The Inside Story of PowerPoint – Its Tips and TricksA Structured Overview of MS PowerPoint
2
Agenda
PowerPoint Processes – A Classification
Evolution of Color Wheel – Its Dimensions
Types of Graphs
Peek into the world of PowerPoint
Usage of Shift and Control Keys
Setting up of Easy Access Tool Bars
Types of Views available in PowerPoint
Basic Do’s & Don'ts while working on a PPT
3
Agenda
PowerPoint Processes – A Classification
Evolution of Color Wheel – Its Dimensions
Types of Graphs
Peek into the world of PowerPoint
Usage of Shift and Control Keys
Setting up of Easy Access Tool Bars
Types of Views available in PowerPoint
Basic Do’s & Don'ts while working on a PPT
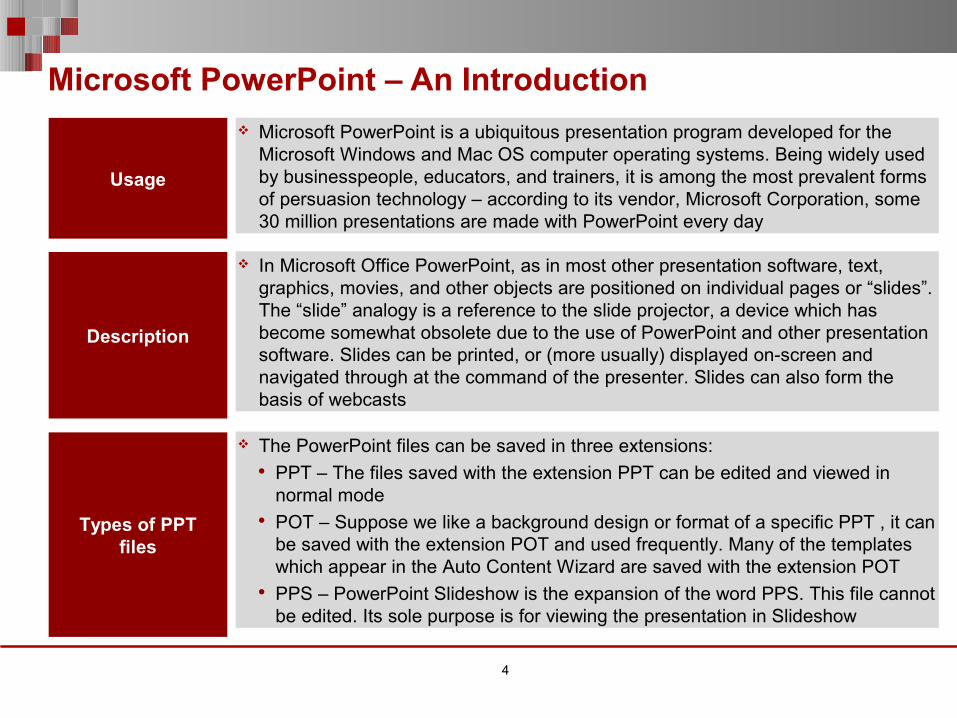
Microsoft PowerPoint – An Introduction
4
Usage
Microsoft PowerPoint is a ubiquitous presentation program developed for the Microsoft Windows and Mac OS computer operating systems. Being widely used by businesspeople, educators, and trainers, it is among the most prevalent forms of persuasion technology – according to its vendor, Microsoft Corporation, some 30 million presentations are made with PowerPoint every day
Description
In Microsoft Office PowerPoint, as in most other presentation software, text, graphics, movies, and other objects are positioned on individual pages or “slides”. The “slide” analogy is a reference to the slide projector, a device which has become somewhat obsolete due to the use of PowerPoint and other presentation software. Slides can be printed, or (more usually) displayed on-screen and navigated through at the command of the presenter. Slides can also form the basis of webcasts
Types of PPT files
The PowerPoint files can be saved in three extensions: PPT – The files saved with the extension PPT can be edited and viewed in
normal mode POT – Suppose we like a background design or format of a specific PPT , it can
be saved with the extension POT and used frequently. Many of the templates which appear in the Auto Content Wizard are saved with the extension POT
PPS – PowerPoint Slideshow is the expansion of the word PPS. This file cannot be edited. Its sole purpose is for viewing the presentation in Slideshow
5
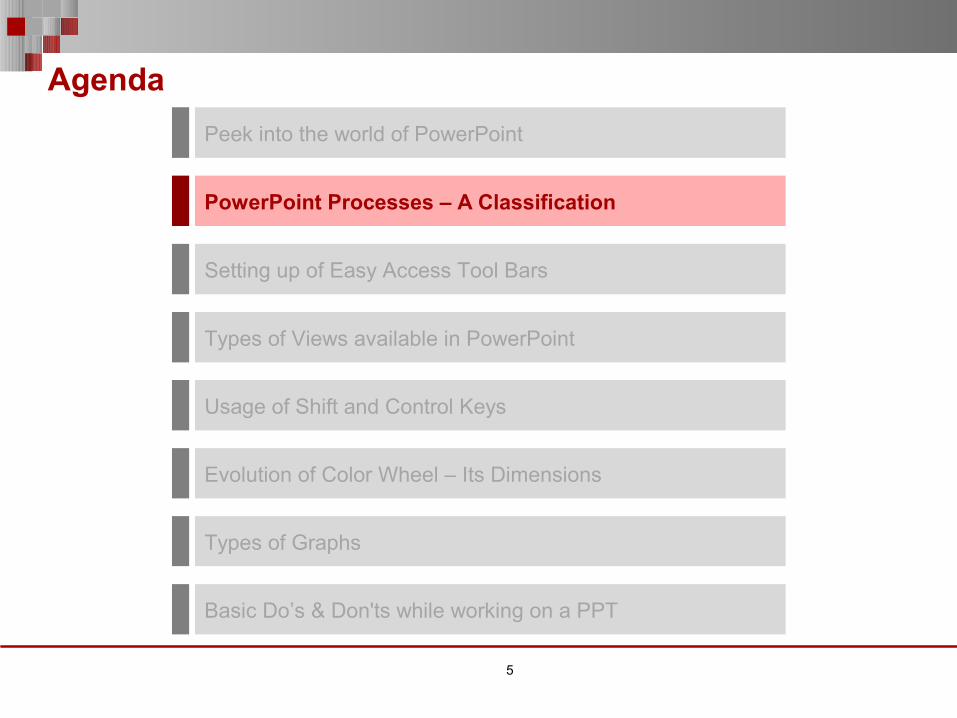
Agenda
PowerPoint Processes – A Classification
Evolution of Color Wheel – Its Dimensions
Types of Graphs
Peek into the world of PowerPoint
Usage of Shift and Control Keys
Setting up of Easy Access Tool Bars
Types of Views available in PowerPoint
Basic Do’s & Don'ts while working on a PPT
6
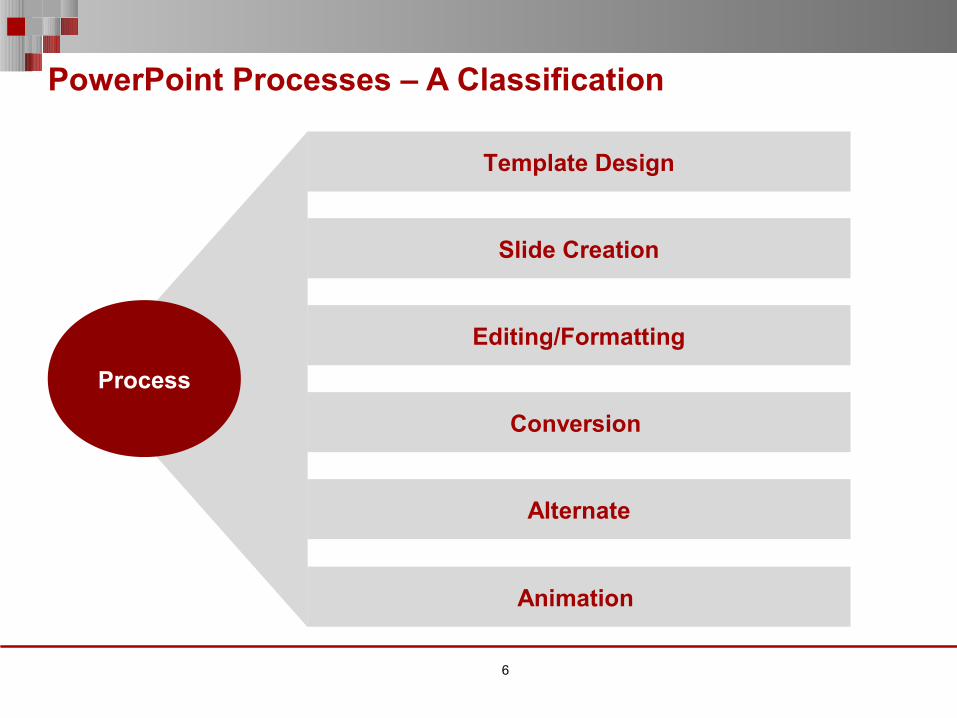
PowerPoint Processes – A Classification
Template Design
Slide Creation
Editing/Formatting
Conversion
Alternate
Animation
Process
7
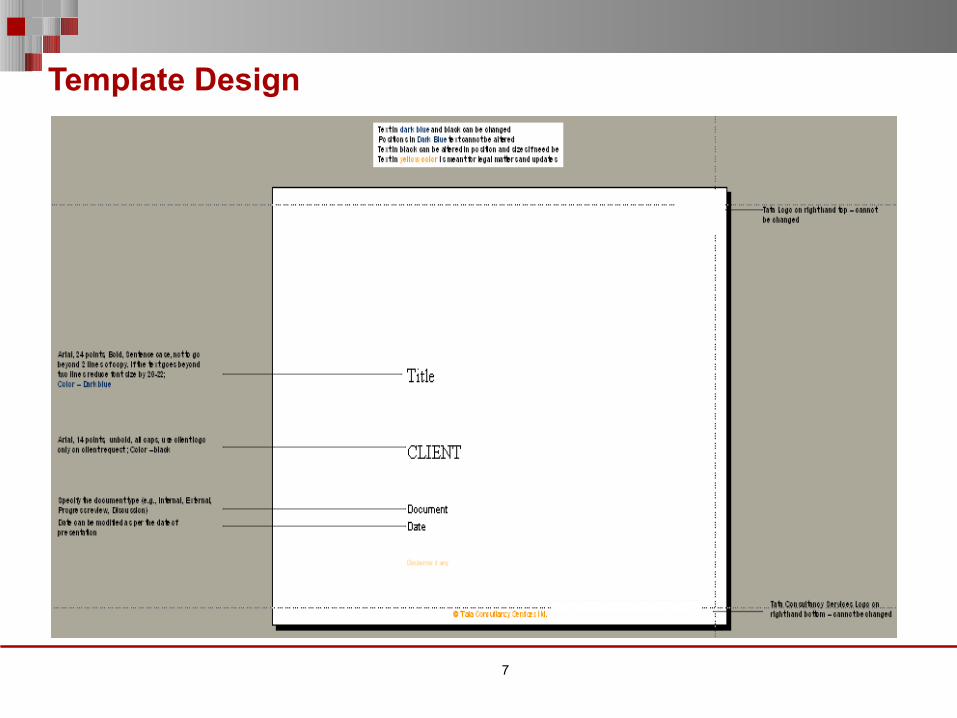
Template Design
8
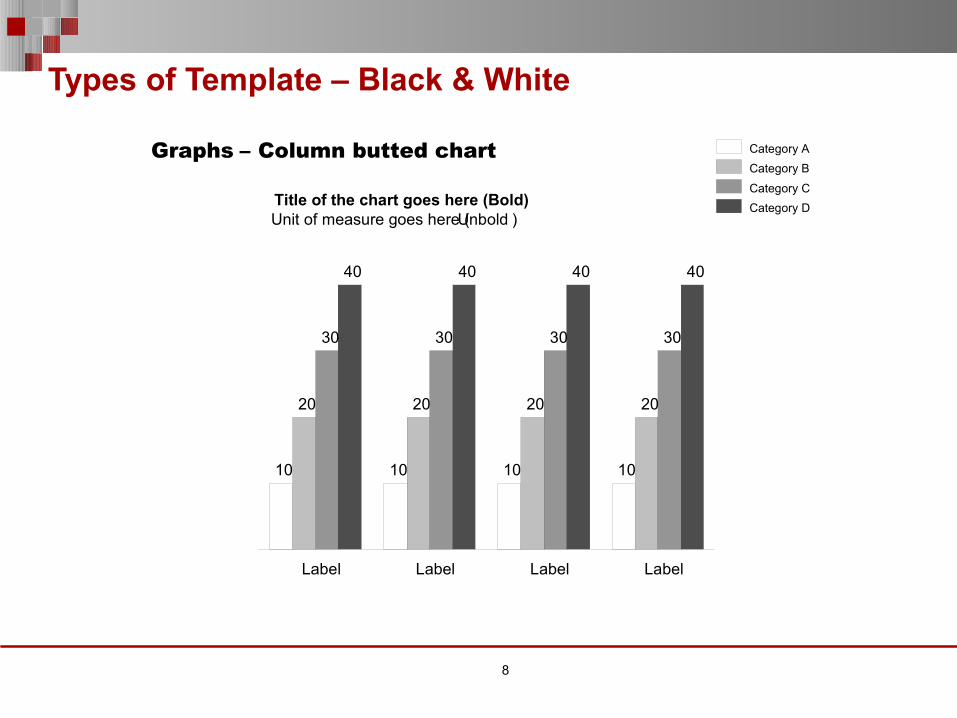
Types of Template – Black & White
Graphs – Column butted chart
10 10 10 10
20 20 20 20
30 30 30 30
40 40 40 40
Label Label Label Label
Category A
Category B
Category D
Category CTitle of the chart goes here (Bold)Unit of measure goes here (Unbold )
9
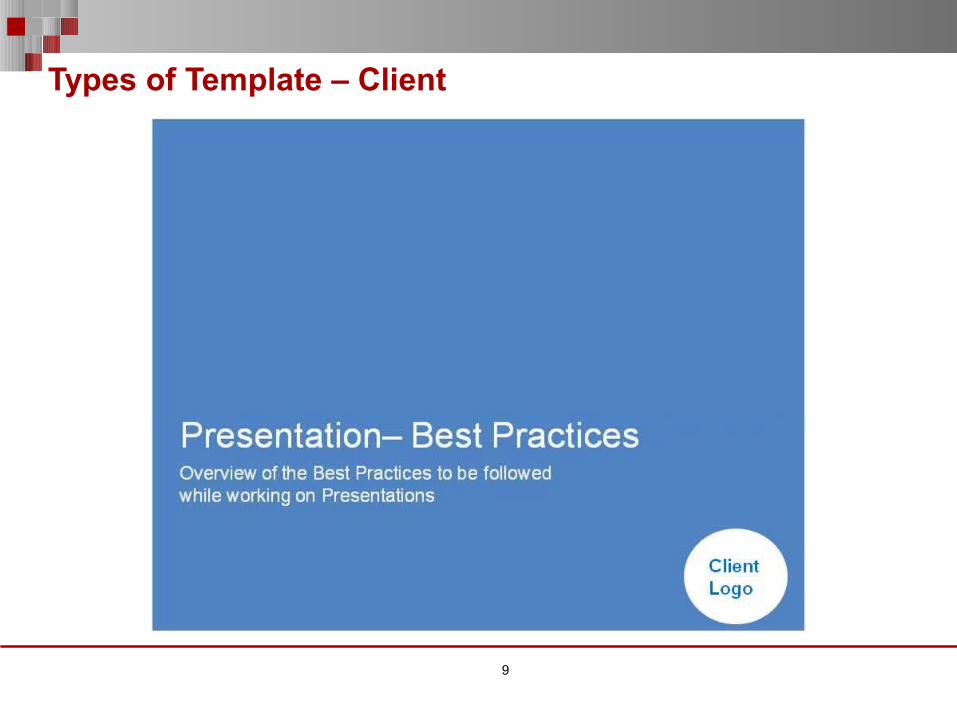
Types of Template – Client
10
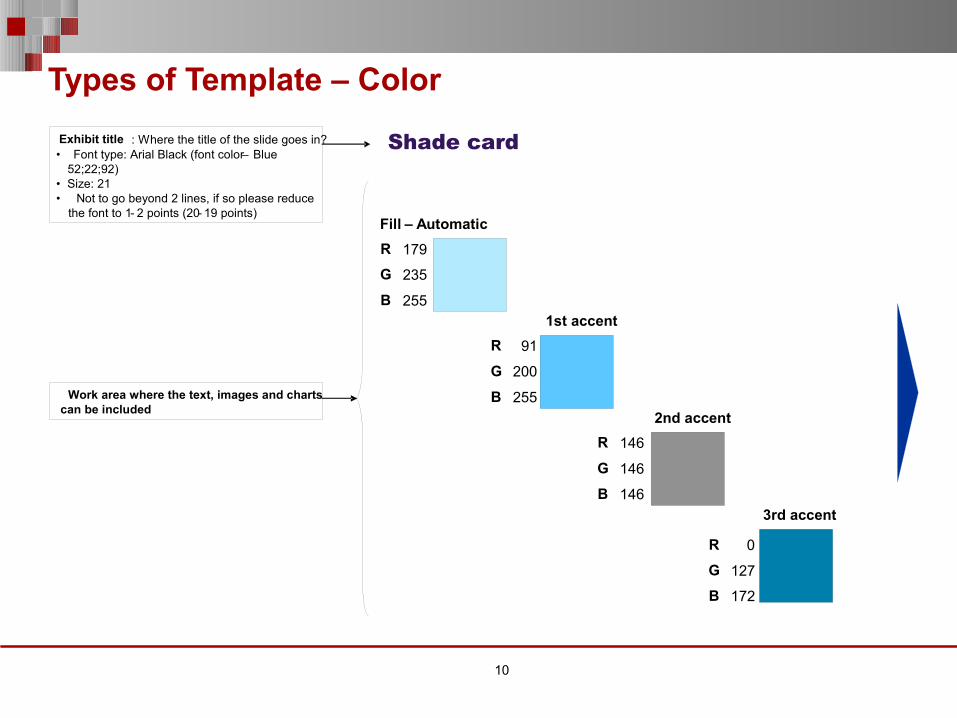
Types of Template – Color
Shade card
Fill – Automatic
179
235
255
R
G
B
1st accent
91
200
255
R
G
B
2nd accent
146
146
146
R
G
B
3rd accent
0
127
172
R
G
B
Exhibit title : Where the title of the slide goes in?• Font type: Arial Black (font color – Blue
52;22;92)• Size: 21• Not to go beyond 2 lines, if so please reduce
the font to 1- 2 points (20- 19 points)
Work area where the text, images and charts can be included
11
Types of Template – Large Audience
12
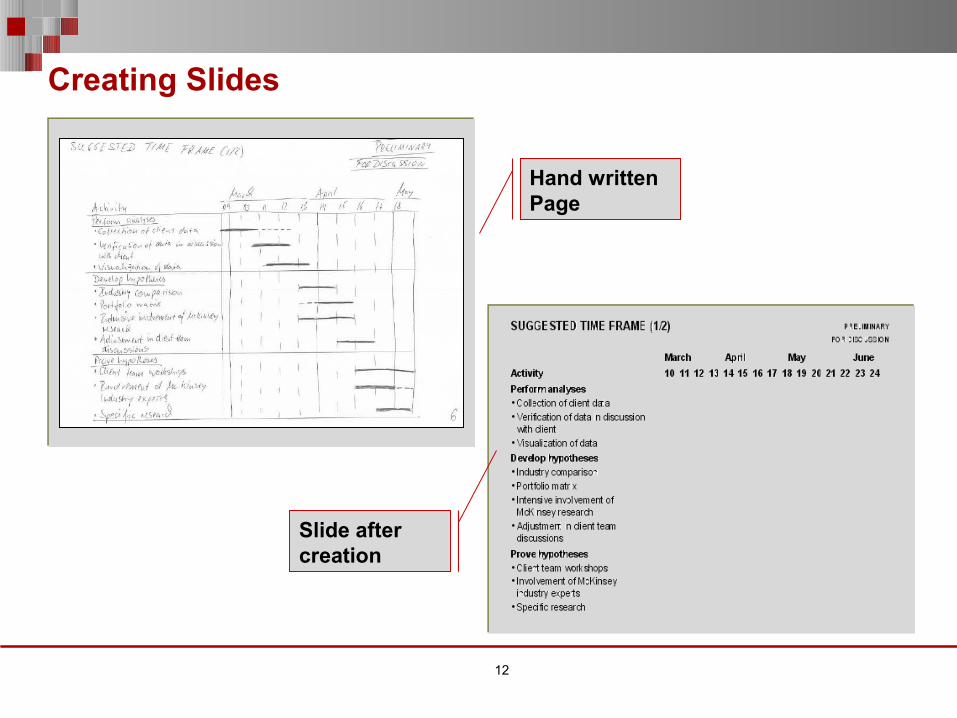
Creating Slides
Hand written Page
Slide after creation
13
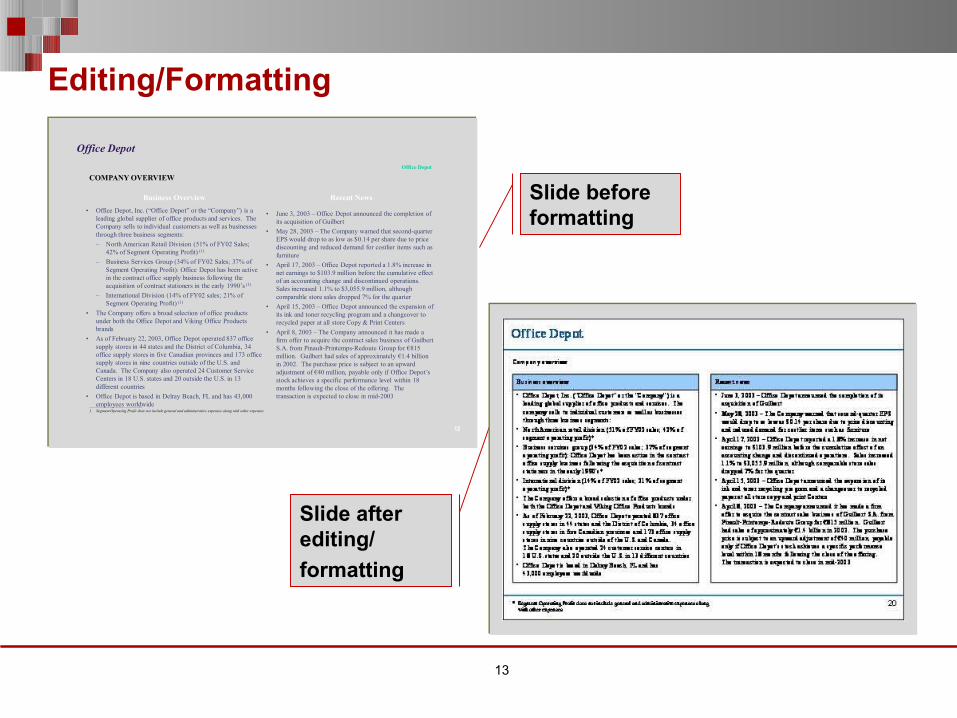
Editing/Formatting
12. 12.
Office Depot
Business Overview Recent News
COMPANY OVERVIEW
Office Depot
• Office Depot, Inc. (“Office Depot” or the “Company”) is a leading global supplier of office products and services. The Company sells to individual customers as well as businesses through three business segments:
– North American Retail Division (51% of FY02 Sales; 42% of Segment Operating Profit) (1)
– Business Services Group (34% of FY02 Sales; 37% of Segment Operating Profit): Office Depot has been active in the contract office supply business following the acquisition of contract stationers in the early 1990’s (1)
– International Division (14% of FY02 sales; 21% of Segment Operating Profit) (1)
• The Company offers a broad selection of office products under both the Office Depot and Viking Office Products brands
• As of February 22, 2003, Office Depot operated 837 office supply stores in 44 states and the District of Columbia, 34 office supply stores in five Canadian provinces and 173 office supply stores in nine countries outside of the U.S. and Canada. The Company also operated 24 Customer Service Centers in 18 U.S. states and 20 outside the U.S. in 13 different countries
• Office Depot is based in Delray Beach, FL and has 43,000 employees worldwide
• June 3, 2003 – Office Depot announced the completion of its acquisition of Guilbert
• May 28, 2003 – The Company warned that second-quarter EPS would drop to as low as $0.14 per share due to price discounting and reduced demand for costlier items such as furniture
• April 17, 2003 – Office Depot reported a 1.8% increase in net earnings to $103.9 million before the cumulative effect of an accounting change and discontinued operations. Sales increased 1.1% to $3,055.9 million, although comparable store sales dropped 7% for the quarter
• April 15, 2003 – Office Depot announced the expansion of its ink and toner recycling program and a changeover to recycled paper at all store Copy & Print Centers
• April 8, 2003 – The Company announced it has made a firm offer to acquire the contract sales business of Guilbert S.A. from Pinault-Printemps-Redoute Group for €815 million. Guilbert had sales of approximately €1.4 billion in 2002. The purchase price is subject to an upward adjustment of €40 million, payable only if Office Depot’s stock achieves a specific performance level within 18 months following the close of the offering. The transaction is expected to close in mid-2003
___________________________1. Segment Operating Profit does not include general and administrative expenses along with other expenses.
Slide before formatting
Slide after editing/
formatting
14
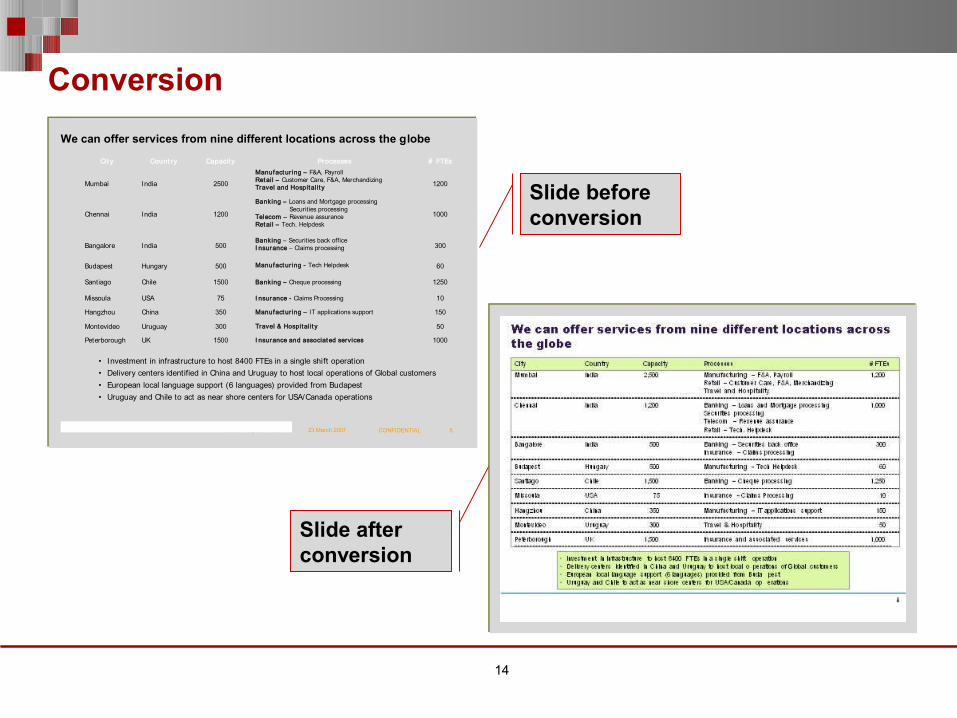
Conversion
Slide after conversion
Slide before conversion
© Tata Consultancy Services ltd. 23 March 2007 5CONFIDENTIAL
We can offer services from nine different locations across the globe
• Investment in infrastructure to host 8400 FTEs in a single shift operation• Delivery centers identified in China and Uruguay to host local operations of Global customers• European local language support (6 languages) provided from Budapest• Uruguay and Chile to act as near shore centers for USA/Canada operations
Cit y Count ry Capacit y Processes # FTEs
Mumbai India 2500
Manufact ur ing – F&A, PayrollRet ai l – Customer Care, F&A, MerchandizingTravel and Hospital it y 1200
Chennai India 1200
Banking – Loans and Mortgage processingSecurities processing
Telecom – Revenue assuranceRet ai l – Tech. Helpdesk
1000
Bangalore India 500Banking – Securities back officeI nsurance – Claims processing 300
Budapest Hungary 500 Manufact ur ing - Tech Helpdesk 60
Santiago Chile 1500 Banking – Cheque processing 1250
Missoula USA 75 I nsurance - Claims Processing 10
Hangzhou China 350 Manufact ur ing – IT applications support 150
Peterborough UK 1500 I nsurance and associat ed services 1000
Montevideo Uruguay 300 Travel & Hospital it y 50
15
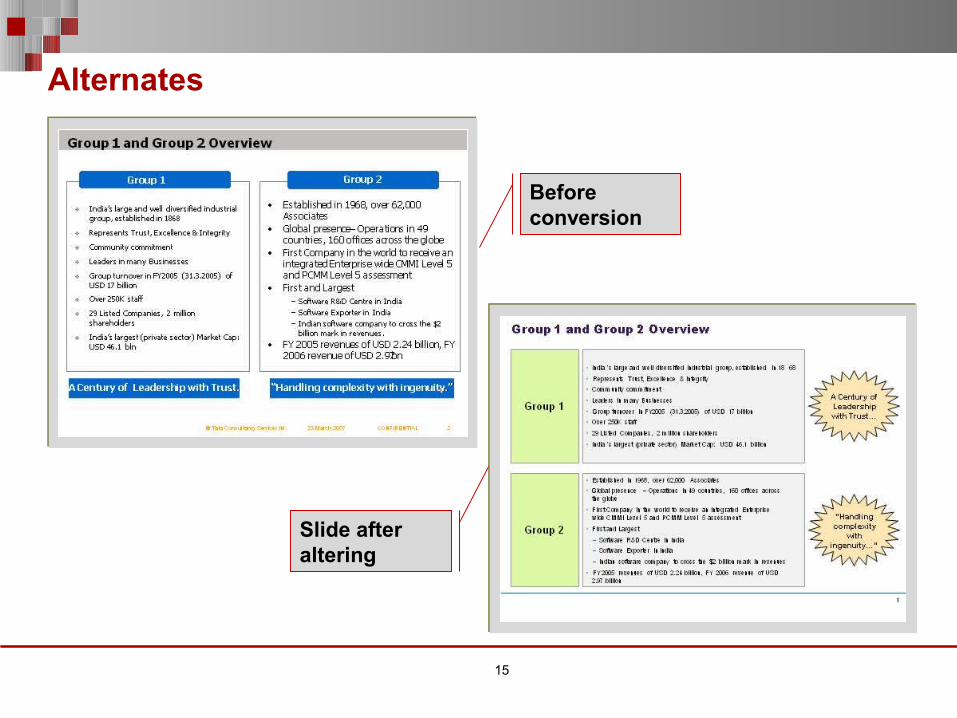
Alternates
Slide after altering
Before conversion
16
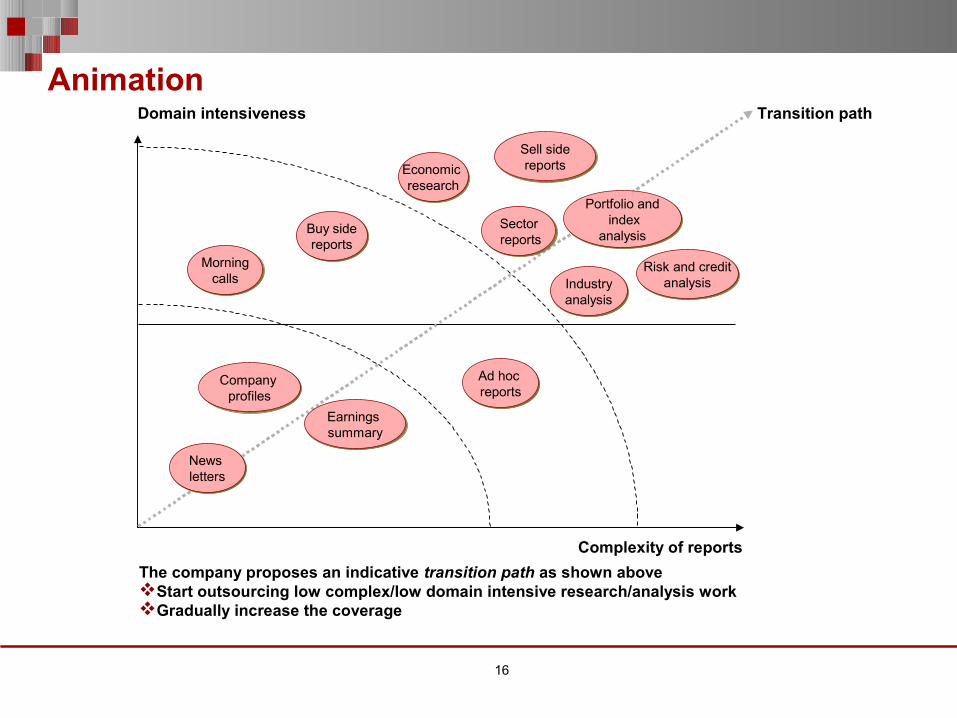
AnimationTransition pathDomain intensiveness
Complexity of reports
News lettersNews letters
Company profiles
Company profiles
Earnings summaryEarnings summary
Morningcalls
Morningcalls
Buy sidereports
Buy sidereports
Ad hoc reportsAd hoc reports
Economic research
Economic research
IndustryanalysisIndustryanalysis
Sector reportsSector reports
Sell sidereports
Sell sidereports
Risk and creditanalysis
Risk and creditanalysis
Portfolio and index
analysis
Portfolio and index
analysis
The company proposes an indicative transition path as shown aboveStart outsourcing low complex/low domain intensive research/analysis workGradually increase the coverage
17
Agenda
PowerPoint Processes – A Classification
Evolution of Color Wheel – Its Dimensions
Types of Graphs
Peek into the world of PowerPoint
Usage of Shift and Control Keys
Setting up of Easy Access Tool Bars
Types of Views available in PowerPoint
Basic Do’s & Don'ts while working on a PPT
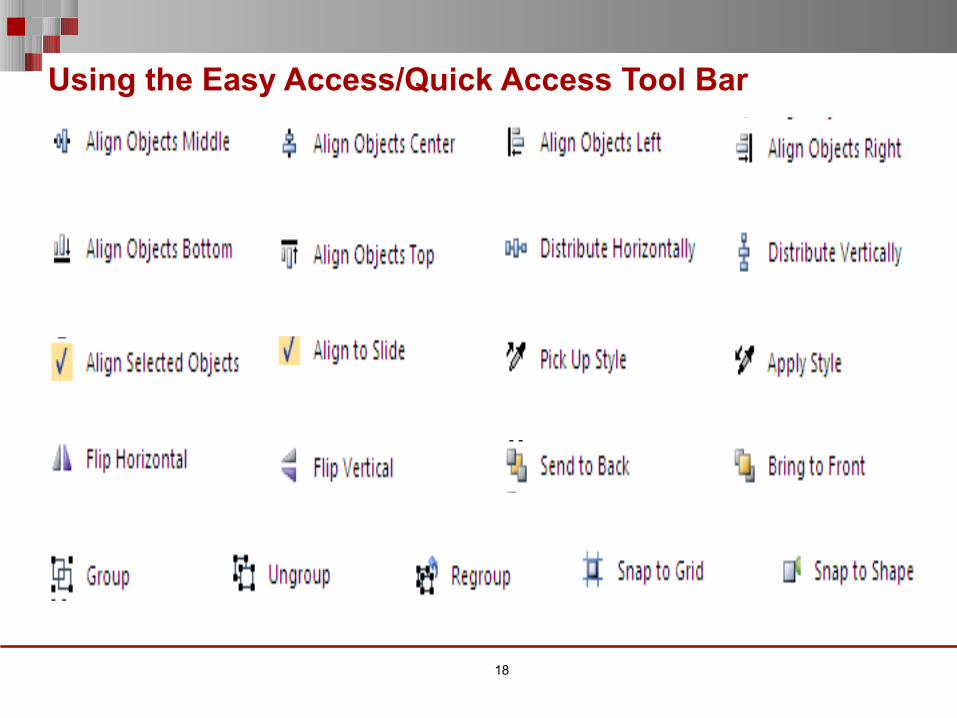
Using the Easy Access/Quick Access Tool Bar
18
Using the Easy Access/Quick Access Tool Bar – Space for Demo
19
20
Agenda
PowerPoint Processes – A Classification
Evolution of Color Wheel – Its Dimensions
Types of Graphs
Peek into the world of PowerPoint
Usage of Shift and Control Keys
Setting up of Easy Access Tool Bars
Types of Views available in PowerPoint
Basic Do’s & Don'ts while working on a PPT
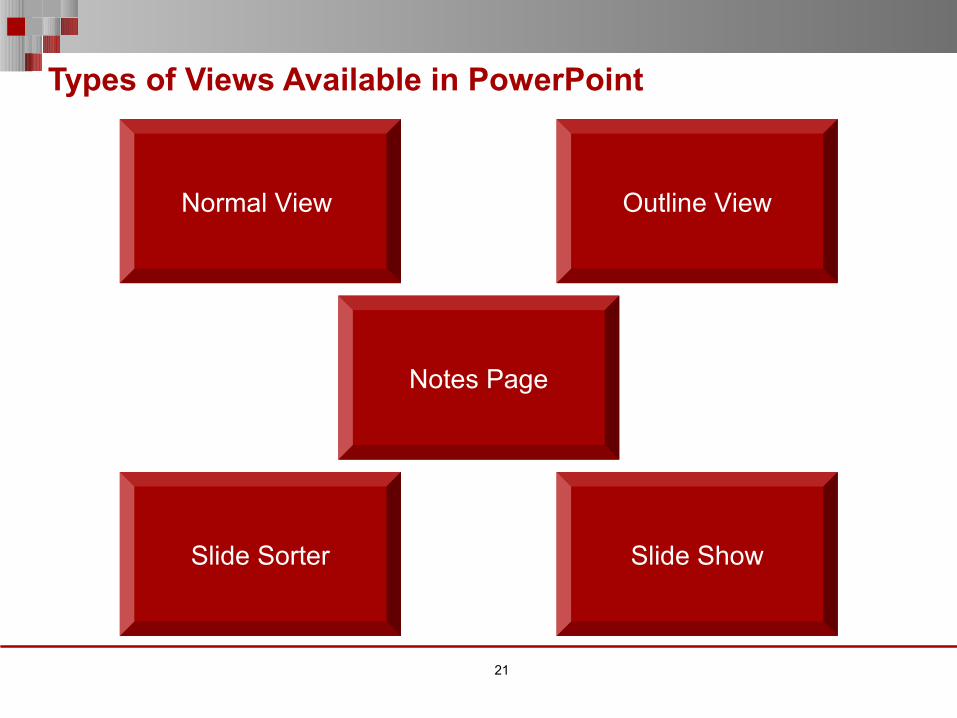
Types of Views Available in PowerPoint
21
Normal View Outline View
Slide Sorter Slide Show
Notes Page
22
Agenda
PowerPoint Processes – A Classification
Evolution of Color Wheel – Its Dimensions
Types of Graphs
Peek into the world of PowerPoint
Usage of Shift and Control Keys
Setting up of Easy Access Tool Bars
Types of Views available in PowerPoint
Basic Do’s & Don'ts while working on a PPT
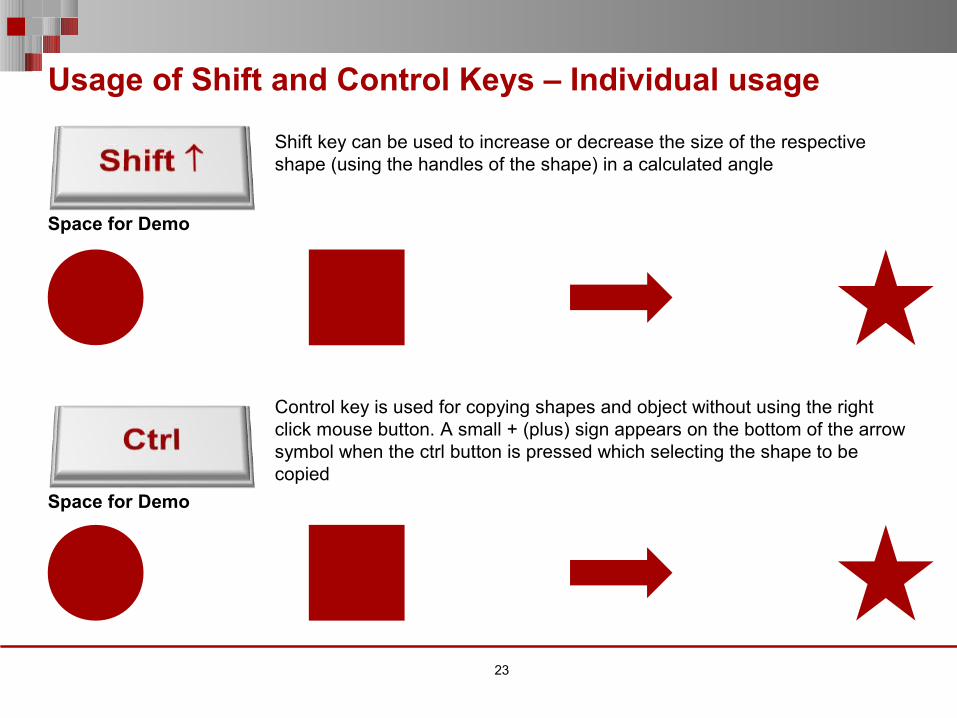
Usage of Shift and Control Keys – Individual usage
23
Shift key can be used to increase or decrease the size of the respective shape (using the handles of the shape) in a calculated angle
Space for Demo
Control key is used for copying shapes and object without using the right click mouse button. A small + (plus) sign appears on the bottom of the arrow symbol when the ctrl button is pressed which selecting the shape to be copied
Space for Demo
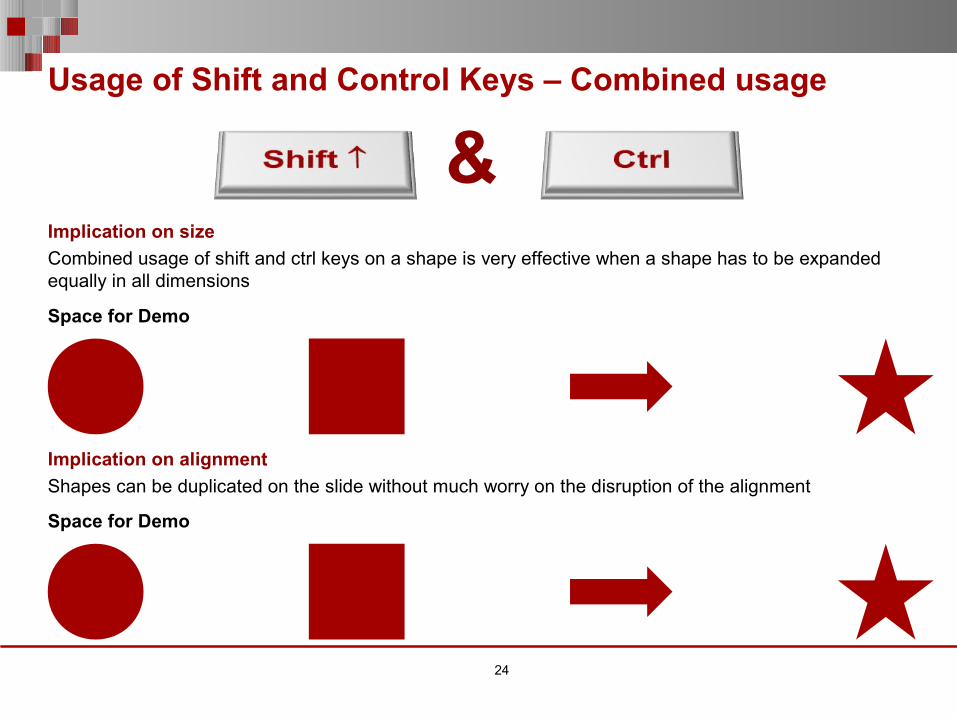
Usage of Shift and Control Keys – Combined usage
24
Implication on size
Combined usage of shift and ctrl keys on a shape is very effective when a shape has to be expanded equally in all dimensions
&
Implication on alignment
Shapes can be duplicated on the slide without much worry on the disruption of the alignment
Space for Demo
Space for Demo
25
Agenda
PowerPoint Processes – A Classification
Evolution of Color Wheel – Its Dimensions
Types of Graphs
Peek into the world of PowerPoint
Usage of Shift and Control Keys
Setting up of Easy Access Tool Bars
Types of Views available in PowerPoint
Basic Do’s & Don'ts while working on a PPT
Evolution of Color Wheel – Its Dimensions
26
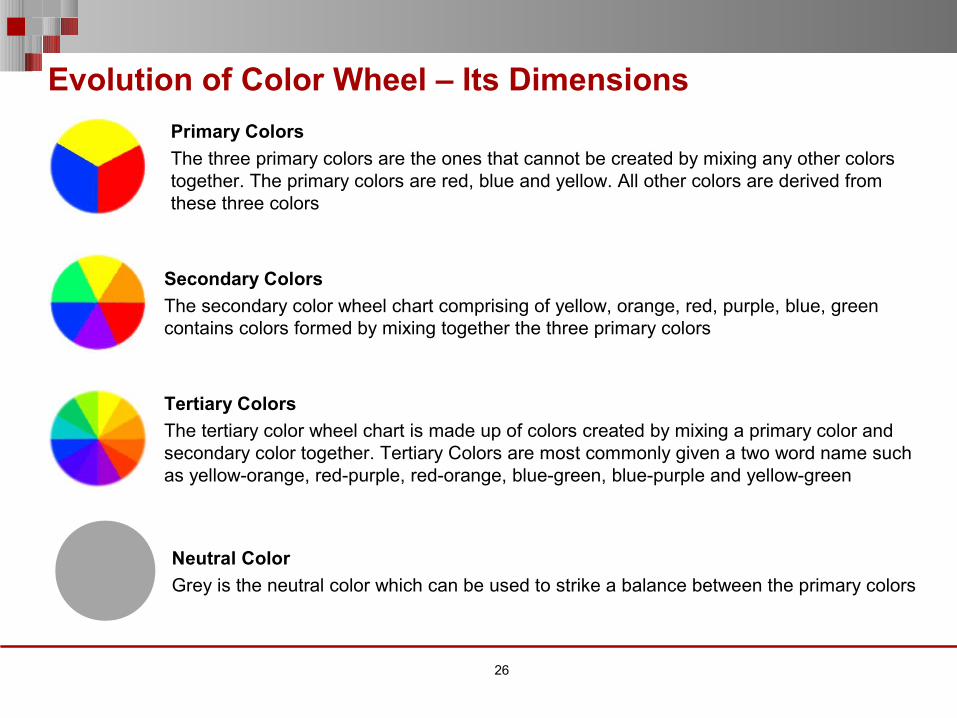
Primary Colors
The three primary colors are the ones that cannot be created by mixing any other colors together. The primary colors are red, blue and yellow. All other colors are derived from these three colors
Secondary Colors
The secondary color wheel chart comprising of yellow, orange, red, purple, blue, green contains colors formed by mixing together the three primary colors
Tertiary Colors
The tertiary color wheel chart is made up of colors created by mixing a primary color and secondary color together. Tertiary Colors are most commonly given a two word name such as yellow-orange, red-purple, red-orange, blue-green, blue-purple and yellow-green
Neutral Color
Grey is the neutral color which can be used to strike a balance between the primary colors
Color Wheel – Analogous and Complimentary Colors
27
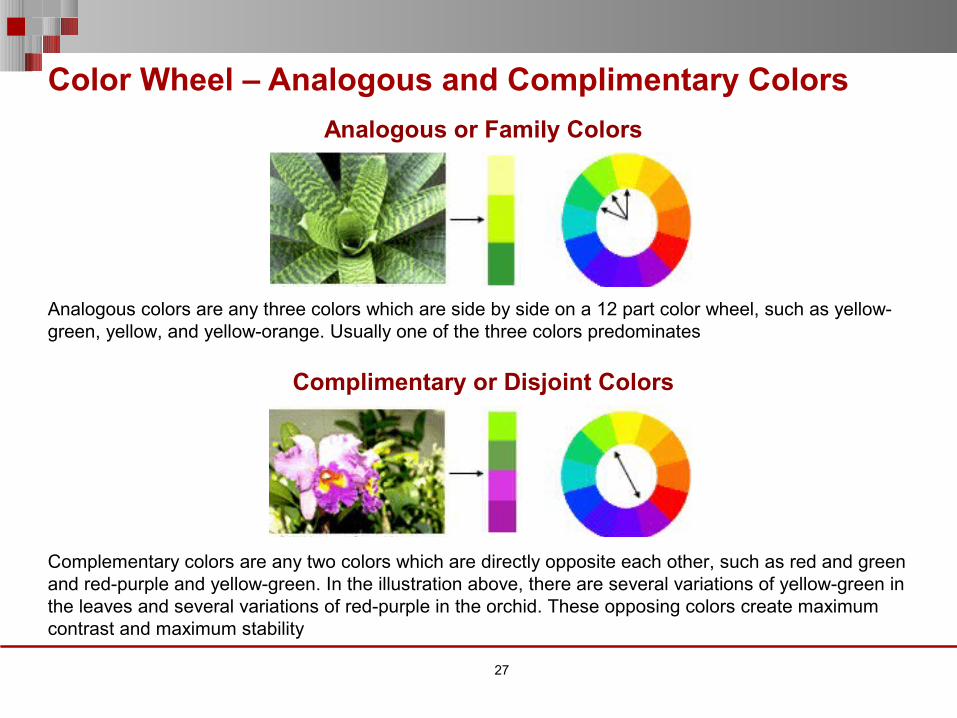
Analogous colors are any three colors which are side by side on a 12 part color wheel, such as yellow-green, yellow, and yellow-orange. Usually one of the three colors predominates
Analogous or Family Colors
Complementary colors are any two colors which are directly opposite each other, such as red and green and red-purple and yellow-green. In the illustration above, there are several variations of yellow-green in the leaves and several variations of red-purple in the orchid. These opposing colors create maximum contrast and maximum stability
Complimentary or Disjoint Colors
28
Agenda
PowerPoint Processes – A Classification
Evolution of Color Wheel – Its Dimensions
Types of Graphs
Peek into the world of PowerPoint
Usage of Shift and Control Keys
Setting up of Easy Access Tool Bars
Types of Views available in PowerPoint
Basic Do’s & Don'ts while working on a PPT
29
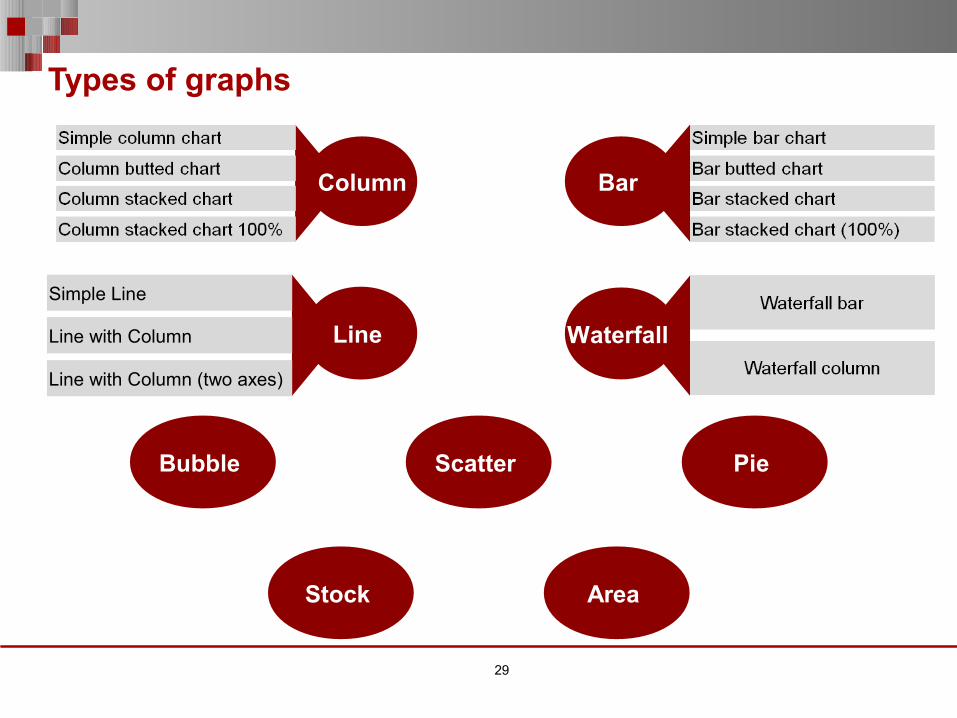
Types of graphs
Bubble Scatter Pie
Stock Area
Column Bar
Waterfall Line
Simple Line
Line with Column
Line with Column (two axes)
30
Agenda
PowerPoint Processes – A Classification
Evolution of Color Wheel – Its Dimensions
Types of Graphs
Peek into the world of PowerPoint
Usage of Shift and Control Keys
Setting up of Easy Access Tool Bars
Types of Views available in PowerPoint
Basic Do’s & Don'ts while working on a PPT
31
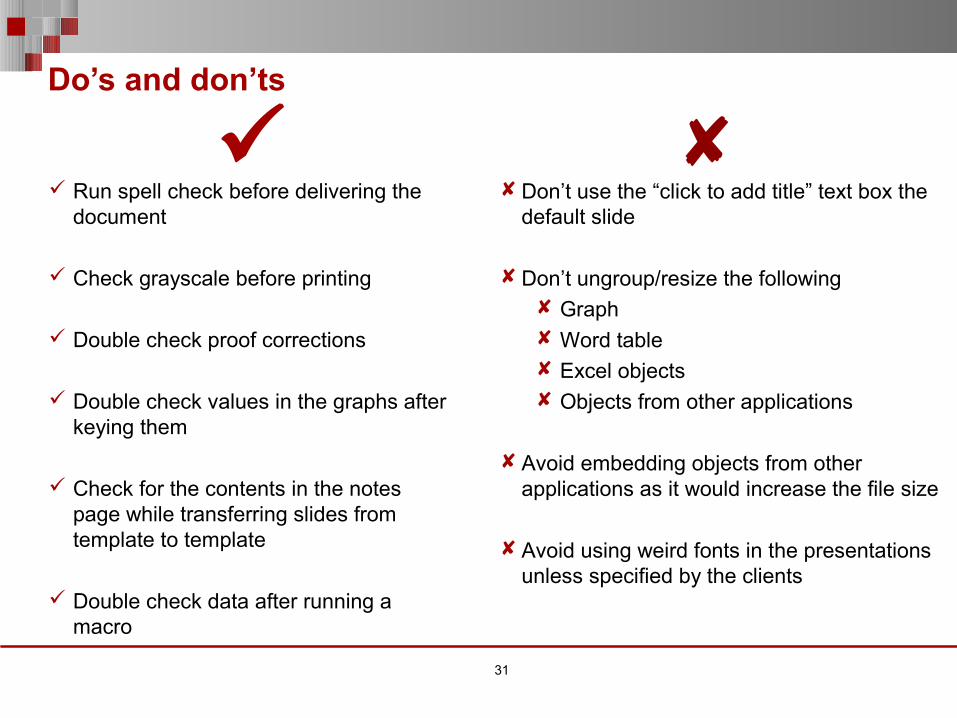
Do’s and don’ts
Run spell check before delivering the document
Check grayscale before printing
Double check proof corrections
Double check values in the graphs after keying them
Check for the contents in the notes page while transferring slides from template to template
Double check data after running a macro
Don’t use the “click to add title” text box the default slide
Don’t ungroup/resize the following
Graph
Word table
Excel objects
Objects from other applications
Avoid embedding objects from other applications as it would increase the file size
Avoid using weird fonts in the presentations unless specified by the clients

32
Thank you !
Recommended