The Impact Strength of Butt Welded Vibration Welds Related to Microstructure and Welding History
ALOIS K. SCHLARB and GOTTFRIED W. EHRENSTEIN
Institute for Materials Technology Uniuersity of Kassel
West Germany
A study has been made of vibration butt welds between plaques of polypropyl- ene. The quality of the welds, as determined by impact tests, has been examined as a function of the welding variables: pressure and vibration amplitude. In addition, the microstructure of the welds has also been examined, classified, and correlated with the welding variables and weld quality. Penetration as a function of time shows three distinct regimes and it is shown that the impact strength of the welds is independent of time once the third regime is reached. The time required to reach the third regime decreases as pressure or amplitude increases and is more sensitive to amplitude of vibration than to pressure. The highest quality welds were produced at low pressure and low amplitude with correspond- ing long times to reach regime three and exhibited a unique, readily identifiable microstructure.
INTRODUCTION
ith the increasing application of vibration W welded parts of engineering polymeric mate- rials in the automotive industry, the mechanical be- havior of the joints under static, dynamic, and impact conditions is becoming of great interest. The behavior of the welds depends on molecular structure, micro- structure, orientation, and internal stresses of poly- meric materials (1). Each of these structural param- eters depends on the welding history. Particularly in semicrystalline polymeric materials, the microstruc- ture seems to be a major factor in the determination of the weld quality (2, 3). Therefore, in this paper the relationships between impact strength, microstruc- ture, and welding history of a semicrystalline poly- propylene are described.
WELDING EXPERIMENTS
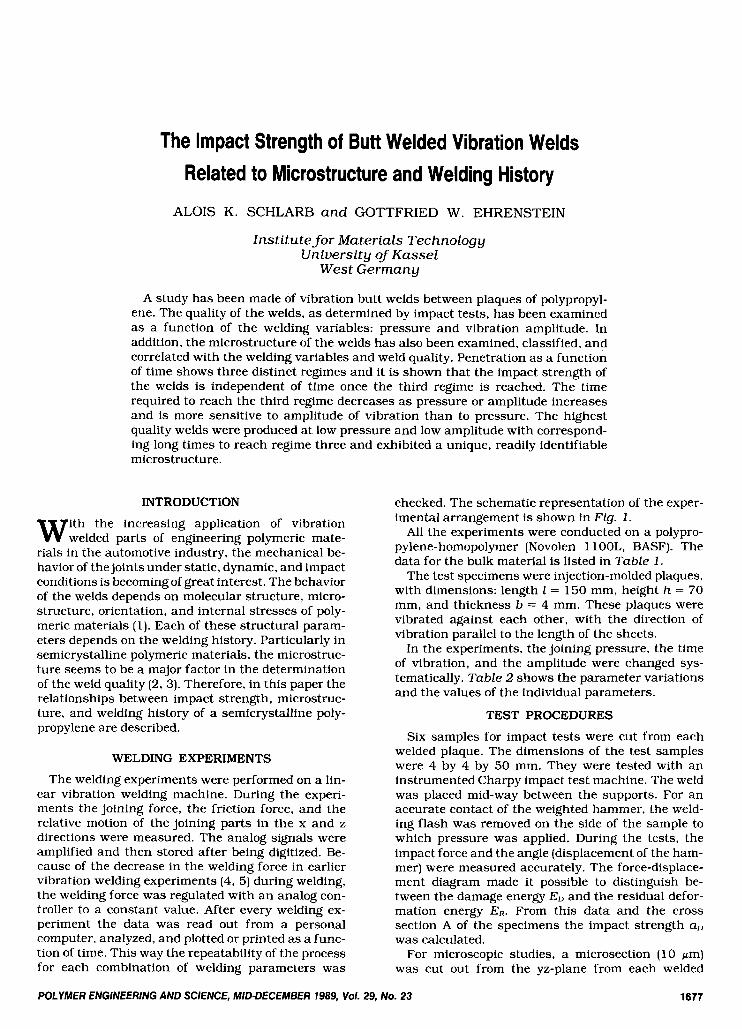
The welding experiments were performed on a lin- ear vibration welding machine. During the experi- ments the joining force, the friction force, and the relative motion of the joining parts in the x and z directions were measured. The analog signals were amplified and then stored after being digitized. Be- cause of the decrease in the welding force in earlier vibration welding experiments (4, 5) during welding, the welding force was regulated with an analog con- troller to a constant value. After every welding ex- periment the data was read out from a personal computer, analyzed, and plotted or printed as a func- tion of time. This way the repeatability of the process for each combination of welding parameters was
checked. The schematic representation of the exper- imental arrangement is shown in Fig. I.
All the experiments were conducted on a polypro- pylene-homopolymer (Novolen 1 1 OOL, BASF). The data for the bulk material is listed in Table I .
The test specimens were injection-molded plaques, with dimensions: length 1 = 150 mm, height h = 70 mm, and thickness b = 4 mm. These plaques were vibrated against each other, with the direction of vibration parallel to the length of the sheets.
In the experiments, the joining pressure, the time of vibration, and the amplitude were changed sys- tematically. Table 2 shows the parameter variations and the values of the individual parameters.
TEST PROCEDURES
Six samples for impact tests were cut from each welded plaque. The dimensions of the test samples were 4 by 4 by 50 mm. They were tested with an instrumented Charpy impact test machine. The weld was placed mid-way between the supports. For an accurate contact of the weighted hammer, the weld- ing flash was removed on the side of the sample to which pressure was applied. During the tests, the impact force and the angle (displacement of the ham- mer) were measured accurately. The force-displace- ment diagram made it possible to distinguish be- tween the damage energy ED and the residual defor- mation energy ER. From this data and the cross section A of the specimens the impact strength aD was calculated.
For microscopic studies, a microsection (10 lm) was cut out from the yz-plane from each welded
POLYMER ENGINEERING AND SCIENCE, MID-DECEMBER 1989, VOI. 29, NO. 23 1677
A. K. Schlarb a n d G. W . Ehrens te in
Vibration Welding Machine Amplifire Unit Store- & Regula- Computing tor Unit Unit
/ / \ / \
C i E - [rn) stm 256m
-A/Dconverter P E
L,,- rn *:: L , - . .
I U E i L d I I I1
/ \ . . . . . . - - . . . . . . . . . . . . . . . . . ~ . . . . . . . - . . . ~ ......
Friction Force @ "' L , - . .
- L
/
- - Penatration *:I
L- . . I I I I 1
L Fig. 1 . Experimental arrangement for vibration welding experiments.
Table 1. Data for the Bulk Material. Table 2. Parameter Variations.
Property Value Unit Welding Time of Ampli- Sample Pressure, Vibration, tude, Number MPa S mm Density 0.908 g/ccm
Yield point 34 N / m d Youngs modulus 1500 N/mm2 lzod impact strength (+23"C) 60 kJ/m2 lzod impact strength (-30°C) 13 kJ/m' Charpy impact strength (+23OC)' 40 kJ/m2 Charpy impact strength (-30°C)" 6 kJ/m'
Measured by authors and calculated from damage energy; (Specimen 4 by 4 by 50 mm).
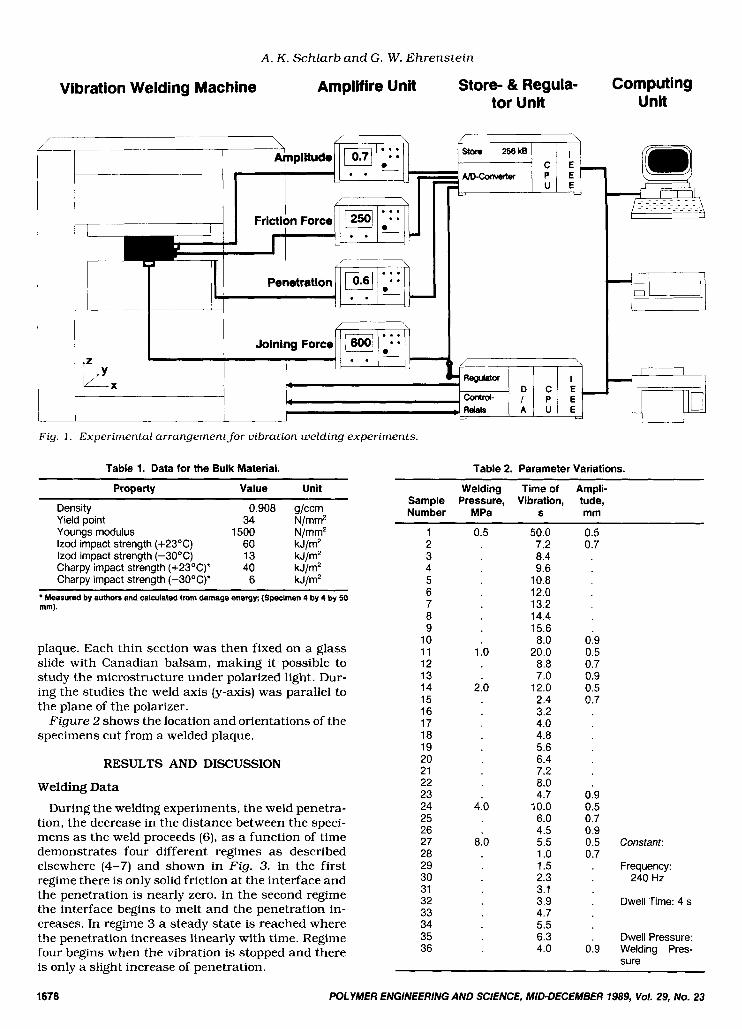
plaque. Each thin section was then fixed on a glass slide with Canadian balsam, making it possible to study the microstructure under polarized light. Dur- ing the studies the weld axis [y-axis) was parallel to the plane of the polarizer.
Figure 2 shows the location and orientations of the specimens cut from a welded plaque.
RESULTS AND DISCUSSION
Welding Data
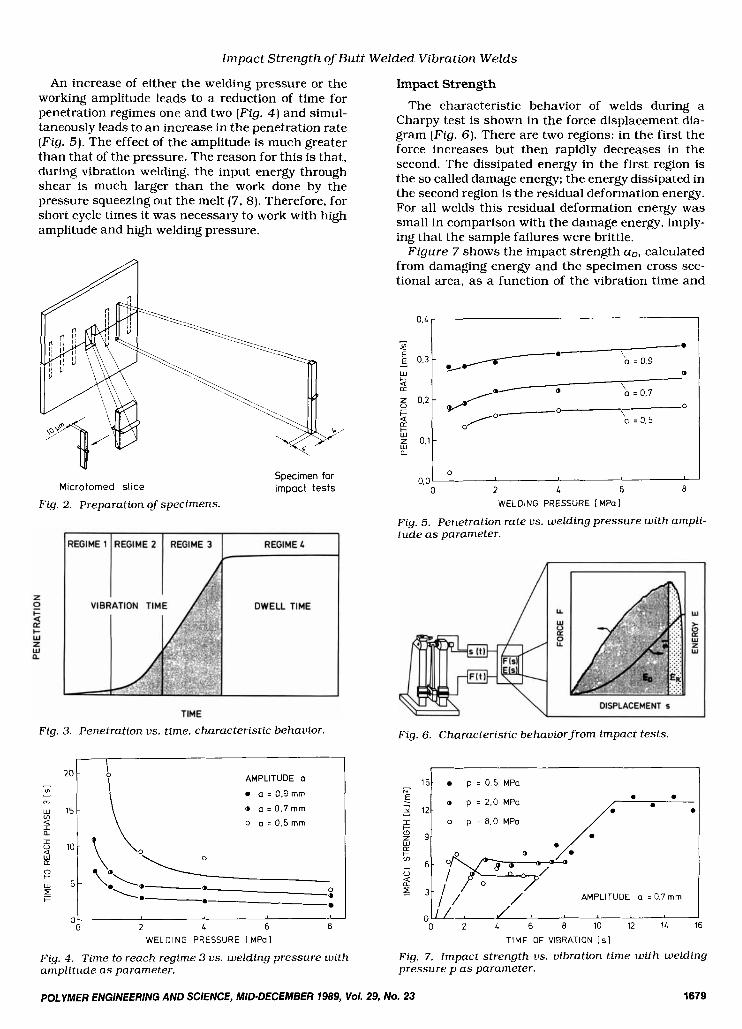
During the welding experiments, the weld penetra- tion, the decrease in the distance between the speci- mens as the weld proceeds (6), as a function of time demonstrates four different regimes as described elsewhere (4-7) and shown in Fig. 3. In the first regime there is only solid friction at the interface and the penetration is nearly zero. In the second regime the interface begins to melt and the penetration in- creases. In regime 3 a steady state is reached where the penetration increases linearly with time. Regime four begins when the vibration is stopped and there
1 2 3 4 5 6 7 8 9
10 11 12 13 14 15 16 17 18 19 20 21 22 23 24 25 26 27 28 29 30 31 32 33 34 35 36
0.5
1 .o
2.0
4.0
8.0
50.0 7.2 8.4 9.6
10.8 12.0 13.2 14.4 15.6 8.0
20.0 8.8 7 .O
12.0 2.4 3.2 4.0 4.8 5.6 6.4 7.2 8.0 4.7
10.0 6.0 4.5 5.5 1 .o 1.5 2.3 3.1 3.9 4.7 5.5 6.3 4.0
0.5 0.7
0.9 0.5 0.7 0.9 0.5 0.7
0.9 0.5 0.7 0.9 0.5 Constant: 0.7 . Frequency:
. Dwell Time: 4 s
240 Hz
. Dwell Pressure: 0.9 Welding Pres-
sure is only a slight increase of penetration.
1678 POLYMER ENGINEERING AND SCIENCE, MID-DECEMBER 1989, Vol. 29, NO. 23
Impact S t reng th of But t W e l d e d Vibration W e l d s
An increase of either the welding pressure or the working amplitude leads to a reduction of time for penetration regimes one and two (Fig. 4) and simul- taneously leads to an increase in the penetration rate (Fig. 5) . The effect of the amplitude is much greater than that of the pressure. The reason for this is that, during vibration welding, the input energy through shear is much larger than the work done by the pressure squeezing out the melt (7, 8). Therefore, for short cycle times it was necessary to work with high amplitude and high welding pressure.
Mtcrotomed slice
Fig. 2. Preparation of specimens.
Specimen for impact tests
Fig. 3. Penetration us. time, characteristic behavior.
I AMPLITUDE a
a a = 0.9 rnrn
o a = 0.7rnm
o a = 0.5rnrn
20
m
m
n
w 15
4
(L
0
0
0 2 L 6 8 0 -
WELDING PRESSURE I MPal
Impact Strength The characteristic behavior of welds during a
Charpy test is shown in the force displacement dia- gram (Fig. 6 ) . There are two regions: in the first the force increases but then rapidly decreases in the second. The dissipated energy in the first region is the so called damage energy; the energy dissipated in the second region is the residual deformation energy. For all welds this residual deformation energy was small in comparison with the damage energy, imply- ing that the sample failures were brittle.
Figure 7 shows the impact strength ao. calculated from damaging energy and the specimen cross sec- tional area, as a function of the vibration time and
0 0.0
0 2 4 6 8
WELDING PRESSURE I MPa 1
Fig. 5. Penetration rate us. welding pressure with ampli- tude as parameter.
Fig. 6. Characteristic behavior from impact tests.
151 a p = 0.5 MPa - ?.
E -
0 2 4 6 8 1 0 1 2 1 4 TIME OF VIBRATION I s 1
Fig. 4. Time to reach regime 3 us. welding pressure with amplitude as parameter.
POLYMER ENGINEERING AND SCIENCE, MID-DECEMBER 7989, Vol. 29, No. 23
Fig. 7 . Impact strength us. Vibration time with welding pressure p as parameter.
1679
A. K . S c h l a r b and G. W . Ehrens te in
welding pressure for the welds produced at a con- stant amplitude of 0.7 mm. The values are the aver- age of a minimum of five samples.
For each welding pressure the impact strength ex- hibits a similar behavior as a function of time. The impact strength first increases with time and then reaches a constant plateau. For a welding pressure of 8.0 MPa there is a slight overshoot and then a constant plateau of about 4.5 kJ/m2 is attained after 3 s. At a pressure of 2.0 MPa, a constant strength level of about 6.0 kJ/m2 is attained after 4 s. The plateau is twice as large (aD = 12.5 kJ/m2) at a welding pressure of 0.5 MPa as compared to welding pressures of 8.0 and 2.0 MPa, but more than 10 s were required to reach this plateau. These results are in good agreement with earlier tensile test results (5).
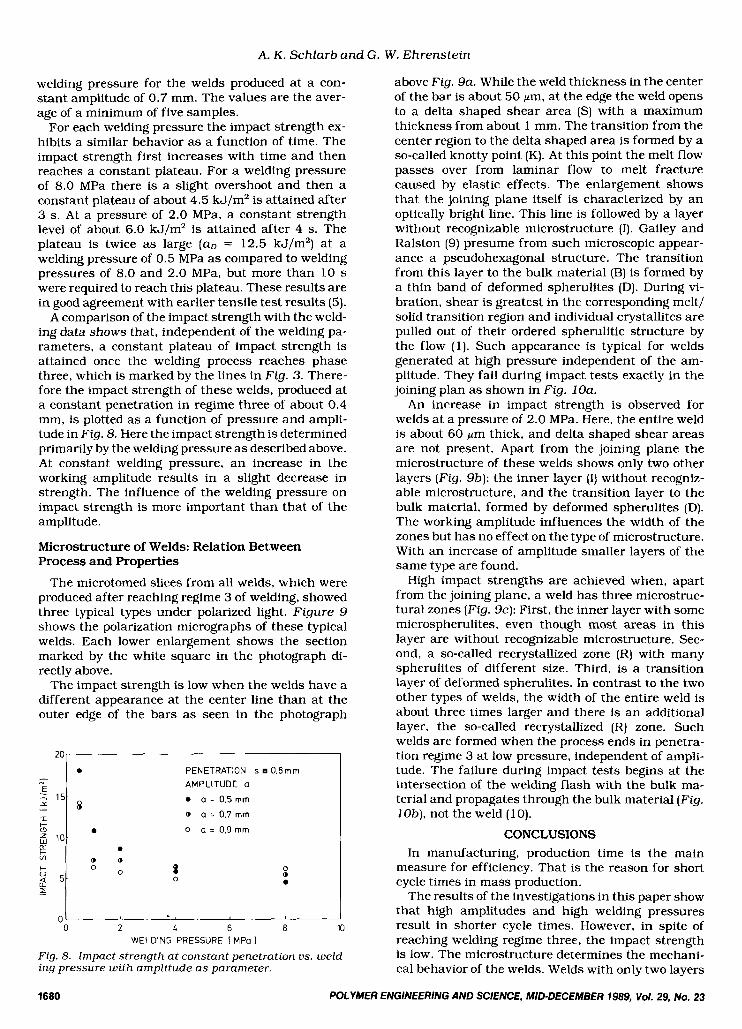
A comparison of the impact strength with the weld- ing data shows that, independent of the welding pa- rameters. a constant plateau of impact strength is attained once the welding process reaches phase three, which is marked by the lines in Fig. 3. There- fore the impact strength of these welds, produced at a constant penetration in regime three of about 0.4 mm, is plotted as a function of pressure and ampli- tude in Fig. 8. Here the impact strength is determined primarily by the welding pressure as described above. At constant welding pressure, an increase in the working amplitude results in a slight decrease in strength. The influence of the welding pressure on impact strength is more important than that of the amplitude.
Microstructure of Welds: Relation Between Process and Properties
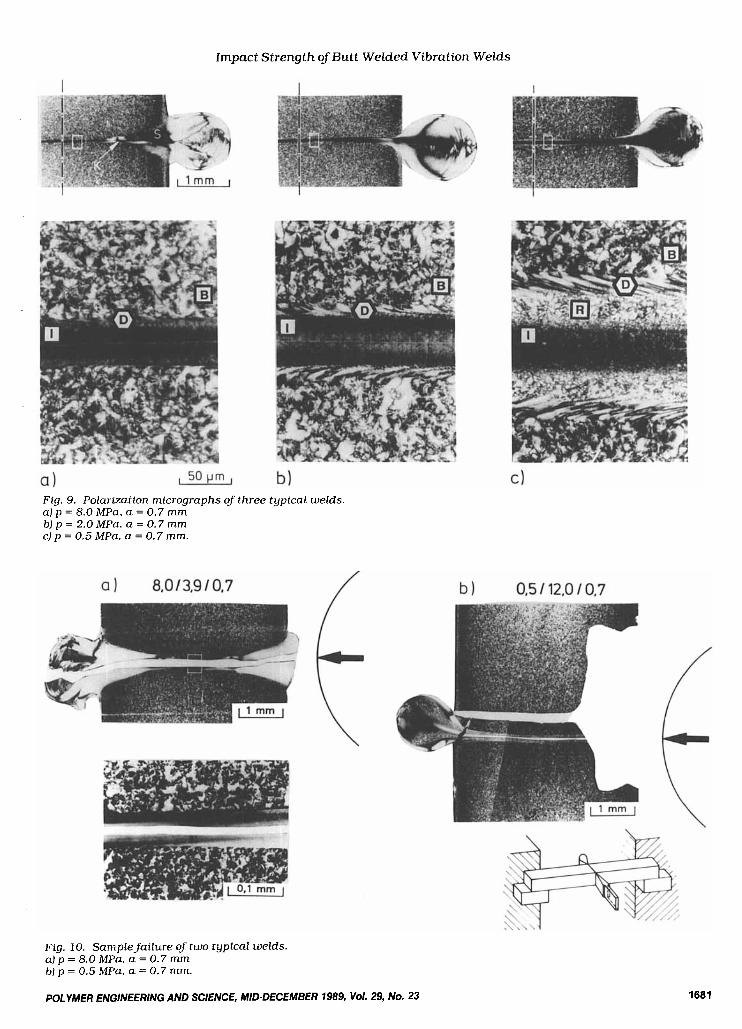
The microtomed slices from all welds, which were produced after reaching regime 3 of welding, showed three typical types under polarized light. Figure 9 shows the polarization micrographs of these typical welds. Each lower enlargement shows the section marked by the white square in the photograph di- rectly above.
The impact strength is low when the welds have a different appearance at the center line than at the outer edge of the bars as seen in the photograph
0
0
0 8 0
PENETRATION s 0.8mm AMPLITUDE a
0 a = 0.5 mm a a = 0.7 mm 0 a = 0.9 m m
0
0’ I 0 2 L 6 8 10
WELDING PRESSURE 1 MPo I Fig. 8. Impact strength at constant penetration us. weld- ing pressure with ampiitude as parameter.
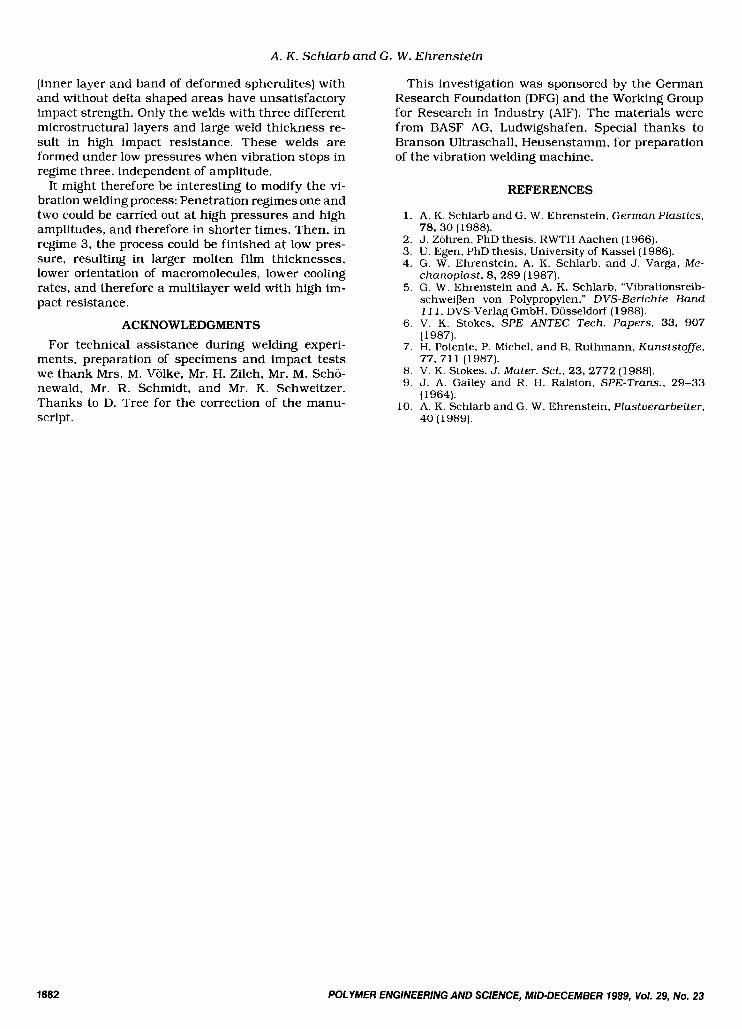
above Fig. 9a. While the weld thickness in the center of the bar is about 50 Fm, at the edge the weld opens to a delta shaped shear area (S ) with a maximum thickness from about 1 mm. The transition from the center region to the delta shaped area is formed by a so-called knotty point (K). At this point the melt flow passes over from laminar flow to melt fracture caused by elastic effects. The enlargement shows that the joining plane itself is characterized by an optically bright line. This line is followed by a layer without recognizable microstructure (I). Gailey and Ralston (9) presume from such microscopic appear- ance a pseudohexagonal structure. The transition from this layer to the bulk material (B) is formed by a thin band of deformed spherulites (D). During vi- bration, shear is greatest in the corresponding melt/ solid transition region and individual crystallites are pulled out of their ordered spherulitic structure by the flow (1). Such appearance is typical for welds generated at high pressure independent of the am- plitude. They fail during impact tests exactly in the joining plan as shown in Fig. 1 O a .
An increase in impact strength is observed for welds at a pressure of 2.0 MPa. Here, the entire weld is about 60 pm thick, and delta shaped shear areas are not present. Apart from the joining plane the microstructure of these welds shows only two other layers (Fig. 9b): the inner layer (I) without recogniz- able microstructure, and the transition layer to the bulk material, formed by deformed spherulites (D). The working amplitude influences the width of the zones but has no effect on the type of microstructure. With an increase of amplitude smaller layers of the same type are found.
High impact strengths are achieved when, apart from the joining plane, a weld has three microstruc- tural zones [Fig. 9c): First, the inner layer with some microspherulites, even though most areas in this layer are without recognizable microstructure. Sec- ond, a so-called recrystallized zone (R) with many spherulites of different size. Third, is a transition layer of deformed spherulites. In contrast to the two other types of welds, the width of the entire weld is about three times larger and there is an additional layer, the so-called recrystallized (R) zone. Such welds are formed when the process ends in penetra- tion regime 3 at low pressure, independent of ampli- tude. The failure during impact tests begins at the intersection of the welding flash with the bulk ma- terial and propagates through the bulk material (Fig. 1 O b ) , not the weld ( 1 0).
CONCLUSIONS In manufacturing, production time is the main
measure for efficiency. That is the reason for short cycle times in mass production.
The results of the investigations in this paper show that high amplitudes and high welding pressures result in shorter cycle times. However, in spite of reaching welding regime three, the impact strength is low. The microstructure determines the mechani- cal behavior of the welds. Welds with only two layers
1680 POLYMER ENGINEERING AND SCIENCE, MID-DECEMBER 1989, Vol. 29, No. 23
Impact Strength of Butt Welded Vibration Welds
Fig. 9. Polarization micrographs of three typical welds. a) p = 8.0 M P a , a = 0.7 rnrn blp=Z.OMPa, a=0.7rnm c) p = 0.5 M P a , a = 0.7 rnm.
Fig. 10. Samplefailure of two typical welds. a l p = 8.0 M P a , a = 0.7 mm bJ p = 0.5 M P a , a = 0.7 mm.
POLYMER ENGINEERING AND SCIENCE, MID-DECEMBER 7989, Vol. 29, NO. 23 1681
A. K. Schlarb and G. W. Ehrenstein
(inner layer and band of deformed spherulites) with and without delta shaped areas have unsatisfactory impact strength. Only the welds with three different microstructural layers and large weld thickness re- sult in high impact resistance. These welds are formed under low pressures when vibration stops in regime three, independent of amplitude.
It might therefore be interesting to modify the vi- bration welding process: Penetration regimes one and two could be carried out at high pressures and high amplitudes, and therefore in shorter times. Then, in regime 3, the process could be finished at low pres- sure, resulting in larger molten film thicknesses, lower orientation of macromolecules, lower cooling rates, and therefore a multilayer weld with high im- pact resistance.
ACKNOWLEDGMENTS For technical assistance during welding experi-
ments, preparation of specimens and impact tests we thank Mrs. M. Volke, Mr. H. Zilch, Mr. M. Scho- newald, Mr. R. Schmidt, and Mr. K. Schweitzer. Thanks to D. Tree for the correction of the manu- script.
This investigation was sponsored by the German Research Foundation (DFG) and the Working Group for Research in Industry (AIF). The materials were from BASF AG, Ludwigshafen. Special thanks to Branson Ultraschall, Heusenstamm, for preparation of the vibration welding machine.
REFERENCES
1. A. K. Schlarb and G. W. Ehrenstein, German Plastics, 78, 30 (1988).
2. J. Zohren, PhD thesis, RWTH Aachen (1966). 3. U. Egen. PhD thesis, University of Kassel(l986). 4. G. W. Ehrenstein. A. K. Schlarb, and J. Varga. Me-
chanoptast, 8, 289 (1987). 5 . G. W. Ehrenstein and A. K. Schlarb, “Vibrationsreib-
schweifien von Polypropylen,” DVS-Berichte Band 1 1 1, DVS-Verlag GmbH, Dusseldorf (1 988).
6. V. K. Stokes, SPE ANTEC Tech. Papers, 33, 907 (1987).
7. H. Potente, P. Michel, and B. Ruthmann, Kunststoffe, 77, 711 (1987).
8. V. K. Stokes, J. Mater. Sci., 23, 2772 (1988). 9. J. A. Gailey and R. H. Ralston, SPE-Trans., 29-33
(1964). 10. A. K. Schlarb and G. W. Ehrenstein, Plastuerarbeiter,
40 (1989).
1682 POLYMER ENGINEERING AND SCIENCE, MID-DECEMBER 1989, Vol. 29, NO. 23
Recommended