The Holy Day Effect
1
The Holy Day Effect
Mohamad Al-Ississ
The American University in Cairo
March 2015
Abstract
We use Muslim holy days to investigate the underlying mechanism behind
the holiday effect. Muslim holy days are exceptionally conducive to
isolating the holy day effect. The study documents a positive change in
stock returns during Ramadan. The significance and magnitude of the
effect is consistent with the heterogeneity of worship intensity during
Ramadan. Five possible causal channels are explored. We find support for
a change in the composition of traded stocks according to their riskiness
on holy days. Additionally, the mood channel is supported through
documenting a negative effect on Ashoura linked to the proportion of Shia
in a country.
JEL Classifications: D01, D03, D83, G10, Z12, Z13
[email protected]. All errors and opinions expressed herein are my own. My special gratitude goes to
Nolan Miller for his feedback. This paper benefited from the participants in the AALIMS conference on
Islam and Economic Development Conference, Duke University’s 2010. This paper is copyrighted by the
author. For permission to reproduce or to request a copy, contact the author.

The Holy Day Effect
2
“Discovery commences with the awareness of anomaly, i.e., with the recognition that nature has somehow
violated the paradigm-induced expectations that govern normal science.”
Thomas Kuhn
1. Introduction
Religion is a central force in the lives of people. It affects their preferences,
decision making, and mood. Can religion therefore affect the stock market?
This study uses Muslim holy days to better understand a well documented stock
market anomaly, the holiday affect: the tendency of stock markets to experience positive
returns prior to holidays on average. While the holiday effect is well documented, its
underlying drivers are not. The leading explanation focuses on the liquidity premium
story. It has also been suggested that mood, which has been documented to affect stock
market returns on other occasions, is the driving force behind the holiday effect. Yet,
separating these two mechanisms is difficult since main Western holidays fall on days
when markets are closed1. Additionally, the holiday effect is noisy for Western events
since they are potentially confounded with documented calendar effects.
Existing literature established abnormal stock returns in Muslim countries during
the Muslim holy month of Ramadan (Husain, 1998; Oguzsoy, 2004; Seyyed, Abraham,
and Al-Hajji, 2005; Al-Hajieh, Redhead, and Rodgers, 2011; Bialkowskia et al., 2012). In
addition to documenting the Ramadan effect, our paper extends existing research in a
number of ways. First, it investigates the effect at the company level, not the index level,
which enhances our understanding of the Ramadan effects and its causality. Second, this
paper uses the actual start dates of Ramadan as declared and practiced within each
country, not converted or calculated dates. Third, we explore the heterogeneity of
1 Frieder and Subrahmanyam (2004) examine stock returns on the St. Patrick's Day when
the market is open.

The Holy Day Effect
3
worship intensity within the month of Ramadan. Most importantly, this paper tests for the
underlying mechanism behind the Ramadan effect.
Muslim holidays are well positioned to investigate the holiday effect and isolate
its underlying mechanism. First, markets remain open during important Muslim holy
days which are observed by overwhelming majorities of the population. Second, naturally
occurring factors in the Islamic calendar enable the decoupling of the mood effect from
other contaminants. The annual shift of the Muslim Hijri calendar vis-à-vis the Gregorian
one permits us to separate the holy day effect from calendar effects. The different
methods Muslim countries use to determine the beginning of lunar Hijri months isolate
the holy day effect from contemporaneous events. The built-in alternating worship
intensity within the month of Ramadan allows a precise test of mood effects.
The first part of this paper documents positive changes on holy days in the returns
of ten Muslim financial markets over the period 1995-2012. The paper uses the inherent
heterogeneity of worship intensity within the month of Ramadan as a robustness check to
test that the documented positive effect on returns is driven by holy days. The religious
significance for Ramadan’s last odd days is higher than its last five even ones. Consistent
with this, we document a statistically significant 0.140% increase in returns on
Ramadan’s last five odd days. The intensity of faith experience culminates on Ramadan’s
27th
day when returns increase a statistically significant 0.452%.
The second part of the paper explores the underlying mechanism behind the holy
days effect. Five potential channels are explored. The first is the liquidity premium
channel whereby traders are receiving higher returns due to decreased liquidity on holy

The Holy Day Effect
4
days. Yet, abnormal returns during Ramadan persist even after controlling for change in
volume on holy days.
The second channel is a change in the composition of traders on holy days due to
decreased (or increased) participation by religiously observant traders on holy days. We
investigate this channel though separating companies according to their compliance with
Islamic law, Shariah. However, we do not find support for this channel.
The third channel separates the physical aspects of fasting from the spiritual ones
using the daily temperatures in the cities of the stock exchanges. We document a positive
main holy day channel, and a negative effect on warmer holy days. The latter effect can
be seen as the physical effect of fasting on stocks.
The fourth channel is a change in the composition of traded stocks as a result of
physical attributes associated with fasting such as fatigue which may lead traders to avoid
riskier stocks. We test for this channel through dividing companies into ten deciles based
on their market capitalization to proxy for their riskiness. We find evidence in support of
this channel.
Finally, we explore and find support for mood as a potential driver for the holy
day effect. We investigate the behavior of returns on Ashoura which is a Muslim holy
day with a different emotional valence from Ramadan, especially for Shia Muslims. We
find that an increase of 1% in the proportion of Shia in a country is associated with a
statistically significant drop of 12.13% % in returns on Ashoura. The remainder of the
paper is organized as follows: Section 2 presents an overview of relevant literature,
section 3 demonstrates the attributes of the Muslim Hijri calendar that are especially
conducive for this research, section 4 describes the methodology and data, section 5

The Holy Day Effect
5
presents the results, section 6 checks the econometric robustness of these results, section
7 investigates potential mechanisms, and section 8 concludes.
2. Relevant Literature
Our study extends existing scholarship in three strands of literature. First, we
extend research on the holiday effect by separating the psychological aspects of the
holiday from the actual market closure. Second, we contribute to the study of the impact
of mood on decision making. Third, we add to the sparse work on the impact of religious
experience on stock markets.
Past research has documented a number of regularities in stock market returns on
the turn of the year, month, week, and day, and around holidays (for a thorough review
see Thaler (1987) and Jacobs and Levy (1988). Lakonishok and Smidt (1988) use ninety
years of DJIA daily returns to investigate the holiday effect. “The average preholiday
rate of return is 0.220 percent for the total sample, compared with the regular daily rate of
return of 0.0094 percent per day. Therefore, the preholiday rate of return is 23 times
larger than the regular daily rate of return, and holidays account for about 50 percent of
the price increase in the DJIA.” Furthermore, they find that the sub period results are
mostly consistent with overall results. Lakonishok and Smidt (1988) show that the
holiday effect is different from other documented seasonal anomalies. Of interest, the
authors find that “preholiday rates of return are generally two to five times larger than
preweekend rates of return. Therefore, there appears to be an additional factor at work”.
Pettengill (1989) confirms the finding that preholiday returns are higher than
other days, regardless of the size of firms. Ariel (1990) also finds a statistically
significant 10 fold increase in pre-holiday returns in the US, during the period 1963-

The Holy Day Effect
6
1982. The holiday effect has been also documented by Kim and Park (1994) across
different US stock markets such as the NYSE, AMEX, and Nasdaq. Furthermore, this
effect has been found in countries other than the US, such as Italy by Barone (1990),
Canada, Japan, Australia, and Hong Kong by Cadsby and Ratner (1992), Japan and UK
by Kim and Park (1994), New Zealand by Vos et al. (1993).
The leading explanation for the holiday anomaly focuses on limiting risk
exposure while the market is closed (Amihud and Mendelson, 1987). Nonetheless, Jacobs
and Levy (1988) point out that “while no fully satisfactory explanation of the holiday
effect has yet surfaced, psychological reasons appear to be the most promising”. Indeed,
there is an increasing literature that investigates the psychological drivers associated with
the nature of these holidays per se, not the closure of the market. To that end,
abnormalities in market return have been examined around the lunar new year in Asia
(Wong et al., 1990; Tong, 1992; Yen and Shyy, 1993; Chan, Khanthavlt and Thomas,
1996). Kuo et al. (2010) document a negative effect associated with the full moon
festival which is associated with nostalgia and negative associations. Psychological
explanations are especially plausible in light of the increasing literature linking the mood
of investors to changes in stock returns. Yet the task of separating the effect of widely
observed religious and cultural holidays from market closure is a challenging one given
that the two often coincide. Wu (2013) investigates the lunar new year using Chinese
stocks traded in the US to bypass market closure.
Emotions and moods have been documented to effect the decision making of
individuals Bagozzi, Gopinath, and Nyer (1999). Moods influence judgment regarding
uncertain future events, with positive mood leading to a more positive evaluation in a
The Holy Day Effect
7
number of situations, Wright and Bower (1992). Of special relevance to financial markets
is the finding that moods influence peoples’ judgment of risk, Johnson and Tversky
(1983). For a review of the impact of mood on decision making see Loewenstein et al.
(2001) and Hirshleifer and Shumway (2003).
A number of studies have linked mood effects to returns of financial markets.
Saunders (1993) reports negative NYSE index returns when it is cloudy in New York.
Kamstra, Kramer, and Levi (2000) report negative returns following daylight savings
time changes. Hirshleifer and Shumway (2003) find a strong statistical relationship
between morning sunshine and stock exchange returns. Kamstra, Kramer, and Levi
(2003) document the effect of seasonal affective disorder (SAD) and stock market
returns. This study further contributes to this growing body of literature.
Finally, investigating the holiday effect through examining Muslim holy days
enhances our understanding of the impact of religious experience on financial markets
One of the few studies on this topic is Frieder and Subrahmanyam (2004) which
examines the impact of the Jewish holy days of Rosh Hashanah and Yom Kippur and the
Catholic Irish one of St. Patrick’s on the MSCI index. They report significant positive
returns on Rosh Hashanah and the days that precede it and on the days that precede St.
Patrick’s Day. They also report a significant impact on trading volumes.
Recently, important contributions have established abnormal returns during
Ramadan. Husain (1998), Oguzsoy (2004) and Seyyed, Abraham, and Al-Hajji (2005)
investigate the effect of Ramadan on the Karachi, Istanbul, and Saudi Stock Exchanges,
respectively. The study on the Istanbul stock exchange documents higher returns during
Ramadan, but not for Karachi and Saudi stock exchanges.

The Holy Day Effect
8
Al-Hajieh, Redhead, and Rodgers (2011) document a positive return during
Ramadan as a whole for a subset of Middle Eastern countries. The study converts
Gregorian dates to the Muslim Hijri ones to investigate the Ramadan effect. The paper
documents positive calendar effects during Ramadan and suspects that mood changes
might cause this anomaly.
Bialkowskia et al. (2012) investigate the Ramadan effect on the Morgan Stanley
Capital International indices of 14 stock exchanges in predominantly Muslim countries
over the years 1989–2007. The study uses latitude and longitude data of the stock
exchanges to determine Ramadan's start. They find that stock returns during Ramadan are
significantly higher than the rest of the year. The authors exclude the liquidity effect and
other seasonal effect as explanations for their observed results and "believe that the
Ramadan effect documented in this paper can best be explained by a change in investor
psychology". In closing the authors encourage further study of the Ramadan effect at the
company level to better understand the driver of the effect, which is what we do in this
paper.
3. Isolating the Holy Day Using the Hijri Calendar
We use Muslim holy days to investigate the impact of religious experience on the
returns of Muslim financial markets. Specifically, the study focuses on an important
Muslim holy day, Ramadan. It is the ninth month of the Muslim Hijri calendar during
which the Quran was revealed to the prophet Mohamad, observed by both Sunni and Shia
Muslims. Fasting during Ramadan is mandatory for Muslims and one of Islam’s five
pillars. During the fast, Muslims do not eat or drink anything from dawn until sunset. It is
a month of heightened religiosity and faith. In addition to fasting, Muslims put more

The Holy Day Effect
9
emphasis on praying, reciting the Quran and giving charity in anticipation of capturing
the month’s promised wealth of blessings.
The use of Muslim holy days is particularly well suited for investigating the
relationship between faith and financial market returns for a number of reasons. First,
these holy days are widely observed on a religious and cultural level by an overwhelming
proportion of the population in the countries under investigation. The wide spread
observance of Ramadan allows for a more measured impact. Additionally, most financial
markets remain open during these holy days.
Second, unlike secular and Christian holidays, Islamic holy days follow a purely
lunar Islamic (Hijri) calendar, not the solar Gregorian calendar. The Muslim Hijri year is
about 11 days shorter than the Gregorian year. This means that while Muslim holy days
fall on the same day of the Hijri calendar, they actually shift days and months each year
on the Gregorian calendar. For example, the first day of Ramadan as declared by Saudi
Arabia shifted backwards by about nine months over twenty-five years, beginning on
April 28th
in 1987 and commencing on August 1st in 2011. Given that the majority of
businesses in these countries follow a Gregorian, not Hijri, fiscal calendar, this enables us
to isolate the faith effect from the established fiscal calendar anomalies, seasonal and
weather effects mentioned in the aforementioned mood literature.
Third, each Muslim country follows an independent and often different method to
determine the start of the lunar month. Countries ascertain the beginning of lunar months
using a variety of methods that range from rudimentary eyewitness observations of the
new crescent to advanced astronomical calculations. Thus, Islamic holy days fall on

The Holy Day Effect
10
different days within the same Hijri year across Muslim countries. This enables us to
lessen the impact of other contemporaneous effects and cross market linkages.
Fourth, the study utilizes the fact that the intensity of worship is not constant
throughout the month of Ramadan. We use this inherent heterogeneity in the intensity of
religious experience within Ramadan to isolate faith from other non-faith aspects of this
holy month. While some of the studies mentioned above did not document a Ramadan
effect on financial markets, our study is the first to utilize this unique attribute of
heterogeneity. The month of Ramadan is perceived as consisting of three parts, equal in
length but different in promised rewards, characteristics, and intensity of worship2.
The last third of Ramadan is perceived as the most blessed part during which
Muslims increase their worship and experience of faith. The last ten days of Ramadan
contain the holiest night in the Islamic calendar, Laylat Al-Qadr, the Night of Destiny,
when the Quran was first revealed to the prophet Mohamad3.
While it has not been revealed on which of the last ten days of Ramadan the Night
of Destiny falls, many Muslim scholars and certainly an overwhelming majority of
Muslims believe that the Night of Destiny occurs on one of last five odd numbered nights
of Ramadan, i.e. the 21st, 23
rd, 25
th, 27
th or 29
th of Ramadan
4. Of these five days, the
Night of Destiny is believed by most Muslims to occur on the eve of Ramadan 27th
. This
2 The following Hadith (saying of the prophet Mohamad) documents that: “The first part [of Ramadan]
brings God’s Mercy, the middle of which brings God’s forgiveness and the last part of which brings
emancipation from hellfire.” Ibn Khuzaymah, 3: 191. 3 The following Quran verses document the sanctity of this night:
“97:1 We revealed it [the Quran] on the Night of Destiny.
97:2 And what will explain to thee what the Night of Destiny is?
97:3 The Night of Destiny is better than a thousand months.
97:4 The angels and the Spirit descend therein, by the permission of their Lord, with all decrees.
97:5 (The night is) Peace until the rising of the dawn.” (The Holy Quran, 97:1-5) 4 The following Hadith supports this argument: "Search for the Night of Destiny in the odd nights of the
last ten days of Ramadan” Bukhari, (3(32): 234).

The Holy Day Effect
11
night witnesses the culmination of faith practice in the Islamic calendar as Muslims spend
it in prayer and Quran recitation in mosques until the break of dawn. Most television and
radio stations in Muslim countries suspend their programming to air live broadcasts of
the conclusion of the Quran recitation from the Grand Mosque in Mecca. Religious
experience, and therefore its impact on financial markets, will be amplified on the more
sacred odd days at the end of Ramadan and culminate on its 27th
day.
4. Methodology and Data
Our dataset comprises all firms listed in the stock exchanges of the ten Muslim
countries that are reported by Compustat during the period January 1, 1995 till August
31, 2012.5 This time period represents the earliest available data, in particular for trading
volume data. We evaluate the impact of faith on financial markets by regressing daily
returns (Reti,,j,t) on a dummy variable (Holy_Dayj,t) that takes the value one if day (t)
was a holy day in country (j), and zero otherwise. As per Saunders (1993), we include
day of the week and month of the year dummies to control for calendar and seasonal
regularities. The daily return of MSCI World Index is also included to control for global
financial movements. As per Saunders (1993), we include the lagged return of the
previous two trading days to account for nonsynchronous trading effects and control for
potential missing variable bias (see Akgiray, 1989)6. As the aim of this study is to
document the holy day effect and its underlying causes, and not explore the viability of
financially exploiting it, we ignore trading and other transaction costs. We use fixed
5 Previous versions of this paper used stock exchange indices, not individual firms, to investigate the effect.
To maintain a consistent dataset within this version, we dropped countries whose individual company stock
information are not reported on Compustat. 6 Including lagged returns for the previous one hundred trading days does not alter the overall results nor
their significance.

The Holy Day Effect
12
effects at the firm level and date levels using Stata’s –xtivreg2- command, and include
dummies at the country level. We use robust Newey and West (1987)
heteroskedasticity-autocorrelation-consistent
standard errors with twelve lags7. The
following regression is estimated to capture the effect on daily returns:
Reti,t = β0 + β1 Holy_Day i,t + β2 MSCI t + β3 + β4
+ β5 Reti,t-1 + β6
Reti,t-2 + ε
where:
Reti,j,t = the arithmetic stock return of firm (i) on day (t) which is listed in
country (j).
Holy_Dayj,t = a dummy variable that takes the value 1 if day (t) is a holy day in
country(j) , and 0 otherwise.
Dt = day of the week dummy variable with Tuesday omitted.
Mt = month of the year dummy variable with April omitted.
MSCI t = the return of MSCI World Index on day (t).
We examine the effect of seven classifications of holy days as explained in the
previous section:
Ramadanj,t = a dummy variable that takes the value 1 if day (t) is part of
the month of Ramadan in country (j), and 0 otherwise.
Ramadan_1-10j,t = a dummy variable that takes the value 1 if day (t) falls on
days 1-10 of Ramadan in country (j), and 0 otherwise.
Ramadan_11-20j,t = a dummy variable that takes the value 1 if day (t) falls on
days 11-20 of Ramadan in country (j), and 0 otherwise.
Ramadan_21-30j,t = a dummy variable that takes the value 1 if day (t) falls on
days 21-30 of Ramadan in country (j), and 0 otherwise.
Odd_Daysj,t = a dummy variable that takes the value 1 if day (t) is on the
21st, 23
rd, 25
th, 27
th, or 29
th day of Ramadan in country (j),
7 Newey and West standard errors are estimated with 12 lags. The lag number is calculated based on the
rule of thumb: Lags= . Where (T) is the longest number of observations for any firm, which in
our case T=4080. We tested the robustness of our results to increased lag periods up to 55 lags with no
important changes to our conclusions.

The Holy Day Effect
13
and 0 otherwise.
Even_Daysj,t = a dummy variable that takes the value 1 if day (t) is on the
22nd
, 24th
, 26th
, 28th
, or 30th
day of Ramadan in country (j),
and 0 otherwise.
Ramadan 21j,t -
Ramadan 30j,t
= a dummy variable that takes the value 1 if day (t) is on day
(z) of Ramadan in country (j), and 0 otherwise. Z ϵ (21-30).
The key challenge to conducting this study is converting the Hijri dates for each
country to Gregorian equivalents in order to determine the exact Gregorian date for the
holy days within each country for the time period under investigation. As mentioned in
the previous section, each Muslim country declares the beginning of lunar months and
hence the dates of holy days independently. Moreover, countries generally do not keep
official records of their past lunar month proclamations. Thus, finding each country’s
Hijri/Gregorian date equivalent is labor intensive and challenging. We used microfilms of
official newspapers archives, formal legislations and decrees from these countries which
often report both Hijri and Gregorian dates to establish the exact Hijri calendar for each
included country. We established holy day dates for each of the 10 countries in the
sample for each year of our timeframe 1995-2012. Table 1 lists summary statistics for the
stock exchanges such as market capitalization, percent of local trading and number of
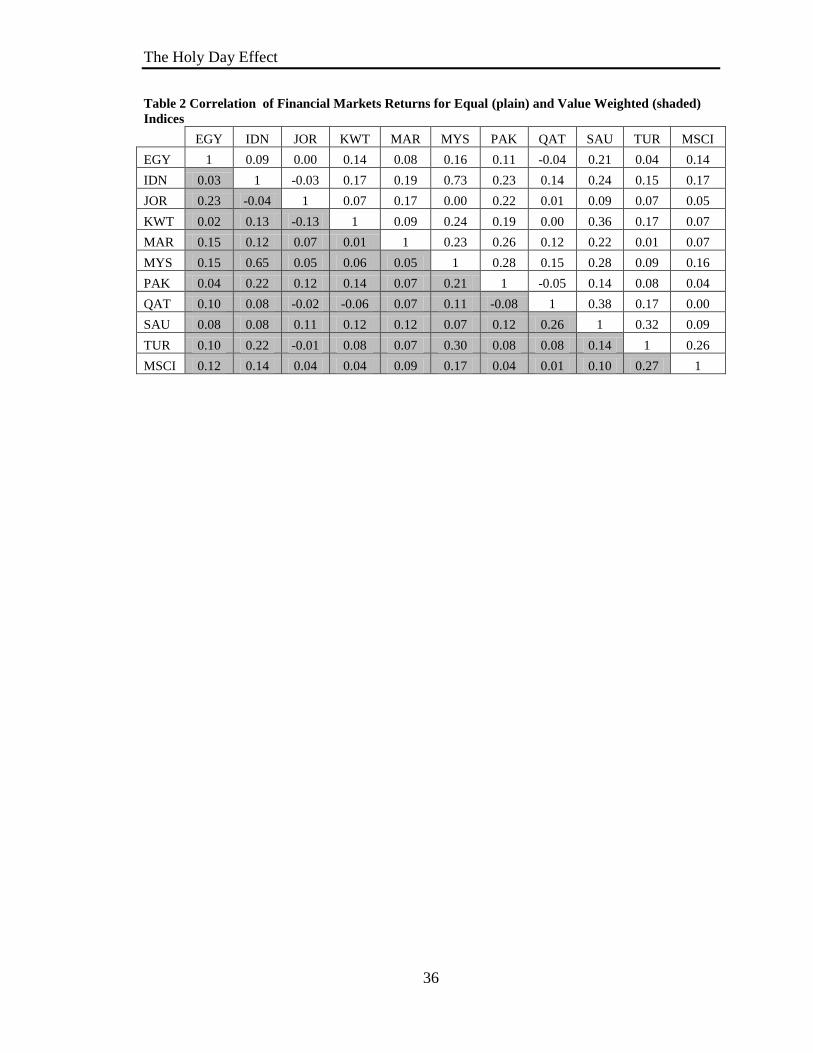
listed companies. Table 2 presents the correlation of returns of equally weighted and
value-weighted indices between each of the ten used financial markets in addition to the
MSCI. The table shows that the stock markets of Malaysia and Indonesia are most
correlated. The average correlation among the ten countries equally weighted and value
weighted indices is 0.10 and 0.15 respectively. Turkey’s stock market is most correlated
with the MSCI World Index with a correlation factor of 0.27. Table 3 lists summary
statistics of used variables.

The Holy Day Effect
14
5. Results
Figure 1 below depicts the mean of daily returns on holy days and all other days. The
means and their descriptive statistics are listed in Table 4. Consistent with our
predictions, returns on holy days differ from those on all other days. Returns during
Ramadan increase 0.051%. Returns drop 0.152% during Ramadan's first third, but they
increase during its second third, its last five odd days and its 27th
day by 0.193%, 0.185%
and 0.524%, respectively. The aforementioned results are statistically different from
those on other days. It is worth noting that while the last five odd days are significantly
different than all other days, returns during its last five even days are not.
Insert Table 4 here.
Figure 1 Mean Daily Returns on Holy Days and All Other Days
Table 5 reports regression results for stock returns on holy days, controlling for
the MSCI, day of the week, and month of the year. Naïve regressions excluding these
0.05
-0.15
0.19
0.12
0.18
0.05
0.52
0.06 0.10
-0.2
-0.1
0.0
0.1
0.2
0.3
0.4
0.5
0.6
Ram
adan
Ram
adan
1-1
0
Ram
adan
11
-20
Ram
adan
21
-30
Od
d D
ays
Even
Day
s
Ram
adan
27
th
Ash
ou
ra
All
Oth
er D
ays
Ave
rage
Re
turn
%

The Holy Day Effect
15
controls are available upon request and are essentially similar to those with controls with
no changes to our conclusions. Table 5 shows that returns during the month of Ramadan
as a whole are not statistically significant (Column 1). Its first ten days are associated
with 0.140% decrease in daily returns (Column 2). On the other hand, returns during
Ramadan’s second and third ten days are associated with increases of 0.089% and
0.042% respectively (Column 2). This result is consistent with Bialkowski et al. (2012)
which finds that returns are higher in the last days of Ramadan than its start. The positive
impact of Ramadan increases on the days associated with higher worship intensity. The
daily returns during the last five odd days of Ramadan are 0.140% higher than all other
days (Column 3).Interestingly, returns on the last five even days of Ramadan decrease by
0.059% (Column 3). Finally, among the last ten days of Ramadan, the last five days of
Ramadan have positive returns with days 29 and 27 registering the highest increase in
returns at 0.784% and 0.452%, respectively (Column 4).
Insert Table 5 here.
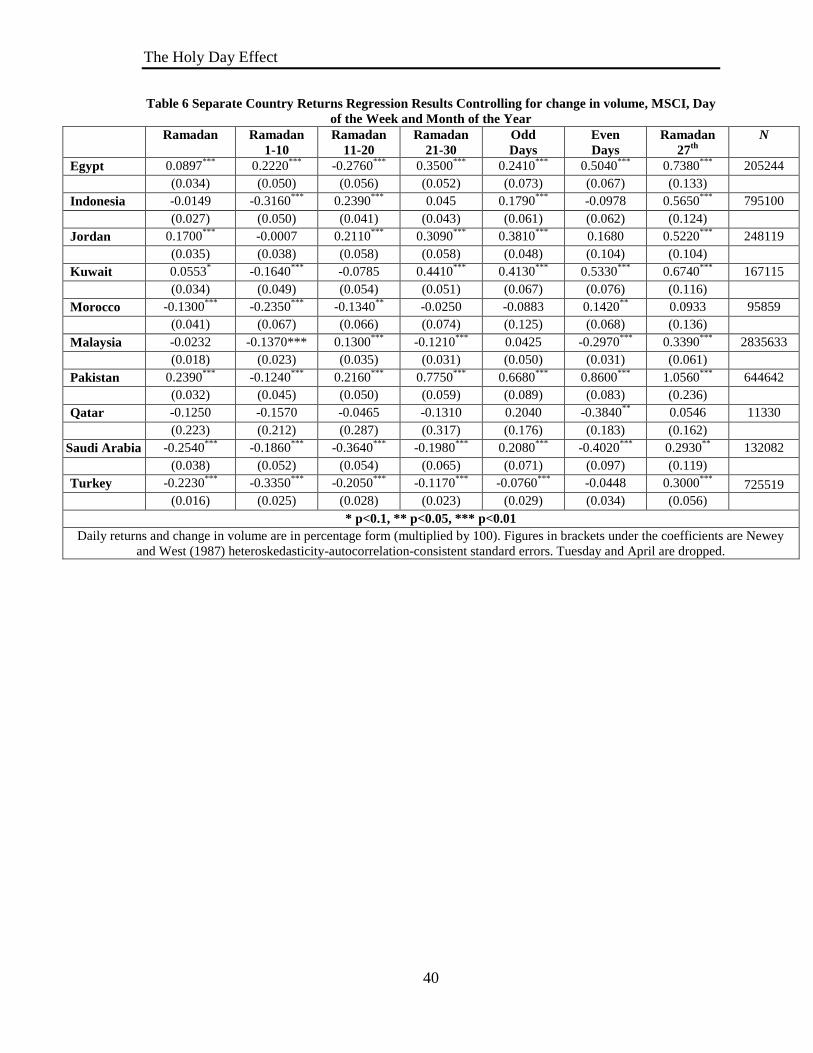
Country-by-country regression results for stock returns on holy days are listed in
Table 6. These regressions control for the volume, MSCI, day of the week, and month of
the year. The results show that for our two key holy day categories, Odd-Days and
Ramadan 27th
, the holy day effect holds, for the most part, on an individual country basis.
Returns on Ramadan’s last five odd days are positive in six of the ten countries, negative
in Turkey and not significant in Morocco, Malaysia and Qatar. Returns on Ramadan 27th
are positive and significant for all countries except for Morocco and Qatar where they are
not significant.
Insert Table 6 here.

The Holy Day Effect
16
6. Robustness
Petersen (2009) shows that a key concern when dealing with panel time series is
correlation of the error terms within firms across time (firm effect) and across firms at a
moment in time (time effect). We use two approaches to address this concern.
First, we form an equally-weighted index from the individual firms to avoid cross
sectional autocorrelation. Ideally we will form a single index across all firms and
countries. However given that the holy days occur on different days across different
countries we are unable to do that. Therefore, we construct an equally weighted index for
each country. We also use value-weighted indices that are reported by these stock
exchanges. We use the return of those two indices as dependent variable in two separate
regressions. As per Saunders (1993), we include the lagged return of the previous two
trading days to account for non-synchronous trading effects and control for potential
missing variable bias (see Akgiray, 1989)8. We also include country level dummies for
each of our ten countries. In addition, we control for the return of the MSCI, day of the
week and month of the year. We estimate:
Index_Reti,t
=
Β0 + β1 Holy_Day I,t + β2 MSCI t + β3 + β4
+
β5 Indexi,t-1 + β6 Indexi,t-2 + β7 + ε
where,
Index_Reti,t The Return of an equally-weighted or value-weighted index of firms in
country (i) on day (t).
Indexi,t-1 One trading day lagged Indexi
8 Including lagged returns for the previous one hundred trading days does not alter the overall results nor
their significance.

The Holy Day Effect
17
Indexi,t-2 Two trading days lagged Indexi
Second, we cluster standard errors on both dimensions country level and time.
The clustering is performed as per Thompson (2006) and Cameron, Gelbach and Miller
(2006) which show that clustering on both dimension simultaneously accounts for the
firm and time effects. We use the Stata ado command -cluster2- written by Mitchell
Petersen.
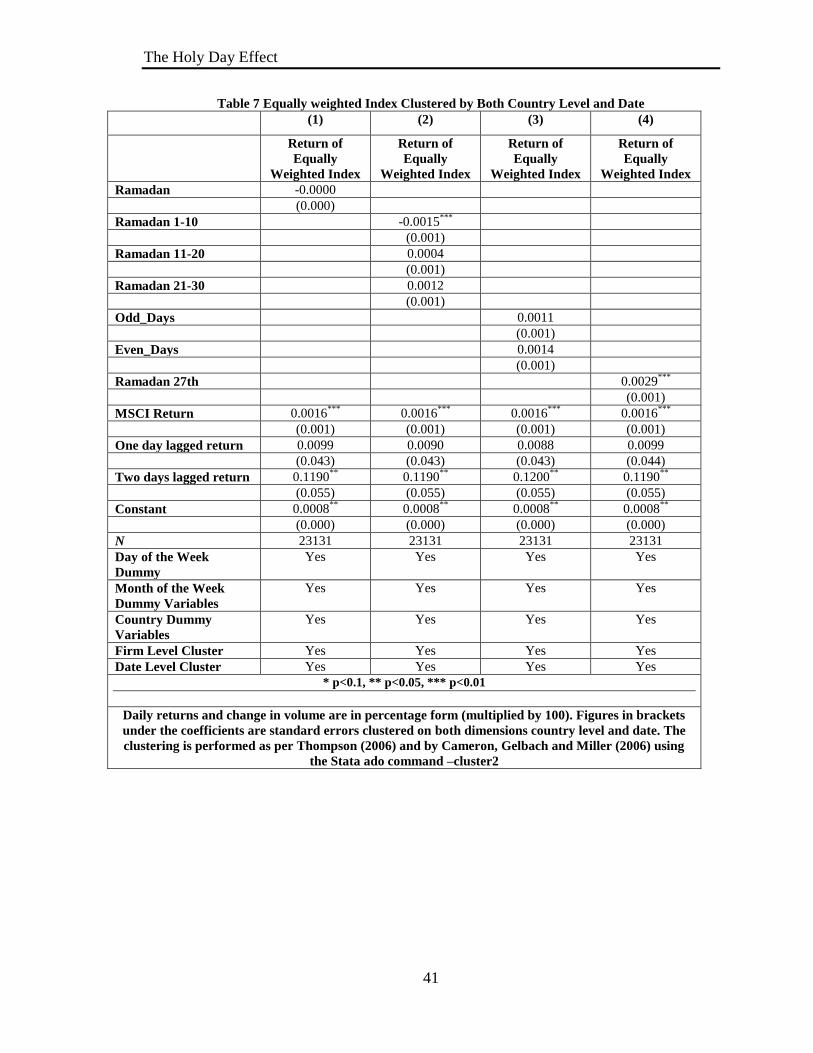
Insert Table 7 here.
Insert Table 8 here.
Tables 7 and 8 list the results of the equally-weighted and value-weighted indices
respectively clustered by both country level and date9. For the equally weighted index,
Ramadan’s first ten days and Ramadan 27th
are associated with a drop of 0.001% and
increase of 0.003% in returns, respectively. Ramadan’s second and last thirds, last five
odd and event days are not statistically significant.
In the case of the value weighted index, Ramadan’s last ten days, last five odd
days, and Ramadan 27 are associated with a 0.250%, 0.244%, and 0.496% statistically
significant increases in returns at the 5% level. The last five even days are associated with
an increase of 0.251% which significant at the 10% level. Ramadan as a whole, its first
and second ten days are not statistically significant.
Additionally, we test the sensitivity of our key findings to all possible
combinations of inclusion/exclusion of all control variables using Stata’s –checkrob-
command. The sensitivity analysis results in Table 9 shows that Ramadan’s last ten days,
9 The results for the equally-weighted index also confirm the main findings, but have been omitted for
brevity. Please contact the author to access them.

The Holy Day Effect
18
its last five odd days, and Ramadan 27th
remain positive and statistically significant 100
percent of the time regardless of the combination of control variables.
Insert Table 9 here.
7. Investigating the Underlying Mechanism:
A discussion of the mechanism underlying the holy day effect is in order. Short of
a divine intervention, well beyond the earthly confines of this paper, five channels can
lead to the statistically significant impact of holy days on market returns. The first
channel is that higher returns on Ramadan are resulting from the liquidity premium
demanded by active participants during the decreased market capitalization on holy days.
The second channel posits that the holy days effect is resulting from an alteration in the
composition of active traders. The third and fourth channels explore whether the effect
results from a change in the composition of traded stocks. The fifth channel is that the
heightened faith experience on holy days affects the mood of investors, thus affecting
their decision making process. We will investigate all these channels given that they are
not mutually exclusive.
The first channel is a liquidity premium story. It predicts that, on average, trading
volume would decrease as a result of physical exhaustion from fasting. This decrease can
impact firms across the board or especially riskier stocks which require higher
concentration and therefore are avoided by fasting traders. As a result of the drop in
trading volume, active participants expect a liquidity premium.
If the observed effect on stock returns is resulting solely from the change in traded
volume on holy days, then the holy day impact on market returns would be eliminated or
The Holy Day Effect
19
severely reduced when controlling for the level of traded volume in the returns
regression. If however, another mechanism is contributing to or causing the change then
controlling for volume in the return regression will not eliminate the holy day effect. To
test this, we estimate the following firm-date fixed effect panel regression using Stata’s –
xtivreg2- command and include country fixed effect dummy controls. We use robust
Newey and West (1987) heteroskedasticity-autocorrelation-consistent standard errors
with twelve lags:
Reti,t = β0 + β1 Holy_Day i,t + β2 Vol i,t + β3 MSCI t + β4 + β5
+ β6
Reti,t-1 + β7 Reti,t-2 + ε
where:
Voli,t = the trading volume of firm i on day t.
The results are listed in Table 10. Controlling for traded volume has not affected
the statistical significance or direction of the holy day effect on the return of stocks.
Insert Table 10 here.
The second channel which may cause the holy day effect is an alteration in the
composition of the active traders themselves due to a change in the trading behavior of
more religious traders on holy days. Shifting the composition of the pool of active traders
towards or away from more religious traders on holy days might affect the composition
of traded stocks these days.
To test for this second mechanism, we would ideally use identifying data on the
composition of active traders in a given day, and look for changes in the composition of
the pool of traders on holy days. However, such data is not publicly reported for any of

The Holy Day Effect
20
the investigated stock markets due to obvious confidentiality and liability concerns.
Therefore, in order to test for the first mechanism, we resort to an indirect test to separate
traders by their religious capital. Specifically, we look for a change in the composition of
traded stocks that is associated with a shift in the composition of traders towards (or away
from) religiously observant traders. Observant Muslim traders steer away from trading in
non-Shariah compliant stocks. Shariah is the Islamic law code which regulates many
aspects of Muslim daily life, including the type of permissible investments. Islamic law
prohibits observant Muslims from investing in firms with a debt to equity ratio higher
than 33% or those whose revenue stream comes from economic activities that are
outlawed in Islamic law. These non-Shariah compliant activities include alcohol,
gambling, tobacco, adult entertainment, pork products, arms and weapons, financial and
insurance companies. Firms that function in any of these according to their North
American Industry Classification System (NAICS) code are designated non-Shariah
compliant. NAICS codes are obtained from the Compustat Database. The market
capitalization of Shariah compliant companies is 36% of the total market capitalization in
the dataset. We use this separating behavior between traders based on their religiosity to
investigate whether the composition of active traders changes on holy days. To this end,
we estimate the following Hausman Taylor model to maintain firm-date fixed effects
while exploring Shariah attributes that are constant within the panel using Stata’s -
xthtaylor- command:
Voli,t = β0 + β1 Holy_Day j,t + β2 Shariahi + β3 (Shariahi X
Holy_Dayj,t) + β4 Muslimj + β5 MSCI t + β6
+ β7 + β8 Voli,t-1 + β9 Voli,t-2 + ε
where,
The Holy Day Effect
21
Shariahi = a dummy variable that takes the value 1 if firm (i) is Shariah
compliant, and 0 otherwise.
We assume that on non-holy days, both religiously observant and non observant
traders trade Shariah compliant firms, but only non-religiously observant ones trade non-
Shariah compliant firms. Therefore, if fewer religiously observant traders participate in
the trading activity on holy days, the traded volume of Shariah compliant firms decreases
while that of non-Shariah compliant firms remains the same. If this argument holds, the
coefficient of the interaction term (Shariahi X Holy_Dayj,t) should be negative and
significant. The results of this regression are listed in Table 11. The coefficients of the
interaction terms (Shariah X Holy_Dayi,t) are not statistically significant except for the
last ten days and the five even days where it is positive and significant at the 10% and 5%
levels, respectively. This indicates that the proportion of religious traders active on the
holy days under investigation is more on the last five even days and last ten days, but not
different on our two key categories of holy days, the last five odd days and Ramadan 27th
.
Therefore the second mechanism is not supported.
Insert Table 11 here.
The third mechanism explores whether the composition of traded stock changes
due to physical aspects associated with worship. For example, perhaps trading in risky
stocks requires higher concentration which leads fasting traders to steer away from such
stocks. We test for this by analyzing the Holy Day effect on days when fasting is more
physically strenuous in order to separate physical aspect of the fast from the spiritual one.
We examine the effect of high temperatures on returns in Ramadan. Since fasting
Muslims abstain from eating and drinking anything, even water, fasting is harder on

The Holy Day Effect
22
hotter days and subjects the body to increased dehydration. We run the following firm-
date fixed effect panel regression using Stata’s –xtivreg2- command and include country
fixed effect dummy controls. We use robust Newey and West (1987) heteroskedasticity-
autocorrelation-consistent standard errors with twelve lags:
Reti,t = β0 + β1 Holy_Day i,t + β2 Tempj,t +β3 (Tempj,t x Holy_Dayj,t ) + β4 Voli,t
+ β5 MSCI t + β6 + β7
+ β8 Reti,t-1 + β9 Reti,t-2 + ε
where:
Tempj,t = The actual maximum daily temperature on day (t) in the city where
the stock exchange of firm (i) is listed. Measured in Fahrenheit and
obtained from the National Oceanic and Atmospheric Administration.
Insert Table 12 here.
Table 12 displays the results of the aforementioned regression. The coefficients of
Ramadan as a whole are positive and significant, with the exception of its first ten days
which is not significant. The interaction term between the holy days and the temperature
is negative and significant for all categories of holy days except for its first ten days. It is
worth noting, that upon controlling for temperature, the coefficient for Ramadan as a
whole and the last five even days become positive and significant. Thus, while returns
increase on Ramadan’s holy days, they decrease on hotter holy days. The previous test
provides indication of two effects on returns, a negative effect linked to physical aspects
of the fast, and a positive effect. The positive effect itself can result from a change in the
composition of traded stocks due to fasting or can be driven by the mood of traders.10
10
It is worth noting here the relationship between temperatures and return is positive as opposed to the
finding of Cao and Wei (2005). However, it should be noted that Cao and Wei (2005) test average daily
temperature while we test the actual maximum temperature on a given day. Unlike Cao and Wei (2005),

The Holy Day Effect
23
The fourth mechanism investigates whether the composition of traded stocks
changes on holy days due to changes in risk tolerance of physically exhausted traders. To
test for this mechanism, we look for a change in the composition of traded stocks that is
consistent with a change in risk tolerance. We use the market capitalization of firms as a
proxy for their risk. Firms with smaller market capitalization can be viewed as illiquid
and have higher transaction costs as per Amihud and Mendelson (1986). Smaller size can
also reflect lower ability to absorb shocks. Consistent with these arguments, market
capitalization has been found by Banz (1981), Reinganum (1981), and Fama and French
(1992) to be negatively correlated with the return of firms.
To test for a change in the risk tolerance of traders on holy days, we divide our
portfolio into ten deciles based on firm’s average market capitalization across the whole
period. Daily market capitalizations are calculated in US dollars using monthly exchange
rates from the CEIC database. We include a dummy for each decile and an interaction
variable for the deciles and the holy day dummy. We estimate the following Hausman
Taylor model to maintain firm-date fixed effects while exploring decile attributes that are
constant within the panel:
Voli,j,t = β0 +
+ β2 Holy_Day j,t +
( X Holy_Dayj,t) + β4 MSCI t + β5
+
+ β7 Voli,t-1 + β8 Voli,t-2 + ε
where,
Mkt_Decilei = Ten dummy variables that take the value 1 if firm (i) is in that
respective market capitalization decile of its exchange rate,
and 0 otherwise.
this paper includes month controls to separating the temperature effect from the calendar one. Finally, this
paper investigates a different country sample than that of Cao and Wei (2005) as none of our countries are
present in their sample.

The Holy Day Effect
24
The results listed in Table 13 show that trading volume for firms in the highest
decile of market capitalization increases during the first and second third of Ramadan, but
decreases during its last third, both on odd and even days. These changes in trading
volume may explain some of the observed changes in return during Ramadan. The
existing literature predicts that companies with higher market capitalization earn lower
return, all else equal. Thus when less trading volume comes from these firms during
Ramadan’s last third; the market’s average return increases. However, our strongest
effect in size (Ramadan 27th
) has not experienced differentiated trading behavior across
market capitalization classifications. Thus, while we find some support for a change in
the composition of traded stock, other channels must be explored to explain the Ramadan
27th
result.
Insert Table 13 here.
The fifth channel is mood based. It posits that markets are bided up on holy days
due to psychological cognitive changes. This can result from a change in the mood of
investors after a heightened religious experience on holy days. This mood explanation is
consistent with a number of studies that have linked mood to changes in stock market
returns. These studies are presented in the literature review section of this paper. Previous
research on emotions documented the influence of emotional states on cognitive
processes such as information processing (Tiedens & Linton, 2001) and risk perceptions
(Lerner and Keltner, 2001; Isen, Nygren & Ashby, 1988). Furthermore, research has gone
beyond the valence of the emotions to study the impact of the appraisal content of those
emotions. The Appraisal-tendency-Framework, (ATF) posits that “specific emotions give

The Holy Day Effect
25
rise to specific cognitive and motivational processes, which account for the effects of
each emotion upon judgment and decision making” (Han, Lerner, & Keltner, 2007).
To assess this channel, we introduce a new Muslim holy day, Ashoura, which
occurs on the tenth day of the first Hijri month of Muharram. Ashoura has a different
emotional impact for Muslims than Ramadan. On that day, Sunni Muslims celebrate the
exile and deliverance of Moses and the Israelites from the Pharaoh. Shia, on the other
hand, mourn the murder and subsequent mutilation of Hussein ibn Ali, the grandson of
the prophet Mohamad at the Battle of Karbala on Ashoura in 680AD. This is a sad day
for Shia marked by public rites and displays of mourning and traditional self flagellation
using swords, chains and blades. Black mourning attire is worn on that day.
This negative emotional valence experienced by Shia makes studying the impact
of religious experience on financial markets on Ashoura especially interesting. The
negative emotions expected to negatively affect their valuation of stock market returns. It
is well established that negative mood distorts peoples’ perceptions and judgments
towards greater negativity (e.g., Carson & Adams, 1980; Cunningham, 1988; Gorn,
Goldberg, & Basu, 1993; Johnson & Tversky, 1983; Mayer, Gaschke, Braverman, &
Evans, 1992; Wright & Bower, 1992).11
Studies have documented that subjects that were
induced with negative emotions made more accurate judgments without consideration to
whether the outcomes were desired or not (e.g., Alloy and Abramson, 1979, Alloy,
Abramson, and Viscusi, 1981; Alloy and Abramson, 1982), and were less likely to
underestimate the probability of negative events, or to overestimate the possibility of
positive ones (Alloy and Ahrens, 1987). Such subjects were also less likely to perceive
11
Raghunathan, R., & Pham, M. T. (1999). All negative moods are not equal: Motivational influences of
anxiety and sadness on decision making. Organizational Behavior and Human Decision Processes, 79, 57.
The Holy Day Effect
26
the world as under their control when it is, instead, subject to exogenous forces (Golin,
Terrell, and Johnson, 1977), and were less likely to overestimate their own abilities in
ambiguous task situations (Tabachnik, Crocker, and Alloy, 1983)12
.
First, we investigate the impact of Ashoura on stock market returns. Unlike the
holier days of Ramadan whose heightened worship occurs on the night before the holy
day, the observance of Ashoura occurs during the day itself. Therefore, we include in our
Ashoura dummy variable the day of Ashoura and the calendar day after it. Given that the
negative impact of Ashoura is localized to Shia, we focus on the sub sample of countries
with more significant Shia population. This subsample includes countries with Shia share
of population exceeding 2% percent. These include: Kuwait (21% Shia), Pakistan (12%
Shia), Saudi Arabia (12% Shia),Turkey (12% Shia), and Qatar (8% Shia),. We estimate
the following regression:
Reti,j,t = β0 + β1 Ashouraj,t + β2 Voli,t + β3 MSCI t + β5
+ β6
+ + β7 Reti,t-1 + β8 Reti,t-2 + ε
where,
Ashouraj,t = a dummy variable that takes the value 1 if day (t) or day (t-1)
was Ashoura in country i, and 0 otherwise.
Insert Table 14 here.
Table 14 lists the results of this regression which show that the coefficient for
Ashoura is not statistically significant. To further assess the mood channel, we exploit the
emotional differences experienced by Shia and Sunni on Ashoura. We expect the mood
effect to cause Shia traders to bid down stock returns given the negative emotions they
12
Staw, B., Barsade, S., (1993). Affect and Managerial Performance: A Test of the Sadder-but-Wiser vs.
Happier-and-Smarter Hypotheses. Administrative Science Quarterly, 38, pp. 304-331.

The Holy Day Effect
27
experience on Ashoura. Ideally, we would separate the behavior of traders according to
whether they are Sunni or Shia. Given that we are unable to access this information, we
proxy for the relative composition of Shia and Sunni traders in the pool of traders using
population averages. To that end, we estimate the following regression:
Reti,j,t = β0 + β1 Ashouraj,t + β2 Shiaj + β3 (Ashouraj,t x Shiaj) +
β4 Voli,t + β5 MSCIt + β6 + β7
+ β8
Reti,t-1 + β9 Reti,t-2 + ε
where,
Ashouraj,t = a dummy variable that takes the value 1 if day t was Ashoura
in country i, and 0 otherwise.
Shiaj = The percent of country (j)’s population that is Shia as
reported by the Pew Research Center report, “Mapping the
Global Muslim Population”, the October 2009.
If the mood of Shia investors is effecting the return on stocks on Ashoura, then this
negative effect should be captured by the interaction term (Ashouraj,t x Shiaj). Column (2)
of Table 14 lists the results. The interaction variable (Ashouraj,t x Shiaj) is indeed
negative and statistically significant. Also of interest is that the main Ashoura effect is
now positive and significant. These results lend credibility to the mood channels as a
driver for the anomalous returns on holy days.
8. Conclusion
This study examines the impact of religious experience on financial markets. It
investigates the effect of the Muslim holy day of Ramadan on the daily returns of ten
Muslim financial markets over the period January 1995 to August 2012. Muslim holy
days are designated using the Muslim Hijri lunar calendar which enables us to avoid

The Holy Day Effect
28
potential seasonal effects. The fact that Muslim countries differ from each other in the
methods used to establish the beginnings of lunar months enables us to lessen the impact
of contemporaneous events and cross market linkages.
The study utilizes the heterogeneity of worship intensity within the month of
Ramadan to validate that the measured effects are a result of the religious experiences not
material commercial effects. The religious capital during Ramadan’s last ten days is
alternating, with its last odd days having higher religious capital than its last five even
ones. Consistent with this we document a statistically significant 0.14% increase in
returns on the last five odd days. The intensity of faith experience culminates on
Ramadan’s 27th
day. The magnitude of the holy day effect is consistent with the
importance of Ramadan’s holy days as the increase in returns culminates on Ramadan
29th
and 27th
at statistically significant 0.784% and 0.452%, respectively.
Additionally, the paper investigates the underlying mechanism behind this holy
day effect. The paper explores five potential mechanisms that can cause the holy day
effect. The first channel that we explore is the liquidity premium. Controlling for traded
volume does not eliminate the statistically significant change in returns on holy days.
Second, we explore whether the effect is driven by a change in the composition of active
traders on holy days. We test for it by separating the trading of religiously observant
investors from the rest using firm compliance with the Islamic Shariah. The results of our
regressions do not establish support for this channel. Third, we separate physical aspects
of fasting from spiritual ones through evaluating the impact of warmer holy days on
returns. We find evidence of two effects, a positive main holy day effect, and a negative
one associated with higher temperature on those holy days. Fourth, we assess whether the

The Holy Day Effect
29
holy day affect is caused by a change in the composition of traded stocks according to
their riskiness. We construct ten deciles of market capitalizations to proxy for firm
riskiness. We find evidence for a shift in trading volume away from firms with the largest
market capitalization during Ramadan’s last ten days. Finally, we test whether mood
changes on holy days are causing the change in return. To do that, we use another
Muslim holiday, Ashoura, which differs in valence from Ramadan for Shia Muslims. We
find a statistically significant drop of 12.13% in returns on Ashoura for every 1%
increase in the proportion of Shia in the population.

The Holy Day Effect
30
References
Abadir, K., Spierdijk, L., 2005. The festivity effect and liquidity constraints: A test on
countries with different calendars. Memorandum 1772, Department of Applied
Mathematics, University of Twente, Enschede. ISSN 0169-2690.
Al-Hajieh, H, K., Redhead and T. Rodgers, 2011. Investor sentiment and calendar
anomaly effects: A case study of the impact of Ramadan on Islamic Middle
Eastern markets. Research in International Business and Finance 25 (3), 345-356.
Amihud, Y., Mendelson, H., 1986. Asset pricing and the bid–ask spread. Journal of
Financial Economics 17, 223–249.
Akgiray V., 1989. Conditional heteroscedasticity in time series of stock returns: Evidence
and forecasts. The Journal of Business, 62(1), pp.55-80.
Alloy, L., Abramson, L., 1979. Judgment of contingency in depressed and nondepressed
students: Sadder but wiser? Journal of Experimental Psychology: General, 108,
pp. 441-485.
Alloy, L., Abramson, L., 1982. Learned helplessness, depression and the illusion of
control. Journal of Personality and Social Psychology, 42, pp. 1114-1126.
Alloy, L., Ahrens, A., 1987. Depression and pessimism for the future: Biased use of
statistically relevant information in predictions for self versus others. Journal of
Personality and Social Psychology, 52, pp. 366-378.
Alloy, L., Abramson, L., Viscusi, D., 1981. Induced mood and the illusion of control.
Journal of Personality and Social Psychology, 41, pp. 1129-1140.
Amihud Y., and Mendelson H., 1987. Trading mechanisms and stock returns: An
empirical investigation. Journal of Finance, 42, pp. 533-553.
Ariel, Robert A., 1990. High stock returns before holidays: Existence and evidence on
possible causes. Journal of Finance 45, pp. 1611-1626.
Bagozzi, R., Mahesh G., and Prashanth N., 1999. The role of emotions in marketing.
Journal of the Academy of Marketing Science, 27, pp. 184-206.
Banz, R.W., 1981. The relationship between return and market value of common stocks.
Journal of Financial Economics 9, 3–18.
Barone, E., 1990. The Italian stock market: efficiency and calendar anomalies.
Journal of Banking and Finance 14, pp. 483-510.

The Holy Day Effect
31
Berk, J., 1995. A critique of size-related anomalies. The Review of Financial Studies,
8(2) 275-286 .
Bialkowskia, J., A., Etebarib, and T.P., Wisniewskic, 2012. Fast profits: Investor
sentiment and stock returns during Ramadan, Journal of Banking and Finance, 36
(3), 835-845.
Bukhari Vol.3, Book 32. Translated by Khan, M.
URL: http://www.scribd.com/doc/2463581/Sahih-Bukhari-Vol-3, accessed on
April 17, 2009
Cadsby, C.B., and Ratner, M.T., 1992. Turn-of-the-month and pre-holiday effects on
stock returns. Journal of Banking and Finance, 16, pp. 497-509.
Carson, T., Adams, H., 1980. Activity valence as a function of mood change. Journal of
Abnormal Psychology, 89, pp. 368-377.
Chan, M. L., Khanthavlt, A., and Thomas, H., 1996. Seasonality and cultural influences
on four asian stock markets. Asia Pacific Journal Of Management, 13(2), 1-24.
Clingingsmith, D., Khwaja, A., and Kremer, M., 2008. The impact of the hajj: Religion
and tolerance in Islam’s global gathering. Quarterly Journal of Economics, 124
(3), pp. 1133-1170.
Cunningham, M., 1988. What do you do when you are unhappy or blue? Mood,
expectancies, and behavior. Motivation and Emotion, 12, pp. 309-331.
Frieder, L., and Subrahmanyam, A., 2004. Nonsecular regularities in returns and volume.
Financial Analysts Journal, 60(4), pp. 29-34.
Global Financial Data, URL: (https://www.globalfinancialdata.com).
Golin, S., Terrell, F., Johnson, B., 1977. Depression and the illusion of control. Journal
of Abnormal Psychology, 86, pp. 440-442.
Gorn, G., Goldberg, M., Basu, K., 1993. Mood, awareness, and product evaluation.
Journal of Consumer Psychology, 2, pp. 237-256.
Han, S., Lerner, J., Keltner D., 2007. Feelings and consumer decision making: The
appraisal-tendency framework. Journal of Consumer Psychology, 17 (3), pp.158-
68.
Hirshleifer, D., and Shumway T., 2003. Good day sunshine: Stock returns and the
weather. The Journal of Finance, 58(3), pp. 1009-1032.

The Holy Day Effect
32
Husain, F., 1998. A seasonality in the Pakistani equity market: The Ramadhan effect. The
Pakistan Development Review, 1(37), pp. 77-81.
Iannaccone, L., 1998. Introduction to the economics of religion. Journal of Economic
Literature, 36, pp. 1465-1495.
Ibn Khuzaymah, Al-Sahih, vol. 3.
Jacobs, B., and Levy, K., 1988. Calendar anomalies: Abnormal returns at calendar
turning points. Financial Analysts Journal, 44(6), pp. 28-39.
Johnson, E. J., and Tversky A., 1983. Affect, generalization, and the perception of risk.
Journal of Personality and Social Psychology, 45, pp. 20-31.
Kamstra, M. , Kramer L., and Levi M., 2000. Losing sleep at the market: The Day- light-
savings anomaly. American Economic Review, 90, pp. 1005-1011.
Kamstra, M. , Kramer L., and Levi M., 2003. Winter blues: A sad stock market cycle.
The American Economic Review, 93(1), pp. 324-343.
Kim, Chan-Wung and Park, Jinwoo, 1994. Holiday effects and stock returns: Further
evidence. Journal of Financial and Quantitative Analysis, 29, pp. 145-157.
Kuo, J.-M., Coakley, J., and Wood, A., 2010. The lunar moon festival and the dark side
of the moon. Applied Financial Economics, 20(20), pp. 1565-1575.
Lakonishok, J. and Schmidt, S., 1988. Are seasonal anomalies real? A ninety year
perspective. The Review of Financial Studies, 1, pp. 403-425.
Lerner, J., Keltner, D., 2001. Fear, anger, and risk. Journal of Personality and Social
Psychology, 81(1), pp. 146-15.
Loewenstein, G., Elke U., Hsee C., and Welch N., 2001. Risk as feelings. Psychological
Bulletin, 127, pp. 267-286.
Mayer, J., Gaschke, Y., Braverman, D., Evans, T., 1992. Mood-Congruent Judgment Is A
General Effect. Journal of Personality and Social Psychology, 63, pp. 119-132.
McCleary, R., 2007. Salvation, damnation, and economic incentives. Journal of
Contemporary Religion, 22(1), pp. 49-74.
Newey, W.K., K.D., West, 1987. A simple, positive semi‐definite, heteroskedasticity and
autocorrelation consistent covariance matrix. Econometrica, 55(3), 703‐708.
Oguzsoy, C.B., and S. Guven, 2004, Holy days effect on Istanbul stock exchange,
Journal of Emerging Market Finance, 3, 63-75.

The Holy Day Effect
33
Petersen M., 2009. Estimating standard errors in finance panel data sets: Comparing
approaches. Review of Financial Studies. 22: 435-480.
Pettengill, G.N., 1989. Holiday closings and security returns. Journal of Financial
Research 12, pp. 57-67.
Raghunathan, R., and Pham, M. T., 1999. All negative moods are not equal: Motivational
influences of anxiety and sadness on decision making. Organizational Behavior
and Human Decision Processes, 79, pp. 56-77.
Saunders, E., Jr., 1993. Stock prices and Wall Street weather. American Economic
Review, 83, pp. 1337-1345.
Seyyed, F., Abraham, A., Al-Hajji, M., 2005. Seasonality in stock returns and volatility:
The Ramadan effect. Research in International Business and Finance, 19(3), pp.
374-383.
Smith, C., Ellsworth, P., 1985. Patterns Of cognitive appraisal in emotion. Journal of
Personality and Social Psychology, 48, pp. 813-838.
Staw, B., Barsade, S., 1993. Affect and managerial performance: A test of the sadder-but-
wiser vs. happier-and-smarter hypotheses. Administrative Science Quarterly, 38,
pp. 304-331.
Tabachnik, N., Crocker, J., Alloy, L., 1983. Depression, social comparison, and the false-
consensus effect. Journal of Personality and Social Psychology, 45, pp. 688-699.
Tong, W. S., 1992. An analysis of the January effect of United States, Taiwan and South
Korean stock returns. Asia Pacific Journal Of Management, 9(2), 189-207.
Thaler R., 1987. Anomalies: Seasonal movements in security prices II: Weekend,
holiday, turn of the month, and intraday effects. The Journal of Economic
Perspectives, 1( 2), pp. 169-177.
Tiedens, L., Linton, S., 2001. Judgment under emotional certainty and uncertainty: The
effects of specific emotions on information processing. Journal of Personality &
Social Psychology, 81, pp. 973-988.
Vos, E., Cheung, J., and Bishop D., 1993. Pre-holiday returns in the New Zealand share
market. Accounting Research Journal, pp. 21-26.
Wong, P. L., Neoh, S. K., Lee, K. H., and Thong, T. S., 1990. Seasonality in the
Malaysian stock market. Asia Pacific Journal of Management, 7(3), 43-62.

The Holy Day Effect
34
Wu, C., 2013. The Chinese New Year holiday effect: evidence from Chinese ADRs.
Investment Management and Financial Innovations, 10(2), pp.8-14.
Wright, W., Bower, G., 1992. Mood effects on subjective probability assessment.
Organizational Behavior and Human Decision Processes, 52, pp. 276-291.
Yen, G., and Shyy, G., 1993. Chinese New Year effect in Asian stock markets, NTU
Management Review, 4, pp. 417-436.

The Holy Day Effect
35
Appendix A
Table 1 Summary of the Financial Markets and Returns Data
Country Stock
Exchange
Market
Cap13
(USD Bn)
Local
Trading14
Listed
Companies
# of Obs Date Market Return (%)
First Last Mean Std.
Dev.
Min Max
Egypt Cairo Stock
Exchange
61 79% 340 324,710 Jun-1995 Aug-2012 0.0005 0.098 -0.969 49.679
Indonesia Jakarta Stock
Exchange
405 65%
355 1,019,886 May-1988 Aug-2012 0.0017 0.104 -0.968 69.000
Jordan Amman Stock
Exchange
27 48% 245 358,339 Jul-1993 Aug-2012 0.0000 0.055 -0.901 19.111
Kuwait Kuwait Stock
Exchange
78 46% 213 282,493 Dec-1999 Aug-2012 -0.0002 0.035 -0.910 5.694
Malaysia Bursa Malaysia 458 33% 112 3,352,493 Dec-1985 Aug-2012 0.0008 0.101 -0.981 106.500
Morocco Casablanca
Stock Exchange
52 77% 80 145,487 Jun-1995 Aug-2012 0.0003 0.036 -0.906 9.600
Pakistan Karachi Stock
Exchange
41 80% 403 756,591 Aug-1992 Aug-2012 0.0014 0.067 -0.960 21.500
Qatar Qatar Stock
Exchange
128 65% 42 70,289 Apr-2002 Aug-2012 0.0004 0.029 -0.607 1.536
Saudi
Arabia
Saudi Stock
Exchange
378 89% 155 244,074 Jan-2000 Aug-2012 0.0003 0.040 -0.854 8.924
Turkey Istanbul Stock
Exchange
270 34% 329 1,094,541 Apr-1989 Aug-2012 0.0007 0.056 -0.999 23.643
13
Market capitalizations are for August 2012. 14
Percent of local trading is for the year 2012, except for Qatar and Pakistan which is for 2013, Morocco 2011, and Turkey 2010.
The Holy Day Effect
36
Table 2 Correlation of Financial Markets Returns for Equal (plain) and Value Weighted (shaded)
Indices
EGY IDN JOR KWT MAR MYS PAK QAT SAU TUR MSCI
EGY 1 0.09 0.00 0.14 0.08 0.16 0.11 -0.04 0.21 0.04 0.14
IDN 0.03 1 -0.03 0.17 0.19 0.73 0.23 0.14 0.24 0.15 0.17
JOR 0.23 -0.04 1 0.07 0.17 0.00 0.22 0.01 0.09 0.07 0.05
KWT 0.02 0.13 -0.13 1 0.09 0.24 0.19 0.00 0.36 0.17 0.07
MAR 0.15 0.12 0.07 0.01 1 0.23 0.26 0.12 0.22 0.01 0.07
MYS 0.15 0.65 0.05 0.06 0.05 1 0.28 0.15 0.28 0.09 0.16
PAK 0.04 0.22 0.12 0.14 0.07 0.21 1 -0.05 0.14 0.08 0.04
QAT 0.10 0.08 -0.02 -0.06 0.07 0.11 -0.08 1 0.38 0.17 0.00
SAU 0.08 0.08 0.11 0.12 0.12 0.07 0.12 0.26 1 0.32 0.09
TUR 0.10 0.22 -0.01 0.08 0.07 0.30 0.08 0.08 0.14 1 0.26
MSCI 0.12 0.14 0.04 0.04 0.09 0.17 0.04 0.01 0.10 0.27 1

The Holy Day Effect
37
Table 3 Summary Statistics of Variables
Obs Mean (%) Std. Dev. (%) Min (%) Max (%)
Daily Returns 5,860,648 0.094 8.692 -99.905 10650.000
Volume 5,860,648 2.09E+07 6.37E+08 0.000 2.29E+11
Market Cap (USD) 5,854,383 7.61E+12 1.57E+14 25000 1.39E+16
MSCI Return 5,860,648 0.017 1.252 -48.715 66.910
Ramadan 5,860,648 0.085 0.279 0.000 1.000
Ramadan 1-10 5,860,648 0.030 0.170 0.000 1.000
Ramadan 11-20 5,860,648 0.030 0.172 0.000 1.000
Ramadan 21-30 5,860,648 0.025 0.156 0.000 1.000
Odd_Days 5,860,648 0.013 0.114 0.000 1.000
Even_Days 5,860,648 0.012 0.109 0.000 1.000
Ramadan 27th 5,860,648 0.003 0.054 0.000 1.000
Ashoura 955,170 0.001 0.032 0.000 1.000
Shia 955,170 0.142 0.038 0.100 0.225
Sunday 5,860,648 0.000 0.000 0.000 0.000
Monday 5,860,648 0.198 0.399 0.000 1.000
Tuesday 5,860,648 0.212 0.409 0.000 1.000
Wednesday 5,860,648 0.215 0.411 0.000 1.000
Thursday 5,860,648 0.201 0.401 0.000 1.000
Friday 5,860,648 0.172 0.378 0.000 1.000
Saturday 5,860,648 0.000 0.000 0.000 0.000
January 5,860,648 0.081 0.273 0.000 1.000
February 5,860,648 0.074 0.262 0.000 1.000
March 5,860,648 0.089 0.285 0.000 1.000
April 5,860,648 0.087 0.282 0.000 1.000
May 5,860,648 0.087 0.282 0.000 1.000
June 5,860,648 0.089 0.285 0.000 1.000
July 5,860,648 0.091 0.288 0.000 1.000
August 5,860,648 0.085 0.278 0.000 1.000
September 5,860,648 0.079 0.269 0.000 1.000
October 5,860,648 0.080 0.272 0.000 1.000
November 5,860,648 0.076 0.265 0.000 1.000
December 5,860,648 0.081 0.272 0.000 1.000

The Holy Day Effect
38
Table 4 Mean of Daily Returns on Holy Days and All Other Days
Obs Mean (%) Std. Dev. (%) Min (%) Max (%) t-test
Ramadan All 498,683 0.051 5.968 -97.826 1047.368 3.592
(0.0003)
Ramadan 1-10 173,671 -0.152 5.832 -90.153 843.750 11.607
(0.000)
Ramadan 11-20 178,122 0.193 5.597 -97.826 550.000 4.496
(0.000)
Ramadan 21-30 146,890 0.120 6.510 -95.000 1047.368 0.963
(0.3355)
Odd_Days 76,664 0.185 7.510 -95.000 1047.368 2.696
(0.007)
Even_Days 70,226 0.050 5.203 -79.892 300.000 1.425
(0.154)
Ramadan_27th
16,971 0.524 5.110 -77.719 220.455 6.244
(0.000)
Ashoura 1,001 0.059 3.802 -15.088 32.5123 0.322§
(0.7472)
All Other Days 5,347,791 0.100 8.911 -99.905 10650.000
Notes: “Obs” denote the number of observations used to compute the mean and other statistics.
“Ramadan All” refers to the mean daily return during the whole month of Ramadan, “Ramadan
1-10” refers to the mean daily return during the first ten days of Ramadan, “Ramadan 11-20”
refers to the mean daily return during the middle ten days of Ramadan, “Ramadan 21-30”
refers to the mean daily return during the last ten days of Ramadan, “Odd Days” refers to the
mean daily return during the odd last ten days of Ramadan, “Even Days” refers to the mean
daily return during the even last ten days of Ramadan, “Ramadan 27th
” refers to the mean daily
return on the 27th
day of Ramadan, “Ashoura” refers to the mean daily return on the day of
Ashoura, “All Other” refers to the mean daily return on all day other than Ramadan and
Ashoura. “t-test” refers to the t-test that the mean of returns on the specific holy day are not
different from the mean of returns on all other days other than Ramadan. Figures in brackets
under the “t-test” denote the two sided p-value for the t-test.
§ T-test versus non-Ashoura days for the subsample including Kuwait, Pakistan, Qatar, Saudi
Arabia and Turkey which are used in the Table 14 regression.

The Holy Day Effect
39
Table 5 Returns Regression Controlling for the MSCI, Day of the Week and Month of the Year
(1) (2) (3) (4)
Daily Returns Daily Returns Daily Returns Daily Returns
Ramadan -0.0049
(0.011)
Ramadan 1-10 -0.1400***
(0.017)
Ramadan 11-20 0.0891***
(0.018)
Ramadan 21-30 0.0415**
(0.019)
Odd_Days 0.1400***
(0.028)
Even_Days -0.0597***
(0.021)
Ramadan 21 -0.3030***
(0.051)
Ramadan 22 -0.5280***
(0.044)
Ramadan 23 -0.0210
(0.075)
Ramadan 24 -0.2470***
(0.041)
Ramadan 25 -0.0295
(0.077)
Ramadan 26 0.2630***
(0.037)
Ramadan 27 0.4520***
(0.041)
Ramadan 28 0.3850***
(0.051)
Ramadan 29 0.7840***
(0.054)
Ramadan 30 0.2610***
(0.089)
MSCI Return 0.3470***
0.3460***
0.3470***
0.3470***
(0.042) (0.042) (0.042) (0.042)
One day lagged return -0.0453***
-0.0453***
-0.0453***
-0.0453***
(0.015) (0.015) (0.015) (0.015)
Two days lagged return -0.0028 -0.0028 -0.0028 -0.00276
(0.003) (0.003) (0.003) (0.003) N 5860643 5860643 5860643 5860643
* p<0.1, ** p<0.05, *** p<0.01 Daily returns and change in volume are in percentage form (multiplied by 100). Figures in brackets
under the coefficients are Newey and West (1987) heteroskedasticity-autocorrelation-consistent
standard errors. Tuesday and April are dropped. Saturday and Sunday were automatically omitted
because of collinearity by Stata.
The Holy Day Effect
40
Table 6 Separate Country Returns Regression Results Controlling for change in volume, MSCI, Day
of the Week and Month of the Year
Ramadan Ramadan
1-10
Ramadan
11-20
Ramadan
21-30
Odd
Days
Even
Days
Ramadan
27th
N
Egypt 0.0897***
0.2220***
-0.2760***
0.3500***
0.2410***
0.5040***
0.7380***
205244
(0.034) (0.050) (0.056) (0.052) (0.073) (0.067) (0.133)
Indonesia -0.0149 -0.3160***
0.2390***
0.045 0.1790***
-0.0978 0.5650***
795100
(0.027) (0.050) (0.041) (0.043) (0.061) (0.062) (0.124)
Jordan 0.1700***
-0.0007 0.2110***
0.3090***
0.3810***
0.1680 0.5220***
248119
(0.035) (0.038) (0.058) (0.058) (0.048) (0.104) (0.104)
Kuwait 0.0553* -0.1640
*** -0.0785 0.4410
*** 0.4130
*** 0.5330
*** 0.6740
*** 167115
(0.034) (0.049) (0.054) (0.051) (0.067) (0.076) (0.116)
Morocco -0.1300***
-0.2350***
-0.1340**
-0.0250 -0.0883 0.1420**
0.0933 95859
(0.041) (0.067) (0.066) (0.074) (0.125) (0.068) (0.136)
Malaysia -0.0232 -0.1370*** 0.1300***
-0.1210***
0.0425 -0.2970***
0.3390***
2835633
(0.018) (0.023) (0.035) (0.031) (0.050) (0.031) (0.061)
Pakistan 0.2390***
-0.1240***
0.2160***
0.7750***
0.6680***
0.8600***
1.0560***
644642
(0.032) (0.045) (0.050) (0.059) (0.089) (0.083) (0.236)
Qatar -0.1250 -0.1570 -0.0465 -0.1310 0.2040 -0.3840**
0.0546 11330
(0.223) (0.212) (0.287) (0.317) (0.176) (0.183) (0.162)
Saudi Arabia -0.2540***
-0.1860***
-0.3640***
-0.1980***
0.2080***
-0.4020***
0.2930**
132082
(0.038) (0.052) (0.054) (0.065) (0.071) (0.097) (0.119)
Turkey -0.2230***
-0.3350***
-0.2050***
-0.1170***
-0.0760***
-0.0448 0.3000***
725519
(0.016) (0.025) (0.028) (0.023) (0.029) (0.034) (0.056)
* p<0.1, ** p<0.05, *** p<0.01
Daily returns and change in volume are in percentage form (multiplied by 100). Figures in brackets under the coefficients are Newey
and West (1987) heteroskedasticity-autocorrelation-consistent standard errors. Tuesday and April are dropped.
The Holy Day Effect
41
Table 7 Equally weighted Index Clustered by Both Country Level and Date
(1) (2) (3) (4)
Return of
Equally
Weighted Index
Return of
Equally
Weighted Index
Return of
Equally
Weighted Index
Return of
Equally
Weighted Index
Ramadan -0.0000
(0.000)
Ramadan 1-10 -0.0015***
(0.001)
Ramadan 11-20 0.0004
(0.001)
Ramadan 21-30 0.0012
(0.001)
Odd_Days 0.0011
(0.001)
Even_Days 0.0014
(0.001)
Ramadan 27th 0.0029***
(0.001)
MSCI Return 0.0016*** 0.0016
*** 0.0016*** 0.0016
***
(0.001) (0.001) (0.001) (0.001) One day lagged return 0.0099 0.0090 0.0088 0.0099
(0.043) (0.043) (0.043) (0.044)
Two days lagged return 0.1190**
0.1190**
0.1200**
0.1190**
(0.055) (0.055) (0.055) (0.055)
Constant 0.0008**
0.0008**
0.0008**
0.0008**
(0.000) (0.000) (0.000) (0.000)
N 23131 23131 23131 23131
Day of the Week
Dummy
Yes Yes Yes Yes
Month of the Week
Dummy Variables
Yes Yes Yes Yes
Country Dummy
Variables
Yes Yes Yes Yes
Firm Level Cluster Yes Yes Yes Yes
Date Level Cluster Yes Yes Yes Yes
* p<0.1, ** p<0.05, *** p<0.01
Daily returns and change in volume are in percentage form (multiplied by 100). Figures in brackets
under the coefficients are standard errors clustered on both dimensions country level and date. The
clustering is performed as per Thompson (2006) and by Cameron, Gelbach and Miller (2006) using
the Stata ado command –cluster2

The Holy Day Effect
42
Table 8 Value Weighted Index Return Clustered by Both Country Level and Date
(1) (2) (3) (4)
Return of Value
Weighted Index
Return of Value
Weighted Index
Return of Value
Weighted Index
Return of Value
Weighted Index
Ramadan 0.0903
(0.056)
Ramadan 1-10 -0.0640
(0.063)
Ramadan 11-20 0.1070
(0.095)
Ramadan 21-30 0.2500**
(0.107)
Odd_Days 0.2440***
(0.079)
Even_Days 0.2510*
(0.148)
Ramadan 27th 0.4960**
(0.198)
MSCI Return 0.1660***
0.1650***
0.1660***
0.1660***
(0.057) (0.057) (0.057) (0.057)
One Day Lagged Return 0.0798***
0.0794***
0.0796***
0.0797***
(0.014) (0.014) (0.014) (0.014)
Two Days Lagged Return 0.0157* 0.0155
* 0.0156
* 0.0157
*
(0.009) (0.009) (0.009) (0.009) Constant -0.0061 -0.0061 -0.0055 -0.0038
(0.059 (0.059 (0.059 (0.059)
N 25847 25847 25847 25847
Day of the Week Dummy Yes Yes Yes Yes
Month of the Week
Dummy Variables
Yes Yes Yes Yes
Country Dummy Variables Yes Yes Yes Yes
Firm Level Cluster Yes Yes Yes Yes
Date Level Cluster Yes Yes Yes Yes
* p<0.1, ** p<0.05, *** p<0.01
Daily returns are in percentage form (multiplied by 100). Figures in brackets under the coefficients are standard
errors clustered on both dimensions country level and date. The clustering is performed as per Thompson (2006) and
by Cameron, Gelbach and Miller (2006) using the Stata ado command –cluster2- cluster2.ado ---- written by Mitchell
Petersen. Tuesday, April and Kuwait are dropped. Saturday and Sunday were automatically omitted by Stata
because of collinearity.

The Holy Day Effect
43
Table 9 Sensitivity Of The Main Results To The Inclusion Of All Combination Of Control Variables
Variable Maximum
Coefficient
Minimum
Coefficient
Mean
Coefficient
Mean
Standard
Error
Share of
Regressions
Significant
at the 5-
percernt
Level
Share of
Regressions
where the
Coefficient
Sign is
Positive
Share of
Regressions
where the
Coefficient
Sign is
Negative
Average
t-Value
Ramadan 0.072 0.003 0.023652 0.050 0.000% 100% 0.000% 0.469
Ramadan 1-10 -0.099 -0.170 -0.131 0.077 0.292% 0.000% 100% 1.700
Ramadan 11-20 0.088 0.013 0.029 0.097 0.000% 100% 0.000% 0.296
Ramadan 21-30 0.252 0.181 0.197 0.081 100% 100% 0.000% 2.422
Odd_Days 0.244 0.183 0.196 0.068 100% 100% 0.000% 2.901
Even_Days 0.261 0.183 0.204 0.124 3.49% 100% 0.000% 1.658
Ramadan 27th 0.539 0.481 0.510 0.165 100% 100% 0.000% 3.096
Daily returns are in percentage form (multiplied by 100). Standard errors clustered on both dimensions country
level and date. The clustering is performed as per Thompson (2006) and by Cameron, Gelbach and Miller (2006)
using the Stata ado command –cluster2- written by Mitchell Petersen. The above sensitivity analysis is conducted
using Stata’s –checkrob- command written by Mikkel Barslund

The Holy Day Effect
44
Table 10 Returns Regression Controlling for the Change in Volume, and All Other Controls
(1) (2) (3) (4)
Daily Returns Daily Returns Daily Returns Daily Returns
Ramadan 0.0009
(0.011)
Ramadan 1-10 -0.1210***
(0.017)
Ramadan 11-20 0.0773***
(0.019)
Ramadan 21-30 0.0530***
(0.019)
Odd_Days 0.1420***
(0.029)
Even_Days -0.0410**
(0.021)
Ramadan 21 -0.3630***
(0.052)
Ramadan 22 -0.4680***
(0.043)
Ramadan 23 0.0047
(0.076)
Ramadan 24 -0.2290***
(0.043)
Ramadan 25 -0.0229
(0.079)
Ramadan 26 0.2670***
(0.0364)
Ramadan 27 0.4580***
(0.0411)
Ramadan 28 0.3600***
(0.045)
Ramadan 29 0.8290***
(0.056)
Ramadan 30 0.2240**
(0.087)
Volume 6.46e-11***
6.46e-11***
6.46e-11***
6.48e-11***
(5.98E-12) (5.98E-12) (5.98E-12) (5.98e-12)
MSCI Return 0.3540***
0.3540***
0.3540***
0.3550***
(0.044) (0.044) (0.044) (0.0440)
One day lagged return -0.0362***
-0.0362***
-0.0362***
-0.0362***
(0.012) (0.012) (0.012) (0.012) Two days lagged return -0.0014 -0.0014 -0.0014 -0.0014
(0.003) (0.003) (0.003) (0.003)
N 5611486 5611486 5611486 5611486
Day of the Week Dummy Yes Yes Yes Yes
Month of the Week Dummy Variables Yes Yes Yes Yes
Country Dummy Variables Yes Yes Yes Yes
Firm Level FE Yes Yes Yes Yes
Date Level FE Yes Yes Yes Yes
* p<0.1, ** p<0.05, *** p<0.01
Daily returns and change in volume are in percentage form (multiplied by 100). Figures in brackets under the coefficients are Newey and
West (1987) heteroskedasticity-autocorrelation-consistent standard errors. Tuesday and April are dropped. Saturday and Sunday were
automatically omitted because of collinearity by Stata.

The Holy Day Effect
45
Table 11 Shariah Compliant Volume Regression
(1) (2) (3) (4)
Volume Volume Volume Volume
Ramadan -932109
(772499)
(Ramadan x Shariah) -126149
(1E+06)
Ramadan 1-10 -857668
(1E+06)
Ramadan 11-20 669344
(1E+06)
Ramadan 21-30 -2945906.5000**
(1E+06)
(Ramadan 1-10 x Shariah) -2E+06
(2E+06)
(Ramadan 11-20 x Shariah) -462979
(2E+06)
(Ramadan 21-30 x Shariah) 3068305.5000*
(2E+06)
Odd_Days -5532902.6000***
(2E+06)
Even_Days -195871
(2E+06)
(Odd_Days x Shariah) 962275
(3E+06)
(Even_Days x Shariah) 5558854.7000**
(3E+06)
Ramadan 27th 1511494
(4E+06)
(Ramadan 27th x Shariah) 6743915
(5E+06)
Shariah -1797905.4000***
-1796107.6000***
-1883000.4000***
-1829177.9000***
(486228) (486218) (480615) (478737)
MSCI Return 409331.4000***
409725.4000***
411518.1000***
408187.2000***
(113456) (113533) (113456) (113453)
One day lagged volume 0.6210*** 0.6210
*** 0.6210*** 0.6210
*** (0.000) (0.000) (0.000) (0.000) Two days lagged volume 0.2490
*** 0.2490*** 0.2490
*** 0.2490***
(0.000) (0.000) (0.000) (0.000) Constant -1E+06 -1E+06 -2E+06 -2E+06
(1E+07) (1E+07) (1E+07) (1E+07)
N 5611499 5611499 5611499 5611499
Day of the Week Dummy Yes Yes Yes Yes
Month of the Week Dummy
Variables
Yes Yes Yes Yes
Country Dummy Variables Yes Yes Yes Yes
Firm Level FE Yes Yes Yes Yes
Date Level FE Yes Yes Yes Yes
* p<0.1, ** p<0.05, *** p<0.01
Daily returns and change in volume are in percentage form (multiplied by 100). Figures in brackets under the
coefficients are standard errors from the Hausman Taylor model. Tuesday and April are dropped. Saturday and
Sunday were automatically omitted by Stata because of collinearity.
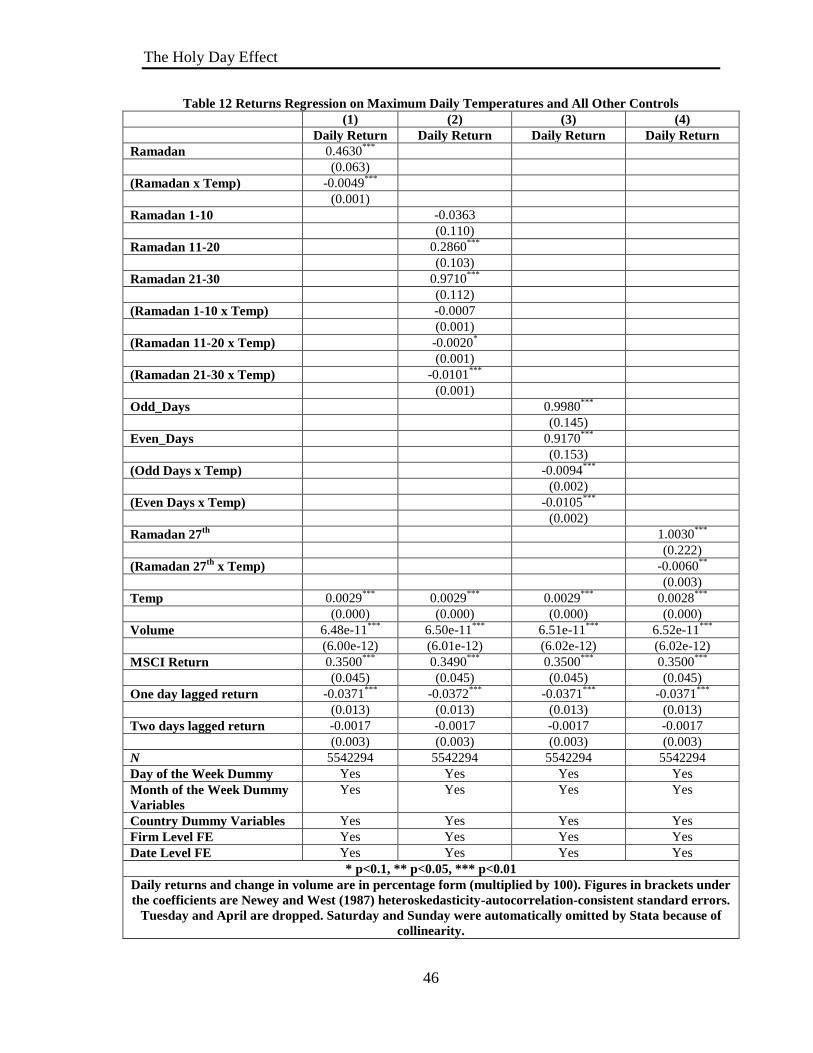
The Holy Day Effect
46
Table 12 Returns Regression on Maximum Daily Temperatures and All Other Controls
(1) (2) (3) (4)
Daily Return Daily Return Daily Return Daily Return
Ramadan 0.4630***
(0.063)
(Ramadan x Temp) -0.0049***
(0.001)
Ramadan 1-10 -0.0363
(0.110)
Ramadan 11-20 0.2860***
(0.103)
Ramadan 21-30 0.9710***
(0.112)
(Ramadan 1-10 x Temp) -0.0007
(0.001)
(Ramadan 11-20 x Temp) -0.0020*
(0.001)
(Ramadan 21-30 x Temp) -0.0101***
(0.001)
Odd_Days 0.9980***
(0.145)
Even_Days 0.9170***
(0.153)
(Odd Days x Temp) -0.0094***
(0.002)
(Even Days x Temp) -0.0105***
(0.002)
Ramadan 27th
1.0030***
(0.222)
(Ramadan 27th
x Temp) -0.0060**
(0.003)
Temp 0.0029***
0.0029***
0.0029***
0.0028***
(0.000) (0.000) (0.000) (0.000)
Volume 6.48e-11***
6.50e-11***
6.51e-11***
6.52e-11***
(6.00e-12) (6.01e-12) (6.02e-12) (6.02e-12)
MSCI Return 0.3500***
0.3490***
0.3500***
0.3500***
(0.045) (0.045) (0.045) (0.045)
One day lagged return -0.0371***
-0.0372***
-0.0371***
-0.0371***
(0.013) (0.013) (0.013) (0.013)
Two days lagged return -0.0017 -0.0017 -0.0017 -0.0017
(0.003) (0.003) (0.003) (0.003) N 5542294 5542294 5542294 5542294
Day of the Week Dummy Yes Yes Yes Yes
Month of the Week Dummy
Variables
Yes Yes Yes Yes
Country Dummy Variables Yes Yes Yes Yes
Firm Level FE Yes Yes Yes Yes
Date Level FE Yes Yes Yes Yes
* p<0.1, ** p<0.05, *** p<0.01
Daily returns and change in volume are in percentage form (multiplied by 100). Figures in brackets under
the coefficients are Newey and West (1987) heteroskedasticity-autocorrelation-consistent standard errors.
Tuesday and April are dropped. Saturday and Sunday were automatically omitted by Stata because of
collinearity.

The Holy Day Effect
47
Table 13 Market Deciles Regressions
(1) (2) (3) (4)
Volume Volume Volume Volume
Ramadan -925209.9000
(1575227.200)
(Ramadan×Market_Cap 1) -195429.2000
(2336861.600)
(Ramadan×Market_Cap 2) -111535.1000
(2218405.800)
(Ramadan×Market_Cap 3) -51472.3000
(2203558.700)
(Ramadan×Market_Cap 4) -34564.8000
(2208897.800)
(Ramadan×Market_Cap 6) -35774.2000
(2232339.300)
(Ramadan×Market_Cap 7) -32349.8000
(2241430.200)
(Ramadan×Market_Cap 8) -30926.3000
(2248969.200)
(Ramadan×Market_Cap 9) -683768.7000
(2245102.300)
(Ramadan×Market_Cap 10) 2327029.4000
(2410599.100)
Ramadan 1-10 -796751.0000
(2587545.800)
Ramadan 11-20 -956824.4000
(2550924.400)
Ramadan 21-30 -1063145.7000
(2801082.000)
(Ramadan 1-10xMarket_Cap 1) -129554.4000
(3841399.800)
(Ramadan 1-10xMarket_Cap 2) -92263.6000
(3661275.700)
(Ramadan 1-10xMarket_Cap 3) 29590.1000
(3623733.400)
(Ramadan 1-10xMarket_Cap 4) -1901.0000
(3636573.200)
(Ramadan 1-10xMarket_Cap 6) 6148.2000
(3675031.700)
(Ramadan 1-10xMarket_Cap 7) 70978.2000
(3687737.600)
(Ramadan 1-10xMarket_Cap 8) 211155.1000
(3702505.400)
(Ramadan 1-10xMarket_Cap 9) -1098545.5000
(3688342.600)
(Ramadan 1-10xMarket_Cap 10) 17258256.9000***
(3962784.200)
(Ramadan 11-20xMarket_Cap 1) -253547.9000
(3776218.300)
(Ramadan 11-20xMarket_Cap 2) -156430.9000
(3596389.500)
(Ramadan 11-20xMarket_Cap 3) -118524.3000
(3573539.200)
(Ramadan 11-20xMarket_Cap 4) -34154.9000

The Holy Day Effect
48
(3585764.300)
(Ramadan 11-20xMarket_Cap 6) -80691.6000
(3625753.200)
(Ramadan 11-20xMarket_Cap 7) -14718.1000
(3642876.700)
(Ramadan 11-20xMarket_Cap 8) -67098.6000
(3659644.500)
(Ramadan 11-20xMarket_Cap 9) 1393865.8000
(3664202.100)
(Ramadan 11-20xMarket_Cap 10) 23918910.8000***
(3953389.300)
(Ramadan 21-30xMarket_Cap 1) -203511.0000
(4220467.100)
(Ramadan 21-30xMarket_Cap 2) -75697.6000
(3961821.300)
(Ramadan 21-30xMarket_Cap 3) -67528.5000
(3947577.800)
(Ramadan 21-30xMarket_Cap 4) -74099.6000
(3949199.700)
(Ramadan 21-30xMarket_Cap 6) -33263.4000
(3990118.700)
(Ramadan 21-30xMarket_Cap 7) -179217.1000
(4006406.500)
(Ramadan 21-30xMarket_Cap 8) -266497.2000
(4008404.700)
(Ramadan 21-30xMarket_Cap 9) -2620739.3000
(3994274.500)
(Ramadan 21-30xMarket_Cap 10) -39202758.7000***
(4258734.700)
Odd_Days -1041935.3000
(3832181.500)
Even_Days -1088245.5000
(4032922.400)
(Odd_DaysxMarket_Cap 1) -309738.7000
(5794722.800)
(Odd_DaysxMarket_Cap 2) -165930.8000
(5423982.200)
(Odd_DaysxMarket_Cap 3) -126032.6000
(5416742.100)
(Odd_DaysxMarket_Cap 4) -132997.5000
(5416185.900)
(Odd_DaysxMarket_Cap 6) -46503.9000
(5476899.200)
(Odd_DaysxMarket_Cap 7) -381741.4000
(5492885.900)
(Odd_DaysxMarket_Cap 8) 188061.8000
(5492907.900)
(Odd_DaysxMarket_Cap 9) -2343447.9000
(5449699.700)
(Odd_DaysxMarket_Cap 10) -55725497.1000***
(5761442.600)
(Even_DaysxMarket_Cap 1) -137285.2000
(6067410.400)

The Holy Day Effect
49
(Even_DaysxMarket_Cap 2) 6512.1000
(5710792.900)
(Even_DaysxMarket_Cap 3) -16990.1000
(5676036.500)
(Even_DaysxMarket_Cap 4) -21947.5000
(5681870.300)
(Even_DaysxMarket_Cap 6) -25203.4000
(5735704.600)
(Even_DaysxMarket_Cap 7) 25992.9000
(5766518.600)
(Even_DaysxMarket_Cap 8) -804696.5000
(5771423.500)
(Even_DaysxMarket_Cap 9) -3055245.9000
(5778215.600)
(Even_DaysxMarket_Cap 10) -22032850.3000***
(6222373.000)
Ramadan 27th -707019.6000
(8014798.200)
(Ramadan 27th ×Market_Cap 1) -458944.5000
(12446596.200)
(Ramadan 27th ×Market_Cap 2) -213277.2000
(11262790.100)
(Ramadan 27th ×Market_Cap 3) -183876.5000
(11326460.200)
(Ramadan 27th ×Market_Cap 4) -263464.4000
(11324535.000)
(Ramadan 27th ×Market_Cap 6) -159423.6000
(11540451.800)
(Ramadan 27th ×Market_Cap 7) -151345.3000
(11547661.600)
(Ramadan 27th ×Market_Cap 8) 935508.9000
(11492560.400)
(Ramadan 27th ×Market_Cap 9) -250332.6000
(11494186.100)
(Ramadan 27th ×Market_Cap 10) -15613238.5000
(12384993.500)
Market _Cap 1 -31629.4000 -20993.7000 -40173.3000 -46176.7000
(6912048.100) (6898657.300) (6867999.300) (6919101.000)
Market _Cap 2 -45925.0000 -47002.9000 -58939.3000 -59367.6000
(7095580.500) (7091894.600) (7047394.800) (7117612.800)
Market _Cap 3 -36384.1000 -39482.1000 -44881.0000 -52829.3000
(7194814.300) (7192893.800) (7159349.400) (7227585.700)
Market _Cap 4 -2934.7000 -4341.6000 -6221.9000 -7727.8000
(7363640.800) (7361387.300) (7328511.700) (7400457.500)
Market _Cap 6 69801.0000 68096.9000 77187.1000 53339.7000
(7511889.700) (7504718.000) (7456278.600) (7536930.100)
Market _Cap 7 378028.3000 370671.8000 394716.8000 368421.6000
(7628126.500) (7621736.900) (7573272.400) (7642715.400)
Market _Cap 8 549022.2000 546896.8000 569782.8000 535711.9000
(7592897.200) (7587628.300) (7540670.800) (7617019.100)
Market _Cap 9 1464853.4000 1451949.2000 1491908.6000 1389414.4000
(8230429.200) (8225332.000) (8199727.200) (8269875.800)
Market _Cap 10 27556856.4000**
27468312.9**
28806825.5000***
27656137.6000**

The Holy Day Effect
50
(11038866.000) (11022255.700) (11007735.200) (11099141.000)
MSCI Return 410356.000***
417698.7000***
419541.8000***
410232.1000***
(113527.100) (113605.000) (113528.700) (113526.000)
One day lagged volume 0.6210***
0.6210***
0.6210***
0.6210***
(0.000) (0.000) (0.000) (0.000)
Two days lagged volume 0.2490***
0.2490***
0.2490***
0.2490***
(0.000) (0.000) (0.000) (0.000)
Constant -1041465.7000 -1043434.4000 -1160504.0000 -1052067.8000
(15587450.200) (15585213.400) (15571871.600) (15603787.500)
N 5608198 5608198 5608198 5608198
Day of the Week Dummy Yes Yes Yes Yes
Month of the Week Dummy
Variables
Yes Yes Yes Yes
Country Dummy Variables Yes Yes Yes Yes
Firm Level FE Yes Yes Yes Yes
Date Level FE Yes Yes Yes Yes
*** p<0.01, ** p<0.05, * p<0.1
Daily returns and change in volume are in percentage form (multiplied by 100). Figures in brackets under the coefficients are
standard errors from the Hausman Taylor model. Tuesday and April are dropped. Saturday and Sunday were automatically omitted
by Stata because of collinearity.

The Holy Day Effect
51
Table 14 Ashoura Regression
(1) (2)
Daily Return Daily Return
Ashoura 0.0067 1.8820***
(0.182) (0.597)
Shia -2.6320**
-2.6020**
(1.238) (1.238)
Interaction variable (Shia * Ashoura) -12.1300***
(3.677)
Volume 6.53e-08***
6.53e-08***
(1.24e-09) (1.24e-09)
MSCI Return 0.1380***
0.1380***
(0.004) (0.004)
One day lagged return -0.0638***
-0.0638***
(0.001) (0.001)
Two days lagged return -0.0233***
-0.0234***
(0.001) (0.001)
Constant 0.4820***
0.4770***
(0.182) (0.182)
N 889,294 889,294
Day of the Week Dummy Yes Yes
Month of the Year Dummy Variables Yes Yes
Country Dummy Variables Yes Yes
Firm Level FE Yes Yes
Date Level FE Yes Yes
* p<0.1, ** p<0.05, *** p<0.01
Daily returns and change in volume are in percentage form (multiplied by 100).
Figures in brackets under the coefficients are Newey and West (1987)
heteroskedasticity-autocorrelation-consistent standard errors. Tuesday and April are
dropped. Saturday and Sunday were automatically omitted by Stata because of
collinearity.
Recommended