The Health Status of American Indians/Native Americans
in Massachusetts
Massachusetts Department of Public HealthCenter for Health Information, Statistics, Research, and Evaluation
Division of Research and Epidemiology

Prepared by the Massachusetts Department of Public Health, Center for Health Information, Statistics, Research, and Evaluation
National American Indian Heritage Month
During National American Indian Heritage Month, we honor the generations of American Indians and Alaska Natives who have added to the character of our Nation. This month is an opportunity to celebrate their many accomplishments and their rich ancestry and traditions.
George W. Bush , 2006

Prepared by the Massachusetts Department of Public Health, Center for Health Information, Statistics, Research, and Evaluation
Native American Collaborators
• Mashpee Wampanoag Tribe
• Aquinnah Wampanoag Tribe
• North American Indian Center of Boston

Prepared by the Massachusetts Department of Public Health, Center for Health Information, Statistics, Research, and Evaluation
Indian Health Service Areas

Prepared by the Massachusetts Department of Public Health, Center for Health Information, Statistics, Research, and Evaluation
Making History
One of the first comprehensive reports on Native American health by a state

Prepared by the Massachusetts Department of Public Health, Center for Health Information, Statistics, Research, and Evaluation
Making History in Massachusetts
• First health report on American Indians
• First statewide report to collaborate with Native Americans
• First report to integrate information from federal, state and tribal data collections
• First report to use Indian-driven data

Prepared by the Massachusetts Department of Public Health, Center for Health Information, Statistics, Research, and Evaluation
American Indian Population by CountyMassachusetts: Census 2000
Source: U.S. Census 2000
Prepared by the Massachusetts Department of Public Health, Center for Health Information, Statistics, Research, and Evaluation
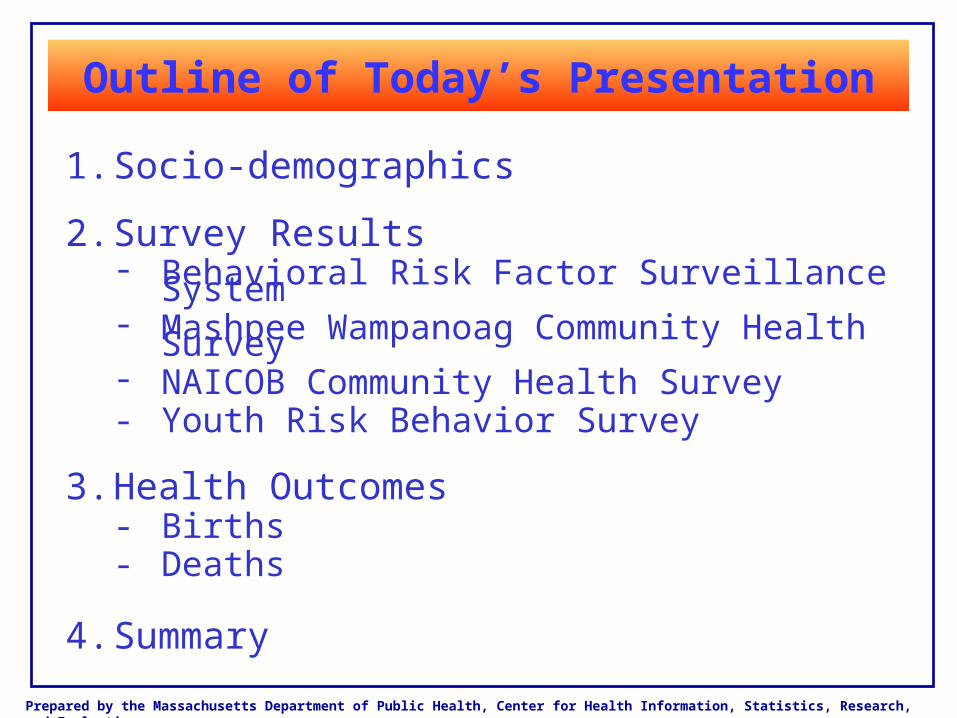
Outline of Today’s Presentation
1. Socio-demographics
2. Survey Results- Behavioral Risk Factor Surveillance System- Mashpee Wampanoag Community Health Survey- NAICOB Community Health Survey - Youth Risk Behavior Survey
3. Health Outcomes- Births- Deaths
4. Summary
Socio-Demographics
Prepared by the Massachusetts Department of Public Health, Center for Health Information, Statistics, Research, and Evaluation
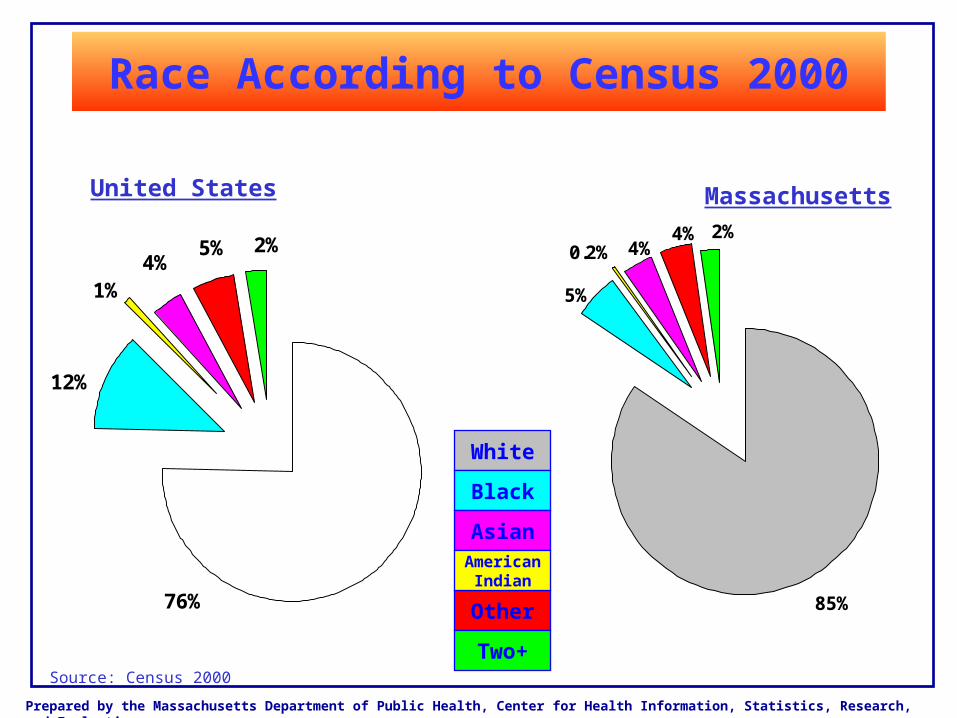
85%
2%4%4%0.2%
5%
Race According to Census 2000
2%5%4%
1%
12%
76%
United States Massachusetts
Source: Census 2000
White
Black
Asian
Other
American Indian
Two+
Prepared by the Massachusetts Department of Public Health, Center for Health Information, Statistics, Research, and Evaluation
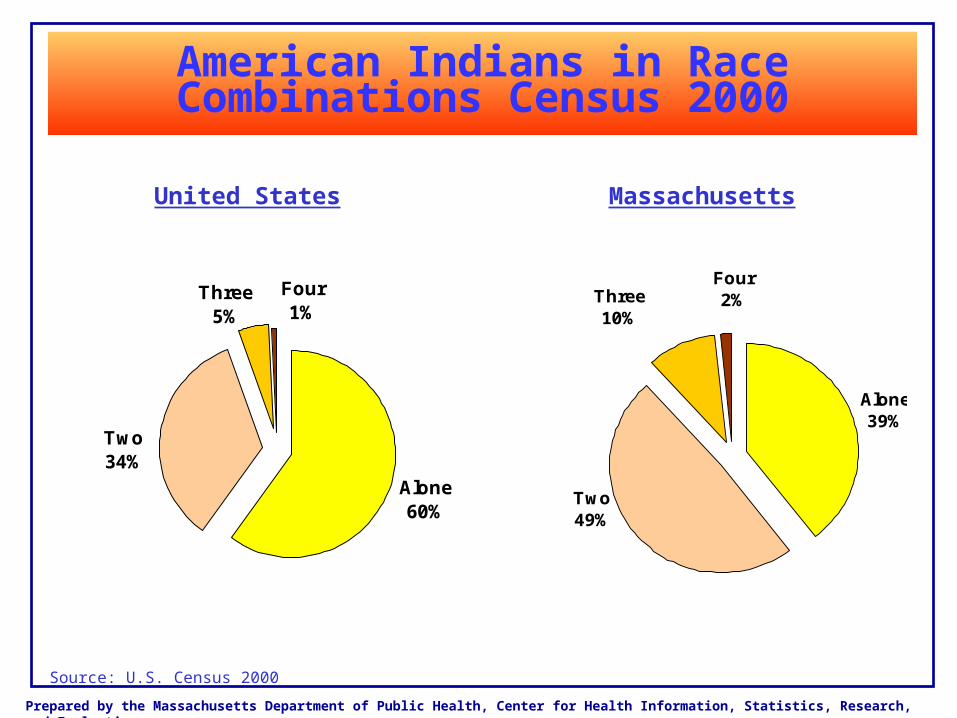
Alone39%
Four2%Three
10%
Two49%
American Indians in Race Combinations Census 2000
Two34%
Three5%
Four1%
Alone60%
United States Massachusetts
Source: U.S. Census 2000

Prepared by the Massachusetts Department of Public Health, Center for Health Information, Statistics, Research, and Evaluation
Different Counts of the American Indian/Alaska Native Population in
Massachusetts: 2000
19,390
38,05020,760
15,015
Census 2000
MDPH 2000
MARS 2000
Census 2000

Prepared by the Massachusetts Department of Public Health, Center for Health Information, Statistics, Research, and Evaluation
33%
31%
23%
14%
39%
32%
21%
7%
-40% -20% 0% 20% 40%Percent (%)
Age Distribution of American Indians in Massachusetts: Census 2000
American Indian Massachusetts Overall
65+
Source: U.S. Census 2000
45-64
25-44
0-24

Prepared by the Massachusetts Department of Public Health, Center for Health Information, Statistics, Research, and Evaluation
American Indian and Alaska Native Tribes Massachusetts: Census 2000
Tribe (Self-Identified) NumberTallied
Percent of MA AIAN Population (Alone or in
Combination)Cherokee 4,037 10.6%
Canadian and Latin American 2,716 7.1%
WampanoagAquinnah Wampanoag* Mashpee Wampanoag
2,546 303 178
6.7%
Micmac 1,554 4.1%
Blackfeet 1,521 4.0%
Iroquois 1,464 3.8%
Nipmuc 710 1.9%
Abenaki Nation of Missiquoi 696 1.8%
Other Tribes 20,689 54.4%
Tribe Not Specified & Not Elsewhere Classified
2,117 5.6%
* Only federally recognized American Indian Tribe in MassachusettsSource: U.S. Census 2000

Prepared by the Massachusetts Department of Public Health, Center for Health Information, Statistics, Research, and Evaluation
TOLLAND1.2%
MASHPEE3.1%
LAWRENCE2%
TISBURY: 1.4%
GAY HEAD (AQUINNAH)39.5%
OAK BLUFFS1.5%
American Indian Populationby Cities and Towns, Massachusetts 2000
American Indian Population by Town
> 1% of Total Population
<= 1% of total population
American Indian Population by City/Town Massachusetts: 2000
Source: U.S. Census 2000
> 1% MA population
<= 1% MA population
Prepared by the Massachusetts Department of Public Health, Center for Health Information, Statistics, Research, and Evaluation
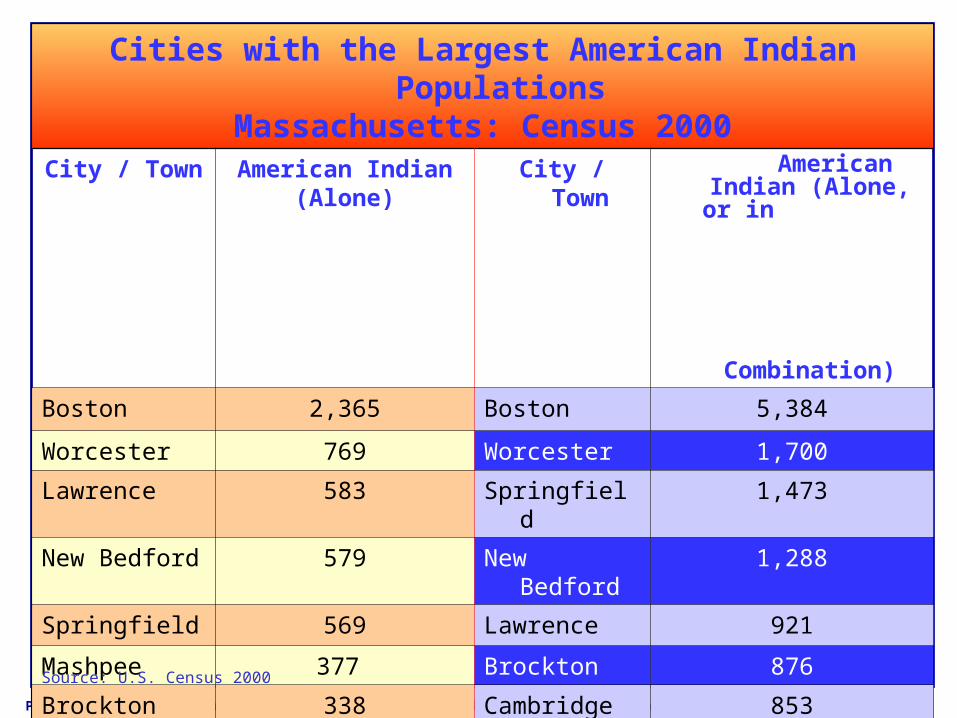
Cities with the Largest American Indian PopulationsMassachusetts: Census 2000
City / Town American Indian(Alone)
City / Town American Indian (Alone, or in
Combination)
Boston 2,365 Boston 5,384
Worcester 769 Worcester 1,700
Lawrence 583 Springfield 1,473
New Bedford 579 New Bedford 1,288
Springfield 569 Lawrence 921
Mashpee 377 Brockton 876
Brockton 338 Cambridge 853
Lynn 332 Lynn 796
Cambridge 290 Lowell 676
Barnstable 283 Fall River 587
Source: U.S. Census 2000

Prepared by the Massachusetts Department of Public Health, Center for Health Information, Statistics, Research, and Evaluation
American Indian PopulationMassachusetts: Census 2000
City / Town American Indian (Alone)
City / Town American Indian (Alone, or in
Combination)
Mashpee 377 Mashpee 502
Aquinnah 126 Aquinnah 148
Source: U.S. Census 2000
•••
Prepared by the Massachusetts Department of Public Health, Center for Health Information, Statistics, Research, and Evaluation
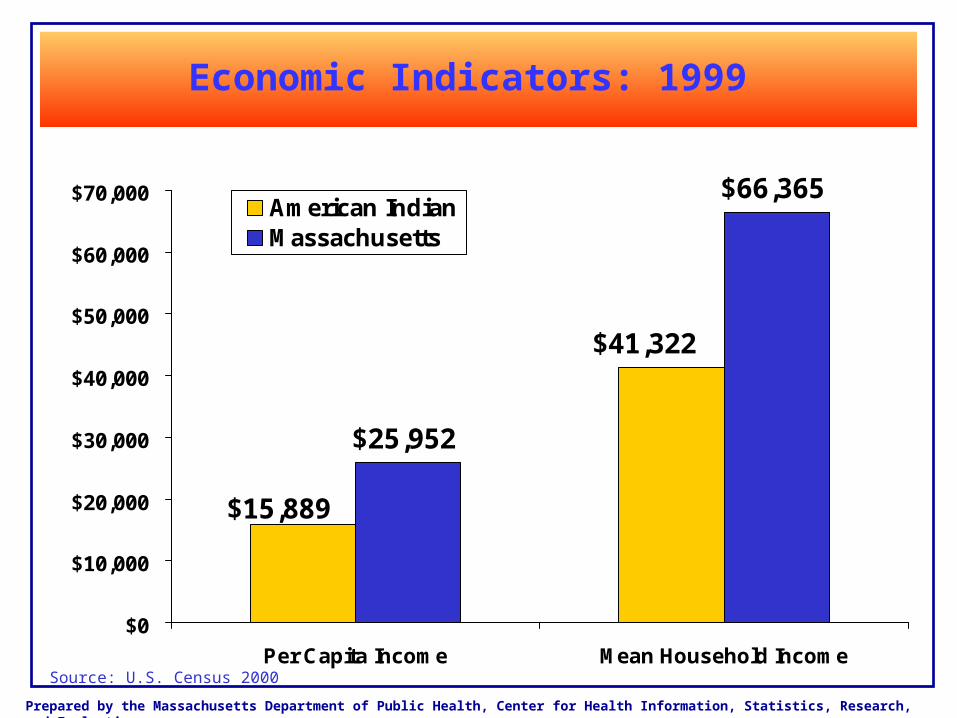
Economic Indicators: 1999
$25,952
$66,365
$41,322
$15,889
$0
$10,000
$20,000
$30,000
$40,000
$50,000
$60,000
$70,000
Per Capita Income Mean Household Income
American IndianMassachusetts
Source: U.S. Census 2000

Prepared by the Massachusetts Department of Public Health, Center for Health Information, Statistics, Research, and Evaluation
Socio-Demographic Indicators: 2000
15.0%9.3%
61.7%
37.7%
21.0%28.0%
0%
20%
40%
60%
80%
100%
Less than High SchoolEducation
Persons Living BelowPoverty
Owner OccupiedHouseholds
American Indian
Massachusetts
Source: U.S. Census 2000

Prepared by the Massachusetts Department of Public Health, Center for Health Information, Statistics, Research, and Evaluation
Less Than High School Education Massachusetts: 2000
Source: U.S. Census 2000, SF-4
13.0%
23.0%
43.0%
23.0%
15.0%
0%
5%
10%
15%
20%
25%
30%
35%
40%
45%
50%
White Non-Hispanic
Black Non-Hispanic
Hispanic American Indian Massachusetts
Per
cen
tag
e

Prepared by the Massachusetts Department of Public Health, Center for Health Information, Statistics, Research, and Evaluation
Census 2000 Adjusted CountMassachusetts: 2000
Race April 2000 Adjusted % Diff.
Total Population 6,349,097 6,396,100 0.7%
White 5,367,286 5,393,584 0.5%
Black 343,454 351,882 2.5%
American Indian 15,015 15,484 3.1%
Asian 240,613 243,171 1.1%
Two or more races 146,005 148,640 1.8% Ethnicity Hispanic 428,729 441,974 3.1%
Source: U.S. Census 2000

Survey Results

Prepared by the Massachusetts Department of Public Health, Center for Health Information, Statistics, Research, and Evaluation
Health Status Findings Behavioral Risk Factor Surveillance Survey
Massachusetts: 2001-2005
65.4%
31.1%29.6%
78.3%
18.8%12.6%
0%
20%
40%
60%
80%
100%
Fair/Poor Health Current Smoker Engage in leisurephysical activity
American Indian
Massachusetts
Source: Behavioral Risk Factor Surveillance System (BRFSS) 2001-2005
Prepared by the Massachusetts Department of Public Health, Center for Health Information, Statistics, Research, and Evaluation
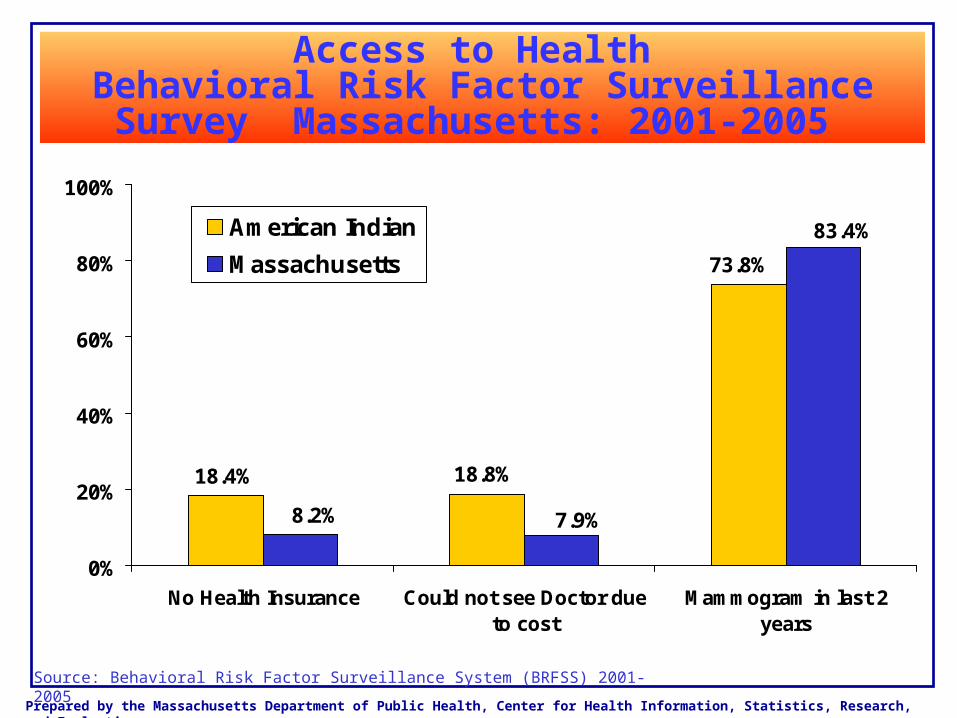
Access to Health Behavioral Risk Factor Surveillance Survey
Massachusetts: 2001-2005
73.8%
18.8%18.4%
83.4%
7.9%8.2%
0%
20%
40%
60%
80%
100%
No Health Insurance Could not see Doctor dueto cost
Mammogram in last 2years
American Indian
Massachusetts
Source: Behavioral Risk Factor Surveillance System (BRFSS) 2001-2005

Prepared by the Massachusetts Department of Public Health, Center for Health Information, Statistics, Research, and Evaluation
Health Status Indicators North American Indian Center of Boston
Community Health Survey: 2002
46.5%
33.7%
20.6%
76.9%
16.7%9.6%
0%
20%
40%
60%
80%
100%
15+ days poor emotionalhealth
Obese Dental visit past year
American Indian
Massachusetts
Source: North American Indian Center of Boston Community Health Survey, 2002.
Prepared by the Massachusetts Department of Public Health, Center for Health Information, Statistics, Research, and Evaluation
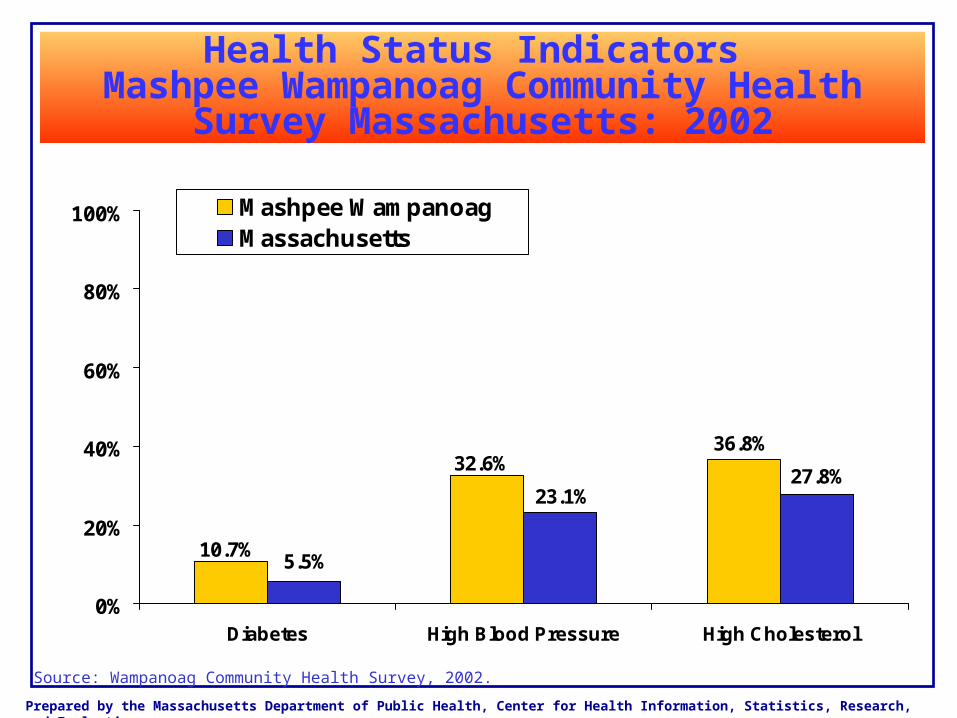
Health Status Indicators Mashpee Wampanoag Community Health Survey
Massachusetts: 2002
36.8%32.6%
10.7%
27.8%23.1%
5.5%
0%
20%
40%
60%
80%
100%
Diabetes High Blood Pressure High Cholesterol
Mashpee WampanoagMassachusetts
Source: Wampanoag Community Health Survey, 2002.
Prepared by the Massachusetts Department of Public Health, Center for Health Information, Statistics, Research, and Evaluation
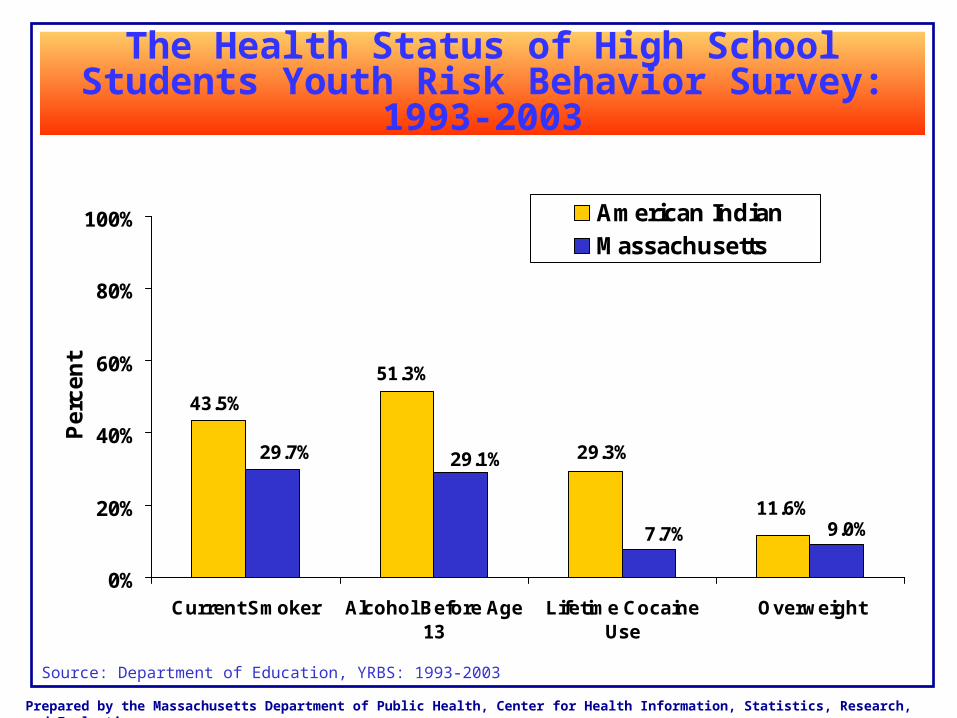
The Health Status of High School Students Youth Risk Behavior Survey: 1993-2003
11.6%
29.3%
51.3%
43.5%
9.0%7.7%
29.1%29.7%
0%
20%
40%
60%
80%
100%
Current Smoker Alcohol Before Age13
Lifetime CocaineUse
Overweight
Pe
rce
nt
American IndianMassachusetts
Source: Department of Education, YRBS: 1993-2003

Prepared by the Massachusetts Department of Public Health, Center for Health Information, Statistics, Research, and Evaluation
24.5%30.3%
9.2%8.7%
0%
20%
40%
60%
80%
100%
Member of Gangs Attempted Suicide
Pe
rce
nt
American IndianMassachusetts
Source: Department of Education, YRBS: 1993-2003
The Health Status of High School Students Youth Risk Behavior Survey: 1993-2003

Health Outcomes
Prepared by the Massachusetts Department of Public Health, Center for Health Information, Statistics, Research, and Evaluation
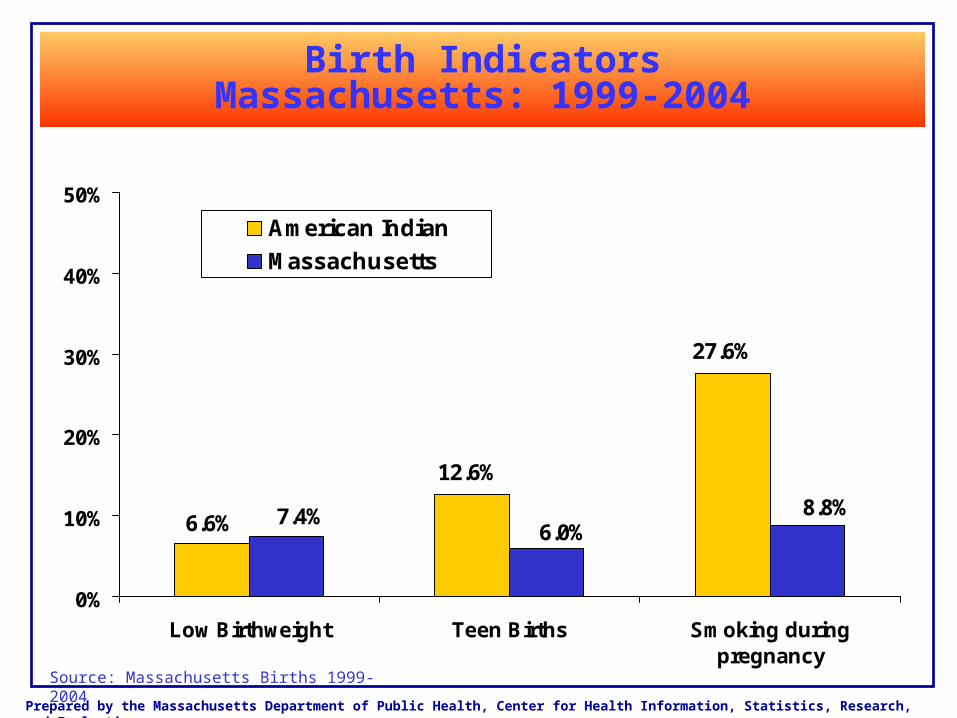
27.6%
12.6%
6.6%8.8%
6.0%7.4%
0%
10%
20%
30%
40%
50%
Low Birthweight Teen Births Smoking duringpregnancy
American Indian
Massachusetts
Source: Massachusetts Births 1999-2004
Birth IndicatorsMassachusetts: 1999-2004
Prepared by the Massachusetts Department of Public Health, Center for Health Information, Statistics, Research, and Evaluation
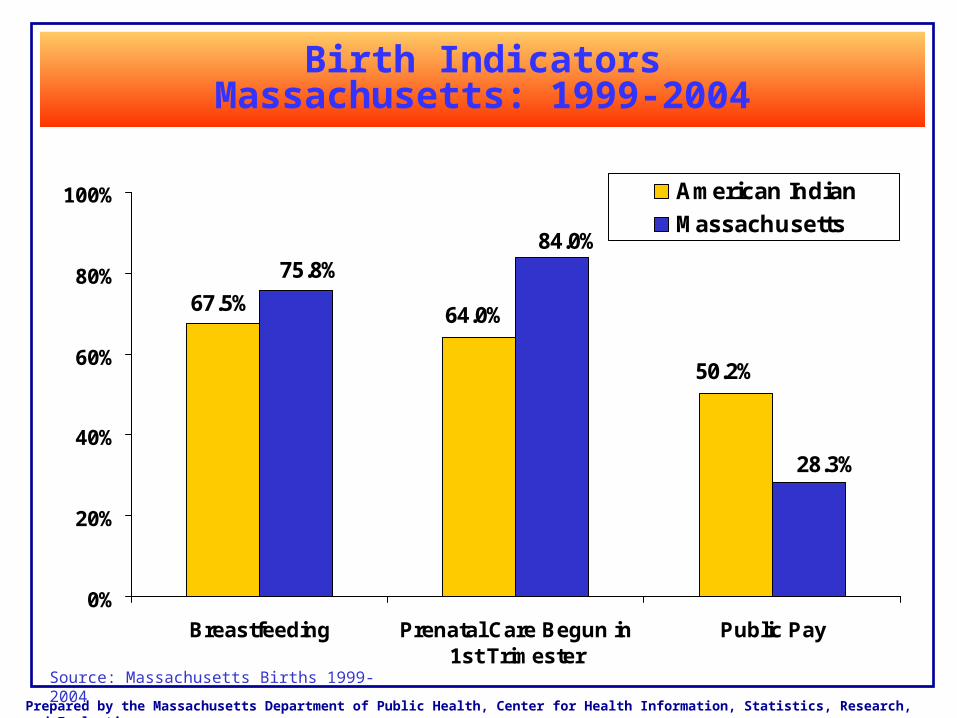
Birth IndicatorsMassachusetts: 1999-2004
50.2%
64.0%67.5%
28.3%
84.0%75.8%
0%
20%
40%
60%
80%
100%
Breastfeeding Prenatal Care Begun in1st Trimester
Public Pay
American Indian
Massachusetts
Source: Massachusetts Births 1999-2004

Prepared by the Massachusetts Department of Public Health, Center for Health Information, Statistics, Research, and Evaluation
Leading Causes of Death (NCHS Ranking) Massachusetts: 1994-2004
Massachusetts (N=611,825)
1. Heart Disease (28%)
2. Cancer (25%)
3. Stroke (6%)
4. CLRD1 (5%)
5. Injuries & Poisonings (4%)
American Indians (N=443)
1. Cancer (23%)
2. Heart Disease (22%)
3. Injuries & Poisonings (9%)
4. Stroke (5%)
5. Pneumonia & Influenza (4%)
1 Chronic Lower Respiratory Disease Source: Massachusetts Department of Public Health, Massachusetts Deaths 1994-2004

Prepared by the Massachusetts Department of Public Health, Center for Health Information, Statistics, Research, and Evaluation
Underestimation in Mortality Rates for American Indians
Because it is more likely for race to be reported as Native American in the Census than it is in the death certificates, this results in a net underestimation of mortality
•The number of deaths (numerator) and the population count (denominator) are inconsistent.
•Race is self-reported on the Census; whereas, on death certificates, race may be reported by the family, the certifying physician, the funeral director, or other informant.
•More than one race can be reported on the Census, whereas, currently, only single races are allowed on the death certificate
•The American Indian population count (denominator) in mortality rates may be inaccurate because of the large number of mixed-race persons who are, in part, Native American.

Prepared by the Massachusetts Department of Public Health, Center for Health Information, Statistics, Research, and Evaluation
All Cause MortalityAge-Adjusted Death Rates: 1994-2004
956.7
392.8498.2
987.0
810.3
0
200
400
600
800
1,000
1,200
1,400
1,600
White non-Hispanic
Black non-Hispanic
Hispanic American Indiannon-Hispanic
American Indian(AlternativeEstimate)
De
ath
s p
er
10
0,0
00
po
pu
lati
on
Age-adjusted to the 2000 US standard population. Source: Massachusetts Department of Public Health, Death certificates.
Adjusted Estimate
Underestimate

Summary

Prepared by the Massachusetts Department of Public Health, Center for Health Information, Statistics, Research, and Evaluation
The Health Status of American Indians/Native Americans in Massachusetts
• Makes history in Massachusetts public health
• A baseline by which we can track improvements in American Indian health
• A much needed resource for American Indian groups to assess the health needs of their communities
• Highlights the need for better methods of collection of race and ethnicity data
• Starting point for research into the health of American Indians and the development of programs targeted to this population
Summary

Prepared by the Massachusetts Department of Public Health, Center for Health Information, Statistics, Research, and Evaluation
How Can You Access this Report?
• Hard Copies: (617) 624-5640
(617) 624-5639
• TDD/TTY: (617) 624-6001
• DPH Website:
http://www.mass.gov/dph/pubstats.htm

Thank You
Recommended