The Greening of the Tugboat Options for Reducing Emissions and Fuel Use
Fuzz Alexander, P.Eng.

Presentation Outline
• Brief history - Who are we?
• Ship Handling Tugs - overview
• Powering Requirements
• Operating Profiles
• Propulsion and Powering Methods: Conventional and
Emerging
• Relative Fuel/Emissions Efficiency
• “GREEN (bucks)” Considerations: CAPEX & OPEX
• Options Summary
• Questions and Comments
2
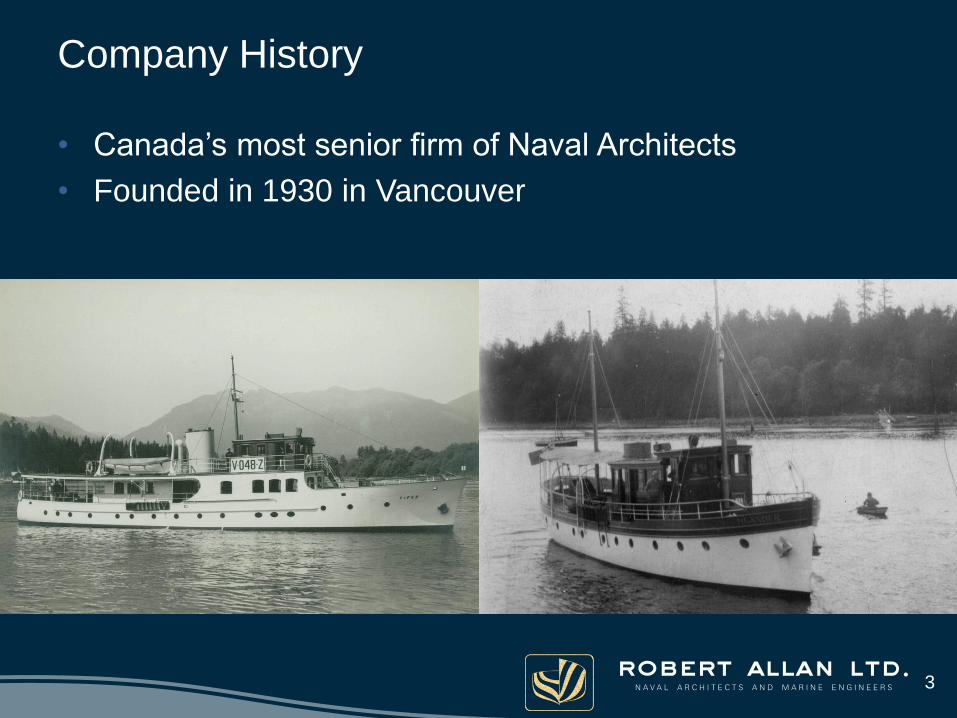
Company History
• Canada’s most senior firm of Naval Architects
• Founded in 1930 in Vancouver
3
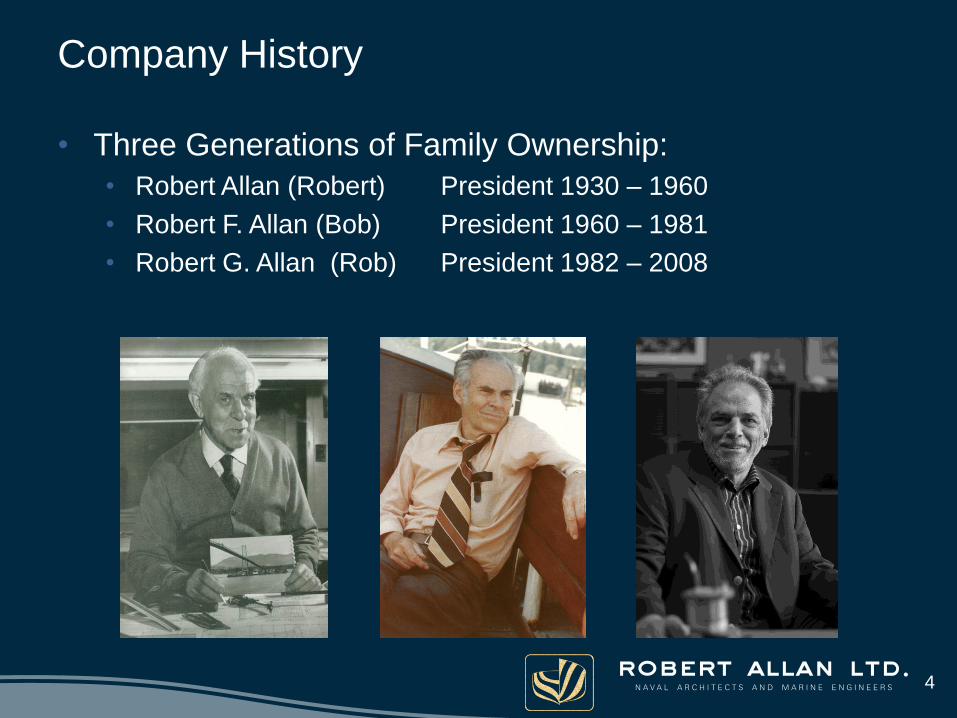
Company History
• Three Generations of Family Ownership:
• Robert Allan (Robert) President 1930 – 1960
• Robert F. Allan (Bob) President 1960 – 1981
• Robert G. Allan (Rob) President 1982 – 2008
4

Company History
• 2008, new era of Management Ownership
• Current technical staff ~ 70
• Diverse Management Team
5

80+ Years
• Always a Focus on Innovative and Diverse designs
6
CNG-powered Short-Sea Drop Trailer Ferry
US Navy Z-Tech Harbour Tugs
Arctic Shipping Self-loading/unloading Log Barges
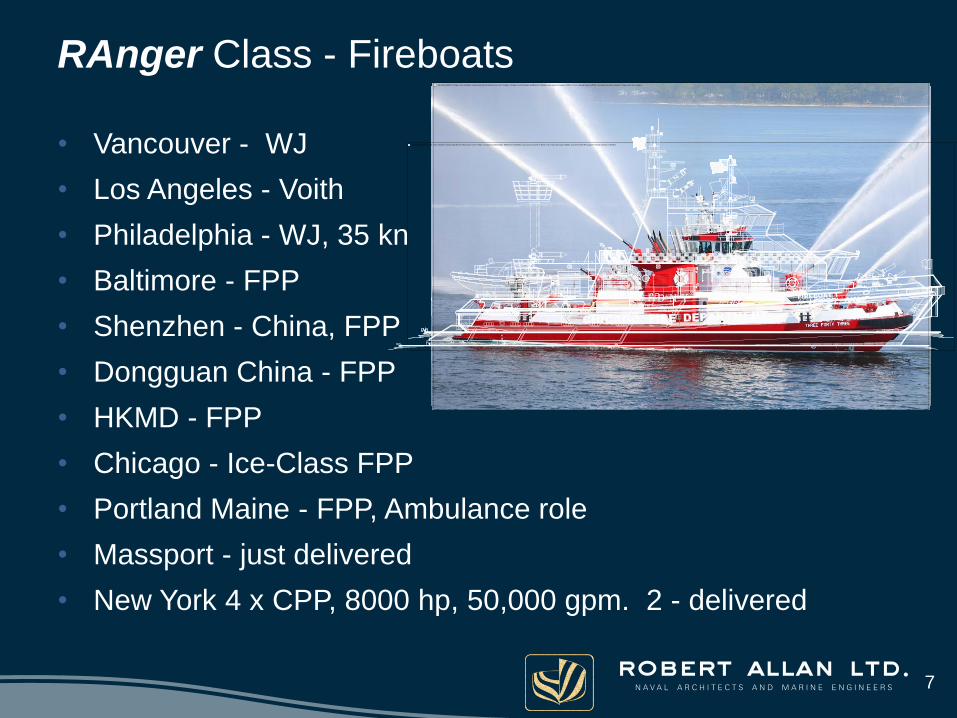
RAnger Class - Fireboats
• Vancouver - WJ
• Los Angeles - Voith
• Philadelphia - WJ, 35 kn
• Baltimore - FPP
• Shenzhen - China, FPP
• Dongguan China - FPP
• HKMD - FPP
• Chicago - Ice-Class FPP
• Portland Maine - FPP, Ambulance role
• Massport - just delivered
• New York 4 x CPP, 8000 hp, 50,000 gpm. 2 - delivered
7

Independent Engineering Services
• Not affiliated with any equipment manufacturers, shipyards
or ship owners
• We work with them all to provide independent professional
design services.
8
Greening of Tugboats
• Various tugboat duties and operating conditions: • Long-haul towboats and pushboats
• Tend to have medium to high load factors (average power vs.
rated power), typically in the range of 40% to 60%, and relatively
high annual runtime, perhaps 5,000 hrs/year or greater
• Relatively consistent operating conditions
• Harbour and escort duty tugs – commonly called ship handling tugs
• Tend to have low load factors, typically in the range of 20 to 35%.
• Widely varying operating conditions
• Annual runtime can range from 1,000 to 5,000 hours, typically
about 2,500.
• Short-haul towboats and pushboats often have similar operating
conditions
• Focus of this Green Tugs discussion is on ship handling tugs
9

Ship Handling Harbour and Escort Duty Tugboats
10

Ship Handling Tugboats: Going Green
11
• Greener Operations = lower environmental impact and potentially lower operating costs
• Low environmental impact = low energy footprint resulting from high energy efficiency
• For Naval Architects, high energy efficiency = low resistance
• Save fuel and reduce emissions by efficient vessel design using efficient propulsion technologies
• Save fuel and reduce emissions by lower operating speeds
• e.g. 20% speed reduction = 25% more transit time = 40% less fuel
• Reduce emissions by using low-carbon fuels
• e.g. natural gas = 20% lower CO2 than diesel fuel for same energy input, plus:
• = up to 99% lower particulates than diesel
• = up to 60% lower fuel cost than diesel

Operating Profile of Ship Handling / Escort Tugs
0%
5%
10%
15%
20%
25%
30%
35%
3% 8% 15% 25% 35% 45% 55% 65% 75% 85% 95%
% o
f O
pera
tin
g T
ime a
t P
ow
er
Vessel % Required Power
Vessel Average Operating Profile Average propulsion power typically = 25% of rated propulsion power
12

• Ship Handling Tugs Modern harbour or escort class tugs typically have twin Z-drive propulsors
or twin Voith Schneider Propellers (cycloidal drives)
Omni-directional maneuverability and high bollard pull are primary functional characteristics
13
RAmparts 32

Installed Prop Power:
5.400kW
Propulsion power:
~5.400kWm
Propulsion Technologies: diesel-mechanical DM version
Wӓrtsilӓ main engines shown are typical for medium-speed applications
14
50 Hz Feeders
8L26 2720 kW at 1000 rpm
WÄRTSILÄ 8L26
G
Ship’s Services
200 kW at 1500 rpm
G
Ship’s Services
200 kW at 1500 rpm
8L26 2720 kW at 1000 rpm
WÄRTSILÄ 8L26
CS300-2800HR
CS300-2800HR
~ 88 TBP
slide images courtesy of:
© Wärtsilä 16 May 2016
PTI 2500 kW
PTI 2500 kW
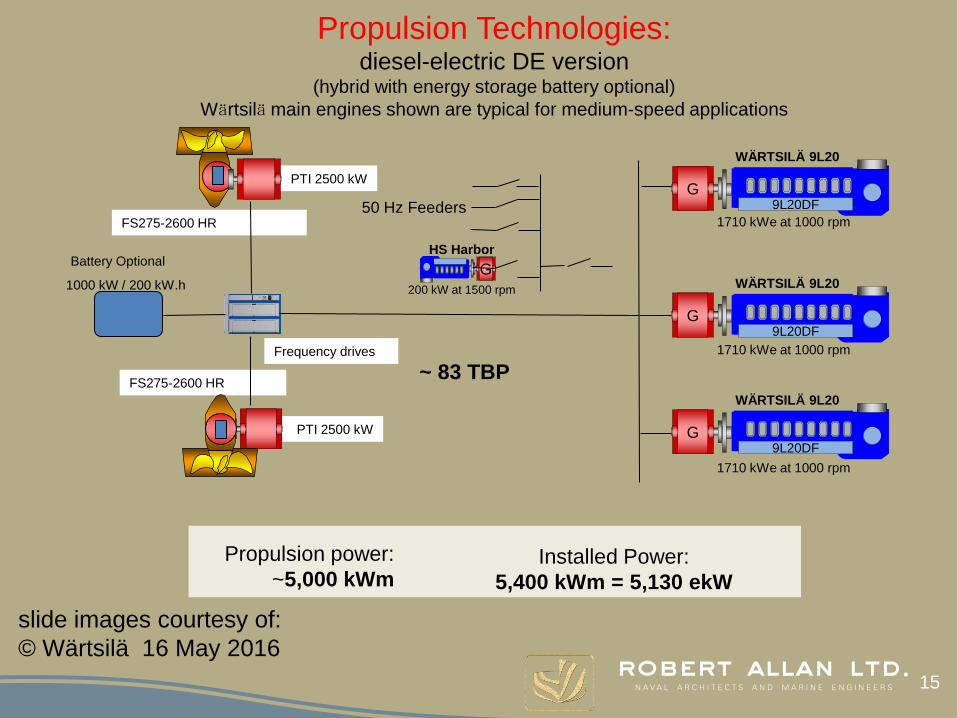
Propulsion Technologies: diesel-electric DE version
(hybrid with energy storage battery optional)
Wӓrtsilӓ main engines shown are typical for medium-speed applications
15
FS275-2600 HR
FS275-2600 HR
Frequency drives
G
HS Harbor
200 kW at 1500 rpm
1710 kWe at 1000 rpm
9L20DF
WÄRTSILÄ 9L20
G
1710 kWe at 1000 rpm
9L20DF
WÄRTSILÄ 9L20
G
50 Hz Feeders
1710 kWe at 1000 rpm
9L20DF
WÄRTSILÄ 9L20
G
Battery Optional
1000 kW / 200 kW.h
~ 83 TBP
Installed Power:
5,400 kWm = 5,130 ekW
Propulsion power:
~5,000 kWm
slide images courtesy of:
© Wärtsilä 16 May 2016
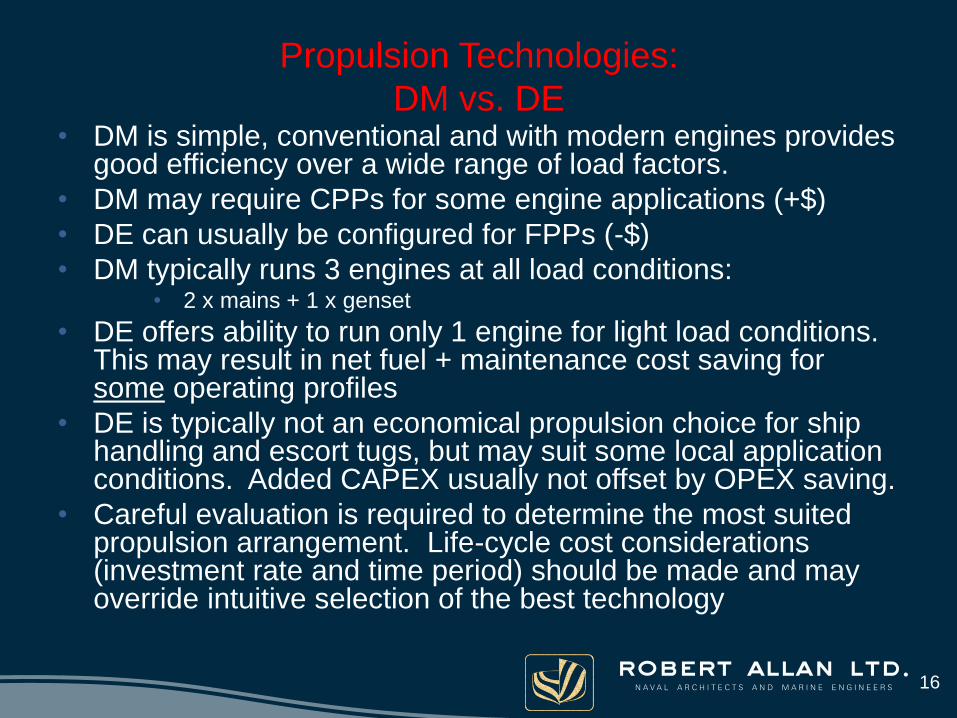
Propulsion Technologies:
DM vs. DE • DM is simple, conventional and with modern engines provides
good efficiency over a wide range of load factors.
• DM may require CPPs for some engine applications (+$)
• DE can usually be configured for FPPs (-$)
• DM typically runs 3 engines at all load conditions: • 2 x mains + 1 x genset
• DE offers ability to run only 1 engine for light load conditions. This may result in net fuel + maintenance cost saving for some operating profiles
• DE is typically not an economical propulsion choice for ship handling and escort tugs, but may suit some local application conditions. Added CAPEX usually not offset by OPEX saving.
• Careful evaluation is required to determine the most suited propulsion arrangement. Life-cycle cost considerations (investment rate and time period) should be made and may override intuitive selection of the best technology
16
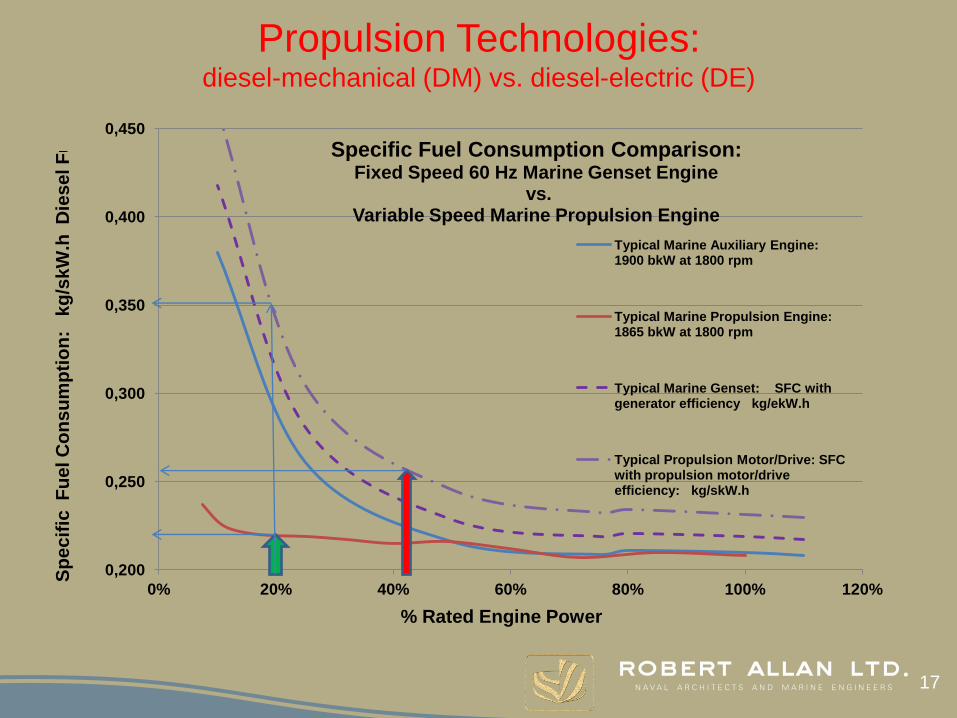
Propulsion Technologies: diesel-mechanical (DM) vs. diesel-electric (DE)
0,200
0,250
0,300
0,350
0,400
0,450
0% 20% 40% 60% 80% 100% 120%
Specific Fuel Consumption Comparison: Fixed Speed 60 Hz Marine Genset Engine
vs. Variable Speed Marine Propulsion Engine
Typical Marine Auxiliary Engine: 1900 bkW at 1800 rpm
Typical Marine Propulsion Engine: 1865 bkW at 1800 rpm
Typical Marine Genset: SFC with generator efficiency kg/ekW.h
Typical Propulsion Motor/Drive: SFC with propulsion motor/drive efficiency: kg/skW.h
% Rated Engine Power
Sp
ecif
ic F
uel C
on
su
mp
tio
n:
kg
/skW
.h D
iesel F
uel
17

Frequency drives
PTO / PTI 850 kW
PTO / PTI 850 kW
Propulsion Technologies: DM-DE mechanical-electrical hybrid version
Wӓrtsilӓ main engines shown are typical for medium-speed applications
18
CS300-2800 HR
CS300-2800 HR
G
HS Harbor
200 kW at 1500 rpm
1600 kW at 1000 rpm
8L20
WÄRTSILÄ 8L20
1600 kW at 1000 rpm
8L20
WÄRTSILÄ 8L20
50 Hz Feeders
1140 kWe at 1000 rpm
G
WÄRTSILÄ 6L20
6L20
1140 kWe at 1000 rpm
G
WÄRTSILÄ 6L20
6l20
~ 82 TBP
slide images courtesy of:
© Wärtsilä 16 May 2012
Installed Power:
5,600 kWm = 3200 kWm + 2,280 ekW
Propulsion power:
~4,900 kWm
Battery (optional)
Propulsion Technologies:
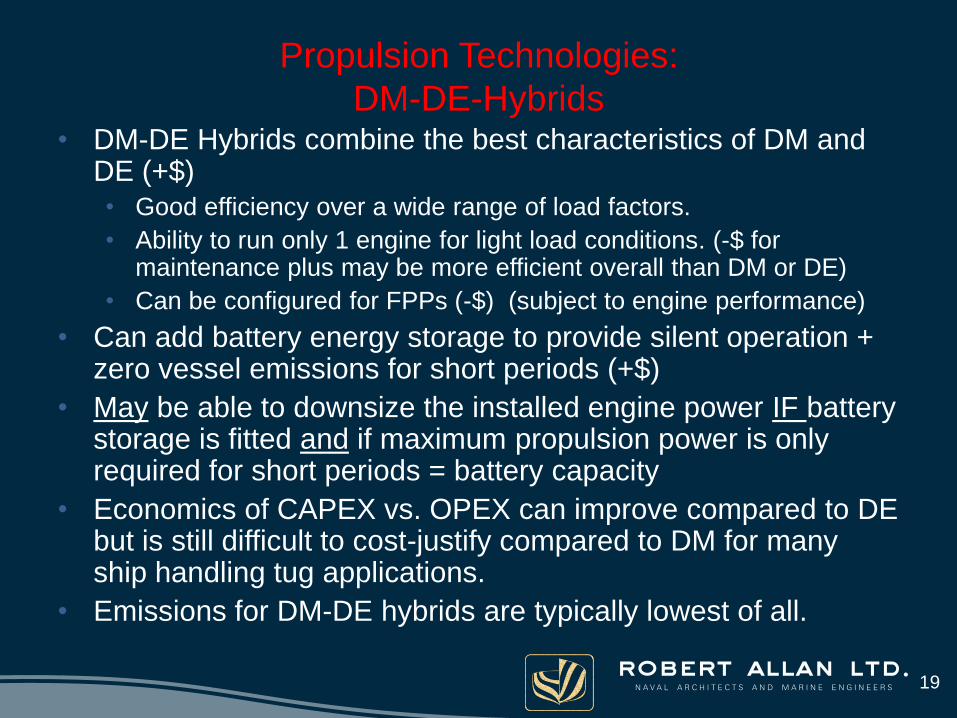
DM-DE-Hybrids • DM-DE Hybrids combine the best characteristics of DM and
DE (+$)
• Good efficiency over a wide range of load factors.
• Ability to run only 1 engine for light load conditions. (-$ for maintenance plus may be more efficient overall than DM or DE)
• Can be configured for FPPs (-$) (subject to engine performance)
• Can add battery energy storage to provide silent operation + zero vessel emissions for short periods (+$)
• May be able to downsize the installed engine power IF battery storage is fitted and if maximum propulsion power is only required for short periods = battery capacity
• Economics of CAPEX vs. OPEX can improve compared to DE but is still difficult to cost-justify compared to DM for many ship handling tug applications.
• Emissions for DM-DE hybrids are typically lowest of all.
19

Naval Architecture Fundamentals:
Speed – resistance – power relationship
20
0
500
1000
1500
2000
2500
3000
0 5 10 15
Propulsion power kW vs. speed kts
e.g. 10 kts speed = 1100 kW; 8 kts speed = 650 kW
= - 40% fuel/emissions for + 25% time

Operating methods for reduced fuel burn/emissions
• Speed: is there really a rush to get there, or to get back?
• Slowing down lowers resistance = less power = less fuel • + 25 % transit time can yield 40% or more in reduced fuel/emissions
• Loiter time: Minimize by slowing down the transit speed • Some operations noted to transit to rendezvous point at 10 kts and then loiter
(drift or hold position) for an hour or more while awaiting the target vessel. This works well – but isn’t efficient, and isn’t green!
• Some operations transit to base at 10 kts and then hold dock-side waiting for next task. This works well – but isn’t efficient, and isn’t green. Could have returned at lower speed.
• Communication and scheduling can minimize fuel burn and emissions
• Empower and reward the crew to save fuel.
• Reap the “greenbacks” that result from optimizing operations.
21

Alternate Fuel: biodiesel fuelled tugs;
conventional fuel bunkering and storage
• Biodiesel fuels are primarily derived from renewable plant oils
• Different processes yield different characteristics:
• FAME fuel: Fatty Acid Methyl Esters. Used pure can result in 10% to 30% reduction in CO2 and PM; but 10% to 25% increase in NOx. This is presently the most commonly available biodiesel but is generally more expensive than conventional diesel and may not be appropriate for some engines at high concentrations. Best left as applicable to low % blends with conventional diesel with reductions/increases proportional to blend.
• HDRD fuel: Hydrogenation Derived Renewable Diesel. Similar reductions in CO2 and PM, less increase in NOx due to better ignition/combustion characteristics. Not commonly available but probably could be lower cost than FAME and more suited to use in engines at higher concentrations. Projected to become more common and potentially closer to conventional diesel cost.
• OTHER. Variety of processes and characteristics and costs. No widespread availability but some may develop to being viable and cost effective
• Biodiesel is legislated as blends with conventional diesel in some regions: e.g. B2, B5, B20.
• US Navy has expressed target to use an average of 50% biodiesel.
22

Alternate Fuel: natural gas fuelled tugs;
CNG or LNG fuel bunkering and storage
• Natural gas is the lowest carbon-content fossil fuel
• Gaseous form can be used in pure gas (spark ignited) or in dual-fuel diesel engines
• Typical engine emissions reduction compared to conventional diesel:
• - 20 % CO2 (may be partially offset by gas-slip for some engines)
• - 90 % PM (compared to pre 2010 engines, similar to EPA Tier 4)
• - 80 % NOx (compared to pre 2010 engines, similar to EPA Tier 4)
• Commonly available as gaseous pipeline distribution in or near most major ports
• For in-hull storage requires space for segregated tank hold for the compressed gas (CNG) or liquefied gas (LNG) storage tanks.
• Can be stored as CNG at nominal 250 bar (3600 psi) which needs ~7 to 10 x the spacial volume of diesel for the same energy content. Some new technologies store at ~500 bar (7000 psi) or higher = ~4 to 7 x spacial volume of diesel.
• CNG is common for automotive applications worldwide, especially South America. Some limited marine application history (including some small ferries in BC).
• CNG applications typically have a shoreside compression and storage station to supply the on-vessel storage cylinders.
• Variety of CNG storage cylinders, some may be accepted for marine applications
• CNG requires compression energy but needs less energy and emissions than liquefaction
23

CNG Storage Cylinders
• e.g. Lincoln Composites Titan tank system – 4 tank
module • Module volume = ~71 m3
• CNG fuel energy content ~97,000 kWf.h @ 250 bar = 9.8 m3 diesel
equivalent
24

LNG Storage – likely the only practical choice for tugs
• Natural gas can be liquefied by cooling to -163 °C and
stored at near atmospheric pressure in a cryogenic tank
(e.g. “thermos” bottles).
• LNG can be heated and re-vaporized to gaseous fuel for
distribution to engines.
• LNG storage tanks can typically sustain several days
without use before temperature/pressure rises too much
and re-cooling or venting is required. Time depends on
effectiveness of insulation. Usually max pressure = 10
bar
25
LNG Storage
• LNG storage at low pressure ( ~ 2 to 5 bar)
• Vaporizer and pressure control system can be integrated with storage tank (tank room adjoins storage tank)
• Tank/tank room unit installs in a segregated tank hold with spacial volume ~ 4 x diesel equivalent
• Currently available tank shapes require premium space • Difficult to allocate LNG storage space on small vessels – especially
tugs
• More frequent bunkering needed than with diesel
• Availability of LNG bunkering must be considered
• LNG cost in order of $.03 to $.06 per kWf.h vs. $.085 for diesel (no taxes; LNG at $7.50 to $ 15 per GJ)
• Promising alternative fuel for higher power, higher runtime applications. May be difficult to cost-justify for some ship handling tug applications.
26
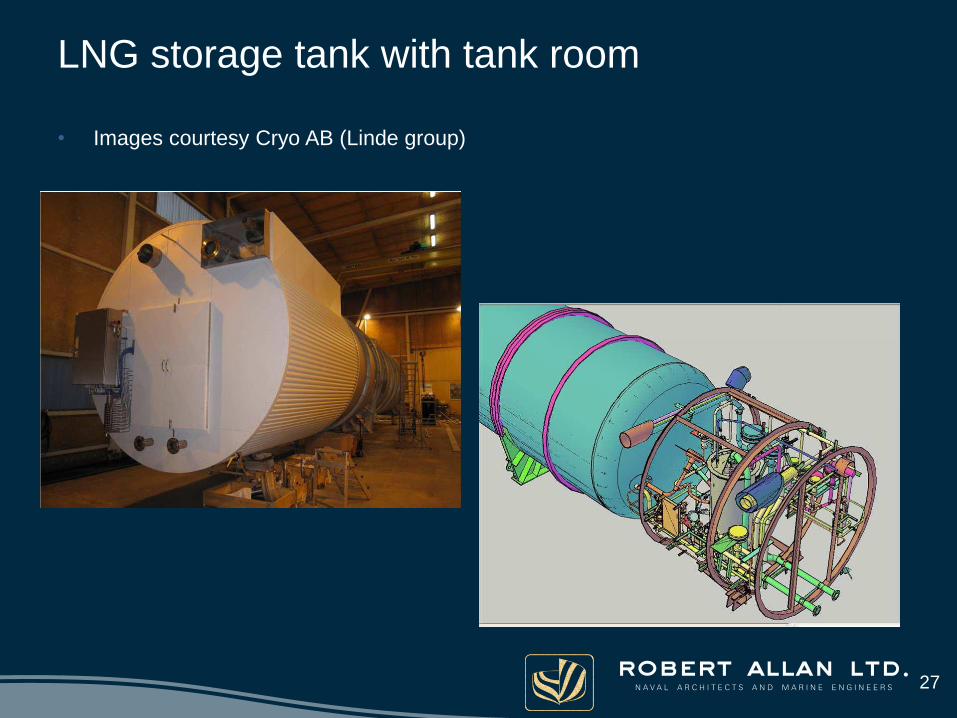
LNG storage tank with tank room
• Images courtesy Cryo AB (Linde group)
27
28
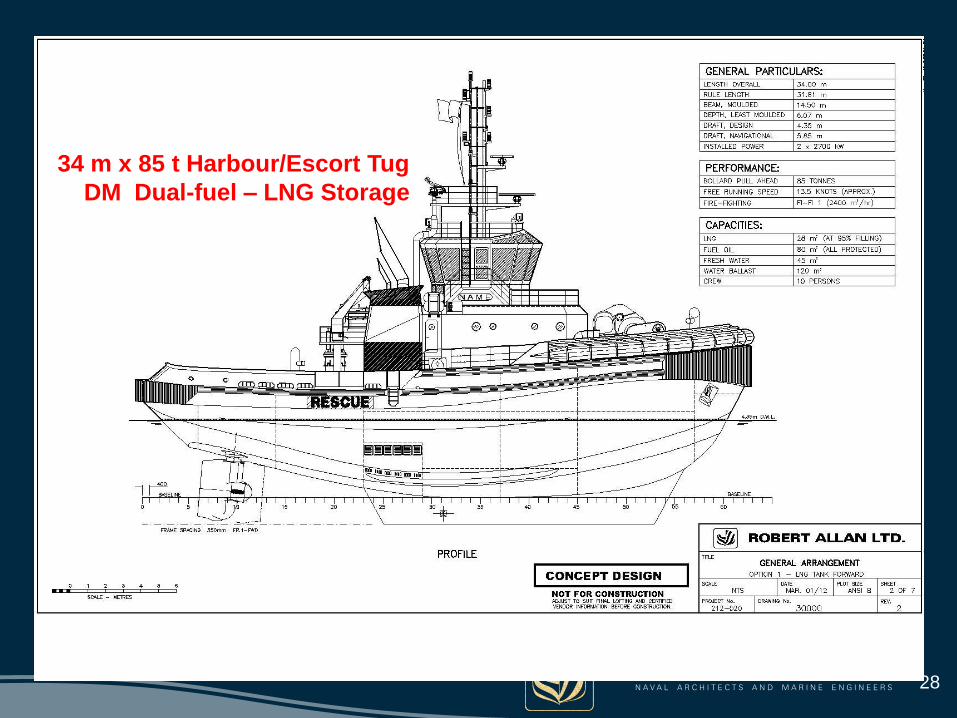
34 m x 85 t Harbour/Escort Tug
DM Dual-fuel – LNG Storage
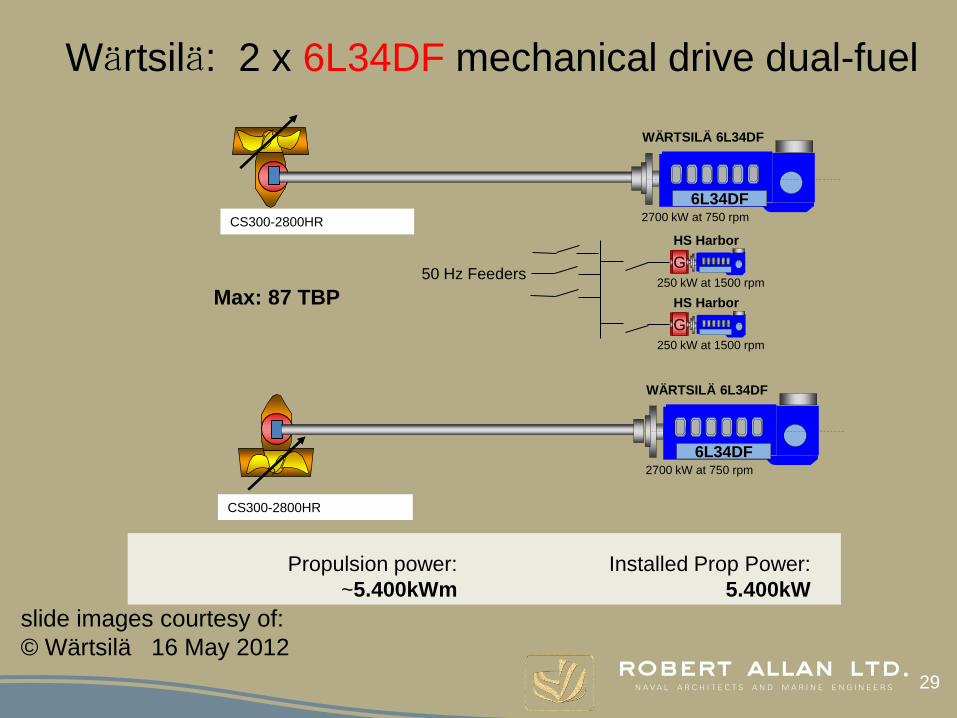
Installed Prop Power:
5.400kW
Propulsion power:
~5.400kWm
50 Hz Feeders
6L34DF 2700 kW at 750 rpm
WÄRTSILÄ 6L34DF
G
HS Harbor
250 kW at 1500 rpm
G
HS Harbor
250 kW at 1500 rpm
Wӓrtsilӓ: 2 x 6L34DF mechanical drive dual-fuel
29
6L34DF 2700 kW at 750 rpm
WÄRTSILÄ 6L34DF
CS300-2800HR
CS300-2800HR
Max: 87 TBP
slide images courtesy of:
© Wärtsilä 16 May 2012
30
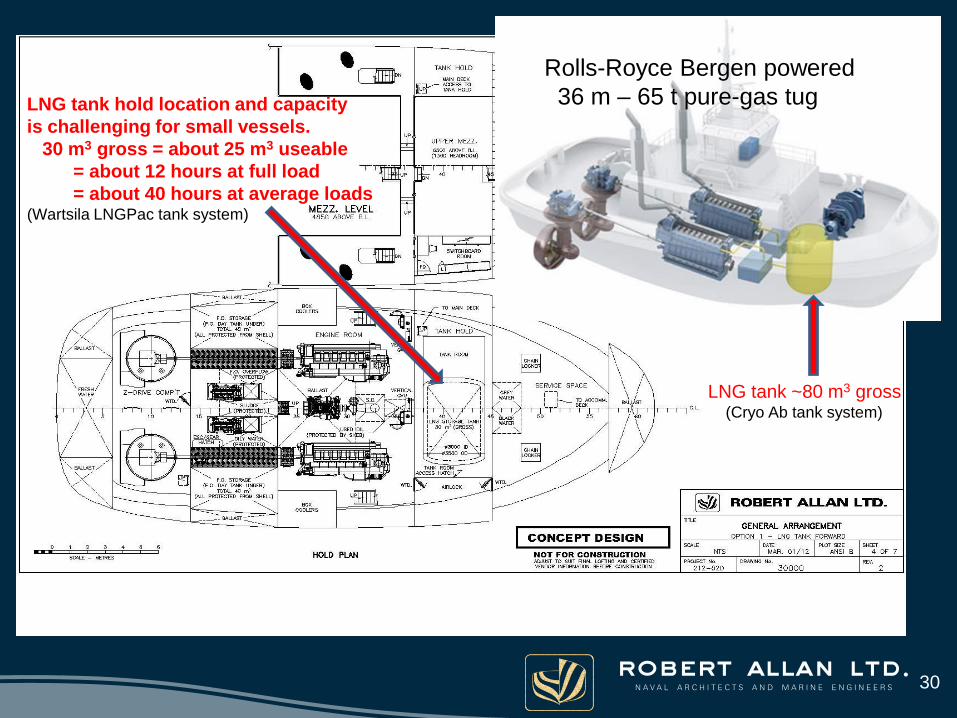
LNG tank hold location and capacity
is challenging for small vessels.
30 m3 gross = about 25 m3 useable
= about 12 hours at full load
= about 40 hours at average loads (Wartsila LNGPac tank system)
Rolls-Royce Bergen powered
36 m – 65 t pure-gas tug
LNG tank ~80 m3 gross
(Cryo Ab tank system)
31
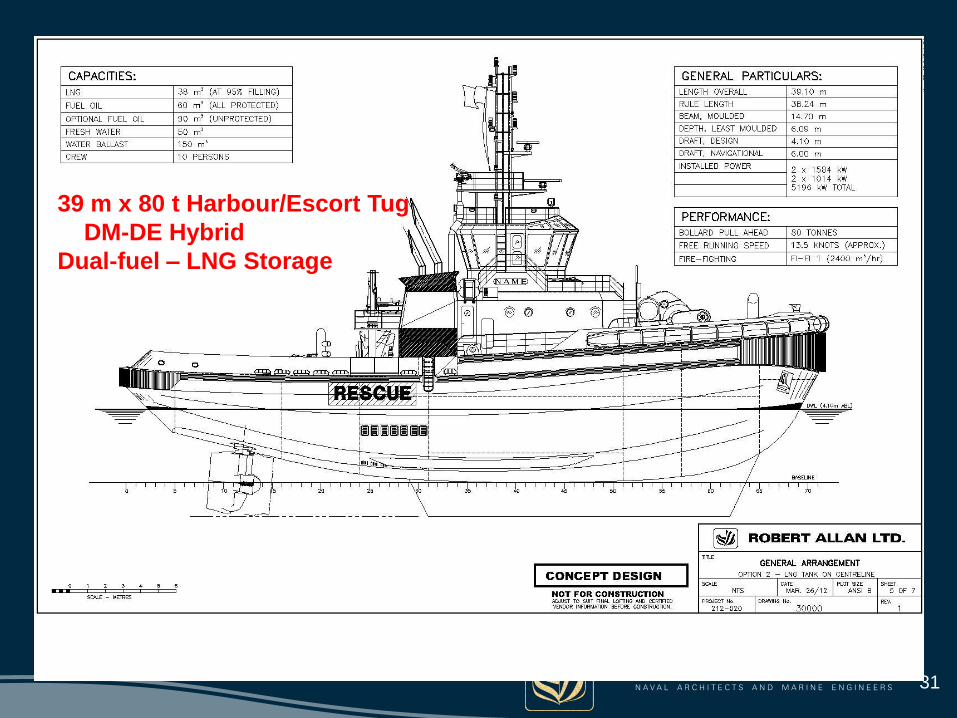
39 m x 80 t Harbour/Escort Tug
DM-DE Hybrid
Dual-fuel – LNG Storage

Installed Prop
Power: 4,868kW
Est. losses:
Mech: 0%
Elec: ~8-9%
Propulsion power: Mech. engines: ~3,168 kW
Elec. engines: ~2,112 kW
Total: ~5,280 kWm
Frequency drives
PTI 850 kW
PTI 850 kW
Wartsila: 2x 9L20DF-DM + 2x 6L20DF-DE;
Dual-fuel Mechanical-Electrical DM-DE Hybrid
32
CS300-2800 HR
CS300-2800 HR
G
HS Harbor
250 kW at 1800 rpm
1584 kW at 1200 rpm
9L20
WÄRTSILÄ 9L20DF
1584 kW at 1200 rpm
9L20
WÄRTSILÄ 9L20DF
60 Hz Feeders
1014 kWe at 1200 rpm
G
WÄRTSILÄ 6L20DF
6L20DF
1014 kWe at 1200 rpm
G
WÄRTSILÄ 6L20DF
6L20DF
Max: 81 TBP
slide images courtesy of:
© Wärtsilä 16 May 2012

33
LNG tank location and capacity
is challenging for small vessels.
33 m3 gross = about 28 m3 useable
= about 14 hours at full load
= about 40 to 45 hours at average loads

34
LNG tank location and capacity
is challenging for small vessels.
40 m3 gross = about 34 m3 useable
= about 17 hours at full load
= about 45 to 55 hours at average loads

Energy Storage and Hybrid Tugs
• Battery energy storage • Can have high power = lots of kW of power for short periods
• = limited kW.h of energy density
• Battery technology evolving to yield higher energy density and longer life with deep discharge cycles.
• Charge/discharge efficiency determines if storing energy is cost-effective compared to generate-and-use. Charging with shore power can be lower cost than on-board generation.
• Some ship handling tugs could do 90% to 99 % of their missions on battery power only with shore sourced recharge. Limited on-board generation needed if tug is dedicated to this specific service.
35
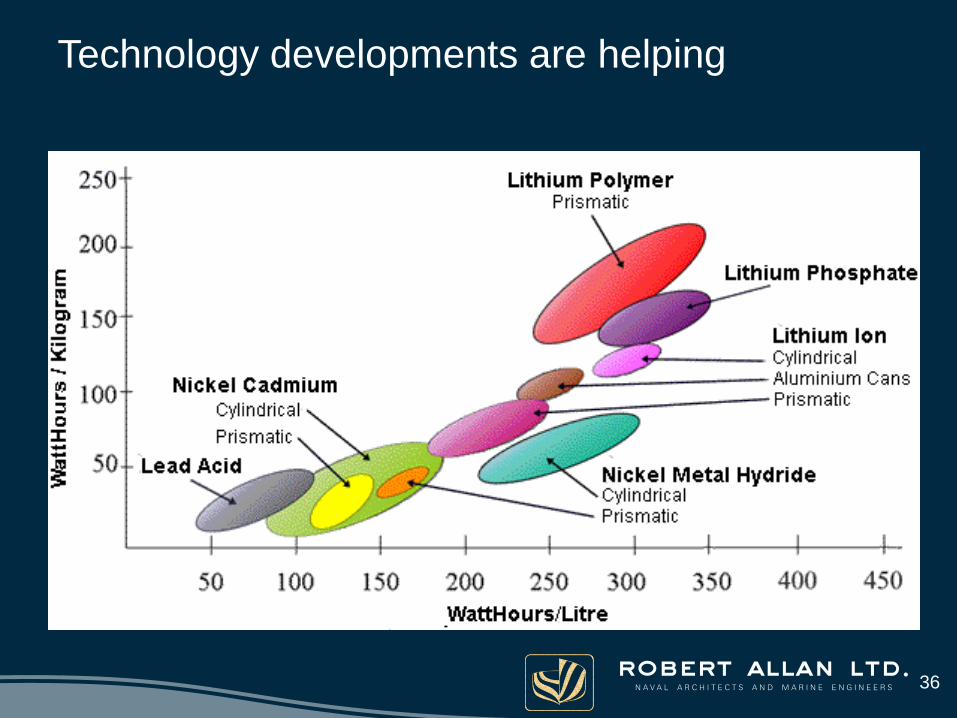
Technology developments are helping
36

Fundamental Solutions to Greener Tugs
• Operations: Reduce vessel speed to minimize fuel burn/emissions where possible (to/from transits are the primary target)
• Alternate fuels for reduced emissions and potentially reduced costs: • Biodiesel
• Natural gas; LNG as the most likely and practical storage medium
• Fuel cells IF they evolve to include integral fuel reforming to enable conventional fuels instead of hydrogen (not discussed – not likely to be practical for harbour tug applications)
• Hybrids or alternatives for propulsion power: • diesel-electric (DE): typically does not reduce fuel burn for ship handling tugs
• mechanical-electric (DM-DE) hybrid - with or without energy storage
• pure electric hybrid (DE-DE): all normal operation from battery storage with DE for emergency use or long-slow transits/repositionoing
• Conventional DM tug configurations with emissions treatment technologies: • e.g. IMO Tier III and/or EPA Tier 4 emission regulations pending 2014 to 2016
will significantly reduce current NOx and PM emissions – but little to no impact on fuel burn/CO2. Indications are that most engines will require aftertreatment system but OPEX implications should be small.
37

38
Options for Green Tugboat Operations Typical Emissions Effect
Typical CAPEX/OPEX
Effect
Existing Vessels:
Scheduling to reduce average transit speeds
Reduced CO2, NOx and PM
relative to fuel burn
No CAPEX cost.
OPEX saving per fuel
burn
Increase use of biofuels
Lower CO2, PM; Higher NOx No CAPEX.
Higher OPEX
Repower to EPA Tier 4 technology (2014 +) -80% NOx + CAPEX (refit?).
Same OPEX ± -80%+ PM
New Vessels:
Build conventional DM with EPA Tier 4 technology
(2014 +). Will be mandatory for US flagged vessels,
may be considered for Canada over IMO III
-80% NOx small + CAPEX (vs.
IMO III). Same OPEX
as IMO III
-80% to -90% PM
(vs. pre-2010 vessels)
Build conventional DM for LNG fuelling to 95%+
substitution of diesel
Similar (or better?) than EPA
T4 above
+20 to +40% CAPEX?
- 30 to -60% OPEX?
Build for EPA T4 + DM/DE Mechanical-Electric hybrid
Better than EPA T4 by reduced
fuel burn
+10 to 20% CAPEX?
OPEX saving per
reduced fuel burn
Build for EPA Tier 4 + DE Diesel Electric Little or no gain, possible +
overall
+10% to 15% CAPEX?
-2% to +10% OPEX?
Being Green can yield “green”backs
= profits by being green
• Instant bottom line greenbacks result from efficient
operations. Obvious and well known but not necessarily
well practised.
• Long term greenbacks returns to more efficient vessels
with task-optimized powering arrangements.
• Alternative fuels capability can yield long term net
greenbacks. Future fuel costs vs. capital/operating cost
premiums must be evaluated but trend looks promising
for some tugboat applications.
39

Thanks for your interest
Comments and Questions invited
Recommended