The Global Economic Outlook
May 2005
Jay H. Bryson, Global EconomistWachovia Corporation
Contributions to U.S. Growth(year-on-year rates)
-4%
-2%
0%
2%
4%
6%
1997 1998 1999 2000 2001 2002 2003 2004 2005
GDP Consumption Investment

U.S. Real GDP Components(year-on-year growth)
-2%
0%
2%
4%
6%
1998 1999 2000 2001 2002 2003 2004 2005
GDP Productivity Employment
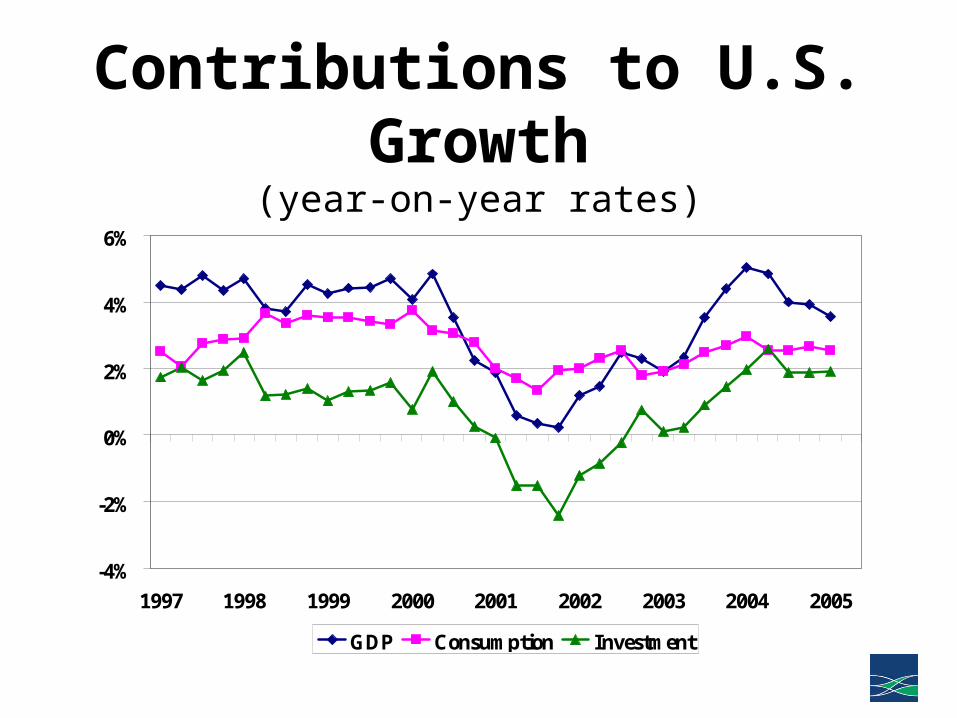
Real Spending Indicators(year-on-year growth, 3-month moving average)
-2%
0%
2%
4%
6%
8%
1991 1993 1995 1997 1999 2001 2003 2005
Disposable Income Personal Consumption Expenditures
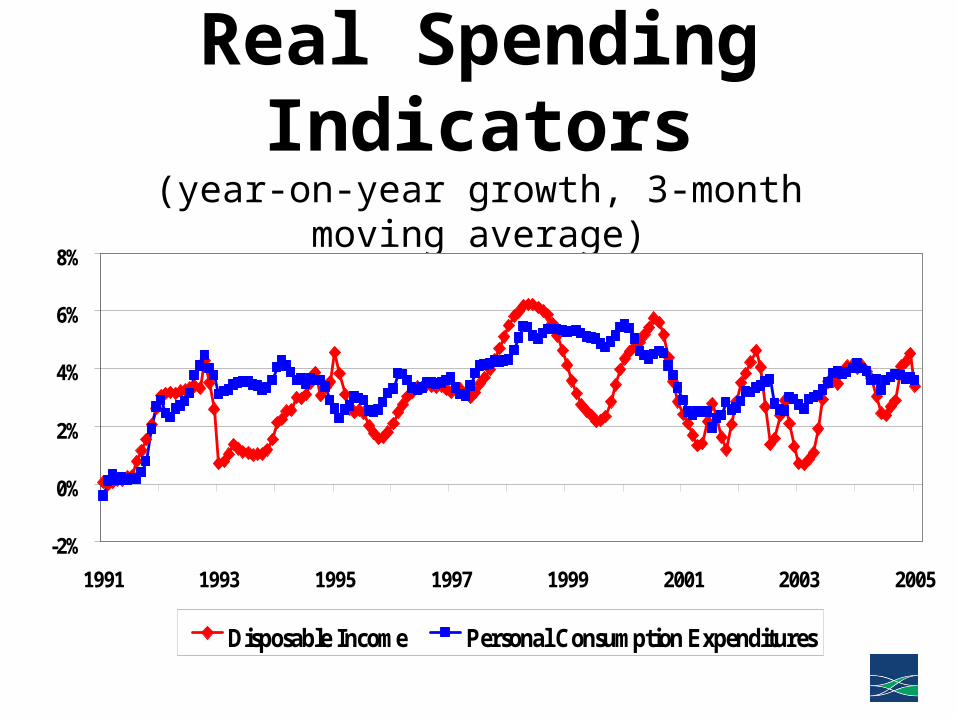
Consumer Purchases of Oil and Gas(as percent of disposable income)
1%
2%
3%
4%
5%
1970 1975 1980 1985 1990 1995 2000 2005
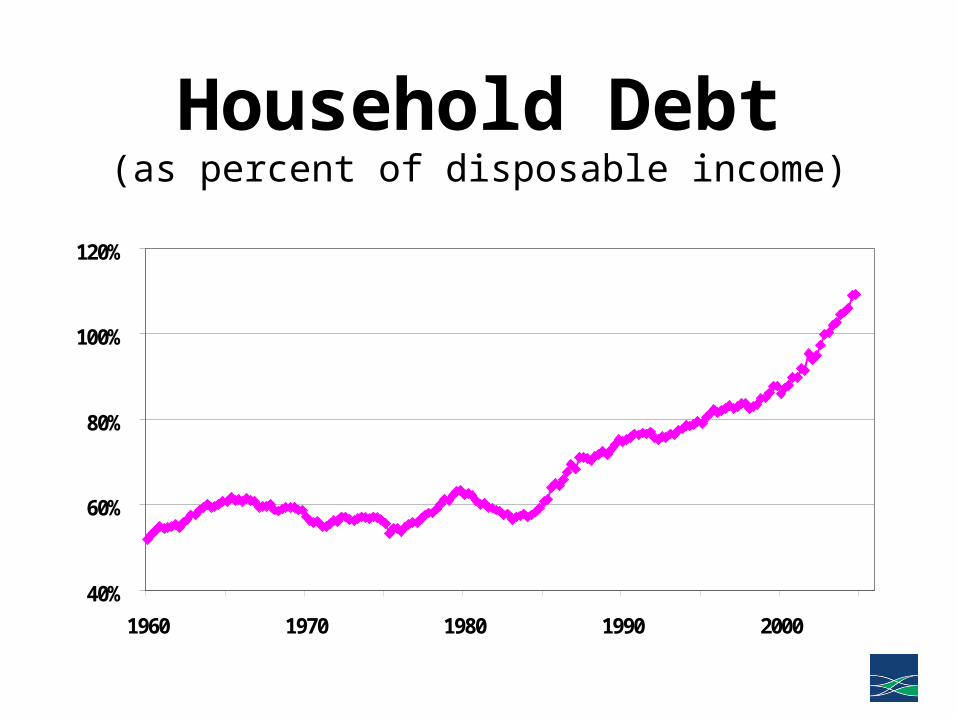
Household Debt(as percent of disposable income)
40%
60%
80%
100%
120%
1960 1970 1980 1990 2000

Household Financial Indicators
20%
25%
30%
35%
40%
45%
1960 1970 1980 1990 2000
6%
8%
10%
12%
14%
16%
Liabilities as % of financial assets (LHS) debt service as % of disposable income

Inventory-to-Sales Ratio(months of inventories at current sales pace)
1.2
1.3
1.4
1.5
1.6
1990 1992 1994 1996 1998 2000 2002 2004

“Core” Capital Goods Orders(year-on-year growth, 3-month moving average)
-30%
-20%
-10%
0%
10%
20%
1997 1998 1999 2000 2001 2002 2003 2004 2005
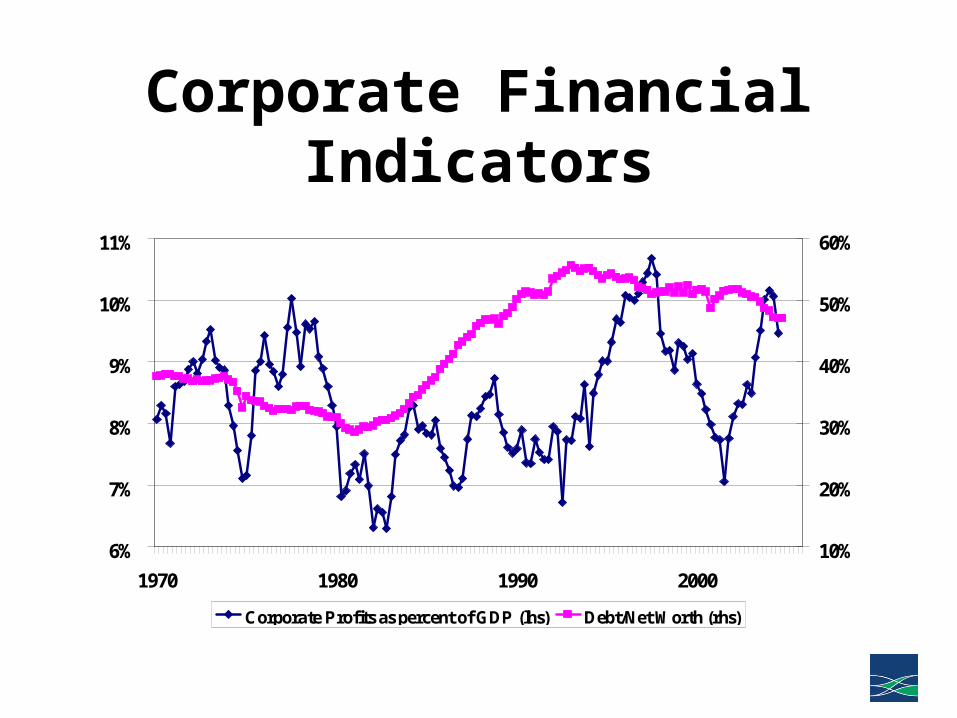
Corporate Financial Indicators
6%
7%
8%
9%
10%
11%
1970 1980 1990 2000
10%
20%
30%
40%
50%
60%
Corporate Profits as percent of GDP (lhs) Debt/Net Worth (rhs)

“Core” PCE Deflator(year-on-year change)
0.0%
0.5%
1.0%
1.5%
2.0%
2.5%
3.0%
1995 1997 1999 2001 2003 2005

U.S. Outlook05-Q2 05-Q3 05-Q4 06-Q1 06-Q2 06-Q3 06-Q4
GDP Growth 3.1 3.1 3.2 3.3 3.3 3.3 3.3
PCE 2.3 2.7 2.8 2.7 2.7 2.6 2.6
BFI 8.2 7.8 7.8 7.9 8.2 8.3 8.3
"Core" CPI Inflation 2.5 2.6 2.7 2.8 2.8 2.9 3.0
Fed Funds Rate 3.25 3.75 4.00 4.25 4.50 4.75 4.75
10-Year Treasury 4.70 5.00 5.20 5.40 5.50 5.80 5.90
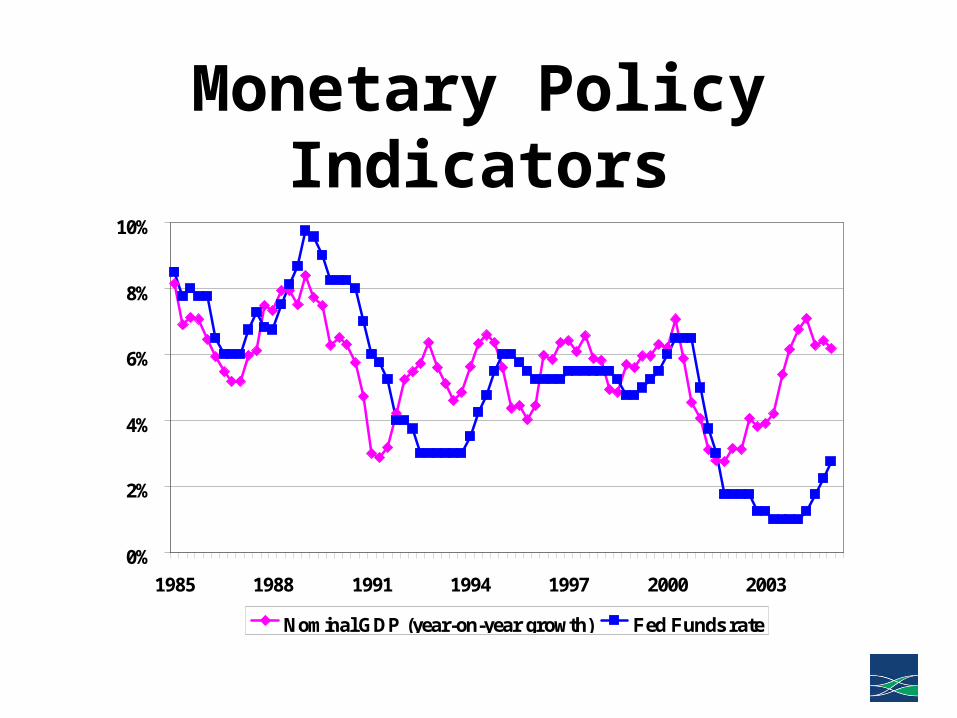
Monetary Policy Indicators
0%
2%
4%
6%
8%
10%
1985 1988 1991 1994 1997 2000 2003
Nominal GDP (year-on-year growth) Fed Funds rate

U.S. External Indicators(4-quarter moving sums)
0
200
400
600
800
1995 1996 1997 1998 1999 2000 2001 2002 2003 2004
billi
ons
of d
olla
rs
Current Account Deficit Private Capital Inflows

Trade in Goods & Services(year-on-year growth, 3-month moving average)
-20%
-10%
0%
10%
20%
30%
1998 1999 2000 2001 2002 2003 2004 2005
Exports Imports

Dollar Exchange RatesCurrency 05-Q2 05-Q3 05-Q4 06-Q1 06-Q2 06-Q3 06-Q4
Euro ($/€) 1.32 1.36 1.40 1.42 1.43 1.44 1.45
U.K. ($/£) 1.90 1.92 1.94 1.95 1.96 1.97 1.97
Switzerland (CHF/$) 1.18 1.15 1.12 1.11 1.11 1.10 1.10
Japan (¥/$) 105 102 100 97 94 92 90
Canada (C$/US$) 1.20 1.18 1.16 1.15 1.14 1.13 1.12

Global Exports(as percent of Global GDP)
0%
5%
10%
15%
20%
25%
30%
1970 1975 1980 1985 1990 1995 2000

Imports-to-Shipments Ratios
2%
3%
4%
5%
1994 1996 1998 2000 2002 2004
10%
20%
30%
40%
Printed Materials (left) All Manufacturing Industries (right)

Real GDP Growth Rates(year-on-year rates)
0%
2%
4%
6%
8%
10%
12%
1997 1998 1999 2000 2001 2002 2003 2004 2005
China India
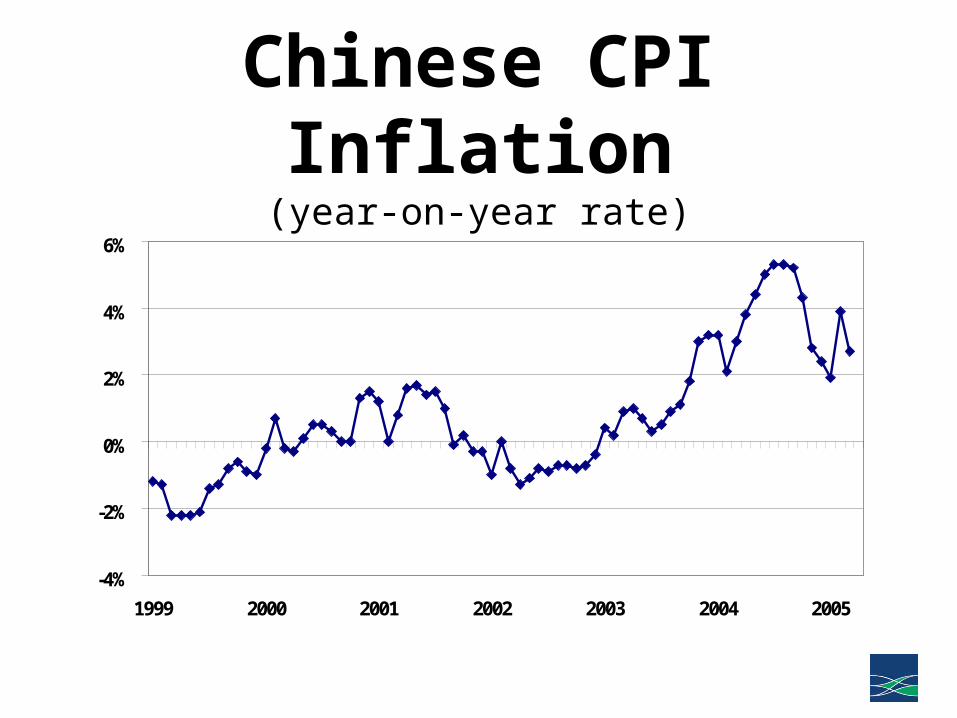
Chinese CPI Inflation(year-on-year rate)
-4%
-2%
0%
2%
4%
6%
1999 2000 2001 2002 2003 2004 2005

Chinese Industrial Production(year-on-year growth, 3-month moving average)
0%
5%
10%
15%
20%
25%
1999 2000 2001 2002 2003 2004 2005
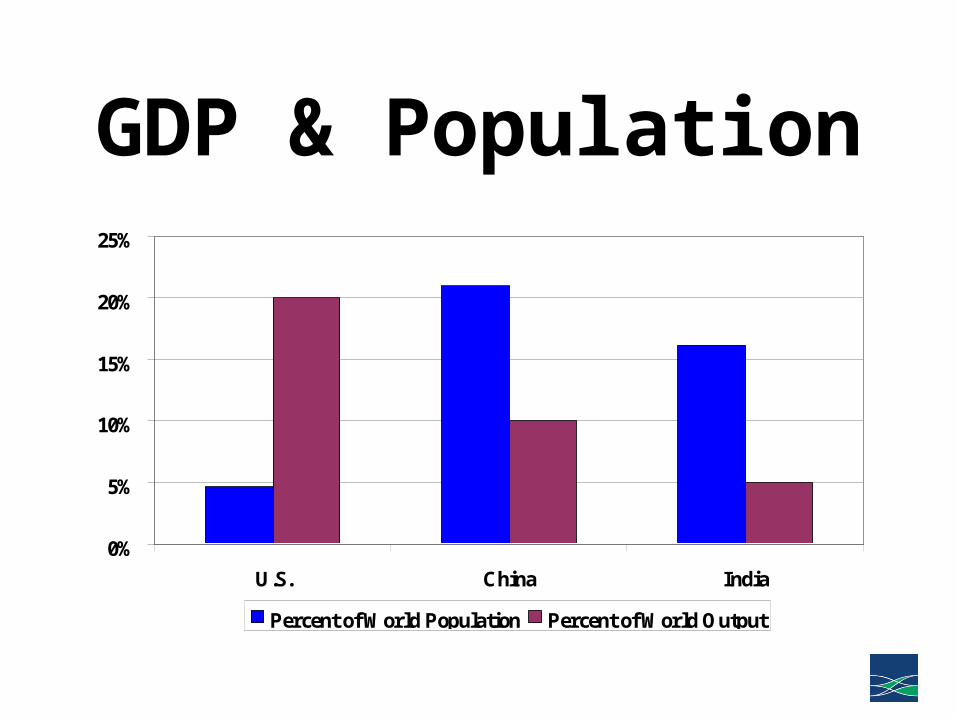
GDP & Population
0%
5%
10%
15%
20%
25%
U.S. China India
Percent of World Population Percent of World Output

Real GDP
0
200
400
600
800
1000
1200
1400
1600
0 10 20 30 40 50 60
years
inde
x
US: 1869-1929 China: 1978-2004 Japan: 1955-2004
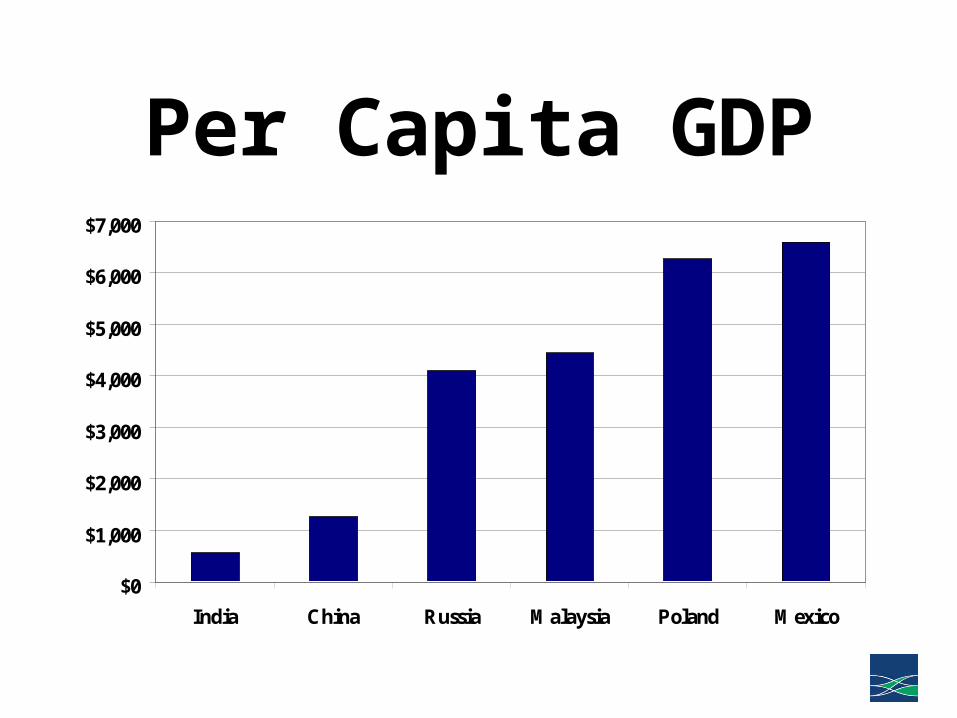
Per Capita GDP
$0
$1,000
$2,000
$3,000
$4,000
$5,000
$6,000
$7,000
India China Russia Malaysia Poland Mexico
Chinese Renminbi• Although not necessarily imminent, the
currency will become more flexible.• China is slowly liberalizing its financial
system. Flexibility needs to be seen in that context.
• Managed float?• Not apparent that currency would
necessarily appreciate in long run.

Notable Near-Term RisksUpside
• Synchronous global upswing in capital spending.
• Decline in foreign savings rates.
• More fiscal stimulus, especially in the Eurozone.
Downside
• Dollar crash.• Geopolitical tension
(terrorism, Iran/North Korea).
• Spike in oil prices.• Inflation scare in U.S.

Summary of Near-Term Outlook
• Global growth should be solid in 2005, albeit somewhat slower than last year.
• Inflation is starting to turn up, although a return to the 1970’s is very unlikely.
• Short-term interest rates should rise further over the next year or so.
• Dollar should trend even lower.
Recommended