© GEO Secretariat
Toshio Koike, Professor The Univeristy of Tokyo/ Japan GEO WG Chair [email protected]
The GEOSS Water Cycle Integrator An Innovative Tool for Effective Collaboration
Extremes Flood/Drought
mitigation adaptation
Climate System
Water Resources
Management System
Water Cycle
Agriculture/Food Biodiversity/Ecosystem
Health Energy
Coordinated and Integrated Efforts for Working Together
MDGs Climate Change Biodiversity
Regime Shift
Sustainable Development

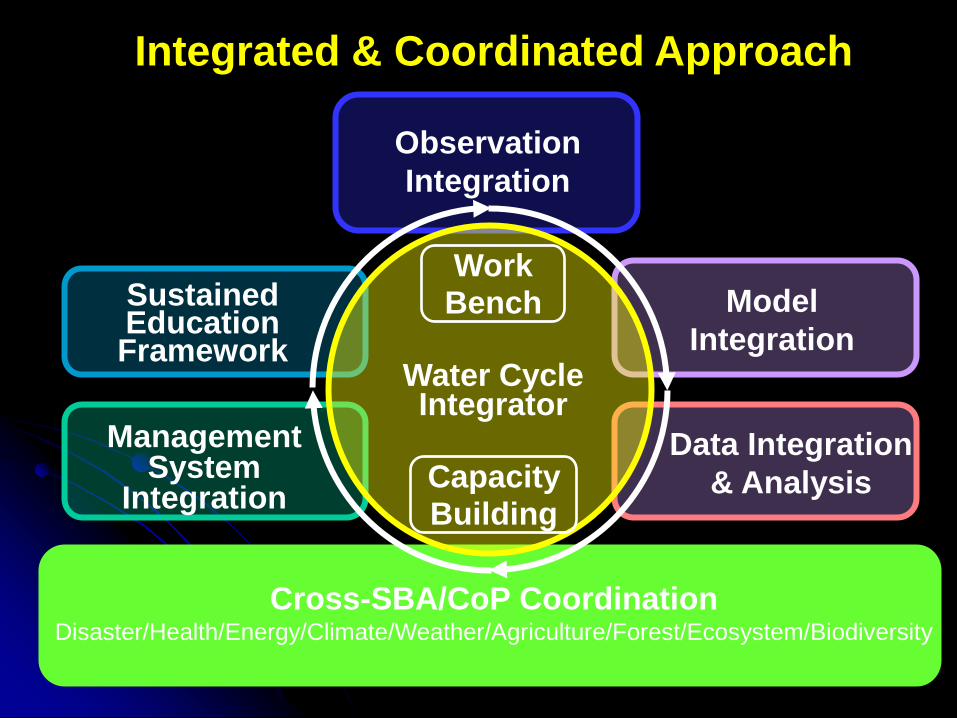
Observation Integration
Model Integration
Data Integration & Analysis
Cross-SBA/CoP Coordination Disaster/Health/Energy/Climate/Weather/Agriculture/Forest/Ecosystem/Biodiversity
Sustained Education Framework
Management System
Integration
Water Cycle Integrator
Integrated & Coordinated Approach
Work Bench
Capacity Building

Drought and Water Scarcity
Floods and Land Slides
Water Pollution
and Ecosystem Degradation
GEOSS Asian Water Cycle Initiative
(AWCI)
Climate Change Impacts on Water Cycle

Observation Integration
Model Integration
Data Integration & Analysis
Cross-SBA/CoP Coordination Disaster/Health/Energy/Climate/Weather/Agriculture/Forest/Ecosystem/Biodiversity
Sustained Education Framework
Management System
Integration
Water Cycle Integrator
Integrated & Coordinated Approach
Work Bench
Capacity Building

Demonstration River Basins

Data Uploading Complete
Quality Controlling Complete Ongoing
Bangladesh Bhutan Cambodia India Indonesia Japan Korea Lao PDR Malaysia Mongolia Myanmar Nepal Pakistan Philippines Sri Lanka Thailand Uzbekistan Vietnam
Document Metadata Registration Complete Ongoing
Observation Metadata Registration Complete Ongoing

8
GCOM-W
GCOM-C
EarthCARE
GPM
ALOS-2 ALOS
Cryosat-2
SMOS
ADM-Aeolus
METEOSAT
MSG MTG
EPS Metop
Post EPS
SMAP
Satellite Observation Integration

Observation Integration
Model Integration
Data Integration & Analysis
Cross-SBA/CoP Coordination Disaster/Health/Energy/Climate/Weather/Agriculture/Forest/Ecosystem/Biodiversity
Sustained Education Framework
Management System
Integration
Water Cycle Integrator
Integrated & Coordinated Approach
Work Bench
Capacity Building

Models
In-situ Observation
Satellite
Data Integration

Integrated Water
Resources Management
(IWRM)
Hydrological Model (eg. WEB-DHM)
Models
Satellite
In-situ Observation
GSMaP
River Flow
Numerical Weather Prediction
TRMM
AMSR-E
Rain Gauge River Discharge
SSM/I
Geostational Satellites
Optimization Scheme
validation

The Red River Basin: 160,000 km2
Hoa Binh Dam
ThacBa TuyenQuang
China
Hanoi
Flood disaster in Hanoi - Tropical cyclones - Historical flood events with damages - Death toll: around 100psn/year Economic loss: $1.2 billion (2006)
Increasing demand for hydropower generation - Increasing by 15%in each year (due to economic growth & urbanization) - Hydropower: 60% of total electricity - Unstable water supply (70% of annual rainfall accumulates in Jul-Sep)

Integrated Water
Resources Management
(IWRM)
Hydrological Model (eg. WEB-DHM)
Satellite
In-situ Observation
GSMaP
Numerical Weather Prediction
TRMM
AMSR-E
Rain Gauge River Discharge
SSM/I
Geostational Satellites
Optimization Scheme
validation
Soil Moisture
Surface Flux LDAS
Land Use MODIS
Soil Moisture
validation
River Flow
Models

10days averaged hydrological parameters in the middle Indus
Latent heat Sensible heat
Surface soil moisture Root zone soil moisture

Integrated Water
Resources Management
(IWRM)
Hydrological Model (eg. WEB-DHM)
Satellite
In-situ Observation
GSMaP
Numerical Weather Prediction
TRMM
AMSR-E
Rain Gauge River Discharge
SSM/I
Geostational Satellites
Optimization Scheme
validation
Soil Moisture
Surface Flux LDAS
Land Use MODIS
Soil Moisture
validation
River Flow
GRACE Ground Water
Models
Ground Water
validation
Monitoring
Drought Index
Seasonal Prediction

σµ−
=x
x dtransforme
)var(x=σ
dxxfxx )()()var( 2∫ −= µ
∫= dxxxf )(µ
dtransforme
dtransformedtransforme xxZSA
σ−
==
Drought Quantification: The Standard Anomaly Index
Agricultural drought
Meteorological drought
Hydrological drought
1) Transform the best-fit distribution pattern into a standardized distribution
2) Normalize by calculating SA
Jaranilla-Sanchez, P. A., et al. (2011), Water Resour. Res., in press.
0 1.0 -1.0 1.5 2.0 -1.5 -2.0
Nea
r nor
mal
Ext
rem
ely
dry
seve
rely
dry
mod
erat
ely
dry
Ext
rem
ely
wet
seve
rely
wet
mod
erat
ely
wet
Standard deviations from the mean Source: [ Mckee et al., 1993]
Nea
r nor
mal

Spatial SA: Philippines

Integrated Water
Resources Management
(IWRM)
Hydrological Model (eg. WEB-DHM)
Satellite
In-situ Observation
GSMaP
Numerical Weather Prediction
TRMM
AMSR-E
Rain Gauge River Discharge
SSM/I
Geostational Satellites
Optimization Scheme
validation
Soil Moisture
Surface Flux LDAS
Land Use MODIS
Soil Moisture
validation
River Flow
GRACE Ground Water
Models
Ground Water
validation
Monitoring
Drought Index
Seasonal Prediction
Seasonal Prediction

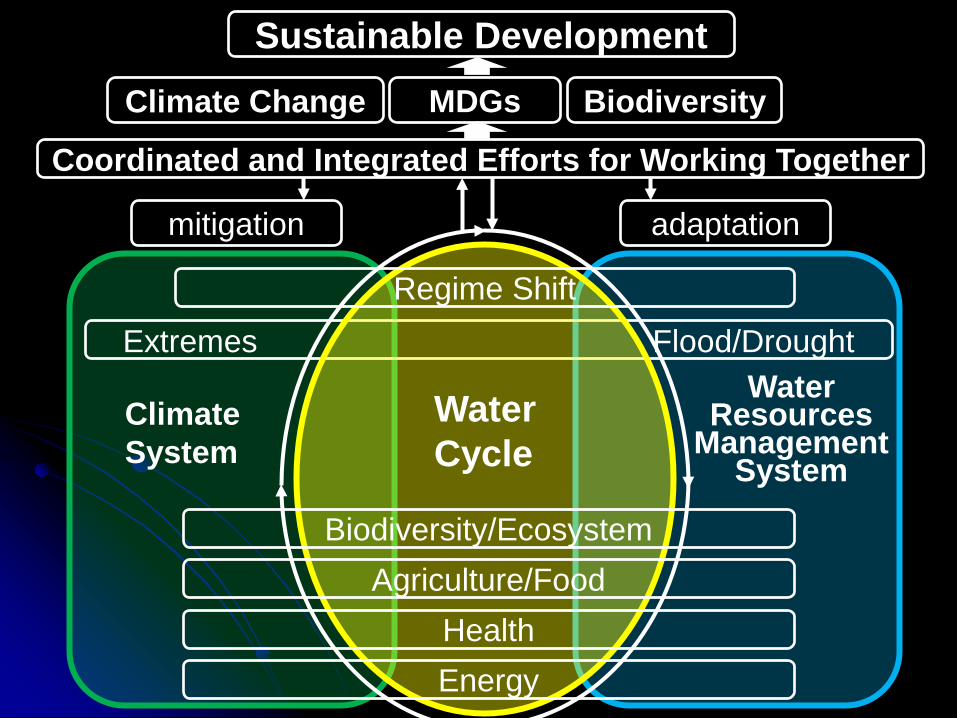
Seasonal Drought Prediction
Month
SA FROM OBSERVED DISCHARGE
SA FROM FORECAST DISCHARGE
June -0.954 -1.010455 July -1.30505 -1.61425
August -0.4937 -2.41276
Close enough, drought conditions can be forecasted
-3
-2.5
-2
-1.5
-1
-0.5
0
0.5
Jan-83 Apr-83 Jul-83
SA
From Observation From Forecast
May Jun. Jul. Aug.
Months 1st 2nd 3rd
Year Observed SFC Observed SCF Observed SCF
1983
1991
1997
1999-2000
ARROW Legends: red= drought; green=normal; blue=wet
e.g. increase towards drought conditions
Seasonal Drought Prediction

Integrated Water
Resources Management
(IWRM)
Hydrological Model (eg. WEB-DHM)
Satellite
In-situ Observation
GSMaP
Numerical Weather Prediction
TRMM
AMSR-E
Rain Gauge River Discharge
SSM/I
Geostational Satellites
Optimization Scheme
validation
Soil Moisture
Surface Flux LDAS
Land Use MODIS
Soil Moisture
validation
GRACE Ground Water
Models
Ground Water
validation
Monitoring
River Flow
Drought Index
Seasonal Prediction
Seasonal Prediction Climate Prediction
Evaluation Bias Correction
Climate Change
Assessment Adaptation

Obs.
Evaluation for relative distribution: Correlation coefficient(CC)
Evaluation of absolute value:
RMSE
Scoring CC and RMES are more than all GCM averaged value :1 CC or RMES are more than all GCM averaged value :0
CC and RMES are less than all GCM averaged value :‐1

Obs.
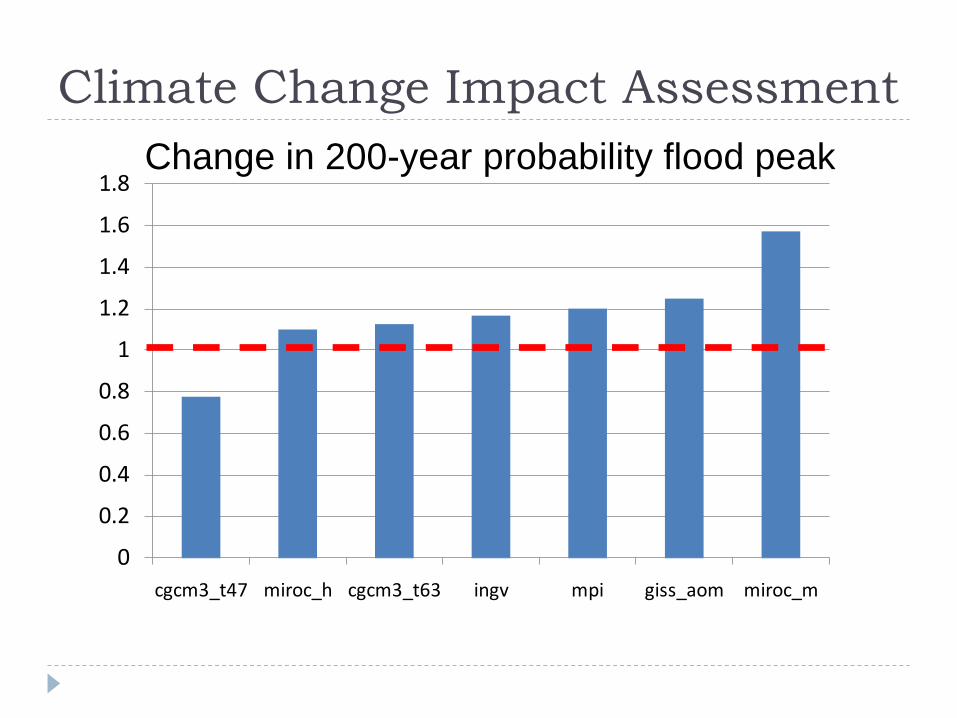
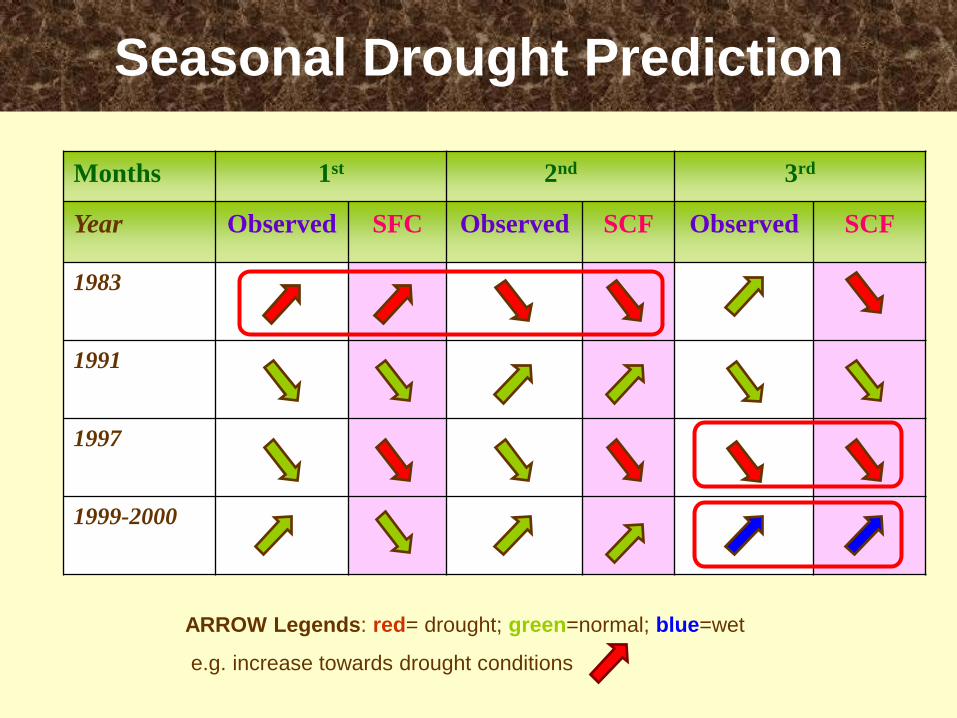
Climate Change Impact Assessment
0
0.2
0.4
0.6
0.8
1
1.2
1.4
1.6
1.8
cgcm3_t47 miroc_h cgcm3_t63 ingv mpi giss_aom miroc_m
200年確率流量の将来予測結果Change in 200-year probability flood peak

Climate Change Impacts on Flood Control Plan in Indonesia
10year Probable flood Current Climate
10year Probable flood 50 years later

Integrated Water
Resources Management
(IWRM)
Hydrological Model (eg. WEB-DHM)
Satellite
In-situ Observation
GSMaP
Numerical Weather Prediction
TRMM
AMSR-E
Rain Gauge River Discharge
SSM/I
Geostational Satellites
Optimization Scheme
validation
Soil Moisture
Surface Flux LDAS
Land Use MODIS
Soil Moisture
validation
GRACE Ground Water
Models
Ground Water
validation
Monitoring
River Flow
Drought Index
Seasonal Prediction
Seasonal Prediction Climate Prediction
Evaluation Bias Correction
Climate Change
Assessment Adaptation
Water Cycle Data Integration
Observation Integration
Model Integration
Data Integration & Analysis
Cross-SBA/CoP Coordination Disaster/Health/Energy/Climate/Weather/Agriculture/Forest/Ecosystem/Biodiversity
Sustained Education Framework
Management System
Integration
Water Cycle Integrator
Integrated & Coordinated Approach
Work Bench
Capacity Building

Weather Prediction
Models
Water Cycle Integrator (WA01-C1, 2012-2015 WP)
In-situ Data
Rainfall River Flow
Soil Moisture
Satellite
MW
Vis. IR
Gravity
Ground Water
Seasonal Prediction Climate
Prediction
Evaluation & Bias Correction
Water Quality
Urban Water Model
Loading Unit
Agricultural Info.
Famer’s Needs
Channel Form
Sedimentation
Biodiversity Data
In-situ Data
Ground Elevation
Sewage
Water Cycle
Model
River Flow
Evapo- transpiration
Soil Moisture
Ground Water
IWRM
Climate Change Adaptation
Agriculture Support
Material Cycle
Model
Crop Model
Channel Analysis
Index Organism
Val. Val.
Urban Environment Conservation
River Basin Management

Observation Integration
Model Integration
Data Integration & Analysis
Cross-SBA/CoP Coordination Disaster/Health/Energy/Climate/Weather/Agriculture/Forest/Ecosystem/Biodiversity
Sustained Education Framework
Management System
Integration
Water Cycle Integrator
Integrated & Coordinated Approach
Work Bench
Capacity Building

Workbench
issues stake- holder
stake-holder
stake- holder
stake- holder
stake- holder
Sharing data & information, and working together

Observation Integration
Model Integration
Data Integration & Analysis
Cross-SBA/CoP Coordination Disaster/Health/Energy/Climate/Weather/Agriculture/Forest/Ecosystem/Biodiversity
Sustained Education Framework
Management System
Integration
Water Cycle Integrator
Integrated & Coordinated Approach
Work Bench
Capacity Building

Drought A
ssessment
Agricultural data (Member Country)
Drought Index (UT)
Distributed Hydrological Model (UT)
Sentinel Asia (AIT/JAXA)
In-situ data Quality Control (UT)
Rainfall Down Scaling (UNU)
Flood Loss Estimation (UNU)
Training Modules Training Course
Flood Inundations model (UNU)
Integrated Flood Analyses System
(ICHARM)
Flood alert & E
vacuation
Support for decision making
Country- A, B, -, -
Support for decision making
Country-a, b, -, - Data Integration
Hydrological M
odel
Drought Indices
Data Integration
Hydrological M
odel
Flood Inundation

Interactions between climate change, biodiversity and desertification
Climate Change
Biodiversity Desertification
Impact of climate change on biodiversity
Climate change could alter distribution of species and their habitats and lead to
migration of plants and animals if there are corridors
Role of biodiversity in climate change mitigation and
adaptation Forest and biodiversity sequester carbon and
affect local climate Biodiversity ensures ecosystem resilience to
climate change
Impact of Climate change on desertification
Rising temperature increases evaportranstation and causes drought
Decreasing precipitation leads to drought Impact of desertification on
climate Desertification causes loss of vegetation an
soil carbon and changes drylands from carbon sink into carbon source
Dust storms increase aerosols with cooling effect
Impact of desertification on biodiversity Desertification degrades habitats for biodiversity and leads to loss of
biodiversity Role of biodiversity in combating desertification Loss of drought- resistant biodiversity reduces resilience of ecosystem
to droughts. Vegetation protects soil from erosion and stabilizes slopes from
landslides.
UNCECAR Climate and Ecosystems
Change Adaptation Research

Observation Integration
Model Integration
Data Integration & Analysis
Cross-SBA/CoP Coordination Disaster/Health/Energy/Climate/Weather/Agriculture/Forest/Ecosystem/Biodiversity
Sustained Education Framework
Management System
Integration
Water Cycle Integrator
Integrated & Coordinated Approach
Work Bench
Capacity Building

Extremes Flood/Drought
mitigation adaptation
Climate System
Water Resources
Management System
Water Cycle
Agriculture/Food Biodiversity/Ecosystem
Health Energy
Coordinated and Integrated Efforts for Working Together
MDGs Climate Change Biodiversity
Regime Shift
Sustainable Development

Thank You.
Actions are now required.
DATA AND INFORMATION, SCIENCE AND TECHNOLOGY, COOPERATION FRAMEWORK, AND PEOPLE ARE NOW READY.
Recommended