The Future of Social Security
Amy Rehder HarrisTax Research and Program Analysis Section
Iowa Department of Revenue
(formerly of the Long Term Modeling Group, Congressional Budget Office, Washington, D.C)
History of Social Security Social Security (OASDI) is mandatory
public insurance to alleviate poverty in old-age Old-Age Insurance established 1935 Expanded to include Survivors and Spouses in
1939 Disability Insurance introduced 1956
Hospital Insurance (Medicare) began 1965
Old-Age Eligibility Must work at least 10 years While working, pay 6.2% (12.4%) payroll tax on
earnings up to taxable maximum $106,800 in 2011 During 2011 – employee pays 2% less – TRA 2010
Upon retirement, benefits a function of AIME: highest 35 years of earnings (indexed for inflation) PIA: progressive formula – higher replacement for lower
lifetime income NRA: rising from 65 to 67 for birth years 1960+ Age at claim (Claim at EEA of 62 = 30% reduction; Claim
at 70 with DRC = 24% increase)
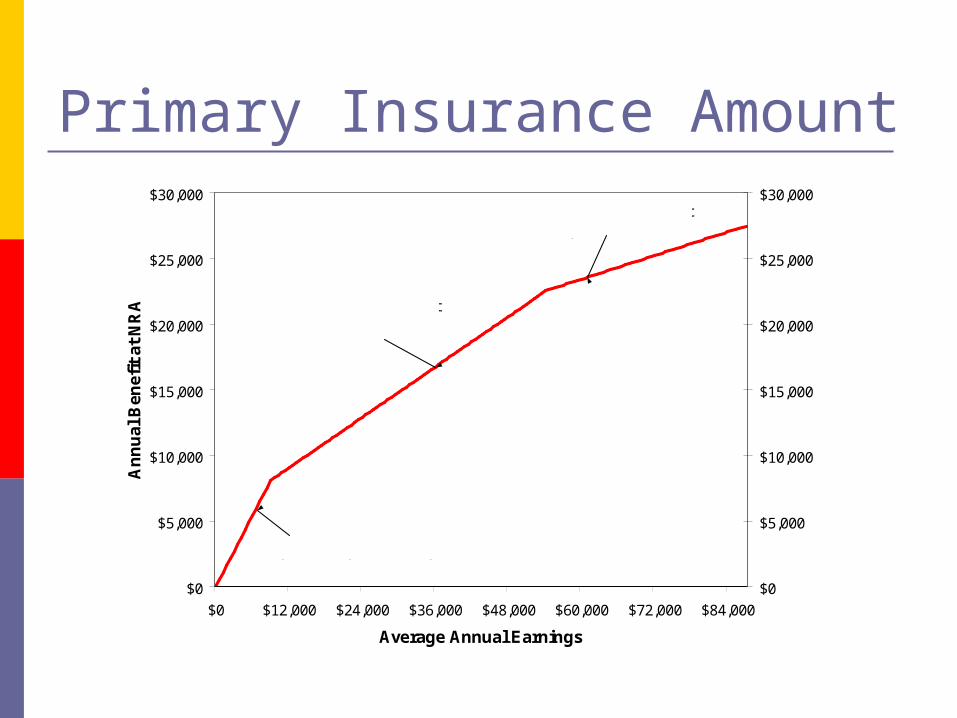
Primary Insurance Amount
$0
$5,000
$10,000
$15,000
$20,000
$25,000
$30,000
$0 $12,000 $24,000 $36,000 $48,000 $60,000 $72,000 $84,000
Average Annual Earnings
An
nu
al B
enef
it a
t N
RA
$0
$5,000
$10,000
$15,000
$20,000
$25,000
$30,000
90 percent replacement up to $8,988
32 percent replacementthrough $54,204
15 percent replacement up to maximum
Old-Age Benefits Retired Workers
32.3 million beneficiaries in Dec. 2008 Average annual benefit was $13,800 in
2008 Auxiliary Beneficiaries
Spouses: 2.4 million Survivors: 4.4 million Children: 2.4 million Also mother/father or parents
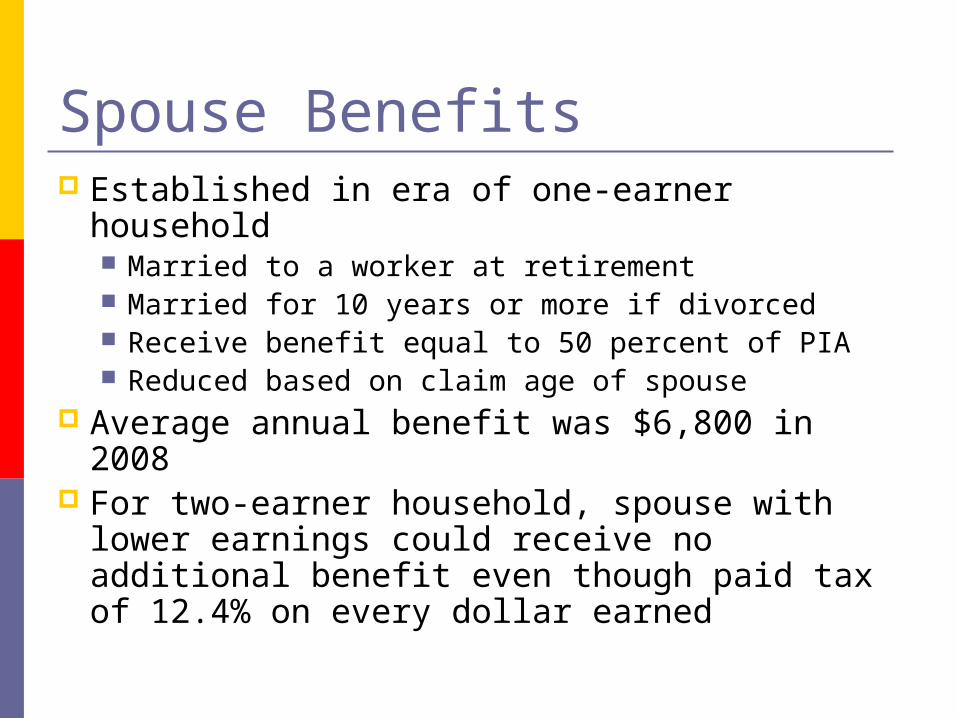
Spouse Benefits Established in era of one-earner household
Married to a worker at retirement Married for 10 years or more if divorced Receive benefit equal to 50 percent of PIA Reduced based on claim age of spouse
Average annual benefit was $6,800 in 2008
For two-earner household, spouse with lower earnings could receive no additional benefit even though paid tax of 12.4% on every dollar earned
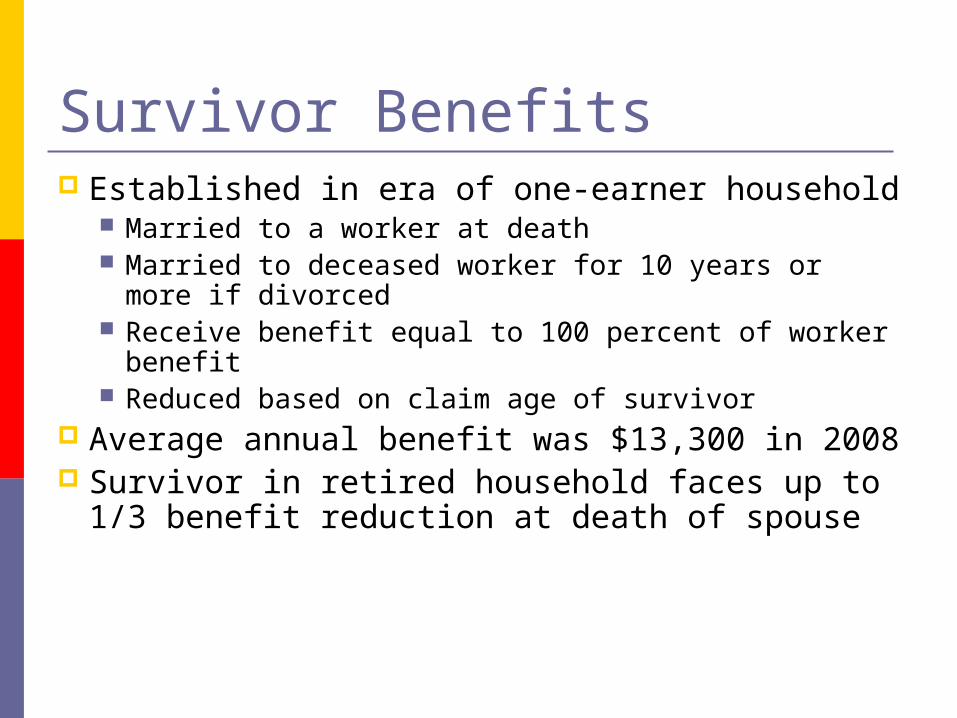
Survivor Benefits Established in era of one-earner household
Married to a worker at death Married to deceased worker for 10 years or
more if divorced Receive benefit equal to 100 percent of worker
benefit Reduced based on claim age of survivor
Average annual benefit was $13,300 in 2008
Survivor in retired household faces up to 1/3 benefit reduction at death of spouse
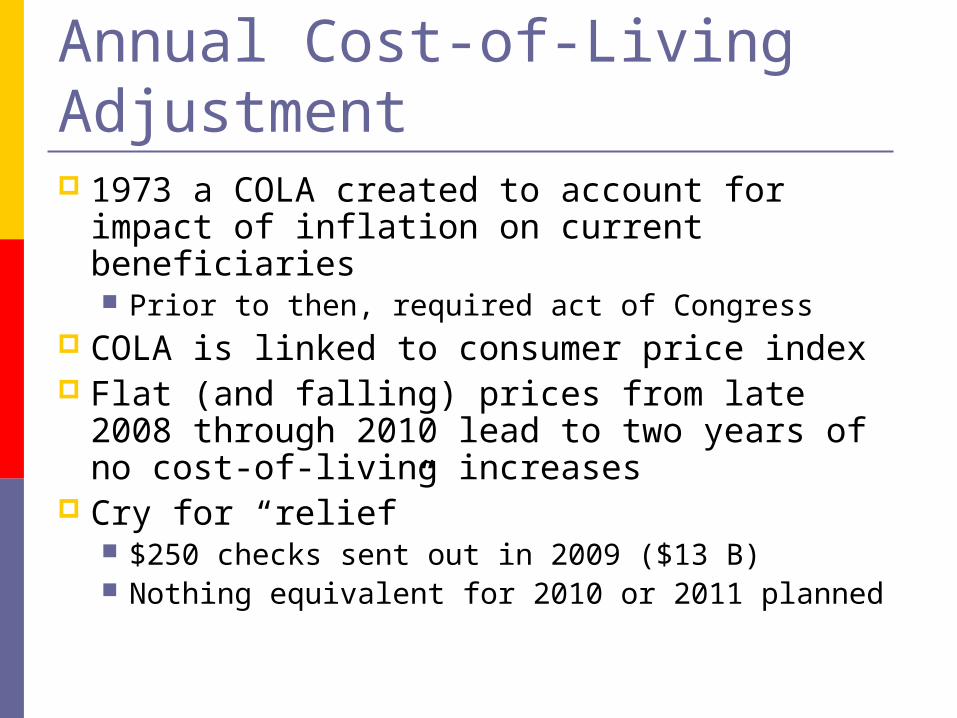
Annual Cost-of-Living Adjustment 1973 a COLA created to account for
impact of inflation on current beneficiaries Prior to then, required act of Congress
COLA is linked to consumer price index Flat (and falling) prices from late 2008
through 2010 lead to two years of no cost-of-living increases
Cry for “relief” $250 checks sent out in 2009 ($13 B) Nothing equivalent for 2010 or 2011 planned
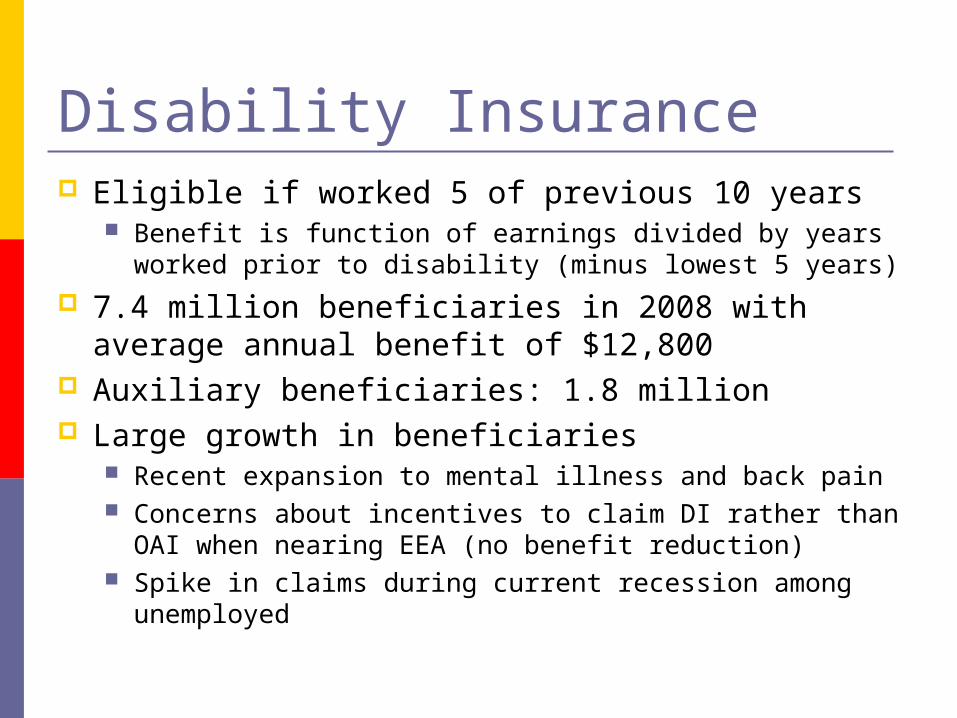
Disability Insurance Eligible if worked 5 of previous 10 years
Benefit is function of earnings divided by years worked prior to disability (minus lowest 5 years)
7.4 million beneficiaries in 2008 with average annual benefit of $12,800
Auxiliary beneficiaries: 1.8 million Large growth in beneficiaries
Recent expansion to mental illness and back pain Concerns about incentives to claim DI rather than OAI
when nearing EEA (no benefit reduction) Spike in claims during current recession among
unemployed
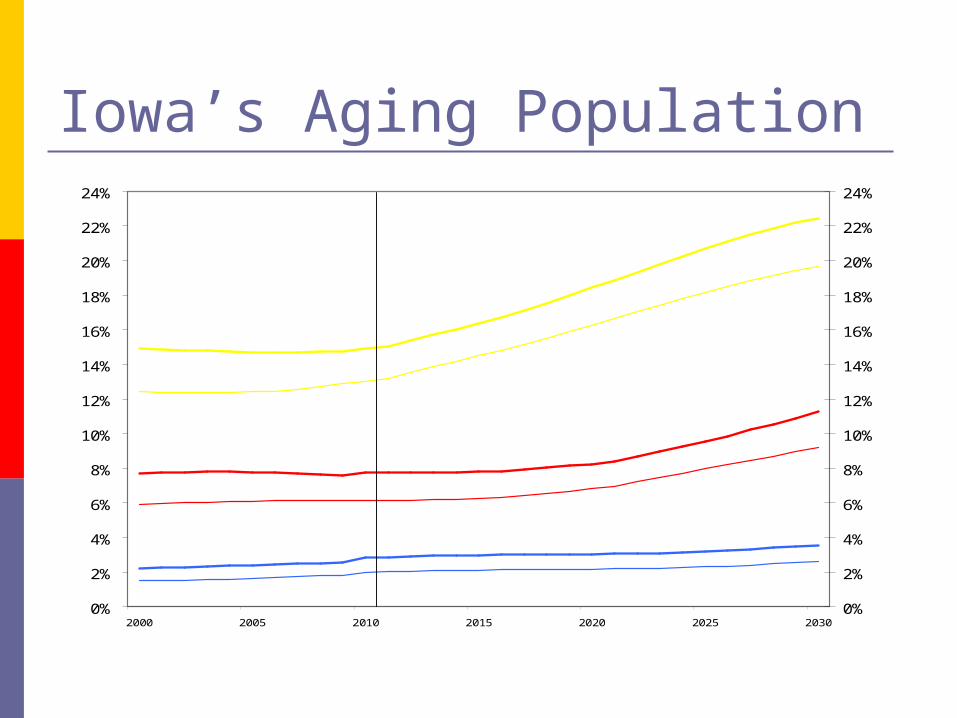
Iowa’s Aging Population
0%
2%
4%
6%
8%
10%
12%
14%
16%
18%
20%
22%
24%
2000 2005 2010 2015 2020 2025 20300%
2%
4%
6%
8%
10%
12%
14%
16%
18%
20%
22%
24%
Iowa Share 65+
Iowa Share 75+
Iowa Share 85+
US Share 65+
US Share 75+
US Share 85+
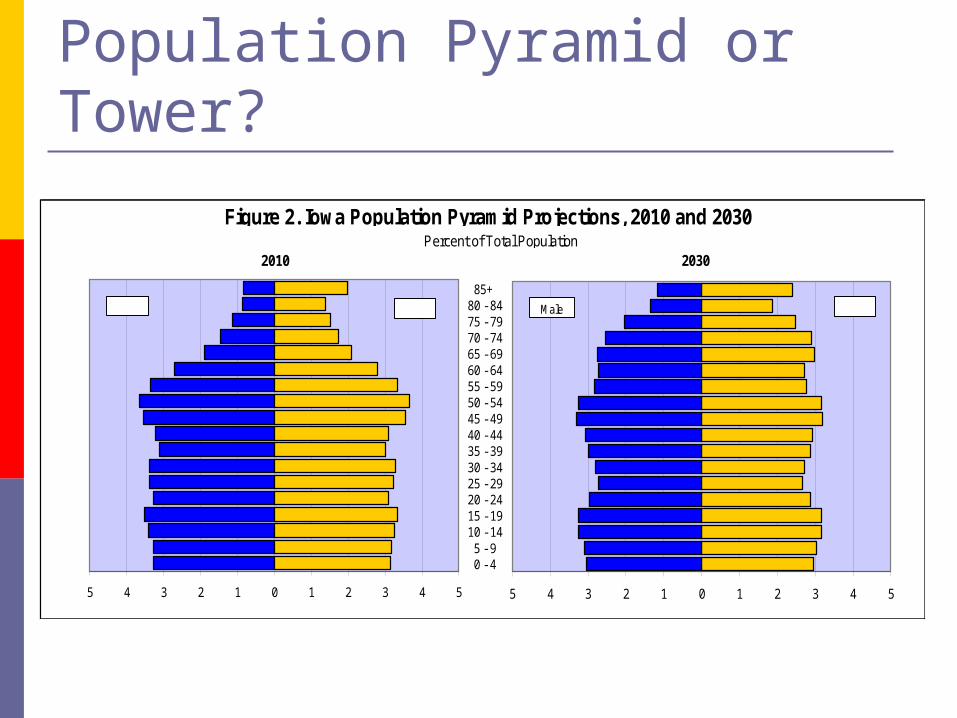
Population Pyramid or Tower?
2010
Figure 2. Iowa Population Pyramid Projections, 2010 and 2030
2030Percent of Total Population
5 4 3 2 1 0 1 2 3 4 55 4 3 2 1 0 1 2 3 4 5
0 - 4 5 - 910 - 1415 - 1920 - 2425 - 2930 - 3435 - 3940 - 4445 - 4950 - 5455 - 5960 - 6465 - 6970 - 7475 - 7980 - 84 85+
Male FemaleMale Female

Impact of Aging Population Worker-Beneficiary Ratio
Iowa and US: 3.0 falling to 2.0 Manifested through deteriorating tax
bases OASDI: Wages Income Taxes: Pensions and investment
earnings often receive preferential tax treatment, additional exempt earnings by age

Taxation of Social Security “Contributions” taxed as income when
earned by federal and state governments Benefits paid at retirement non-taxable
until 1983 If other income above $32,000/$25,000, up to
50% taxable Revenue to OASDI Trust Fund Attempting to improve system finances in
preparation for baby boomers 1993 up to 85%, money to Medicare
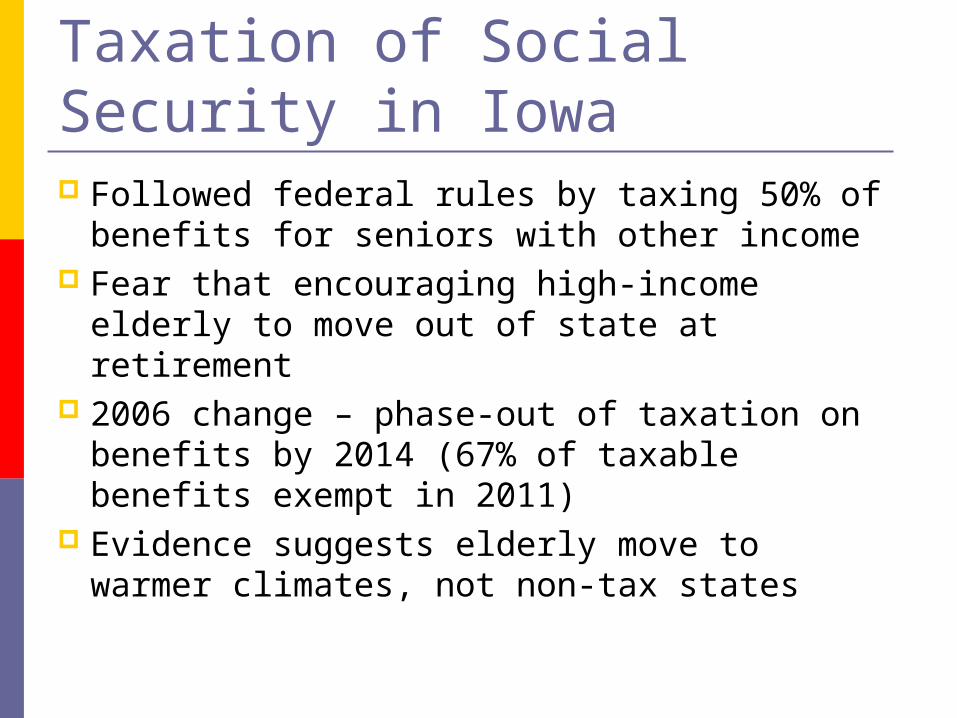
Taxation of Social Security in Iowa Followed federal rules by taxing 50% of
benefits for seniors with other income Fear that encouraging high-income elderly
to move out of state at retirement 2006 change – phase-out of taxation on
benefits by 2014 (67% of taxable benefits exempt in 2011)
Evidence suggests elderly move to warmer climates, not non-tax states

Social Security Long Run Finances Social Security currently running surpluses
– saved in OASDI Trust Fund Taxes > Benefits
Projections show future will have large deficits
How are those projections made? What can Congress do to prevent the
system from going broke?

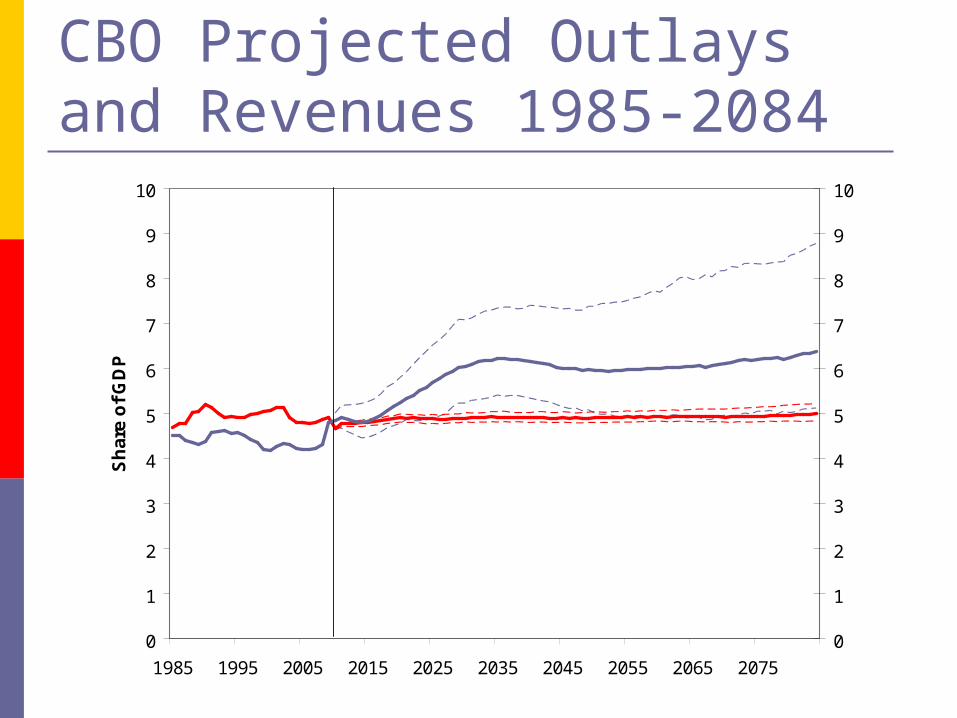
CBO Projected Outlays and Revenues 1985-2084
0
1
2
3
4
5
6
7
8
9
10
1985 1995 2005 2015 2025 2035 2045 2055 2065 2075
Sh
are
of
GD
P
0
1
2
3
4
5
6
7
8
9
10
Outlays
Revenues
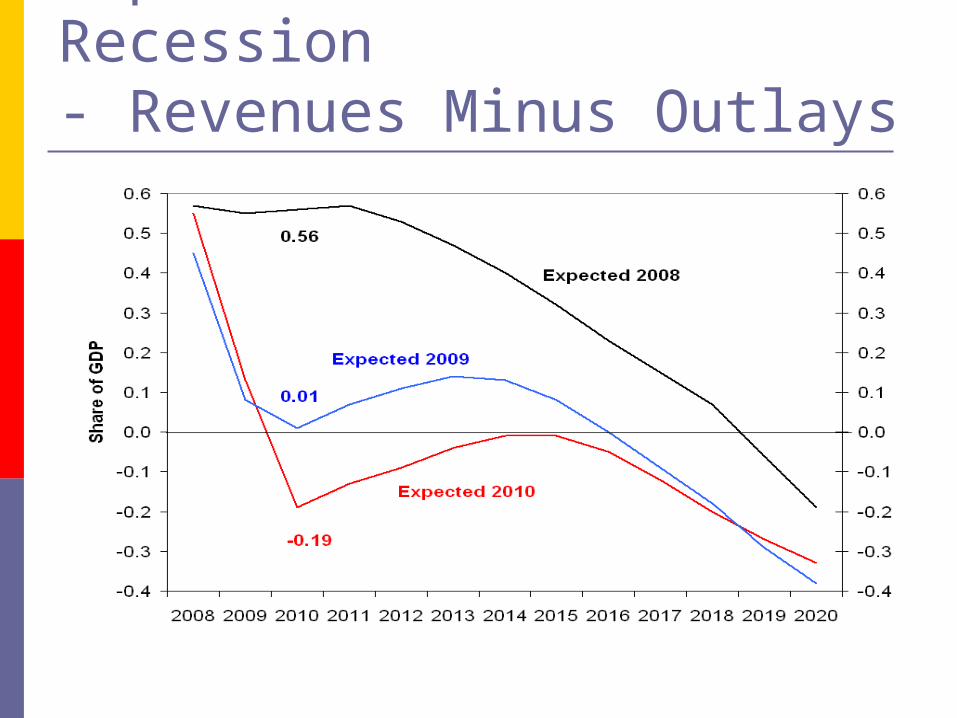
Impact of the Great Recession- Revenues Minus Outlays
Social Security Administration Social Security is administered by SSA, an
executive branch agency SSA produces an Annual Trustees report
about the future of the system Short-run (10 years) Long-run (75 years)http://www.ssa.gov/OACT/TR/2010/tr2010.pdf
CBO produces long-term projections http://www.cbo.gov/ftpdocs/119xx/doc11943/10-22-SocialSecurity_chartbook.pdf
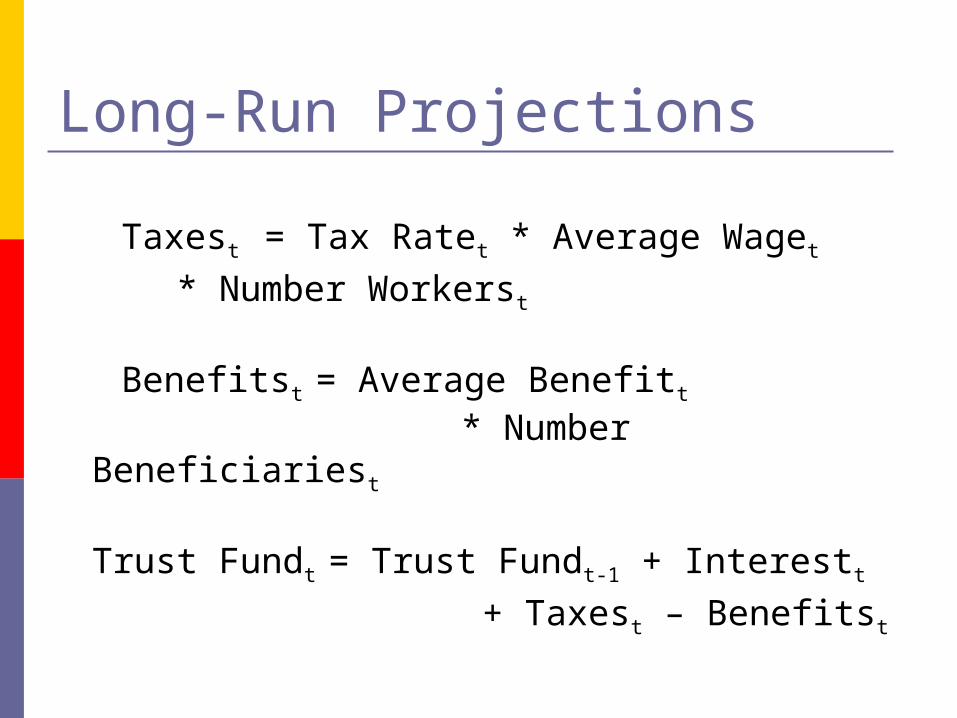
Long-Run Projections
Taxest = Tax Ratet * Average Waget
* Number Workerst
Benefitst = Average Benefitt
* Number Beneficiariest
Trust Fundt = Trust Fundt-1 + Interestt
+ Taxest – Benefitst
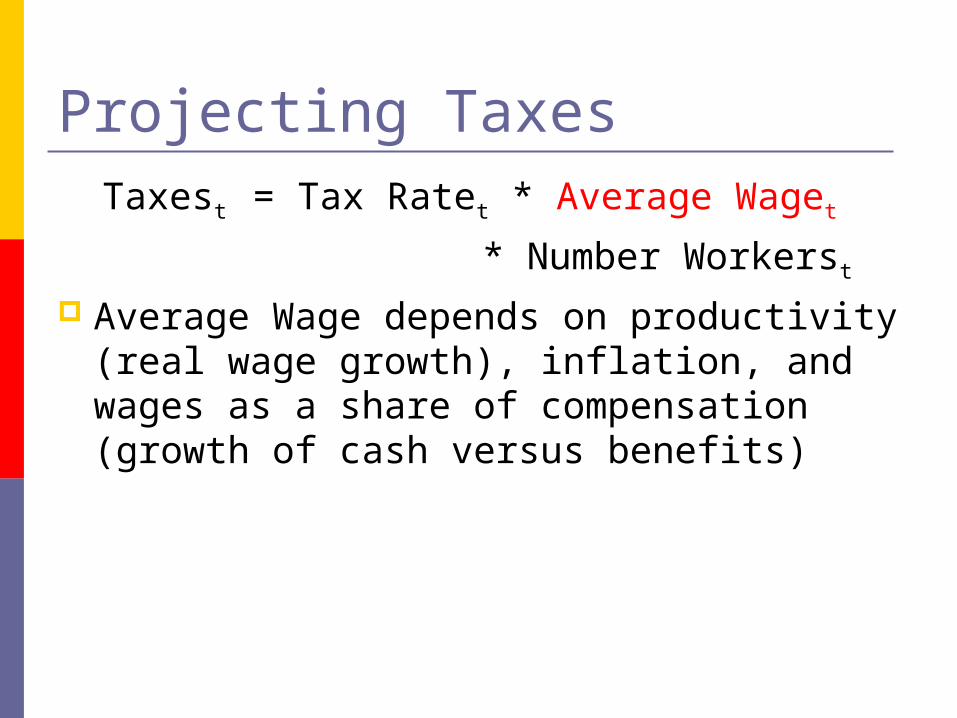
Projecting Taxes Taxest = Tax Ratet * Average Waget
* Number Workerst
Average Wage depends on productivity (real wage growth), inflation, and wages as a share of compensation (growth of cash versus benefits)
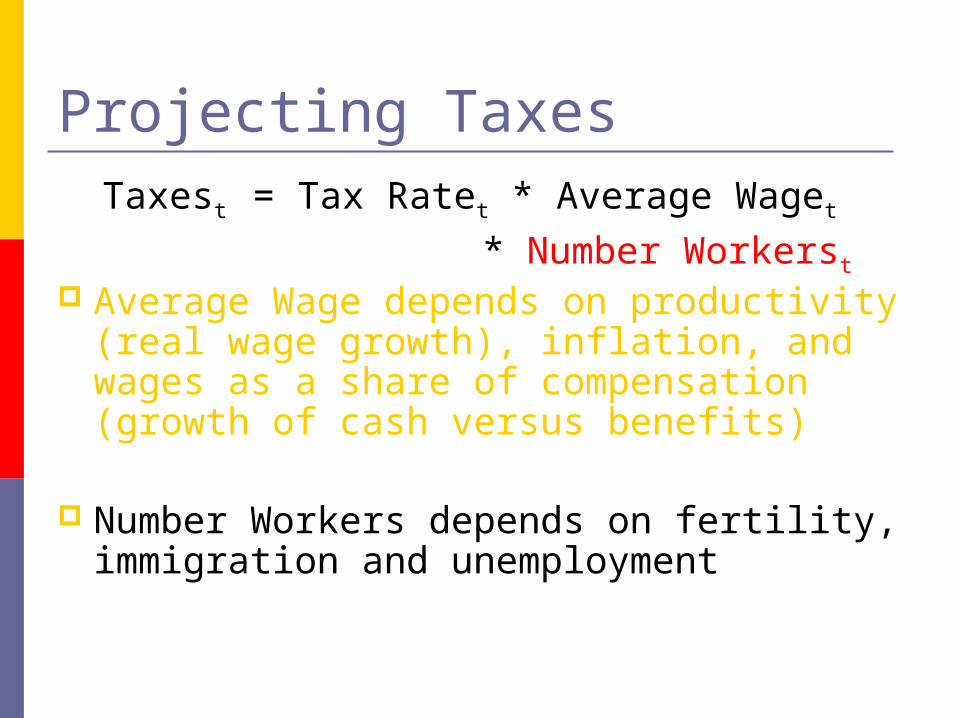
Projecting Taxes Taxest = Tax Ratet * Average Waget
* Number Workerst
Average Wage depends on productivity (real wage growth), inflation, and wages as a share of compensation (growth of cash versus benefits)
Number Workers depends on fertility, immigration and unemployment
Projecting Benefits
Benefitst = Average Benefitt
* Number Beneficiariest
Average Benefit depends on past wages and inflation (along with all of the policy rules)

Projecting Benefits
Benefitst = Average Benefitt
* Number Beneficiariest
Average Benefit depends on past wages and inflation (along with all of the policy rules)
Number Beneficiaries depends on fertility (60 years earlier), mortality, and disability rates
Projecting Trust Fund Balances
Trust Fundt = Trust Fundt-1 + Interestt
+ Taxest – Benefitst
Interest rates on government bonds (IOU’s to ourselves)
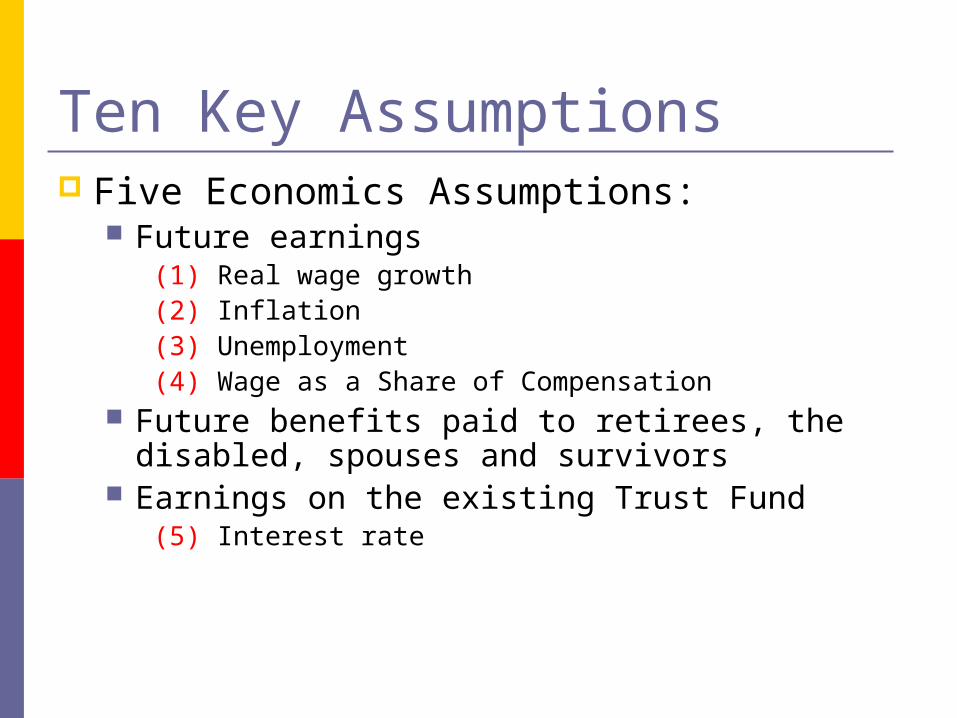
Ten Key Assumptions Five Economics Assumptions:
Future earnings(1) Real wage growth (2) Inflation(3) Unemployment(4) Wage as a Share of Compensation
Future benefits paid to retirees, the disabled, spouses and survivors
Earnings on the existing Trust Fund(5) Interest rate
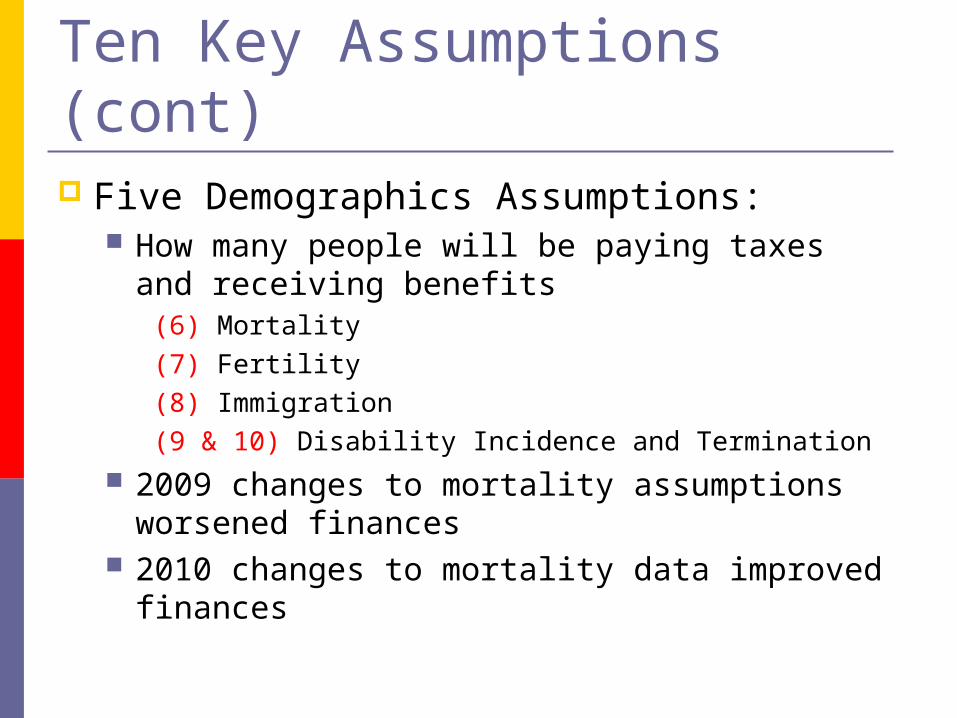
Ten Key Assumptions (cont) Five Demographics Assumptions:
How many people will be paying taxes and receiving benefits
(6) Mortality(7) Fertility(8) Immigration(9 & 10) Disability Incidence and Termination
2009 changes to mortality assumptions worsened finances
2010 changes to mortality data improved finances
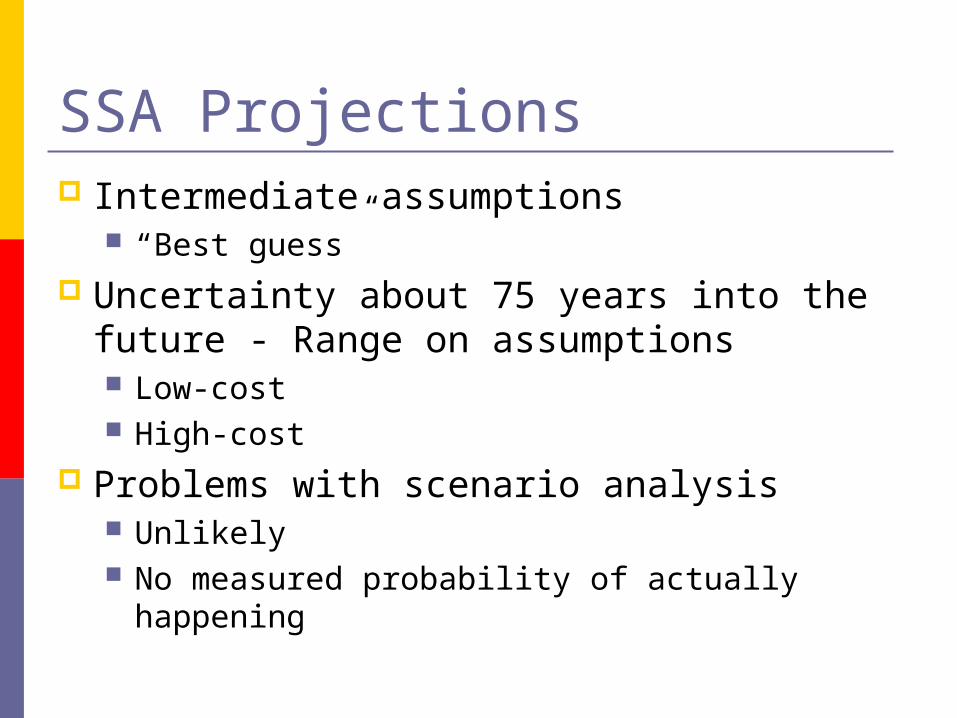
SSA Projections Intermediate assumptions
“Best guess” Uncertainty about 75 years into the future
- Range on assumptions Low-cost High-cost
Problems with scenario analysis Unlikely No measured probability of actually happening
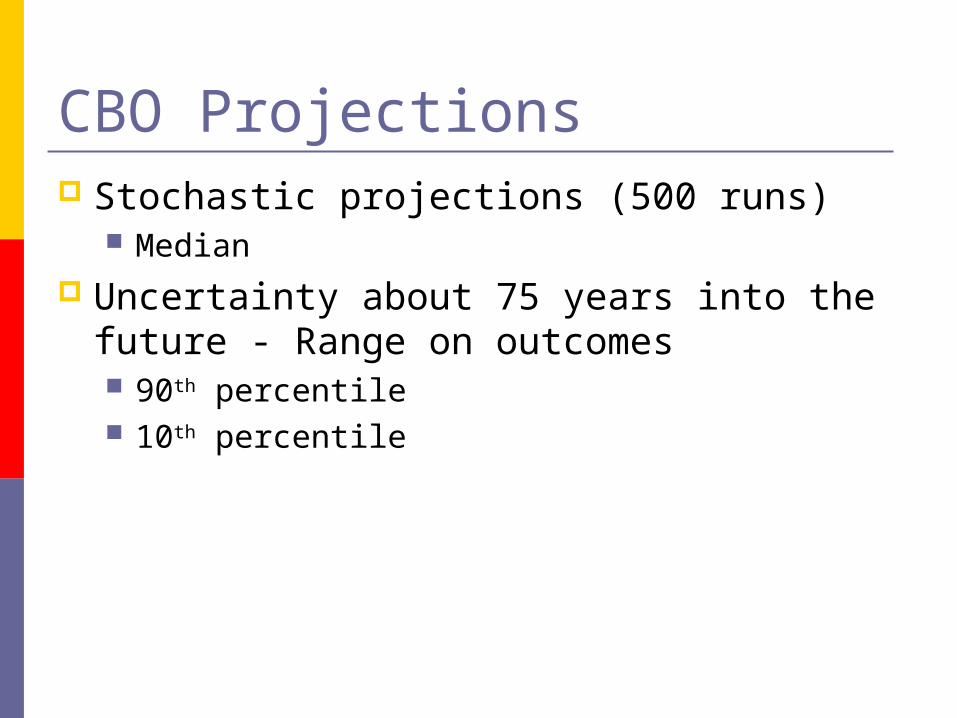
CBO Projections Stochastic projections (500 runs)
Median Uncertainty about 75 years into the future
- Range on outcomes 90th percentile 10th percentile
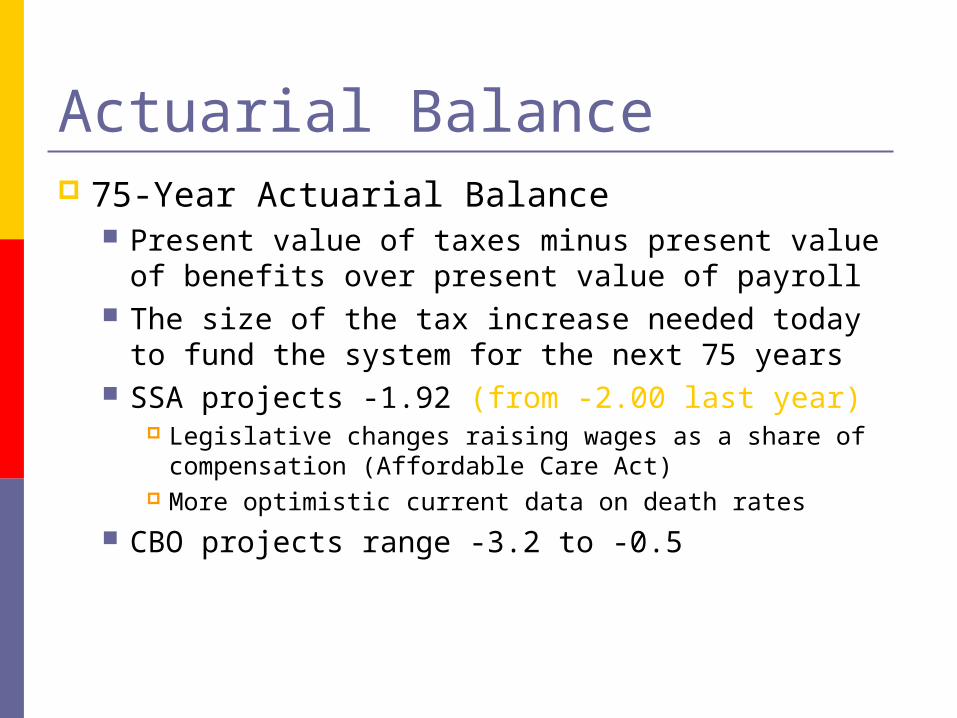
Actuarial Balance 75-Year Actuarial Balance
Present value of taxes minus present value of benefits over present value of payroll
The size of the tax increase needed today to fund the system for the next 75 years
SSA projects -1.92 (from -2.00 last year) Legislative changes raising wages as a share of
compensation (Affordable Care Act) More optimistic current data on death rates
CBO projects range -3.2 to -0.5
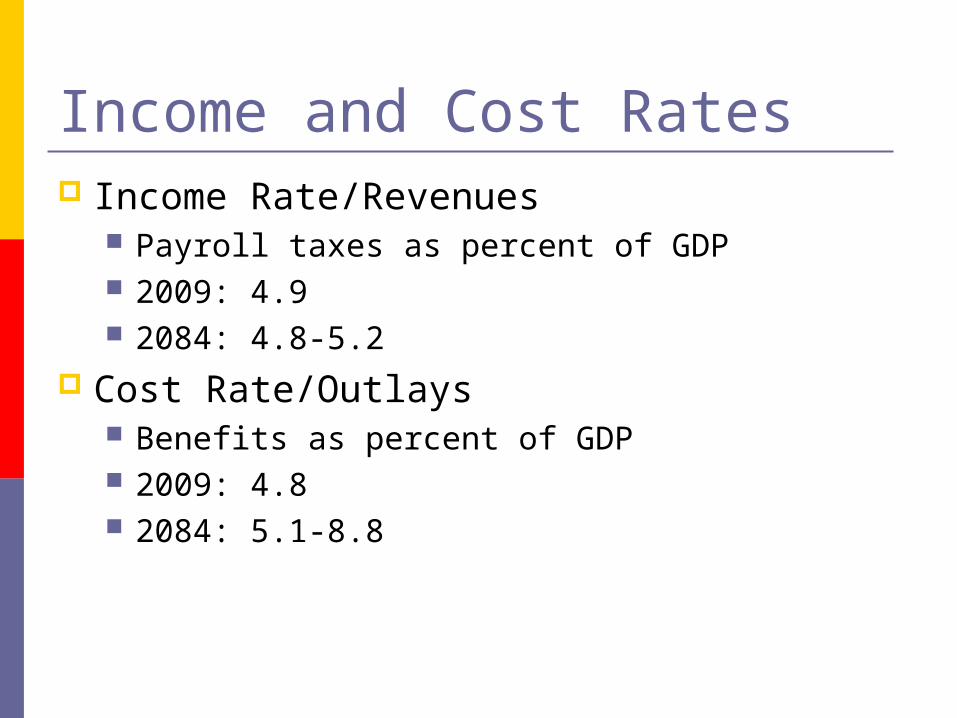
Income and Cost Rates Income Rate/Revenues
Payroll taxes as percent of GDP 2009: 4.9 2084: 4.8-5.2
Cost Rate/Outlays Benefits as percent of GDP 2009: 4.8 2084: 5.1-8.8
CBO Projected Outlays and Revenues 1985-2084
0
1
2
3
4
5
6
7
8
9
10
1985 1995 2005 2015 2025 2035 2045 2055 2065 2075
Sh
are
of
GD
P
0
1
2
3
4
5
6
7
8
9
10
Outlays
Revenues
Trust Fund Ratio Trust fund assets over annual
expenditures Measures if the system can pay benefits Currently large surplus Source of touted “Exhaustion Date” SSA projects the system will “go broke” in
2037 (same as last year) CBO projects between 2032 to 2058 However, current outlays exceed revenues –
living on interest and soon trust fund assets will be “redeemed”
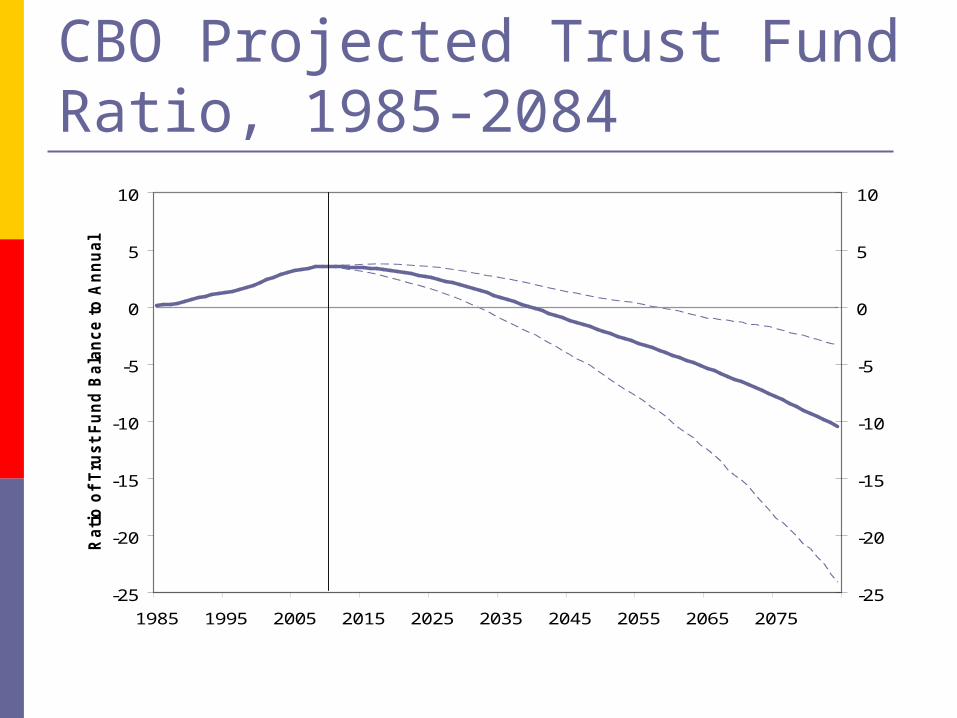
CBO Projected Trust Fund Ratio, 1985-2084
-25
-20
-15
-10
-5
0
5
10
1985 1995 2005 2015 2025 2035 2045 2055 2065 2075
Ra
tio
of
Tru
st
Fu
nd
Ba
lan
ce
to
An
nu
al
Ou
tla
ys
-25
-20
-15
-10
-5
0
5
10

Hope under Current Law? Taxest = Tax Ratet * Average Waget
* Number Workerst
Benefitst = Average Benefitt
* Number Beneficiariest
Trust Fundt = Trust Fundt-1 + Interestt
+ Taxest – Benefitst
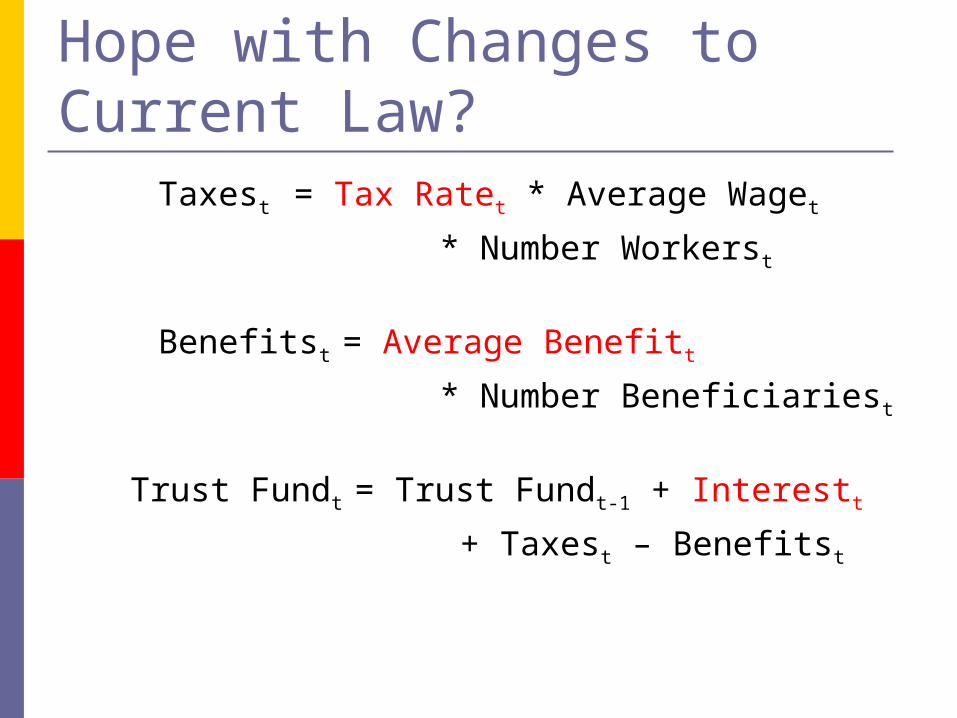
Hope with Changes to Current Law? Taxest = Tax Ratet * Average Waget
* Number Workerst
Benefitst = Average Benefitt
* Number Beneficiariest
Trust Fundt = Trust Fundt-1 + Interestt
+ Taxest – Benefitst
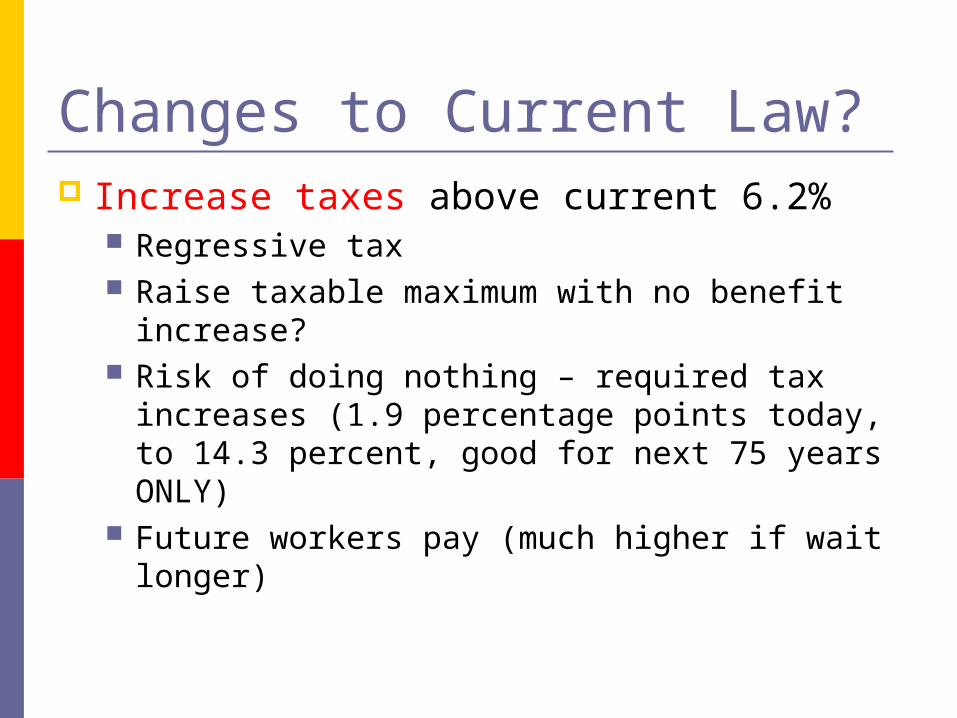
Changes to Current Law? Increase taxes above current 6.2%
Regressive tax Raise taxable maximum with no benefit
increase? Risk of doing nothing – required tax increases
(1.9 percentage points today, to 14.3 percent, good for next 75 years ONLY)
Future workers pay (much higher if wait longer)
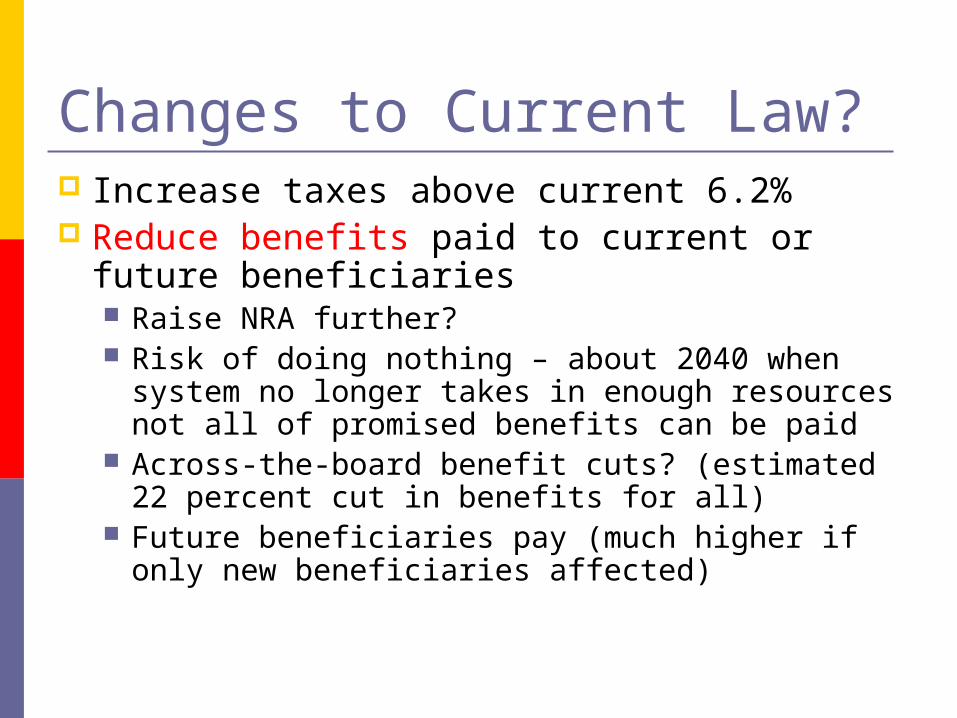
Changes to Current Law? Increase taxes above current 6.2% Reduce benefits paid to current or future
beneficiaries Raise NRA further? Risk of doing nothing – about 2040 when
system no longer takes in enough resources not all of promised benefits can be paid
Across-the-board benefit cuts? (estimated 22 percent cut in benefits for all)
Future beneficiaries pay (much higher if only new beneficiaries affected)
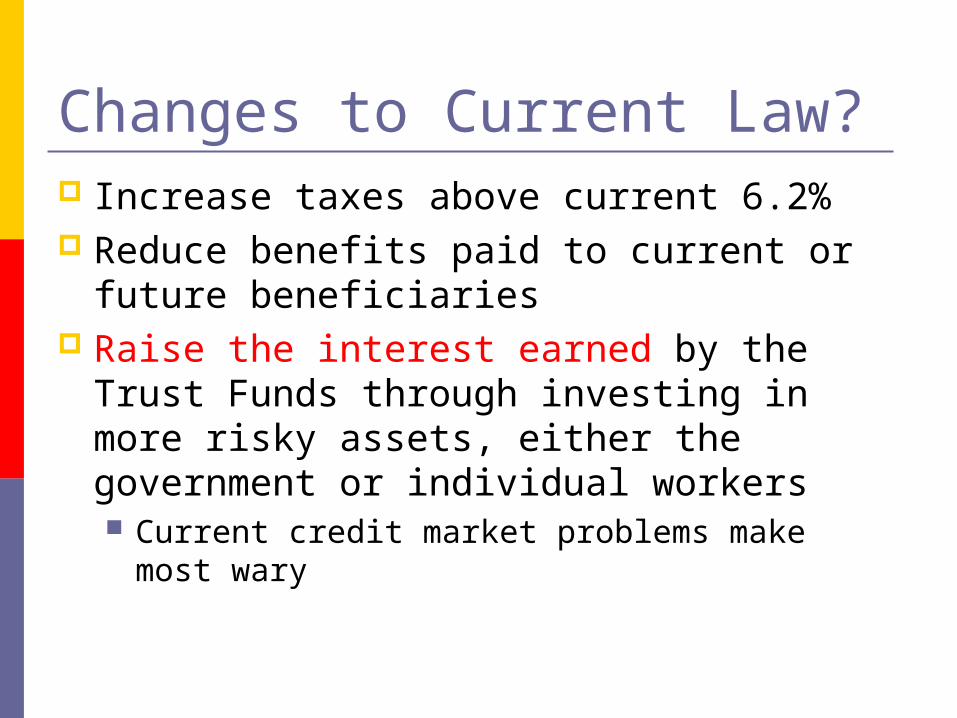
Changes to Current Law? Increase taxes above current 6.2% Reduce benefits paid to current or future
beneficiaries Raise the interest earned by the Trust
Funds through investing in more risky assets, either the government or individual workers Current credit market problems make most
wary
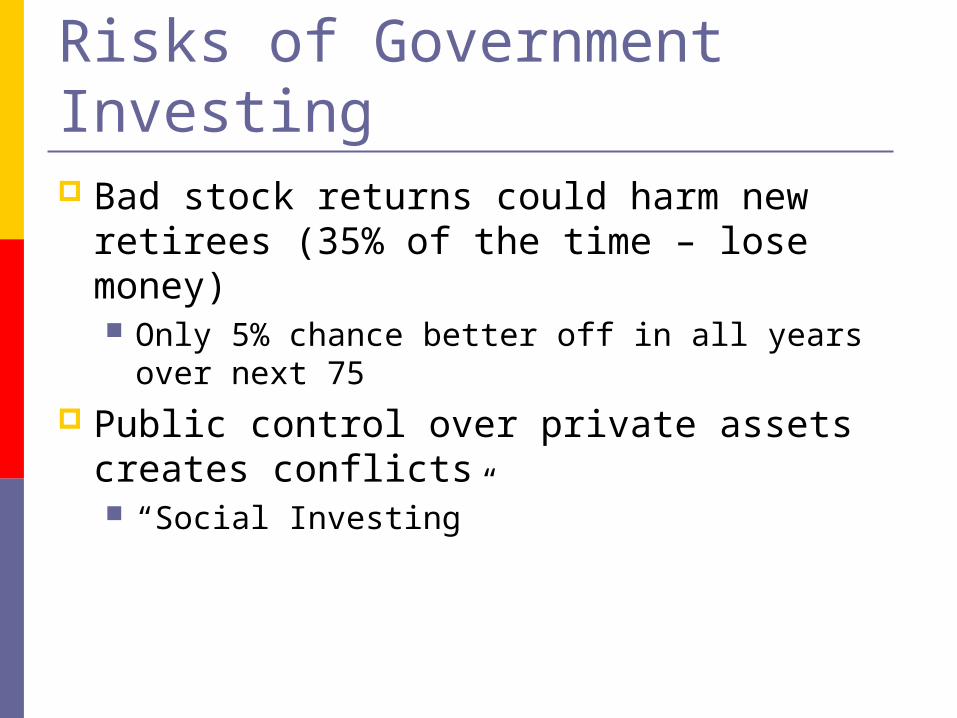
Risks of Government Investing Bad stock returns could harm new retirees
(35% of the time – lose money) Only 5% chance better off in all years over
next 75 Public control over private assets creates
conflicts “Social Investing”
Individual Accounts Allow individuals to take part of payroll tax
and invest in higher returns paid by the stock market
Trade-off is must accept higher risks Stock market is NOT a sure thing
President Obama Opposes any “privatization” Proposed no specific changes in FY 2012
budget, but some reportedly considered: Raising taxable maximum to $180,000 from
current $106,800 (90% of wages, up from 84%)
Change COLA calculation, reduce growth of benefits
Bring uncovered state and local employees into the system (small numbers)
National Commission on Fiscal Responsibility and Reform
Make PIA formula more progressiveRaise taxable maximum to 90% of wagesMake COLA calculation more accurateRaise NRA (69) and EEA (64) by 2075Cover all state and local employees Low-earner benefit at 125% of povertyRaise benefits for very old and long-time disabled (over 20 years)
Improve education of future retirees Increase flexibility for claiming benefits Encourage personal retirement savings

Your future retirement? Social Security benefits are uncertain for
your generation if reforms not instituted soon
Still not a great method of “saving” for retirement
Three-legged stool Public pension (Social Security) Private pension (401k) Personal saving (Roth IRA)
Economics informs us - solution is political
Even Bigger Mess: Medicare Congressional efforts for Social Security
reform ended with 2006 election Current health care reform debate has
shifted focus to Medicare Much bigger financial problem Same concerns about aging with little control
on benefit costs Serves as an example of government-run
health care Considered in Affordable Care Act – mostly as a
source of funds
Medicare defined Medicare is publicly-provided health
insurance for the elderly Medicaid is publicly-provided health insurance
for low income uninsured Four parts
Part A: Hospital Insurance (HI) Part B: Supplemental Medical Insurance (SMI) Part C: Medicare Advantage is alternative to
A&B Part D: Prescription Drugs
Who is covered? Elderly, 65+ (83.6% of beneficiaries)
Everyone automatically covered by HI, must sign up for SMI (95% do)
38.7 million beneficiaries in 2009 Disabled eligible after two years receiving
DI benefits 7.6 million beneficiaries in 2009
End stage renal disease (kidney dialysis)
What is covered? HI covers inpatient hospital care, skilled
nursing facilities, home health services, and hospice care
SMI covers doctor visits, lab tests, and outpatient hospital care
Part D covers prescription drugs (w limits – some removed as part of ACA)
Does NOT cover nursing homes
How is Medicare financed? HI financed through payroll taxes
1.45% (3.9%) on all earnings (HI Trust Fund) SMI and Part D financed through monthly
premiums (25%) and general revenues SMI $96.40-369.10 (2011) each month
means-tested premium Part D varies by plan Deducted from Social Security checks Also co-pays and deductibles
Medicare in financial trouble Dramatic growth in the program
1980: $37 Billion 2009: $502 Billion ($40 Billion 1-yr increase)
Similar to Social Security, Medicare has a bleak financial future Baby boomers start to retire in next 5 years People living longer Health costs rising faster than economy as a
whole
Excess Cost Growth Growth in spending per beneficiary that
exceeds growth in per capita GDP 3.0 percent over 1970-2005 2.1 percent over 1990-2005
Captures both policy changes and “residual” growth
Assumption going forward dramatically alters projections of program growth
Same issues for Medicaid (program for poor jointly funded by the states)
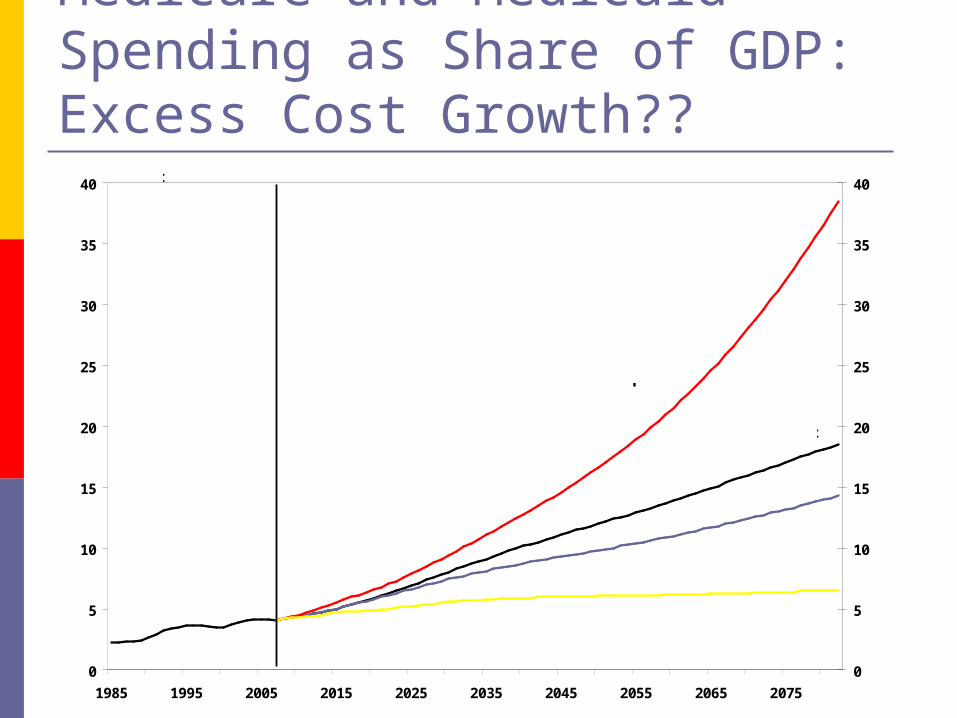
Medicare and Medicaid Spending as Share of GDP: Excess Cost Growth??
0
5
10
15
20
25
30
35
40
1985 1995 2005 2015 2025 2035 2045 2055 2065 2075
0
5
10
15
20
25
30
35
40
Excess Cost Growth of 1 percent
Excess Cost Growth of 2.5 percent
No Excess Cost Growth
CBO Forecast
Percent
…so federal budget in trouble HI Trust Fund, currently in surplus, is
projected to be exhausted in 2029 as costs rise Improved by ACA changes to spending
SMI will squeeze other federal spending as the Part B costs rise – 75% from current taxpayers
Part D cheaper so far, but cries to expand coverage may raise costs Estimated to cost $400 B over 10 years

Your future retirement? Health care diminishing as private
retirement benefit
Reliance on Medicare also uncertain
Health care likely to undergo major changes in next few years as costs rise
Economics informs us – solution is political
Recommended