29 May 2013
Revised
This publication was produced for review by the United States Agency for International Development. It was
prepared by Chemonics International Inc.
THE FRESH FRUIT AND
VEGETABLE MARKETS OF
EAST AFRICA
AN ASSESSMENT OF REGIONAL VALUE CHAIN ACTORS,
ACTIVITIES AND CONSTRAINTS IN KENYA, TANZANIA AND
UGANDA
29 May 2013
Revised
The author’s views expressed in this publication do not necessarily reflect the views of the United States
Agency for International Development or the United States Government.
Contract No. EEM-I-00-07-00008-00, Task Order 5
Contents
List of Acronyms .......................................................................................................... v
Glossary of Terms......................................................................................................... vi
List of Figures ............................................................................................................. vii
Executive Summary ...................................................................................................... 1
Introduction ................................................................................................................. 3
Structure of the Report ............................................................................................... 4
Regional Trade in Fresh Fruits and Vegetables ................................................................ 5
Regional Trade Flows ................................................................................................ 5
Tomatoes .............................................................................................................. 5
Pineapples ............................................................................................................ 8
Oranges .............................................................................................................. 11
Bananas .............................................................................................................. 15
Onions ................................................................................................................ 18
Recommendations ................................................................................................... 20
Understanding the Value Chains ................................................................................... 21
Wholesale and Aggregation Market Dynamics ........................................................... 21
Market Governance and Organization Overview ..................................................... 23
Market Trader Associations .................................................................................. 24
Wakulima Market, Nairobi, Kenya ........................................................................ 25
Kongowea Wholesale Market, Mombasa, Kenya .................................................... 26
Kilombero Wholesale Market, Arusha, Tanzania .................................................... 26
Owino Market, Kampala, Uganda ......................................................................... 27
Nakasero market, Kampala, Uganda ...................................................................... 27
Aggregation Markets ........................................................................................... 27
Value Chain Actors, Activities and Constraints .......................................................... 28
Producers ............................................................................................................ 29
Traders ............................................................................................................... 29
Transporters ........................................................................................................ 31
Retailers ............................................................................................................. 31
Cooperation ............................................................................................................ 31
Inefficiencies in FFV Value Chains ........................................................................... 32
Recommendations ................................................................................................... 37
Impact on Food Security and Nutrition .......................................................................... 38
Current Consumption Patterns of FFV ....................................................................... 38
Kenya ................................................................................................................. 38
THE FRESH FRUIT AND VEGETABLE MARKETS OF EAST AFRICA IV
Tanzania ............................................................................................................. 39
Uganda ............................................................................................................... 40
Closing the Micro-nutrient Deficiency Gap ................................................................ 41
Link between Trade and Nutrition ............................................................................. 42
Availability ......................................................................................................... 42
Affordability ....................................................................................................... 43
Recommendations ................................................................................................... 43
Recommendations and Action Plan ............................................................................... 44
Bibliography .............................................................................................................. 51
Annex 1: Institutions, NGOs and other actors in the region working on horticulture........... 54
Annex 2: Constraints ranked by value chain actors ......................................................... 61
Annex 3: Nutrient Profiles of Selected AIVs and other Vegetables ................................... 63
Annex 3: Notes on Methodology .................................................................................. 64
Annex 4: Wholesale and Aggregator Markets Surveyed .................................................. 67
Annex 5: Survey Instruments ....................................................................................... 69
THE FRESH FRUIT AND VEGETABLE MARKETS OF EAST AFRICA V
List of Acronyms
ACTESA Alliance for Commodity Trade in Eastern and Southern Africa
AIV African indigenous vegetables
ARNS African Regional Nutrition Strategy
AVRDC The World Vegetable Center
DHS Demographic and Health Survey
CAADP Comprehensive African Agricultural Development
CFSVA Comprehensive Food Security and Vulnerability Analysis
COMESA Common Market for Eastern and Southern Africa
COMPETE Competitiveness and Trade Expansion Program
EA East Africa
EAC East African Community
EAGC Eastern Africa Grain Council
EU European Union
FAFS Framework for African Food Security
FCS Food Consumption Score
FPEAK Fresh Produce Exporters Association of Kenya
FFV Fresh fruits and vegetables
FTF Feed the Future
HDCA Horticulture Crops Development Authority
IFPRI International Food Policy Research Institute
JMC Joint Market Committee
KARI Kenya Agriculture Research Institute
KEPHIS Kenya Plant Health Inspectorate Service
KHA Kenya Horticulture Authority
KHCDA Kenya Horticulture Development Agency
KHCP Kenya Horticulture Competitiveness Project
KRA Kenya Revenue Authority
KWTA Kongowea Wholesale Traders Association
MDG Millennium Development Goals
MRL Minimum Residue Limits
MSU Michigan State University
MTA Market Trader Association
NGO Non-governmental organization
NCC Nairobi City Council
OFSP Orange fleshed sweet potatoes
RDA Recommended Daily Allowance
SPS Sanitary and Phytosanitary
TAPP Tanzania Agriculture Productivity Program
TRA Tanzania Revenue Authority
UBOS Uganda Bureau of Statistics
USDA United States Department of Agriculture
VAD Vitamin A Deficiency
WEAI Women’s Empowerment in Agriculture Index
WHO World Health Organization
THE FRESH FRUIT AND VEGETABLE MARKETS OF EAST AFRICA VI
Glossary of Terms
Aggregator: An aggregator is an intermediary/ trader (see below) who assembles produce in
rural production areas and prepares them for transport and marketing in wholesale markets.
Aggregators are often responsible for sorting, grading and transport of goods to wholesale
outlets. Aggregators sometimes transport produce themselves or they hire transporters.
Broker: A broker is an actor in FFV value chains that does not own the product in any point
in the chain. Brokers connect buyers and sellers and can negotiate price on behalf of either
party. They operate on the farm level connecting producers and traders and on market levels
connecting wholesalers to intermediaries to retailers, etc. Broker commissions vary.
Cess: A fee or tax paid in Kenya when crossing district boundaries within the country. The
origin of this fee dates back to colonial times to keep local produce in the district of origin
and discourage trade.
Dietary Diversity: A qualitative measure of food consumption, dietary diversity measures
the number of unique foods consumed over a given period of time. Dietary diversity provides
information on household food security. It reflects household access to a variety of foods and
is a proxy of micronutrient adequacy of the diet of individuals.
Food Consumption Score: A key indicator in measuring food security is by Food
Consumption Scores (FCS), which combines: i) dietary diversity (the number of individual
foods consumed over the past week is collected); ii) food frequency (the number of days in
the past week that a specific food item has been consumed is collected); and iii) the
nutritional importance of the food groups (which are weighted to reflect this). Previous
studies have shown dietary diversity to be correlated with nutrient adequacy, kilocalorie
intake, children’s and women’s anthropometry and socio-economic status. As such, the FCS
is an effective proxy indicator of food access and nutrition intake.
Intermediaries: An intermediary buys from farmers, brokers or from other intermediaries
and takes ownership of the product at the time they receive it. They sell to other
intermediaries, institutional consumers, and large suppliers at the retail level.
Retailer: Retailers sell directly to an individual, household or institutional customer. A
variety of actors along the FFV supply chain engage in retail sale. Farmers and traders can
sell informally along the roadside or in markets and kiosks or formally in markets, green
grocers and supermarkets.
Traders: All actors working at the trade level along the value chain, including
intermediaries, wholesalers, and brokers.
Wholesalers: In this study, a wholesaler is an intermediary who operates only at the
wholesale market. He buys from farmers or intermediaries and often hires uses brokers for
trading.
THE FRESH FRUIT AND VEGETABLE MARKETS OF EAST AFRICA VII
List of Figures
Figure 1: East Africa Tomato Production and Trade Flow Map.......................................... 6
Figure 2. 2010 Production and Trade Volume Data (MT) .................................................. 7 Figure 3: 2009-2011 Average Wholesale Tomato Prices ................................................... 7 Figure 4: East Africa Pineapple Production and Trade Flow Map....................................... 8
Figure 5: 2010 Pineapple Production and Trade Volume Data (MT) ................................... 9
Figure 6: 2009-2011 Average Wholesale Pineapple Prices ................................................ 9
Figure 7: 2010/2011 Select Market Wholesale Pineapple Prices ....................................... 10 Figure 8: East Africa Orange Production and Trade Flow Map ........................................ 11
Figure 9: 2010 Orange Trade Volume Data (MT) ........................................................... 12
Figure 10: Regional Orange Trade Calendar .................................................................. 12 Figure 11: 2009-2011 Nairobi and Mombasa Relative Wholesale Orange Prices ............... 12
Figure 12: 2009-2011 Average Wholesale Orange Prices ................................................ 13 Figure 13: 2009/2010 Select Market Wholesale Orange Prices ........................................ 13
Figure 14: Relative Uganda Wholesale Orange Prices..................................................... 14 Figure 15: East Africa Banana Production and Trade Flow Map ...................................... 15
Figure 16: 2010 Banana Production and Trade Volume Data (MT) .................................. 16
Figure 17: 2009-2011 Average Wholesale Cooking Banana Prices ................................... 16 Figure 18: 2010/2011 Select Markets Wholesale Cooking Banana Prices.......................... 17
Figure 19: East Africa Onion Production and Trade Flow Map ........................................ 18
Figure 20: 2010 Onion Production and Trade Volume Data (MT) .................................... 19
Figure 21: 2009-2011 Average Wholesale Onion Prices .................................................. 19
Figure 22: Regional Onion Trade Flow Calendar ........................................................... 20
Figure 23: Demographic Breakdown of Survey Respondents ........................................... 21 Figure 24: Wholesale and Aggregation Markets in Uganda, Kenya and Tanzania .............. 22 Figure 25: Wholesale Market Structure ......................................................................... 23
Figure 27: Regional Horticulture Value Chain Actors, Activities and Constraints .............. 29 Figure 28: Kenya Red Onion Value Chain Costs ............................................................ 32
Figure 29: Uganda Pineapple Value Chain Costs ............................................................ 34 Figure 30: Kenya Tomato Value Chain Costs................................................................ 34
Figure 31: Tanzania Orange Value Chain Costs ............................................................. 36
Figure 32: Average Costs along Selected FFV Value Chains ........................................... 36 Figure 33: Main Food Sources for Kenyan Households (%HH) ....................................... 39
Figure 34: Food Item Consumption: Tanzania ............................................................... 39
Figure 35: Mean Days Food Item Consumed by Wealth Quintile: Tanzania ...................... 40
Figure 36: Diet Consumption and Food Sources Kenya, Tanzania, Uganda ....................... 41 Figure 37: Micro-nutrient Content of Select FFV (per 100g) ........................................... 42
Figure 38: FFV High in Micronutrients ......................................................................... 42
Figure 39: Top Constraints Wholesalers/ Traders Across 3 Countries ............................... 61 Figure 40: Constraints Matrix by Actor and Country ...................................................... 62
Figure 41: Nutrient Profiles of Selected Indigenous African Vegetables ........................... 63
Figure 42: Nutrient Profiles of Selected Fresh Produce Products ...................................... 63
THE FRESH FRUIT AND VEGETABLE MARKETS OF EAST AFRICA 1
Executive Summary
USAID is interested in better understanding the fresh fruits and vegetables (FFV) production
and marketing systems in the EA region to determine if trade-related interventions could
enhance FFV consumption in the region. The assumption being that increased access to
regional markets could make FFV more available and affordable to a wider range of
consumers. The East Africa Trade Hub (EATH) was tasked to conduct research on the FFV
sector and to advise USAID East Africa on possible interventions that could be supported
under their Feed the Future (FtF) program that aims to improve food security and nutrition.
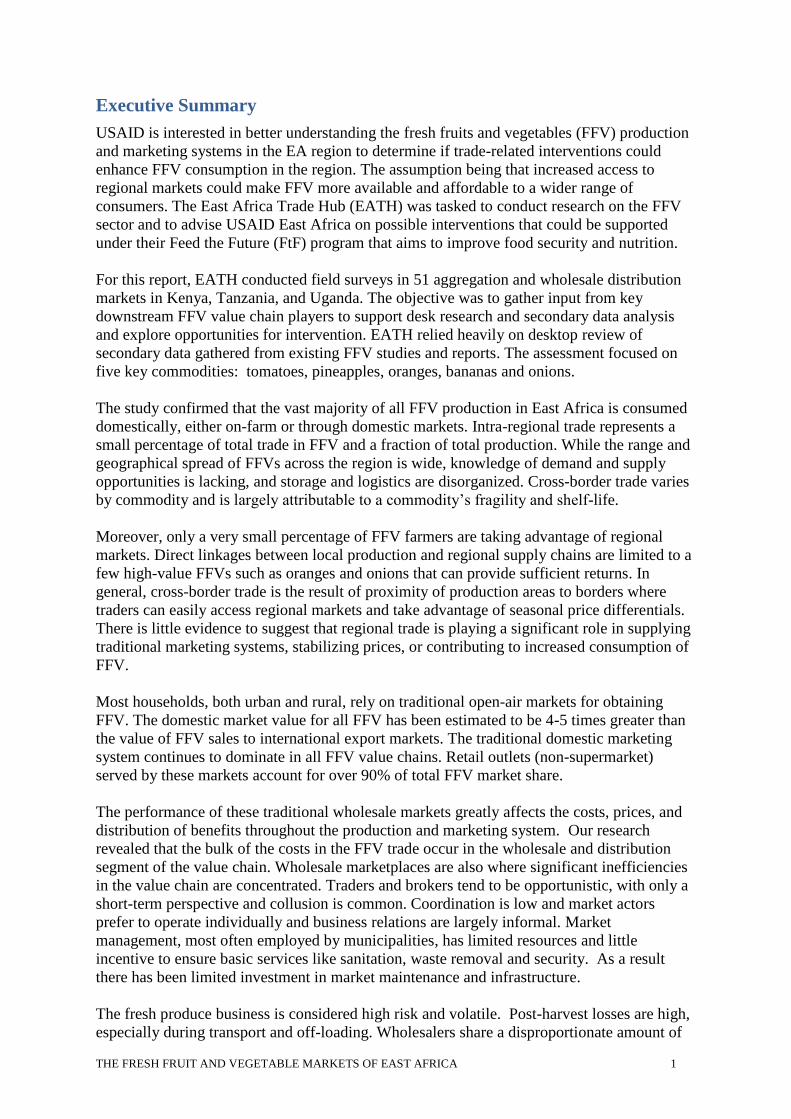
For this report, EATH conducted field surveys in 51 aggregation and wholesale distribution
markets in Kenya, Tanzania, and Uganda. The objective was to gather input from key
downstream FFV value chain players to support desk research and secondary data analysis
and explore opportunities for intervention. EATH relied heavily on desktop review of
secondary data gathered from existing FFV studies and reports. The assessment focused on
five key commodities: tomatoes, pineapples, oranges, bananas and onions.
The study confirmed that the vast majority of all FFV production in East Africa is consumed
domestically, either on-farm or through domestic markets. Intra-regional trade represents a
small percentage of total trade in FFV and a fraction of total production. While the range and
geographical spread of FFVs across the region is wide, knowledge of demand and supply
opportunities is lacking, and storage and logistics are disorganized. Cross-border trade varies
by commodity and is largely attributable to a commodity’s fragility and shelf-life.
Moreover, only a very small percentage of FFV farmers are taking advantage of regional
markets. Direct linkages between local production and regional supply chains are limited to a
few high-value FFVs such as oranges and onions that can provide sufficient returns. In
general, cross-border trade is the result of proximity of production areas to borders where
traders can easily access regional markets and take advantage of seasonal price differentials.
There is little evidence to suggest that regional trade is playing a significant role in supplying
traditional marketing systems, stabilizing prices, or contributing to increased consumption of
FFV.
Most households, both urban and rural, rely on traditional open-air markets for obtaining
FFV. The domestic market value for all FFV has been estimated to be 4-5 times greater than
the value of FFV sales to international export markets. The traditional domestic marketing
system continues to dominate in all FFV value chains. Retail outlets (non-supermarket)
served by these markets account for over 90% of total FFV market share.
The performance of these traditional wholesale markets greatly affects the costs, prices, and
distribution of benefits throughout the production and marketing system. Our research
revealed that the bulk of the costs in the FFV trade occur in the wholesale and distribution
segment of the value chain. Wholesale marketplaces are also where significant inefficiencies
in the value chain are concentrated. Traders and brokers tend to be opportunistic, with only a
short-term perspective and collusion is common. Coordination is low and market actors
prefer to operate individually and business relations are largely informal. Market
management, most often employed by municipalities, has limited resources and little
incentive to ensure basic services like sanitation, waste removal and security. As a result
there has been limited investment in market maintenance and infrastructure.
The fresh produce business is considered high risk and volatile. Post-harvest losses are high,
especially during transport and off-loading. Wholesalers share a disproportionate amount of
THE FRESH FRUIT AND VEGETABLE MARKETS OF EAST AFRICA 2
the risk and establish prices to account for these losses. Gross profit statistics often mask the
real return on investment for these players. Many wholesale markets feature brokered
transactions rather than transfer of ownership between first sellers and wholesalers. This
brokering activity frequently creates suspicion among farmers and smaller traders.
Consumption patterns of FFV in East African households indicate strong consumer
preference towards other food groups, even as household level incomes rise. Consumption of
FFV on a daily basis is still low for all income classes in all three countries. Although food
consumption patterns vary by country and income group, many of these traditional diets are
based on cereals or starches and FFV are not priority food items. Relatively high prices mean
that FFVs remain out of reach for food and nutrition insecure households—those that need
them the most.
EATH was able to determine several areas of potential interventions to help overcome some
of these challenges. These centered on improving data and information collection and
analysis, identifying key public and private partners to lead efforts to enhance FFV trade,
supporting efforts to build capacities of regional and national level FFV trade associations,
improving wholesale market efficiencies through better cooperation among value chain
player and developing nutritional awareness campaigns to encourage more FFV
consumption.
Key Recommendations include:
1. Improve the region’s capacity to collect and analyze FFV trade flow, price and market
information
2. Develop interventions to address wholesale market inefficiencies
3. Improve the FFV policy and enabling environment
4. Promote consumer awareness campaigns on the nutritional benefits of eating FFV
THE FRESH FRUIT AND VEGETABLE MARKETS OF EAST AFRICA 3
Introduction
USAID East Africa is working to enhance food security and nutrition in the region. The
increased consumption of fresh fruits and vegetables (FFV) could play an important role in
achieving this objective. Fruits and vegetables are essential to an adequately varied diet. The
World Health Organization (WHO) recommends the consumption of at least 400g of fruits
and vegetables per day to provide essential, necessary nutrients lacking in other food groups.
Fruit and vegetables contain a range of macro and micronutrients including pro-vitamin A,
iron and zinc which help to prevent malnutrition. Under-consumption of fruit and vegetables
is among the top ten risk factors leading to micronutrient malnutrition and is associated with
the prevalence of chronic diseases.
There are many reasons for inadequate quantities of FFV in East African diets. Although
food consumption patterns vary by country and income group, many of these traditional diets
are based on cereals or starches and FFV are not part of everyday consumption patterns and
not featured as a priority food item in household food budgets. Also, the high prices of FFV
could preclude certain income groups from including FFV in their diets. Lower income
households are often the very groups that need FFV the most as they are at a higher risk of
food insecurity and malnutrition than wealthier households.
USAID is interested in better understanding the FFV production and marketing systems in
the EA region to assess the extent to which trade-related interventions could enhance FFV
consumption in the region. This study evaluated the following hypothesis:
As regional markets become increasingly integrated, FFV should become
more widely available throughout the year, helping stabilize prices and
making these products more affordable to consumers. Reliable access to larger
regional markets should encourage farmers to diversify production for sale,
potentially increasing household incomes. Year-round availability of a range
of fruits and vegetables should encourage increased trade in FFV and will
automatically have a direct, simple impact on reducing malnutrition.
EATH has been tasked to advise USAID East Africa on the FFV value chain and make
recommendations for possible interventions in the FFV sector based on the findings of this
assessment. EATH conducted two studies looking at the FFV sector that informed the
findings of this report.
In late 2011, EATH carried out a rapid assessment of intra-regional trade in FFV throughout
East Africa. EATH engaged a local firm, IMANI Development Ltd. to assist in this effort to
gather data to gauge the quantities of intra-regional trade in selected horticultural
commodities and to determine the most important trade flows and key border crossings. The
team looked at pineapples, bananas, passion fruit, onions, tomatoes, and cabbages, to provide
a good cross-section of fruits and vegetables. The study also identified key production areas
for each commodity that supplied these value chains.
Although the data in the rapid assessment indicated that most (>90%) horticultural crops are
produced and marketed through traditional domestically-sourced production and marketing
systems, the study identified at least some fruits and vegetables that are traded regionally,
mostly through informal channels, but some that are also traded through more formal trade
routes and recorded in formal trade statistics. These included: bananas (both sweet and
green), oranges, pineapples, mangoes, onions and tomatoes.
THE FRESH FRUIT AND VEGETABLE MARKETS OF EAST AFRICA 4
EATH interview with the market manager in
Mwanza, Tanzania
The second study described in this report was designed to provide an in-depth look at the
downstream links of these FFV value chains and trace their movement from production
zones, to aggregator markets, and into the various marketing channels for distribution to
retailers and consumers. The study analyzed the
market dynamics and systems influencing both
domestic and regional trade of these and other
horticultural crops available in East African
markets. The study also looked at FFV
consumption patterns and nutritional aspects of
FFVs grown and traded in the region. During the
course of the study, EATH carried out a critical
review of USAID’s “enhanced trade” hypothesis to
evaluate its validity based on field research and
primary and secondary data analysis.
For this report, EATH relied heavily on a desk top
review of secondary data gathered from existing
FFV studies and reports. EATH augmented this data
with current production figures and price trend
analysis. To further support secondary data, EATH
incorporated results from the three-country field
survey (Kenya, Tanzania, and Uganda) to gain a
more detailed understanding of the activities and
constraints of key value chain players in principal
aggregation and distribution markets in these three
countries.
Structure of the Report
Section 1(“Regional Trade in FFV”) describes trade of tomatoes, pineapples, oranges,
bananas, and onions between Kenya, Tanzania and Uganda. This section situates trade flows
within the context of production volumes, seasonality, and price trends over three years.
Section 2 (“Understanding the Value Chains”) begins by describing the dynamics of
wholesale and aggregation markets, including governance and management structures,
followed by more in-depth descriptions of the region’s primary wholesale market models.
Case studies of select markets provide a more detailed picture of governance mechanisms and
common constraints confronted by market participants. The second half of Section 2 defines
various actors along FFV value chains and their roles and activities and discusses constraints
revealed in survey results. Finally, the costs along selected value chains are outlined
underlining weaknesses and market inefficiencies common across FFV value chains. Section
3 (“Impact on Food Security and Nutrition”), provides a brief overview of dietary diversity
and consumption patterns in all three countries. This section discusses the possible effects of
increased intra-regional trade flow of FFV on food security and nutrition outcomes in the
region.
Each section concludes with recommendations based on analysis of specific opportunities
and constraints. These recommendations are discussed in greater detail in Section 4
(“Recommendations and Action Plan”). Actionable recommendations are outlined and
classified by near-term, medium-term and long-term objectives for USAID.
THE FRESH FRUIT AND VEGETABLE MARKETS OF EAST AFRICA 5
Regional Trade in Fresh Fruits and Vegetables
An analysis of the region’s trade flows conducted by Imani for the EA Trade Hub in 2010
revealed that intra-regional trade represents a small percentage of total trade. Looking at the
percent traded as a percent of national production gives a sense of the dominance of domestic
trade. That share varies by commodity and is largely attributable to a commodity’s fragility
and shelf-life. For example, trade in tomatoes is 1.32% of total production, which would
indicate that proximity to market is key for this fragile and perishable crop. Trade in onions,
which are hardier and have a longer shelf-life (up to three months if dried and stored
properly), is somewhat higher at 6.5% but still small compared to total production. For
purposes of this analysis the difference between total production and intra-regional trade
represents domestic trade. Intra-regional trade in lower value, bulkier horticulture
commodities such as bananas is also low at 0.02%, which would indicate that there is
sufficient local production to meet demand.
The sections below provide a more detailed assessment of five key commodities: tomatoes,
pineapples, oranges, bananas and onions.
Regional Trade Flows
Tomatoes
East Africa’s tomato farmers primarily produce Italian processing varieties (Rio Grande,
Roma and Money Maker). These varieties are preferred because they are high yielding,
disease resistant and have a longer shelf-life than other varieties. Kenya has two main
production seasons – November – February and April – June with peak production in May.
Tanzania’s main production period is from August – December with peak production in
October. Uganda has two production periods – the long, six month period is from April –
September with a short season from December – January.
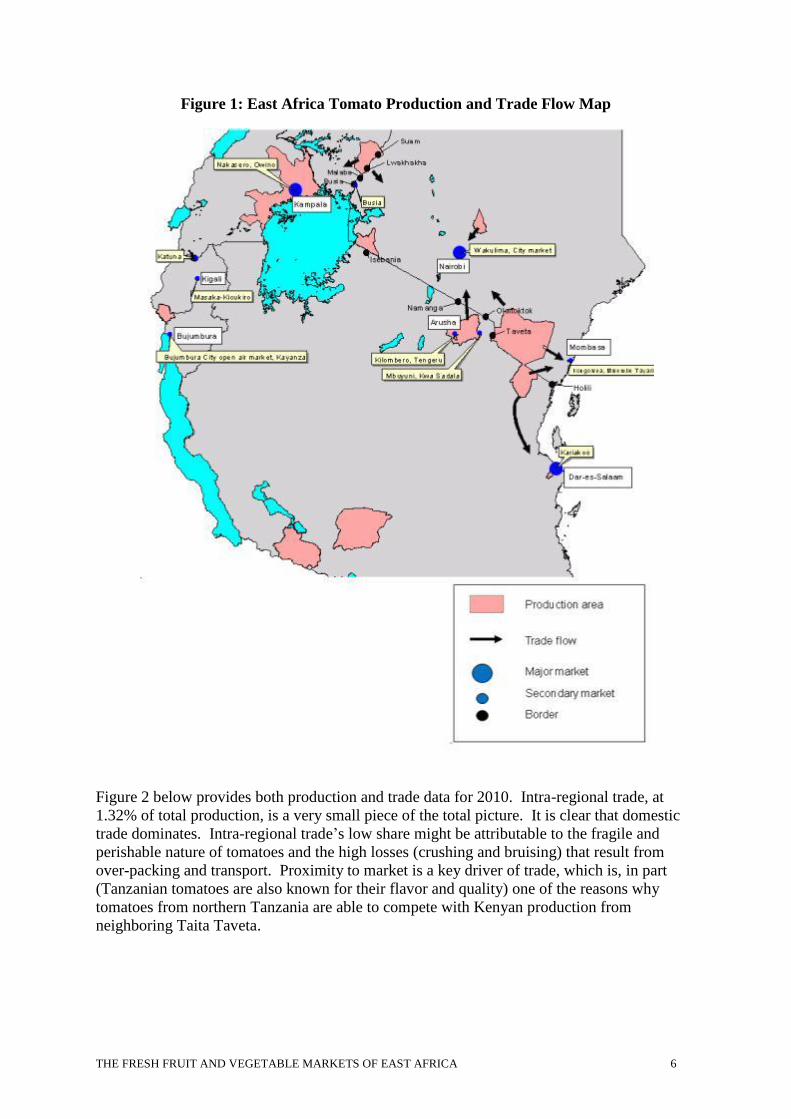
Figure 1 below shows the main production areas. In Kenya, Taita Taveta is the leading
production area (14.3% of national production). Other important production areas are
Migori, Kajiado and Kirinyaga. In Uganda, Mukono, Kayunga and Mubende districts are the
leading production areas. In northern Tanzania, production is concentrated in Arusha,
Kilimanjaro and Lushoto districts that serve as a source of supply to Kenya.
THE FRESH FRUIT AND VEGETABLE MARKETS OF EAST AFRICA 6
Figure 1: East Africa Tomato Production and Trade Flow Map
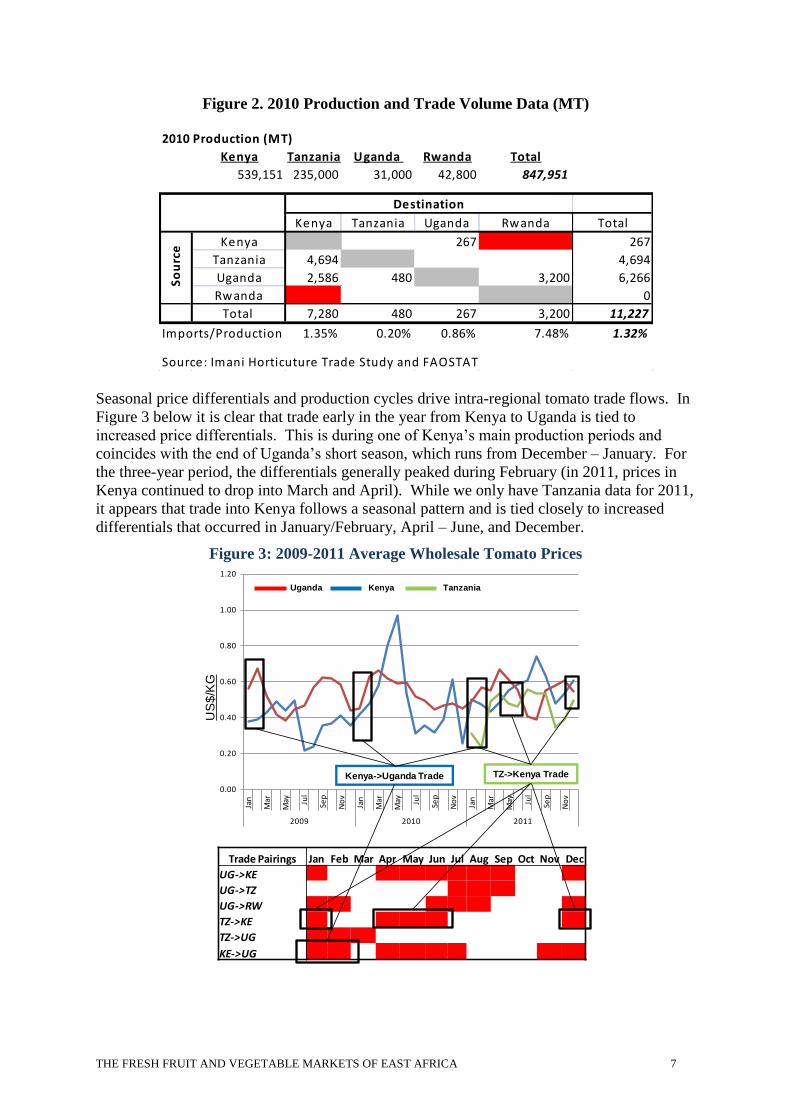
Figure 2 below provides both production and trade data for 2010. Intra-regional trade, at
1.32% of total production, is a very small piece of the total picture. It is clear that domestic
trade dominates. Intra-regional trade’s low share might be attributable to the fragile and
perishable nature of tomatoes and the high losses (crushing and bruising) that result from
over-packing and transport. Proximity to market is a key driver of trade, which is, in part
(Tanzanian tomatoes are also known for their flavor and quality) one of the reasons why
tomatoes from northern Tanzania are able to compete with Kenyan production from
neighboring Taita Taveta.
THE FRESH FRUIT AND VEGETABLE MARKETS OF EAST AFRICA 7
2010 Production (MT)
Kenya Tanzania Uganda Rwanda Total
539,151 235,000 31,000 42,800 847,951
Kenya Tanzania Uganda Rwanda Total
Kenya 267 267
Tanzania 4,694 4,694
Uganda 2,586 480 3,200 6,266
Rwanda 0
Total 7,280 480 267 3,200 11,227
Imports/Production 1.35% 0.20% 0.86% 7.48% 1.32%
Source: Imani Horticuture Trade Study and FAOSTAT
Destination
So
urc
e
Figure 2. 2010 Production and Trade Volume Data (MT)
Seasonal price differentials and production cycles drive intra-regional tomato trade flows. In
Figure 3 below it is clear that trade early in the year from Kenya to Uganda is tied to
increased price differentials. This is during one of Kenya’s main production periods and
coincides with the end of Uganda’s short season, which runs from December – January. For
the three-year period, the differentials generally peaked during February (in 2011, prices in
Kenya continued to drop into March and April). While we only have Tanzania data for 2011,
it appears that trade into Kenya follows a seasonal pattern and is tied closely to increased
differentials that occurred in January/February, April – June, and December.
Figure 3: 2009-2011 Average Wholesale Tomato Prices
0.00
0.20
0.40
0.60
0.80
1.00
1.20
Jan
Mar
May Ju
l
Sep
No
v
Jan
Mar
May Ju
l
Sep
No
v
Jan
Mar
May Ju
l
Sep
No
v
2009 2010 2011
Trade Pairings Jan Feb Mar Apr May Jun Jul Aug Sep Oct Nov Dec
UG->KE
UG->TZ
UG->RW
TZ->KE
TZ->UG
KE->UG
Uganda Kenya Tanzania
Kenya->Uganda Trade TZ->Kenya Trade
US
$/K
G
THE FRESH FRUIT AND VEGETABLE MARKETS OF EAST AFRICA 8
Pineapples
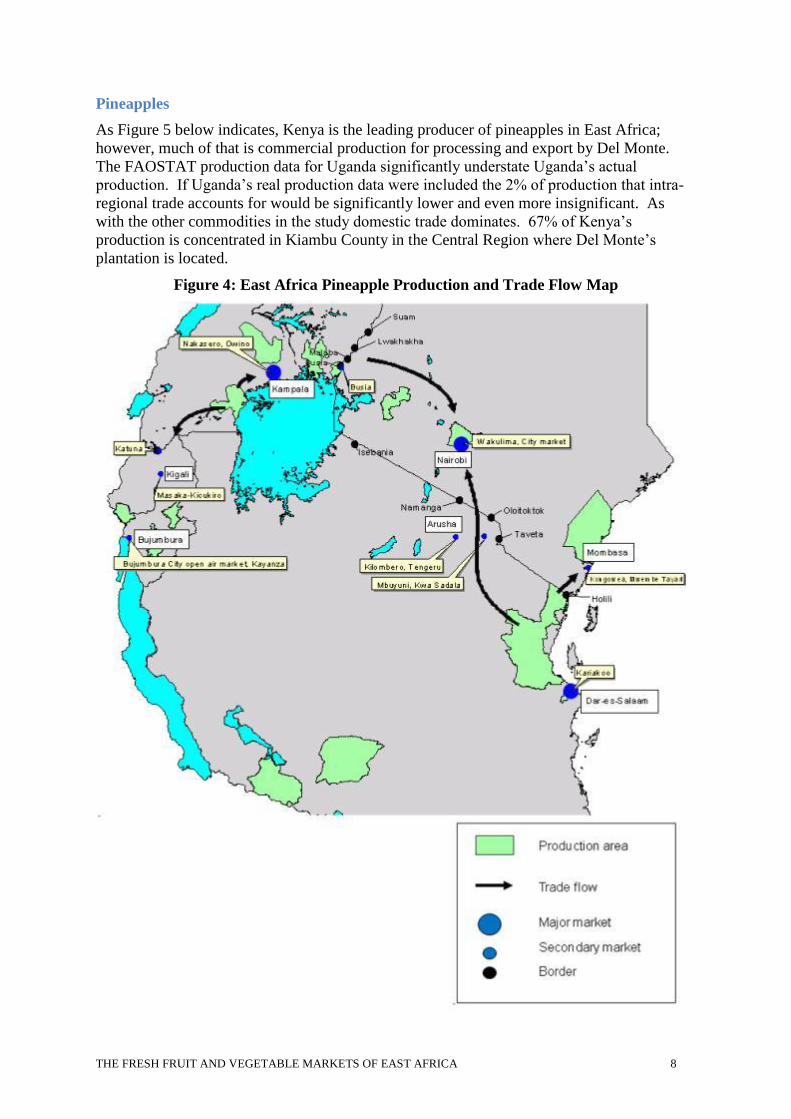
As Figure 5 below indicates, Kenya is the leading producer of pineapples in East Africa;
however, much of that is commercial production for processing and export by Del Monte.
The FAOSTAT production data for Uganda significantly understate Uganda’s actual
production. If Uganda’s real production data were included the 2% of production that intra-
regional trade accounts for would be significantly lower and even more insignificant. As
with the other commodities in the study domestic trade dominates. 67% of Kenya’s
production is concentrated in Kiambu County in the Central Region where Del Monte’s
plantation is located.
Figure 4: East Africa Pineapple Production and Trade Flow Map
THE FRESH FRUIT AND VEGETABLE MARKETS OF EAST AFRICA 9
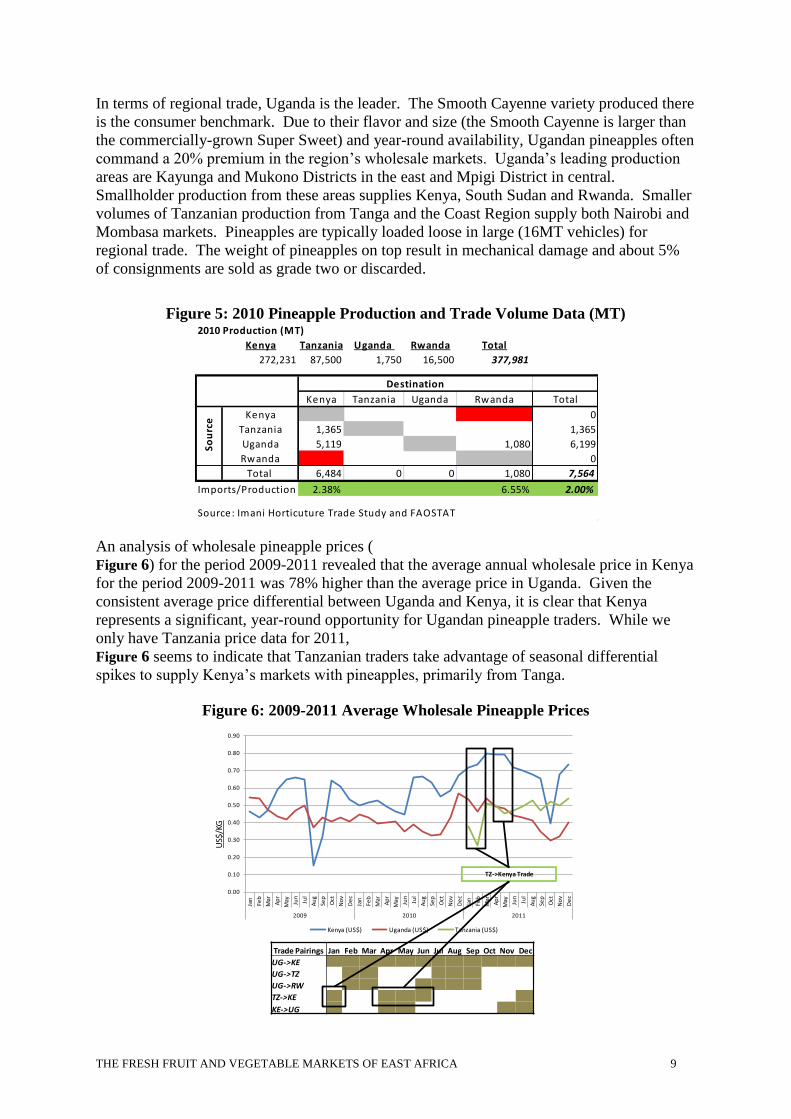
In terms of regional trade, Uganda is the leader. The Smooth Cayenne variety produced there
is the consumer benchmark. Due to their flavor and size (the Smooth Cayenne is larger than
the commercially-grown Super Sweet) and year-round availability, Ugandan pineapples often
command a 20% premium in the region’s wholesale markets. Uganda’s leading production
areas are Kayunga and Mukono Districts in the east and Mpigi District in central.
Smallholder production from these areas supplies Kenya, South Sudan and Rwanda. Smaller
volumes of Tanzanian production from Tanga and the Coast Region supply both Nairobi and
Mombasa markets. Pineapples are typically loaded loose in large (16MT vehicles) for
regional trade. The weight of pineapples on top result in mechanical damage and about 5%
of consignments are sold as grade two or discarded.
Figure 5: 2010 Pineapple Production and Trade Volume Data (MT)
An analysis of wholesale pineapple prices (
Figure 6) for the period 2009-2011 revealed that the average annual wholesale price in Kenya
for the period 2009-2011 was 78% higher than the average price in Uganda. Given the
consistent average price differential between Uganda and Kenya, it is clear that Kenya
represents a significant, year-round opportunity for Ugandan pineapple traders. While we
only have Tanzania price data for 2011,
Figure 6 seems to indicate that Tanzanian traders take advantage of seasonal differential
spikes to supply Kenya’s markets with pineapples, primarily from Tanga.
Figure 6: 2009-2011 Average Wholesale Pineapple Prices
US$
/KG
0.00
0.10
0.20
0.30
0.40
0.50
0.60
0.70
0.80
0.90
Jan
Feb
Mar
Ap
r
May Ju
n
Jul
Au
g
Sep
Oct
No
v
De
c
Jan
Feb
Mar
Ap
r
May Ju
n
Jul
Au
g
Sep
Oct
No
v
De
c
Jan
Feb
Mar
Ap
r
May Ju
n
Jul
Au
g
Sep
Oct
No
v
De
c
2009 2010 2011
Kenya (US$) Uganda (US$) Tanzania (US$)
Trade Pairings Jan Feb Mar Apr May Jun Jul Aug Sep Oct Nov Dec
UG->KE
UG->TZ
UG->RW
TZ->KE
KE->UG
TZ->Kenya Trade
2010 Production (MT)
Kenya Tanzania Uganda Rwanda Total
272,231 87,500 1,750 16,500 377,981
Kenya Tanzania Uganda Rwanda Total
Kenya 0
Tanzania 1,365 1,365
Uganda 5,119 1,080 6,199
Rwanda 0
Total 6,484 0 0 1,080 7,564
Imports/Production 2.38% 6.55% 2.00%
Source: Imani Horticuture Trade Study and FAOSTAT
Destination
So
urc
e
THE FRESH FRUIT AND VEGETABLE MARKETS OF EAST AFRICA 10
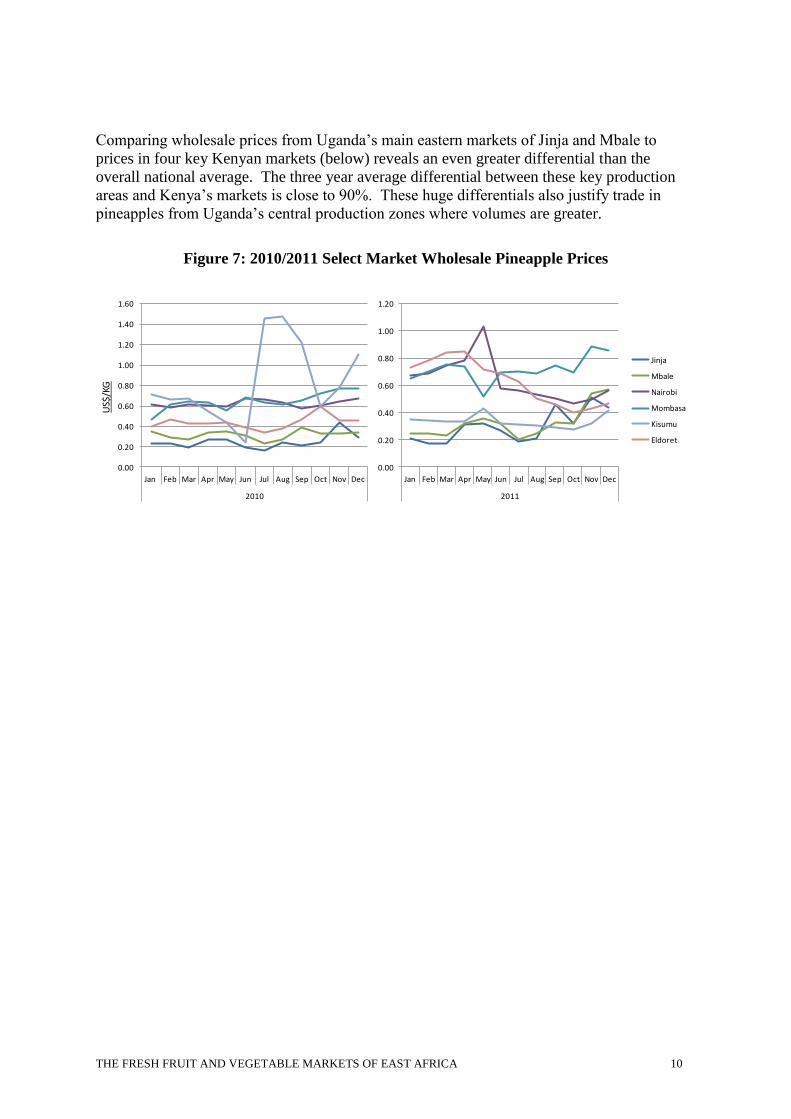
Comparing wholesale prices from Uganda’s main eastern markets of Jinja and Mbale to
prices in four key Kenyan markets (below) reveals an even greater differential than the
overall national average. The three year average differential between these key production
areas and Kenya’s markets is close to 90%. These huge differentials also justify trade in
pineapples from Uganda’s central production zones where volumes are greater.
Figure 7: 2010/2011 Select Market Wholesale Pineapple Prices
US$
/KG
0.00
0.20
0.40
0.60
0.80
1.00
1.20
Jan Feb Mar Apr May Jun Jul Aug Sep Oct Nov Dec
2011
Jinja
Mbale
Nairobi
Mombasa
Kisumu
Eldoret
0.00
0.20
0.40
0.60
0.80
1.00
1.20
1.40
1.60
Jan Feb Mar Apr May Jun Jul Aug Sep Oct Nov Dec
2010
THE FRESH FRUIT AND VEGETABLE MARKETS OF EAST AFRICA 11
Oranges
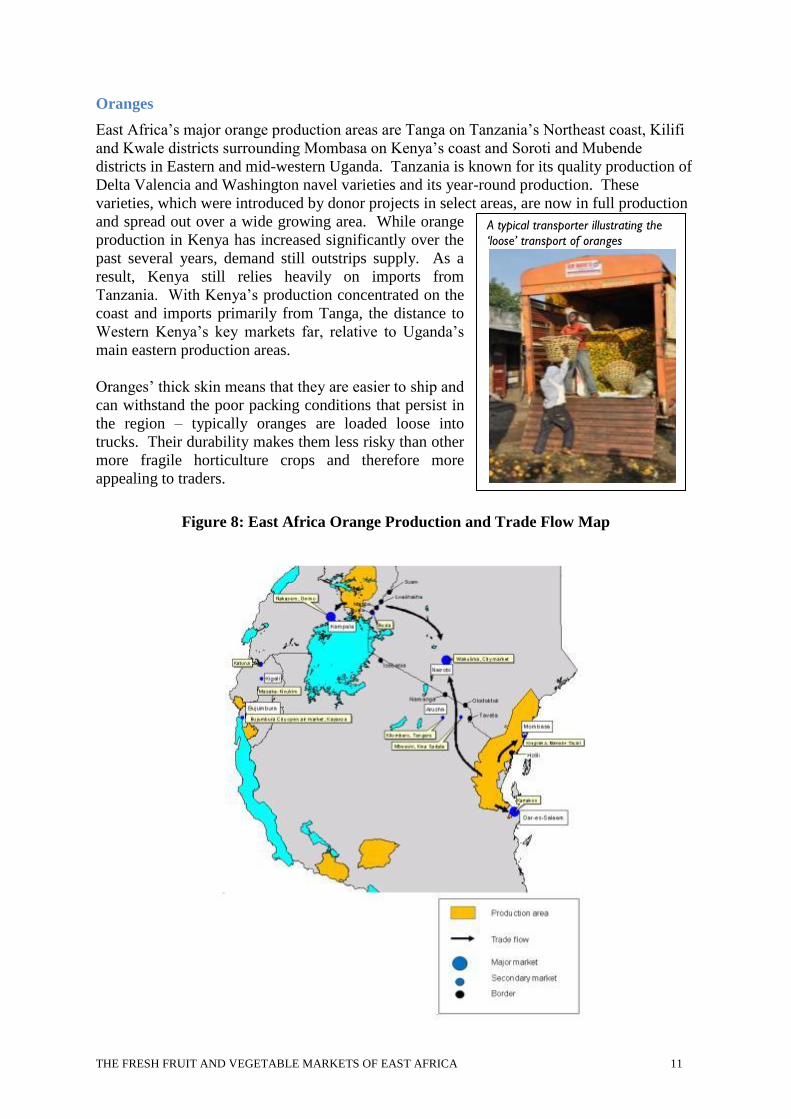
East Africa’s major orange production areas are Tanga on Tanzania’s Northeast coast, Kilifi
and Kwale districts surrounding Mombasa on Kenya’s coast and Soroti and Mubende
districts in Eastern and mid-western Uganda. Tanzania is known for its quality production of
Delta Valencia and Washington navel varieties and its year-round production. These
varieties, which were introduced by donor projects in select areas, are now in full production
and spread out over a wide growing area. While orange
production in Kenya has increased significantly over the
past several years, demand still outstrips supply. As a
result, Kenya still relies heavily on imports from
Tanzania. With Kenya’s production concentrated on the
coast and imports primarily from Tanga, the distance to
Western Kenya’s key markets far, relative to Uganda’s
main eastern production areas.
Oranges’ thick skin means that they are easier to ship and
can withstand the poor packing conditions that persist in
the region – typically oranges are loaded loose into
trucks. Their durability makes them less risky than other
more fragile horticulture crops and therefore more
appealing to traders.
Figure 8: East Africa Orange Production and Trade Flow Map
A typical transporter illustrating the
‘loose’ transport of oranges
THE FRESH FRUIT AND VEGETABLE MARKETS OF EAST AFRICA 12
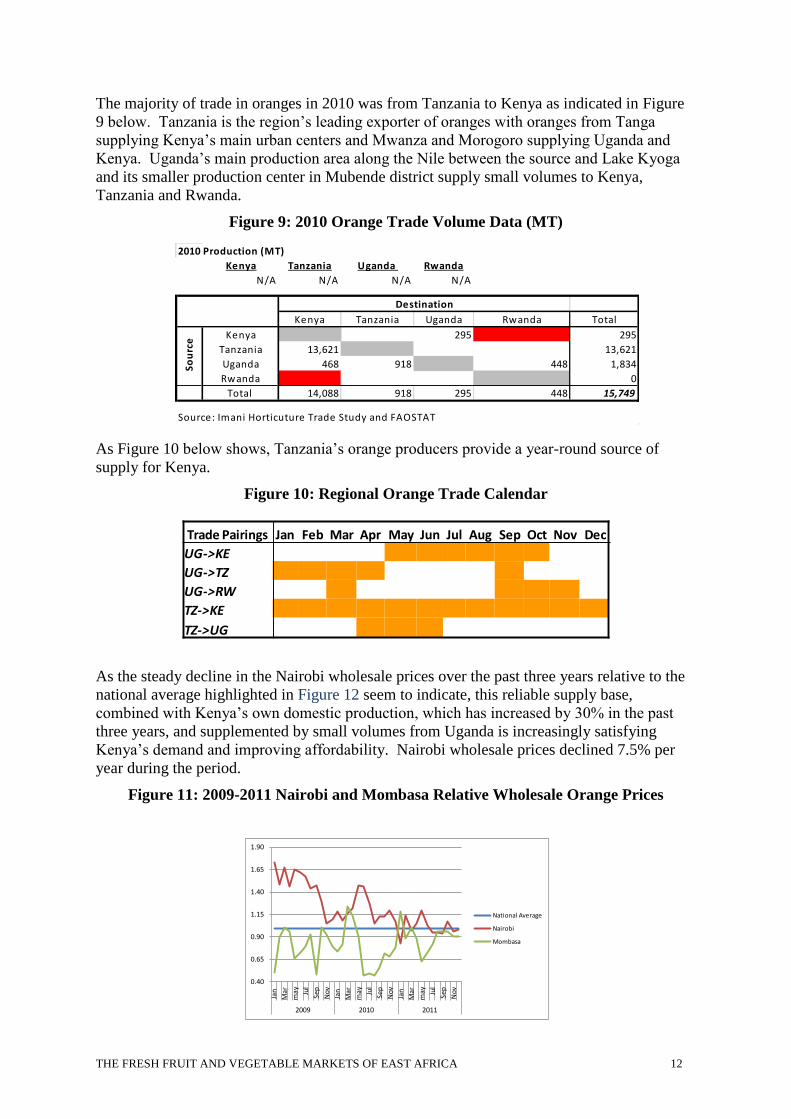
The majority of trade in oranges in 2010 was from Tanzania to Kenya as indicated in Figure
9 below. Tanzania is the region’s leading exporter of oranges with oranges from Tanga
supplying Kenya’s main urban centers and Mwanza and Morogoro supplying Uganda and
Kenya. Uganda’s main production area along the Nile between the source and Lake Kyoga
and its smaller production center in Mubende district supply small volumes to Kenya,
Tanzania and Rwanda.
Figure 9: 2010 Orange Trade Volume Data (MT)
As Figure 10 below shows, Tanzania’s orange producers provide a year-round source of
supply for Kenya.
Figure 10: Regional Orange Trade Calendar
As the steady decline in the Nairobi wholesale prices over the past three years relative to the
national average highlighted in Figure 12 seem to indicate, this reliable supply base,
combined with Kenya’s own domestic production, which has increased by 30% in the past
three years, and supplemented by small volumes from Uganda is increasingly satisfying
Kenya’s demand and improving affordability. Nairobi wholesale prices declined 7.5% per
year during the period.
Figure 11: 2009-2011 Nairobi and Mombasa Relative Wholesale Orange Prices
Trade Pairings Jan Feb Mar Apr May Jun Jul Aug Sep Oct Nov Dec
UG->KE
UG->TZ
UG->RW
TZ->KE
TZ->UG
0.40
0.65
0.90
1.15
1.40
1.65
1.90
Jan
Mar
may Ju
l
Sep
Nov
Jan
Mar
may Ju
l
Sep
Nov
Jan
Mar
may Ju
l
Sep
Nov
2009 2010 2011
National Average
Nairobi
Mombasa
2010 Production (MT)
Kenya Tanzania Uganda Rwanda
N/A N/A N/A N/A
Kenya Tanzania Uganda Rwanda Total
Kenya 295 295
Tanzania 13,621 13,621
Uganda 468 918 448 1,834
Rwanda 0
Total 14,088 918 295 448 15,749
Source: Imani Horticuture Trade Study and FAOSTAT
Destination
So
urc
e
THE FRESH FRUIT AND VEGETABLE MARKETS OF EAST AFRICA 13
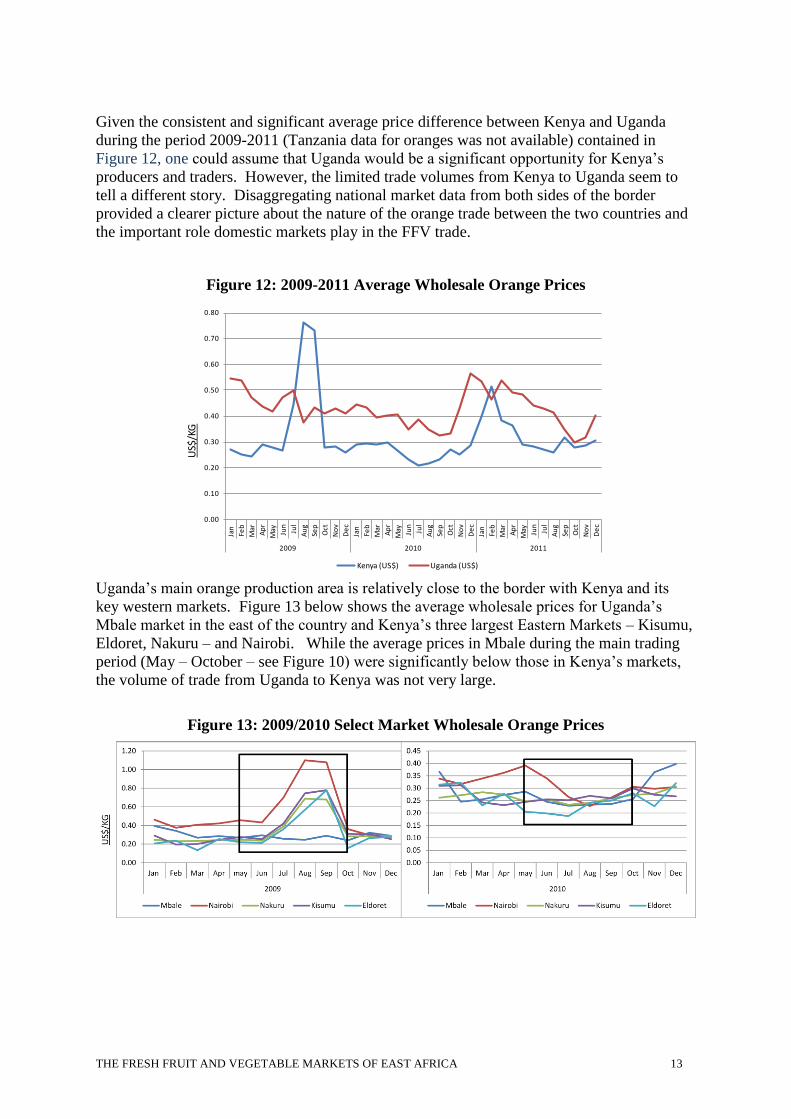
Given the consistent and significant average price difference between Kenya and Uganda
during the period 2009-2011 (Tanzania data for oranges was not available) contained in
Figure 12, one could assume that Uganda would be a significant opportunity for Kenya’s
producers and traders. However, the limited trade volumes from Kenya to Uganda seem to
tell a different story. Disaggregating national market data from both sides of the border
provided a clearer picture about the nature of the orange trade between the two countries and
the important role domestic markets play in the FFV trade.
Figure 12: 2009-2011 Average Wholesale Orange Prices
Uganda’s main orange production area is relatively close to the border with Kenya and its
key western markets. Figure 13 below shows the average wholesale prices for Uganda’s
Mbale market in the east of the country and Kenya’s three largest Eastern Markets – Kisumu,
Eldoret, Nakuru – and Nairobi. While the average prices in Mbale during the main trading
period (May – October – see Figure 10) were significantly below those in Kenya’s markets,
the volume of trade from Uganda to Kenya was not very large.
Figure 13: 2009/2010 Select Market Wholesale Orange Prices
US$
/KG
0.00
0.10
0.20
0.30
0.40
0.50
0.60
0.70
0.80
Jan
Feb
Mar
Ap
r
May Ju
n
Jul
Au
g
Sep
Oct
No
v
De
c
Jan
Feb
Mar
Ap
r
May Ju
n
Jul
Au
g
Sep
Oct
No
v
De
c
Jan
Feb
Mar
Ap
r
May Ju
n
Jul
Au
g
Sep
Oct
No
v
De
c
2009 2010 2011
Kenya (US$) Uganda (US$)
THE FRESH FRUIT AND VEGETABLE MARKETS OF EAST AFRICA 14
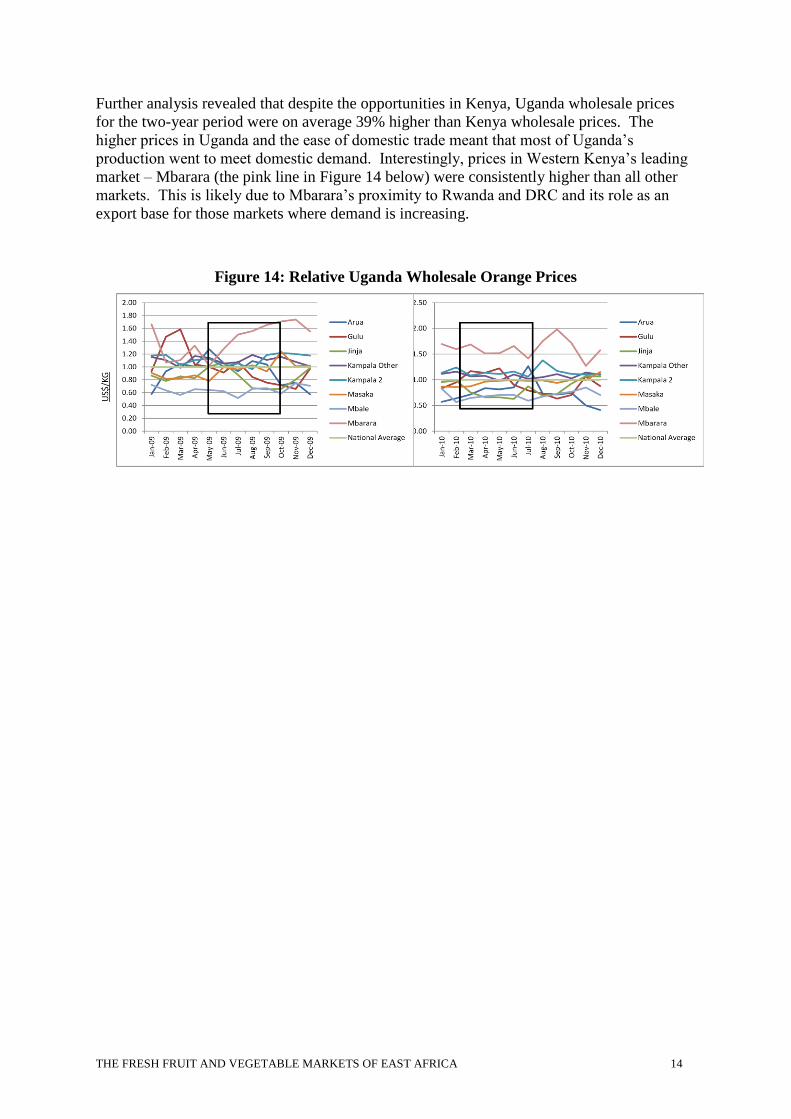
Further analysis revealed that despite the opportunities in Kenya, Uganda wholesale prices
for the two-year period were on average 39% higher than Kenya wholesale prices. The
higher prices in Uganda and the ease of domestic trade meant that most of Uganda’s
production went to meet domestic demand. Interestingly, prices in Western Kenya’s leading
market – Mbarara (the pink line in Figure 14 below) were consistently higher than all other
markets. This is likely due to Mbarara’s proximity to Rwanda and DRC and its role as an
export base for those markets where demand is increasing.
Figure 14: Relative Uganda Wholesale Orange Prices
THE FRESH FRUIT AND VEGETABLE MARKETS OF EAST AFRICA 15
Bananas
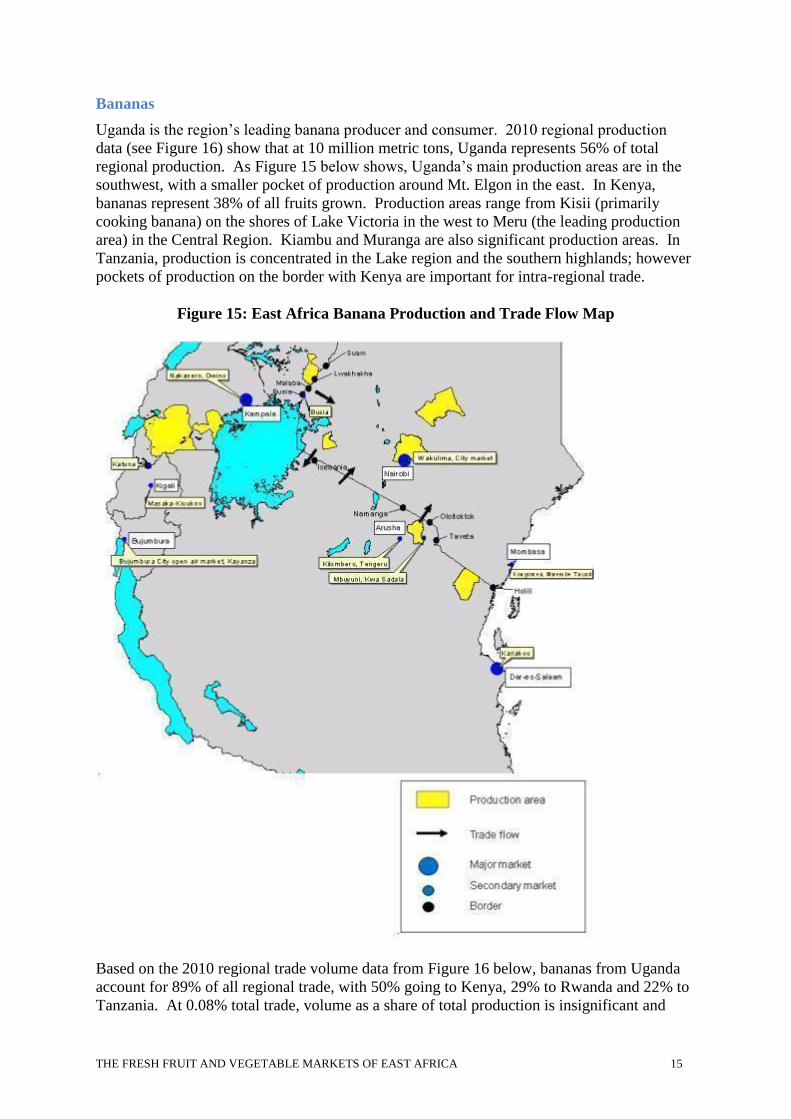
Uganda is the region’s leading banana producer and consumer. 2010 regional production
data (see Figure 16) show that at 10 million metric tons, Uganda represents 56% of total
regional production. As Figure 15 below shows, Uganda’s main production areas are in the
southwest, with a smaller pocket of production around Mt. Elgon in the east. In Kenya,
bananas represent 38% of all fruits grown. Production areas range from Kisii (primarily
cooking banana) on the shores of Lake Victoria in the west to Meru (the leading production
area) in the Central Region. Kiambu and Muranga are also significant production areas. In
Tanzania, production is concentrated in the Lake region and the southern highlands; however
pockets of production on the border with Kenya are important for intra-regional trade.
Figure 15: East Africa Banana Production and Trade Flow Map
Based on the 2010 regional trade volume data from Figure 16 below, bananas from Uganda
account for 89% of all regional trade, with 50% going to Kenya, 29% to Rwanda and 22% to
Tanzania. At 0.08% total trade, volume as a share of total production is insignificant and
THE FRESH FRUIT AND VEGETABLE MARKETS OF EAST AFRICA 16
would indicate that, apart from some opportunistic trade, bananas are primarily a
domestically traded commodity.
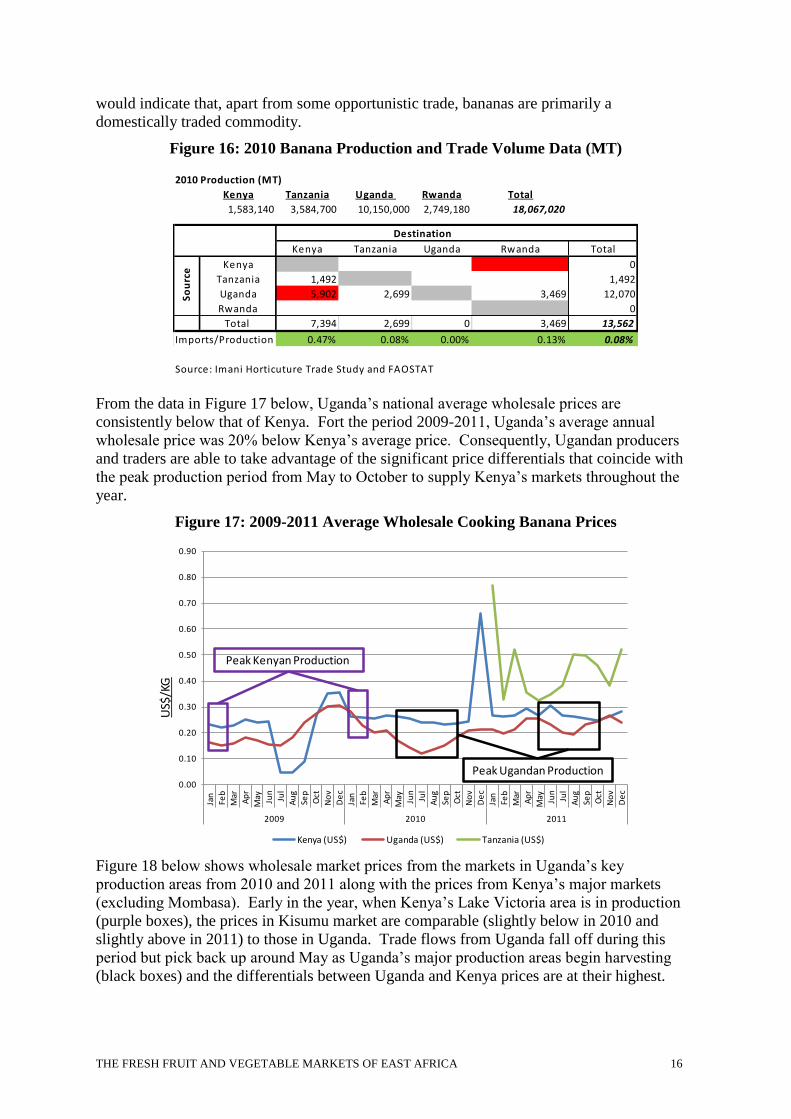
Figure 16: 2010 Banana Production and Trade Volume Data (MT)
From the data in Figure 17 below, Uganda’s national average wholesale prices are
consistently below that of Kenya. Fort the period 2009-2011, Uganda’s average annual
wholesale price was 20% below Kenya’s average price. Consequently, Ugandan producers
and traders are able to take advantage of the significant price differentials that coincide with
the peak production period from May to October to supply Kenya’s markets throughout the
year.
Figure 17: 2009-2011 Average Wholesale Cooking Banana Prices
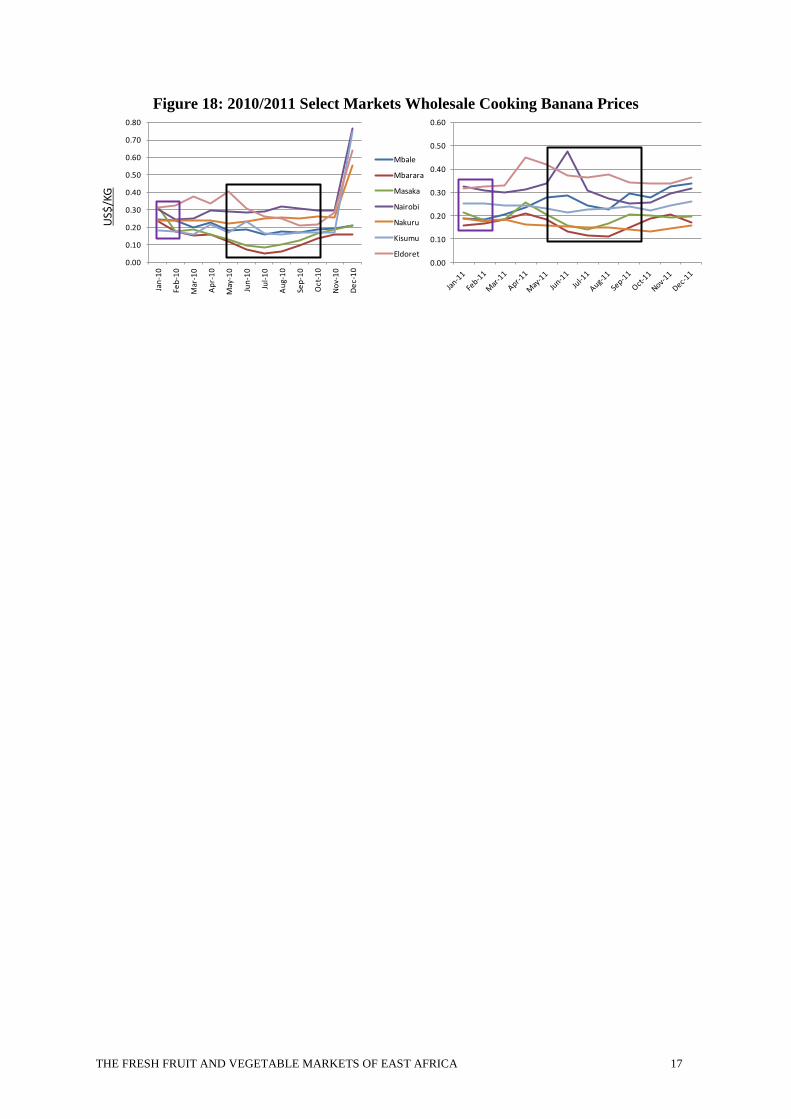
Figure 18 below shows wholesale market prices from the markets in Uganda’s key
production areas from 2010 and 2011 along with the prices from Kenya’s major markets
(excluding Mombasa). Early in the year, when Kenya’s Lake Victoria area is in production
(purple boxes), the prices in Kisumu market are comparable (slightly below in 2010 and
slightly above in 2011) to those in Uganda. Trade flows from Uganda fall off during this
period but pick back up around May as Uganda’s major production areas begin harvesting
(black boxes) and the differentials between Uganda and Kenya prices are at their highest.
0.00
0.10
0.20
0.30
0.40
0.50
0.60
0.70
0.80
0.90
Jan
Feb
Mar
Ap
r
May Ju
n
Jul
Au
g
Sep
Oct
No
v
De
c
Jan
Feb
Mar
Ap
r
May Ju
n
Jul
Au
g
Sep
Oct
No
v
De
c
Jan
Feb
Mar
Ap
r
May Ju
n
Jul
Au
g
Sep
Oct
No
v
De
c
2009 2010 2011
Kenya (US$) Uganda (US$) Tanzania (US$)
US$
/KG
Peak Ugandan Production
Peak Kenyan Production
2010 Production (MT)
Kenya Tanzania Uganda Rwanda Total
1,583,140 3,584,700 10,150,000 2,749,180 18,067,020
Kenya Tanzania Uganda Rwanda Total
Kenya 0
Tanzania 1,492 1,492
Uganda 5,902 2,699 3,469 12,070
Rwanda 0
Total 7,394 2,699 0 3,469 13,562
Imports/Production 0.47% 0.08% 0.00% 0.13% 0.08%
Source: Imani Horticuture Trade Study and FAOSTAT
So
urc
e
Destination
THE FRESH FRUIT AND VEGETABLE MARKETS OF EAST AFRICA 17
Figure 18: 2010/2011 Select Markets Wholesale Cooking Banana Prices
US$
/KG
0.00
0.10
0.20
0.30
0.40
0.50
0.60
0.70
0.80
Jan
-10
Feb
-10
Mar
-10
Ap
r-1
0
May
-10
Jun
-10
Jul-
10
Au
g-1
0
Sep
-10
Oct
-10
No
v-1
0
De
c-1
0
Mbale
Mbarara
Masaka
Nairobi
Nakuru
Kisumu
Eldoret0.00
0.10
0.20
0.30
0.40
0.50
0.60
THE FRESH FRUIT AND VEGETABLE MARKETS OF EAST AFRICA 18
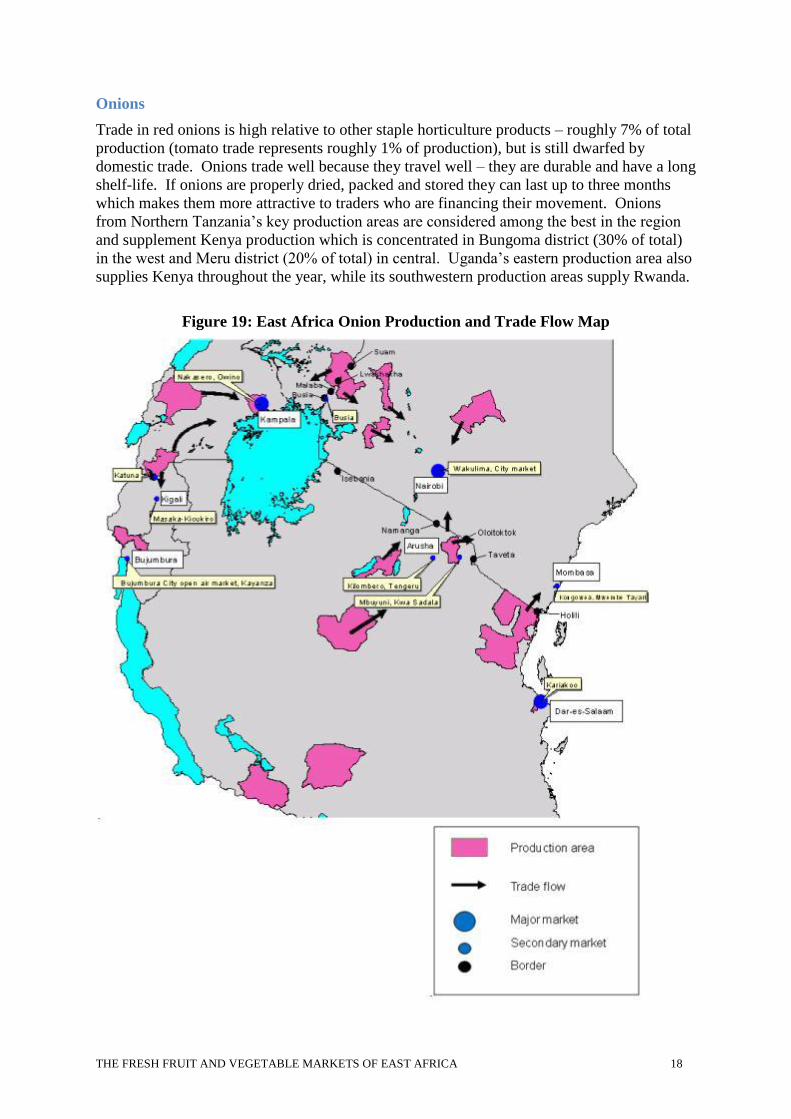
Onions
Trade in red onions is high relative to other staple horticulture products – roughly 7% of total
production (tomato trade represents roughly 1% of production), but is still dwarfed by
domestic trade. Onions trade well because they travel well – they are durable and have a long
shelf-life. If onions are properly dried, packed and stored they can last up to three months
which makes them more attractive to traders who are financing their movement. Onions
from Northern Tanzania’s key production areas are considered among the best in the region
and supplement Kenya production which is concentrated in Bungoma district (30% of total)
in the west and Meru district (20% of total) in central. Uganda’s eastern production area also
supplies Kenya throughout the year, while its southwestern production areas supply Rwanda.
Figure 19: East Africa Onion Production and Trade Flow Map
THE FRESH FRUIT AND VEGETABLE MARKETS OF EAST AFRICA 19
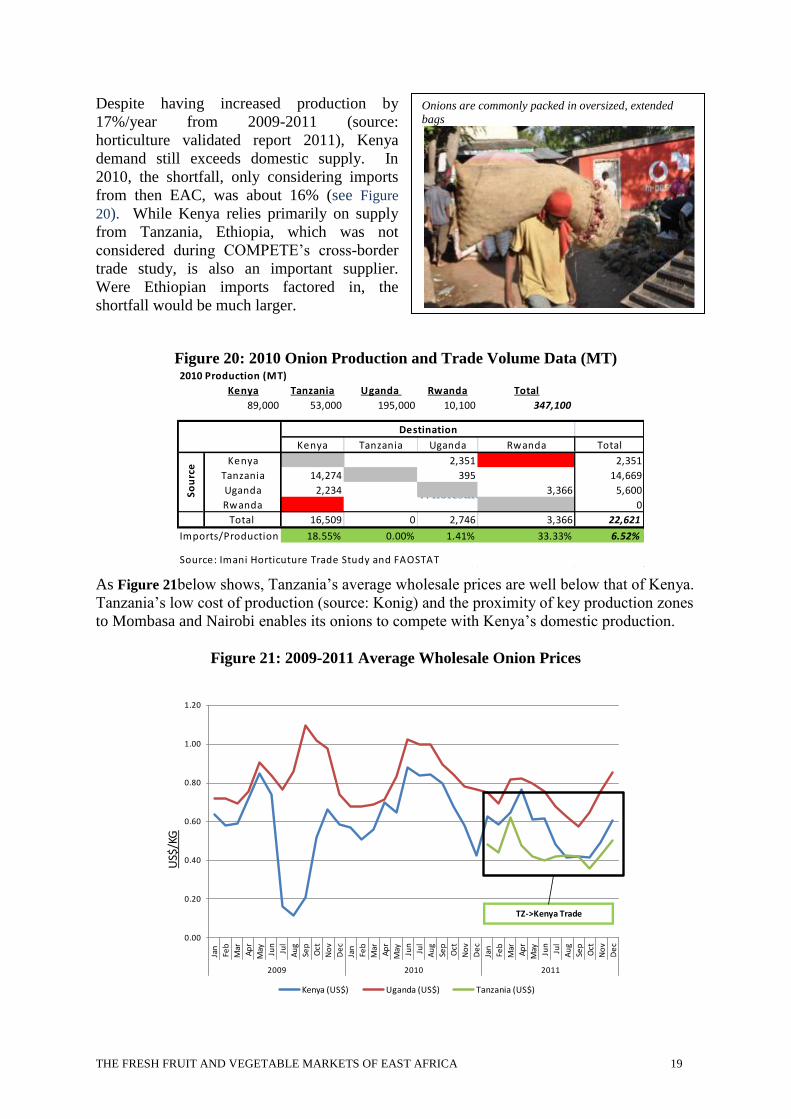
Onions are commonly packed in oversized, extended
bags
Despite having increased production by
17%/year from 2009-2011 (source:
horticulture validated report 2011), Kenya
demand still exceeds domestic supply. In
2010, the shortfall, only considering imports
from then EAC, was about 16% (see Figure
20). While Kenya relies primarily on supply
from Tanzania, Ethiopia, which was not
considered during COMPETE’s cross-border
trade study, is also an important supplier.
Were Ethiopian imports factored in, the
shortfall would be much larger.
Figure 20: 2010 Onion Production and Trade Volume Data (MT)
Figure 21: 2009-2011 Average Wholesale Onion Prices
As Figure 21below shows, Tanzania’s average wholesale prices are well below that of Kenya.
Tanzania’s low cost of production (source: Konig) and the proximity of key production zones
to Mombasa and Nairobi enables its onions to compete with Kenya’s domestic production.
Figure 21: 2009-2011 Average Wholesale Onion Prices
US$
/KG
0.00
0.20
0.40
0.60
0.80
1.00
1.20
Jan
Feb
Mar
Ap
r
May Ju
n
Jul
Au
g
Sep
Oct
No
v
De
c
Jan
Feb
Mar
Ap
r
May Ju
n
Jul
Au
g
Sep
Oct
No
v
De
c
Jan
Feb
Mar
Ap
r
May Ju
n
Jul
Au
g
Sep
Oct
No
v
De
c
2009 2010 2011
Kenya (US$) Uganda (US$) Tanzania (US$)
TZ->Kenya Trade
2010 Production (MT)
Kenya Tanzania Uganda Rwanda Total
89,000 53,000 195,000 10,100 347,100
Kenya Tanzania Uganda Rwanda Total
Kenya 2,351 2,351
Tanzania 14,274 395 14,669
Uganda 2,234 3,366 5,600
Rwanda 0
Total 16,509 0 2,746 3,366 22,621
Imports/Production 18.55% 0.00% 1.41% 33.33% 6.52%
Source: Imani Horticuture Trade Study and FAOSTAT
Destination
So
urc
e
THE FRESH FRUIT AND VEGETABLE MARKETS OF EAST AFRICA 20
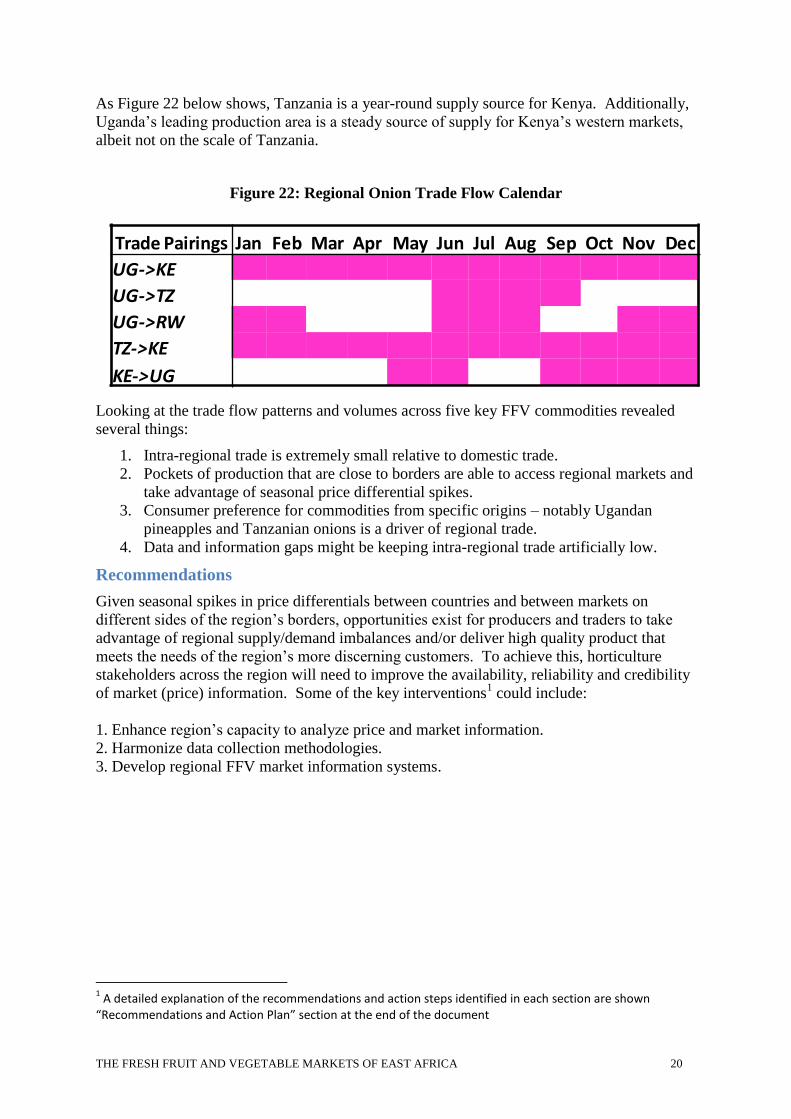
As Figure 22 below shows, Tanzania is a year-round supply source for Kenya. Additionally,
Uganda’s leading production area is a steady source of supply for Kenya’s western markets,
albeit not on the scale of Tanzania.
Figure 22: Regional Onion Trade Flow Calendar
Looking at the trade flow patterns and volumes across five key FFV commodities revealed
several things:
1. Intra-regional trade is extremely small relative to domestic trade.
2. Pockets of production that are close to borders are able to access regional markets and
take advantage of seasonal price differential spikes.
3. Consumer preference for commodities from specific origins – notably Ugandan
pineapples and Tanzanian onions is a driver of regional trade.
4. Data and information gaps might be keeping intra-regional trade artificially low.
Recommendations
Given seasonal spikes in price differentials between countries and between markets on
different sides of the region’s borders, opportunities exist for producers and traders to take
advantage of regional supply/demand imbalances and/or deliver high quality product that
meets the needs of the region’s more discerning customers. To achieve this, horticulture
stakeholders across the region will need to improve the availability, reliability and credibility
of market (price) information. Some of the key interventions1 could include:
1. Enhance region’s capacity to analyze price and market information.
2. Harmonize data collection methodologies.
3. Develop regional FFV market information systems.
1 A detailed explanation of the recommendations and action steps identified in each section are shown
“Recommendations and Action Plan” section at the end of the document
Trade Pairings Jan Feb Mar Apr May Jun Jul Aug Sep Oct Nov Dec
UG->KE
UG->TZ
UG->RW
TZ->KE
KE->UG
THE FRESH FRUIT AND VEGETABLE MARKETS OF EAST AFRICA 21
COMPETE interview with the market
manager in Mwanza, Tanzania
Understanding the Value Chains
While the range and geographical spread of FFVs across the East African region is wide,
year- round availability is sporadic, knowledge of demand and supply opportunities is
lacking, and storage and logistics are not well organized. The FFV business is considered
high risk and volatile. Post harvest losses are high and many rural communities are missing
out on the opportunity to consume fresh produce. As discussed in the previous section,
existing trade is highly seasonal, most crops are extremely perishable with relatively short
shelf –life and prices are volatile.
EATH conducted an assessment of the major value chain actors in selected FFV value chains
to supplement secondary data collected through desk research. The focus was on providing
near-term, actionable recommendations that can improve efficiency along FFV value chains.
Below is a discussion of key finding revealed through field research.
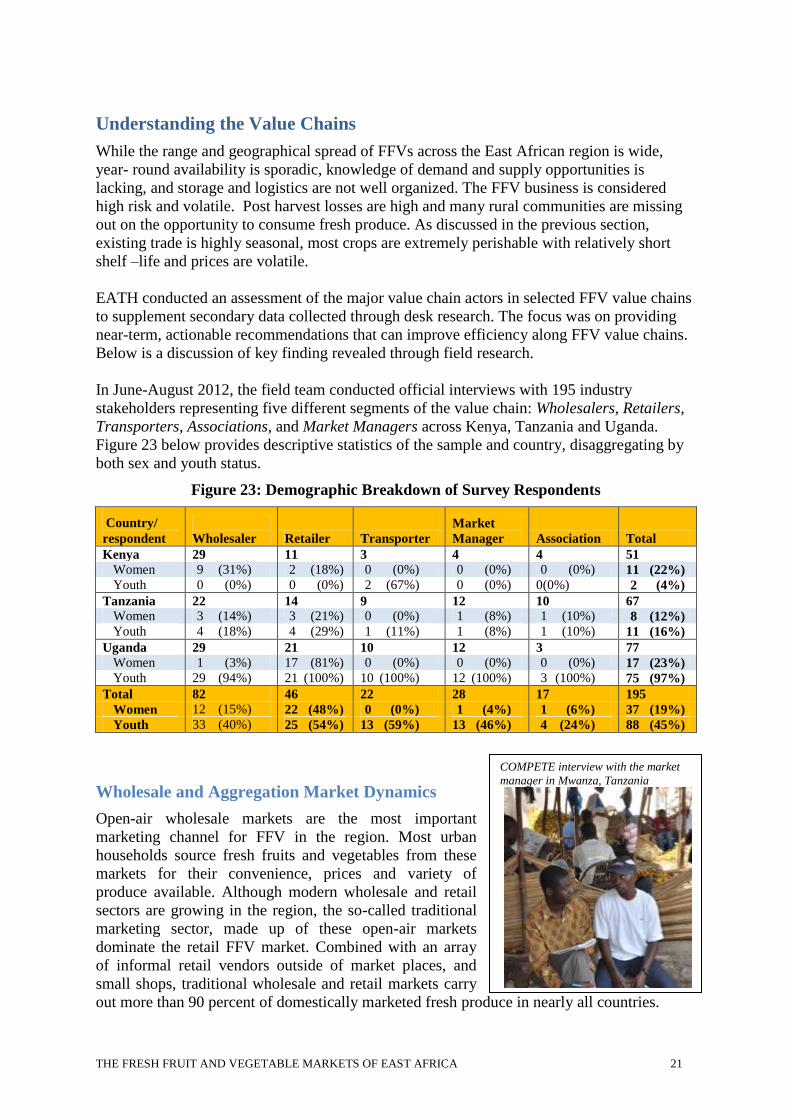
In June-August 2012, the field team conducted official interviews with 195 industry
stakeholders representing five different segments of the value chain: Wholesalers, Retailers,
Transporters, Associations, and Market Managers across Kenya, Tanzania and Uganda.
Figure 23 below provides descriptive statistics of the sample and country, disaggregating by
both sex and youth status.
Figure 23: Demographic Breakdown of Survey Respondents
Country/
respondent
Wholesaler Retailer Transporter
Market
Manager Association Total
Kenya 29 11 3 4 4 51
Women 9 (31%) 2 (18%) 0 (0%) 0 (0%) 0 (0%) 11 (22%)
Youth 0 (0%) 0 (0%) 2 (67%) 0 (0%) 0(0%) 2 (4%)
Tanzania 22 14 9 12 10 67
Women 3 (14%) 3 (21%) 0 (0%) 1 (8%) 1 (10%) 8 (12%)
Youth 4 (18%) 4 (29%) 1 (11%) 1 (8%) 1 (10%) 11 (16%)
Uganda 29 21 10 12 3 77
Women 1 (3%) 17 (81%) 0 (0%) 0 (0%) 0 (0%) 17 (23%)
Youth 29 (94%) 21 (100%) 10 (100%) 12 (100%) 3 (100%) 75 (97%)
Total 82 46 22 28 17 195
Women 12 (15%) 22 (48%) 0 (0%) 1 (4%) 1 (6%) 37 (19%)
Youth 33 (40%) 25 (54%) 13 (59%) 13 (46%) 4 (24%) 88 (45%)
Wholesale and Aggregation Market Dynamics
Open-air wholesale markets are the most important
marketing channel for FFV in the region. Most urban
households source fresh fruits and vegetables from these
markets for their convenience, prices and variety of
produce available. Although modern wholesale and retail
sectors are growing in the region, the so-called traditional
marketing sector, made up of these open-air markets
dominate the retail FFV market. Combined with an array
of informal retail vendors outside of market places, and
small shops, traditional wholesale and retail markets carry
out more than 90 percent of domestically marketed fresh produce in nearly all countries.
THE FRESH FRUIT AND VEGETABLE MARKETS OF EAST AFRICA 22
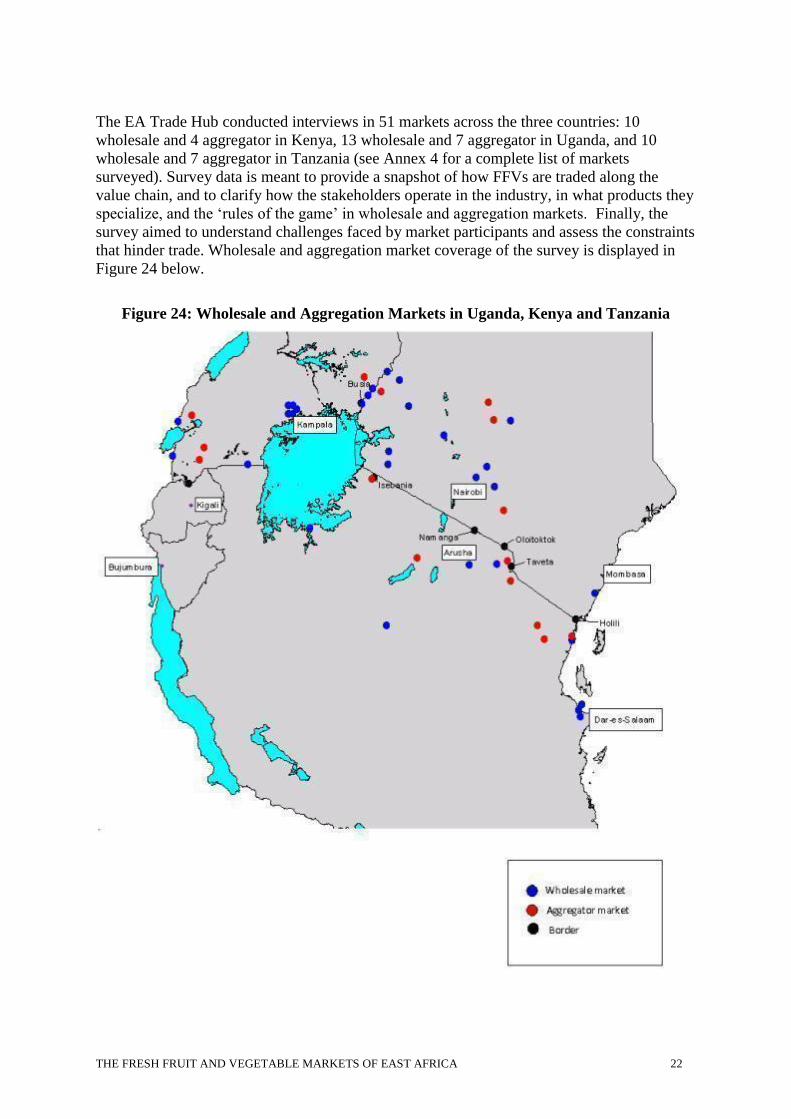
The EA Trade Hub conducted interviews in 51 markets across the three countries: 10
wholesale and 4 aggregator in Kenya, 13 wholesale and 7 aggregator in Uganda, and 10
wholesale and 7 aggregator in Tanzania (see Annex 4 for a complete list of markets
surveyed). Survey data is meant to provide a snapshot of how FFVs are traded along the
value chain, and to clarify how the stakeholders operate in the industry, in what products they
specialize, and the ‘rules of the game’ in wholesale and aggregation markets. Finally, the
survey aimed to understand challenges faced by market participants and assess the constraints
that hinder trade. Wholesale and aggregation market coverage of the survey is displayed in
Figure 24 below.
Figure 24: Wholesale and Aggregation Markets in Uganda, Kenya and Tanzania
THE FRESH FRUIT AND VEGETABLE MARKETS OF EAST AFRICA 23
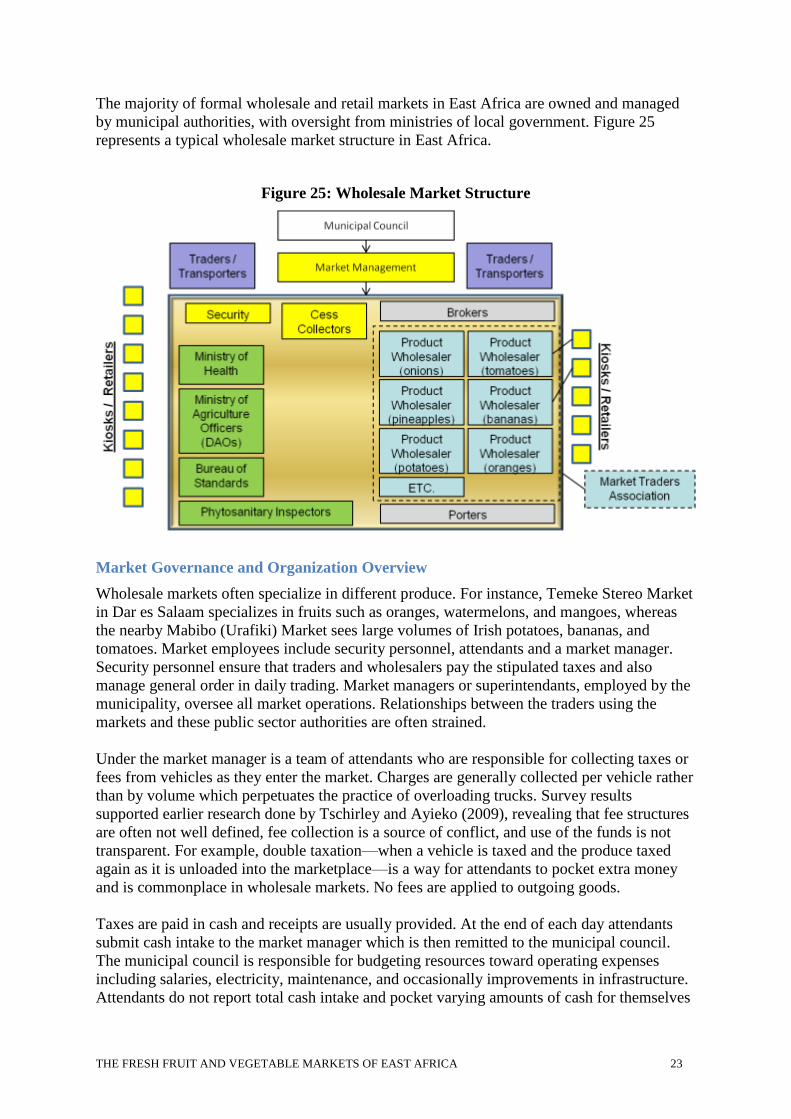
The majority of formal wholesale and retail markets in East Africa are owned and managed
by municipal authorities, with oversight from ministries of local government. Figure 25
represents a typical wholesale market structure in East Africa.
Figure 25: Wholesale Market Structure
Market Governance and Organization Overview
Wholesale markets often specialize in different produce. For instance, Temeke Stereo Market
in Dar es Salaam specializes in fruits such as oranges, watermelons, and mangoes, whereas
the nearby Mabibo (Urafiki) Market sees large volumes of Irish potatoes, bananas, and
tomatoes. Market employees include security personnel, attendants and a market manager.
Security personnel ensure that traders and wholesalers pay the stipulated taxes and also
manage general order in daily trading. Market managers or superintendants, employed by the
municipality, oversee all market operations. Relationships between the traders using the
markets and these public sector authorities are often strained.
Under the market manager is a team of attendants who are responsible for collecting taxes or
fees from vehicles as they enter the market. Charges are generally collected per vehicle rather
than by volume which perpetuates the practice of overloading trucks. Survey results
supported earlier research done by Tschirley and Ayieko (2009), revealing that fee structures
are often not well defined, fee collection is a source of conflict, and use of the funds is not
transparent. For example, double taxation—when a vehicle is taxed and the produce taxed
again as it is unloaded into the marketplace—is a way for attendants to pocket extra money
and is commonplace in wholesale markets. No fees are applied to outgoing goods.
Taxes are paid in cash and receipts are usually provided. At the end of each day attendants
submit cash intake to the market manager which is then remitted to the municipal council.
The municipal council is responsible for budgeting resources toward operating expenses
including salaries, electricity, maintenance, and occasionally improvements in infrastructure.
Attendants do not report total cash intake and pocket varying amounts of cash for themselves
THE FRESH FRUIT AND VEGETABLE MARKETS OF EAST AFRICA 24
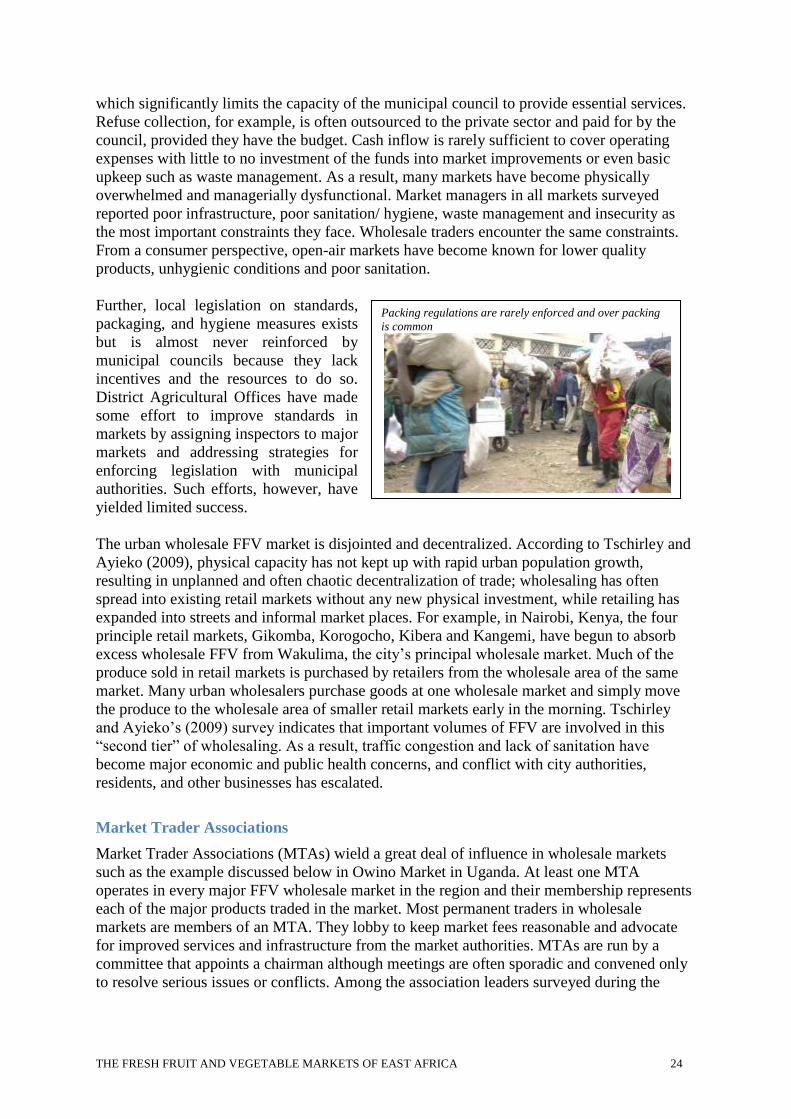
Packing regulations are rarely enforced and over packing
is common
which significantly limits the capacity of the municipal council to provide essential services.
Refuse collection, for example, is often outsourced to the private sector and paid for by the
council, provided they have the budget. Cash inflow is rarely sufficient to cover operating
expenses with little to no investment of the funds into market improvements or even basic
upkeep such as waste management. As a result, many markets have become physically
overwhelmed and managerially dysfunctional. Market managers in all markets surveyed
reported poor infrastructure, poor sanitation/ hygiene, waste management and insecurity as
the most important constraints they face. Wholesale traders encounter the same constraints.
From a consumer perspective, open-air markets have become known for lower quality
products, unhygienic conditions and poor sanitation.
Further, local legislation on standards,
packaging, and hygiene measures exists
but is almost never reinforced by
municipal councils because they lack
incentives and the resources to do so.
District Agricultural Offices have made
some effort to improve standards in
markets by assigning inspectors to major
markets and addressing strategies for
enforcing legislation with municipal
authorities. Such efforts, however, have
yielded limited success.
The urban wholesale FFV market is disjointed and decentralized. According to Tschirley and
Ayieko (2009), physical capacity has not kept up with rapid urban population growth,
resulting in unplanned and often chaotic decentralization of trade; wholesaling has often
spread into existing retail markets without any new physical investment, while retailing has
expanded into streets and informal market places. For example, in Nairobi, Kenya, the four
principle retail markets, Gikomba, Korogocho, Kibera and Kangemi, have begun to absorb
excess wholesale FFV from Wakulima, the city’s principal wholesale market. Much of the
produce sold in retail markets is purchased by retailers from the wholesale area of the same
market. Many urban wholesalers purchase goods at one wholesale market and simply move
the produce to the wholesale area of smaller retail markets early in the morning. Tschirley
and Ayieko’s (2009) survey indicates that important volumes of FFV are involved in this
“second tier” of wholesaling. As a result, traffic congestion and lack of sanitation have
become major economic and public health concerns, and conflict with city authorities,
residents, and other businesses has escalated.
Market Trader Associations
Market Trader Associations (MTAs) wield a great deal of influence in wholesale markets
such as the example discussed below in Owino Market in Uganda. At least one MTA
operates in every major FFV wholesale market in the region and their membership represents
each of the major products traded in the market. Most permanent traders in wholesale
markets are members of an MTA. They lobby to keep market fees reasonable and advocate
for improved services and infrastructure from the market authorities. MTAs are run by a
committee that appoints a chairman although meetings are often sporadic and convened only
to resolve serious issues or conflicts. Among the association leaders surveyed during the
THE FRESH FRUIT AND VEGETABLE MARKETS OF EAST AFRICA 25
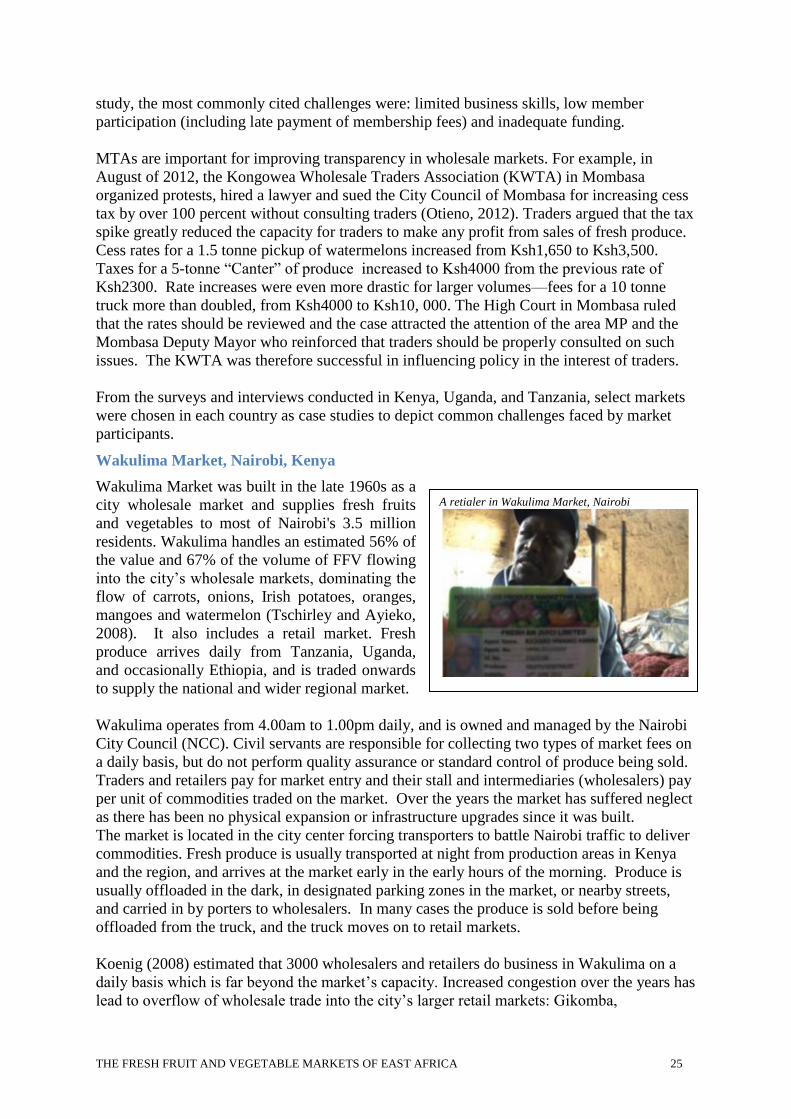
A retialer in Wakulima Market, Nairobi
study, the most commonly cited challenges were: limited business skills, low member
participation (including late payment of membership fees) and inadequate funding.
MTAs are important for improving transparency in wholesale markets. For example, in
August of 2012, the Kongowea Wholesale Traders Association (KWTA) in Mombasa
organized protests, hired a lawyer and sued the City Council of Mombasa for increasing cess
tax by over 100 percent without consulting traders (Otieno, 2012). Traders argued that the tax
spike greatly reduced the capacity for traders to make any profit from sales of fresh produce.
Cess rates for a 1.5 tonne pickup of watermelons increased from Ksh1,650 to Ksh3,500.
Taxes for a 5-tonne “Canter” of produce increased to Ksh4000 from the previous rate of
Ksh2300. Rate increases were even more drastic for larger volumes—fees for a 10 tonne
truck more than doubled, from Ksh4000 to Ksh10, 000. The High Court in Mombasa ruled
that the rates should be reviewed and the case attracted the attention of the area MP and the
Mombasa Deputy Mayor who reinforced that traders should be properly consulted on such
issues. The KWTA was therefore successful in influencing policy in the interest of traders.
From the surveys and interviews conducted in Kenya, Uganda, and Tanzania, select markets
were chosen in each country as case studies to depict common challenges faced by market
participants.
Wakulima Market, Nairobi, Kenya
Wakulima Market was built in the late 1960s as a
city wholesale market and supplies fresh fruits
and vegetables to most of Nairobi's 3.5 million
residents. Wakulima handles an estimated 56% of
the value and 67% of the volume of FFV flowing
into the city’s wholesale markets, dominating the
flow of carrots, onions, Irish potatoes, oranges,
mangoes and watermelon (Tschirley and Ayieko,
2008). It also includes a retail market. Fresh
produce arrives daily from Tanzania, Uganda,
and occasionally Ethiopia, and is traded onwards
to supply the national and wider regional market.
Wakulima operates from 4.00am to 1.00pm daily, and is owned and managed by the Nairobi
City Council (NCC). Civil servants are responsible for collecting two types of market fees on
a daily basis, but do not perform quality assurance or standard control of produce being sold.
Traders and retailers pay for market entry and their stall and intermediaries (wholesalers) pay
per unit of commodities traded on the market. Over the years the market has suffered neglect
as there has been no physical expansion or infrastructure upgrades since it was built.
The market is located in the city center forcing transporters to battle Nairobi traffic to deliver
commodities. Fresh produce is usually transported at night from production areas in Kenya
and the region, and arrives at the market early in the early hours of the morning. Produce is
usually offloaded in the dark, in designated parking zones in the market, or nearby streets,
and carried in by porters to wholesalers. In many cases the produce is sold before being
offloaded from the truck, and the truck moves on to retail markets.
Koenig (2008) estimated that 3000 wholesalers and retailers do business in Wakulima on a
daily basis which is far beyond the market’s capacity. Increased congestion over the years has
lead to overflow of wholesale trade into the city’s larger retail markets: Gikomba,
THE FRESH FRUIT AND VEGETABLE MARKETS OF EAST AFRICA 26
Korogocho, Kibera and Kangemi. These markets have little to no infrastructure or facilities.
Much of the wholesale trade taking place in these markets is illegal and without a license
from the NCC (Koenig, 2008). For example, wholesale traders at Gikomba Market can only
trade between 4am and 8am. After 8am, the market is used exclusively for retail activities.
Kongowea Wholesale Market, Mombasa, Kenya
Kongowea is one of the largest wholesale markets in East and Central Africa where an
estimated 15,000 people buy and sell FFV, dried fish, poultry and other foodstuffs each day.
According to one study (Onduru, 2008), the market receives between 70 and 120 truckloads
of agriculture produce each day during its busiest months (July-September; January-
February). The market opens at 5am and closes at 2pm for cleaning and garbage removal.
Kongowea is a municipal market with a similar governance structure to Wakulima. Built with
German funding, the market has a perimeter fence, considerable covering and storage
facilities for cereals and other non-perishable commodities. It is managed by the Municipal
Council of Mombasa under the Ministry of Local Government. Market fees are collected
from trucks outside the gate before goods and produce are allowed on the premises.
Wholesale trade of FFV occurs in both covered and uncovered sections of the market.
Although, the market is meant to be exclusively for wholesale trade, some retailers and
hawkers trade on the premise, which has lead to confrontation between wholesale traders and
the market management (Onduru, 2008).
The municipal council is responsible for sanitation and hygiene in the market. Municipal staff
is charged with garbage removal and cleaning daily, although traders are expected to
maintain a certain level of cleanliness. Municipal council staff has had difficulty managing
the volume of garbage generated daily and sanitation and hygiene remain persistent
problems. In 2005, traders organized a mass protest against the Council and its failure to
ensure garbage removal services and maintain acceptable levels of sanitation in the market’s
toilets. The protests had some impact as the Council has taken steps to improve hygiene,
although it remains a major constraint to traders and market staff (Onduru, 2008). Traders we
interviewed in Kongowea cited the lack of proper storage and poor sanitation as the most
important constraints they face.
Kilombero Wholesale Market, Arusha, Tanzania
FFV as well as grains and rice are traded in the Kilombero market. The market was a
publically owned open-air market until 2007 when the SACCOS Trader Association took
over management of the market and invested in the market’s infrastructure. Today, the
Arusha Municipality Council maintains ownership of the land only. The Trader Association,
created in 1999 regulates market access and collects fees depending on how much each trader
sells. The municipality is responsible for cleaning and upkeep and security. Traders have
formed sub-groups according to crop and elect representatives for each crop division. These
groups meet regularly to discuss important issues and challenges. (Koenig, 2008) According
to Koenig, (2008) the major problems traders face in Kilombero are insecurity and space. At
the time of the study, the market did not have security lights and the market for onions was
congested and overcrowded.
Kilombero is one of the most important markets for onions in Northern Tanzania with
volumes traded between 120 and 220 MT/day during high season (between 24 and 67.5
MT/day during the low season). Most of the onions come from Karatu district and are sold to
Tanzanian and Kenyan traders. An estimated 80 to 100 MT/month are transported to Kenya
for sale (Koenig, 2008).
THE FRESH FRUIT AND VEGETABLE MARKETS OF EAST AFRICA 27
Other markets managed by MTAs include Mgandini, Lushoto, (Tanga region), Ukombozi
(Singida). Finally, the largest market in Dar es Salaam, Mabibo Market, is entirely managed
and owned by the MTA; even the market’s infrastructure was financed and built by the
association. It is one of the better organized FFV wholesale markets in the region. Although it
appears that markets run by MTAs are more efficiently managed, it was unclear from
stakeholder interviews what, if any, downsides exist to this model. A more in-depth
assessment of MTA market governance would be useful in comparing various governance
structures.
Owino Market, Kampala, Uganda
The largest wholesale market in Uganda and one of the largest markets in East Africa, Owino
was built in the 1970’s for a few hundred vendors and had over 5000 vendors and 30,000
employees by the early 1990s. Today, buyers, traders and transporters compete for space, the
majority of walkways are uncovered and sewage and rain water run through open drains.
Informal evening markets began to expand in the streets surrounding Owino, creating
competition to the traders who operated formally within the market and during its operating
hours. Market officials commonly charge illegal fees and bribes for allowing these evening
markets to operate.
Traders and vendors pay considerable fees in order to do business in Owino. Venders in the
market often rent space from stall owners who own several spaces. Vendors pay rental fees,
contract with transporters and security firms, pay fees to market authorities and the Market
Vendor’s Association (MVA). The MVA plays a large role in market organization and
governance in Owino and is the largest stakeholder organization in Owino (Freedman, 2000).
The association is comprised of dozens of committees formed by type of merchandize and
market zoning and general oversight. Larger committees meet to discuss waste disposal,
market fees, administrative practices, security, market plans and transport. Smaller
committees meet to hear a wide range of disputes, resolving some of them and transferring
others to higher-level committees. High-level, central committees address issues like market
redevelopment plans, security and corruption linked to the evening market.
Nakasero market, Kampala, Uganda
After Owino, it is the second largest FFV wholesale market in Uganda, and also a regional
market, since mangoes come in from Kenya, onions from Tanzania, and product is
transported up to Juba from here. It was built in 1934 by the colonial administration as
Kampala’s main produce market, and the infrastructure has not been updated for the last 59
years, despite the huge increase in trade going through it.
Aggregation Markets
Aggregation markets serve as collection points for farmers and brokers to bring produce for
onward transport to sale in larger urban markets, as well as local retail trade. Wholesale
markets are supplied by local production zones in addition to aggregation markets.
Aggregation markets are rural produce collection points located near major highways,
junctions and central road networks. They are generally located in uncovered, open spaces
with plenty of space for grading, sorting and re-packing. Some are close to major cross-
border trading routes. For example, in Emali, Kenya, Tanzanian trucks bring onions to a
THE FRESH FRUIT AND VEGETABLE MARKETS OF EAST AFRICA 28
central point on the Mombasa highway. From there, product moves east to the large
Kongowea market in Mombasa, or northwest to Wakulima market in Nairobi. According to
Tschirley and Ayieko (2008), nearly 80 percent of all produce in Kenya moving off the farm
is assembled by assemblers/ intermediaries in rural areas who then transport the produce to
urban wholesale markets.
In general, aggregation in rural areas is rather dispersed with most of the produce flowing
through informal assembly markets. Some aggregation markets are under the jurisdiction of
municipal councils and others are the result of ad hoc rural assembly points. Most trading at
aggregation markets is informal; brokers phone their counterparts in wholesale markets early
in the morning to determine and set price structures. Some intermediary/ wholesalers visit
farms directly, aggregating produce by the truckload for forward shipment to wholesale
markets. The volume of produce that bypasses aggregation markets can be considerable. In
Kenya, an estimated one-fifth of all produce coming off farms flows directly to retail traders
in the capital city (Tschirley and Ayieko, 2008).
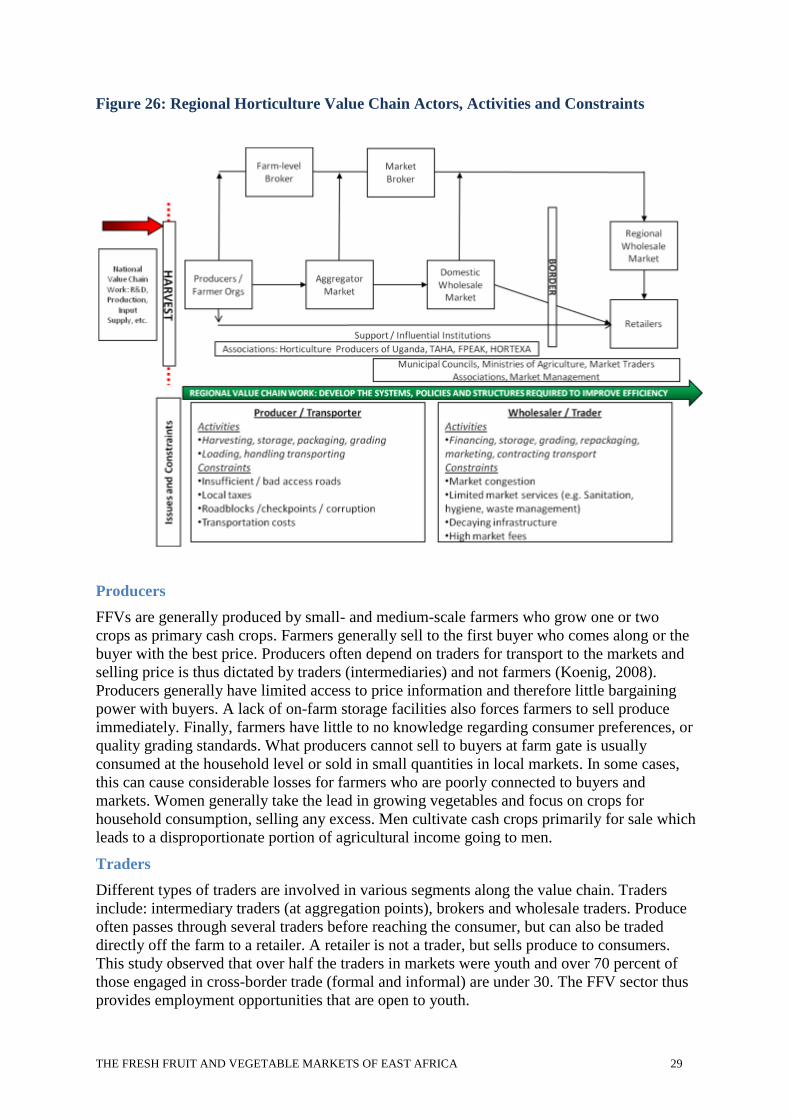
Value Chain Actors, Activities and Constraints
Below is a map of the FFV value chain actors, activities and constraints. Relationships
between actors are informal, based on family ties and friendships and a very low level of
coordination exists between actors within and across different segments of the value chain.
Relations between value chain actors are usually spot-market. For the purpose of this study,
we use definitions and terminology borrowed from Koenig et al. (2008) combined with data
collected from markets surveyed. Male traders dominate the more profitable wholesale
segment of the horticulture value chain compared to farming and retailing which consist
mainly of women and youth.
THE FRESH FRUIT AND VEGETABLE MARKETS OF EAST AFRICA 29
Figure 26: Regional Horticulture Value Chain Actors, Activities and Constraints
Producers
FFVs are generally produced by small- and medium-scale farmers who grow one or two
crops as primary cash crops. Farmers generally sell to the first buyer who comes along or the
buyer with the best price. Producers often depend on traders for transport to the markets and
selling price is thus dictated by traders (intermediaries) and not farmers (Koenig, 2008).
Producers generally have limited access to price information and therefore little bargaining
power with buyers. A lack of on-farm storage facilities also forces farmers to sell produce
immediately. Finally, farmers have little to no knowledge regarding consumer preferences, or
quality grading standards. What producers cannot sell to buyers at farm gate is usually
consumed at the household level or sold in small quantities in local markets. In some cases,
this can cause considerable losses for farmers who are poorly connected to buyers and
markets. Women generally take the lead in growing vegetables and focus on crops for
household consumption, selling any excess. Men cultivate cash crops primarily for sale which
leads to a disproportionate portion of agricultural income going to men.
Traders
Different types of traders are involved in various segments along the value chain. Traders
include: intermediary traders (at aggregation points), brokers and wholesale traders. Produce
often passes through several traders before reaching the consumer, but can also be traded
directly off the farm to a retailer. A retailer is not a trader, but sells produce to consumers.
This study observed that over half the traders in markets were youth and over 70 percent of
those engaged in cross-border trade (formal and informal) are under 30. The FFV sector thus
provides employment opportunities that are open to youth.
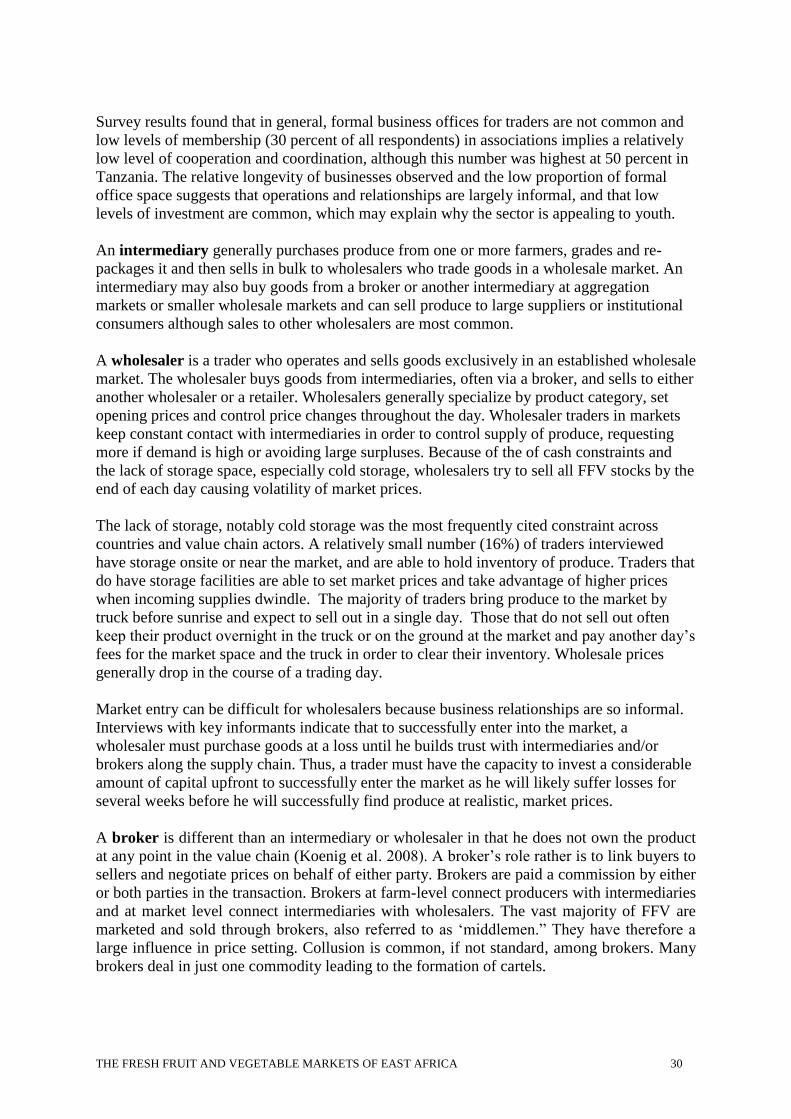
THE FRESH FRUIT AND VEGETABLE MARKETS OF EAST AFRICA 30
Survey results found that in general, formal business offices for traders are not common and
low levels of membership (30 percent of all respondents) in associations implies a relatively
low level of cooperation and coordination, although this number was highest at 50 percent in
Tanzania. The relative longevity of businesses observed and the low proportion of formal
office space suggests that operations and relationships are largely informal, and that low
levels of investment are common, which may explain why the sector is appealing to youth.
An intermediary generally purchases produce from one or more farmers, grades and re-
packages it and then sells in bulk to wholesalers who trade goods in a wholesale market. An
intermediary may also buy goods from a broker or another intermediary at aggregation
markets or smaller wholesale markets and can sell produce to large suppliers or institutional
consumers although sales to other wholesalers are most common.
A wholesaler is a trader who operates and sells goods exclusively in an established wholesale
market. The wholesaler buys goods from intermediaries, often via a broker, and sells to either
another wholesaler or a retailer. Wholesalers generally specialize by product category, set
opening prices and control price changes throughout the day. Wholesaler traders in markets
keep constant contact with intermediaries in order to control supply of produce, requesting
more if demand is high or avoiding large surpluses. Because of the of cash constraints and
the lack of storage space, especially cold storage, wholesalers try to sell all FFV stocks by the
end of each day causing volatility of market prices.
The lack of storage, notably cold storage was the most frequently cited constraint across
countries and value chain actors. A relatively small number (16%) of traders interviewed
have storage onsite or near the market, and are able to hold inventory of produce. Traders that
do have storage facilities are able to set market prices and take advantage of higher prices
when incoming supplies dwindle. The majority of traders bring produce to the market by
truck before sunrise and expect to sell out in a single day. Those that do not sell out often
keep their product overnight in the truck or on the ground at the market and pay another day’s
fees for the market space and the truck in order to clear their inventory. Wholesale prices
generally drop in the course of a trading day.
Market entry can be difficult for wholesalers because business relationships are so informal.
Interviews with key informants indicate that to successfully enter into the market, a
wholesaler must purchase goods at a loss until he builds trust with intermediaries and/or
brokers along the supply chain. Thus, a trader must have the capacity to invest a considerable
amount of capital upfront to successfully enter the market as he will likely suffer losses for
several weeks before he will successfully find produce at realistic, market prices.
A broker is different than an intermediary or wholesaler in that he does not own the product
at any point in the value chain (Koenig et al. 2008). A broker’s role rather is to link buyers to
sellers and negotiate prices on behalf of either party. Brokers are paid a commission by either
or both parties in the transaction. Brokers at farm-level connect producers with intermediaries
and at market level connect intermediaries with wholesalers. The vast majority of FFV are
marketed and sold through brokers, also referred to as ‘middlemen.” They have therefore a
large influence in price setting. Collusion is common, if not standard, among brokers. Many
brokers deal in just one commodity leading to the formation of cartels.
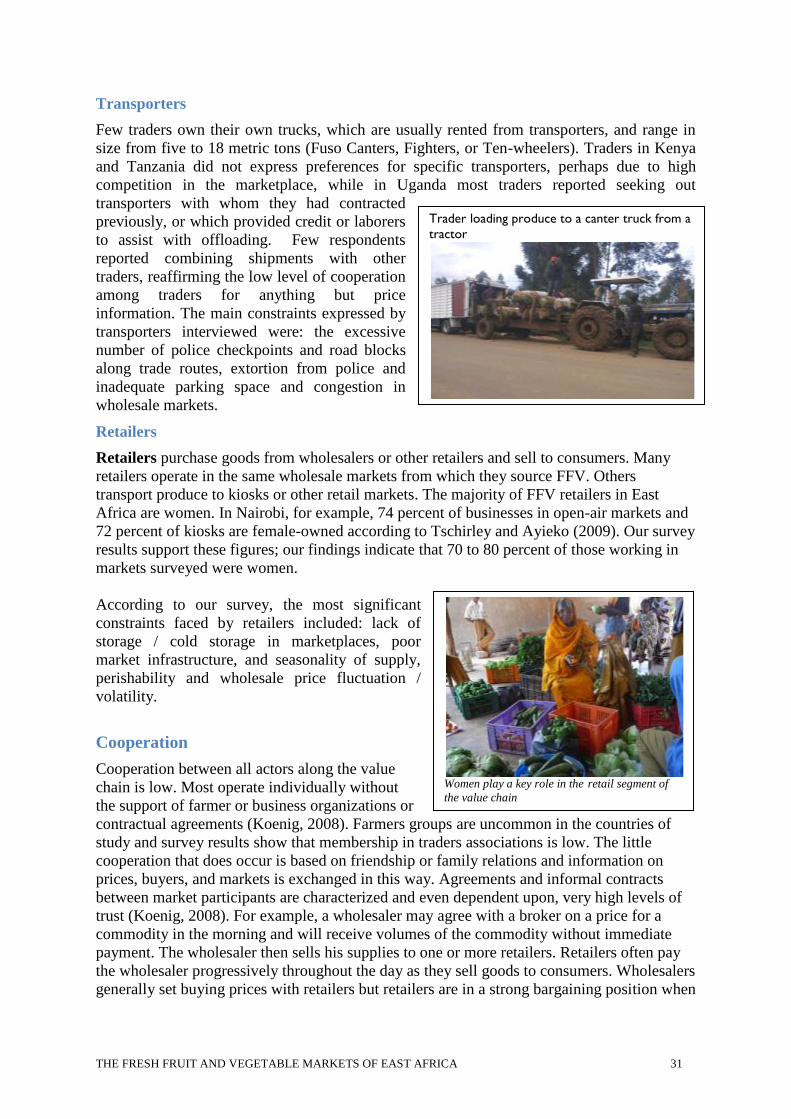
THE FRESH FRUIT AND VEGETABLE MARKETS OF EAST AFRICA 31
Women play a key role in the retail segment of
the value chain
Trader loading produce to a canter truck from a
tractor
Transporters
Few traders own their own trucks, which are usually rented from transporters, and range in
size from five to 18 metric tons (Fuso Canters, Fighters, or Ten-wheelers). Traders in Kenya
and Tanzania did not express preferences for specific transporters, perhaps due to high
competition in the marketplace, while in Uganda most traders reported seeking out
transporters with whom they had contracted
previously, or which provided credit or laborers
to assist with offloading. Few respondents
reported combining shipments with other
traders, reaffirming the low level of cooperation
among traders for anything but price
information. The main constraints expressed by
transporters interviewed were: the excessive
number of police checkpoints and road blocks
along trade routes, extortion from police and
inadequate parking space and congestion in
wholesale markets.
Retailers
Retailers purchase goods from wholesalers or other retailers and sell to consumers. Many
retailers operate in the same wholesale markets from which they source FFV. Others
transport produce to kiosks or other retail markets. The majority of FFV retailers in East
Africa are women. In Nairobi, for example, 74 percent of businesses in open-air markets and
72 percent of kiosks are female-owned according to Tschirley and Ayieko (2009). Our survey
results support these figures; our findings indicate that 70 to 80 percent of those working in
markets surveyed were women.
According to our survey, the most significant
constraints faced by retailers included: lack of
storage / cold storage in marketplaces, poor
market infrastructure, and seasonality of supply,
perishability and wholesale price fluctuation /
volatility.
Cooperation
Cooperation between all actors along the value
chain is low. Most operate individually without
the support of farmer or business organizations or
contractual agreements (Koenig, 2008). Farmers groups are uncommon in the countries of
study and survey results show that membership in traders associations is low. The little
cooperation that does occur is based on friendship or family relations and information on
prices, buyers, and markets is exchanged in this way. Agreements and informal contracts
between market participants are characterized and even dependent upon, very high levels of
trust (Koenig, 2008). For example, a wholesaler may agree with a broker on a price for a
commodity in the morning and will receive volumes of the commodity without immediate
payment. The wholesaler then sells his supplies to one or more retailers. Retailers often pay
the wholesaler progressively throughout the day as they sell goods to consumers. Wholesalers
generally set buying prices with retailers but retailers are in a strong bargaining position when
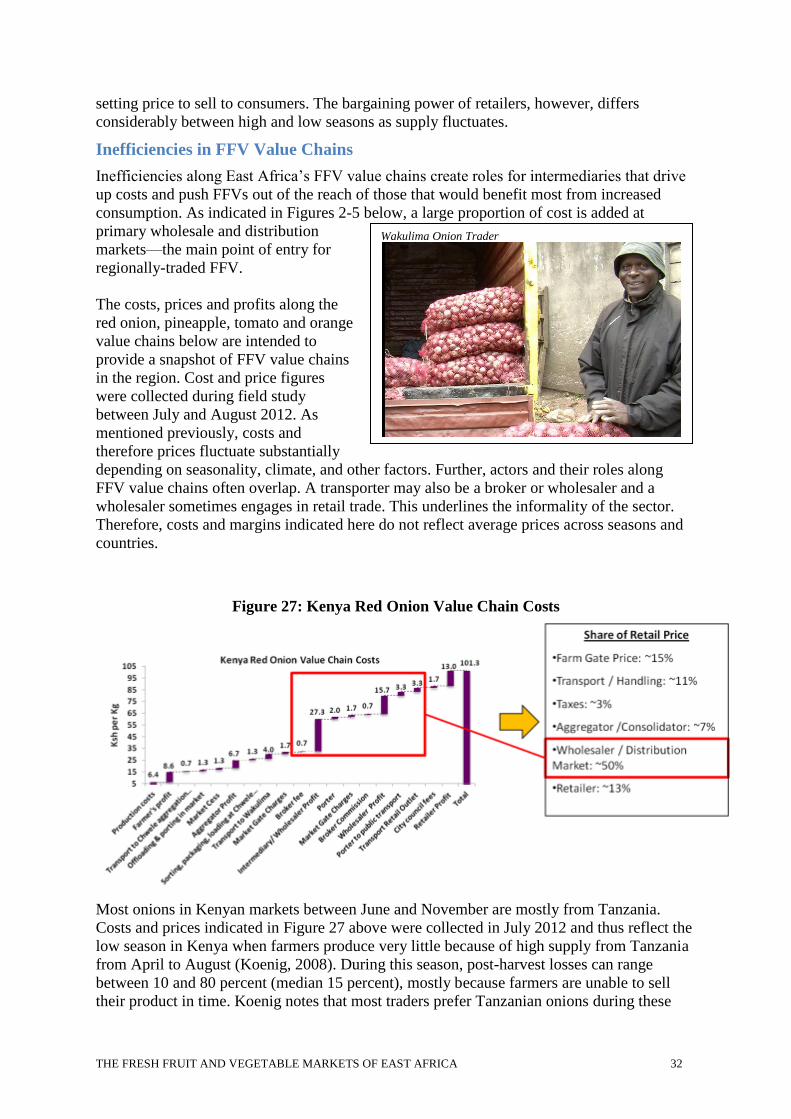
THE FRESH FRUIT AND VEGETABLE MARKETS OF EAST AFRICA 32
setting price to sell to consumers. The bargaining power of retailers, however, differs
considerably between high and low seasons as supply fluctuates.
Inefficiencies in FFV Value Chains
Inefficiencies along East Africa’s FFV value chains create roles for intermediaries that drive
up costs and push FFVs out of the reach of those that would benefit most from increased
consumption. As indicated in Figures 2-5 below, a large proportion of cost is added at
primary wholesale and distribution
markets—the main point of entry for
regionally-traded FFV.
The costs, prices and profits along the
red onion, pineapple, tomato and orange
value chains below are intended to
provide a snapshot of FFV value chains
in the region. Cost and price figures
were collected during field study
between July and August 2012. As
mentioned previously, costs and
therefore prices fluctuate substantially
depending on seasonality, climate, and other factors. Further, actors and their roles along
FFV value chains often overlap. A transporter may also be a broker or wholesaler and a
wholesaler sometimes engages in retail trade. This underlines the informality of the sector.
Therefore, costs and margins indicated here do not reflect average prices across seasons and
countries.
Figure 27: Kenya Red Onion Value Chain Costs
Most onions in Kenyan markets between June and November are mostly from Tanzania.
Costs and prices indicated in Figure 27 above were collected in July 2012 and thus reflect the
low season in Kenya when farmers produce very little because of high supply from Tanzania
from April to August (Koenig, 2008). During this season, post-harvest losses can range
between 10 and 80 percent (median 15 percent), mostly because farmers are unable to sell
their product in time. Koenig notes that most traders prefer Tanzanian onions during these
Wakulima Onion Trader
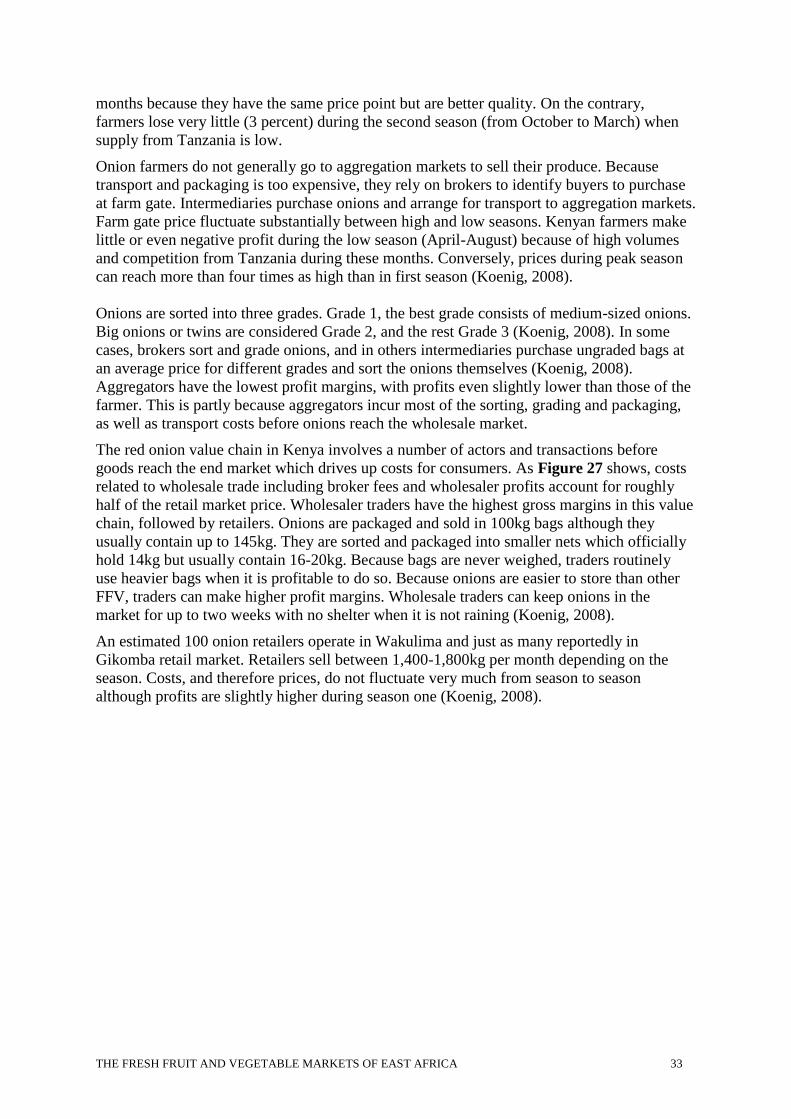
THE FRESH FRUIT AND VEGETABLE MARKETS OF EAST AFRICA 33
months because they have the same price point but are better quality. On the contrary,
farmers lose very little (3 percent) during the second season (from October to March) when
supply from Tanzania is low.
Onion farmers do not generally go to aggregation markets to sell their produce. Because
transport and packaging is too expensive, they rely on brokers to identify buyers to purchase
at farm gate. Intermediaries purchase onions and arrange for transport to aggregation markets.
Farm gate price fluctuate substantially between high and low seasons. Kenyan farmers make
little or even negative profit during the low season (April-August) because of high volumes
and competition from Tanzania during these months. Conversely, prices during peak season
can reach more than four times as high than in first season (Koenig, 2008).
Onions are sorted into three grades. Grade 1, the best grade consists of medium-sized onions.
Big onions or twins are considered Grade 2, and the rest Grade 3 (Koenig, 2008). In some
cases, brokers sort and grade onions, and in others intermediaries purchase ungraded bags at
an average price for different grades and sort the onions themselves (Koenig, 2008).
Aggregators have the lowest profit margins, with profits even slightly lower than those of the
farmer. This is partly because aggregators incur most of the sorting, grading and packaging,
as well as transport costs before onions reach the wholesale market.
The red onion value chain in Kenya involves a number of actors and transactions before
goods reach the end market which drives up costs for consumers. As Figure 27 shows, costs
related to wholesale trade including broker fees and wholesaler profits account for roughly
half of the retail market price. Wholesaler traders have the highest gross margins in this value
chain, followed by retailers. Onions are packaged and sold in 100kg bags although they
usually contain up to 145kg. They are sorted and packaged into smaller nets which officially
hold 14kg but usually contain 16-20kg. Because bags are never weighed, traders routinely
use heavier bags when it is profitable to do so. Because onions are easier to store than other
FFV, traders can make higher profit margins. Wholesale traders can keep onions in the
market for up to two weeks with no shelter when it is not raining (Koenig, 2008).
An estimated 100 onion retailers operate in Wakulima and just as many reportedly in
Gikomba retail market. Retailers sell between 1,400-1,800kg per month depending on the
season. Costs, and therefore prices, do not fluctuate very much from season to season
although profits are slightly higher during season one (Koenig, 2008).
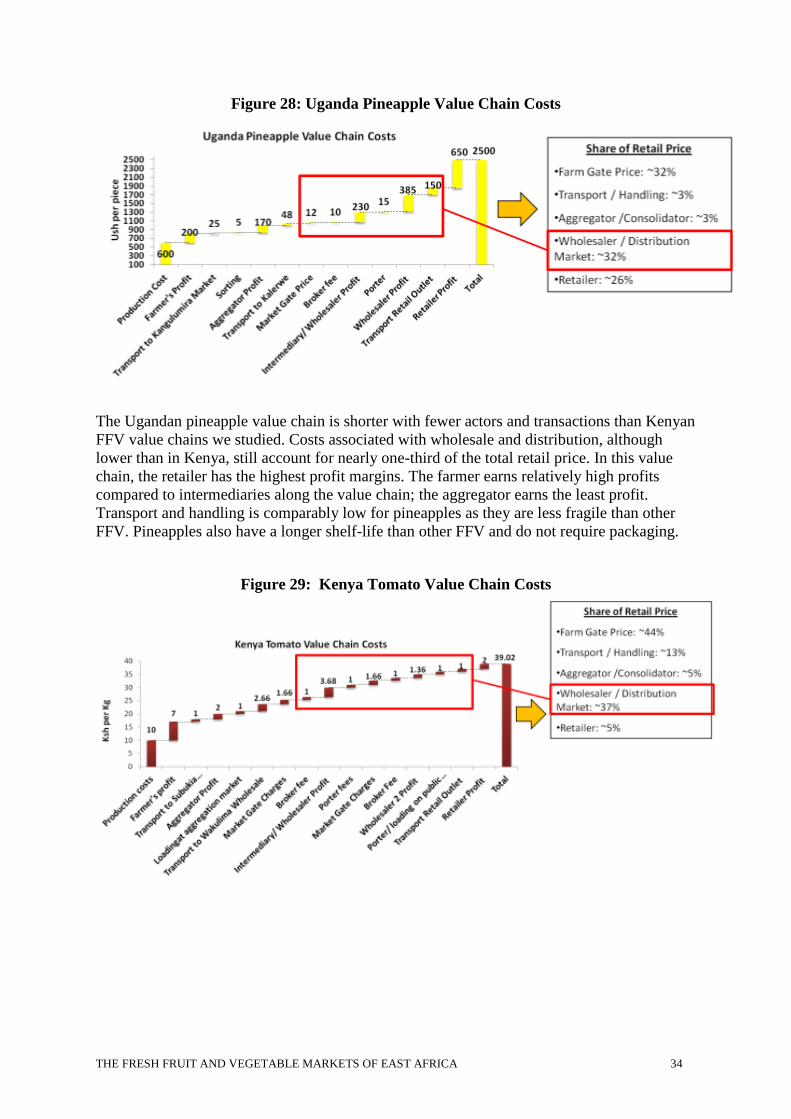
THE FRESH FRUIT AND VEGETABLE MARKETS OF EAST AFRICA 34
Figure 28: Uganda Pineapple Value Chain Costs
The Ugandan pineapple value chain is shorter with fewer actors and transactions than Kenyan
FFV value chains we studied. Costs associated with wholesale and distribution, although
lower than in Kenya, still account for nearly one-third of the total retail price. In this value
chain, the retailer has the highest profit margins. The farmer earns relatively high profits
compared to intermediaries along the value chain; the aggregator earns the least profit.
Transport and handling is comparably low for pineapples as they are less fragile than other
FFV. Pineapples also have a longer shelf-life than other FFV and do not require packaging.
Figure 29: Kenya Tomato Value Chain Costs
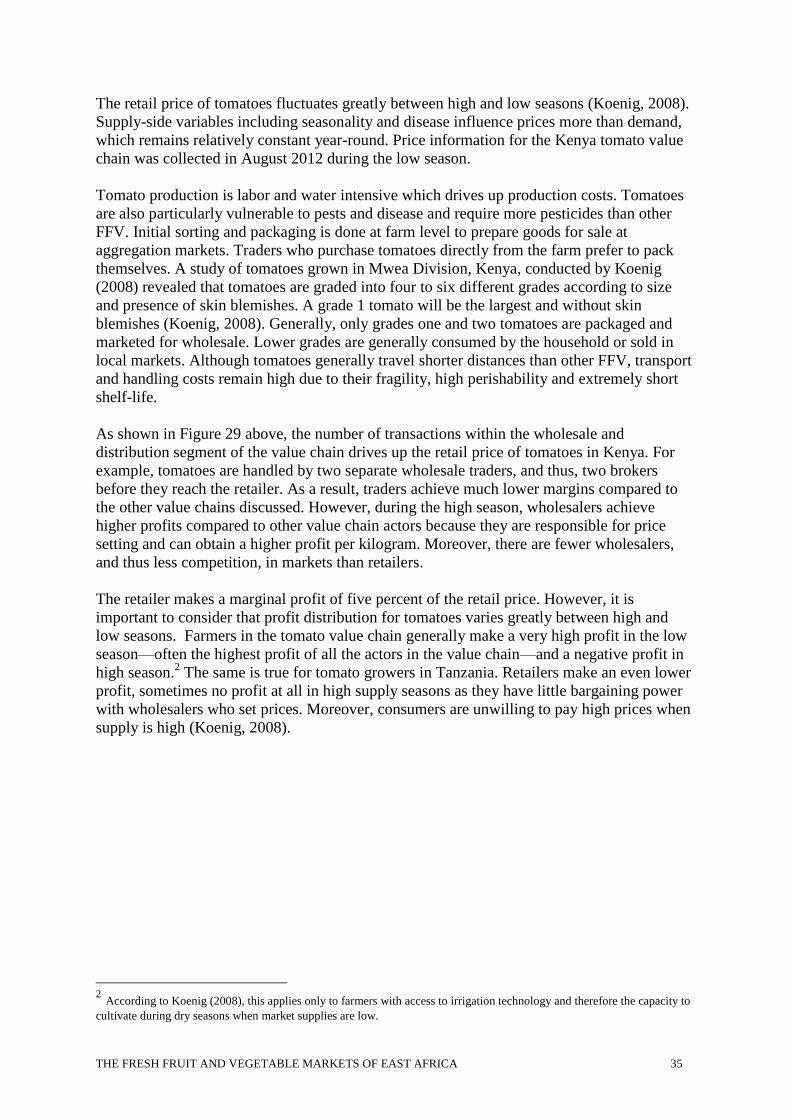
THE FRESH FRUIT AND VEGETABLE MARKETS OF EAST AFRICA 35
The retail price of tomatoes fluctuates greatly between high and low seasons (Koenig, 2008).
Supply-side variables including seasonality and disease influence prices more than demand,
which remains relatively constant year-round. Price information for the Kenya tomato value
chain was collected in August 2012 during the low season.
Tomato production is labor and water intensive which drives up production costs. Tomatoes
are also particularly vulnerable to pests and disease and require more pesticides than other
FFV. Initial sorting and packaging is done at farm level to prepare goods for sale at
aggregation markets. Traders who purchase tomatoes directly from the farm prefer to pack
themselves. A study of tomatoes grown in Mwea Division, Kenya, conducted by Koenig
(2008) revealed that tomatoes are graded into four to six different grades according to size
and presence of skin blemishes. A grade 1 tomato will be the largest and without skin
blemishes (Koenig, 2008). Generally, only grades one and two tomatoes are packaged and
marketed for wholesale. Lower grades are generally consumed by the household or sold in
local markets. Although tomatoes generally travel shorter distances than other FFV, transport
and handling costs remain high due to their fragility, high perishability and extremely short
shelf-life.
As shown in Figure 29 above, the number of transactions within the wholesale and
distribution segment of the value chain drives up the retail price of tomatoes in Kenya. For
example, tomatoes are handled by two separate wholesale traders, and thus, two brokers
before they reach the retailer. As a result, traders achieve much lower margins compared to
the other value chains discussed. However, during the high season, wholesalers achieve
higher profits compared to other value chain actors because they are responsible for price
setting and can obtain a higher profit per kilogram. Moreover, there are fewer wholesalers,
and thus less competition, in markets than retailers.
The retailer makes a marginal profit of five percent of the retail price. However, it is
important to consider that profit distribution for tomatoes varies greatly between high and
low seasons. Farmers in the tomato value chain generally make a very high profit in the low
season—often the highest profit of all the actors in the value chain—and a negative profit in
high season.2 The same is true for tomato growers in Tanzania. Retailers make an even lower
profit, sometimes no profit at all in high supply seasons as they have little bargaining power
with wholesalers who set prices. Moreover, consumers are unwilling to pay high prices when
supply is high (Koenig, 2008).
2 According to Koenig (2008), this applies only to farmers with access to irrigation technology and therefore the capacity to
cultivate during dry seasons when market supplies are low.
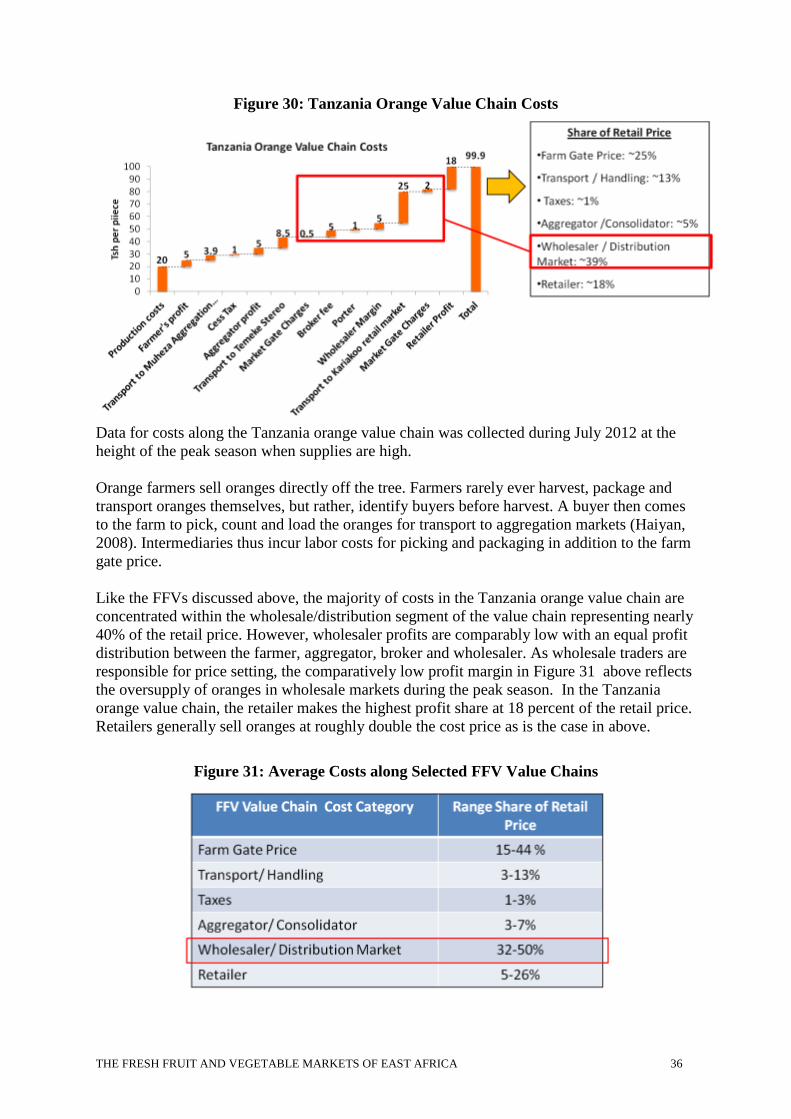
THE FRESH FRUIT AND VEGETABLE MARKETS OF EAST AFRICA 36
Figure 30: Tanzania Orange Value Chain Costs
Data for costs along the Tanzania orange value chain was collected during July 2012 at the
height of the peak season when supplies are high.
Orange farmers sell oranges directly off the tree. Farmers rarely ever harvest, package and
transport oranges themselves, but rather, identify buyers before harvest. A buyer then comes
to the farm to pick, count and load the oranges for transport to aggregation markets (Haiyan,
2008). Intermediaries thus incur labor costs for picking and packaging in addition to the farm
gate price.
Like the FFVs discussed above, the majority of costs in the Tanzania orange value chain are
concentrated within the wholesale/distribution segment of the value chain representing nearly
40% of the retail price. However, wholesaler profits are comparably low with an equal profit
distribution between the farmer, aggregator, broker and wholesaler. As wholesale traders are
responsible for price setting, the comparatively low profit margin in Figure 31 above reflects
the oversupply of oranges in wholesale markets during the peak season. In the Tanzania
orange value chain, the retailer makes the highest profit share at 18 percent of the retail price.
Retailers generally sell oranges at roughly double the cost price as is the case in above.
Figure 31: Average Costs along Selected FFV Value Chains
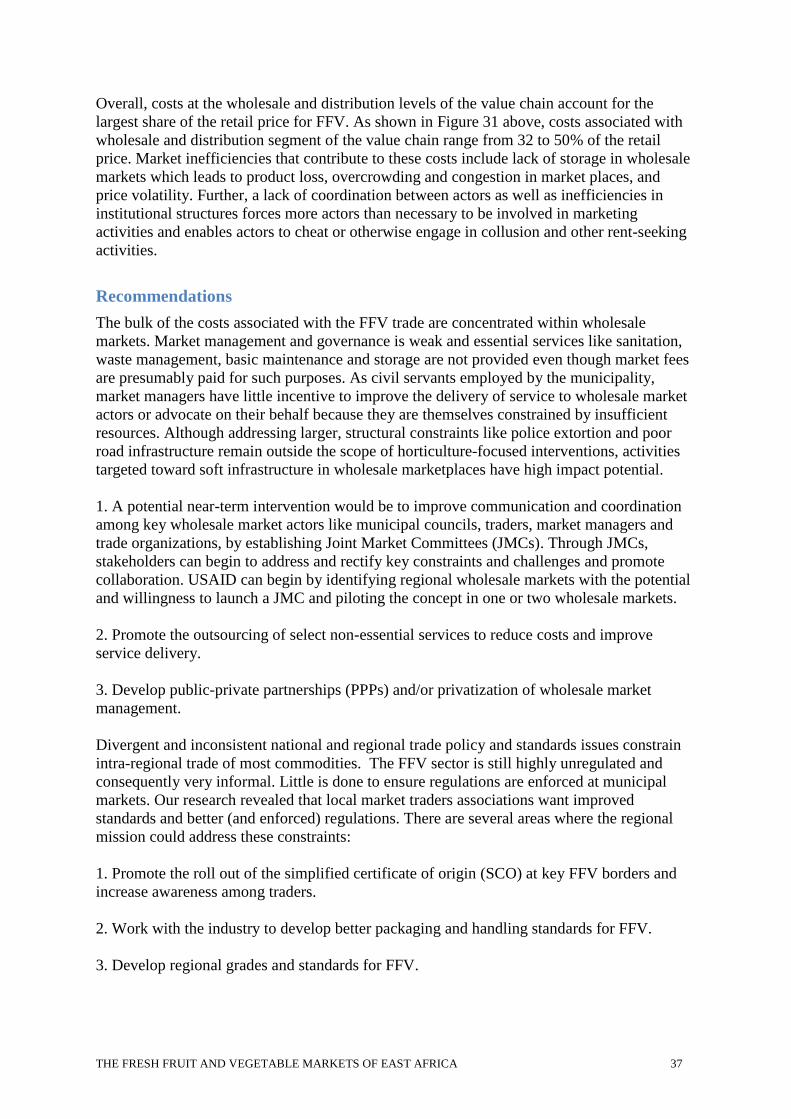
THE FRESH FRUIT AND VEGETABLE MARKETS OF EAST AFRICA 37
Overall, costs at the wholesale and distribution levels of the value chain account for the
largest share of the retail price for FFV. As shown in Figure 31 above, costs associated with
wholesale and distribution segment of the value chain range from 32 to 50% of the retail
price. Market inefficiencies that contribute to these costs include lack of storage in wholesale
markets which leads to product loss, overcrowding and congestion in market places, and
price volatility. Further, a lack of coordination between actors as well as inefficiencies in
institutional structures forces more actors than necessary to be involved in marketing
activities and enables actors to cheat or otherwise engage in collusion and other rent-seeking
activities.
Recommendations
The bulk of the costs associated with the FFV trade are concentrated within wholesale
markets. Market management and governance is weak and essential services like sanitation,
waste management, basic maintenance and storage are not provided even though market fees
are presumably paid for such purposes. As civil servants employed by the municipality,
market managers have little incentive to improve the delivery of service to wholesale market
actors or advocate on their behalf because they are themselves constrained by insufficient
resources. Although addressing larger, structural constraints like police extortion and poor
road infrastructure remain outside the scope of horticulture-focused interventions, activities
targeted toward soft infrastructure in wholesale marketplaces have high impact potential.
1. A potential near-term intervention would be to improve communication and coordination
among key wholesale market actors like municipal councils, traders, market managers and
trade organizations, by establishing Joint Market Committees (JMCs). Through JMCs,
stakeholders can begin to address and rectify key constraints and challenges and promote
collaboration. USAID can begin by identifying regional wholesale markets with the potential
and willingness to launch a JMC and piloting the concept in one or two wholesale markets.
2. Promote the outsourcing of select non-essential services to reduce costs and improve
service delivery. 3. Develop public-private partnerships (PPPs) and/or privatization of wholesale market
management.
Divergent and inconsistent national and regional trade policy and standards issues constrain
intra-regional trade of most commodities. The FFV sector is still highly unregulated and
consequently very informal. Little is done to ensure regulations are enforced at municipal
markets. Our research revealed that local market traders associations want improved
standards and better (and enforced) regulations. There are several areas where the regional
mission could address these constraints:
1. Promote the roll out of the simplified certificate of origin (SCO) at key FFV borders and
increase awareness among traders.
2. Work with the industry to develop better packaging and handling standards for FFV.
3. Develop regional grades and standards for FFV.
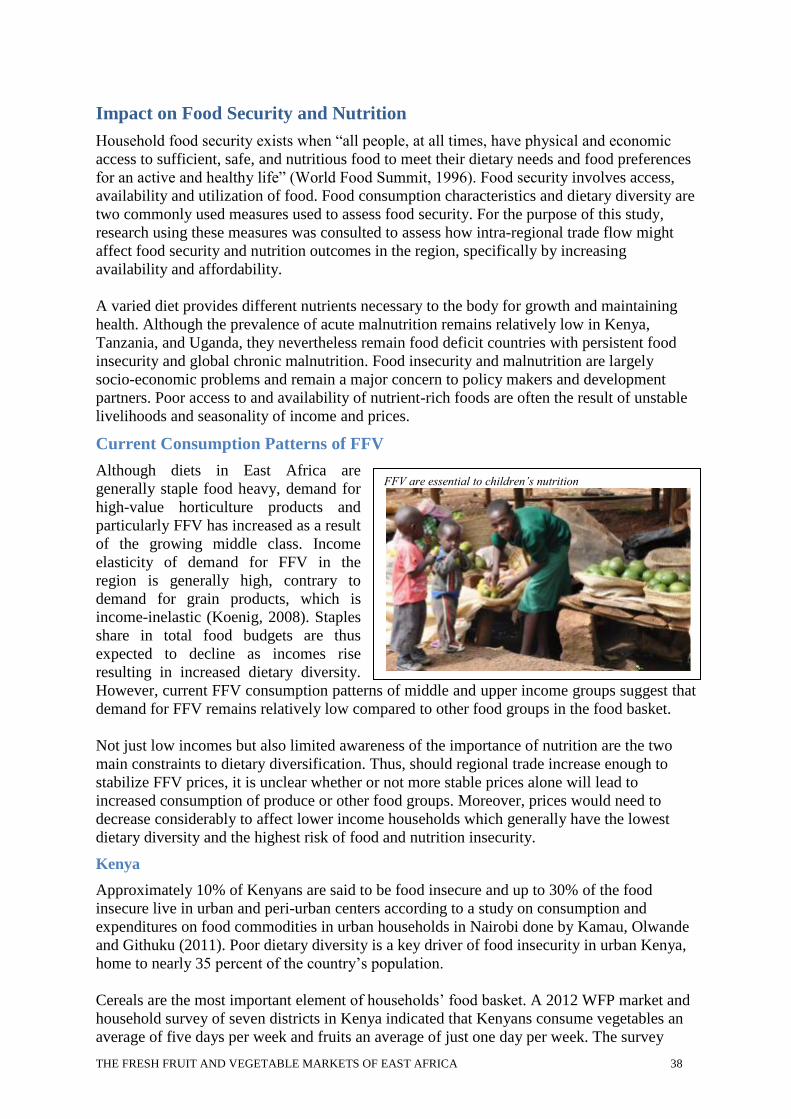
THE FRESH FRUIT AND VEGETABLE MARKETS OF EAST AFRICA 38
FFV are essential to children’s nutrition
Impact on Food Security and Nutrition
Household food security exists when “all people, at all times, have physical and economic
access to sufficient, safe, and nutritious food to meet their dietary needs and food preferences
for an active and healthy life” (World Food Summit, 1996). Food security involves access,
availability and utilization of food. Food consumption characteristics and dietary diversity are
two commonly used measures used to assess food security. For the purpose of this study,
research using these measures was consulted to assess how intra-regional trade flow might
affect food security and nutrition outcomes in the region, specifically by increasing
availability and affordability.
A varied diet provides different nutrients necessary to the body for growth and maintaining
health. Although the prevalence of acute malnutrition remains relatively low in Kenya,
Tanzania, and Uganda, they nevertheless remain food deficit countries with persistent food
insecurity and global chronic malnutrition. Food insecurity and malnutrition are largely
socio-economic problems and remain a major concern to policy makers and development
partners. Poor access to and availability of nutrient-rich foods are often the result of unstable
livelihoods and seasonality of income and prices.
Current Consumption Patterns of FFV
Although diets in East Africa are
generally staple food heavy, demand for
high-value horticulture products and
particularly FFV has increased as a result
of the growing middle class. Income
elasticity of demand for FFV in the
region is generally high, contrary to
demand for grain products, which is
income-inelastic (Koenig, 2008). Staples
share in total food budgets are thus
expected to decline as incomes rise
resulting in increased dietary diversity.
However, current FFV consumption patterns of middle and upper income groups suggest that
demand for FFV remains relatively low compared to other food groups in the food basket.
Not just low incomes but also limited awareness of the importance of nutrition are the two
main constraints to dietary diversification. Thus, should regional trade increase enough to
stabilize FFV prices, it is unclear whether or not more stable prices alone will lead to
increased consumption of produce or other food groups. Moreover, prices would need to
decrease considerably to affect lower income households which generally have the lowest
dietary diversity and the highest risk of food and nutrition insecurity.
Kenya
Approximately 10% of Kenyans are said to be food insecure and up to 30% of the food
insecure live in urban and peri-urban centers according to a study on consumption and
expenditures on food commodities in urban households in Nairobi done by Kamau, Olwande
and Githuku (2011). Poor dietary diversity is a key driver of food insecurity in urban Kenya,
home to nearly 35 percent of the country’s population.
Cereals are the most important element of households’ food basket. A 2012 WFP market and
household survey of seven districts in Kenya indicated that Kenyans consume vegetables an
average of five days per week and fruits an average of just one day per week. The survey
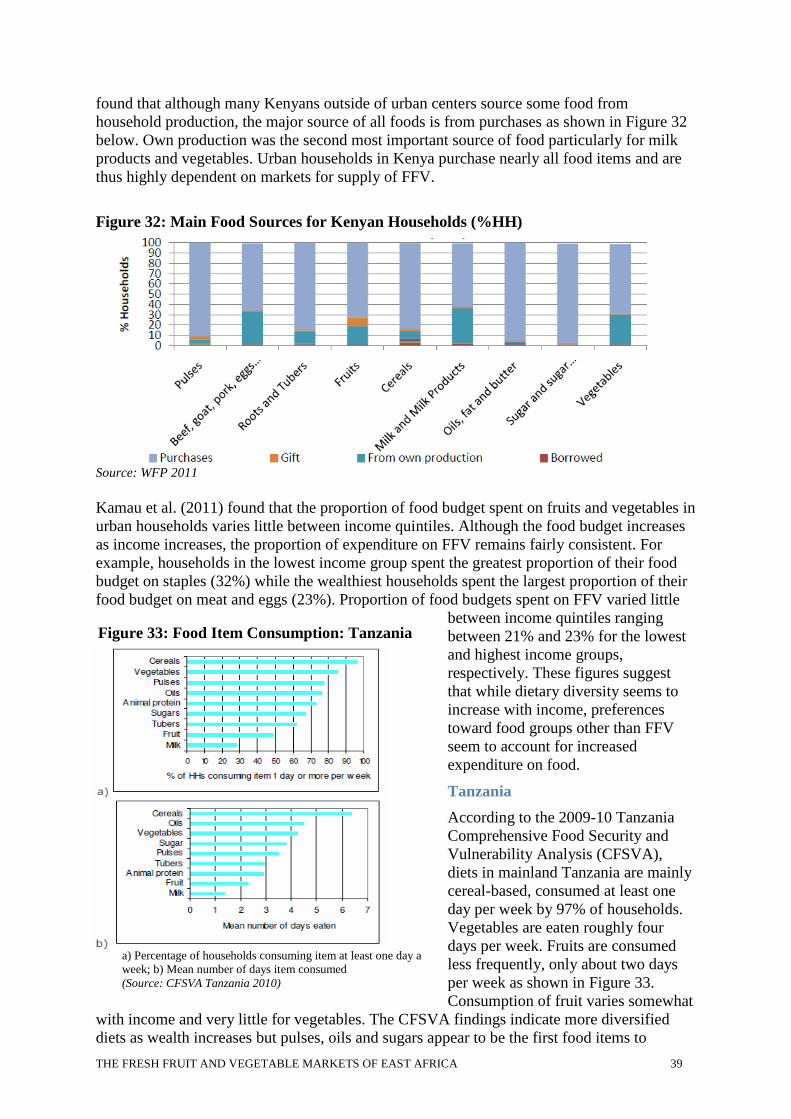
THE FRESH FRUIT AND VEGETABLE MARKETS OF EAST AFRICA 39
Figure 33: Food Item Consumption: Tanzania
a) Percentage of households consuming item at least one day a
week; b) Mean number of days item consumed
(Source: CFSVA Tanzania 2010)
found that although many Kenyans outside of urban centers source some food from
household production, the major source of all foods is from purchases as shown in Figure 32
below. Own production was the second most important source of food particularly for milk
products and vegetables. Urban households in Kenya purchase nearly all food items and are
thus highly dependent on markets for supply of FFV.
Figure 32: Main Food Sources for Kenyan Households (%HH)
Source: WFP 2011
Kamau et al. (2011) found that the proportion of food budget spent on fruits and vegetables in
urban households varies little between income quintiles. Although the food budget increases
as income increases, the proportion of expenditure on FFV remains fairly consistent. For
example, households in the lowest income group spent the greatest proportion of their food
budget on staples (32%) while the wealthiest households spent the largest proportion of their
food budget on meat and eggs (23%). Proportion of food budgets spent on FFV varied little
between income quintiles ranging
between 21% and 23% for the lowest
and highest income groups,
respectively. These figures suggest
that while dietary diversity seems to
increase with income, preferences
toward food groups other than FFV
seem to account for increased
expenditure on food.
Tanzania
According to the 2009-10 Tanzania
Comprehensive Food Security and
Vulnerability Analysis (CFSVA),
diets in mainland Tanzania are mainly
cereal-based, consumed at least one
day per week by 97% of households.
Vegetables are eaten roughly four
days per week. Fruits are consumed
less frequently, only about two days
per week as shown in Figure 33.
Consumption of fruit varies somewhat
with income and very little for vegetables. The CFSVA findings indicate more diversified
diets as wealth increases but pulses, oils and sugars appear to be the first food items to
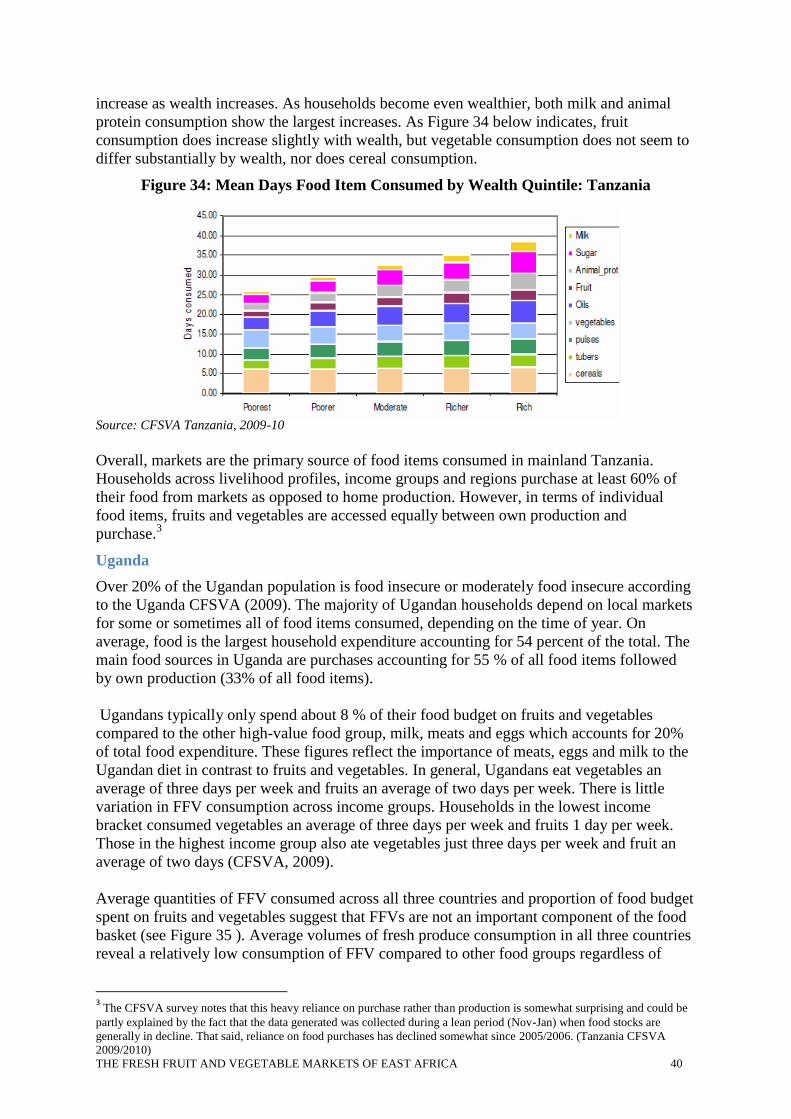
THE FRESH FRUIT AND VEGETABLE MARKETS OF EAST AFRICA 40
increase as wealth increases. As households become even wealthier, both milk and animal
protein consumption show the largest increases. As Figure 34 below indicates, fruit
consumption does increase slightly with wealth, but vegetable consumption does not seem to
differ substantially by wealth, nor does cereal consumption.
Figure 34: Mean Days Food Item Consumed by Wealth Quintile: Tanzania
Source: CFSVA Tanzania, 2009-10
Overall, markets are the primary source of food items consumed in mainland Tanzania.
Households across livelihood profiles, income groups and regions purchase at least 60% of
their food from markets as opposed to home production. However, in terms of individual
food items, fruits and vegetables are accessed equally between own production and
purchase.3
Uganda
Over 20% of the Ugandan population is food insecure or moderately food insecure according
to the Uganda CFSVA (2009). The majority of Ugandan households depend on local markets
for some or sometimes all of food items consumed, depending on the time of year. On
average, food is the largest household expenditure accounting for 54 percent of the total. The
main food sources in Uganda are purchases accounting for 55 % of all food items followed
by own production (33% of all food items).
Ugandans typically only spend about 8 % of their food budget on fruits and vegetables
compared to the other high-value food group, milk, meats and eggs which accounts for 20%
of total food expenditure. These figures reflect the importance of meats, eggs and milk to the
Ugandan diet in contrast to fruits and vegetables. In general, Ugandans eat vegetables an
average of three days per week and fruits an average of two days per week. There is little
variation in FFV consumption across income groups. Households in the lowest income
bracket consumed vegetables an average of three days per week and fruits 1 day per week.
Those in the highest income group also ate vegetables just three days per week and fruit an
average of two days (CFSVA, 2009).
Average quantities of FFV consumed across all three countries and proportion of food budget
spent on fruits and vegetables suggest that FFVs are not an important component of the food
basket (see Figure 35 ). Average volumes of fresh produce consumption in all three countries
reveal a relatively low consumption of FFV compared to other food groups regardless of
3 The CFSVA survey notes that this heavy reliance on purchase rather than production is somewhat surprising and could be
partly explained by the fact that the data generated was collected during a lean period (Nov-Jan) when food stocks are
generally in decline. That said, reliance on food purchases has declined somewhat since 2005/2006. (Tanzania CFSVA
2009/2010)
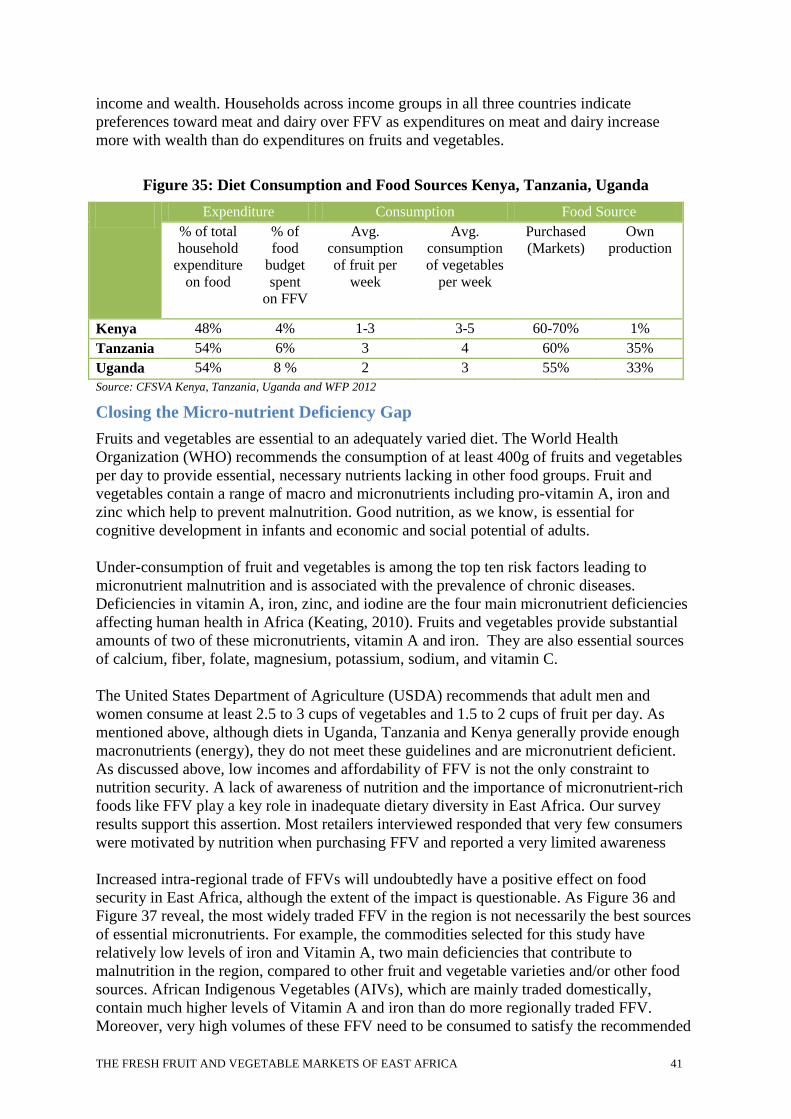
THE FRESH FRUIT AND VEGETABLE MARKETS OF EAST AFRICA 41
income and wealth. Households across income groups in all three countries indicate
preferences toward meat and dairy over FFV as expenditures on meat and dairy increase
more with wealth than do expenditures on fruits and vegetables.
Figure 35: Diet Consumption and Food Sources Kenya, Tanzania, Uganda
Expenditure Consumption Food Source
% of total
household
expenditure
on food
% of
food
budget
spent
on FFV
Avg.
consumption
of fruit per
week
Avg.
consumption
of vegetables
per week
Purchased
(Markets)
Own
production
Kenya 48% 4% 1-3 3-5 60-70% 1%
Tanzania 54% 6% 3 4 60% 35%
Uganda 54% 8 % 2 3 55% 33%
Source: CFSVA Kenya, Tanzania, Uganda and WFP 2012
Closing the Micro-nutrient Deficiency Gap
Fruits and vegetables are essential to an adequately varied diet. The World Health
Organization (WHO) recommends the consumption of at least 400g of fruits and vegetables
per day to provide essential, necessary nutrients lacking in other food groups. Fruit and
vegetables contain a range of macro and micronutrients including pro-vitamin A, iron and
zinc which help to prevent malnutrition. Good nutrition, as we know, is essential for
cognitive development in infants and economic and social potential of adults.
Under-consumption of fruit and vegetables is among the top ten risk factors leading to
micronutrient malnutrition and is associated with the prevalence of chronic diseases.
Deficiencies in vitamin A, iron, zinc, and iodine are the four main micronutrient deficiencies
affecting human health in Africa (Keating, 2010). Fruits and vegetables provide substantial
amounts of two of these micronutrients, vitamin A and iron. They are also essential sources
of calcium, fiber, folate, magnesium, potassium, sodium, and vitamin C.
The United States Department of Agriculture (USDA) recommends that adult men and
women consume at least 2.5 to 3 cups of vegetables and 1.5 to 2 cups of fruit per day. As
mentioned above, although diets in Uganda, Tanzania and Kenya generally provide enough
macronutrients (energy), they do not meet these guidelines and are micronutrient deficient.
As discussed above, low incomes and affordability of FFV is not the only constraint to
nutrition security. A lack of awareness of nutrition and the importance of micronutrient-rich
foods like FFV play a key role in inadequate dietary diversity in East Africa. Our survey
results support this assertion. Most retailers interviewed responded that very few consumers
were motivated by nutrition when purchasing FFV and reported a very limited awareness
Increased intra-regional trade of FFVs will undoubtedly have a positive effect on food
security in East Africa, although the extent of the impact is questionable. As Figure 36 and
Figure 37 reveal, the most widely traded FFV in the region is not necessarily the best sources
of essential micronutrients. For example, the commodities selected for this study have
relatively low levels of iron and Vitamin A, two main deficiencies that contribute to
malnutrition in the region, compared to other fruit and vegetable varieties and/or other food
sources. African Indigenous Vegetables (AIVs), which are mainly traded domestically,
contain much higher levels of Vitamin A and iron than do more regionally traded FFV.
Moreover, very high volumes of these FFV need to be consumed to satisfy the recommended
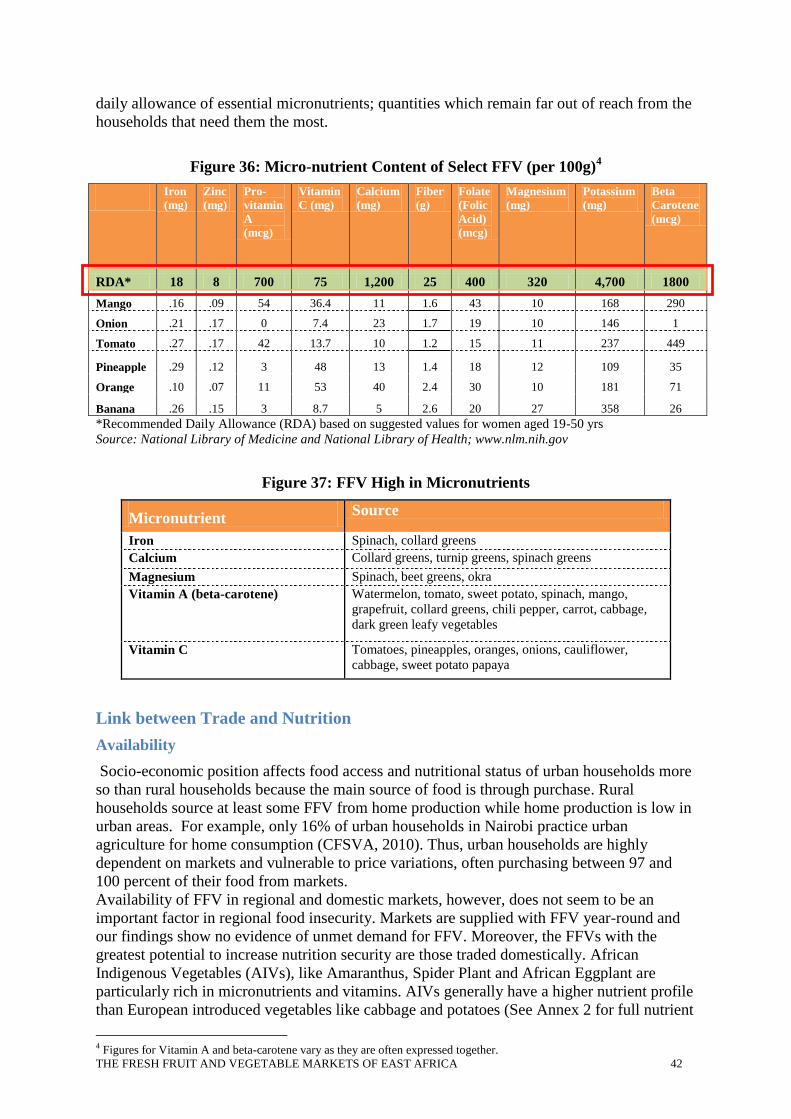
THE FRESH FRUIT AND VEGETABLE MARKETS OF EAST AFRICA 42
daily allowance of essential micronutrients; quantities which remain far out of reach from the
households that need them the most.
Figure 36: Micro-nutrient Content of Select FFV (per 100g)4
Iron
(mg)
Zinc
(mg)
Pro-
vitamin
A
(mcg)
Vitamin
C (mg)
Calcium
(mg)
Fiber
(g)
Folate
(Folic
Acid)
(mcg)
Magnesium
(mg)
Potassium
(mg)
Beta
Carotene
(mcg)
RDA* 18 8 700 75 1,200 25 400 320 4,700 1800
Mango .16 .09 54 36.4 11 1.6 43 10 168 290
Onion .21 .17 0 7.4 23 1.7 19 10 146 1
Tomato .27 .17 42 13.7 10 1.2 15 11 237 449
Pineapple .29 .12 3 48 13 1.4 18 12 109 35
Orange .10 .07 11 53 40 2.4 30 10 181 71
Banana .26 .15 3 8.7 5 2.6 20 27 358 26
*Recommended Daily Allowance (RDA) based on suggested values for women aged 19-50 yrs
Source: National Library of Medicine and National Library of Health; www.nlm.nih.gov
Figure 37: FFV High in Micronutrients
Micronutrient Source
Iron Spinach, collard greens
Calcium Collard greens, turnip greens, spinach greens
Magnesium Spinach, beet greens, okra
Vitamin A (beta-carotene) Watermelon, tomato, sweet potato, spinach, mango,
grapefruit, collard greens, chili pepper, carrot, cabbage,
dark green leafy vegetables
Vitamin C Tomatoes, pineapples, oranges, onions, cauliflower,
cabbage, sweet potato papaya
Link between Trade and Nutrition
Availability
Socio-economic position affects food access and nutritional status of urban households more
so than rural households because the main source of food is through purchase. Rural
households source at least some FFV from home production while home production is low in
urban areas. For example, only 16% of urban households in Nairobi practice urban
agriculture for home consumption (CFSVA, 2010). Thus, urban households are highly
dependent on markets and vulnerable to price variations, often purchasing between 97 and
100 percent of their food from markets.
Availability of FFV in regional and domestic markets, however, does not seem to be an
important factor in regional food insecurity. Markets are supplied with FFV year-round and
our findings show no evidence of unmet demand for FFV. Moreover, the FFVs with the
greatest potential to increase nutrition security are those traded domestically. African
Indigenous Vegetables (AIVs), like Amaranthus, Spider Plant and African Eggplant are
particularly rich in micronutrients and vitamins. AIVs generally have a higher nutrient profile
than European introduced vegetables like cabbage and potatoes (See Annex 2 for full nutrient
4 Figures for Vitamin A and beta-carotene vary as they are often expressed together.
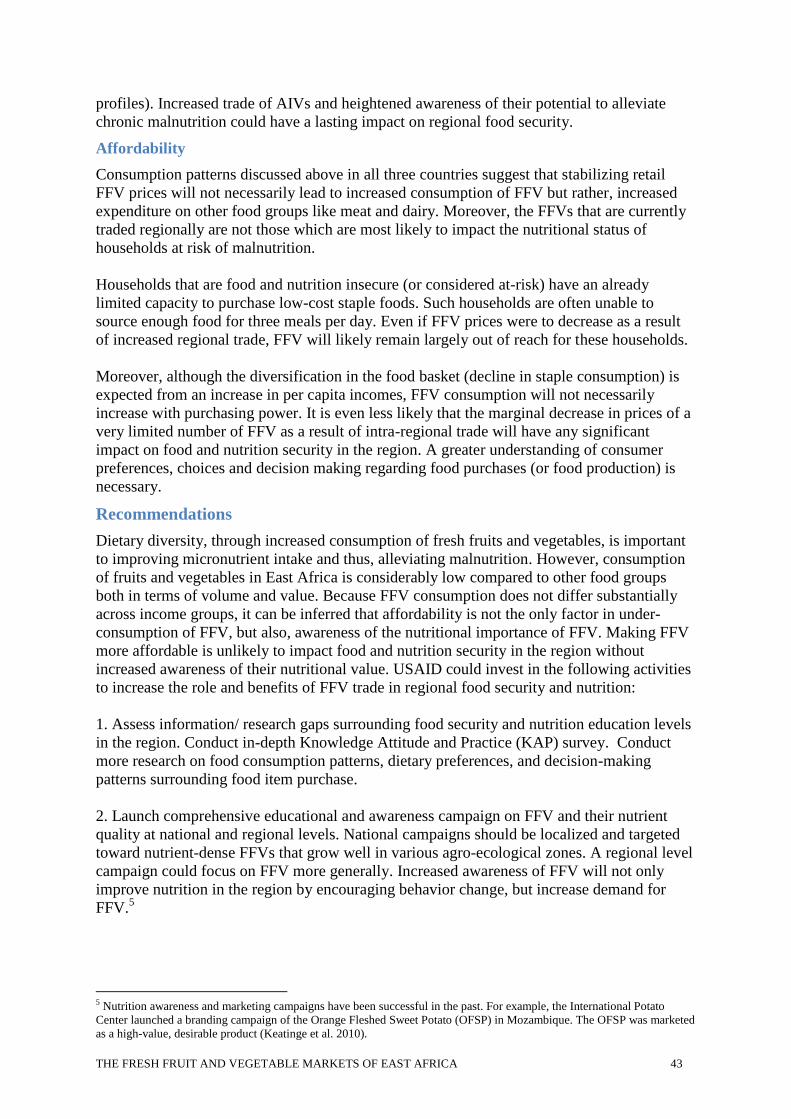
THE FRESH FRUIT AND VEGETABLE MARKETS OF EAST AFRICA 43
profiles). Increased trade of AIVs and heightened awareness of their potential to alleviate
chronic malnutrition could have a lasting impact on regional food security.
Affordability
Consumption patterns discussed above in all three countries suggest that stabilizing retail
FFV prices will not necessarily lead to increased consumption of FFV but rather, increased
expenditure on other food groups like meat and dairy. Moreover, the FFVs that are currently
traded regionally are not those which are most likely to impact the nutritional status of
households at risk of malnutrition.
Households that are food and nutrition insecure (or considered at-risk) have an already
limited capacity to purchase low-cost staple foods. Such households are often unable to
source enough food for three meals per day. Even if FFV prices were to decrease as a result
of increased regional trade, FFV will likely remain largely out of reach for these households.
Moreover, although the diversification in the food basket (decline in staple consumption) is
expected from an increase in per capita incomes, FFV consumption will not necessarily
increase with purchasing power. It is even less likely that the marginal decrease in prices of a
very limited number of FFV as a result of intra-regional trade will have any significant
impact on food and nutrition security in the region. A greater understanding of consumer
preferences, choices and decision making regarding food purchases (or food production) is
necessary.
Recommendations
Dietary diversity, through increased consumption of fresh fruits and vegetables, is important
to improving micronutrient intake and thus, alleviating malnutrition. However, consumption
of fruits and vegetables in East Africa is considerably low compared to other food groups
both in terms of volume and value. Because FFV consumption does not differ substantially
across income groups, it can be inferred that affordability is not the only factor in under-
consumption of FFV, but also, awareness of the nutritional importance of FFV. Making FFV
more affordable is unlikely to impact food and nutrition security in the region without
increased awareness of their nutritional value. USAID could invest in the following activities
to increase the role and benefits of FFV trade in regional food security and nutrition:
1. Assess information/ research gaps surrounding food security and nutrition education levels
in the region. Conduct in-depth Knowledge Attitude and Practice (KAP) survey. Conduct
more research on food consumption patterns, dietary preferences, and decision-making
patterns surrounding food item purchase.
2. Launch comprehensive educational and awareness campaign on FFV and their nutrient
quality at national and regional levels. National campaigns should be localized and targeted
toward nutrient-dense FFVs that grow well in various agro-ecological zones. A regional level
campaign could focus on FFV more generally. Increased awareness of FFV will not only
improve nutrition in the region by encouraging behavior change, but increase demand for
FFV.5
5 Nutrition awareness and marketing campaigns have been successful in the past. For example, the International Potato
Center launched a branding campaign of the Orange Fleshed Sweet Potato (OFSP) in Mozambique. The OFSP was marketed
as a high-value, desirable product (Keatinge et al. 2010).
THE FRESH FRUIT AND VEGETABLE MARKETS OF EAST AFRICA 44
Recommendations and Action Plan
The value chain and market inefficiencies documented in this report inhibit cross border trade
in FFV despite favorable seasonal price differentials and consumer demand for regional
products. While many of the challenges in the horticulture sector are bilateral in nature, there
are a number of constraints that drive up prices of regionally-traded commodities that could
be addressed regionally by USAID East Africa.
Below is a set of recommendations for how to tackle some of these challenges incrementally.
Potential interventions are broken down into near, medium, and long-term activities.
Recommendation 1: Improve the region’s capacity to collect and analyze FFV trade
flow, price and market information
The study was limited in some cases by the lack of data on trade and prices at both the
national and regional level. As is the case with other value chains, unreliable and
inconsistent data collection methodologies, inadequate distribution/access, and limited data
sets create information asymmetry within horticulture value chains and afford only a narrow
view of national markets. This makes the FFV value chain non-transparent and effectively
blinds value-chain participants to both national and regional market opportunities and
encourages informal transactional trading systems. It also constrains regional trade and
negatively impacts food security. Improving the region’s capacity to collect and disseminate
information on FFVs should contribute to increased trade.
Near term:
Harmonize data collection methodologies. If market information is useful, reliable, and
readily available, value chain actors will use it. Developing harmonized data sets/collection
methodologies and delivering consistency across the region will help drive market
information use and will facilitate the development of regional links.
EATH has worked with RESAKKS, EAGC, national bureaus of statistics, MIS providers,
and other partners to develop a uniform data collection methodology for traditional staple
food crops and could use the same approach to convene key horticulture stakeholders to build
consistency across the region. USAID could work directly with existing data providers like
TAHA, UBOS, HCDA to increase frequency (goal is daily) of data collection and improve
quality and dissemination. Training programs could be managed by RESSAKs and other
regional partners such as the new EATH. To ensure sustainability of data collection
networks, USAID and its partners need to build a network of permanent market participants
who could collect data as part of their daily job. Ministry of Agriculture/Trade enumerators
already collecting data is one potential source of on-the-ground resources. Another source
could be wholesale market managers and Municipal Councils who have a full-time presence
in key markets and could provide the data to traders as an additional service to justify the fees
they charge and to increase throughput.
Medium term:
Enhance analysis of price and market information. Comparison of prices across countries is
lacking as most research has been conducted at the bilateral level. Further value chain cost
analyses for major crops across several countries would provide valuable insight into both
sources of competitive advantage/disadvantage and constraints and would serve as a useful
benchmark against which USAID and its implementing partners could design specific
interventions and evaluate impact. These analyses could serve as the foundation for
collaboration/coordination with bilateral partners engaged in the sector. Additionally,
USAID could work with key stakeholders to aggregate data and work to build capacity within
THE FRESH FRUIT AND VEGETABLE MARKETS OF EAST AFRICA 45
organizations such as TAHA, HCDA, and HCA to analyze the data and package it in a way
that supports decision making. USAID could also leverage horticulture data to strengthen the
EAC’s Regional Food Balance Sheet.
Long term:
Develop regional FFV market information systems. The regional mission could support
efforts to develop a regional FFV market information platform. Building on the model that
was used to expand the Eastern Africa Grain Council’s Regional Agricultural Trade
Intelligence Network (RATIN) and leveraging the tools developed to support that expansion,
USAID could build a new system with limited investment. Upfront work to map the current
national and regional MIS provider landscape, understand existing capabilities/gaps, and
identify national partners should begin immediately. The next step would be to engage
national MIS providers in an effort to get buy-in for a regional platform and agree on the
right home/owner (potentially HCA, whose capacity has improved and which is being
supported by a range of donors). The success of a regional platform will rest in its ability to
deliver value to both national partners that are contributing data to the system as well as users
of the data. Developing innovative partnerships with mobile network operators that support
marketing efforts and expands dissemination and data use will also be critical to sustain an
integrated regional network.
While HCA has made significant strides, it still needs additional capacity development
support to build it into a strong regional body. Any intervention on the part of USAID East
Africa should be coordinated with other donors.
Recommendation 2: Develop interventions to address wholesale market inefficiencies
As was discussed in detail above, the operational structure and performance of the region’s
wholesale markets has a significant impact on retail prices and the affordability of FFVs. The
survey confirmed that costs borne by traders within wholesale markets are high and result
from poor market management, insufficient service delivery and limited investment in
infrastructure by municipal councils. Post-harvest losses during transport and off-loading are
high and wholesalers, who already share a disproportionate amount of the risk within the
value chain, set prices that reflect these losses. Wholesale prices also reflect the costs
absorbed by wholesalers to pay for services that should be provided by market management
such as sanitation, trash removal and security. Given the high level of dysfunction in most
wholesale markets which drives up costs unnecessarily, there is an opportunity for USAID to
design interventions that are focused on building efficiency and reducing costs within
markets.
Near term:
Improve coordination among key wholesale market actors (municipal councils, traders,
market managers, traders’ associations, government agencies (e.g. Ministries of Agriculture,
Bureaus of Standards, etc.). Traditional wholesale markets are comprised of a large number
of players who are not working efficiently together. Consequently, mistrust is high and
markets function at suboptimal levels. Facilitating communication and collaboration among
market actors is a necessary first step towards improving market operations. USAID could
leverage the Joint Border Committee (JBC) model that EATH has employed to improve the
functioning of borders and facilitate cross-border trade movement, to improve coordination in
markets and facilitate problem solving. This type of intervention should help deliver
efficiency gains that contribute to cost reductions and build trust among the various
stakeholders that will deliver benefits to all market actors.
THE FRESH FRUIT AND VEGETABLE MARKETS OF EAST AFRICA 46
To implement this activity, USAID and its partners would need to identify several markets
across the region that would be willing to participate in a pilot Joint Market Committee
(JMC). The implementing partner, working with the pilot JMCs, would develop and refine
operating protocols and systems (again drawing on the extensive work done with JBCs) and
initiate an initial assessment of key challenges/constraints within each market and work with
the JMCs to agree on priority actions and timelines. The lessons learned during each pilot
would then be compiled into a replicable JMC roadmap that could be expanded to other
markets across the region.
Medium term:
Promote the outsourcing of select non-essential services to reduce costs and improve service
delivery. Most of the region’s wholesale markets are managed by municipal councils who
employ management teams on-the-ground in markets tasked with oversight and service
delivery. The challenge has been that municipal councils are not always adept at managing
markets. Competing priorities at the municipal level and strained budgets often mean that
fees paid by wholesalers to market managers are not always used to cover market operations.
As a result, service delivery suffers or is non-existent. Some of the services that are
necessary to the proper functioning of markets such as security, sanitation and trash removal
are not necessarily municipal council core competencies and could be better provided by
service providers. Outsourcing non-essential services to external companies would provide
municipal councils with additional revenue streams while helping to reduce their direct costs.
Working through the JMCs, an outsourcing model could be developed. The presence of
multiple stakeholders on JMCs could also help ensure transparency in the process and serve
as a more effective oversight mechanism to ensure that contracted service providers are
meeting their obligations. There are examples of markets where this has been done so
preliminary work to understand what has worked and what hasn’t would be critical.
Long term:
Develop public-private partnerships (PPPs) and/or privatization of wholesale market
management. There are a number of cases observed during this study where PPPs are
working well in the management of wholesale markets. The mission could support efforts to
review legal frameworks for the establishment and management of markets that often hinder
active private sector engagement and contribute to the progressive decline of public market
places There is an opportunity to look closely at these models and to tease out the best
practices for sharing with a larger audience.
Recommendation 3: Improve the FFV policy and enabling environment
Divergent and inconsistent national and regional trade policy and standards issues constrain
intra-regional trade of most commodities. The FFV sector is still highly unregulated and
consequently very informal. Little is done to ensure regulations are enforced at municipal
markets. Our research revealed that local market traders associations want improved
standards and better (and enforced) regulations. There are several areas that the regional
mission could address these constraints:
Near term:
Promote the roll out of the simplified certificate of origin (SCO) at key FFV borders and
increase awareness among traders. In Article 14 of the EAC customs union, all FFV
products fall under Rules of Origin (Rule 5). As long as they are harvested within the 5
partner states, they can be traded duty free, as long as they are accompanied by supporting
documents, an EAC simplified certificate of origin if the products are valued below $2000 or
an EAC certificate of origin from the exporter, if the goods are valued over $2000. During its
THE FRESH FRUIT AND VEGETABLE MARKETS OF EAST AFRICA 47
final year, EATH will be conducting cross-border trade forums at select markets across the
region. While the focus will be on traditional staple foods, involving FFV traders in these
forums will help drive awareness of SCO, increase transparency at borders and promote
formal trade.
Medium-long term:
Work with the FFV industry to improve packaging and handling of FFV. Local legislation on
standards, packaging, and hygiene measures exists but is almost never reinforced by
municipal councils because they lack incentives and the resources to do so. Generally, few
FFV are packaged and handled properly. Transport and handling costs for FFV remain high
due to their fragility, high perishability and extremely short shelf-life. Working with regional
partners in FFV, USAID could support efforts to reduce post harvest handling losses due to
improper handling and packaging. The region should take advantage of existing best
practices that have been identified through various research and development programs
focusing on these issues.
Develop regional grades and standards for FFV. The lack of basic standards and/or the lack
of awareness of existing standards for most products make transactions less transparent and
afford buyers/traders the opportunity to set their own standards and secure an advantage in
the producer-buyer relationship, which breeds mistrust between value-chain participants.
Promoting consistency and harmonization of quality standards for FFVs should help facilitate
trade and promote greater transparency across the value chain. The benefits that accrue to
producers from a more transparent quality standards system should be an incentive for
smallholders to invest in production and will support the push for greater regional food
security. A process similar to that USAID used to develop the 22 staple foods quality
standards could be used for FFVs. This would involve engaging key horticulture
stakeholders and national bureaus of standards and coordination with the EAC’s Technical
Standards Committee. Standards should be developed in conjunction with the Swahili GAP,
currently in draft form, and under the ownership of FPEAK. Swahili GAP is a regional code
of conduct aimed at increasing professionalism in the industry. Promoting the consistent
adoption among key value chain actors across the region will be essential and will involve the
development of awareness materials for distribution to national partners.
Recommendation 4: Promote consumer awareness campaigns on the nutritional
benefits of eating FFV
FFVs are not a priority food item in the East Africa food basket. Under consumption of FFVs
is largely due to consumer preferences toward other food items. Our survey revealed that
many consumers are unaware of the nutritional importance of FFV. Although consumers
reported medicinal advantages or qualities of FFV, nutrition was not a motivator for purchase
of FFV. In order for FFVs to improve food security and nutrition in the region, the benefits of
FFV must be promoted to increase consumption.
Near term:
Improve understanding of food consumption patterns, dietary preferences and decision-
making patterns surrounding food item purchase (or production). In order to diversify diets
in East Africa and promote increased consumption of FFVs, a greater understanding of
people’s choices and constraints surrounding food-related decisions is necessary. The mission
could further assess information and research gaps surrounding food security and nutrition
education levels in the region. USAID could support national and international partners who
specialize in these areas to conduct targeted studies of food choices and preferences such as
THE FRESH FRUIT AND VEGETABLE MARKETS OF EAST AFRICA 48
an in-depth Knowledge Attitude and Practice (KAP) Survey. The mission could also support
further study of the region’s agro-ecological zones and nutrient-dense FFV that grow best in
varying zones. USAID could identify potential public and private sector partners for the
promotion of FFV.
Medium-long term:
Launch a comprehensive education and awareness campaign on FFV at national and
regional levels. Increased consumption of FFV will not only improve regional food security
and nutrition but drive demand and thus trade in FFV. There is an opportunity to encourage
and support PPPs in branding and marketing FFVs. USAID could support regional
campaigns aimed at increasing awareness of the nutritional importance of FFV and
promoting behavior change toward increased consumption of FFVs. The mission could also
support national, localized campaigns that promote the production of nutrient-dense FFV
according to the agro-ecological zones where they grow the best.
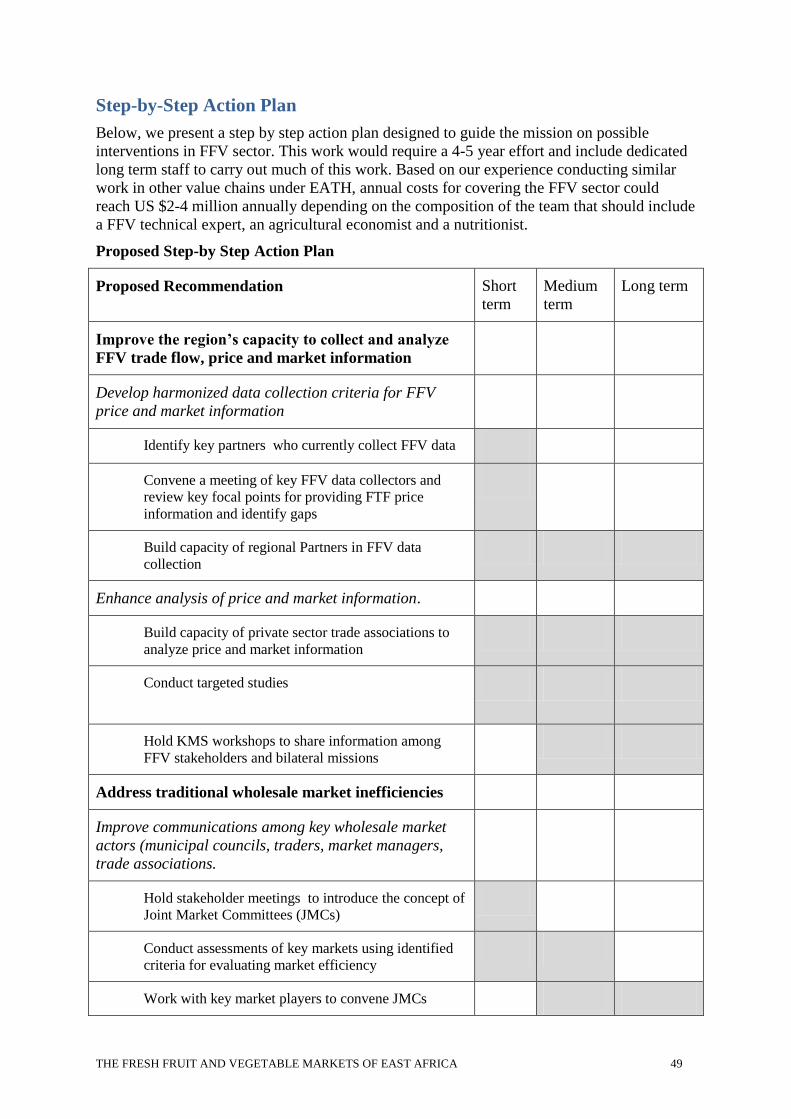
THE FRESH FRUIT AND VEGETABLE MARKETS OF EAST AFRICA 49
Step-by-Step Action Plan
Below, we present a step by step action plan designed to guide the mission on possible
interventions in FFV sector. This work would require a 4-5 year effort and include dedicated
long term staff to carry out much of this work. Based on our experience conducting similar
work in other value chains under EATH, annual costs for covering the FFV sector could
reach US $2-4 million annually depending on the composition of the team that should include
a FFV technical expert, an agricultural economist and a nutritionist.
Proposed Step-by Step Action Plan
Proposed Recommendation Short
term
Medium
term
Long term
Improve the region’s capacity to collect and analyze
FFV trade flow, price and market information
Develop harmonized data collection criteria for FFV
price and market information
Identify key partners who currently collect FFV data
Convene a meeting of key FFV data collectors and
review key focal points for providing FTF price
information and identify gaps
Build capacity of regional Partners in FFV data
collection
Enhance analysis of price and market information.
Build capacity of private sector trade associations to
analyze price and market information
Conduct targeted studies
Hold KMS workshops to share information among
FFV stakeholders and bilateral missions
Address traditional wholesale market inefficiencies
Improve communications among key wholesale market
actors (municipal councils, traders, market managers,
trade associations.
Hold stakeholder meetings to introduce the concept of
Joint Market Committees (JMCs)
Conduct assessments of key markets using identified
criteria for evaluating market efficiency
Work with key market players to convene JMCs
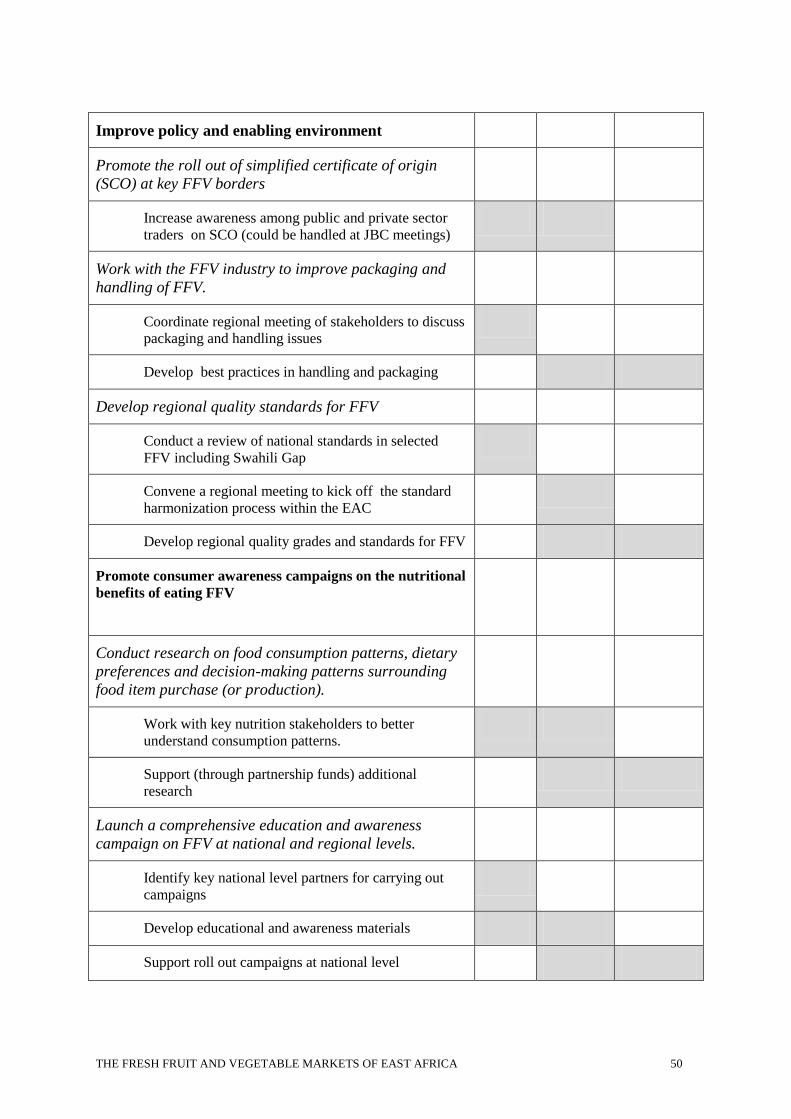
THE FRESH FRUIT AND VEGETABLE MARKETS OF EAST AFRICA 50
Improve policy and enabling environment
Promote the roll out of simplified certificate of origin
(SCO) at key FFV borders
Increase awareness among public and private sector
traders on SCO (could be handled at JBC meetings)
Work with the FFV industry to improve packaging and
handling of FFV.
Coordinate regional meeting of stakeholders to discuss
packaging and handling issues
Develop best practices in handling and packaging
Develop regional quality standards for FFV
Conduct a review of national standards in selected
FFV including Swahili Gap
Convene a regional meeting to kick off the standard
harmonization process within the EAC
Develop regional quality grades and standards for FFV
Promote consumer awareness campaigns on the nutritional
benefits of eating FFV
Conduct research on food consumption patterns, dietary
preferences and decision-making patterns surrounding
food item purchase (or production).
Work with key nutrition stakeholders to better
understand consumption patterns.
Support (through partnership funds) additional
research
Launch a comprehensive education and awareness
campaign on FFV at national and regional levels.
Identify key national level partners for carrying out
campaigns
Develop educational and awareness materials
Support roll out campaigns at national level
THE FRESH FRUIT AND VEGETABLE MARKETS OF EAST AFRICA 51
Bibliography
Dever, D. (2007). Small-farm access to high-value horticultural markets in Kenya (Case
Study No. 6-4 of the program: "Food Policy for Developing Countries: the role of
government in the global food system). Cornell University.
Ewbank, R., Nyang, M., Webo, C., & Roothaert, R. (2007). Socio-economic assessment of
four MATF-funded projects (Working Paper No.8). Farm Africa.
Farm Africa (n.d.). Kenyan farmers reap benefits from better marketing (Appropriate
Technology, Vol 36, No 1). Retrieved from Maendeleo Agricultural Technology Fund
website: http://www.farmafrica.org.uk
Farm Concern International (n.d.). The agricultural input/ output value chain analysis of
embu, Meru, Iaita, and Makueni. CNFA Inc., AgMark, and Farm Concern
International
Farm Concern International (2006). Brief: viable market opportunities and investigative
research on market threats for urban and peri-urban farms. Farm Concern
International, Urban Harvest, International Potato Center.
Farm Concern International (n.d.). Business opportunities brief: watermelon, green grams,
bulb onion, tomatoes and sunflower. CNFA Inc., AgMark, and Farm Concern
International.
Freedman, Jim (2000). Transforming Development: Foreign Aid for a Changing World.
University of Toronto Press.
Haiyan, Tu. (2008). A Reconnaissance Study of the Citrus Value Chains in Tanga Region,
Tanzania. Larenstein University of Applied Science. Wageningen, The Netherlands.
Japan International Cooperation Agency (2013). A study report on horticulture sub-sector in
Uganda (Draft). JICA.
Kamau, M., J. Olwande and J. Githuku. (2011). Consumption and Expenditures on Key Food
Commodities in Urban Households: the Case of Nairobi. Tegemeo Working Paper
41. Nairobi; Tegemeo Institute, Egerton University.
Karuga, S. (2010). Kenya's Regional Horticulture Trade (Draft Report). USAID/KHDP.
Keatinge, J.D.H. et al. (2010). Relearning Old Lessons for the Future of Food—By Bread
Alone No Longer: diversifying diets with fruit and vegetables. Crop Science, Vol. 50,
March-April. www.crops.org
Kenya Horticulture Competitiveness Project (2012). KHCP Final Report: Horticulture Audit
June 2011-March 2012. Fintrac, Inc.
Kenya Horticulture Competitiveness Project (n.d.). Kenya’s intra Africa horticulture trade.
Fintrac for USAID. Retrieved from: http://www.growkenya.org
THE FRESH FRUIT AND VEGETABLE MARKETS OF EAST AFRICA 52
Kenya Horticulture Competitiveness Project (n.d.). Fruits and vegetables retail audit. Fintrac
for USAID. Retrieved from: http://www.growkenya.org
Kenya Horticulture Competitiveness Project (2011, July). Horticulture retail audit. Fintrac for
USAID. Retrieved from: http://www.growkenya.org
Koenig, T., Blatt, J., Brakel, K., Kloss, K., Nilges, T., & Woellert, F. (2008). Market-driven
development and poverty reduction: A value chain analysis of fresh vegetables in
Kenya and Tanzania (SLE Series). Humboldt Universitat Zu Berlin, Center for
Advanced Training in Rural Development.
Makorere, R., & Mbiha, E. (2012). Evaluation of efficiency of orange marketing system in
Tanzania: Empirical evidence from Muheza district in Tanga region. Department of
Agricultural Economics, Sokoine University of Agriculture, Tanzania.
Mathenge, M., & Tschirley, D. (2006). Seasonal analysis of selected fresh fruit and vegetable
prices at wholesale level in key urban markets of Kenya (Working Paper No. 22).
Tegemeo Institue of Agricultural Policy and Development, Egerton University.
Ngugi, I. K. , R. Gitau, J. Nyoro (2007). Access to high value markets by smallholder farmers
of African indigenous vegetables in Kenya, Regoverning Markets Innovative Practice
series, IIED, London.
Nyoro, J. (2004). Regoverning markets: securing small-scale producer participation in
restructured national and regional agri-food systems. Case of supermarkets as outlet
for fresh fruits and vegetables and dairy in Kenya and Uganda. Tegemeo Institute of
Agricultural Policy and Development, Egerton University.
Onduru, Davies (2008). Improving the Tanzania—Mombasa Cross-border Tomato Product
Chain: A study of Mombasa tomato market. ETC East Africa Ltd. For the Agricultural
Economics Research Institute, Wageningen University. www.etc-international.org
Otieno, Brian. 8 August 2012. Kenya: Kongowea Market Traders Protest Increased Levies.
All Africa Retrieved from: www.allafrica.com
Tanzania Horticultural Association (2012). Position Paper: Key Policy Issues Affecting
Tanzania's Horticultural Industry. Tanzania Horticultural Association.
Tschirley, D. (2011). What is the scope for horticulture to drive smallholder poverty
reduction in Africa? Policy Synthesis for cooperating USAID Offices and Country
Missions (No.88). Michigan State University.
Tschirley, D., Ayieko, M., Hichaambwa, M., Goeb, J., & Loescher, W. (2010). Modernizing
africa's fresh produce supply chains without rapid supermarket takeover: towards a
definition of research and investment priorities (MSU International Development
Working Paper No. 106). Michigan State University, Department of Agricultural,
Food, and Resource Economics.
THE FRESH FRUIT AND VEGETABLE MARKETS OF EAST AFRICA 53
Tschirley, D., Muendo, K. M., & Weber, M. T. (2004). Improving Kenya's domestic
horticultural production and marketing system: current competitiveness, forces of
change and challenges for the future (Working Paper no. 08B). Tegemeo Institue of
Agricultural Policy and Devleopment, Egerton University.
Tschirley, D. L., Muendo, K. M., Ayieko, M., & Weber, M. T. (2004). Improving Kenya's
domestic horticulture marketing system: competitiveness, forces of change and
challenges for the future (Policy Brief No. 4). Retrieved from Tegemeo Institute for
Agricultural Policy and Development website:
http://www.tegemeo.org/publications.asp
Tschirley, David and M. Ayieko. 2008. Assessment of Kenya’s Domestic Horticultural
Production and Marketing Systems and Lessons Learned for the Future. Tegemeo
Working Paper 32. Nairobi; Tegemeo Institute of Agriculture Policy and
Development, Egerton University.
Tu, H. (2008). A reconnaissance study of the citrus value chains in Tanga region, Tanzania.
Larenstein University, Wageningen, The Netherlands.
United States Agency for International Development. 2011. Horticulture Market News:
February 2011. Kenya Horticulture Competitiveness Project.
World Food Program. 2009. Comprehensive Food Security & Vulnerability Analysis
Uganda. WFP VAM Food Security Analysis.
World Food Program 2010. Comprehensive Food Security & Vulnerability Analysis
Tanzania. WFP VAM Food Security Analysis.
World Food Program 2010. Comprehensive Food Security & Vulnerability Analysis Kenya
High Density Urban Areas. WFP VAM Food Security Analysis.
World Food Programme (2012). Unconditional cash tansfer baseline survey. World Food
Programme.
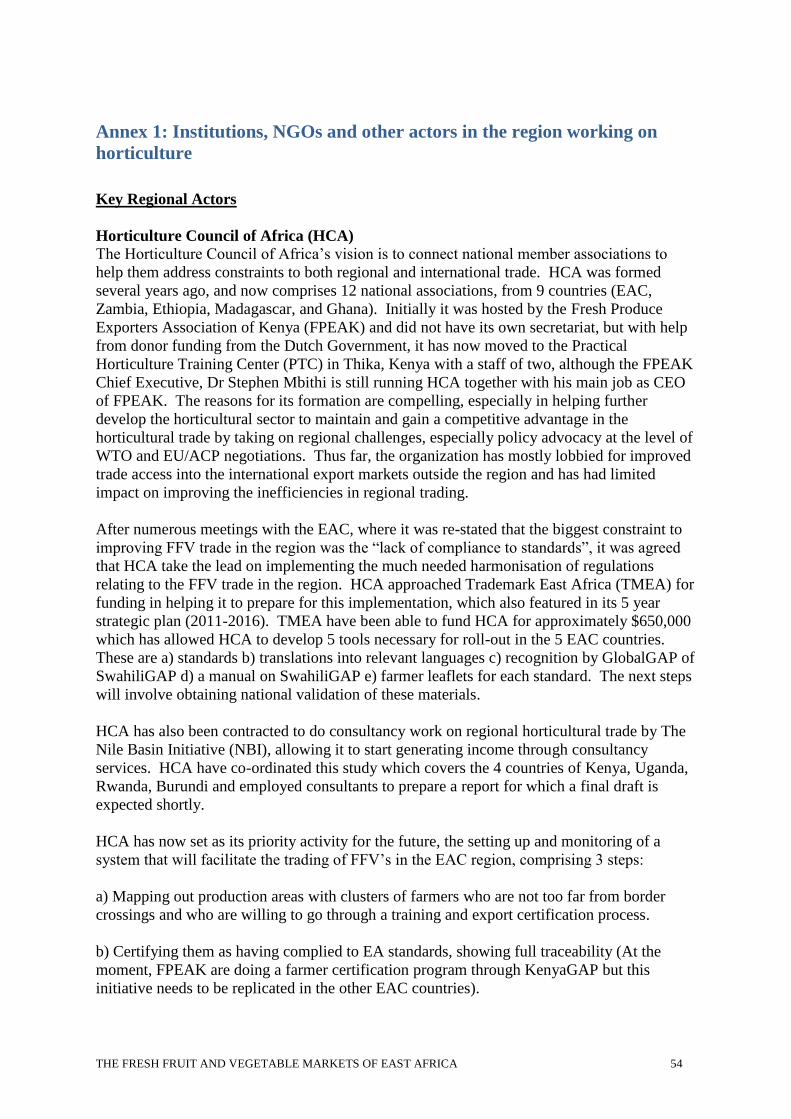
THE FRESH FRUIT AND VEGETABLE MARKETS OF EAST AFRICA 54
Annex 1: Institutions, NGOs and other actors in the region working on
horticulture
Key Regional Actors
Horticulture Council of Africa (HCA)
The Horticulture Council of Africa’s vision is to connect national member associations to
help them address constraints to both regional and international trade. HCA was formed
several years ago, and now comprises 12 national associations, from 9 countries (EAC,
Zambia, Ethiopia, Madagascar, and Ghana). Initially it was hosted by the Fresh Produce
Exporters Association of Kenya (FPEAK) and did not have its own secretariat, but with help
from donor funding from the Dutch Government, it has now moved to the Practical
Horticulture Training Center (PTC) in Thika, Kenya with a staff of two, although the FPEAK
Chief Executive, Dr Stephen Mbithi is still running HCA together with his main job as CEO
of FPEAK. The reasons for its formation are compelling, especially in helping further
develop the horticultural sector to maintain and gain a competitive advantage in the
horticultural trade by taking on regional challenges, especially policy advocacy at the level of
WTO and EU/ACP negotiations. Thus far, the organization has mostly lobbied for improved
trade access into the international export markets outside the region and has had limited
impact on improving the inefficiencies in regional trading.
After numerous meetings with the EAC, where it was re-stated that the biggest constraint to
improving FFV trade in the region was the “lack of compliance to standards”, it was agreed
that HCA take the lead on implementing the much needed harmonisation of regulations
relating to the FFV trade in the region. HCA approached Trademark East Africa (TMEA) for
funding in helping it to prepare for this implementation, which also featured in its 5 year
strategic plan (2011-2016). TMEA have been able to fund HCA for approximately $650,000
which has allowed HCA to develop 5 tools necessary for roll-out in the 5 EAC countries.
These are a) standards b) translations into relevant languages c) recognition by GlobalGAP of
SwahiliGAP d) a manual on SwahiliGAP e) farmer leaflets for each standard. The next steps
will involve obtaining national validation of these materials.
HCA has also been contracted to do consultancy work on regional horticultural trade by The
Nile Basin Initiative (NBI), allowing it to start generating income through consultancy
services. HCA have co-ordinated this study which covers the 4 countries of Kenya, Uganda,
Rwanda, Burundi and employed consultants to prepare a report for which a final draft is
expected shortly.
HCA has now set as its priority activity for the future, the setting up and monitoring of a
system that will facilitate the trading of FFV’s in the EAC region, comprising 3 steps:
a) Mapping out production areas with clusters of farmers who are not too far from border
crossings and who are willing to go through a training and export certification process.
b) Certifying them as having complied to EA standards, showing full traceability (At the
moment, FPEAK are doing a farmer certification program through KenyaGAP but this
initiative needs to be replicated in the other EAC countries).
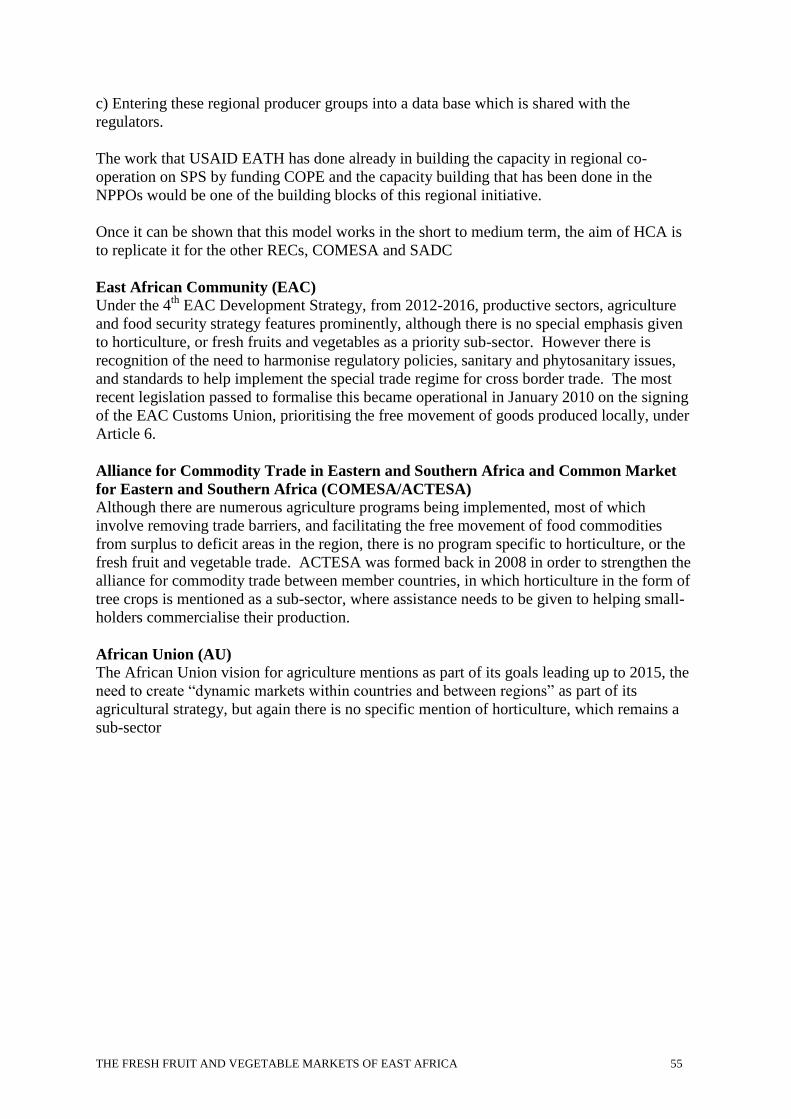
THE FRESH FRUIT AND VEGETABLE MARKETS OF EAST AFRICA 55
c) Entering these regional producer groups into a data base which is shared with the
regulators.
The work that USAID EATH has done already in building the capacity in regional co-
operation on SPS by funding COPE and the capacity building that has been done in the
NPPOs would be one of the building blocks of this regional initiative.
Once it can be shown that this model works in the short to medium term, the aim of HCA is
to replicate it for the other RECs, COMESA and SADC
East African Community (EAC)
Under the 4th
EAC Development Strategy, from 2012-2016, productive sectors, agriculture
and food security strategy features prominently, although there is no special emphasis given
to horticulture, or fresh fruits and vegetables as a priority sub-sector. However there is
recognition of the need to harmonise regulatory policies, sanitary and phytosanitary issues,
and standards to help implement the special trade regime for cross border trade. The most
recent legislation passed to formalise this became operational in January 2010 on the signing
of the EAC Customs Union, prioritising the free movement of goods produced locally, under
Article 6.
Alliance for Commodity Trade in Eastern and Southern Africa and Common Market
for Eastern and Southern Africa (COMESA/ACTESA)
Although there are numerous agriculture programs being implemented, most of which
involve removing trade barriers, and facilitating the free movement of food commodities
from surplus to deficit areas in the region, there is no program specific to horticulture, or the
fresh fruit and vegetable trade. ACTESA was formed back in 2008 in order to strengthen the
alliance for commodity trade between member countries, in which horticulture in the form of
tree crops is mentioned as a sub-sector, where assistance needs to be given to helping small-
holders commercialise their production.
African Union (AU)
The African Union vision for agriculture mentions as part of its goals leading up to 2015, the
need to create “dynamic markets within countries and between regions” as part of its
agricultural strategy, but again there is no specific mention of horticulture, which remains a
sub-sector
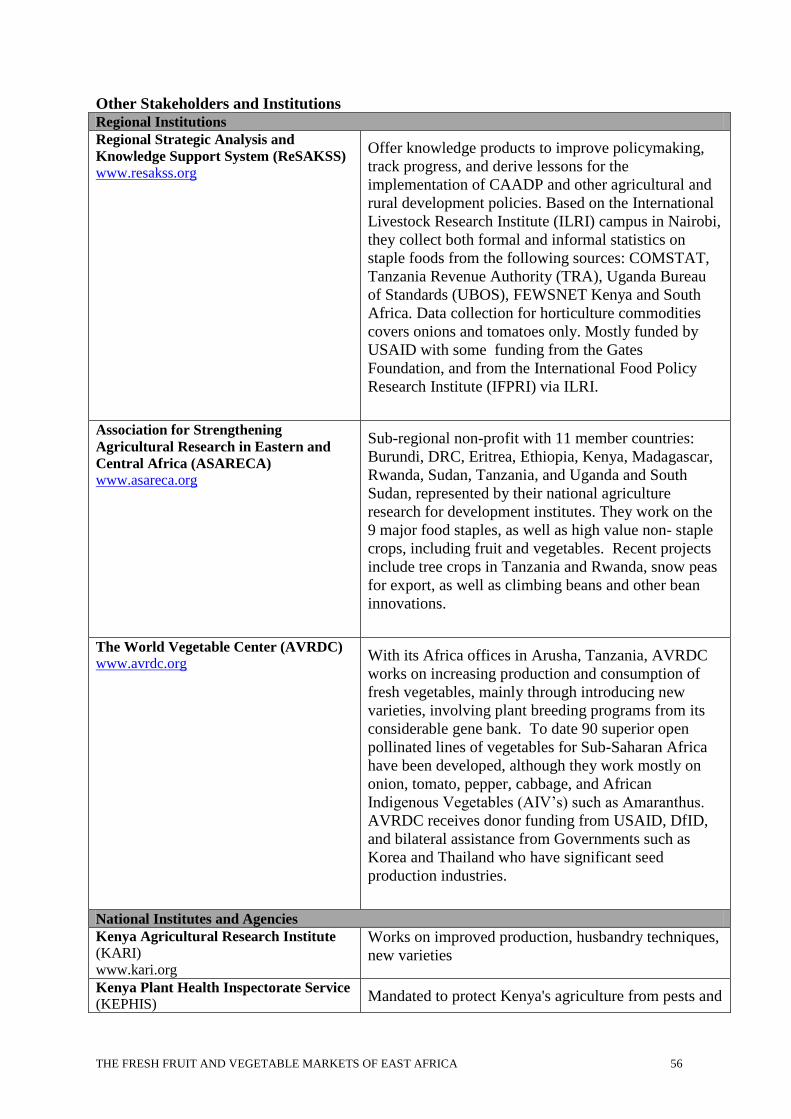
THE FRESH FRUIT AND VEGETABLE MARKETS OF EAST AFRICA 56
Other Stakeholders and Institutions
Regional Institutions
Regional Strategic Analysis and
Knowledge Support System (ReSAKSS)
www.resakss.org
Offer knowledge products to improve policymaking,
track progress, and derive lessons for the
implementation of CAADP and other agricultural and
rural development policies. Based on the International
Livestock Research Institute (ILRI) campus in Nairobi,
they collect both formal and informal statistics on
staple foods from the following sources: COMSTAT,
Tanzania Revenue Authority (TRA), Uganda Bureau
of Standards (UBOS), FEWSNET Kenya and South
Africa. Data collection for horticulture commodities
covers onions and tomatoes only. Mostly funded by
USAID with some funding from the Gates
Foundation, and from the International Food Policy
Research Institute (IFPRI) via ILRI.
Association for Strengthening
Agricultural Research in Eastern and
Central Africa (ASARECA)
www.asareca.org
Sub-regional non-profit with 11 member countries:
Burundi, DRC, Eritrea, Ethiopia, Kenya, Madagascar,
Rwanda, Sudan, Tanzania, and Uganda and South
Sudan, represented by their national agriculture
research for development institutes. They work on the
9 major food staples, as well as high value non- staple
crops, including fruit and vegetables. Recent projects
include tree crops in Tanzania and Rwanda, snow peas
for export, as well as climbing beans and other bean
innovations.
The World Vegetable Center (AVRDC)
www.avrdc.org With its Africa offices in Arusha, Tanzania, AVRDC
works on increasing production and consumption of
fresh vegetables, mainly through introducing new
varieties, involving plant breeding programs from its
considerable gene bank. To date 90 superior open
pollinated lines of vegetables for Sub-Saharan Africa
have been developed, although they work mostly on
onion, tomato, pepper, cabbage, and African
Indigenous Vegetables (AIV’s) such as Amaranthus.
AVRDC receives donor funding from USAID, DfID,
and bilateral assistance from Governments such as
Korea and Thailand who have significant seed
production industries.
National Institutes and Agencies
Kenya Agricultural Research Institute (KARI)
www.kari.org
Works on improved production, husbandry techniques,
new varieties
Kenya Plant Health Inspectorate Service (KEPHIS)
Mandated to protect Kenya's agriculture from pests and
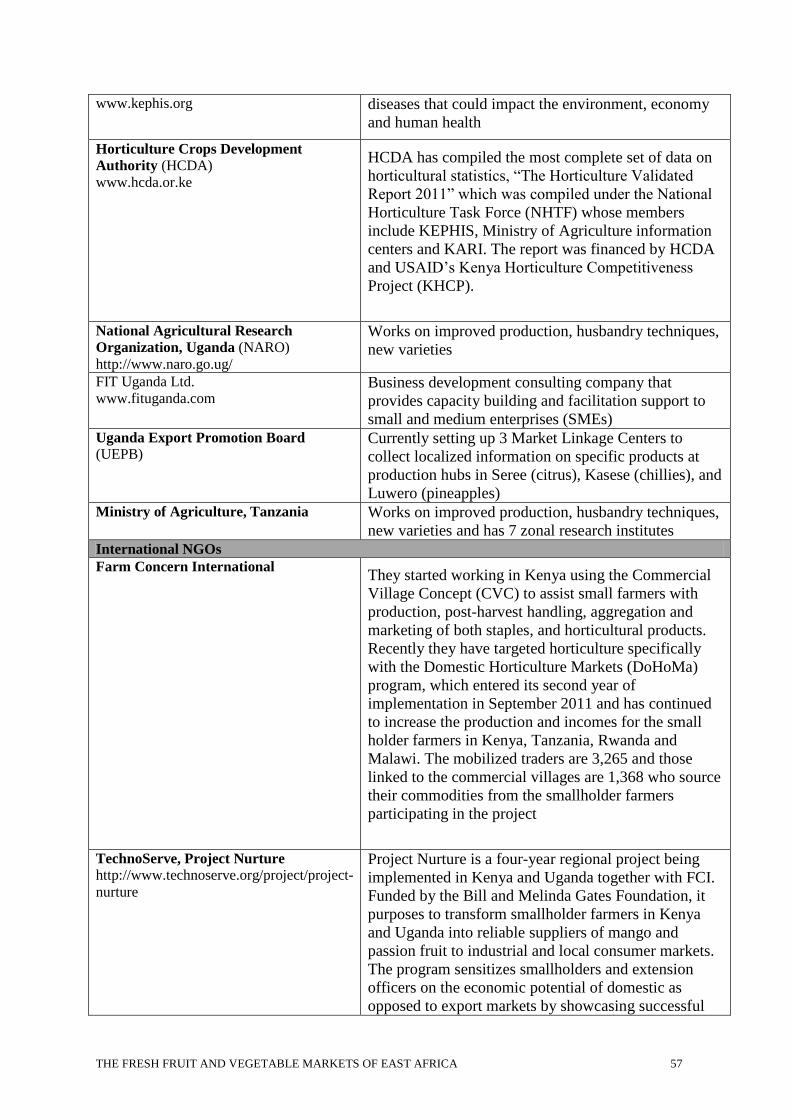
THE FRESH FRUIT AND VEGETABLE MARKETS OF EAST AFRICA 57
www.kephis.org diseases that could impact the environment, economy
and human health
Horticulture Crops Development
Authority (HCDA)
www.hcda.or.ke
HCDA has compiled the most complete set of data on
horticultural statistics, “The Horticulture Validated
Report 2011” which was compiled under the National
Horticulture Task Force (NHTF) whose members
include KEPHIS, Ministry of Agriculture information
centers and KARI. The report was financed by HCDA
and USAID’s Kenya Horticulture Competitiveness
Project (KHCP).
National Agricultural Research
Organization, Uganda (NARO)
http://www.naro.go.ug/
Works on improved production, husbandry techniques,
new varieties
FIT Uganda Ltd.
www.fituganda.com Business development consulting company that
provides capacity building and facilitation support to
small and medium enterprises (SMEs)
Uganda Export Promotion Board (UEPB)
Currently setting up 3 Market Linkage Centers to
collect localized information on specific products at
production hubs in Seree (citrus), Kasese (chillies), and
Luwero (pineapples)
Ministry of Agriculture, Tanzania Works on improved production, husbandry techniques,
new varieties and has 7 zonal research institutes
International NGOs Farm Concern International
They started working in Kenya using the Commercial
Village Concept (CVC) to assist small farmers with
production, post-harvest handling, aggregation and
marketing of both staples, and horticultural products.
Recently they have targeted horticulture specifically
with the Domestic Horticulture Markets (DoHoMa)
program, which entered its second year of
implementation in September 2011 and has continued
to increase the production and incomes for the small
holder farmers in Kenya, Tanzania, Rwanda and
Malawi. The mobilized traders are 3,265 and those
linked to the commercial villages are 1,368 who source
their commodities from the smallholder farmers
participating in the project
TechnoServe, Project Nurture
http://www.technoserve.org/project/project-
nurture
Project Nurture is a four-year regional project being
implemented in Kenya and Uganda together with FCI.
Funded by the Bill and Melinda Gates Foundation, it
purposes to transform smallholder farmers in Kenya
and Uganda into reliable suppliers of mango and
passion fruit to industrial and local consumer markets.
The program sensitizes smallholders and extension
officers on the economic potential of domestic as
opposed to export markets by showcasing successful
THE FRESH FRUIT AND VEGETABLE MARKETS OF EAST AFRICA 58
small-scale fruit producers. It also organizes small-
scale farmers into producers’ associations and assists
each association to identify a centralized produce
collection point in order to facilitate access to local
processors.
Upon its completion, revenues of the 54,000 small-
scale fruit producers in Kenya and Uganda are
projected to increase from the current $12.5million to
$25 million
Farm Africa
www.farmafrica.org Works on mango, passion fruit, pineapple production
in the region, mainly Kenya, Uganda, Tanzania,
Ethiopia. In Kenya, they work in particular in Kitui in
Eastern Province, which is more densely populated
with mangoes than anywhere else. Passion fruit work
is centred in Kwale in Coast Province where 3000
women farmers are receiving assistance in improved
orchard management, and there is also work going on
with improved pineapple production. Funding comes
through various foundations and charity donations,
some channelled through Africa Harvest’s Maendeleo
Agricultural Enterprise Fund to which small farmers
can apply for grants.
CABI
www.cabi.org Working in Kenya and Tanzania to improve yields and
reduce post-harvest losses. One of the relevant projects
is to improve access to good AIV seed for small
farmers, using funding from ASARECA. Since AIV’s
are a significant contributor to food security and
nutrition for East African smallholder farmers, they are
helping create viable and sustainable seed production
enterprises at the local level, particularly with crops
such as Amaranthus, African Nightshade, Crotalaria,
Spider Plant, Jute Mallow, and African eggplant.
National Donor Funded Projects
Kenya Horticultural Competitiveness
Program (KHCP) http://www.growkenya.org/
Implemented by Fintrac Inc. working on helping
200,000 small- scale farmers improve their
productivity, value addition, working along the value
chain in line with the objectives of the FtF Initiative.
KHCP works on specific products such as sweet
potatoes, passion fruit, onions, cabbages. The project is
implemented in cooperation with Kenyan private and
public sector partners through grants aimed at engaging
marginalized groups such as women and youth and
improving competitiveness and livelihoods throughout
Kenya.
The program aims to increase incomes for 200,000
small farmers and strengthen their businesses network
by improving and creating local, regional and global
THE FRESH FRUIT AND VEGETABLE MARKETS OF EAST AFRICA 59
market opportunities. This project will help Kenyans
feed themselves by building a countrywide horticulture
distribution network that provides a year-round supply
of high-quality, nutritious products grown by Kenyan
farmers.
Part of the FtF initiative, KHCP believes that this kind
of environment will increase rural incomes, create jobs,
and improve food security.
Tanzania Agricultural Productivity
Program (TAPP)
http://www.tanzania-agric.org/
Based in Arusha and implemented by Fintrac Inc.,
TAPP is a 5 year program that started in 2009, funded
by USAID Tanzania. The project aims to help improve
smallholder incomes, through improved productivity,
improved nutrition, and better access to markets, and a
large part of their product portfolio is made up of
horticultural products. Their six target zones are
Arusha, Kilimanjaro, Lushoto, Morogoro, Coastal
strip, and Zanzibar.
Kenya Agricultural Value Chain
Enterprises (KAVES) Project Awarded early 2013, and is now in start-up, KAVES
includes horticulture along with other staple food value
chains. It is a bilateral program focused on the 2 FtF
priority geographic regions, HR1 (High Rainfall 1), in
the west of Kenya, and SA2 (Semi Arid 2), in the east
of Kenya. The work involves continuing existing
agronomy support to smallholders on improving yields,
post-harvest handling, and market linkages, for a range
of crops particularly those with high nutritional profiles
such as the green leafy vegetables and orange fleshed
sweet potatoes.
Regional and National Trade Associations
Horticultural Council of Africa (HCA)
http://www.fpeak.org/hca.html
An umbrella organisation for 13 national horticultural
trade associations in Africa. Members of HCA are
drawn from the major horticulture exporting countries
of the Eastern, Central and Southern Africa (ECSA)
region. They include Kenya, Uganda, Zambia,
Tanzania, Zimbabwe, South Africa, Burundi, Rwanda,
and Ethiopia. Their mission is to promote growth of
horticultural sector in the East, Central and Southern
Africa Region through information sharing,
collaborative research/technology, environmental
stability and collective bargaining.
Fresh Produce Exporters Association
of Kenya (FPEAK)
www.fpeak.org
Representing mainly fresh produce exporters, but also
has in its membership domestic horticulture
companies.
THE FRESH FRUIT AND VEGETABLE MARKETS OF EAST AFRICA 60
Horticulture Exporters Association,
Uganda (HORTEXA)
http://www.agro-
info.net/?website_id=7317
Has depended largely on donor funding for many
years, as well as the relatively newly-formed
Horticulture Promotion Organisation of Uganda
(HPOU) in 2005, with 30 members. They are assisting
HORTEXA with the National Working Group on
codes of practice, as well as the Quality, Infrastructure
and Standards Project (QUISP) funded by SIDA
together with the Ministry of Trade, Industry and Co-
operatives.
Tanzania Horticulture Association (TAHA)
www.tanzaniahorticulture.com
Based in Arusha, TAHA represents both domestic and
export companies, with some funding from TAPP.
A main reference point for collection of horticultural
data in Tanzania, from both national wholesale
markets, and export data from border crossings.
National NGOs
Africa Harvest Africa Harvest is a Kenyan NGO that works with the
National Banana Association, on programs targeted
toward the expanded use of tissue culture to help
farmers become less exposed to crop diseases. Some
of their funding comes from Rockefeller Foundation.
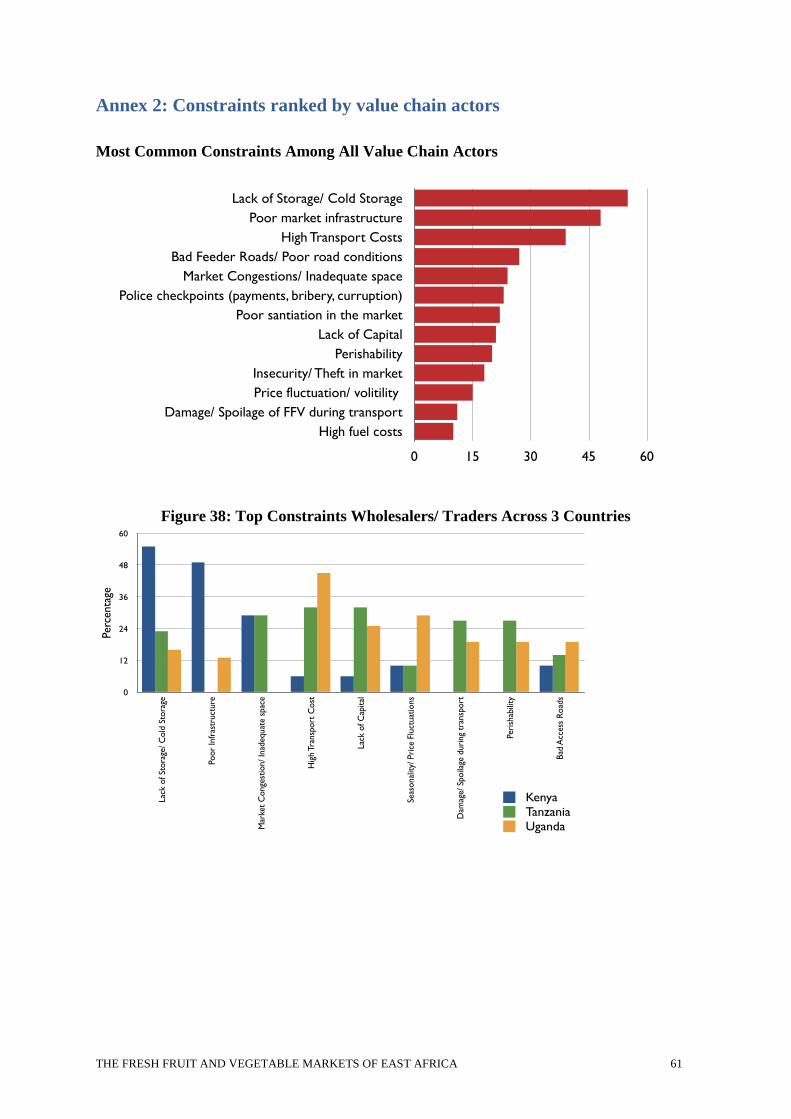
THE FRESH FRUIT AND VEGETABLE MARKETS OF EAST AFRICA 61
Annex 2: Constraints ranked by value chain actors
Most Common Constraints Among All Value Chain Actors
Figure 38: Top Constraints Wholesalers/ Traders Across 3 Countries
Lack of Storage/ Cold Storage
Poor market infrastructure
High Transport Costs
Bad Feeder Roads/ Poor road conditions
Market Congestions/ Inadequate space
Police checkpoints (payments, bribery, curruption)
Poor santiation in the market
Lack of Capital
Perishability
Insecurity/ Theft in market
Price fluctuation/ volitility
Damage/ Spoilage of FFV during transport
High fuel costs
0 15 30 45 60
Figure 7: Most Common Constraints Among All Value Chain Actors
0
12
24
36
48
60
Lac
k of St
ora
ge/
Cold
Sto
rage
Poor
Infr
astr
uct
ure
Mar
ket
Conge
stio
n/
Inad
equat
e sp
ace
Hig
h T
ransp
ort
Cost
Lac
k of C
apital
Seas
onal
ity/
Pri
ce F
luct
uat
ions
Dam
age/
Spoila
ge d
uri
ng
tran
sport
Peri
shab
ility
Bad
Acc
ess
Road
s
Figure 8. Top Constraints Wholesalers/ Traders Across 3 countries
Per
centa
ge
Kenya
Tanzania
Uganda
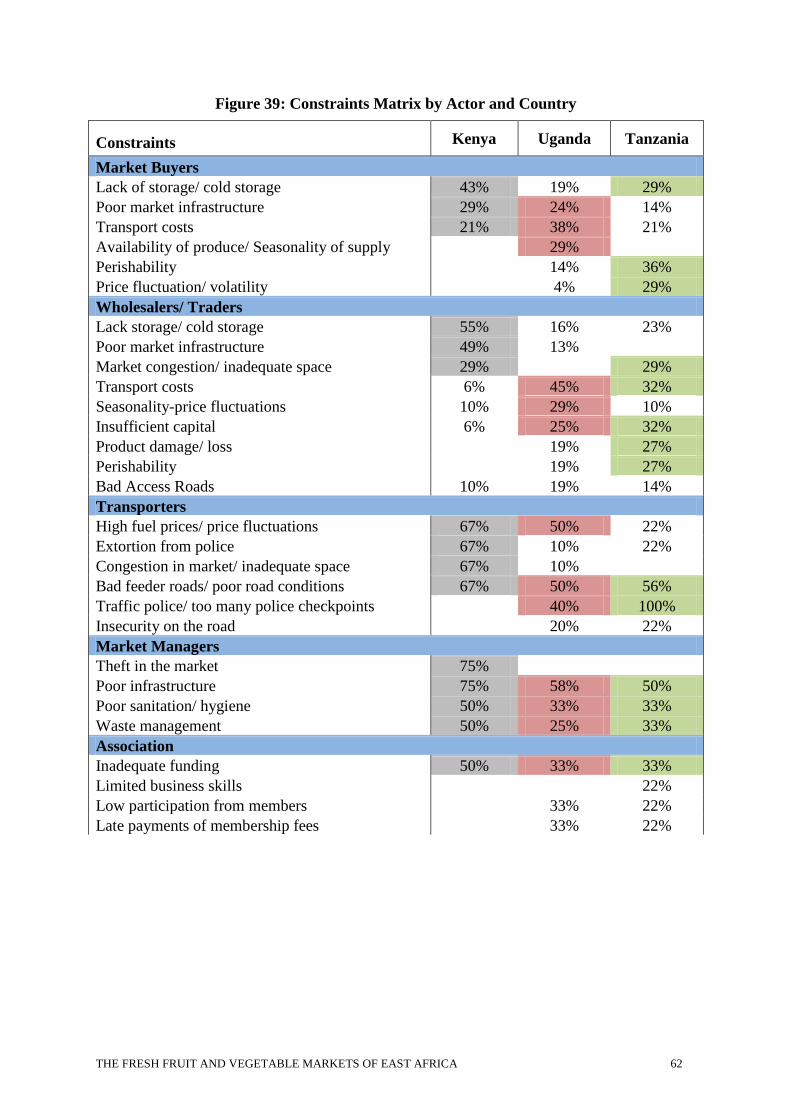
THE FRESH FRUIT AND VEGETABLE MARKETS OF EAST AFRICA 62
Figure 39: Constraints Matrix by Actor and Country
Constraints Kenya Uganda Tanzania
Market Buyers
Lack of storage/ cold storage 43% 19% 29%
Poor market infrastructure 29% 24% 14%
Transport costs 21% 38% 21%
Availability of produce/ Seasonality of supply
29%
Perishability
14% 36%
Price fluctuation/ volatility
4% 29%
Wholesalers/ Traders
Lack storage/ cold storage 55% 16% 23%
Poor market infrastructure 49% 13%
Market congestion/ inadequate space 29%
29%
Transport costs 6% 45% 32%
Seasonality-price fluctuations 10% 29% 10%
Insufficient capital 6% 25% 32%
Product damage/ loss
19% 27%
Perishability
19% 27%
Bad Access Roads 10% 19% 14%
Transporters
High fuel prices/ price fluctuations 67% 50% 22%
Extortion from police 67% 10% 22%
Congestion in market/ inadequate space 67% 10%
Bad feeder roads/ poor road conditions 67% 50% 56%
Traffic police/ too many police checkpoints
40% 100%
Insecurity on the road
20% 22%
Market Managers
Theft in the market 75%
Poor infrastructure 75% 58% 50%
Poor sanitation/ hygiene 50% 33% 33%
Waste management 50% 25% 33%
Association
Inadequate funding 50% 33% 33%
Limited business skills
22%
Low participation from members
33% 22%
Late payments of membership fees 33% 22%
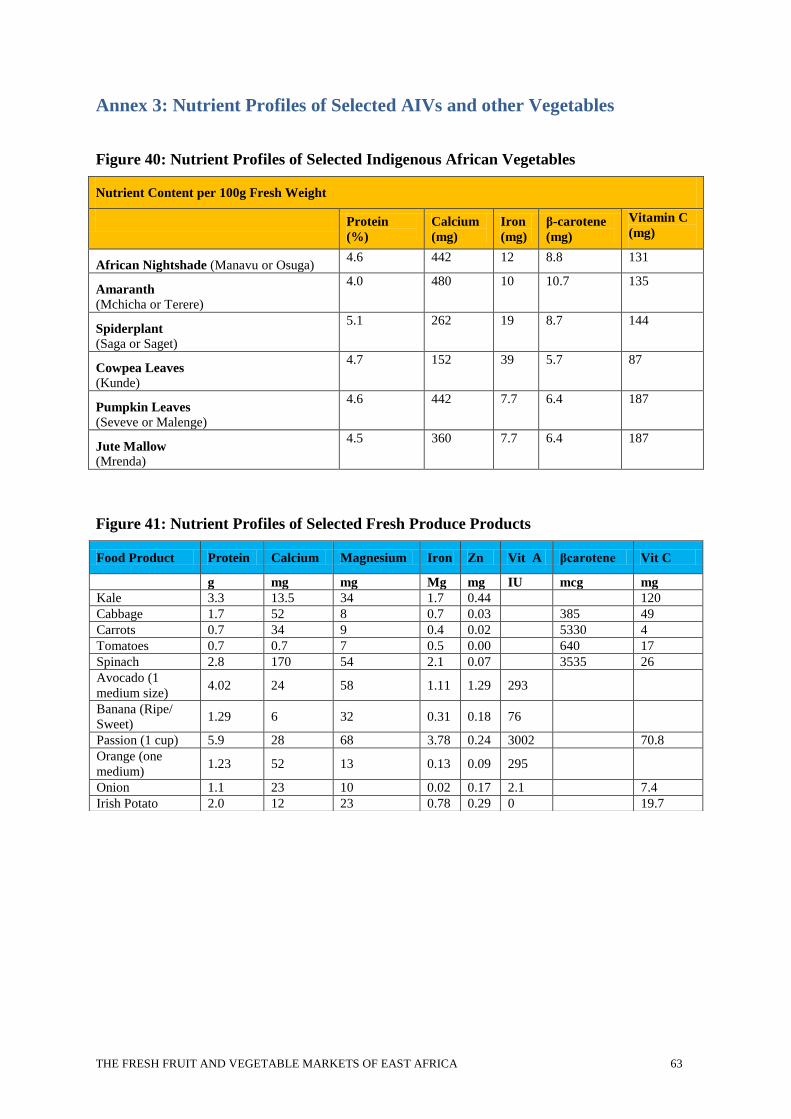
THE FRESH FRUIT AND VEGETABLE MARKETS OF EAST AFRICA 63
Annex 3: Nutrient Profiles of Selected AIVs and other Vegetables
Figure 40: Nutrient Profiles of Selected Indigenous African Vegetables
Nutrient Content per 100g Fresh Weight
Protein
(%)
Calcium
(mg)
Iron
(mg)
β-carotene
(mg)
Vitamin C
(mg)
African Nightshade (Manavu or Osuga) 4.6 442 12 8.8 131
Amaranth
(Mchicha or Terere)
4.0 480 10 10.7 135
Spiderplant
(Saga or Saget)
5.1 262 19 8.7 144
Cowpea Leaves
(Kunde)
4.7 152 39 5.7 87
Pumpkin Leaves
(Seveve or Malenge)
4.6 442 7.7 6.4 187
Jute Mallow
(Mrenda)
4.5 360 7.7 6.4 187
Figure 41: Nutrient Profiles of Selected Fresh Produce Products
Food Product Protein Calcium Magnesium Iron Zn Vit A βcarotene Vit C
g mg mg Mg mg IU mcg mg
Kale 3.3 13.5 34 1.7 0.44 120
Cabbage 1.7 52 8 0.7 0.03 385 49
Carrots 0.7 34 9 0.4 0.02 5330 4
Tomatoes 0.7 0.7 7 0.5 0.00 640 17
Spinach 2.8 170 54 2.1 0.07 3535 26
Avocado (1
medium size) 4.02 24 58 1.11 1.29 293
Banana (Ripe/
Sweet) 1.29 6 32 0.31 0.18 76
Passion (1 cup) 5.9 28 68 3.78 0.24 3002 70.8
Orange (one
medium) 1.23 52 13 0.13 0.09 295
Onion 1.1 23 10 0.02 0.17 2.1 7.4
Irish Potato 2.0 12 23 0.78 0.29 0 19.7
THE FRESH FRUIT AND VEGETABLE MARKETS OF EAST AFRICA 64
Annex 3: Notes on Methodology
Rational USAID seeks to understand the opportunities to increase regional trade in select horticulture
crops to balance out seasonal variations in supply from one area to another, increase the
availability, and reduce the average price of nutritious foods throughout the whole year. It is
hypothesized that increased availability and lower prices of fruits and vegetables will
significantly improve the quality of diets in the region, while improved production and post-
harvest practices will improve product quality and lead to increased competitiveness and
trade. Growth in this area will also provide incentives for smallholder farmers to diversify
production, improving household livelihoods.
Previous work in this area used statistics gleaned from phytosanitary inspection offices, such
as Kenya Plant Health Inspectorate Service (KEPHIS), or customs data from central offices
and border crossings. However, formal statistics do not accurately represent the FFV sector
because trade is largely informal. Thus, addressing the constraints to regional trade in FFV
requires a better understanding how both formal and informal trade operates, the location of
major markets, and the major market actors.
Objective of the Study
The objective of this study was to assess the major trade flows for horticulture products in
East Africa to understand the dynamics of regional trade in FFV, highlight weaknesses in the
value chain, and propose interventions that could be developed to address food security and
nutritional deficiencies through increased intra-regional trade. This study builds on the
2011regional horticulture study completed by EATH, as well as other horticultural reports
from bilateral projects and Missions in the region. It considers horticultural crops that are
traded in significant quantities, which were identified in the preceding EATH study which
may present significant and previously unidentified potential in terms of growth,
competitiveness, and nutritional impact. Many of the more nutritious crops, like African
Indigenous Vegetables (AIVs) and orange fleshed sweet potatoes are highly perishable and
significant structural changes may need to occur before these products can be traded
competitively across borders.
General Approach
In-depth desk research was conducted on the regional FFV sector and various FFV value
chains in Uganda, Kenya and Tanzania. We also used empirical methods to support
secondary data collection. The assessment team conducted interviews with market
participants and key stakeholders and experts. Based on primary and secondary data
collection and analysis, EATH made conclusions and recommendations to USAID.
The research team included a national consultant in Kenya, Uganda and Tanzania and a
Kenya-based nutrition expert. The team conducted desk research of the horticulture trade and
nutrition prior to the initiation of fieldwork. Fieldwork was supervised by the EATH Staple
Foods Specialist, and desk research, overall coordination, design, data analysis, synthesis,
and writing was completed by a DC-based value chain consultant who traveled to the region
for consultation and oversight. Consultants in each country conducted surveys in targeted
regions, using questionnaires tailored for various stakeholders.
THE FRESH FRUIT AND VEGETABLE MARKETS OF EAST AFRICA 65
Site Selection
The countries in this study were selected based on their central location in the region, their
strong production capacity for horticultural products, the existence of known and vibrant
trade routes, and the existence of a customs union which promotes increased trade between
the countries. Kenya is a global leader in horticulture exports, yet is a net importer of fresh
fruits and vegetables. Uganda and Tanzania are both net exporters of horticulture and major
trading partners with Kenya. Given the climate and growing conditions, all three countries
have great potential for growth as demand in the region expands.
Regions, districts, wholesale and retail markets, aggregation points, and border points were
selected based on a number of factors. Given the focus of the FTF strategy on the Northern
and Central transport corridors, sites were selected based on their proximity to these corridors
and their role in feeding or receiving produce that transits through the corridors. Individual
markets, aggregation points, and border posts were selected based on reported and known
volumes of produce that passes through them as part of a regional horticultural value chain.
In some sites, multiple markets were visited because each was responsible for different
produce. For instance, Wakulima Market is the main FFV wholesale market in Nairobi, but
tomatoes are not traded there, but rather, in the adjacent Marigiti Market.
Approach to Fieldwork and Data Collection
Data collection was done through desk research, field surveys, and interviews with
stakeholders such as industry associations, large businesses, NGOs. Fieldwork was conducted
over a twelve week period in each country between June and September 2012. The field team
conducted official interviews with 195 industry stakeholders representing five different
segments of the population: Wholesale Traders, Retailers, Transporters, Associations, and
Market Managers across Kenya, Tanzania, and Uganda. Data was gathered in regional
wholesale markets in urban areas where our teams interviewed traders and aggregators,
buyers and sellers, and managers and local trade association representatives.
Instruments were tested and refined during the initial stages of field research to ensure
consistency, sufficient response rates, and relevance. The survey instruments included
identifying and demographic information and contained a mixture of quantitative and
qualitative questions tailored for the type of respondent. Snowball sampling was used to
identify survey participants. Men and women were asked about product choices, purchase
and sale locations, sales volumes and values, export and import activities, packaging,
transportation, nutrition awareness, and perceptions of constraints and solutions for the
sector. Gaps in the data reflect instances when respondents refused to answer certain
questions.
Field consultants also conducted key informant interviews with industry stakeholders from
government, the private sector, and NGOs to collect anecdotal information about the
horticulture sector and its potential for expansion in regional trade. Interviews were also
conducted with representatives from major commercial fruit and vegetable actors in the
supermarket industry in Kenya, in order to inform a snapshot narrative of the current status of
the supermarket industry in the region and the roles of retailers, distributors, and wholesalers.
Analysis of Primary Data
The primary data analysis for this study is descriptive. Analysis was done through
transcription of questionnaire data into a spreadsheet, enabling comparison and summary
across countries, regions, and sites. The qualitative analysis was also compared with the
THE FRESH FRUIT AND VEGETABLE MARKETS OF EAST AFRICA 66
secondary literature data when possible. Data is presented using descriptive statistics through
tables and graphs to show information such as import and export, market volumes, and FFVs
price statistics.
Limitations of Methodology
Because most trade in FFV is largely unrecorded, obtaining quantitative data is difficult.
Research in this study is therefore, qualitative, using structured and unstructured with experts
and industry stakeholders as well as a review of recent literature. The findings are largely
empirical—based on observation—but considered to be anecdotal and indicative rather than
statistically rigorous. This approach was born out of necessity, in that horticulture trade in
East Africa is largely informal and non-transparent.
Seventy to 80 percent of regional cross-border trade in FFV goes unrecorded by relevant
authorities. There is a severe lack of published statistics at the local level, and those that are
published, like customs figures, data from phytosanitary inspection offices, or market
information, are recorded inconsistently across different bodies, making comparability
impossible.
Interviews frequently encountered difficulties finding people willing to be interviewed. Many
people were concerned that the information would be used by competitors, or about potential
tax liabilities of reporting accurate figures. Moreover, most traders and business owners did
not keep records, responses were based on memory or unverified estimates. These
limitations could affect the quality of data collected.
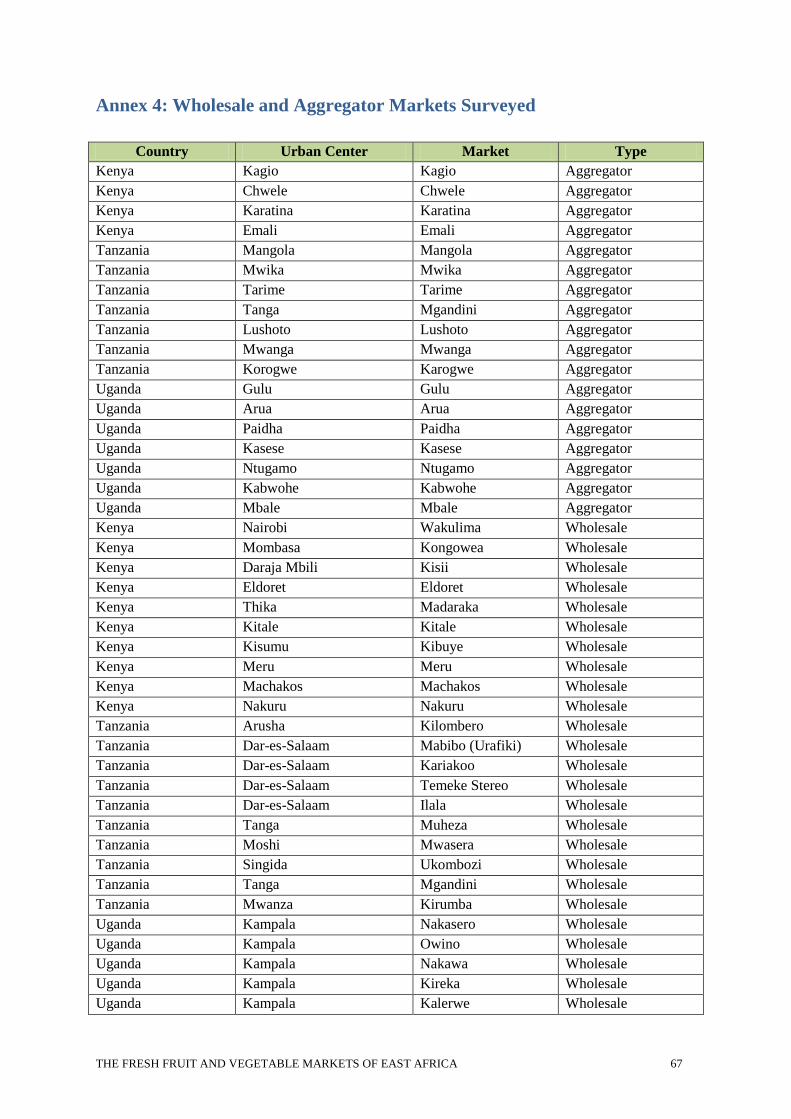
THE FRESH FRUIT AND VEGETABLE MARKETS OF EAST AFRICA 67
Annex 4: Wholesale and Aggregator Markets Surveyed
Country Urban Center Market Type
Kenya Kagio Kagio Aggregator
Kenya Chwele Chwele Aggregator
Kenya Karatina Karatina Aggregator
Kenya Emali Emali Aggregator
Tanzania Mangola Mangola Aggregator
Tanzania Mwika Mwika Aggregator
Tanzania Tarime Tarime Aggregator
Tanzania Tanga Mgandini Aggregator
Tanzania Lushoto Lushoto Aggregator
Tanzania Mwanga Mwanga Aggregator
Tanzania Korogwe Karogwe Aggregator
Uganda Gulu Gulu Aggregator
Uganda Arua Arua Aggregator
Uganda Paidha Paidha Aggregator
Uganda Kasese Kasese Aggregator
Uganda Ntugamo Ntugamo Aggregator
Uganda Kabwohe Kabwohe Aggregator
Uganda Mbale Mbale Aggregator
Kenya Nairobi Wakulima Wholesale
Kenya Mombasa Kongowea Wholesale
Kenya Daraja Mbili Kisii Wholesale
Kenya Eldoret Eldoret Wholesale
Kenya Thika Madaraka Wholesale
Kenya Kitale Kitale Wholesale
Kenya Kisumu Kibuye Wholesale
Kenya Meru Meru Wholesale
Kenya Machakos Machakos Wholesale
Kenya Nakuru Nakuru Wholesale
Tanzania Arusha Kilombero Wholesale
Tanzania Dar-es-Salaam Mabibo (Urafiki) Wholesale
Tanzania Dar-es-Salaam Kariakoo Wholesale
Tanzania Dar-es-Salaam Temeke Stereo Wholesale
Tanzania Dar-es-Salaam Ilala Wholesale
Tanzania Tanga Muheza Wholesale
Tanzania Moshi Mwasera Wholesale
Tanzania Singida Ukombozi Wholesale
Tanzania Tanga Mgandini Wholesale
Tanzania Mwanza Kirumba Wholesale
Uganda Kampala Nakasero Wholesale
Uganda Kampala Owino Wholesale
Uganda Kampala Nakawa Wholesale
Uganda Kampala Kireka Wholesale
Uganda Kampala Kalerwe Wholesale
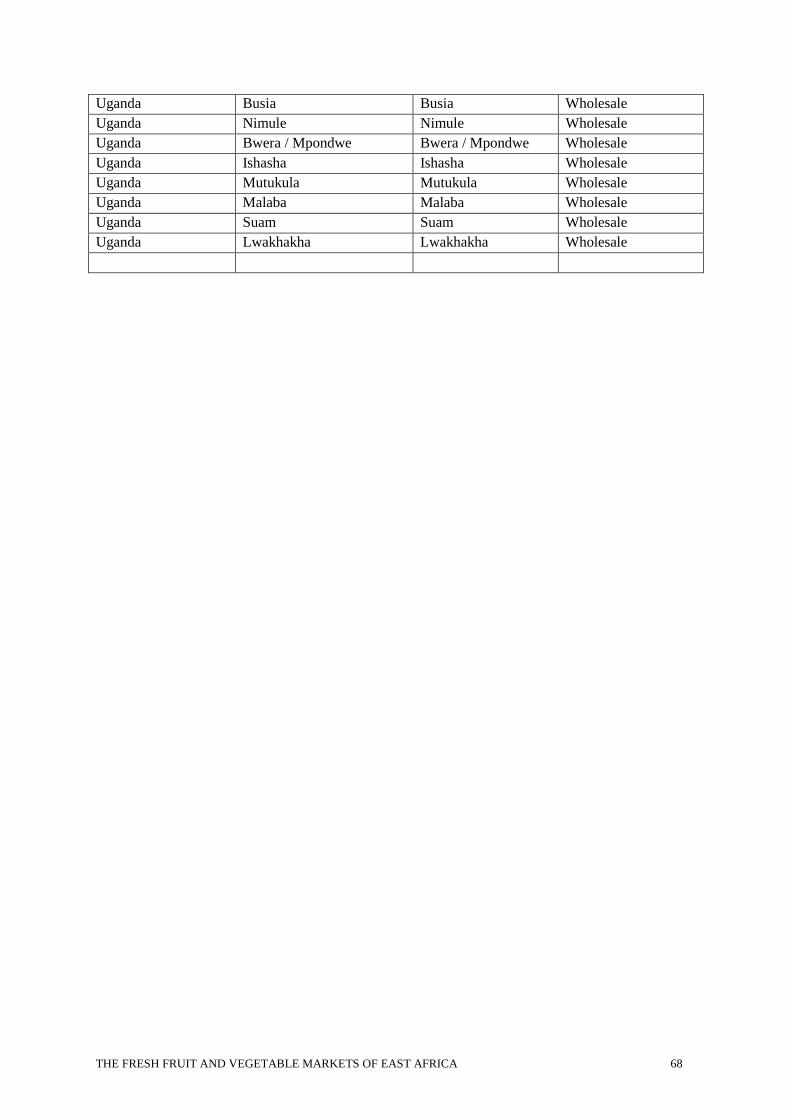
THE FRESH FRUIT AND VEGETABLE MARKETS OF EAST AFRICA 68
Uganda Busia Busia Wholesale
Uganda Nimule Nimule Wholesale
Uganda Bwera / Mpondwe Bwera / Mpondwe Wholesale
Uganda Ishasha Ishasha Wholesale
Uganda Mutukula Mutukula Wholesale
Uganda Malaba Malaba Wholesale
Uganda Suam Suam Wholesale
Uganda Lwakhakha Lwakhakha Wholesale
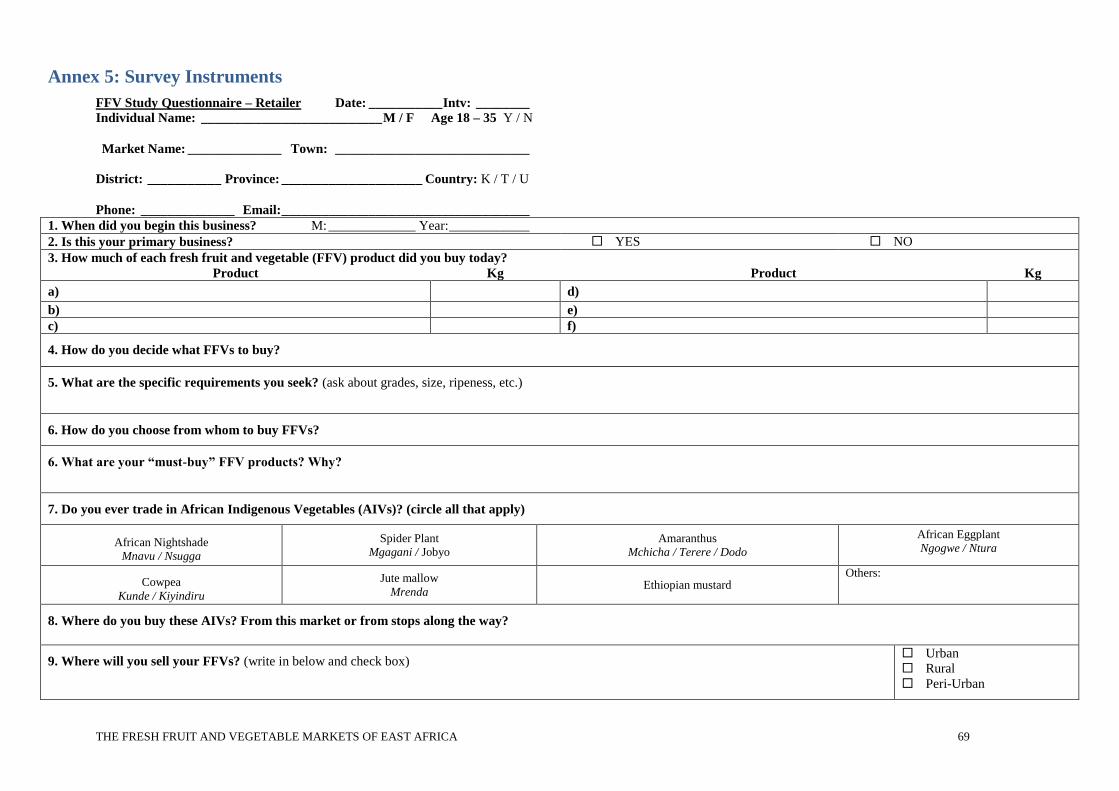
THE FRESH FRUIT AND VEGETABLE MARKETS OF EAST AFRICA 69
Annex 5: Survey Instruments
FFV Study Questionnaire – Retailer Date: ___________ Intv: ________ Individual Name: ___________________________ M / F Age 18 – 35 Y / N
Market Name: ______________ Town: _____________________________
District: ___________ Province: _____________________ Country: K / T / U
Phone: ______________ Email: _____________________________________
1. When did you begin this business? M: _____________ Year: ____________
2. Is this your primary business? YES NO
3. How much of each fresh fruit and vegetable (FFV) product did you buy today?
Product Kg Product Kg
a) d)
b) e)
c) f)
4. How do you decide what FFVs to buy?
5. What are the specific requirements you seek? (ask about grades, size, ripeness, etc.)
6. How do you choose from whom to buy FFVs?
6. What are your “must-buy” FFV products? Why?
7. Do you ever trade in African Indigenous Vegetables (AIVs)? (circle all that apply)
African Nightshade
Mnavu / Nsugga
Spider Plant
Mgagani / Jobyo
Amaranthus
Mchicha / Terere / Dodo
African Eggplant
Ngogwe / Ntura
Cowpea
Kunde / Kiyindiru
Jute mallow
Mrenda Ethiopian mustard
Others:
8. Where do you buy these AIVs? From this market or from stops along the way?
9. Where will you sell your FFVs? (write in below and check box) Urban
Rural
Peri-Urban
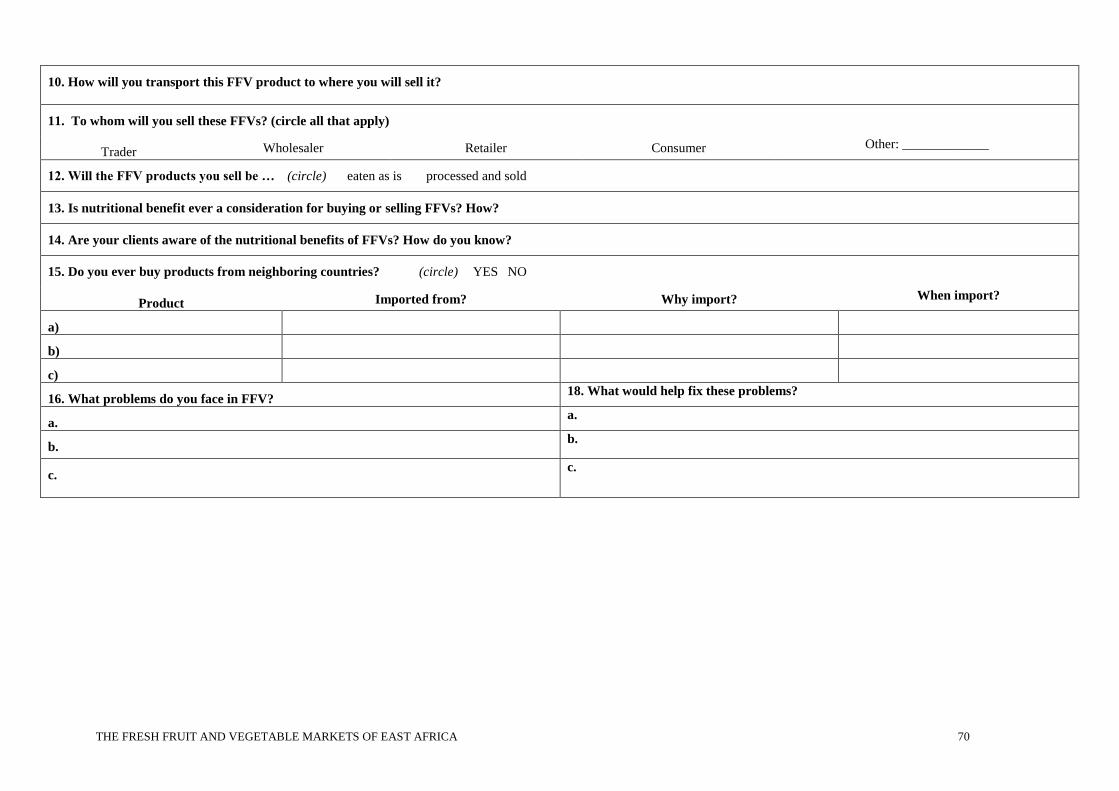
THE FRESH FRUIT AND VEGETABLE MARKETS OF EAST AFRICA 70
10. How will you transport this FFV product to where you will sell it?
11. To whom will you sell these FFVs? (circle all that apply)
Trader Wholesaler Retailer Consumer Other: _____________
12. Will the FFV products you sell be … (circle) eaten as is processed and sold
13. Is nutritional benefit ever a consideration for buying or selling FFVs? How?
14. Are your clients aware of the nutritional benefits of FFVs? How do you know?
15. Do you ever buy products from neighboring countries? (circle) YES NO
Product Imported from? Why import? When import?
a)
b)
c)
16. What problems do you face in FFV? 18. What would help fix these problems?
a. a.
b. b.
c. c.
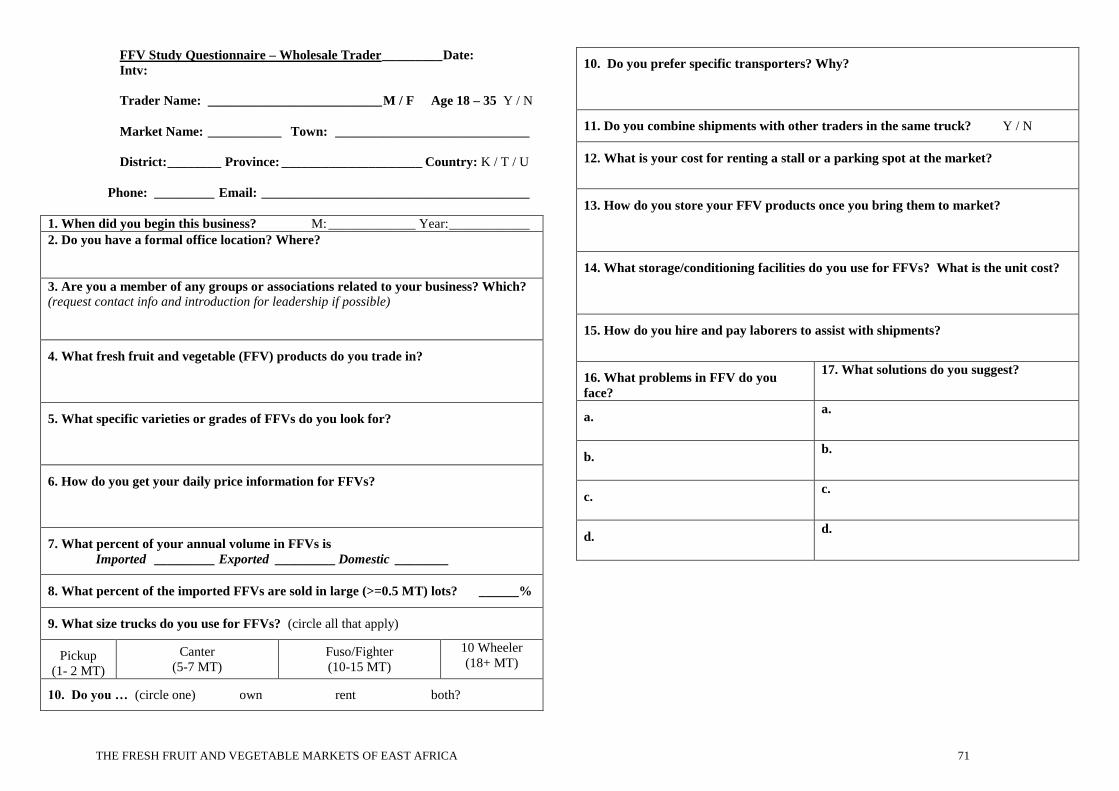
THE FRESH FRUIT AND VEGETABLE MARKETS OF EAST AFRICA 71
FFV Study Questionnaire – Wholesale Trader _________ Date:
Intv:
Trader Name: __________________________ M / F Age 18 – 35 Y / N
Market Name: ___________ Town: _____________________________
District: ________ Province: _____________________ Country: K / T / U
Phone: _________ Email: ________________________________________
1. When did you begin this business? M: _____________ Year: ____________
2. Do you have a formal office location? Where?
3. Are you a member of any groups or associations related to your business? Which?
(request contact info and introduction for leadership if possible)
4. What fresh fruit and vegetable (FFV) products do you trade in?
5. What specific varieties or grades of FFVs do you look for?
6. How do you get your daily price information for FFVs?
7. What percent of your annual volume in FFVs is
Imported _________ Exported _________ Domestic ________
8. What percent of the imported FFVs are sold in large (>=0.5 MT) lots? ______%
9. What size trucks do you use for FFVs? (circle all that apply)
Pickup
(1- 2 MT)
Canter
(5-7 MT)
Fuso/Fighter
(10-15 MT)
10 Wheeler
(18+ MT)
10. Do you … (circle one) own rent both?
10. Do you prefer specific transporters? Why?
11. Do you combine shipments with other traders in the same truck? Y / N
12. What is your cost for renting a stall or a parking spot at the market?
13. How do you store your FFV products once you bring them to market?
14. What storage/conditioning facilities do you use for FFVs? What is the unit cost?
15. How do you hire and pay laborers to assist with shipments?
16. What problems in FFV do you
face?
17. What solutions do you suggest?
a. a.
b. b.
c. c.
d. d.
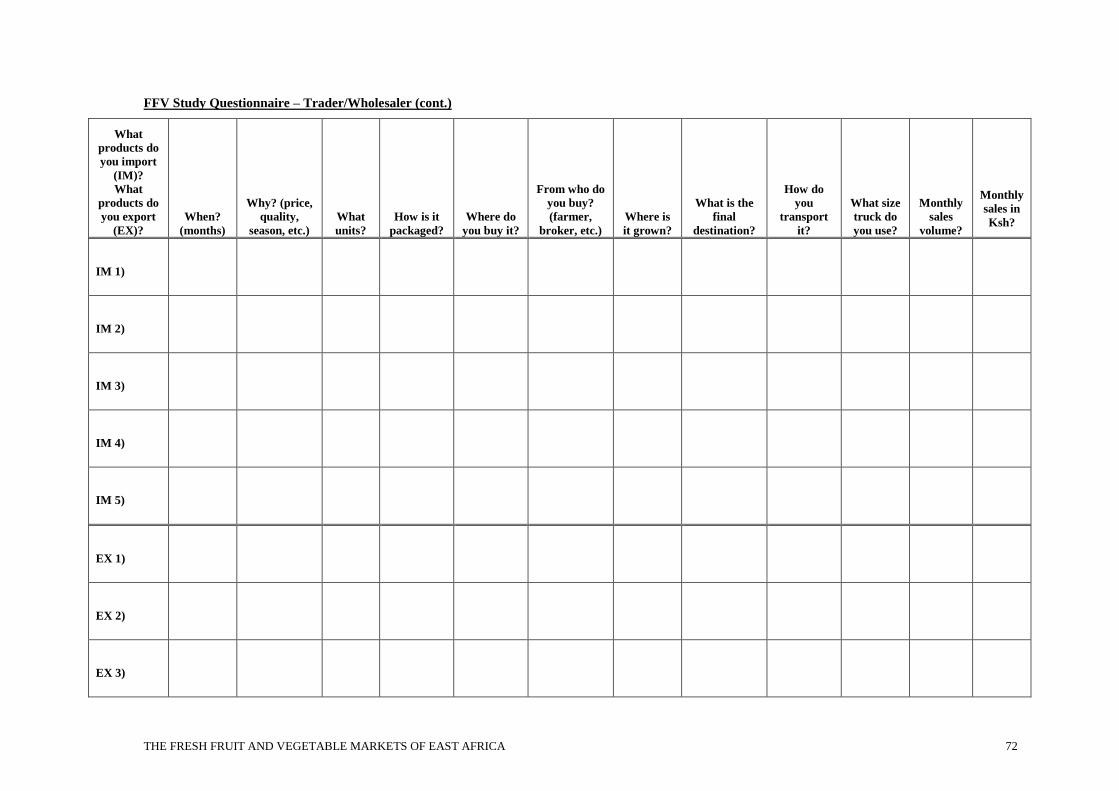
THE FRESH FRUIT AND VEGETABLE MARKETS OF EAST AFRICA 72
FFV Study Questionnaire – Trader/Wholesaler (cont.)
What
products do
you import
(IM)?
What
products do
you export
(EX)?
When?
(months)
Why? (price,
quality,
season, etc.)
What
units?
How is it
packaged?
Where do
you buy it?
From who do
you buy?
(farmer,
broker, etc.)
Where is
it grown?
What is the
final
destination?
How do
you
transport
it?
What size
truck do
you use?
Monthly
sales
volume?
Monthly
sales in
Ksh?
IM 1)
IM 2)
IM 3)
IM 4)
IM 5)
EX 1)
EX 2)
EX 3)
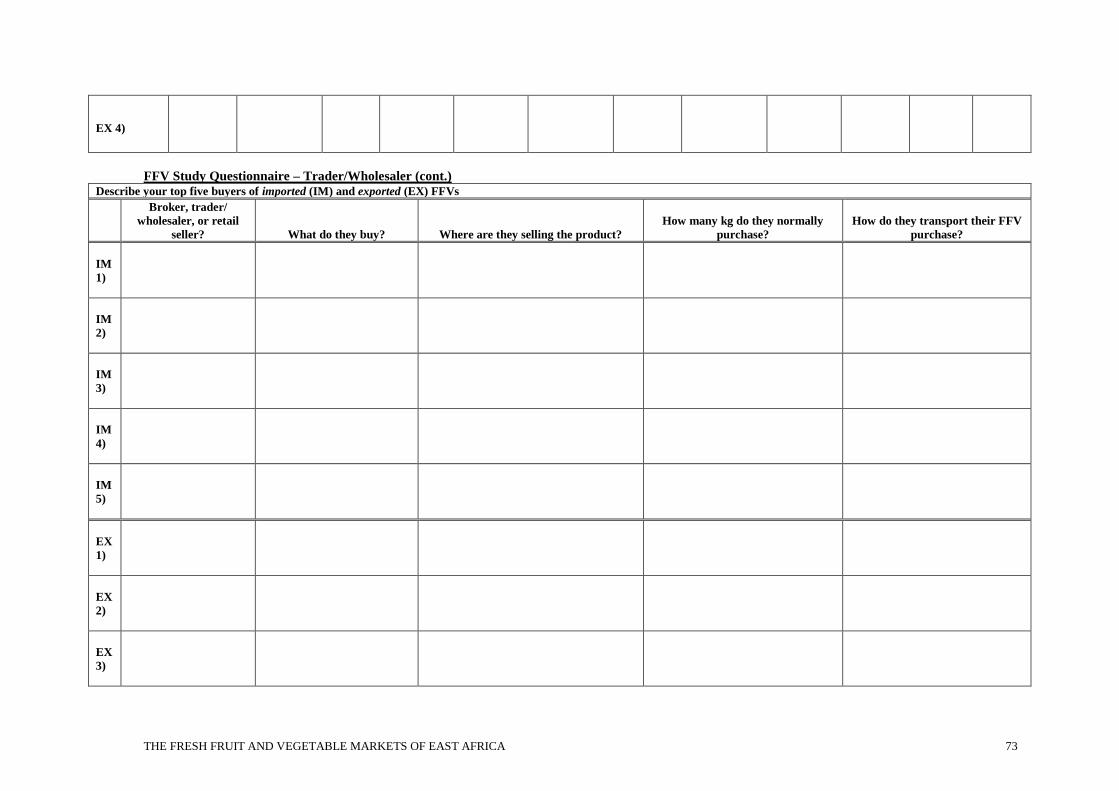
THE FRESH FRUIT AND VEGETABLE MARKETS OF EAST AFRICA 73
EX 4)
FFV Study Questionnaire – Trader/Wholesaler (cont.)
Describe your top five buyers of imported (IM) and exported (EX) FFVs
Broker, trader/
wholesaler, or retail
seller? What do they buy? Where are they selling the product?
How many kg do they normally
purchase?
How do they transport their FFV
purchase?
IM
1)
IM
2)
IM
3)
IM
4)
IM
5)
EX
1)
EX
2)
EX
3)
THE FRESH FRUIT AND VEGETABLE MARKETS OF EAST AFRICA 74
EX
4)
EX
5)
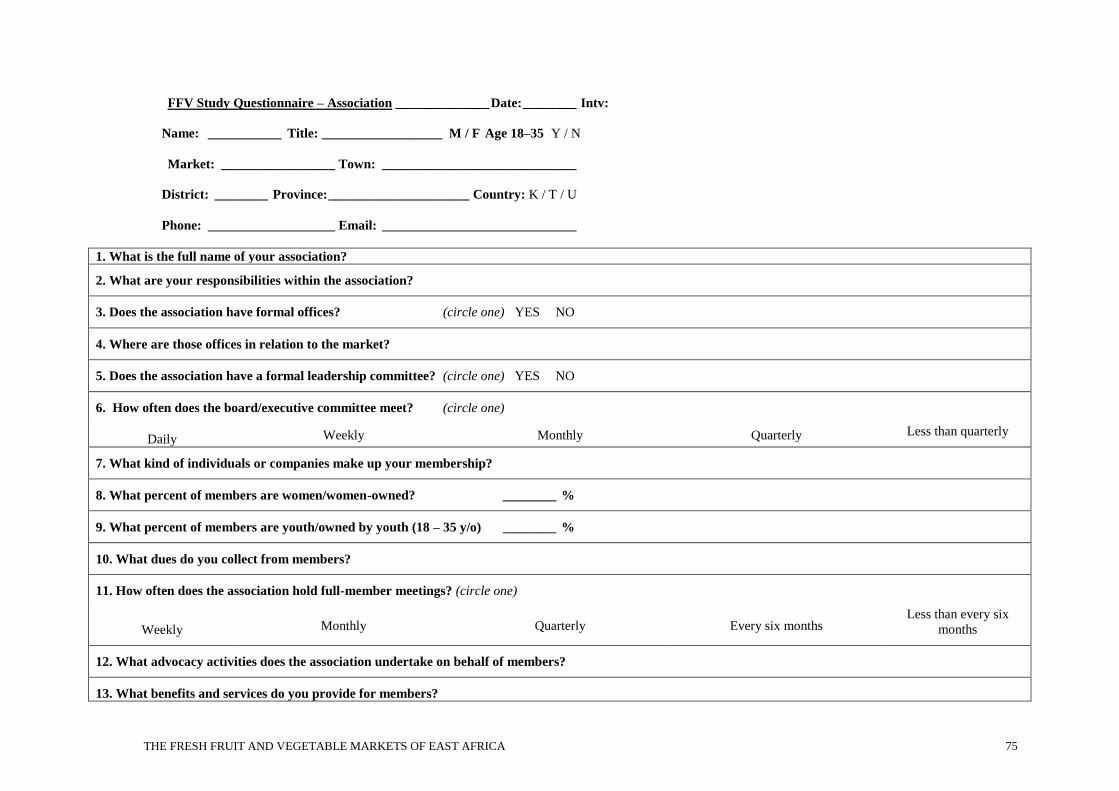
THE FRESH FRUIT AND VEGETABLE MARKETS OF EAST AFRICA 75
FFV Study Questionnaire – Association ______________ Date: ________ Intv:
Name: ___________ Title: __________________ M / F Age 18–35 Y / N
Market: _________________ Town: _____________________________
District: ________ Province: _____________________ Country: K / T / U
Phone: ___________________ Email: _____________________________
1. What is the full name of your association?
2. What are your responsibilities within the association?
3. Does the association have formal offices? (circle one) YES NO
4. Where are those offices in relation to the market?
5. Does the association have a formal leadership committee? (circle one) YES NO
6. How often does the board/executive committee meet? (circle one)
Daily Weekly Monthly Quarterly Less than quarterly
7. What kind of individuals or companies make up your membership?
8. What percent of members are women/women-owned? ________ %
9. What percent of members are youth/owned by youth (18 – 35 y/o) ________ %
10. What dues do you collect from members?
11. How often does the association hold full-member meetings? (circle one)
Weekly Monthly Quarterly Every six months Less than every six
months
12. What advocacy activities does the association undertake on behalf of members?
13. What benefits and services do you provide for members?
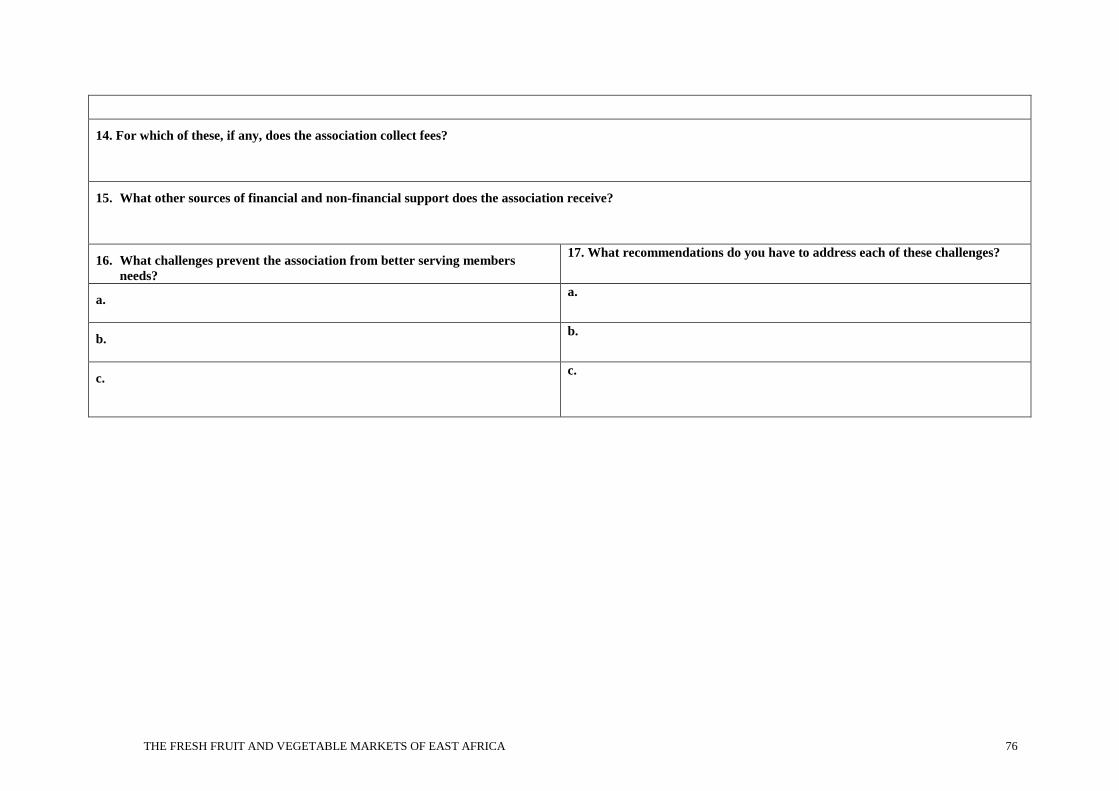
THE FRESH FRUIT AND VEGETABLE MARKETS OF EAST AFRICA 76
14. For which of these, if any, does the association collect fees?
15. What other sources of financial and non-financial support does the association receive?
16. What challenges prevent the association from better serving members
needs?
17. What recommendations do you have to address each of these challenges?
a.
a.
b.
b.
c. c.
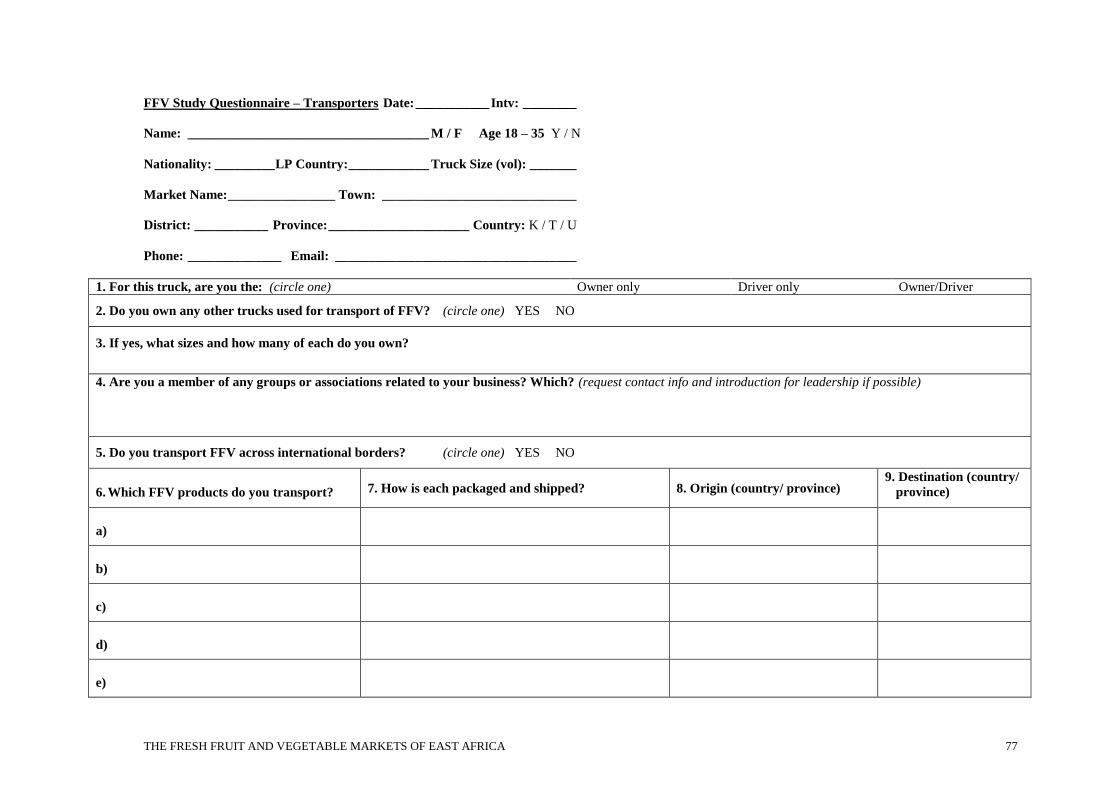
THE FRESH FRUIT AND VEGETABLE MARKETS OF EAST AFRICA 77
FFV Study Questionnaire – Transporters Date: ___________ Intv: ________
Name: ____________________________________ M / F Age 18 – 35 Y / N
Nationality: _________ LP Country: ____________ Truck Size (vol): _______
Market Name: ________________ Town: _____________________________
District: ___________ Province: _____________________ Country: K / T / U
Phone: ______________ Email: ____________________________________
1. For this truck, are you the: (circle one) Owner only Driver only Owner/Driver
2. Do you own any other trucks used for transport of FFV? (circle one) YES NO
3. If yes, what sizes and how many of each do you own?
4. Are you a member of any groups or associations related to your business? Which? (request contact info and introduction for leadership if possible)
5. Do you transport FFV across international borders? (circle one) YES NO
6. Which FFV products do you transport? 7. How is each packaged and shipped? 8. Origin (country/ province) 9. Destination (country/
province)
a)
b)
c)
d)
e)
THE FRESH FRUIT AND VEGETABLE MARKETS OF EAST AFRICA 78
7. Describe a normal cross-border or internal trip with FFV, from start to finish. (Ask about origin, destination, police/other checkpoints, informal payments, road
conditions, the border crossing, time at each step, laborers, etc. Use the back of the sheet if necessary)
8. What problems make it more difficult for you to do business and make money?
a.
b.
c.
9. What improvements do you think are necessary?
a.
b.
c.
THE FRESH FRUIT AND VEGETABLE MARKETS OF EAST AFRICA 79
FFV Study Questionnaire – Market Manager _________ Date: ________ Intv:
Name: _________________________________ M / F Age 18 – 35 Y / N
Market Name: ____________ Town: _____________________________
District: _______ Province: _____________________ Country: K / T / U
Phone: __________ Email: ____________________________________
1. What is the full name of the organization responsible for managing this market?
2. Is this entity … (circle): Public Private Non-profit Other: ________
3. What is your title and position within the management team?
4. What are your responsibilities?
5. What information does the market management collect?
6. What fees are collected by the market management? How much are they?
7. Which are the primary FFVs sold in this market?
a) d)
b) e)
c) f)
8. For each, what months are they imported for sale, why, and in what volumes?
THE FRESH FRUIT AND VEGETABLE MARKETS OF EAST AFRICA 80
Product Months Why? Daily Weekly Monthly
a) MT MT MT
b) MT MT MT
c) MT MT MT
d) MT MT MT
e) MT MT MT
f) MT MT MT
9. For each, what months are they exported for sale, why, and in what volumes?
Product Months Why? Daily Weekly Monthly
a) MT MT MT
b) MT MT MT
c) MT MT MT
d) MT MT MT
e) MT MT MT
f) MT MT MT
10. What problems in the market do you see that need improvement?
a.
b.
c.
11. What improvements would you propose?
a.
b.
Recommended


![Consumer Preferencesfor Fresh Fruit and Vegetable …ageconsearch.umn.edu/bitstream/27346/1/19010061.pdf · Consumer Preferencesfor Fresh Fruit and Vegetable Retail Package Sizes]](https://img.pdfslide.us/doc/110x75/5b09d83e7f8b9a93738e87e5/consumer-preferencesfor-fresh-fruit-and-vegetable-preferencesfor-fresh-fruit-and.jpg)