Proceeding 2nd Sriwijaya, Economics, Accounting, and Business Conference 2016
ISBN 979-587-627-9 718
THE FEASIBILITY OF INVESTMENT PLANTATION AND
OPPORTUNITIES IN COFFEE INDUSTRY PROCESSING IN MUARA ENIM
REGENCY
Azwardi1)
Imam Asngari2)
Muklish3)
Andy Mulyana4)
Riswani5)
Feriadi6)
1)2)3)Economic Faculty of University Sriwijaya
4)5)6)Agriculture Faculty of University Sriwijaya
PDD AKN Banyuasin
Abstract
The purpose of research conducted to determine the feasibility of investment in coffe
plantations and coffee commodities downstream opportunities. Investment feasibility
coffee plantations cover the technical aspects, production aspects, market aspects,
farmer institutional aspects and financial rubber plantation business aspects. However,
coffee commodities downstream cover products derived from coffee. Data used
including primary and secondary data. Secondary data obtained from the relevant
agencies, such as BPS and plantation department. Besides, primary data is obtained
from observation and focus group discussions with farmers and coffee trader.
Methods used include IRR, NPV and B/C ratio. Based on the research results
feasibility of investment in coffee plantations from geographical aspect tend to
feasible in all regions of Muara Enim to cultivate coffee plants, but the centre area of
the coffee in Muara Enim located in the Semende Darat Laut (44,10 %), Tanjung
Agung (31,01 %), Semende Darat Ulu (11,19 %), dan Semende Darat Tengah (10,98
%). The productivity of Tengah (10,98 %) coffee plantation Tengah (10,98 %)
Tengah (10,98 %) in Muara Enim Regency. The productivity of coffee plantations in
Muara Enim higher than nationwide, where the average productivity is based on the
study was 1.06 tonnes per ha. Coffee product s are marketed through a marketing
channel that starts from farmers as producers, the majority sold to a collector, which
then passed into the hands of wholesalers and exporters, to get into the hands of
consumers. From the measurement of financial feasibility of coffee farming by using
four eligibility criteria shows that farming is feasible to be developed with the B/C
1.20 (> 1) meaningful, any costs incurred by Rp.1 will generate profits of Rp.1.2.
Coffee agro-industry and potentially cultivated in this region. Assumptions
consumption amounted to 0,407 ounces of ground coffee per capita, hence the need
for coffee powder as much as 338 tons per year. Investment opportunities of coffee
beans, among others, can be processed into roasted coffee, ground coffee, instant
coffee, coffee mix (coffee with milk), and coffee bags.
Keywords: Coffee, Investment Feasibility, Downstream products

Proceeding 2nd Sriwijaya, Economics, Accounting, and Business Conference 2016
ISBN 979-587-627-9 719
BACKGROUND
The agricultural sector during the period 2009-2015 contributed an average
of 16.08 percent to the GDP of Muara Enim, and absorbed 19.23 percent of labor
force, the second largest after the mining sector. When viewed from the location
quotient (LQ), then the sector or sub-sector basis Muara Enim featured among other
sub plantation crops that are part of the agricultural sector. Additionally premises
using AHP approach to look at the determinants of the leading sectors consisting of
Economic Value, SDA, HR, Production Scale, Technology, Skill Labor Market,
Production, Competitiveness, Institutional, derivatives Processed Products,
Infrastructure. Overall the sector sequence seeded based on 11 criteria that there is
plantation sector with an average weight of 0.1587.. Based on the calculation of AHP,
coffee processing industry has the third rank, is equal to 0.2136.
Table 1. Coffee Plant Size According to Muara Enim
No Districts 2011 2012 2013 2014 2015 2016
1 Semende Darat
Laut 11.070,00 11.077,00 11.077,00 11.076,00 11.076,00 11.076,00
2 Semende Darat
Ulu 2.785,00 2.785,00 2.822,00 2.786,00 2.786,00 2.812,00
3 Semende Darat
Tengah 2.720,00 2.719,60 2.757,00 2.720,00 2.720,00 2.759,00
4 Tanjung Agung 7.783,00 7.783,00 7.783,00 7.791,00 7.791,00 7.791,00
5 Rambang 0,00 0,00 0,00 0,00 0,00 0,00
6 Lubai 109,00 109,00 54,00 55,00 55,00 55,00
7 Lawang Kidul 198,00 198,00 198,00 198,00 198,00 198,00
8 Muara Enim 246,00 246,00 246,00 246,00 246,00 246,00
9 Ujan Mas 10,00 10,00 10,00 10,00 10,00 10,00
10 Gunung Megang 92,00 92,00 52,00 52,00 52,00 52,00
11 Benakat 0,00 0,00 0,00 0,00 0,00 0,00
12 Rambang Dangku 88,00 88,00 88,00 88,00 88,00 88,00
13 Gelumbang 27,00 27,00 27,00 27,00 27,00 27,00
14 Lembak 0,00 0,00 0,00 0,00 0,00 0,00
15 Sungai Rotan 0,00 0,00 0,00 0,00 0,00 0,00
16 Muara Bellida 4,00 4,00 4,00 4,00 4,00 4,00
17 Kelekar 0,00 0,00 0,00 0,00 0,00 0,00
18 Belimbing 0,00 0,00 40,00 40,00 40,00 40,00
19 Lubai Ulu 0,00 0,00 0,00 0,00 0,00 0,00
20 Belide Darat 0,00 0,00 55,00 55,00 55,00 55,00
Total 25.132,00 25.139,00 25.213,00 25.148,00 25.148,00 25.213,00
Sumber :Statistik Perkebunan Kabupaten Muara Tahun 2016

Proceeding 2nd Sriwijaya, Economics, Accounting, and Business Conference 2016
ISBN 979-587-627-9 720
Based on the results of data analysis of Landsat ETM + 8 with a path / row
125/063 which was acquired on 6 August 2016, the coffee plant in Muara Enim in
four sub-districts Semende Inland Sea, District Semende Army Ulu, District and Sub-
district Semende Middle Ground Tanjung Agung. Meanwhile, according to statistics
Plantation Muara Enim 2016, coffee plants spread across 14 districts, and the districts
of the most widespread coffee plant found in the same sub-district locations with the
results of analysis of Landsat imagery is 4 districts.
THEORIES
Internal Rate of Return is the discount rate that equates the present value of
the cash inflows and investment value of a business, in other words IRR is the
discount rate that produced the NPV = 0. If the capital cost of a business is greater
than the IRR is the discount rate which generates NPV = 0. If the capital cost of a
business is greater than IRR, the NPV becomes negative, so that the business is not
feasible, the higher the IRR compared to the cost of capital, the better the business to
have. Conversely, if the IRR is less than the cost of capital, the project will not be
taken. So the maximum capital costs which may be incurred equals to IRR.
Net B/C is the ratio between the sums of PV positive net benefit with the
sums of PV negative net benefit. The positive present value number is the numerator
and the number of negative present value is the denominator.
Net B/C shows an overview how many times the benefits obtained from the
cost incurred. If the net B/C > 1, then the project or business idea to be established is
feasible. Vice versa, if the net B/C < 1, then the project or business idea to be
established is not feasible. Net B/C ratio is an additional net benefit of acceptable
projects from every 1 unit amount spent.
Break Even Point is the point at which an activity is not gaining money, but
it also is not losing money. Break Even Point or BEP may imply an analysis to
determine and find the number of goods or services to be sold to consumers at a
certain price to cover the costs incurred as well as the benefit / profit.
BEP means a situation in which the company's operations does not earn a
profit and does not suffer a loss (income assessed using the total cost). BEP analysis is
not solely to determine the state of the company reached the BEP point, but the
analysis of BEP is able to provide information to lending companies on various levels

Proceeding 2nd Sriwijaya, Economics, Accounting, and Business Conference 2016
ISBN 979-587-627-9 721
of sales volume, as well as its relationship with the possibility of obtaining profits
according to the level of sales concerned.
METHODOLOGY
In determining the economic feasibility using Internal Rate of Return (IRR),
Benefit Cost Ratio (B / C ratio) and Break Even Point.
a. Intenal rate of Return
IRR can be counted manually as follows:
∑
( )
Where: t is the year of investment projects
n is the life of the investment project
Ct is net cash flow in year t
C0 is the initial capital investment in year 0
b. B/C Ratio
Formula Net B / C ratio is as follows:
∑
( )
∑ ( ))
⁄
Where :
Bt is Benefit at year t
Ct is cost at year t
i is Discount Factor
t is the year of investment projects
Indicators NET B/C Ratio is:
If the Net B/C > 1, then the project is feasible to be implemented
If the Net B/C < 1, then the project is not feasible to be implemented
c. Break Even Point
Formula BEP is as follows:

Proceeding 2nd Sriwijaya, Economics, Accounting, and Business Conference 2016
ISBN 979-587-627-9 722
Where :
BEP is Break Even Point
FC is Fixed Cost
VC is Variable Cost
P is Price per unit
S is Sales Volume
RESULTS
Feasibility Investment Plantation
Technical Aspect
Most areas in Muara Enim are suitable for coffee cultivation plants, but the
areas that become the center of the coffee in Muara Enim regency are located in the
Semende Darat Laut (44,10 %), Tanjung Agung (31,01 %), Semende Darat Ulu
(11,19 %), dan Semende Darat Tengah (10,98 %). These areas have geographical
conditions, climate and type of soil that ideal for growing coffee trees, especially for
robusta coffee.
The areas of the centers have geographical conditions, climate and type of
soil that the majority of eligible ideal for growing coffee plants, especially robusta
coffee is still the dominating type of coffee farmers cultivated in this region, although
the arabica coffee also been developed. Technically, robusta grows optimally at an
altitude of 400-700 m above sea level, but several of them are still able to grow well
and have economic value at altitudes below 400 m. While arabica coffee growing
requires a higher location than robusta coffee, which is between 500-1700 m above
sea level. On elements rainfall identified that rainfall is optimum for coffee (arabica
and robusta) are in areas that have a rainfall average of 2000-3000 mm per year, has a
dry month (rainfall <100 mm per month) for 3 - 4 months and dry months between
the last period completely dry (no rain) for 2 weeks - 1.5 months.
Coffee plants generally require large amounts of sunlight at the beginning of
the dry season or the end of the rainy season. It is necessary to stimulate the growth of
flower buds. The wind plays a role in helping the process of moving pollen coffee
from the coffee plant one plant to another. This condition is needed, especially for the
type of coffee is self-sterile.

Proceeding 2nd Sriwijaya, Economics, Accounting, and Business Conference 2016
ISBN 979-587-627-9 723
For soil, in general, coffee plants require soil that is loose, fertile and rich in
organic matter. The type of soil and volcanic latosol preferred coffee plants. Soil
drainage ugly, heavy clay and sandy soil that less water binding capabilities, as well
as its low N content not suitable for growing coffee. In addition, the coffee plants also
require soil that is slightly acidic, with pH 4,5 - 6 for robusta and pH 5.0 to 6.5 for
arabica coffee. Soil more acid can be neutralized with quicklime / fertilizer, for
example, bone powder or CA- (PO2) + Ca and metaphosphat or Ca (PO2). Coffee
plants require water depth of soil at least, three meters from the ground. Land must
have drainage and good water binding capability.
High altitude affect the low temperature. Arabica coffee grows better suited
on a plateau with an altitude of 1000-1700 m above sea level. If below 1000 m above
sea level, will be susceptible HV. If above 1700 m above sea level, the temperature
will be too cold. Robusta coffee grows well in lowland to 1500 m above sea level, but
the economic is growing at an altitude of 800 m above sea boundary. As for the type
of coffee Liberika grow well in the lowlands, where the poor and heat. The terms of
technical feasibility in order to be able to grow optimally coffee that has been owned
by the majority of regions of coffee production center in Muara Enim. Average coffee
producing areas in Muara Enim is above 600-1000 meters above sea level spread
across 5 sub-districts Semende Army Ulu, Semende Central Army, Army Semende
Sea, Tanjung Agung and Lawang Kidul. Rainfall in these areas also tend to be high,
with variations between 35 mm to 305 mm throughout 2015 with average air
temperature during the day 230C - 240C.
The majority of farmers who cultivate coffee plantations on the part of the
production process using technology that tends to be simple, and in most of the other
production processes have been familiar with the application of technology. In the
planting process that starts from the selection of seeds, most farmers actually have
used seeds, but understanding superior species that become an option for planting
based on the advice of the government is not fully known. Type of coffee grown by
farmers in Muara Enim Regency generally is a type of robusta coffee dominate, and
Arabica are beginning to be developed.
At the stage of the treatment process, the activities undertaken farmers are
weeding (land clearing), fertilization and combating pests and plant diseases. All three
of these activities have not been ideal if exercised following the guidelines of Good

Proceeding 2nd Sriwijaya, Economics, Accounting, and Business Conference 2016
ISBN 979-587-627-9 724
Agriculture Practices The coffee, however, was done by the farmers towards the
correct maintenance practices. The technology used is also still relatively modest.
Clearing land (weeding), the average farmer only use equipment that is generally used
by other farmers such as machetes, sickles and hoes done by human labor generally
come from within the family. Ideally, weeding must be done starting from the coffee
plant immature (TBM), at this stage of the coffee plants need to be maintained to be
free from the interference of weeds in a radius of 1 m is kept clean of weeds. This
activity in the local language is called besiang or weeding. Methods of weed control
can be done by a combination of mechanical and chemical means. Work of weed
control include pruning, if necessary, ground-breaking light on the eve of fertilizing,
and spraying.
At fertilization, fertilizing technology already known to farmers but the
average application rate of adoption is still low. This is due to lack of capital to buy
fertilizer to the type and amount of ideal. Fertilization needs of the coffee plant coffee
plant depends on the age and condition of the plants. This is because the coffee plant
nutrient requirements differ both according to age of the plant, the plant species, as
well as the type of nutrient. Arabica coffee types require more nutrients than other
types of robusta coffee. Therefore, it must be preceded by analysis of soil, leaf
analysis and field fertilization experiment in advance. The management of the coffee
crop yield (TM) is relatively the same as the TBM management activities. The
difference is in the frequency and volume of maintenance and the need for fertilizers
and pesticides that are larger than the TBM.
Weaknesses farmers in fertilization made recommendations good cultivation
of the government may not all be met community that would affect production. For
example in the case of fertilizer, which farmers may be better prioritize buy basic
necessities than do the fertilization is expensive. Attractions such as the coffee plant is
an annual plant which means that the income of farmers received after harvest while
other needs can not be postponed.
Dose ideal coffee crop fertilization will increase production in accordance
with the instructions correct fertilization. However, because of their price disparity
between subsidized and non-subsidized fertilizers causing fertilizer prices for farmers
is expensive and scarce. Good coffee crop fertilization.

Proceeding 2nd Sriwijaya, Economics, Accounting, and Business Conference 2016
ISBN 979-587-627-9 725
On the coffee farmers in Muara Enim, the type of fertilizer they commonly
use are urea, SP36 and KCl. The dose used is generally not adapted to the age of the
plant, but given the means and the same dose with the frequency depending on
financial conditions. However, the farmers who have the ability to better capital,
fertilization has been done which leads to ideal conditions, as recommended.
The same condition is also seen in the activities eradication of pests and
diseases, which are generally only performed if the coffee plants attacked by pests or
diseases. If there is no attack, the activities eradication of pests and diseases are not
carried out by the farmers.
Coffee farmers in areas producer in Muara Enim regency which is dominated
by the majority of people already seek plantation coffee for generations. As is
generally the smallholder, though farmers already have the experience of trying to
farm the coffee was pretty long, but their understanding of doing the right cultivation
techniques as recommended in the Good Agricultural Practices (GAP) coffee is still
likely to be low for certain parts. For example, farmers' understanding of the
categories and criteria of seeds are encouraged government and way of cultivation is
still low. Even if there are already understood, still they are not sure or are still
hesitant to apply it.
Behavior on the part of care despite already done but not optimal. This
condition is associated with the level of technical knowledge about the correct
cultivation is still low, coupled with the ability of capital which is still low. From
parts of treatment should be done, it seems that part of fertilization is still a problem,
so farmers need to be given guidance on correct implementation. To overcome this
problem the Plantation Office Muara Enim continuously conduct training through
extension activities, training and demonstration periodically to coffee farmers.
Average farmers still do fertilization activities are ideal as recommended
associated frequency, dose and type of fertilizer that is appropriate to the age of the
plant. Farmers tend to fertilization with equal treatment for all ages fertilizing plants
with an average frequency of only once a year. And ideally, fertilization performed at
least twice a year, the beginning of the rainy season with the second phase at the end
of the rainy season. Dose of fertilizer given by the average farmer is still low, where
young plants are immature (TBM) and plants over five years has produced (TM) were
given the same dose which is about 0.5 to 0.80 kg, ideally fertilization twice , TBM

Proceeding 2nd Sriwijaya, Economics, Accounting, and Business Conference 2016
ISBN 979-587-627-9 726
dose of about 2x50 GRM / tree (urea), 2x50 GRM / tree (SP-36) and 2x40 GRM / tree
(KCL). Dose TM bermur ideally 5-10 years approximately 2x150 GRM / tree (urea),
2x130 GRM / tree (P-36) and 2x180 GRM / tree (KCL)
The next major issue is the way that has not been proper fertilization, where
farmers generally make a hole with a distance of about 1 meter, whereas proper
fertilization way is to make a small hole as deep as 10 cm around the plant so far ¾
crown width, fertilizer inserted and covered with earth. Third, weeding or at least 1
meter circumference grass crops, but farmers are less concerned about the cleanliness
of grass (weeds) nuisance growth of plants. Farmers generally clear land by spraying
fields with weed killer (herbicide).
Production Aspect
Coffee production is high and will depend on the quality of plant
maintenance activities both when immature and crop yield. Farmers cultivated coffee
plant in Muara Enim generally flower at the age of three years with the fruit can be
harvested at the age of four years. Coffee harvest time was strongly influenced by the
climate and the type of coffee. Climate affects the flowering period, fruit maturity and
harvest periods.
Coffee plants flowering at once but gradually, causing their age difference of
fruit in one dompolan same. Harvest is generally done in a few rotations between 1-2
weeks per rotation. In each of the coffee harvest season is divided into three stages,
namely the preliminary harvest period (fruit base), a period of great harvest or harvest
(banging the great) and a final harvest (fruit hose).
Farmers in Muara Enim production is generally dependent on climatic
conditions and high rainfall. In the season with high rainfall production declines. In
general, the coffee harvest per hectare ranges from 500-800 kg / ha of ideally 1-1, 5
tons per hectare. The level of production and productivity of coffee plants in Muara
Enim regency until 2016 shows production and productivity differences between
regions manufacturer. The differences are influenced by soil type, altitude,
temperature, average days of rain and average rainfall. The level of production and
productivity of crops to produce coffee and Plants Damaged or old plants per year
according to the sub-district of the results of such studies.
Proceeding 2nd Sriwijaya, Economics, Accounting, and Business Conference 2016
ISBN 979-587-627-9 727
Based on the level of production, all these four districts also occupy the
highest production. The production rate 3 districts in Semende reached 66.02 percent
and District Court headland reached 30.90 percent of the total coffee production
Muara Enim regency as many as 25 213 tonnes in 2016. For the production of the
eight other districts are relatively insignificant because it is not a major crop in
addition does not suitable for growing coffee. In terms of productivity, the coffee
plantations in Muara Enim average productivity based on the study was 1.06 tonnes
per ha. Compared with the national productivity of 700 kg per ha, the productivity is
relatively still slightly higher than the national productivity. However, when
compared internationally, for example, state that in fact Vietnamese newcomer in the
coffee trade, productivity can reach 1.54 tonnes per ha, over traditional coffee
producing countries such as Brazil; 1 ton per hectare and Columbia; 1.22 tonnes per
ha.
But if it is seen by the dominant four districts only, the productivity level is
quite high. The highest was the District Semende Central at 1.1 tonnes per ha,
followed by the District Land Sea Semende of 1.05 tons per hectare, then the district
of Tanjung Agung by 1.08 tonnes per ha, and the District of Central Army Semende
by 0.99 tonnes per ha.
On the primary data collection through interviews and observations, the
variables discussed is how the dynamics of coffee cultivation by farmers can
influence production levels throughout the year. Extracting information from it, it is
known that coffee farming activities in the region is the main livelihood Semende
cultivated intensively enough although combined with extending for price
developments are less promising. Habits of life which is inseparable from the culture
of coffee drinking also affects the level of production and productivity. Based on such
case, the amount of production and productivity of coffee in the area and the district
of Tanjung Agung Semende can be justified.
Based on these factors, the amount of productivity from the results of
different studies with data from the Department. The average productivity of the
Service data is 1.06 tons per hectare, while the FGD is 0,981 tonnes per ha. This
occurs because of the statistical bias level, farmers and workers. According to the
farmers is less significant as production from other districts outside the dominant four
districts namely SDU, SDT, SDL and Tanjung Agung. But if these four districts were
Proceeding 2nd Sriwijaya, Economics, Accounting, and Business Conference 2016
ISBN 979-587-627-9 728
counted then the productivity is at 1.06 which is still higher than the national
productivity but still below international productivity.
Marketing Aspects
Coffee Marketing in Indonesia including that occurred in Muara Enim
generally carried out in the form of fresh, secondary processed products and
processed products end. In general, the coffee is traded in coffee rice with a moisture
content of 13%, both domestically and for export. Marketing in the form of fresh
coffee will likely provide little added value when compared with selling secondary
processed products or processed late.
Results of research on various agricultural and plantation products shows that
farmers only get the profit margin in comparison to the merchant or medium
entrepreneurs, large scale industrial entrepreneur who sells coffee in the form of
processed products or final and diversification of products and markets outside of
retention. Coffee marketing chain is produced by farmers who are known as coffee
carelessly generally not meet the quality standards of export coffee, the water level is
still high, which ranged between 16-20%. Random coffee is not sold directly to
exporters, but sold through middlemen before being sold to exporters. Asalan coffee
trade chain is generally quite long, ranging from mobile vendors, local traders,
wholesalers and exporters
Coffee marketing chain from farmers or plantation can also through various
channels to the coffee farmers' associations or directly to the collector. Furthermore,
traders will sell coffee rice to wholesalers or directly to exporters and ground coffee.
The prerequisite is the coffee must be of good quality and is already sorted so that it
meets the quality requirements specified. In the era of free trade manufacturers are
required to develop creativity in creating a quality product that can be accepted by
consumers. Some of the potential products that can be developed in an effort to boost
the marketing of coffee, among others: developing a wide range of coffee products in
a variety of packaging, develop new products with a mixture of coffee with other
products, such as milk, chocolate, cakes, confectionery, dodol, etc., develop market
segments the new well for existing products and for new products that will be
developed as well as strategic alliances in developing products processed coffee with
various companies whose products can be combined with the coffee products, both at
Proceeding 2nd Sriwijaya, Economics, Accounting, and Business Conference 2016
ISBN 979-587-627-9 729
home and abroad (eg in the beverage industry, food industry, industry essence, and so
on) .
Forms of coffee sold in Muara Enim majority is divided into two kinds of
forms of marketing that is still shaped coffee beans and processed coffee (coffee
powder). This causes, perpetrators of coffee marketing in Muara Enim classified into
two groups following the shape of coffee sold. The first group is marketing businesses
that sell coffee in processed form (coffee powder) and the second group is a marketer
who sells coffee in the form of seeds. Area marketing of coffee products in Muara
Enim regency consists of domestic marketing (local and regional), as well as
international marketing (export). Marketing the domestic market and export
marketing is generally carried out by the producers (farmers) and the coffee industry
players. Shape the domestic market has the same structure as other agricultural
commodity markets, where there are relatively the same marketing channels, and the
position of farmers tend to act only as a price taker, while traders in the position of
price maker. In this form of marketing coffee to the international market is regulated
by the International Coffee Organization (ICO) that determines the standard of world
coffee prices, then in marketing Indonesia constrained by the rules of the ICO.
Coffee products are marketed through a marketing channel that starts from
farmers as producers, the majority sold to a collector, which then passed into the
hands of wholesalers and exporters, to get into the hands of consumers. Overview
coffee industry cluster in Muara Enim in harmony with the existing marketing
channels in the region, where the dry coffee beans at random as the raw material of
coffee powder produced by coffee plantations. The coffee beans are then purchased
by collectors of coffee, which is then processed by manufacturers of coffee, to
produce ground coffee. Production of ground coffee is then distributed to local
markets, national markets and there are already entering the export market.
Farmer Institutional Aspect
Institutional role becomes very important because it goes beyond the role of
technology and the abundance of resources. At first factor of the abundance of
resources (resource endowment) is considered the most important factor for growth
and technological progress factor is an important factor in improving the effectiveness
and efficiency of resources value in relation to resource productivity. However, lately
Proceeding 2nd Sriwijaya, Economics, Accounting, and Business Conference 2016
ISBN 979-587-627-9 730
recognized that the institutional role is the most important factor as aligning in the
process of production, distribution and consumption. Institutional factors are
recognized as the most important factor in driving economic growth, beyond
technological factors and the abundance of resources because there is no means
abundance and sophistication of institutional resources without reliable. Institutional
development (institutional capacity building) and organizational behavior
(organizational behavior) must be supported by a social consciousness (social
consciousness) through replanting values (values replanting). That is, the institutional
development along with the contract and the organization is an important factor in
development policy. Institutional development needs to be aligned with local values
through role-based development paradigm change as well.
The existence of Farmers Group (poktan), Farmers Group (Gapoktan),
Village Unit Cooperatives (KUD) and Owned village (BUMDES) is an institution
that is essential for the strengthening of farmers both in the organization of farmers in
various things ranging from coffee cultivation, procurement of inputs, until the sale of
the production. Weakness farmers are generally less able to cultivate and harness the
power of institutional organization Poktan, Gapoktan and KUD as a pathway to
mempejuangkan bargaining position of farmers in product sales, so when farmers
faced with a market that tends oligopsonistic, they are helpless. As a result, the price
of coffee products farmers will be pressured by traders (middlemen), and only a few
farmers to make a profit. Farmer institutions such as cooperatives or BUMDES, can
be used as a container farmers by strengthening the agency had coffee processing
industry that is owned by all the farmers, so that the value-added coffee products will
be enjoyed by farmers.
The existence of Farmers Group (poktan), Farmers Group (Gapoktan),
Village Unit Cooperatives (KUD) and Owned village (BUMDES) is an institution
that is essential for the strengthening of farmers both in the organization of farmers in
various things ranging from coffee cultivation, procurement of inputs, until the sale of
the production. Weakness farmers are generally less able to cultivate and harness the
power of institutional organization Poktan, Gapoktan and KUD as a pathway to
mempejuangkan bargaining position of farmers in product sales, so when farmers
faced with a market that tends oligopsonistic, they are helpless. As a result, the price
of coffee products farmers will be pressured by traders (middlemen), and only a few

Proceeding 2nd Sriwijaya, Economics, Accounting, and Business Conference 2016
ISBN 979-587-627-9 731
farmers to make a profit. Farmer institutions such as cooperatives or BUMDES, can
be used as a container farmers by strengthening the agency had coffee processing
industry that is owned by all the farmers, so that the value-added coffee products will
be enjoyed by farmers.
Coffee Plantation Financial Feasibility
Land financing and operation of the coffee plantations are generally obtained
from a source own capital financing, and land for the cultivation of coffee is also
available, so the cost of the purchase or lease of land is not taken into account. Coffee
plants if cultivated and maintained properly takes 3 years to be able to harvest.
Therefore, the development of coffee plantations require long-term investment with a
grace period of 3 years. Coffee plantation investment cost components such as other
plantation crops consists of pre-operating costs, land clearing, planting and
maintenance of immature plantations.
Annual operating costs are calculated to facilitate the proponents and
interested third parties to assess the financial outlook for coffee plantations in the
future. In calculating annual operating costs assumptions were used: (1) the prices of
raw and auxiliary materials essentially will not change significantly; (2) The same
thing applies to direct wages, salaries, and overhead costs; (3) the selling price of
processed coffee will not change significantly; and (4) inflation in the country will
affect the selling price and direct costs commensurately.
Maintenance of immature plantations starting in 0 s / d year to 2 and
maintenance of generating plants starting from year 3 onwards s / d year to 20 (age
productive coffee plants). The amount of the investment cost per hectare for 3 years
starting from the year-to-0 is Rp.32,698,512, From Table 2 can be explained that the
investment costs to be incurred for the coffee plantation industry started the year to 0
up to 2 years (before production) is Rp. 32,698,512, - per hectare. The costs incurred
for the purchase of inputs, from seeds and fertilizers to pesticides, coupled with the
cost of the payment of wages of workers, and farming equipment purchases
necessary. The next investment costs before the coffee plants produce presented in
Table 2.

Proceeding 2nd Sriwijaya, Economics, Accounting, and Business Conference 2016
ISBN 979-587-627-9 732
Table 2. Agro-Industry Opportunities for Coffee Products
in Muara Enim Regency in 2010-2016
No Components Value Characteristics
1 NPV (df 15%) Rp 41,005,288 Feasible
2 IRR 35.58% Feasible
3 Gross B/C 2.20 Feasible
4 Net B/C 1.20 Feasible 3th

Proceeding 2nd Sriwijaya, Economics, Accounting, and Business Conference 2016
ISBN 979-587-627-9 733
Table 3. Analysis of Financial Feasibility per hectare Coffee Plantation Investment Period year 0 to year 10th
No.
Costs And Benefits
Components
Years
0 1 2 3 4 5 6 7 8 9 10
I. Investment cost
A. Plantation 26,510,440 2,315,500 2,315,500 0 0 0 0 0 0 0 0
1. Wages and Salaries 15,640,000 1,320,000 1,320,000 0 0 0 0 0 0 0 0
2. Basic Materials 6,755,000 785,000 785,000 0 0 0 0 0 0 0 0
3. Tools 1,705,400 - 0 0 0 0 0 0 0 0 0
4. Contingency 2,410,040 210,500 210,500 0 0 0 0 0 0 0 0
Total Investment cost 26,510,440 2,315,500 2,315,500 0 0 0 0 0 0 0 0
B. Management Fee (5%) 1,325,522 115,775 115,775 0 0 0 0 0 0 0 0
II. Net Investment 27,835,962 2,431,275 2,431,275 0 0 0 0 0 0 0 0
III. Operational Cost 0 0 0 2,770,000 2,050,000 2,100,000 2,100,000 2,100,000 2,100,000 2,100,000 2,100,000
1. Wages and Salaries 0 0 0 1,920,000 1,200,000 1,200,000 1,200,000 1,200,000 1,200,000 1,200,000 1,200,000
2. Basic Materials 0 0 0 850,000 850,000 900,000 900,000 900,000 900,000 900,000 900,000
4. Management fee /(5%) 0 0 0 0 0 0 0 0 0 0 0
IV. Total Cost (II+III) 27,835,962 2,431,275 2,431,275 2,770,000 2,050,000 2,100,000 2,100,000 2,100,000 2,100,000 2,100,000 2,100,000
V. Revenue 0 0 0 19,600,000 22,400,000 25,200,000 30,800,000 33,600,000 36,400,000 36,400,000 33,600,000
Quantityi (kg) 0 0 0 700 800 900 1,100 1,200 1,300 1,300 1,200
Price /kg 0 0 0 28,000 28,000 28,000 28,000 28,000 28,000 28,000 28,000
VI. Profit (V-IV)
-
27,835,962
-
2,431,275
-
2,431,275 16,830,000 20,350,000 23,100,000 28,700,000 31,500,000 34,300,000 34,300,000 31,500,000
df = 15% 1 0.8696 0.7561 0.6575 0.5718 0.4972 0.4323 0.3759 0.3269 0.2843 0.2472
PVB -
27,835,962 -
2,114,152 -
1,838,393 11,065,998 11,635,179 11,484,783 12,407,802 11,842,017 11,212,731 9,750,201 7,786,318
PVC 27,835,962 2,114,152 1,838,393 1,821,320 1,172,094 1,044,071 907,888 789,468 686,494 596,951 519,088
PVR 0 0 0 12,887,318.16 12,807,272.70 12,528,853.73 13,315,689.95 12,631,484.54 11,899,224.57 10,347,151.80 8,305,406.13
Proceeding 2nd Sriwijaya, Economics, Accounting, and Business Conference 2016
ISBN 979-587-627-9 734
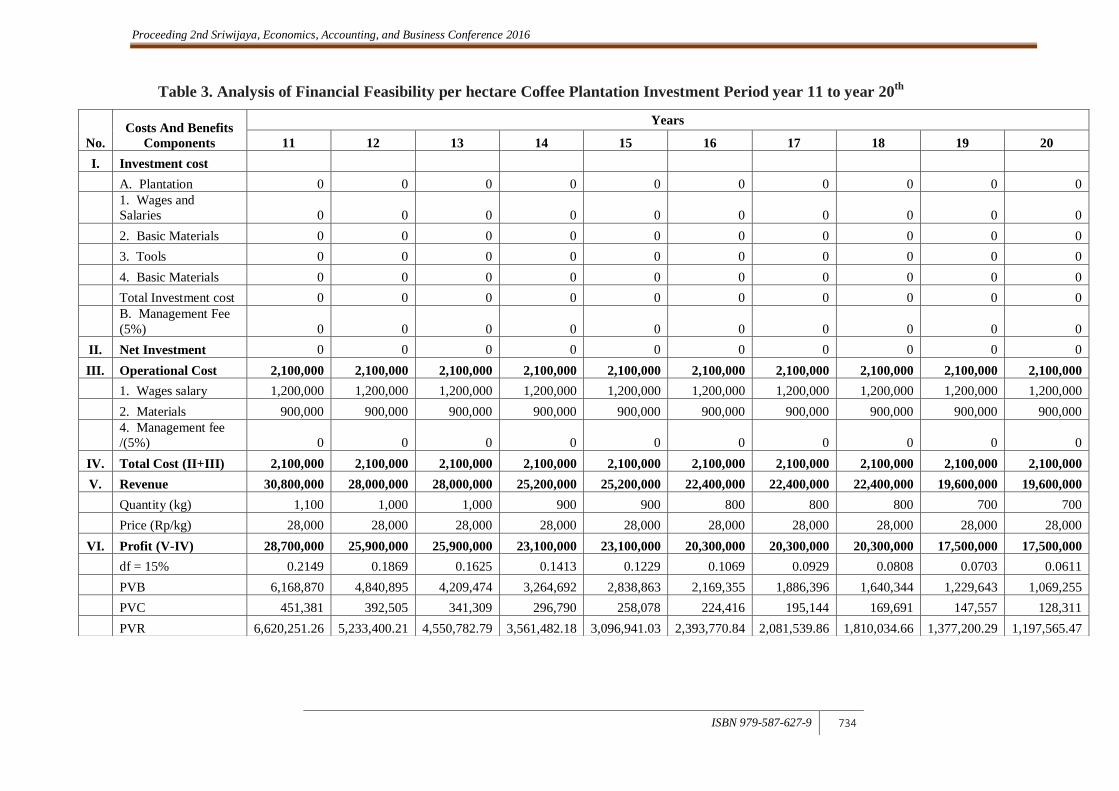
Table 3. Analysis of Financial Feasibility per hectare Coffee Plantation Investment Period year 11 to year 20th
No.
Costs And Benefits
Components
Years
11 12 13 14 15 16 17 18 19 20
I. Investment cost
A. Plantation 0 0 0 0 0 0 0 0 0 0
1. Wages and
Salaries 0 0 0 0 0 0 0 0 0 0
2. Basic Materials 0 0 0 0 0 0 0 0 0 0
3. Tools 0 0 0 0 0 0 0 0 0 0
4. Basic Materials 0 0 0 0 0 0 0 0 0 0
Total Investment cost 0 0 0 0 0 0 0 0 0 0
B. Management Fee
(5%) 0 0 0 0 0 0 0 0 0 0
II. Net Investment 0 0 0 0 0 0 0 0 0 0
III. Operational Cost 2,100,000 2,100,000 2,100,000 2,100,000 2,100,000 2,100,000 2,100,000 2,100,000 2,100,000 2,100,000
1. Wages salary 1,200,000 1,200,000 1,200,000 1,200,000 1,200,000 1,200,000 1,200,000 1,200,000 1,200,000 1,200,000
2. Materials 900,000 900,000 900,000 900,000 900,000 900,000 900,000 900,000 900,000 900,000
4. Management fee
/(5%) 0 0 0 0 0 0 0 0 0 0
IV. Total Cost (II+III) 2,100,000 2,100,000 2,100,000 2,100,000 2,100,000 2,100,000 2,100,000 2,100,000 2,100,000 2,100,000
V. Revenue 30,800,000 28,000,000 28,000,000 25,200,000 25,200,000 22,400,000 22,400,000 22,400,000 19,600,000 19,600,000
Quantity (kg) 1,100 1,000 1,000 900 900 800 800 800 700 700
Price (Rp/kg) 28,000 28,000 28,000 28,000 28,000 28,000 28,000 28,000 28,000 28,000
VI. Profit (V-IV) 28,700,000 25,900,000 25,900,000 23,100,000 23,100,000 20,300,000 20,300,000 20,300,000 17,500,000 17,500,000
df = 15% 0.2149 0.1869 0.1625 0.1413 0.1229 0.1069 0.0929 0.0808 0.0703 0.0611
PVB 6,168,870 4,840,895 4,209,474 3,264,692 2,838,863 2,169,355 1,886,396 1,640,344 1,229,643 1,069,255
PVC 451,381 392,505 341,309 296,790 258,078 224,416 195,144 169,691 147,557 128,311
PVR 6,620,251.26 5,233,400.21 4,550,782.79 3,561,482.18 3,096,941.03 2,393,770.84 2,081,539.86 1,810,034.66 1,377,200.29 1,197,565.47

Proceeding 2nd Sriwijaya, Economics, Accounting, and Business Conference 2016
ISBN 979-587-627-9 735
Coffee Downstream Opportunities
Coffee production area in 2016 covering an area of 22 275 hectares with a total
production of 25 212 tonnes of coffee beans. Leading commodity coffee has a line of
industrial tree called coffee agro-industry and potentially cultivated in this region. Four
districts main producer of coffee in Muara Enim, namely Sub Semende Inland Sea,
Semende Central Army, Army Semende Ulu and Tanjung Agung. Assumptions
consumption amounted to 0,407 ounces of ground coffee per capita, hence the need for
coffee powder as much as 338 tons per year. If per kg of coffee beans ground into powder
coffee 80 percent, then the potential for as many as 21 178 ton.Dengan coffee powder thus
surplus coffee grounds as much as 20 882 tonnes.
Investment opportunities of coffee beans, among others, can be processed into
roasted coffee, ground coffee, instant coffee, coffee mix (coffee with milk), and coffee
bags. While the skin can be made of ironwood and acetic acid. A mixture of skin and flesh
can be processed into ethanol and vinegar eat.
Table 4 Agro-Industry Opportunities for Coffee Products
in Muara Enim Regency in 2010-2016
Years
Area (Ha)
coffee
beans
(Ton)
Domestic
Consumption (Ton)
Surpluscoffee
beans (Ton)
Potential
Powder
Coffee
(Ton)
Powder
Coffee
(Ton)
Surplus
Powder
Coffee (Ton)
Agro-Industry
Opportunities
for Coffee
Products
2010 22,404 25,126 417 24,709 21,106 350 20,756 1. roasted coffee
2. ground coffee
instant coffee,
3. coffee mix
(coffee with
milk)
4. coffee bags
5. flavored
coffee
2011 22,501 25,132 425 24,707 21,111 357 20,754 2012 23,501 25,139 332 24,807 21,117 279 20,837 2013 22,444 25,213 338 24,875 21,179 284 20,895 2014 22,450 25,147 343 24,804 21,123 289 20,835 2015 23,449 25,147 337 24,810 21,123 286 20,837
2016 24,275 25,212 338 24,874 21,178 296 20,882
Sourced : by Statistics Plantation and various sources, 2016 (processed)

Proceeding 2nd Sriwijaya, Economics, Accounting, and Business Conference 2016
ISBN 979-587-627-9 736
SUMMARY AND RECOMMENDATION
Based on the research results can be explained coffee plantation investment
feasibility of geographical aspects, production, markets, farmer institutional and financial
feasibility. Geographically cultivated farmers in Muara Enim regency located in areas that
did have the geographical factors that correspond to ideal growing condition of the coffee
plant. Coffee center area in Muara Enim in Sub Semende Inland Sea (44.10%), Tanjung
Agung (31.01%), Semende Army Ulu (11.19%), and Central Army Semende (10.98%).
Based on the level of production, all these four districts also occupy the highest production.
The production rate 3 districts in Semende reached 66.02 percent and District Court
headland reached 30.90 percent of the total coffee production Muara Enim regency as
many as 25 213 tonnes in 2016. For the production of the eight other districts are relatively
insignificant because it is not a major crop in addition does not suitable for growing coffee.
In terms of productivity, the coffee plantations in Muara Enim average productivity based
on the study was 1.06 tonnes per ha. Compared with the national productivity of 700 kg
per ha, the productivity is relatively still slightly higher than the national productivity.
However, when compared internationally, for example, state that in fact Vietnamese
newcomer in the coffee trade, productivity can reach 1.54 tonnes per ha, over traditional
coffee producing countries such as Brazil; 1 ton per hectare and Columbia; 1.22 tonnes per
ha. Coffee products are marketed through a marketing channel that starts from farmers as
producers, the majority sold to a collector, which then passed into the hands of wholesalers
and exporters, to get into the hands of consumers.
Overview coffee industry cluster in Muara Enim in harmony with the existing
marketing channels in the region, where the dry coffee beans at random as the raw material
of coffee powder produced by coffee plantations. The coffee beans are then purchased by
collectors of coffee, which is then processed by manufacturers of coffee, to produce
ground coffee. Production of ground coffee is then distributed to local markets, national
markets and there are already entering the export market. From the measurement of
financial feasibility of coffee farming by using four eligibility criteria shows that farming
is feasible to be developed with the B / C 1.20 (> 1) meaningful, any costs incurred by
Rp.1 will generate profits of Rp.1.2. In addition, this business can continue to survive on
the interest rate up to 35.58%. Coffee production area in 2016 covering an area of 22 275
hectares with a total production of 25 212 tonnes of coffee beans. Leading commodity
coffee has a line of industrial tree called coffee agro-industry and potentially cultivated in
Proceeding 2nd Sriwijaya, Economics, Accounting, and Business Conference 2016
ISBN 979-587-627-9 737
this region. Four districts main producer of coffee in Muara Enim, namely Sub Semende
Inland Sea, Semende Central Army, Army Semende Ulu and Tanjung Agung.
Assumptions consumption amounted to 0,407 ounces of ground coffee per capita, hence
the need for coffee powder as much as 338 tons per year. If per kg of coffee beans ground
into powder coffee 80 percent, then the potential for as many as 21 178 ton.Dengan coffee
powder thus surplus coffee grounds as much as 20 882 tonnes. Investment opportunities of
coffee beans, among others, can be processed into roasted coffee, ground coffee, instant
coffee, coffee mix (coffee with milk), and coffee bags. While the skin can be made of
ironwood and acetic acid. A mixture of skin and flesh can be processed into ethanol and
vinegar eat
REFERENCES
Central Board Statistc Muara Enim Regency. 2016. Muara Enim in Figure. Muara Enim
Regency: BPS
Central Board Statistc Muara Enim Regency. 2015. Social Economy Indicator Kabupaten
Muara Enim. Muara Enim Regency: BPS
Central Board Statistc Muara Enim Regency. 2015. GDRP Muara Enim Regency: BPS
Berbagai Tahun. Muara Enim. Regency: BPS.
Dinas Perkebunan. 2012. Pengembangan dan Penguatan, Informasi, dan Database
Perkebunan Komoditas Strategis di Kabupaten Muara Enim. Muara Enim: Disbun.
Dinas Perkebunan. 2015. Laporan Akuntabilitas Instansi Pemerintahan Kabupaten Muara
Enim. Muara Enim: Disbun.
Departemen Perindustrian. 2009. Pohon Agro Industri Kopi. Indonesia: Dep. Perindustrian.
Dirjen Perindustrian Agro Dan Kimia Departemen Perindustrian. 2007. Pohon agro
industri pengolahan karet. Muara Enim: Perindustrian.
Kuncoro, Mudrajad. 2013. Economic Indicator. Yogyakarta. UPP STIM YKPN.
Muta’ali, Lutfhi. 2015. Regional Analysis Method for Regionl Planning, and Environment.
Yogyakarta: Badan Penerbit Fakultas Geografi (BPFG) Universitas Gadjah Mada.
Saragih, Jef Rudiantho. 2015. Regional Planning and Local Economic Development Based
on Agricultur : Theory and Application. Yogyakarta. Pustaka Pelajar.
Pusat Pendidikan dan Studi Kebanksentralan Bank Indonesia. 2001. Daya Saing Daerah :
Konsep Dan Pengukurannya di Indonesia. Yogyakarta. BPFE.
Recommended