The External Environment for Developing Countries
October 2009The World Bank
Development EconomicsProspects Group

The DOW regains 10,000
9/1/20089/2/20089/3/20089/4/20089/5/20089/8/20089/9/20089/10/20089/11/20089/12/20089/15/20089/16/20089/17/20089/18/20089/19/20089/22/20089/23/20089/24/20089/25/20089/26/20089/29/20089/30/200810/1/200810/2/200810/3/200810/6/200810/7/200810/8/200810/9/200810/10/200810/13/200810/14/200810/15/200810/16/200810/17/200810/20/200810/21/200810/22/200810/23/200810/24/200810/27/200810/28/200810/29/200810/30/200810/31/200811/3/200811/4/200811/5/200811/6/200811/7/200811/10/200811/11/200811/12/200811/13/200811/14/200811/17/200811/18/200811/19/200811/20/200811/21/200811/24/200811/25/200811/26/200811/27/200811/28/200812/1/200812/2/200812/3/200812/4/200812/5/200812/8/200812/9/200812/10/200812/11/200812/12/200812/15/200812/16/200812/17/200812/18/200812/19/200812/22/200812/23/200812/24/200812/25/200812/26/200812/29/200812/30/200812/31/20081/1/20091/2/20091/5/20091/6/20091/7/20091/8/20091/9/20091/12/20091/13/20091/14/20091/15/20091/16/20091/19/20091/20/20091/21/20091/22/20091/23/20091/26/20091/27/20091/28/20091/29/20091/30/20092/2/20092/3/20092/4/20092/5/20092/6/20092/9/20092/10/20092/11/20092/12/20092/13/20092/16/20092/17/20092/18/20092/19/20092/20/20092/23/20092/24/20092/25/20092/26/20092/27/20093/2/20093/3/20093/4/20093/5/20093/6/20093/9/20093/10/20093/11/20093/12/20093/13/20093/16/20093/17/20093/18/20093/19/20093/20/20093/23/20093/24/20093/25/20093/26/20093/27/20093/30/20093/31/20094/1/20094/2/20094/3/20094/6/20094/7/20094/8/20094/9/20094/10/20094/13/20094/14/20094/15/20094/16/20094/17/20094/20/20094/21/20094/22/20094/23/20094/24/20094/27/20094/28/20094/29/20094/30/20095/1/20095/4/20095/5/20095/6/20095/7/20095/8/20095/11/20095/12/20095/13/20095/14/20095/15/20095/18/20095/19/20095/20/20095/21/20095/22/20095/25/20095/26/20095/27/20095/28/20095/29/20096/1/20096/2/20096/3/20096/4/20096/5/20096/8/20096/9/20096/10/20096/11/20096/12/20096/15/20096/16/20096/17/20096/18/20096/19/20096/22/20096/23/20096/24/20096/25/20096/26/20096/29/20096/30/20097/1/20097/2/20097/3/20097/6/20097/7/20097/8/20097/9/20097/10/20097/13/20097/14/20097/15/20097/16/20097/17/20097/20/20097/21/20097/22/20097/23/20097/24/20097/27/20097/28/20097/29/20097/30/20097/31/20098/3/20098/4/20098/5/20098/6/20098/7/20098/10/20098/11/20098/12/20098/13/20098/14/20098/17/20098/18/20098/19/20098/20/20098/21/20098/24/20098/25/20098/26/20098/27/20098/28/20098/31/20099/1/20099/2/20099/3/20099/4/20099/7/20099/8/20099/9/20099/10/20099/11/20099/14/20099/15/20099/16/20099/17/20099/18/20099/21/20099/22/20099/23/20099/24/20099/25/20099/28/20099/29/20099/30/200910/1/200910/2/200910/5/200910/6/200910/7/200910/8/200910/9/200910/12/200910/13/200910/14/200910/15/200910/16/200910/19/200910/20/20096,000
7,000
8,000
9,000
10,000
11,000
12,000
DJIA
Source: Thomson/Datastream.

Jan-06 Jul-06 Jan-07 Jul-07 Jan-08 Jul-08 Jan-09 Jul-0975
80
85
90
95
100
Source: JPMorgan-Chase.
Nominal effective rate [NEER]
Dollar declines imply a return to pre-crisis levels of the effective exchange rate
Indices, 2000=100.
Real effective rate [REER]
Neer 87.1Neer 85.5

Industrial countries
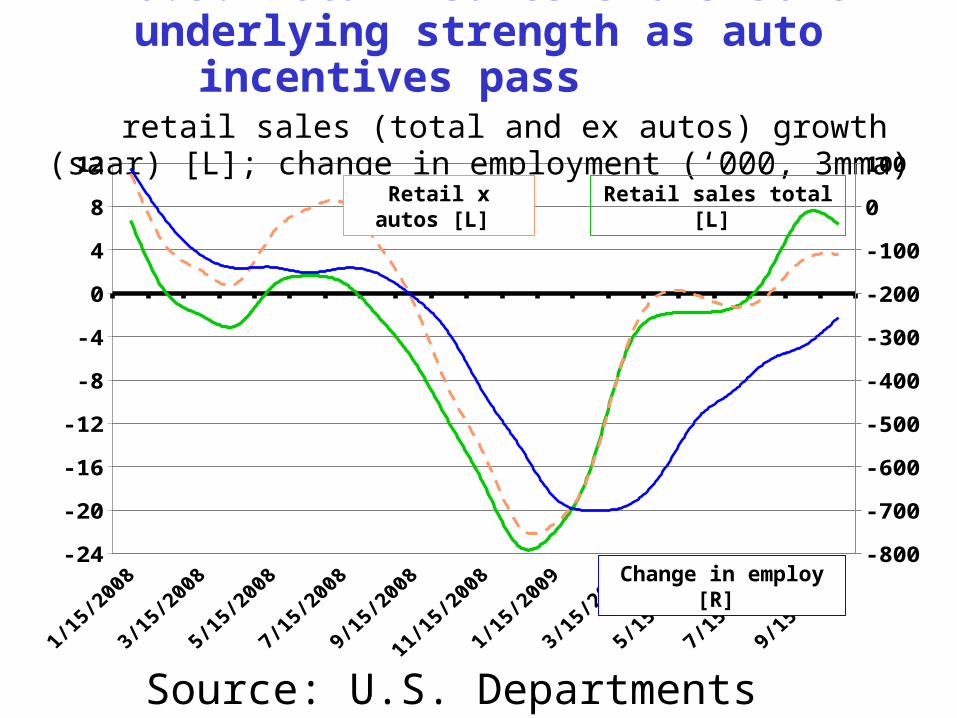
U.S. retail sales shows some underlying strength as auto incentives pass
retail sales (total and ex autos) growth (saar) [L]; change in employment (‘000, 3mma) [R]
Jan-08 May-08 Sep-08 Jan-09 May-09 Sep-09-24
-20
-16
-12
-8
-4
0
4
8
12
-800
-700
-600
-500
-400
-300
-200
-100
0
100
Source: U.S. Departments of Commerce and Labor.
Retail x autos [L]
Change in employ [R]
Retail sales total [L]

A revival in both domestic and foreign demand is coming to support output growth
export volumes, capital goods orders ch%
(saar) [L]; IP mfgr ch% (saar) [R]
Jan-08 May-08 Sep-08 Jan-09 May-09 Sep-09-50
-38
-25
-13
0
13
25
-25
-20
-15
-10
-5
0
5
10
Source: Department of Commerce and Federal Reserve System.
Capital goods orders [L]
IP manufacuring [R]
Export volumes [L]

Actual FY-2008 Preliminary FY-2009-4
-3
-2
-1
0
1
2
3ReceiptsOutlays
Source: Treasury, OMB and CBO.
U.S. spending up 17.8%, receipts down 16.6% yields fiscal deficit of about 10% of GDP
acutal FY 2008 and preliminary FY 2009 federal budget accounts ($trillion)
Deficit: $459 billion, 3.2% GDP
Deficit: $1,409 billion, 9.9% GDP

A change in sentiment toward stronger growth in Japan?
household spending and wages, ch% (y/y) [L]; Tokyo consumer sentiment [R]
Jan-08 Jun-08 Nov-08 Apr-09 Sep-09-10
-8
-6
-4
-2
0
2
4
27.5
32.5
37.5
42.5
Source: Japan Cabinet Office.
Consumer confidence [R]
Wages, growth y/y [L]
Household expenditure [L]

Japan’s orders-, exports and production take another leg up during August
core machinery orders, export volumes and mfgr output, ch% saar
Jan-08 Apr-08 Jul-08 Oct-08 Jan-09 Apr-09 Jul-09-80
-60
-40
-20
0
20
40
60
Source: Bank of Japan and Japan Cabinet Office.
Production
Core machinery orders
Goods export volumes
Jan-07 May-07 Sep-07 Jan-08 May-08 Sep-08 Jan-09 May-09 Sep-09-8
-6
-4
-2
0
2
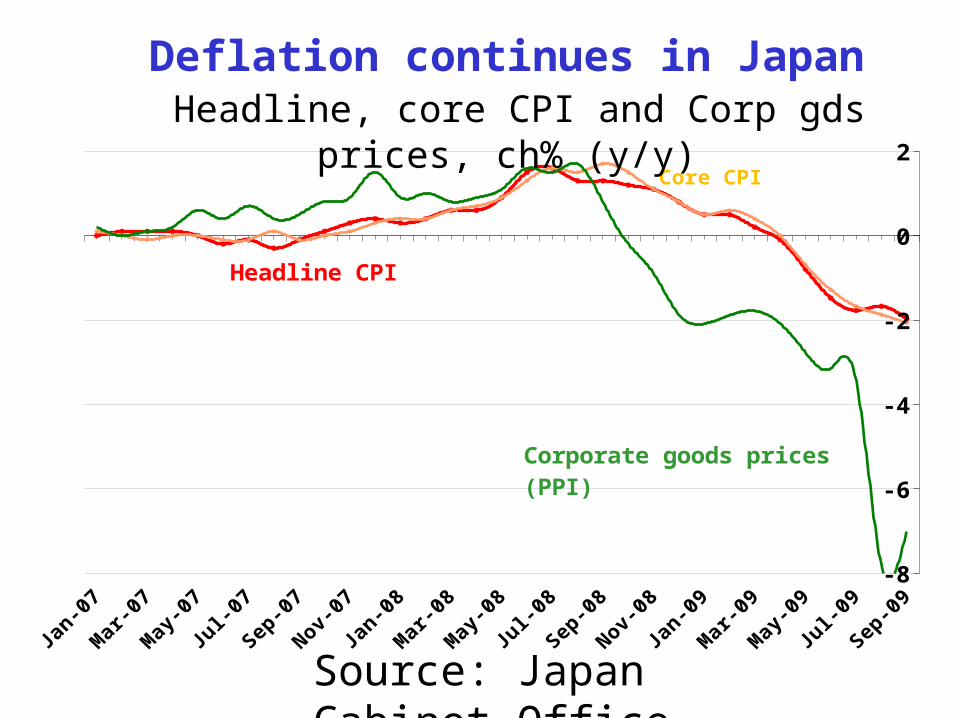
Headline CPI
Corporate goods prices (PPI)
Core CPI
Deflation continues in Japan Headline, core CPI and Corp gds prices,
ch% (y/y)
Source: Japan Cabinet Office.

Jan-08 Apr-08 Jul-08 Oct-08 Jan-09 Apr-09 Jul-09-50.0
-37.5
-25.0
-12.5
0.0
12.5
25.0
Euro Area production moves sharply higher in August– due in part to auto incentives
manufacturing output, ch% (saar)
Germany
Source: Eurostat.
Euro Area
Italy
France

Household spending remains weakas unemployment continues to mount
Euro Area unemployment rate (%) [L] and retail volume growth (y/y) [R]
Jan-08 May-08 Sep-08 Jan-09 May-09 Sep-097.0
7.5
8.0
8.5
9.0
9.5
10.0
-5
-4
-3
-2
-1
0
1
2
Source: EUROSTAT.
Italy [R]
France [R]
Germany sales [R]
EA unemployment rate [L]

Jan-08 May-08 Sep-08 Jan-09 May-09 Sep-0980
100
120
140
160
180
zloty sterling rouble dollar yen
Euro appreciation may come to affect export prospects
euro cross exchange rates for select trade partners (LCU per euro)
Source: Thomson/Datastream and DECPG.

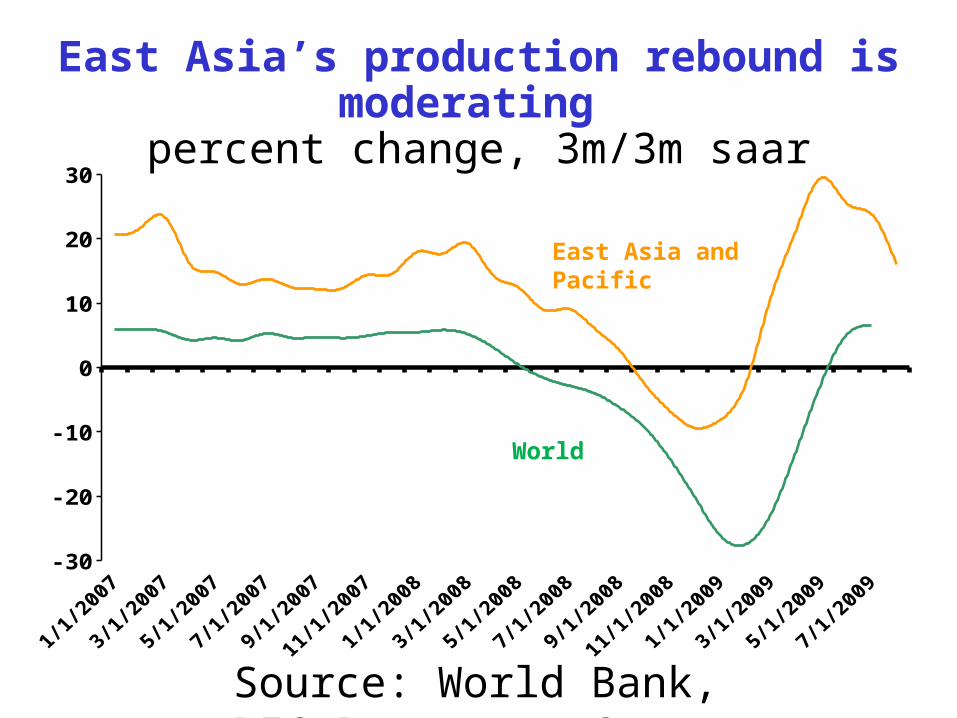
Industrial production
Jan-07 Jul-07 Jan-08 Jul-08 Jan-09 Jul-09-30
-20
-10
0
10
20
30
East Asia’s production rebound is moderating
percent change, 3m/3m saar
World
East Asia and Pacific
Source: World Bank, DEC Prospects Group

High income country developments driving the global IP
cycle
Q1-07 Q2-07 Q3-07 Q4-07 Q1-08 Q2-08 Q3-08 Q4-08 Q1-09 Q2-09 Q3-09-8
-6
-4
-2
0
2
4
6High Income Countries
Developing countries excl China
China
Source: World Bank, DEC Prospects Group.
contributions to global IP growth (% q-o-q)
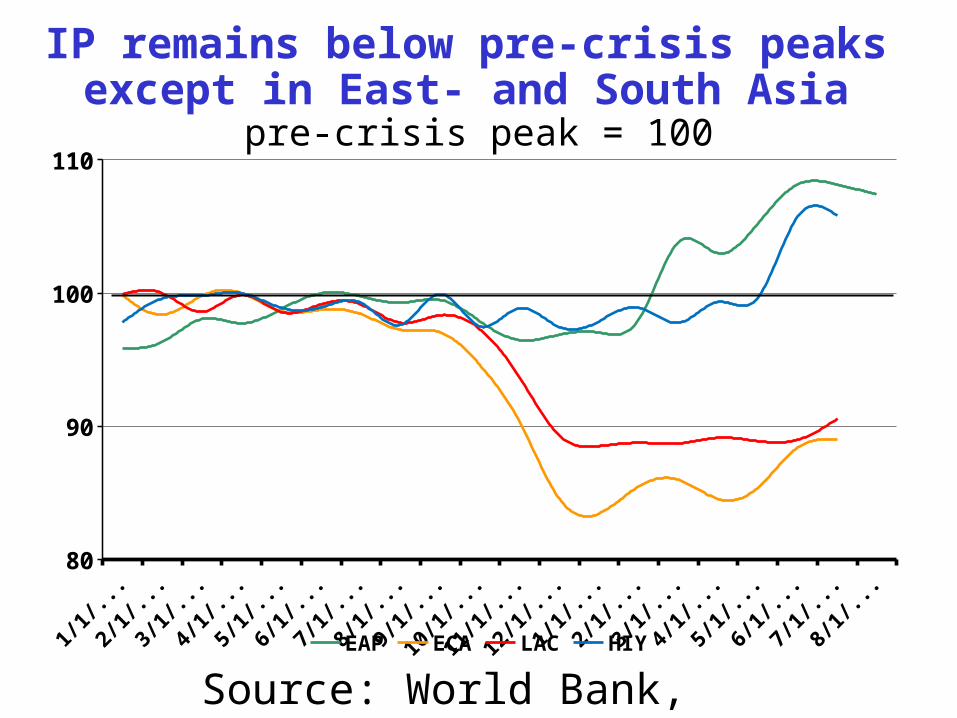
Jan-08 Jul-08 Jan-09 Jul-0980
90
100
110
EAP ECA LAC SAS
IP remains below pre-crisis peaks except in East- and South Asia
pre-crisis peak = 100
Source: World Bank, DEC Prospects Group
International trade

U.S. trade deficit shrinks as personal savings rate rises from record lows
Trade balance $ bn [R]; Personal savings as a percent of disposable income [L]
Jan-90 Jan-93 Jan-96 Jan-99 Jan-02 Jan-05 Jan-080
2
4
6
8
-80
-70
-60
-50
-40
-30
-20
-10
0
Source: U.S. Department of Commerce.
Trade balance [R]
Personal Savings rate [L]

Source: Haver Analytics.
Jan-08 May-08 Sep-08 Jan-09 May-09 Sep-09-80
-60
-40
-20
0
20
40
60
80
15
20
25
30
35
40
Fixed asset investments [R]
Total imports excl. oil [L]
Investment-driven imports by China poised to slow
gross fixed capital formation [R]; Imports excl oil [L] %chg saar

Emerging Asia leads import recovery Total import volumes, 3mma seasonally
adjusted annualized % change
-80
-60
-40
-20
0
20
40
60
80
100
High Income countries
Source: World Bank, DEC Prospects Group.
East Asia including China
East Asia excl. China

Oil prices

Oil prices and OECD oil stocks
Jan-00Feb-00Mar-00Apr-00May-00Jun-00Jul-00Aug-00Sep-00Oct-00Nov-00Dec-00Jan-01Feb-01Mar-01Apr-01May-01Jun-01Jul-01Aug-01Sep-01Oct-01Nov-01Dec-01Jan-02Feb-02Mar-02Apr-02May-02Jun-02Jul-02Aug-02Sep-02Oct-02Nov-02Dec-02Jan-03Feb-03Mar-03Apr-03May-03Jun-03Jul-03Aug-03Sep-03Oct-03Nov-03Dec-03Jan-04Feb-04Mar-04Apr-04May-04Jun-04Jul-04Aug-04Sep-04Oct-04Nov-04Dec-04Jan-05Feb-05Mar-05Apr-05May-05Jun-05Jul-05Aug-05Sep-05Oct-05Nov-05Dec-05Jan-06Feb-06Mar-06Apr-06May-06Jun-06Jul-06Aug-06Sep-06Oct-06Nov-06Dec-06Jan-07Feb-07Mar-07Apr-07May-07Jun-07Jul-07Aug-07Sep-07Oct-07Nov-07Dec-07Jan-08Feb-08Mar-08Apr-08May-08Jun-08Jul-08Aug-08Sep-08Oct-08Nov-08Dec-08Jan-09Feb-09Mar-09Apr-09May-09Jun-09Jul-09Aug-09Sep-09Oct-09Nov-09Dec-09Jan-090
20
40
60
80
100
120
140
2,300
2,400
2,500
2,600
2,700
2,800
$/bbl million bbl
Oil price [L scale]
OECD stocks [R]
Source: IEA and DECPG Commodities Group.
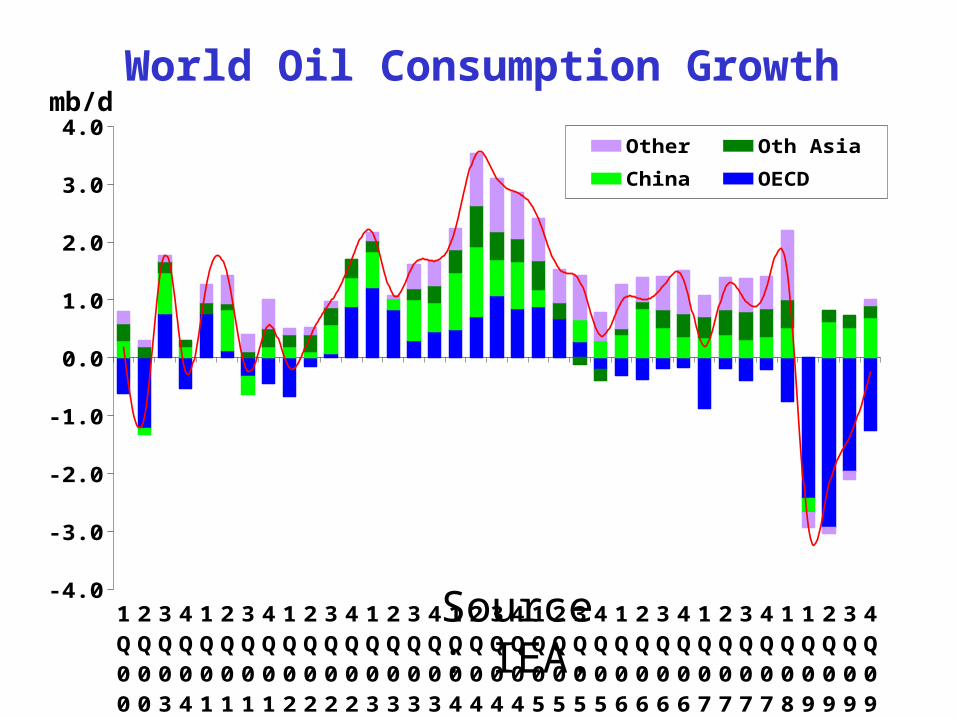
World Oil Consumption Growth
1Q00
2Q00
3Q03
4Q04
1Q01
2Q01
3Q01
4Q01
1Q02
2Q02
3Q02
4Q02
1Q03
2Q03
3Q03
4Q03
1Q04
2Q04
3Q04
4Q04
1Q05
2Q05
3Q05
4Q05
1Q06
2Q06
3Q06
4Q06
1Q07
2Q07
3Q07
4Q07
1Q08
1Q09
2Q09
3Q09
4Q09
-4.0
-3.0
-2.0
-1.0
0.0
1.0
2.0
3.0
4.0Other Oth Asia China
OECD TOTAL
mb/d
Source: IEA.

OPEC Spare Capacity (mb/d)
Jan-01Feb-01Mar-01Apr-01May-01Jun-01Jul-01Aug-01Sep-01Oct-01Nov-01Dec-01Jan-02Feb-02Mar-02Apr-02May-02Jun-02Jul-02Aug-02Sep-02Oct-02Nov-02Dec-02Jan-03Feb-03Mar-03Apr-03May-03Jun-03Jul-03Aug-03Sep-03Oct-03Nov-03Dec-03Jan-04Feb-04Mar-04Apr-04May-04Jun-04Jul-04Aug-04Sep-04Oct-04Nov-04Dec-04Jan-05Feb-05Mar-05Apr-05May-05Jun-05Jul-05Aug-05Sep-05Oct-05Nov-05Dec-05Jan-06Feb-06Mar-06Apr-06May-06Jun-06Jul-06Aug-06Sep-06Oct-06Nov-06Dec-06Jan-07Feb-07Mar-07Apr-07May-07Jun-07Jul-07Aug-07Sep-07Oct-07Nov-07Dec-07Jan-08Feb-08Mar-08Apr-08May-08Jun-08Jul-08Aug-08Sep-08Oct-08Nov-08Dec-08Jan-09Feb-09Mar-09Apr-09May-09Jun-09Jul-09Aug-09Sep-090
1
2
3
4
5
6
7
Source: IEA and DECPG Commodities Group.

Non-oil commodity prices

Jan-05 Jan-06 Jan-07 Jan-08 Jan-09100
150
200
250
300
350
Grains
Fats & Oils
Other Food
Beverages
Fats & Oils, and grains off in October(2000=100)
Source: DECPG Commodities Group.

Copper stocks and prices
Jan-05Apr-0
5
Aug-05Dec-05
Apr-06
Aug-06Dec-06
Apr-07
Aug-07
Nov-07Mar-0
8Jul-0
8
Nov-08Mar-0
9Jul-0
91000
2000
3000
4000
5000
6000
7000
8000
9000
0
100
200
300
400
500
600
$/ton ‘000 tons
Copper price
LME stocks
Source: LME and DECPG Commodities Group.

Freight rates fall on weaker demand and increases in new vessel capacity
Jan-00
Aug-00Feb-01
Sep-01Apr-0
2
Nov-02Jun-03
Jan-04
Aug-04Mar-0
5Oct-0
5
May-06
Nov-06Jun-07
Jan-08
Aug-08Mar-0
9Oct-0
90
2,000
4,000
6,000
8,000
10,000
12,000
Baltic dry freight index
Source: Datastream and DECPG Commodities Group.

International Finance

A substantial pickup in flows in September
Source: DECPG Finance Team.
Gross capital flows to developing countries
$ billion 2007
Total H1 Q3 Jan-Sep Total H1 Q3 Aug Sep Jan-Sep
Total 652 258 82 340 390 110 97 14 42 207
Bonds 146 53 9 62 65 36 37 4 13 73
Banks 312 151 63 214 257 40 22 6 9 63
Equity 194 54 10 64 68 33 38 4 21 71
Lat. America 156 61 18 80 90 37 32 1 15 69
Bonds 45 17 1 18 20 15 21 1 11 36
E. Europe 247 99 35 134 157 22 25 3 8 47
Bonds 64 27 7 35 35 13 11 1 1 24
Asia 188 69 18 88 98 44 32 6 15 76
Bonds 23 7 0 7 7 6 3 1 1 9
Others 61 28 11 38 45 7 8 2 4 15
2008 2009
2003 2004 2005 2006 2007 2008 YTD 2009 YTD0
20
40
60
80
100
120
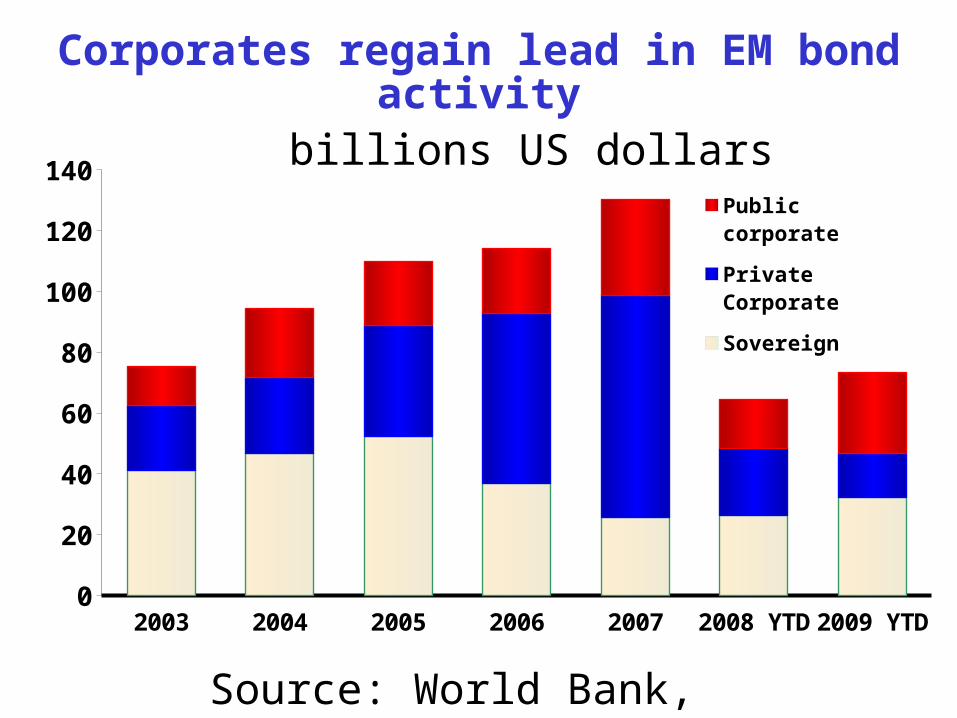
140Public cor-porate
Private Cor-porate
Sovereign
Corporates regain lead in EM bond activity billions US dollars
Source: World Bank, DEC Prospects Group

EM IPO activity regains momentum
Jan-08 Apr-08 Jul-08 Oct-08 Jan-09 Apr-09 Jul-090
1000
2000
3000
4000
5000
6000
7000
8000
0
5
10
15
20
25
30
Source: DECPG, Finance Team.
Capital raised [Bars, left]
Number of deals [Line, right]

Currencies

Jul-08 Oct-08 Jan-09 Apr-09 Jul-09 Oct-091.230
1.270
1.310
1.350
1.390
1.430
1.470
1.510
1.550
1.590
1.630 86
90
94
98
102
106
110
Source: Thomson/Datastream.
yen/USD
USD/Euro (inverse)
Dollar’s fall picks up in September and October
USD per Euro (inverse) [Left] and Yen per USD [right]

Jan-06 Jul-06 Jan-07 Jul-07 Jan-08 Jul-08 Jan-09 Jul-0975
80
85
90
95
100
Source: JPMorgan-Chase.
Nominal effective rate [NEER]
Dollar declines imply a return to pre-crisis levels of the effective exchange rate
Indices, 2000=100.
Real effective rate [REER]
Neer 87.1Neer 85.5

The External Environment for Developing Countries
October 2009The World Bank
Development EconomicsProspects Group
Recommended