The Effects of Thermal Conditions
and Indoor Air Quality
on Health, Comfort
and Cognitive Performance
of Students
Chatzidiakou L, Mumovic D, Dockrell J
Commissioned by:

The Effects of Thermal Conditions and Indoor AirQuality on Health, Comfort and Cognitive
Performance of Students
Authors:
Lia Chatzidiakou, Dejan Mumovic, Julie Dockrell
Published by:The Bartlett, UCL Faculty of the Built Environment
UCL Institute for Environmental Design and EngineeringLondon, October 2014

Published by:
The Bartlett, UCL Faculty of the Built Environment, London, October 2014
Copyright ©Built Offsite
ISBN 978-0-9930137-3-7
About the authors
UCL is ranked fourth in the world’s top ten universities by the QS World University Rankings (2012). More than 4,000 academic and research staff at UCL are
dedicated to research and teaching of the highest standards. Nobel prizes have been awarded to 21 former academics and graduates. In the last 2008 Research
Assessment Exercise (RAE), UCL was rated the best research university in London, and third in the UK overall, for the number of its submissions which were
considered of ‘world-leading quality’. UCL is one of the most successful UK universities at attracting funding, with an income of nearly £900 million in 2012,
when we received: (a) 3rd highest allocation of Research Council UK funding, and (b) 3rd highest allocation of European Research Council Starting Grants. More
than 40% of the almost 27,000-strong student community is engaged in graduate studies, with more than a third of these graduate students pursuing research
degrees.
The Institute of Education has a reputation as the UK’s premier institution for the education and training of teachers and for the conduct of educational and social
research. Originally founded in October 1902 as the London Day Training College, in 1987 the award of a Royal Charter confirmed its status as an independent
college and school of the University of London. Over the last one hundred years the Institute has seen a broadening of responsibilities, and it is now the largest
university centre of education research in the UK – undertaking around a quarter of the education research carried out in UK universities – as well as being one of
the largest UK centres of social science – as the second highest recipient of social science research funding among higher education institutions. In any one year,
staff at the IOE are engaged in over 250 research projects funded by research councils, charities, government departments and international agencies.
Professor Julie Dockrell
Julie is Professor of Psychology and Special Needs at the Institute of Education, University of London, and a Visiting Professor at the University of Umea in
Sweden. She has also acted as an advisor or consultant to the Department for Education, the National Children’s Bureau, Open University and the Qualifications
and Curriculum Authority, amongst others. She has expertise and an extensive publications record in language development and difficulties; the wider impacts of
experiencing a language problem; lexical development and semantic representation; assessment of language and cognition; developmental difficulties; impact of
acoustic environments on language and learning; and interventions to enhance oral language skills.
Professor Dejan Mumovic
Dejan is a building scientist with a background in heating, ventilation and air conditioning engineering and the extensive experience of monitoring and modelling
work in the field of the built environment. Dejan is a Professor of Building Performance Analysis at the UCL Institute for Environmental Design and Engineering.
He is a member of the Education Funding Agency Steering Committees on Building Performance Evaluation and Ventilation Design. Dejan is a co founder and
long standing board member of CIBSE School Design Group (5,700 members, 2013). He co-authored and edited DCLG’s Ventilation Design in Schools and
forthcoming CIBSE’s TM on Integrated School Design.
Lia Chatzidiakou
Lia is a doctoral researcher in healthy buildings at the UCL Institute for Environmental Design and Engineering. She has been working on a large EU Commission
project School Indoor Pollution and Health: Observatory Network In Europe (SINPHONIE) which aims to improve indoor air quality in schools by establishing
indoor air quality benchmarks for schools and assessing effects of indoor air quality on health of primary school children. Lia is a postgraduate teaching assistant
on MSc in Environmental Design and Engineering.
Advisors
Josephine Kavanagh, Rebecca Rees
ii
Built Offsite preface
Built Offsite Ltd is an education construction specialist operating across the UK and is very aware of its respon-
sibility to create optimum learning environments for the benefit of the students making use of these new school
facilities.
Since its inception Built Offsite has been committed to reducing the energy demand and environmental impact in
its design and specification of the school buildings it constructs. As a result of this continued development focus
on sustainability the Company routinely provides schools that can achieve a peak heating demands of less than 10
W/m2 which is in line with the best Passivhaus standards.
However the Company has increasingly become aware that the drive towards energy efficiency could be to the
detriment of indoor air quality, with consequential negative impacts on learning performance for the school.
Built Offsite has now focussed its R&D efforts towards developing classroom environments that seek to optimise
Indoor Air Quality (IAQ) and energy demand to create sustainable school buildings that have a positive impact
on learning performance.
Built Offsite believed it was essential to establish if there were clear, unequivocal quantitative links between air
quality in the classroom and cognitive performance to support this development objective. With this in mind Built
Offsite commissioned the internationally respected authorities in this field, University College London (UCL)
and the Institute of Education (IoE), to work together to undertake an independent and systematic review of the
published research in this area to determine the evidence base for this link.
iii
Executive summary
The present review evaluates the strength and consistency of current evidence indicating that there is an associa-
tion between indoor pollutants and thermal conditions in schools on students’ performance. Moreover, the report
examines evidence that air pollution and thermal conditions may have acute and adverse effects on students’ health
which can indirectly affect performance, through impaired attendance and discomfort. Current guidelines ensuring
adequate IAQ in UK school classrooms have been framed around CO2 levels, and do not consider specific pollu-
tants, as there is no direct evidence linking exposure to indoor microbial and chemical pollutants in classrooms
with reduced performance. Main findings include:
1. There is evidence that lower temperatures in the range between 25�C to 20�C improved student performance
by 2% to 4% for every 1�C reduction. Whilst the current guidance in BB101 permits classroom tempera-
tures above 25�C there is evidence that maintaining classroom temperatures substantially below these DfE
guidelines could have significant benefits both in terms of student performance and well being.
2. Low outdoor air ventilation rates and thus high indoor concentrations of CO2 impairs attention span and
increases concentration loss and tiredness . There is evidence that increasing ventilation rates from 5 L/s-p
to 15 L/s-p was associated with a 7% improvement in academic performance. Further there is evidence that
cognitive performance may be affected at CO2 levels as low as 1000 ppm.
3. Higher indoor CO2 levels have been associated with increased probability of communicable infection, asth-
matic symptoms, absenteeism, and impaired academic performance of children. Every decrease of indoor
CO2 levels by 1000 ppm was associated with at least 1.0% to 2.5% relative decrease in illness absence of
students.
4. Currently there is no evidence on the effect of VOC levels on cognitive performance of students. Higher
levels of Total Volatile Organic Compounds (TVOCs) were associated with Sick Building Syndrome (SBS)
symptoms and dissatisfaction with IAQ. Control of indoor sources together with CO2 levels below 1300 ppm
(95%CI1: 1200 to 1400 ppm) may result to TVOCs levels below 200 µg/m3, that is the lowest threshold for
discomfort in some countries. Currently, there are no guidelines on indoor TVOCs concentrations in UK
for non-industrial environments.
5. Increased ventilation rates can reduce indoor mould concentrations (an increase of 1 CFU/m3 of microbial
concentrations for every 1 ppm increase in CO2); however thresholds for mould concentrations are not well
defined. Sufficient evidence associates high microbial concentrations with general and respiratory symp-
toms in children. There were no studies on the effect of biological concentrations on cognitive performance
of students.
6. Traffic related pollutants, such as Particulate Matter, ozone and carbon monoxide were linked to increased
illness-related absenteeism and asthma incidence. Exposure to nitrogen dioxide was related to asthma in-
cidence and asthma exacerbations. Indoor levels of traffic related pollutants shall be considered separately
because low CO2 levels do not guarantee a healthy environment, although they provide a first indication of
exposure.
1Confidence Interval: for a given statistic calculated for a sample of observations, the confidence interval is a range of values around thatstatistic that are believed to contain, with a certain probability (eg 95%), the true value of that statistic.
iv
Based on the available evidence, engineering recommendations for healthy, comfortable school environments
conducive to knowledge have been proposed:
1. Schools should not allow temperatures to drift above the recommended range of 20 to 22 �C in the winter
season and 22 to 24 �C in the summer. While current guidelines allow temperatures in the range of 25 �C to
32 �C, evidence suggests that temperatures in this range may impact on cognitive performance and comfort
of the students.
2. Overall evidence suggests limiting average indoor CO2 concentrations in all teaching and learning spaces to
an average of 1000 ppm (a minimum fresh air supply rate of 8 L/s-p) during a teaching day, which is below
current guidelines.
3. Construction and cleaning materials used in the classrooms should not be used if they impact on IAQ. Ma-
terials can be screened based upon both content and actual measured emissions. VOC content refers to the
amount of chemicals in the product that are VOCs and, as such, can potentially off gas from the product
during installation or use. VOC emissions refer to the gases released by the product during installation or
use. With serious debate about the applicability of emissions tests for other chemicals of concern, screening
by content is currently the most reliable way to avoid problematic exposures. Project teams should commu-
nicate directly with manufacturers’ representatives to obtain information about chemicals of concern.
4. Filtration of outdoor air can deal effectively with airborne particles but not with other chemicals while it
introduces further challenges (increased running costs, source of contamination if filters are poorly main-
tained). Location of school buildings should be considered in relation to outdoor pollution sources. More
broadly, policy should be directed towards citywide level planning, such as urban greening programmes
around school buildings, which are likely to decrease outdoor pollution levels reducing prevalence of respi-
ratory illness. Monitoring of indoor concentrations of chemicals known in respect of their hazardousness to
health, should be performed routinely in school buildings. Indoor concentrations shall comply with guide-
lines of the World Health Organisation, which provide a scientific basis for legally enforceable standards
for the indoor environment.
Overall, this report found indicative evidence that CO2 levels in classrooms lower than those recommended in
current guidelines could improve academic performance, health and comfort of the occupants. However, carefully
designed studies, controlling for potential confounding factors, are required to extend and elaborate the findings
outlined in this report.
v
Contents
Built Offsite preface iii
Executive summary iv
List of Figures vii
List of Tables vii
Nomenclature viii
1 Introduction 1
2 Regulatory framework and empirical evidence on indoor levels in school settings 2
2.1 Thermal conditions . . . . . . . . . . . . . . . . . . . . . . . . . . . . . . . . . . . . . . . . . . 2
2.2 Ventilation rates and CO2 levels . . . . . . . . . . . . . . . . . . . . . . . . . . . . . . . . . . . 3
2.3 Guideline values for indoor pollutants . . . . . . . . . . . . . . . . . . . . . . . . . . . . . . . . 4
3 Methodology 5
3.1 Aims . . . . . . . . . . . . . . . . . . . . . . . . . . . . . . . . . . . . . . . . . . . . . . . . . . 5
3.2 Search strategy . . . . . . . . . . . . . . . . . . . . . . . . . . . . . . . . . . . . . . . . . . . . 5
3.3 Inclusion and exclusion criteria . . . . . . . . . . . . . . . . . . . . . . . . . . . . . . . . . . . . 6
3.4 Classification and quality assessment of studies . . . . . . . . . . . . . . . . . . . . . . . . . . . 7
3.5 Data extraction and synthesis of evidence . . . . . . . . . . . . . . . . . . . . . . . . . . . . . . 9
4 The effect of temperature on health, cognitive performance and comfort 9
5 The effect of ventilation rates and CO2 levels on health, cognitive performance and perceived IAQ 13
6 The effect of school exposure on health and perceived IAQ 16
7 Discussion 17
7.1 Synthesis of findings . . . . . . . . . . . . . . . . . . . . . . . . . . . . . . . . . . . . . . . . . 17
7.2 Future work and recommendations . . . . . . . . . . . . . . . . . . . . . . . . . . . . . . . . . . 19
7.3 Strengths and limitations of review . . . . . . . . . . . . . . . . . . . . . . . . . . . . . . . . . . 20
8 Conclusions 20
References 22
Appendix
vi
List of Figures
1 Correlation between indoor CO2 levels and ventilation rates in naturally and mechanically venti-
lated classrooms . . . . . . . . . . . . . . . . . . . . . . . . . . . . . . . . . . . . . . . . . . . . 3
2 Moderate relationship between CO2 concentrations and TVOCs in 132 classrooms in published
literature . . . . . . . . . . . . . . . . . . . . . . . . . . . . . . . . . . . . . . . . . . . . . . . . 5
3 Flow diagram of study selection . . . . . . . . . . . . . . . . . . . . . . . . . . . . . . . . . . . 8
4 Normalised performance as a function of classroom temperature . . . . . . . . . . . . . . . . . . 12
5 Percentage change in performance in association with average ventilation rate . . . . . . . . . . . 15
List of Tables
1 WHO guidelines of maximum acceptable levels of indoor pollutants . . . . . . . . . . . . . . . . 4
2 Keywords used . . . . . . . . . . . . . . . . . . . . . . . . . . . . . . . . . . . . . . . . . . . . 9
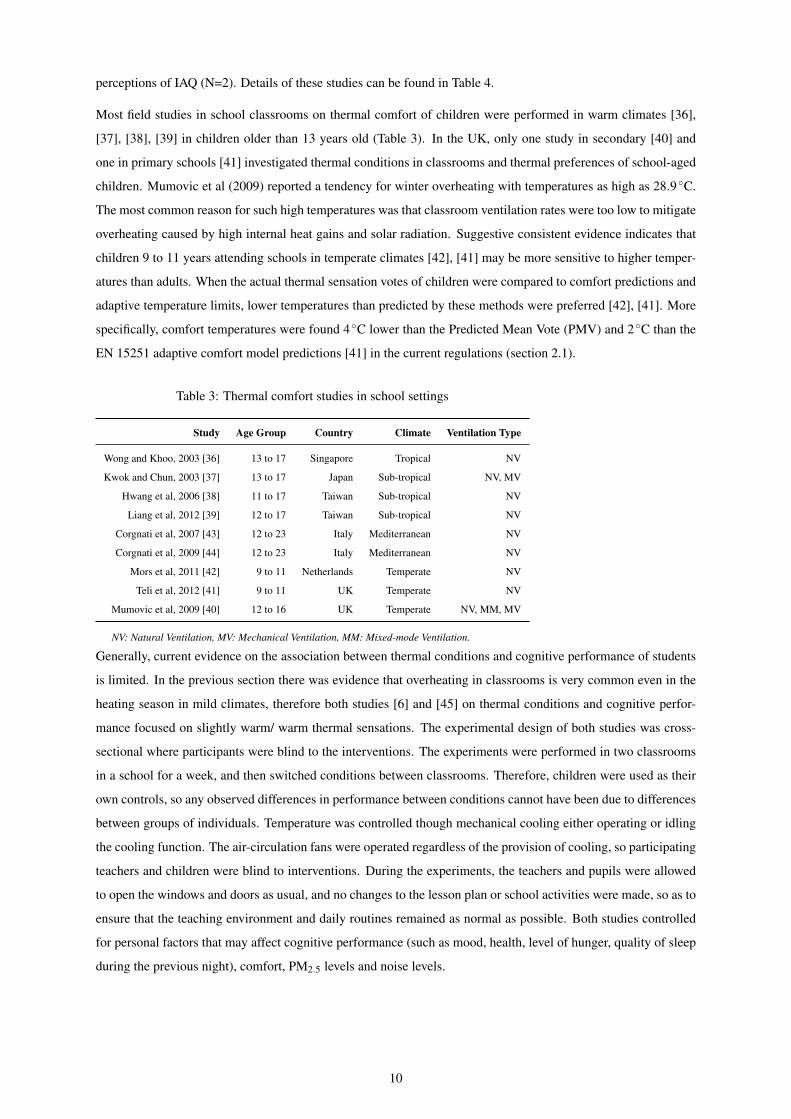
3 Thermal comfort studies in school settings . . . . . . . . . . . . . . . . . . . . . . . . . . . . . . 10
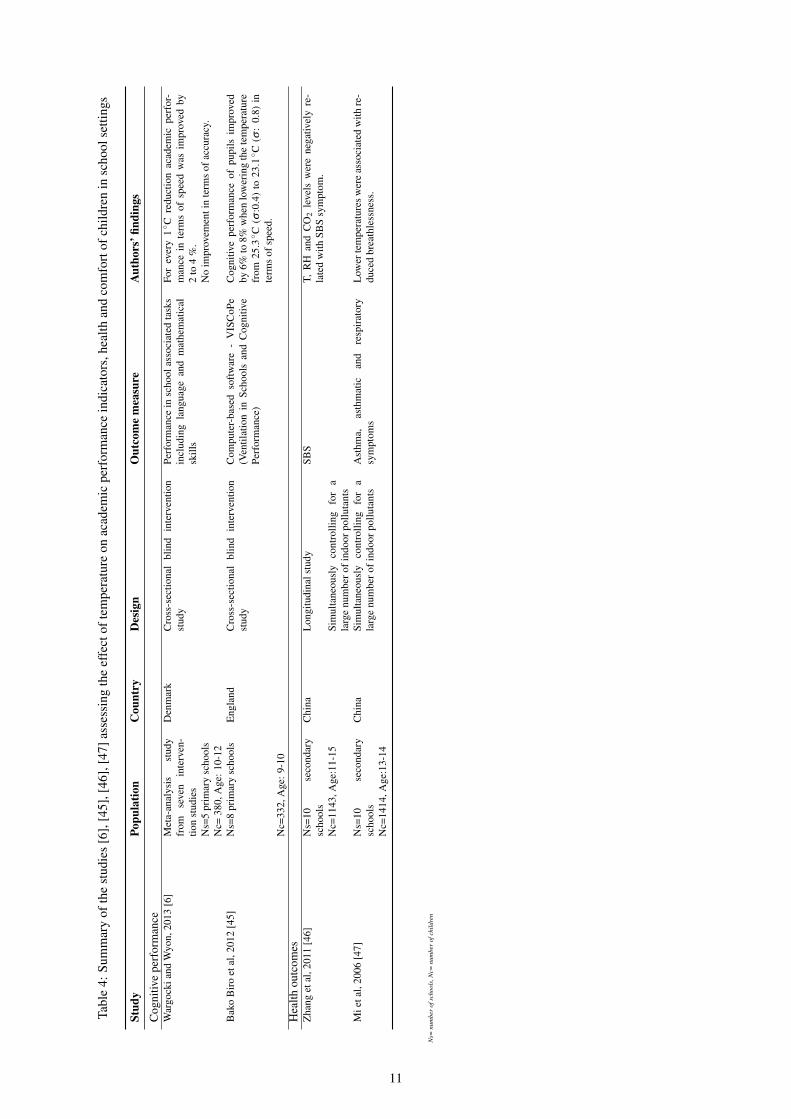
4 Summary of the studies assessing the effect of temperature on academic performance indicators,
health and comfort of children in school settings . . . . . . . . . . . . . . . . . . . . . . . . . . . 11
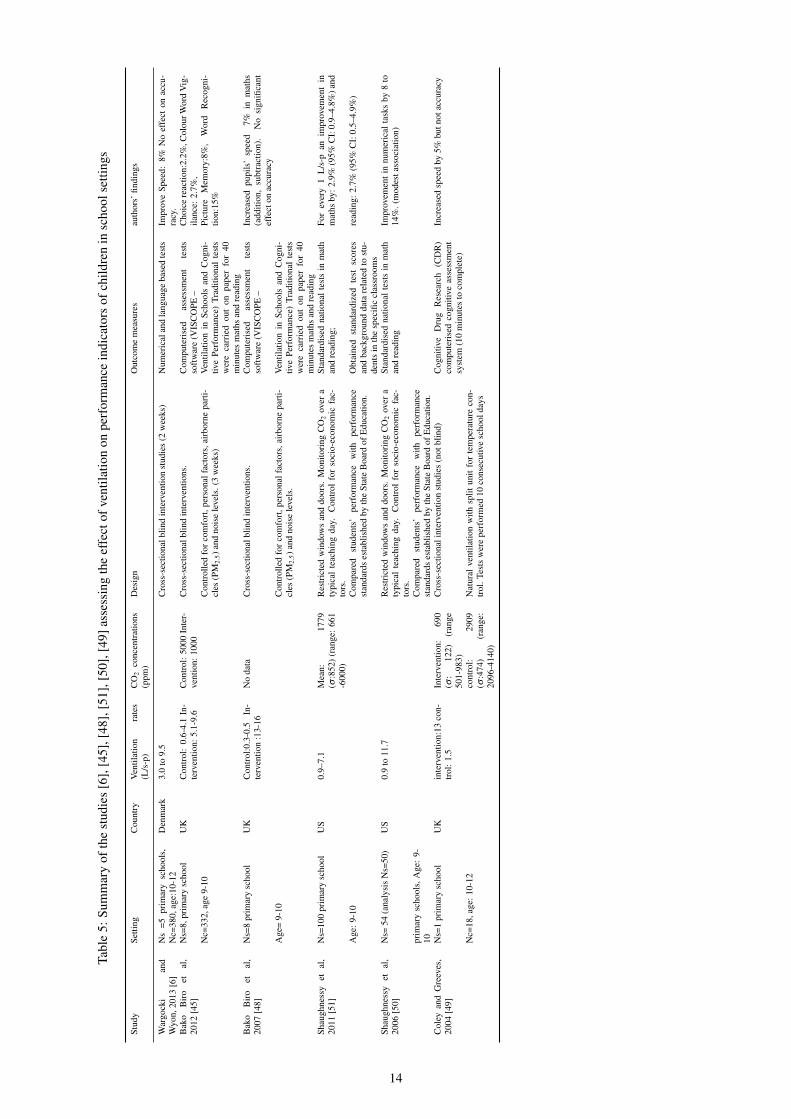
5 Summary of the studies assessing the effect of ventilation on performance indicators of children
in school settings . . . . . . . . . . . . . . . . . . . . . . . . . . . . . . . . . . . . . . . . . . . 14
vii
Nomenclature
s standard deviation
µm micrometre
DCO2 indoor minus outdoor CO2 levels
95%CI 95% Confidence Interval
ASHRAE American Society of Heating, Refrigeration, and Air-Conditioning Engineers
BB101 Building Bulletin 101
CFU/m3 Colony Forming Unit per cubic meter of air
CO Carbon Monoxide
CO2 Carbon Dioxide
ISAAC The International Study of Asthma and Allergies in Childhood
L/s-p litres per second per person
Ns Number of schools
Nc Number of children
NO Nitrogen Monoxide
NO2 Nitrogen Dioxide
NV Natural Ventilation
MM Mixed-Mode Ventilation
MV Mechanical Ventilation
O3 Ozone
OR Odds Ratio
meta-OR meta-analytic Odds Ratio
PM Particulate Matter
PM2.5 Airborne particles with a diameter less than or equal to 2.5 µm
PM10 Airborne particles with a diameter less than or equal to 10 µm
PMV Predicted Mean Vote
PPD Predicted Percentage Dissatisfied
ppm Parts Per Million
RH Relative Humidity
SBS Sick Building Syndrome
TVOCs Total Volatile Organic Compounds
VOC Volatile Organic Compound
viii
1 Introduction
School buildings are complex spaces to design as they need to perform well in all aspects of environmental
conditions, including, but not limited to, air quality and acoustic levels [1], while needing to accommodate periods
with very high occupant densities. The typical classroom has on average four times as many occupants per square
metre as the typical office building. According to Eurostat (2011) [2], the average primary class size in European
countries and the US was 21 (s : 2) pupils corresponding to a density ranging from 2 to 3.1 m2 per person. The
high occupancy densities in school classrooms result in high internal heat gains, high carbon dioxide (CO2) levels,
emissions of body odours together with various indoor pollutants (physical, chemical and microbial).
Former meta-analytic reviews [3], [4], [5] offer a comprehensive picture of air quality and thermal conditions
in school settings, emphasising that reduced ventilation rates and elevated indoor temperatures in schools are
common, frequently much worse than in office buildings [6]. Children are more vulnerable to airborne pollutants
than adults because their developing lungs breathe more air compared to the relative size of their bodies, and they
have an underdeveloped ability to communicate concerns in response to pollutant levels. Children spend most of
their time indoors while at school [2]. School authorities have a particular duty of care for their pupils in ensuring
that appropriate conditions in the indoor environment are maintained. In this context, thermal comfort levels and
Indoor Air Quality (IAQ) have a crucial role to play in producing an environment that supports optimal educational
and health outcomes.
Health symptoms and irritations in indoor environments are reported with different frequency; one group of fre-
quent symptoms has been identified as Sick Building Syndrome (SBS). Presently, it is not clear if SBS consists
of symptoms correlated to an exposure or reflects an accumulation of effects of several unrelated indoor expo-
sures.
The UK has one of the highest prevalence rates of childhood asthma among European countries, with almost 10%
of children (1.1 million) suffering from symptoms [7]. In many countries a significant increase in asthma hospital
admissions among asthmatic children peak in September, and coincide closely with their return to the school
environment [8], [9], [10]. These studies indicate that a sub-population of school-aged children with asthma
receive challenges when returning back to school that trigger their asthma, such as viral infections and exposure
to allergens. Rising respiratory disease has led to an increasing research focus on IAQ in schools and the need
for worldwide epidemiological campaigns, such as the International Study of Asthma and Allergies in Childhood
(ISAAC) involving more than 100 countries and nearly 2 million children [11].
While other variables, such as socio-economic factors, diet, special educational needs and pedagogy, affect health
and educational outcomes [12], the present review evaluates the strength and consistency of current evidence that
indoor pollutants and thermal conditions in schools may influence students’ performance or attendance. Addi-
tionally, this review briefly presents evidence that school exposure may have health and comfort implications on
school occupants, which may impair performance indirectly. For example, exposure to indoor pollutants may ex-
acerbate diseases, such as asthma, resulting in health symptoms or absenteeism that in turn impairs performance
indirectly through effects on attendance.
1
2 Regulatory framework and empirical evidence on indoor levels in school
settings
This section presents current regulatory frameworks developed to ensure acceptable thermal conditions and ade-
quate IAQ in educational settings and other non-industrial environments. Moreover, current evidence on thermal
conditions and indoor pollution levels in classrooms is summarised.
2.1 Thermal conditions
There has been an extensive research on thermal comfort over several decades, which has led to two main ap-
proaches, the thermo-physiological and the adaptive comfort approach. Both approaches form the basis for ex-
isting thermal comfort standards, which include ISO 7730 [13], ASHRAE Standard 55 [14], and at the European
level EN 15251 [15]. The thermo-physiological model was developed by Fanger [16] based on extensive Ameri-
can and European experiments which involved over 1000 subjects exposed to well-controlled environments. The
model equation developed is presented in ISO 7730, and can be used to calculate Predicted Mean Vote (PMV).
This predicted thermal sensation can be transferred to the predicted thermal comfort in the form of Predicted Per-
centage Dissatisfied (PPD), which is the predicted percentage of people in a large group that will be dissatisfied
at a PMV value. The calculation of PMV takes into account the thermo-physiological properties of humans and
their balance with the environment. On a personal level this includes the activity level and clothing insulation.
The thermal environment is determined by the variables air temperature, mean radiant temperature, relative hu-
midity and air velocity. The recommended temperature range lies between 20 �C ±1 to 24.5 �C ±2.5 depending
on season.
Latest versions of the standards ASHRAE 55 2010 [14], ISO 7730 [13] and EN 15251 [15] include also an adap-
tive thermal comfort diagram in the evaluation of thermal comfort of a not fully conditioned indoor environment
allowing for a wider band of temperatures and corresponding energy savings. The required operative temperature
is estimated as a function of a weighted running mean of the exterior temperature. Adaptive models have been
developed through fieldwork and state that thermal preferences depend on the way people interact with their envi-
ronment, modifying their own behaviour and adapting their expectations to match the thermal environment.
Based on the above standards [14], [13], [15], the UK Building Bulletin 101 (BB101) recommendation focuses on
preventing overheating in the non-heating season [17]. More specifically, BB101 recommends that air temperature
in UK classrooms during the occupied period of the non-heating season, should not exceed 32�C and there should
be no more than 120 hours when the air temperature in the classroom rises above 28 �C . Moreover, the average
internal to external temperature difference should not exceed 5 �C . The revised BB101 performance criteria
[18] suggests that when the external air temperature is 22�C, or higher, the internal operative temperature should
not exceed the external air temperature by more than 3�C. Regarding the heating season, regulatory framework
focuses on minimum indoor temperatures in the workplace of 16�C [19].
2
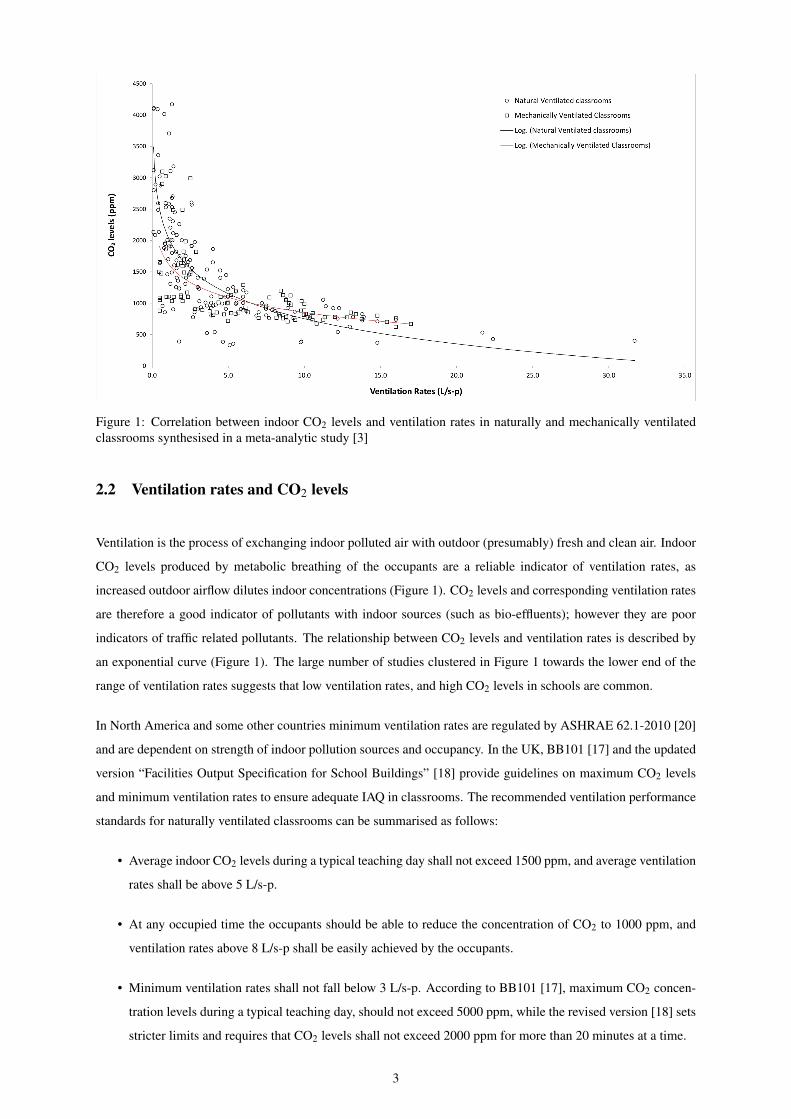
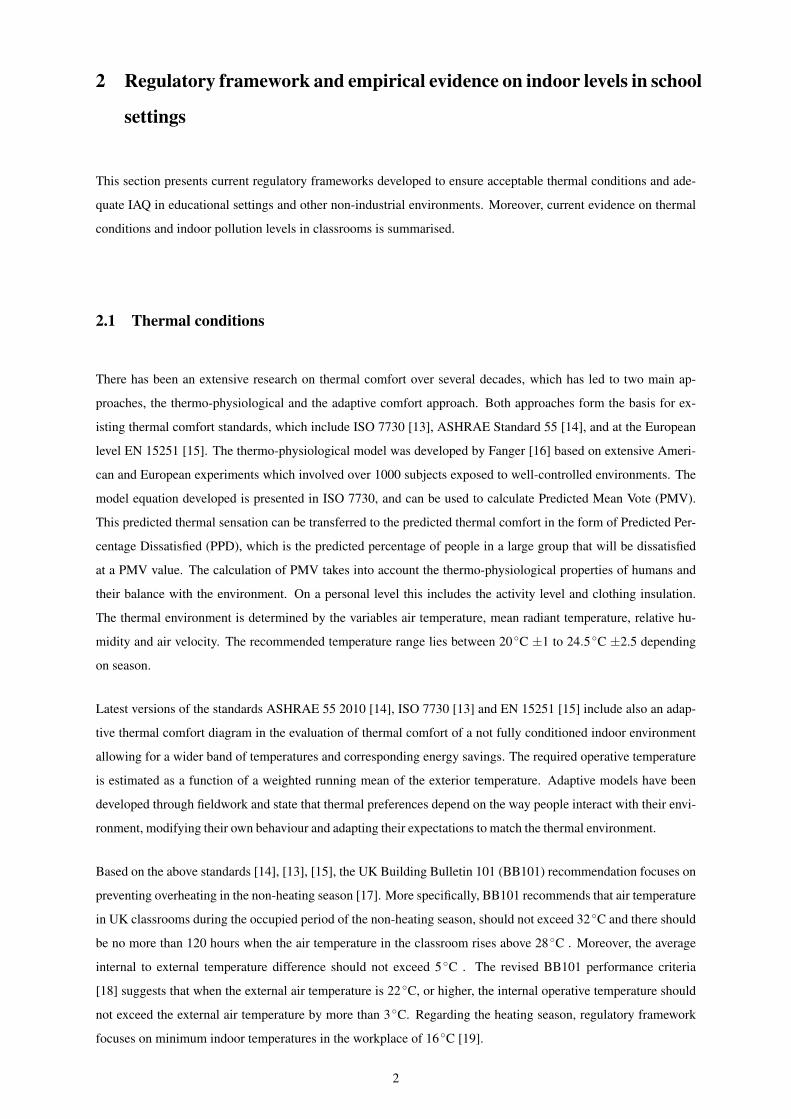
Figure 1: Correlation between indoor CO2 levels and ventilation rates in naturally and mechanically ventilatedclassrooms synthesised in a meta-analytic study [3]
2.2 Ventilation rates and CO2 levels
Ventilation is the process of exchanging indoor polluted air with outdoor (presumably) fresh and clean air. Indoor
CO2 levels produced by metabolic breathing of the occupants are a reliable indicator of ventilation rates, as
increased outdoor airflow dilutes indoor concentrations (Figure 1). CO2 levels and corresponding ventilation rates
are therefore a good indicator of pollutants with indoor sources (such as bio-effluents); however they are poor
indicators of traffic related pollutants. The relationship between CO2 levels and ventilation rates is described by
an exponential curve (Figure 1). The large number of studies clustered in Figure 1 towards the lower end of the
range of ventilation rates suggests that low ventilation rates, and high CO2 levels in schools are common.
In North America and some other countries minimum ventilation rates are regulated by ASHRAE 62.1-2010 [20]
and are dependent on strength of indoor pollution sources and occupancy. In the UK, BB101 [17] and the updated
version “Facilities Output Specification for School Buildings” [18] provide guidelines on maximum CO2 levels
and minimum ventilation rates to ensure adequate IAQ in classrooms. The recommended ventilation performance
standards for naturally ventilated classrooms can be summarised as follows:
• Average indoor CO2 levels during a typical teaching day shall not exceed 1500 ppm, and average ventilation
rates shall be above 5 L/s-p.
• At any occupied time the occupants should be able to reduce the concentration of CO2 to 1000 ppm, and
ventilation rates above 8 L/s-p shall be easily achieved by the occupants.
• Minimum ventilation rates shall not fall below 3 L/s-p. According to BB101 [17], maximum CO2 concen-
tration levels during a typical teaching day, should not exceed 5000 ppm, while the revised version [18] sets
stricter limits and requires that CO2 levels shall not exceed 2000 ppm for more than 20 minutes at a time.
3
2.3 Guideline values for indoor pollutants
Building regulatory frameworks for the provision of adequate IAQ has been framed around CO2 levels and cor-
responding ventilation rates rather than specific pollutants (see previous section). WHO guidelines provide a
scientific basis for legally enforceable standards [21],[22]. Guidelines focus on chemicals that are often found
indoors in concentrations of health concern. WHO 2006 and 2010 guideline values of the traffic-related pollutants
investigated in this review, are presented in Table 1.
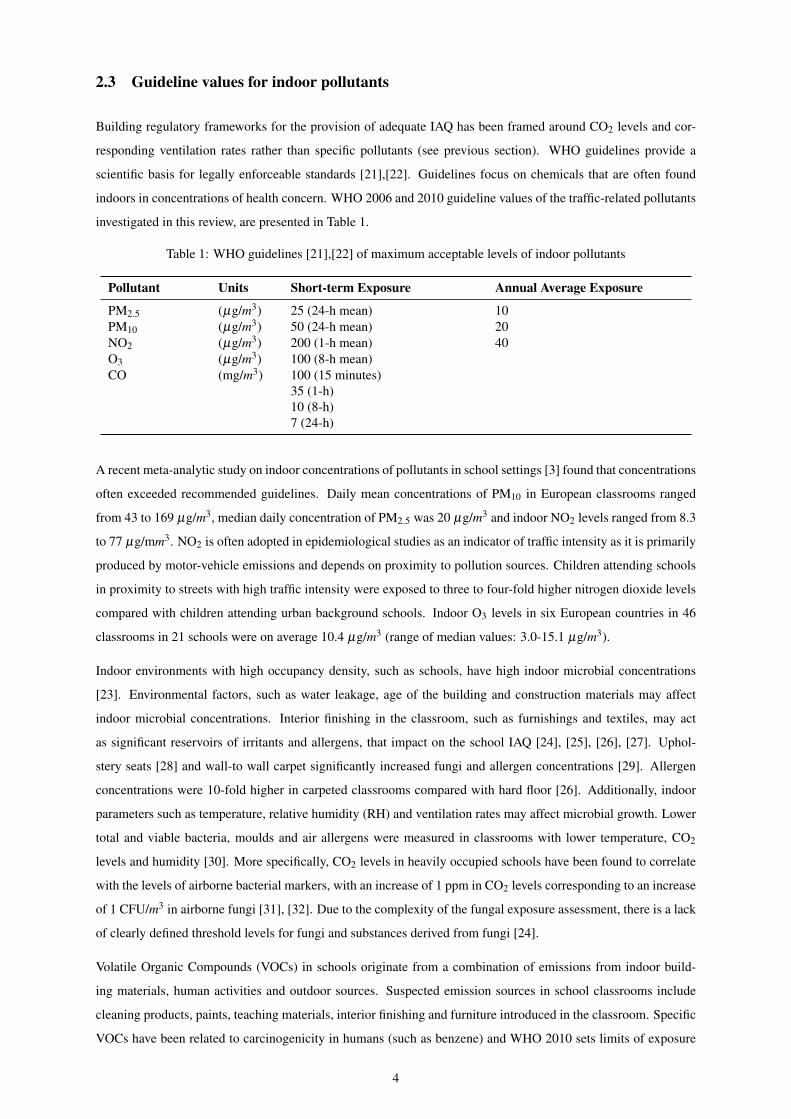
Table 1: WHO guidelines [21],[22] of maximum acceptable levels of indoor pollutants
Pollutant Units Short-term Exposure Annual Average Exposure
PM2.5 (µg/m3) 25 (24-h mean) 10PM10 (µg/m3) 50 (24-h mean) 20NO2 (µg/m3) 200 (1-h mean) 40O3 (µg/m3) 100 (8-h mean)CO (mg/m3) 100 (15 minutes)
35 (1-h)10 (8-h)7 (24-h)
A recent meta-analytic study on indoor concentrations of pollutants in school settings [3] found that concentrations
often exceeded recommended guidelines. Daily mean concentrations of PM10 in European classrooms ranged
from 43 to 169 µg/m3, median daily concentration of PM2.5 was 20 µg/m3 and indoor NO2 levels ranged from 8.3
to 77 µg/mm3. NO2 is often adopted in epidemiological studies as an indicator of traffic intensity as it is primarily
produced by motor-vehicle emissions and depends on proximity to pollution sources. Children attending schools
in proximity to streets with high traffic intensity were exposed to three to four-fold higher nitrogen dioxide levels
compared with children attending urban background schools. Indoor O3 levels in six European countries in 46
classrooms in 21 schools were on average 10.4 µg/m3 (range of median values: 3.0-15.1 µg/m3).
Indoor environments with high occupancy density, such as schools, have high indoor microbial concentrations
[23]. Environmental factors, such as water leakage, age of the building and construction materials may affect
indoor microbial concentrations. Interior finishing in the classroom, such as furnishings and textiles, may act
as significant reservoirs of irritants and allergens, that impact on the school IAQ [24], [25], [26], [27]. Uphol-
stery seats [28] and wall-to wall carpet significantly increased fungi and allergen concentrations [29]. Allergen
concentrations were 10-fold higher in carpeted classrooms compared with hard floor [26]. Additionally, indoor
parameters such as temperature, relative humidity (RH) and ventilation rates may affect microbial growth. Lower
total and viable bacteria, moulds and air allergens were measured in classrooms with lower temperature, CO2
levels and humidity [30]. More specifically, CO2 levels in heavily occupied schools have been found to correlate
with the levels of airborne bacterial markers, with an increase of 1 ppm in CO2 levels corresponding to an increase
of 1 CFU/m3 in airborne fungi [31], [32]. Due to the complexity of the fungal exposure assessment, there is a lack
of clearly defined threshold levels for fungi and substances derived from fungi [24].
Volatile Organic Compounds (VOCs) in schools originate from a combination of emissions from indoor build-
ing materials, human activities and outdoor sources. Suspected emission sources in school classrooms include
cleaning products, paints, teaching materials, interior finishing and furniture introduced in the classroom. Specific
VOCs have been related to carcinogenicity in humans (such as benzene) and WHO 2010 sets limits of exposure
4
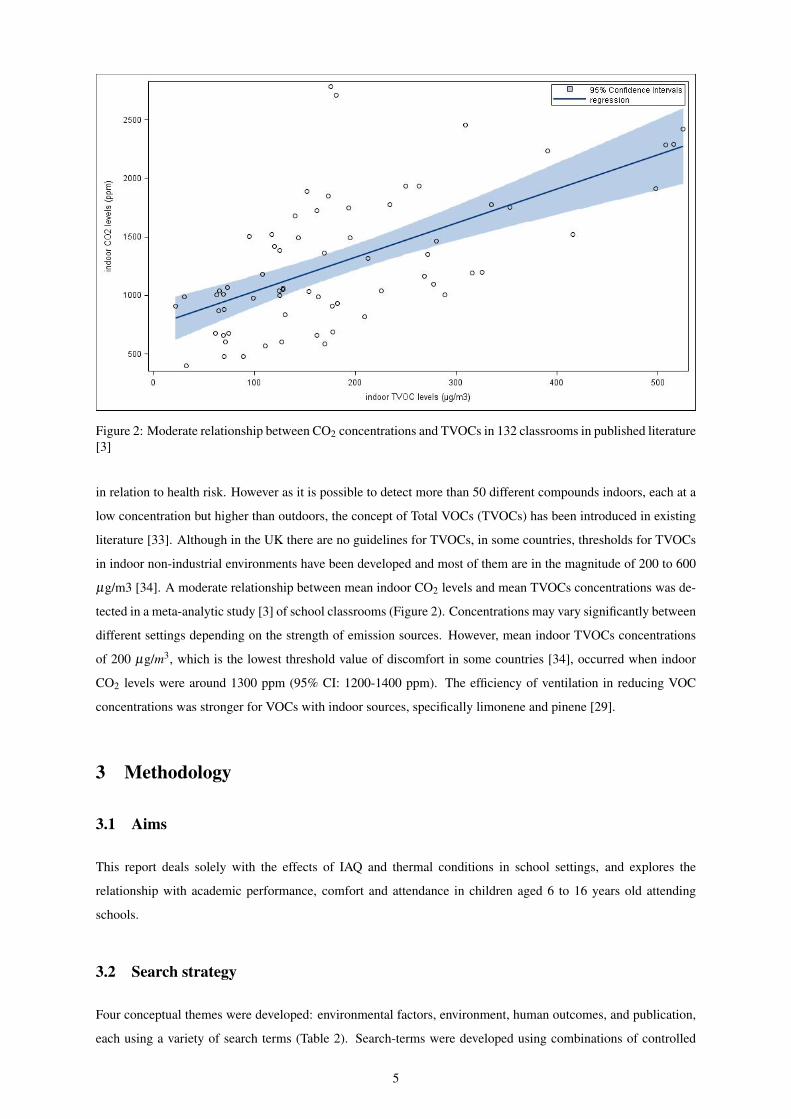
Figure 2: Moderate relationship between CO2 concentrations and TVOCs in 132 classrooms in published literature[3]
in relation to health risk. However as it is possible to detect more than 50 different compounds indoors, each at a
low concentration but higher than outdoors, the concept of Total VOCs (TVOCs) has been introduced in existing
literature [33]. Although in the UK there are no guidelines for TVOCs, in some countries, thresholds for TVOCs
in indoor non-industrial environments have been developed and most of them are in the magnitude of 200 to 600
µg/m3 [34]. A moderate relationship between mean indoor CO2 levels and mean TVOCs concentrations was de-
tected in a meta-analytic study [3] of school classrooms (Figure 2). Concentrations may vary significantly between
different settings depending on the strength of emission sources. However, mean indoor TVOCs concentrations
of 200 µg/m3, which is the lowest threshold value of discomfort in some countries [34], occurred when indoor
CO2 levels were around 1300 ppm (95% CI: 1200-1400 ppm). The efficiency of ventilation in reducing VOC
concentrations was stronger for VOCs with indoor sources, specifically limonene and pinene [29].
3 Methodology
3.1 Aims
This report deals solely with the effects of IAQ and thermal conditions in school settings, and explores the
relationship with academic performance, comfort and attendance in children aged 6 to 16 years old attending
schools.
3.2 Search strategy
Four conceptual themes were developed: environmental factors, environment, human outcomes, and publication,
each using a variety of search terms (Table 2). Search-terms were developed using combinations of controlled
5
vocabulary and free-text terms. Only papers with title, keywords or abstracts including records in each of the four
search categories were selected.
The term Indoor Environmental Quality (IEQ) refers to Indoor Air Quality (IAQ) (including biological, chemical
and particulate pollutants), thermal conditions (temperature, relative humidity, air movement), as well as noise
and light. The environmental factors of primary interest considered in this review are two measured IEQ factors:
IAQ and thermal conditions. IAQ was further analysed in two specific terms: ventilation and indoor pollutants
(Table 2).
IEQ plays an important role for human health, comfort and performance. Health, comfort and performance can be
influenced by physiological, behavioural and psychological factors, while performance can additionally be influ-
enced by the individual (skills, gender, circadian cycle, emotional state) and social variables. The human outcomes
of primary interest in this review are performance, absenteeism and health, and comfort. Performance is related
to the ability of an individual to undertake different mentally and physically demanding tasks. Cognitive assess-
ment in relation to school exposure is normally evaluated with standardised tests which can be pen-and-paper or
computer based tests. Research focusing on the relationship between IEQ and performance considers two distinct
aspects of human performance; accuracy and speed. This review does not consider current debates about the
proper measurement of academic performance, but considers educational achievement tests and neurobehavioral
performance tests to be relatively objective metrics of learning or performance that, whatever their limitations, are
more accurate than subjective assessments of performance.
Absenteeism is the degree to which pupils are absent from school. Some studies separate illness related from
non-illness related absenteeism. Because absence from schools may be related to respiratory infections, asthma,
allergies, gastrointestinal infections, or other disease, it can serve as an indicator of health effects sufficiently
severe to require staying home from school. Absenteeism can reasonably be considered to have an impact upon
educational attainment. Reduced attendance may impair learning by decreasing class time for teaching and learn-
ing. Finally, the review collected evidence on factors that may affect school occupants’ comfort in relation to
thermal conditions and IAQ. Thermal comfort is depended on hydrothermal conditions of the environment, as
well as personal factors such as activity levels and cloth insulation. Sensory irritations and perceived IAQ may
provide a first indication of exposure, and affect health and comfort of the occupants.
This review used electronic databases of scientific publications available up to September 2013, including Med-
line/PubMed, the American Society of Heating, Refrigerating and Air-Conditioning Engineers (ASHRAE), Sci-
enceDirect, Scopus and SpringerLink. In addition, a manual search was conducted for selected publications in the
journal Indoor Air (over the past 10 years).
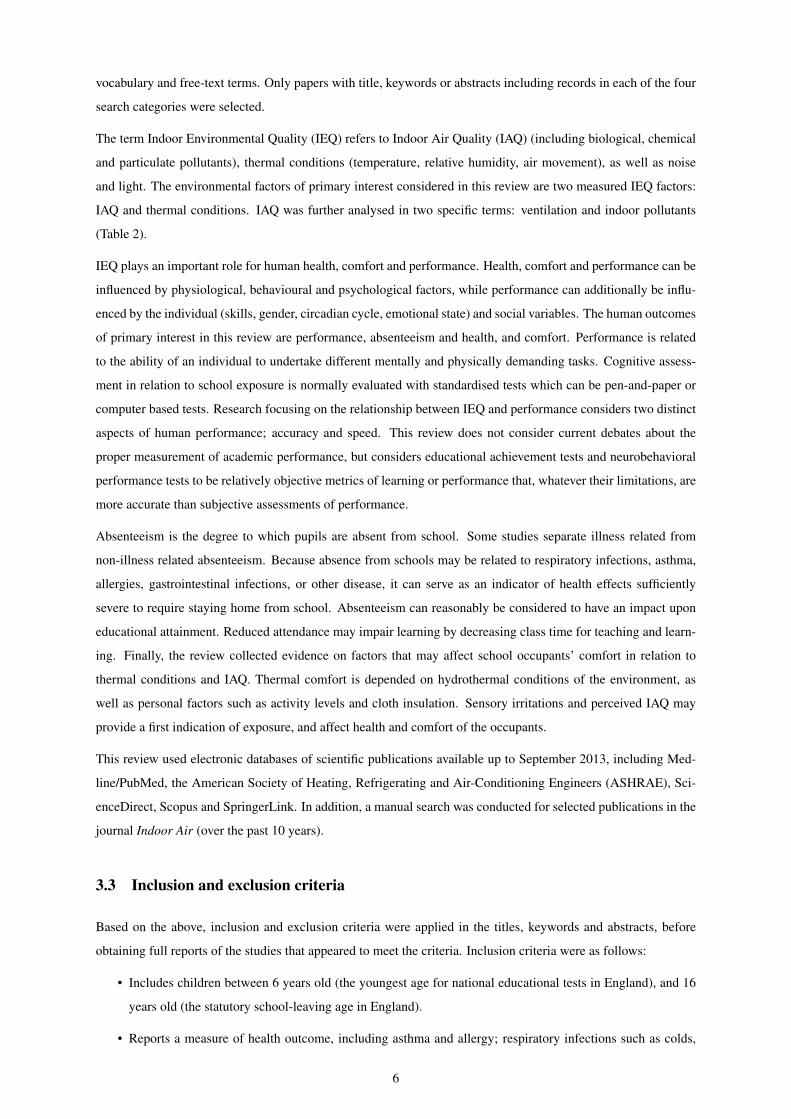
3.3 Inclusion and exclusion criteria
Based on the above, inclusion and exclusion criteria were applied in the titles, keywords and abstracts, before
obtaining full reports of the studies that appeared to meet the criteria. Inclusion criteria were as follows:
• Includes children between 6 years old (the youngest age for national educational tests in England), and 16
years old (the statutory school-leaving age in England).
• Reports a measure of health outcome, including asthma and allergy; respiratory infections such as colds,
6
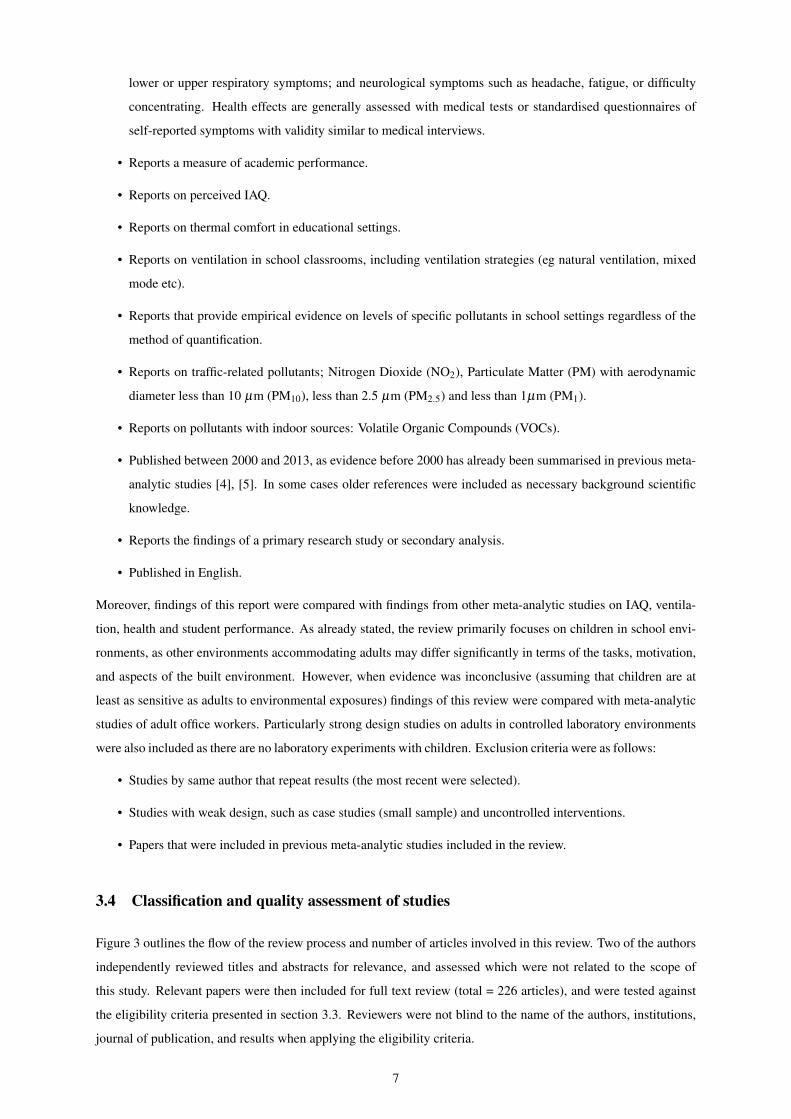
lower or upper respiratory symptoms; and neurological symptoms such as headache, fatigue, or difficulty
concentrating. Health effects are generally assessed with medical tests or standardised questionnaires of
self-reported symptoms with validity similar to medical interviews.
• Reports a measure of academic performance.
• Reports on perceived IAQ.
• Reports on thermal comfort in educational settings.
• Reports on ventilation in school classrooms, including ventilation strategies (eg natural ventilation, mixed
mode etc).
• Reports that provide empirical evidence on levels of specific pollutants in school settings regardless of the
method of quantification.
• Reports on traffic-related pollutants; Nitrogen Dioxide (NO2), Particulate Matter (PM) with aerodynamic
diameter less than 10 µm (PM10), less than 2.5 µm (PM2.5) and less than 1µm (PM1).
• Reports on pollutants with indoor sources: Volatile Organic Compounds (VOCs).
• Published between 2000 and 2013, as evidence before 2000 has already been summarised in previous meta-
analytic studies [4], [5]. In some cases older references were included as necessary background scientific
knowledge.
• Reports the findings of a primary research study or secondary analysis.
• Published in English.
Moreover, findings of this report were compared with findings from other meta-analytic studies on IAQ, ventila-
tion, health and student performance. As already stated, the review primarily focuses on children in school envi-
ronments, as other environments accommodating adults may differ significantly in terms of the tasks, motivation,
and aspects of the built environment. However, when evidence was inconclusive (assuming that children are at
least as sensitive as adults to environmental exposures) findings of this review were compared with meta-analytic
studies of adult office workers. Particularly strong design studies on adults in controlled laboratory environments
were also included as there are no laboratory experiments with children. Exclusion criteria were as follows:
• Studies by same author that repeat results (the most recent were selected).
• Studies with weak design, such as case studies (small sample) and uncontrolled interventions.
• Papers that were included in previous meta-analytic studies included in the review.
3.4 Classification and quality assessment of studies
Figure 3 outlines the flow of the review process and number of articles involved in this review. Two of the authors
independently reviewed titles and abstracts for relevance, and assessed which were not related to the scope of
this study. Relevant papers were then included for full text review (total = 226 articles), and were tested against
the eligibility criteria presented in section 3.3. Reviewers were not blind to the name of the authors, institutions,
journal of publication, and results when applying the eligibility criteria.
7
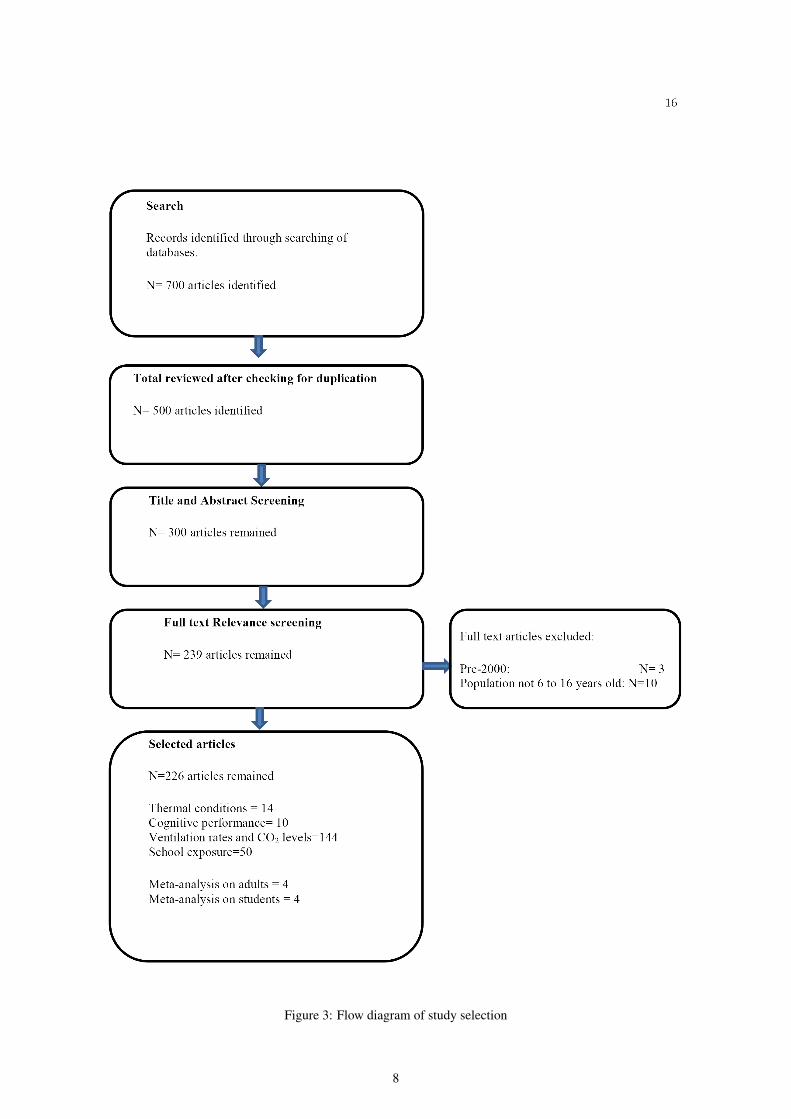
Figure 3: Flow diagram of study selection
8
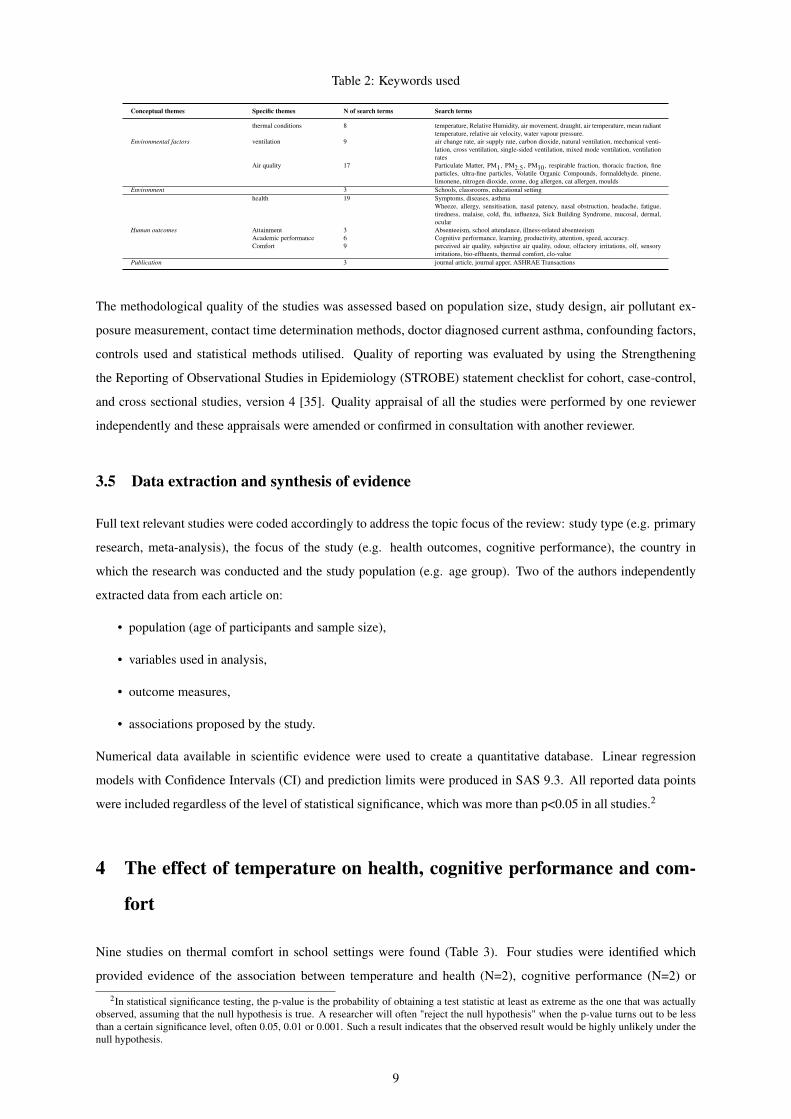
Table 2: Keywords used
Conceptual themes Specific themes N of search terms Search terms
thermal conditions 8 temperature, Relative Humidity, air movement, draught, air temperature, mean radianttemperature, relative air velocity, water vapour pressure.
Environmental factors ventilation 9 air change rate, air supply rate, carbon dioxide, natural ventilation, mechanical venti-lation, cross ventilation, single-sided ventilation, mixed mode ventilation, ventilationrates
Air quality 17 Particulate Matter, PM1, PM2.5, PM10, respirable fraction, thoracic fraction, fineparticles, ultra-fine particles, Volatile Organic Compounds, formaldehyde, pinene,limonene, nitrogen dioxide, ozone, dog allergen, cat allergen, moulds
Environment 3 Schools, classrooms, educational settinghealth 19 Symptoms, diseases, asthma
Wheeze, allergy, sensitisation, nasal patency, nasal obstruction, headache, fatigue,tiredness, malaise, cold, flu, influenza, Sick Building Syndrome, mucosal, dermal,ocular
Human outcomes Attainment 3 Absenteeism, school attendance, illness-related absenteeismAcademic performance 6 Cognitive performance, learning, productivity, attention, speed, accuracy.Comfort 9 perceived air quality, subjective air quality, odour, olfactory irritations, olf, sensory
irritations, bio-effluents, thermal comfort, clo-valuePublication 3 journal article, journal apper, ASHRAE Transactions
The methodological quality of the studies was assessed based on population size, study design, air pollutant ex-
posure measurement, contact time determination methods, doctor diagnosed current asthma, confounding factors,
controls used and statistical methods utilised. Quality of reporting was evaluated by using the Strengthening
the Reporting of Observational Studies in Epidemiology (STROBE) statement checklist for cohort, case-control,
and cross sectional studies, version 4 [35]. Quality appraisal of all the studies were performed by one reviewer
independently and these appraisals were amended or confirmed in consultation with another reviewer.
3.5 Data extraction and synthesis of evidence
Full text relevant studies were coded accordingly to address the topic focus of the review: study type (e.g. primary
research, meta-analysis), the focus of the study (e.g. health outcomes, cognitive performance), the country in
which the research was conducted and the study population (e.g. age group). Two of the authors independently
extracted data from each article on:
• population (age of participants and sample size),
• variables used in analysis,
• outcome measures,
• associations proposed by the study.
Numerical data available in scientific evidence were used to create a quantitative database. Linear regression
models with Confidence Intervals (CI) and prediction limits were produced in SAS 9.3. All reported data points
were included regardless of the level of statistical significance, which was more than p<0.05 in all studies.2
4 The effect of temperature on health, cognitive performance and com-
fort
Nine studies on thermal comfort in school settings were found (Table 3). Four studies were identified which
provided evidence of the association between temperature and health (N=2), cognitive performance (N=2) or
2In statistical significance testing, the p-value is the probability of obtaining a test statistic at least as extreme as the one that was actuallyobserved, assuming that the null hypothesis is true. A researcher will often "reject the null hypothesis" when the p-value turns out to be lessthan a certain significance level, often 0.05, 0.01 or 0.001. Such a result indicates that the observed result would be highly unlikely under thenull hypothesis.
9
perceptions of IAQ (N=2). Details of these studies can be found in Table 4.
Most field studies in school classrooms on thermal comfort of children were performed in warm climates [36],
[37], [38], [39] in children older than 13 years old (Table 3). In the UK, only one study in secondary [40] and
one in primary schools [41] investigated thermal conditions in classrooms and thermal preferences of school-aged
children. Mumovic et al (2009) reported a tendency for winter overheating with temperatures as high as 28.9 �C.
The most common reason for such high temperatures was that classroom ventilation rates were too low to mitigate
overheating caused by high internal heat gains and solar radiation. Suggestive consistent evidence indicates that
children 9 to 11 years attending schools in temperate climates [42], [41] may be more sensitive to higher temper-
atures than adults. When the actual thermal sensation votes of children were compared to comfort predictions and
adaptive temperature limits, lower temperatures than predicted by these methods were preferred [42], [41]. More
specifically, comfort temperatures were found 4 �C lower than the Predicted Mean Vote (PMV) and 2 �C than the
EN 15251 adaptive comfort model predictions [41] in the current regulations (section 2.1).
Table 3: Thermal comfort studies in school settings
Study Age Group Country Climate Ventilation Type
Wong and Khoo, 2003 [36] 13 to 17 Singapore Tropical NV
Kwok and Chun, 2003 [37] 13 to 17 Japan Sub-tropical NV, MV
Hwang et al, 2006 [38] 11 to 17 Taiwan Sub-tropical NV
Liang et al, 2012 [39] 12 to 17 Taiwan Sub-tropical NV
Corgnati et al, 2007 [43] 12 to 23 Italy Mediterranean NV
Corgnati et al, 2009 [44] 12 to 23 Italy Mediterranean NV
Mors et al, 2011 [42] 9 to 11 Netherlands Temperate NV
Teli et al, 2012 [41] 9 to 11 UK Temperate NV
Mumovic et al, 2009 [40] 12 to 16 UK Temperate NV, MM, MV
NV: Natural Ventilation, MV: Mechanical Ventilation, MM: Mixed-mode Ventilation.
Generally, current evidence on the association between thermal conditions and cognitive performance of students
is limited. In the previous section there was evidence that overheating in classrooms is very common even in the
heating season in mild climates, therefore both studies [6] and [45] on thermal conditions and cognitive perfor-
mance focused on slightly warm/ warm thermal sensations. The experimental design of both studies was cross-
sectional where participants were blind to the interventions. The experiments were performed in two classrooms
in a school for a week, and then switched conditions between classrooms. Therefore, children were used as their
own controls, so any observed differences in performance between conditions cannot have been due to differences
between groups of individuals. Temperature was controlled though mechanical cooling either operating or idling
the cooling function. The air-circulation fans were operated regardless of the provision of cooling, so participating
teachers and children were blind to interventions. During the experiments, the teachers and pupils were allowed
to open the windows and doors as usual, and no changes to the lesson plan or school activities were made, so as to
ensure that the teaching environment and daily routines remained as normal as possible. Both studies controlled
for personal factors that may affect cognitive performance (such as mood, health, level of hunger, quality of sleep
during the previous night), comfort, PM2.5 levels and noise levels.
10
Tabl
e4:
Sum
mar
yof
the
stud
ies
[6],
[45]
,[46
],[4
7]as
sess
ing
the
effe
ctof
tem
pera
ture
onac
adem
icpe
rfor
man
cein
dica
tors
,hea
lthan
dco
mfo
rtof
child
ren
insc
hool
setti
ngs
Stud
yPo
pula
tion
Cou
ntry
Des
ign
Out
com
em
easu
reAu
thor
s’fin
ding
sC
ogni
tive
perf
orm
ance
War
gock
iand
Wyo
n,20
13[6
]M
eta-
anal
ysis
stud
yfr
omse
ven
inte
rven
-tio
nst
udie
s
Den
mar
kC
ross
-sec
tiona
lbl
ind
inte
rven
tion
stud
yPe
rfor
man
cein
scho
olas
soci
ated
task
sin
clud
ing
lang
uage
and
mat
hem
atic
alsk
ills
For
ever
y1�
Cre
duct
ion
acad
emic
perf
or-
man
cein
term
sof
spee
dw
asim
prov
edby
2to
4%
.N
s=5
prim
ary
scho
ols
No
impr
ovem
enti
nte
rms
ofac
cura
cy.
Nc=
380,
Age
:10-
12B
ako
Biro
etal
,201
2[4
5]N
s=8
prim
ary
scho
ols
Engl
and
Cro
ss-s
ectio
nal
blin
din
terv
entio
nst
udy
Com
pute
r-ba
sed
softw
are
-V
ISC
oPe
(Ven
tilat
ion
inSc
hool
san
dC
ogni
tive
Perf
orm
ance
)
Cog
nitiv
epe
rfor
man
ceof
pupi
lsim
prov
edby
6%to
8%w
hen
low
erin
gth
ete
mpe
ratu
refr
om25.3
� C(s
:0.4
)to
23.1
� C(s
:0.
8)in
term
sof
spee
d.N
c=33
2,A
ge:9
-10
Hea
lthou
tcom
esZh
ang
etal
,201
1[4
6]N
s=10
seco
ndar
ysc
hool
sC
hina
Long
itudi
nals
tudy
SBS
T,R
Han
dC
O2
leve
lsw
ere
nega
tivel
yre
-la
ted
with
SBS
sym
ptom
.N
c=11
43,A
ge:1
1-15
Sim
ulta
neou
sly
cont
rolli
ngfo
ra
larg
enu
mbe
rofi
ndoo
rpol
luta
nts
Mie
tal,
2006
[47]
Ns=
10se
cond
ary
scho
ols
Chi
naSi
mul
tane
ousl
yco
ntro
lling
for
ala
rge
num
bero
find
oorp
ollu
tant
sA
sthm
a,as
thm
atic
and
resp
irato
rysy
mpt
oms
Low
erte
mpe
ratu
resw
ere
asso
ciat
edw
ithre
-du
ced
brea
thle
ssne
ss.
Nc=
1414
,Age
:13-
14
Ns=
num
ber
ofsc
hool
s,N
c=nu
mbe
rof
child
ren
11
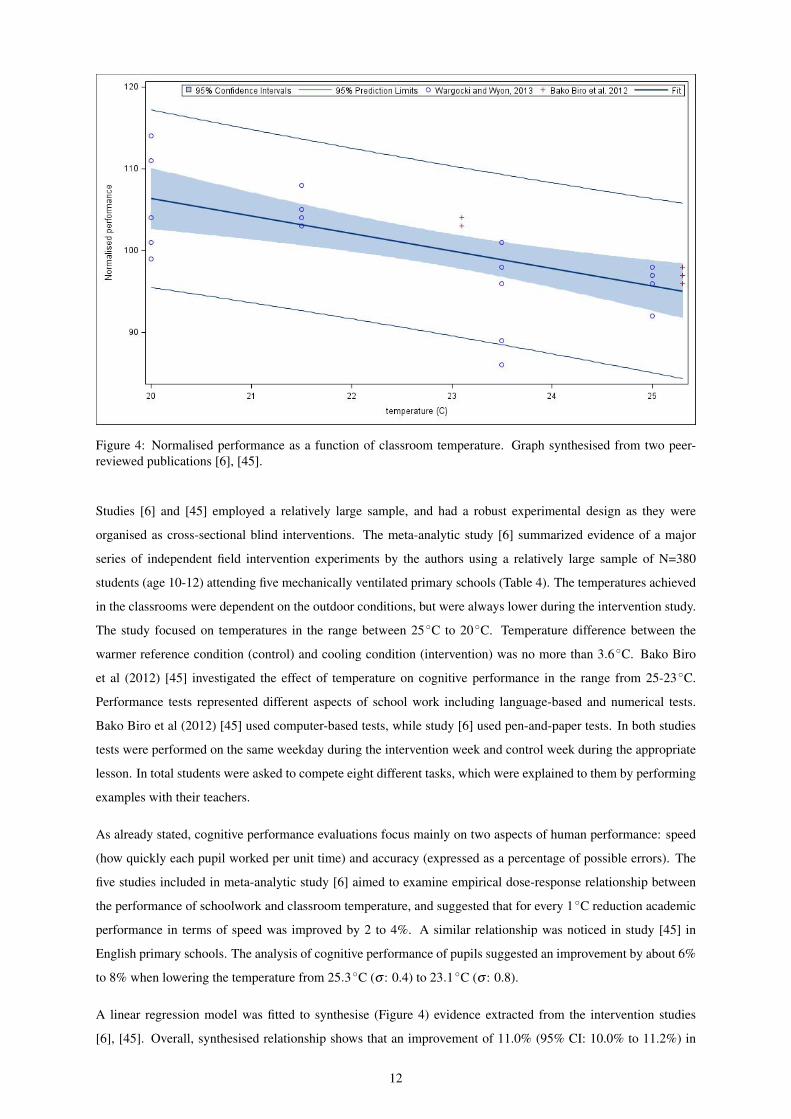
Figure 4: Normalised performance as a function of classroom temperature. Graph synthesised from two peer-reviewed publications [6], [45].
Studies [6] and [45] employed a relatively large sample, and had a robust experimental design as they were
organised as cross-sectional blind interventions. The meta-analytic study [6] summarized evidence of a major
series of independent field intervention experiments by the authors using a relatively large sample of N=380
students (age 10-12) attending five mechanically ventilated primary schools (Table 4). The temperatures achieved
in the classrooms were dependent on the outdoor conditions, but were always lower during the intervention study.
The study focused on temperatures in the range between 25�C to 20�C. Temperature difference between the
warmer reference condition (control) and cooling condition (intervention) was no more than 3.6 �C. Bako Biro
et al (2012) [45] investigated the effect of temperature on cognitive performance in the range from 25-23 �C.
Performance tests represented different aspects of school work including language-based and numerical tests.
Bako Biro et al (2012) [45] used computer-based tests, while study [6] used pen-and-paper tests. In both studies
tests were performed on the same weekday during the intervention week and control week during the appropriate
lesson. In total students were asked to compete eight different tasks, which were explained to them by performing
examples with their teachers.
As already stated, cognitive performance evaluations focus mainly on two aspects of human performance: speed
(how quickly each pupil worked per unit time) and accuracy (expressed as a percentage of possible errors). The
five studies included in meta-analytic study [6] aimed to examine empirical dose-response relationship between
the performance of schoolwork and classroom temperature, and suggested that for every 1 �C reduction academic
performance in terms of speed was improved by 2 to 4%. A similar relationship was noticed in study [45] in
English primary schools. The analysis of cognitive performance of pupils suggested an improvement by about 6%
to 8% when lowering the temperature from 25.3 �C (s : 0.4) to 23.1 �C (s : 0.8).
A linear regression model was fitted to synthesise (Figure 4) evidence extracted from the intervention studies
[6], [45]. Overall, synthesised relationship shows that an improvement of 11.0% (95% CI: 10.0% to 11.2%) in
12
cognitive performance may be expected when temperature drops from 25�C to 20 �C.
Little evidence is available regarding health symptoms of students in relation to classroom thermal conditions
(Table 4). One study found a suggestive relationship that temperatures at the lower end of the comfortable range
may improve health, cognitive performance and perception of school children [47]. Average indoor temperatures
recorded were 17 �C (range: 13–21 �C) and concluded that lower temperatures had a protective effect on health by
reducing breathlessness among students. Suggestive evidence indicates that lowering the temperature from 25 to
20 �C reduced SBS symptoms among students [46].
5 The effect of ventilation rates and CO2 levels on health, cognitive per-
formance and perceived IAQ
In line with current guidelines, the majority of studies have focused on CO2 measurements as an indicator of
IAQ (Figure 2) reflecting the relative difficulty and expense of obtaining measurements of specific pollutants and
identifying any related effects on performance. In total there were six studies found that investigated the effects
of CO2 and corresponding ventilation rates on cognitive performance of children, and a summary is presented
in Table 5. All studies were performed in primary schools in children from 9 to 12 years old, and three of
them were conducted in UK schools. Two studies investigated the effect of ventilation rates and CO2 levels on
absenteeism of school children. Four studies associated the impact of reduced ventilation rates on specific health
symptoms.
Three studies [6], [45], [48] employed experimental designs with a relatively large sample, as they were organised
as cross-sectional blind interventions as described in section 4. Similarly to interventions controlling indoor
temperatures in the classrooms, the blind interventions were performed by modifying ventilation rates. Findings
of these studies were consistent reporting improvement in cognitive performance. More specifically, increasing the
ventilation rate in classrooms improved the performance in pen-and paper school tasks that required mathematical
skills [45]. The effect was evident for tasks that required more complex skills (such as spatial working memory
and verbal ability to recognize words and non-words), and improved the results obtained in a range of computer-
based psychological diagnostic tests [39]. Higher ventilation rates were found to improve performance by 8% in
terms of speed, but not in percentage of errors [6]. One study in the UK [49] used a similar experimental design
with cross-sectional intervention studies; however the sample was smaller and the interventions were not blind, as
higher ventilation rates were provided with natural ventilation strategies. The results were consistent with study
[6] as the study also reported in improvement in terms of speed by 5% but not accuracy.
Two studies that used a large sample of schools [50], [51] compared the performance of students in national
tests attending classrooms with varying CO2 levels and ventilation rates. The studies controlled for various socio-
economic factors that may affect performance of children and compared national test scores. These studies showed
that in classrooms with high ventilation rates, as indicated by a lower concentration of CO2, a higher proportion of
pupils passed the standard language and mathematical tests that were routinely applied by educational authorities.
The relationship was significant for mathematical tasks [50], [51] which was consistent with previous findings
[45].
13
Tabl
e5:
Sum
mar
yof
the
stud
ies
[6],
[45]
,[48
],[5
1],[
50],
[49]
asse
ssin
gth
eef
fect
ofve
ntila
tion
onpe
rfor
man
cein
dica
tors
ofch
ildre
nin
scho
olse
tting
s
Stud
ySe
tting
Cou
ntry
Vent
ilatio
nra
tes
(L/s
-p)
CO
2co
ncen
tratio
ns(p
pm)
Des
ign
Out
com
em
easu
res
auth
ors’
findi
ngs
War
gock
ian
dW
yon,
2013
[6]
Ns
=5pr
imar
ysc
hool
s,N
c=38
0,ag
e:10
-12
Den
mar
k3.
0to
9.5
Cro
ss-s
ectio
nalb
lind
inte
rven
tion
stud
ies
(2w
eeks
)N
umer
ical
and
lang
uage
base
dte
sts
Impr
ove
Spee
d:8%
No
effe
cton
accu
-ra
cy.
Bak
oB
iroet
al,
2012
[45]
Ns=
8,pr
imar
ysc
hool
UK
Con
trol:
0.6-
4.1
In-
terv
entio
n:5.
1-9.
6C
ontro
l:50
00In
ter-
vent
ion:
1000
Cro
ss-s
ectio
nalb
lind
inte
rven
tions
.C
ompu
teris
edas
sess
men
tte
sts
softw
are
(VIS
CO
PE–
Cho
ice
reac
tion:
2.2%
,Col
ourW
ord
Vig
-ila
nce:
2.7%
,N
c=33
2,ag
e9-
10C
ontro
lled
forc
omfo
rt,pe
rson
alfa
ctor
s,ai
rbor
nepa
rti-
cles
(PM
2.5)
and
nois
ele
vels
.(3
wee
ks)
Vent
ilatio
nin
Scho
ols
and
Cog
ni-
tive
Perf
orm
ance
)Tr
aditi
onal
test
sw
ere
carr
ied
out
onpa
per
for
40m
inut
esm
aths
and
read
ing
Pict
ure
Mem
ory:
8%,
Wor
dR
ecog
ni-
tion:
15%
Bak
oB
iroet
al,
2007
[48]
Ns=
8pr
imar
ysc
hool
UK
Con
trol:0
.3-0
.5In
-te
rven
tion
:13-
16N
oda
taC
ross
-sec
tiona
lblin
din
terv
entio
ns.
Com
pute
rised
asse
ssm
ent
test
sso
ftwar
e(V
ISC
OPE
–In
crea
sed
pupi
ls’
spee
d7%
inm
aths
(add
ition
,su
btra
ctio
n).
No
sign
ifica
ntef
fect
onac
cura
cyA
ge=
9-10
Con
trolle
dfo
rcom
fort,
pers
onal
fact
ors,
airb
orne
parti
-cl
es(P
M2.
5)an
dno
ise
leve
ls.
Vent
ilatio
nin
Scho
ols
and
Cog
ni-
tive
Perf
orm
ance
)Tr
aditi
onal
test
sw
ere
carr
ied
out
onpa
per
for
40m
inut
esm
aths
and
read
ing
Shau
ghne
ssy
etal
,20
11[5
1]N
s=10
0pr
imar
ysc
hool
US
0.9–
7.1
Mea
n:17
79(s
:852
)(ra
nge:
661
-600
0)
Res
trict
edw
indo
ws
and
door
s.M
onito
ring
CO
2ov
era
typi
cal
teac
hing
day.
Con
trol
for
soci
o-ec
onom
icfa
c-to
rs.
Stan
dard
ised
natio
nalt
ests
inm
ath
and
read
ing;
For
ever
y1
L/s-
pan
impr
ovem
ent
inm
aths
by:2
.9%
(95%
CI:
0.9–
4.8%
)and
Age
:9-1
0C
ompa
red
stud
ents
’pe
rfor
man
cew
ithpe
rfor
man
cest
anda
rds
esta
blis
hed
byth
eSt
ate
Boa
rdof
Educ
atio
n.O
btai
ned
stan
dard
ized
test
scor
esan
dba
ckgr
ound
data
rela
ted
tost
u-de
nts
inth
esp
ecifi
ccl
assr
oom
s
read
ing:
2.7%
(95%
CI:
0.5–
4.9%
)
Shau
ghne
ssy
etal
,20
06[5
0]N
s=54
(ana
lysi
sN
s=50
)U
S0.
9to
11.7
Res
trict
edw
indo
ws
and
door
s.M
onito
ring
CO
2ov
era
typi
cal
teac
hing
day.
Con
trol
for
soci
o-ec
onom
icfa
c-to
rs.
Stan
dard
ised
natio
nalt
ests
inm
ath
and
read
ing
Impr
ovem
enti
nnu
mer
ical
task
sby
8to
14%
.(m
odes
tass
ocia
tion)
prim
ary
scho
ols,
Age
:9-
10C
ompa
red
stud
ents
’pe
rfor
man
cew
ithpe
rfor
man
cest
anda
rds
esta
blis
hed
byth
eSt
ate
Boa
rdof
Educ
atio
n.C
oley
and
Gre
eves
,20
04[4
9]N
s=1
prim
ary
scho
olU
Kin
terv
entio
n:13
con-
trol:
1.5
Inte
rven
tion:
690
(s:
122)
(ran
ge50
1-98
3)
Cro
ss-s
ectio
nali
nter
vent
ion
stud
ies
(not
blin
d)C
ogni
tive
Dru
gR
esea
rch
(CD
R)
com
pute
rised
cogn
itive
asse
ssm
ent
syst
em(1
0m
inut
esto
com
plet
e)
Incr
ease
dsp
eed
by5%
butn
otac
cura
cy
Nc=
18,a
ge:1
0-12
cont
rol:
2909
(s:4
74)
(ran
ge:
2096
-414
0)
Nat
ural
vent
ilatio
nw
ithsp
litun
itfo
rte
mpe
ratu
reco
n-tro
l.Te
sts
wer
epe
rfor
med
10co
nsec
utiv
esc
hool
days
14
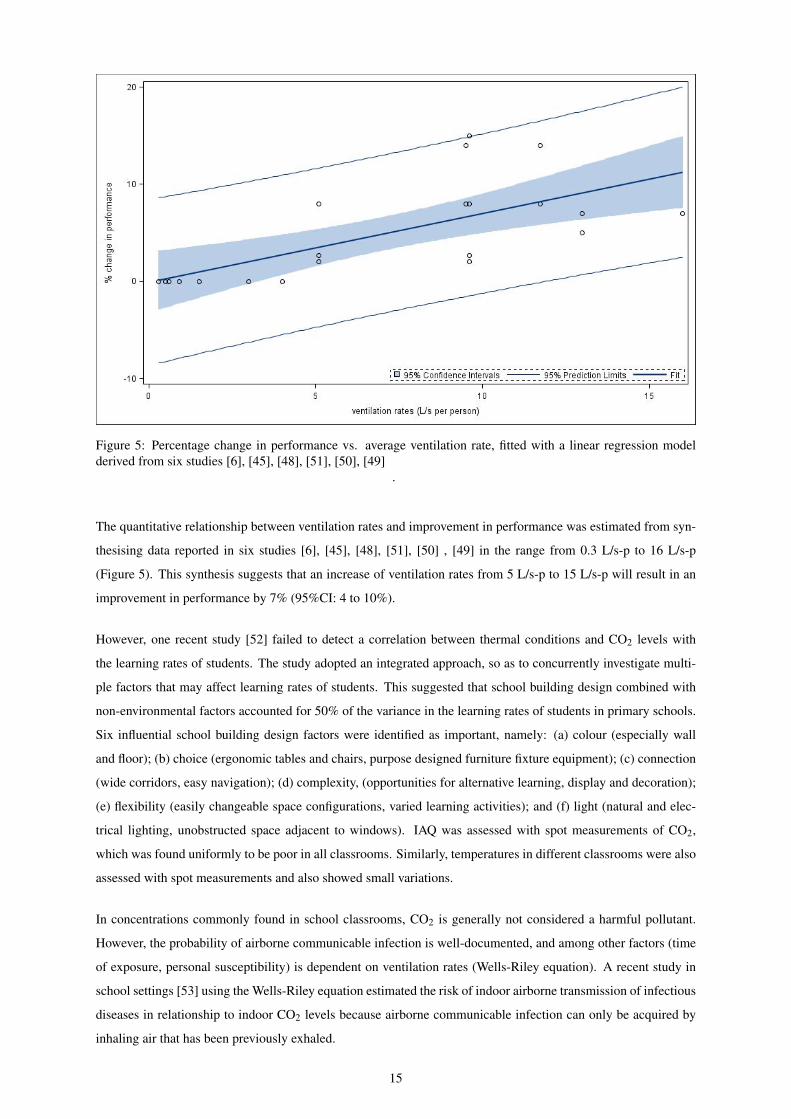
Figure 5: Percentage change in performance vs. average ventilation rate, fitted with a linear regression modelderived from six studies [6], [45], [48], [51], [50], [49]
.
The quantitative relationship between ventilation rates and improvement in performance was estimated from syn-
thesising data reported in six studies [6], [45], [48], [51], [50] , [49] in the range from 0.3 L/s-p to 16 L/s-p
(Figure 5). This synthesis suggests that an increase of ventilation rates from 5 L/s-p to 15 L/s-p will result in an
improvement in performance by 7% (95%CI: 4 to 10%).
However, one recent study [52] failed to detect a correlation between thermal conditions and CO2 levels with
the learning rates of students. The study adopted an integrated approach, so as to concurrently investigate multi-
ple factors that may affect learning rates of students. This suggested that school building design combined with
non-environmental factors accounted for 50% of the variance in the learning rates of students in primary schools.
Six influential school building design factors were identified as important, namely: (a) colour (especially wall
and floor); (b) choice (ergonomic tables and chairs, purpose designed furniture fixture equipment); (c) connection
(wide corridors, easy navigation); (d) complexity, (opportunities for alternative learning, display and decoration);
(e) flexibility (easily changeable space configurations, varied learning activities); and (f) light (natural and elec-
trical lighting, unobstructed space adjacent to windows). IAQ was assessed with spot measurements of CO2,
which was found uniformly to be poor in all classrooms. Similarly, temperatures in different classrooms were also
assessed with spot measurements and also showed small variations.
In concentrations commonly found in school classrooms, CO2 is generally not considered a harmful pollutant.
However, the probability of airborne communicable infection is well-documented, and among other factors (time
of exposure, personal susceptibility) is dependent on ventilation rates (Wells-Riley equation). A recent study in
school settings [53] using the Wells-Riley equation estimated the risk of indoor airborne transmission of infectious
diseases in relationship to indoor CO2 levels because airborne communicable infection can only be acquired by
inhaling air that has been previously exhaled.
15
A study that quantified this relationship found that an increase in CO2 concentrations by 1000 ppm was associated
(p<0.05) with a 0.5–0.9% decrease in annual average daily attendance [54], which averaged to 5% of total student
absences. The study used a relatively large sample size of 436 classrooms located in 22 schools over the period of
a year. The range of indoor CO2 levels were 10 to 4200 ppm above outdoor levels (DCO2). The limitations of the
study include that it did not separate illness from non-illness related absenteeism, and used spot measurements of
CO2. A recent study [55] used a more robust methodology in a sample of 162 classrooms located in 28 primary
schools in three climatic districts over a two-year period. Both studies [54] and [55] controlled for socio-economic
and demographic characteristics of the population. Study [55] used long term CO2 measurements to infer more
detailed ventilation rates and obtained records of illness related absenteeism over a two-year period. Regardless of
climate, season or ventilation strategy, findings consistently estimated that for every 1 L/s-p increase in classroom
ventilation rates in the range between 4.0 L/s-p to 7.1 L/s-p illness related absences were reduced by 1.0 to 1.5%
(p<0.01). Converting findings of [55] to a comparable metric, each decrease of indoor CO2 levels by 1000 ppm
was associated with a 1.0% to 2.5% relative decrease in illness absence, approximately 2 to 5 times lower than the
findings reported in [54].
The suggestive evidence linking higher CO2 levels in classrooms with increased absenteeism of children might be
related to the increased probability of viral infections. Viral infections can trigger asthmatic attacks in a subpopu-
lation of children. Therefore, indoor CO2 levels in the classrooms were associated with current asthma (odds ratio:
1.18 per 100 ppm, 95%CI: 1.06-1.32, p<0.01) [47]. One study that used non-invasive medical tests associated low
ventilation rates and corresponding high CO2 levels with nasal patency [56] and other SBS symptoms [46].
6 The effect of school exposure on health and perceived IAQ
Information compared in this section highlights the critical health implications addressed in exposure studies in the
school environment. Moreover, suggestive evidence links exposure to specific pollutants with IAQ dissatisfaction.
Sensory irritations may affect health and comfort of the occupants directly and performance indirectly, and provide
a first indication of exposure. Very little evidence is currently available on the association between cognitive
performance and specific pollutants in the school environment. Two studies [6] and [45] that directly tested
whether reducing particle concentrations in classrooms would improve the performance of schoolwork found that
even though the electrostatic air cleaners reduced the PM levels, there was no general effect on the performance
of schoolwork.
A recent meta-analytic study [57] employed a systematic approach to evaluate the potential relationship between
asthma and asthmatic symptoms in children with exposure to traffic related pollutants. The systematic meta-
analysis included 19 studies, which did not separate school-exposure from non-school exposure. Overall, the
study concluded that children living or attending schools near high traffic density roads were exposed to higher
levels of motor-vehicle pollutants, and had higher incidence and prevalence of childhood asthma and wheeze.
The meta-analysis odds ratios (meta-OR) were estimated. More specifically, prevalence of childhood asthma was
positively associated with exposure to NO2 (meta-OR: 1.05, 95%CI: 1.00–1.11), NO (meta-OR: 1.02, 95%CI:
1.00–1.04), and CO (meta-OR: 1.06, 95% CI: 1.01–1.12). Exposure to NO2 was positively associated with a
higher incidence of childhood asthma (meta-OR: 1.14, 95%CI: 1.06–1.24), and exposures to particulate matter was
16
positively associated with a higher incidence of wheeze in children (meta-OR: 1.05, 95%CI: 1.04–1.07).
Limited evidence related school exposure to NO2 at 34.8 to 44 µg/m3 with increased allergy exacerbations; current
conjunctivitis; current wheeze; and current itchy skin rush [58], which is around WHO 2010 guideline values
(Table 1). School absenteeism was significantly related to exposure to O3 [59], [60], [61], PM [61], [62] and CO
[59], [63].
Studies have reported positive associations for general and respiratory symptoms, including a higher occurrence
of respiratory infections, with exposure to fungal particles [64], [64]. The total amount of viable and non-viable
airborne fungi species (total moulds) may provide quantitative information on microbial concentration in indoor
settings. Two studies [65], [66] found that total moulds were a significant predictor of satisfaction with IAQ,
and quantified the relationship that for every 10-fold increase of moulds satisfaction decreased by OR: 1.9 (95%
CI: 1.3-2.8, p<0.01). The study [65] controlled for other environmental exposures (such as dust, VOCs, and
traffic related pollutants), and personal factors (age, gender, atopy, home exposure etc). High levels of TVOCs in
classrooms were suspected to be the source of SBS symptoms such as throat dryness, eye symptoms and adverse
health effects [67].
7 Discussion
7.1 Synthesis of findings
This report primarily investigated the potential associations between thermal conditions and ventilation rates in
educational settings with health responses and cognitive performance of school children. In this section findings
are synthesised by considering overall evidence available on specific relationships, and emphasising strong or
consistent trends.
Currently, CO2 is generally not considered harmful at concentrations normally found indoors, and so is often
accorded little significance other than as an indicator of ventilation; however emerging evidence indicates that high
CO2 levels and low ventilation rates may impact on health and academic performance of school occupants.
1. Indoor CO2 concentrations can be considered a measure of risk of transmission of airborne disease through-
out the classroom. It can be hypothesised that decreased ventilation rates in classrooms may be associated
with increased illness absences from respiratory infections, due to increased indoor airborne concentrations
of respiratory virus. Two studies found a positive association between reduced absenteeism with increased
ventilation rates inferred from CO2 measurements. However, the magnitude of the association differed sig-
nificantly between the studies: the reduction rate of absenteeism ranged from 1.0% up to 7.1% for every
increase in ventilation rates by 1 L/s-p. Explanation for the discrepancies included the different methods
of estimation of ventilation rates, as well as the distinction in the outcome between illness related and to-
tal absenteeism which could inflate results. A similar study in office workers found a 2.9% decrease in
short-term illness absence in adults per 1 L/s-p increase in ventilation rates (range: 12 to 24 L/s-p) [68].
Suggestive evidence links higher CO2 levels with increased asthmatic symptoms and nasal patency, which
could be explained by the increased probability of conducing viral infections. However, as these studies are
correlational, causality cannot be established.
17
2. Limited evidence is available on the association between lower ventilation rates and higher CO2 levels with
increased SBS symptoms of school occupants. A meta-analytic study in office workers [69] indicated that
outdoor airflows up to 10 L/s-p may be effective in reducing SBS symptom prevalence and dissatisfaction
with air quality, and a similar relationship might be likely for schools.
3. There is indicative evidence associating high CO2 levels and corresponding low ventilation rates to reduced
performance resulting from impaired attention span, concentration loss and tiredness. More specifically, a
linear regression model synthesised from published evidence indicates that an increase of ventilation rates
from 5 L/s-p to 15 L/s-p was associated with a 7% increase in academic performance of children. Findings
of this report agree with previous systematic meta-analytic studies in school children [4] and adults [70].
The quantitative relationship between work performance in adults and a wider range of ventilation rates
showed a statistically significant increase in performance per unit increase in ventilation rates up to 15 L/s-p
by a 1-3% improvement in average performance of office workers per 10 L/s-person increase in outdoor
air ventilation rate [70]. Because children are more sensitive than adults to environmental exposure, it is
expected that the magnitude of effect would be greater.
Studies included in the review examining the potential associations between CO2 levels and inferred ven-
tilation rates with academic performance employed cross-sectional experimental designs. The studies per-
formed blind interventions altering only ventilation rates and using each student as their own control, and
therefore eliminating socio-economic confounding factors and variations between individuals that may af-
fect performance outcomes. However, one limitation of the studies was the lack of simultaneous monitoring
of pollutants with indoor sources which are likely to build-up at lower ventilation rates and might affect
performance. In light of these concerns, the recent experiment performed on adults in controlled laboratory
conditions [71] provides strong suggestive evidence that cognitive performance may be affected at CO2
levels as low as 1000 ppm. Findings of this study are not definitive, as a small population sample was used.
4. There is indicative evidence indicating that increased ventilation rates may also improve cognitive perfor-
mance and health and comfort of the occupants indirectly through: (a) mitigating overheating; (b) reducing
TVOCs; and (c) reducing microbial concentrations;
(a) Two studies in temperate climates showed that the PMV and adaptive comfort model used in existing
thermal comfort standards have limited suitability for predicting the thermal comfort conditions as both
models did not accurately reflect the children’s actual thermal sensation. The results suggested that
children prefer an indoor thermal environment with lower temperatures compared with adults. Possible
explanations are that children have higher metabolic rate per kg body weight, have limited available
adaptive opportunities in classrooms or are more physically active than adults. Limited evidence as-
sociated higher temperatures in school classrooms with dissatisfaction with IAQ and increased SBS
symptoms.
Two cross-sectional experimental interventional studies indicated that lowering the temperature from
25 to 20 �C improved speed of performance by 2-4%. The observed effects of temperature on perfor-
mance could be caused by physiological effects of thermal discomfort, and also by the distraction by
thermal discomfort [6]. Although there are no experiments in school settings that investigate cognitive
performance of students in temperatures above 25 �C or below 20�C , previous work in office workers
18
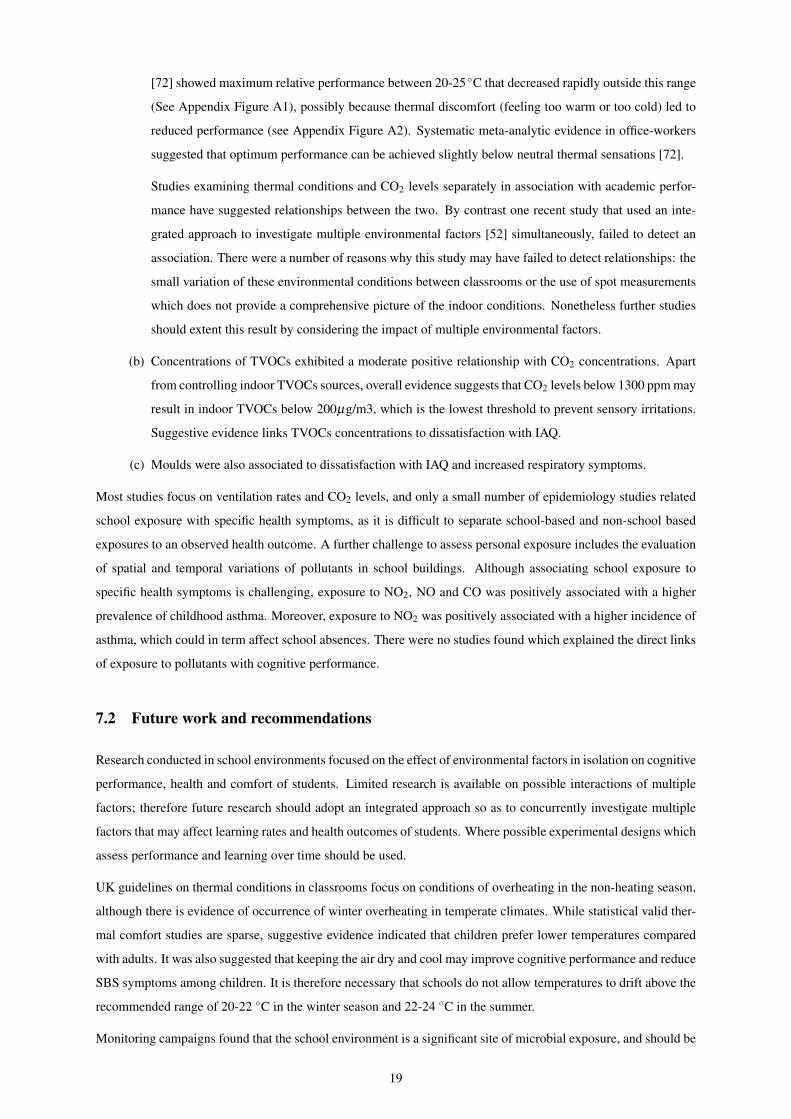
[72] showed maximum relative performance between 20-25 �C that decreased rapidly outside this range
(See Appendix Figure A1), possibly because thermal discomfort (feeling too warm or too cold) led to
reduced performance (see Appendix Figure A2). Systematic meta-analytic evidence in office-workers
suggested that optimum performance can be achieved slightly below neutral thermal sensations [72].
Studies examining thermal conditions and CO2 levels separately in association with academic perfor-
mance have suggested relationships between the two. By contrast one recent study that used an inte-
grated approach to investigate multiple environmental factors [52] simultaneously, failed to detect an
association. There were a number of reasons why this study may have failed to detect relationships: the
small variation of these environmental conditions between classrooms or the use of spot measurements
which does not provide a comprehensive picture of the indoor conditions. Nonetheless further studies
should extent this result by considering the impact of multiple environmental factors.
(b) Concentrations of TVOCs exhibited a moderate positive relationship with CO2 concentrations. Apart
from controlling indoor TVOCs sources, overall evidence suggests that CO2 levels below 1300 ppm may
result in indoor TVOCs below 200µg/m3, which is the lowest threshold to prevent sensory irritations.
Suggestive evidence links TVOCs concentrations to dissatisfaction with IAQ.
(c) Moulds were also associated to dissatisfaction with IAQ and increased respiratory symptoms.
Most studies focus on ventilation rates and CO2 levels, and only a small number of epidemiology studies related
school exposure with specific health symptoms, as it is difficult to separate school-based and non-school based
exposures to an observed health outcome. A further challenge to assess personal exposure includes the evaluation
of spatial and temporal variations of pollutants in school buildings. Although associating school exposure to
specific health symptoms is challenging, exposure to NO2, NO and CO was positively associated with a higher
prevalence of childhood asthma. Moreover, exposure to NO2 was positively associated with a higher incidence of
asthma, which could in term affect school absences. There were no studies found which explained the direct links
of exposure to pollutants with cognitive performance.
7.2 Future work and recommendations
Research conducted in school environments focused on the effect of environmental factors in isolation on cognitive
performance, health and comfort of students. Limited research is available on possible interactions of multiple
factors; therefore future research should adopt an integrated approach so as to concurrently investigate multiple
factors that may affect learning rates and health outcomes of students. Where possible experimental designs which
assess performance and learning over time should be used.
UK guidelines on thermal conditions in classrooms focus on conditions of overheating in the non-heating season,
although there is evidence of occurrence of winter overheating in temperate climates. While statistical valid ther-
mal comfort studies are sparse, suggestive evidence indicated that children prefer lower temperatures compared
with adults. It was also suggested that keeping the air dry and cool may improve cognitive performance and reduce
SBS symptoms among children. It is therefore necessary that schools do not allow temperatures to drift above the
recommended range of 20-22 �C in the winter season and 22-24 �C in the summer.
Monitoring campaigns found that the school environment is a significant site of microbial exposure, and should be
19
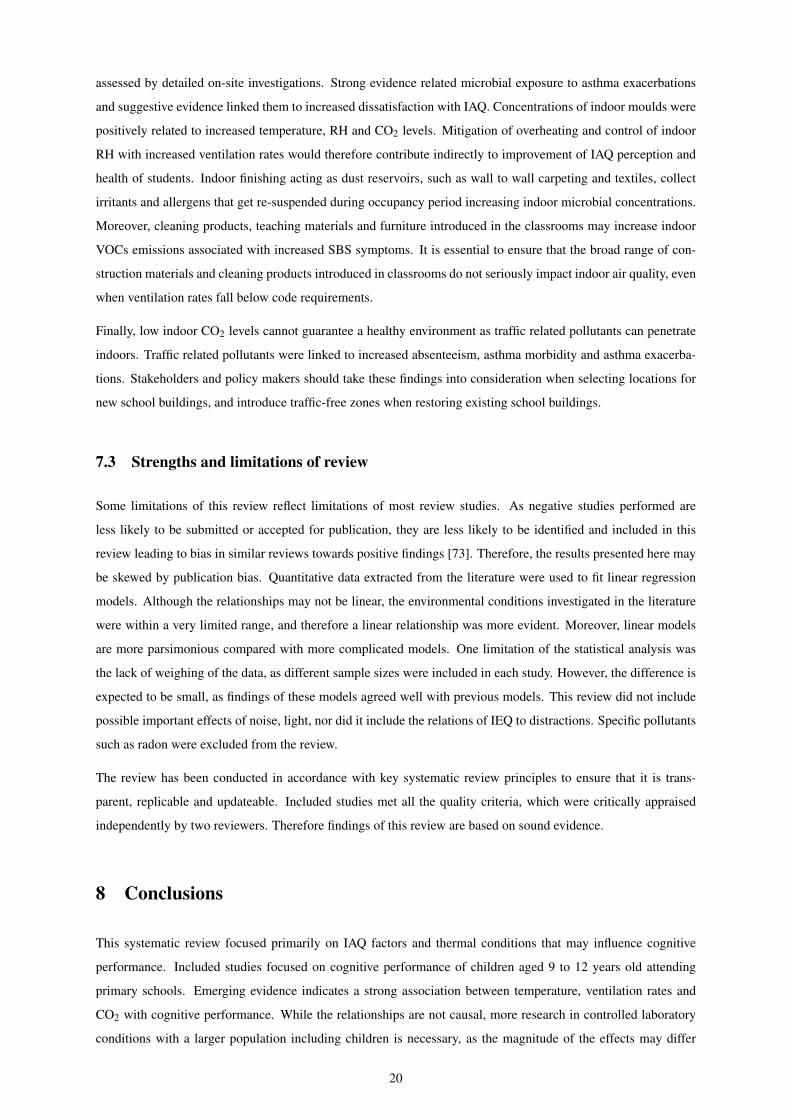
assessed by detailed on-site investigations. Strong evidence related microbial exposure to asthma exacerbations
and suggestive evidence linked them to increased dissatisfaction with IAQ. Concentrations of indoor moulds were
positively related to increased temperature, RH and CO2 levels. Mitigation of overheating and control of indoor
RH with increased ventilation rates would therefore contribute indirectly to improvement of IAQ perception and
health of students. Indoor finishing acting as dust reservoirs, such as wall to wall carpeting and textiles, collect
irritants and allergens that get re-suspended during occupancy period increasing indoor microbial concentrations.
Moreover, cleaning products, teaching materials and furniture introduced in the classrooms may increase indoor
VOCs emissions associated with increased SBS symptoms. It is essential to ensure that the broad range of con-
struction materials and cleaning products introduced in classrooms do not seriously impact indoor air quality, even
when ventilation rates fall below code requirements.
Finally, low indoor CO2 levels cannot guarantee a healthy environment as traffic related pollutants can penetrate
indoors. Traffic related pollutants were linked to increased absenteeism, asthma morbidity and asthma exacerba-
tions. Stakeholders and policy makers should take these findings into consideration when selecting locations for
new school buildings, and introduce traffic-free zones when restoring existing school buildings.
7.3 Strengths and limitations of review
Some limitations of this review reflect limitations of most review studies. As negative studies performed are
less likely to be submitted or accepted for publication, they are less likely to be identified and included in this
review leading to bias in similar reviews towards positive findings [73]. Therefore, the results presented here may
be skewed by publication bias. Quantitative data extracted from the literature were used to fit linear regression
models. Although the relationships may not be linear, the environmental conditions investigated in the literature
were within a very limited range, and therefore a linear relationship was more evident. Moreover, linear models
are more parsimonious compared with more complicated models. One limitation of the statistical analysis was
the lack of weighing of the data, as different sample sizes were included in each study. However, the difference is
expected to be small, as findings of these models agreed well with previous models. This review did not include
possible important effects of noise, light, nor did it include the relations of IEQ to distractions. Specific pollutants
such as radon were excluded from the review.
The review has been conducted in accordance with key systematic review principles to ensure that it is trans-
parent, replicable and updateable. Included studies met all the quality criteria, which were critically appraised
independently by two reviewers. Therefore findings of this review are based on sound evidence.
8 Conclusions
This systematic review focused primarily on IAQ factors and thermal conditions that may influence cognitive
performance. Included studies focused on cognitive performance of children aged 9 to 12 years old attending
primary schools. Emerging evidence indicates a strong association between temperature, ventilation rates and
CO2 with cognitive performance. While the relationships are not causal, more research in controlled laboratory
conditions with a larger population including children is necessary, as the magnitude of the effects may differ
20
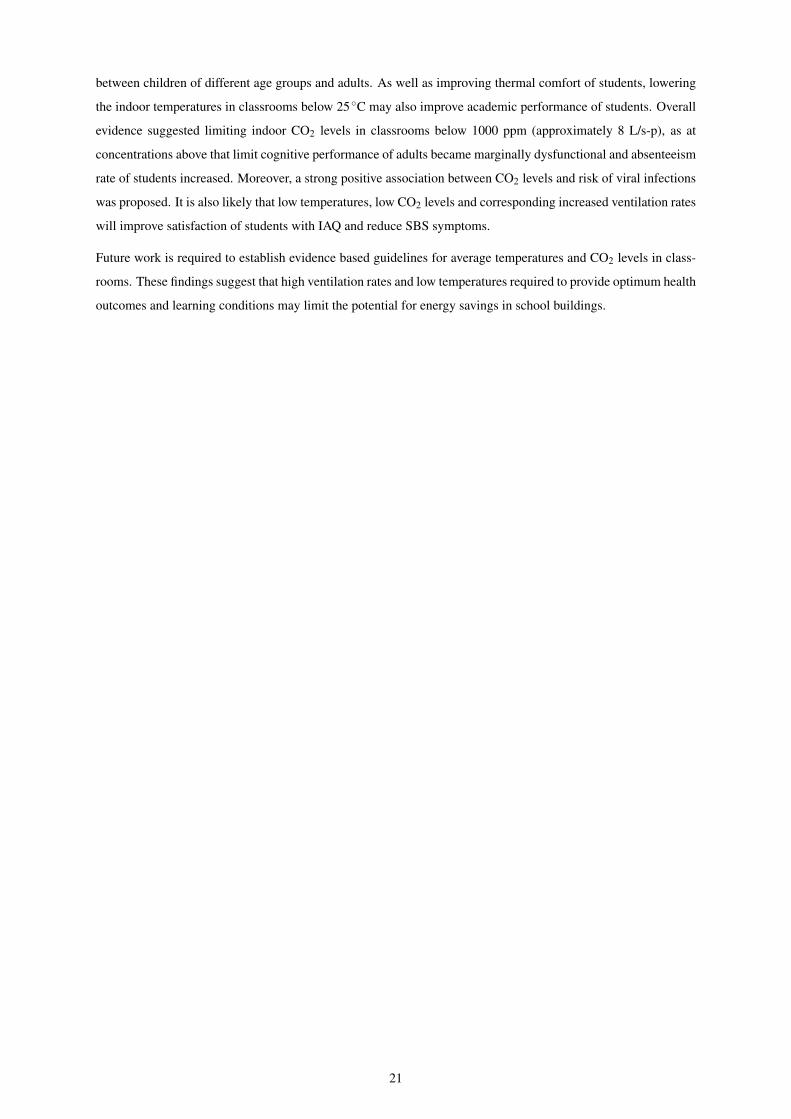
between children of different age groups and adults. As well as improving thermal comfort of students, lowering
the indoor temperatures in classrooms below 25�C may also improve academic performance of students. Overall
evidence suggested limiting indoor CO2 levels in classrooms below 1000 ppm (approximately 8 L/s-p), as at
concentrations above that limit cognitive performance of adults became marginally dysfunctional and absenteeism
rate of students increased. Moreover, a strong positive association between CO2 levels and risk of viral infections
was proposed. It is also likely that low temperatures, low CO2 levels and corresponding increased ventilation rates
will improve satisfaction of students with IAQ and reduce SBS symptoms.
Future work is required to establish evidence based guidelines for average temperatures and CO2 levels in class-
rooms. These findings suggest that high ventilation rates and low temperatures required to provide optimum health
outcomes and learning conditions may limit the potential for energy savings in school buildings.
21
References
[1] K. Wall, J. Dockrell, and N. Peacey, “Primary Schools: The Built Environment. Research Briefing 6-1,”
tech. rep., 2008.
[2] Eurostat, “School enrolment and levels of education,” 2011.
[3] L. Chatzidiakou, D. Mumovic, and A. J. Summerfield, “What do we know about indoor air quality in school
classrooms ? A critical review of the literature,” Intelligent Building International, no. October, pp. 37–41,
2012.
[4] M. J. Mendell and G. a. Heath, “Do indoor pollutants and thermal conditions in schools influence student
performance? A critical review of the literature.,” Indoor air, vol. 15, pp. 27–52, Feb. 2005.
[5] J. M. Daisey, W. J. Angell, and M. G. Apte, “Indoor air quality, ventilation and health symptoms in schools:
an analysis of existing information.,” Indoor air, vol. 13, pp. 53–64, Mar. 2003.
[6] P. Wargocki and D. P. Wyon, “Providing better thermal and air quality conditions in school classrooms
would be cost-effective,” Building and Environment, vol. 59, pp. 581–589, Jan. 2013.
[7] World Health Organization, “Chronic respiratory disease,” 2012.
[8] S. a. Julious, L. M. Osman, and M. Jiwa, “Increases in asthma hospital admissions associated with the end
of the summer vacation for school-age children with asthma in two cities from England and Scotland.,”
Public health, vol. 121, pp. 482–4, June 2007.
[9] V. Grech, M. Balzan, and S. Distefano, “Paediatric Wheezy Admissions at and around School Holiday
Periods,” vol. 16, no. 01, pp. 23–26, 2004.
[10] D. Lincoln, G. Morgan, V. Sheppeard, B. Jalaludin, S. Corbett, and J. Beard, “Childhood asthma and return
to school in Sydney, Australia.,” Public health, vol. 120, pp. 854–62, Sept. 2006.
[11] A. S. J. Mallol, J. Crane, E. von Mutius, J. Odhiambo, U. Keil and T. I. P. T. S. Group, “The International
Study of Asthma and Allergies in Childhood (ISAAC) Phase Three: A global synthesis,” Allergologia et
Immunopathologia, vol. 41, no. 2, pp. 73–85, 2013.
[12] World Health Organisation (WHO), “Social determinants of health: The solid facts,” in Healthy cities:
Health for all (R. Wilkinson and M. Marmont, eds.), pp. 89–116, World Health Organisation, 2nd ed., 2003.
[13] British Standard Institution, “BS EN ISO 7730:2005. Ergonomics of the thermal environment - Analytical
determination and interpretation of thermal comfort using calculation of the PMV and PPD indices and
local thermal comfort criteria. Milton Keynes: BSI,” 2005.
[14] American Society of Heating Refrigerating and Air-Conditioning Engineers, “ANSI/ASHRAE 55-2010 –
Thermal Environmental Conditions for Human Occupancy,” 2010.
[15] British Standard Institution, “BS EN 15251:2007. Indoor environmental input parameters for design and
assessment of energy performance of buildings addressing indoor air quality , thermal environment ,
lighting and acoustics. Milton Keynes: BSI,” 2007.
22
[16] P. Fanger, Thermal comfort: Analysis and applications in environmental engineering. Copenhagen: Danish
Technical Press, 1970.
[17] Department for Education and Skills, “Building Bulletin 101-ventilation of School Buildings,” 2006.
[18] Department for Education, “Facilities output specification for the PSBP PFI projects,” 2012.
[19] Workplace health safety and welfare, “Workplace (Health, Safety and Welfare) Regulations 1992.
Approved Code of Practice and guidance,” tech. rep.
[20] American Society of Heating Refrigerating and Air-Conditioning Engineers, “ASHRAE STANDARD
62.1-2010: Ventilation for Acceptable Indoor Air Quality,” 2010.
[21] World Health Organisation, “WHO Air quality guidelines for particulate matter, ozone, nitrogen dioxide
and sulfur dioxide,” tech. rep., 2005.
[22] World Health Organisation, “WHO guidelines for indoor air quality: selected pollutants,” 2010.
[23] W.-K. Jo and Y.-J. Seo, “Indoor and outdoor bioaerosol levels at recreation facilities, elementary schools,
and homes.,” Chemosphere, vol. 61, pp. 1570–9, Dec. 2005.
[24] P. M. Salo, M. L. Sever, and D. C. Zeldin, “Indoor allergens in school and day care environments.,” The
Journal of allergy and clinical immunology, vol. 124, pp. 185–192, Aug. 2009.
[25] S. J. Arbes, M. Sever, J. Mehta, N. Collette, B. Thomas, and D. C. Zeldin, “Exposure to indoor allergens in
day-care facilities: Results from two North Carolina counties.,” The Journal of allergy and clinical
immunology, vol. 116, pp. 133–9, July 2005.
[26] K. Foarde and M. Berry, “Comparison of biocontaminant levels associated with hard vs. carpet floors in
nonproblem schools: results of a year long study.,” Journal of exposure analysis and environmental
epidemiology, vol. 14 Suppl 1, pp. S41–8, Jan. 2004.
[27] G. Smedje and D. Norback, “Irritants and Allergens at School in Relation to Furnishing and Cleaning,”
Indoor Air, vol. 11, pp. 127–133, 2001.
[28] Z. H. Zhao, L. Elfman, Z. H. Wang, Z. Zhang, and D. Norbäck, “A comparative study of asthma, pollen, cat
and dog allergy among pupils and allergen levels in schools in Taiyuan city, China, and Uppsala, Sweden.,”
Indoor air, vol. 16, pp. 404–13, Dec. 2006.
[29] C. Godwin and S. Batterman, “Indoor air quality in Michigan schools.,” Indoor air, vol. 17, pp. 109–21,
Apr. 2007.
[30] HESE, “Health Effects of School Environment ( HESE ) Final Scientific Report,” Tech. Rep. January,
Siena, 2006.
[31] A. Fox, W. Harley, C. Feigley, D. Salzberg, A. Sebastian, and L. Larsson, “Increased levels of bacterial
markers and CO2 in occupied school rooms,” Journal of Environmental Monitoring, vol. 5, pp. 246–252,
Mar. 2003.
[32] G. Ramachandran, J. L. Adgate, S. Banerjee, T. R. Church, D. Jones, A. L. Fredrickson, and K. Sexton,
“Indoor Air Quality in Two Urban Elementary Schools-Measurements of Airborne Fungi, Carpet Allergens,
23
CO2, Temperature and Relative Humidity,” Journal of Occupational and Environmental Hygiene, vol. 2,
pp. 553–566, 2005.
[33] L. Molhave, Human responses to Organic Air pollutants in Organic Indoor Air Pollutants: Occurrence,
Measurement, Evaluation. Weinheim: WILEY-VCH Verlag GmbH& Co.KGaA, second ed., 2009.
[34] T. Salthammer, “Critical evaluation of approaches in setting indoor air quality guidelines and reference
values.,” Chemosphere, vol. 82, pp. 1507–17, Mar. 2011.
[35] E. V. Elm, D. G. Altman, M. Egger, S. J. Pocock, C. Gø tzsche, and J. P. Vandenbroucke, “Policy and
practice The Strengthening the Reporting of Observational Studies in Epidemiology ( STROBE ) Statement
: guidelines for reporting observational studies *,” vol. 045120, no. August, pp. 867–872, 2007.
[36] N. H. Wong and S. S. Khoo, “Thermal comfort in classrooms in the tropics,” Energy and Buildings, vol. 35,
no. February 2002, pp. 337–351, 2003.
[37] A. G. Kwok and C. Chun, “T hermal comfort in Japanese schools,” vol. 74, pp. 245–252, 2003.
[38] R.-L. Hwang, T.-P. Lin, and N.-J. Kuo, “Field experiments on thermal comfort in campus classrooms in
Taiwan,” Energy and Buildings, vol. 38, pp. 53–62, Jan. 2006.
[39] H.-H. Liang, T.-P. Lin, and R.-L. Hwang, “Linking occupants’ thermal perception and building thermal
performance in naturally ventilated school buildings,” Applied Energy, vol. 94, pp. 355–363, June 2012.
[40] D. Mumovic, J. Palmer, M. Davies, M. Orme, I. Ridley, T. Oreszczyn, C. Judd, R. Critchlow, H. Medina,
G. Pilmoor, C. Pearson, and P. Way, “Winter indoor air quality, thermal comfort and acoustic performance
of newly built secondary schools in England,” Building and Environment, vol. 44, pp. 1466–1477, July
2009.
[41] D. Teli, M. F. Jentsch, and P. a.B. James, “Naturally ventilated classrooms: An assessment of existing
comfort models for predicting the thermal sensation and preference of primary school children,” Energy
and Buildings, vol. 53, pp. 166–182, Oct. 2012.
[42] S. T. Mors, J. L. Hensen, M. G. Loomans, and A. C. Boerstra, “Adaptive thermal comfort in primary school
classrooms: Creating and validating PMV-based comfort charts,” Building and Environment, vol. 46,
pp. 2454–2461, Dec. 2011.
[43] S. P. Corgnati, M. Filippi, and S. Viazzo, “Perception of the thermal environment in high school and
university classrooms: Subjective preferences and thermal comfort,” Building and Environment, vol. 42,
pp. 951–959, Feb. 2007.
[44] S. P. Corgnati, R. Ansaldi, and M. Filippi, “Thermal comfort in Italian classrooms under free running
conditions during mid seasons: Assessment through objective and subjective approaches,” Building and
Environment, vol. 44, pp. 785–792, Apr. 2009.
[45] Z. Bakó-Biró, D. Clements-Croome, N. Kochhar, H. Awbi, and M. Williams, “Ventilation rates in schools
and pupils’ performance,” Building and Environment, vol. 48, pp. 215–223, Feb. 2012.
24
[46] G. Zhang, J. Spickett, K. Rumchev, a. H. Lee, and S. Stick, “Indoor environmental quality in a ’low
allergen’ school and three standard primary schools in Western Australia.,” Indoor air, vol. 16, pp. 74–80,
Feb. 2006.
[47] Y.-H. Mi, D. Norbäck, J. Tao, Y.-L. Mi, and M. Ferm, “Current asthma and respiratory symptoms among
pupils in Shanghai, China: influence of building ventilation, nitrogen dioxide, ozone, and formaldehyde in
classrooms.,” Indoor air, vol. 16, pp. 454–64, Dec. 2006.
[48] Z. Bakó-biró, N. Kochhar, H. B. Awbi, and M. Williams, “Ventilation Rates in Schools and Learning
Performance,” in Proceedings of Clima -Wellbeing indoors, (Helsinki), FINVAC, 2007.
[49] D. A. Coley and R. Greeves, “The Effect of low ventilation rates on the cognitive function of a primary
school class,” Education, no. 01392, 2004.
[50] R. J. Shaughnessy, U. Haverinen-Shaughnessy, a. Nevalainen, and D. Moschandreas, “A preliminary study
on the association between ventilation rates in classrooms and student performance.,” Indoor air, vol. 16,
pp. 465–8, Dec. 2006.
[51] U. Haverinen-Shaughnessy, D. J. Moschandreas, and R. J. Shaughnessy, “Association between substandard
classroom ventilation rates and students’ academic achievement.,” Indoor air, vol. 21, pp. 121–31, Apr.
2011.
[52] P. Barrett, Y. Zhang, J. Moffat, and K. Kobbacy, “A holistic, multi-level analysis identifying the impact of
classroom design on pupils’ learning,” Building and Environment, vol. 59, pp. 678–689, Jan. 2013.
[53] S. N. Rudnick and D. K. Milton, “Risk of indoor airborne infection transmission estimated from carbon
dioxide concentration.,” Indoor air, vol. 13, pp. 237–45, Sept. 2003.
[54] D. G. Shendell, R. Prill, W. J. Fisk, M. G. Apte, D. Blake, and D. Faulkner, “Associations between
classroom CO2 concentrations and student attendance in Washington and Idaho.,” Indoor air, vol. 14,
pp. 333–41, Oct. 2004.
[55] M. J. Mendell, E. a. Eliseeva, M. M. Davies, M. Spears, A. Lobscheid, W. J. Fisk, and M. G. Apte,
“Association of classroom ventilation with reduced illness absence: a prospective study in California
elementary schools.,” Indoor air, vol. 23, pp. 515–528, Mar. 2013.
[56] R. Walinder, D. Norback, G. Wieslander, G. Smedje, and C. Erwall, “Nasal Mucosal Swelling in Relation to
Low Air Exchange Rate in Schools,” Indoor Air, vol. 7, pp. 198–205, 1997.
[57] J. Gasana, D. Dillikar, A. Mendy, E. Forno, and E. Ramos Vieira, “Motor vehicle air pollution and asthma
in children: a meta-analysis.,” Environmental research, vol. 117, pp. 36–45, Aug. 2012.
[58] N. a.H. Janssen, B. Brunekreef, P. van Vliet, F. Aarts, K. Meliefste, H. Harssema, and P. Fischer, “The
Relationship between Air Pollution from Heavy Traffic and Allergic Sensitization, Bronchial
Hyperresponsiveness, and Respiratory Symptoms in Dutch Schoolchildren,” Environmental Health
Perspectives, vol. 111, pp. 1512–1518, June 2003.
[59] L. Chen, B. L. Jennison, and S. T. Omaye, “Elementary school absenteeism and air pollution,” Inhalation
Toxicology, vol. 12, pp. 997–1016, 2000.
25
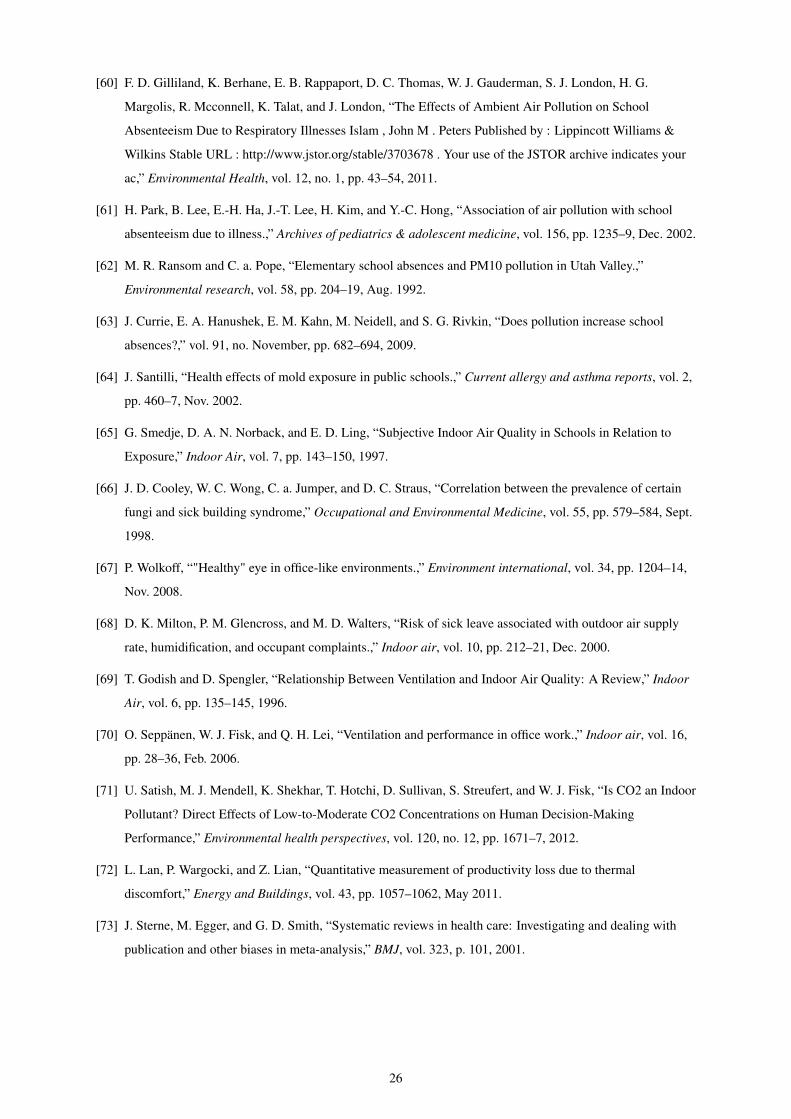
[60] F. D. Gilliland, K. Berhane, E. B. Rappaport, D. C. Thomas, W. J. Gauderman, S. J. London, H. G.
Margolis, R. Mcconnell, K. Talat, and J. London, “The Effects of Ambient Air Pollution on School
Absenteeism Due to Respiratory Illnesses Islam , John M . Peters Published by : Lippincott Williams &
Wilkins Stable URL : http://www.jstor.org/stable/3703678 . Your use of the JSTOR archive indicates your
ac,” Environmental Health, vol. 12, no. 1, pp. 43–54, 2011.
[61] H. Park, B. Lee, E.-H. Ha, J.-T. Lee, H. Kim, and Y.-C. Hong, “Association of air pollution with school
absenteeism due to illness.,” Archives of pediatrics & adolescent medicine, vol. 156, pp. 1235–9, Dec. 2002.
[62] M. R. Ransom and C. a. Pope, “Elementary school absences and PM10 pollution in Utah Valley.,”
Environmental research, vol. 58, pp. 204–19, Aug. 1992.
[63] J. Currie, E. A. Hanushek, E. M. Kahn, M. Neidell, and S. G. Rivkin, “Does pollution increase school
absences?,” vol. 91, no. November, pp. 682–694, 2009.
[64] J. Santilli, “Health effects of mold exposure in public schools.,” Current allergy and asthma reports, vol. 2,
pp. 460–7, Nov. 2002.
[65] G. Smedje, D. A. N. Norback, and E. D. Ling, “Subjective Indoor Air Quality in Schools in Relation to
Exposure,” Indoor Air, vol. 7, pp. 143–150, 1997.
[66] J. D. Cooley, W. C. Wong, C. a. Jumper, and D. C. Straus, “Correlation between the prevalence of certain
fungi and sick building syndrome,” Occupational and Environmental Medicine, vol. 55, pp. 579–584, Sept.
1998.
[67] P. Wolkoff, “"Healthy" eye in office-like environments.,” Environment international, vol. 34, pp. 1204–14,
Nov. 2008.
[68] D. K. Milton, P. M. Glencross, and M. D. Walters, “Risk of sick leave associated with outdoor air supply
rate, humidification, and occupant complaints.,” Indoor air, vol. 10, pp. 212–21, Dec. 2000.
[69] T. Godish and D. Spengler, “Relationship Between Ventilation and Indoor Air Quality: A Review,” Indoor
Air, vol. 6, pp. 135–145, 1996.
[70] O. Seppänen, W. J. Fisk, and Q. H. Lei, “Ventilation and performance in office work.,” Indoor air, vol. 16,
pp. 28–36, Feb. 2006.
[71] U. Satish, M. J. Mendell, K. Shekhar, T. Hotchi, D. Sullivan, S. Streufert, and W. J. Fisk, “Is CO2 an Indoor
Pollutant? Direct Effects of Low-to-Moderate CO2 Concentrations on Human Decision-Making
Performance,” Environmental health perspectives, vol. 120, no. 12, pp. 1671–7, 2012.
[72] L. Lan, P. Wargocki, and Z. Lian, “Quantitative measurement of productivity loss due to thermal
discomfort,” Energy and Buildings, vol. 43, pp. 1057–1062, May 2011.
[73] J. Sterne, M. Egger, and G. D. Smith, “Systematic reviews in health care: Investigating and dealing with
publication and other biases in meta-analysis,” BMJ, vol. 323, p. 101, 2001.
26
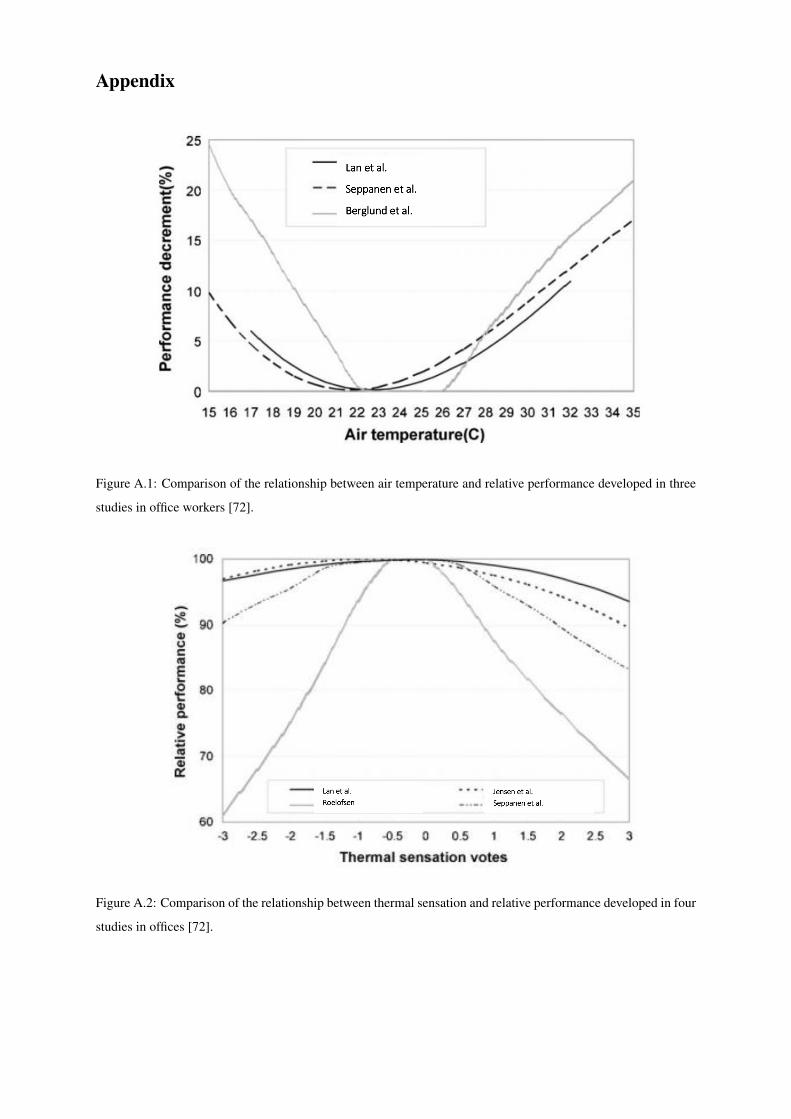
Appendix
Figure A.1: Comparison of the relationship between air temperature and relative performance developed in three
studies in office workers [72].
Figure A.2: Comparison of the relationship between thermal sensation and relative performance developed in four
studies in offices [72].
Studies compared in the Figures A.1 and A.2 taken from the meta-analytic study [72]:
O. Seppänen, W. Fisk, Q.H. Lei, Room temperature and productivity in office work, in: eScholarship Repository,
Lawrence Berkeley National Laboratory, University of California, http://repositories.cdlib.org/lbnl/LBNL-60952.
2006.
P. Roelofsen, The design of the workplace as a strategy for productivity enhancement, in: Clima 2000/Napoli 2001
World Congress, Napoli, 2001.
K.L Jensen, J. Toftum, P. Friis-Hansen, A bayesian network approach to the evaluation of building design and its
consequences for employee performance and operational costs, Building and Environment, vol. 44, pp. 456–462,
2009.
L.G. Berglund, R.R. Gonzales, A.P. Gagge, Predicted human performance decrement from thermal discomfort and
ET*, in: Proceedings of the Fifth International Conference on Indoor Air Quality and Climate, Toronto, Canada,
pp. 215–220, 1990.


Commissioned by:
Copying the report in part or in full is not permitted without prior consent.
Recommended