The University of Maine The University of Maine
DigitalCommons@UMaine DigitalCommons@UMaine
Honors College
Spring 5-2016
The Effects of Emotional and Instrumental Support on Students’ The Effects of Emotional and Instrumental Support on Students’
Mathematical Attitudes Mathematical Attitudes
Victoria M. Calabrese University of Maine
Follow this and additional works at: https://digitalcommons.library.umaine.edu/honors
Part of the Elementary Education Commons
Recommended Citation Recommended Citation Calabrese, Victoria M., "The Effects of Emotional and Instrumental Support on Students’ Mathematical Attitudes" (2016). Honors College. 371. https://digitalcommons.library.umaine.edu/honors/371
This Honors Thesis is brought to you for free and open access by DigitalCommons@UMaine. It has been accepted for inclusion in Honors College by an authorized administrator of DigitalCommons@UMaine. For more information, please contact [email protected].

THE EFFECTS OF EMOTIONAL AND INSTRUMENTAL SUPPORT ON
STUDENTS’ MATHEMATICAL ATTITUDES
By
Victoria M. Calabrese
A Thesis Submitted in Partial Fulfillment of the Requirements for a Degree with Honors
(Elementary Education)
The Honors College
University of Maine
May 2016
Advisory Committee: Eric Pandiscio, Associate Professor of Mathematics Education, Chair Billy Jackson, Lecturer of Mathematics, Research Associate for STEM Education
Jordan LaBouff, Assistant Professor of Psychology, Honors College Sid Mitchell, Associate Professor of Educational Psychology
Maryia Nezol, Lecturer of Education Literacy, Graduate Student

© 2016 Victoria Calabrese
All Rights Reserved

iii
Abstract
This study tests to see if a correlation exists between students’ attitudes towards
mathematics and teacher pedagogy through emotional and instrumental support.
Emotional support is defined as an individual’s perception of a mathematics teacher as
being warm, friendly, caring, and empathic (Katz & Gueta, 2010). Instrumental support is
defined by an individual’s perception of a mathematics teacher’s instruction, whether the
teacher is considered to be helpful, and if the teacher provides guidance when needed
(Spielberger, 1979). Two surveys were administered and three interviews were conducted
to investigate this hypothesis. The first survey consisted of 12 Likert scale items, 5 open-
ended responses and 9 mathematics problems for students to solve. Three students were
chosen from the first survey to be interviewed in order to delve deeper into their past
mathematical experiences. The second survey consisted of 35 Likert scale items that dealt
with both emotional and instrumental support. The overall findings of this study
illustrated that emotional and instrumental support did affect students’ overall attitudes
with mathematics.

iv
Acknowledgements
I would first like to thank everyone who was part of my honors thesis committee.
Thank you to Eric Pandiscio, who was my thesis advisor. I appreciate your kindness,
patience, and support with me throughout the entire process. I am thankful for your
speedy responses to my emails and your quick editing. I appreciate you always believing
in my ability to finish my thesis even knowing during some points that I really needed to
get myself into gear! This entire process would not have been the same without you.
Thank you to Sid Mitchell who spent hours with me analyzing and explaining how to
read my results. Thank you to Jordan for giving me so much feedback on my reading list
and overall support on my thesis. I also appreciate you taking the time to Skype with me
to answer my questions. Thank you to Maryia Nezol who was willing to sit down with
me and discuss my thesis. I appreciate all of the tips you gave me and that you introduced
the software Dedoose to me so I could use it to analyze my qualitative data. I would like
to thank Billy Jackson who introduced to me various articles and journals that sparked
my curiosity and helped me narrow in on my posed hypothesis.
I would also like to thank Todd Zoroya and Janet Nichols for letting me take time
from their teaching to give the surveys to their classes.
Lastly, I would like to thank all of my family and friends, especially my loving
parents, Steven and Deborah Calabrese. Without their support and positivity, I would not
have been able to finish my thesis.

v
Tables of Contents
Acknowledgements……………………………..……………...................................... iv Introduction…………………………………….…………….…………….…………. 1 Literature Review………………………………….………….…………….………… 1
Attitudes……………………………….…………………………….…….….. 1 Instruction……………………………….………………………………..…… 9
Methods……………………………………………………………….………….…… 14 Results………………………………………………………………….……….…….. 19 Discussion………………………………………………………………….…….……. 24 Conclusion……………………………………………………………………….….… 33 Works Cited……………………………………………………………………….…... 35 Appendix A (IRB Approval) …………………………………………………….…… 39 Appendix B (Consent Forms and Surveys)…………...……………………………..... 41 List of Tables and Figures………………………………………………………….…. 53 Table 1.…………………………………………………...…………………… 53
Table 2.………………………………………………...……………………… 55
Table 3….……………………………………………...……………………… 57
Table 4……….………………………………………...……………………… 59
Table 5…….…………………………………………...……………………… 64
Table 6…….…………………………………………...……………………… 69
Table 7…….…………………………………………...……………………… 81
Figure 1…….…………………………………………………...………...…… 82 Author’s Biography………………………………………….........................................83

1
Introduction When students think of mathematics, many think poorly of it. Students are
becoming more inclined to have negative attitudes towards mathematics. Both emotional
and instrumental support may be affecting the overall attitudes of students in
mathematics. There is research depicting how lack of differentiating instruction and lack
of teacher empathy may be one of the reasons students are acquiring negative attitudes
(Zan & Di Martino, 2007). Students who acquire negative attitudes with mathematics
also achieve lower scores on summative assessments such as homework and tests. By
achieving lower scores, this causes students to dislike mathematics even more; this can
create a spiral that causes them to feel anxious towards mathematics and to lower their
self-efficacy beliefs.
Contributions
This study was conducted to contribute to the body of research dealing with
mathematical attitudes. Specifically, this study aimed to see if there is a connection
between college student’s current overall attitudes regarding mathematics and their past
experiences with both emotional and instrumental support from teachers prior to
attending college.
Literature Review Attitudes
In Lisa Medoff’s article, Getting Beyond “I Hate Math!” she explains how a
particular student dislikes mathematics and finds it difficult for many reasons (Medoff,

2
2009). The student does not always understand the material the teacher tries to explain,
but she is too afraid to ask clarifying questions because she believes the teacher will
become frustrated and upset with her. When she does manage to ask questions, the
teacher rewrites the problem on the board and impatiently tells the student to pay
attention and does not show concern for where the student may have gotten confused
(Medoff, 2009). The student also feels anxious and nervous to ask her friends for help
with mathematics because she feels like she will be judged for not understanding the
material (Medoff, 2009). The student described in Medoff’s scenario provides an
example of how many people feel about mathematics. This student in Medoff’s scenario
is how many people feel about mathematics. Many students exhibit anxiety and negative
attitudes towards mathematics, and this is partially due to the teacher’s own attitudes and
instructional practices (Sonnert et. al., 2014).
In order to justify the claim that students’ attitudes towards math are influenced
by teacher pedagogy, the construct of attitude needs to be defined clearly. However, in
past research, attitude is not defined explicitly. The definition is often left up to the
researcher’s interpretation (Zan et. al., 2007) in order to be able to construct and use a
more accurate definition that fits the posed question (Ruffell et. al., 1998). Zan et. al.
(2007), separate the definition of attitude into three different categories that allow the
definition of attitude to be used interchangeably within research The first category
includes attaining a positive or negative opinion or disposition regarding mathematics.
The second category includes developing an attitude based on an emotional response, in
terms of the beliefs regarding the subjects and the behaviors demonstrated in

3
reference to mathematics. Finally, the last category refers to attitude becoming a
pattern of beliefs and emotions about math (Zan et. al., 2007).
Positive and Negative Attitudes
An individual’s attitude may be measured through different instruments. One
common way is by surveys that use a Thurstone or Likert scale, but there are other
methods that can be used to determine attitude such as observation and interviews.
Through the added up scores from either method, an outcome is deduced to depict
whether an individual’s attitude is positive or negative (Zan et. al., 2007).
The items on questionnaires range from emotions, to beliefs, to those related to
behavior (Zan et. al., 2007). One common challenge of questionnaires is that it can be
hard to measure whether the negative attitudes students exhibit are how they feel about
mathematics overall or if it is how they feel about a certain topic within mathematics
such as geometry or algebra (Belbase, 2011).
Some variables that are seen on questionnaires involving attitudes can include
motivation to learn mathematics, mathematics anxiety, and attitudes towards
mathematics, which all significantly impact mathematical achievement (Ernest, 2004).
There is also a positive relationship between students’ attitudes towards mathematics and
their achievement level (Cleary & Chen, 2009). These positive and negative reactions can
be determined by knowing the individuals’ specific beliefs and attitudes and having an
exact definition of what classifies as a positive or negative attitude in the research of
which it pertains (Zan et. al., 2007).
Hannula (2002), separates a student’s attitude towards math into four different
categories: Emotions the students experience during mathematical activities; emotions

4
students experience when learning mathematics conceptually; mathematical evaluations;
and the value of mathematics related goals in the students’ global structure (Belbase,
2011). For the basic definition of attitude (Zan et. al., 2007), having a positive attitude
can cause a positive emotional disposition towards mathematics, while having a negative
attitude can cause a negative emotional disposition towards mathematics. The second and
third definitions, which involve emotional responses, beliefs, and behaviors, do not have
a definitive definition of a positive or negative attitude and as a result can have wavering
definitions of the words within an individual’s particular study (Zan et. al., 2007).
In order to define the results as positive, it depends if the positive attitude has a
correlation with the emotions, beliefs, or behaviors of an individual’s attitude regarding
mathematics (Ma & Kishor, 1997). For instance, a positive emotional attitude is justified
when someone perceives something as pleasurable, while anxiety would be seen as a
negative emotional attitude. Positive attitudes based on beliefs are usually beliefs that are
shared positively by the “experts” (Ma & Kishor, 1997). Positive behavioral attitudes
refer to someone who is successful and has high achievement, but that poses a limitation
on how to assess achievement and what is classified as high and low achievement
(Middleton & Spanias, 1999).
Sam (1999) indicates that students who like mathematics are more inclined to
choose mathematics as their course of study in college, while those who dislike
mathematics tend to think of it as a difficult subject for many reasons such as problem
solving or the class environment (Sternberg, 2008). Students who have negative attitudes
towards mathematics tend to not pay attention during the lesson. This can cause a lack of
knowledge of the material, which can result in deficiencies in students’ mathematical
5
background and lack of prior knowledge going forward (Mumcu & Aktas, 2015). Also, if
students are not given a strong mathematical foundation to begin with, this can be a
contributing factor to an individual’s negative attitude towards mathematics.
Subsequently, from both scenarios, lack of mathematical knowledge can cause fears and
anxieties, which would not allow a student to take the necessary steps to learn the
information in the future due to a fear of failure (Mumcu & Aktas, 2015).
Anxiety
Someone’s attitude is perceived as being negative towards mathematics when
they are classified as having high anxiety (Belbase, 2011). Due to poor, negative attitudes
with mathematics, this might cause individuals to avoid studying math and not using it in
their daily life. Consequently, this can lower a student’s self-efficacy and increase their
mathematical anxiety, which can result in a student having low interest in learning
mathematics (Sam, 1999). As Medoff states, it’s important to help the students who have
negative attitudes towards mathematics by creating a safe, comfortable class environment
that is differentiated to the students’ needs (Medoff, 2004). In order to prevent negative
attitudes, anxiety, which can be a leading cause, needs to be reduced. However, is is
important to define the relation of anxiety to mathematics in order to begin to understand
it (Belbase, 2011).
One definition of anxiety is experiencing a lack of comfort when required to
perform mathematically (McLeod, 1992). Anxiety can also mean the feeling of tension,
helplessness, and mental disorganization with both numbers and shapes (Richardson &
Suinn, 1972). Anxiety that creates dislike, worry, and fear, can be created through
negative perceptions arising from mathematics class. Those who experience anxiety try to

6
get rid of the “problem” by avoiding it altogether. They may also develop negative
attitudes about the cause of the problem - mathematics (Belbase, 2011). Students may
begin mathematics because they struggle with understanding the material. They may have
difficulties learning because of their anxiety, which can impact students’ visual working
memory in math. This is different from anxiety seen in other subjects as it impacts the
verbal working memory (Miller and Bichsel, 2004). The result is a student’s impacted
visual working memory can cause trait or state anxiety in a student (Miller & Bichsel,
2004).
According to Miller and Bichsel (2004), there are two classifications of anxiety –
trait and state. Individuals who experience trait anxiety have a tendency to feel anxious in
all types of situations. Individuals who experience state anxiety tend to feel anxious in
specific personal situations (Miller & Bichsel, 2004). Students who have mathematics
anxiety tend to have state anxiety, which causes individuals to have a fear of mathematics
due to class, homework, exams, or other situations. Individuals with high state anxiety
had lower achievement performance than individuals with lower state anxiety (Belbase,
2011). Besides achieving lower than others, students who have anxiety with mathematics
can have other hindrances as well. For example, a student may not major in mathematics
or aspire for a career that involves mathematics. Subsequently, students who have
mathematical anxiety tend to have issues doing mathematics, have a decline in their
mathematics achievement, avoid mathematics, limit their choices of a college major and
future career, and have feelings of guilt and shame (Richardson & Suinn, 1972).
Ma and Kishor (1997) believe there is a correlation between mathematics
achievement, performance, and anxiety. Students who have positive attitudes

7
regarding math often have had positive experiences with the class environment,
with teachers’ dispositions, and with particular situations. As a result, these
students are less likely to have mathematical anxiety. Cemen constructed a model of
mathematical anxiety using those antecedents. Within those categories, environmental
influences may have been due to negative mathematics experiences and lack of parental
encouragement; dispositional influences may have been due to negative attitudes and lack
of confidence; and situational influences may have been due to classroom factors and the
instructional format that the teacher used. For students who do not experience these
characteristics in a classroom, they may acquire negative attitudes and anxiety. Cemen,
(1987 as cited by Belbase, 2011) addresses the issue of not seeing environmental,
dispositional, and situational antecedents in a classroom.
Attitude Limitations
In a study conducted by Mumcu (Year) on the relationship between students’
attitudes towards mathematics and their achievement level, there were two focal points
(Mumcu & Aktas, 2015). First, there was a focus on students’ attitudes and self-efficacy
perceptions in regards to mathematics and the relation between the two concepts. Within
the study, attitudes and self-efficacy were explored in terms of gender, grade (with high
school), program, and mathematics achievement. The study depicted that the correlation
between the two could not be determined and was rendered uncertain (Mumcu & Aktas,
2015). These studies were rendered uncertain due to certain limitations (Belbase, 2011)
concerning students’ beliefs and attitudes because of social status and gender.
Some studies examined these limitations to see if it would impact students’ beliefs
and attitudes and their performance at school and understanding of mathematics and

8
mathematical proofs. They saw a major difference between males and females. Male
students thought mathematical understanding was achieved through procedures and the
studying of conceptual understanding. Females tended to have less positive attitudes
towards mathematics than males did (Swetz, 1983 as cited by Belbase, 2011). Hembree
(1990), noted that gender often played a key role in there being a correlation between
high anxiety and performance level with males having a lower performance level than
females. In some studies there was a positive correlation between studying mathematics
through understanding and a student’s high performance at school and being able to
understand mathematical proofs Belbase, 2011). Overall, gender and social status
contribute to students’ overall attitudes towards mathematics.
Attitudes Affected by Instructional Practice
There is considerable research regarding student’s attitudes with mathematics, the
teacher’s pedagogical methods and behaviors, and whether that affects the student’s
achievement in mathematics (Ma and Kishor, 1997). Some research supports a
correlation between the three, but according to Ma and Kishor (1997) there has only been
speculations of such correlations. In their study the correlation was statistically
significant, but not strong enough to make a case for an educational practice that warrants
a change in how mathematics is taught in schools (Ma and Kishor, 1997). Belbase (2011)
tries to prove that there is a correlation between student’s anxiety levels and how the
student learns through the teachers’ instructional practices. In some research Belbase’s
(2011) hypothesis is proven, slightly, through the depictions of students’ negative
attitudes and the way a student learns mathematics (Zan et. al., 2007).

9
For students who tend to have math anxiety, there has also been a trend in their
misbehavior during class time. Some methods that are being used to rectify the issue are
modifying content, modifying task demands, and modifying delivery system (Mancil &
Maynard, 2007). In order to modify content, a teacher should alter the type and the
amount of information being presented to a student. To modify task demands, a teacher
can have students respond to questions in different ways that can allow them to answer
questions nonverbally. Lastly, modifying delivery system results in changing
instructional agents, format, and context in order benefit the student (Mancil & Maynard,
2007).
Instruction
Instructional Methods
Instructional support is used to define whether a teacher’s pedagogical practices
have impacted a student’s attitude towards mathematics positively or negatively. One
type of instructional support, known as “instrumental,” is defined as a student’s
perception of being provided with instrumental resources and practical help (Malecki &
Demaray, 2003). This encompasses questioning, clarifying, correcting, elaborating, and
modeling behaviors, which all contribute to understanding and developing skills for
problem solving in mathematics. (Malecki 2003) Instrumental support goes beyond using
textbooks to teach and does not place emphasis solely on memorizing formulas and
applying rules. Yackel and Cobb (1996) posit a need for instrumental instruction in
schools to change students’ overall attitudes in mathematics

10
In many cases, mathematics instruction needs to provide students multiple
opportunities to experience problem solving. These problems should teach individuals
how to construct solutions to real-life situations that may require multiple steps (Carolina,
2003). Studies have shown in both Japan and the United States that the use of practical
experiences and problems in mathematics can contribute to enjoying and learning
mathematics (Daniel, 2005). Before this enjoyment can take place, individuals need to
feel confident about their abilities to engage in these experiences. In order for them to
feel confident, they need the tools and the resources to learn, which is done through
different instructional practices.
In North Carolina, a mandated test requires students to integrate mathematical
ideas with applications from other content areas. In addition, the test covers four domains
– communication, processing information, problem solving, and using numbers and data
(Carolina, 2003). Through the test, teachers are able to address each of the four main
domains to try and use effective instructional strategies. For instance, to teach problem
solving, teachers would give tasks for students to complete where the solution method is
not known; where students would have to apply and adapt multiple problem-solving
strategies; and teach a basic understanding of problem-solving tasks. Teachers also need
to make sure they recognize and use connections among mathematical ideas and
communicate understandings of how related concepts build on each other (Carolina,
2003).
There are many ways that teachers can approach the subject of problem solving so
that mathematics can become a more enjoyable subject for students. One way is for
students to work in cooperative pairs or groups and also for them to learn how to figure
11
out solutions for themselves. Daniel (2005), notes that students in both Japan and China
typically ended up liking mathematics more due to these methods. Daniel (2005) also
speculated that computer-based instruction might also have an affect on a student’s
overall attitude towards mathematics. It was discovered that computer-based instruction
helped with a student’s self-beliefs about mathematics as long as the students were
working individually. Daniel (2005) noted, however, that there was no statistically
significant data proving whether the computer-based instruction impacted the students’
actual learning (Daniel, 2005).
Anxiety has also been connected to the teaching of mathematics and in shaping
later attitudes concerning mathematics (Stenmark & Hall, 1983). A reason for this is that
teachers tend to use traditional methods of instruction and don’t promote the use of
activities and experiences to learn. This in turn can create students who acquire a math
phobia, or anxiety (Dodd, 1992). Gresham et. al. (1997), tried to implement new teaching
strategies such as cooperative learning groups, journals, use of manipulatives, problem
solving with real-life situations, calculators, and computers. As a result, some students
found all of the new materials and methods to be beneficial and it gave them the
resources and the confidence to problem solve individually at school and at home.
However, implementing the new methods was a process that required deliberate
planning, and many of the students feared working in groups for problem solving until
they learned how to work cooperatively (Gresham et. al., 1997). Also, low-achieving
students were more willing to work on difficult problems and theories (Finley, 1992).
Teacher Attitude

12
A teacher’s attitude towards math can cause students to have negative attitudes
towards learning mathematics and towards mathematics itself (Erskine, 2010). The
quality of the classroom environment can also impact a student’s attitude and beliefs
towards mathematics (Kessel, 2005). Teachers who have a poor view of their students
and their abilities can cause students to have mathematics anxiety and negative attitudes
concerning mathematics (Erskine, 2010). For instance, teachers who believe
mathematics is purely the study of numbers and procedures have a tendency to teach
procedurally more than conceptually. This results is students being unaware of why
certain concepts work in mathematics. Also, teachers who comment that not everyone is
“good” at math are setting their students up to fail because of the Pygmalion effect, which
means higher teacher expectations lead to an increase in student performance. As a result,
there needs to be a change in elementary teachers’ attitudes and dispositions towards
mathematics and its pedagogy so it does not impact students later on in their lives
(Erskine, 2010).
This theory of teacher expectancy goes hand-in-hand with the emotional support
that can cause a student to have positive or negative attitude towards mathematics.
Emotional support is considered to be a students’ perception of trust, warmth, respect,
and communications of empathy and care from the teacher. In instances where students
are working through a tough problem, it is noted that it is beneficial when the student
feels helped and supported (Federici & Skaalvik, 2014). In Federici and Skaavlvik’s
(2014) study, he noted that teachers who appeared to care for their students embodied and
provided both emotional and instrumental support for their students. For struggling
students to benefit from emotional support of a teacher, instrumental support needs to be

13
present as well. If emotional support is the only support present, it can cause more
damage than good to some students (Federici & Skaalvik, 2014). For instance, teachers
who had a high emotional support, but average instrumental support occasionally caused
their students to have lower expectations for themselves. It also caused a negative trend
in their achievement because they felt that the teachers were only being kind and
empathetic towards them because they believed the student couldn’t achieve the work
(Federici & Skaalvik, 2014). For teachers that only showed instrumental support, such as
promoting group work and clarifying and elaborating explanations, students tended to
have less anxiety and more motivation to achieve.
It should be noted that although emotional and instrumental support cause
positive attitudes, there are some instances where it does not. Teachers who use any of
the modifications such as task demands or instrumental and emotional support can be
classified as “ambitious teachers”, which can result in negative attitudinal trends in their
students (Sonnert et. al., 2014). Ambitious teachers are more likely to probe and ask
questions to their students, which may be beneficial to some students, but may trigger
mathematical anxiety instead. Ambitious teachers in Sonnert et. al.’s (2014), were not
seen as the traditional “good” teacher, but instead were seen as an overbearing, strict
teacher. This poses the question of what characteristics constitutes someone being a good
or bad teacher, which goes beyond the scope of the present study.

14
Methods
Participants
The study sample consisted of 136 students in total from both a Pre-Calculus and
Education Psychology course on campus. The first study sample consisted of 99 students
enrolled in a Pre-Calculus course at the University of Maine during the fall semester of
the 2015 academic year. All 99 of the students were 18 years of age or older and the
sample was comprised of first, second, third, and fourth year students.
The Pre-Calculus class used in the participant sample was through the Math Den on
campus, which is a facility that aids students who are taking College Algebra, Pre-
Calculus, and Statistics. The Math Den provides support in a hybrid online format that
utilizes a program called MathLab.
After the intial survey (SURVEY 1) was administered to the 99 students in Pre-
Calculus, a second survey (SURVEY 2) was administered to 48 students who were
enrolled in an educational psychology course at the University of Maine. Again, these 48
students were 18 years of age or older and were in their first, second, third, or fourth year
of college. SURVEY 2 was administered to focus the questions specifically on students’
attitudes and the different instructional practices they experienced.
Mathematics Attitudes Written Survey
SURVEY 1 was distributed among the Pre-Calculus students, and it dealt with
students’ attitudes towards math presently, the way they were taught math before college,
and how they solved certain mathematical problems. The sample was volunteer-based
and students who chose to participate in the survey were allowed to opt out of any of the

15
questions that made them uncomfortable or seemed too difficult to solve. The written
survey was broken into two different sections – a Likert scale survey and open-ended
response questions.
The first part of the survey consisted of twelve items that were rated on a 5-point
Likert scale system with 5 being “Strongly Agree” and 1 being “Strongly Disagree.”
Participants were asked to rate items such as “I like learning math,” and “I worked in
groups to solve math problems.” The participants were asked to do this in hopes of
finding a correlation between their mathematical attitudes and their past experiences with
different instructional practices. At the end of the Likert scale section, there was a box
that asked for students to write additional comments if they wanted to mention anything
the survey did not include.
The second part of the survey consisted of fourteen opened-ended response
questions that either asked them how mathematics made them feel or asked them to solve
certain mathematics problems. Examples of these types of questions included “Does math
make you anxious? Please explain why or why not,” and “Do !! and !
! have the same
answer? Why or why not?” Finally, two questions asked the students if they were given
questions similar to those on the survey while there were in school, that led them to think
deeply about their understanding of a mathematics concept.
SURVEY 2 was given to an educational psychology course, which many
education majors take at the University of Maine, instead of a mathematics course in the
hopes that there would be less bias with current mathematics experiences. It was
conducted with more inclusive questions regarding attitudes towards mathematics and
teacher pedagogy and emotional behaviors. There were 35 items on SURVEY 2 that were

16
rated on a 5-pont Likert scale system with 5 being “Strongly Agree” and 1 being
“Strongly Disagree.” The first twelve items of the second survey mirrored the first twelve
items of the first survey to increase the amount of participants when analyzing the data
later.
Interview
Three students were chosen to be interviewed based on their responses on the
SURVEY 1. Similar to the written survey, the interview centered around students’
attitude towards math, the way they were taught math before college, and the way they
solved math problems. In addition, interviewees were asked questions based on their
responses on the written survey. The interviews lasted between twenty and thirty
minutes. The students selected were allowed to decline the invitation to be interviewed,
and were permitted to stop at any point. Participants who agreed to be interviewed were
offered an hour of one-on-one tutoring for their Pre-Calculus final as long as they
completed the interview. They were allowed to opt out of any questions they did not want
to answer. Sample questions from the interview consisted of questions such as, “I noticed
in your survey that you mentioned that you don’t like learning math. So I was just curious
why you don’t like math?” and “Was there a time you really enjoyed a math class and
why do you think you really enjoyed it?”
Procedure
During the last twenty minutes of a Pre-Calculus class, SURVEY 1 was
distributed among the 99 students in the class. Before they began, it was explained to
them how the survey was volunteer-based and that they had to be 18 years of age or

17
older. Additionally, they were told that participants would be invited to be interviewed to
help with the second part of the study and would be contacted through the University of
Maine email system. The surveys were collected and put in a locked room afterwards to
be analyzed later. Similarly, SURVEY 2 was conducted the same way with the students
filling out the survey during the first 10 minutes of an Educational Psychology class. No
interviews were solicited from this class.
The written responses on SURVEY 1 were used to categorize the participants into
four sections – those who enjoyed mathematics and responded with correct answers on
the given mathematics problems, those who enjoyed mathematics and were unable to
answer the given mathematics problems correctly, those who did not enjoy mathematics,
but were able to answer the given mathematics problems correctly, and those who did not
enjoy mathematics and were unable to answer the mathematics problems correctly. After
categorizing the students into the four groups, based on the open-ended questions and
how they were answered, three students were chosen to be interviewed.
Five students were invited to be interviewed based on their written survey
responses. Three students who responded with a “yes” were asked to come to the Math
Den at a particular day and time to be audio recorded the entire time. They were asked
about their attitude towards math and what may or may not have caused them to like
math. Following those questions, they were asked questions based on their responses on
the written survey. Finally, they were asked to solve mathematics problems and explain
to the interviewer their thought process in what is often referred to as a “think-aloud.”
Initially, these data were going to show how the participants’ achievement level might be
impacted by their attitudes. However, it was later decided to not use those data due to the

18
nature of the study and the proposed hypothesis. Before the interview ended, participants
were asked to add anything they wanted the interviewer to know about their experience
and attitude with mathematics.
After the written survey and the three interviews, the data from the Likert scale
part of they survey was entered into Excel to be used later to analyze for any correlations
from the students’ responses. The audio-recorded interviews were transcribed and later
analyzed, along with the open-ended response questions in the written survey, using a
qualitative software system called Dedoose.
Analysis
The Likert scale items from both surveys were analyzed using SPSS, a
quantitative analysis software system. For the first twelve items of both surveys, a one-
way ANOVA test was administered by gender and year. A one-way ANOVA test was
also used to find a correlation between all twelve of the items to see if there were any
positive or negative trends, which involved a Bivariate Pearson scale. Likewise, the
second survey was analyzed the same way using a one-way ANOVA test for gender,
year, and between all of the items.
Dedoose, a qualitative analysis software system was used for the written items on
SURVEY 1. The first five items on the written section dealt with student’s attitudes and
experiences with mathematics. They were entered into Dedoose and using codes, the
frequency of the words, or the codes created, were depicted within the written responses.
From the frequency of the codes (i.e. emotional and instrumental support, teacher,

19
anxiety) it was possible to see positive and negative trends in students’ attitudes
regarding mathematics.
Results
Results from the one-way ANOVA analysis of correlations are presented in
Tables 1-6 (See Appendix). These include correlations between students’ year in college,
gender, students’ attitudes towards mathematics, and their past mathematical experiences.
Data for the analysis are drawn from SURVEYS 1 and 2. The reason for administering
SURVEY 2 after looking at the results from SURVEY 1 was to include more questions
regarding attitudes and examples of instrumental and emotional support. This was
distributed in order to find stronger correlations between the two inferences – students’
attitudes and instructional strategies and behaviors.
Year in College
The analysis depicts 136 students on questions 1 through 12 from both SURVEY
1 and SURVEY 2. This first analysis was done according to year in college, with the
fourth year eliminated because there were only four participants in that group. The results
showed that first (M=3.68) and third (M=3.47) year students were more inclined to work
in groups to solve math problems than second (M=3.22) year students with a significance
of 0.04. No other results were significant.
Another analysis was done on the SURVEY 2 for questions 1 through 35
completed by 48 students. The analysis excluded years three and four because there were
few students in each of those years and it skewed the data giving misleading results

20
(those results are in the appendix). The results showed that first (M=3.44) year students
believed mathematics to be more boring than second (M=2.67) year students with a
significance of 0.015. Results also showed that first (M=2.67) year students were less
likely to enjoy math than second (M=3.48) year students with a significance of 0.022.
Additionally, the results showed that first (M=3.49) year students practiced exercises
over and over again more than second (M=3..48) year students with a significance of
0.034. No other results were significant.
Gender
The analysis depicts 136 students on questions 1 through 12 from both SURVEY
1 and SURVEY 2. This analysis was done by gender and excluded unknown genders so
the results would not be skewed by unknown genders. The results showed that males
(M=3.14) were more likely to come up with new ways to solve math problems than
females (M=2.66) with a significance of 0.01. No other results were found to be
significant.
Another analysis was done on SURVEY 2 for questions 1 through 35 completed
by 48 students. The results showed that males (M=3.75) generally enjoyed math class
more than females (M=2.84) with a significance of 0.012. Additionally, the results
showed that males (M=2.44) were less nervous when given world problems than females
(M=3.34) with a significance of 0.029. The results also showed that males (M=3.31)
believed that they were born being good at math more than females (M=2.41) with a
significance of 0.006. Lastly, the results showed that males (M=3.88) felt safer asking
questions during math class than females (M=3.19) with a significance of 0.038. No other

21
results were found to be significant.
Attitude and Mathematical Experience Correlations
An analysis was conducted on the first twelve questions on SURVEY 1 and
SURVEY 2 to see if there was a correlation between students’ attitudes towards
mathematics and their past mathematical experiences. There were a total of 136
participants, which excluded the unknown genders and the fourth year participants. The
participants indicated their level of agreement with each item using a Likert-type scale
ranging from 1 (strongly disagree) to 5 (strongly agree).
Although many correlations were found among the different questions that may
be considered interesting and worthy of future inquiry, only a few of the questions were
pertinent to the focused research questions of this study. See the discussion and the
appendix for information on the other correlations.
Question 1 (M=3.93) correlated with Question 9 (M=3.875) with a Pearson
correlation of 0.196 and a significance of 0.022. It showed that students who believed
they could succeed in mathematics generally had teachers who would give them
problems to figure out for themselves. Question 1 also correlated with Question 11
(M=3.838) with a Pearson correlation of 0.184 and a significance of 0.032. This depicted
that students who believed they could succeed in mathematics had teachers who asked
them to explain their reasoning behind their answers.
Question 3 (M=2.95) correlated with Question 12 (M=3.51) with a Pearson
correlation of 0.211 and a significance of 0.014. This depicted that students who found
math to be boring had more experience working in groups with math, which according to

22
other research seems to be inconsistent since working in groups is supposed to impact a
student’s attitude positively.
Students who liked to come up with new ways to solve mathematics problems
(Question 5) had teachers who were interested in their work even if it was wrong
(Question 10) and had teachers ask them their reasoning behind their answers (Question
11). Question 5 (M=2.86) and Question 10 (M=3.50) had a Pearson correlation of 0.184
and a significance of 0.032, while Question 5 and Question 11 (M=3.84) had a Pearson
correlation of 0.171 and a significance of 0.046.
No other significant correlations were found in this study concerning questions 1-
12. However, it is important to note that the use of technology seemed to not have any
significance on the students’ attitudes towards mathematics either positively or
negatively.
A similar second analysis was conducted on 35 questions from SURVEY 2 to see
if there was a correlation between students’ attitudes towards mathematics and their past
mathematical experiences. There were a total of 48 participants. The participants
indicated their agreement with each item using a Likert-type scale ranging from 1
(Strongly Disagree) to 5 (Strongly Agree).
Table 6 in the Appendix shows that there is a correlation between students’
positive attitudes towards mathematics and what is considered to be “good” pedagogical
practices from teachers (Spielberger, 1979). For instance, students who enjoyed
mathematics class (M=3.15) had a positive correlation with many different pedagogical
strategies that depicted emotional and instrumental support from the teachers. One
example of such support is having a teacher that always had a positive attitude about

23
math. It is important to note that students who generally had positive attitudes towards
math were negatively correlated with questions concerning anxiety. For instance,
Question 13 (M=3.15) and Question 34 (M=3.77) had a Pearson correlation of -0.608. No
other results were found to be significant.
Written Surveys and Interviews
A qualitative analysis was done on the written responses from SURVEY 1 and the
interviews using theme based codes (i.e. teacher, anxiety, tests, instrumental support,
emotional support, positive attitudes, and negative attitudes) on Dedoose, which can be
found in Table 7 and Figure 1.1 in the appendix. Questions 1 through 5 were used for the
analysis because those questions dealt with students’ attitudes and their opinions on their
past mathematical experiences.
Through the analysis, it was illustrated that students who tended to have positive
attitudes towards mathematics had positive mathematical experiences attributed to the
teacher. The participants described their teachers as embodying the characteristics of
emotional and/or instrumental support. Such characteristics include: positive attitudes,
helpfulness, and different instructional strategies including promoting group work.
Likewise, students who mostly had negative attitudes towards math experienced classes
with teachers lacking these characteristics. It is also important to note that while the
majority of students who had mathematics anxiety generally displayed negative attitudes
towards mathematics, anxiety was seen in a few students who mostly had positive or
neutral attitudes towards mathematics. One of the main causes of the anxiety was tests
and grades. No other results were found to be significant to the study.

24
Discussion
This study was conducted to investigate whether a correlation exists between
students’ attitudes towards mathematics and teacher pedagogy. Through the use of both a
quantitative and qualitative analysis, results demonstrate that teacher pedagogy impacts
students’ beliefs and attitudes concerning mathematics.
There are two dimensions to teacher pedagogy that have been discussed in this
research – emotional and instrumental support. Emotional support is characterized by an
individual’s perception of a mathematics teacher as being warm, friendly, caring, and
empathic (Katz & Gueta, 2010). Instrumental support is characterized by an individual’s
perception of a mathematics teacher’s instruction and whether they consider the teacher
to be helpful and if the teacher provides guidance when needed (Spielberger, 1979).
The first twelve questions of both SURVEY 1 and SURVEY 2 depicted that
teachers had impacted students’ attitudes towards mathematics either through emotional
or instrumental support. Students who believed that they could succeed and were
confident in their abilities to achieve in mathematics were more likely to experience
instrumental support. They were given support in order to problem solve and truly
understand why their solutions were accurate. By being given the tools necessary to
achieve success in mathematics, the participants acquired a positive attitude towards
mathematics. Additionally, students who were more likely to come up with new ways to
solve mathematics problems were more likely to have teachers who were interested in
their work and their reasoning behind their solution. The teacher’s instrumental support
most likely contributed to this, but the teacher’s emotional support probably did as well.

25
Although it cannot be determined for certain, the teacher may have been caring and
curious about how a student acquired an answer, and instead of immediately telling the
student s/he is wrong, the teacher tried to understand the student’s work. This promotes a
positive atmosphere so that students do not become anxious and worried about getting
wrong answers during mathematics classes. If a class is facilitated in this manner, the
students likely will feel comfortable and attribute positive attitudes towards mathematics
to the teacher.
Another example of instrumental support is allowing students to work in groups
together. However, surprisingly, it was depicted that students who found mathematics to
be boring were more likely to work in groups during class. Interestingly, one of the
students who was interviewed discussed working in groups.
V: Were you able to work with people in groups in order to complete those sheets
or did you have to work on it yourself?
J: Sometimes you were allowed to work with others. I usually did not. But that
was more of a personal choice.
V: Okay. So you like working by yourself instead of with other people. Is that
more beneficial to you or?
J: Sometimes. It was also because I usually was smarter than a lot of my peers so I
didn’t just want to give away the answers for some of it.
From this interview, it could be said that students did not find group work to be
beneficial because developmentally they may not have been capable of working in groups
in a manner where everyone contributed to figuring out the solutions together. Also, it
appears there had been a lack of communication and support from the teacher. This

26
participant should not associate working in groups with giving answers to his/her peers.
The teacher could have provided suitable support to show that working in groups could
be used as a tool in order to use everyone’s strengths to figure out solutions to problems.
However, the student being interviewed could have been given practice exercises instead
of problem solving questions, which in turn may have caused the participant to give
answers to him/her peers.
Within the first survey, no other correlations were applicable to the particular
study’s question. However, participants who had positive attitudes generally had positive
attitudes throughout the survey. Likewise, participants with mostly negative attitudes had
correlations with other negative attitudes. It is not unusual for students to have consistent
attitudes towards mathematics, but it is unusual that there doesn’t seem to be any impact
as to why that is the case. In some instances emotional support had a positive impact on
the students’ attitudes towards mathematics, while other times it had a negative affect.
Likewise, students who had good instrumental support, like figuring out problems
together in groups and having teachers who were interested in their reasoning, show
instrumental support throughout their mathematical experience. Participants who had
indicated that they mostly learned from copying down notes from the board did not
experience any other type of instrumental support. This was consistent with the second
survey as well. Students who experienced lecture type classes were also taught
mathematics more formulaically than conceptually. This shows that participants were
taught instrumentally (formulaically) more than relationally (conceptually), which is a
type of teaching strategy (Skemp, 2006). The instrumental teaching strategy that Skemp
(2006) discusses is different from instrumental support. Teachers who want to teach

27
mathematics formulaically and do not delve into understanding how something works use
instrumental teaching. Instrumental support, however, is different from instrumental
teaching because teachers who exhibit instrumental support guide students into higher
thinking and do not teach only through lecture.
Although some participants didn’t acquire negative attitudes because they were
taught instrumentally, it’s important to note that many of the participants had been taught
in that manner. Many teachers choose to teach instrumentally for a variety of reasons. For
instance, instrumental mathematics is easier for students to understand, the rewards are
immediate, and a student is able to get an answer quicker because less higher thinking is
involved (Skemp, 2006). Relational teaching also has benefits, but many teachers choose
not to use this method because it takes more time (Skemp, 2006). However, once a
student understands a concept presented to them relationally, they are able to remember it
far longer than they would if they were taught instrumentally (Skemp, 2006). One
participant who was interviewed had said, “I wish I would have learned in different ways
because sometimes I would have to look it up on the Internet and I just felt like taking
notes straight off the board wasn’t enough for me.” The participant is accurate in their
assessment. If they had been taught relationally instead, they may have learned and
understood the material better.
Some students in the written survey attributed their negative experiences with
mathematics with not understanding the material fully, which hints at the possibility that
they may have been taught instrumentally. When asked if they have had a bad experience
with mathematics, one participant wrote, “Yes, when the topic was poorly explained and
I didn’t understand it.” Otherwise, the student wrote about positive experiences where the

28
teacher provided both instrumental support through relational learning and emotional
support. This was also illustrated in their Likert scale responses.
A second survey was conducted and given to another set of participants. The
second survey included more concise questions specifically relating to both positive and
negative mathematical attitudes such as anxiety and different pedagogical practices.
Participants who had positive experiences with mathematics such as having
teachers care about their answers, being able to work in groups, and being in a classroom
that allowed them to be comfortable to ask questions, caused them to have positive
attitudes towards mathematics. They tended to have higher self-efficacy beliefs and had
more favorable attitudes towards mathematics. Additionally, they did not exhibit traits of
anxiety in general or even with word problems. The same can be said about students who
had negative attitudes towards mathematics. They did not have much differential teaching
and had more anxiety. The trends that were seen for both groups were expected from the
posed question for the study.
According to (Federici & Skaalvik, 2014), emotional and instrumental support are
strongly correlated. Although this correlation was not the focus on the present study, with
the written responses on the first survey, it is valuable to note that whenever students
perceived a teacher as being instrumentally supportive, more than likely the teacher also
exhibited characteristics of emotional support. This correlation was stronger when
negative attitudes were present. Students who experienced “bad” math teachers
considered them to be “bad” because of lack of emotional and instrumental support. In
turn, their primary experiences with mathematics were negative, causing them to have
negative attitudes towards mathematics as seen in their written words. This may be the

29
case because when students notice that a teacher’s instruction and helpfulness is poor,
they may also start to believe that their attitude is seen as uncaring and not empathetic. In
some instances, students who perceive a teacher as having less than ideal instrumental
support often view the lack of emotional support as a teacher having low expectations
and may exhibit a lack of effort when teaching (Skaalvik, E. M. & Skaalvik, S., 2013).
This was depicted during one participant’s interview when they were asked about a bad
math experience.
V: Can you explain your worst experience with a math class and why that
was?
F: I think it was my freshman year. I didn’t like the teacher much and for
me it’s best for me to learn if I like the teacher and if I don’t like the teacher right off the
vat then it’s just going to be a bad class for me even if I try to ask for help. I just will get
this divide from the teacher that I don’t want to be there and I just have a bad feeling with
them. It’s just a bad experience.
However, it should be noted that this was only one experience that the participant
had. S/he also explained how s/he had many teachers who took the time to explain
concepts and used various methods such as manipulatives to teach resulting in him/her
having positive attitudes towards mathematics. Perhaps, if his/her experience had mainly
been similar to the one she described above, s/he may have had negative attitudes instead.
Interestingly enough, one of the main causes of why students have negative
attitudes with mathematics was not from teacher pedagogy, but from anxiety caused by
either tests or grades. Students who claimed to have positive attitudes said they were

30
often anxious with mathematics because of tests. One student wrote, “I have always
enjoyed math. Tests make me anxious, but that is common through all of my classes.” A
possible reason for this may be because the written survey was given to pre-calculus
students at the University of Maine, which may be considered a remedial course since
many students have taken pre-calculus previously. Due to it being a remedial course, it
impacts the student’s mathematical achievement greatly, which in turn affects the
student’s attitude and anxiety level (Green, 1990). This was not depicted too much within
the study, but some students were unable to do basic computations with fractions.
The nature of the study does not focus on gender or year, but some important
findings concerning gender arose within the study. First year students were more likely to
practice exercises over and over again and attributed mathematics to being boring.
Although it is not certain, this could perhaps be a result of the push on standardized
testing and testing in general in schools. There is a need to practice exercises over and
over in the classrooms to assure that students will pass, but as a result, it may be causing
students to like mathematics less.
The biggest difference between males and females in the study was that males
tended to have more positive attitudes with mathematics and higher self-beliefs than
females. Males believed that they were born being good at math more than females did.
There is a stigma around mathematics and that males have higher achievement than
females do. For females that truly believe this, they may end up having lower self-
esteem, more anxiety, and as a result negative attitudes towards mathematics. It was
shown in the second survey that females were more likely to have anxiety towards
mathematics, but it was not a significant finding.

31
Other studies (Daniel, 2005; Hannafin & Scott, 2001), mention how technology,
such as computers, can be used to help students and can cause students to have better
positive attitudes towards mathematics. In my study, technology hardly had any
correlations with the questions in either the first or the second survey. However, there
was one correlation dealing with technology that was present in the second survey.
Students who worked in groups also thought that technology had helped them learn
mathematics. This is interesting because earlier in the same survey, another question,
question 7, parallels question 22, which was correlated with technology, but question 7
does not have any significant correlation with it. Thus, the statement, “Technology
helped me to learn math”, appears to be unreliable in this study, and nothing can be said
about it. However, for future studies, it may be important to note that having specific
questions regarding technology may be more valuable instead of having one broad
question concerning it. This study’s focus was not on technology though, and the
question was placed on the survey as a possible teaching strategy used to support students
through instrumental support.
Limitations
There were a few limitations involved with the study that are important to note.
The surveys were all given to college students who were at least 18 years or older. They
were asked to remember their mathematics experiences before college, which included
elementary education. The first survey was given to a Pre-Calculus course, which may
have influenced their answers. Many discussed their current experiences with
mathematics instead of discussing their prior experiences, which resulted in more

32
participants saying favorable things about the course and its instruction. Similarly,
although the second survey was given to students who were not in a mathematics course,
many had previously taken a mathematics course in college or were currently enrolled in
one. This too could have caused students to draw on their current experiences rather their
past experiences. This could have further become a problem because in the surveys they
needed to indicate both their current attitudes towards mathematics and also their past
experiences. Although this was stated in both the directions and out loud to them before
they filled out the surveys, students may have forgotten and either filled the survey out to
reflect their current mathematics experiences or to reflect their past mathematics
attitudes.
Additionally, the majority of the participants from both surveys had been female
(78 out 136), while the minority had been male. This could cause the data to depict
common themes that are found in gender differences concerning mathematics. Females
are more likely to exhibit anxiety over testing situations, which can interfere with their
working memory, and their overall attitude with mathematics (Goolsby, 1988). This
would contribute to the common theme of test anxiety seen throughout the written
surveys. Females are also more likely to exhibit negative attitudes towards mathematics
in general because of the stigma that females are not capable of doing mathematics as
well as males (Leder et. al., 2014).
Another limitation is that all of the information is acquired from the students, but
none of the data is observed firsthand. Some of the data among the students contradicts
itself because many students on the Likert scale section of the surveys considered
themselves to have overall positive attitudes towards mathematics. However, on the

33
written section of the first survey and during the interviews, many students discuss
negative experiences and negative attitudes associated with it more than their positive
experiences. This may have been caused by confusion on how to answer the Likert scaled
questions or the participants may have felt more comfortable divulging their negative
experiences with written or spoken words instead.
There were also questions on the written survey and during the interview that
were originally intended to be beneficial to the study. However, upon further reflection as
the study continued, it was apparent that many of the questions were unnecessary for this
particular study. Some of the questions dealt with students’ achievement and whether the
students thought conceptually or procedurally. Although this can be a sign that students
may have been taught with proper instrumental support, it does not coincide with the true
nature of the study. The main focus is to see if there is a relationship between emotional
and instrumental support and students’ current mathematical attitudes. For this reason,
questions were omitted from the results section because they were not pertinent.
Conclusion
The results of this study show that students’ attitudes towards mathematics can be
impacted by both emotional and instrumental support from teachers. However, students
who generally had positive attitudes remembered negative experiences invoked by lack
of emotional support from teachers more than the instrumental support that may have
been provided by them. It was also shown that one of the highest contributing factors of a
teachers’ negative attitude was caused by anxiety from tests or the content area such as
algebra.

34
For future iterations of this study, it would be valuable to survey students who are
currently in elementary, middle, and high school. By surveying all three of these grade
levels, it could be possible to detect when students begin to acquire negative attitudes
towards mathematics. It also would be important to observe firsthand the characteristics
the teachers exhibit and whether emotional and instrumental support impacts students’
attitudes. It is also important to do this with a wide range of students who are equally
male and female. The questions would be more closely related to emotional and
instrumental support and common mathematical attitudes. A Likert scale survey and
written responses could be used, but more data could be obtained from the observations
as well. Lastly, future studies that delve more into gender bias, technology, and the
effects of group-work would be interesting to explore based on preliminary results from
this study.

35
Works Cited
Belbase, S. (2011). Images, anxieties and attitudes toward mathematics. Proceedings of the 33rd Annual Meeting of the North American Chapter of the International Group for the Psychology of Mathematics Education, 1934–1935.
Carolina, N. (2003). Instructional strategies for mathematics teachers. Exit Exam, 2002.
Cemen, P. B. (1987). The nature of mathematics anxiety. ERIC Document, 287 729. Retrieved from http://www.eric.ed.gov/ERICWebPortal/detail?accno=ED287729
Cleary, T. J., & Chen, P. P. (2009). Self-regulation, motivation and math achievement in middle school: Variations across grade level and math context. Journal of School Psychology, 47, 291–314.
Daniel, J. (2005). Motivational qualities of instructional strategies and computer use for mathematics teaching in japan and the United States: Results from the TIMSS 1999 assessment. International Journal of Instructional Media, 32, 89–104.
Dodd, A. (1992). Insights from a math phobic. Mathematics Teacher, 85, 296-298.
Ernest, P. (2004). Images of mathematics, values and gender: A philosophical perspective. Mathematics Education: Exploring the Culture of Learning.
Erskine, B. M. (2010). Raising mathematical achievement starts with the elementary teacher recommendation to improve content and pedagogical.
Federici, R. A., & Skaalvik, E. M. (2014). Students’ perceptions of emotional and instrumental teacher support: Relations with motivational and emotional responses. International Education Studies, 7, 21–36.
Finley, K.W. (1992). Calculators add up to math magic in the classroom. Calculators in Mathematics Education, 195-199.
Goolsby, C.B. (1988). Factors affecting mathematics achievement in high-risk college students. Research and Teaching in Developmental Education, 4, 18-27.
Green, L.T. 1990. Test anxiety, mathematics anxiety and teacher comments: relationship to achievement in remedial mathematics classes. The Journal of Negro Education, 59 , 320–335.
Gresham, G., Ed, S., Sloan, T., Vinson, B., & Ph, D. (1997). Reducing mathematics anxiety in fourth grade “at-risk ” students.
Hachey, A. C. (2009). I hate math.

36
Hannafin, R.D., & Scott, B.N. (2001). Teaching and learning with dynamic geometry programs in student-centered learning environments: A mixed method inquiry. Computers in the Schools, 17, 121-141.
Hannula, M.S. (2002). Attitude towards mathematics: emotions, expectations, and values. Educational Studies in Mathematics, 49, 25-46.
Hembree, R. (1990). The nature, effects, and relief of mathematics anxiety. Journal for Research in Mathematics Education, 21, 33–46.
Daniel, J. (2005). Motivational qualities of instructional strategies and computer use for mathematics teaching in japan and the United States: results from the TIMSS 1999 assessment. International Journal of Instructional Media, 32, 89–104.
Karjanto, N., & Yong, S. T. (2016). Test anxiety in mathematics among early undergraduate students in a British university. http://dx.doi.org/10.1080/03043797.2012.742867
Katz, I., Kaplan, A., & Gueta, G. (2010). Students' needs, teachers' support, and motivation for doing homework: A cross-sectionalsStudy. Journal of Experimental Education, 78 246-267. http://dx.doi.org/10.1080/00220970903292868
Kessel, C. (2005). Mathematics: content and pedagogy.
Leder, G. C., Forgasz, H., & Jackson, G. (2014). Mathematics, English and Gender Issues: Do Teachers Count? AJTE Australian Journal of Teacher Education, 39(9). doi:10.14221/ajte.2014v39n9.3
Ma, X., & Kishor, N. (1997). Assessing the relationship between attitude towards mathematics and achievement in mathematics: A meta-analysis. Journal for Research in Mathematics Education, 28(1), 26-47.
Malecki, C. K., & Demaray, M. K. (2003). What type of support do they need? Investigating student adjustment as related to emotional, informational, appraisal, and instrumental support. School Psychology Quarterly, 18(3), 231-252. http://dx.doi.org/10.1521/scpq.18.3.231.22576
Mancil, G. R., & Maynard, K. L. (2007). Mathematics instruction and behavior problems: Making the connection. Beyond Behavior, 24–29.
McLeod, D. B. (1992). Research on affect in mathematics education: A reconceptualization. Handbook of research on mathematics teaching and learning, 575-596.
Medoff, Lisa. (1999). I hate math! I couldn’t learn it, and I can't teach it!. Childhood Education, 75(4), 225–230. http://doi.org/10.1080/00094056.1999.10522022

37
Middleton, J. a, & Spanias, P. (1999). Motivation for achievement in mathematics : findings, generalizations, and criticisms of the research. Journal for Research in Mathematics Education, 30(1), 65–88. http://doi.org/10.2307/749630
Miller, H., & Bichsel, J. (2004). Anxiety, working memory, gender, and math performance. Personality and Individual Differences, 37, 591-606.
Mumcu, Y., & Aktas, C. (2015). Multi-program high school students ’ attitudes and self-efficacy perceptions toward mathematics. 59, 207–226.
Richardson, F. C, & Suinn, R. M. (1972). The mathematics anxiety rating scale: psychometric data. Journal of Counseling Psychology, 79, 551-554.
Ruffell, M., Mason, J., Allen, B. (1998). Studying attitude to mathematics. Educational Studies in Mathematics, 35, 1-18.
Sam, L.C. (1999). Public images of mathematics.
Skaalvik, E. M., & Skaalvik, S. (2013). School goal structure: Associations with students' perceptions of their teachers as emotionally supportive, academic self-concept, instrinsic motivation, effort, and help seeking behavior. International Journal of Educational Research, 61, 5-14. http://dx.doi.org/10.1016/j.ijer.2013.03.007
Skemp, Richard R. (2006). Instrumental and relational understanding. 12(2), 88–95.
Sonnert, G., Sadler, P. M., Sadler, S. M., & Bressoud, D. M. (2014). The impact of instructor pedagogy on college calculus students’ attitude toward mathematics. International Journal of Mathematical Education in Science and Technology, 46(3), 370–387. http://doi.org/10.1080/0020739X.2014.979898
Spielberger, C. D. (1979). Understanding stress and anxiety.
Stenmark, J. & Hall, R. (1983). Anxiety disorder and phobias.
Sterenberg, G. (2008). Investigating teachers’ images of mathematics. Journal of Mathematics Teacher Education, 11, 89-105.
Swetz, F.J., Langgulung, H., & Johar, A.R. (1983). Attitudes towards mathematics and school learning in Malaysia and Indonesia: Urban-rural and male-female dichotomy. Comparative Education Review, 27(3), 394-402.
Yackel, E., & Cobb, P. (1996). National Council of Teachers of Mathematics. Journal for Research in Mathematics Education, 27(4), 458–477.
Zan, R., Martino, P. Di, & Matematica, D. (2007). Attitude toward mathematic : overcoming the positive/negative dichotomy. Tmme, Monograaph, 157–168.

38
Retrieved from http://www.math.umt.edu/tmme/monograph3/Zan_Monograph3_pp.157_168.pdf

39
Appendix A

40
Approval of IRB addendum for the second survey:

41
Appendix B
SURVEY CONSENT FORM You are invited to participate in a research project being conducted by Victoria Calabrese, an undergraduate student in the College of Education and Human Development at the University of Maine and her Honors thesis advisor, Eric Pandiscio, from the College of Education and Human Development. The purpose of the research is to determine how students were taught mathematics before college and the attitudes they now display towards mathematics. You must be at least 18 years of age to participate. What Will You Be Asked to Do? If you decide to participate, you will be asked to complete a written survey exploring your attitude about mathematics and how you were taught mathematics before college. Additionally, the survey includes short-answer mathematics problems. This survey will take you about 15 minutes to complete. Some students may be contacted to participate in a follow up interview. The interview will be voluntary. Risks
Except for your time and inconvenience, there are no risks to you from participating in this study.
Benefits -You may learn how your attitude about math has been affected by the teaching style you have experienced before college.
- This project will contribute to the body of educational research on student learning by investigating the link between attitudes towards mathematics and early instruction in mathematics.
Confidentiality Your name will remain on the survey in order to contact you to participate in a follow up interview. Surveys will be kept in the investigator’s locked office and only Victoria Calabrese and Eric Pandiscio will look at the surveys. Your instructor, Todd Zoroya will NOT have access to your responses. The data from the survey will be entered into a password-protected computer and kept until June 30, 2016. Your name or other identifying information will not be reported in any publications. The paper surveys with your name will be destroyed by March 31, 2016. Voluntary Participation is voluntary. If you choose to take part in this study, you may stop at any time and/or skip any questions. Contact Information If you have any questions about this study, please contact me at [email protected]. You may also reach the faculty advisor on this study at [email protected]. If you have any questions about your rights as a research participant, please contact Gayle Jones, Assistant to the University of Maine’s

42
Protection of Human Subjects Review Board, at 581-1498 (or e-mail [email protected]).
MATH ATTITUDE SURVEY
NAME:
Freshman Sophomore Junior Senior
Below are a number of statements regarding attitudes in math and the way you were taught. Pease read each one carefully and indicate to what extent you agree or disagree.
Attitude About Math
Strongly
Disagree
Disagree
Neutral Agree Strongly
Agree
1. I believe that I can succeed in math. 1 2 3 4 5
2. I like learning math. 1 2 3 4 5 3. Math is boring. 1 2 3 4 5 4. Math is important throughout my life. 1 2 3 4 5
Problem Solving in Math 5. I like to come up with new ways to solve math problems. 1 2 3 4 5
6. I believe there is usually only one right way to solve math problems. 1 2 3 4 5
How You Were Taught in Grade School
7. Technology helped me to understand math. 1 2 3 4 5
8. We only copied down notes from the board. 1 2 3 4 5
9. My teacher introduced math problems to us that we had to figure out the solution to.
1 2 3 4 5
10. My teacher was interested in my work even if it was wrong. 1 2 3 4 5
11. My teacher asked me to explain how I got my answers to math 1 2 3 4 5

43
problems. 12. I worked in groups to solve math problems. 1 2 3 4 5
Additional Comments:
SHORT ANSWERS:
1. Was there ever a time when you did not enjoy a math class? If so, what were the reasons for this?
2. Was there ever a time when you did enjoy a math class? If so, what led to this enjoyment?
3. Does math make you anxious? Please explain why or why not.

44
4. What confuses you in math? Give an example.
5. What is easy for you in math? Give an example.
6. Order from greatest to least. How did you know the order?
!!
, !!, 0.5, 0.7
7. Solve for x. Please show any relevant work. 2x + 4 = 12 + 4x
8. Solve.
45
a). !! +
!! =
b).
!!× !
!=
c).
!!− 1 =
d).
!!÷ !
! =
9. Do !! and
!! have the same answer? Why or why not?
10. Multiply 645x786. Show your work and explain.
11. If you wanted to order fractions from least to greatest, how would you determine the order without turning the fractions into decimals?

46
12. Multiply 12x18 mentally (without paper or pencil). Explain how you would multiple the two numbers mentally.
13. Was it a common occurrence for you to be given questions like those above while you were in grade school?
14. Do you think similar questions would have been beneficial to you in order to get a clearer understanding of mathematics? Why or why not?

47
INDIVIDUAL INTERVIEW CONSENT FORM You are invited to participate in a research project being conducted by Victoria Calabrese, an undergraduate student in the College of Education and Human Development at the University of Maine and her honors thesis advisor, Eric Pandiscio, from the College of Education and Human Development. The purpose of the research is to determine how students were taught mathematics before college. You must be at least 18 years of age to participate. What Will You Be Asked to Do? If you decide to participate, you will be interviewed individually to discuss your responses from the survey you completed a few weeks ago. You will be voice recorded during the interview session. The interview will take anywhere from 30 minutes to 1 hour to complete. Some example questions might include telling about your experience with math, how math makes you feel, and multiplying 255 by 350. Risks
- Except for your time and inconvenience, there are no risks to you from participating in this study.
Benefits
- You may learn how your attitude about math has been affected by the teaching style you have experienced before college.
- This project will contribute to the body of educational research on student learning by investigating the link between attitudes towards mathematics and early instruction in mathematics.
Compensation
- You will receive one hour of one-on-one tutoring for your next test if the interview is completed.
Confidentiality
Your name will not be linked to any of the interviews. Voice recordings will be kept in the investigator’s locked office and only Victoria Calabrese and Eric Pandiscio will be the ones listening to the voice recordings. Your instructor, Todd Zoroya, will NOT have access to students’ responses. All voice recording from the interviews will be destroyed by March 31, 2016. Recordings will be transcribed and transcriptions with be kept on a password protected computer. Transcriptions will be destroyed by June 30, 2016.
Voluntary

48
Participation is voluntary and you may skip any questions. If you choose to take part in this study, you may stop at any time. If you withdraw or do not complete the interview you will be ineligible for the one-on-one tutoring. Contact Information If you have any questions about this study, please contact me at [email protected]. You may also reach the faculty advisor on this study at [email protected]. If you have any questions about your rights as a research participant, please contact Gayle Jones, Assistant to the University of Maine’s Protection of Human Subjects Review Board, at 581-1498 (or e-mail [email protected]).

49
SURVEY CONSENT FORM You are invited to participate in a research project being conducted by Victoria Calabrese, an undergraduate student in the College of Education and Human Development at the University of Maine and her Honors thesis advisor, Eric Pandiscio, from the College of Education and Human Development. The purpose of the research is to determine how students were taught mathematics before college and the attitudes they now display towards mathematics. You must be at least 18 years of age to participate. What Will You Be Asked to Do? If you decide to participate, you will be asked to complete an anonymous survey exploring your attitude about mathematics and how you were taught mathematics before college. This survey will take you about 10 minutes to complete. Risks
Except for your time and inconvenience, there are no risks to you from participating in this study.
Benefits -You may learn how your attitude about math has been affected by the teaching style you have experienced before college.
- This project will contribute to the body of educational research on student learning by investigating the link between attitudes towards mathematics and early instruction in mathematics.
Confidentiality The survey is anonymous; do not write your name on the survey. Surveys will be kept in the investigator’s locked office and only Victoria Calabrese and Eric Pandiscio will look at the surveys. Your instructor will NOT have access to your responses. The data from the survey will be entered into a password-protected computer and kept until June 30, 2016. The paper surveys with will be destroyed by April 30, 2016. Voluntary Participation is voluntary. If you choose to take part in this study, you may stop at any time and/or skip any questions. Contact Information If you have any questions about this study, please contact me at [email protected]. You may also reach the faculty advisor on this study at [email protected]. If you have any questions about your rights as a research participant, please contact Gayle Jones, Assistant to the University of Maine’s Protection of Human Subjects Review Board, at 581-1498 (or e-mail [email protected]).

50
MATH ATTITUDE SURVEY Preferred Gender:
Female Male Year:
Freshman Sophomore Junior Senior Have many math courses have you taken while in college?
0 1 2 3 or More Are you currently taking any math courses?
Yes No
Directions: Below are a number of statements regarding your attitudes in math and the way you were taught math before college. Pease read each one carefully and indicate to what extent you agree or disagree. Please note that the statements regarding your attitudes are your attitudes towards math NOW, while the statements about your experiences are from your experiences with math BEFORE college.
Statement
Strongly Disagree
Disagree
Neutral Agree Strongly
Agree
1. I believe that I can succeed in math. 1 2 3 4 5
2. I like learning math. 1 2 3 4 5 3. Math is boring. 1 2 3 4 5 4. Math is important
throughout my life. 1 2 3 4 5
5. I like to come up with new ways to solve math problems.
1 2 3 4 5
6. I believe there is usually only one right way to solve math problems.
1 2 3 4 5
7. Technology helped me to understand math. 1 2 3 4 5
8. We only copied down notes from the board. 1 2 3 4 5

51
9. My teacher introduced math problems to us that we had to figure out the solution to.
1 2 3 4 5
10. My teacher was interested in my work even if it was wrong.
1 2 3 4 5
11. My teacher asked me to explain how I got my answers to math problems.
1 2 3 4 5
12. I worked in groups to solve math problems. 1 2 3 4 5
13. I enjoyed math class. 1 2 3 4 5 14. Math is easy for me. 1 2 3 4 5 15. I was told it was okay to
ask questions during class. 1 2 3 4 5
16. I listened and paid attention during math class.
1 2 3 4 5
17. I understood what was taught during class, but then forgot how to do it when I got home.
1 2 3 4 5
18. I have had a bad experience with math because of a teacher.
1 2 3 4 5
19. Word problems make me nervous. 1 2 3 4 5
20. My teacher made me practice exercises over and over again.
1 2 3 4 5
21. My teacher was more concerned with how I got the answer than if the answer was correct.
1 2 3 4 5
22. I worked in groups to try and solve math problems.
1 2 3 4 5
23. My math experience was more formulaic than problem solving.
1 2 3 4 5
24. I was taught one way to 1 2 3 4 5

52
solve a math problem. 25. If I didn’t understand
something, my teacher taught the process again and didn’t explain the reasoning behind it.
1 2 3 4 5
26. I was actively involved when learning math.
1 2 3 4 5
27. My math teacher always had a positive attitude towards math.
1 2 3 4 5
28. When the teacher called on me during math class, I was anxious.
1 2 3 4 5
29. I dislike math. 1 2 3 4 5 30. I believe that people are
born being good at math. 1 2 3 4 5
31. Math isn’t really useful outside of school.
1 2 3 4 5
32. I don’t understand math. 1 2 3 4 5 33. I felt safe asking questions
during math class. 1 2 3 4 5
34. I felt respected during math class.
1 2 3 4 5
35. Math gives me anxiety. 1 2 3 4 5

53
List of Tables and Figures
Table 1. Descriptive Statistics Among Year in College on Survey One
Year
Mean
Standard Deviation Q1 Year 1
Year 2 Year 3 Total
3.919 3,956 3.941 3.934
.698
.878 1.345 .854
Q2 Year 1 Year 2 Year 3 Total
3.196 3.289 3.529 3.268
1.016 1.100 1.463 1.104
Q3 Year 1 Year 2 Year 3 Total
3.008 2.844 2.647 2.952
1.018 .952 1.222 1.029
Q4 Year 1 Year 2 Year 3 Total
3.703 2.578 3.471 3.632
1.155 1.011 1.125 1.101
Q5 Year 1 Year 2 Year 3 Total
2.926 2.822 1.706 2.864
1.019 1.051 1.359 1.071
Q6 Year 1 Year 2 Year 3 Total
2.297 2.133 2.118 2.221
.872 1.217 1.054 1.016
Q7 Year 1 Year 2
3.203 3.578
1.271 .941

54
Year 3 Total
3.412 3.353
1.064 1.152
Q8 Year 1 Year 2 Year 3
Total
2.905 2.711 2.588 2.801
1.100 1.014 1.064 1.067

55
Table 1. (Continued)
Year
Mean
Standard Deviation Q9 Year 1
Year 2 Year 3 Total
3.865 4.000 3.588 3.875
.881
.707 1.228 .881
Q10 Year 1 Year 2 Year 3 Total
3.459 3.378 3.412 3.493
.982
.812 1.004 .927
Q11 Year 1 Year 2 Year 3 Total
3.838 3.889 3.706 3.838
.811
.775 1.047 .828
Q12 Year 1 Year 2 Year 3 Total
3.689 3.222 3.471 3.507
.843 1.064 1.179 .981

56
Table 2. Descriptive Statistics Among Gender on Survey One
Year
Mean
Standard Deviation Q1 Female
Male Total
3.897 3.983 3.934
.783
.946
.854
Q2 Female Male Total
3.160 3.414 3.268
1.083 1.124 1.104
Q3 Female Male Total
3.032 2.845 2.952
1.058 .988 1.029
Q4 Female Male Total
3.526 3.776 3.632
1.066 1.140 1.101
Q5 Female Male Total
2.660 3.138 2.864
1.071 1.017 1.071
Q6 Female Male Total
2.167 2.293 2.221
.999 1.043 1.016
Q7 Female
Male Total
3.423 3.259 3.353
1.134 1.178 1.152
Q8 Female Male Total
2.756 2.862 2.801
1.059 1.083 1.067

57
Table 2. (Continued)
Year
Mean
Standard Deviation Q9 Female
Male Total
3.833 3.931 3.875
.710 1.074 .8881
Q10 Female Male Total
3.538 3.431 3.493
.785 1.094 .927
Q11 Female Male Total
3.769 3.931 3.838
.772
.896
.828
Q12 Female Male Total
3.551 3.448 3.507
.962 1.012 .981

58
Table 3. Correlations and Descriptive Statistics Among Questions on Survey One
M (SD)
Q1 Sig.
Q2 Sig.
Q3 Sig.
Q4 Sig.
Q5 Sig.
Q6 Sig.
Question 1 3.93 (.85) .616** -.358** .290**
Question 2 3.27 (1.10) .616** -.680** .198* .421** -.225**
Question 3 2.95 (1.03) -.358** -.680** -.186* -.312**
Question 4 3.63 (1.10) .198* -.186* .234**
Question 5 2.86 (1.07) .290** .421** -.312** .234** -.245**
Question 6 2.21 (1.02) -.225** -.245**
Question 7 3.35 (1.15)
Question 8 2.80 (1.07) 3
Question 9 3.88 (.88) .196*
Question 10 3.49 (.93) .184*
Question 11 3.84 (.83) .184* .171*
Question 12 3.50 (.98) .211*

59
Table 3. (Continued)
Q7 Sig.
Q8 Sig.
Q9 Sig.
Q10 Sig.
Q11 Sig.
Q12 Sig.
Question 1 .196* .184*
Question 2
Question 3 .211*
Question 4
Question 5 .184* .171*
Question 6
Question 7
Question 8 -.230** -.330**
Question 9 .284** .206*
Question 10 -.230** .284** .491* .171*
Question 11 -.330** .491** .266**
Question 12 .171* .266**
**Correlation is significant at the 0.01 level (2-tailed) **Correlation is significant at the 0.05 level (2-tailed)

60
Table 4. Descriptive Statistics Among Year in College on Survey Two
Year
Mean
Standard Deviation Q1 Year 1
Year 2 Total
3.78 4.14 3.97
.428
.727
.628
Q2 Year 1 Year 2 Total
2.78 3.38 3.10
.943 1.024 1.021
Q3 Year 1 Year 2 Total
3.44 2.67 3.03
.922
.966 1.013
Q4 Year 1
Year 2 Total
3.39 3.57 3.49
1.145 1.028 1.073
Q5 Year 1 Year 2 Total
2.33 2.86 2.62
.907 1.014 .990
Q6 Year 1 Year 2 Total
2.22 2.00 2.10
.548
.949
.788
Q7 Year 1 Year 2 Total
3.56 3.33 3.44
1.097 .913 .995
Q8 Year 1 Year 2 Total
2.61 2.76 2.69
1.037 .995 1.004

61
Table 4. (Continued)
Year
Mean
Standard Deviation Q9 Year 1
Year 2 Total
3.56 4.00 3.79
.992
.548
.767
Q10 Year 1 Year 2 Total
3.50 3.52 3.51
.857
.680
.756
Q11 Year 1 Year 2 Total
4.00 3.90\3.95
.485
.768
.647
Q12 Year 1 Year 2 Total
3.78 3.52 3.64
.808
.814
.811
Q13 Year 1 Year 2 Total
2.67 3.48 3.10
1.085 1.030 1.119
Q14 Year 1 Year 2 Total
3.06 3.24 3.15
1.056 1.338 1.204
Q15 Year 1 Year 2 Total
4.33 4.24 4.28
.485
.625
.560
Q16 Year 1 Year 2 Total
3.89 3.95 3.92
.676
.805
.739

62
Table 4. (Continued)
Year
Mean
Standard Deviation Q17 Year 1
Year 2 Total
3.33 2.90 3.10
1.138 .889 1.021
Q18 Year 1 Year 2 Total
3.28 3.05 3.15
1.227 1.203 1.204
Q19 Year 1 Year 2 Total
3.39 2.90 3.12
.344
.257
.212
Q20 Year 1 Year 2 Total
3.94 3.48 3.69
.098
.178
.111
Q21 Year 1
Year 2 Total
3.22 3.52 3.38
.286
.190
.167
Q22 Year 1
Year 2 Total
3.78 3.48 3.62
.732
.814
.782
Q23 Year 1 Year 2 Total
3.11 3.14 3.13
.900
.655
.767
Q24 Year 1 Year 2 Total
2.50 2.81 2.67
.857
.981
.927

63
Table 4. (Continued)
Year
Mean
Standard Deviation Q25 Year 1
Year 2 Total
2.78 2.62 2.69
1.003 .865 .922
Q26 Year 1
Year 2 Total
3.33 3.29 3.31
.840 1.056 .950
Q27 Year 1
Year 2 Total
3.61 3.76 3.69
.037
.831
.922
Q28 Year 1 Year 2 Total
3.28 3.43 3.36
1.179 .978 1.063
Q29 Year 1 Year 2 Total
3.22 2.62 2.90
1.166 1.203 1.209
Q30 Year 1 Year 2 Total
2.67 2.81 2.74
.07 1.167 1.044
Q31 Year 1 Year 2 Total
1.89 2.10 2.00
.676
.831
.762
Q32 Year 1
Year 2 Total
2.56 2.29 2.41
2.249 1.102 1.117

64
Table 4. (Continued)
Year
Mean
Standard Deviation Q33 Year 1
Year 2 Total
3.28 3.48 3.38
.895 1.030 .963
Q34 Year 1 Year 2 Total
3.39 3.62 3.51
.778
.921
.854
Q35 Year 1 Year 2 Total
3.39 2.86 3.10
1.145 .062 1.119

65
Table 5. Descriptive Statistics Among Gender on Survey Two
Year
Mean
Standard Deviation Q1 Female
Male Total
3.88 4.13 3.96
.793
.806
.798
Q2 Female Male Total
2.97 3.56 3.17
1.150 1.263 1.209
Q3 Female
Male Total
3.13 2.63 2.96
.942 1.204 1.051
Q4 Female Male Total
3.56 2.44 2.52
1,076 .964 1.031
Q5 Female Male Total
2.50 2.88 2.63
1.107 1.088 1.104
Q6 Female Male Total
2.19 1.88 2.08
.896
.719
.846
Q7 Female Male Total
3.50 3.56 3.52
.984
.964
.967
Q8 Female Male Total
2.63 2.75 2.67
1.040 1.125 1.059

66
Table 5. (Continued)
Year
Mean
Standard Deviation Q9 Female
Male Total
3.75 4.00 3.83
.672
.894
.753
Q10 Female Male Total
3.56 3.38 3.50
.716 1.088 .851
Q11 Female Male Total
3.91 4.06 3.96
.641
.772
.683
Q12 Female Male Total
3.56 3.63 3.58
.840
.806
.821
Q13 Female Male Total
2.84 3.75 3.15
1.221 .931 1.203
Q14 Female Male Total
2.94 3.56 3.15
1.216 1.263 1.255
Q15 Female Male Total
4.19 4.31 4.23
.644
.602
.627
Q16 Female Male Total
3.97 3.94 3.96
.695
.929
.771

67
Table 5. (Continued)
Year
Mean
Standard Deviation Q17 Female
Male Total
3.03 3.13 3.06
1.031 1.204 1.080
Q18 Female Male Total
3.09 3.13 3.10
1.174 1.204 1.171
Q19 Female Male Total
3.34 2.44 2.04
1.285 1.365 1.368
Q20 Female Male Total
3.66 3.44 3.58
.787
.964
.846
Q21 Female Male Total
3.41 3.44 3.42
1.073 .892 1.007
Q22 Female Male Total
3.69 3.50 3.63
.738
.996
.815
Q23 Female Male Total
3.16 3.19 3.17
.808
.981
.859
Q24 Female Male Total
2.50 2.88 2.63
.842 1.147 .959

68
Table 5. (Continued)
Year
Mean
Standard Deviation Q25 Female
Male Total
2.63 2.69 2.65
.907 1.078 .956
Q26 Female
Male Total
3.47 3.31 3.42
.718 1.302 .942
Q27 Female Male Total
3.69 3.94 3.77
.965
.929
.951
Q28 Female Male Total
3.38 3.00 3.25
1l212 1.095 1.176
Q29 Female Male Total
2.91 2.31 2.71
1.376 1.195 1.336
Q30 Female Male Total
2.41 3.31 2.71
.979 1.138 1.110
Q31 Female
Male Total
1.81 2.00 1.88
.780
.894
.815
Q32 Female Male Total
2.47 2.06 2.33
1.295 .998 1.209

69
Table 5. (Continued)
Year
Mean
Standard Deviation Q33 Female
Male Total
3.19 3.88 3.42
1.148 .806 1.088
Q34 Female Male Total
3.44 3.63 3.50
1.076 .885 1.011
Q35 Female Male Total
3.13 2.50 2.92
1.338 1.033 1.269

70
Table 6. Correlations and Descriptive Statistics Among Questions on Survey Two
M (SD)
Q1 Sig.
Q2 Sig.
Q3 Sig.
Q4 Sig.
Q5 Sig.
Q6 Sig.
Question 1 3.96 (.80) .735** -.433** .337* .417** -.310*
Question 2 3.17 (1.21) .735** -.664** -.644** .558** -.430**
Question 3 2.96 (1.05) -.433** -.431** -.509** .363*
Question 4 3.52 (1.03) .337* -.431** .325* -.295*
Question 5 2.63 (1.10) .417** .558** -.509** .325*
Question 6 2.08 (.86) -.310* -.430** .363* -.295*
Question 7 3.52 (.97)
Question 8 2.67 (1.06)
Question 9 3.83 (.75)
Question 10 3.50 (.85) .317*
Question 11 3.96 (.68)
Question 12 3.58 (.82) .300*
Question 13 3.15 (1.20) .694** .788** -.736** .539**
Question 14 3.15 (1.26) .686** .685** -.479** .409**
Question 15 4.23 (.63) .487** .370**
Question 16 3.96 (.77) .343*
Question 17 3.06 (1.08) .392** -.432** .565**
Question 18 3.10 (1.17)
Question 19 3.04 (1.37) -.330* -.468** .430**

71
Table 6. (Continued)
M (SD)
Q1 Sig.
Q2 Sig.
Q3 Sig.
Q4 Sig.
Q5 Sig.
Q6 Sig.
Question 20 3.58 (.85) .339*
Question 21 3.42 (1.01)
Question 22 3.63 (.82) .304* -.325*
Question 23 3.17 (.86)
Question 24 2.63 (.96)
Question 25 2.65 (.96) .303*
Question 26 3.42 (.94)
Question 27 3.77 (.95) .436** .367*
Question 28 3.25 (1.18) .301* -
.373**
Question 29 2.71 (1.34) .371** -.562** .582* -.351* -
.307*
.417**
Question 30 2.71 (1.11) -.292*
Question 31 1.88 (.82) -.351* .355*
Question 32 2.33 (1.21) -.449** -.505** .380* .388**
Question 33 3.42 (1.09) .658** .561** -
.394**
-.293*
Question 34 3.50 (1.01) .607** .644** -.501**
.439**
.420**

72
Question 35 2.92 (1.27) -.382** -.560** .604** -
.342*
.383**
Table 6. (Continued)
Q7 Sig.
Q8 Sig.
Q9 Sig.
Q10 Sig.
Q11 Sig.
Q12 Sig.
Q13 Sig.
Question 1 .694**
Question 2 .788**
Question 3 .300* -.736**
Question 4
Question 5 .317* .539**
Question 6
Question 7
Question 8 -.461**
Question 9
Question 10
Question 11 -.461**
Question 12
Question 13
Question 14 .296* .719**
Question 15 .299* .470** .378**
Question 16 .325* .360*

73
Question 17 .294* -.531**
Question 18 .355* -.340*
Question 19 -.521**
Table 6. (Continued)
Q7 Sig.
Q8 Sig.
Q9 Sig.
Q10 Sig.
Q11 Sig.
Q12 Sig.
Q13 Sig.
Question 20
Question 21 -.326* .298*
Question 22 .361* .747**
Question 23 .296* -.291*
Question 24 .524**
Question 25 .533**
Question 26 -.434** .319* .292*
Question 27 -.458** .355* .411** .366* .328*
Question 28 -.312*
Question 29 .321* -.608**
Question 30
Question 31
Question 32 -.459**
Question 33 .322* .310* .341* .700**
Question 34 -.398** .621**
Question 35 -.605**

74
Table 6. (Continued)
Q14 Sig.
Q15 Sig.
Q16 Sig.
Q17 Sig.
Q18 Sig.
Q19 Sig.
Q20 Sig.
Question 1 .686** .487** .343** -.392** -.330* .339*
Question 2 .685** .370** -.432** -.468
Question 3 -.479** .565** .430**
Question 4
Question 5 .409**
Question 6
Question 7
Question 8 .355*
Question 9 .296*
Question 10 .299* .325*
Question 11 .473** .360* -.340*
Question 12 .294*
Question 13 .719** .378** -.531** -.521**
Question 14 .389** -.368* -.425**
Question 15 .389** .504** -.408**
Question 16 .504**
Question 17 -.368* . .474**
Question 18 .432** .432**
Question 19 -.425** -.408** .474** .474**
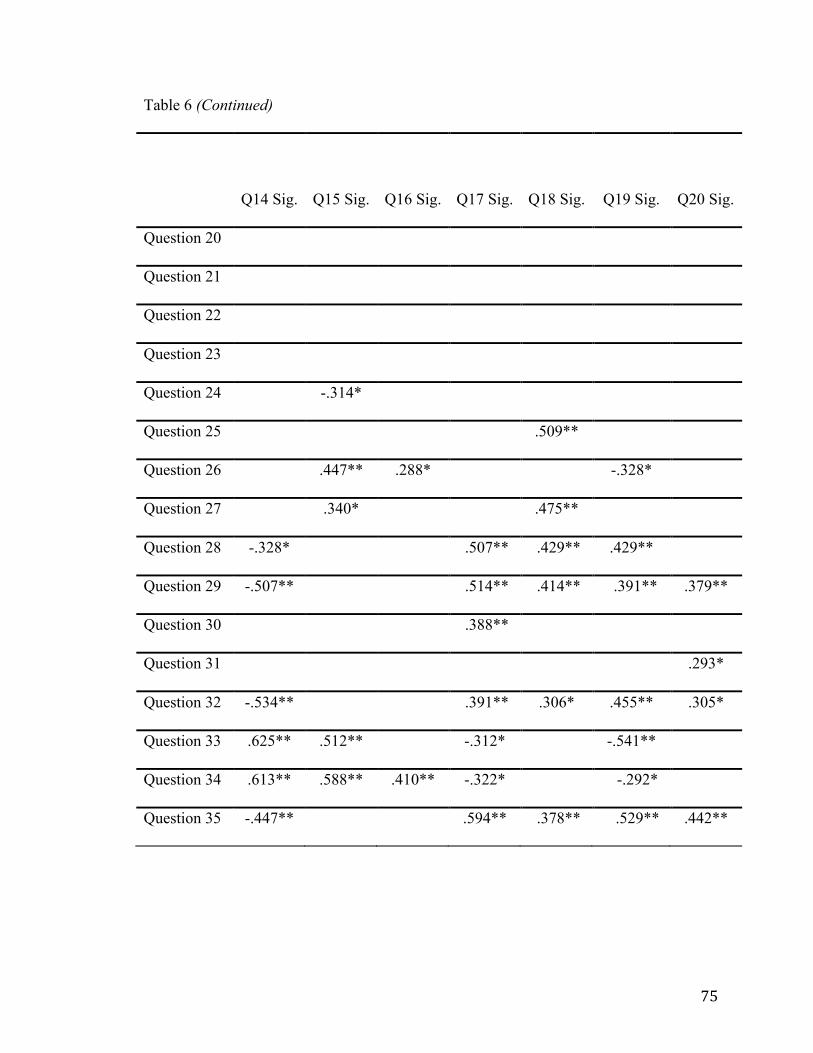
75
Table 6 (Continued)
Q14 Sig.
Q15 Sig.
Q16 Sig.
Q17 Sig.
Q18 Sig.
Q19 Sig.
Q20 Sig.
Question 20
Question 21
Question 22
Question 23
Question 24 -.314*
Question 25 .509**
Question 26 .447** .288* -.328*
Question 27 .340* .475**
Question 28 -.328* .507** .429** .429**
Question 29 -.507** .514** .414** .391** .379**
Question 30 .388**
Question 31 .293*
Question 32 -.534** .391** .306* .455** .305*
Question 33 .625** .512** -.312* -.541**
Question 34 .613** .588** .410** -.322* -.292*
Question 35 -.447** .594** .378** .529** .442**

76
Table 6. (Continued)
Q21 Sig.
Q22 Sig.
Q23 Sig.
Q24 Sig.
Q25 Sig.
Q26 Sig.
Q27 Sig.
Question 1 .436**
Question 2 .367*
Question 3 .304* .303*
Question 4
Question 5 -.325*
Question 6 .328*
Question 7 .361*
Question 8 -.326* .296* .524** .553** -.434** -.458**
Question 9
Question 10 .298* -.291* .319* .355*
Question 11 .292* .411**
Question 12 .747** .366*
Question 13 .328*
Question 14
Question 15 -.314* .447** .340*
Question 16 .288*
Question 17
Question 18 .509** -.475**
Question 19 -.328*

77
Question 20
Table 6. (Continued)
Q21 Sig.
Q22 Sig.
Q23 Sig.
Q24 Sig.
Q25 Sig.
Q26 Sig.
Q27 Sig.
Question 21 .376* .352*
Question 22 .376**
Question 23
Question 24 .478** -.412**
Question 25 .478** -.423** -.349*
Question 26 .352* -.412** -.423** .418**
Question 27 -.349* .418**
Question 28
Question 29 -.384**
Question 30
Question 31
Question 32
Question 33 .444**
Question 34 .432**
Question 35 .291*

78
Table 6. (Continued)
Q28 Sig.
Q29 Sig.
Q30 Sig.
Q31 Sig.
Question 1 .371**
Question 2 -.562**
Question 3 .301* .582**
Question 4 -373** -.351* -.292* -.351*
Question 5 -.307*
Question 6 .417** .355*
Question 7
Question 8 .321*
Question 9
Question 10
Question 11
Question 12 .397**
Question 13 -.312* .608**
Question 14 -.328* -.507**
Question 15
Question 16
Question 17 .507** .514** .388**
Question 18 .429** .414**
Question 19 .391**

79
Question 20 .379** .293*
Table 6 (Continued)
Q28 Sig.
Q29 Sig.
Q30 Sig.
Q31 Sig.
Question 21
Question 22
Question 23
Question 24
Question 25 .384**
Question 26
Question 27
Question 28 .548** .302*
Question 29 .548** .286* .337*
Question 30 .302* .286* .288*
Question 31 .337* .288*
Question 32 .419** .667** .375** .475**
Question 33 -.354*
Question 34 -.299*
Question 35 .642** .738** .375** .319*
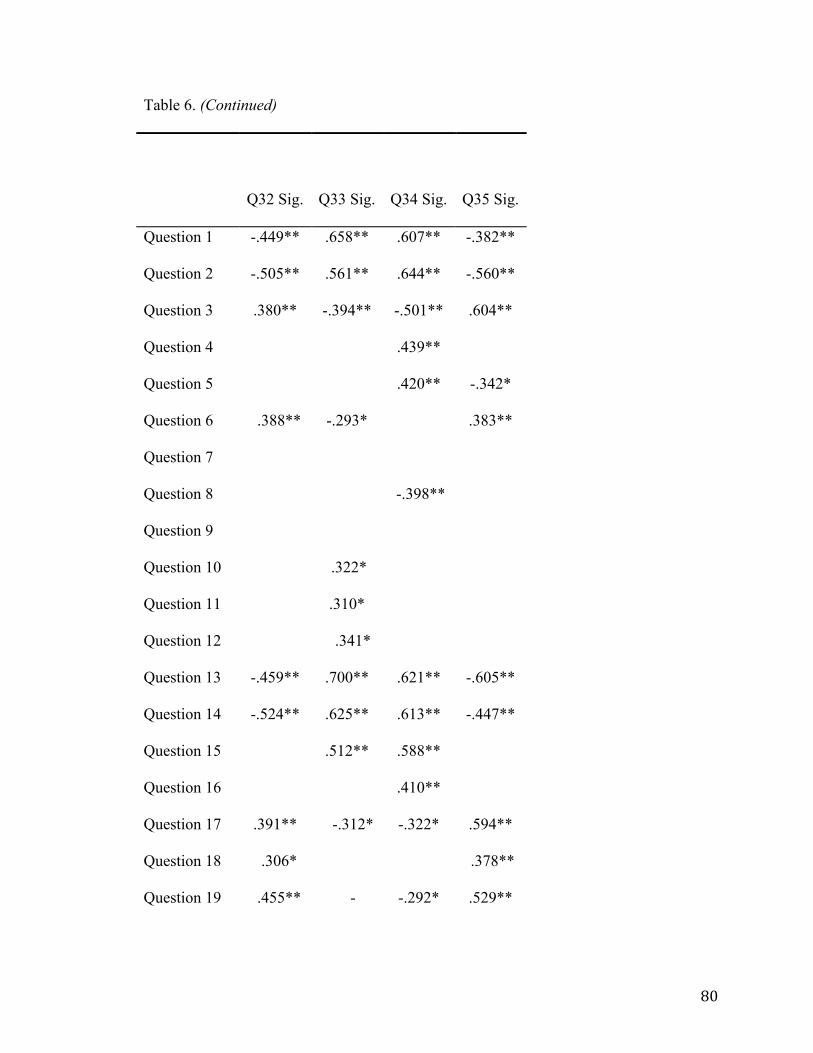
80
Table 6. (Continued)
Q32 Sig.
Q33 Sig.
Q34 Sig.
Q35 Sig.
Question 1 -.449** .658** .607** -.382**
Question 2 -.505** .561** .644** -.560**
Question 3 .380** -.394** -.501** .604**
Question 4 .439**
Question 5 .420** -.342*
Question 6 .388** -.293* .383**
Question 7
Question 8 -.398**
Question 9
Question 10 .322*
Question 11 .310*
Question 12 .341*
Question 13 -.459** .700** .621** -.605**
Question 14 -.524** .625** .613** -.447**
Question 15 .512** .588**
Question 16 .410**
Question 17 .391** -.312* -.322* .594**
Question 18 .306* .378**
Question 19 .455** - -.292* .529**

81
Table 6. (Continued)
Q32 Sig.
Q33 Sig.
Q34 Sig.
Q35 Sig.
Question 23
Question 24
Question 25 .291*
Question 26
Question 27 .444** .432**
Question 28 .419** .642**
Question 29 .667** -.354* -.299* .738**
Question 30 .375** .375**
Question 31 .475** .319*
Question 32 -.286* .671**
Question 33 -.286* .677** -.329*
Question 34 .677**
Question 35 .671** -.329*
**Correlation is significant at the 0.01 level (2-tailed) **Correlation is significant at the 0.05 level (2-tailed)
.541**
Question 20 .305* .442**
Question 21
Question 22

82
Table 7. Frequency of Codes on Survey One
Codes
Positive
Average
Negative Teacher
26 3 15
Emotional Support
16 1 16
Instrumental Support
30 2 24
Anxiety
4 8 17
Complicated/Struggling
2 2 4
Exams/ Grades
8 8 5
Grade School
5 3 2
Totals
91 27 84

83
Figure 1. Frequency of Codes on Survey One
0 10 20 30 40 50 60 70 80 90 100
Positive
Negative
Neutral

84
Author’s Biography
Victoria M. Calabrese was born in Madison, New Jersey on September 27, 1993.
She was raised in New Jersey until she was 13 and then moved to Patagonia, Arizona
where she graduated from high school as valedictorian of her class in 2012. Majoring in
elementary education, Victoria has a minor in mathematics. She is a member of Kappa
Delta Pi and Gamma Sigma Sigma Delta Nu. She is also a student ambassador for the
University of Maine and works in the Math Den on campus.
Recommended