PARPART-LI ET AL., PAGE 1
The effect of preservative and temperature on the analysis of circulating tumor DNA
Short title: Effects of preservative and temperature on ctDNA analysis
Sonya Parpart-Li1, Bjarne Bartlett2,3, Maria Popoli2,3, Vilmos Adleff2, Laura Tucker1, Rebecca Steinberg1,
Andrew Georgiadis1, Jill Phallen2, Julie Brahmer2, Nilo Azad2, Ilene Browner2, Daniel Laheru2, Victor E.
Velculescu2, Mark Sausen1 and Luis A. Diaz Jr.2,3
1Personal Genome Diagnostics, Inc., Baltimore, MD 21224, USA.
2The Sidney Kimmel Comprehensive Cancer Center, Johns Hopkins University School of Medicine,
Baltimore, MD 21287, USA.
3The Swim Across America Laboratory at Johns Hopkins, Baltimore, MD 21287, USA.
Conflict of Interest Disclosures:
Victor E. Velculescu and Luis A. Diaz Jr. are co-founders of Personal Genome Diagnostics.
Sonya Parpart-Li, Laura Tucker, Rebecca Steinberg, Andrew Georgiadis, and Mark Sausen are employees
of Personal Genome Diagnostics.
on April 9, 2019. © 2016 American Association for Cancer Research.clincancerres.aacrjournals.org Downloaded from
Author manuscripts have been peer reviewed and accepted for publication but have not yet been edited. Author Manuscript Published OnlineFirst on November 8, 2016; DOI: 10.1158/1078-0432.CCR-16-1691
PARPART-LI ET AL., PAGE 2
Statement of Translation Relevance
Preserving the integrity of ctDNA over an extended period is crucial to achieve the high
sensitivity required for downstream molecular analyses. In this study we pre-analytically processed
blood samples in two tube types, specific for the collection of plasma, under various environmental
conditions to determine the best approach for maintaining ctDNA quality and yield. Notably, we found
that the plasma fraction of whole blood is more desirable than the serum fraction for the analysis of
ctDNA. The most commonly used tube type for plasma collection, K2EDTA, stored at 4°C maintains
ctDNA in a manner similar to Cell-Free DNA Blood Collection tubes (Streck™) stored in ambient
conditions. At 4°C cell lysis is prevented, reducing the amount of total genomic DNA released into the
plasma and allowing for variants in ctDNA to be more readily detected. These results will inform the
design of studies that rely on collecting plasma for ctDNA analysis.
on April 9, 2019. © 2016 American Association for Cancer Research.clincancerres.aacrjournals.org Downloaded from
Author manuscripts have been peer reviewed and accepted for publication but have not yet been edited. Author Manuscript Published OnlineFirst on November 8, 2016; DOI: 10.1158/1078-0432.CCR-16-1691
PARPART-LI ET AL., PAGE 3
Abstract
PURPOSE: Analysis of genomic alterations in cell-free DNA (cfDNA) is evolving as an approach to detect,
monitor and genotype malignancies. Methods to separate the liquid from the cellular fraction of whole
blood for circulating tumor DNA (ctDNA) analyses have been largely unstudied although these may be a
critical consideration for assay performance.
EXPERIMENTAL DESIGN: To evaluate the influence of blood processing on cfDNA and ctDNA quality and
yield, we compared the cfDNA levels in serum to those in plasma. Given the limitations of serum for
ctDNA analyses, we evaluated the effects of two plasma processing approaches, K2EDTA and Cell-Free
DNA™ BCT (BCT) tubes, on cfDNA and ctDNA recovery. A total of 45 samples from 9 cancer patients
were collected in both tube types. Once collected, blood was processed into plasma immediately or
kept at room temperature and processed into plasma at 1, 3, 5, or 7 days.
RESULTS: As early as 24 hours after collection, plasma isolated from blood collected in K2EDTA tubes
contained an elevated level of cfDNA that increased over time compared with BCT tubes where no
significant increase in cfDNA levels was observed. When samples from an additional six cancer patients,
collected in the same manner, were stored at 4°C in K2EDTA tubes over the course of 3 days, total cfDNA
and ctDNA levels were comparable between samples collected in BCT tubes. At day 3, there was a trend
towards a decrease in ctDNA levels in both tubes that was more pronounced when measuring the
mutant allele fraction for cases stored at 4°C in K2EDTA tubes.
CONCLUSIONS: In summary, methods of blood processing have a strong influence on cfDNA and ctDNA
levels and should be a consideration when evaluating ctDNA in peripheral circulation.
on April 9, 2019. © 2016 American Association for Cancer Research.clincancerres.aacrjournals.org Downloaded from
Author manuscripts have been peer reviewed and accepted for publication but have not yet been edited. Author Manuscript Published OnlineFirst on November 8, 2016; DOI: 10.1158/1078-0432.CCR-16-1691
PARPART-LI ET AL., PAGE 4
Introduction
The clinical applicability of liquid biopsies is becoming increasingly evident with the emergence of novel
targeted therapies(1-3) combined with next-generation technologies for assessment of tumor-specific
sequence and structural alterations in cell-free DNA (cfDNA) derived from blood(4-12). These
noninvasive approaches provide a method to evaluate tumor-specific alterations present in the tumor
sample without the need for a tissue biopsy through direct identification of circulating tumor DNA
(ctDNA) similar to noninvasive prenatal screening tests (NIPT) that scan a maternal blood sample for
genetic conditions in the fetus. On average, the fetal fraction of DNA in maternal plasma ranges from
10-30%(13-15). In contrast, ctDNA is often present at significantly lower levels and can be considerably
affected by less robust sample collection techniques as there may be only a few mutant DNA fragments
per milliliter (mL) of plasma(6, 16). Therefore, ctDNA levels may depend upon how the cell and cell-free
components were isolated into plasma or serum, especially since cfDNA has a very short half-life(6, 17,
18). Once cfDNA is released into circulation from apoptotic or necrotic cells, the half-life is estimated to
be about 2 hours(6, 18). Though the rapid turnover of cfDNA allows for sophisticated monitoring of
tumor dynamics, blood collection procedures should be carefully considered if the end goal is to detect
ctDNA. To date, plasma has been the primary cell-free blood component used for ctDNA analyses, but
studies have been conducted using serum(5). In order to isolate plasma, whole blood is anticoagulated
to prevent clotting of the cellular component and following centrifugation, the cell-free supernatant is
removed. When three commonly used anticoagulants (di-potassium ethylenediaminetetraacetic acid
(K2EDTA), lithium heparin and sodium citrate) were evaluated in their ability to stabilize cfDNA levels
after venipuncture, it was found that total plasma DNA concentrations were stable with all three
anticoagulants if whole blood was processed into plasma within 6 hours. However, K2EDTA was the
anticoagulant with the least change in cfDNA levels after 6 hours(19). To better understand the
on April 9, 2019. © 2016 American Association for Cancer Research.clincancerres.aacrjournals.org Downloaded from
Author manuscripts have been peer reviewed and accepted for publication but have not yet been edited. Author Manuscript Published OnlineFirst on November 8, 2016; DOI: 10.1158/1078-0432.CCR-16-1691
PARPART-LI ET AL., PAGE 5
influence of pre-analytic whole blood processing on cell-free DNA levels, we evaluated several
conditions to find the optimal approach.
Materials and Methods
Patient selection and sample processing
All biologic specimens utilized in this study were obtained from patients enrolled in a study approved by
the Johns Hopkins University Institutional Review Board and provided informed consent. Patients
whose tumors had been sequenced as part of standard clinical care and had ‘hot spot’ mutations in
KRAS, EGFR, or BRAF were recruited into this study.
Serum was prepared after collection of the whole blood into tubes containing no anticoagulant. Whole
blood was allowed to clot by leaving it undisturbed at room temperature for 15-30 minutes. The clot
was removed by centrifuging at 1,000-2,000 x g for 10 minutes in a refrigerated centrifuge. The
resulting supernatant is designated serum and was carefully aspirated from the tube without disturbing
the clot (cells) and transferred in 1mL aliquots into 1.5mL Eppendorf tubes, and then centrifuged a
second time at 18,400 x g for 10 minutes to remove cellular debris. Serum aliquots were then
transferred to a new 1.5mL Eppendorf tube and frozen at -80°C.
Plasma was prepared from whole blood collected in K2EDTA or BCT tubes. Cells were removed from the
plasma by centrifugation at 375 x g for 10 minutes at RT. The resulting supernatant is designated
plasma and was carefully aspirated from the tube without disturbing the buffy coat layer (cells) and
transferred in 1mL aliquots into 1.5mL Eppendorf tubes, and then centrifuged a second time at 18,400 x
g for 10 minutes to remove cellular debris. Plasma aliquots were then transferred to a new 1.5mL
Eppendorf tube and frozen at -80°C.
on April 9, 2019. © 2016 American Association for Cancer Research.clincancerres.aacrjournals.org Downloaded from
Author manuscripts have been peer reviewed and accepted for publication but have not yet been edited. Author Manuscript Published OnlineFirst on November 8, 2016; DOI: 10.1158/1078-0432.CCR-16-1691
PARPART-LI ET AL., PAGE 6
Plasma processing at Room Temperature
Ten tubes of peripheral blood (approximately 10 mL per tube) were collected from each patient with
tumors that harbored KRAS mutations. Of these 10 tubes, five were K2EDTA tubes and the five tubes
were BCT tubes. After venipuncture, the tubes were inverted 10 times immediately after the blood
draw. Whole blood was kept at room temperature and processed into plasma at time points (0, 24, 72,
120, 168 hours), except for the baseline sample (time 0) that was processed into plasma (as described
above) within four hours of venipuncture.
Plasma processing at Room Temperature and 4°C
When the influence of temperature on ctDNA levels was assessed, 12 tubes of peripheral blood
(approximately 10 mL per tube) were collected from six patients with tumors that harbored KRAS
mutations. Of these 12 tubes, six were K2EDTA tubes and the six tubes were BCT tubes. After
venipuncture, the tubes were inverted several times. K2EDTA tubes and BCT tubes were equally split
into two sets: one set was kept at 4°C while the other set was stored at RT and processed into plasma at
time points 0, 24 and 72 hours, except for the baseline sample (time 0) that was processed into plasma
(as described above) within four hours of venipuncture.
Cell-free DNA extraction and mutant analysis
Circulating cell-free DNA was extracted from plasma using the QIAamp Circulating Nucleic Acid Kit
(Qiagen, Catalog #55114). The purified DNA concentration was determined using Qubit dsDNA HS Assay
Kit (Life Technologies, Catalog #Q32854). All extracted DNA was analyzed with the appropriate droplet
digital PrimePCR™ assay (BioRad, Catalog #100-31246 and #100-31249) on the BioRad QX200 droplet
digital PCR system to determine the number of wild-type and mutant genomic equivalents. The mutant
on April 9, 2019. © 2016 American Association for Cancer Research.clincancerres.aacrjournals.org Downloaded from
Author manuscripts have been peer reviewed and accepted for publication but have not yet been edited. Author Manuscript Published OnlineFirst on November 8, 2016; DOI: 10.1158/1078-0432.CCR-16-1691
PARPART-LI ET AL., PAGE 7
fractional abundance was calculated as a percent of the total DNA present at each time point. The
fragment size of cell-free DNA derived from plasma and serum was measured using the High Sensitivity
DNA Kit on the 2100 Bioanalyzer (Agilent, Catalog #5067-4627).
Circulating cell-free DNA from healthy controls was extracted and quantified as described above.
Genomic libraries were created from the total yield of extracted DNA using NEB (Ipswich, MA) enzyme
mixes for End Repair (cat# E6050), A-tail (cat# E6053) and ligation (cat# E6056, incorporating 8 pooled
adapter oligonucleotides generated by IDT (Redwood City, CA)) followed by 12 cycles of PCR and
purified as described previously using Agencourt AMPure XP beads (Beckman Coulter, IN) (20). A 58
gene panel (Suppl. Table 4) interrogating 80,930 nucleotides was employed to detect sequence
mutations by next generation sequencing, using the Agilent SureSelect in-solution targeted enrichment
system (Agilent, Santa Clara, CA)(21).
Targeted regions were captured in-solution using a custom SureSelect kit according to the
manufacturer’s instructions. The captured DNA library was immobilized from the beads using 200 µL of
a 95% Formamide and 10mM EDTA solution at 65°C for 5 minutes. Once separated from the beads, the
DNA was purified using Agencourt AMPure XP beads (Beckman Coulter, IN) in a ratio of 1.0x to 1.8x ratio
of captured DNA library to beads and washed using 70% ethanol according to manufacturer instructions.
The captured DNA library was amplified and purified as described previously (20). The captured
genomic library underwent 100 bp paired-end sequencing on a HiSeq 2500 instrument (Illumina, San
Diego, CA) to obtain an average of 26,574X total coverage in the targeted region of interest (Suppl. Table
5), with variant identification performed as previously described(21, 22).
Statistical analyses
on April 9, 2019. © 2016 American Association for Cancer Research.clincancerres.aacrjournals.org Downloaded from
Author manuscripts have been peer reviewed and accepted for publication but have not yet been edited. Author Manuscript Published OnlineFirst on November 8, 2016; DOI: 10.1158/1078-0432.CCR-16-1691
PARPART-LI ET AL., PAGE 8
The statistical difference between BCT and K2EDTA tubes at various time points as well as the difference
in total genomic equivalents (GEs) or mutant allele fraction between serum and plasma was calculated
using a paired, two-tailed Student’s t-test where p < 0.05 was considered significant (Graphpad Prism
v5.00). To study sample size, a power analysis was performed in R (v3.2.4). 6 samples were determined
to provide an 80% power for the detection of a 10% difference between blood collection tube types
(P<0.05, SD=7). One sample set was removed from the analysis as the baseline MAF was <1%, and had
the potential to confound these findings. For a reduced study size of five, the study was determined to
provide 67% power for the detection of a 10% difference between blood collection tube types.
Results
Total and tumor-derived cell-free DNA levels in plasma and serum
To evaluate the yield of cell-free DNA between serum and plasma, the quantity of total genome
equivalents (GEs) and the mutant allele fraction were compared between serum and plasma collected
from stage II and III pancreatic cancer patients (n=46 and n=51, respectively). All cases were known to
harbor mutations in KRAS at p.G12C, p.G12D, p.G12I, p.G12R, p.G12S, p.G12V, or p.G13D positions.
DNA extracted from serum was analyzed for mutations known to be present in the matched tumor using
standard droplet digital PCR assays. We compared our results in serum with a similar dataset we had
previously analyzed for mutations in plasma from 51 stage-matched pancreatic cancer patients from a
study by Sausen et al.(20). Total GEs were significantly greater in the DNA obtained from serum
specimens (P<0.001, Figure 1A), whereas the observed mutant allele fraction was significantly higher in
the DNA obtained from plasma compared to serum specimens (P<0.001, Figure 1B). While distinct
peaks of cfDNA were observed in plasma with the largest fraction measuring 155 base pairs on average,
the cfDNA fragments in the serum varied considerably in size ranging from 150 to 2,000 base pairs
(Figure 1C).
on April 9, 2019. © 2016 American Association for Cancer Research.clincancerres.aacrjournals.org Downloaded from
Author manuscripts have been peer reviewed and accepted for publication but have not yet been edited. Author Manuscript Published OnlineFirst on November 8, 2016; DOI: 10.1158/1078-0432.CCR-16-1691
PARPART-LI ET AL., PAGE 9
The effect of immediate and delayed plasma preparation on total and tumor-derived cell-free DNA levels
Whole blood from nine colorectal cancer patients where the tumor genotype was known to harbor a
mutation in KRAS, EGFR, or BRAF, was collected and monitored to assess the stability of DNA obtained
from K2EDTA tubes and BCT tubes at room temperature (RT) over a period of seven days (Suppl. Figure 1
and Suppl. Table 1). During this time, the change in overall GEs observed in DNA obtained from BCT
tubes remained stable compared to K2EDTA tubes stored at room temperature (P<0.005 between 0 and
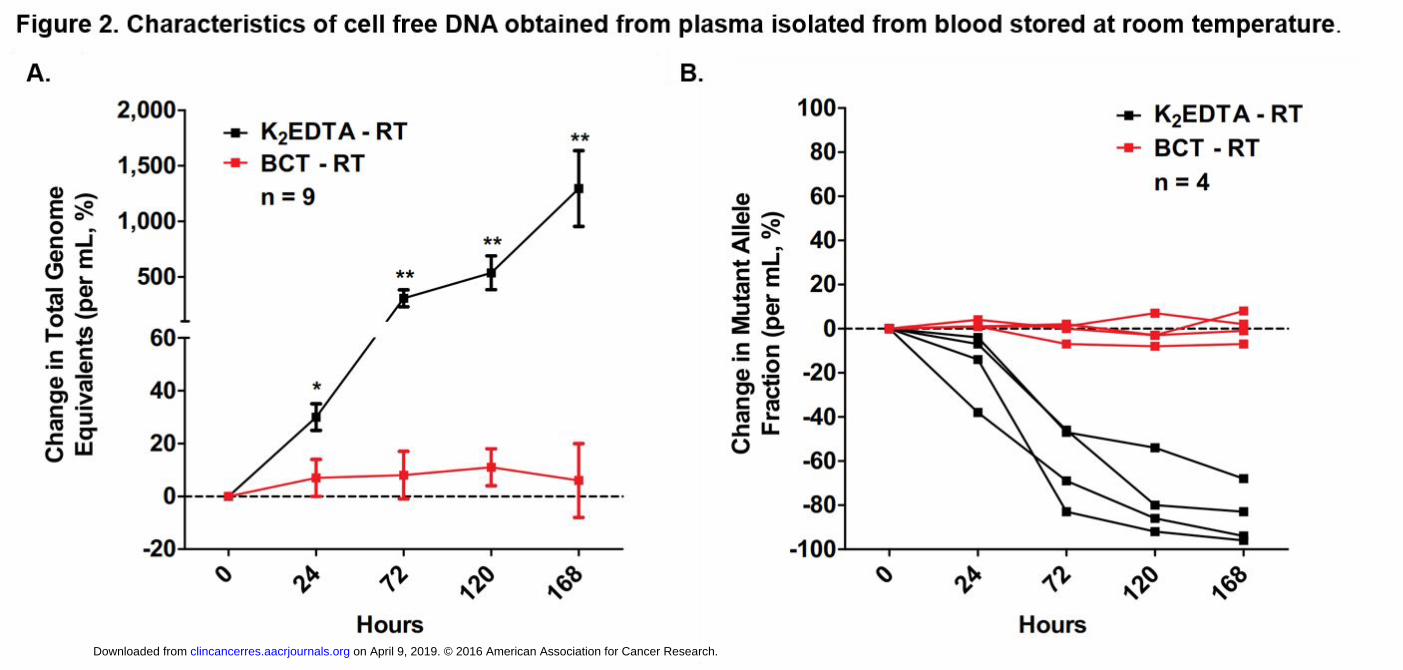
168 hours, Figure 2A, Suppl. Table 2). Within 24 hours, a significant increase in the number of total GEs
was observed in the DNA obtained from K2EDTA tubes, which continued to increase over time. After
one week, there was a 13-fold increase in total GEs per milliliter in K2EDTA tubes, while the percent
increase of total GEs per milliliter obtained from BCT tubes was 6%. For cases where the mutant allele
fraction (MAF) was >1% in both tube types, the observed MAF was stable in blood collected and stored
in BCT tubes but decreased considerably in blood collected and stored in K2EDTA tubes (Figure 2B, one
time point in P1 was unable to be evaluated and therefore excluded from analysis, Suppl. Table 2).
The effect of temperature on total and tumor-derived cell-free DNA levels
To determine whether storage of K2EDTA tubes at 4°C could increase the allowable time interval
between blood collection and fractionation, blood was collected in both K2EDTA and BCT tubes from six
KRAS or EGFR mutant positive cancer patients (Suppl. Figure 1 and Suppl. Table 1) and held at either
room temperature (Streck™ BCT) or at 4°C (K2EDTA) for up to 72 hours. When K2EDTA tubes were
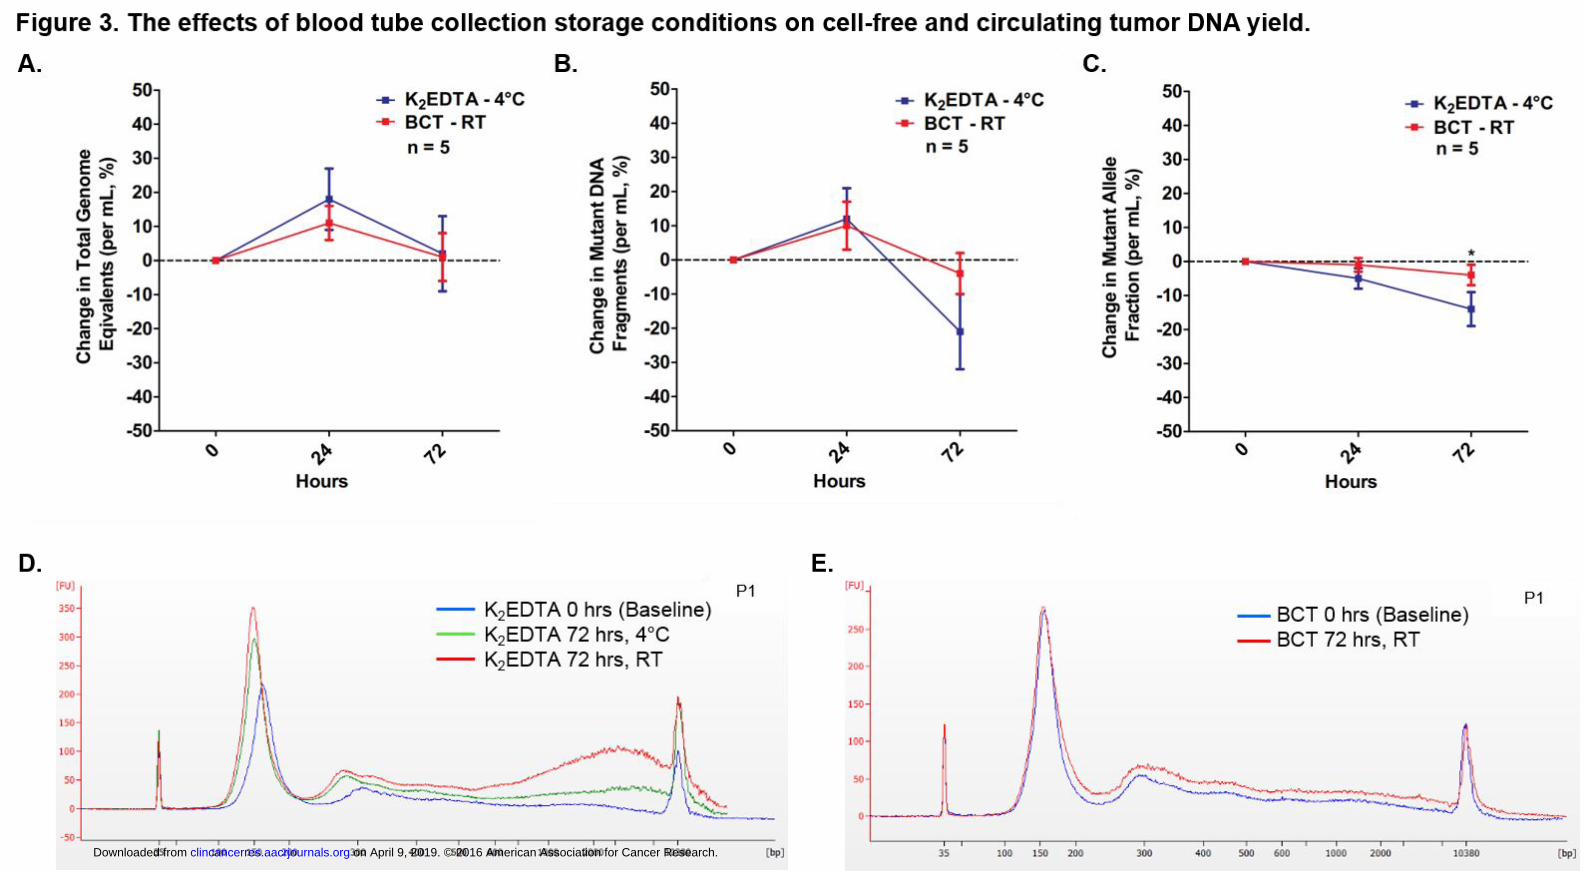
stored at 4°C, there was no significant increase in yield of total GEs over the three-day period (Figure 3A,
Suppl. Table 3) in contrast to the observed increase in total GEs when whole blood was kept at room
temperature and stored in K2EDTA tubes. We also analyzed the change in total mutant DNA fragments
on April 9, 2019. © 2016 American Association for Cancer Research.clincancerres.aacrjournals.org Downloaded from
Author manuscripts have been peer reviewed and accepted for publication but have not yet been edited. Author Manuscript Published OnlineFirst on November 8, 2016; DOI: 10.1158/1078-0432.CCR-16-1691
PARPART-LI ET AL., PAGE 10
per milliliter and the change in mutant allele fraction over the same three-day period. The percent
change in the number of mutant DNA fragments initially increased at 24 hours in both tubes but
decreased by 4% (Streck™ BCT) or 21% (K2EDTA) at 72 hours, with no significant difference observed
between K2EDTA and BCT tubes (P>0.05 at each time point, Figure 3B, Suppl. Table 3). The mutant allele
fraction decreased in plasma isolated from K2EDTA tubes and BCT at 24- and 72 hours with a statistically
significant difference observed between tube types (P<0.05, Figure 3C, Suppl. Table 3) at 72 hours.
There was an observable difference in genomic DNA levels between plasma DNA extracted at baseline
(within 4 hours of blood draw) and plasma DNA extracted at 72 hours in K2EDTA tubes stored at 4°C or
room temperature (Figure 3D). While, BCT tubes show minimal differences in total cfDNA levels
regardless of storage temperature or time (Figure 3E). In all cases, the trends in cfDNA and ctDNA levels
were consistent between K2EDTA tubes and BCT in each series tested.
The effect of immediate and delayed plasma preparation on plasma volume
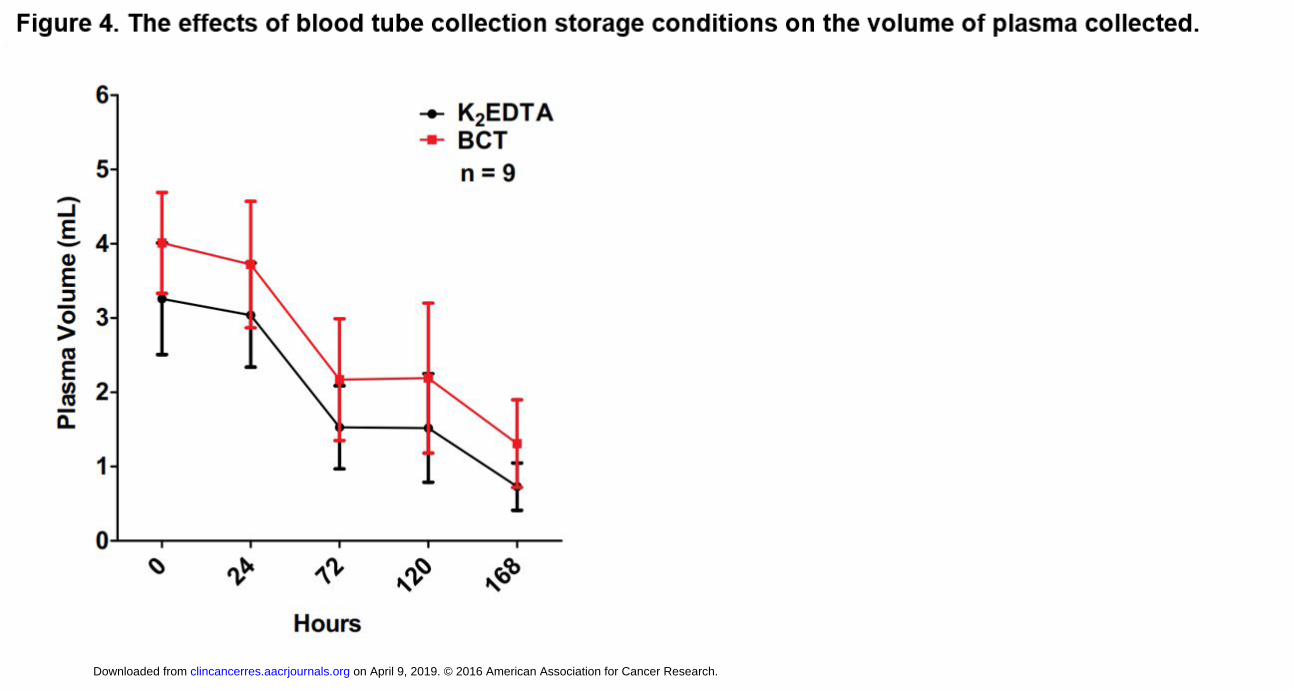
In addition to total GEs, we evaluated the volume of plasma obtained from fractionated blood at room
temperature over the seven-day period. We found that the volume of plasma obtained decreased in
both tube types over time using the same fractionation conditions (Figure 4A). By day 7 (168 hours),
less than 2 mL of plasma was fractionated from each 10 mL Vacutainer tube (Streck™ or K2EDTA)
containing 8-10 mL of whole blood.
Next-generation sequencing quality and specificity
The number of mutations between BCT and K2EDTA tubes was analyzed using a hybrid-capture, next
generation sequencing approach. Three BCT and three K2EDTA tubes of whole blood (approximately 10
mL per tube) from 3 healthy individuals were analyzed for sequence mutations over a 72-hour period
on April 9, 2019. © 2016 American Association for Cancer Research.clincancerres.aacrjournals.org Downloaded from
Author manuscripts have been peer reviewed and accepted for publication but have not yet been edited. Author Manuscript Published OnlineFirst on November 8, 2016; DOI: 10.1158/1078-0432.CCR-16-1691
PARPART-LI ET AL., PAGE 11
where BCT tubes were stored at RT while K2EDTA tubes at 4°C (Suppl. Table 5). Using a targeted 58 gene
panel designed to cover 80,930 nucleotides and detect sequence mutations in plasma, the observed per
base error rate, calculated as the number of bases mutated divided by the number of targeted bases,
was similar between plasma isolated from K2EDTA and BCT tubes (0.00041% vs. 0.00014%, p=0.28,
Student’s t-test). Consistent with previous findings, the yield of cfDNA in healthy individuals was
significantly lower than the yield in diseased individuals (p<0.02 Student’s t-test, Suppl. Table 6)(4, 23,
24).
Discussion
Methods of whole blood processing, preservation and storage are important considerations for the
analysis of ctDNA. A common question is whether serum or plasma are equivalent for cfDNA analyses.
It is clear that the abundance and nature of the cfDNA is very different in these two fractions of whole
blood. Serum contains high molecular weight DNA, likely attributed to how serum is produced by
clotting whole blood into a solid and liquid phase. This relatively violent process results in the release of
cellular DNA into the cell-free liquid component by lysis and apoptosis (Figure 1). In contrast, plasma is
produced using an anticoagulant (potassium EDTA, sodium citrate, lithium heparin) and the cellular
(solid) component gently separates from the plasma (liquid) component resulting in cfDNA that is
uniform in size (median size of 180 bp). This is likely the reason that K2EDTA tubes are recommended by
the International Council for Standardization in Hematology (ICSH) and the Clinical and Laboratory
Standards Institute (CLSI) as the ideal tube for molecular testing (such as routine PCR-based molecular
diagnostics and HIV viral load testing) because the anticoagulant dipotassium salts preserve cellular
components(25, 26) and prevent contamination and dilution with cellular DNA that may interfere with
analyses of cell-free DNA. In addition, EDTA salts have been shown to inhibit DNAse activity and thereby
on April 9, 2019. © 2016 American Association for Cancer Research.clincancerres.aacrjournals.org Downloaded from
Author manuscripts have been peer reviewed and accepted for publication but have not yet been edited. Author Manuscript Published OnlineFirst on November 8, 2016; DOI: 10.1158/1078-0432.CCR-16-1691
PARPART-LI ET AL., PAGE 12
help preserve cfDNA levels ex vivo during storage, transport and processing(27). Di- and tri-potassium
(K2 and K3) salts of EDTA are standard anticoagulants that have been used in studies with cfDNA.
K2EDTA is spray-dried on the walls of the tube rather than added in liquid form, as is the case for
K3EDTA. The spray-dried coating has been shown to prevent both cell shrinkage and other osmotic
effects on blood cells more effectively than in liquid form(28, 29). Several studies have evaluated cfDNA
and ctDNA levels when whole blood was stored and preserved with K3EDTA. These analyses show
varying results, many with findings similar to ours when evaluating cfDNA and ctDNA levels in stored
whole blood(27, 28, 30-33).
In our study we compared K2EDTA tubes with BCT tubes, which are intended to preserve cell-free DNA
through proprietary components that are free of formaldehyde. Cell-free DNA levels remained stable in
BCT tubes over a 7-day period even when whole blood was stored at room temperature and likewise
cfDNA levels were stable when whole blood was stored at 4°C in K2EDTA tubes for 24 hours. Not
surprisingly, temperature has been shown to have a strong influence on peripheral blood storage in
K2EDTA coated tubes. Prior studies have shown that storage of whole blood in K2EDTA tubes at 4°C
results in the stability of leukocytes and plasma proteins for an extended period (29). Likewise, storage
of whole blood at 4oC preserves both total cfDNA and ctDNA at levels equivalent to the BCT tubes. In
contrast, when blood was stored at room temperature in K2EDTA coated tubes, there was a massive
release of cfDNA presumably by cells undergoing unorganized death by lysis or necrosis as
demonstrated by the high molecular weight DNA fragments found in the plasma after 24 hours (Figures
2a and 3d). At room temperature, there was also a concomitant decrease in the fraction of ctDNA
(figure 2b) likely from the dilution of the mutant DNA fragments by wild-type DNA released by the lysed
lymphocytes. We also noted that at room temperature, the volume of plasma recovered significantly
decreased regardless of storage tube used and should be considered when storage times exceed 1 day,
on April 9, 2019. © 2016 American Association for Cancer Research.clincancerres.aacrjournals.org Downloaded from
Author manuscripts have been peer reviewed and accepted for publication but have not yet been edited. Author Manuscript Published OnlineFirst on November 8, 2016; DOI: 10.1158/1078-0432.CCR-16-1691
PARPART-LI ET AL., PAGE 13
especially when samples are idle. Furthermore, it appears that using either of these preservatives have
no observable effects on the quality of NGS analyses of cfDNA.
As the number of ctDNA analyses increase for the determination of mutation profiles in cancer patients
for research and clinical care, the methods used for whole blood preservation and storage prior to
processing into plasma and DNA extraction will influence the quality of analysis. It is clear that
minimizing cellular lysis during whole blood storage is of high importance and this can be accomplished
using BCT tubes at room temperature or in EDTA tubes stored at 4oC.
Acknowledgements
We would like to thank S. Bonerigo and A. Ryan (Johns Hopkins) for their clinical coordination.
on April 9, 2019. © 2016 American Association for Cancer Research.clincancerres.aacrjournals.org Downloaded from
Author manuscripts have been peer reviewed and accepted for publication but have not yet been edited. Author Manuscript Published OnlineFirst on November 8, 2016; DOI: 10.1158/1078-0432.CCR-16-1691
PARPART-LI ET AL., PAGE 14
References
1. Alix-Panabieres C, Pantel K. Clinical Applications of Circulating Tumor Cells and Circulating Tumor DNA as Liquid Biopsy. Cancer discovery. 2016;6:479-91. 2. Diaz LA, Jr., Bardelli A. Liquid biopsies: genotyping circulating tumor DNA. Journal of clinical oncology : official journal of the American Society of Clinical Oncology. 2014;32:579-86. 3. Heitzer E, Ulz P, Geigl JB. Circulating tumor DNA as a liquid biopsy for cancer. Clinical chemistry. 2015;61:112-23. 4. Dawson SJ, Tsui DW, Murtaza M, Biggs H, Rueda OM, Chin SF, et al. Analysis of circulating tumor DNA to monitor metastatic breast cancer. The New England journal of medicine. 2013;368:1199-209. 5. Diaz LA, Jr., Williams RT, Wu J, Kinde I, Hecht JR, Berlin J, et al. The molecular evolution of acquired resistance to targeted EGFR blockade in colorectal cancers. Nature. 2012;486:537-40. 6. Diehl F, Schmidt K, Choti MA, Romans K, Goodman S, Li M, et al. Circulating mutant DNA to assess tumor dynamics. Nature medicine. 2008;14:985-90. 7. Leary RJ, Kinde I, Diehl F, Schmidt K, Clouser C, Duncan C, et al. Development of personalized tumor biomarkers using massively parallel sequencing. Science translational medicine. 2010;2:20ra14. 8. Leary RJ, Sausen M, Kinde I, Papadopoulos N, Carpten JD, Craig D, et al. Detection of chromosomal alterations in the circulation of cancer patients with whole-genome sequencing. Science translational medicine. 2012;4:162ra54. 9. Newman AM, Bratman SV, To J, Wynne JF, Eclov NC, Modlin LA, et al. An ultrasensitive method for quantitating circulating tumor DNA with broad patient coverage. Nature medicine. 2014;20:548-54. 10. Diaz LA, Jr., Sausen M, Fisher GA, Velculescu VE. Insights into therapeutic resistance from whole-genome analyses of circulating tumor DNA. Oncotarget. 2013;4:1856-7. 11. Haber DA, Velculescu VE. Blood-based analyses of cancer: circulating tumor cells and circulating tumor DNA. Cancer discovery. 2014;4:650-61. 12. Bettegowda C, Sausen M, Leary RJ, Kinde I, Wang Y, Agrawal N, et al. Detection of circulating tumor DNA in early- and late-stage human malignancies. Science translational medicine. 2014;6:224ra24. 13. Canick JA, Palomaki GE, Kloza EM, Lambert-Messerlian GM, Haddow JE. The impact of maternal plasma DNA fetal fraction on next generation sequencing tests for common fetal aneuploidies. Prenatal diagnosis. 2013;33:667-74. 14. Wang E, Batey A, Struble C, Musci T, Song K, Oliphant A. Gestational age and maternal weight effects on fetal cell-free DNA in maternal plasma. Prenatal diagnosis. 2013;33:662-6. 15. Ashoor G, Poon L, Syngelaki A, Mosimann B, Nicolaides KH. Fetal fraction in maternal plasma cell-free DNA at 11-13 weeks' gestation: effect of maternal and fetal factors. Fetal diagnosis and therapy. 2012;31:237-43. 16. Diehl F, Li M, Dressman D, He Y, Shen D, Szabo S, et al. Detection and quantification of mutations in the plasma of patients with colorectal tumors. Proceedings of the National Academy of Sciences of the United States of America. 2005;102:16368-73. 17. Fleischhacker M, Schmidt B. Circulating nucleic acids (CNAs) and cancer--a survey. Biochimica et biophysica acta. 2007;1775:181-232. 18. Lo YM, Zhang J, Leung TN, Lau TK, Chang AM, Hjelm NM. Rapid clearance of fetal DNA from maternal plasma. American journal of human genetics. 1999;64:218-24. 19. Lam NY, Rainer TH, Chiu RW, Lo YM. EDTA is a better anticoagulant than heparin or citrate for delayed blood processing for plasma DNA analysis. Clinical chemistry. 2004;50:256-7.
on April 9, 2019. © 2016 American Association for Cancer Research.clincancerres.aacrjournals.org Downloaded from
Author manuscripts have been peer reviewed and accepted for publication but have not yet been edited. Author Manuscript Published OnlineFirst on November 8, 2016; DOI: 10.1158/1078-0432.CCR-16-1691
PARPART-LI ET AL., PAGE 15
20. Sausen M, Phallen J, Adleff V, Jones S, Leary RJ, Barrett MT, et al. Clinical implications of genomic alterations in the tumour and circulation of pancreatic cancer patients. Nature communications. 2015;6:7686. 21. Parpart-Li S, Angiuoli SV, Chesnick B, Galens KG, Jones S, Kadan M, et al. A method for comprehensive genomic analysis of cell free DNA [Abstract]. Cancer Res; 2015 April 18-22; Philadelphia, PA; 2015. p. 2405. 22. Jones S, Anagnostou V, Lytle K, Parpart-Li S, Nesselbush M, Riley DR, et al. Personalized genomic analyses for cancer mutation discovery and interpretation. Science translational medicine. 2015;7:283ra53. 23. Schwarzenbach H, Stoehlmacher J, Pantel K, Goekkurt E. Detection and monitoring of cell-free DNA in blood of patients with colorectal cancer. Annals of the New York Academy of Sciences. 2008;1137:190-6. 24. Chun FK, Muller I, Lange I, Friedrich MG, Erbersdobler A, Karakiewicz PI, et al. Circulating tumour-associated plasma DNA represents an independent and informative predictor of prostate cancer. BJU international. 2006;98:544-8. 25. Recommendations of the International Council for Standardization in Haematology for Ethylenediaminetetraacetic Acid Anticoagulation of Blood for Blood Cell Counting and Sizing. International Council for Standardization in Haematology: Expert Panel on Cytometry. American journal of clinical pathology. 1993;100:371-2. 26. Adcock DM, Hoefner DM, Kottke-Marchant K, Marlar RA, Szamosi DI, Warunek DJ. H21-A5: Collection, Transport, and Processing of Blood Specimens for Testing Plasma-Based Coagulation Assays and Molecular Hemostasis Assays; Approved Guideline. Clinical and Laboratory Standards Institute. 2008;28. 27. Barra GB, Santa Rita TH, de Almeida Vasques J, Chianca CF, Nery LF, Santana Soares Costa S. EDTA-mediated inhibition of DNases protects circulating cell-free DNA from ex vivo degradation in blood samples. Clinical biochemistry. 2015;48:976-81. 28. Kang Q, Henry NL, Paoletti C, Jiang H, Vats P, Chinnaiyan AM, et al. Comparative analysis of circulating tumor DNA stability In K3EDTA, Streck, and CellSave blood collection tubes. Clinical biochemistry. 2016. 29. Banfi G, Salvagno GL, Lippi G. The role of ethylenediamine tetraacetic acid (EDTA) as in vitro anticoagulant for diagnostic purposes. Clinical chemistry and laboratory medicine. 2007;45:565-76. 30. Norton SE, Lechner JM, Williams T, Fernando MR. A stabilizing reagent prevents cell-free DNA contamination by cellular DNA in plasma during blood sample storage and shipping as determined by digital PCR. Clinical biochemistry. 2013;46:1561-5. 31. El Messaoudi S, Rolet F, Mouliere F, Thierry AR. Circulating cell free DNA: Preanalytical considerations. Clinica chimica acta; international journal of clinical chemistry. 2013;424:222-30. 32. Denis MG, Knol AC, Theoleyre S, Vallee A, Dreno B. Efficient Detection of BRAF Mutation in Plasma of Patients after Long-term Storage of Blood in Cell-Free DNA Blood Collection Tubes. Clinical chemistry. 2015;61:886-8. 33. Toro PV, Erlanger B, Beaver JA, Cochran RL, VanDenBerg DA, Yakim E, et al. Comparison of cell stabilizing blood collection tubes for circulating plasma tumor DNA. Clinical biochemistry. 2015;48:993-8.
on April 9, 2019. © 2016 American Association for Cancer Research.clincancerres.aacrjournals.org Downloaded from
Author manuscripts have been peer reviewed and accepted for publication but have not yet been edited. Author Manuscript Published OnlineFirst on November 8, 2016; DOI: 10.1158/1078-0432.CCR-16-1691
PARPART-LI ET AL., PAGE 16
Figure 1. Levels of genomic DNA in serum and plasma of pancreatic cancer patients. A) The average
total genomic equivalents are significantly lower in plasma than in serum (*P<0.001, Student’s t-test). B)
The observed mutant allele fraction is significantly lower in serum compared to plasma (*P<0.001,
Student’s t-test). C) Cell free DNA is observed at one major peak between 150-200 base pairs and one
minor peak around 300 base pairs in plasma. In serum, cell free DNA is observed at multiple peaks
between 150-2,000 base pairs.
Figure 2. Characteristics of cell free DNA obtained from plasma isolated from blood stored at room
temperature. A) The percentage change in total genome equivalents significantly increased in K2EDTA
tubes compared to BCT tubes at room temperature (P<0.05 at 24 hours, P<0.01 at 72, 120, and 168
hours, Student’s t-test). The percentage change in total genome equivalents significantly increased
within the K2EDTA tube type (P<0.005 between 0 and 168 hours, Student’s t-test) but did not change
over time within the BCT tubes (P>0.05 for all time points, Student’s t-test). *Indicates a significant
difference between K2EDTA and BCT tubes. B) The observed mutant allele fraction is stable over time
when blood is preserved in BCT tubes but decreases when blood is preserved in K2EDTA tubes
(representative 4 cases shown). *P<0.05; **P<0.01
Figure 3. The effects of blood tube collection storage conditions on cell-free and circulating tumor
DNA yield. A) The percentage change in total genome equivalents per milliliter remained stable using
both tube types up to three days when K2EDTA tubes were stored at 4°C and BCT tubes were stored at
RT. There was no significant difference between or within the tube types at any time point (P>0.05
Student’s t-test). B) The percent change in mutant DNA fragments decreased at 72 hours in both BCT (-
4%) and K2EDTA (-21%) tubes however, the decrease was not significant within or between tube types at
any time point (P>0.05 Student’s t-test). C) The percent change in mutant allele fraction decreased after
on April 9, 2019. © 2016 American Association for Cancer Research.clincancerres.aacrjournals.org Downloaded from
Author manuscripts have been peer reviewed and accepted for publication but have not yet been edited. Author Manuscript Published OnlineFirst on November 8, 2016; DOI: 10.1158/1078-0432.CCR-16-1691
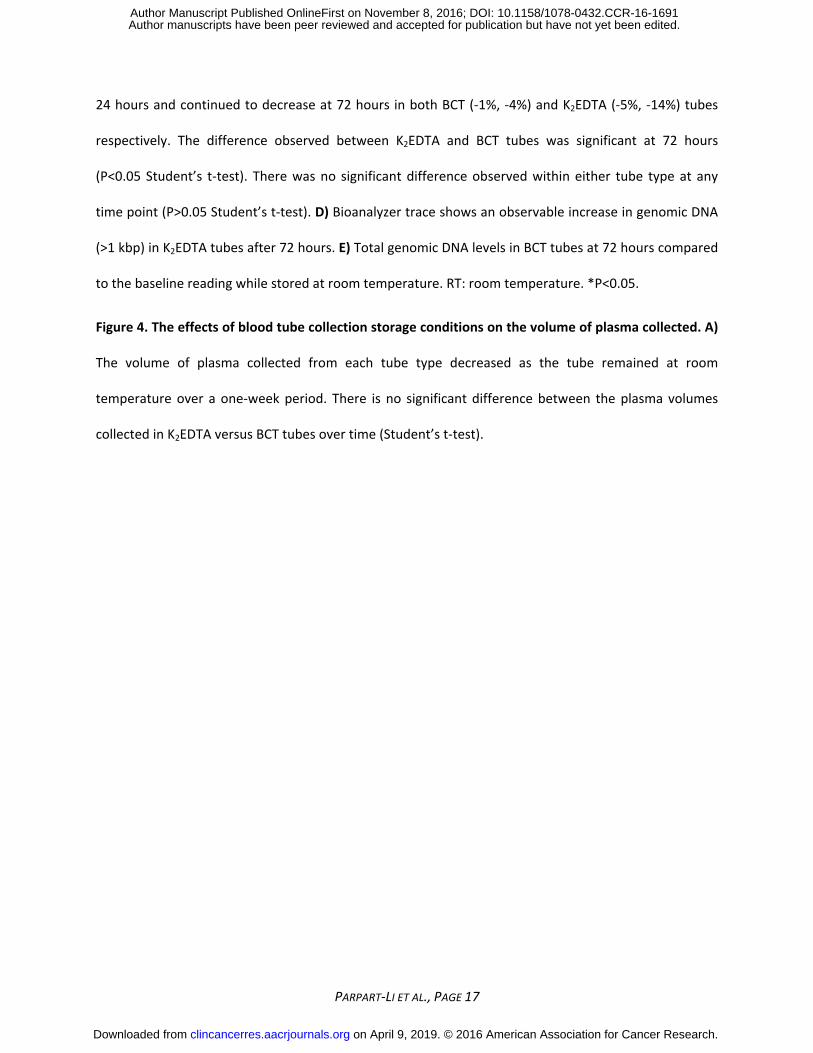
PARPART-LI ET AL., PAGE 17
24 hours and continued to decrease at 72 hours in both BCT (-1%, -4%) and K2EDTA (-5%, -14%) tubes
respectively. The difference observed between K2EDTA and BCT tubes was significant at 72 hours
(P<0.05 Student’s t-test). There was no significant difference observed within either tube type at any
time point (P>0.05 Student’s t-test). D) Bioanalyzer trace shows an observable increase in genomic DNA
(>1 kbp) in K2EDTA tubes after 72 hours. E) Total genomic DNA levels in BCT tubes at 72 hours compared
to the baseline reading while stored at room temperature. RT: room temperature. *P<0.05.
Figure 4. The effects of blood tube collection storage conditions on the volume of plasma collected. A)
The volume of plasma collected from each tube type decreased as the tube remained at room
temperature over a one-week period. There is no significant difference between the plasma volumes
collected in K2EDTA versus BCT tubes over time (Student’s t-test).
on April 9, 2019. © 2016 American Association for Cancer Research.clincancerres.aacrjournals.org Downloaded from
Author manuscripts have been peer reviewed and accepted for publication but have not yet been edited. Author Manuscript Published OnlineFirst on November 8, 2016; DOI: 10.1158/1078-0432.CCR-16-1691
Published OnlineFirst November 8, 2016.Clin Cancer Res Sonya Parpart-Li, Bjarne Bartlett, Maria Popoli, et al. circulating tumor DNAThe effect of preservative and temperature on the analysis of
Updated version
10.1158/1078-0432.CCR-16-1691doi:
Access the most recent version of this article at:
Material
Supplementary
http://clincancerres.aacrjournals.org/content/suppl/2016/11/08/1078-0432.CCR-16-1691.DC1
Access the most recent supplemental material at:
Manuscript
Authoredited. Author manuscripts have been peer reviewed and accepted for publication but have not yet been
E-mail alerts related to this article or journal.Sign up to receive free email-alerts
Subscriptions
Reprints and
To order reprints of this article or to subscribe to the journal, contact the AACR Publications
Permissions
Rightslink site. Click on "Request Permissions" which will take you to the Copyright Clearance Center's (CCC)
.http://clincancerres.aacrjournals.org/content/early/2016/11/08/1078-0432.CCR-16-1691To request permission to re-use all or part of this article, use this link
on April 9, 2019. © 2016 American Association for Cancer Research.clincancerres.aacrjournals.org Downloaded from
Author manuscripts have been peer reviewed and accepted for publication but have not yet been edited. Author Manuscript Published OnlineFirst on November 8, 2016; DOI: 10.1158/1078-0432.CCR-16-1691
Recommended