Florida International UniversityFIU Digital Commons
FIU Electronic Theses and Dissertations University Graduate School
10-18-2013
The Effect of Contemporary HydrologicModification on Vegetation CommunityComposition Distinctness in the FloridaEvergladesEwan IsherwoodFlorida International University, [email protected]
DOI: 10.25148/etd.FI13120912Follow this and additional works at: https://digitalcommons.fiu.edu/etd
Part of the Plant Biology Commons, and the Terrestrial and Aquatic Ecology Commons
This work is brought to you for free and open access by the University Graduate School at FIU Digital Commons. It has been accepted for inclusion inFIU Electronic Theses and Dissertations by an authorized administrator of FIU Digital Commons. For more information, please contact [email protected].
Recommended CitationIsherwood, Ewan, "The Effect of Contemporary Hydrologic Modification on Vegetation Community Composition Distinctness in theFlorida Everglades" (2013). FIU Electronic Theses and Dissertations. 1027.https://digitalcommons.fiu.edu/etd/1027

FLORIDA INTERNATIONAL UNIVERSITY
Miami, Florida
THE EFFECT OF CONTEMPORARY HYDROLOGIC MODIFICATION
ON VEGETATION COMMUNITY COMPOSITION DISTINCTNESS IN THE FLORIDA
EVERGLADES
A thesis submitted in partial fulfillment of
the requirements for the degree of
MASTER OF SCIENCE
in
BIOLOGY
by
Ewan Isherwood
2013

ii
To: Dean Kenneth G. Furton College of Arts and Sciences
This thesis, written by Ewan Isherwood, and entitled The Effect of Contemporary Hydrologic Modification on Vegetation Community Composition Distinctness in the Florida Everglades, having been approved in respect to style and intellectual content, is referred to you for judgment. We have read this thesis and recommend that it be approved.
_______________________________________
James Heffernan
_______________________________________
Kenneth Feeley
_______________________________________
Jennifer Richards
_______________________________________
Evelyn Gaiser, Major Professor
Date of Defense: October 18 2013 The thesis of Ewan Isherwood is approved.
_______________________________________ Dean Kenneth G. Furton
College of Arts and Sciences
______________________________________ Dean Lakshmi N. Reddi
University Graduate School
Florida International University, 2013

iii
ACKNOWLEDGMENTS
I express thanks to my chair, Dr. Evelyn Gaiser, for taking me on as a student and
pushing me to understand the Everglades and statistical analyses better, as well as help
me with administrative tasks when I was unable to do them myself. I also thank my
committee members: Dr. Kenneth Feeley, who gave an excellent perspective to me on
ecological concepts outside of the Everglades, and Dr. Jennifer Richards, whose
botanical knowledge of the Everglades and more broadly community ecology principles
was critical in shaping many parts of my thesis.
I owe a debt of gratitude to my academic supervisor, Dr. James Heffernan, whose
help, often daily, from my first day through to submission of my thesis, has undeniably
been essential to me earning this degree. His passion for science and teaching is
boundless, and the scientific and literary skills I have gained through his encouragement
I will carry with me forever.
I thank my funding sources: the United States Army Corps of Engineers and South
Florida Water Management District for help with all research costs. For site access, I
also thank Everglades National Park.
I am grateful for the academic support given by Dr. Michael Ross, Dr. Jay Sah,
Megan Fork and Kristofor Voss, and for Megan’s help with thesis revisions on multiple
occasions.
None of this would have been possible without all of the help I received with
fieldwork: our lab manager, Lawrence Lopez, as well as Mario Cisneros, Virginia
Fernandez, Megan Fork, Dr. James Heffernan, Sean Koester, Jay Munyon, Pablo Ruiz,
Alexandra Saldana, Gabriel Sone, Dr. Danielle Watts, and the Ross Lab at Florida
International University. I also thank Ian Jones for helping me with several administrative
tasks when I was not able to.

iv
Finally, I would like to thank my family and friends for their support. Certainly,
without your help and goodwill I would not be in this position today. I especially would
like to thank my wife, Megan Fork, whose belief in my ability and help with every step
and every issue I have faced has been phenomenal.

v
ABSTRACT OF THE THESIS
THE EFFECT OF CONTEMPORARY HYDROLOGIC MODIFICATION ON
VEGETATION COMMUNITY COMPOSITION DISTINCTNESS IN THE FLORIDA
EVERGLADES
by
Ewan Isherwood
Florida International University, 2013
Miami, Florida
Professor Evelyn Gaiser, Major Professor
The historic Everglades Ridge and Slough landscape maintained regularly
spaced and elevated sawgrass ridges interspersed among exposed deeper-water
sloughs; however, widespread but irregular hydrologic modification has degraded much
of this landscape patterning. My study assessed the effects of hydrologic modification on
vegetation community distinctness within the Ridge and Slough landscape through
sampling species composition at fine-scales along a hydrologic gradient to measure the
magnitude of segregation of species among patch types. The results show that
vegetation community and topographic variation degradation is widespread, with
distinctness differences proceeding and possibly being driven by topographic variation
loss. Vegetation responses to past hydrologic regime modifications are likely affected by
temporal lags; however, vegetation distinctness regeneration may also be hindered by a
vegetatively homogeneous alternative stable state. Hydrologic regime restoration is
critical for Ridge and Slough patterned landscape reestablishment, but management
targets are complicated by vegetation response lags and possibly alternative stable
states.

vi
TABLE OF CONTENTS
CHAPTER PAGE
1. Introduction ................................................................................................................... 1
2. Wetlands ....................................................................................................................... 3
3. The Florida Everglades ................................................................................................ 5 3.1. Background and history ..................................................................................... 5 3.2. Vegetation community changes ........................................................................ 7 3.3. Vegetation community and topographic variation loss .................................... 10 3.4. Vegetation communities and leading indicators of ecological change ............ 12
4. Objectives and approach ............................................................................................ 13
5. Methods ..................................................................................................................... 14 5.1. Sampling design and implementation ............................................................... 14 5.2. Estimation of local hydrologic regime ............................................................... 16 5.3. Analysis of Vegetation Composition and Distinctness ...................................... 17 5.4. Software ........................................................................................................... 24 6. Results ....................................................................................................................... 25 6.1. Vegetation composition and distinctness ......................................................... 25 6.2. Hydrologic and topographic effects on distinctness ......................................... 28 7. Discussion .................................................................................................................. 31
7.1. Vegetation community distinctness in the Ridge and Slough landscape ......... 31 7.2. Vegetation community distinctness and hydrologic regime modification ......... 34 7.3. Vegetation community distinctness and topographic variation ......................... 35 7.4. Vegetation and topographic response lags ...................................................... 36 8. Conclusions ................................................................................................................ 41 8.1. Theoretical applications .................................................................................... 41 8.2. Management implications ................................................................................. 42 9. Figures and Tables .................................................................................................... 43
10. References ................................................................................................................ 66

vii
LIST OF FIGURES
FIGURE PAGE
1. Ridge and Slough landscape of the Everglades ......................................................... 43
2. Site map with 27 landscape blocks (PSUs) from two years of sampling ................... 44
3. Two PSUs ordinated by NMDS and clustered by k-means ........................................ 45
4. Schematic of lag scenarios following a reduction in the hydrologic regime ................ 46
5. Major species’ abundances within the most common field designated communities . 47
6. Hydrologic regimes for major communities among basins ......................................... 48
7. NMDS ordination scores for the three most abundant vegetation communities ......... 49
8. NMDS ordination site scores within PSUs rotated to the hydrologic axis ................... 50
9. Sawgrass relative abundance for each cluster within each PSU ................................ 51
10. Community statistics: count, cluster segregation, and hydrologic regimes ............... 52
11. Odds Ratio Test for k-means derived clusters within communities .......................... 53
12. Vegetation community distinctness along the hydrologic gradient .......................... 54
13. Vegetation community distinctness’ association with topographic variation ............ 55
14. Vegetation community distinctness and topographic variation counts and KDE ...... 56
15. The k-means cluster distance difference in MWD across the hydrologic gradient ... 57
16. Sawgrass abundance and MWD correlation across the hydrologic gradient ............ 58
17. Mantel r vegetation-topography correlation across the hydrologic gradient ............. 59
18. Vegetation community distinctness across the Ridge and Slough landscape .......... 60
19. Topographic variation across the Ridge and Slough landscape .............................. 61
20. The k-means difference in MWD across Ridge and Slough landscape .................... 62
21. Sawgrass—MWD correlation across Ridge and Slough landscape ......................... 63
22. Mantel r vegetation-topography across Ridge and Slough landscape ...................... 64
23. Conservation status for each PSU across the Ridge and Slough landscape ........... 65

1
Introduction
Ecological communities within landscapes range from being composed of discrete
sets of species to a continuously varying blend of any number of individual ecological
patches (Levin and Paine 1974). Patchiness may arise through unevenness in abiotic
environmental drivers exerting stress upon a landscape (Sousa 1984) or variation in
edaphic properties (Wiens et al. 1985). However, patchiness may also arise biotically
through competition among species for a finite resource (MacArthur and Levins 1964,
Peltzer 2001), such as nutrients, water or light (Connell 1983), allelopathy limiting other
species’ ability to compete (Vivanco et al. 2004, Bais et al. 2006), mutualistic facilitative
interactions among sets of species within communities (Stachowicz 2001), dispersal
dynamics (Levine and Murrell 2003), scale-dependent feedbacks between vegetation
and underlying abiotic environments (Rietkerk et al. 2004, Rietkerk and van de Koppel
2008), or a complex mixture of any of the above (Callaway and Walker 1997). Moreover,
the contrast between community patches can be heightened by the presence of
ecosystem engineers modifying physical habitats (Gilad et al. 2004, Crain and Bertness
2005).
However, ecological communities are not static: variation in spatial patterning both
within and among patches through time arise from changes in the environmental drivers
exerting stress on landscapes (Callaway and Walker 1997). Current (Allen and
Breshears 1998, Feeley and Rehm 2012) but also past (Milchunas and Lauenroth 1995)
abiotic and biotic drivers of ecological change affect patches by influencing species
movements. Patch changes through time may be assessed through measuring shifting
species composition (Walker et al. 1999) and species interactions within and among
patches (Morellet et al. 2007, Tylianakis et al. 2007), patch functionality (Carpenter and

2
Brock 2006, Scheffer et al. 2009), or through measuring species response times to
relatively slight environmental variations (Scheffer and Carpenter 2003).
In addition, ecological boundaries between adjacent patches are often critical
components of landscape patterning and changes (Strayer et al. 2003), as boundaries
frequently exhibit abrupt shifts in environmental conditions and, consequently, often
have different ecological characteristics compared those to within patches (Gosz 1992,
Ries et al. 2004, Kark and van Rensburg 2006).
Ecosystems affected by changing abiotic or biotic drivers may undergo abrupt
ecological regime shifts among alternative stable states (Scheffer et al. 2001, Beisner et
al. 2003). Alternative stable states within ecosystems may impede environmental
managers’ restoration efforts, as transitions between states may be dependent on a
regime shift’s direction; that is, the ecosystems exhibit hysteresis (Scheffer et al. 2001,
Beisner et al. 2003). To prevent undesirable regime shifts from occurring, it is therefore
critical that leading indicators of environmental change—characteristics that can signify
when landscapes are about to undergo possible rapid changes—are determined
(Groffman et al. 2006). Patch changes and leading indicators of ecological change
analyses are often focused on variation through time; however, if environmental drivers
exerting stress across a landscape are uniform in type, but not necessarily strength, it is
often more pragmatic to conduct analyses in a spatial context as a proxy for temporal
variation (Groffman et al. 2006). Identifying measurable and quantifiable ecological
characteristics that indicate thresholds of ecosystem change are important for
environmental managers whose goals include limiting or preventing ecosystem
degradation (Niemi and McDonald 2004, Scheffer et al. 2009).

3
Wetlands
The heterogeneous and sometimes harsh flooding-drying regimes of wetlands
support a range of both emergent and submergent plant species (Keddy 2010, Mitsch
and Gosselink 2011). The hydrologic regime is the dominant driver creating and
maintaining heterogeneous patches in wetlands, as species, which frequently define
patch characteristics, usually occupy restricted hydrologically derived niche spaces (van
der Valk 1981, Spence 1982, Weiher and Keddy 1995, Noon 1996). Heterogeneous
patches are most apparent in wetlands that contain abrupt topographic variation and
distinct ecological boundaries (van der Valk 1981, Zedler 2000). However, both patches
and their ecological boundaries are affected by changing environmental conditions,
which frequently results in patches becoming less pronounced within a landscape (van
der Valk 1981, Zedler 2000, Magee and Kentula 2005, Stallins 2006, Post et al. 2007,
Corenblit et al. 2007).
The stress exerted on wetland vegetation by the hydrologic regime, as exemplified
by periodic dry-downs, governs species’ physiology and life-history strategies (Foster et
al. 1983, Magee and Kentula 2005). Wetland vegetation therefore possess unique and
diverse reproductive strategies, including rapid response times, turnover, and
proliferation in favorable conditions (Keddy 2010, Mitsch and Gosselink 2011). Wetland
vegetation also have various structural adaptations particularly in response to drying
stress (Jackson and Colmer 2005). These include, but are not limited to, production of a
seed bank to take advantage of sporadically favorable hydrologic conditions (van der
Valk 1981, Casanova and Brock 2000), malleable morphology under different hydrologic
regimes (Miller and Zedler 2003), or regeneration through asexual vegetative
propagation (Combroux et al. 2002, Combroux and Bornette 2004).

4
Topographic patterning in wetlands can arise from interactions between living plants
and partially decayed vegetation, known as peat (Foster et al. 1983, Eppinga et al. 2008,
2010), forming the soil base for many wetland plant species. Complexity in topographic
patterning can be derived from spatially variable differences in both peat accretion and
decomposition that sustain and are sustained by microhabitat differences in resource
limitation (Belyea and Clymo 2001, van Wesenbeeck et al. 2008, Watts et al. 2010,
Eppinga et al. 2010). Spatial variation may particularly arise in wetlands with long
hydroperiods and acidic pH, where non-living organic biomass readily accumulates and
contributes to the soil building (Clymo 1984, Smith et al. 1993, Belyea and Clymo 2001).
Furthermore, in wetlands with distinct vegetation patches, topographic relief (and
therefore localized water depth) can vary considerably over small horizontal distances
(Kirkman et al. 1998, Larsen et al. 2007), despite a level water surface (as it is
constrained by gravity). As the hydrologic regime is modified, imbalances occur in the
equilibrium between peat accretion and aerobic respiration, because changes in these
processes with respect to water depth are non-linear (Cohen et al. 2011, Heffernan et al.
2013). For example, lowering water depth increases both peat accretion, through
primary production, and aerobic respiration, through increasing microbial activity and
CO2 emissions to the atmosphere, but the rates of these processes are different at
varying water depths. The resulting imbalances in the accretion-respiration equilibrium
can transition landscapes with complex plant communities and topographic patterning to
landscapes that are more vegetatively and topographically homogeneous (Eppinga et al.
2007, Watts et al. 2010). Furthermore, transitions may occur rapidly through a transition
between multiple alternative stable states in a positive accretion-respiration feedback
loop (Chase 2003, Eppinga et al. 2007).

5
As with many ecosystems world-wide, wetlands are experiencing considerable
changes. In particular, land use and climactic changes are altering the timing and
severity of disturbances, often with catastrophic effects on wetland vegetation
communities such as loss of total extent, changes in vegetation assemblages, invasive
species and disruptions to ecological patterning and functionality (Mitsch and Gosselink
2000, Zedler and Kercher 2004, Eppinga et al. 2007). In the present study, my overall
objective is to further understanding of the effects of hydrologic regime modification on
vegetation community patterning. The Florida Everglades’ distinct vegetative and
topographic patterning and variable hydrologic regimes make it an excellent system to
understand the interactions among vegetation, topography and hydrologic regimes that
are common to many wetlands, and, more broadly, how such interactions depend on
and influence the spatial patterning of ecological communities.
The Florida Everglades
Background and history
The Florida Everglades, located in southern Florida, USA, is a large subtropical
wetland with diverse hydrologic, vegetative, and edaphic characteristics. Historically, a
significant portion of this system was a slow, meandering river originating in the
Kissimmee River floodplain, flowing into the large and shallow Lake Okeechobee,
draining south and then southwest over extensive and highly oligotrophic peatlands into
Florida Bay (Gaiser et al. 2004, McVoy et al. 2011). The subtropical Everglades peatland
emerged 5-6,000 years ago with rising sea levels trapping freshwater flowing southward
over a limestone bedrock platform 160 kilometres long and 50 kilometres wide into
Florida Bay, at a near uniform descent totalling only about six vertical meters (Stephens

6
1956, Gleason and Stone 1994, McVoy et al. 2011). Vegetation quickly colonized the
submerged landscape, and peat, without sufficient aerobic respiration to oxidize,
accumulated on the bedrock up to over 3 m (Gleason and Stone 1994). However,
human-induced alterations to the hydrologic regime, including reduction, stabilization,
and impoundment of water through diversion and compartmentalization via canals,
levees and roads, have degraded both pre-drainage vegetation community patterning
and the underlying variation in topographic relief (Davis and Ogden 1994, Ogden 2005,
Watts et al. 2010, McVoy et al. 2011).
Widespread recognition by the public on the effect changes to the hydrologic regime
was having on the Everglades landscapes was inspired by Marjory Stoneman Douglas’
influential book The Everglades: River of Grass (Douglas 1947), which borrowed its
name from both the Everglades’ subtle but important riverine characteristics and the
extensive stands of sawgrass (Cladium jamaicense) that grow only 1-2 m above the
water surface across the entire landscape—a characteristic thought to have prevailed for
approximately the last 1,000 years (Bernhardt and Willard 2009). Douglas’ illustration
that the Everglades was not a simple swamp, but more a river, inspired of much greater
public awareness that the Everglades had intrinsic value that warranted intensive
hydrologic regime management and restoration efforts. An early result of this awareness
was the formation of the Everglades National Park at the end of the same year. Despite
River of Grass increasing public awareness of the need for Everglades restoration, the
phrase has left an impression that the Everglades is a relatively homogeneous (but
flowing) grassy marsh—and does not entirely convey the ecosystem's spatially diverse
and complex vegetative and topographic characteristics (Richardson 2010).
Eight major landscapes occupied the historic pre-drainage greater Everglades
(roughly from north to south): Custard Apple Swamp, Sawgrass Plains, Ridge and

7
Slough, Peat Transverse Glades, Rockland Marl Marsh, Marl Transverse Glades,
Perrine Marl Marsh, and the Ochopee Marl Marsh (McVoy et al. 2011). Of these, the
Ridge and Slough landscape covered approximately 6,000 km2; over 50% of the total
spatial extent of the Everglades (about 11,000 km2). Prior to hydrologic regime
modification, the Ridge and Slough landscape was composed of abrupt shifts in
topographic relief organized in a regular ‘corrugated’ pattern at distinct intervals parallel
to water flow (Figure 1). Ridges, comprised almost—but not quite—entirely of dense
stands of sawgrass, were located in areas of higher topographic relief, and therefore
lower localized water depths, whereas sloughs containing white water lily (Nymphaea
odorata), bladderworts (Utricularia spp.), and other macrophytes were at lower elevation
and, therefore, deeper localized water depths (Loveless 1959, Ogden 2005, McVoy et al.
2011). A third community, the wet prairie, was comprised of spikerush (Eleocharis
cellulosa), maidencane (Panicum hemitomon), beakrush (Rhynchospora tracyi), and
other emergent plants in areas of intermediate water depths, usually occupying the area
near the boundaries between adjacent ridges and sloughs (Loveless 1959, Ogden
2005). However, the permanent presence of the wet prairie community in the pre-
drainage landscape, particularly at densities currently found, is disputed (McVoy et al.
2011). The Ridge and Slough landscape was also to a much lesser spatial extent
interspersed with higher elevation tree islands that contained hardwood plant
communities with areas that remained fully emergent throughout the year (Loveless
1959, Sklar and Valk 2002, Ross and Sah 2011).
Vegetation community changes
Vegetation communities in the Everglades, as in most wetlands, are restricted to a
relatively narrow range of elevations determined by the hydrologic regime (White 1994,

8
Ross et al. 2003, Armentano et al. 2006). The hydrologic regime is the most significant
factor affecting the distribution, composition, shape and size of vegetation patches
across the Everglades landscape (Gunderson 1994, Busch et al. 1998, Sklar et al. 1999,
Ross et al. 2003, Armentano et al. 2006, Zweig and Kitchens 2008, Todd et al. 2010,
Nungesser 2011, Foti et al. 2012, Sah et al. 2013). Furthermore, stress exerted by the
hydrologic regime is thought to create and maintain ridge and slough communities, as
well as distinct ecological boundaries (Larsen et al. 2007, Givnish et al. 2008, Watts et
al. 2010, Cohen et al. 2011, Foti et al. 2013, Heffernan et al. 2013). Vegetation
production, which is ultimate source of the organic matter in peat, and aerobic
respiration, which consumes that organic material, are also influenced by hydrologic
regime modification (SCT 2003, Zweig and Kitchens 2009, Larsen and Harvey 2010,
D’Odorico et al. 2011, Cohen et al. 2011). Ridges accumulate biomass faster than
sloughs (Childers et al. 2006), but, because water depths are lower and hydroperiods
are shorter on ridges, aerobic respiration rates are also higher (Larsen and Harvey 2010,
Cohen et al. 2011). Over long time scales, the production-respiration equilibrium is
regulated at equal rates within both ridges and sloughs, limiting the difference in
elevation between the two patch types. Therefore, the production-respiration equilibrium
also create and maintain topographic variation, although the specific mechanisms of
topographic creation, maintenance and degradation remain a matter of debate (Larsen
et al. 2007, Cheng et al. 2011, Cohen et al. 2011, Kaplan et al. 2012, Heffernan et al.
2013).
Beginning in the early 20th century, widespread anthropogenic modification of
hydrologic regimes has altered vegetation patch patterning and composition in the Ridge
and Slough landscape (Davis et al. 1994, Fennema et al. 1994, Gunderson 1994, Light
and Dineen 1994, SCT 2003, Ogden 2005, Nungesser 2011, McVoy et al. 2011).

9
Average water levels across the Ridge and Slough landscape are estimated to have
been 30-45 cm lower in 1955 than during between the pre-drainage era; although, water
levels have rebounded in some areas since then, partially through concentrated
restoration efforts (McVoy et al. 2011). Currently, sloughs frequently “dry-down” by the
end of the dry season, but in the pre-drainage Ridge and Slough landscape sloughs are
believed to have dried very rarely (McVoy et al. 2011). Shorter hydroperiods have
significantly restricted the range and abundance of particularly slough species such as
the historically ubiquitous white water lily and the even more hydrologically constrained
spatterdock (Nuphar advena); a species adapted to the deepest water depths (McVoy et
al. 2011). Lower water depths over sustained periods have, alternatively, led to range
expansion in species that are better adapted to lower water levels, such as sawgrass
(Urban et al. 1993, Davis and Ogden 1994, Gunderson 2001). Ridges have invaded
slough areas (SCT 2003, Ogden 2005), and much of the slough landscape, particularly
in Everglades National Park, has been usurped by wet prairies and ridges (Davis et al.
1994, Olmsted and Armentano 1997, Busch et al. 1998). Similarly, woody vegetation
likely did not inhabit the ridge community prior to hydrologic regime modification (McVoy
et al. 2011), but wax myrtle (Myrica cerifera) and coastal plain willow (Salix caroliniana)
frequently inhabit the core of ridge communities in drained areas (Loveless 1959, McVoy
et al. 2011).
Although Everglades’ vegetation across the Ridge and Slough landscape is strongly
regulated by the hydrologic regime, other environmental drivers of vegetation community
changes may operate independently or in concert with hydrologic regime modification.
For example, increased nutrient concentrations are an important driver of vegetation
patterns in areas of the Ridge and Slough landscape, in part caused by the proliferation
of southern cattail (Typha domingensis), which outcompetes sawgrass communities in

10
areas with high phosphorus concentrations and adequate water depths (Urban et al.
1993, Craft et al. 1995, Newman et al. 1996, Daoust and Childers 2004). However,
phosphorus is quickly taken up by organisms and the extent of the influence of
phosphorus enrichment, while penetrating several kilometers into the protected areas of
Everglades National Park, is localized compared to the total extent of the Ridge and
Slough landscape (Childers et al. 2003). Fire events are common in the Everglades, but
damage to non-woody vegetation is limited mostly to above the water surface, and its
direct effects on vegetation communities in the Ridge and Slough landscape are likely
negligible (Herndon et al. 1991, Beckage et al. 2003, Larsen et al. 2011). However, the
influence of fires burning living organic matter on soil accumulation and the interactive
effects of hydrologic regime modification and fire events warrant further research
(Lockwood et al. 2003). Muck fires (peat fires) can burn peat to 10-20 cm deep when
dry, and may exert considerable stress on vegetation patches over long timescales
(Sklar and Valk 2002), such as causing succession of sawgrass dominated ridges into
wet prairies and sloughs (Gunderson 1994). Although the direct impact of muck fires is
likely relatively localized, the spatial propagation of vegetation succession following
muck fire damage also merits future research. Finally, the effects of hurricanes and
moisture redistribution during infrequent and stochastic events driving vegetation
patterns in the Ridge and Slough landscape remains understudied.
Vegetation community and topographic variation loss
The distinct ecological boundaries between vegetation communities that were a
defining feature of the pre-drainage Ridge and Slough landscape are dependent on the
maintenance of abrupt topographic relief, which is itself affected by hydrologic regime
modification (Larsen et al. 2007, Watts et al. 2010). Hydrologic regime modification

11
therefore affects both topographic variation and vegetation community patterning
(because vegetation communities are strongly dependent on the local long-term water
depths and hydroperiods), sometime after an initial perturbation (Ross et al. 2003,
Givnish et al. 2008, Zweig and Kitchens 2009, Watts et al. 2010). However, neither the
relative nor absolute timescales of the interrelated vegetation patterning and topographic
variation changes are well understood. Ross et al. (2003) found that vegetation
communities in the hydrologically diverse Shark Slough, ENP correlated to localized
water depth, but that after hydrologic regime modification vegetation communities lost
association to their absolute water depths. The authors suggest that long-term loss of
connectivity might be caused by vegetation response lags after changing hydrologic
conditions, possibly in combination with increasing fire regimes affecting sawgrass
succession at higher elevations. Givnish et al. (2008) determined that vegetation
communities across a hydrologic gradient responded predictably to long-term water
depths, but that the absolute water depths among basins supporting the same
vegetation communities were significantly different, indicating that temporal lags in
vegetation responses to hydrologic changes may be significant and over extended
timeframes. Watts et al. (2010) hypothesized that topographic variation changes occur
more rapidly than changes in vegetation communities after hydrologic regime
modification. They argued that drainage and stabilization of the hydrologic regime led to
rapid peat loss through aerobic bacterial respiration in higher elevation ridges compared
to sloughs, leading to flattening of landscape-scale topography. Simultaneously, but over
significantly longer timescales, drained and stabilized hydrologic regimes facilitate ridge
expansion through drained sloughs, eventually homogenizing vegetation patches across
landscapes. Shifts in vegetation communities and topography from heterogeneous to
homogeneous landscapes were hypothesized to occur through a relatively rapid

12
transition between the two stable states (Watts et al. 2010, Cohen et al. 2011, Heffernan
et al. 2013).
Vegetation communities and leading indicators of ecological change
Some plant species in the Everglades are more resistant to changing hydrologic
regimes than others because of differences among species in biomass storage,
maturation, regeneration intervals, and fecundity. Specific sets of species therefore may
be particularly useful as leading indicators of environmental change. Possible leading
indicators of change through analysis of differences among species in the Everglades
include work by Zweig and Kitchens (2008, 2009) who found that vegetation groups
within broader community types assigned in to one of several different categories based
on species composition responded to changing hydrologic regimes at different rates as a
consequence of different life-history strategies. Similarly, groups of species that have a
very short turnover time, such as the microbial organisms comprising periphyton
communities, have been suggested as appropriate early indicators of change because
they react quickly to relatively small environmental fluctuations (Gottlieb et al. 2006,
Gaiser 2009, Gaiser et al. 2013). At the landscape scale, Wu et al. (2006) established
that ridge patterning changed in response to modified hydrologic regimes at variable
rates through time, suggesting that changes in ridge patterning itself could be useful as a
leading indicator in predicting community changes. Detection of rapid and potentially
catastrophic environmental changes in the Everglades are mostly concentrated on
specific species, localized patches of communities, distinct groups of species, or,
alternatively, landscape-level processes. In this respect, analyses of changes in
vegetation community composition within a wider landscape as a useful leading indicator
of catastrophic ecosystem changes are currently underdeveloped.

13
The relative timescales of vegetation-topographic variation loss and how long these
interrelated changes occur after an initial perturbation to the hydrologic regime is not well
understood. Increased knowledge of the concomitant vegetation-topography changes
would be an important step towards describing the processes that drive vegetation and
topographic degradation and restoration, and could help Everglades’ environmental
managers assess leading indicators of ecosystem changes.
Objectives and approach
The primary goal of this study is to further understanding of changes in vegetation
community distinctness caused by hydrologic modification using species compositional
differences within and among different landscape blocks across a hydrologic regime
gradient. These issues are addressed in two questions:
1. How is vegetation community distinctness affected by topographic variation
and hydrologic regime changes in the contemporary Everglades Ridge and Slough
landscape?
2. What are the relative timescales of vegetation and topographic variation
change in the contemporary Everglades Ridge and Slough landscape?
I address these questions using spatially extensive and intensive descriptors of
vegetation community composition and their relationships to topography and, ultimately,
the hydrologic regime. I assess differences in vegetation community distinctness by
measuring the segregation of species composition among patches. A spatial measure of
variable hydrologic regimes is used as a proxy for changes through time. Concomitant

14
topographic variation differences are also measured in order to assess the relative
timescales of vegetation and topographic changes after hydrologic regime modification.
Methods
Sampling design and implementation
My study takes advantage of a previously established framework for representative
sampling over a large portion of several historic Everglades landscapes. A Generalized
Random-Tessellation Stratified sampling design (GRTS; Stevens and Olsen 2004) was
used to arrange the Everglades landscapes into a grid of 2 x 5 km landscape blocks
(hereafter referred to as primary sampling units [PSUs]), with the 5 km edge of each
PSU aligned parallel to the historic water flow. A spatially-stratified random sample of 80
PSUs was selected for sampling over a five year period (n = 16 per year), with each
yearly draw also representing a spatially balanced sample of all of the modern
Everglades basins (Everglades National Park (ENP), Loxahatchee National Wildlife
Refuge (LNWR), Water Conservation Area 2 (WCA 2), Water Conservation Area 3A
South (WCA 3A S), Water Conservation Area 3A North (WCA 3A N), and Water
Conservation Area 3B (WCA 3B); Figure 2).
Data for this study were taken from 27 PSUs (from sampling years 1 and 2) that
were located inside the historic distribution of the Ridge and Slough landscape (McVoy
et al. 2011). Four additional PSUs located outside of the historic Ridge and Slough
landscape were sampled but not analyzed in the current study. One PSU was physically
inaccessible for sampling (because of dense cattail overgrowth): PSU 5, located at the
northern boundary of WCA 2. The 27 PSUs ultimately included in this study captured a
wide range of contemporary hydrologic regimes within the historic boundaries of the

15
Everglades Ridge and Slough landscape, with vegetation communities and topographic
variation covering all major basins, from well-conserved to severely degraded (Wu et al.
2006, Givnish et al. 2008, Watts et al. 2010, Nungesser 2011).
Each PSU contained 80 sampling nodes in a spatially-stratified design. The PSUs
were divided in to a grid (each of the sixteen grid cells within a PSU being 1.25 km by
500 m), with 5 nodes randomly distributed within each grid cell. Each node contained
three sampling points; a central sampling point, and two sampling points parallel and
perpendicular to the long axis of the PSU and the historic direction of the water flow (to
the north and east respectively) at random distances between 3 and 35 meters—a total
of 240 sampling points for each PSU. For PSUs within ENP, access, which was usually
by helicopter and foot, restricted sampling to 135 sampling points. GPS coordinates
were calculated on a computer beforehand and then located in the field using a Garmin
GPS 72 navigator (precision: ± 3 m). Field sampling was conducted in 2010 and
continued in 2011 largely during the Everglades’ wet season between the months of July
and December to maximize the number of sampling points with water above the soil
surface. At each sampling points, all plants within a 1 m2 quadrat were identified to
species level, and plant and periphyton densities were estimated as the percentage
cover of the sampling area at 1%, 5% or 10% intervals thereafter.
Each sampling point was also designated in the field to categorical vegetation
community types (for example; ridge, slough, wet prairie), or mixed communities (for
sampling points that were ambiguous, such as the ridge/slough mix) based on a visual
inspection of the species within the quadrat. The water depth was measured using a
meter ruler with a 10 cm diameter foot and was defined as the distance from the peat
surface at the center of the quadrat to the water surface.

16
Estimation of local hydrologic regime
The US Geological Survey’s Everglades Depth Estimation Network (EDEN) records
water stage data daily from 253 stations at a grid size of 400 m2. The height of the water
surface at any geographic point can be calculated through interpolation of water stage
data collected by several nearby stations (Pearlstine et al. 2007). The accuracy of both
the EDEN network’s stage data and its interpolation was independently validated in Liu
et al. (2009). Statistical measures relating to the water depth over several years provide
a more accurate representation of the temporal hydrologic fluxes compared to the field
measurements at time of sampling, which provide only a “snapshot” of daily and
seasonally dynamic hydrologic conditions. However, more precise local water depth
measurements do allow improved estimates of elevation, and thus long-term hydrologic
conditions, as compared to the coarse resolution of the soil elevation map (400 m2
pixels) used by EDEN to estimate water depths. By combining the temporal stage data
from EDEN water surface height records and the measured water depth, we estimated
the fluctuating water depth at each sampling point for the period of time EDEN water
level recorders have been recording (direct measurements since October 1, 1999;
hindcast data available back to January 1, 1991). From these, we calculated long-term
mean water depth and inundation frequency (i.e., hydroperiod) for 20 years prior to the
sampling date for each sampling point. The mean water depth for individual sampling
points over the 20 year record was calculated by using the EDEN record to calculate the
water surface height at each sampling point’s geographic location on the sampling day,
and taking away the measured water depth to calculate the elevation of the peat surface
for each sampling point. Then, the peat surface elevation was taken away from the
mean water surface height over the 20 year EDEN record, giving the mean water depth
over the 20 year record at each sampling point. The mean water depth within each PSU

17
over the 20 year EDEN record was calculated by taking the mean of all within-PSU’s
sampling points’ mean water depths over the 20 year EDEN record. The mean water
depth over the 20 year EDEN record across PSUs represented, in this analysis, the
hydrologic gradient across the Ridge and Slough landscape. Within each basin (ENP,
WCA 3A S, etc.), the mean and variation among PSUs in mean water depth over the 20
year EDEN record was calculated using the mean for all PSUs within each basin (shown
in Figure 2).
Analysis of Vegetation Composition and Distinctness
Differences in the distinctness of vegetation community composition were assessed
across the Ridge and Slough landscape to better understand the effects of hydrologic
regime modification on vegetation patterning. Vegetation community composition
distinctness was quantified using Kruskal's non-metric multidimensional scaling (NMDS;
Kruskal 1964) ordination to partition sampling points within PSUs on the basis of species
composition dissimilarity. I used local-scale (within-sampling points) associations to
assess how vegetation community composition varied as a function of local hydrologic
regimes. To describe distinctness of vegetation communities within each PSU, sampling
points within each PSU were partitioned into two clusters, the distance between cluster
centers providing the measure of vegetation community distinctness. I used the cluster
distance proxy to assess the differences in distinctness among PSUs and its relation to
topographic and ultimately hydrologic characteristics.
The distinctness of vegetation community composition (Question 1) was measured
using clustering of sampling points within ordination space, with each sampling point
containing a vector of species and their respective abundances. Distinctness was
analyzed using NMDS ordination. In this analysis, a single “global” NMDS ordination was

18
created that encompassed all PSUs in order both to obtain a global measurement of the
clustering of sampling points—regardless of the environmental conditions—among all
PSUs and to standardize all measures of dissimilarity within and among-PSUs.
All observations from sampling points within each PSU were separated from the
global NMDS to characterize compositional patterns within PSUs. Observations from
each PSU were coerced into two discrete clusters using k-means clustering. Two
clusters were chosen in this analysis: (1) to simplify within-PSU distinctness measures;
and (2) to best represent the presumed distinct communities associated with the
overwhelmingly dominant ridge and slough communities in the historic pre-drainage
landscape which, in this analysis, should occupy distinct regions of the NMDS ordination
space (because distinct communities are theorized to be composed of distinct sets of
species). Cluster calculations were run 25 times with random starts and the most
appropriate clustering solution was used for this analysis. The likely most appropriate k-
means cluster positions are obtained from the minimization of the sum of squares
distance for each sampling point to the Voronoi-derived cluster centers using a nearest
neighbor algorithm. To calculate a test statistic of vegetation community distinctness, the
sum of squares distance between the two cluster centers was calculated for each PSU,
and divided by the number of sampling points to derive the mean sum of squares (which
is independent of the number of within-PSU points sampled used in this analysis).
Larger cluster distance values result from a greater distance between the two k-means
derived cluster centers, and, at least hypothesized in this study, greater vegetation
community composition distinctness (a two dimensional schematic diagram based on
data from shown in Figure 3a). Conversely, smaller cluster distances (nearer cluster
centers) indicated less distinct vegetation community composition, and therefore a more
vegetatively homogeneous landscape (Figure 3b). The PSUs were hypothesized to

19
display variation in vegetation community composition distinctness, decreasing with
increasing disparity between the estimated pre-drainage hydrologic regime and the
spatially variable contemporary hydrologic regimes.
The PSU cluster distances were related directly to the hydrologic regime using a
vector of the 20 year mean water depth fitted to the NMDS ordination space, aligned in
the direction where it explained the most amount of the variation in the individual
sampling points’ mean water depths (Kantvilas and Minchin 1989). While the method for
arranging the vegetation site scores in the NMDS ordination plot is non-metric, the
ordination space itself is metric (Euclidian), as well as the overlain hydrologic vector. In
this analysis, the ordination space was rotated so that the 20 year hydrologic regime
predictor variable became the new primary axis (hereafter referred to as the hydrologic
axis). Since this rotation shifted sampling points within a PSU equally (the rotation was
about the NMDS origin), cluster distances were unaffected. Rotating the NMDS
ordination to the 20 year hydrologic axis not only enabled analyses on the basis of an
ecologically meaningful variable (as opposed to a randomly generated rotation or a
rotation to the largest principal component), it also enabled assessment of vegetation
community patterns across a linear and regularly spaced axis (representing the 20 year
hydrologic regime).
The relationship between cluster distance (as the measure of community
distinctness) and the long-term hydrologic regime was analyzed to assess the effect
hydrologic regime modification had on vegetation community distinctness across the
Everglades Ridge and Slough landscape. Both drainage and impoundment influence
landscape patterning and community composition (Ross et al. 2003, Wu et al. 2006,
Givnish et al. 2008, Nungesser 2011, Sah et al. 2013), so it is therefore hypothesized
that relationships between hydrologic conditions and vegetation community distinctness

20
would be non-linear, with highest distinctness values at intermediate water levels. The
Gaussian function (which was chosen over least-squares linear regression because of
the hypothesized shape of the relationship between vegetation community distinctness
and the hydrologic regime) was fitted to the vegetation distinctness measure based on
the mean and standard deviation of the PSUs’ hydrologic regimes over the 20 year
hydrologic record.
To assess whether vegetation distinctness corresponded to the physical
segregation of vegetation communities, the mean and variation of the three most
frequently observed vegetation communities were compared across the hydrologic axis
within the NMDS ordination space and related to the 20 year mean water depth.
Because Everglades vegetation communities generally assemble on narrow
hydrologically derived habitats (Loveless 1959, McVoy et al. 2011), communities were
hypothesized to occupy distinct positions across the hydrologic axis. Furthermore,
communities that are dominated by few species, such as ridges (which are dominated by
sawgrass), are hypothesized to occupy a less variable hydrologic regime than others
such as the myriad of species that constitute the slough community.
The premise in this analysis is that cluster distances correspond to distinct
communities, but other patterns could also produce large cluster distances. For
example, PSUs could be composed of a single high-variance cluster rather than two
discrete clusters. To assess the correspondence of cluster distance and distinctness,
PSU-scale vegetation community distinctness was examined over the hydrologic
gradient using site scores based on the NMDS ordination rotated to the 20 year
hydrologic axis. The PSUs with larger cluster distances were assessed for the presence
of distinct clustering (i.e., a bimodal distribution along the primary hydrologic axis) which
were hypothesized to represent dominance by distinct ridge and slough communities. In

21
PSUs with shorter cluster distances, I expected that bimodality would degrade. In other
words, two clusters should be apparent in more vegetatively distinct PSUs if species
composition within these PSUs is strongly partitioned to hydrologically derived habitats.
To test whether the k-means cluster analysis partitioned communities, a global k-
means analysis using two clusters was compared to the field designated vegetation
communities along the hydrologic gradient. A global k-means analysis was chosen
preferentially over summing the individual k-means analyses used for the cluster
distance analyses as there was no expectation that vegetatively indistinct PSUs would
partition into discrete communities. An odds ratio test was used to quantitatively assess
how likely a given cluster was to appear in a particular community, as it revealed how
strongly the k-means clustering technique segregated the field designated vegetation
communities.
A second approach to confirm that k-means derived clusters corresponded to ridges
and sloughs in relatively distinct PSUs assessed the differences in abundance of a
dominant species between the two clusters within each PSU. Sawgrass (Cladium
jamaicense) was chosen because it is overwhelmingly dominant in ridges and relatively
rare in sloughs, the two most spatially extensive vegetation community types, and it is
currently ubiquitous in the Ridge and Slough landscape. Within each PSU, the mean
sawgrass percentage cover for each k-means derived cluster in the NMDS ordination
space was calculated. The PSUs were ranked according to their hydrologic regimes
(mean water depth over 20 years), to facilitate understanding of how sawgrass
partitioned within and among PSUs across the hydrologic gradient. Distinct vegetation
communities within PSUs were hypothesized to segregate strongly between clusters,
with one cluster containing a high abundance of sawgrass (corresponding to ridges) and
the other a low abundance of sawgrass (sloughs). Furthermore, k-means clustering was

22
hypothesized to not partition well in vegetatively degraded PSUs, because they are
either frequently dominated by a single community type or there is more mixing of
species among communities. Very dry or very wet PSUs over the 20 year hydrologic
record should be reflected by absolute sawgrass abundances, where drier PSUs have
more total sawgrass and wet PSUs, less, corresponding to sawgrass’ competitiveness in
drier landscapes.
The relationship between vegetation community distinctness and a quantified
measure of topographic variation was evaluated to further understanding of the relative
timescales of changes across the Ridge and Slough landscape. Topographic variation
within each PSU was calculated using the standard deviation of elevations (or measured
water depths). To assess the relative rates of vegetation community distinctness and
topographic variation changes (Question 2), the relationship between cluster distance
and within-PSU topographic variation was assessed by simple least-squares linear
regression. The relationship between vegetation community distinctness and
topographic variation was also used to assess the relative time scales over which
vegetation and topography degrade. If vegetation was found to degrade first, then PSUs
with indistinct communities but large topographic variation would be observed;
conversely, if topography was found to degrade before vegetation, then the expected
observation would be PSUs with distinct vegetation communities but little topographic
variation. To evaluate these predictions, vegetation community distinctness and
topographic variation by PSU were categorized based on the position of a local minimum
across a gradient of each measure’s value. The local minimum was reasoned to
represent a relatively rapid transition in both vegetation community distinctness and
topographic variation. Relative timescales of change were evaluated using a quadrant
system, with each quadrant relating to the four possible states of conserved or degraded

23
community distinctness and topographic variation based on the local minimum
(schematic diagram shown in Figure 4). The quadrant system is therefore also a
measure of PSU-scale ecological condition. Vegetation community changes were likely
influenced by topographic variation changes if significantly more PSUs were located in
the conserved vegetation-degraded topography quadrant, and vice versa.
Three measures to evaluate the relationship between elevation and vegetation
community composition within each PSU were created. Each measure tested the
hypothesis that the association between vegetation communities and topographic
variation decreased with long-term hydrologic regime modification at both the wettest
and the driest extremes of the hydrologic gradient. The first measure used was the
difference in water depth between k-means derived clusters, which was calculated by
taking the difference in the mean of water depths (as a proxy for elevation) over the 20
year record for all sampling points within each cluster constituting a PSU. The k-means
difference in mean water depth therefore provides a statistic that is directly derived from
the vegetation community composition distinctness (cluster distance) and topographic
variation (with water depth as the proxy) analyses. The second measure was the
correlation between each sampling point’s sawgrass abundance and the mean water
depth over 20 years within each PSU, analyzed using least-squares regression.
Sawgrass’ correlation to water depth was included because sawgrass abundance is a
relatively simple metric to quantify for Everglades’ environmental managers and least-
squares regression is a relatively concise and commonly used statistical technique. The
third measure utilized the Mantel test (Fortin et al. 2002) to provide a metric of the
correlation between vegetation community composition and 20 year mean water depth.
The Mantel test was used in this analysis because the technique compares actual

24
vegetation community composition and related topographic elevation as a commonly
used ecological multivariate analytical method.
These five indices: k-means difference in water depth, sawgrass correlation to water
depth, Mantel test, vegetation community distinctness and topographic variation, were
mapped on to the Everglades Ridge and Slough landscape to assess the spatial
patterns of landscape condition. A sixth map, derived from the categorical community
distinctness-topography quadrants, shows the PSUs that are vegetatively and
topographically conserved, degraded or in a transitional state based on the vegetation-
topography quadrant system of landscape condition.
Software
All analyses and visualizations were performed using R (version 2.15.2; R
Development Core Team 2011), except the vegetation-topography quadrant graphic
(Figure 4), which was created using Inkscape (version 0.48; www.inkscape.org). The
global NMDS ordination was created using the metaMDS function in the vegan package
(version 2.0-5; Oksanen et al. 2005). The default convergence criterion in monoMDS
(the engine metaMDS uses to produce random starting points) was too slack to find a
convergent solution and was therefore tightened (but is now the default criterion as of
vegan 2.0-6). The dissimilarity matrix for the NMDS ordination was calculated using the
vegdist function in vegan with the Jaccard index, which, as a metric index, was
preferentially chosen for detecting the underlying metric hydrologic gradient over the
semimetric Bray-Curtis. Fitting and rotating the NMDS to the 20 year hydrologic axis was
completed using the enfit function in vegan. The Mantel test also used the Jaccard index
for calculating the distance matrix for vegetation communities and the Euclidean index
was used for the distance matrix for the mean water depth over 20 years vector. The k-

25
means derived clusters were calculated using the R base package stats (R Development
Core Team 2011), and all maps were created using the base R plotting functions (R
Development Core Team 2011). All other figures were created using ggplot2 (version
0.9.1; Wickham 2008) and combined, where relevant, using lattice (version 0.20-24;
Sarkar 2010) or Inkscape (www.inkscape.org).
Results
Vegetation composition and distinctness
Overall, 4,859 points were sampled and used in these analyses, including 2,570
ridge, 1,036 slough, and 593 wet prairie communities based on field designations. Seven
different vegetation communities across the entire Everglades Ridge and Slough
landscape were described, although, of these, only four communities had greater than
50 sampling points (ridge, slough, wet prairie and cattail). Eight different assemblages in
the 1 m2 quadrats were characterized as not belonging to a single community type and
labelled as one of the “mixed” communities (for example, a ridge/slough mix). Twenty-
seven additional sampling points were measured but were dry, and were removed prior
to analysis because they would provide inaccurate long-term mean water depths. One
sample was removed because of a water depth recording error. Four sampling points
were removed because no plants were recorded, and would have prohibited the NMDS
ordination calculation. Two sampling points were removed from the analysis and the
NMDS ordination rerun because of the presence of cocoplum (Chrysobalanus icaco) at
extreme water depths having an unduly large effect on the ordination calculation. A
scree plot of the NMDS ordination suggested weakly that five dimensions would best
represent the data, resulting in a stress value of 0.0835 (8.35%).

26
Species were largely limited to their field designated communities: sawgrass
(Cladium jamaicense) was most abundant in ridges and then in the mixed ridge/slough
and ridge/wet prairie communities; spikerush (Eleocharis spp.) were most abundant in
wet prairies and slough-wet prairie mix; bladderworts (Utricularia spp.) and white water
lily (Nymphaea odorata) were most abundant in sloughs and mixed slough communities;
and cattail (Typha domingensis) was almost entirely contained within the cattail
community (Figure 5). Periphyton was more cosmopolitan than any other component of
the Everglades plant communities; it was abundant in all major community types in
except the driest (tree island and mixed tree island) and likely the most eutrophic (cattail;
see McCormick et al. 2008, Gaiser et al. 2011). Vegetation communities categorized by
their field designation sorted along the 20 year mean water depth (Figure 6). For
example, ridges were consistently at lower water depths than wet prairies which were, in
turn, constantly drier than sloughs. The contemporary hydrologic regime varied among
all Everglades basins: Water Conservation Area 3A North (WCA 3A N) had the highest
20 year mean water depth, but also the largest variance within all three of the most
frequently sampled vegetation communities suggesting that it is the most hydrologically
diverse basin (Figure 6). Loxahatchee National Wildlife Reserve (LNWR) had the lowest
water depth over this period across all major vegetation communities. No wet prairie
communities were observed in Water Conservation Area 2 (WCA 2), and only one in
LNWR, whereas wet prairie communities were unusually abundant compared to sloughs
in Everglades National Park (ENP). Water Conservation Area 3A South (WCA 3A S) had
a proportionately higher percentage of sloughs compared to all other basins. Within each
Everglades basin, the 20 year mean water depth decreased from sloughs to wet prairies
(which were entirely absent in WCA 2), to ridges. However, communities did not equate
hydrologically between basins; for example, the 157 sloughs in LNWR were at a lower

27
20 year mean water depth (24.3 cm) than the mean water depth in the 2,240 ridges in
every other basin (mean = 30.75 cm; Figure 6).
The three most frequently observed vegetation communities segregated distinctly
across the hydrologic axis (Figure 7). The ridge community was most frequently
observed close to its median water depth, indicating that this community is relatively
compositionally homogeneous, whereas sloughs and wet prairie communities displayed
more variability across the hydrologic axis. In conserved PSUs with distinct community
composition (large cluster distances), NMDS scores along the hydrologic vector were
split clearly into two clusters (Figure 8). However, in more vegetatively degraded PSUs,
the within-PSU NMDS site scores along the hydrologic axis were less bimodal and
clusters were less distinct.
Within almost all PSUs, sawgrass abundances were weighted heavily towards a
single cluster (Figure 9). However, the segregation of sawgrass between clusters was
greatest in the most distinct PSUs (the green [or lighter] bars in Figure 9) with all PSUs
containing at least < 20% in one cluster and > 60% in the other. Sawgrass segregation
between clusters was still observed in the less distinct PSUs (the red [or darker] bars in
Figure 9), but distributions and average sawgrass abundances were considerably less
predictable than in more distinct PSUs.
The global k-means clustering analysis of vegetation communities correlated
strongly to the mean water depth over 20 years (as a proxy for topographic elevation;
Figure 10). A total of 81.3% field designated ridge communities were in Cluster 1 and
97.5% of sloughs were located in cluster 2, along with 87.9% of wet prairie communities.
Furthermore, the mean water depths for the three most frequently observed vegetation
communities, the ridge, slough, and wet prairie, correlated with the mean water depths
along the hydrologic axis (Figure 7). Mixed vegetation communities designated in the

28
field were almost always located between their constituent communities, for example,
mixed slough/wet prairie communities had a mean water depth, hydroperiod, and cluster
ratios between that of the slough and the wet prairie communities. However, this was
notably not the case for the relatively frequently observed ridge/slough mixed community
which had on average marginally lower mean water depths than ridges. The odds ratio
for the three community types based on the global k-means cluster analysis indicated
that field designated ridges were 169 times more likely to be in cluster 1 than sloughs,
and that wet prairies were more closely aligned to sloughs than ridges (odds ratio of 5.37
and 31.5, respectively; Figure 11).
Hydrologic and topographic effects on distinctness
Distinct communities, represented by cluster distance, were only observed across
the 20 year hydrologic gradient between about 20-50 cm mean water depth (Figure 12).
The PSUs near the hydrologic extremes, in both the wetter and the drier directions,
contained only relatively indistinct communities. The PSUs in ENP, WCA 3A S and
Water Conservation Area 3B (WCA 3B) clustered relatively closely on both the
vegetation community distinctness and the 20 year mean water depth axes, whereas
WCA 3A N’s PSUs had both variable vegetation distinctness (i.e., between cluster
distance) and high variability in 20 year mean water depth (containing both the two driest
and three wettest PSUs along the hydrologic gradient). Three PSUs, all in northern WCA
3A N, contained more than 5% relative total cattail abundance as a percentage of the
total vegetation cover (PSU 11 at 6.29%; PSU 27 at 16.00%; and PSU 19 at 20.57%),
which correlated to increased community composition distinctness (cluster distance =
0.288, 0.904, and 0.689, respectively).
29
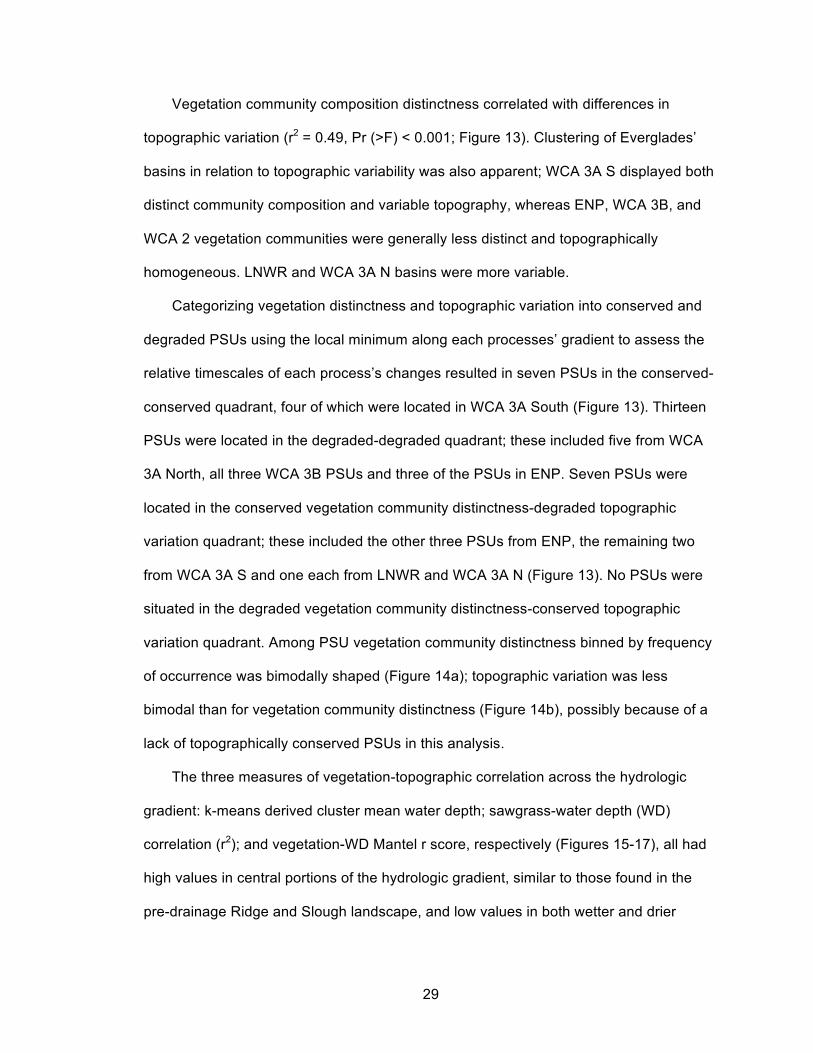
Vegetation community composition distinctness correlated with differences in
topographic variation (r2 = 0.49, Pr (>F) < 0.001; Figure 13). Clustering of Everglades’
basins in relation to topographic variability was also apparent; WCA 3A S displayed both
distinct community composition and variable topography, whereas ENP, WCA 3B, and
WCA 2 vegetation communities were generally less distinct and topographically
homogeneous. LNWR and WCA 3A N basins were more variable.
Categorizing vegetation distinctness and topographic variation into conserved and
degraded PSUs using the local minimum along each processes’ gradient to assess the
relative timescales of each process’s changes resulted in seven PSUs in the conserved-
conserved quadrant, four of which were located in WCA 3A South (Figure 13). Thirteen
PSUs were located in the degraded-degraded quadrant; these included five from WCA
3A North, all three WCA 3B PSUs and three of the PSUs in ENP. Seven PSUs were
located in the conserved vegetation community distinctness-degraded topographic
variation quadrant; these included the other three PSUs from ENP, the remaining two
from WCA 3A S and one each from LNWR and WCA 3A N (Figure 13). No PSUs were
situated in the degraded vegetation community distinctness-conserved topographic
variation quadrant. Among PSU vegetation community distinctness binned by frequency
of occurrence was bimodally shaped (Figure 14a); topographic variation was less
bimodal than for vegetation community distinctness (Figure 14b), possibly because of a
lack of topographically conserved PSUs in this analysis.
The three measures of vegetation-topographic correlation across the hydrologic
gradient: k-means derived cluster mean water depth; sawgrass-water depth (WD)
correlation (r2); and vegetation-WD Mantel r score, respectively (Figures 15-17), all had
high values in central portions of the hydrologic gradient, similar to those found in the
pre-drainage Ridge and Slough landscape, and low values in both wetter and drier
30
hydrologic extremes. Vegetation-topography correlations were again highest between
about 20-50 cm mean water depth, and no large values were found at either the wettest
or driest extremes of the hydrologic gradient.
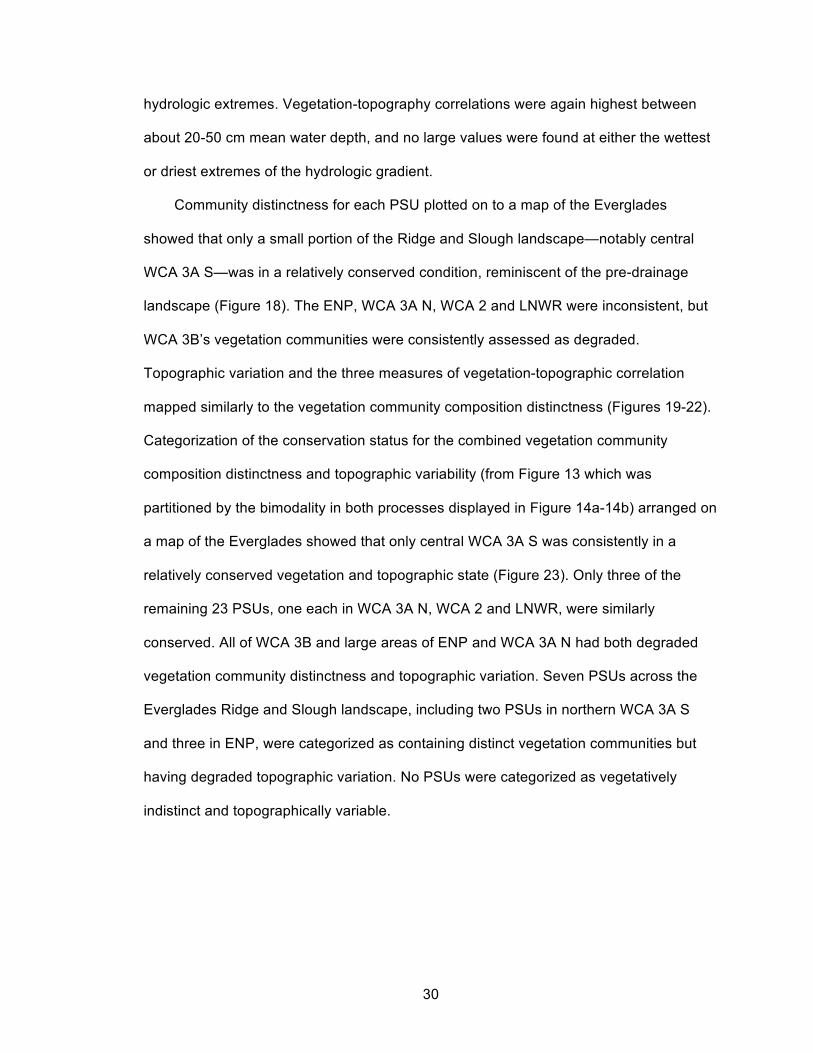
Community distinctness for each PSU plotted on to a map of the Everglades
showed that only a small portion of the Ridge and Slough landscape—notably central
WCA 3A S—was in a relatively conserved condition, reminiscent of the pre-drainage
landscape (Figure 18). The ENP, WCA 3A N, WCA 2 and LNWR were inconsistent, but
WCA 3B’s vegetation communities were consistently assessed as degraded.
Topographic variation and the three measures of vegetation-topographic correlation
mapped similarly to the vegetation community composition distinctness (Figures 19-22).
Categorization of the conservation status for the combined vegetation community
composition distinctness and topographic variability (from Figure 13 which was
partitioned by the bimodality in both processes displayed in Figure 14a-14b) arranged on
a map of the Everglades showed that only central WCA 3A S was consistently in a
relatively conserved vegetation and topographic state (Figure 23). Only three of the
remaining 23 PSUs, one each in WCA 3A N, WCA 2 and LNWR, were similarly
conserved. All of WCA 3B and large areas of ENP and WCA 3A N had both degraded
vegetation community distinctness and topographic variation. Seven PSUs across the
Everglades Ridge and Slough landscape, including two PSUs in northern WCA 3A S
and three in ENP, were categorized as containing distinct vegetation communities but
having degraded topographic variation. No PSUs were categorized as vegetatively
indistinct and topographically variable.

31
Discussion
The results of this study show that degradation of vegetation community
composition distinctness in the Everglades Ridge and Slough landscape is widespread,
contrasting with the distinct vegetation communities that defined this landscape before
significant human-induced modifications of the hydrologic regime began in the early 20th
century. Outside of the intermediate range of contemporary long-term hydrologic
regimes observed in this study—in both the drier and wetter directions—distinct
vegetation communities were absent. Differences in vegetation community composition
distinctness and topographic variation in this study were correlated across the hydrologic
gradient. Despite being highly coupled, vegetation community composition changes
likely lag behind those in topographic variability, based on the prevalence of PSUs which
possessed distinct community composition and homogeneous topographic relief and the
absence of PSUs with the opposite configuration. The occurrence of degraded
vegetation communities approximately within the range of long-term mean water depths
that also support distinct communities may reflect decadal-scale lags in vegetation
responses to changes in hydrologic regime restoration; however, it cannot be discounted
that degraded landscapes reside within a vegetatively and topographically
homogeneous alternative stable state, constrained by a large or possibly even
impassable threshold in hydrologic conditions, which prevent vegetation pattern
restoration (see Larsen et al. 2007, Cohen et al. 2011, Heffernan et al. 2013).
Vegetation community distinctness in the Ridge and Slough landscape
The quantitative measures of landscape-scale community composition distinctness
strongly suggest that much of the vegetation community patterning that was a feature of
32
the pre-drainage Ridge and Slough landscape has been lost. All basins in the
Everglades Ridge and Slough landscape displayed extensive vegetation community
degradation, with the notable exception of central Water Conservation Area 3A South
(WCA 3A S), which contained relatively conserved (i.e. distinct) vegetation communities
(Figure 18). Direct comparisons of community distinctness between the pre-drainage
and the contemporary landscapes assessed in this study are precluded by the limited
quantitative data on historical vegetation community patterning. However, what is certain
is that the pre-drainage landscape was dominated by stands of sawgrass in ridge
communities that strikingly contrasted with the surrounding more open sloughs.
Vegetation community composition distinctness in the historic pre-drainage Everglades
landscape would likely have been high, particularly if, as asserted by (McVoy et al.
2011), wet prairie communities were less frequent and less densely populated by
several wet prairie species such as spikerush (Eleocharis cellulosa) and maidencane
(Panicum hemitomon) that were commonly found in this study (Figures 5 and 10). Even
the most conserved basin in this study, central WCA 3A S, contained a high abundance
of the wet prairie community (Figure 6). Therefore, although portions of central WCA 3A
S have likely the most similar vegetation community patterning to the pre-drainage Ridge
and Slough landscape based on findings in this research, central WCA 3A S abundant,
dense and persistent wet prairie communities mean that even it likely displays some
amount of degraded vegetative patterning compared to what the area historically
exhibited.
Several patterns assessed in this study support the assertion that shorter cluster
distances reflect vegetation community degradation based on loss of compositional
distinctness in the Ridge and Slough landscape. For example, in the global k-means
cluster analysis, sets of species partitioned strongly within field designated communities

33
(Figure 5). Ridges were found to be dominated by sawgrass, whereas wet prairies and
sloughs shared more similar species and were more cosmopolitan. Differences in
distinctness between ridges and sloughs as an indicator of vegetation community
change is supported by distinctness measures based on the k-means derived clustering
of sawgrass abundances (Figure 9). In more conserved PSUs, sawgrass abundances
were consistently well separated by cluster (with all of the more conserved PSUs
containing at least < 20% in one cluster and > 60% in the other). Ridges and sloughs
broadly occupy the two end members of the NMDS ordination gradient, with the wet
prairie community occupying a more central portion (Figure 7). Similarly, ridge
communities were considerably more likely to be in a particular cluster over the slough
community and, again, the wet prairie community was more divided among clusters
(Figure 11). In addition, differences among PSUs related to the loss of bimodal
clustering as distinctness decreased (Figure 8). Given that this bimodality is based on
dominance by the ridge community at one end of the gradient and the slough community
at the other (see Figure 7), degradation of bimodality (and therefore distinctness) is
based on the loss of either ridge or slough communities and the proliferation of centrally
positioned wet prairie or mixed communities. The loss of vegetation distinctness among
PSUs is therefore likely to be mostly influenced by pattern degradation among ridge and
slough communities, the proliferation of communities that occupy a more central portion
of the hydrologic gradient, or possibly the mixing of species beyond historic locations.
Unlike slough communities, cattail communities are able to form dense and
relatively uniform stands with substantial biomass, and therefore fill a different ecological
role in the Everglades than slough communities. The cattail (Typha domingensis)
species was found in significant quantities (> 5% total relative abundance) in three
PSUs, which may have increased cluster distance in those landscapes. Cattail may

34
increase cluster distance, and therefore vegetation community distinctness, as it rapidly
proliferates in areas that have been impacted by phosphorus enrichment, possibly either
by encroachment into sloughs and usurping slough species in deeper waters or through
outcompeting ridges in ridge-dominated areas. Cattail creates slough-like environments
through aeration of soils from flow-through convection in the roots and rhizomes,
resulting in deeper water conditions (Belanger et al. 1989, Urban et al. 1993). Because
of the nature of this study’s statistical analysis, the presence of significant quantities of
cattail within PSUs likely results in similar clustering outputs to PSUs with high
abundances of sloughs. Prolific cattail within PSUs is likely caused by eutrophication
(McCormick et al. 2008, Gaiser et al. 2011), and should therefore be considered
degraded, despite the likely increase in cluster distance. Therefore, in heavily eutrophic
areas of the Ridge and Slough landscape, caution is advised is using community
composition based cluster distance measures as the sole measure of landscape
degradation.
Vegetation community distinctness and hydrologic regime modification
The results of this study suggest that distinct vegetation communities require
hydrologic conditions similar to those believed to have existed in the pre-drainage Ridge
and Slough landscape (Figure 12; McVoy et al. 2011). Distinct vegetation communities
occurred almost entirely within the range of 20-50 cm long-term mean water depth
(Figure 12). Assuming a steady yearly cycle between the two hydrologic extremes
averaged across ridges and sloughs in the pre-drainage landscape—estimated at 6 cm
for ridges and 67 cm for sloughs in McVoy et al. (2011)—the mean of 36.5 cm is roughly
similar to the 20 year hydrologic regime of the most conserved vegetation communities

35
in this analysis. In the extremes of the hydrologic regime gradient—near both the driest
and the wettest conditions—vegetation community distinctness was consistently low.
This study relates the consequences of a temporally variable hydrologic regime on
vegetation community composition distinctness using a space-for-time substitution.
Vegetation community distinctness was found to react relatively predictably and
negatively as the hydrologic regime departs further from the estimated pre-drainage
regimes towards the extreme end-members of the hydrologic gradient (Figure 12). In this
study, the spatial analysis is supported by previous works that relate the hydrologic
regime to vegetation community changes through time. For example, Armentano et al.
(2006) established that composition and patterning of vegetation communities
responded rapidly and substantially to changing hydrologic conditions over a 24 year
period in Taylor Slough, ENP, but that vegetation communities did not always follow
hydrologic regime changes. Busch et al. (1998) found that vegetation communities
assessed over a decade associated predictably on hydrologically derived habitats and
responded to hydrologic changes over a 40 year period. These time-based studies
support the results of this spatially-focused study, showing that the distance between
clusters is a faithful representation of vegetation community composition distinctness
and that distinctness is negatively impacted with increasing hydrologic regime
modification.
Vegetation community distinctness and topographic variation
In the Everglades Ridge and Slough landscape, as in all wetlands, topography acts
as an intermediary between hydrologic processes exerting stress and the resultant
vegetation community patterning (Figure 7, 9-10; van der Valk 1981, Mitsch and
Gosselink 2000). Changes in topographic variation therefore affect vegetation patterning

36
as species are forced to exist within hydrologically derived niche spaces that they did not
previously, or species shift to a novel area that may or may not already be occupied by
another species. The complex relationship that plants have with the hydrologic regime
found in this study builds on the empirical research by Watts et al. (2010) and Givnish et
al. (2008) and theory by Larsen et al. (2007), Cohen et al. (2011), Heffernan et al.
(2013), and others, who have established that hydrologically drained as well as
impounded landscapes resulted in reduced topographic variability in the Ridge and
Slough landscape. As topographic variation is lost, vegetation community distinctness
also decreases (Figure 13) indicating not only that vegetation-topography changes are
closely coupled, but that their respective changes are both influenced by hydrologic
regime modification (Watts et al. 2010, Cohen et al. 2011, Heffernan et al. 2013); Figure
12 and 13).
Vegetation and topographic response lags
Variation in water depths among Everglades’ basins and associated differences in
vegetation communities suggest the possibility of temporal lags in past and future
vegetation responses to hydrologic modification (Figure 12). The high abundance of
lower water depth wet prairie communities in place of sloughs in ENP compared to in
WCA 3A (Figure 12), as well as the dominance of the ridge community over all other
community types in WCA 3B, despite both WCA 3B and ENP having similar long-term
mean water depths to the more vegetatively conserved WCA 3A S (Figure 6), are both
phenomenon indicative of temporal response lags. Furthermore, habitat settlement by
species to field derived communities was found to be consistent among basins even
though the absolute long-term water depths were variable (Figure 6 and 10), indicating
that responses by vegetation communities lag behind changes in hydrologic regimes.
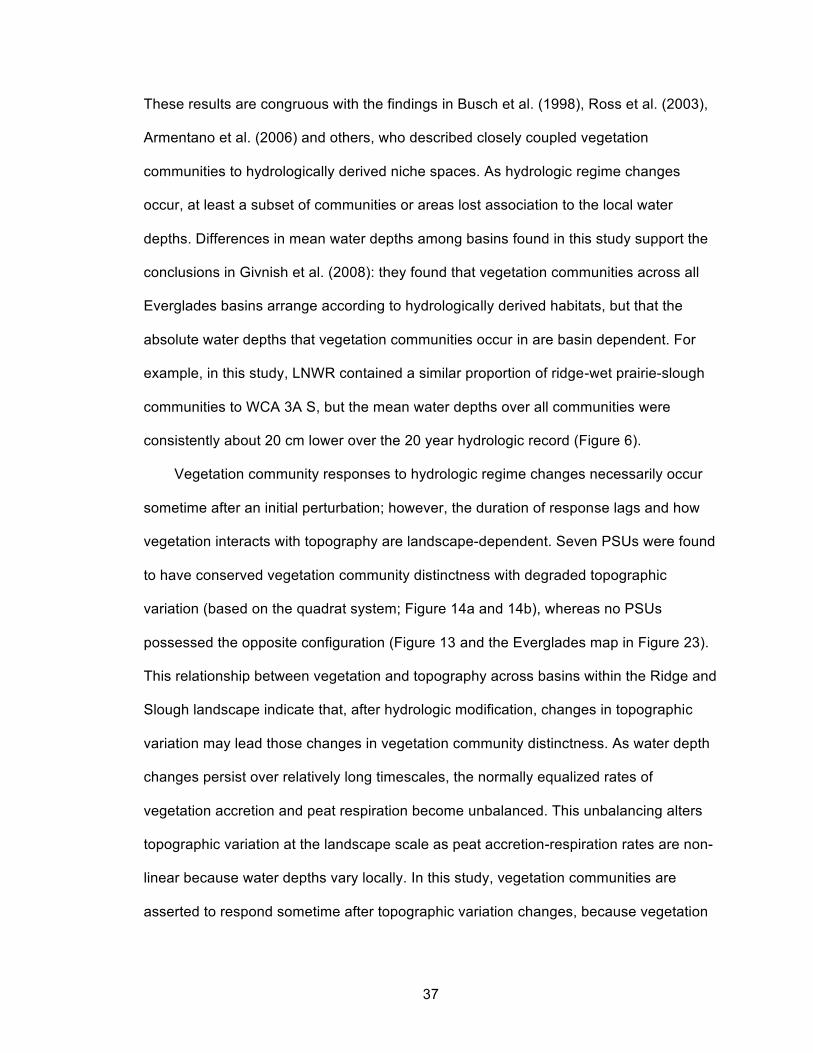
37
These results are congruous with the findings in Busch et al. (1998), Ross et al. (2003),
Armentano et al. (2006) and others, who described closely coupled vegetation
communities to hydrologically derived niche spaces. As hydrologic regime changes
occur, at least a subset of communities or areas lost association to the local water
depths. Differences in mean water depths among basins found in this study support the
conclusions in Givnish et al. (2008): they found that vegetation communities across all
Everglades basins arrange according to hydrologically derived habitats, but that the
absolute water depths that vegetation communities occur in are basin dependent. For
example, in this study, LNWR contained a similar proportion of ridge-wet prairie-slough
communities to WCA 3A S, but the mean water depths over all communities were
consistently about 20 cm lower over the 20 year hydrologic record (Figure 6).
Vegetation community responses to hydrologic regime changes necessarily occur
sometime after an initial perturbation; however, the duration of response lags and how
vegetation interacts with topography are landscape-dependent. Seven PSUs were found
to have conserved vegetation community distinctness with degraded topographic
variation (based on the quadrat system; Figure 14a and 14b), whereas no PSUs
possessed the opposite configuration (Figure 13 and the Everglades map in Figure 23).
This relationship between vegetation and topography across basins within the Ridge and
Slough landscape indicate that, after hydrologic modification, changes in topographic
variation may lead those changes in vegetation community distinctness. As water depth
changes persist over relatively long timescales, the normally equalized rates of
vegetation accretion and peat respiration become unbalanced. This unbalancing alters
topographic variation at the landscape scale as peat accretion-respiration rates are non-
linear because water depths vary locally. In this study, vegetation communities are
asserted to respond sometime after topographic variation changes, because vegetation

38
responses occur only after amenable habitats arise with changes in water depth. For
species that vegetatively propagate, such as sawgrass (Cladium jamaicense), the loss of
topographic variation between adjacent patches facilitates this advancement because
there is an effective blurring of habitats between adjacent patches. Species that access
the seed bank, such as many wet prairie species, do not necessarily interact directly with
an ecological boundary; however, hydrologic conditions must be favorable for them to
propagate, survive, or outcompete other species in a new patch type. Ultimately, this
study suggests that when species move beyond their historic positions, vegetation
community distinctness reduces because different species move beyond their historic
positions at different rates.
Among basins, conserved vegetation communities existed predominantly within a
range of 20-50 cm mean water depth over the 20 year period assessed in this study
(Figure 12). However, seven vegetatively degraded PSUs in the Everglades National
Park (ENP) and Water Conservation Area 3B (WCA 3B) contained long-term hydrologic
conditions similar to those in vegetatively conserved PSUs (Figure 12). Hydrologic
management decisions in the 1940s through to the 1980s resulted in considerable
drying in ENP (Light and Dineen 1994, Ross et al. 2003, Gunderson and Light 2006,
Armentano et al. 2006), but possibly also WCA 3B as it borders ENP to the north.
Reduced water levels in these basins in the 1930s through 1970s resulted in the
establishment of two relatively intensive efforts to restore water levels towards pre-
drainage hydrologic regimes with Florida Governor Bob Graham’s “Save our
Everglades” program, introduced in 1983-4, and the dissolution by the U.S. Congress of
a Federal program that required considerable water storage in the Water Conservation
Areas that hydrologically starved the downstream ENP (Light and Dineen 1994,
Gunderson and Light 2006). These two programs were reinforced in 2000 with the

39
unveiling of the Comprehensive Everglades Restoration Plan (CERP; McLean et al.
2002, Sklar et al. 2005). Other studies also confirm that the hydrologic regime pre-1991
in at least ENP were lower, such as Busch et al. (1998), Armentano et al. (2006), and
Sah et al. (2013), with an increase in water levels only occurring relatively recently,
within the range of the EDEN water surface height records (about 20 years). Therefore,
vegetation communities in ENP and WCA 3B that are currently vegetatively degraded
may not yet have noticeably responded to hydrologic regime restoration efforts that were
restored to a reasonable degree over 20 years ago. Neither the PSUs in ENP nor WCA
3B were found to have any significant abundance of cattail, indicating that cattail
prevalence likely does not conflate community distinctness measures as has probably
occurred elsewhere in the Ridge and Slough landscape.
Vegetation community distinctness responses to restoration of hydrologic regimes
probably respond significantly at the landscape scale at timescales beyond 20 years, if
they occur at all. Despite improvements in hydrologic regimes to approximately pre-
drainage levels over the last 20 years, vegetation communities in most notably ENP and
WCA 3B still have not recovered to a vegetatively distinct or patterned landscape.
Although vegetation recovery lags are possibly 20 years or more behind sampling dates
in this analysis, the long history of lower water depths in these landscapes from the
beginning of the 20th century indicate that it is possible that vegetation community
response lags are considerably longer than this. Previous studies addressing lags have
found similar, but not as extreme, timescales of vegetation responses. For example,
Zweig and Kitchens (2008) determined that vegetation communities in southern WCA 3A
are influenced considerably by both the current and the historic hydrologic regimes. In
addition, they found that vegetation responses to hydrologic regime modification varied
among species; sawgrass and white water lily response times were about four years
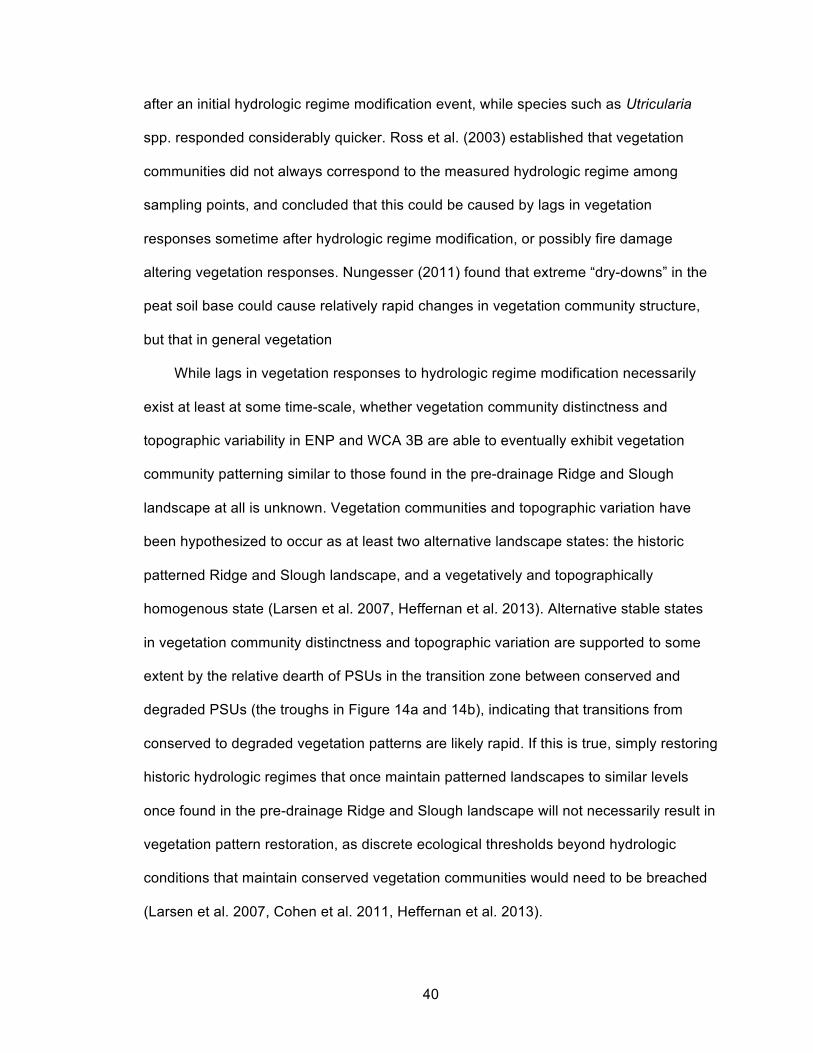
40
after an initial hydrologic regime modification event, while species such as Utricularia
spp. responded considerably quicker. Ross et al. (2003) established that vegetation
communities did not always correspond to the measured hydrologic regime among
sampling points, and concluded that this could be caused by lags in vegetation
responses sometime after hydrologic regime modification, or possibly fire damage
altering vegetation responses. Nungesser (2011) found that extreme “dry-downs” in the
peat soil base could cause relatively rapid changes in vegetation community structure,
but that in general vegetation
While lags in vegetation responses to hydrologic regime modification necessarily
exist at least at some time-scale, whether vegetation community distinctness and
topographic variability in ENP and WCA 3B are able to eventually exhibit vegetation
community patterning similar to those found in the pre-drainage Ridge and Slough
landscape at all is unknown. Vegetation communities and topographic variation have
been hypothesized to occur as at least two alternative landscape states: the historic
patterned Ridge and Slough landscape, and a vegetatively and topographically
homogenous state (Larsen et al. 2007, Heffernan et al. 2013). Alternative stable states
in vegetation community distinctness and topographic variation are supported to some
extent by the relative dearth of PSUs in the transition zone between conserved and
degraded PSUs (the troughs in Figure 14a and 14b), indicating that transitions from
conserved to degraded vegetation patterns are likely rapid. If this is true, simply restoring
historic hydrologic regimes that once maintain patterned landscapes to similar levels
once found in the pre-drainage Ridge and Slough landscape will not necessarily result in
vegetation pattern restoration, as discrete ecological thresholds beyond hydrologic
conditions that maintain conserved vegetation communities would need to be breached
(Larsen et al. 2007, Cohen et al. 2011, Heffernan et al. 2013).

41
Conclusions
Theoretical applications
Future studies regarding vegetation community changes within patterned
landscapes and other self-organized ecosystems may benefit from considering
quantified fine-scale vegetation community composition differences as a measure of
environmental degradation. The methodology in this study is a novel technique that is
useful in reducing inherent dimensionality within empirical ecological community data to
a meaningful test statistic that faithfully represents the observed ecological processes in
at least predominantly binary systems (i.e., the domination by ridges and sloughs make
the Ridge and Slough landscape at least in conserved areas predominantly binary). In
this study, measurements of compositional differences facilitated analysis of subtle
variation among local vegetation communities, as well as determination of differences
among landscape blocks across an environmental gradient. Furthermore, complete
measurements of species composition gave this study direct ecological relevance, and
localized measures were easily relatable to the underlying fine-scale elevational
gradients.
Partitioning of patterned landscapes based on the dominance of two distinct
community types (the ridge and slough in this study) based on the distance between two
defined clusters within an ordination space provides a novel method to assess
vegetation pattern degradation. The use of NMDS ordination and k-means derived
cluster distances is an effective methodology for future research relating the degradation
of complex and patchy landscapes. Test statistics deriving metrics for both vegetation
and topography allow direct comparisons between the relative rates of changes in
response to environmental drivers.

42
Management implications
Restoration of vegetation communities within landscapes has long been a goal of
managers of the Everglades ecosystems (McLean et al. 2002, Sklar et al. 2005). This
study helps identify the hydrologic regimes that permit and preclude the persistence of
the Ridge and Slough landscape. Widespread areas of the Ridge and Slough landscape
were found to be in a vegetatively degraded state. Vegetation community degradation is
likely caused by alterations in the hydrologic regimes towards the extremes of the
hydrologic gradient—both in the drier and wetter directions—more extreme than the
regimes believed to have existed in the pre-drainage Ridge and Slough landscape.
Differences in vegetation communities probably reflect changes in topographic variation,
and, therefore, management of the underlying topographic relief deserves more
attention. However, restoration of hydrologic regimes is unlikely to produce immediate
results, as vegetation communities may lag behind hydrologic regime restoration,
possibly for decades. In addition, understanding the role alternative stable state
dynamics has in vegetation community changes in the Ridge and Slough landscape is
critical, as thresholds in hydrologic restoration may prohibit restoration of compositionally
and spatially distinct communities that dominated the pre-drainage Everglades.

43
Figures and Tables
Figure 1. Ridge and Slough landscape of the Everglades. Both ridges and sloughs run roughly parallel to water flow roughly in the north/south direction. (Image courtesy of Robert Sobczak, National Park Service).

44
Figure 2. Site map with 27 landscape blocks (PSUs) from two years of sampling. Red PSUs (PSU 0 to PSU 15) are from year one (2010); blue (PSU 17 to PSU 81) are from year two (2011). The PSUs are 2 km by 5 km and oriented parallel to flow and contain up to 240 sampling points in a spatially-stratified design. Check-marked PSUs in ENP were sampled but outside the historic Ridge and Slough landscape and not analyzed. Dense stands of cattail prohibited sampling of PSU 5 in WCA 2.

45
Figure 3. Two PSUs ordinated by NMDS and clustered by k-means. Sampling points are positioned on the NMDS based on dissimilarities in each sampling points’ species composition. Clustering separates sampling points within PSUs using a nearest neighbor approach. In (a), PSU 23 clusters are relatively far apart, indicating a significant segregation of sampling points, or a relatively conserved PSU. In (b), PSU 9 clusters are closer, indicating a loss of vegetation community distinctness, or a relatively degraded PSU.

46
Figure 4. Schematic of lag scenarios following a reduction in the hydrologic regime: (1) topographic variation is reduced after modification of the hydrologic regime, followed by a lagged response in vegetation community distinctness changes; (2) vegetation community distinctness declines after modification of the hydrologic regime, followed by a lagged response in topographic variation; (3) vegetation community distinctness amd topographic variation loss is simultaneously reduced, with both processes lagging behind modification of the hydrologic regime.

47
Figure 5. Major species’ abundances within the most common field designated communities. Sawgrass is Cladium jamaicense; Spikerushes are Eleocharis celulosa, Elecocharis Eleongata, Eleocharis interstincta, and an unidentified Eleocharis species; Bladderworts are Utricularia cornuta, Utricularia foliosa, Utricularia gibba, Utricularia purpurea, and an unidentified Utricularia species; Waterlily is Nymphaea odorata.

48
Figure 6. Hydrologic regimes for major communities among basins. ENP is Everglades National Park; LNWR is Loxahatchee National Wildlife Refuge; WCA 2; Water Conservation Area 2; WCA 3A S is Water Conservation Area 3A South; WCA 3A N is Water Conservation Area 3A North; WCA 3B is Water Conservation Area 3B. Error bars is the standard deviation associated with water depth within basins. Counts are the total counts of communitiy types within each basin. No wet prairies were found in WCA 2.

49
Figure 7. NMDS ordination scores for the three most abundant vegetation communities. The NMDS is rotated to the hydrologic (mean water depth over 20 years) axis. The ridge, wet prairie and slough communities comprise 86.4% of all sampling points. The ruler at the top is the average water depth over 20 years across the hydrologic vector on the NMDS ordination space.

50
Figure 8. NMDS ordination site scores within PSUs rotated to the hydrologic axis. The NMDS is rotated to the hydrologic (mean water depth over 20 years) axis. From left to right and top to bottom, PSUs are sorted by distinctness (k-means derived cluster distance). Red and blue bars correspond to within-PSU k-means derived clusters.
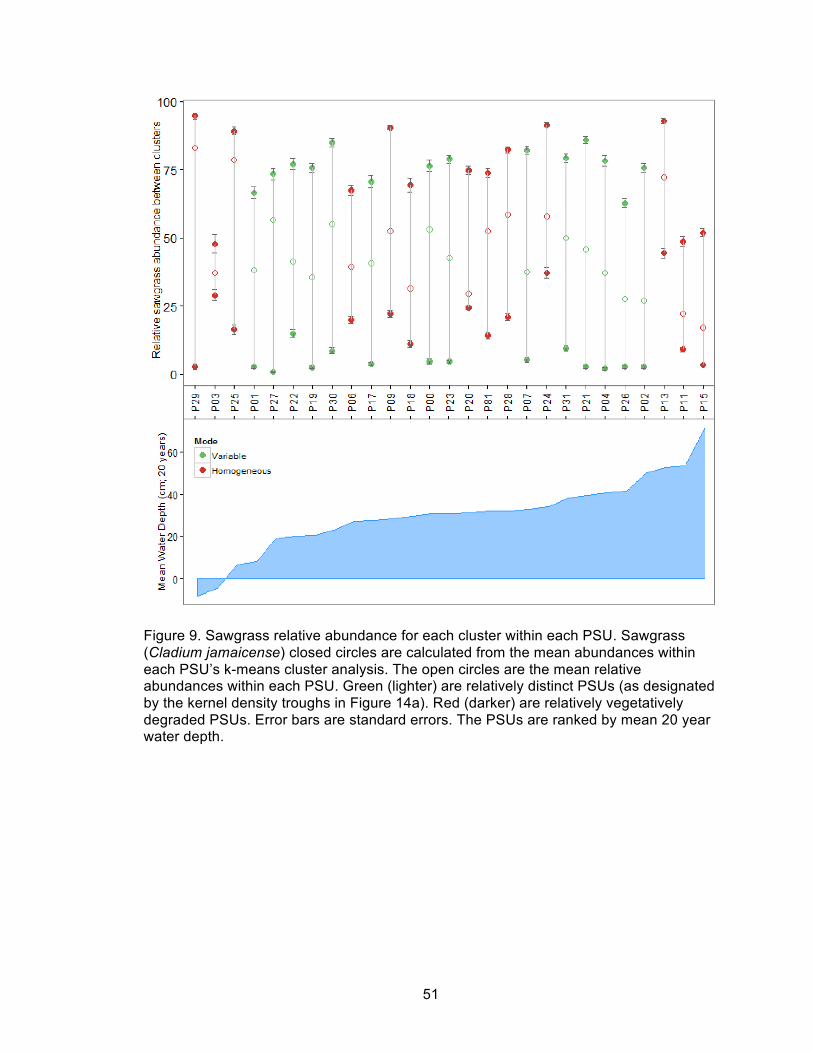
51
Figure 9. Sawgrass relative abundance for each cluster within each PSU. Sawgrass (Cladium jamaicense) closed circles are calculated from the mean abundances within each PSU’s k-means cluster analysis. The open circles are the mean relative abundances within each PSU. Green (lighter) are relatively distinct PSUs (as designated by the kernel density troughs in Figure 14a). Red (darker) are relatively vegetatively degraded PSUs. Error bars are standard errors. The PSUs are ranked by mean 20 year water depth.

52
Figure 10. Community statistics: count, cluster segregation, and hydrologic regimes. Count is the total number of each community across all 27 PSUs within the Ridge and Slough landscape. The proportion of communities in cluster 1 is derived from the global k-means cluster analysis. Mean water depth over 20 years and inundation frequency (hydroperiod) are shown for each community. Error bars are standard deviations. The PSUs are ranked by 20 year mean water depth.

53
Figure 11. Odds Ratio Test for k-means derived clusters within communities. R is the ridge community; WP is wet prairie; S is slough. Communities across the Ridge and Slough landscape were designated in the field and the k-means clustering was conducted globally (across all PSUs simultaneously). The test examines the odds of the first community being in cluster 1 compared to the second community (for example, the first bar shows that ridges are 156.3 times more likely to be in cluster 1 compared to sloughs).

54
Figure 12. Vegetation community distinctness along the hydrologic gradient. Distinctness was measured by the distance between k-means derived clusters within each PSU from the NMDS ordination space. The distribution was fitted using a Gaussian function for each sampling point averaged over 20 years of variable water depth. The distribution’s mean is the mean of the PSUs 20 year water depths; the standard deviation of the distribution is the standard deviation of the PSUs 20 year water depths. ENP is Everglades National Park; LNWR is Loxahatchee National Wildlife Refuge; WCA 2; Water Conservation Area 2; WCA 3A S is Water Conservation Area 3A South; WCA 3A N is Water Conservation Area 3A North; WCA 3B is Water Conservation Area 3B.

55
Figure 13. Vegetation community distinctness’ association with topographic variation. (r2 = 0.49, Pr (>F) < 0.001.) Distinctness was measured by the distance between k-means derived clusters within each PSU from the NMDS ordination space. ENP is Everglades National Park; LNWR is Loxahatchee National Wildlife Refuge; WCA 2; Water Conservation Area 2; WCA 3A S is Water Conservation Area 3A South; WCA 3A N is Water Conservation Area 3A North; WCA 3B is Water Conservation Area 3B.

56
Figure 14. Vegetation community distinctness and topographic variation counts and KDE. Vegetation community distinctness is derived from the k-means derived between cluster distance for each PSU across the Ridge and Slough landscape (6a); topographic variability is derived from each PSU’s mean water depth standard deviation (6b). The KDE (kernel density estimations) troughs are used to separate each process into conserved and degraded condition.
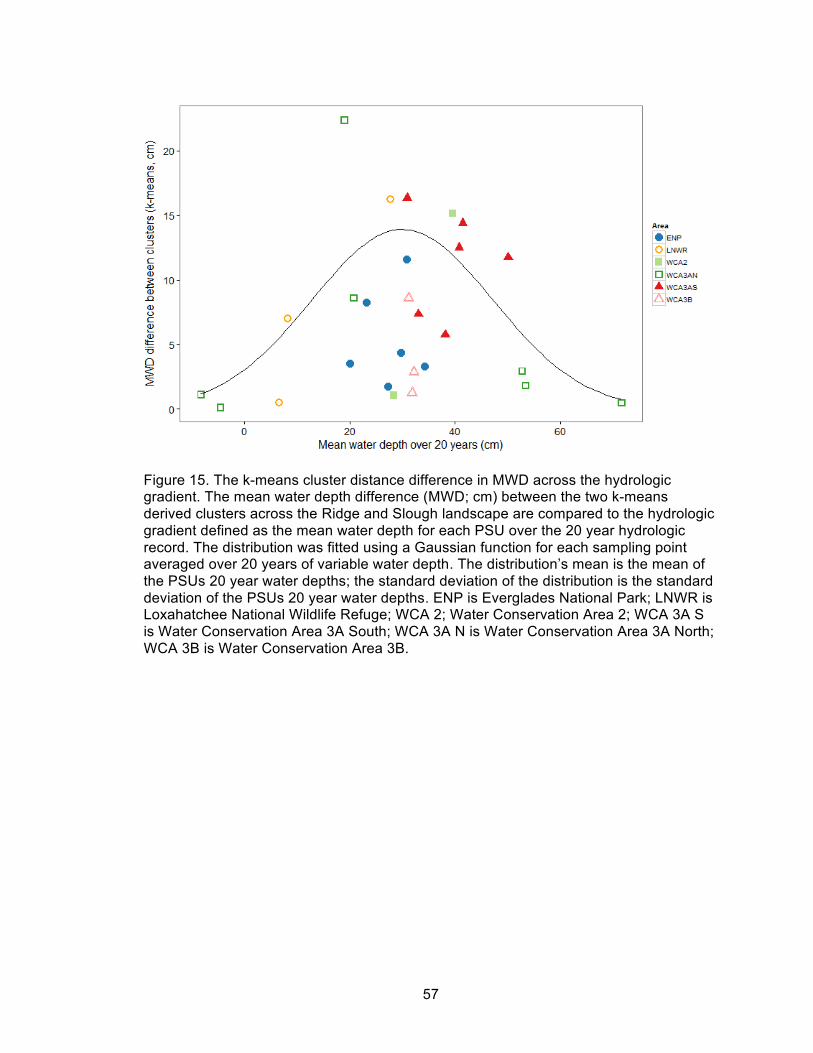
57
Figure 15. The k-means cluster distance difference in MWD across the hydrologic gradient. The mean water depth difference (MWD; cm) between the two k-means derived clusters across the Ridge and Slough landscape are compared to the hydrologic gradient defined as the mean water depth for each PSU over the 20 year hydrologic record. The distribution was fitted using a Gaussian function for each sampling point averaged over 20 years of variable water depth. The distribution’s mean is the mean of the PSUs 20 year water depths; the standard deviation of the distribution is the standard deviation of the PSUs 20 year water depths. ENP is Everglades National Park; LNWR is Loxahatchee National Wildlife Refuge; WCA 2; Water Conservation Area 2; WCA 3A S is Water Conservation Area 3A South; WCA 3A N is Water Conservation Area 3A North; WCA 3B is Water Conservation Area 3B.

58
Figure 16. Sawgrass abundance and MWD correlation across the hydrologic gradient. Sawgrass (Cladium jamaicense) mean abundances within each PSU across the Ridge and Slough landscape is compared to the hydrologic gradient defined as the mean water depth (cm) for a PSU over the 20 year time period. The distribution was fitted using a Gaussian function for each sampling point averaged over 20 years of variable water depth. The distribution’s mean is the mean of the PSUs 20 year water depths; the standard deviation of the distribution is the standard deviation of the PSUs 20 year water depths. ENP is Everglades National Park; LNWR is Loxahatchee National Wildlife Refuge; WCA 2; Water Conservation Area 2; WCA 3A S is Water Conservation Area 3A South; WCA 3A N is Water Conservation Area 3A North; WCA 3B is Water Conservation Area 3B.

59
Figure 17. Mantel r vegetation-topography correlation across the hydrologic gradient. The Mantel Test measures the correlation between vegetation abundances and topographic elevation (i.e., 20 year mean water depths) for each PSU across the Ridge and Slough landscape and is compared to the hydrologic gradient defined as the mean water depth (cm) for a PSU over the 20 year time period. The distribution was fitted using a Gaussian function for each sampling point averaged over 20 years of variable water depth. The distribution’s mean is the mean of the PSUs 20 year water depths; the standard deviation of the distribution is the standard deviation of the PSUs 20 year water depths. ENP is Everglades National Park; LNWR is Loxahatchee National Wildlife Refuge; WCA 2; Water Conservation Area 2; WCA 3A S is Water Conservation Area 3A South; WCA 3A N is Water Conservation Area 3A North; WCA 3B is Water Conservation Area 3B.

60
Figure 18. Vegetation community distinctness across the Ridge and Slough landscape. Green PSUs are most distinct and red the most homogeneous. Black hashed PSUs in the Everglades National Park are located outside the historic Ridge and Slough landscape. Dense stands of cattail prohibited sampling of PSU 5 in WCA 2.

61
Figure 19. Topographic variation across the Ridge and Slough landscape. Green PSUs are most distinct and red the most homogeneous. Black hashed PSUs in the Everglades National Park are located outside the historic Ridge and Slough landscape. Dense stands of cattail prohibited sampling of PSU 5 in WCA 2.

62
Figure 20. The k-means difference in MWD across the Ridge and Slough landscape. Green PSUs are most distinct and red the most homogeneous. Black hashed PSUs in the Everglades National Park are located outside the historic Ridge and Slough landscape. Dense stands of cattail prohibited sampling of PSU 5 in WCA 2.
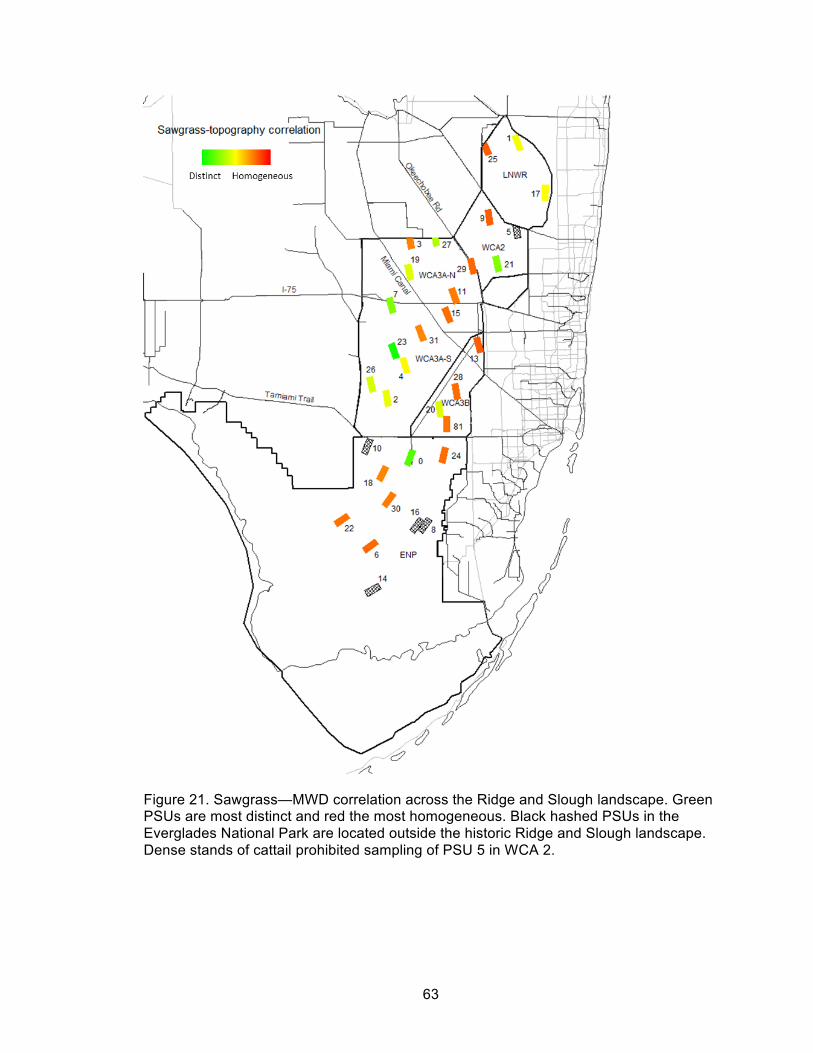
63
Figure 21. Sawgrass—MWD correlation across the Ridge and Slough landscape. Green PSUs are most distinct and red the most homogeneous. Black hashed PSUs in the Everglades National Park are located outside the historic Ridge and Slough landscape. Dense stands of cattail prohibited sampling of PSU 5 in WCA 2.

64
Figure 22. Mantel r vegetation-topography across the Ridge and Slough landscape. Green PSUs are most distinct and red the most homogeneous. Black hashed PSUs in the Everglades National Park are located outside the historic Ridge and Slough landscape. Dense stands of cattail prohibited sampling of PSU 5 in WCA 2.

65
Figure 23. Conservation status for each PSU across the Ridge and Slough landscape. Green (PSUs 2, 4, 17, 21, 23, 26, 27); conserved vegetation community distinctness (high distinctness) and topography (high variation). Red (PSUs 3, 6, 9, 11, 13, 15, 18, 20, 24, 25, 28, 29, 81); both degraded vegetation community distinctness and topography. Yellow (PSUs 0, 1, 7, 19, 22, 30, 31) PSUs were found to have conserved vegetation community distinctness and degraded topographic variation. Black hashed PSUs in the Everglades National Park are located outside the historic Ridge and Slough landscape. Dense stands of cattail prohibited sampling of PSU 5 in WCA 2. Darkened areas are areas significantly affected by cattail (Typha Domingensis) which may distort the interpretation of both vegetation community distinctness and topographic variation measures in this study.

66
References
Allen, C. D., and D. D. Breshears. 1998. Drought-induced shift of a forest–woodland ecotone: rapid landscape response to climate variation. Proceedings of the National Academy of Sciences 95:14839–14842.
Armentano, T. V., J. P. Sah, M. S. Ross, D. T. Jones, H. C. Cooley, and C. S. Smith.
2006. Rapid responses of vegetation to hydrological changes in Taylor Slough, Everglades National Park, Florida, USA. Hydrobiologia 569:293–309.
Bais, H. P., T. L. Weir, L. G. Perry, S. Gilroy, and J. M. Vivanco. 2006. The role of root
exudates in rhizosphere interactions with plants and other organisms. Annual Review of Plant Biology 57:233–266.
Beckage, B., W. J. Platt, M. G. Slocum, and B. Panko. 2003. Influence of the El Nino
Southern Oscillation on fire regimes in the Florida Everglades. Ecology 84:3124–3130.
Beisner, B. E., D. T. Haydon, and K. Cuddington. 2003. Alternative stable states in
ecology. Frontiers in Ecology and the Environment 1:376–382. Belanger, T. V., D. J. Scheidt, and J. R. Platko. 1989. Effects of nutrient enrichment on
the Florida Everglades. Lake and Reservoir Management 5:101–111. Belyea, L. R., and R. S. Clymo. 2001. Feedback control of the rate of peat formation.
Proceedings of the Royal Society of London. Series B: Biological Sciences 268:1315 –1321.
Bernhardt, C. E., and D. A. Willard. 2009. Response of the Everglades ridge and slough
landscape to climate variability and 20th-century water management. Ecological Applications 19:1723–1738.
Busch, D. E., W. F. Loftus, and O. L. Bass. 1998. Long-term hydrologic effects on marsh
plant community structure in the southern Everglades. Wetlands 18:230–241. Callaway, R. M., and L. R. Walker. 1997. Competition and facilitation: a synthetic
approach to interactions in plant communities. Ecology 78:1958–1965. Carpenter, S. R., and W. A. Brock. 2006. Rising variance: a leading indicator of
ecological transition. Ecology Letters 9:311–318. Casanova, M. T., and M. A. Brock. 2000. How do depth, duration and frequency of
flooding influence the establishment of wetland plant communities? Plant Ecology 147:237–250.
Chase, J. M. 2003. Community assembly: when should history matter? Oecologia
136:489–498.

67
Cheng, Y., M. Stieglitz, G. Turk, and V. Engel. 2011. Effects of anisotropy on pattern formation in wetland ecosystems. Geophysical Research Letters 38.
Childers, D. L., R. F. Doren, R. Jones, G. B. Noe, M. Rugge, and L. J. Scinto. 2003.
Decadal change in vegetation and soil phosphorus pattern across the Everglades landscape. Journal of Environmental Quality 32:344–362.
Childers, D. L., D. Iwaniec, D. Rondeau, G. Rubio, E. Verdon, and C. J. Madden. 2006.
Responses of sawgrass and spikerush to variation in hydrologic drivers and salinity in Southern Everglades marshes. Hydrobiologia 569:273–292.
Clymo, R. S. 1984. The limits to peat bog growth. Philosophical Transactions of the
Royal Society of London. B, Biological Sciences 303:605–654. Cohen, M. J., D. L. Watts, J. B. Heffernan, and T. Z. Osborne. 2011. Reciprocal biotic
control on hydrology, nutrient gradients, and landform in the greater Everglades. Critical Reviews in Environmental Science and Technology 41:395–429.
Combroux, I. C. S., and G. Bornette. 2004. Propagule banks and regenerative strategies
of aquatic plants. Journal of Vegetation Science 15:13–20. Combroux, I. C. S., G. Bornette, and C. Amoros. 2002. Plant regenerative strategies
after a major disturbance: the case of a riverine wetland restoration. Wetlands 22:234–246.
Connell, J. H. 1983. On the prevalence and relative importance of interspecific
competition: evidence from field experiments. American Naturalist:661–696. Corenblit, D., E. Tabacchi, J. Steiger, and A. M. Gurnell. 2007. Reciprocal interactions
and adjustments between fluvial landforms and vegetation dynamics in river corridors: A review of complementary approaches. Earth-Science Reviews 84:56–86.
Craft, C. B., J. Vymazal, and C. J. Richardson. 1995. Response of everglades plant
communities to nitrogen and phosphorus additions. Wetlands 15:258–271. Crain, C. M., and M. D. Bertness. 2005. Community impacts of a tussock sedge: is
ecosystem engineering important in benign habitats? Ecology 86:2695–2704. D’Odorico, P., V. Engel, J. A. Carr, S. F. Oberbauer, M. S. Ross, and J. P. Sah. 2011.
Tree–grass coexistence in the Everglades freshwater system. Ecosystems 14:298–310.
Daoust, R. J., and D. L. Childers. 2004. Ecological effects of low-level phosphorus
additions on two plant communities in a neotropical freshwater wetland ecosystem. Oecologia 141:672–686.
68
Davis, S. M., L. H. Gunderson, W. A. Park, J. R. Richardson, and J. E. Mattson. 1994. Landscape dimension, composition, and function in a changing Everglades ecosystem. Pages 419–444 in S. Davis and J. Ogden, editors. Everglades: the Ecosystem and its Restoration. St. Lucia Press, Del Ray Beach, Florida.
Davis, S. M., and J. C. Ogden. 1994. Everglades: the ecosystem and its restoration. St.
Lucia Press, Del Ray Beach, Florida. Douglas, M. S. 1947. The Everglades: river of grass. Pineapple Press Inc. Eppinga, M. B., M. Rietkerk, L. R. Belyea, M. B. Nilsson, P. C. D. Ruiter, and M. J.
Wassen. 2010. Resource contrast in patterned peatlands increases along a climatic gradient. Ecology 91:2344–2355.
Eppinga, M. B., M. Rietkerk, W. Borren, E. D. Lapshina, W. Bleuten, and M. J. Wassen.
2008. Regular surface patterning of peatlands: confronting theory with field data. Ecosystems 11:520–536.
Eppinga, M. B., M. Rietkerk, M. J. Wassen, and P. C. Ruiter. 2007. Linking habitat
modification to catastrophic shifts and vegetation patterns in bogs. Plant Ecology 200:53–68.
Feeley, K. J., and E. M. Rehm. 2012. Amazon’s vulnerability to climate change
heightened by deforestation and man-made dispersal barriers. Global Change Biology 18:3606–3614.
Fennema, R. J., C. J. Neidrauer, R. A. Johnson, T. K. MacVicar, and W. A. Perkins.
1994. A computer model to simulate natural Everglades hydrology. Everglades: The Ecosystem and its restoration. St. Lucie Press, Delray Beach:249–289.
Fortin, M.-J., M. R. Dale, and J. van Hoef. 2002. Spatial analysis in ecology. in A. H. El-
Shaarawi and W. W. Piegorsch, editors. Encyclopedia of environmetrics. John Wiley & Sons, Ltd.
Foster, D., G. King, P. Glaser, and H. Wright Jr. 1983. Origin of string patterns in boreal
peatlands. Nature 306:256–258. Foti, R., M. del Jesus, A. Rinaldo, and I. Rodriguez-Iturbe. 2012. Hydroperiod regime
controls the organization of plant species in wetlands. Proceedings of the National Academy of Sciences 109:19596–19600.
Foti, R., M. del Jesus, A. Rinaldo, and I. Rodriguez-Iturbe. 2013. Signs of critical
transition in the Everglades wetlands in response to climate and anthropogenic changes. Proceedings of the National Academy of Sciences 110:6296–6300.
Gaiser, E. E. 2009. Periphyton as an indicator of restoration in the Florida Everglades.
Ecological Indicators 9:S37–S45.

69
Gaiser, E. E., P. V. McCormick, S. E. Hagerthey, and A. D. Gottlieb. 2011. Landscape patterns of periphyton in the Florida Everglades. Critical Reviews in Environmental Science and Technology 41:92–120.
Gaiser, E. E., L. J. Scinto, J. H. Richards, K. Jayachandran, D. L. Childers, J. C. Trexler,
and R. D. Jones. 2004. Phosphorus in periphyton mats provides the best metric for detecting low-level P enrichment in an oligotrophic wetland. Water Research 38:507–516.
Gaiser, E. E., P. Sullivan, F. A. Tobias, A. J. Bramburger, and J. C. Trexler. 2013.
Boundary Effects on Benthic Microbial Phosphorus Concentrations and Diatom Beta Diversity in a Hydrologically-modified, Nutrient-limited Wetland. Wetlands:1–10.
Gilad, E., J. Von Hardenberg, A. Provenzale, M. Shachak, and E. Meron. 2004.
Ecosystem engineers: from pattern formation to habitat creation. Physical Review Letters 93:98105.
Givnish, T. J., J. C. Volin, V. D. Owen, V. C. Volin, J. D. Muss, and P. H. Glaser. 2008.
Vegetation differentiation in the patterned landscape of the central Everglades: importance of local and landscape drivers. Global Ecology and Biogeography 17:384–402.
Gleason, P. J., and P. Stone. 1994. Age, origin, and landscape evolution of the
Everglades peatland. Pages 149–197 in S. M. Davis and J. C. Ogden, editors. Everglades: the Ecosystem and its Restoration. St. Lucie Press, Boca Raton, FL, 323-40.
Gosz, J. R. 1992. Gradient analysis of ecological change in time and space: implications
for forest management. Ecological Applications:248–261. Gottlieb, A. D., J. H. Richards, and E. E. Gaiser. 2006. Comparative study of periphyton
community structure in long and short-hydroperiod Everglades marshes. Hydrobiologia 569:195–207.
Groffman, P., J. Baron, T. Blett, A. Gold, I. Goodman, L. Gunderson, B. Levinson, M.
Palmer, H. Paerl, G. Peterson, N. Poff, D. Rejeski, J. Reynolds, M. Turner, K. Weathers, and J. Wiens. 2006. Ecological thresholds: the key to successful environmental management or an important concept with no practical application? Ecosystems 9:1–13.
Gunderson, L. H. 1994. Vegetation of the Everglades: Determinants of Community
Composition. Pages 323–340 in S. M. Davis and J. C. Ogden, editors. Everglades: The Ecosystem and its Restoration. St. Lucie Press, Boca Raton, FL.
Gunderson, L. H. 2001. South Florida: The reality of change and the prospects for
sustainability: Managing surprising ecosystems in southern Florida. Ecological Economics 37:371–378.

70
Gunderson, L., and S. S. Light. 2006. Adaptive management and adaptive governance in the everglades ecosystem. Policy Sciences 39:323–334.
Heffernan, J. B., D. L. Watts, and M. J. Cohen. 2013. Discharge competence and pattern
formation in peatlands: a meta-ecosystem model of the Everglades ridge-slough landscape. PloS one 8:e64174.
Herndon, A., L. Gunderson, and J. Stenberg. 1991. Sawgrass (Cladium jamaicense)
survival in a regime of fire and flooding. Wetlands 11:17–28. Jackson, M. B., and T. D. Colmer. 2005. Response and adaptation by plants to flooding
stress. Annals of Botany 96:501–505. Kantvilas, G., and P. R. Minchin. 1989. An analysis of epiphytic lichen communities in
Tasmanian cool temperate rainforest. Vegetatio 84:99–112. Kaplan, D. A., R. Paudel, M. J. Cohen, and J. W. Jawitz. 2012. Orientation matters:
Patch anisotropy controls discharge competence and hydroperiod in a patterned peatland. Geophysical Research Letters 39.
Kark, S., and B. J. van Rensburg. 2006. Ecotones: marginal or central areas of
transition? Israel Journal of Ecology and Evolution 52:29–53. Keddy, P. A. 2010. Wetland ecology: principles and conservation. Cambridge University
Press. Kirkman, L. K., M. B. Drew, L. T. West, and E. R. Blood. 1998. Ecotone characterization
between upland longleaf pine/wiregrass stands and seasonally-ponded isolated wetlands. Wetlands 18:346–364.
Kruskal, J. B. 1964. Multidimensional scaling by optimizing goodness of fit to a
nonmetric hypothesis. Psychometrika 29:1–27. Larsen, L., N. Aumen, C. Bernhardt, V. Engel, T. Givnish, S. Hagerthey, J. Harvey, L.
Leonard, P. McCormick, C. Mcvoy, G. Noe, M. Nungesser, K. Rutchey, F. Sklar, T. Troxler, J. Volin, and D. Willard. 2011. Recent and historic drivers of landscape change in the Everglades ridge, slough, and tree island mosaic. Critical Reviews in Environmental Science and Technology 41:344–381.
Larsen, L. G., and J. W. Harvey. 2010. How vegetation and sediment transport
feedbacks drive landscape change in the Everglades and wetlands worldwide. The American Naturalist 176:E66–E79.
Larsen, L. G., Judson W. Harvey, and J. P. Crimaldi. 2007. A delicate balance:
ecohydrological feedbacks governing landscape morphology in a lotic peatland. Ecological Monographs 77:591–614.
Levin, S. A., and R. T. Paine. 1974. Disturbance, patch formation, and community
structure. Proceedings of the National Academy of Sciences 71:2744–2747.

71
Levine, J. M., and D. J. Murrell. 2003. The community-level consequences of seed dispersal patterns. Annual Review of Ecology, Evolution, and Systematics:549–574.
Light, S. S., and J. W. Dineen. 1994. Water control in the Everglades: a historical
perspective. Everglades: The Ecosystem and its Restoration. St. Lucie Press, Delray Beach, FL:47–84.
Liu, Z., J. C. Volin, V. Dianne Owen, L. G. Pearlstine, J. R. Allen, F. J. Mazzotti, and A.
L. Higer. 2009. Validation and ecosystem applications of the EDEN water-surface model for the Florida Everglades. Ecohydrology 2:182–194.
Lockwood, J. L., M. S. Ross, and J. P. Sah. 2003. Smoke on the water: the interplay of
fire and water flow on Everglades restoration. Frontiers in Ecology and the Environment 1:462–468.
Loveless, C. M. 1959. A study of the vegetation in the Florida Everglades. Ecology 40:2–
9. MacArthur, R., and R. Levins. 1964. Competition, habitat selection, and character
displacement in a patchy environment. Proceedings of the National Academy of Sciences of the United States of America 51:1207.
Magee, T. K., and M. E. Kentula. 2005. Response of wetland plant species to hydrologic
conditions. Wetlands Ecology and Management 13:163–181. McCormick, P. V., S. Newman, and L. W. Vilchek. 2008. Landscape responses to
wetland eutrophication: loss of slough habitat in the Florida Everglades, USA. Hydrobiologia 621:105–114.
McLean, A. R., J. C. Ogden, and E. E. Williams. 2002. Comprehensive Everglades
Restoration Plan. McVoy, C. W., W. P. Said, J. Obeysekera, J. V. Arman, and T. Dreschel. 2011.
Landscapes and Hydrology of the Predrainage Everglades. University Press of Florida.
Milchunas, D. G., and W. K. Lauenroth. 1995. Inertia in plant community structure: state
changes after cessation of nutrient-enrichment stress. Ecological Applications 5:452–458.
Miller, R. C., and J. B. Zedler. 2003. Responses of native and invasive wetland plants to
hydroperiod and water depth. Plant Ecology 167:57–69. Mitsch, W. J., and J. G. Gosselink. 2000. The value of wetlands: importance of scale and
landscape setting. Ecological Economics 35:25–33. Mitsch, W. J., and J. G. Gosselink. 2011. Wetlands. John Wiley & Sons.

72
Morellet, N., J.-M. Gaillard, A. J. M. Hewison, P. Ballon, Y. Boscardin, P. Duncan, and F. Klein. 2007. Indicators of ecological change: new tools for managing populations of large herbivores. Ecology 44:634–643.
Newman, S., J. B. Grace, and J. W. Koebel. 1996. Effects of nutrients and hydroperiod
on Typha, Cladium, and Eleocharis: implications for Everglades restoration. Ecological Applications 6:774–783.
Niemi, G. J., and M. E. McDonald. 2004. Application of ecological indicators. Annual
Review of Ecology, Evolution, and Systematics:89–111. Noon, K. F. 1996. A model of created wetland primary succession. Landscape and
Urban Planning 34:97–123. Nungesser, M. 2011. Reading the landscape: temporal and spatial changes in a
patterned peatland. Wetlands Ecology and Management 19:475–493. Ogden, J. C. 2005. Everglades ridge and slough conceptual ecological model. Wetlands
25:810–820. Oksanen, J., R. Kindt, and B. O’Hara. 2005. Vegan: R functions for vegetation
ecologists. URL: http://cc.oulu.fi/jarioksa/softhelp/vegan.html. Olmsted, I., and T. V. Armentano. 1997. Vegetation of Shark Slough, Everglades
National Park. SFNRC Technical. Pearlstine, L., A. Higer, M. Palaseanu, I. Fujisaki, and F. Mazzotti. 2007. Spatially
continuous interpolation of water stage and water depths using the Everglades Depth Estimation Network (EDEN). IFAS CIR1521.
Peltzer, D. A. 2001. Plant responses to competition and soil origin across a prairie–forest
boundary. Journal of Ecology 89:176–185. Post, D. M., M. W. Doyle, J. L. Sabo, and J. C. Finlay. 2007. The problem of boundaries
in defining ecosystems: a potential landmine for uniting geomorphology and ecology. Geomorphology 89:111–126.
R Development Core Team. 2011. R: A language and environment for statistical
computing. R Foundation for Statistical Computing, Vienna, Austria. Richardson, C. 2010. The Everglades: North America’s subtropical wetland. Wetlands
Ecology and Management 18:517–542. Ries, L., R. J. Fletcher Jr, J. Battin, and T. D. Sisk. 2004. Ecological responses to habitat
edges: mechanisms, models, and variability explained. Annual Review of Ecology, Evolution, and Systematics:491–522.
Rietkerk, M., S. C. Dekker, P. C. De Ruiter, and J. Van De Koppel. 2004. Self-organized
patchiness and catastrophic shifts in ecosystems. Science 305:1926–1929.

73
Rietkerk, M., and J. van de Koppel. 2008. Regular pattern formation in real ecosystems. Trends in Ecology & Evolution 23:169–175.
Ross, M. S., D. L. Reed, J. P. Sah, P. L. Ruiz, and M. T. Lewin. 2003.
Vegetation:environment relationships and water management in Shark Slough, Everglades National Park. Wetlands Ecology and Management 11:291–303.
Ross, M. S., and J. P. Sah. 2011. Forest Resource Islands in a Sub-tropical Marsh: Soil–
Site Relationships in Everglades Hardwood Hammocks. Ecosystems 14:632–645.
Sah, J. P., M. S. Ross, S. Saha, P. Minchin, and J. Sadle. 2013. Trajectories of
vegetation response to water management in Taylor Slough, Everglades National Park, Florida. Wetlands:1–15.
Sarkar, D. 2010. lattice: Lattice graphics. R package version 0.19-13, URL http://CRAN.
R-project. org/package= lattice. Scheffer, M., J. Bascompte, W. A. Brock, V. Brovkin, S. R. Carpenter, V. Dakos, H. Held,
E. H. van Nes, M. Rietkerk, and G. Sugihara. 2009. Early-warning signals for critical transitions. Nature 461:53–59.
Scheffer, M., S. Carpenter, J. A. Foley, C. Folke, and B. Walker. 2001. Catastrophic
shifts in ecosystems. Nature 413:591–596. Scheffer, M., and S. R. Carpenter. 2003. Catastrophic regime shifts in ecosystems:
linking theory to observation. Trends in Ecology & Evolution 18:648–656.
–62. South Florida Ecosystem Restoration Working Group.
Sklar, F. H., M. J. Chimney, S. Newman, P. McCormick, D. Gawlik, S. Miao, C. McVoy,
W. Said, J. Newman, and C. Coronado. 2005. The ecological-societal underpinnings of Everglades restoration. Frontiers in Ecology and the Environment 3:161–169.
Sklar, F. H., and A. van der Valk (Eds.). 2002. Tree islands of the Everglades:
Dordrecht: Kluwer Academic Publishers. Sklar, F., C. McVoy, R. Van Zee, D. Gawlik, D. Swift, W. Park, C. Fitz, Y. Wu, D.
Rudnick, T. Fontaine, and others. 1999. Hydrologic Needs: The effects of altered hydrology on the Everglades. Everglades Interim Report, SFWMD, West Palm Beach, FL, USA.
Smith, C. M. S., M. S. Cresser, and R. D. J. Mitchell. 1993. Sensitivity to acid deposition
of dystrophic peat in Great Britain. Ambio:22–26. Sousa, W. P. 1984. The role of disturbance in natural communities. Annual Review of
Ecology and Systematics 15:353–391.

74
Spence, D. H. N. 1982. The zonation of plants in freshwater lakes. Advances in ecological research 12:37–125.
Stachowicz, J. J. 2001. Mutualism, facilitation, and the structure of ecological
communities. Bioscience 51:235–246. Stallins, J. A. 2006. Geomorphology and ecology: Unifying themes for complex systems
in biogeomorphology. Geomorphology 77:207–216. Stephens, J. C. 1956. Subsidence of organic soils in the Florida Everglades. Soil
Science Society of America Journal 20:77–80. Stevens Jr, D. L., and A. R. Olsen. 2004. Spatially balanced sampling of natural
resources. Journal of the American Statistical Association 99:262–278. Strayer, D. L., M. E. Power, W. F. Fagan, S. T. Pickett, and J. Belnap. 2003. A
classification of ecological boundaries. BioScience 53:723–729. Todd, M. J., R. Muneepeerakul, D. Pumo, S. Azaele, F. Miralles-Wilhelm, A. Rinaldo,
and I. Rodriguez-Iturbe. 2010. Hydrological drivers of wetland vegetation community distribution within Everglades National Park, Florida. Advances in Water Resources 33:1279–1289.
Tylianakis, J. M., T. Tscharntke, and O. T. Lewis. 2007. Habitat modification alters the
structure of tropical host-parasitoid food webs. Nature 445:202–205. Urban, N. H., S. M. Davis, and N. G. Aumen. 1993. Fluctuations in sawgrass and cattail
densities in Everglades Water Conservation Area 2A under varying nutrient, hydrologic and fire regimes. Aquatic Botany 46:203–223.
Van der Valk, A. G. 1981. Succession in wetlands: a Gleasonian approach. Ecology
62:688–696. Vivanco, J. M., H. P. Bais, F. R. Stermitz, G. C. Thelen, and R. M. Callaway. 2004.
Biogeographical variation in community response to root allelochemistry: novel weapons and exotic invasion. Ecology Letters 7:285–292.
Walker, B., A. Kinzig, and J. Langridge. 1999. Plant attribute diversity, resilience, and
ecosystem function: The nature and significance of dominant and minor species. Ecosystems 2:95–113.
Watts, D. L., M. J. Cohen, J. B. Heffernan, and T. Z. Osborne. 2010. Hydrologic
modification and the loss of self-organized patterning in the ridge–slough mosaic of the Everglades. Ecosystems 13:813–827.
Weiher, E., and P. A. Keddy. 1995. The assembly of experimental wetland plant
communities. Oikos:323–335.

75
Van Wesenbeeck, B. K., J. Van De Koppel, P. M. J. Herman, and T. J. Bouma. 2008. Does scale-‐dependent feedback explain spatial complexity in salt-‐marsh ecosystems? Oikos 117:152–159.
White, P. S. 1994. Synthesis: vegetation pattern and process in the Everglades
ecosystem. Everglades: the ecosystem and its restoration. St Lucia Press, St Lucia:445–460.
Wickham, H. 2008. ggplot2: An implementation of the grammar of graphics. R package
version 0.7, URL: http://CRAN. R-project. org/package= ggplot2. Wiens, J. A., C. S. Crawford, and J. R. Gosz. 1985. Boundary dynamics: a conceptual
framework for studying landscape ecosystems. Oikos:421–427. Wu, Y., N. Wang, and K. Rutchey. 2006. An analysis of spatial complexity of ridge and
slough patterns in the Everglades ecosystem. Ecological Complexity 3:183–192. Zedler, J. B. 2000. Progress in wetland restoration ecology. Trends in Ecology &
Evolution 15:402–407. Zedler, J. B., and S. Kercher. 2004. Causes and consequences of invasive plants in
wetlands: opportunities, opportunists, and outcomes. Critical Reviews in Plant sciences 23:431–452.
Zweig, C. L., and W. M. Kitchens. 2008. Effects of landscape gradients on wetland
vegetation communities: information for large-scale restoration. Wetlands 28:1086–1096.
Zweig, C. L., and W. M. Kitchens. 2009. Multi-state succession in wetlands: a novel use
of state and transition models. Ecology 90:1900–1909.
Recommended