This PDF is a selection from an out-of-print volume from the National Bureauof Economic Research
Volume Title: Issues in the Economics of Immigration
Volume Author/Editor: George J. Borjas, editor
Volume Publisher: University of Chicago Press
Volume ISBN: 0-226-06631-2
Volume URL: http://www.nber.org/books/borj00-1
Publication Date: January 2000
Chapter Title: The Educational Attainment of Immigrants: Trends and Implications
Chapter Author: Julian R. Betts, Magnus Lofstrom
Chapter URL: http://www.nber.org/chapters/c6053
Chapter pages in book: (p. 51 - 116)

-
The Educational Attainment of Immigrants Trends and Implications
Julian R. Betts and Magnus Lofstrom
2.1 Introduction
Immigration can heavily influence the way in which a country’s labor force evolves over time. Recent American experience bears this out. The proportion of immigrants in the adult population, aged 24-64, rose from 4.7 percent in 1970 to 6.2 percent in 1980 and to 7.9 percent in 1990. At the same time, there is a general perception that the educational composi- tion of the immigrant population has changed over the last two decades, with immigrants becoming less skilled relative to native-born Americans. In a string of articles, Borjas has shown that such “cohort” effects are crucial in explaining the rising wage gap between immigrants and natives. (See, e.g., Borjas 1985, 1990.)
This paper has two broad goals. The first is to present a detailed portrait of the educational attainment of immigrants relative to native-born Amer- icans. We will examine the extent to which immigrants’ level of education has changed, both in an absolute sense and relative to that of natives, between 1970 and 1990. We also study the dynamics of educational attain- ment, by comparing and modeling the enrollment behavior of immigrants relative to natives over time. The second broad goal of the paper is to ex- amine the implications of these trends both for immigrants themselves and for natives.
For immigrants, the central question we address is how trends in immi-
Julian R. Betts is associate professor of economics at the University of California, San Diego, and senior fellow at the Public Policy Institute of California. Magnus Lofstrom is a research associate at the Institute for the Study of Labor, Bonn, Germany.
The authors thank George Borjas, Caroline Hoxby, and preconference participants for helpful comments.
51
52 Julian R. Betts and Magnus Lofstrom
grants’ educational attainment have affected their earnings relative to earnings of native-born Americans. We focus on modeling the returns to education, allowing for nonlinearities that have not always been addressed in the earlier literature on immigration. For instance, we study the relative size of “sheepskin,” or graduation, effects for immigrants and natives, and test the idea that the returns to education depend in part on whether the education was obtained abroad or in the United States. We find these nonlinearities to be of some importance. We also extend the work of Brats- berg and Terrell (1997) by studying the role that traits of the country of origin play in determining the returns to education among immigrants.
Finally, we also study the impact of recent immigration on the educa- tional attainment of natives. While several studies have examined whether inflows of immigrants have altered the wage structure facing natives, there are good reasons to believe that immigration can also affect the level of education that natives acquire. If the arrival of less-skilled immigrants low- ers the wages of high school dropouts, it may provide an incentive for natives to acquire more education. But on the other hand, immigrants may “crowd out” natives from education, in part by making schools less effective when many of the students have limited proficiency in English. At the college level, there is the additional possibility that immigrants compete with native minorities for admissions under affirmative action programs. Betts (1998) and Hoxby (1998) provide evidence that immi- grants have “crowded out’’ native minorities at both the high school and college levels. We present further evidence of the extent to which the ratio of immigrants in the local population induces natives to acquire more or less education, using a greater time span than was used in the two pre- vious studies.
2.2 Data
In this paper we use the 1970, 1980, and 1990 U.S. Censuses of Popula- tion and Housing. Given the extremely large data set that results from this pooling across three censuses, we extracted a 20 percent randomly selected subsample of native-born Americans from the 5 percent sample of the 1980 and 1990 censuses. All native-born Americans and immigrants from the 1 percent 1970 census are included. Since the 1990 census is not a random sample of the population, sampling weights were used. These were set to the appropriate constants for the 1970 and 1980 censuses. All weights were then adjusted accordingly since not all observations for na- tives were used. Furthermore, there is a slight variation in the samples used for the tables and analysis presented here. In the first two tables we present summary statistics of educational attainment for males and fe- males. This is the least restrictive sample in which all individuals aged 16-64 from the sample described above are included. For the remainder of
The Educational Attainment of Immigrants 53
the paper, only observations for males are included. Also, wage regressions restrict the sample to include males aged 24-64 who worked the year prior to the census and earned at least $50 in 1989 dollars. Workers for whom census data on age, sex, immigrant status, or education were allocated were deleted. Section 2.5, which examines the impact of immigration on the educational attainment of natives, uses a similar three-census pooled data set that we will describe more fully in the section.
It is important to realize that census data include not only legally admit- ted immigrants but also foreigners who are temporarily but legally in the United States on visas, as well as a large number of illegal aliens. Warren and Passel (1987) use 1980 census data and Immigration and Naturaliza- tion Service (INS) data to estimate that about one half of the 2 million people in the census who report being born in Mexico are illegal immi- grants. Borjas, Freeman, and Lang (1991) extend this work by analyzing vital statistics, and they conclude that the 1980 census includes about two thirds of illegal aliens born in Mexico, due to undercounting. We use the census data in the belief that they give the most detailed picture available of all immigrants, regardless of legal status. Of course, it does not speak directly to immigration policy, since some of the immigrants in the sample were not admitted legally. On the other hand, one could equally well use INS data to infer trends in the educational attainment of legally admitted immigrants. Such an approach gives a much better idea of how admission criteria have affected the occupational mix of legally admitted immigrants. But it will necessarily give a less accurate picture of the overall traits of all immigrants in the country. This second approach is adopted by Jasso, Rosenmeig, and Smith in chapter 5 in this volume.
2.3 Trends in Educational Attainment and Enrollment among Natives and Immigrants
2.3.1 Basic Results
We begin by presenting evidence on the distribution of educational at- tainment among natives and immigrants derived from the 1970, 1980, and 1990 censuses. Table 2.1 shows the mean, 25th, 50th, and 75th percentiles of years of schooling among both groups, for males aged 16-64.’
This table reveals some complex patterns. In terms of the mean level
1. The 1990 census codes educational attainment differently from the 1970 and 1980 cen- suses. In the 1990 data, we recoded years of schooling in the same fashion as Borjas (1995). No school completed, nursery school, and kindergarten are recoded as 0 years of schooling; first through fourth grade are recoded as 2.5 years; fifth through eighth grade as 6.5 years; ninth grade as 9 years; tenth grade as 10 years; eleventh grade or twelfth grade without a high school diploma as 11 years; high school graduate as 12 years; some college, no degree as 13 years; associate degree as 14 years; bachelor’s degree as 16 years; master’s degree as 17 years; and professional or doctorate degree as 20 years.
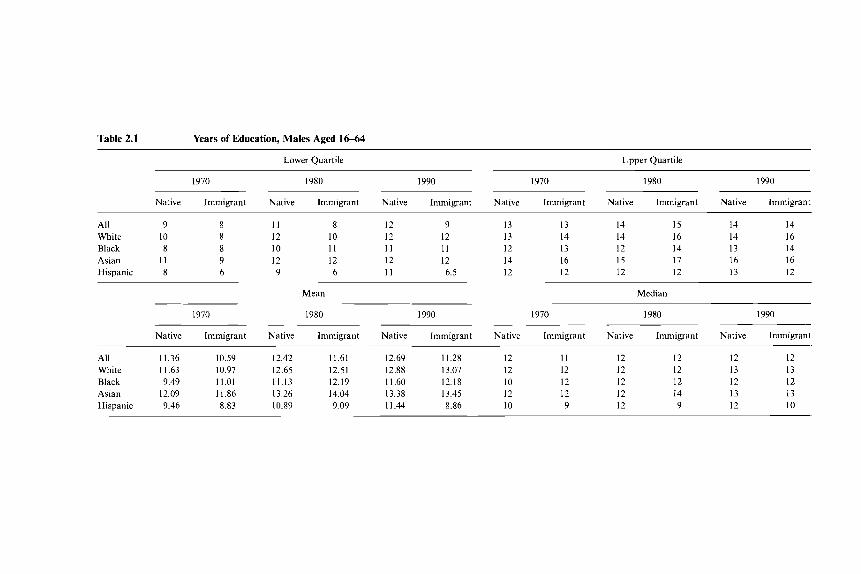
Table 2.1 Years of Education, Males Aged 16-64
Lower Quartile Upper Quartile
1970 1980 1990 1970 1980 1990
Native Immigrant Native Immigrant Native Immigrant Native Immigrant Native Immigrant Native Immigrant
All 9 8 11 8 12 9 13 13 14 15 14 14 White i n 8 12 i n 12 12 13 14 14 16 14 16 Black 8 8 in I 1 I1 11 12 13 12 14 13 14 Asian 11 9 12 12 12 12 14 16 15 17 16 16 Hispanic 8 6 9 6 I 1 6.5 12 12 12 12 13 12
Mean Median
1970 1980 I990 1970 1980 1990
Native Immigrant Native Immigrant Native Immigrant Native Immigrant Native Immigrant Native Immigrant
All 11.36 10.59 12.42 11.61 12.69 11.28 12 11 12 12 12 I2 White 11.63 10.97 12.65 12.51 12.88 13.07 12 12 12 12 13 13 Black 9.49 11.01 11.13 12.19 11.60 12.18 10 12 12 12 12 12 Asian 12.09 11.86 13.26 14.04 13.38 13.45 12 12 12 14 13 13 Hispanic 9.46 8.83 10.89 9.09 11.44 8.86 10 9 12 9 12 10
The Educational Attainment of Immigrants 55
of education, it does not appear that immigrants became steadily less well educated over time. The mean level of education of immigrants rose slightly from 1970 to 1980 but fell slightly by 1990. Overall, for the 1970-90 period, immigrants became slightly more educated, with a two- thirds of a year increase in years of schooling. The trends for natives are startlingly different, with increases in mean years of schooling in both decades totaling one and one-third years. Immigrants did become less well educated relative to natives in both decades, but in absolute terms, immi- grants’ mean level of education rose slightly.
Trends in the median, upper, and lower quartiles reveal considerable het- erogeneity in the immigrant population. The drop in the relative level of immigrants’ education has been caused by a considerable decline in the relative educational attainment of the lower quartile of immigrants. Be- tween 1970 and 1990, the gap in years of schooling between the 25th per- centile immigrant and the 25th percentile native rose from just one year to three years. The data on the median and upper quartiles tell a quite different story. The median level of education of natives remained at 12 years in all three decades; among immigrants, the median level of educa- tion rose from 11 to 12 years. The level of education of the 75th percentile immigrant rose from 13 to 14 years between 1970 and 1990, exactly match- ing the corresponding levels for natives. Furthermore, in 1980 the upper quartile immigrant had 15 years of education, compared to 14 for natives,
In summary, the upper half of the immigrant population has been and continues to be at least as highly educated as the upper half of the native population. The observed decline in the mean level of immigrants’ educa- tion relative to natives reflects a decline in the relative educational status of the bottom half of the immigrant population.
The table also breaks down the distribution of education among the larger raciallethnic groups. These calculations show that at all three quan- tiles, the years of schooling of white, black, and Asian immigrants have increased significantly between 1970 and 1990. Among Hispanics, the mean level of education was far lower than for the other immigrant groups in 1970, and it remained stagnant through the next two decades. The data for the three quantiles show the same stagnation in education among His- panic immigrants.
Table 2.2 shows the same data, calculated this time for women. The mean level of education among immigrant women increased by more than it did for men over the 1970-90 period, up from 10.05 to 11.06 years. However, this increase is still lower than the one for native women; over the same period, the mean level of education increased from 11.26 to 12.61 for natives. The key trend shown among men seems to hold for women as well: Educational attainment increased among immigrants in absolute terms but declined in relative terms. As for men, the decline in female immigrants’ level of education relative to natives has been caused solely by a widening gap in the education in the bottom half of the educational
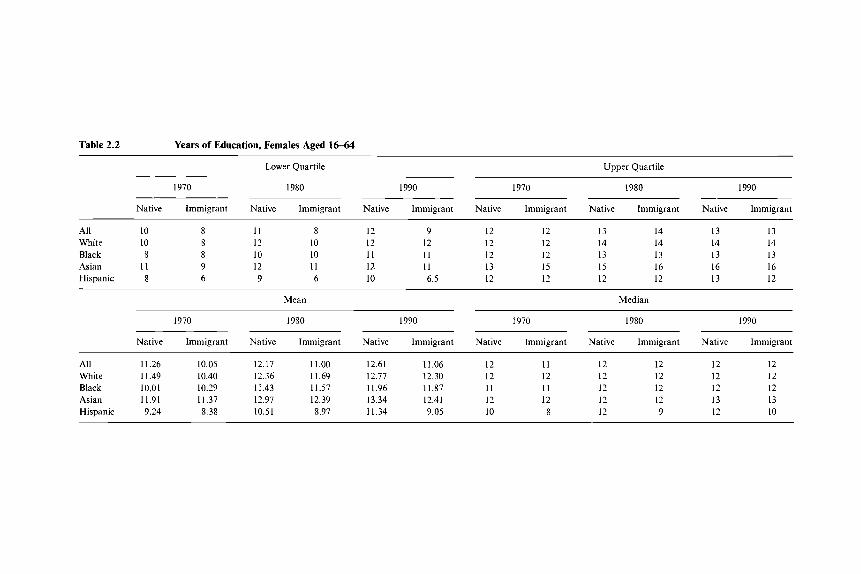
Table 2.2 Years of Education, Females Aged 16-64
Lower Quartile Upper Quartile
1970 1980 1990 1970 1980 1990
Native Immigrant Native Immigrant Native Immigrant Native Immigrant Native Immigrant Native Immigrant
All 10 8 I 1 8 12 9 12 12 13 14 13 13 White 10 8 12 10 12 12 12 12 14 14 14 14 Black 8 8 10 10 11 11 12 12 13 13 13 13 Asian 11 9 12 11 12 11 13 15 15 16 16 16 Hispanic 8 6 9 6 10 6.5 12 12 12 12 13 12
Mean Median
1970 1980 1990
Native Immigrant Native Immigrant Native Immigrant
1970 1980 1990
Native Immigrant Native Immigrant Native Immigrant
All 11.26 10.05 12.17 11.00 12.61 11.06 White 1 1.49 10.40 12.36 11.69 12.77 12.30 Black 10.01 10.29 11.43 11.57 11.96 11.87 Asian 11.91 11.37 12.97 12.39 13.34 12.41 Hispanic 9.24 8.38 10.51 8.97 11.34 9.05
12 11 12 12 12 12 12 12 12 12 12 12 11 I1 12 12 12 12 12 12 12 12 13 13 10 8 12 9 12 10
The Educational Attainment of Immigrants 57
Table 2.3 Mean Years of Total Schooling
Years of Education
Cohort 1970
Arrived 1985-89 Arrived 1980-84 Arrived 1975-79 Arrived 1970-74 Arrived 1965-69 11.313 Arrived 1960-64 10.963 Arrived 1950-59 10.680 Arrived before 1950 10.208
1980
12.254 11.492 11.855 12.338 12.376 12.351
1990
12.266 11.679 1 1.492 11.448 12.244 12.721 12.723 13.100
Note: Data are from 1970, 1980, and 1990 public use samples of the U.S. census for immi- grant men aged 24-64.
distribution. The gap between immigrants and natives increased among the lower quartiles by one year, while there is essentially no difference in educational attainment between immigrants and natives at the median or in the upper quartile.
Although the rest of sections 2.2 and 2.3 focuses on males only, tables 2.1 and 2.2 do establish that the patterns in the relative education of immi- grants over time have been quite similar for men and women.
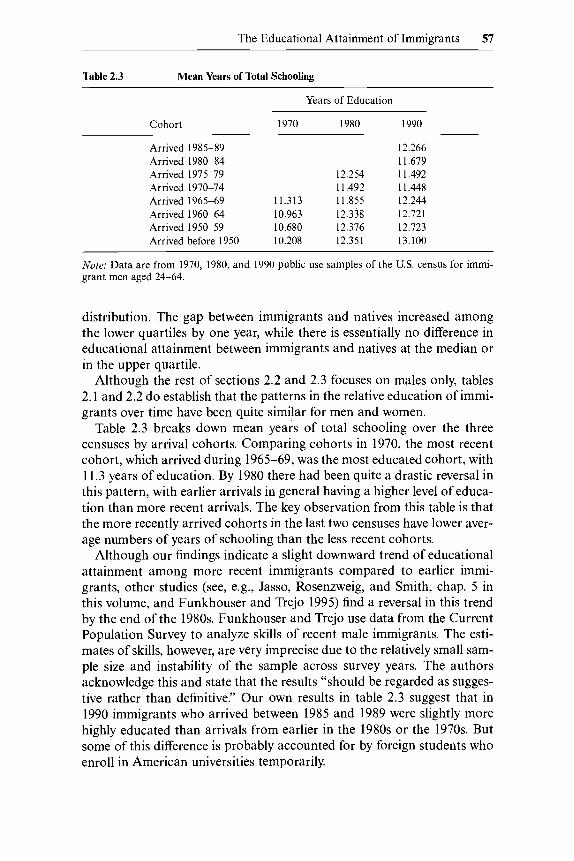
Table 2.3 breaks down mean years of total schooling over the three censuses by arrival cohorts. Comparing cohorts in 1970, the most recent cohort, which arrived during 1965-69, was the most educated cohort, with 11.3 years of education. By 1980 there had been quite a drastic reversal in this pattern, with earlier arrivals in general having a higher level of educa- tion than more recent arrivals. The key observation from this table is that the more recently arrived cohorts in the last two censuses have lower aver- age numbers of years of schooling than the less recent cohorts.
Although our findings indicate a slight downward trend of educational attainment among more recent immigrants compared to earlier immi- grants, other studies (see, e.g., Jasso, Rosenzweig, and Smith, chap. 5 in this volume, and Funkhouser and Trejo 1995) find a reversal in this trend by the end of the 1980s. Funkhouser and Trejo use data from the Current Population Survey to analyze skills of recent male immigrants. The esti- mates of skills, however, are very imprecise due to the relatively small sam- ple size and instability of the sample across survey years. The authors acknowledge this and state that the results “should be regarded as sugges- tive rather than definitive.” Our own results in table 2.3 suggest that in 1990 immigrants who arrived between 1985 and 1989 were slightly more highly educated than arrivals from earlier in the 1980s or the 1970s. But some of this difference is probably accounted for by foreign students who enroll in American universities temporarily.
58 Julian R. Betts and Magnus Lofstrom
Jasso, Rosenzweig, and Smith utilize INS data to analyze trends in skills of immigrants. The advantage of this data set is that it only includes legal immigrants and the admission criteria of each individual can be identified. However, the disadvantage is that the data set does not contain any infor- mation about education or earnings. The authors instead use information on occupation to infer skill levels of immigrants. The finding of a reversal of the downward trend in immigrant skill clearly depends on the accuracy of this method.
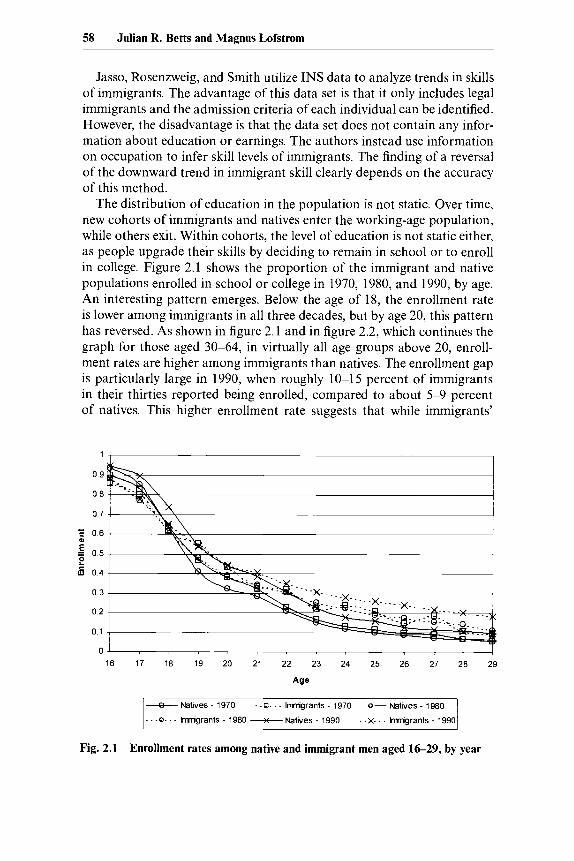
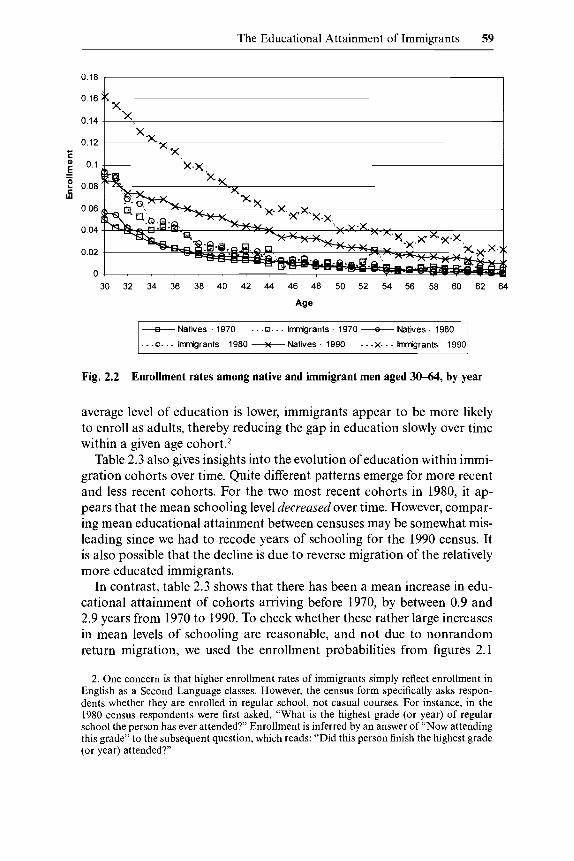
The distribution of education in the population is not static. Over time, new cohorts of immigrants and natives enter the working-age population, while others exit. Within cohorts, the level of education is not static either, as people upgrade their skills by deciding to remain in school or to enroll in college. Figure 2.1 shows the proportion of the immigrant and native populations enrolled in school or college in 1970, 1980, and 1990, by age. An interesting pattern emerges. Below the age of 18, the enrollment rate is lower among immigrants in all three decades, but by age 20, this pattern has reversed. As shown in figure 2.1 and in figure 2.2, which continues the graph for those aged 30-64, in virtually all age groups above 20, enroll- ment rates are higher among immigrants than natives. The enrollment gap is particularly large in 1990, when roughly 10-15 percent of immigrants in their thirties reported being enrolled, compared to about 5-9 percent of natives. This higher enrollment rate suggests that while immigrants’
1 ,
0.9
0 8
0.7
5 0 6
E = 0.5 : 16 0 4
0.3
0.2
0 1
0 4 T I 16 17 18 19 20 21 22 23 24 25 26 27 28 29
Age
--€I-- Natrves - 1970
. . - 0 . . . lmgrants - 1980 - Natrves - 1990
- . 0- - - lmgrants - 1970 - Natrves - 1980
. . .x-. . lmgrants - 1990
Fig. 2.1 Enrollment rates among native and immigrant men aged 16-29, by year
The Educational Attainment of Immigrants 59
30 32 34 36 38 40 42 44 46 48 50 52 54 56 58 60 62 64
Age
--e- Natives - 1970
. . - 0 . . . Imnigrants - 1980 +Natives - 1990
. . . Q- . . imnigrants - 1970 - Natives - 1980
. - -x . . - kmrgrants - 1990
Fig. 2.2 Enrollment rates among native and immigrant men aged 3 M , by year
average level of education is lower, immigrants appear to be more likely to enroll as adults, thereby reducing the gap in education slowly over time within a given age cohort.*
Table 2.3 also gives insights into the evolution of education within immi- gration cohorts over time. Quite different patterns emerge for more recent and less recent cohorts. For the two most recent cohorts in 1980, it ap- pears that the mean schooling level decreased over time. However, compar- ing mean educational attainment between censuses may be somewhat mis- leading since we had to recode years of schooling for the 1990 census. It is also possible that the decline is due to reverse migration of the relatively more educated immigrants.
In contrast, table 2.3 shows that there has been a mean increase in edu- cational attainment of cohorts arriving before 1970, by between 0.9 and 2.9 years from 1970 to 1990. To check whether these rather large increases in mean levels of schooling are reasonable, and not due to nonrandom return migration, we used the enrollment probabilities from figures 2.1
2. One concern is that higher enrollment rates of immigrants simply reflect enrollment in English as a Second Language classes. However, the census form specifically asks respon- dents whether they are enrolled in regular school, not casual courses. For instance, in the 1980 census respondents were first asked, “What is the highest grade (or year) of regular school the person has ever attended?’ Enrollment is inferred by an answer of “Now attending this grade” to the subsequent question, which reads: “Did this person finish the highest grade (or year) attended?”
60 Julian R. Betts and Magnus Lofstrom
and 2.2 to calculate the expected increase in education over a 20-year pe- riod. This is calculated by the following formula:
29 39
C Enrollment Probability,,,,,, + C Enrollment Probability,,,,,, , ,=20 r=30
where i is the age and 1970 and 1980 represent the census year. In the above example, the 20-year interval looked at is for an individual who is 20 years old in 1970 and 39 years old in 1989. The expected increase in mean years of schooling for an immigrant in this period is 2.78 years. This is certainly in the range of mean increase in education mentioned above. However, table 2.3 shows that the largest increase in educational attain- ment over the 20-year period was for the oldest cohort, arrivals before 1950. This group is likely to have a large proportion of individuals who were older than 20 in 1970. If we use the formula above for an immigrant who is 30 in 1970, the predicted increase in schooling is only 0.66 years. It appears that perhaps for the cohort that arrived before 1950, the large apparent gains in mean education over time partly reflect nonrandom re- turn migration whereby less skilled workers returned home over time. But for the cohorts that arrived in the 1950s and 1960s, the observed gains may be genuine.
Immigrants to the United States are likely to have acquired some educa- tion in their home country and some after migrating. There is no question in the censuses that asks for this information specifically. However, we can calculate proxies for these as follows, assuming individuals are in school continuously from age six. If an immigrant migrated at an age of six or younger, we assume that all schooling took place in the United States. If the age at migration was between six and the total number of years of schooling plus six, premigration education is set at age at migration minus six and the remainder is assumed to be U.S. education. If age at migration is greater than years of education plus six, it is assumed that all schooling took place a b r ~ a d . ~
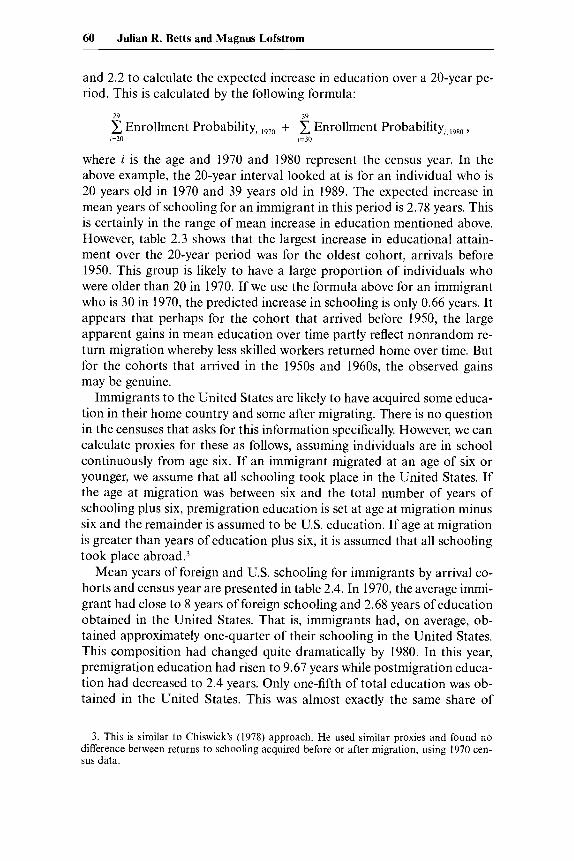
Mean years of foreign and U.S. schooling for immigrants by arrival co- horts and census year are presented in table 2.4. In 1970, the average immi- grant had close to 8 years of foreign schooling and 2.68 years of education obtained in the United States. That is, immigrants had, on average, ob- tained approximately one-quarter of their schooling in the United States. This composition had changed quite dramatically by 1980. In this year, premigration education had risen to 9.67 years while postmigration educa- tion had decreased to 2.4 years. Only one-fifth of total education was ob- tained in the United States. This was almost exactly the same share of
3. This is similar to Chiswick's (1978) approach. He used similar proxies and found no difference between returns to schooling acquired before or after migration, using 1970 cen- sus data.
Table 2.4 Mean Years of Foreign and U.S. Schooling
1970 1980 1990
Premigration Postmigration Premigration Postmigration Premigration Postmigration Education Cohort Education Education Education Education Education
All 7.966 2.684 9.672 2.404 9.515 2.365
Arrived 1985-89 Arrived 1980-84 Arrived 1975-79 Arrived 1970-74 Arrived 1965-69 Arrived 1960-64 Arrived 1950-59 Arrived before 1950
12.253 11.501
12.240 0.015 10.744 11.285 0.207 9.785
11.310 0.003 11.165 0.690 8.886 10.859 0.103 10.368 1.970 7.844 9.833 0.847 7.997 4.379 6.697 5.185 5.023 7.009 5.342 2.391
0.013 0.178 0.748 1.663 3.357 4.877 6.026
10.709
Nore: Data are from 1970, 1980, and 1990 public use samples of the US. census for immigrant men aged 24-64.
62 Julian R. Betts and Magnus Lafstrom
postmigration education to total education that was observed in 1990, when foreign education had decreased slightly to 9.51 years and U.S.- acquired schooling had dropped further to 2.36 years. It is possible that this is simply driven by an increase in immigration in the 1970s and 1980s. Since recently arrived immigrants have obtained most of their schooling in their home country, as is shown in table 2.4, and the proportion of recent immigrants to the total immigrant population has been increasing, the share of postmigration education will consequently decrease.
It is interesting to note that the composition of pre-and postmigration education changes drastically over time for a given arrival cohort. For example, the 1960-64 arrival cohort had only 0.1 years of U.S. education in 1970. In 1980 this had increased to 1.97 years, and by 1990 it was 4.87 years. The large increase in postmigration education within cohorts over time likely reflects a genuine increase in education among immigrants, nonrandom reverse migration, and possibly, recall bias in which immi- grants progressively understate the proportion of their education obtained abroad over time. Another plausible reason for the increase is that the older members of a cohort will have lower life expectancy, so that the composition of the cohort shifts over time toward a greater proportion of immigrants who arrived at a younger age. It is these youngest arrivals who are most likely to enroll in American schools and colleges.
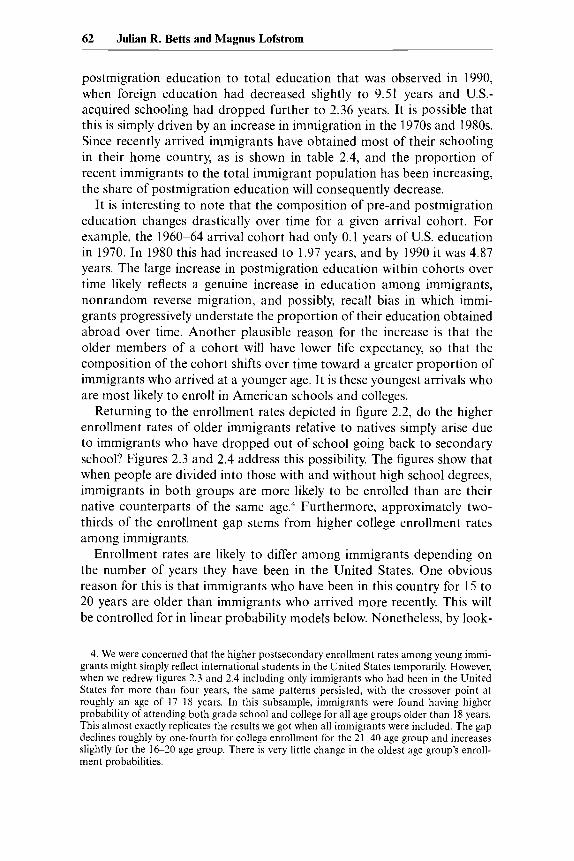
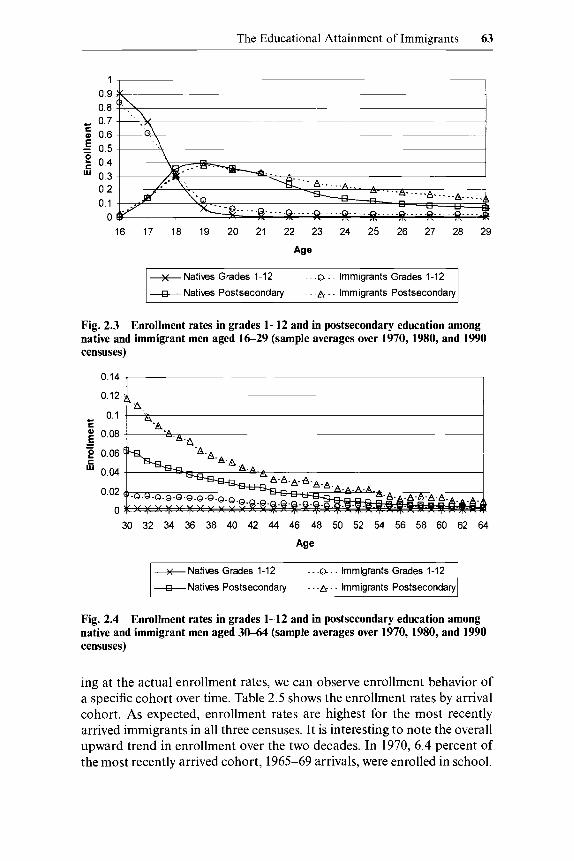
Returning to the enrollment rates depicted in figure 2.2, do the higher enrollment rates of older immigrants relative to natives simply arise due to immigrants who have dropped out of school going back to secondary school? Figures 2.3 and 2.4 address this possibility. The figures show that when people are divided into those with and without high school degrees, immigrants in both groups are more likely to be enrolled than are their native counterparts of the same age.j Furthermore, approximately two- thirds of thc enrollment gap stems from higher college enrollment rates among immigrants.
Enrollment rates are likely to differ among immigrants depending on the number of years they have been in the United States. One obvious reason for this is that immigrants who have been in this country for 15 to 20 years are older than immigrants who arrived more recently. This will be controlled for in linear probability models below. Nonetheless, by look-
4. We were concerned that the higher postsecondary enrollment rates among young immi- grants might simply reflect international students in the United States temporarily. However, when we redrew figures 2.3 and 2.4 including only immigrants who had been in the United States for more than four years, the same patterns persisted, with the crossover point at roughly an age of 17-18 years. In this subsample, immigrants were found having higher probability of attending both grade school and college for all age groups older than 18 years. This almost exactly replicates the results we got when all immigrants were included. The gap declines roughly by one-fourth for college enrollment for the 21-40 age group and increases slightly for the 16-20 age group. There is very little change in the oldest age group’s enroll- ment probabilities.
The Educational Attainment of Immigrants 63
1 0.9 0.8
cI 0.7
i o.6 = 0.5 0.4 0.3 0.2 0.1
0 16 17 18 19 20 21 22 23 24 25 26 27 28 29
Age
+Natiws Grades 1-12
-B-- Natives Postsecondary
- - -0.. - Immigrants Grades 1-12
- . .A- - - Immigrants Postsecondary
Fig. 2.3 Enrollment rates in grades 1-12 and in postsecondary education among native and immigrant men aged 16-29 (sample averages over 1970, 1980, and 1990 censuses)
0.14
0.12
0.1
0.08
2 0.06
0.04
0.02
0
c
- -
30 32 34 36 38 40 42 44 46 48 50 52 54 56 58 60 62 64
Age
+Natiws Grades 1-12
&Natives Postsecondary
. . .o-. . Immigrants Grades 1-12
. . .A-. . Immigrants Postsecondary
Fig. 2.4 Enrollment rates in grades 1-12 and in postsecondary education among native and immigrant men aged 30-64 (sample averages over 1970,1980, and 1990 censuses)
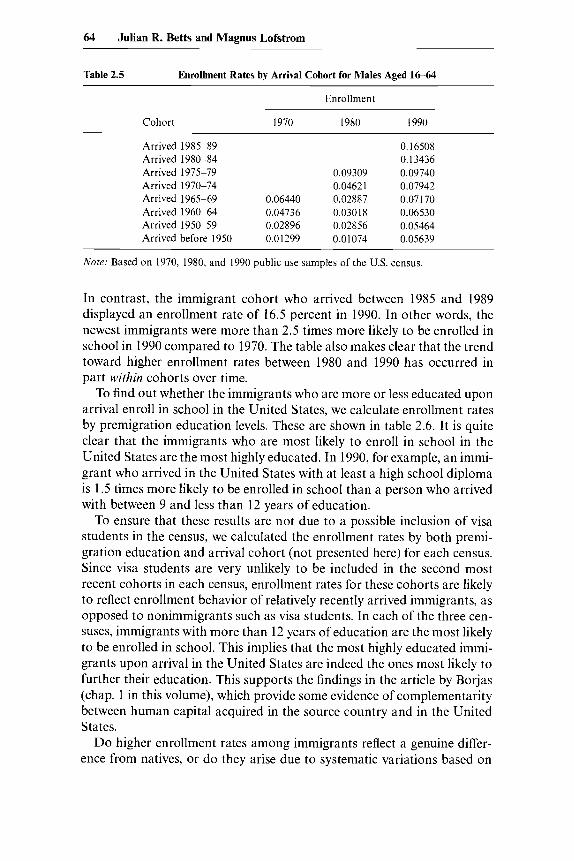
ing at the actual enrollment rates, we can observe enrollment behavior of a specific cohort over time. Table 2.5 shows the enrollment rates by arrival cohort. As expected, enrollment rates are highest for the most recently arrived immigrants in all three censuses. It is interesting to note the overall upward trend in enrollment over the two decades. In 1970, 6.4 percent of the most recently arrived cohort, 1965-69 arrivals, were enrolled in school.
64 Julian R. Betts and Magnus Lofstrom
Table 2.5 Enrollment Rates by Arrival Cohort for Males Aged 16-64
Enrollment
Cohort 1970 I980 1990
Arrived 1985-89 Arrived 1980-84 Arrived 1975-79 Arrived 1970-74 Arrived 1965-69 Arrived 1960-64 Arrived 1950-59 Arrived before 1950
0.16508 0.13436
0.09309 0.09740 0.04621 0.07942
0.06440 0.02887 0.07170 0.04736 0.03018 0.06530 0.02896 0.02856 0.05464 0.01299 0.01074 0.05639
Note: Based on 1970, 1980, and 1990 public use samples of the U.S. census.
In contrast, the immigrant cohort who arrived between 1985 and 1989 displayed an enrollment rate of 16.5 percent in 1990. In other words, the newest immigrants were more than 2.5 times more likely to be enrolled in school in 1990 compared to 1970. The table also makes clear that the trend toward higher enrollment rates between 1980 and 1990 has occurred in part within cohorts over time.
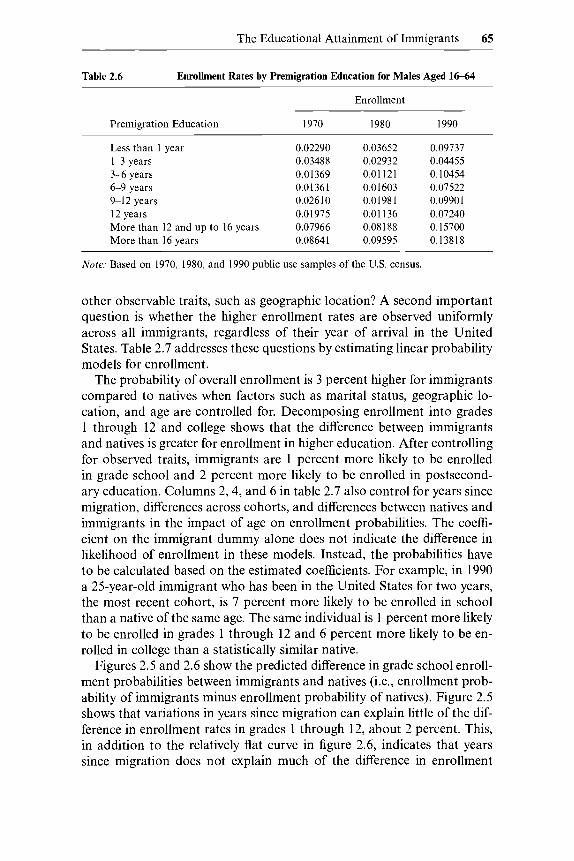
To find out whether the immigrants who are more or less educated upon arrival enroll in school in the United States, we calculate enrollment rates by premigration education levels. These are shown in table 2.6. It is quite clear that the immigrants who are most likely to enroll in school in the United States are the most highly educated. In 1990, for example, an immi- grant who arrived in the United States with at least a high school diploma is 1.5 times more likely to be enrolled in school than a person who arrived with between 9 and less than 12 years of education.
To ensure that these results are not due to a possible inclusion of visa students in the census, we calculated the enrollment rates by both premi- gration education and arrival cohort (not presented here) for each census. Since visa students are very unlikely to be included in the second most recent cohorts in each census, enrollment rates for these cohorts are likely to reflect enrollment behavior of relatively recently arrived immigrants, as opposed to nonimmigrants such as visa students. In each of the three cen- suses, immigrants with more than 12 years of education are the most likely to be enrolled in school. This implies that the most highly educated immi- grants upon arrival in the United States are indeed the ones most likely to further their education. This supports the findings in the article by Borjas (chap. 1 in this volume), which provide some evidence of complementarity between human capital acquired in the source country and in the United States.
Do higher enrollment rates among immigrants reflect a genuine differ- ence from natives, or do they arise due to systematic variations based on
The Educational Attainment of Immigrants 65
Table 2.6 Enrollment Rates by Remigration Education for Males Aged 16-64
Premigration Education
Less than 1 year 1-3 years 3 ~ 6 years 6-9 years 9-12 years 12 years More than 12 and up to 16 years More than 16 years
Enrollment
1970
0.0229 0 0.03488 0.01369 0.01361 0.02610 0.01975 0.07966 0.08641
1980
0.03652 0.02932 0.01121 0.01603 0.01 98 1 0.01136 0.081 88 0.09595
1990
0.09737 0.04455 0.10454 0.07522 0.09901 0.07240 0.15700 0.13818
Note: Based on 1970, 1980, and 1990 public use samples of the U.S. census.
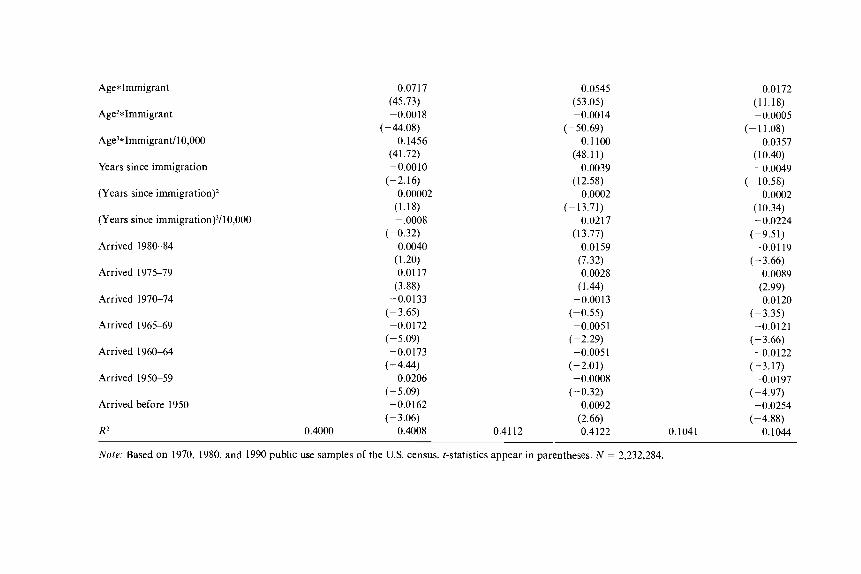
other observable traits, such as geographic location? A second important question is whether the higher enrollment rates are observed uniformly across all immigrants, regardless of their year of arrival in the United States. Table 2.7 addresses these questions by estimating linear probability models for enrollment.
The probability of overall enrollment is 3 percent higher for immigrants compared to natives when factors such as marital status, geographic lo- cation, and age are controlled for. Decomposing enrollment into grades 1 through 12 and college shows that the difference between immigrants and natives is greater for enrollment in higher education. After controlling for observed traits, immigrants are 1 percent more likely to be enrolled in grade school and 2 percent more likely to be enrolled in postsecond- ary education. Columns 2,4, and 6 in table 2.7 also control for years since migration, differences across cohorts, and differences between natives and immigrants in the impact of age on enrollment probabilities. The coeffi- cient on the immigrant dummy alone does not indicate the difference in likelihood of enrollment in these models. Instead, the probabilities have to be calculated based on the estimated coefficients. For example, in 1990 a 25-year-old immigrant who has been in the United States for two years, the most recent cohort, is 7 percent more likely to be enrolled in school than a native of the same age. The same individual is 1 percent more likely to be enrolled in grades 1 through 12 and 6 percent more likely to be en- rolled in college than a statistically similar native.
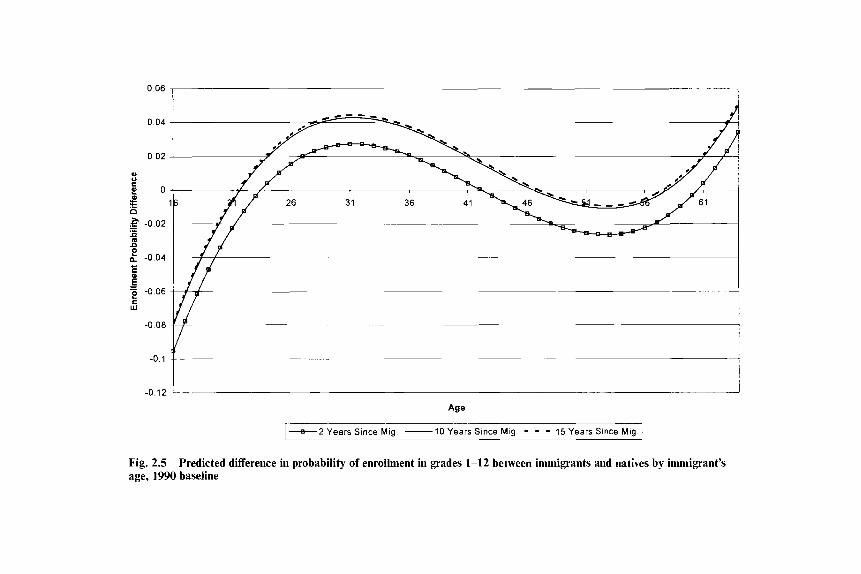
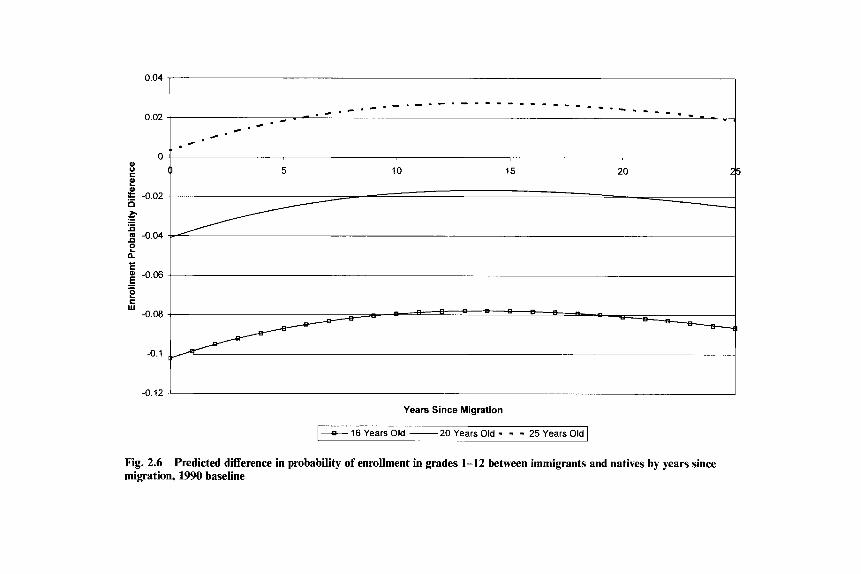
Figures 2.5 and 2.6 show the predicted difference in grade school enroll- ment probabilities between immigrants and natives (i.e., enrollment prob- ability of immigrants minus enrollment probability of natives). Figure 2.5 shows that variations in years since migration can explain little of the dif- ference in enrollment rates in grades 1 through 12, about 2 percent. This, in addition to the relatively flat curve in figure 2.6, indicates that years since migration does not explain much of the difference in enrollment
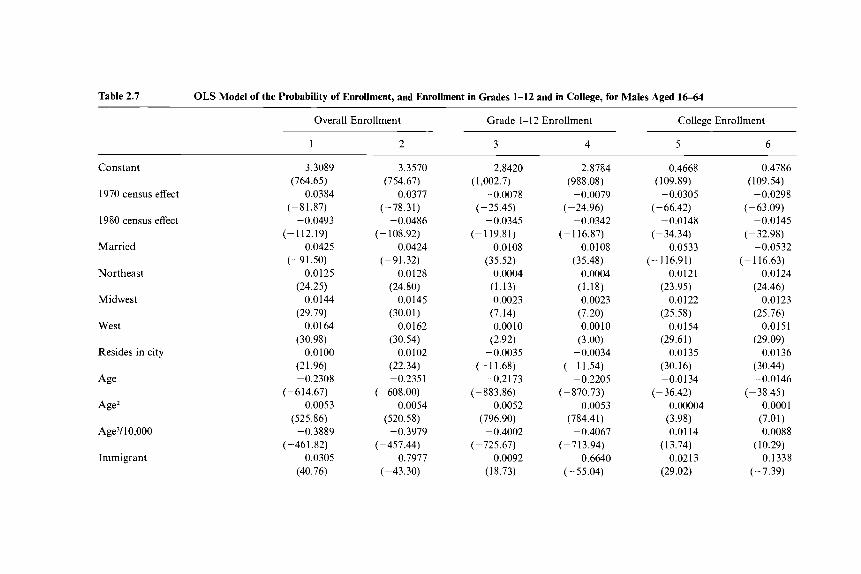
Table 2.7 OLS Model of the Probability of Enrollment, and Enrollment in Grades 1-12 and in College, for Males Aged 16-64
Overall Enrollment Grade 1-12 Enrollment College Enrollment
1 2 3 4 5 6
Constant
1970 census effect
1980 census effect
Married
Northeast
Midwest
West
Resides in city
Age
Age2
Age3/10,000
Immigrant
3.3089
-0.0384 (764.65)
(-81.87)
(- 112.19)
(-9 1.50)
(24.25)
(29.79)
(30.98)
(21.96)
-0.0493
-0.0425
0.0125
0.0144
0.0164
0.0100
-0.2308
0.0053
-0.3889
0.0305
(-614.67)
(525.86)
(-461.82)
(40.76)
3.3570
-0.0377 (754.67)
(-78.31)
(-108.92)
(-91.32)
-0.0486
-0.0424
0.0128 (24.80)
0.0145 (30.01)
0.0162 (30.54)
0.0102 (22.34) -0.2351
(- 608.00)
(520.58) 0.0054
-0.3979 (-457.44)
-0.7977 (-43.30)
2.8420 (1,002.7)
-0.0078 (- 25.45)
(-1 19.81) -0.0345
0.0108 (35.52)
0.0004 (1.13) 0.0023
(7.14) 0.0010
(2.92) -0.0035
(- 11.68)
(-883.86)
(796.90)
(- 725.67)
-0.2 173
0.0052
-0.4002
0.0092 (18.73)
2.8784 (988.08)
-0.0079 (-24.96)
-0.0342 (- 116.87)
0.0108 (35.48)
0.0004 (1.18) 0.0023
(7.20) 0.0010
(3.00) -0.0034
(- 11.54)
(-870.73) -0.2205
0.0053 (784.41)
-0.4067 (- 7 13.94)
( - 55.04) -0.6640
0.4668 (109.89)
-0.0305 (- 66.42)
-0.0148 (-34.34)
-0.0533
0.0121 (23.95)
0.0122 (25.58)
0.0154 (29.61)
0.0135 (30.16) -0.0134
(-36.42) 0.00004
(3.98) 0.01 14
(1 3.74) 0.0213
(29.02)
(- 116.91)
0.4786 ( 1 09.54)
-0.0298 (- 63.09)
-0.0145 (-32.98)
(-116.63)
(24.46)
(25.76)
(29.09)
(30.44)
(- 38.45)
-0.0532
0.0124
0.0123
0.0151
0.0136
- 0.0 I46
0.0001 (7.01) 0.0088
(10.29) -0.1338
(-7.39)
Age*Immigrant
Age2*Immigrant
Age3*Immigrantl 10,000
Years since immigration
(Years since
(Years since immigration)’/10,000
Arrived 1980-84
Arrived 197579
Arrived 1970-74
Arrived 1965-69
Arrived 1960-64
Arrived 1950-59
Arrived before 1950
R2
0.0717 (45.73) -0.0018
(-44.08) 0.1456
(41.72) - 0.00 10
(-2.16) 0.00002
(1.18) - ,0008
(-0.32) 0.0040
(1.20) 0.0117
(3.88) -0.0133
( - 3.65)
(-5.09) -0.0172
-0.0173 (-4.44) -0.0206
(-5.09)
(-3.06) -0.0162
0.4000 0.4008
0.0545 (53.05) -0.0014
(- 50.69) 0.1 100
(48.1 1) 0.0039
( 12.58) -0.0002
(- 13.71) 0.0217
(13.77) 0.0159
(7.32) 0.0028
(1.44) -0.0013
(-0.55)
(-2.29) -0.0051
-0.0051 (-2.01) -0.0008
(-0.32) 0.0092
(2.66) 0.41 12 0.4122
0.0172
-0.0005
0.0357
-0.0049
0.0002
-0.0224
(11.18)
(- 11.08)
( 10.40)
(- 10.58)
(10.34)
(-9.51)
(- 3.66) -0.0119
0.0089 (2.99)
-0.0120 (-3.35) -0.0121
(-3.66) - 0.0 122
(- 3.1 7) -0.0197
(-4.97)
(-4.88) -0.0254
0.1041 0.1044
Note; Based on 1970, 1980, and 1990 public use samples of the US. census. ?-statistics appear in parentheses. N = 2,232,284.
0.06 , 0 04
0 02
a
i o t P - - 0 0 2 6
s n
-0 04 *
- E p -0 06 E w
-0 08
-0 1
-2 Years Since Mig - 10 Years Since Mig - - - 15 Years Since Mig
Fig. 2.5 Predicted difference in probability of enrollment in grades 1-12 between immigrants and natives by immigrant’s age, 1990 baseline
I
I I
I 4 I
I 1
I I I I
I I
I I I I 1 I I I
L \ \ \
L
r \
70 Julian R. Betts and Magnus Lofstrom
probabilities for grades 1 through 12. Instead, age appears to be the driving force behind the differences. The pattern is complex, but the most striking pattern is lower enrollment rates for immigrants in their teens compared to their native peers.
The relatively low enrollment rates among younger immigrants may in- dicate that immigrants, in particular from Mexico, do not “drop in” to high school when they arrive in the United States. The average Hispanic immigrant in our sample has fewer than nine years of schooling and has already been out of school for at least one year by the age of 16. Similarly, Vernez and Abrahamse (1996) report that the average Mexican immigrant has only seven years of schooling. It may be hard for these young individu- als to perform at the same academic level as their native peers. It is quite possible that they postpone some education until later in life. This would then explain some of the higher enrollment rates in grade school for immi- grants in their twenties and thirties.
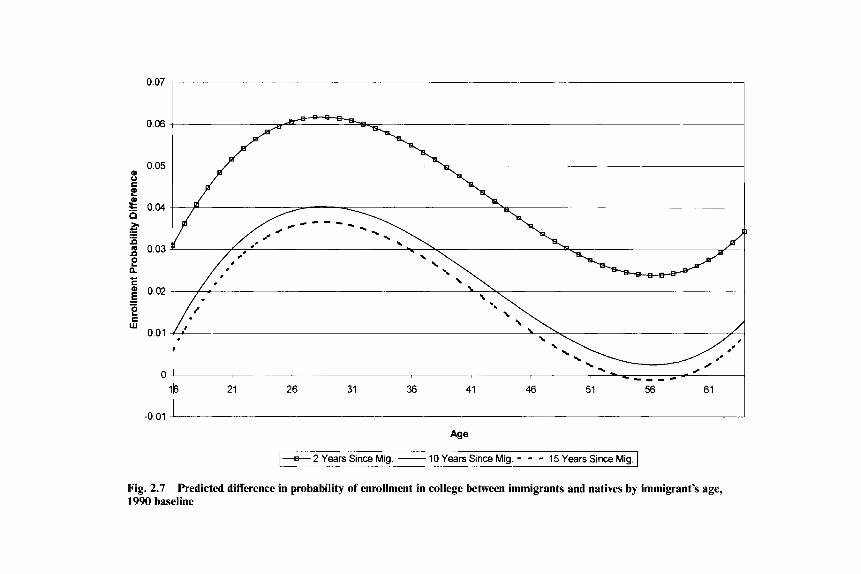
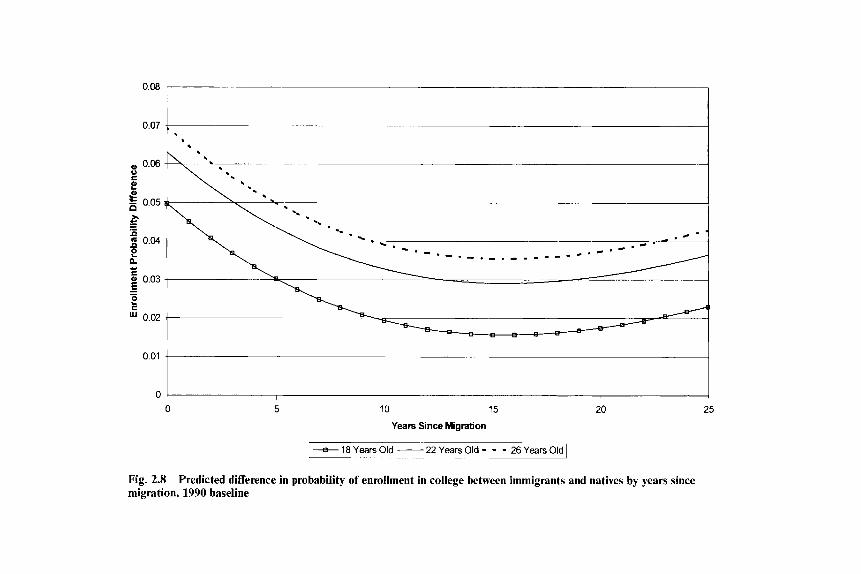
The predicted difference in enrollment in postsecondary education probabilities between immigrants and natives is quite different from that in grades 1 through 12. Immigrants of all ages are more likely to be en- rolled in college than are natives of the same age. These differences are also much more influenced by years since migration than are enrollment probabilities in grade school. This is shown in figures 2.7 and 2.8. Immi- grants appear to enroll at a much higher rate relatively early after migrat- ing, regardless of age. The benefits, and possible requirement, of acquiring US.-specific human capital in the labor market would give immigrants an incentive to acquire these skills soon after arriving: The earlier these skills are obtained, the longer is the period during which the benefits can be reaped. It should also be noted that the finding that immigrants enroll in postsecondary schooling early after arrival may possibly partially reflect inclusion of visa students in the censuses.
Although immigrants do appear to be more likely to enroll in both sec- ondary and postsecondary education, it is the level of education, and not its rate of change, that is a more relevant predictor of an immigrant’s eco- nomic welfare. Table 2.8 presents two models of years of schooling, along with two models for probability of high school graduation and two models for probability of college graduation.
Immigrants are predicted to have 1.4 fewer years of education compared to natives when age, geographic location, and marital status are taken into account. Although immigrants are 18 percent less likely to graduate from high school, they are not less likely to be college graduates. This again shows that there is great heterogeneity in educational attainment among immigrants; as we showed in tables 2.1 and 2.2, the upper quartile of immi- grants is as highly educated as the upper quartile of natives. Column 2 in table 2.8 adds cohort effects, controls for years since migration, and immigrant’s age. Immigrants who arrived in the 1950s have 1.5 years more
"8
1
z 0
1
-----r-
I \ 1
1
,
I/ 0
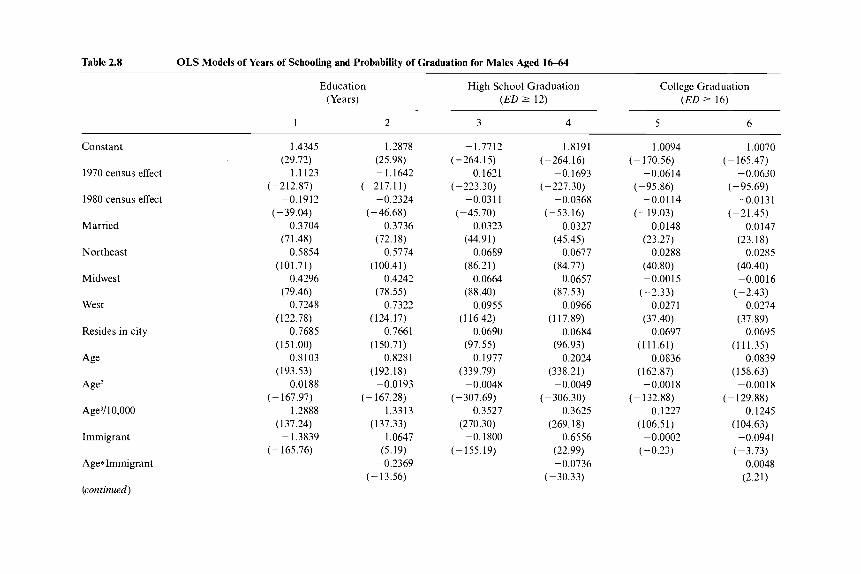
Table 2.8 OLS Models of Years of Schooling and Probability of Graduation for Males Aged 16-64
Education High School Graduation College Graduation (Years) (ED 2 12) (ED P 16)
1 2 3 4 5 6
Constant
1970 census effect
1980 census effect
Married
Northeast
Midwest
West
Resides in city
Age
Age'
Age3/ 10,000
Immigrant
Age*Immigrant
(continued)
1.4345
- 1.1 123 (29.72)
(-212.87)
(-39.04) -0.1912
0.3704
0.5854
0.4296
0.7248
0.7685
0.8103
-0.0188
1.2888
- 1.3839
(71.48)
(101.71)
(79.46)
(122.78)
(1 51 .OO)
(193.53)
(-167.97)
(137.24)
(- 165.76)
1.2878 (25.98) -1.1642
(-217.11)
(-46.68)
(72.18)
(100.4 1)
(78.55)
( 124.17)
(1 50.71)
(192.18)
-0.2324
0.3736
0.5774
0.4242
0.7322
0.7661
0.8281
-0.0193 (- 167.28)
( 137.33) 1.3313
1.0647 (5.19)
-0.2369 (-13.56)
-1.7712 (-264.15)
(- 223.30)
(-45.70)
(44.91)
(86.21)
(88.40)
(116.42)
-0.1621
-0.031 1
0.0323
0.0689
0.0664
0.0955
0.0690
0.1977 (97.55)
(339.79)
(- 307.69)
(270.30)
(- 1 55.19)
-0.0048
0.3527
-0.1800
-1.8191 (- 264.16)
(- 227.30)
(-53.16)
-0.1693
-0.0368
0.0327
0.0677
0.0657
0.0966
0.0684
0.2024
(45.45)
(84.77)
(87.53)
(117.89)
(96.93)
(338.21) -0.0049
0.3625 (269.18)
0.6556 (22.99) -0.0736
(-30.33)
( - 306.30)
- 1.0094 (- 170.56)
(-95.86) -0.0614
-0.0114 (-19.03)
0.0148 (23.27)
0.0288 (40.80) -0.00 15
(-2.33) 0.0271
0.0697
0.0836
-0.0018
(37.40)
(1 11.61)
(1 62.87)
(-132.88) 0.1227
-0.0002 (1 06.5 1)
(-0.23)
- 1.0070 (- 165.47)
(-95.69)
(-21.45)
(23.18)
(40.40)
-0.0630
-0.0131
0.0147
0.0285
-0.0016
0.0274
0.0695
0.0839
-0.0018
0.1245
-0.0941
0.0048
(-2.43)
(37.89)
(1 11.35)
(1 58.63)
( - 129.88)
( I 04.63)
(-3.73)
(2.21)
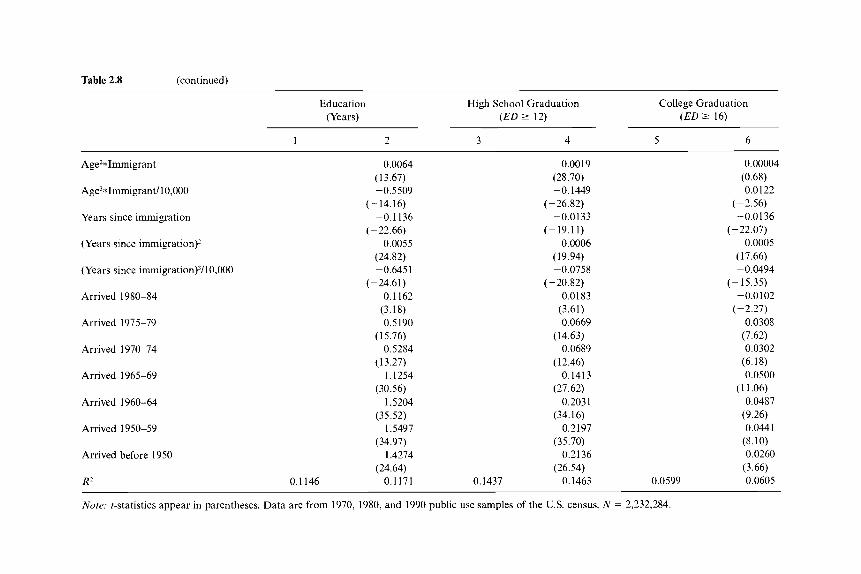
Table 2.8 (continued)
Education High School Graduation College Graduation (Years) (ED 2 12) (ED 2 16)
1 2 3 4 5 6
Age2*Immigrant
Age3*Immigrant/10,000
Years since immigration
(Years since immigration)2
(Years since immigration)’/lO,OOO
Arrived 1980-84
Arrived 1975-79
Arrived 1970-74
Arrived 1965-69
Arrived 1960-64
Arrived 1950-59
Arrived before 1950
R2
0.0064 (13.67) -0.5509
( - 14.16)
(-22.66) -0.1136
0.0055 (24.82) -0.6451
(-24.61) 0.1162
(3.18) 0.5190
(15.76) 0.5284
(13.27) 1.1254
(30.56) 1.5204
(35.52) 1,5497
(34.97) 1.4274
(24.64) 0.1146 0.1171
0.0019 (28.70) -0.1449
(-26.82)
(-19.11)
( 19.94)
(-20.82)
-0.0133
0.0006
-0.0758
0.0183 (3.61) 0.0669
(14.63) 0.0689
(12.46) 0.1413
(27.62) 0.2031
(34.16) 0.2197
(3 5.70) 0.2136
(26.54) 0.1437 0.1463
0.00004 (0.68)
-0.0122
-0.0136
0.0005
-0.0494 (-15.35)
-0.0102 (-2.27)
0.0308 (7.62) 0.0302
(6.18) 0.0500
(1 1.06) 0.0487
(9.26) 0.0441
0.0260 (3.66)
0.0599 0.0605
(-2.56)
(-22.07)
(17.66)
(8.10)
Note: t-statistics appear in parentheses. Data are from 1970, 1980, and 1990 public use samples of the U.S. census. N = 2,232,284
The Educational Attainment of Immigrants 75
-0 5 O 5
1
-1.5 >
-2
-2.5
-3 i I 16 21 26 31 35 41 46 51 56 61
-2 Years Since Migrabon + 5 Years Snce Migration - IOYearsSinceMigation - - - 15 Years Since Migabon
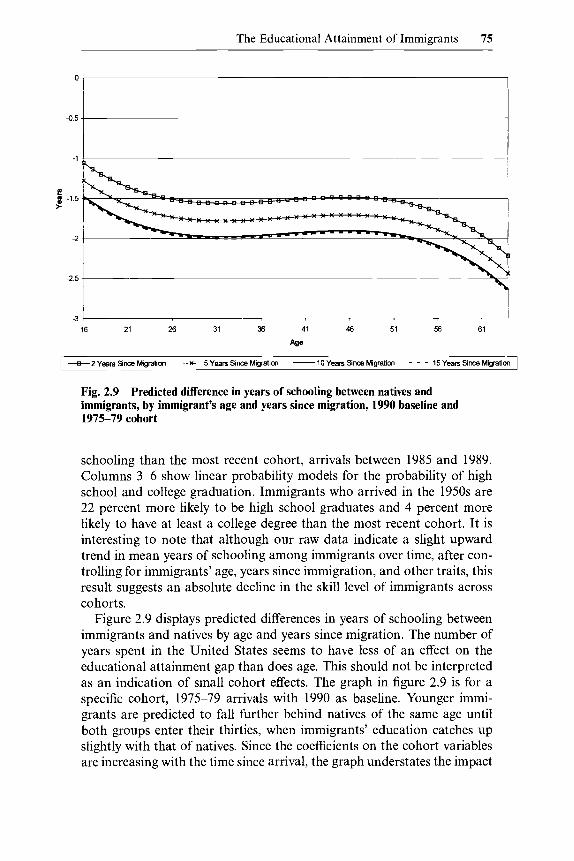
Fig. 2.9 Predicted difference in years of schooling between natives and immigrants, by immigrant’s age and years since migration, 1990 baseline and 1975-79 cohort
schooling than the most recent cohort, arrivals between 1985 and 1989. Columns 3-6 show linear probability models for the probability of high school and college graduation. Immigrants who arrived in the 1950s are 22 percent more likely to be high school graduates and 4 percent more likely to have at least a college degree than the most recent cohort. It is interesting to note that although our raw data indicate a slight upward trend in mean years of schooling among immigrants over time, after con- trolling for immigrants’ age, years since immigration, and other traits, this result suggests an absolute decline in the skill level of immigrants across cohorts.
Figure 2.9 displays predicted differences in years of schooling between immigrants and natives by age and years since migration. The number of years spent in the United States seems to have less of an effect on the educational attainment gap than does age. This should not be interpreted as an indication of small cohort effects. The graph in figure 2.9 is for a specific cohort, 1975-79 arrivals with 1990 as baseline. Younger immi- grants are predicted to fall further behind natives of the same age until both groups enter their thirties, when immigrants’ education catches up slightly with that of natives. Since the coefficients on the cohort variables are increasing with the time since arrival, the graph understates the impact
76 Julian R. Betts and Magnus Lofstrom
of years since migration. Nonetheless, it appears that, overall, for a given year since migration, the educational gap increases with age. For example, among the most recent immigrants, it seems that the older immigrants are relatively less educated compared to both natives and younger immigrants.
Another way of looking at this question is to think of age at migration, rather than years since migration, as a key determinant of total education acquired.5 For example, looking at the line for two years since migration in figure 2.9, we see that the younger the person when he immigrates to the United States, the higher will be his level of education in general. See Gonzalez (1997) for an analysis of the effect of age at immigration on the level of education of immigrants. He finds, as implied by our analysis, that immigrants who arrive at an earlier age in the end obtain more years of schooling.
2.3.2 Robustness of the Linear Probability Models
As a test of robustness, the linear probability models of enrollment and graduation presented in tables 2.7 and 2.8 were also estimated by probit. This was done since the enrollment probabilities are quite close to zero for some groups, so that the lincarly estimated probabilities may suggest negative probabilities. The probit results for the immigrant variables, in- cluding marginal effects, are shown in appendix tables 2A.2 and 2A.3.
The probit results are quite similar with a few relatively minor excep- tions discussed below. The simpler enrollment models in table 2A.2- models 1,3, and 5-show that predicted enrollment probability differences between immigrants and natives do not change very much in the probit models, compared to the least squares models. Immigrants are still more likely to be enrolled in both grade school and postsecondary education. Fig- ures 2.5,2.6,2.7, and 2.8 were also re-generated by using the marginal effects from the probit results in the more complex models 4 and 6 (these figures are not presented in this paper). When the marginal effects are evaluated at the means, using the means for immigrants for variables that are specific to immigrants, the figures resemble the original figures quite closely.
The graduation probabilities are also quite similar when the results from the probit models are used. The probit results in models 3 and 5 in table 2A.3 indicate that immigrants are approximately 20.6 percent less likely to be high school graduates and about 0.1 percent less likely to be college graduates, compared to statistically similar natives. The identically defined linear probability models suggest 18 percent and no difference, respec- tively. Our calculations for predicted graduation probabilities using mod- els 3 and 5 in table 2A.3 show results similar but not identical to the
5. Of course. we cannot include age, years since migration, and age at migration in the regression since they are perfectly collinear. Furthermore, the problem of collinearity arises in all our models that include cohort dummies, years since migration, and census years.
The Educational Attainment of Immigrants 77
derived predictions from the linear models shown in table 2.8. For ex- ample, the probit estimates indicate that an immigrant who arrived be- tween 1985 and 1989 is 26.1 percent less likely to be a high school graduate and about 4.4 percent less likely to be a college graduate compared to an immigrant who arrived in the first half of the 1960s. The predicted gradua- tion probabilities derived from the least squares models suggest differences of 20.3 and 4.9 percent, respectively.
Overall, the probit models appear to closely support the estimates from the linear probability models.
2.4 Implications of Recent Trends for the Immigrant-Native Earning Gap
2.4.1 Basic Results
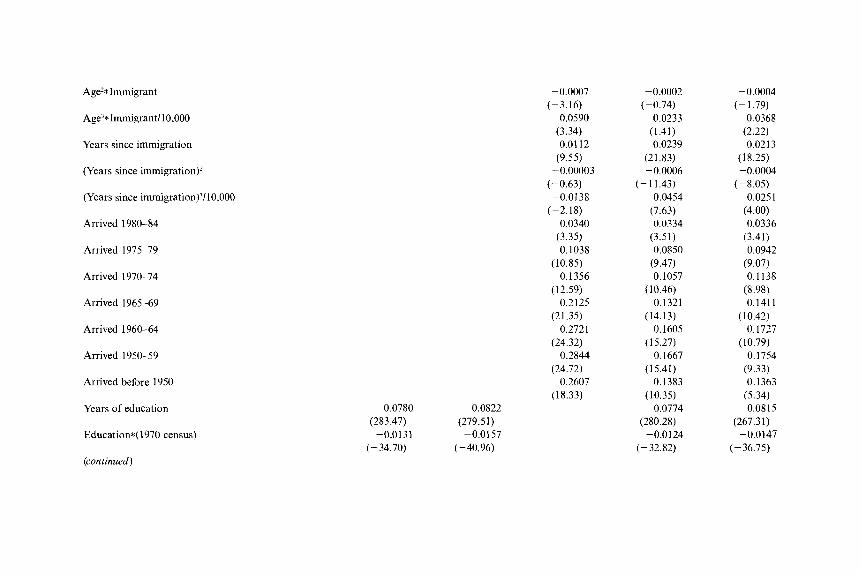
The changes in schooling of immigrants over the last two decades, as described above, are likely to have consequences for the welfare of immi- grants. In particular, they may affect how immigrants perform in the labor market. The decline in the relative educational attainment of immigrants is likely to affect the difference between immigrants’ and natives’ earnings. Table 2.9 shows six models of log weekly earnings. The first two models assume that earnings for immigrants and natives are affected equally by factors such as age and education. Later models do not impose this restric- tion. The coefficient on the immigrant dummy variable in table 2.9, col- umns 1 and 2, can be interpreted as the approximate immigrant-native earnings gap. This gap is close to 18 percent when controlling for period effects, geographic location, city residence, and age. However, as shown in model 2, adding variables for education, and education interacted with period effects, narrows the gap to slightly over 7 percent. In other words, the lower levels of schooling of immigrants explain more than half of the wage differential. If we further adjust for differences in returns to educa- tion between immigrants and natives, as in model 3, the data suggest that part of the reason why immigrants earn less is that they have significantly lower returns to education.h
Model 3 does not capture several important factors that affect earnings. It is not only returns to education that may differ between immigrants and natives. It is quite likely that age affects earnings differently between the two groups. Also, the number of years in the United States and year of arrival, or arrival cohort, is likely to affect wages. Models 4-6 replicate
6 . In fact, as an artifact of the specification, the gap is turned into an earnings advantage for immigrants with relatively low schooling levels. For example, in the 1990 sample, immi- grants with seven or fewer years of education are predicted to earn more than natives with similar traits. But the vast majority of immigrants have higher levels of education than this; for these immigrants, model 3 indicates that virtually all of the earnings gap with natives can be explained by lower levels of education and lower returns to education among immigrants.
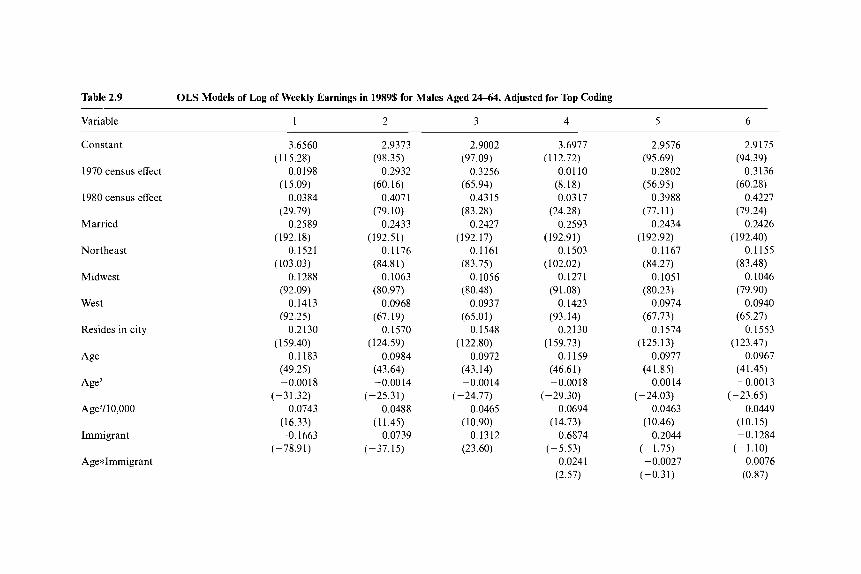
Table 2.9 OLS Models of Log of Weekly Earnings in 1989% for Males Aged 2464, Adjusted for Top Coding
Variable 1 2 3 4 5 6
Constant
1970 census effect
1980 census effect
Married
Northeast
Midwest
West
Resides in city
Age
Age2
Age3/10,000
Immigrant
Age*Immigrant
3.6560 (115.28)
0.0198 (15.09)
0.0384 (29.79)
0.2589 (192.18)
0.1521 (103.03)
0.1288 (92.09)
0.1413 (92.25)
0.2130 (1 59.40)
0.1183 (49.25) -0.0018
(-3 1.32) 0.0743
-0.1663 (16.33)
(-78.91)
2.9373
0.2932
0.4071
0.2433
0.1176
0.1063
0.0968
0.1570
0.0984
(98.3 5)
(60.16)
(79.10)
(192.51)
(84.81)
(80.97)
(67.19)
(124.59)
(43.64) - 0.00 14
0.0488 (-25.31)
(1 1.45) -0.0739
(-37.15)
2.9002
0.3256
0.431 5
0.2427
0.1161
0.1056
0.0937
0.1548
0.0972
(97.09)
(65.94)
(83.28)
(1 92.17)
(83.75)
(80.48)
(65.01)
(122.80)
(43.14) -0.0014
0.0465
0.1312
(- 24.77)
(10.90)
(23.60)
3.6977
0.0110 (8.18) 0.0317
(24.28) 0.2593
(192.91) 0.1503
(102.02) 0.1271
(9 1.08) 0.1423
(93.14) 0.2130
(159.73) 0.1159
(46.61) -0.0018
0.0694 (14.73) -0.6874
(-5.53) 0.0241
(2.57)
(1 12.72)
(-29.30)
2.9576 (95.69)
0.2802 (56.95)
0.3988 (77.1 1 )
0.2434 (192.92)
0.1167 (84.27)
0.1051 (80.23)
0.0974 (67.73)
0. I574 (125.13)
0.0977 (41.85) -0.0014
(-24.03) 0.0463
(10.46) -0.2044
(-1.75)
(-0.31) -0.0027
2.9175
0.3136
0.4227
0.2426
0.1155
0.1046
0.0940
0.1553
0.0967
-0.00 13
0.0449
-0.1284
(94.39)
(60.28)
(79.24)
(1 92.40)
(83.48)
(79.90)
(65.27)
(123.47)
(41.45)
(-23.65)
(10.15)
(-1.10) 0.0076
(0.87)
Age2*Immigrant
Age3*Immigrant/10,000
Years since immigration
(Years since immigration)*
(Years since immigrati0n)~/10,000
Arrived 1980-84
Arrived 1975 79
Arrived 1970-74
Arrived 1965-69
Arrived 1960-64
Arrived 1950-59
Arrived before 1950
Years of education
Education*( 1970 census)
(continued)
-0.0007
0.0590 (3.34) 0.0112
(9.55) -0.00003
(-0.63)
(-2.18) 0.0340
(3.35) 0.1038
( 10.85) 0.1356
(1 2.59) 0.2125
(21.35) 0.2721
(24.32) 0.2844
(24.72) 0.2607
(1 8.3 3)
(-3.16)
-0.0138
0.0780 0.0822
-0.0131 -0.0157 (283.47) (279.51)
(-34.70) (-40.96)
-0.0002 (-0.74)
0.0233 (1.41) 0.0239
(21.83) -0.0006
(- 1 1.43) 0.0454
(7.63) 0.0334
(3.51) 0.0850
(9.47) 0.1057
(10.46) 0.1321
(14.13) 0.1605
(1 5.27) 0.1667
(15.41) 0.1383
(10.35) 0.0774
(280.28)
(-32.82) -0.0124
-0.0004 (- 1.79)
0.0368 (2.22) 0.021 3
(18.25) -0.0004
(-8.05) 0.0251
(4.00) 0.0336
0.0942 (9.07) 0.1138
(8.98) 0.141 1
(10.42) 0.1727
(10.79) 0.1754
(9.33) 0.1363
(5.34) 0.0815
(3.41)
(267.31)
(- 36.75) -0.0147
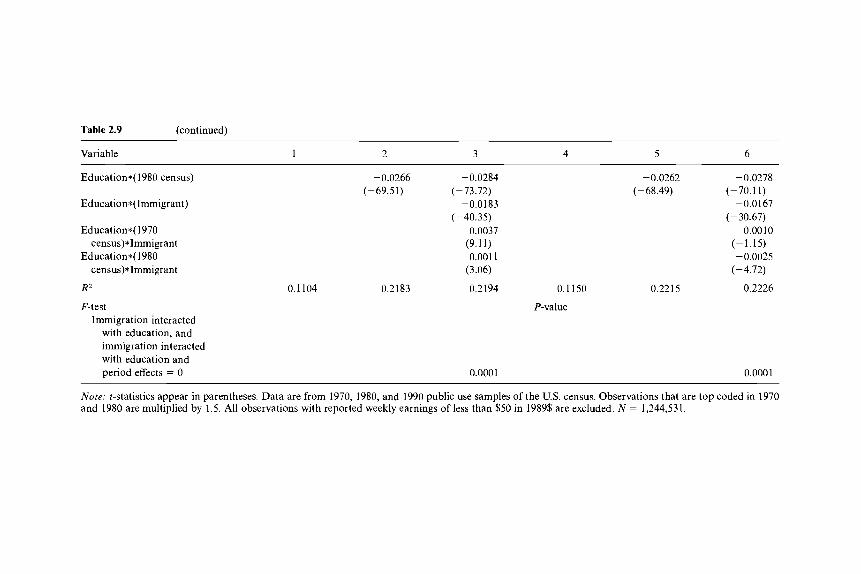
Table 2.9 (continued)
Variable 1 2 3 4 5 6
Education*(1980 census)
Education*(Immigrant)
Education*( 1970
Education*( 1980
R2
F-test
census)*Immigrant
census)*Immigrant
Immigration interacted with education, and immigration interacted with education and period effects = 0
0.1104
-0.0266 -0.0284 (- 69.5 1) (- 73.72)
-0.0183 (-40.35)
0.0037 (9.1 1) 0.001 I
(3.06)
0.2183 0.2194 0.1150
-0.0262 -0.0278 (-68.49) (-70.11)
(- 30.67)
(- 1.15)
(-4.72)
-0.0167
-0.0010
-0.0025
0.2226 0.2215
P-value
0.0001 0.0001
Note: t-statistics appear in parentheses. Data are from 1970, 1980, and 1990 public use samples of the U.S. census. Observations that are top coded in 1970 and 1980 are multiplied by 1.5. All observations with reported weekly earnings of less than $50 in 1989$ are excluded. N = 1,244,531.
The Educational Attainment of Immigrants 81
0 05
0
-0 05
- 0 1
p -015 d :: -02
% 4 -025
-0 3
-0 35
-0 4
-0 45
Age
-2 Years Since Mig No Educ
. - -X . . 2 Years Since Mig Educ
--I%- 10 Years Since Mig No Educ
- - 0 - . 10 Years Since Mig Educ . . !3 - 15 Years Since Mig Educ
-+- 15 Years Since Mig No Educ
Fig. 2.10 Predicted log wage gap by immigrant’s age, without controls for education (solid fines) and with controls (dashed fines)
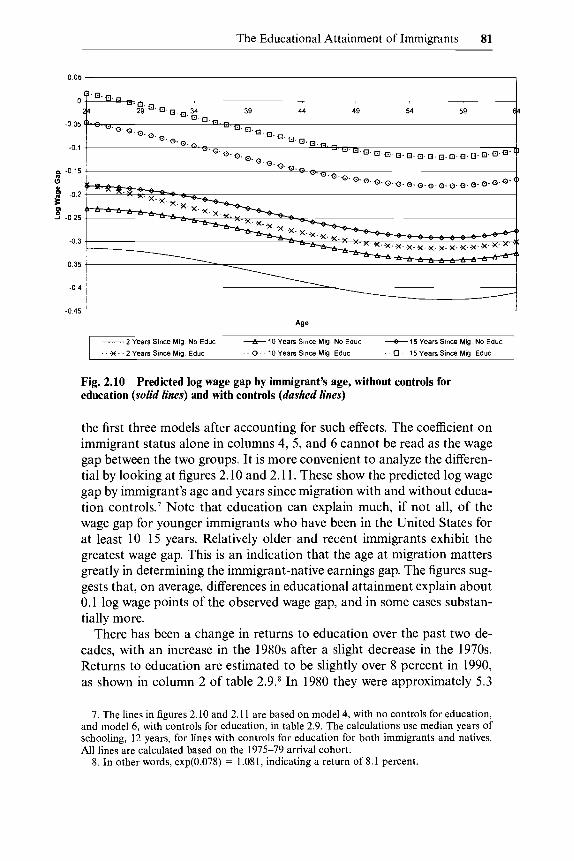
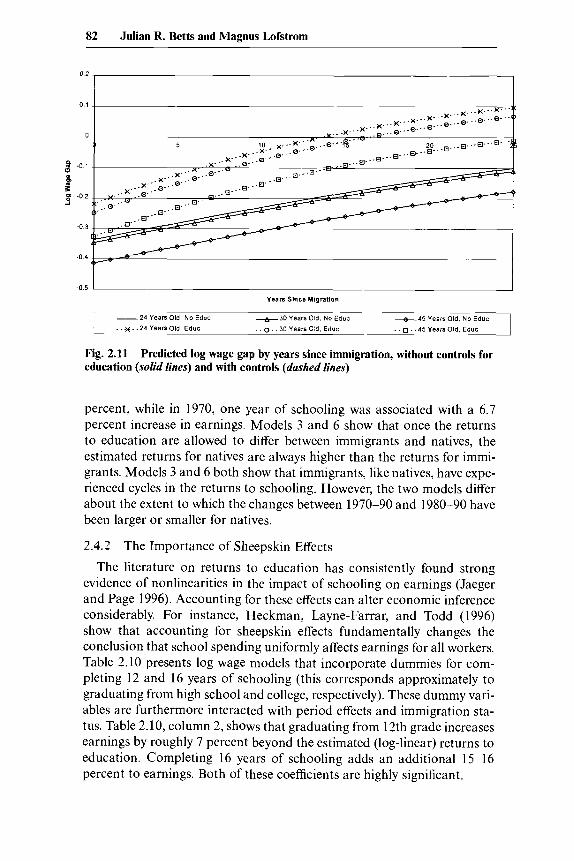
the first three models after accounting for such effects. The coefficient on immigrant status alone in columns 4, 5, and 6 cannot be read as the wage gap between the two groups. It is more convenient to analyze the differen- tial by looking at figures 2.10 and 2.1 1. These show the predicted log wage gap by immigrant’s age and years since migration with and without educa- tion controls.’ Note that education can explain much, if not all, of the wage gap for younger immigrants who have been in the United States for at least 10-15 years. Relatively older and recent immigrants exhibit the greatest wage gap. This is an indication that the age at migration matters greatly in determining the immigrant-native earnings gap. The figures sug- gests that, on average, differences in educational attainment explain about 0.1 log wage points of the observed wage gap, and in some cases substan- tially more.
There has been a change in returns to education over the past two de- cades, with an increase in the 1980s after a slight decrease in the 1970s. Returns to education are estimated to be slightly over 8 percent in 1990, as shown in column 2 of table 2.9.* In 1980 they were approximately 5.3
7. The lines in figures 2.10 and 2.1 1 are based on model 4, with no controls for education, and model 6 , with controls for education, in table 2.9. The calculations use median years of schooling, 12 years, for lines with controls for education for both immigrants and natives. All lines are calculated based on the 1975-79 arrival cohort.
8. In other words, exp(0.078) = 1.081, indicating a return of 8.1 percent.
82 Julian R. Betts and Magnus Lofstrom
0.2
0 1
0
$ -01
z g -02
.0.3
-0 4
-0.5 I Years Since Migration
-24 Years Old. No Educ
. . . x . . 24 Years Old, Educ
-30 Years Old, No Educ
. .o.. 30 Years Old, Educ
-45 Years Old, No Educ
. .o.. 45 Years Old, Educ
Fig. 2.11 education (solid lines) and with controls (dashed lines)
Predicted log wage gap by years since immigration, without controls for
percent, while in 1970, one year of schooling was associated with a 6.7 percent increase in earnings. Models 3 and 6 show that once the returns to education are allowed to differ between immigrants and natives, the estimated returns for natives are always higher than the returns for immi- grants. Models 3 and 6 both show that immigrants, like natives, have expe- rienced cycles in the returns to schooling. However, the two models differ about the extent to which the changes between 1970-90 and 1980-90 have been larger or smaller for natives.
2.4.2
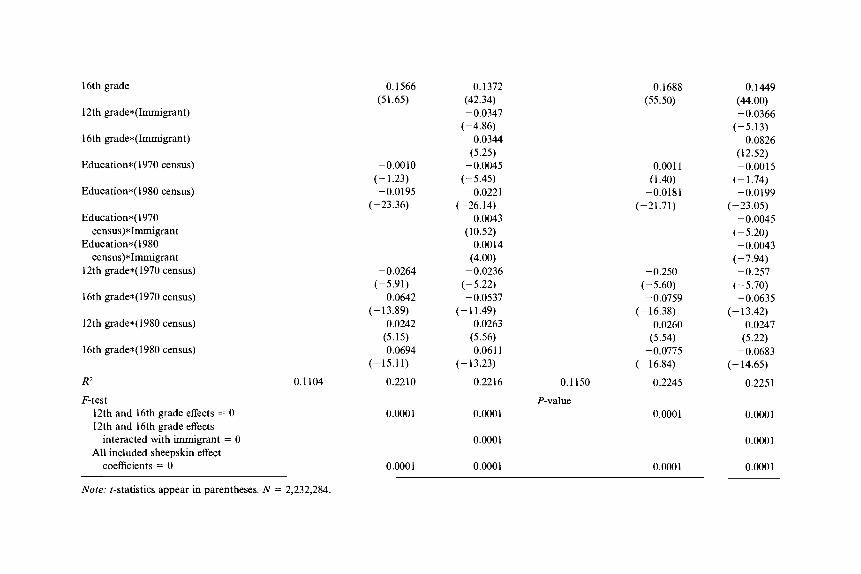
The literature on returns to education has consistently found strong evidence of nonlinearities in the impact of schooling on earnings (Jaeger and Page 1996). Accounting for these effects can alter economic inference considerably. For instance, Heckman, Layne-Farrar, and Todd (1996) show that accounting for sheepskin effects fundamentally changes the conclusion that school spending uniformly affects earnings for all workers. Table 2.10 presents log wage models that incorporate dummies for com- pleting 12 and 16 years of schooling (this corresponds approximately to graduating from high school and college, respectively). These dummy vari- ables are furthermore interacted with period effects and immigration sta- tus. Table 2.10, column 2, shows that graduating from 12th grade increases earnings by roughly 7 percent beyond the estimated (log-linear) returns to education. Completing 16 years of schooling adds an additional 15-16 percent to earnings. Both of these coefficients are highly significant.
The Importance of Sheepskin Effects
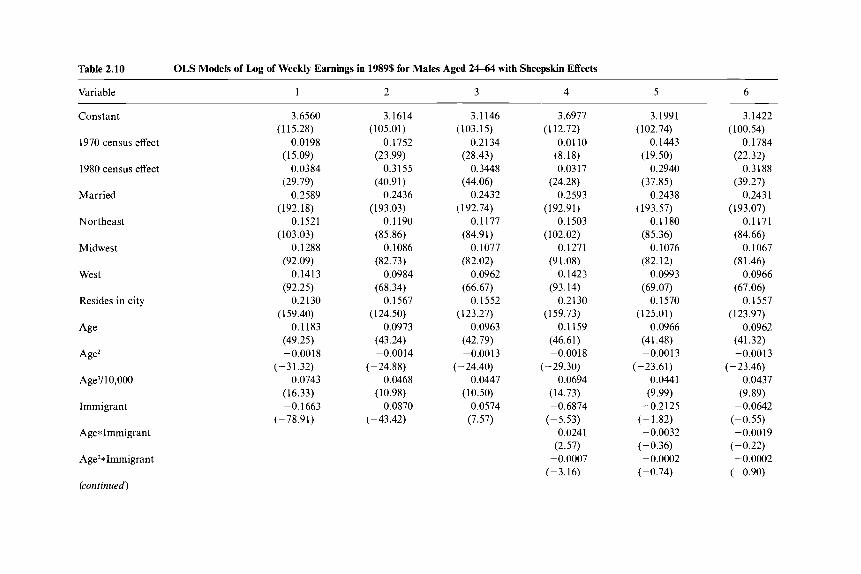
Table 2.10 OLS Models of Log of Weekly Earnings in 198% for Males Aged 2464 with Sheepskin Effects
Variable 1 2 3 4 5 6
Constant
1970 census effect
1980 census effect
Married
Northeast
Midwest
West
Resides in city
Age
Age2
Age3/l 0,000
Immigrant
Age*Immigrant
Age'*Immigrant
(continued)
3.6560 (1 15.28)
0.0198 (15.09)
0.0384 (29.79)
0.2589 (1 92.18)
0.1521 (1 03.03)
0.1288 (92.09)
0.1413 (92.25)
0.2130 (1 59.40)
0.1183 (49.25) -0.0018
(-3 I .32) 0.0743
(16.33) -0.1663
(-78.91)
3.1614
0.1752
0.3155
0.2436
0.1 190
0.1086
0.0984
0.1567
0.0973
(105.01)
(23.99)
(40.91)
(193.03)
(85.86)
(82.73)
(68.34)
( 124.50)
(43.24) -0.0014
(-24.88) 0.0468
-0.0870 (10.98)
(-43.42)
3.1146
0.2134
0.3448
0.2432
0.1177
0.1077
0.0962
0.1552
0.0963
(1 03.1 5)
(28.43)
(44.06)
(192.74)
(84.91)
(82.02)
(66.67)
(123.27)
(42.79) -0.0013
0.0447
0.0574
(- 24.40)
(10.50)
(7.57)
3.6977
0.01 10 (8.18) 0.0317
(24.28) 0.2593
(192.91) 0.1 SO3
0.1271 (91.08)
0.1423 (93.14)
0.2130 (159.73)
0.1159 (46.61) - 0.00 1 8
0.0694
- 0.6874
0.0241 (2.57)
-0.0007
(1 12.72)
(102.02)
(-29.30)
(14.73)
(-5.53)
(-3.16)
3.1991
0.1443
0.2940
0.2438
0.1180
0.1076
0.0993
0.1570
0.0966
( 102.74)
(19.50)
(37.85)
(193.57)
(85.36)
(82.12)
(69.07)
(125.01)
(41.48) -0.0013
(-23.61) 0.0441
(9.99) -0.2125
(- 1.82) -0.0032
(-0.36) -0.0002
(- 0.74)
3.1422
0.1784
0.3188
0.2431
0.1171
0.1067
0.0966
0.1557
0.0962
-0.0013
(1 00.54)
(22.32)
(39.27)
( 1 93.07)
(84.66)
(81.46)
(67.06)
(123.97)
(41.32)
(- 23.46) 0.0437
(9.89) -0.0642
(- 0.55) - 0.00 19
(-0.22) -0.0002
(-0.90)
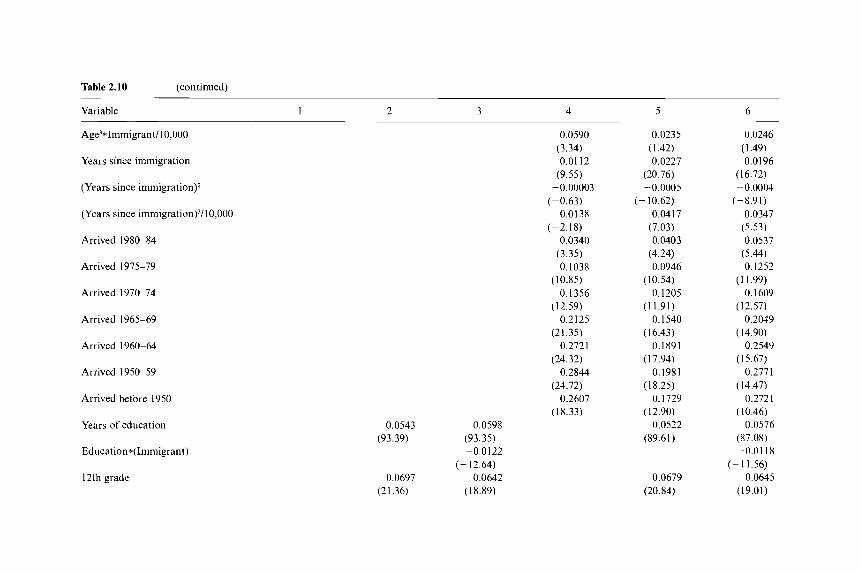
Table 2.10 (continued)
Variable 1 2 3 4 5 6
Age’*Immigrant/lO,OOO
Years since immigration
(Years since immigration)*
(Years since immigration)~/10,000
Arrived 1980-84
Arrived 1975-79
Arrived 1970-74
Arrived 1965-69
Arrived 1960-64
Arrived 1950-59
Arrived before 1950
Years of education
Education*(Immigrant)
12th grade
0.0590 (3.34) 0.01 12
(9.55) -0.00003
(-0.63)
(-2.18) 0.0340
(3.35) 0.1038
0.1356
0.2125
0.2721
0.2844
0.2607
-0.0138
(10.85)
(12.59)
(21.35)
(24.32)
(24.72)
(18.33) 0.0543 0.0598
-0.0 122
0.0697 0.0642
(93.39) (93.35)
(- 12.64)
(21.36) (18.89)
0.0235 (1.42) 0.0227
(20.76) - 0.0005
(- 10.62) 0.0417
(7.03) 0.0403
(4.24) 0.0946
(10.54) 0.1205
(11.91) 0.1540
(16.43) 0.1891
(1 7.94) 0.1981
(18.25) 0.1729
(12.90) 0.0522
(89.61)
0.0679 (20.84)
0.0246 (1.49) 0.0196
(16.72) -0.0004
(-8.91) 0.0347
(5.53) 0.0537
(5.44) 0.1252
(1 1.99) 0.1609
(12.57) 0.2049
(14.90) 0.2549
(1 5.67) 0.2771
(14.47) 0.2721
(10.46) 0.0576
(87.08) -0.0118
(- 11.56) 0.0645
(19.01)
16th grade
12th grade*(Immigrant)
16th grade*(Immigrant)
Education*( I970 census)
Education*(1980 census)
Education*( 1970 census)*lmmigrant
Education*( 1980 census)*Immigrant
12th grade*(1970 census)
16th grade*(1970 census)
12th grade*(1980 census)
16th grade*(1980 census)
R2
F-test 12th and 16th grade effects = 0 12th and 16th grade effects
All included sheepskin effect interacted with immigrant = 0
coefficients = 0
0.1104
0.1566 (51.65)
-0.0010
-0.0195 (- 1.23)
(-23.36)
-0.0264
-0.0642 ( - 1 3.89)
0.0242 (5.15)
-0.0694
(-5.91)
(- 15.1 1)
0.2210
0.0001
0.0001
0.1372 (42.34) -0.0347
(-4.86) 0.0344
(5.25) -0.0045
-0.0221
0.0043 (10.52)
0.0014 (4.00)
-0.0236
(- 5.45)
(-26.14)
(- 5.22)
(- 11.49) -0.0537
0.0263 (5.56)
-0.0611 (- 13.23)
0.2216
0.0001
0.0001
0.0001
0.1688 (55.50)
0.001 1 (1.40)
-0.0181 (-21.71)
-0.250 (-5.60) -0.0759
(- 16.38) 0.0260
(5.54) -0.0775
(-16.84)
0.1150 0.2245
P-value 0.0001
0.0001
0.1449
-0.0366 (-5.13)
0.0826 (12.52) -0.0015
(-1.74) - 0.0 199
(-23.05) -0.0045
-0.0043
(44.00)
(- 5.20)
(-7.94) -0.257
(-5.70) -0.0635
(- 13.42) 0.0247
-0.0683 (5.22)
(- 14.65)
0.2251
0.0001
0.0001
0.0001
Note: ?-statistics appear in parentheses. N = 2,232,284.
86 Julian R. Betts and Magnus Lofstrom
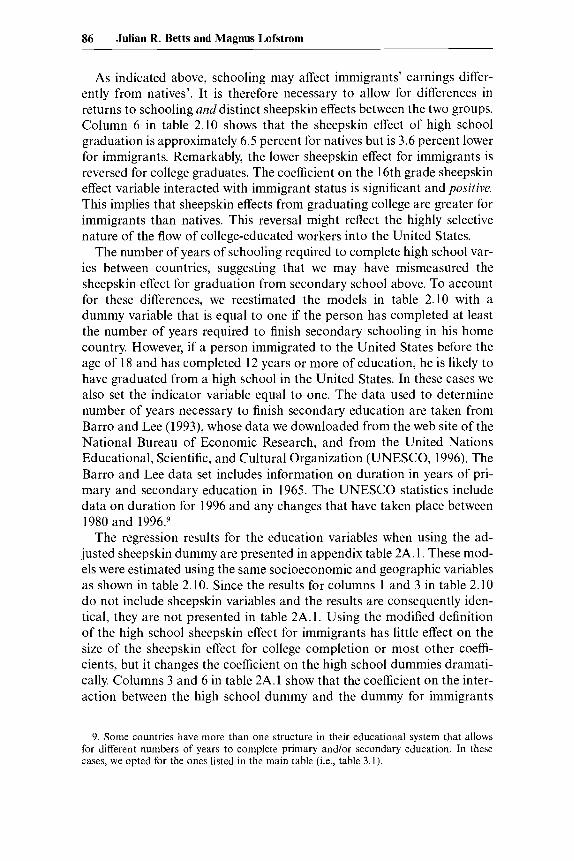
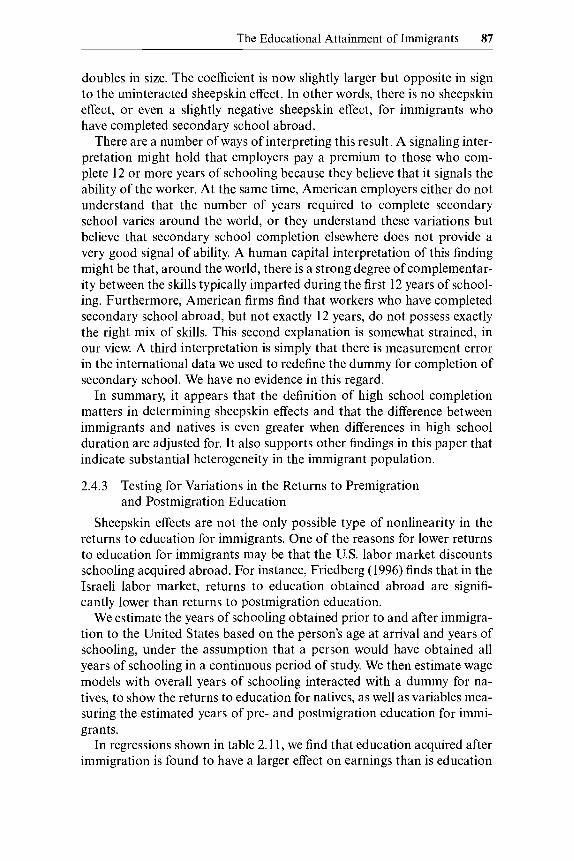
As indicated above, schooling may affect immigrants’ earnings differ- ently from natives’. It is therefore necessary to allow for differences in returns to schooling and distinct sheepskin effects between the two groups. Column 6 in table 2.10 shows that the sheepskin effect of high school graduation is approximately 6.5 percent for natives but is 3.6 percent lower for immigrants. Remarkably, the lower sheepskin effect for immigrants is reversed for college graduates. The coefficient on the 16th grade sheepskin effect variable interacted with immigrant status is significant and positive. This implies that sheepskin effects from graduating college are greater for immigrants than natives. This reversal might reflect the highly selective nature of the flow of college-educated workers into the United States.
The number of years of schooling required to complete high school var- ies between countries, suggesting that we may have mismeasured the sheepskin effect for graduation from secondary school above. To account for these differences, we reestimated the models in table 2.10 with a dummy variable that is equal to one if the person has completed at least the number of years required to finish secondary schooling in his home country. However, if a person immigrated to the United States before the age of 18 and has completed 12 years or more of education, he is likely to have graduated from a high school in the United States. In these cases we also set the indicator variable equal to one. The data used to determine number of years necessary to finish secondary education are taken from Barro and Lee (1993), whose data we downloaded from the web site of the National Bureau of Economic Research, and from the United Nations Educational, Scientific, and Cultural Organization (UNESCO, 1996). The Barro and Lee data set includes information on duration in years of pri- mary and secondary education in 1965. The UNESCO statistics include data on duration for 1996 and any changes that have taken place between 1980 and 1996.9
The regression results for the education variables when using the ad- justed sheepskin dummy are presented in appendix table 2A. 1. These mod- els were estimated using the same socioeconomic and geographic variables as shown in table 2.10. Since the results for columns 1 and 3 in table 2.10 do not include sheepskin variables and the results are consequently iden- tical, they are not presented in table 2A. 1. Using the modified definition of the high school sheepskin effect for immigrants has little effect on the size of the sheepskin effect for college completion or most other coeffi- cients, but it changes the coefficient on the high school dummies dramati- cally. Columns 3 and 6 in table 2A. 1 show that the coefficient on the inter- action between the high school dummy and the dummy for immigrants
9. Some countries have more than one structure in their educational system that allows for different numbers of years to complete primary and/or secondary education. In these cases, we opted for the ones listed in the main table (i.e., table 3.1).
The Educational Attainment of Immigrants 87
doubles in size. The coefficient is now slightly larger but opposite in sign to the uninteracted sheepskin effect. In other words, there is no sheepskin effect, or even a slightly negative sheepskin effect, for immigrants who have completed secondary school abroad.
There are a number of ways of interpreting this result. A signaling inter- pretation might hold that employers pay a premium to those who com- plete 12 or more years of schooling because they believe that it signals the ability of the worker. At the same time, American employers either do not understand that the number of years required to complete secondary school varies around the world, or they understand these variations but believe that secondary school completion elsewhere does not provide a very good signal of ability. A human capital interpretation of this finding might be that, around the world, there is a strong degree of complementar- ity between the skills typically imparted during the first 12 years of school- ing. Furthermore, American firms find that workers who have completed secondary school abroad, but not exactly 12 years, do not possess exactly the right mix of skills. This second explanation is somewhat strained, in our view. A third interpretation is simply that there is measurement error in the international data we used to redefine the dummy for completion of secondary school. We have no evidence in this regard.
In summary, it appears that the definition of high school completion matters in determining sheepskin effects and that the difference between immigrants and natives is even greater when differences in high school duration are adjusted for. It also supports other findings in this paper that indicate substantial heterogeneity in the immigrant population.
2.4.3 Testing for Variations in the Returns to Premigration and Postmigration Education
Sheepskin effects are not the only possible type of nonlinearity in the returns to education for immigrants. One of the reasons for lower returns to education for immigrants may be that the U.S. labor market discounts schooling acquired abroad. For instance, Friedberg (1996) finds that in the Israeli labor market, returns to education obtained abroad are signifi- cantly lower than returns to postmigration education.
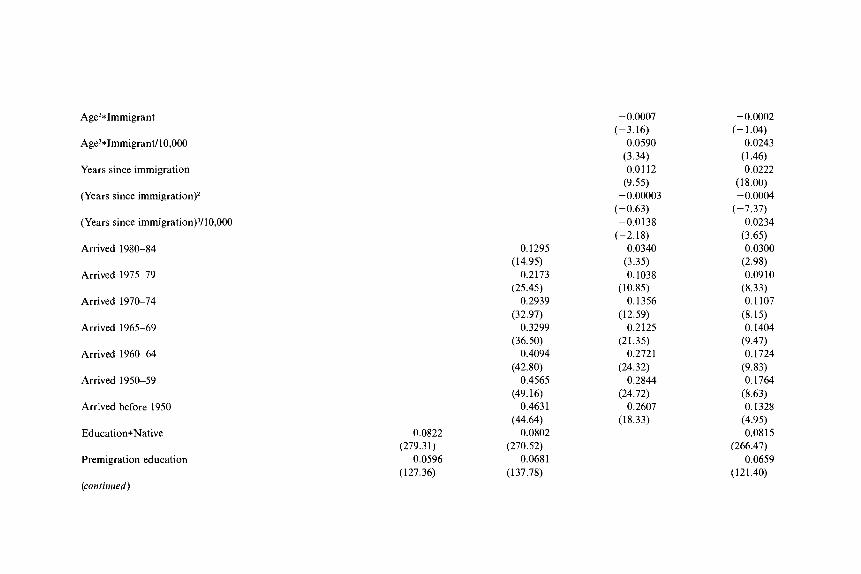
We estimate the years of schooling obtained prior to and after immigra- tion to the United States based on the person’s age at arrival and years of schooling, under the assumption that a person would have obtained all years of schooling in a continuous period of study. We then estimate wage models with overall years of schooling interacted with a dummy for na- tives, to show the returns to education for natives, as well as variables mea- suring the estimated years of pre- and postmigration education for immi- grants.
In regressions shown in table 2.1 1, we find that education acquired after immigration is found to have a larger effect on earnings than is education
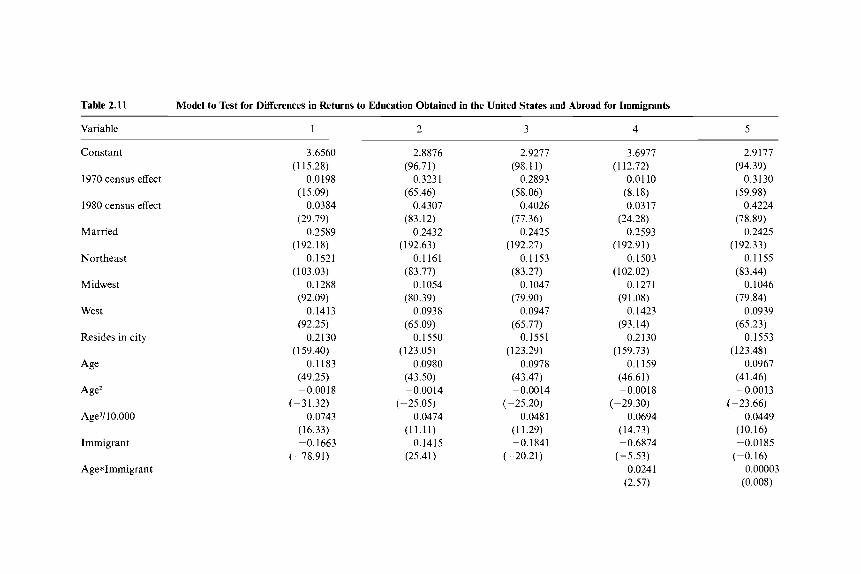
Table 2.11 Model to Test for Differences in Returns to Education Obtained in the United States and Abroad for Immigrants
Variable 1 2 3 4 5
Constant
1970 census effect
1980 census effect
Married
Northeast
Midwest
West
Resides in city
Age
Age2
Age'/ 10,000
Immigrant
Age*Immigrant
3.6560 (1 15.28)
0.0198 (15.09)
0.0384 (29.79)
0.2589 (192.18)
0.1521 (103.03)
0.1288 (92.09)
0.1413 (92.25)
0.2130 (1 59.40)
0.1183 (49.25) -0,0018
(-3 1.32) 0.0743
-0.1663 (16.33)
(-78.91)
2.8876
0.3231
0.4307
0.2432
0.1161
0.1054
0.0938
0.1550
0.0980
(96.71)
(65.46)
(83.12)
(192.63)
(83.77)
(80.39)
(65.09)
(123.05)
(43.50) -0.0014
0.0474
0.1415
(-25.05)
(1 1.1 1)
(25.41)
2.9277
0.2893
0.4026
0.2425
0.1153
0.1047
0.0947
0.1551
0.0978
(98.11)
(58.06)
(77.36)
(1 92.27)
(83.27)
(79.90)
(65.77)
(123.29)
(43.47) -0.0014
(-25.20)
( 1 1.29) -0.1841
0.0481
(-20.21)
3.6977 (112.72)
0.01 10 (8.18) 0.0317
(24.28) 0.2593
(192.91) 0.1503
0.1271
0.1423
0.2130
0.1159
(102.02)
(91.08)
(93.14)
(1 59.73)
(46.61) -0.0018
(- 29.30)
(14.73) -0.6874
0.0694
(-5.53) 0.0241
(2.57)
2.9177
0.3130 (59.98)
0.4224 (78.89)
0.2425 (192.33)
0.1155 (83.44)
0.1046 (79.84)
0.0939 (65.23)
0.1553 (123.48)
0.0967 (41.46) -0.0013
(- 23.66)
(10.16) -0.0185
(-0.16)
(94.39)
0.0449
0.00003 (0.008)
Age2*Immigrant
Age3*Immigrant/10,000
Years since immigration
(Years since immigrationy
(Years since immigrati0n)~/10,000
Arrived 1980-84
Arrived 1975-79
Arrived 1970-74
Arrived 1965-69
Arrived 1960-64
Arrived 1950-59
Arrived before 1950
Education*Native
Premigration education
(continued)
0.0822
0.0596 (279.31)
(127.36)
0.1295
0.2173
0.2939
0.3299
0.4094
0.4565
0.4631
0.0802
0.0681
(14.95)
(25.45)
(32.97)
(36.50)
(42.80)
(49.16)
(44.64)
(270.52)
(137.78)
-0.0007
0.0590 (3.34) 0.0112
(9.55) -0.00003
(- 3.16)
(-0.63) -0.0138
(-2.18) 0.0340
(3.35) 0.1038
0.1356
0.2125
0.2721
0.2844
0.2607
(10.85)
(12.59)
(21.35)
(24.32)
(24.72)
( 18.33)
-0.0002
0.0243 (1.46) 0.0222
-0.0004
(-1.04)
(18.00)
(-7.37) 0.0234
(3.65) 0.0300
(2.98) 0.0910
(8.33) 0.1107
(8.15) 0.1404
(9.47) 0.1724
(9.83) 0.1764
(8.63) 0.1328
0.0815
0.0659
(4.95)
(266.47)
(121.40)
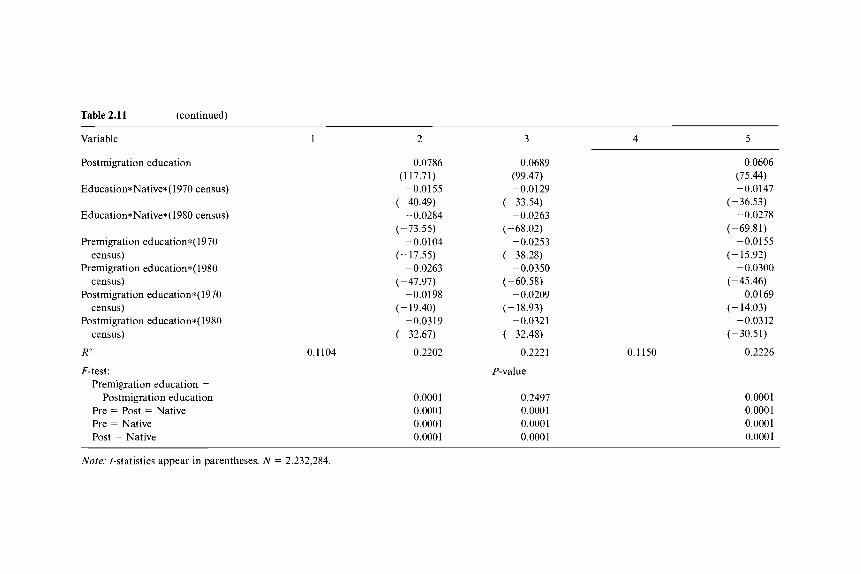
Table 2.11 (continued)
Variable 1 2 3 4 5
Postmigration education
Education*Native*( 1970 census)
Education*Native*( 1980 census)
Premigration education*( 1970
Premigration education*( 1980
Postmigration education*( 1970
Postmigration education*( 1980
census)
census)
census)
census)
R’
F-test: Premigration education =
Pre = Post = Native Pre = Native Post = Native
Postmigration education
0.0786 (1 17.71)
(-40.49) -0.0155
-0.0284 ( - 73.55)
(- 1 7.55)
(-47.97)
-0.0104
-0.0263
-0.0198
-0.03 19 (-19.40)
(-32.67)
0.1104 0.2202
0.0001 0.0001 0.0001 0.0001
0.0689 (99.47) -0.0129
(- 33.54)
(-68.02)
(-38.28)
(-60.58)
(- 18.93)
(-32.48)
-0.0263
-0.0253
-0.0350
-0.0209
-0.0321
0.2221
P-value
0.2497 0.0001 0.0001 0.0001
0.0606
-0.0147 (75.44)
(-36.53)
(-69.81) -0.0278
-0.0155 (-15.92)
-0.0300 (-45.46)
(- 14.03)
(- 30.5 1)
-0.0 169
-0.0312
0.1150 0.2226
0.0001 0.0001 0.0001 0.0001
Note: t-statistics appear in parentheses. N = 2,232,284
The Educational Attainment of Immigrants 91
obtained in the home country. The difference is close to 2 percent, as shown in table 2.10, column 2. It is also very interesting to note that the difference between returns to postmigration education and returns to na- tives' education is much smaller, one-third of a percent. The null hypothe- sis of equality in returns between pre- and postmigration education is re- jected as indicated by the very low p-values for theftests. If we control for cohort effects, as shown in column 3, the difference between the two coefficients becomes insignificant, indicating no difference in returns to pre- and postmigration education. Furthermore, if we allow for differences in the impact of age on earnings between immigrants and natives and control for cohorts and years since migration, as shown in model 5, it appears that education obtained before moving to the United States yields greater returns than postmigration education. It is unclear what causes this surprising result. It may partially be explained by differences in rates of return to premigration education due to differences in school quality in the source country. Bratsberg and Terrell (1997) find evidence of such an effect.
The results in table 2.11 are valid only to the extent that our method for allocating total years of schooling in years of postmigration and premigra- tion education is valid. To check this, we analyzed data from the 1976 Survey of Income and Education (SIE). This is the only sufficiently large data set including information on pre- and postmigration education for immigrants in the United States.lo In this survey, respondents were asked whether they attended school before coming to the United States, and if so, for how many years. Postmigration education is then simply calculated by subtracting premigration education from total years of education. We replicated the sampling procedure from the three censuses with the excep- tion that we included all natives and immigrants between the ages of 18 and 64 who earned at least $50 in 1989 dollars. The same models that are presented in table 2.11 were estimated using the SIE data and are shown in table 2.12. For obvious reasons, no period effects or interactions with period effects are included in these models.
The returns to education appear to be about 2-3.5 percent smaller in all models shown in table 2.12 for all three education categories, premigra- tion, postmigration, and native education, when we use the SIE data com- pared to when we use the census data. However, the SIE data are from the mid-1970s. A closer look at the coefficients for variables interacted with period effects in the regressions using census data indicate that the esti- mated differences are quite small.
Model 2 in table 2.12 shows that education acquired in the United States by immigrants yields statistically significantly greater returns than does premigration schooling, by about 0.8 percent. When cohort effects are
10. We thank George Borjas for suggesting that we use this data set.
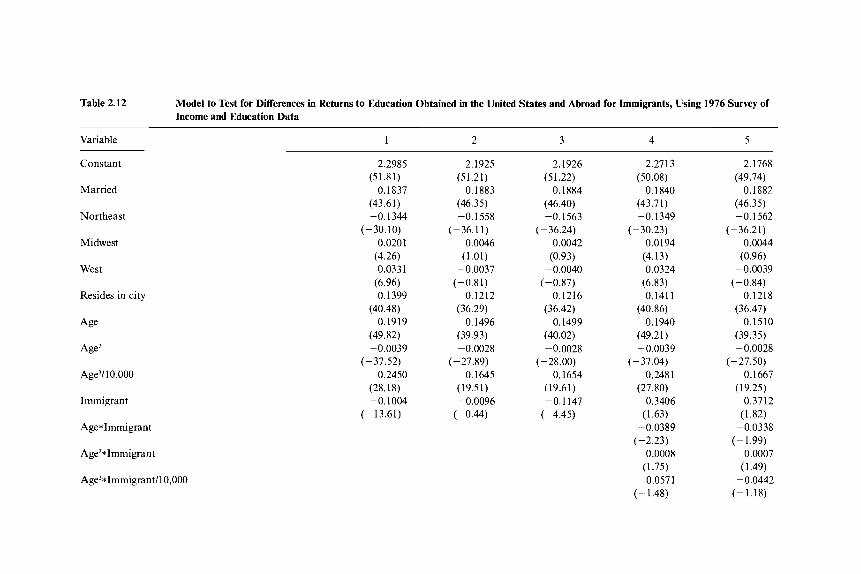
Table 2.12 Model to Test for Differences in Returns to Education Obtained in the United States and Abroad for Immigrants, Using 1976 Survey of Income and Education Data
Variable 1 2 3 4 5
Constant
Married
Northeast
Midwest
West
Resides in city
Age
AgeZ
Age3/l 0,000
Immigrant
Age*Immigrant
Age’*Immigrant
Age3*Immigrant/10,000
2.2985
0.1837 (51.81)
(43.61) -0.1344
(- 30.10) 0.0201
(4.26) 0.033 1
(6.96) 0.1399
(40.48) 0.1919
(49.82) -0.0039
(- 37.52) 0.2450
(28.18) - 0.1004
(-13.61)
2.1925
0.1883 (51.21)
(46.35) -0.1558
(-36.11) 0.0046
(1.01) -0.0037
0.1212
0.1496
(-0.81)
(36.29)
(39.93) -0.0028
(-27.89) 0.1645
(19.51) -0.0096
(-0.44)
2.1926
0.1884
-0.1563
(51.22)
(46.40)
(-36.24) 0.0042
(0.93) -0.0040
0.1216
0.1499
(-0.87)
(36.42)
(40.02) -0.0028
(-28.00) 0.1654
-0.1147 (19.61)
(-4.45)
2.2713
0.1840 (50.08)
(43.71) -0.1349
0.0194 (4.13) 0.0324
(6.83) 0.1411
(40.86) 0.1940
(49.21) -0.0039
(-37.04)
(- 30.23)
0.2481 (27.80)
0.3406 (1.63)
-0.0389
0.0008 (1.75)
-0.0571
(-2.23)
(-1.48)
2.1768
0.1882 (49.74)
(46.35) -0.1562
0.0044 (0.96)
-0.0039
0.1218
0.1510
-0.0028
0.1667 (19.25)
0.3712 (1.82)
-0.0338
0.0007 (1.49)
-0.0442
(-36.21)
(-0.84)
(36.47)
(39.35)
(-27.50)
(- 1.99)
(-1.18)
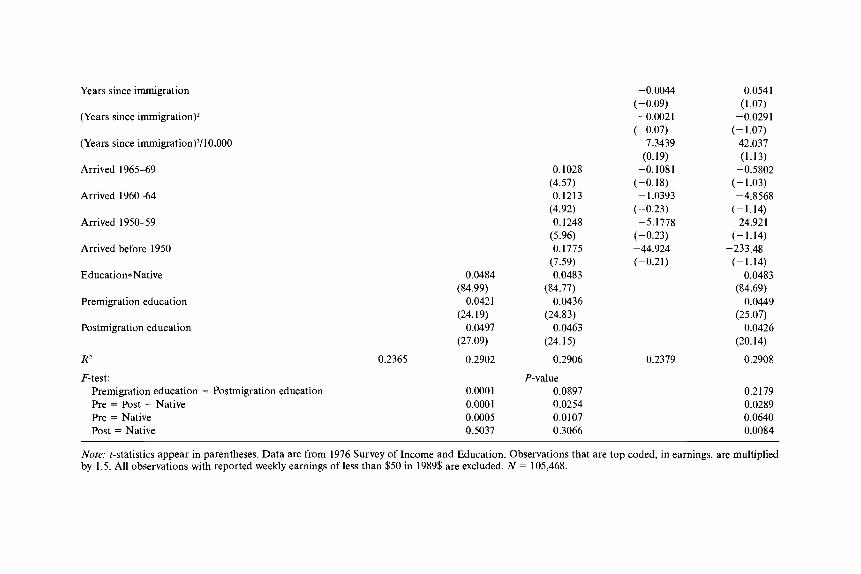
Years since immigration
(Years since immigration)2
(Years since immigration)’/10,000
Arrived 1965-69
Arrived 1960-64
Arrived 1950-59
Arrived before 1950
Education*Native
Premigration education
Postmigration education
R2
F-test: Premigration education = Postmigration education Pre = Post = Native Pre = Native Post = Native
0.2365
0.0484
0.0421
0.0497
(84.99)
(24.19)
(27.09)
0.2902
0.0001 0.0001 0.0005 0.5037
0.1028 (4.57) 0.1213
(4.92) 0.1248
(5.96) 0.1775
0.0483
0.0436
0.0463
(7.59)
(84.77)
(24.83)
(24.15)
0.2906
P-value 0.0897 0.0254 0.0107 0.3066
-0.0044
-0.0021
7.3439 (0.19)
-0.108 1
(-0.09)
(-0.07)
(-0.18) - 1.0393
(-0.23)
(-0.23) -44.924
-5.1778
(-0.21)
0.2379
0.0541 (1.07)
-0.0291 (-1.07)
42.037 (1.13)
(- 1.03)
(-1.14) -24.921 (-1.14)
(- 1.14)
-0.5802
-4.8568
- 233.48
0.0483
0.0449
0.0426
(84.69)
(25.07)
(20.14)
0.2908
0.2179 0.0289 0.0640 0.0084
Note: t-statistics appear in parentheses. Data are from 1976 Survey of Income and Education. Observations that are top coded, in earnings, are multiplied by 1.5. All observations with reported weekly earnings of less than $50 in 1989$ are excluded. N = 105,468.
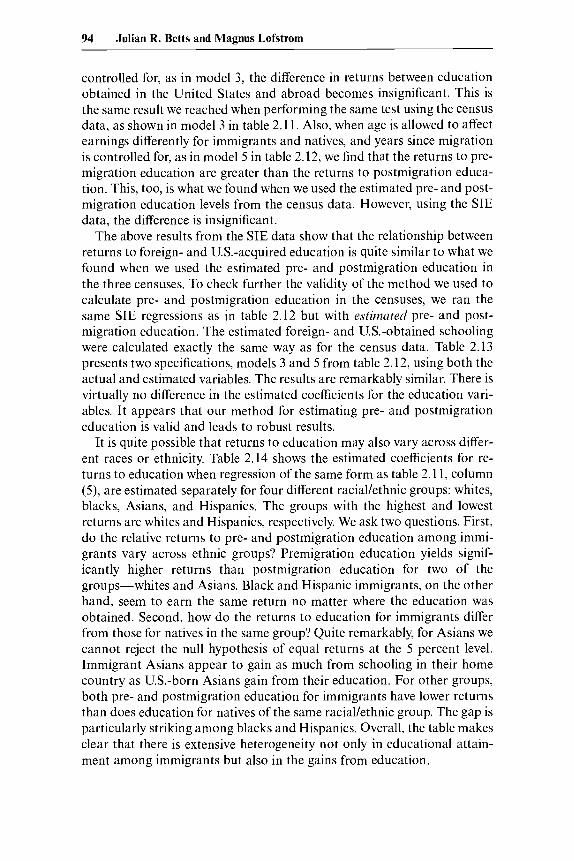
94 Julian R. Betts and Magnus Lofstrom
controlled for, as in model 3, the difference in returns between education obtained in the United States and abroad becomes insignificant. This is the same result we reached when performing the same test using the census data, as shown in model 3 in table 2.1 1 . Also, when age is allowed to affect earnings differently for immigrants and natives, and years since migration is controlled for, as in model 5 in table 2.12, we find that the returns to pre- migration education are greater than the returns to postmigration educa- tion. This, too, is what we found when we used the estimated pre- and post- migration education levels from the census data. However, using the SIE data, the difference is insignificant.
The above results from the SIE data show that the relationship between returns to foreign- and US.-acquired education is quite similar to what we found when we used the estimated pre- and postmigration education in the three censuses. To check further the validity of the method we used to calculate pre- and postmigration education in the censuses, we ran the same SIE regressions as in table 2.12 but with estimated pre- and post- migration education. The estimated foreign- and US.-obtained schooling were calculated exactly the same way as for the census data. Table 2.13 presents two specifications, models 3 and 5 from table 2.12, using both the actual and estimated variables. The results are remarkably similar. There is virtually no difference in the estimated coefficients for the education vari- ables. It appears that our method for estimating pre- and postmigration education is valid and leads to robust results.
It is quite possible that returns to education may also vary across differ- ent races or ethnicity. Table 2.14 shows the estimated coefficients for re- turns to education when regression of the same form as table 2.1 1, column (5 ) , are estimated separately for four different racial/ethnic groups: whites, blacks, Asians, and Hispanics. The groups with the highest and lowest returns are whites and Hispanics, respectively. We ask two questions. First, do the relative returns to pre- and postmigration education among immi- grants vary across ethnic groups? Premigration education yields signif- icantly higher returns than postmigration education for two of the groups-whites and Asians. Black and Hispanic immigrants, on the other hand, seem to earn the same return no matter where the education was obtained. Second, how do the returns to education for immigrants differ from those for natives in the same group? Quite remarkably, for Asians we cannot reject the null hypothesis of equal returns at the 5 percent level. Immigrant Asians appear to gain as much from schooling in their home country as U.S.-born Asians gain from their education. For other groups, both pre- and postmigration education for immigrants have lower returns than does education for natives of the same racial/ethnic group. The gap is particularly striking among blacks and Hispanics. Overall, the table makes clear that there is extensive heterogeneity not only in educational attain- ment among immigrants but also in the gains from education.
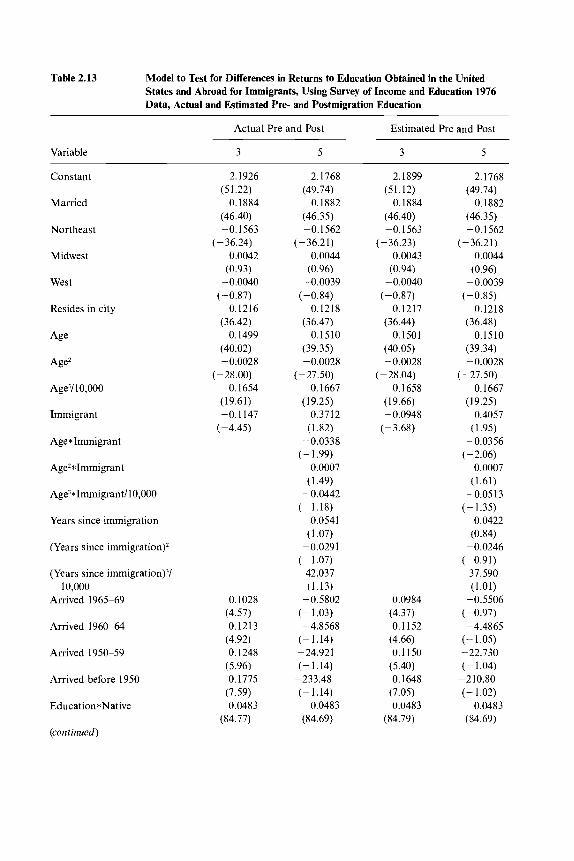
Table 2.13 Model to Test for Differences in Returns to Education Obtained in the United States and Abroad for Immigrants, Using Survey of Income and Education 1976 Data, Actual and Estimated Pre- and Postmigration Education
Variable
Actual Pre and Post
3 5 3 5
Estimated Pre and Post
Constant
Married
Northeast
Midwest
West
Resides in city
Age
Age2
Age3/10,000
Immigrant
Age*Immigrant
AgeZ*Immigran t
Age3*Immigrant/l 0,000
Years since immigration
(Years since immigration)2
(Years since immigration)’/
Arrived 1965-69
Arrived 1960-64
Arrived 1950-59
Arrived before 1950
Education*Native
(continued)
10,000
2.1926
0.1884 (5 1.22)
(46.40) -0.1563
(-36.24) 0.0042
(0.93) -0.0040
0.1216
0.1499
-0.0028
0.1654
-0.1 147
(-0.87)
(36.42)
(40.02)
(-28.00)
(19.61)
(-4.45)
0.1028
0.1213 (4.92) 0.1248
(5.96) 0.1775
0.0483
(4.57)
(7.59)
(84.77)
2.1768
0.1882 (49.74)
(46.35) -0.1562
(-36.21) 0.0044
(0.96) -0.0039
( -0.84) 0.1218
0.1510 (36.47)
(39.35)
(-27.50) -0.0028
0.1667 (19.25)
0.3712 (1.82)
-0.0338 (- 1.99)
0.0007 (1.49) - 0.0442
(- 1.18) 0.0541
(1.07) -0.0291
(- 1.07) 42.037 (1.13)
-0.5802 (- 1.03)
( - 1.14) -24.921 (- 1.14)
-233.48 (- 1.14)
(84.69)
-4.8568
0.0483
2.1899
0.1884
-0.1563 (- 36.23)
0.0043 (0.94)
-0.0040 (-0.87)
(36.44)
(40.05)
(51.12)
(46.40)
0.1217
0.1501
-0.0028 ( - 28.04)
0.1658 (19.66) -0.0948
(-3.68)
0.0984
0.1152 (4.66) 0.1150
(5.40) 0.1648
(7.05) 0.0483
(84.79)
(4.37)
2.1768
0.1882 (49.74)
(46.35) -0.1562
(- 36.21) 0.0044
(0.96) -0.0039
0.1218
0.1510
-0.0028
0.1667 (19.25)
0.4057 (1.95)
(-0.85)
(36.48)
(39.34)
(-27.50)
-0.0356 (-2.06)
0.0007 (1.61)
-0.0513 (-1.35)
0.0422 (0.84) - 0.0246
(-0.91) 37.590 (1.01)
-0.5506 (-0.97) -4.4865
( - I .05) -22.730 (- 1.04)
-2 10.80 (-1.02)
(84.69) 0.0483
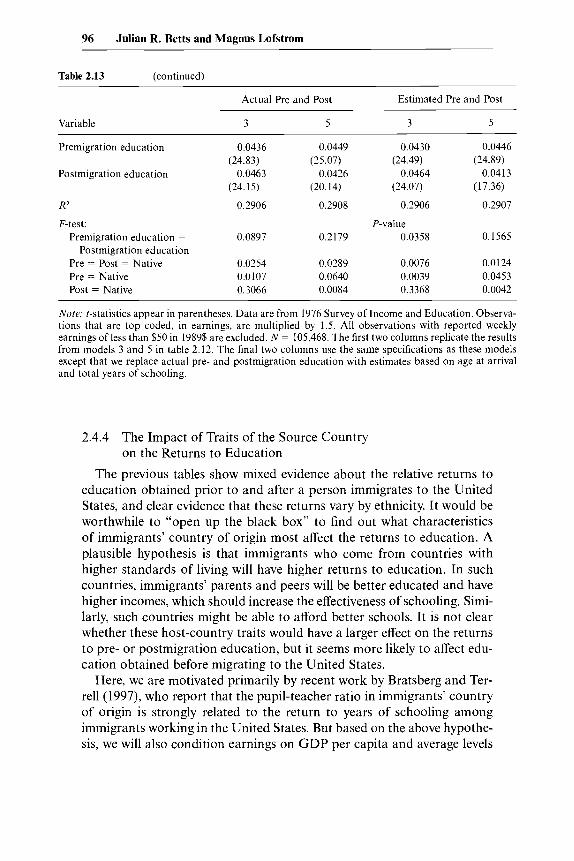
96 Julian R. Betts and Magnus Lofstrom
Table 2.13 (continued)
Variable
Actual Pre and Post
3 5 3 5
Estimated Pre and Post
~
Premigration education 0.0436 0.0449 0.0430 0.0446
Postmigration education 0.0463 0.0426 0.0464 0.0413
R2 0.2906 0.2908 0.2906 0.2907
F-test: P-value
(24.83) (25.07) (24.49) (24.89)
(24.15) (20.14) (24.07) (17.36)
Premigration education = 0.0897 0.2179 0.0358 0.1565
Pre = Post = Native 0.0254 0.0289 0.0076 0.0124 Pre = Native 0.0107 0.0640 0.0039 0.0453 Post = Native 0.3066 0.0084 0.3368 0.0042
Postmigration education
Note: t-statistics appear in parentheses. Data are from 1976 Survey of Income and Education. Observa- tions that are top coded, in earnings, are multiplied by 1.5. All observations with reported weekly earnings of less than $50 in 1989$ are excluded. N = 105,468. The first two columns replicate the results from models 3 and 5 in table 2.12. The final two columns use the same specifications as these models except that we replace actual pre- and postmigration education with estimates based on age at arrival and total years of schooling.
2.4.4 The Impact of Traits of the Source Country on the Returns to Education
The previous tables show mixed evidence about the relative returns to education obtained prior to and after a person immigrates to the United States, and clear evidence that these returns vary by ethnicity. It would be worthwhile to “open up the black box” to find out what characteristics of immigrants’ country of origin most affect the returns to education. A plausible hypothesis is that immigrants who come from countries with higher standards of living will have higher returns to education. In such countries, immigrants’ parents and peers will be better educated and have higher incomes, which should increase the effectiveness of schooling. Simi- larly, such countries might be able to afford better schools. It is not clear whether these host-country traits would have a larger effect on the returns to pre- or postmigration education, but it seems more likely to affect edu- cation obtained before migrating to the United States.
Here, we are motivated primarily by recent work by Bratsberg and Ter- re11 (1997), who report that the pupil-teacher ratio in immigrants’ country of origin is strongly related to the return to years of schooling among immigrants working in the United States. But based on the above hypothe- sis, we will also condition earnings on GDP per capita and average levels
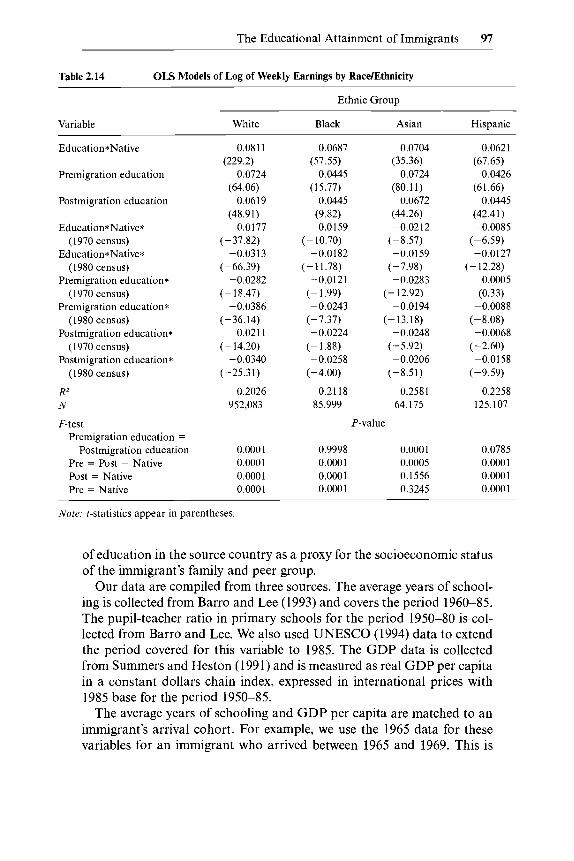
The Educational Attainment of Immigrants 97
Table 2.14 OLS Models of Log of Weekly Earnings by RacelEthnicity
Ethnic Group
Variable White
Education*Native
Premigration education
Postmigration education
Education*Native* (1970 census)
Education*Native* ( 1980 census)
Premigration education* (1970 census)
Premigration education* (1980 census)
Postmigration education* (1970 census)
Postmigration education* (1980 census)
R2 N
F-test Premigration education =
Postmigration education Pre = Post = Native Post = Native Pre = Native
0.081 1
0.0724
0.0619
-0.0177
(229.2)
(64.06)
(48.91)
(-37.82)
(-66.39)
(-18.47)
(-36.14)
(- 14.20)
(-25.31)
-0.0313
-0.0282
-0.0386
-0.021 1
-0.0340
0.2026 952,083
0.0001 0.0001 0.0001 0.0001
Black
0.0687 (57.55)
0.0445 (1 5.77)
0.0445 (9.82)
-0.0159 (-10.70)
(- 11.78)
(-1.99)
(- 7.37)
(-1.88)
(-4.00)
-0.0182
-0.0121
-0.0243
-0.0224
-0.0258
0.21 18 85,999
Asian
0.0704 (35.36)
0.0724 (80.11)
0.0672 (44.26) -0.0212
-0.0159 (-8.57)
(-7.98)
(-12.92)
(- 13.18)
(-5.92)
(-8.51)
- 0.0283
-0.0194
-0.0248
-0.0206
0.2581 64,175
Hispanic
0.0621
0.0426
0.0445
(67.65)
(61.66)
(42.41) -0.0085
(- 6.59)
(-12.28) -0.0127
0.0005 (0.33)
-0,0088 (- 8.08) -0.0068
(-2.60)
(-9.59) -0.0158
0.2258 125,107
P-value
0.9998 0.0001 0.0785 0.0001 0.0005 0.0001 0.0001 0.1556 0.0001 0.0001 0.3245 0.0001
Nore: t-statistics appear in parentheses.
of education in the source country as a proxy for the socioeconomic status of the immigrant’s family and peer group.
Our data are compiled from three sources. The average years of school- ing is collected from Barro and Lee (1993) and covers the period 1960-85. The pupil-teacher ratio in primary schools for the period 1950-80 is col- lected from Barro and Lee. We also used UNESCO (1994) data to extend the period covered for this variable to 1985. The GDP data is collected from Summers and Heston (1991) and is measured as real GDP per capita in a constant dollars chain index, expressed in international prices with 1985 base for the period 1950-85.
The average years of schooling and GDP per capita are matched to an immigrant’s arrival cohort. For example, we use the 1965 data for these variables for an immigrant who arrived between 1965 and 1969. This is
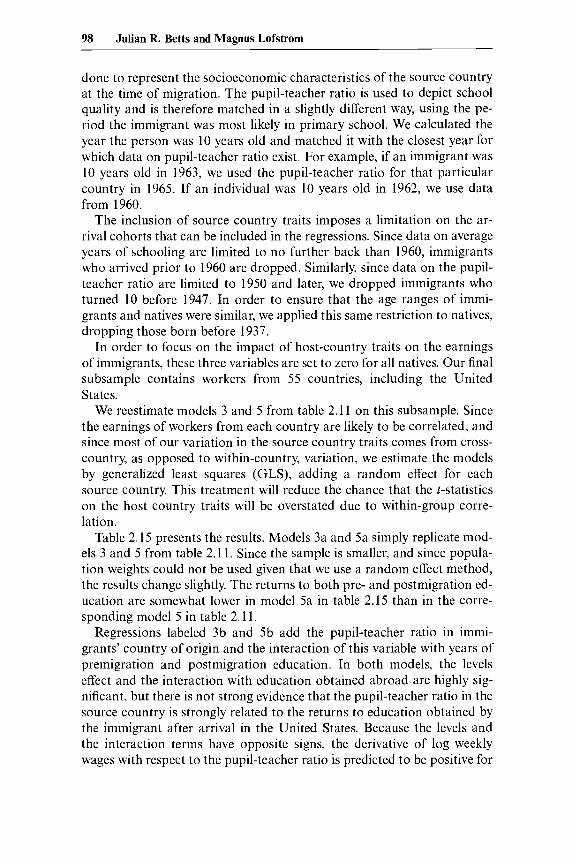
98 Julian R. Betts and Magnus Lofstrom
done to represent the socioeconomic characteristics of the source country at the time of migration. The pupil-teacher ratio is used to depict school quality and is therefore matched in a slightly different way, using the pe- riod the immigrant was most likely in primary school. We calculated the year the person was 10 years old and matched it with the closest year for which data on pupil-teacher ratio exist. For example, if an immigrant was 10 years old in 1963, we used the pupil-teacher ratio for that particular country in 1965. If an individual was 10 years old in 1962, we use data from 1960.
The inclusion of source country traits imposes a limitation on the ar- rival cohorts that can be included in the regressions. Since data on average years of schooling are limited to no further back than 1960, immigrants who arrived prior to 1960 are dropped. Similarly, since data on the pupil- teacher ratio are limited to 1950 and later, we dropped immigrants who turned 10 before 1947. In order to ensure that the age ranges of immi- grants and natives were similar, we applied this same restriction to natives, dropping those born before 1937.
In order to focus on the impact of host-country traits on the earnings of immigrants, these three variables are set to zero for all natives. Our final subsample contains workers from 55 countries, including the United States.
We reestimate models 3 and 5 from table 2.1 1 on this subsample. Since the earnings of workers from each country are likely to be correlated, and since most of our variation in the source country traits comes from cross- country, as opposed to within-country, variation, we estimate the models by generalized least squares (GLS), adding a random effect for each source country. This treatment will reduce the chance that the &statistics on the host country traits will be overstated due to within-group corre- lation.
Table 2.15 presents the results. Models 3a and 5a simply replicate mod- els 3 and 5 from table 2.11. Since the sample is smaller, and since popula- tion weights could not be used given that we use a random effect method, the results change slightly. The returns to both pre- and postmigration ed- ucation are somewhat lower in model 5a in table 2.15 than in the corre- sponding model 5 in table 2.11.
Regressions labeled 3b and 5b add the pupil-teacher ratio in immi- grants’ country of origin and the interaction of this variable with years of premigration and postmigration education. In both models, the levels effect and the interaction with education obtained abroad are highly sig- nificant, but there is not strong evidence that the pupil-teacher ratio in the source country is strongly related to the returns to education obtained by the immigrant after arrival in the United States. Because the levels and the interaction terms have opposite signs, the derivative of log weekly wages with respect to the pupil-teacher ratio is predicted to be positive for
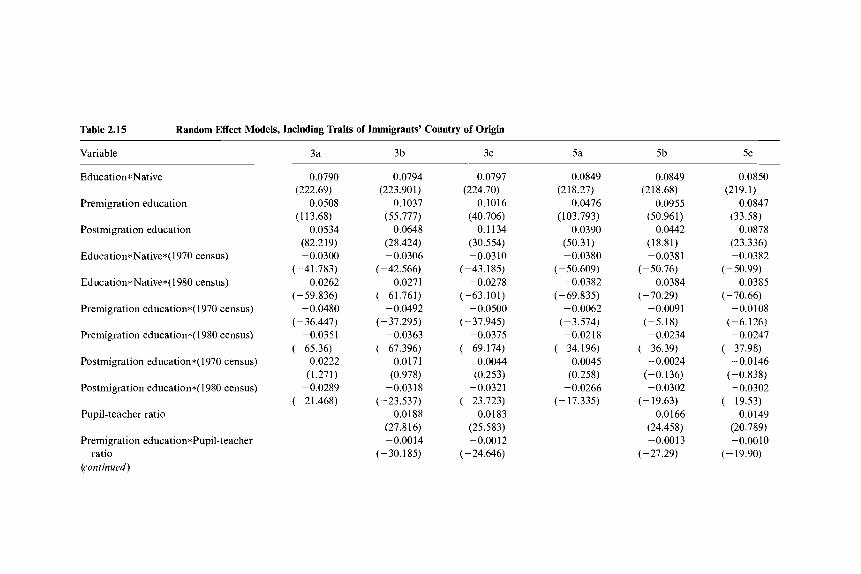
Table 2.15 Random Effect Models, Including Traits of Immigrants’ Country of Origin
Variable 3a 3b 3c 5a 5b 5c
Education*Native
Premigration education
Postmigration education
Education*Native*( 1970 census)
Education*Native*( 1980 census)
Premigration education*( 1970 census)
Premigration education*( 1980 census)
Postmigration education*( 1970 census)
Postmigration education*( 1980 census)
Pupil-teacher ratio
Premigration education*Pupil-teacher ratio
(continued)
0.0790
0.0508
0.0534 (82.219) -0.0300
(-41.783) -0.0262
(- 59.836) -0.0480
(-36.447) -0.0351
( - 65.36) 0.0222
(1.271) -0.0289
(-21.468)
(222.69)
(1 13.68)
0.0794 (223.901)
0.1037 (55.777)
0.0648 (28.424) -0.0306
(-42.566) -0.0271
(-61.761) -0.0492
(-37.295) -0.0363
(-67.396) 0.0171
(0.978) -0.0318
(-23.537) 0.0188
(27.8 16) -0.0014
(-30.185)
0.0797
0.1016 (40.706)
0.1134 (30.5 54) -0.0310
(-43.185) -0.0278
(-63.101) -0.0500
(-37.945) -0.0375
(- 69.174) 0.0044
(0.253) -0.0321
(-23.723)
(224.70)
0.0183 (25.583) -0.0012
(-24.646)
0.0849 (218.27)
0.0476 (103.793)
0.0390 (50.31) -0.0380
(-50.609) -0.0382
(-69.835) -0.0062
(- 3.574) -0.0218
(-34.196) 0.0045
(0.258) -0.0266
(-17.335)
0.0849
0.0955 (50.961)
0.0442 (18.81) -0.0381
(2 18.68)
(- 50.76)
(-70.29)
(-5.18)
(-36.39)
-0.0384
-0.0091
-0.0234
-0.0024 (-0.136) -0.0302
(-19.63) 0.0166
(24.458) -0.0013
( - 27.29)
0.0850
0.0847 (33.58)
0.0878 (23.336) -0.0382
(219.1)
(-50.99)
(- 70.66) -0.0385
-0.0108 (- 6.126) -0.0247
(- 37.98) -0.0146
(-0.838) -0.0302
0.0149 (20.789) -0.0010
(- 19.53)
(-19.90)
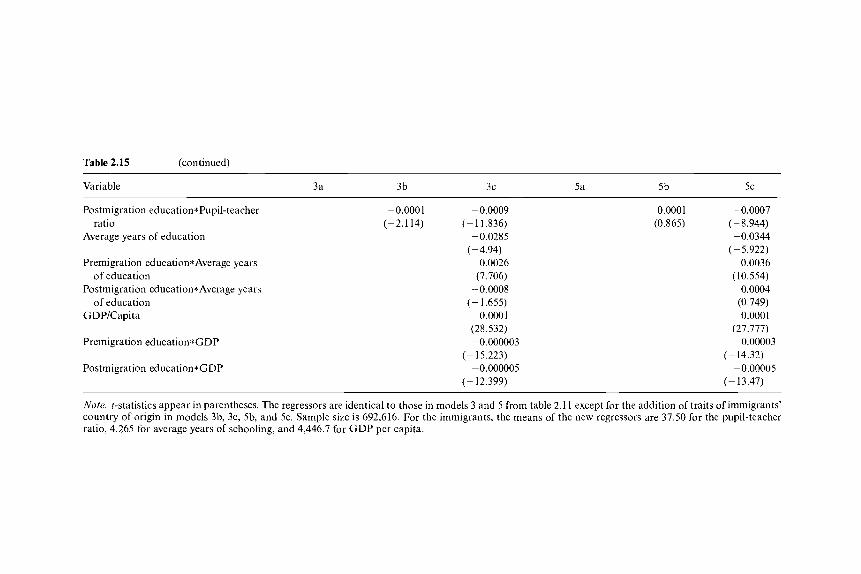
Table 2.15 (continued)
Variable 3a 3b 3c 5a 5b 5c
Postmigration education*Pupil-teacher
Average years of education
Premigration education*Average years
Postmigration education*Average years
GDP/Capita
Premigration education*GDP
ratio
of education
of education
Postmigration education*GDP
- 0.000 1 -0.0009 (- 2.1 14) (- 11.836)
-0.0285
0.0026 (7.706)
-0.0008 (-1.655)
0.0001 (28.532) -0.000003
(-4.94)
(-15.223)
(-12.399) -0.000005
0.0001 -0.0007 (0.865) (-8.944)
-0.0344 (-5.922)
0.0036 (10.554)
0.0004 (0.749) 0.0001
(27.777) -0.00003
(- 14.32) -0.00005
(- 13.47)
Note: t-statistics appear in parentheses. The regressors are identical to those in models 3 and 5 from table 2. I 1 except for the addition of traits of immigrants’ country of origin in models 3b, 3c, 5b, and 5c. Sample size is 692,616. For the immigrants, the means of the new regressors are 37.50 for the pupil-teacher ratio, 4.265 for average years of schooling, and 4,446.7 for GDP per capita.
The Educational Attainment of Immigrants 101
immigrants with less premigration education and negative for those with more premigration education. In model 3b, the derivative is negative for immigrants with 14 or more years of schooling obtained abroad, and in model 5b the crossover point is at 13 years of premigration education. That is, smaller class size benefits the earnings of only those immigrants who have obtained at least some college education before entering the United States. This represents a rather small fraction of immigrants in the sample, for whom mean years of pre- and postmigration education are 9.9 and 1.3 years, respectively. This result is highly similar to recent findings concerning the impact of the pupil-teacher ratio on the earnings of natives. Both Betts (1995) and Heckman, Layne-Farrar, and Todd (1996) find evi- dence that smaller pupil-teacher ratios are associated with higher earnings only for those with some college education.
In models 3c and 5c we add GDP per capita and average years of educa- tion in the immigrant’s country of origin, both on their own and interacted with years of schooling obtained abroad and in the United States. The addition of these regressors reduces both the levels of significance and the absolute size of the coefficients on the pupil-teacher ratio and its interac- tion with premigration education slightly. However, in both models, the pupil-teacher ratio now affects the returns to postmigration education sig- nificantly. Given the variation in results between models b and c, it is not clear whether the pupil-teacher ratio in the country of origin really does affect the impact of education obtained by the immigrant in the United States. But both specifications indicate that the pupil-teacher ratio has a larger marginal impact on the returns to premigration education than it does on postmigration education. We find this result quite intuitive.
The average years of educational attainment in the source country is highly significant: The coefficient on the level effect is negative, and the co- efficient on its interaction with premigration education is positive. Model 3c suggests that the net effect of higher average educational attainment in the host country on an immigrant’s wages becomes positive if the immi- grant’s own premigration education is 11 or more years. The correspond- ing crossover point in model 5c is 10 years of education.
GDP per capita in the source country also affects earnings of immi- grants significantly. Unlike the other two variables, this trait affects earn- ings positively for all immigrants, regardless of their level of education. The impact of GDP per capita on earnings in the United States appears to weaken somewhat as the immigrant obtains more education of either type.
Differences in returns to education obtained in the United States and abroad in the above models will partially depend on the three source coun- try traits we control for. This is the case since we interact these characteris- tics with pre- and postmigration education. We are particularly interested to see at what levels of the pupil-teacher ratio, a measure of school re- sources in the immigrant’s source country, U.S. education yields greater
102 Julian R. Betts and Magnus Lofstrom
returns than education acquired abroad. In other words, we want to solve for the point at which the partial derivative of the wage equation with respect to premigration education is equal to this partial derivative with respect to postmigration education. We performed the necessary calcula- tions using the returns to education observed in 1990. In model 3b, this happens at approximately the median pupil-teacher ratio of 30.1, among the countries included in the sample. For ratios above this, the returns to postmigration education are greater than for premigration education. The overtaking point in model 5b is slightly higher, at around 37 pupils per teacher. In the more complex models, 3c and 5c, where we also include variables for average years of education and GDP per capita in the source countries, it is also necessary to hold these variables constant to analyze differences in returns to education. In these models we hold average years of education and GDP per capita constant at the median values. The pupil-teacher ratio at which postmigration schooling yields a greater re- turn than premigration education occurs at approximately 30 students per teacher in model 3c. In model 5c, the crossover pointtakes place at a rela- tively high pupil-teacher ratio of 55. The higher crossover point in model 5c may be due to correlation between pupil-teacher ratio and GDP per capita and/or average years of schooling. The results from all these models indicate, quite intuitively, that returns to education acquired abroad are only greater for immigrants who come from countries with relatively high quality, in the sense of classroom size, of education.
The overall conclusion from this analysis is that the characteristics of the source country affect immigrants’ earnings substantially. Reductions in the pupil-teacher ratio and increases in the average level of educational attainment increase earnings of immigrants significantly, but only for the most highly educated workers. (For the pupil-teacher ratio, additional spending on schools increases earnings only for those immigrants with some college education. The effects become zero or opposite in sign for less well educated immigrants.) Both of these variables have a greater im- pact on the returns to premigration education than to postmigration edu- cation. GDP per capita affects earnings positively for all immigrants, al- though it is the least well educated immigrants for whom the effect is the largest.
2.5 Implications of the Rise in Immigration for the Educational Attainment of Natives: Further Tests of the Crowding Out Hypothesis
The previous section studies the impact of trends in immigrants’ educa- tional attainment on immigrants themselves. But it seems likely that the rising gap in educational attainment between immigrants and natives has
The Educational Attainment of Immigrants 103
also affected the lives of natives. Accordingly, we now examine educational outcomes of natives.
Many studies have examined whether immigration has affected the wages of natives. But immigration might also influence natives’ own ed- ucational attainment. The direction of such effects is theoretically un- certain. Immigrants are likely to increase both the costs and benefits of education to natives. The marginal cost of education for natives may rise due to competition between immigrant and American-born students for school resources. At the same time, the marginal benefit of education for natives may rise if the arrival of relatively unskilled immigrants increases the returns to education.
Two papers have addressed the question of whether immigrants crowd natives out of education. Betts (1998) models the probability of high school graduation among native blacks and Hispanics as a function of the proportion of immigrants in the local population. Using both state-level and metropolitan-level analyses, the paper finds evidence that inflows of immigrants significantly reduce the probability of high school graduation among these two minority groups. Hoxby (1998) tests whether immigrants crowd native-born blacks and Hispanics out of colleges. She, too, finds ev- idence in favor of the crowding out hypothesis.
In this section, we extend the work in these papers by using pooled 1970, 1980, and 1990 census data. The section extends the work of Betts (1998) and Hoxby (1998) by modeling total years of schooling obtained, rather than just the probability of graduating from high school or the probability of enrolling in college. It further extends earlier work by in- cluding 1970 data in addition to data from the 1980 and 1990 censuses. The section extends the earlier work by examining the impact of immigra- tion on the educational attainment of not only blacks and Hispanics but also Asians and whites. (Hoxby’s paper, unlike that of Betts, also examines the impact of immigration on natives who are disadvantaged, but it does not explicitly study crowding out for native Asians or whites.) We would expect immigration to have had a more adverse impact on the educational attainment of minorities than of whites, to the extent that immigrant schoolchildren attend the same inner city schools attended by many native minorities. Furthermore, given that white students’ test scores tend to be higher than scores of American-born minorities, it is possible that, within schools, white students are placed in classes that have relatively few immi- grant schoolchildren. For this reason, the presence of children with limited English proficiency (LEP) in schools should have a more adverse effect on the educational attainment of native minorities than on that of whites.
The key hypothesis that we test is that the years of schooling obtained by natives aged 24-30 is unrelated to the proportion of immigrants in the same age group. Betts (1998) examined the probability of high school
104 Julian R. Betts and Magnus Lofstrom
graduation among those aged 19-25. Since we are interested in the years of schooling obtained eventually by people, we opted for the older 24-30 age group, so as to capture gains in schooling resulting from college atten- dance." We use the person's current state of residence to attribute the ratio of immigrants to the total population in the age group. This will introduce measurement error if some people live in a different state at the time of the census than the state in which they obtained the bulk of their education. For this reason, we use the subsample of people who report living in the same state five years before the census. We will also report in footnotes the results when the full sample, including movers, was used in the regressions.
For this analysis, we use the full 5 percent samples for each minority group in 1980 and 1990, the full 1 percent sample available in 1970, and a 0.005 percent sample of whites in all years. However, in 1980, information on whether a person was living in the same state five years earlier was available for only one-half of respondents. We adjust our weights accord- ingly. Unlike the earlier regression analysis in the paper, but following Betts (1998) and Hoxby (1998), we include both men and women in the sample. The inclusion of women, among other things, helps to counteract the loss of observations due to the age restriction on our sample.
In order to control for the traits of the parents of the young people aged 24 30 in our sample, for each ethnidracial group we examine people in the same ethnidracial group in the same state who are aged 45-64 and who are not themselves immigrants. For this proxy group for parents, we calculate the average income per capita in 1990 prices and the proportion of people in the groups who are high school dropouts. We also control for the average pupil-teacher ratio in the state in which the person resides. For each age group, we take a simple average of the pupil-teacher ratio for each year in which group members were likely to have been in school. (For instance, for people aged 24-30 in the 1970 census, we take averages of the pupil-teacher ratios between the school years 1946-47 and 1963-64. These data are based on data published by the National Center for Educa- tion Statistics [various years] in the Digest of Education Statistics and the Biennial Survey of Education in the United States [Federal Security Agency, various years].)
We estimate a fixed-effect model that takes account of any unobserved variations in educational attainment of people living in different states:
49
EDUC,,, = CSTATElrry, + a,,CENSUS701,, + a,,CENSUS80,J, ,=I (1)
11, This choice of age group also makes our sample relatively independent of the sample of younger workers chosen by Betts (1998).
The Educational Attainment of Immigrants 105
where years of schooling for person i living in state s in time t is regressed on state dummies; dummies for census year; the proportion of immigrants in the state’s population, both calculated for the age group 24-30; and a vector y,, of personal traits: age and dummy variables for whether the person is female or lives in a city. Based on availability of data on the pupil- teacher ratio, we include all states but Alaska and Hawaii and we also in- clude the District of Columbia. In regressions that do not condition on the pupil-teacher ratio, we include observations from Alaska and Hawaii.
It is important to understand how the impact of immigrants on natives’ educational attainment is identified in this model. Regressors include fixed effects for each state and a dummy for two of the three census years. This sweeps out all variation between states and at the same time removes na- tional trends. The variation that remains is the variation within each state across years that is uncorrelated with the national trends. The advantage of this difference on difference model is that it does not simply test for a correlation across states in immigrants’ population shares and natives’ educational attainment at any one point in time. If immigrants have his- torically been attracted to certain states that happen to have natives with particularly high or low levels of educational attainment, and if there is an omitted variable that is driving both of these patterns, we would have obtained biased results. Instead, we use chunges in the immigrant share of the population for each state over time, and the part of this change that varies from national trends, to identify the effects of immigration. There of course remains the possibility that an omitted variable drives state-by- state changes in both immigration and natives’ educational attainment, but our approach removes all unobserved state-level effects that are fixed over time, as well as national trends.
Table 2.16 shows the main results. For each ethnichacia1 group, two specifications are estimated, with and without the proxies for parental ed- ucation, parental income, and the pupil-teacher ratio. In all cases the re- sults are consistent: A higher ratio of immigrants in the young population is associated with a significantly lower level of education among natives. The results are little changed when the trio of other variables-proxies for parental income, parental dropout rates, and pupil-teacher ratios-are added, in models 2, 4, and 6.”
Numerically, the effects are biggest among Hispanics and Asians, fol- lowed by b1a~ks.I~ As expected, the impact on whites is smaller than on American-born minorities. The effects are meaningful. Consider the re- sults based on the more fully specified models. An increase of 0.05 in the
12. The large drop in the number of observations in the more fully specified model for Asians reflects the fact that the pupil-teacher ratio was not available for Hawaii, where a substantial fraction of Asians in the sample lived.
13. Similarly, Betts (1998) finds that immigration has a larger effect on the educational attainment of native Hispanics than of native blacks.
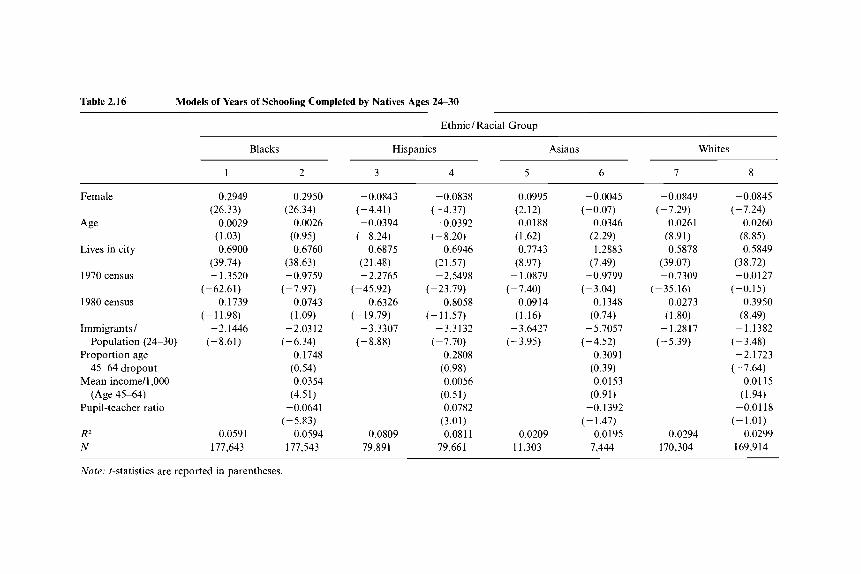
Table 2.16 Models of Years of Schooling Completed by Natives Ages 2630
Ethnic/Racial Group
Blacks Hispanics Asians Whites
I 2 3 4 5 6 7 8
Female
Age
Lives in city
1970census
1980census
Immigrants/ Population (24-30)
Proportion age 45-64 dropout
Mean income/1,000 (Age 45-64)
Pupil-teacher ratio
RZ N
0.2949 (26.33)
0.0029 (1.03) 0.6900
(39.74) - 1.3520
(-62.61)
(- 11.98)
(-8.61)
-0.1739
-2.1446
0.0591 177,643
0.2950 (26.34)
0.0026 (0.95) 0.6760
(38.63) -0.9759
(-7.97) 0.0743
(1.09) -2.0312
(-6.34) 0.1748
(0.54) 0.0354
(4.51) -0.0641
(-5.83)
177,543 0.0594
-0.0843 (-4.41)
(- 8.24) -0.0394
0.6875
-2.2765 (21.48)
(-45.92)
(-19.79)
(-8.88)
-0.6326
-3.3307
0.0809 79,891
-0.0838 (-4.37)
(-8.20) -0.0392
0.6946
-2.5498 (21.57)
(-23.79)
(-11.57)
( - 7.70)
-0.8058
-3.3132
0.2808 (0.98) 0.0056
(0.51) 0.0782
(3.01) 0.081 1
79,661
0.0995 (2.12) 0.0188
(1.62) 0.7743
(8.97) - 1.0879
(-7.40) 0.0914
(1.16)
(-3.95) -3.6427
0.0209 1 1,303
-0.0045
0.0346 (2.29) 1.2883
(7.49)
(-3.04)
(-0.07)
-0.9799
0.1348 (0.74)
-5.7057 (-4.52)
0.3091 (0.39) 0.0153
(0.91) -0.1392
(- 1.47) 0.0195
7,444
-0.0849
0.0261 (8.91) 0.5878
(39.07) -0.7309
(-7.29)
( - 35.1 6) 0.0273
(1.80)
(-5.39) -1.2817
0.0294 170,304
-0.0845 (-7.24)
0.0260 (8.85) 0.5849
(38.72) -0.0127
(-0.15) 0.3950
(8.49) -1.1382
( - 3.48)
(-7.64) -2.1723
0.0115 (1.94)
-0.0118 (- 1.01)
0.0299 169,914
Note: t-statistics are reported in parentheses
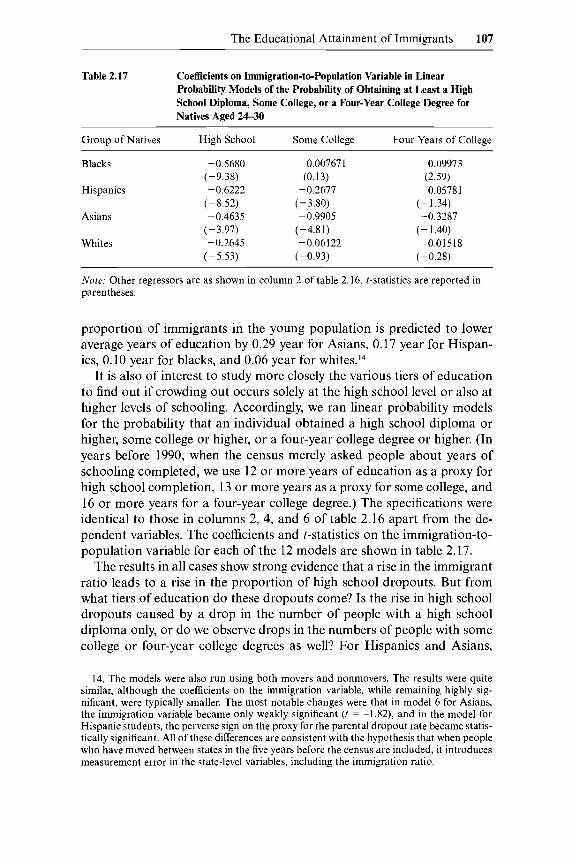
The Educational Attainment of Immigrants 107
Table 2.17 Coefficients on Immigration-to-Population Variable in Linear Probability Models of the Probability of Obtaining at Least a High School Diploma, Some College, or a Four-Year College Degree for Natives Aged 24-30
Group of Natives High School Some College Four Years of College
Blacks -0.5680 (-9.38)
(-8.52) Hispanics -0.6222
Asians -0.4635 (-3.97)
(-5.53) Whites -0.2645
0.007671 (0.13)
-0.2677 (-3.80)
(-4.81)
(-0.93)
-0.9905
-0.061 22
0.09973 (2.59)
-0.05781 (- 1.34)
(-1.40)
(-0.28)
-0.3287
-0.01518
~~
Note Other regressors are as shown in column 2 of table 2 16 t-statistics are reported in parentheses
proportion of immigrants in the young population is predicted to lower average years of education by 0.29 year for Asians, 0.17 year for Hispan- ics, 0.10 year for blacks, and 0.06 year for whites.I4
It is also of interest to study more closely the various tiers of education to find out if crowding out occurs solely at the high school level or also at higher levels of schooling. Accordingly, we ran linear probability models for the probability that an individual obtained a high school diploma or higher, some college or higher, or a four-year college degree or higher. (In years before 1990, when the census merely asked people about years of schooling completed, we use 12 or more years of education as a proxy for high school completion, 13 or more years as a proxy for some college, and 16 or more years for a four-year college degree.) The specifications were identical to those in columns 2, 4, and 6 of table 2.16 apart from the de- pendent variables. The coefficients and t-statistics on the immigration-to- population variable for each of the 12 models are shown in table 2.17.
The results in all cases show strong evidence that a rise in the immigrant ratio leads to a rise in the proportion of high school dropouts. But from what tiers of education do these dropouts come? Is the rise in high school dropouts caused by a drop in the number of people with a high school diploma only, or do we observe drops in the numbers of people with some college or four-year college degrees as well? For Hispanics and Asians,
14. The models were also run using both movers and nonmovers. The results were quite similar, although the coefficients on the immigration variable, while remaining highly sig- nificant, were typically smaller. The most notable changes were that in model 6 for Asians, the immigration variable became only weakly significant (t = -1.82), and in the model for Hispanic students, the perverse sign on the proxy for the parental dropout rate became statis- tically significant. All of these differences are consistent with the hypothesis that when people who have moved between states in the five years before the census are included, it introduces measurement error in the state-level variables, including the immigration ratio.
108 Julian R. Betts and Magnus Lofstrom
a rise in the immigrant ratio is associated with a drop in the proportion of students with some college or four-year college degrees. The association is significant for “some college” only, though. For blacks and whites the share of people with at least some college is insignificantly related to the immigrant ratio. This suggests that the main effect of a rise in immigration for whites and blacks is to discourage those who would have graduated from high school but not attended university from completing high school. These results are borne out by the results for the models of the probability of obtaining a four-year college degree, where there is no significant link to the immigrant ratio for whites. Among blacks, an even stronger result emerges, in which the fraction of young native blacks who obtain a college degree is significantly and positively related to the immigrant ratio.
Based on these data, the two groups for which there is evidence that immigration crowds natives out of college are Hispanics and Asians. How- ever, in both cases, the link is significant only when examining students at the sub-baccalaureate level.
Even though the evidence that immigrants crowd natives out of educa- tion is stronger at the secondary level than the postsecondary level, census data can shed no light on whether immigration causes natives who do attend postsecondary education to shift between universities. Hoxby (1998) finds evidence that at very selective and extremely selective colleges (with average SAT scores in the observed student population above 1100 and 1200, respectively), immigrants do tend to crowd out American-born minorities. Taken together with the above results based on census data, the implication is that a rise in immigration might not necessarily prevent native minorities from attending four-year colleges, but it may diminish the quality of colleges that they do attend. This finding is extremely rele- vant for policymakers, given findings by James et al. (1989) and Loury and Garman (1995) that the quality of university attended influences a student’s future wages positively.
2.6 Conclusion and Summary
In this paper we present a detailed picture of the educational attainment of immigrants in the United States utilizing data from the three most re- cent censuses 1970, 1980, and 1990. The paper presents trends in educa- tional attainment and its distribution among natives and immigrants. The
15. We also ran these models including people who had moved between states over the last five years. This might be the more appropriate sample for examining crowding out from colleges if many college attendees left home to go to university and still live in the same state at the time of the census. For the most part, the results were quite similar in this larger sample. The only substantive difference was that in the model for college completion among Hispanics, the coetficient and r-statistic changed to -0.091 and 2.53; respectively. Thus, His- panics are clearly the racial/ethnic group for which the evidence of crowding out across all levels of education is strongest.
The Educational Attainment of Immigrants 109
main findings are that immigrants’ level of education relative to natives has declined over the two decades studied, for both males and females. This fall is driven by a widening gap in educational attainment among the bottom half of the educational distribution. But the absolute level of education among immigrants rose slightly between 1970 and 1990. More- over, the top half of the immigrant population is at least as highly educated as the top half of natives. This analysis paints a far more complex picture of the nature of recent immigrants than is commonly given in the press.
We also model enrollment behavior of immigrants relative to natives. Immigrants are found to be more likely to be enrolled in both grades 1-12 and college. This also holds true after we control for socioeconomic char- acteristics, years since migration, and cohort effects. We infer that immi- grants’ educational attainment is likely to catch up at least partially to that of similarly aged natives as the immigrants spend more time in the United States.
The paper then analyzes the effects of these trends on immigrants and natives. For immigrants, we examine the wage gap with natives. We find that the lower levels of schooling of immigrants can explain more than half of the immigrant-native wage gap. We also allow for nonlinearities in returns to education. “Sheepskin,” or graduation, effects are highly sig- nificant. In particular, sheepskin effects for graduating from college are greater for immigrants than natives, but they are smaller for completion of secondary school. When we redefined the sheepskin effect for comple- tion of secondary school based on the actual number of years required in different foreign countries, we found that American employers pay no premium whatsoever to those who have completed secondary school abroad.
This paper also incorporates models allowing for differences in returns to foreign- and U.S.-acquired education. We find that natives’ returns to schooling are greater than immigrants’ returns to both pre- and postmi- gration education. In relatively simple models, we find that education ac- quired after immigrating to the United States brings a greater payoff to immigrants than does education acquired prior to immigrating. But the result is not robust and, in fact, is reversed once we allow age to affect earnings differently between immigrants and natives and control for years since migration and cohort effects. This result also holds when 1976 Sur- vey of Income and Education data are used. This is significant since the latter survey, unlike the census, explicitly asks respondents about the amount of education that they received before and after immigrating to the United States.
Comparisons of returns to pre- and postmigration education reveal differences among ethnic groups. Whites and Asians are found to earn a greater return to education obtained in their source country, while Hispan- ics display greater returns to US.-acquired education than to premigration
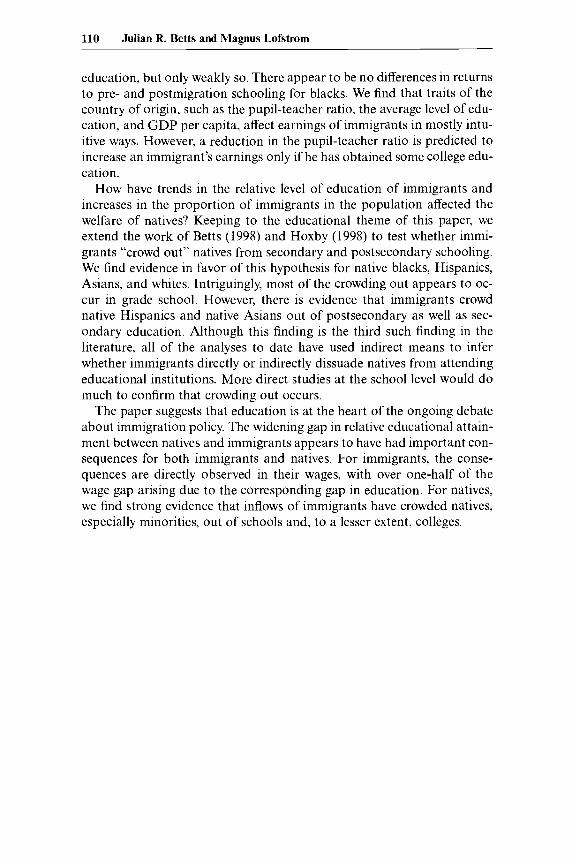
110 Julian R. Betts and Magnus Lofstrom
education, but only weakly so. There appear to be no differences in returns to pre- and postmigration schooling for blacks. We find that traits of the country of origin, such as the pupil-teacher ratio, the average level of edu- cation, and GDP per capita, affect earnings of immigrants in mostly intu- itive ways. However, a reduction in the pupil-teacher ratio is predicted to increase an immigrant’s earnings only if he has obtained some college edu- cation.
How have trends in the relative level of education of immigrants and increases in the proportion of immigrants in the population affected the welfare of natives? Keeping to the educational theme of this paper, we extend the work of Betts (1998) and Hoxby (1998) to test whether immi- grants “crowd out” natives from secondary and postsecondary schooling. We find evidence in favor of this hypothesis for native blacks, Hispanics, Asians, and whites. Intriguingly, most of the crowding out appears to oc- cur in grade school. However, there is evidence that immigrants crowd native Hispanics and native Asians out of postsecondary as well as sec- ondary education. Although this finding is the third such finding in the literature, all of the analyses to date have used indirect means to infer whether immigrants directly or indirectly dissuade natives from attending educational institutions. More direct studies at the school level would do much to confirm that crowding out occurs.
The paper suggests that education is at the heart of the ongoing debate about immigration policy. The widening gap in relative educational attain- ment between natives and immigrants appears to have had important con- sequences for both immigrants and natives. For immigrants, the conse- quences are directly observed in their wages, with over one-half of the wage gap arising due to the corresponding gap in education. For natives, we find strong evidence that inflows of immigrants have crowded natives, especially minorities, out of schools and, to a lesser extent, colleges.
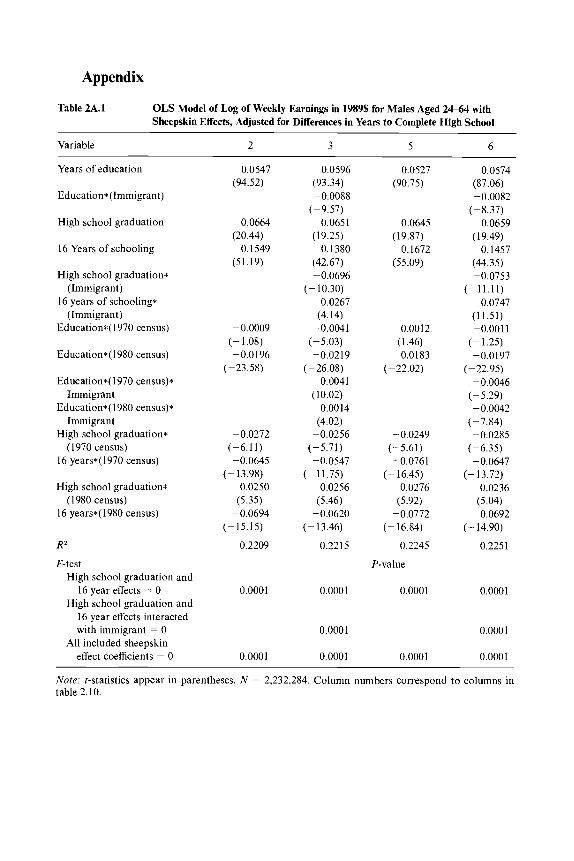
Appendix
Table 2A.1 OLS Model of Log of Weekly Earnings in 1989% for Males Aged 2 4 6 4 with Sheepskin Effects, Adjusted for Differences in Years to Complete High School
Variable 2 3 5 6
Years of education
Education*(Immigrant)
High school graduation
16 Years of schooling
High school graduation*
16 years of schooling*
Education*(1970 census)
(Immigrant)
(Immigrant)
Education*(l980 census)
Education*(1970 census)*
Education*(l980 census)*
High school graduation*
16 years*(1970 census)
Immigrant
Immigrant
(1970 census)
High school graduation*
16 years*(1980 census) (1980 census)
R2
F-test High school graduation and
16 year effects = 0 High school graduation and
16 year effects interacted with immigrant = 0
All included sheepskin effect coefficients = 0
0.0547 (94.52)
0.0664
0.1549 (20.44)
(5 1.19)
-0.0009 (- 1.08)
(-23.58) -0.0196
-0.0272 (-6.1 1)
(- 13.98) 0.0250
(5.35) -0.0694
- 0.0645
(- 15.15)
0.2209
0.0001
0.0001
0.0596
-0.0088
0.0651
0.1380
(93.34)
(-9.57)
(19.25)
(42.67) -0.0696
0.0267 (4.14)
-0.0041
(- 10.30)
(-5.03)
(-26.08) -0.0219
0.0041
0.0014 (4.02)
-0.0256 (-5.71)
(- 11.75)
(10.02)
-0.0547
0.0256 (5.46)
-0.0620 (- 13.46)
0.2215
0.0001
0.0001
0.0001
0.0527 (90.75)
0.0645
0.1672 ( 19.87)
(55.09)
0.0012 (1.46)
-0.0183 (-22.02)
-0.0249 (-5.61)
(- 16.45) -0.0761
0.0276 (5.92)
-0.0772 ( - 1 6.84)
0.2245
P-value
0.0001
0.0001
0.0574 (87.06) -0.0082
( - 8.37) 0.0659
0.1457 (19.49)
(44.35)
(-1 1.1 1) -0.0753
0.0747 (11.51) -0.001 1
(-1.25) -0.0197
(-22.95)
(-5.29)
(-7.84)
(-6.35)
(- 13.72)
-0.0046
- 0.0042
-0.0285
-0.0647
0.0236 (5.04)
-0.0692 (- 14.90)
0.2251
0.0001
0.0001
0.0001
Note: t-statistics appear in parentheses. N = 2,232,284. Column numbers correspond to columns in table 2.10.
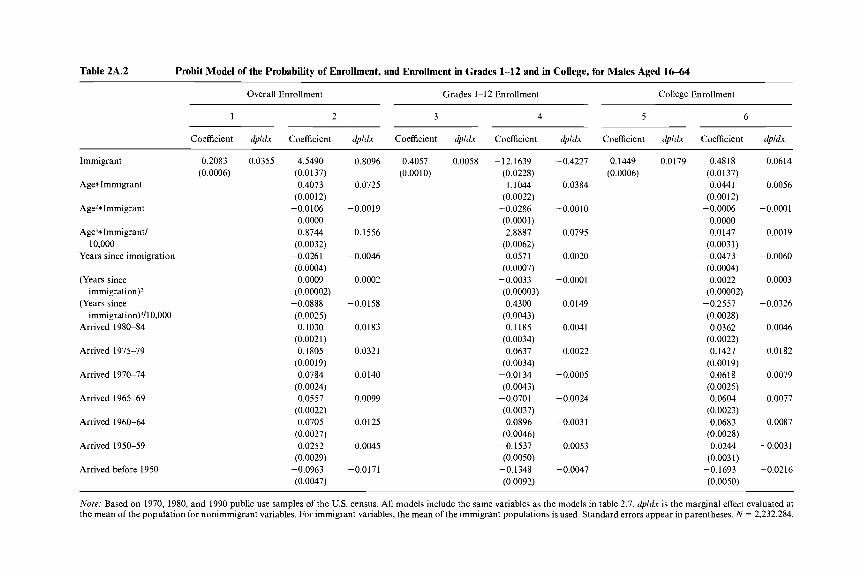
Table 2A.2 Probit Model of the Probability of Enrollment, and Enrollment in Grades 1-12 and in College, for Males Aged 16-64
Overall Enrollment Grades 1-12 Enrollment College Enrollment
1 2 3 4 5 6
Coefficient dpldx Coefficient dpldx Coefficient dpldx Coefficient dpldx Coefficient dpldx Coefficient dpldx
Immigrant
AgeImmigrant
Age**Immigrant
Age’*Immigrant/
Years since immigration
(Years since
(Years since
Arrived 1980-84
Arrived 1975-79
Arrived 1970-74
Arrived 1965-69
Arrived 1960-64
Arrived 1950-59
Arrived before 1950
10,000
immigration)’
immigration)3/10,000
0.2083 0.0355 -4.5490 (0.0006) (0.0137)
0.4073 (0.0012)
-0.0106 0.0000 0.8744
(0.0032)
(0.0004) 0.0009
(0.00002) -0.0888 (0.0025) 0.1030
(0.0021) 0.1805
(0.0019) 0.0784
(0.0024) 0.0557
(0.0022) 0.0705
(0.0027) 0.0252
(0.0029) -0.0963 (0.0047)
-0.0261
-0.8096
0.0725
- 0.00 19
0.1556
-0.0046
0.0002
-0.0158
0.0183
0.0321
0.0140
0.0099
0.0125
0.0045
-0.0171
0.4057 0.0058 - 12. I639 (0.0010) (0.0228)
1.1044 (0.0022)
-0.0286 (0.0001) 2.8887
(0.0062) 0.0571
(0.0007) -0.0033 (0.00003) 0.4300
(0.0043) 0.1185
(0.0034) 0.0637
(0.0034)
(0.0043)
(0.0037)
(0.0046)
(0.0050)
(0.0092)
-0.0134
-0.0701
-0.0896
-0.1537
-0.1348
-0,4227
0.0384
- 0.00 10
0.0795
0.0020
-0.0001
0.0149
0.0041
0.0022
-0.0005
-0.0024
-0.0031
-0.0053
-0.0047
0.1449 0.0179 -0.4818 (0.0006) (0.0137)
0.0441 (0.00l2)
-0.0006 0.0000 0.0147
(0.0031) -0.0473 (0.0004) 0.0022
-0.2557 (0.00002)
(0.0028) 0.0362
0.1427 (0.0019) 0.0618
(0.0025) 0.0604
(0.0023) 0.0683
(0.0028) -0.0244 (0.0031)
-0.1693 (0.0050)
(0.0022)
-0.0614
0.0056
-0.0001
0.0019
-0.0060
0.0003
-0.0326
0.0046
0.0182
0.0079
0.0077
0.0087
-0.0031
-0.0216
Note: Based on 1970, 1980, and 1990 public use samples of the U.S. census. All models include the same variables as the models in table 2.7. dpldx is the marginal effect evaluated at the mean of the population for nonimmigrant variables. For immigrant variables, the mean of the immigrant populations is used. Standard errors appear in parentheses. N = 2,232,284.
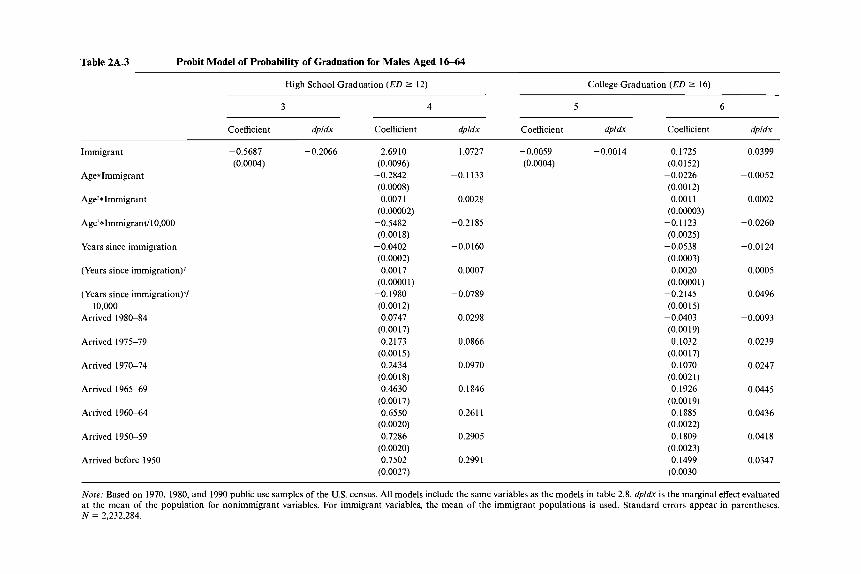
Table 2A.3 Probit Model of Probability of Graduation for Males Aged 16-64
High School Graduation (ED 2 12) College Graduation (ED 2 16)
3 4 5 6
Coefficient dpldx Coefficient dpldx Coefficient dpldx Coefficient dpldx
Immigrant
Age*lmmigrant
Agez* Immigrant
Age3*Immigrant/10,000
Years since immigration
(Years since immigration)z
(Years since immigration)’/
Arrived 1980-84 10,000
Arrived 1975-79
Arrived 1970-74
Arrived 1965-69
Arrived 1960-64
Arrived 1950-59
Arrived before 1950
-0.5687 -0.2066 2.6910 (0.0004) (0.0096)
-0.2842 (0.0008) 0.0071
(0.00002) -0.5482 (0.0018)
-0.0402 (0.0002) 0.0017
(0.00001) -0.1980 (0.0012) 0.0747
(0.0017) 0.2173
(0.0015) 0.2434
0.4630 (0.0017) 0.6550
(0.0020) 0.7286
(0.0020) 0.7502
(0.0027)
(O.OOl8)
1.0727 -0.0059 -
(0.0004) -0.1133
0.0028
-0.2185
- 0.01 60
0.0007
-0.0789
0.0298
0.0866
0.0970
0.1846
0.261 1
0.2905
0.2991
-0.0014 0.1725 (0.0152)
-0.0226
0.001 1 (0.00003)
-0.1123 (0.0025)
-0.0538 (0.0003) 0.0020
(0.0000 I) -0.2145 (O.OOl5)
-0.0403
(0.0012)
(0.001 9) 0.1032
(0.0017) 0.1070
0.1926 (0.00 19) 0.1885
(0.0022) 0. I809
(0.0023) 0.1499
(0.0030
(0.0021)
0.0399
-0.0052
0.0002
-0.0260
-0.0124
0.0005
-0.0496
-0.0093
0.0239
0.0247
0.0445
0.0436
0.0418
0.0347
Note: Based on 1970, 1980, and 1990 public use samples of the US. census. All models include the same variables as the models in table 2.8. dpldx is the marginal effect evaluated at the mean of the population for nonimmigrant variables. For immigrant variables, the mean of the immigrant populations is used. Standard errors appear in parentheses. N = 2,232,284.
114 Julian R. Betts and Magnus Lofstrom
References
Barro, Robert J., and Jong-Wha Lee. 1993. International comparisons of educa- tional attainment. Journal of Monetary Economics 3:363-94.
Betts, Julian R. 1995. Does school quality matter? Evidence from the National Longitudinal Survey of Youth. Review of Economics and Statistics 77:231-50.
. 1998. Educational crowding out: Do immigrants affect the educational attainment of American minorities? In Help or hindrance? The economic im- plications of immigration for African-Americans, ed. Daniel S. Hamermesh and Frank D. Bean, 253-81. New York: Russell Sage Foundation.
Borjas, George J. 1985. Assimilation changes in cohort quality and the earnings of immigrants. Journal of Labor Economics 4:463-89.
. 1990. Friends or strangers: The impact of immigrunts on the U S . economy. New York: Basic Books.
. 1995. Assimilation changes in cohort quality revisited: What happened to immigrant earnings in the 1980’s? Journal of Labor Economics 2:201-45.
Borjas, George J., Richard B. Freeman, and Kevin Lang. 1991. Undocumented Mexican-born workers in the United States: How many, how permanent? In Immigration, trade, and the labor market, ed. John M. Abowd and Richard B. Freeman, 77-100. Chicago: University of Chicago Press.
Bratsberg, Bernt, and Dek Terrell. 1997. School quality and returns to cducation of U.S. immigrants. Kansas State University, Manhattan, Kansas.
Chiswick, Barry R. 1978. The effect of Americanization on the earnings of foreign- born men. Journal of Political Economy 5:897-921.
Federal Security Agcncy. Various years. Biennial survey of education in the United States. Washington, D.C.: Office of Education.
Friedberg, Rachel M. 1996. You can’t take it with you? Immigrant assimilation and the portability of human capital. NBER Working Paper no. 5837. Cam- bridge, Mass.: National Bureau of Economic Research, November.
Funkhouser, Edward, and Stephen S. Trejo, 1995. The labor market skills of recent male immigrants-evidence from the current population survey. Industrial and Labor Relations Review 48 (4): 792-8 1 1 .
Gonzalez, Arturo. 1997. The education and quality of immigrant children: The impact of age at arrival. Mexican-American Studies and Research Center, Uni- versity of Arizona, Tucson, Arizona.
Heckman, James, Anne Laync-Farrar, and Pctra Todd. 1996. Human capital pric- ing equations with an application to estimating the effect of schooling quality on earnings. Review of Economics and Statistics 4:562-610.
Hoxby, Caroline M. 1998. Do immigrants crowd disadvantaged American natives out of higher education? In Help or hindrance? The economic implications ofim- migration for African-Americans, ed. Daniel S. Hamermesh and Frank D. Bean, 282-321. New York: Russell Sage Foundation.
Jaeger, David A,, and Marianne E. Page. 1996. Degrees matter: New evidence on sheepskin effects in the returns to education. Review of Economics und Statis- tics 4:733-40.
James, Estelle, Nabeel Alsalam, Joseph C. Conaty, and Duc-Le To. 1989. College quality and future earnings: Where should you send your child to college? Amer- ican Economic Review 2:247-52.
Loury, Linda Datcher, and David Garman. 1995. College selectivity and earnings. Journal of Labor Economics 2:289-308.

The Educational Attainment of Immigrants 115
National Center for Education Statistics. Various years. Digest of education statis- tics. Washington, D.C.: U.S. Department of Education.
Summers, Robert, and Alan Heston. 1991. The Penn world table (mark 5): An expanded set of international comparisons, 1950-1988. Quarterly Journal of Economics 9:327-68.
United Nations Educational, Scientific, and Cultural Organization (UNESCO). Various years. Statistical yearbook. Paris: Imprimerie de la Manutention, May- enne.
Vernez, George, and Allan Abrahamse. 1996. How immigrants fare in U S . educa- tion. Santa Monica, Calif.: The RAND Corporation.
Warren, Robert, and Jeffrey S. Passel. 1987. A count of the uncountable: Estimates of undocumented aliens counted in the 1980 census. Demography 24:375-93.

This Page Intentionally Left Blank
Recommended