The Education Fiscal Accountability and Oversight Act
of 2004
Local School System Annual Master Plan Update
Budget Review
December 30, 2016
Karen B. Salmon, Ph.D. State Superintendent of Schools
Andrew R. Smarick
President, Maryland State Board of Education
Larry Hogan Governor
Kristy Michel Chief Operating Officer
Dr. Sylvia Lawson
Chief Performance Officer
Kristina Kyles-Smith Assistant State Superintendent
Division of Student, Family, and School Support
The Maryland State Department of Education does not discriminate on the basis of age, ancestry/national origin, color, disability, gender identity/expression, marital status, race, religion, sex, or sexual orientation in matters affecting employment or in providing access to programs and activities and provides equal access to the Boy Scouts and other designated youth groups. For inquiries related to Department policy, please contact: For inquiries related to departmental policy, please contact:
Equity Assurance and Compliance Office Maryland State Department of Education
200 West Baltimore Street Baltimore, Maryland 21201-2595
410-767-0433 (voice) 410-767-0431 (fax)
410-333-6442 (TTY/TDD)
Table of Contents Page SB 894: Report on the Budget Review of the Annual Master Plan Updates 1
Budget Summaries 5
Allegany 5
Anne Arundel 7
Baltimore City 11
Baltimore County 13
Calvert 17
Caroline 19
Carroll 21
Cecil 23
Charles 25
Dorchester 27
Frederick 29
Garrett 31
Harford 33
Howard 35
Kent 39
Montgomery 41
Prince George’s 45
Queen Anne’s 47
St. Mary’s 49
Somerset 51
Talbot 53
Washington 55
Wicomico 57
Worcester 59
Background In 2002, the Maryland General Assembly enacted the Bridge to Excellence in Public Schools Act, which restructured Maryland’s public school finance system and increased State aid to public schools by an estimated $1.3 billion over six fiscal years (2003-2008). As a result of this legislation, Maryland adopted a standards-based approach to public school financing. The new funding formula was based on the principles of adequacy, equity, simplicity, and flexibility, linking resources to the needs of students by distributing 74 percent of State aid inverse to local wealth. The Bridge to Excellence legislation required local school systems to develop a five-year Comprehensive Master Plan that outlined strategies for improving student achievement and eliminating achievement gaps. Local school systems have submitted annual updates to the original approved Master Plans. School systems analyzed student performance and other data to assess their current practices and make changes where applicable. Updated plans are due to MSDE annually on October 15th. Approximately 8 panels comprised of 80 individuals from local school systems and MSDE staff are involved in an initial panel review and consensus. The final submitted plans are also reviewed by panel facilitators and technical reviewers to ensure all clarifying questions posed during the reviews were adequately addressed. Recommendations regarding approvability of the plans are then made to the State Superintendent. Based on the unprecedented increases in State aid and given the unrestricted nature of these funds, the Maryland General Assembly enacted the Fiscal Accountability and Oversight Act of 2004, which, among other fiscal measures, expanded the scope of the Master Plan Annual Updates to include a detailed summary of how each local board of education’s current year approved budget and actual prior year budget are consistent with the goals, objectives, and strategies detailed in the Master Plan. The State Superintendent is required to report to the Governor and the General Assembly, annually, on the alignment of local school system annual budgets with Master Plan goals and objectives. This report provides an overview of the guidance provided to local school systems, education funding changes, a statewide analysis of local budget data, and the results of the 2016 review. Budget summaries for each school system are included in the appendix. 2016 Comprehensive Master Plan Local School System Guidance Local School Systems are required to provide documentation showing the alignment between current and prior year budgets and master plan goals and objectives. Local School Systems illustrate this connection through the budget narrative in the executive summary, a current year report (how funds are being allocated in the current fiscal year), and a prior year variance report (a comparative analysis of the prior year plan). Additionally, Local school systems incorporate a discussion of how current resources are allocated throughout the content portion of the plans. Local school systems were asked prepare the budget tables with a focus on their total budget and allocate planned and actual expenditures to one of four assurance areas (Standards and
1
Assessments, Data Systems to Support Instruction, Great Teachers and Leaders, and Turning Around Lowest Achieving Schools), mandatory costs of doing business, or other items deemed necessary by the local board of education. Education Funding in Maryland State funding for education in Maryland has remained a priority, despite difficult economic pressures. In FY 2017, total Direct State Aid to Local Education is $5.5 billion, or 32% of the State’s operating budget. In Local School System budgets, State funds account for 44% of total funds, local funding accounts for 49%, and the remaining 7% is from federal and other fund sources. Changes in State Education Funding The 2016 Legislative Session resulted in a number of changes to education funding in fiscal 2017. The Geographic Cost of Education Index program is mandated and funded at 100% ($137 million). This program, formerly a non-mandated portion of the State Aid formulas, provides additional funds to 13 school systems in higher cost areas. The phase-in of the Net Taxable Income (NTI) Adjustment Grant is 60% in fiscal 2017, with full phase-in completed in fiscal 2019. Federal Funds Federal funding is returning to pre-stimulus funding levels in that the majority of American Recovery and Reinvestment Act of 2009 (ARRA) funds have expired. Local school systems included federal Race to the Top funds in their fiscal documents for FY2016 as the grant ended on September 30, 2015. Fiscal Analysis Revenue For the current year, FY 2017, local school systems were asked to show their entire budget, attributing revenue to the descriptions outlined in the chart below. For the prior year, FY 2016, local school systems were asked to show the change in revenue (planned v. actual within 2016). State revenue as reported does not include State-paid retirement benefits. However local funding includes the locally paid portion. Federal funds are reported in three categories: Federal ARRA Funds, Federal Revenue (regular Title I and IDEA funds), and Other Federal Funds.
2
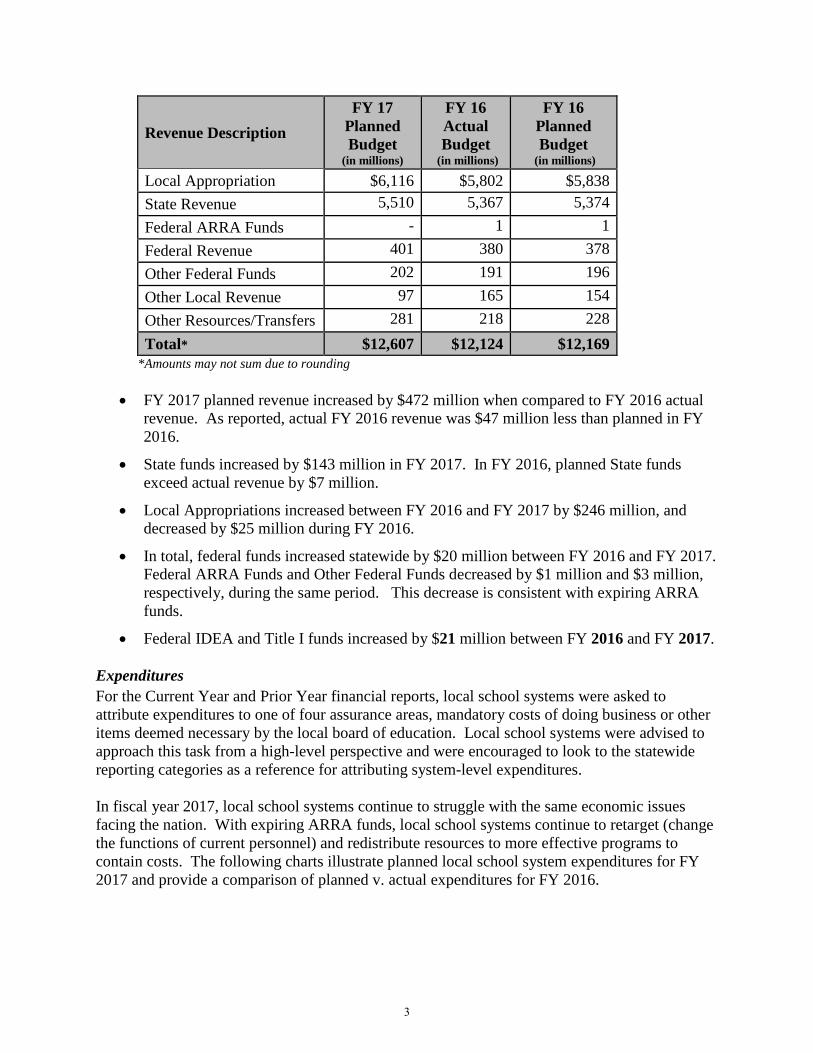
Revenue Description FY 17
Planned Budget
(in millions)
FY 16 Actual Budget
(in millions)
FY 16 Planned Budget
(in millions) Local Appropriation $6,116 $5,802 $5,838 State Revenue 5,510 5,367 5,374 Federal ARRA Funds - 1 1 Federal Revenue 401 380 378 Other Federal Funds 202 191 196 Other Local Revenue 97 165 154 Other Resources/Transfers 281 218 228 Total* $12,607 $12,124 $12,169
*Amounts may not sum due to rounding
• FY 2017 planned revenue increased by $472 million when compared to FY 2016 actual revenue. As reported, actual FY 2016 revenue was $47 million less than planned in FY 2016.
• State funds increased by $143 million in FY 2017. In FY 2016, planned State funds exceed actual revenue by $7 million.
• Local Appropriations increased between FY 2016 and FY 2017 by $246 million, and decreased by $25 million during FY 2016.
• In total, federal funds increased statewide by $20 million between FY 2016 and FY 2017. Federal ARRA Funds and Other Federal Funds decreased by $1 million and $3 million, respectively, during the same period. This decrease is consistent with expiring ARRA funds.
• Federal IDEA and Title I funds increased by $21 million between FY 2016 and FY 2017. Expenditures For the Current Year and Prior Year financial reports, local school systems were asked to attribute expenditures to one of four assurance areas, mandatory costs of doing business or other items deemed necessary by the local board of education. Local school systems were advised to approach this task from a high-level perspective and were encouraged to look to the statewide reporting categories as a reference for attributing system-level expenditures. In fiscal year 2017, local school systems continue to struggle with the same economic issues facing the nation. With expiring ARRA funds, local school systems continue to retarget (change the functions of current personnel) and redistribute resources to more effective programs to contain costs. The following charts illustrate planned local school system expenditures for FY 2017 and provide a comparison of planned v. actual expenditures for FY 2016.
3
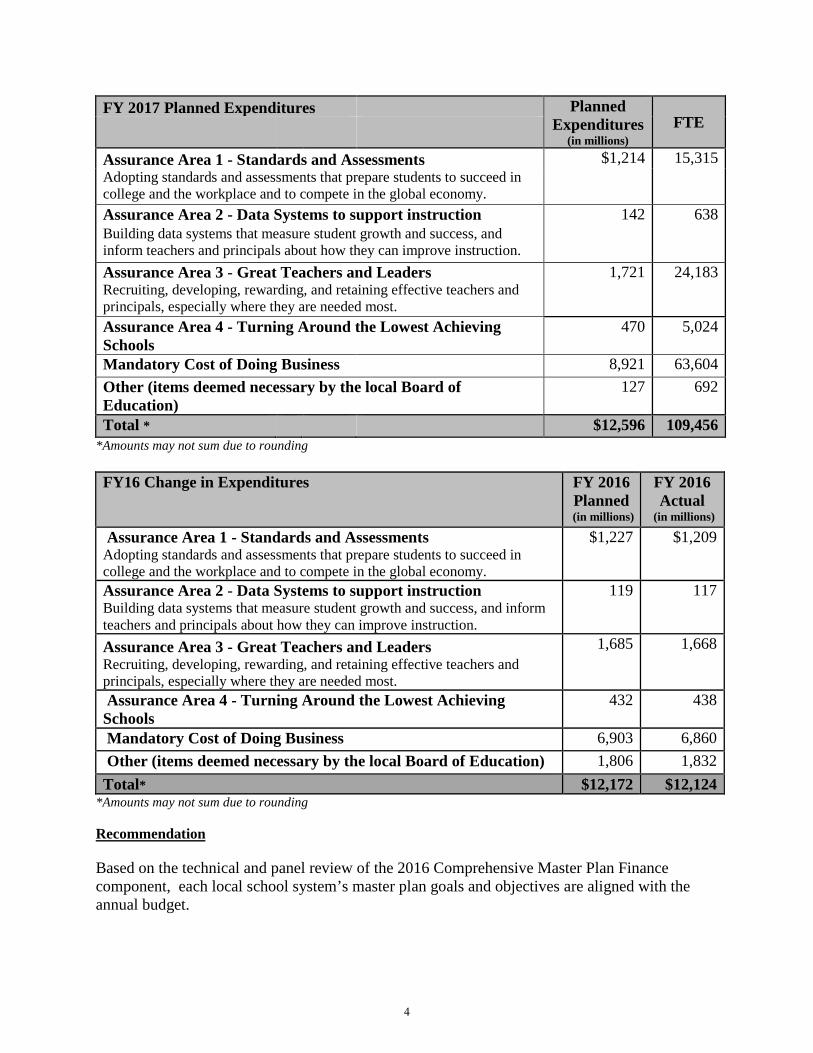
FY 2017 Planned Expenditures Planned Expenditures
(in millions) FTE
Assurance Area 1 - Standards and Assessments $1,214 15,315 Adopting standards and assessments that prepare students to succeed in college and the workplace and to compete in the global economy. Assurance Area 2 - Data Systems to support instruction 142 638 Building data systems that measure student growth and success, and inform teachers and principals about how they can improve instruction. Assurance Area 3 - Great Teachers and Leaders Recruiting, developing, rewarding, and retaining effective teachers and principals, especially where they are needed most.
1,721 24,183
Assurance Area 4 - Turning Around the Lowest Achieving Schools
470 5,024
Mandatory Cost of Doing Business 8,921 63,604 Other (items deemed necessary by the local Board of Education)
127 692
Total * $12,596 109,456 *Amounts may not sum due to rounding FY16 Change in Expenditures FY 2016
Planned (in millions)
FY 2016 Actual
(in millions) Assurance Area 1 - Standards and Assessments Adopting standards and assessments that prepare students to succeed in college and the workplace and to compete in the global economy.
$1,227 $1,209
Assurance Area 2 - Data Systems to support instruction Building data systems that measure student growth and success, and inform teachers and principals about how they can improve instruction.
119 117
Assurance Area 3 - Great Teachers and Leaders Recruiting, developing, rewarding, and retaining effective teachers and principals, especially where they are needed most.
1,685 1,668
Assurance Area 4 - Turning Around the Lowest Achieving Schools
432 438
Mandatory Cost of Doing Business 6,903 6,860 Other (items deemed necessary by the local Board of Education) 1,806 1,832 Total* $12,172 $12,124
*Amounts may not sum due to rounding Recommendation Based on the technical and panel review of the 2016 Comprehensive Master Plan Finance component, each local school system’s master plan goals and objectives are aligned with the annual budget.
4
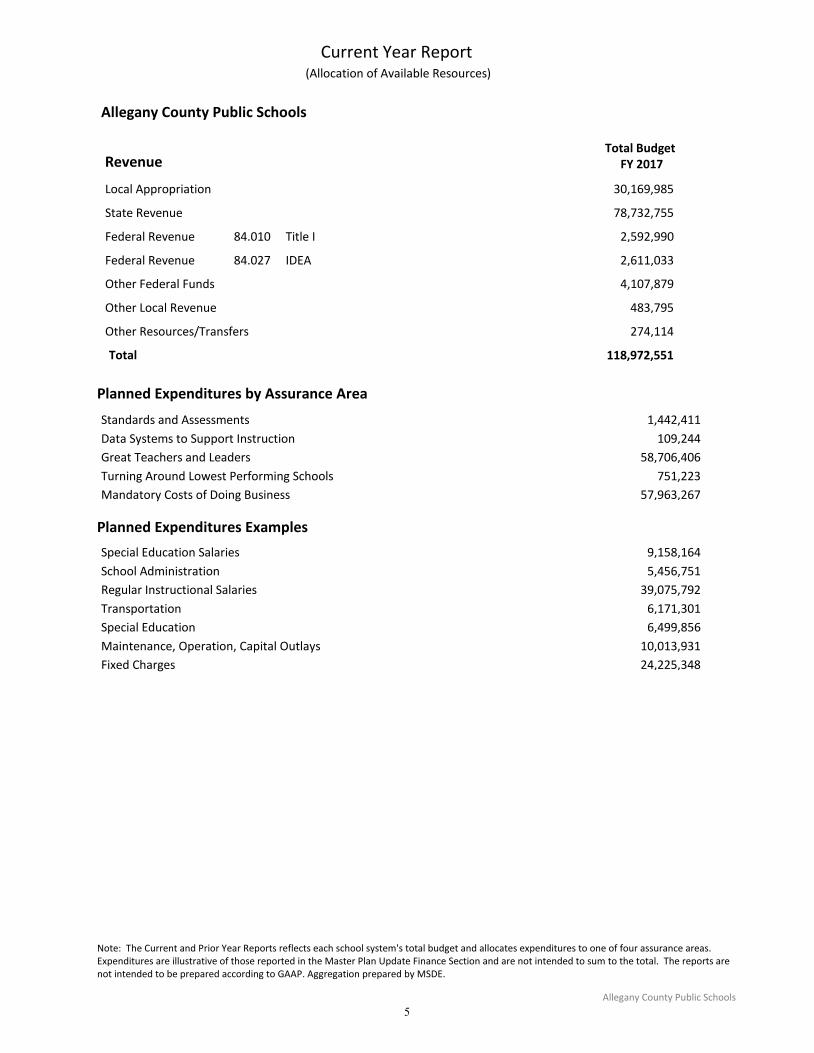
Allegany County Public Schools
RevenueTotal Budget
FY 2017
Current Year Report (Allocation of Available Resources)
30,169,985Local Appropriation
78,732,755State Revenue
2,592,990Federal Revenue 84.010 Title I
2,611,033Federal Revenue 84.027 IDEA
4,107,879Other Federal Funds
483,795Other Local Revenue
274,114Other Resources/Transfers
118,972,551Total
Planned Expenditures by Assurance Area
Standards and Assessments 1,442,411
Data Systems to Support Instruction 109,244
Great Teachers and Leaders 58,706,406
Turning Around Lowest Performing Schools 751,223
Mandatory Costs of Doing Business 57,963,267
Planned Expenditures Examples
Special Education Salaries 9,158,164
School Administration 5,456,751
Regular Instructional Salaries 39,075,792
Transportation 6,171,301
Special Education 6,499,856
Maintenance, Operation, Capital Outlays 10,013,931
Fixed Charges 24,225,348
Prior Year Comparison Report
Note: The Current and Prior Year Reports reflects each school system's total budget and allocates expenditures to one of four assurance areas. Expenditures are illustrative of those reported in the Master Plan Update Finance Section and are not intended to sum to the total. The reports are not intended to be prepared according to GAAP. Aggregation prepared by MSDE.
Allegany County Public Schools
5

Original Budget
7/1/2015
Final Budget
6/30/2016 ChangeRevenue
Allegany County Public Schools
Prior Year Comparison Report (Planned v. Actual)
29,837,545 29,837,545 0Local Appropriation
77,217,824 77,217,824 0State Revenue
2,656,310 2,653,143 -3,167Federal Revenue 84.010 Title I
2,577,005 2,350,103 -226,902Federal Revenue 84.027 IDEA
4,319,448 5,195,823 876,375Other Federal Funds
309,630 309,630 0Other Local Revenue
5,133,813 5,133,813 0Other Resources/Transfers
122,051,575 646,306Total 122,697,881
Actual Expenditures by Assurance Area
1,346,297Standards and Assessments
109,664Data Systems to Support Instruction
58,717,108Great Teachers and Leaders
638,596Turning Around Lowest Performing Schools
58,024,798Mandatory Costs of Doing Business
3,861,417Other items deemed necessary by the Local Board of Education
Actual Expenditure Examples
School Administration 5,209,774
Special Education Instructional Salaries 9,020,858
Regular Instructional Salaries 39,273,613
Special Education 5,759,044
Transportation 5,932,200
Maintenance Operations, Capital Outlay 9,050,078
Fixed Charges 25,887,956
Fund Balance Increase/Expenditure Control 3,861,417
Note: The Current and Prior Year Reports reflects each school system's total budget and allocates expenditures to one of four assurance areas. Expenditures are illustrative of those reported in the Master Plan Update Finance Section and are not intended to sum to the total. The reports are not intended to be prepared according to GAAP. Aggregation prepared by MSDE.
Allegany County Public Schools
6
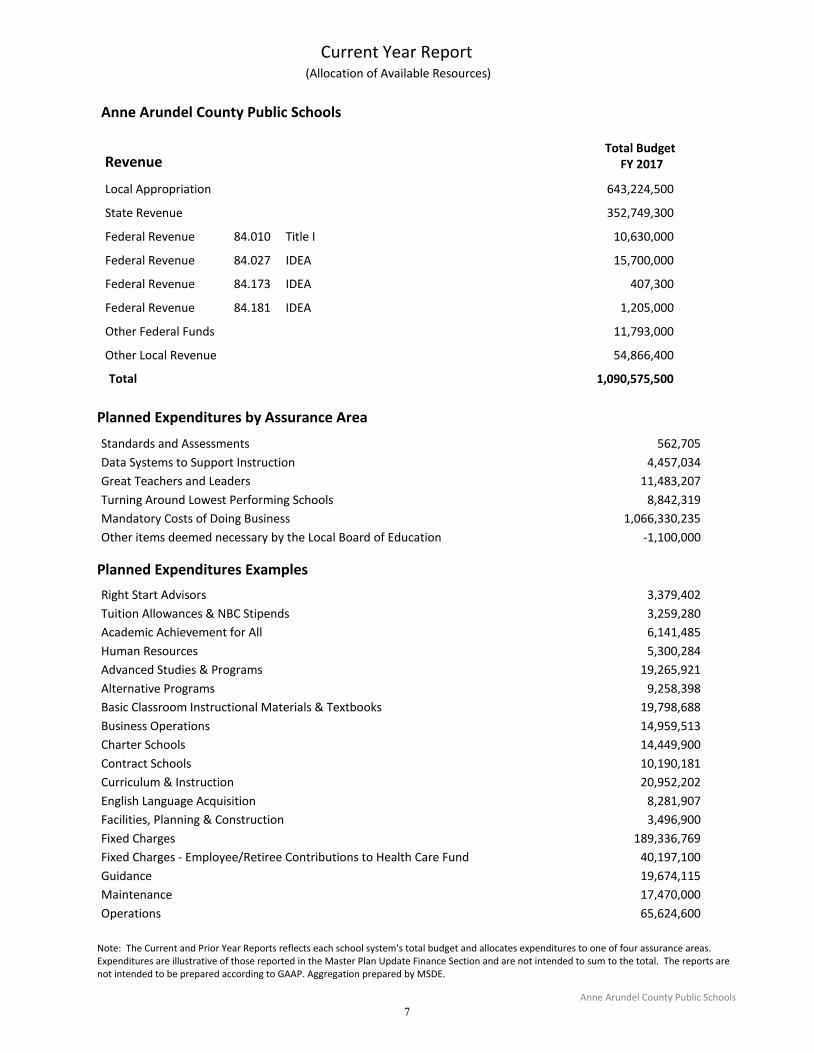
Anne Arundel County Public Schools
RevenueTotal Budget
FY 2017
Current Year Report (Allocation of Available Resources)
643,224,500Local Appropriation
352,749,300State Revenue
10,630,000Federal Revenue 84.010 Title I
15,700,000Federal Revenue 84.027 IDEA
407,300Federal Revenue 84.173 IDEA
1,205,000Federal Revenue 84.181 IDEA
11,793,000Other Federal Funds
54,866,400Other Local Revenue
1,090,575,500Total
Planned Expenditures by Assurance Area
Standards and Assessments 562,705
Data Systems to Support Instruction 4,457,034
Great Teachers and Leaders 11,483,207
Turning Around Lowest Performing Schools 8,842,319
Mandatory Costs of Doing Business 1,066,330,235
Other items deemed necessary by the Local Board of Education -1,100,000
Planned Expenditures Examples
Right Start Advisors 3,379,402
Tuition Allowances & NBC Stipends 3,259,280
Academic Achievement for All 6,141,485
Human Resources 5,300,284
Advanced Studies & Programs 19,265,921
Alternative Programs 9,258,398
Basic Classroom Instructional Materials & Textbooks 19,798,688
Business Operations 14,959,513
Charter Schools 14,449,900
Contract Schools 10,190,181
Curriculum & Instruction 20,952,202
English Language Acquisition 8,281,907
Facilities, Planning & Construction 3,496,900
Fixed Charges 189,336,769
Fixed Charges - Employee/Retiree Contributions to Health Care Fund 40,197,100
Guidance 19,674,115
Maintenance 17,470,000
Operations 65,624,600
Note: The Current and Prior Year Reports reflects each school system's total budget and allocates expenditures to one of four assurance areas. Expenditures are illustrative of those reported in the Master Plan Update Finance Section and are not intended to sum to the total. The reports are not intended to be prepared according to GAAP. Aggregation prepared by MSDE.
Anne Arundel County Public Schools
7
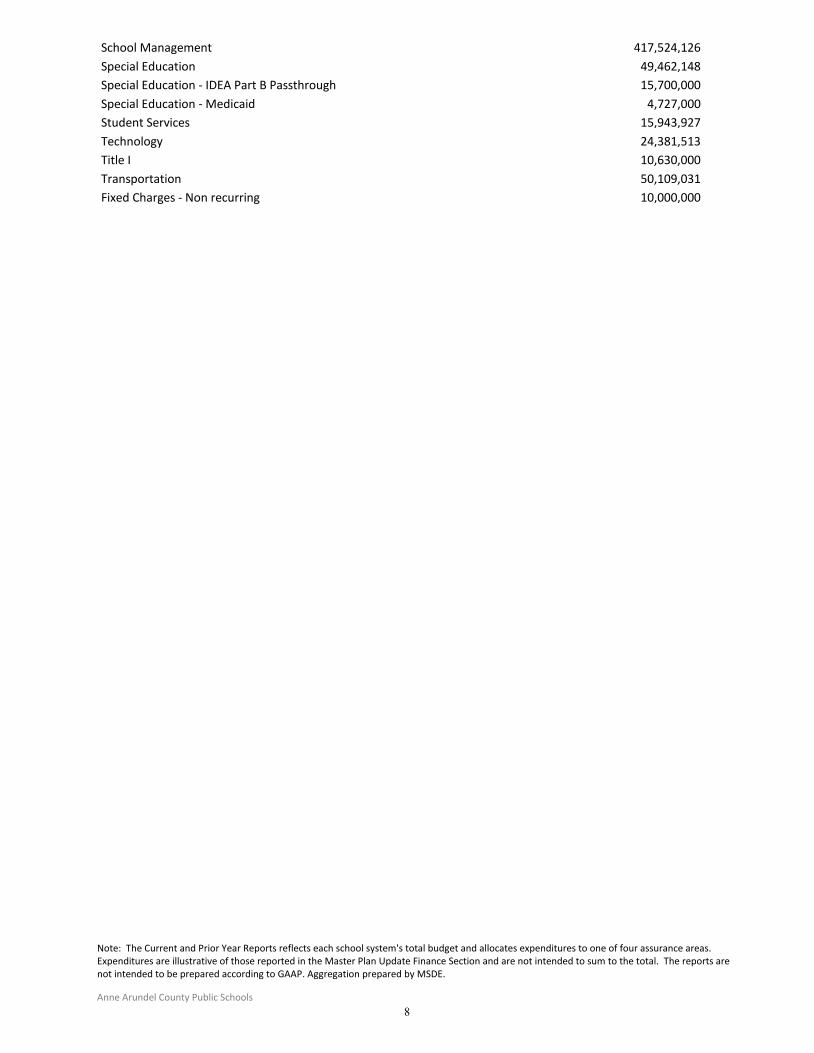
School Management 417,524,126
Special Education 49,462,148
Special Education - IDEA Part B Passthrough 15,700,000
Special Education - Medicaid 4,727,000
Student Services 15,943,927
Technology 24,381,513
Title I 10,630,000
Transportation 50,109,031
Fixed Charges - Non recurring 10,000,000
Prior Year Comparison Report
Note: The Current and Prior Year Reports reflects each school system's total budget and allocates expenditures to one of four assurance areas. Expenditures are illustrative of those reported in the Master Plan Update Finance Section and are not intended to sum to the total. The reports are not intended to be prepared according to GAAP. Aggregation prepared by MSDE.
Anne Arundel County Public Schools
8
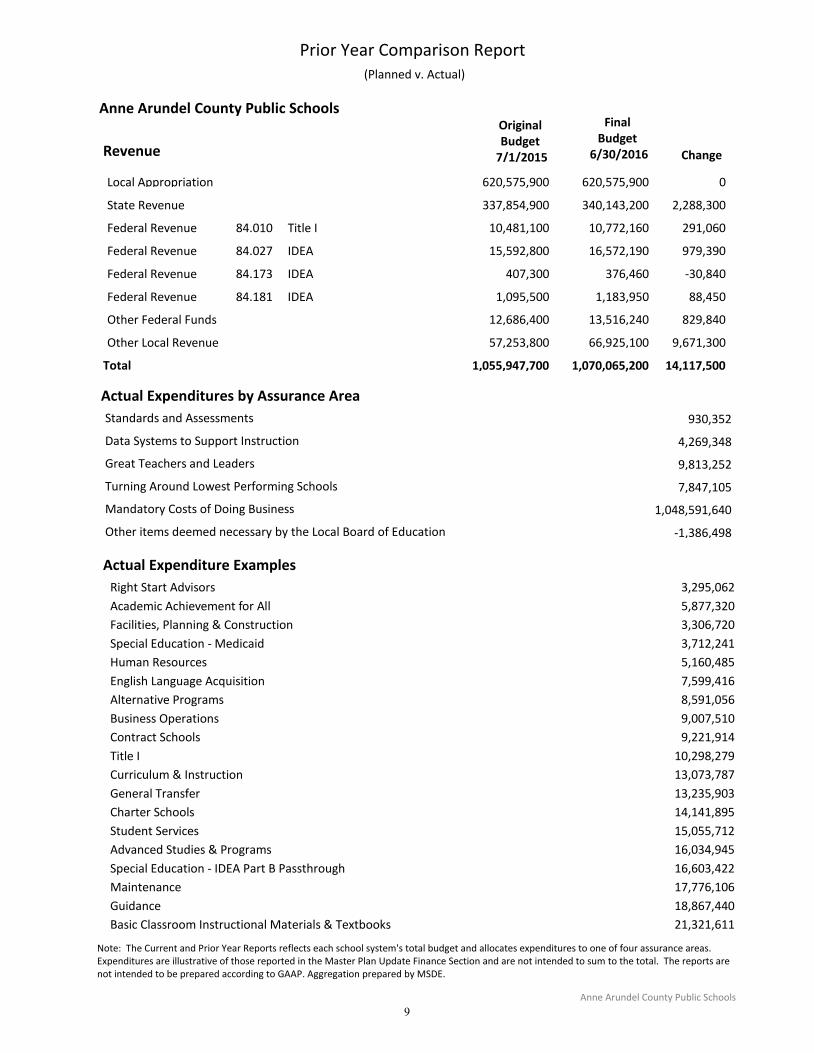
Original Budget
7/1/2015
Final Budget
6/30/2016 ChangeRevenue
Anne Arundel County Public Schools
Prior Year Comparison Report (Planned v. Actual)
620,575,900 620,575,900 0Local Appropriation
337,854,900 340,143,200 2,288,300State Revenue
10,481,100 10,772,160 291,060Federal Revenue 84.010 Title I
15,592,800 16,572,190 979,390Federal Revenue 84.027 IDEA
407,300 376,460 -30,840Federal Revenue 84.173 IDEA
1,095,500 1,183,950 88,450Federal Revenue 84.181 IDEA
12,686,400 13,516,240 829,840Other Federal Funds
57,253,800 66,925,100 9,671,300Other Local Revenue
1,055,947,700 14,117,500Total 1,070,065,200
Actual Expenditures by Assurance Area
930,352Standards and Assessments
4,269,348Data Systems to Support Instruction
9,813,252Great Teachers and Leaders
7,847,105Turning Around Lowest Performing Schools
1,048,591,640Mandatory Costs of Doing Business
-1,386,498Other items deemed necessary by the Local Board of Education
Actual Expenditure Examples
Right Start Advisors 3,295,062
Academic Achievement for All 5,877,320
Facilities, Planning & Construction 3,306,720
Special Education - Medicaid 3,712,241
Human Resources 5,160,485
English Language Acquisition 7,599,416
Alternative Programs 8,591,056
Business Operations 9,007,510
Contract Schools 9,221,914
Title I 10,298,279
Curriculum & Instruction 13,073,787
General Transfer 13,235,903
Charter Schools 14,141,895
Student Services 15,055,712
Advanced Studies & Programs 16,034,945
Special Education - IDEA Part B Passthrough 16,603,422
Maintenance 17,776,106
Guidance 18,867,440
Basic Classroom Instructional Materials & Textbooks 21,321,611
Note: The Current and Prior Year Reports reflects each school system's total budget and allocates expenditures to one of four assurance areas. Expenditures are illustrative of those reported in the Master Plan Update Finance Section and are not intended to sum to the total. The reports are not intended to be prepared according to GAAP. Aggregation prepared by MSDE.
Anne Arundel County Public Schools
9
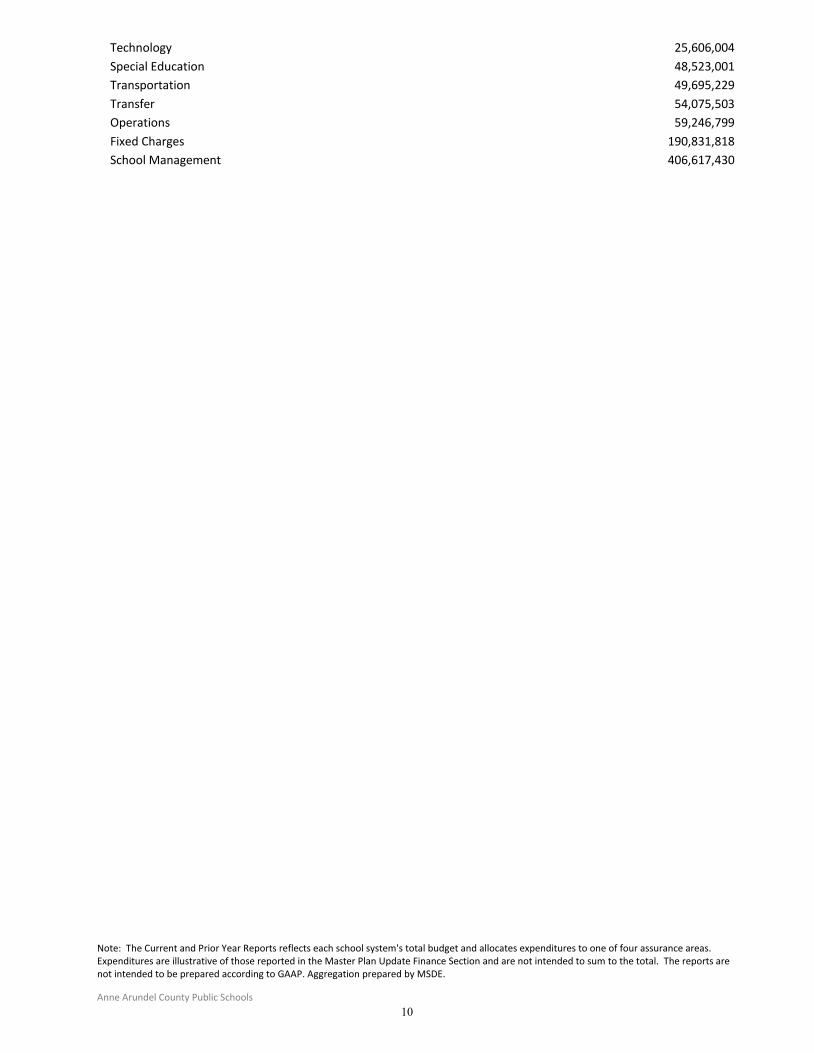
Technology 25,606,004
Special Education 48,523,001
Transportation 49,695,229
Transfer 54,075,503
Operations 59,246,799
Fixed Charges 190,831,818
School Management 406,617,430
Note: The Current and Prior Year Reports reflects each school system's total budget and allocates expenditures to one of four assurance areas. Expenditures are illustrative of those reported in the Master Plan Update Finance Section and are not intended to sum to the total. The reports are not intended to be prepared according to GAAP. Aggregation prepared by MSDE.
Anne Arundel County Public Schools
10
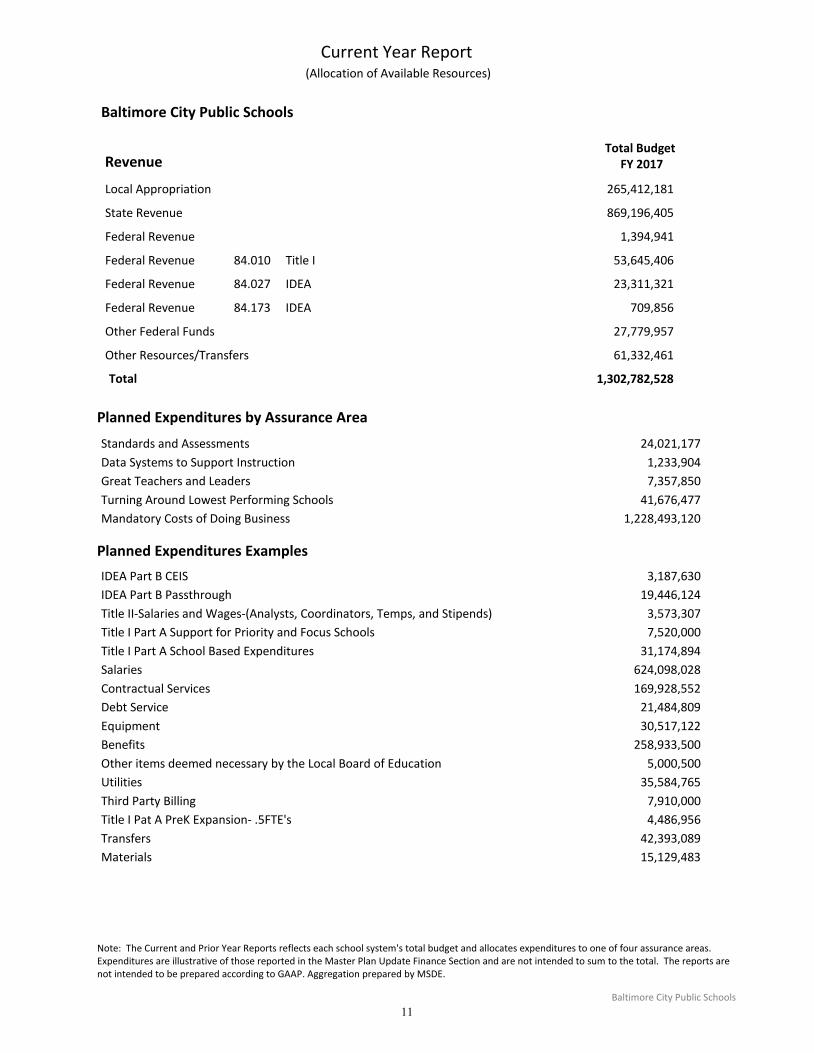
Baltimore City Public Schools
RevenueTotal Budget
FY 2017
Current Year Report (Allocation of Available Resources)
265,412,181Local Appropriation
869,196,405State Revenue
1,394,941Federal Revenue
53,645,406Federal Revenue 84.010 Title I
23,311,321Federal Revenue 84.027 IDEA
709,856Federal Revenue 84.173 IDEA
27,779,957Other Federal Funds
61,332,461Other Resources/Transfers
1,302,782,528Total
Planned Expenditures by Assurance Area
Standards and Assessments 24,021,177
Data Systems to Support Instruction 1,233,904
Great Teachers and Leaders 7,357,850
Turning Around Lowest Performing Schools 41,676,477
Mandatory Costs of Doing Business 1,228,493,120
Planned Expenditures Examples
IDEA Part B CEIS 3,187,630
IDEA Part B Passthrough 19,446,124
Title II-Salaries and Wages-(Analysts, Coordinators, Temps, and Stipends) 3,573,307
Title I Part A Support for Priority and Focus Schools 7,520,000
Title I Part A School Based Expenditures 31,174,894
Salaries 624,098,028
Contractual Services 169,928,552
Debt Service 21,484,809
Equipment 30,517,122
Benefits 258,933,500
Other items deemed necessary by the Local Board of Education 5,000,500
Utilities 35,584,765
Third Party Billing 7,910,000
Title I Pat A PreK Expansion- .5FTE's 4,486,956
Transfers 42,393,089
Materials 15,129,483
Prior Year Comparison Report
Note: The Current and Prior Year Reports reflects each school system's total budget and allocates expenditures to one of four assurance areas. Expenditures are illustrative of those reported in the Master Plan Update Finance Section and are not intended to sum to the total. The reports are not intended to be prepared according to GAAP. Aggregation prepared by MSDE.
Baltimore City Public Schools
11
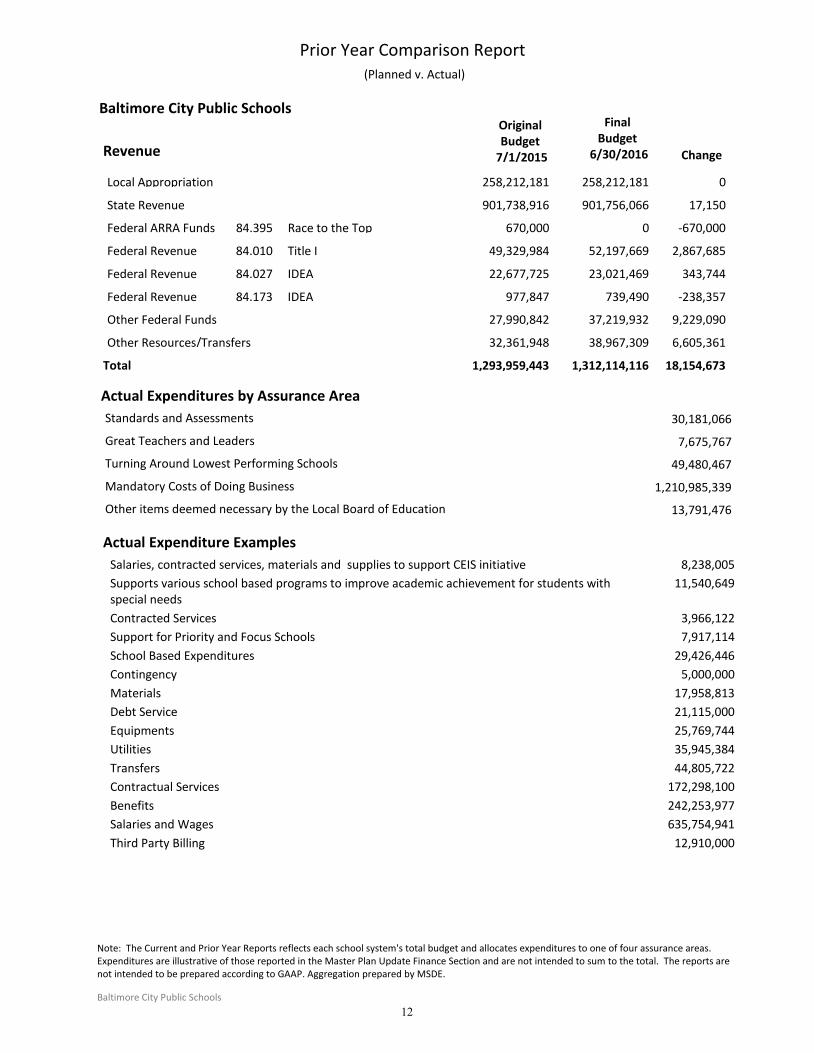
Original Budget
7/1/2015
Final Budget
6/30/2016 ChangeRevenue
Baltimore City Public Schools
Prior Year Comparison Report (Planned v. Actual)
258,212,181 258,212,181 0Local Appropriation
901,738,916 901,756,066 17,150State Revenue
670,000 0 -670,000Federal ARRA Funds 84.395 Race to the Top
49,329,984 52,197,669 2,867,685Federal Revenue 84.010 Title I
22,677,725 23,021,469 343,744Federal Revenue 84.027 IDEA
977,847 739,490 -238,357Federal Revenue 84.173 IDEA
27,990,842 37,219,932 9,229,090Other Federal Funds
32,361,948 38,967,309 6,605,361Other Resources/Transfers
1,293,959,443 18,154,673Total 1,312,114,116
Actual Expenditures by Assurance Area
30,181,066Standards and Assessments
7,675,767Great Teachers and Leaders
49,480,467Turning Around Lowest Performing Schools
1,210,985,339Mandatory Costs of Doing Business
13,791,476Other items deemed necessary by the Local Board of Education
Actual Expenditure Examples
Salaries, contracted services, materials and supplies to support CEIS initiative 8,238,005
Supports various school based programs to improve academic achievement for students with special needs
11,540,649
Contracted Services 3,966,122
Support for Priority and Focus Schools 7,917,114
School Based Expenditures 29,426,446
Contingency 5,000,000
Materials 17,958,813
Debt Service 21,115,000
Equipments 25,769,744
Utilities 35,945,384
Transfers 44,805,722
Contractual Services 172,298,100
Benefits 242,253,977
Salaries and Wages 635,754,941
Third Party Billing 12,910,000
Note: The Current and Prior Year Reports reflects each school system's total budget and allocates expenditures to one of four assurance areas. Expenditures are illustrative of those reported in the Master Plan Update Finance Section and are not intended to sum to the total. The reports are not intended to be prepared according to GAAP. Aggregation prepared by MSDE.
Baltimore City Public Schools
12
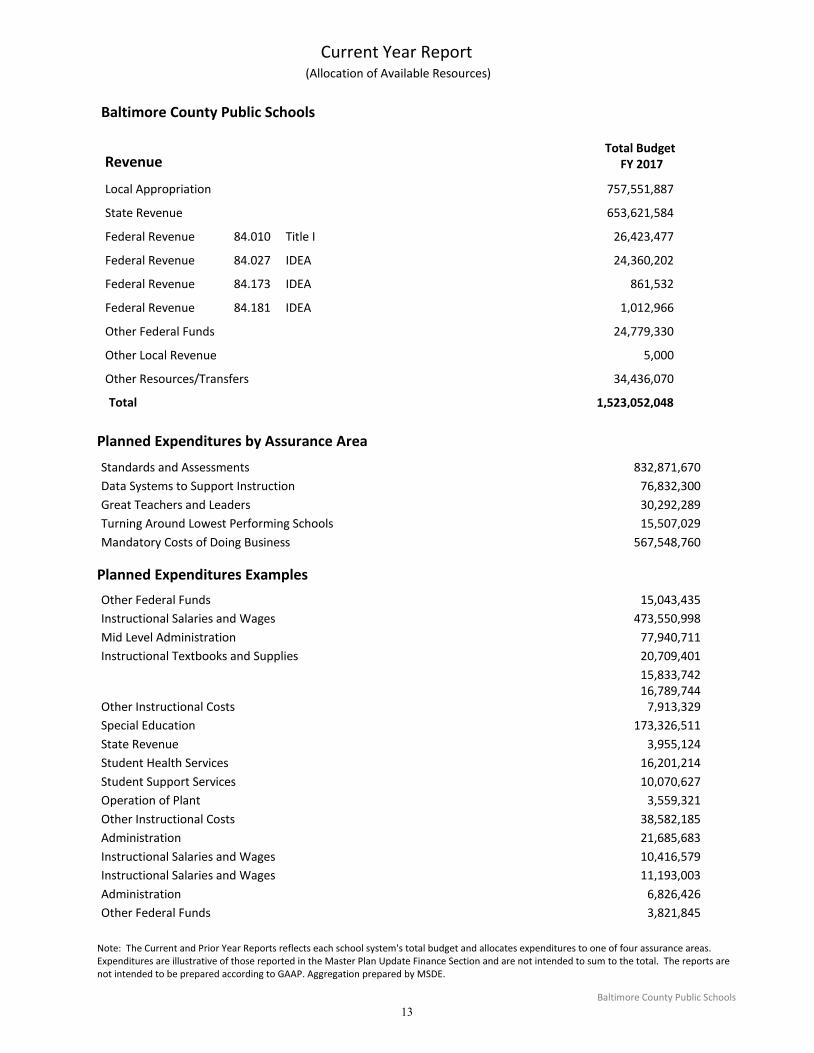
Baltimore County Public Schools
RevenueTotal Budget
FY 2017
Current Year Report (Allocation of Available Resources)
757,551,887Local Appropriation
653,621,584State Revenue
26,423,477Federal Revenue 84.010 Title I
24,360,202Federal Revenue 84.027 IDEA
861,532Federal Revenue 84.173 IDEA
1,012,966Federal Revenue 84.181 IDEA
24,779,330Other Federal Funds
5,000Other Local Revenue
34,436,070Other Resources/Transfers
1,523,052,048Total
Planned Expenditures by Assurance Area
Standards and Assessments 832,871,670
Data Systems to Support Instruction 76,832,300
Great Teachers and Leaders 30,292,289
Turning Around Lowest Performing Schools 15,507,029
Mandatory Costs of Doing Business 567,548,760
Planned Expenditures Examples
Other Federal Funds 15,043,435
Instructional Salaries and Wages 473,550,998
Mid Level Administration 77,940,711
Instructional Textbooks and Supplies 20,709,401
15,833,74216,789,744
Other Instructional Costs 7,913,329
Special Education 173,326,511
State Revenue 3,955,124
Student Health Services 16,201,214
Student Support Services 10,070,627
Operation of Plant 3,559,321
Other Instructional Costs 38,582,185
Administration 21,685,683
Instructional Salaries and Wages 10,416,579
Instructional Salaries and Wages 11,193,003
Administration 6,826,426
Other Federal Funds 3,821,845
Note: The Current and Prior Year Reports reflects each school system's total budget and allocates expenditures to one of four assurance areas. Expenditures are illustrative of those reported in the Master Plan Update Finance Section and are not intended to sum to the total. The reports are not intended to be prepared according to GAAP. Aggregation prepared by MSDE.
Baltimore County Public Schools
13
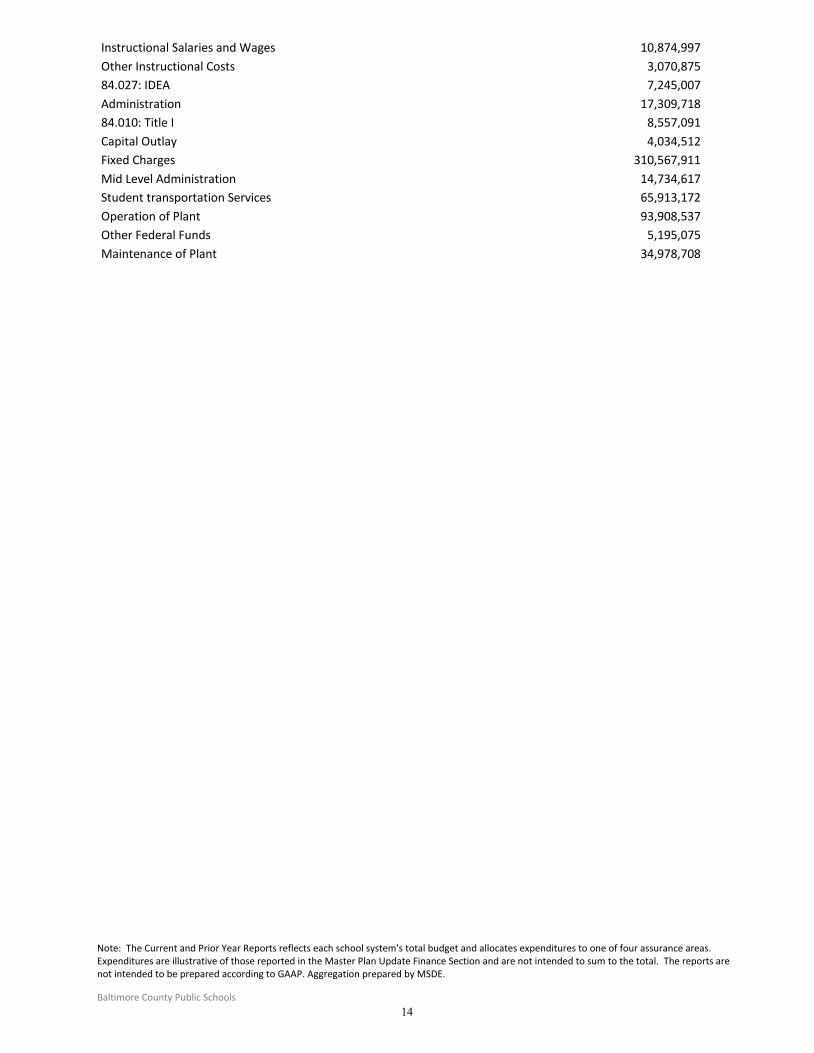
Instructional Salaries and Wages 10,874,997
Other Instructional Costs 3,070,875
84.027: IDEA 7,245,007
Administration 17,309,718
84.010: Title I 8,557,091
Capital Outlay 4,034,512
Fixed Charges 310,567,911
Mid Level Administration 14,734,617
Student transportation Services 65,913,172
Operation of Plant 93,908,537
Other Federal Funds 5,195,075
Maintenance of Plant 34,978,708
Prior Year Comparison Report
Note: The Current and Prior Year Reports reflects each school system's total budget and allocates expenditures to one of four assurance areas. Expenditures are illustrative of those reported in the Master Plan Update Finance Section and are not intended to sum to the total. The reports are not intended to be prepared according to GAAP. Aggregation prepared by MSDE.
Baltimore County Public Schools
14

Original Budget
7/1/2015
Final Budget
6/30/2016 ChangeRevenue
Baltimore County Public Schools
Prior Year Comparison Report (Planned v. Actual)
748,849,077 711,376,797 -37,472,280Local Appropriation
626,932,721 623,501,731 -3,430,990State Revenue
0 98,405 98,405Federal ARRA Funds 84.395 Race to the Top
25,816,096 26,382,397 566,301Federal Revenue 84.010 Title I
23,475,204 24,101,110 625,906Federal Revenue 84.027 IDEA
1,058,956 981,807 -77,149Federal Revenue 84.173 IDEA
971,821 909,139 -62,682Federal Revenue 84.181 IDEA
21,342,129 17,610,548 -3,731,581Other Federal Funds
0 14,704 14,704Other Local Revenue
31,178,486 26,871,641 -4,306,845Other Resources/Transfers
1,479,624,490 -47,776,211Total 1,431,848,279
Actual Expenditures by Assurance Area
806,626,031Standards and Assessments
54,817,525Data Systems to Support Instruction
23,127,126Great Teachers and Leaders
8,204,626Turning Around Lowest Performing Schools
539,072,971Mandatory Costs of Doing Business
Actual Expenditure Examples
Student Support Services 8,866,656
Other Instructional Costs 9,283,745
Other Federal Funds 9,371,616
Student Health Services 15,006,003
IDEA 15,218,023
Title I 18,661,263
Instructional Textbooks and Supplies 22,998,166
Mid Level Administration 71,797,342
Special Education 167,327,245
Instructional Salaries and Wages 463,618,524
Operation of Plant 3,091,827
Instructional Salaries and Wages 7,949,731
Administration 19,118,313
Other Instructional Costs 21,896,229
Other Federal Funds 3,718,765
Instructional Salaries and Wages 4,421,604
Administration 6,155,721
Other Instructional Costs 3,116,541
Note: The Current and Prior Year Reports reflects each school system's total budget and allocates expenditures to one of four assurance areas. Expenditures are illustrative of those reported in the Master Plan Update Finance Section and are not intended to sum to the total. The reports are not intended to be prepared according to GAAP. Aggregation prepared by MSDE.
Baltimore County Public Schools
15
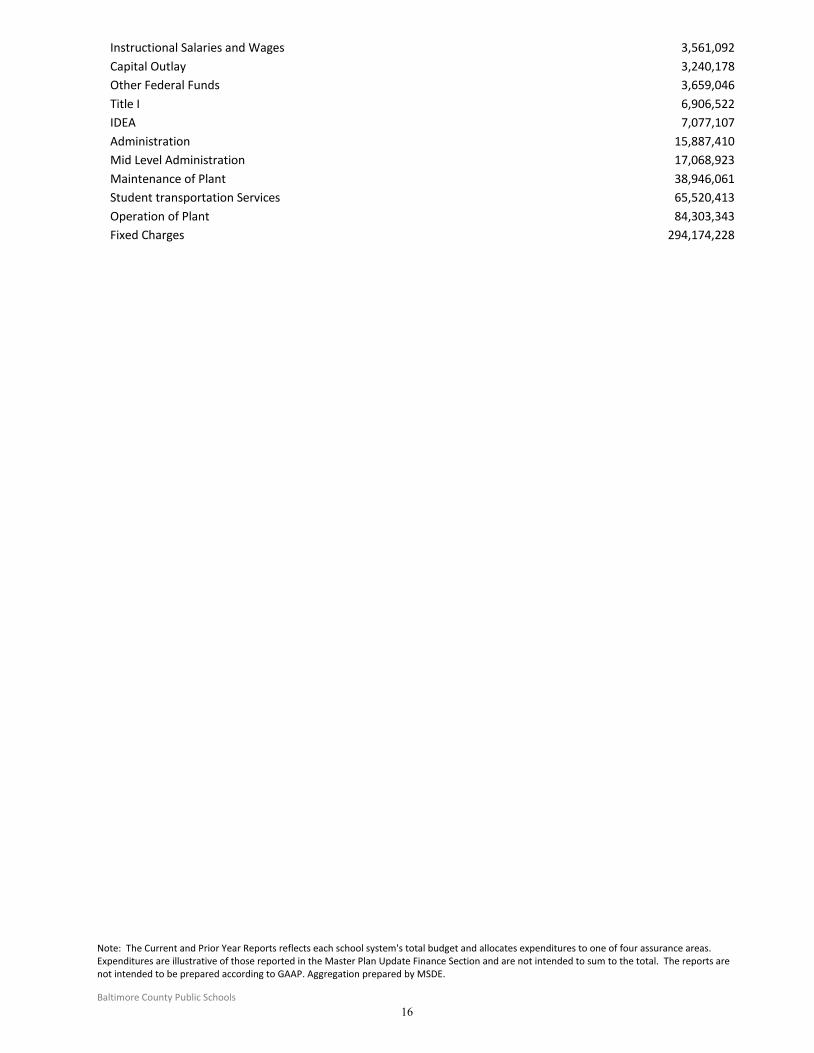
Instructional Salaries and Wages 3,561,092
Capital Outlay 3,240,178
Other Federal Funds 3,659,046
Title I 6,906,522
IDEA 7,077,107
Administration 15,887,410
Mid Level Administration 17,068,923
Maintenance of Plant 38,946,061
Student transportation Services 65,520,413
Operation of Plant 84,303,343
Fixed Charges 294,174,228
Note: The Current and Prior Year Reports reflects each school system's total budget and allocates expenditures to one of four assurance areas. Expenditures are illustrative of those reported in the Master Plan Update Finance Section and are not intended to sum to the total. The reports are not intended to be prepared according to GAAP. Aggregation prepared by MSDE.
Baltimore County Public Schools
16
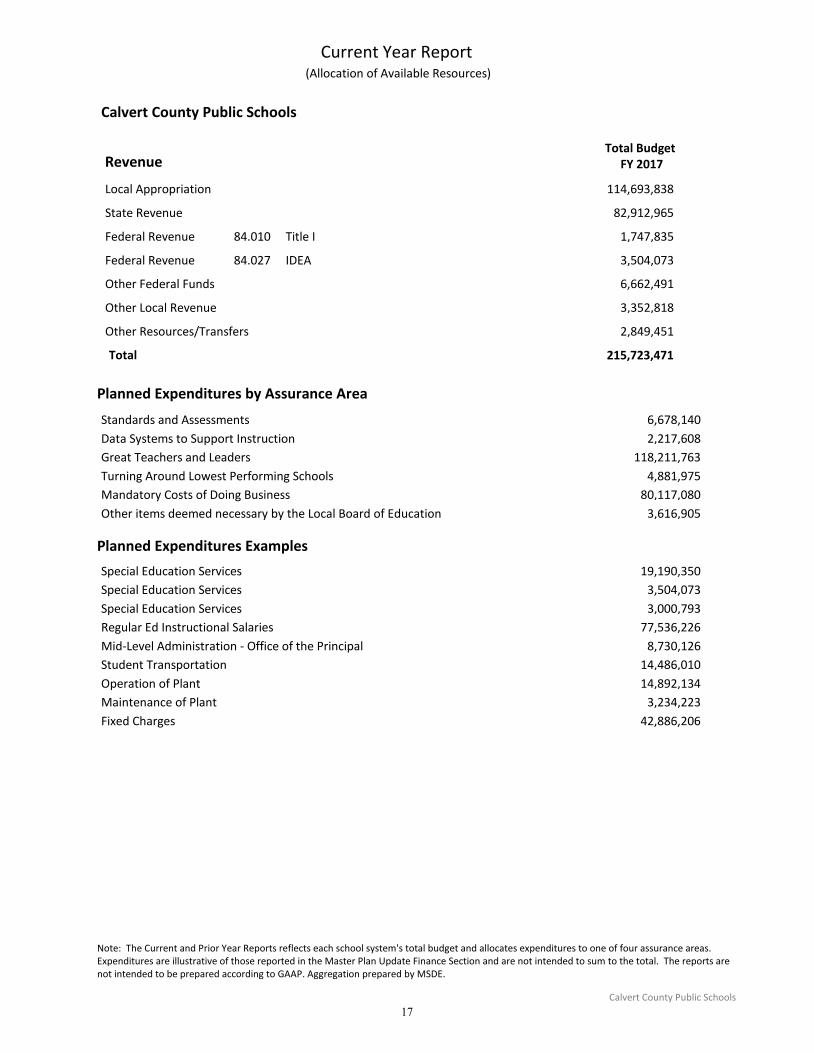
Calvert County Public Schools
RevenueTotal Budget
FY 2017
Current Year Report (Allocation of Available Resources)
114,693,838Local Appropriation
82,912,965State Revenue
1,747,835Federal Revenue 84.010 Title I
3,504,073Federal Revenue 84.027 IDEA
6,662,491Other Federal Funds
3,352,818Other Local Revenue
2,849,451Other Resources/Transfers
215,723,471Total
Planned Expenditures by Assurance Area
Standards and Assessments 6,678,140
Data Systems to Support Instruction 2,217,608
Great Teachers and Leaders 118,211,763
Turning Around Lowest Performing Schools 4,881,975
Mandatory Costs of Doing Business 80,117,080
Other items deemed necessary by the Local Board of Education 3,616,905
Planned Expenditures Examples
Special Education Services 19,190,350
Special Education Services 3,504,073
Special Education Services 3,000,793
Regular Ed Instructional Salaries 77,536,226
Mid-Level Administration - Office of the Principal 8,730,126
Student Transportation 14,486,010
Operation of Plant 14,892,134
Maintenance of Plant 3,234,223
Fixed Charges 42,886,206
Prior Year Comparison Report
Note: The Current and Prior Year Reports reflects each school system's total budget and allocates expenditures to one of four assurance areas. Expenditures are illustrative of those reported in the Master Plan Update Finance Section and are not intended to sum to the total. The reports are not intended to be prepared according to GAAP. Aggregation prepared by MSDE.
Calvert County Public Schools
17

Original Budget
7/1/2015
Final Budget
6/30/2016 ChangeRevenue
Calvert County Public Schools
Prior Year Comparison Report (Planned v. Actual)
114,876,122 114,876,122 0Local Appropriation
79,752,905 79,804,358 51,453State Revenue
1,714,675 1,653,233 -61,442Federal Revenue 84.010 Title I
3,373,952 3,029,106 -344,846Federal Revenue 84.027 IDEA
5,849,077 3,783,818 -2,065,259Other Federal Funds
2,185,759 4,554,364 2,368,605Other Local Revenue
2,522,375 623,180 -1,899,195Other Resources/Transfers
210,274,865 -1,950,684Total 208,324,181
Actual Expenditures by Assurance Area
6,671,284Standards and Assessments
2,300,228Data Systems to Support Instruction
113,475,986Great Teachers and Leaders
3,811,552Turning Around Lowest Performing Schools
77,627,841Mandatory Costs of Doing Business
4,437,290Other items deemed necessary by the Local Board of Education
Actual Expenditure Examples
Special Education Services 3,029,106
Mid-Level Administration - Office of the Principal 8,684,116
Special Education Services 19,114,885
Regular Ed Instructional Salaries 75,732,238
Maintenance of Plant 3,155,405
Student Transportation 13,786,107
Operation of Plant 14,377,020
Fixed Charges 41,480,218
Note: The Current and Prior Year Reports reflects each school system's total budget and allocates expenditures to one of four assurance areas. Expenditures are illustrative of those reported in the Master Plan Update Finance Section and are not intended to sum to the total. The reports are not intended to be prepared according to GAAP. Aggregation prepared by MSDE.
Calvert County Public Schools
18
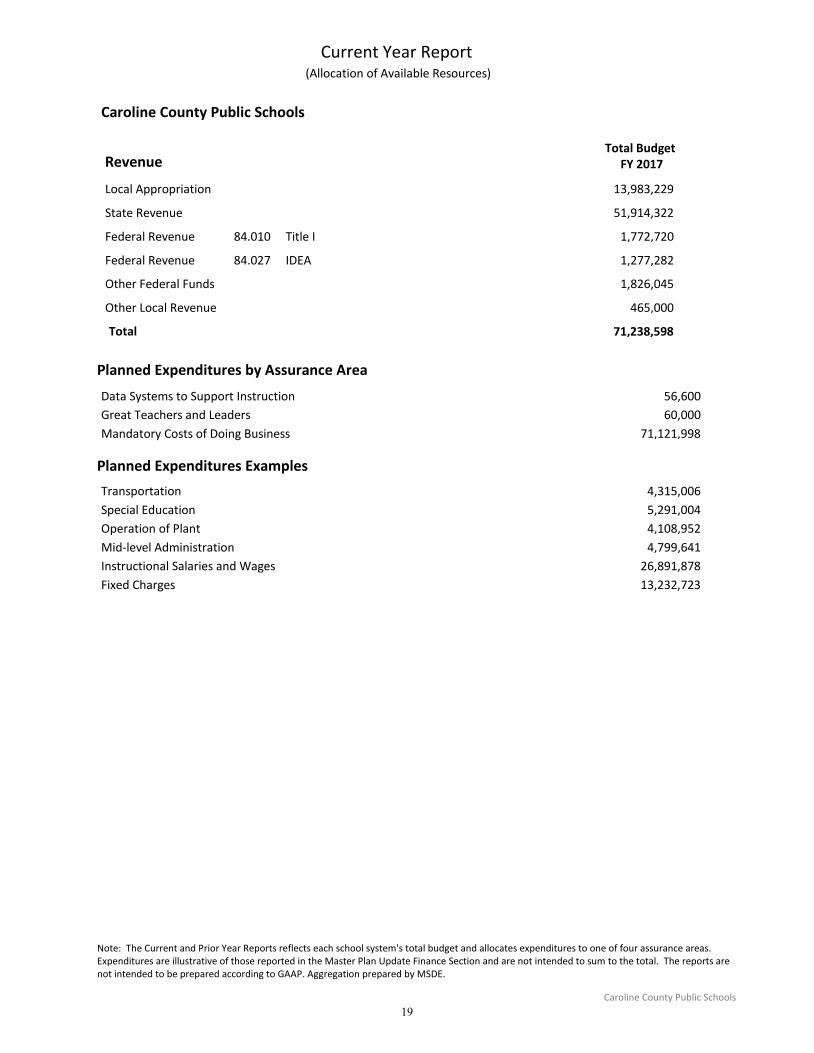
Caroline County Public Schools
RevenueTotal Budget
FY 2017
Current Year Report (Allocation of Available Resources)
13,983,229Local Appropriation
51,914,322State Revenue
1,772,720Federal Revenue 84.010 Title I
1,277,282Federal Revenue 84.027 IDEA
1,826,045Other Federal Funds
465,000Other Local Revenue
71,238,598Total
Planned Expenditures by Assurance Area
Data Systems to Support Instruction 56,600
Great Teachers and Leaders 60,000
Mandatory Costs of Doing Business 71,121,998
Planned Expenditures Examples
Transportation 4,315,006
Special Education 5,291,004
Operation of Plant 4,108,952
Mid-level Administration 4,799,641
Instructional Salaries and Wages 26,891,878
Fixed Charges 13,232,723
Prior Year Comparison Report
Note: The Current and Prior Year Reports reflects each school system's total budget and allocates expenditures to one of four assurance areas. Expenditures are illustrative of those reported in the Master Plan Update Finance Section and are not intended to sum to the total. The reports are not intended to be prepared according to GAAP. Aggregation prepared by MSDE.
Caroline County Public Schools
19
Original Budget
7/1/2015
Final Budget
6/30/2016 ChangeRevenue
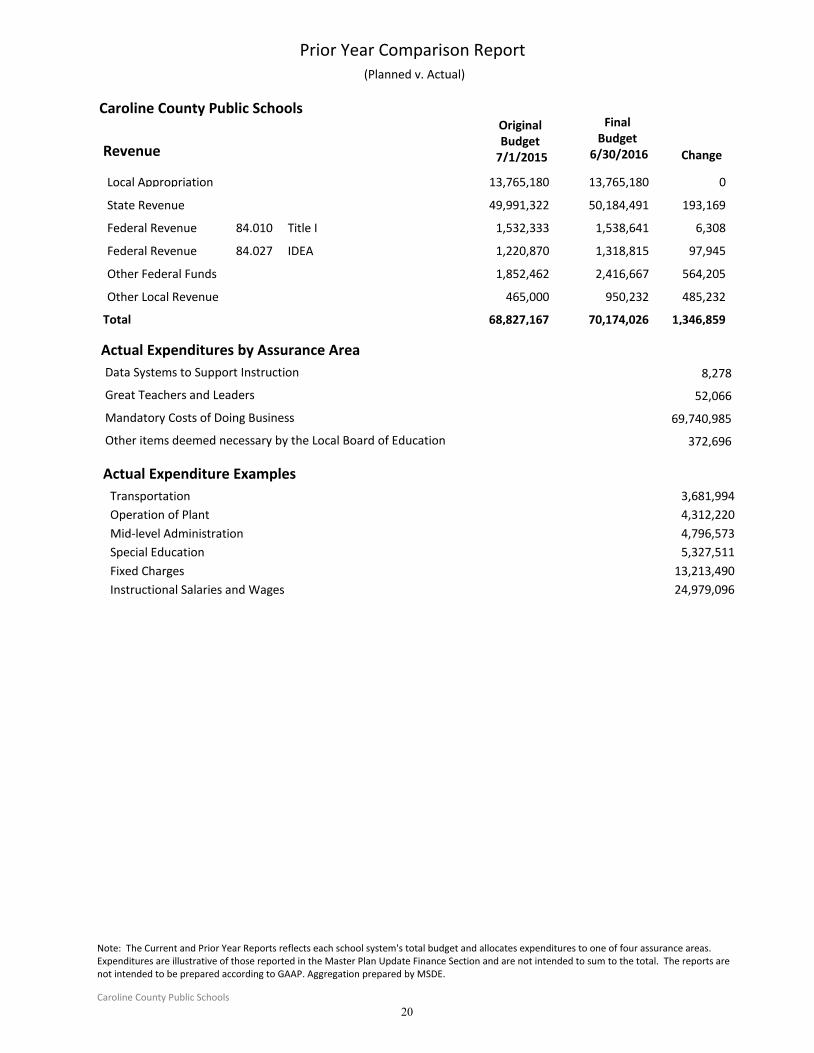
Caroline County Public Schools
Prior Year Comparison Report (Planned v. Actual)
13,765,180 13,765,180 0Local Appropriation
49,991,322 50,184,491 193,169State Revenue
1,532,333 1,538,641 6,308Federal Revenue 84.010 Title I
1,220,870 1,318,815 97,945Federal Revenue 84.027 IDEA
1,852,462 2,416,667 564,205Other Federal Funds
465,000 950,232 485,232Other Local Revenue
68,827,167 1,346,859Total 70,174,026
Actual Expenditures by Assurance Area
8,278Data Systems to Support Instruction
52,066Great Teachers and Leaders
69,740,985Mandatory Costs of Doing Business
372,696Other items deemed necessary by the Local Board of Education
Actual Expenditure Examples
Transportation 3,681,994
Operation of Plant 4,312,220
Mid-level Administration 4,796,573
Special Education 5,327,511
Fixed Charges 13,213,490
Instructional Salaries and Wages 24,979,096
Note: The Current and Prior Year Reports reflects each school system's total budget and allocates expenditures to one of four assurance areas. Expenditures are illustrative of those reported in the Master Plan Update Finance Section and are not intended to sum to the total. The reports are not intended to be prepared according to GAAP. Aggregation prepared by MSDE.
Caroline County Public Schools
20
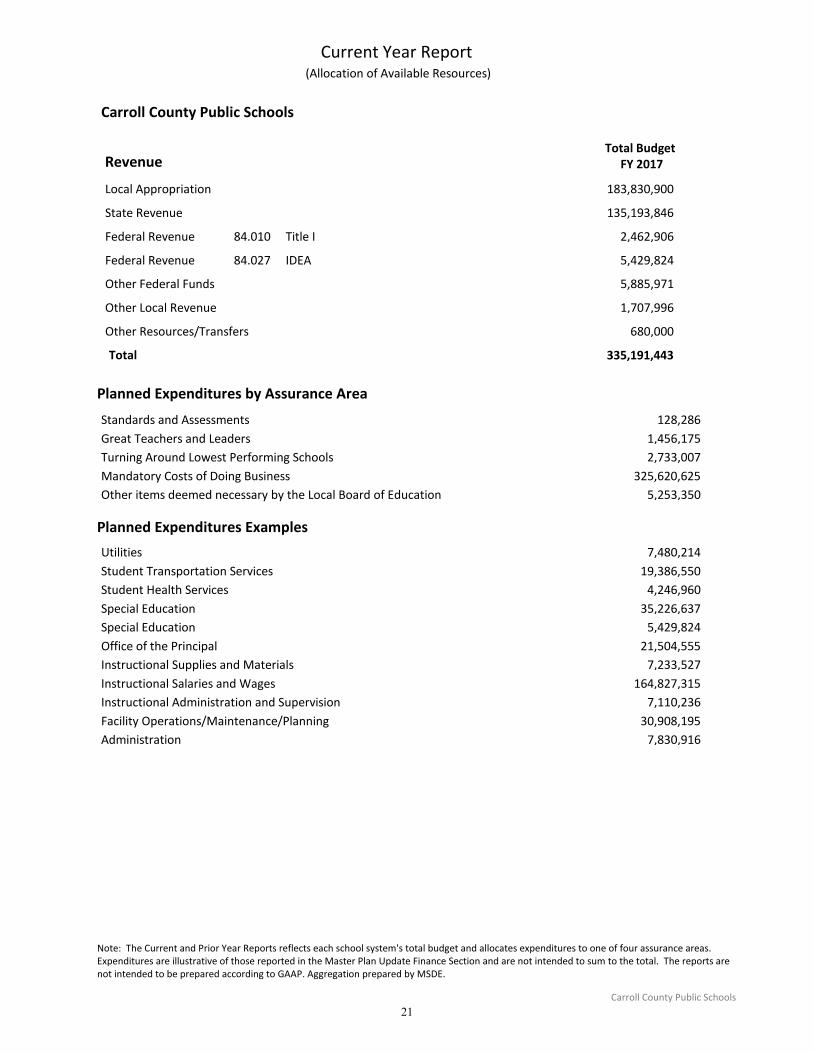
Carroll County Public Schools
RevenueTotal Budget
FY 2017
Current Year Report (Allocation of Available Resources)
183,830,900Local Appropriation
135,193,846State Revenue
2,462,906Federal Revenue 84.010 Title I
5,429,824Federal Revenue 84.027 IDEA
5,885,971Other Federal Funds
1,707,996Other Local Revenue
680,000Other Resources/Transfers
335,191,443Total
Planned Expenditures by Assurance Area
Standards and Assessments 128,286
Great Teachers and Leaders 1,456,175
Turning Around Lowest Performing Schools 2,733,007
Mandatory Costs of Doing Business 325,620,625
Other items deemed necessary by the Local Board of Education 5,253,350
Planned Expenditures Examples
Utilities 7,480,214
Student Transportation Services 19,386,550
Student Health Services 4,246,960
Special Education 35,226,637
Special Education 5,429,824
Office of the Principal 21,504,555
Instructional Supplies and Materials 7,233,527
Instructional Salaries and Wages 164,827,315
Instructional Administration and Supervision 7,110,236
Facility Operations/Maintenance/Planning 30,908,195
Administration 7,830,916
Prior Year Comparison Report
Note: The Current and Prior Year Reports reflects each school system's total budget and allocates expenditures to one of four assurance areas. Expenditures are illustrative of those reported in the Master Plan Update Finance Section and are not intended to sum to the total. The reports are not intended to be prepared according to GAAP. Aggregation prepared by MSDE.
Carroll County Public Schools
21
Original Budget
7/1/2015
Final Budget
6/30/2016 ChangeRevenue
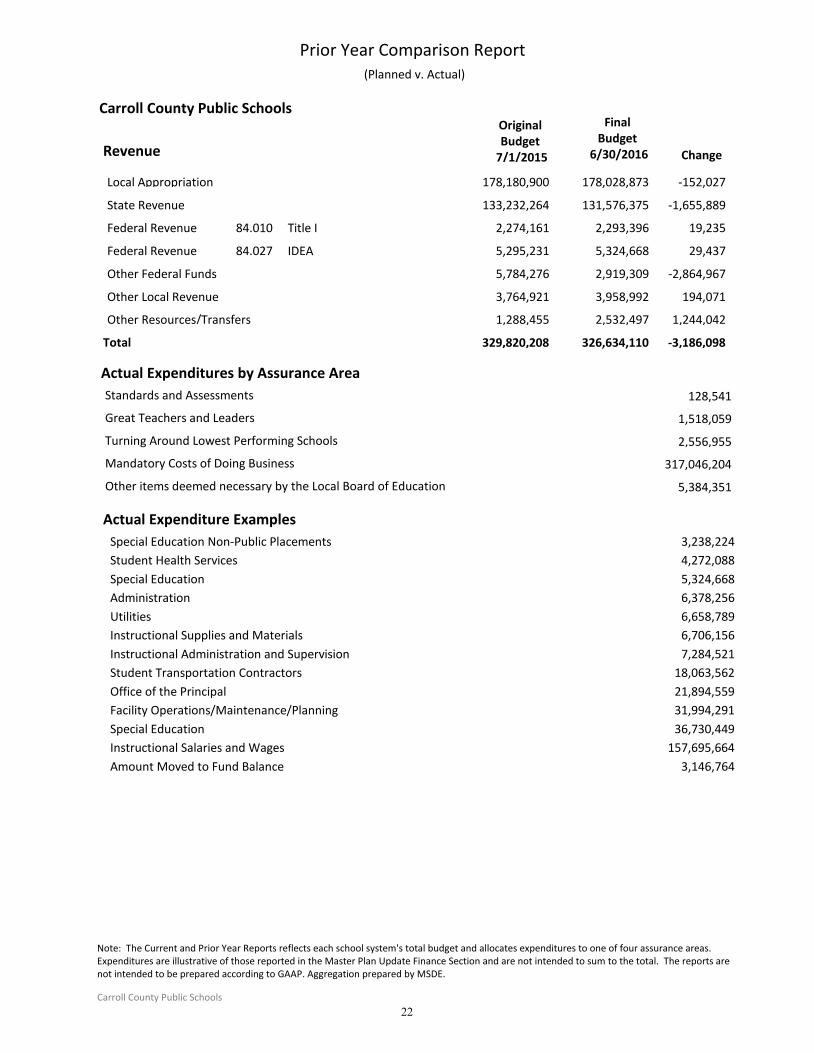
Carroll County Public Schools
Prior Year Comparison Report (Planned v. Actual)
178,180,900 178,028,873 -152,027Local Appropriation
133,232,264 131,576,375 -1,655,889State Revenue
2,274,161 2,293,396 19,235Federal Revenue 84.010 Title I
5,295,231 5,324,668 29,437Federal Revenue 84.027 IDEA
5,784,276 2,919,309 -2,864,967Other Federal Funds
3,764,921 3,958,992 194,071Other Local Revenue
1,288,455 2,532,497 1,244,042Other Resources/Transfers
329,820,208 -3,186,098Total 326,634,110
Actual Expenditures by Assurance Area
128,541Standards and Assessments
1,518,059Great Teachers and Leaders
2,556,955Turning Around Lowest Performing Schools
317,046,204Mandatory Costs of Doing Business
5,384,351Other items deemed necessary by the Local Board of Education
Actual Expenditure Examples
Special Education Non-Public Placements 3,238,224
Student Health Services 4,272,088
Special Education 5,324,668
Administration 6,378,256
Utilities 6,658,789
Instructional Supplies and Materials 6,706,156
Instructional Administration and Supervision 7,284,521
Student Transportation Contractors 18,063,562
Office of the Principal 21,894,559
Facility Operations/Maintenance/Planning 31,994,291
Special Education 36,730,449
Instructional Salaries and Wages 157,695,664
Amount Moved to Fund Balance 3,146,764
Note: The Current and Prior Year Reports reflects each school system's total budget and allocates expenditures to one of four assurance areas. Expenditures are illustrative of those reported in the Master Plan Update Finance Section and are not intended to sum to the total. The reports are not intended to be prepared according to GAAP. Aggregation prepared by MSDE.
Carroll County Public Schools
22
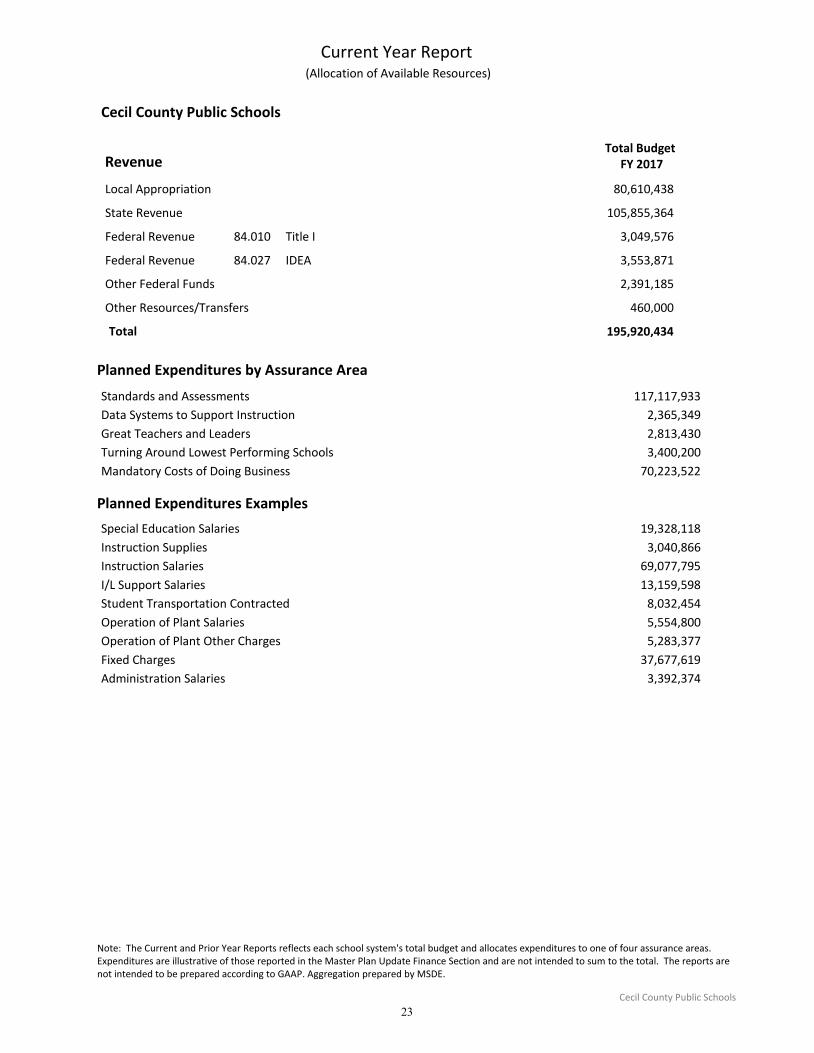
Cecil County Public Schools
RevenueTotal Budget
FY 2017
Current Year Report (Allocation of Available Resources)
80,610,438Local Appropriation
105,855,364State Revenue
3,049,576Federal Revenue 84.010 Title I
3,553,871Federal Revenue 84.027 IDEA
2,391,185Other Federal Funds
460,000Other Resources/Transfers
195,920,434Total
Planned Expenditures by Assurance Area
Standards and Assessments 117,117,933
Data Systems to Support Instruction 2,365,349
Great Teachers and Leaders 2,813,430
Turning Around Lowest Performing Schools 3,400,200
Mandatory Costs of Doing Business 70,223,522
Planned Expenditures Examples
Special Education Salaries 19,328,118
Instruction Supplies 3,040,866
Instruction Salaries 69,077,795
I/L Support Salaries 13,159,598
Student Transportation Contracted 8,032,454
Operation of Plant Salaries 5,554,800
Operation of Plant Other Charges 5,283,377
Fixed Charges 37,677,619
Administration Salaries 3,392,374
Prior Year Comparison Report
Note: The Current and Prior Year Reports reflects each school system's total budget and allocates expenditures to one of four assurance areas. Expenditures are illustrative of those reported in the Master Plan Update Finance Section and are not intended to sum to the total. The reports are not intended to be prepared according to GAAP. Aggregation prepared by MSDE.
Cecil County Public Schools
23
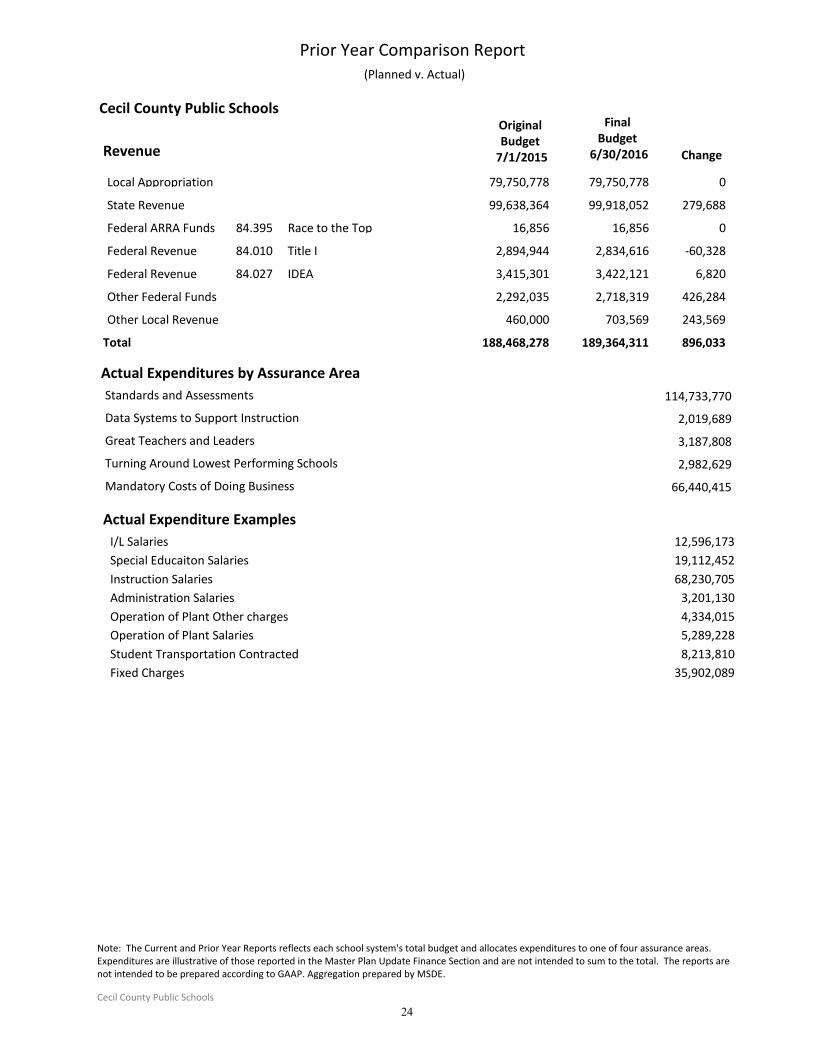
Original Budget
7/1/2015
Final Budget
6/30/2016 ChangeRevenue
Cecil County Public Schools
Prior Year Comparison Report (Planned v. Actual)
79,750,778 79,750,778 0Local Appropriation
99,638,364 99,918,052 279,688State Revenue
16,856 16,856 0Federal ARRA Funds 84.395 Race to the Top
2,894,944 2,834,616 -60,328Federal Revenue 84.010 Title I
3,415,301 3,422,121 6,820Federal Revenue 84.027 IDEA
2,292,035 2,718,319 426,284Other Federal Funds
460,000 703,569 243,569Other Local Revenue
188,468,278 896,033Total 189,364,311
Actual Expenditures by Assurance Area
114,733,770Standards and Assessments
2,019,689Data Systems to Support Instruction
3,187,808Great Teachers and Leaders
2,982,629Turning Around Lowest Performing Schools
66,440,415Mandatory Costs of Doing Business
Actual Expenditure Examples
I/L Salaries 12,596,173
Special Educaiton Salaries 19,112,452
Instruction Salaries 68,230,705
Administration Salaries 3,201,130
Operation of Plant Other charges 4,334,015
Operation of Plant Salaries 5,289,228
Student Transportation Contracted 8,213,810
Fixed Charges 35,902,089
Note: The Current and Prior Year Reports reflects each school system's total budget and allocates expenditures to one of four assurance areas. Expenditures are illustrative of those reported in the Master Plan Update Finance Section and are not intended to sum to the total. The reports are not intended to be prepared according to GAAP. Aggregation prepared by MSDE.
Cecil County Public Schools
24
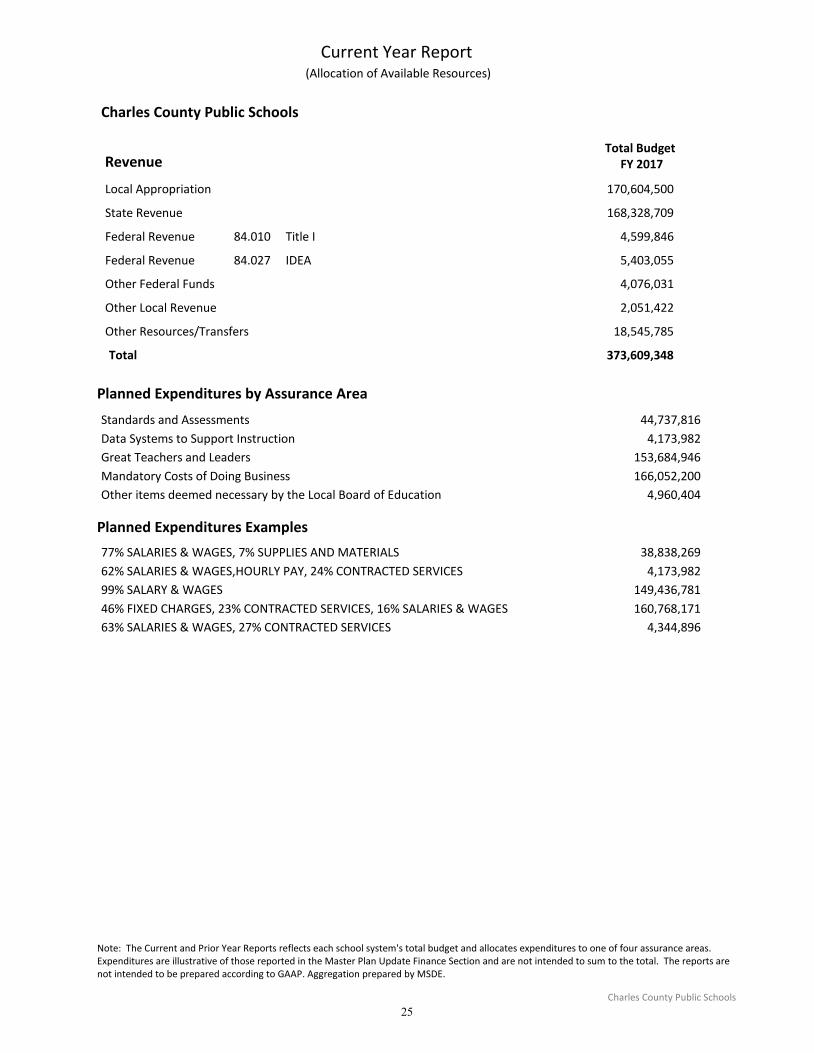
Charles County Public Schools
RevenueTotal Budget
FY 2017
Current Year Report (Allocation of Available Resources)
170,604,500Local Appropriation
168,328,709State Revenue
4,599,846Federal Revenue 84.010 Title I
5,403,055Federal Revenue 84.027 IDEA
4,076,031Other Federal Funds
2,051,422Other Local Revenue
18,545,785Other Resources/Transfers
373,609,348Total
Planned Expenditures by Assurance Area
Standards and Assessments 44,737,816
Data Systems to Support Instruction 4,173,982
Great Teachers and Leaders 153,684,946
Mandatory Costs of Doing Business 166,052,200
Other items deemed necessary by the Local Board of Education 4,960,404
Planned Expenditures Examples
77% SALARIES & WAGES, 7% SUPPLIES AND MATERIALS 38,838,269
62% SALARIES & WAGES,HOURLY PAY, 24% CONTRACTED SERVICES 4,173,982
99% SALARY & WAGES 149,436,781
46% FIXED CHARGES, 23% CONTRACTED SERVICES, 16% SALARIES & WAGES 160,768,171
63% SALARIES & WAGES, 27% CONTRACTED SERVICES 4,344,896
Prior Year Comparison Report
Note: The Current and Prior Year Reports reflects each school system's total budget and allocates expenditures to one of four assurance areas. Expenditures are illustrative of those reported in the Master Plan Update Finance Section and are not intended to sum to the total. The reports are not intended to be prepared according to GAAP. Aggregation prepared by MSDE.
Charles County Public Schools
25
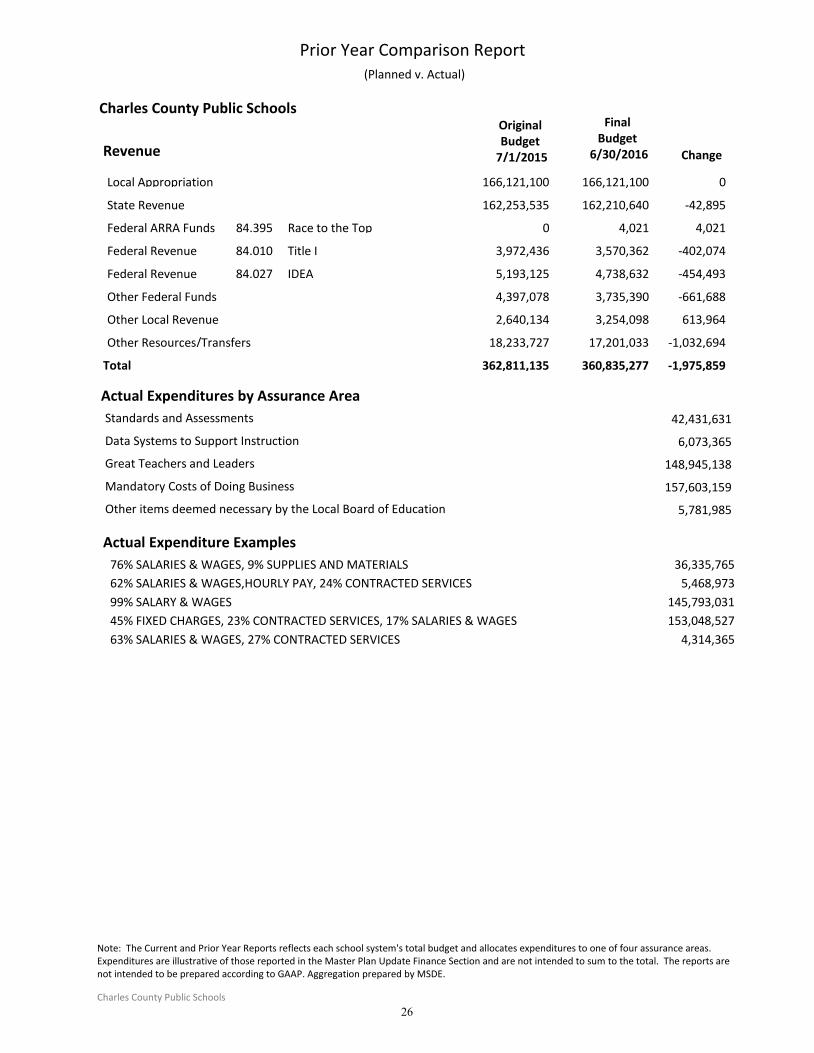
Original Budget
7/1/2015
Final Budget
6/30/2016 ChangeRevenue
Charles County Public Schools
Prior Year Comparison Report (Planned v. Actual)
166,121,100 166,121,100 0Local Appropriation
162,253,535 162,210,640 -42,895State Revenue
0 4,021 4,021Federal ARRA Funds 84.395 Race to the Top
3,972,436 3,570,362 -402,074Federal Revenue 84.010 Title I
5,193,125 4,738,632 -454,493Federal Revenue 84.027 IDEA
4,397,078 3,735,390 -661,688Other Federal Funds
2,640,134 3,254,098 613,964Other Local Revenue
18,233,727 17,201,033 -1,032,694Other Resources/Transfers
362,811,135 -1,975,859Total 360,835,277
Actual Expenditures by Assurance Area
42,431,631Standards and Assessments
6,073,365Data Systems to Support Instruction
148,945,138Great Teachers and Leaders
157,603,159Mandatory Costs of Doing Business
5,781,985Other items deemed necessary by the Local Board of Education
Actual Expenditure Examples
76% SALARIES & WAGES, 9% SUPPLIES AND MATERIALS 36,335,765
62% SALARIES & WAGES,HOURLY PAY, 24% CONTRACTED SERVICES 5,468,973
99% SALARY & WAGES 145,793,031
45% FIXED CHARGES, 23% CONTRACTED SERVICES, 17% SALARIES & WAGES 153,048,527
63% SALARIES & WAGES, 27% CONTRACTED SERVICES 4,314,365
Note: The Current and Prior Year Reports reflects each school system's total budget and allocates expenditures to one of four assurance areas. Expenditures are illustrative of those reported in the Master Plan Update Finance Section and are not intended to sum to the total. The reports are not intended to be prepared according to GAAP. Aggregation prepared by MSDE.
Charles County Public Schools
26
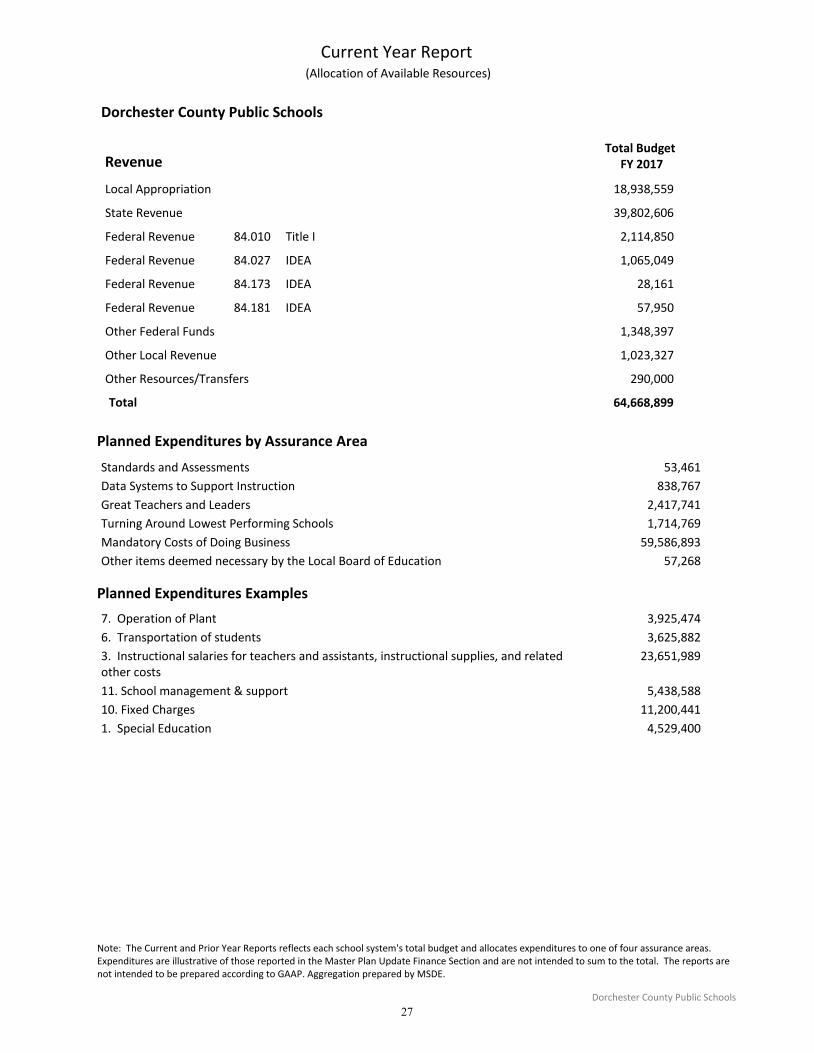
Dorchester County Public Schools
RevenueTotal Budget
FY 2017
Current Year Report (Allocation of Available Resources)
18,938,559Local Appropriation
39,802,606State Revenue
2,114,850Federal Revenue 84.010 Title I
1,065,049Federal Revenue 84.027 IDEA
28,161Federal Revenue 84.173 IDEA
57,950Federal Revenue 84.181 IDEA
1,348,397Other Federal Funds
1,023,327Other Local Revenue
290,000Other Resources/Transfers
64,668,899Total
Planned Expenditures by Assurance Area
Standards and Assessments 53,461
Data Systems to Support Instruction 838,767
Great Teachers and Leaders 2,417,741
Turning Around Lowest Performing Schools 1,714,769
Mandatory Costs of Doing Business 59,586,893
Other items deemed necessary by the Local Board of Education 57,268
Planned Expenditures Examples
7. Operation of Plant 3,925,474
6. Transportation of students 3,625,882
3. Instructional salaries for teachers and assistants, instructional supplies, and related other costs
23,651,989
11. School management & support 5,438,588
10. Fixed Charges 11,200,441
1. Special Education 4,529,400
Prior Year Comparison Report
Note: The Current and Prior Year Reports reflects each school system's total budget and allocates expenditures to one of four assurance areas. Expenditures are illustrative of those reported in the Master Plan Update Finance Section and are not intended to sum to the total. The reports are not intended to be prepared according to GAAP. Aggregation prepared by MSDE.
Dorchester County Public Schools
27
Original Budget
7/1/2015
Final Budget
6/30/2016 ChangeRevenue
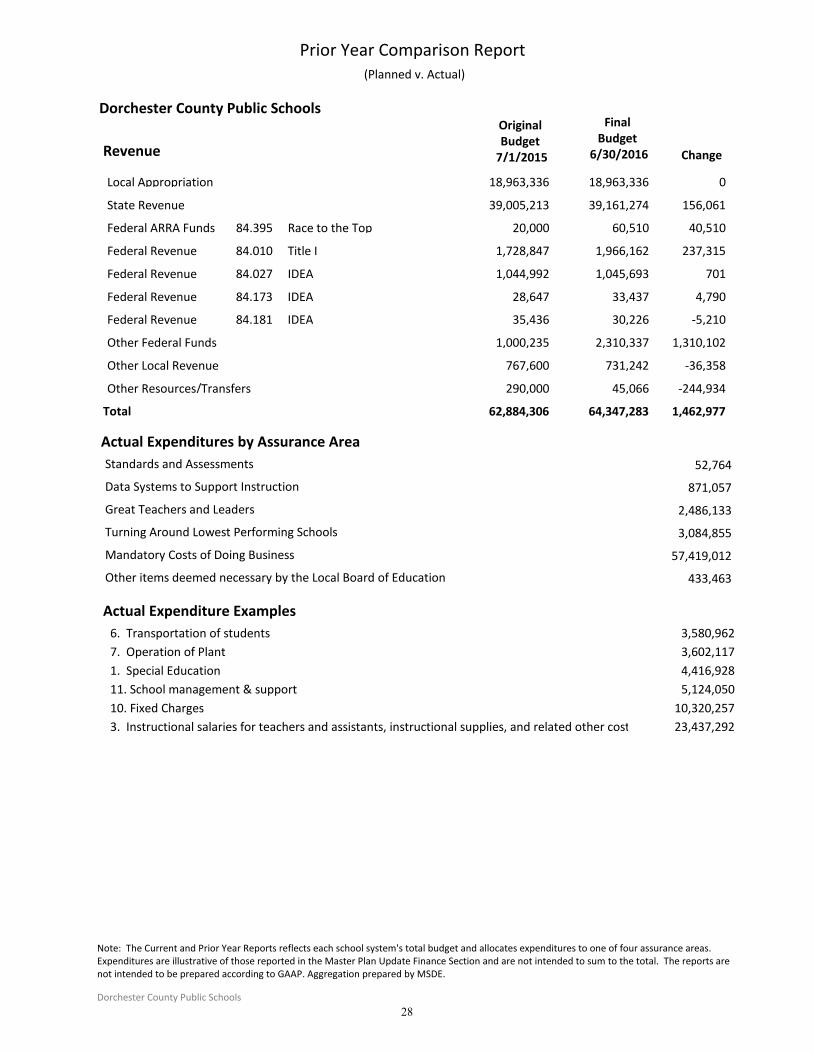
Dorchester County Public Schools
Prior Year Comparison Report (Planned v. Actual)
18,963,336 18,963,336 0Local Appropriation
39,005,213 39,161,274 156,061State Revenue
20,000 60,510 40,510Federal ARRA Funds 84.395 Race to the Top
1,728,847 1,966,162 237,315Federal Revenue 84.010 Title I
1,044,992 1,045,693 701Federal Revenue 84.027 IDEA
28,647 33,437 4,790Federal Revenue 84.173 IDEA
35,436 30,226 -5,210Federal Revenue 84.181 IDEA
1,000,235 2,310,337 1,310,102Other Federal Funds
767,600 731,242 -36,358Other Local Revenue
290,000 45,066 -244,934Other Resources/Transfers
62,884,306 1,462,977Total 64,347,283
Actual Expenditures by Assurance Area
52,764Standards and Assessments
871,057Data Systems to Support Instruction
2,486,133Great Teachers and Leaders
3,084,855Turning Around Lowest Performing Schools
57,419,012Mandatory Costs of Doing Business
433,463Other items deemed necessary by the Local Board of Education
Actual Expenditure Examples
6. Transportation of students 3,580,962
7. Operation of Plant 3,602,117
1. Special Education 4,416,928
11. School management & support 5,124,050
10. Fixed Charges 10,320,257
3. Instructional salaries for teachers and assistants, instructional supplies, and related other costs 23,437,292
Note: The Current and Prior Year Reports reflects each school system's total budget and allocates expenditures to one of four assurance areas. Expenditures are illustrative of those reported in the Master Plan Update Finance Section and are not intended to sum to the total. The reports are not intended to be prepared according to GAAP. Aggregation prepared by MSDE.
Dorchester County Public Schools
28
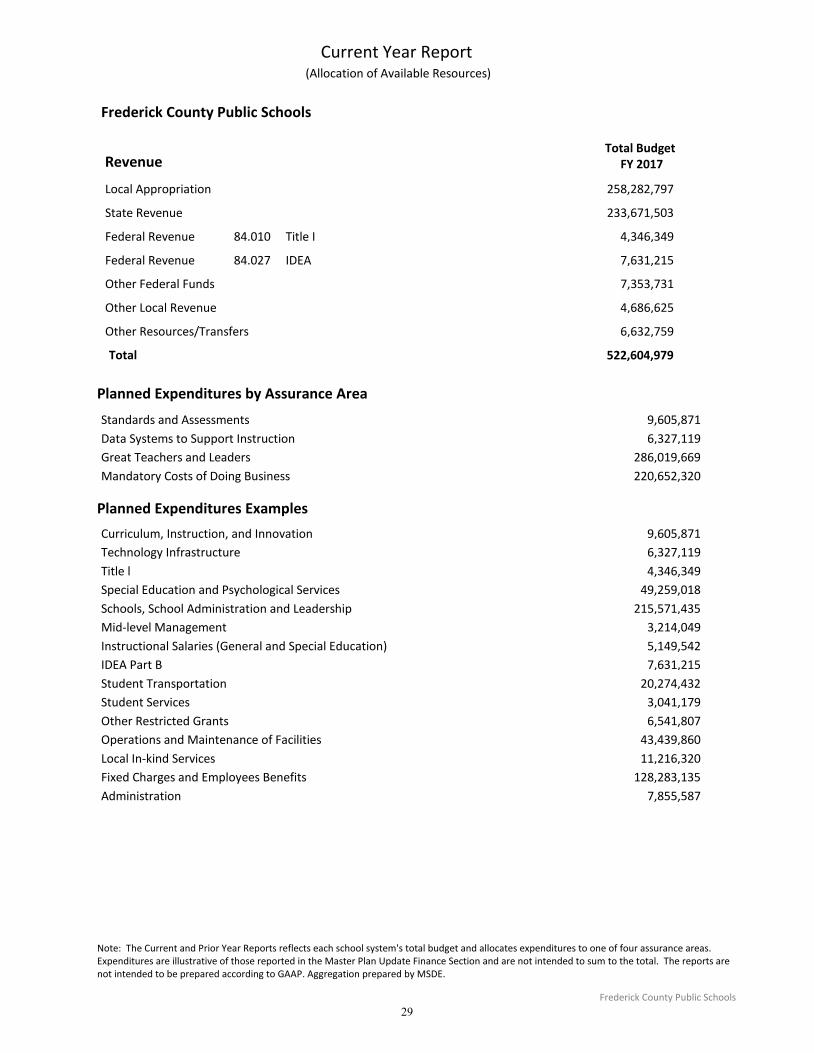
Frederick County Public Schools
RevenueTotal Budget
FY 2017
Current Year Report (Allocation of Available Resources)
258,282,797Local Appropriation
233,671,503State Revenue
4,346,349Federal Revenue 84.010 Title I
7,631,215Federal Revenue 84.027 IDEA
7,353,731Other Federal Funds
4,686,625Other Local Revenue
6,632,759Other Resources/Transfers
522,604,979Total
Planned Expenditures by Assurance Area
Standards and Assessments 9,605,871
Data Systems to Support Instruction 6,327,119
Great Teachers and Leaders 286,019,669
Mandatory Costs of Doing Business 220,652,320
Planned Expenditures Examples
Curriculum, Instruction, and Innovation 9,605,871
Technology Infrastructure 6,327,119
Title l 4,346,349
Special Education and Psychological Services 49,259,018
Schools, School Administration and Leadership 215,571,435
Mid-level Management 3,214,049
Instructional Salaries (General and Special Education) 5,149,542
IDEA Part B 7,631,215
Student Transportation 20,274,432
Student Services 3,041,179
Other Restricted Grants 6,541,807
Operations and Maintenance of Facilities 43,439,860
Local In-kind Services 11,216,320
Fixed Charges and Employees Benefits 128,283,135
Administration 7,855,587
Prior Year Comparison Report
Note: The Current and Prior Year Reports reflects each school system's total budget and allocates expenditures to one of four assurance areas. Expenditures are illustrative of those reported in the Master Plan Update Finance Section and are not intended to sum to the total. The reports are not intended to be prepared according to GAAP. Aggregation prepared by MSDE.
Frederick County Public Schools
29
Original Budget
7/1/2015
Final Budget
6/30/2016 ChangeRevenue
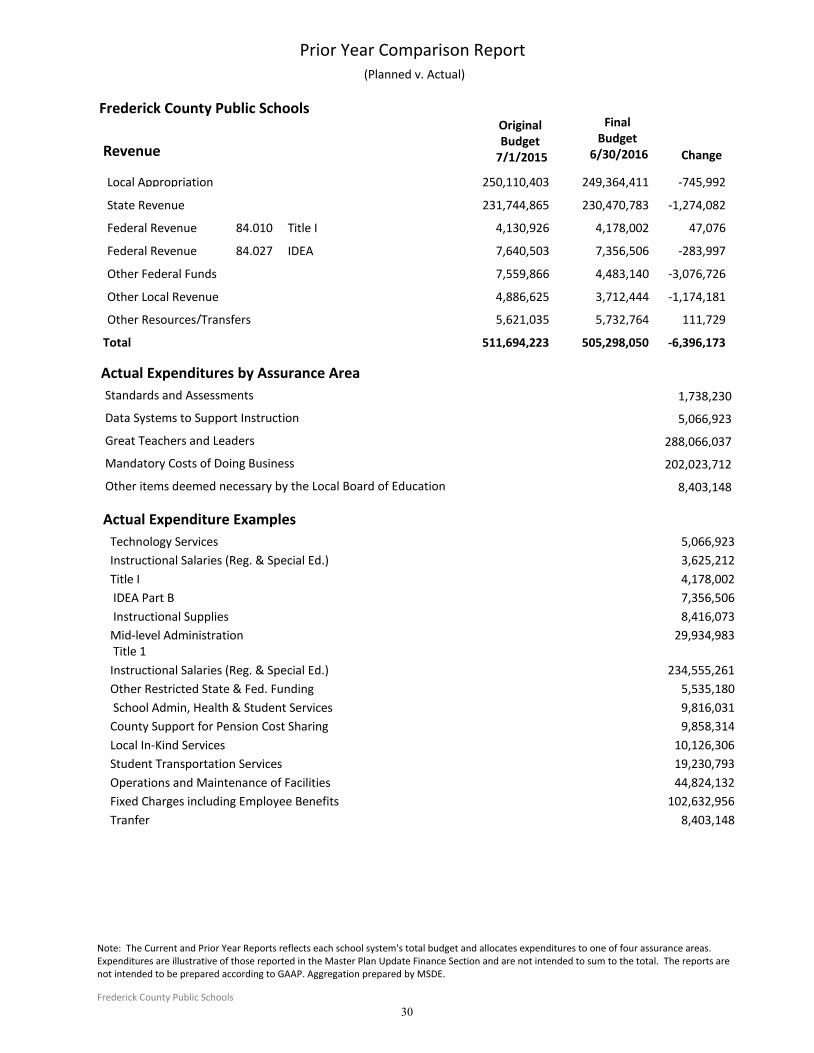
Frederick County Public Schools
Prior Year Comparison Report (Planned v. Actual)
250,110,403 249,364,411 -745,992Local Appropriation
231,744,865 230,470,783 -1,274,082State Revenue
4,130,926 4,178,002 47,076Federal Revenue 84.010 Title I
7,640,503 7,356,506 -283,997Federal Revenue 84.027 IDEA
7,559,866 4,483,140 -3,076,726Other Federal Funds
4,886,625 3,712,444 -1,174,181Other Local Revenue
5,621,035 5,732,764 111,729Other Resources/Transfers
511,694,223 -6,396,173Total 505,298,050
Actual Expenditures by Assurance Area
1,738,230Standards and Assessments
5,066,923Data Systems to Support Instruction
288,066,037Great Teachers and Leaders
202,023,712Mandatory Costs of Doing Business
8,403,148Other items deemed necessary by the Local Board of Education
Actual Expenditure Examples
Technology Services 5,066,923
Instructional Salaries (Reg. & Special Ed.) 3,625,212
Title I 4,178,002
IDEA Part B 7,356,506
Instructional Supplies 8,416,073
Mid-level Administration Title 1
29,934,983
Instructional Salaries (Reg. & Special Ed.) 234,555,261
Other Restricted State & Fed. Funding 5,535,180
School Admin, Health & Student Services 9,816,031
County Support for Pension Cost Sharing 9,858,314
Local In-Kind Services 10,126,306
Student Transportation Services 19,230,793
Operations and Maintenance of Facilities 44,824,132
Fixed Charges including Employee Benefits 102,632,956
Tranfer 8,403,148
Note: The Current and Prior Year Reports reflects each school system's total budget and allocates expenditures to one of four assurance areas. Expenditures are illustrative of those reported in the Master Plan Update Finance Section and are not intended to sum to the total. The reports are not intended to be prepared according to GAAP. Aggregation prepared by MSDE.
Frederick County Public Schools
30
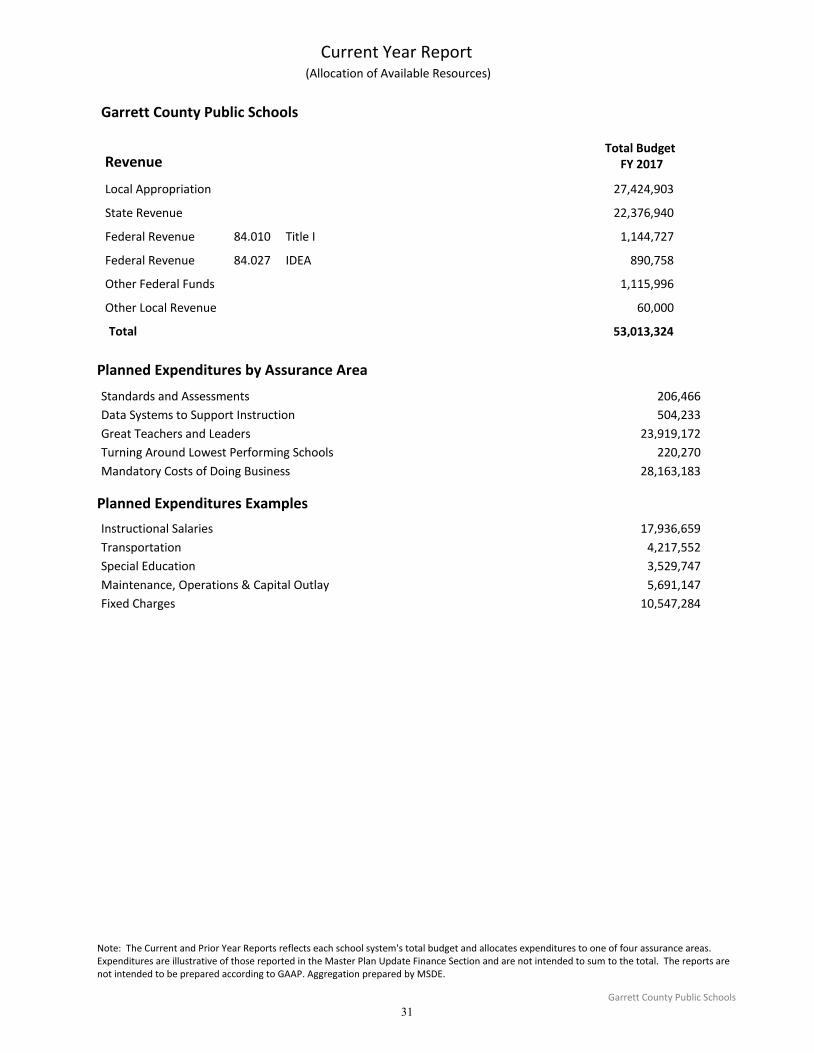
Garrett County Public Schools
RevenueTotal Budget
FY 2017
Current Year Report (Allocation of Available Resources)
27,424,903Local Appropriation
22,376,940State Revenue
1,144,727Federal Revenue 84.010 Title I
890,758Federal Revenue 84.027 IDEA
1,115,996Other Federal Funds
60,000Other Local Revenue
53,013,324Total
Planned Expenditures by Assurance Area
Standards and Assessments 206,466
Data Systems to Support Instruction 504,233
Great Teachers and Leaders 23,919,172
Turning Around Lowest Performing Schools 220,270
Mandatory Costs of Doing Business 28,163,183
Planned Expenditures Examples
Instructional Salaries 17,936,659
Transportation 4,217,552
Special Education 3,529,747
Maintenance, Operations & Capital Outlay 5,691,147
Fixed Charges 10,547,284
Prior Year Comparison Report
Note: The Current and Prior Year Reports reflects each school system's total budget and allocates expenditures to one of four assurance areas. Expenditures are illustrative of those reported in the Master Plan Update Finance Section and are not intended to sum to the total. The reports are not intended to be prepared according to GAAP. Aggregation prepared by MSDE.
Garrett County Public Schools
31

Original Budget
7/1/2015
Final Budget
6/30/2016 ChangeRevenue
Garrett County Public Schools
Prior Year Comparison Report (Planned v. Actual)
26,590,600 26,788,900 198,300Local Appropriation
20,875,865 21,137,465 261,600State Revenue
0 60,772 60,772Federal ARRA Funds 84.395 Race to the Top
1,138,774 1,192,498 53,724Federal Revenue 84.010 Title I
881,184 974,287 93,103Federal Revenue 84.027 IDEA
1,141,516 1,561,488 419,972Other Federal Funds
1,050,000 1,301,135 251,135Other Local Revenue
38,618 1,112,322 1,073,704Other Resources/Transfers
51,716,557 2,412,310Total 54,128,867
Actual Expenditures by Assurance Area
200,173Standards and Assessments
611,106Data Systems to Support Instruction
23,989,792Great Teachers and Leaders
129,949Turning Around Lowest Performing Schools
29,197,847Mandatory Costs of Doing Business
Actual Expenditure Examples
Instructional Salaries 17,537,097
Special Education 3,367,916
Transportation 4,070,764
Maintenance, Operations, & Capital Outlays 5,654,973
Fixed Charges 10,149,757
Note: The Current and Prior Year Reports reflects each school system's total budget and allocates expenditures to one of four assurance areas. Expenditures are illustrative of those reported in the Master Plan Update Finance Section and are not intended to sum to the total. The reports are not intended to be prepared according to GAAP. Aggregation prepared by MSDE.
Garrett County Public Schools
32
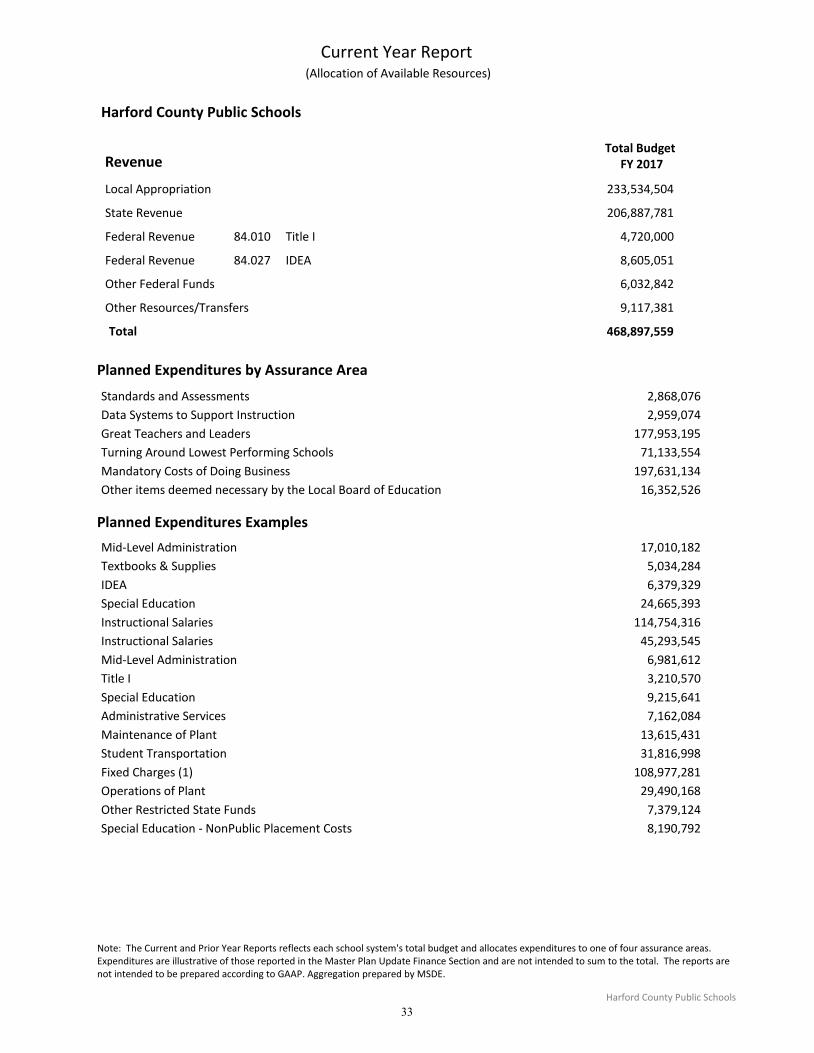
Harford County Public Schools
RevenueTotal Budget
FY 2017
Current Year Report (Allocation of Available Resources)
233,534,504Local Appropriation
206,887,781State Revenue
4,720,000Federal Revenue 84.010 Title I
8,605,051Federal Revenue 84.027 IDEA
6,032,842Other Federal Funds
9,117,381Other Resources/Transfers
468,897,559Total
Planned Expenditures by Assurance Area
Standards and Assessments 2,868,076
Data Systems to Support Instruction 2,959,074
Great Teachers and Leaders 177,953,195
Turning Around Lowest Performing Schools 71,133,554
Mandatory Costs of Doing Business 197,631,134
Other items deemed necessary by the Local Board of Education 16,352,526
Planned Expenditures Examples
Mid-Level Administration 17,010,182
Textbooks & Supplies 5,034,284
IDEA 6,379,329
Special Education 24,665,393
Instructional Salaries 114,754,316
Instructional Salaries 45,293,545
Mid-Level Administration 6,981,612
Title I 3,210,570
Special Education 9,215,641
Administrative Services 7,162,084
Maintenance of Plant 13,615,431
Student Transportation 31,816,998
Fixed Charges (1) 108,977,281
Operations of Plant 29,490,168
Other Restricted State Funds 7,379,124
Special Education - NonPublic Placement Costs 8,190,792
Prior Year Comparison Report
Note: The Current and Prior Year Reports reflects each school system's total budget and allocates expenditures to one of four assurance areas. Expenditures are illustrative of those reported in the Master Plan Update Finance Section and are not intended to sum to the total. The reports are not intended to be prepared according to GAAP. Aggregation prepared by MSDE.
Harford County Public Schools
33
Original Budget
7/1/2015
Final Budget
6/30/2016 ChangeRevenue
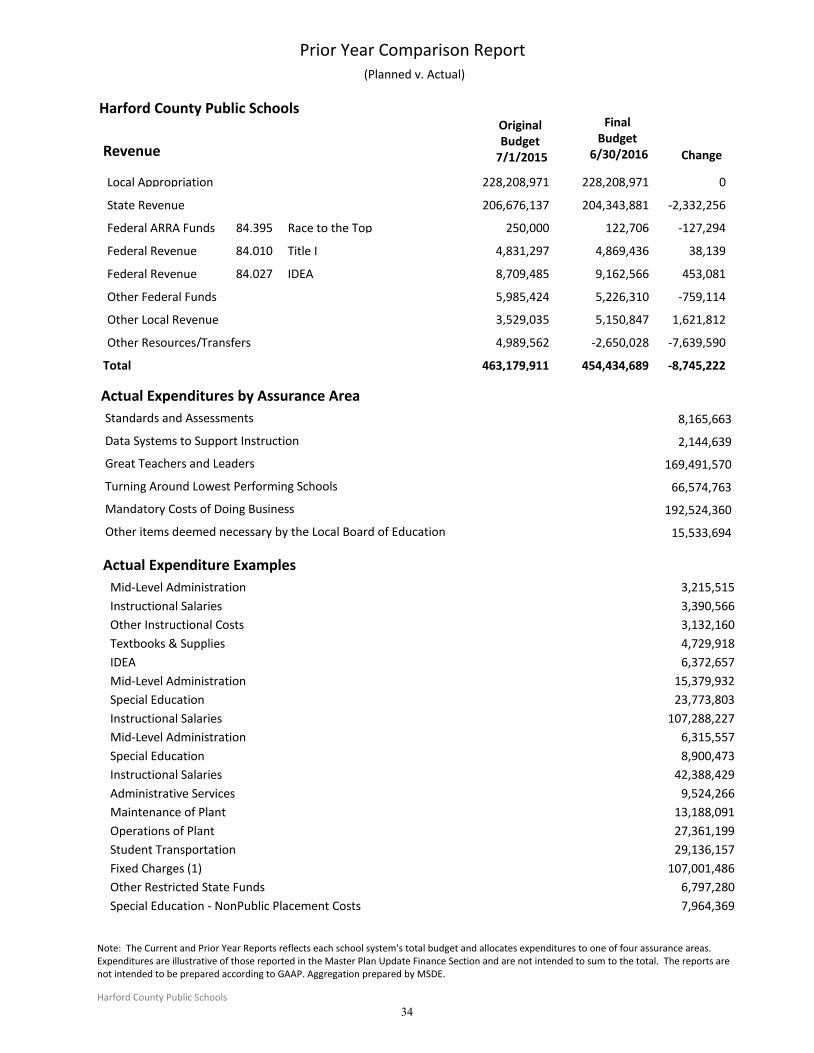
Harford County Public Schools
Prior Year Comparison Report (Planned v. Actual)
228,208,971 228,208,971 0Local Appropriation
206,676,137 204,343,881 -2,332,256State Revenue
250,000 122,706 -127,294Federal ARRA Funds 84.395 Race to the Top
4,831,297 4,869,436 38,139Federal Revenue 84.010 Title I
8,709,485 9,162,566 453,081Federal Revenue 84.027 IDEA
5,985,424 5,226,310 -759,114Other Federal Funds
3,529,035 5,150,847 1,621,812Other Local Revenue
4,989,562 -2,650,028 -7,639,590Other Resources/Transfers
463,179,911 -8,745,222Total 454,434,689
Actual Expenditures by Assurance Area
8,165,663Standards and Assessments
2,144,639Data Systems to Support Instruction
169,491,570Great Teachers and Leaders
66,574,763Turning Around Lowest Performing Schools
192,524,360Mandatory Costs of Doing Business
15,533,694Other items deemed necessary by the Local Board of Education
Actual Expenditure Examples
Mid-Level Administration 3,215,515
Instructional Salaries 3,390,566
Other Instructional Costs 3,132,160
Textbooks & Supplies 4,729,918
IDEA 6,372,657
Mid-Level Administration 15,379,932
Special Education 23,773,803
Instructional Salaries 107,288,227
Mid-Level Administration 6,315,557
Special Education 8,900,473
Instructional Salaries 42,388,429
Administrative Services 9,524,266
Maintenance of Plant 13,188,091
Operations of Plant 27,361,199
Student Transportation 29,136,157
Fixed Charges (1) 107,001,486
Other Restricted State Funds 6,797,280
Special Education - NonPublic Placement Costs 7,964,369
Note: The Current and Prior Year Reports reflects each school system's total budget and allocates expenditures to one of four assurance areas. Expenditures are illustrative of those reported in the Master Plan Update Finance Section and are not intended to sum to the total. The reports are not intended to be prepared according to GAAP. Aggregation prepared by MSDE.
Harford County Public Schools
34
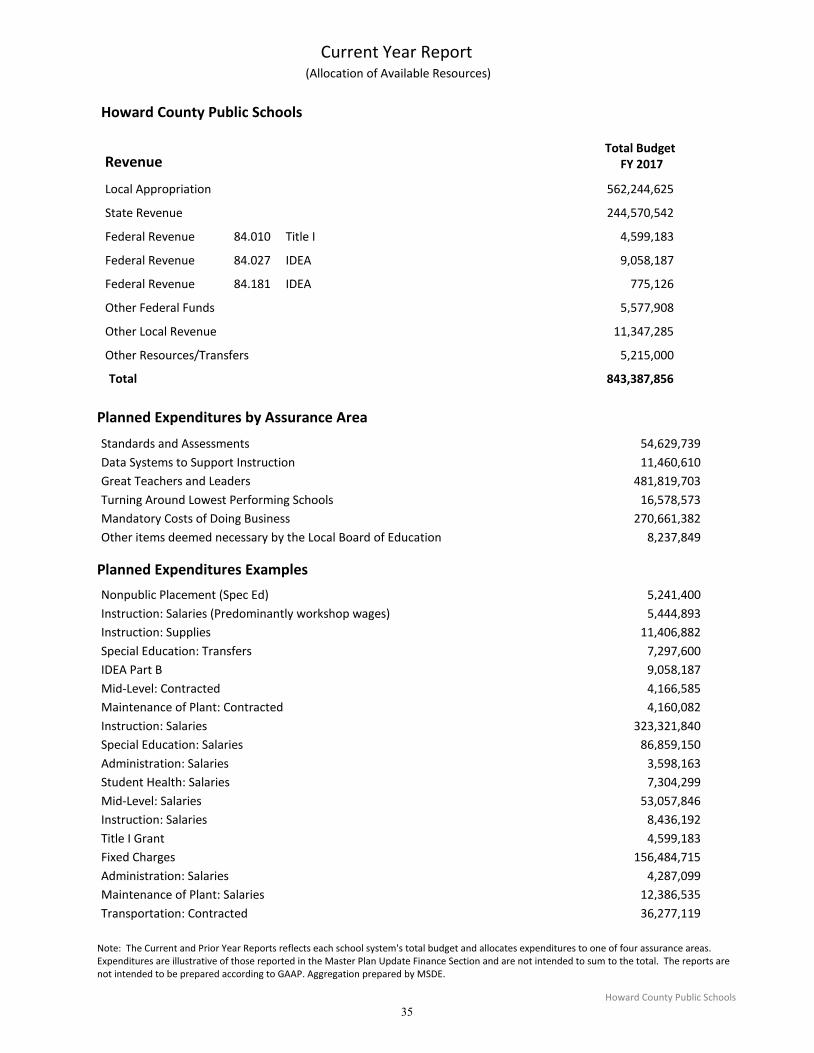
Howard County Public Schools
RevenueTotal Budget
FY 2017
Current Year Report (Allocation of Available Resources)
562,244,625Local Appropriation
244,570,542State Revenue
4,599,183Federal Revenue 84.010 Title I
9,058,187Federal Revenue 84.027 IDEA
775,126Federal Revenue 84.181 IDEA
5,577,908Other Federal Funds
11,347,285Other Local Revenue
5,215,000Other Resources/Transfers
843,387,856Total
Planned Expenditures by Assurance Area
Standards and Assessments 54,629,739
Data Systems to Support Instruction 11,460,610
Great Teachers and Leaders 481,819,703
Turning Around Lowest Performing Schools 16,578,573
Mandatory Costs of Doing Business 270,661,382
Other items deemed necessary by the Local Board of Education 8,237,849
Planned Expenditures Examples
Nonpublic Placement (Spec Ed) 5,241,400
Instruction: Salaries (Predominantly workshop wages) 5,444,893
Instruction: Supplies 11,406,882
Special Education: Transfers 7,297,600
IDEA Part B 9,058,187
Mid-Level: Contracted 4,166,585
Maintenance of Plant: Contracted 4,160,082
Instruction: Salaries 323,321,840
Special Education: Salaries 86,859,150
Administration: Salaries 3,598,163
Student Health: Salaries 7,304,299
Mid-Level: Salaries 53,057,846
Instruction: Salaries 8,436,192
Title I Grant 4,599,183
Fixed Charges 156,484,715
Administration: Salaries 4,287,099
Maintenance of Plant: Salaries 12,386,535
Transportation: Contracted 36,277,119
Note: The Current and Prior Year Reports reflects each school system's total budget and allocates expenditures to one of four assurance areas. Expenditures are illustrative of those reported in the Master Plan Update Finance Section and are not intended to sum to the total. The reports are not intended to be prepared according to GAAP. Aggregation prepared by MSDE.
Howard County Public Schools
35

Operation of Plant: Other 18,938,771
Operation of Plant: Salaries 21,843,478
Maintenance of Plant: Contracted 6,874,493
Grant Contingency 5,504,516
Prior Year Comparison Report
Note: The Current and Prior Year Reports reflects each school system's total budget and allocates expenditures to one of four assurance areas. Expenditures are illustrative of those reported in the Master Plan Update Finance Section and are not intended to sum to the total. The reports are not intended to be prepared according to GAAP. Aggregation prepared by MSDE.
Howard County Public Schools
36
Original Budget
7/1/2015
Final Budget
6/30/2016 ChangeRevenue
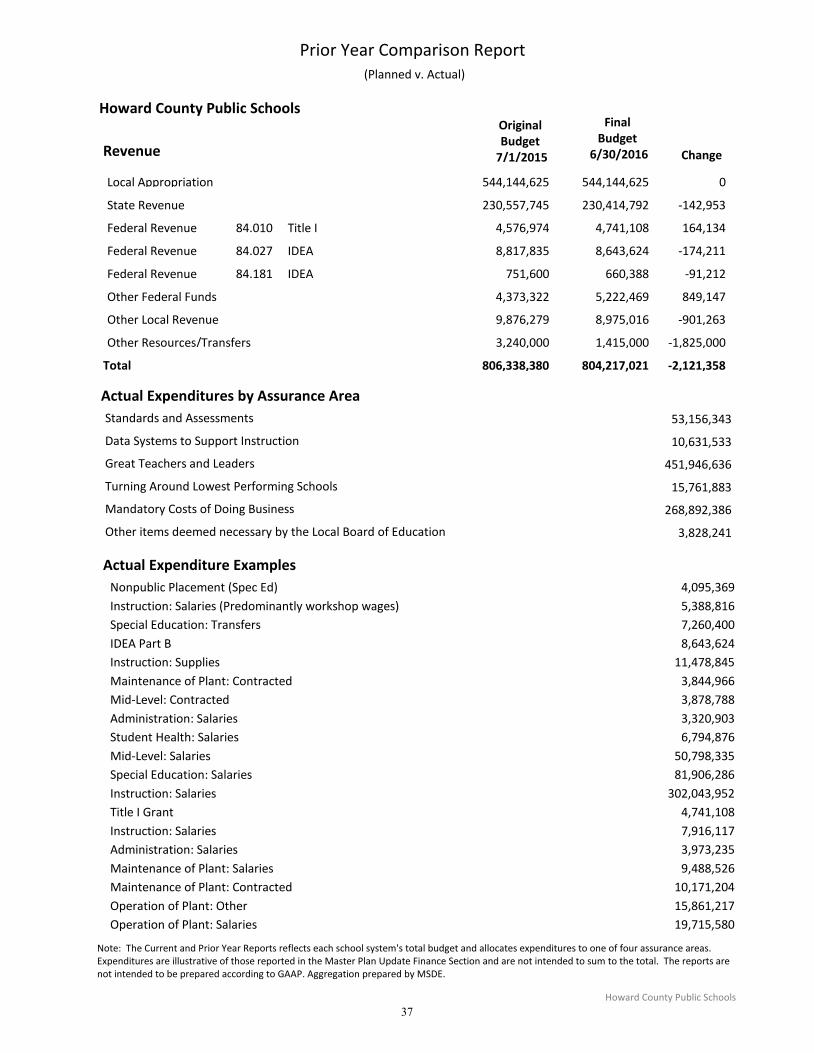
Howard County Public Schools
Prior Year Comparison Report (Planned v. Actual)
544,144,625 544,144,625 0Local Appropriation
230,557,745 230,414,792 -142,953State Revenue
4,576,974 4,741,108 164,134Federal Revenue 84.010 Title I
8,817,835 8,643,624 -174,211Federal Revenue 84.027 IDEA
751,600 660,388 -91,212Federal Revenue 84.181 IDEA
4,373,322 5,222,469 849,147Other Federal Funds
9,876,279 8,975,016 -901,263Other Local Revenue
3,240,000 1,415,000 -1,825,000Other Resources/Transfers
806,338,380 -2,121,358Total 804,217,021
Actual Expenditures by Assurance Area
53,156,343Standards and Assessments
10,631,533Data Systems to Support Instruction
451,946,636Great Teachers and Leaders
15,761,883Turning Around Lowest Performing Schools
268,892,386Mandatory Costs of Doing Business
3,828,241Other items deemed necessary by the Local Board of Education
Actual Expenditure Examples
Nonpublic Placement (Spec Ed) 4,095,369
Instruction: Salaries (Predominantly workshop wages) 5,388,816
Special Education: Transfers 7,260,400
IDEA Part B 8,643,624
Instruction: Supplies 11,478,845
Maintenance of Plant: Contracted 3,844,966
Mid-Level: Contracted 3,878,788
Administration: Salaries 3,320,903
Student Health: Salaries 6,794,876
Mid-Level: Salaries 50,798,335
Special Education: Salaries 81,906,286
Instruction: Salaries 302,043,952
Title I Grant 4,741,108
Instruction: Salaries 7,916,117
Administration: Salaries 3,973,235
Maintenance of Plant: Salaries 9,488,526
Maintenance of Plant: Contracted 10,171,204
Operation of Plant: Other 15,861,217
Operation of Plant: Salaries 19,715,580
Note: The Current and Prior Year Reports reflects each school system's total budget and allocates expenditures to one of four assurance areas. Expenditures are illustrative of those reported in the Master Plan Update Finance Section and are not intended to sum to the total. The reports are not intended to be prepared according to GAAP. Aggregation prepared by MSDE.
Howard County Public Schools
37
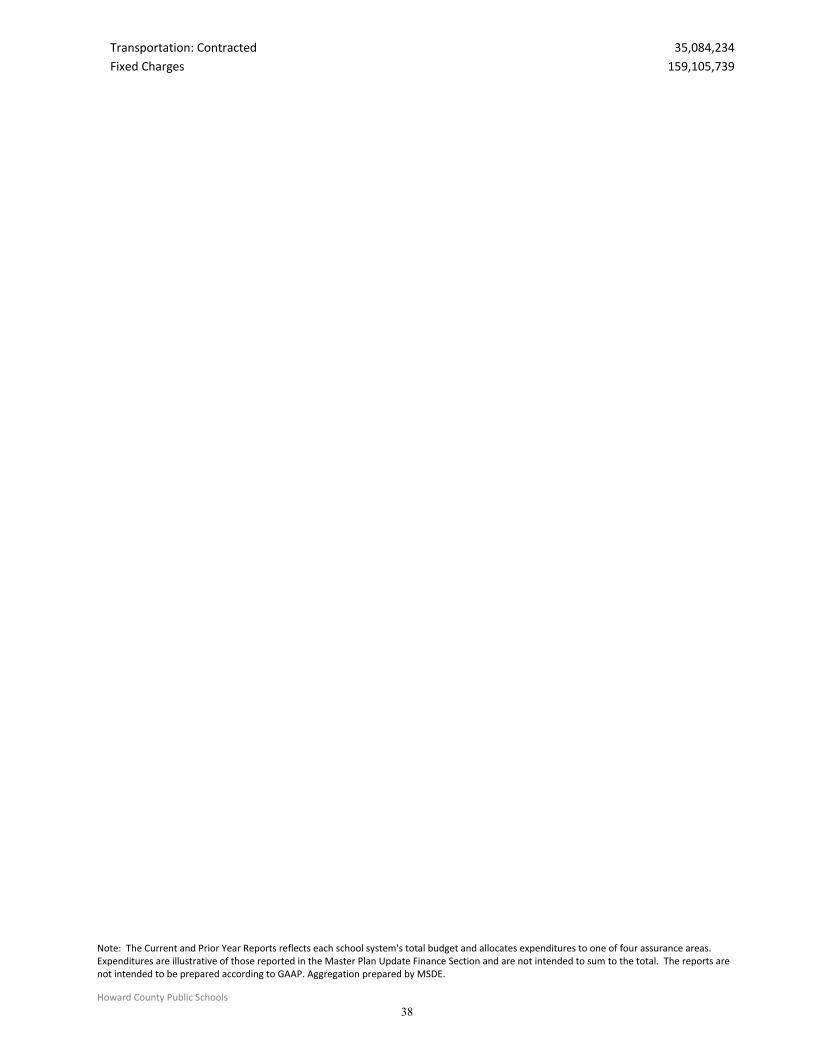
Transportation: Contracted 35,084,234
Fixed Charges 159,105,739
Note: The Current and Prior Year Reports reflects each school system's total budget and allocates expenditures to one of four assurance areas. Expenditures are illustrative of those reported in the Master Plan Update Finance Section and are not intended to sum to the total. The reports are not intended to be prepared according to GAAP. Aggregation prepared by MSDE.
Howard County Public Schools
38
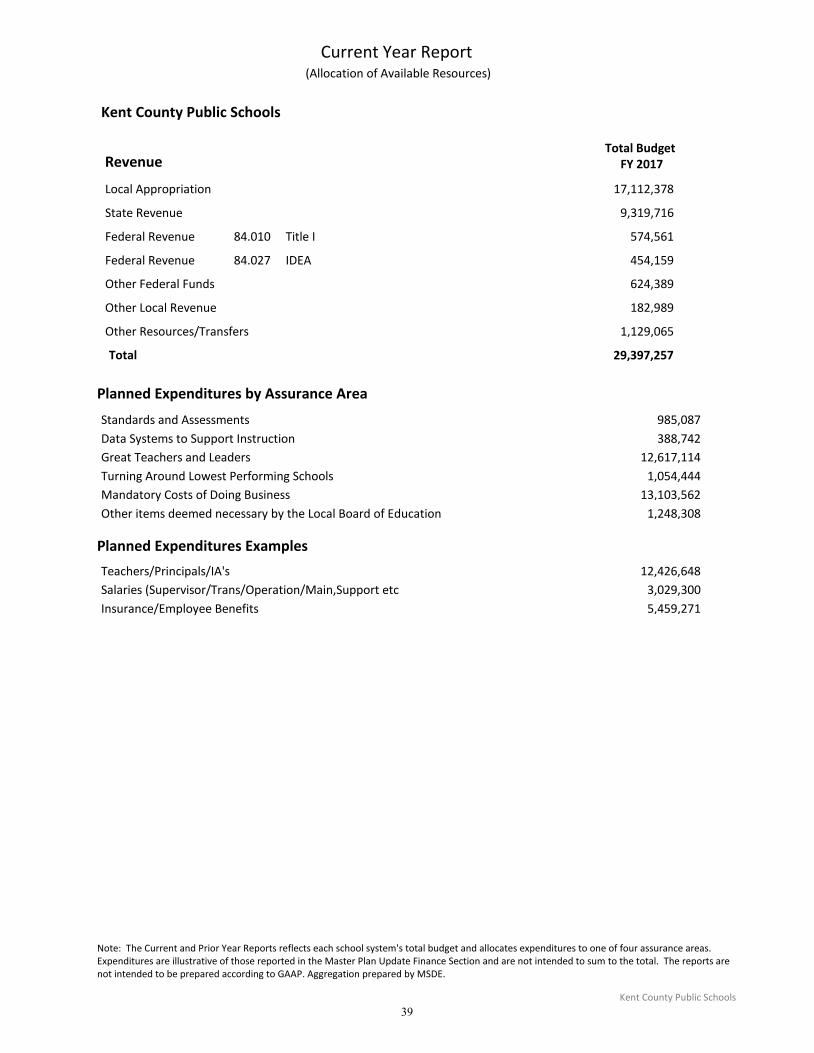
Kent County Public Schools
RevenueTotal Budget
FY 2017
Current Year Report (Allocation of Available Resources)
17,112,378Local Appropriation
9,319,716State Revenue
574,561Federal Revenue 84.010 Title I
454,159Federal Revenue 84.027 IDEA
624,389Other Federal Funds
182,989Other Local Revenue
1,129,065Other Resources/Transfers
29,397,257Total
Planned Expenditures by Assurance Area
Standards and Assessments 985,087
Data Systems to Support Instruction 388,742
Great Teachers and Leaders 12,617,114
Turning Around Lowest Performing Schools 1,054,444
Mandatory Costs of Doing Business 13,103,562
Other items deemed necessary by the Local Board of Education 1,248,308
Planned Expenditures Examples
Teachers/Principals/IA's 12,426,648
Salaries (Supervisor/Trans/Operation/Main,Support etc 3,029,300
Insurance/Employee Benefits 5,459,271
Prior Year Comparison Report
Note: The Current and Prior Year Reports reflects each school system's total budget and allocates expenditures to one of four assurance areas. Expenditures are illustrative of those reported in the Master Plan Update Finance Section and are not intended to sum to the total. The reports are not intended to be prepared according to GAAP. Aggregation prepared by MSDE.
Kent County Public Schools
39
Original Budget
7/1/2015
Final Budget
6/30/2016 ChangeRevenue
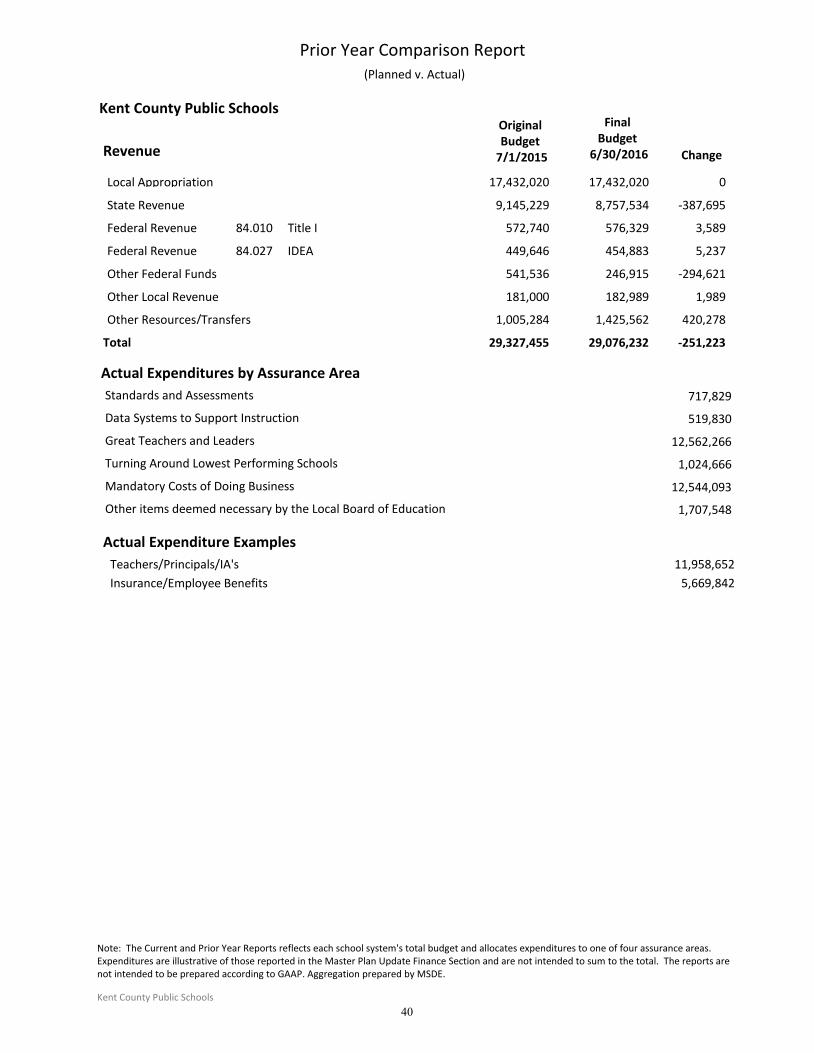
Kent County Public Schools
Prior Year Comparison Report (Planned v. Actual)
17,432,020 17,432,020 0Local Appropriation
9,145,229 8,757,534 -387,695State Revenue
572,740 576,329 3,589Federal Revenue 84.010 Title I
449,646 454,883 5,237Federal Revenue 84.027 IDEA
541,536 246,915 -294,621Other Federal Funds
181,000 182,989 1,989Other Local Revenue
1,005,284 1,425,562 420,278Other Resources/Transfers
29,327,455 -251,223Total 29,076,232
Actual Expenditures by Assurance Area
717,829Standards and Assessments
519,830Data Systems to Support Instruction
12,562,266Great Teachers and Leaders
1,024,666Turning Around Lowest Performing Schools
12,544,093Mandatory Costs of Doing Business
1,707,548Other items deemed necessary by the Local Board of Education
Actual Expenditure Examples
Teachers/Principals/IA's 11,958,652
Insurance/Employee Benefits 5,669,842
Note: The Current and Prior Year Reports reflects each school system's total budget and allocates expenditures to one of four assurance areas. Expenditures are illustrative of those reported in the Master Plan Update Finance Section and are not intended to sum to the total. The reports are not intended to be prepared according to GAAP. Aggregation prepared by MSDE.
Kent County Public Schools
40
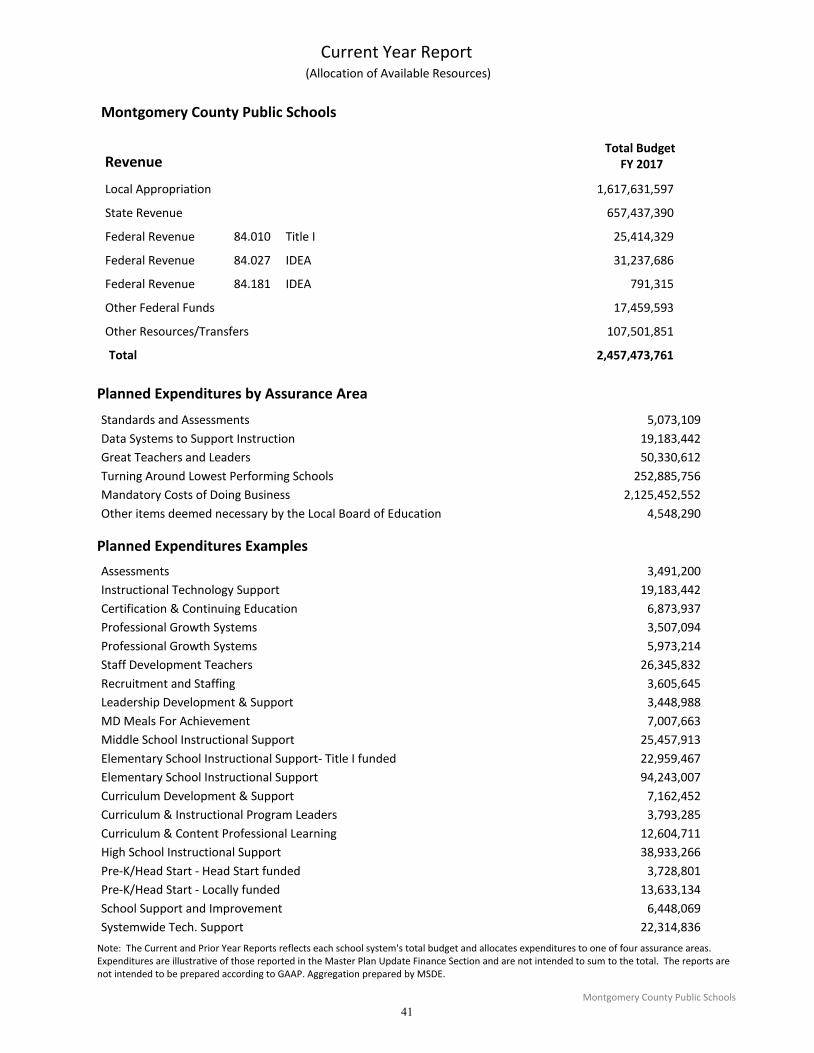
Montgomery County Public Schools
RevenueTotal Budget
FY 2017
Current Year Report (Allocation of Available Resources)
1,617,631,597Local Appropriation
657,437,390State Revenue
25,414,329Federal Revenue 84.010 Title I
31,237,686Federal Revenue 84.027 IDEA
791,315Federal Revenue 84.181 IDEA
17,459,593Other Federal Funds
107,501,851Other Resources/Transfers
2,457,473,761Total
Planned Expenditures by Assurance Area
Standards and Assessments 5,073,109
Data Systems to Support Instruction 19,183,442
Great Teachers and Leaders 50,330,612
Turning Around Lowest Performing Schools 252,885,756
Mandatory Costs of Doing Business 2,125,452,552
Other items deemed necessary by the Local Board of Education 4,548,290
Planned Expenditures Examples
Assessments 3,491,200
Instructional Technology Support 19,183,442
Certification & Continuing Education 6,873,937
Professional Growth Systems 3,507,094
Professional Growth Systems 5,973,214
Staff Development Teachers 26,345,832
Recruitment and Staffing 3,605,645
Leadership Development & Support 3,448,988
MD Meals For Achievement 7,007,663
Middle School Instructional Support 25,457,913
Elementary School Instructional Support- Title I funded 22,959,467
Elementary School Instructional Support 94,243,007
Curriculum Development & Support 7,162,452
Curriculum & Instructional Program Leaders 3,793,285
Curriculum & Content Professional Learning 12,604,711
High School Instructional Support 38,933,266
Pre-K/Head Start - Head Start funded 3,728,801
Pre-K/Head Start - Locally funded 13,633,134
School Support and Improvement 6,448,069
Systemwide Tech. Support 22,314,836
Note: The Current and Prior Year Reports reflects each school system's total budget and allocates expenditures to one of four assurance areas. Expenditures are illustrative of those reported in the Master Plan Update Finance Section and are not intended to sum to the total. The reports are not intended to be prepared according to GAAP. Aggregation prepared by MSDE.
Montgomery County Public Schools
41
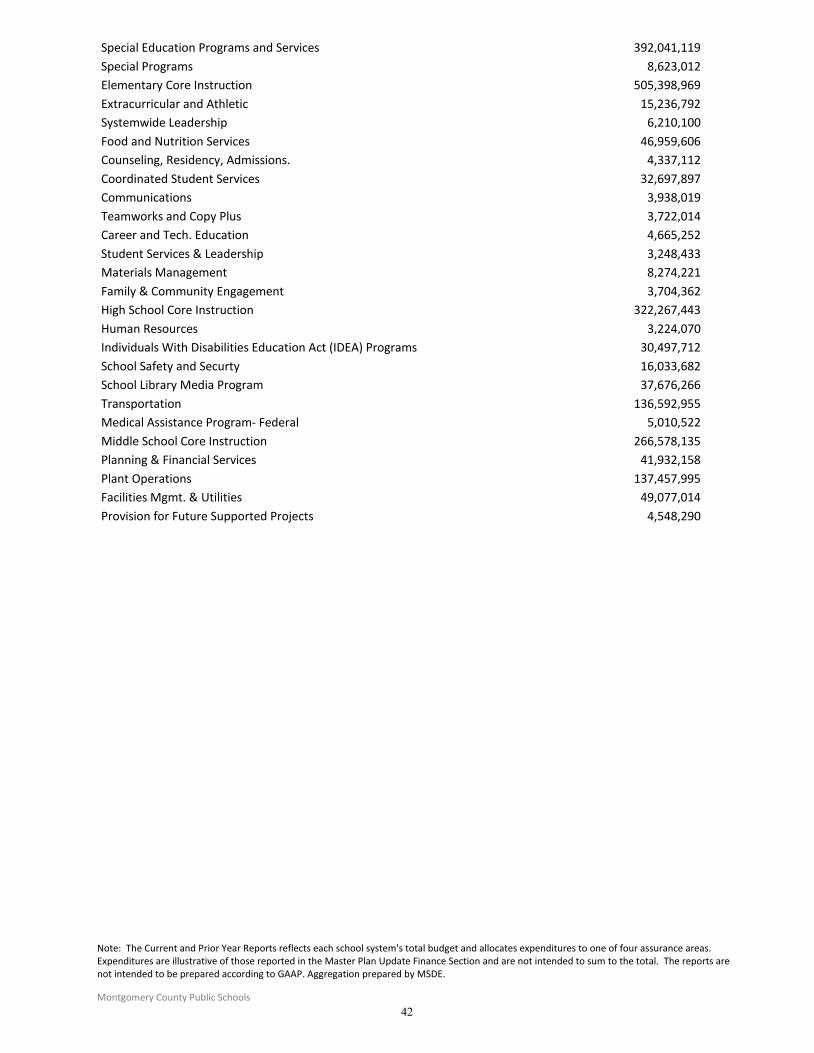
Special Education Programs and Services 392,041,119
Special Programs 8,623,012
Elementary Core Instruction 505,398,969
Extracurricular and Athletic 15,236,792
Systemwide Leadership 6,210,100
Food and Nutrition Services 46,959,606
Counseling, Residency, Admissions. 4,337,112
Coordinated Student Services 32,697,897
Communications 3,938,019
Teamworks and Copy Plus 3,722,014
Career and Tech. Education 4,665,252
Student Services & Leadership 3,248,433
Materials Management 8,274,221
Family & Community Engagement 3,704,362
High School Core Instruction 322,267,443
Human Resources 3,224,070
Individuals With Disabilities Education Act (IDEA) Programs 30,497,712
School Safety and Securty 16,033,682
School Library Media Program 37,676,266
Transportation 136,592,955
Medical Assistance Program- Federal 5,010,522
Middle School Core Instruction 266,578,135
Planning & Financial Services 41,932,158
Plant Operations 137,457,995
Facilities Mgmt. & Utilities 49,077,014
Provision for Future Supported Projects 4,548,290
Prior Year Comparison Report
Note: The Current and Prior Year Reports reflects each school system's total budget and allocates expenditures to one of four assurance areas. Expenditures are illustrative of those reported in the Master Plan Update Finance Section and are not intended to sum to the total. The reports are not intended to be prepared according to GAAP. Aggregation prepared by MSDE.
Montgomery County Public Schools
42
Original Budget
7/1/2015
Final Budget
6/30/2016 ChangeRevenue
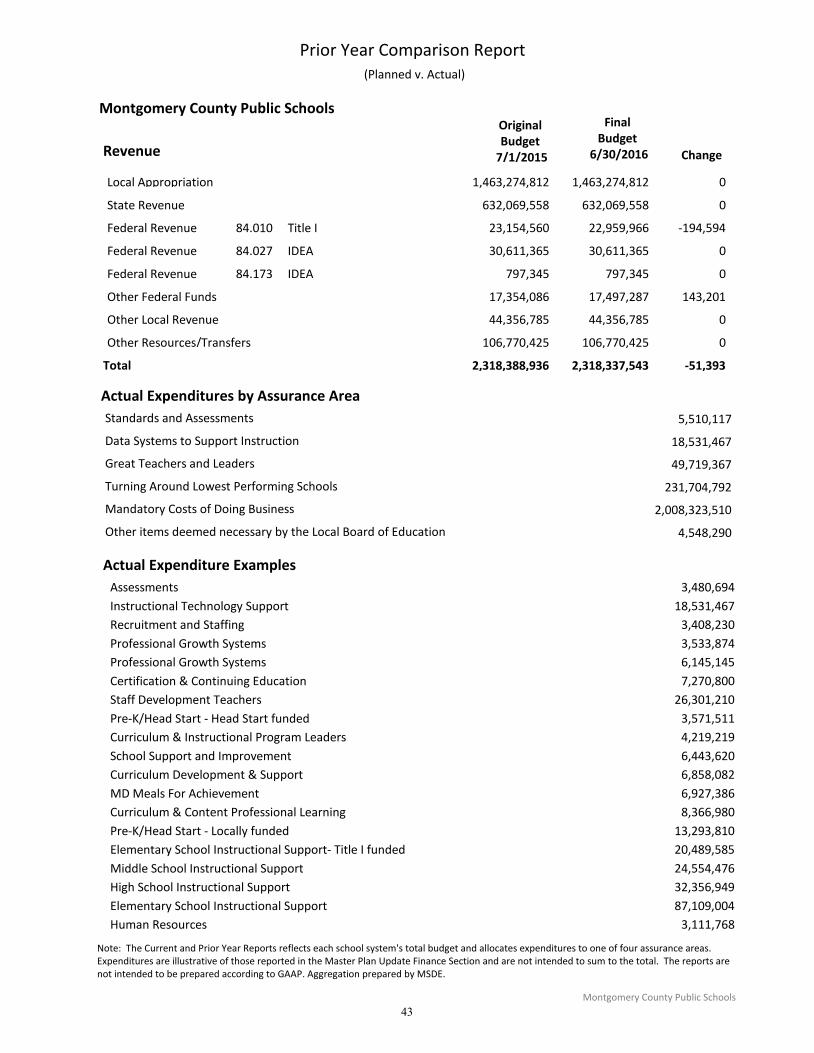
Montgomery County Public Schools
Prior Year Comparison Report (Planned v. Actual)
1,463,274,812 1,463,274,812 0Local Appropriation
632,069,558 632,069,558 0State Revenue
23,154,560 22,959,966 -194,594Federal Revenue 84.010 Title I
30,611,365 30,611,365 0Federal Revenue 84.027 IDEA
797,345 797,345 0Federal Revenue 84.173 IDEA
17,354,086 17,497,287 143,201Other Federal Funds
44,356,785 44,356,785 0Other Local Revenue
106,770,425 106,770,425 0Other Resources/Transfers
2,318,388,936 -51,393Total 2,318,337,543
Actual Expenditures by Assurance Area
5,510,117Standards and Assessments
18,531,467Data Systems to Support Instruction
49,719,367Great Teachers and Leaders
231,704,792Turning Around Lowest Performing Schools
2,008,323,510Mandatory Costs of Doing Business
4,548,290Other items deemed necessary by the Local Board of Education
Actual Expenditure Examples
Assessments 3,480,694
Instructional Technology Support 18,531,467
Recruitment and Staffing 3,408,230
Professional Growth Systems 3,533,874
Professional Growth Systems 6,145,145
Certification & Continuing Education 7,270,800
Staff Development Teachers 26,301,210
Pre-K/Head Start - Head Start funded 3,571,511
Curriculum & Instructional Program Leaders 4,219,219
School Support and Improvement 6,443,620
Curriculum Development & Support 6,858,082
MD Meals For Achievement 6,927,386
Curriculum & Content Professional Learning 8,366,980
Pre-K/Head Start - Locally funded 13,293,810
Elementary School Instructional Support- Title I funded 20,489,585
Middle School Instructional Support 24,554,476
High School Instructional Support 32,356,949
Elementary School Instructional Support 87,109,004
Human Resources 3,111,768
Note: The Current and Prior Year Reports reflects each school system's total budget and allocates expenditures to one of four assurance areas. Expenditures are illustrative of those reported in the Master Plan Update Finance Section and are not intended to sum to the total. The reports are not intended to be prepared according to GAAP. Aggregation prepared by MSDE.
Montgomery County Public Schools
43

Systemwide Leadership 3,704,592
Teamworks and Copy Plus 3,771,193
Family & Community Engagement 3,898,737
Communications 3,919,523
Counseling, Residency, Admissions. 4,407,249
Medical Assistance Program- Federal 5,067,213
Career and Tech. Education 5,111,975
Special Programs 8,213,820
Materials Management 8,563,072
Extracurricular and Athletic 14,612,339
School Safety and Securty 16,015,013
Planning & Financial Services 17,579,936
Systemwide Tech. Support 23,022,688
Individuals With Disabilities Education Act (IDEA) Programs 29,879,475
Coordinated Student Services 31,232,074
School Library Media Program 36,990,791
Food and Nutrition Services 46,239,493
Facilities Mgmt. & Utilities 48,002,605
Plant Operations 135,372,855
Transportation 135,507,803
Middle School Core Instruction 245,703,153
High School Core Instruction 299,558,549
Special Education Programs and Services 378,227,142
Elementary Core Instruction 480,175,027
Provision for Future Supported Projects 4,548,290
Note: The Current and Prior Year Reports reflects each school system's total budget and allocates expenditures to one of four assurance areas. Expenditures are illustrative of those reported in the Master Plan Update Finance Section and are not intended to sum to the total. The reports are not intended to be prepared according to GAAP. Aggregation prepared by MSDE.
Montgomery County Public Schools
44

Prince George's County Public Schools
RevenueTotal Budget
FY 2017
Current Year Report (Allocation of Available Resources)
698,329,100Local Appropriation
1,091,627,000State Revenue
36,370,981Federal Revenue 84.010 Title I
25,132,808Federal Revenue 84.027 IDEA
35,016,311Other Federal Funds
13,383,900Other Local Revenue
24,000,000Other Resources/Transfers
1,923,860,100Total
Planned Expenditures by Assurance Area
Standards and Assessments 14,020,314
Data Systems to Support Instruction 2,117,600
Great Teachers and Leaders 31,516,019
Turning Around Lowest Performing Schools 2,728,601
Mandatory Costs of Doing Business 1,823,235,752
Other items deemed necessary by the Local Board of Education 50,241,814
Planned Expenditures Examples
Charter Schools 6,584,123
Compensation Commitments 22,225,346
Reserve for Negotiated Compensation Improvements 8,400,000
Health Insurance Benefits 11,000,000
Equipment -7,500,000
FY 2017 Core Services Requirements - Restricted 58,143,235
Base Adjustments 13,188,992
General Liability Insurances 9,000,000
Lease Purchases 7,541,144
Other Post Employment Benefits (OPEB) 15,000,000
Restricted Programs - JROTC Reductions -10,579,772
Teacher Pension Shift 5,000,000
FY 2017 Core Services Requirements Base 1,721,857,153
Title I 36,370,981
IDEA, B. 25,132,808
Deputy Superintendent for Teaching and Learning -3,120,642
Chief Operating Officer -5,033,104
Prior Year Comparison Report
Note: The Current and Prior Year Reports reflects each school system's total budget and allocates expenditures to one of four assurance areas. Expenditures are illustrative of those reported in the Master Plan Update Finance Section and are not intended to sum to the total. The reports are not intended to be prepared according to GAAP. Aggregation prepared by MSDE.
Prince George's County Public Schools
45
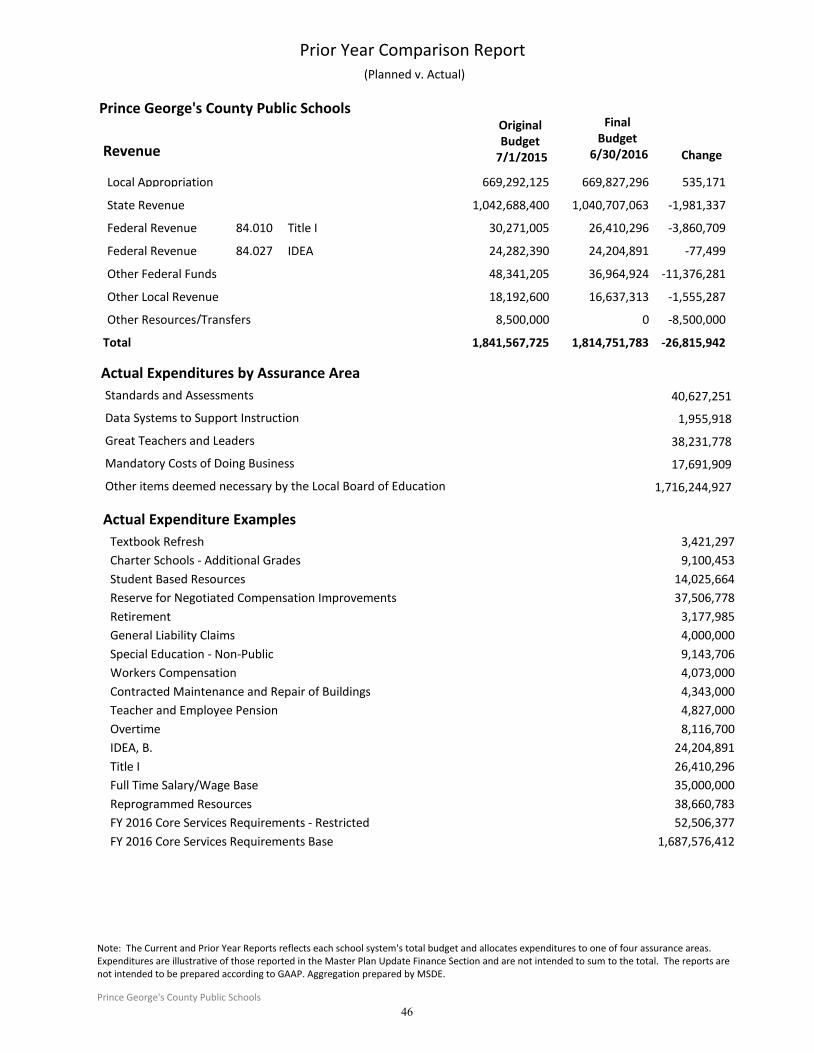
Original Budget
7/1/2015
Final Budget
6/30/2016 ChangeRevenue
Prince George's County Public Schools
Prior Year Comparison Report (Planned v. Actual)
669,292,125 669,827,296 535,171Local Appropriation
1,042,688,400 1,040,707,063 -1,981,337State Revenue
30,271,005 26,410,296 -3,860,709Federal Revenue 84.010 Title I
24,282,390 24,204,891 -77,499Federal Revenue 84.027 IDEA
48,341,205 36,964,924 -11,376,281Other Federal Funds
18,192,600 16,637,313 -1,555,287Other Local Revenue
8,500,000 0 -8,500,000Other Resources/Transfers
1,841,567,725 -26,815,942Total 1,814,751,783
Actual Expenditures by Assurance Area
40,627,251Standards and Assessments
1,955,918Data Systems to Support Instruction
38,231,778Great Teachers and Leaders
17,691,909Mandatory Costs of Doing Business
1,716,244,927Other items deemed necessary by the Local Board of Education
Actual Expenditure Examples
Textbook Refresh 3,421,297
Charter Schools - Additional Grades 9,100,453
Student Based Resources 14,025,664
Reserve for Negotiated Compensation Improvements 37,506,778
Retirement 3,177,985
General Liability Claims 4,000,000
Special Education - Non-Public 9,143,706
Workers Compensation 4,073,000
Contracted Maintenance and Repair of Buildings 4,343,000
Teacher and Employee Pension 4,827,000
Overtime 8,116,700
IDEA, B. 24,204,891
Title I 26,410,296
Full Time Salary/Wage Base 35,000,000
Reprogrammed Resources 38,660,783
FY 2016 Core Services Requirements - Restricted 52,506,377
FY 2016 Core Services Requirements Base 1,687,576,412
Note: The Current and Prior Year Reports reflects each school system's total budget and allocates expenditures to one of four assurance areas. Expenditures are illustrative of those reported in the Master Plan Update Finance Section and are not intended to sum to the total. The reports are not intended to be prepared according to GAAP. Aggregation prepared by MSDE.
Prince George's County Public Schools
46
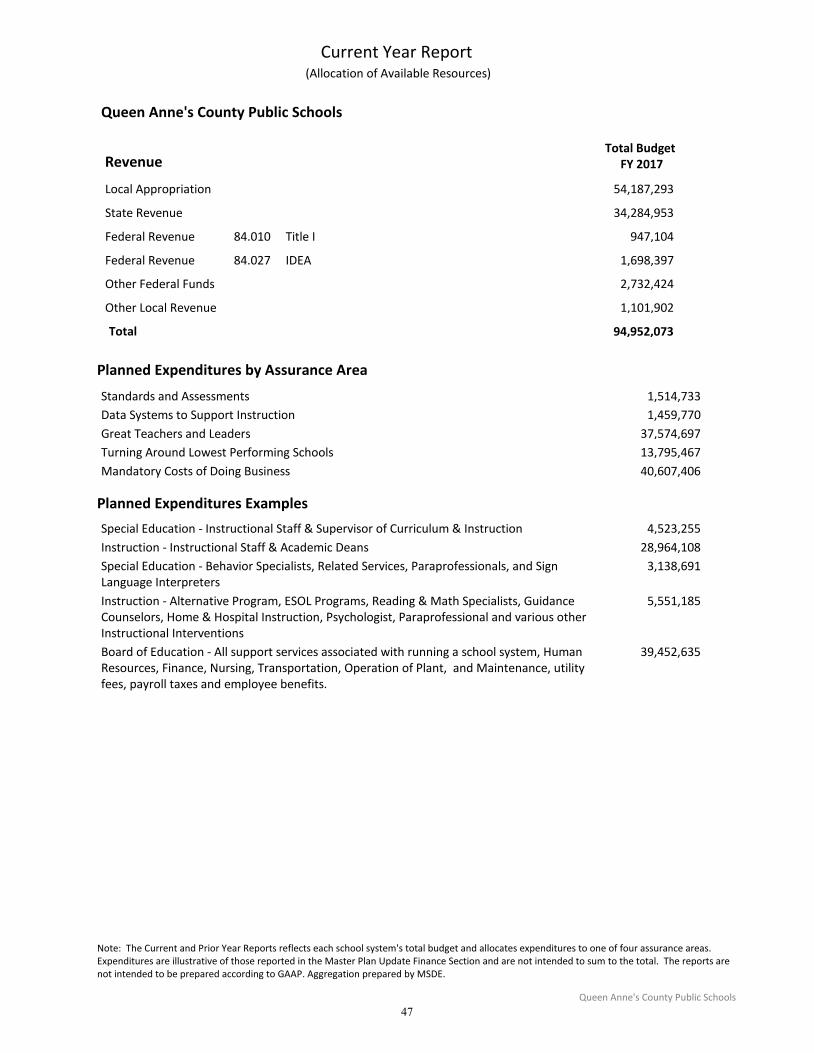
Queen Anne's County Public Schools
RevenueTotal Budget
FY 2017
Current Year Report (Allocation of Available Resources)
54,187,293Local Appropriation
34,284,953State Revenue
947,104Federal Revenue 84.010 Title I
1,698,397Federal Revenue 84.027 IDEA
2,732,424Other Federal Funds
1,101,902Other Local Revenue
94,952,073Total
Planned Expenditures by Assurance Area
Standards and Assessments 1,514,733
Data Systems to Support Instruction 1,459,770
Great Teachers and Leaders 37,574,697
Turning Around Lowest Performing Schools 13,795,467
Mandatory Costs of Doing Business 40,607,406
Planned Expenditures Examples
Special Education - Instructional Staff & Supervisor of Curriculum & Instruction 4,523,255
Instruction - Instructional Staff & Academic Deans 28,964,108
Special Education - Behavior Specialists, Related Services, Paraprofessionals, and Sign Language Interpreters
3,138,691
Instruction - Alternative Program, ESOL Programs, Reading & Math Specialists, Guidance Counselors, Home & Hospital Instruction, Psychologist, Paraprofessional and various other Instructional Interventions
5,551,185
Board of Education - All support services associated with running a school system, Human Resources, Finance, Nursing, Transportation, Operation of Plant, and Maintenance, utility fees, payroll taxes and employee benefits.
39,452,635
Prior Year Comparison Report
Note: The Current and Prior Year Reports reflects each school system's total budget and allocates expenditures to one of four assurance areas. Expenditures are illustrative of those reported in the Master Plan Update Finance Section and are not intended to sum to the total. The reports are not intended to be prepared according to GAAP. Aggregation prepared by MSDE.
Queen Anne's County Public Schools
47
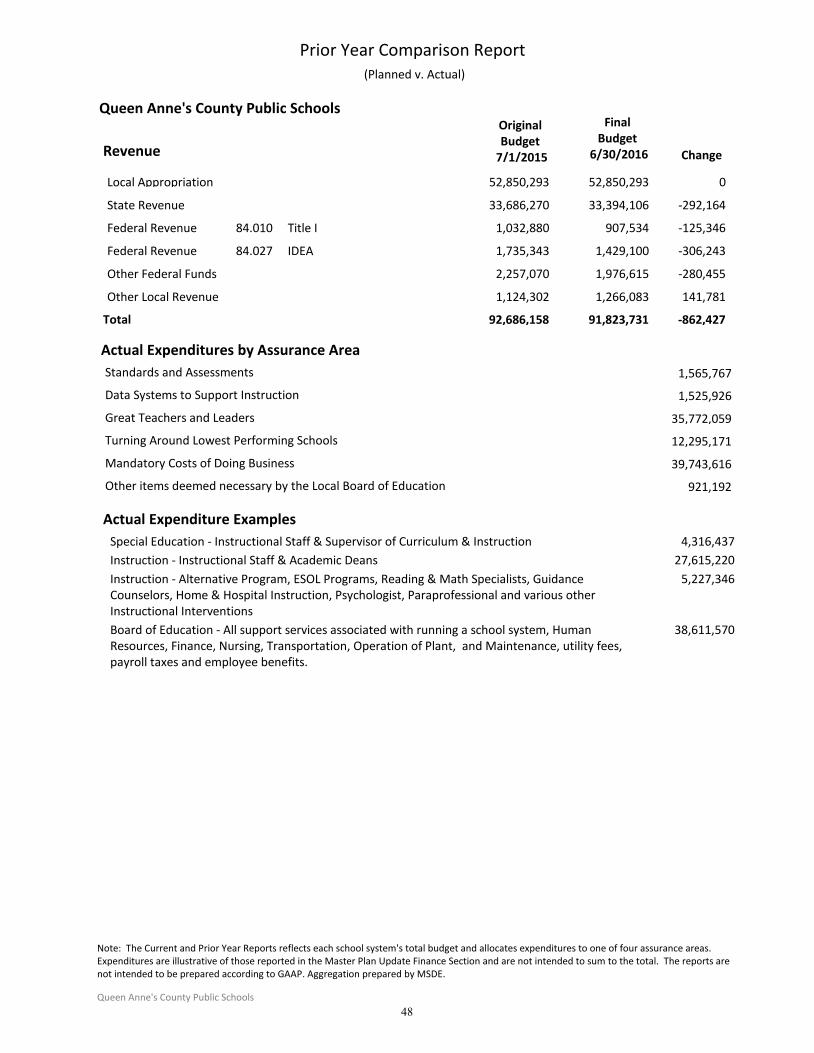
Original Budget
7/1/2015
Final Budget
6/30/2016 ChangeRevenue
Queen Anne's County Public Schools
Prior Year Comparison Report (Planned v. Actual)
52,850,293 52,850,293 0Local Appropriation
33,686,270 33,394,106 -292,164State Revenue
1,032,880 907,534 -125,346Federal Revenue 84.010 Title I
1,735,343 1,429,100 -306,243Federal Revenue 84.027 IDEA
2,257,070 1,976,615 -280,455Other Federal Funds
1,124,302 1,266,083 141,781Other Local Revenue
92,686,158 -862,427Total 91,823,731
Actual Expenditures by Assurance Area
1,565,767Standards and Assessments
1,525,926Data Systems to Support Instruction
35,772,059Great Teachers and Leaders
12,295,171Turning Around Lowest Performing Schools
39,743,616Mandatory Costs of Doing Business
921,192Other items deemed necessary by the Local Board of Education
Actual Expenditure Examples
Special Education - Instructional Staff & Supervisor of Curriculum & Instruction 4,316,437
Instruction - Instructional Staff & Academic Deans 27,615,220
Instruction - Alternative Program, ESOL Programs, Reading & Math Specialists, Guidance Counselors, Home & Hospital Instruction, Psychologist, Paraprofessional and various other Instructional Interventions
5,227,346
Board of Education - All support services associated with running a school system, Human Resources, Finance, Nursing, Transportation, Operation of Plant, and Maintenance, utility fees, payroll taxes and employee benefits.
38,611,570
Note: The Current and Prior Year Reports reflects each school system's total budget and allocates expenditures to one of four assurance areas. Expenditures are illustrative of those reported in the Master Plan Update Finance Section and are not intended to sum to the total. The reports are not intended to be prepared according to GAAP. Aggregation prepared by MSDE.
Queen Anne's County Public Schools
48

St. Mary's County Public Schools
RevenueTotal Budget
FY 2017
Current Year Report (Allocation of Available Resources)
104,190,393Local Appropriation
101,749,880State Revenue
4,038,190Federal Revenue 84.010 Title I
3,992,054Federal Revenue 84.027 IDEA
10,591,041Other Federal Funds
68,900Other Local Revenue
4,094,553Other Resources/Transfers
228,725,011Total
Planned Expenditures by Assurance Area
Standards and Assessments 56,091
Data Systems to Support Instruction 110,000
Great Teachers and Leaders 208,000
Mandatory Costs of Doing Business 209,120,549
Other items deemed necessary by the Local Board of Education 19,230,370
Planned Expenditures Examples
Utilities 4,885,047
Transportation 13,908,468
Contractual agreements - salaries 123,598,833
Contractual agreements - salaries 4,336,925
Contractual agreements - benefits 48,130,224
Supplies/Materials 6,560,701
Contracted Services 5,641,685
Prior Year Comparison Report
Note: The Current and Prior Year Reports reflects each school system's total budget and allocates expenditures to one of four assurance areas. Expenditures are illustrative of those reported in the Master Plan Update Finance Section and are not intended to sum to the total. The reports are not intended to be prepared according to GAAP. Aggregation prepared by MSDE.
St. Mary's County Public Schools
49
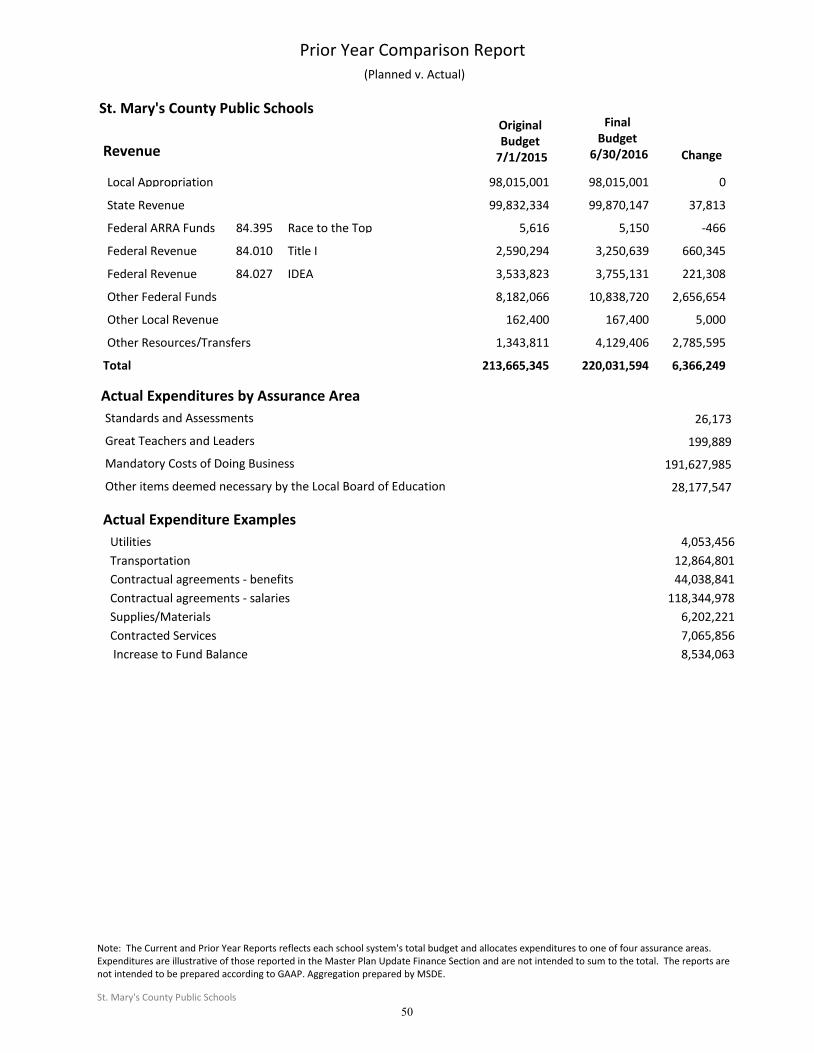
Original Budget
7/1/2015
Final Budget
6/30/2016 ChangeRevenue
St. Mary's County Public Schools
Prior Year Comparison Report (Planned v. Actual)
98,015,001 98,015,001 0Local Appropriation
99,832,334 99,870,147 37,813State Revenue
5,616 5,150 -466Federal ARRA Funds 84.395 Race to the Top
2,590,294 3,250,639 660,345Federal Revenue 84.010 Title I
3,533,823 3,755,131 221,308Federal Revenue 84.027 IDEA
8,182,066 10,838,720 2,656,654Other Federal Funds
162,400 167,400 5,000Other Local Revenue
1,343,811 4,129,406 2,785,595Other Resources/Transfers
213,665,345 6,366,249Total 220,031,594
Actual Expenditures by Assurance Area
26,173Standards and Assessments
199,889Great Teachers and Leaders
191,627,985Mandatory Costs of Doing Business
28,177,547Other items deemed necessary by the Local Board of Education
Actual Expenditure Examples
Utilities 4,053,456
Transportation 12,864,801
Contractual agreements - benefits 44,038,841
Contractual agreements - salaries 118,344,978
Supplies/Materials 6,202,221
Contracted Services 7,065,856
Increase to Fund Balance 8,534,063
Note: The Current and Prior Year Reports reflects each school system's total budget and allocates expenditures to one of four assurance areas. Expenditures are illustrative of those reported in the Master Plan Update Finance Section and are not intended to sum to the total. The reports are not intended to be prepared according to GAAP. Aggregation prepared by MSDE.
St. Mary's County Public Schools
50
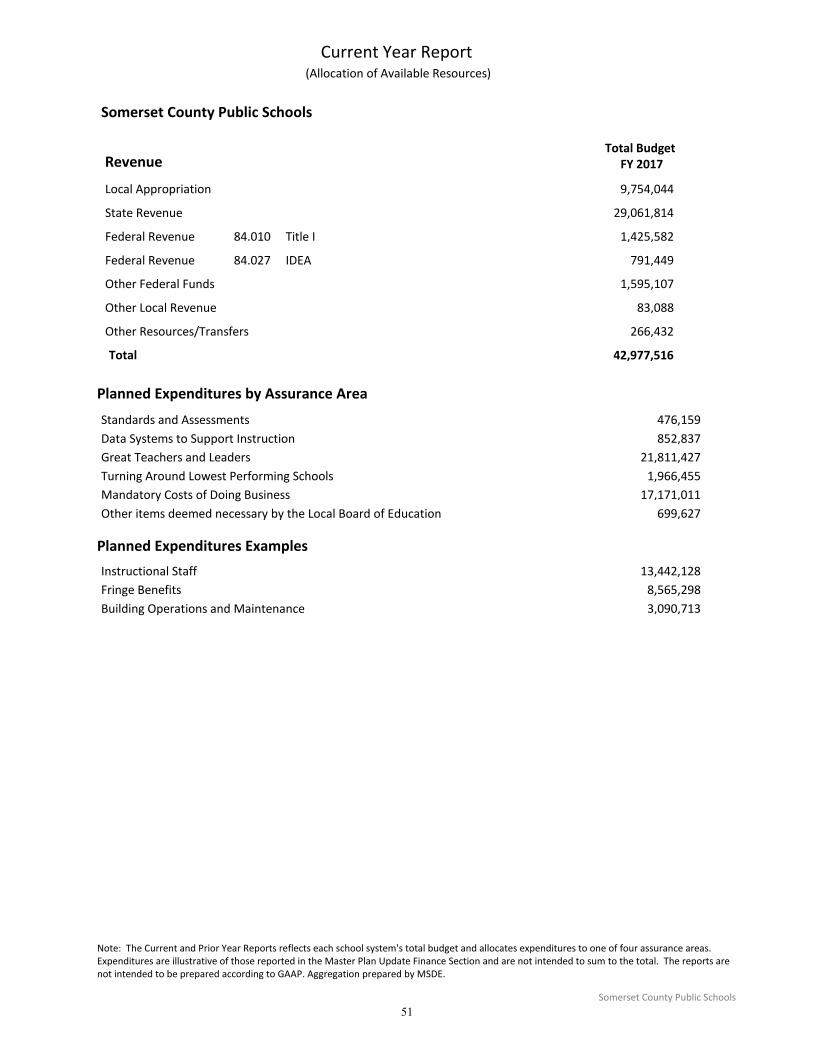
Somerset County Public Schools
RevenueTotal Budget
FY 2017
Current Year Report (Allocation of Available Resources)
9,754,044Local Appropriation
29,061,814State Revenue
1,425,582Federal Revenue 84.010 Title I
791,449Federal Revenue 84.027 IDEA
1,595,107Other Federal Funds
83,088Other Local Revenue
266,432Other Resources/Transfers
42,977,516Total
Planned Expenditures by Assurance Area
Standards and Assessments 476,159
Data Systems to Support Instruction 852,837
Great Teachers and Leaders 21,811,427
Turning Around Lowest Performing Schools 1,966,455
Mandatory Costs of Doing Business 17,171,011
Other items deemed necessary by the Local Board of Education 699,627
Planned Expenditures Examples
Instructional Staff 13,442,128
Fringe Benefits 8,565,298
Building Operations and Maintenance 3,090,713
Prior Year Comparison Report
Note: The Current and Prior Year Reports reflects each school system's total budget and allocates expenditures to one of four assurance areas. Expenditures are illustrative of those reported in the Master Plan Update Finance Section and are not intended to sum to the total. The reports are not intended to be prepared according to GAAP. Aggregation prepared by MSDE.
Somerset County Public Schools
51
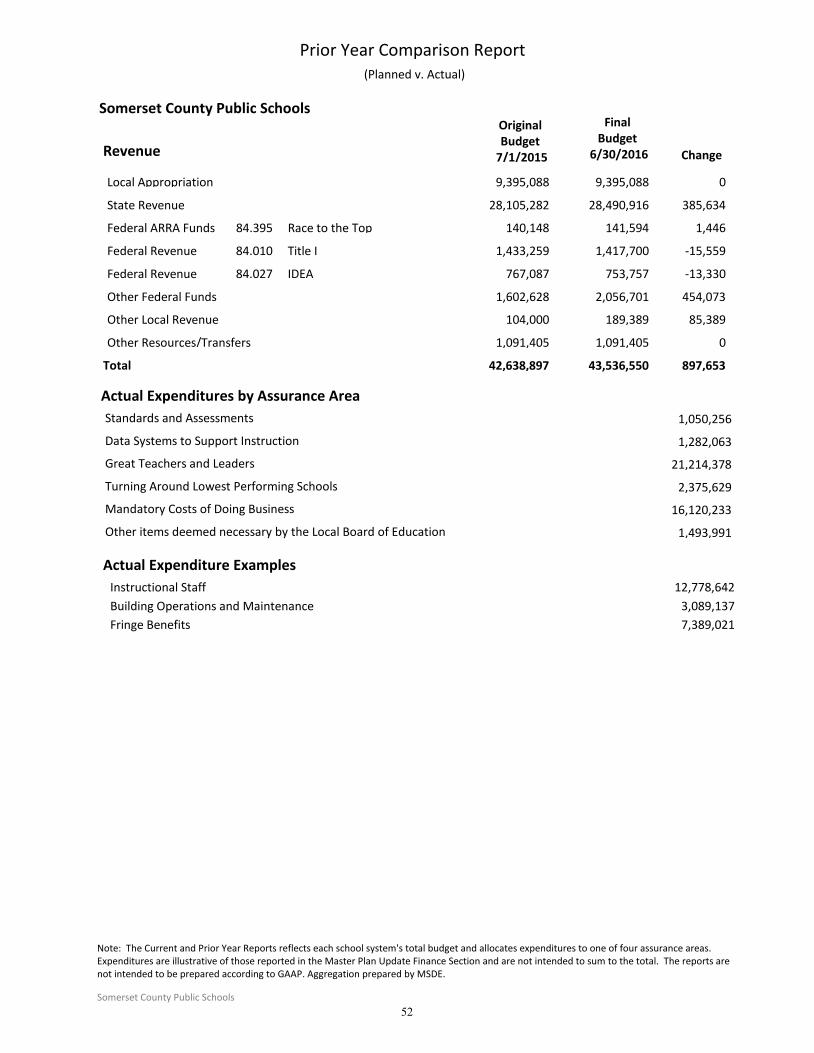
Original Budget
7/1/2015
Final Budget
6/30/2016 ChangeRevenue
Somerset County Public Schools
Prior Year Comparison Report (Planned v. Actual)
9,395,088 9,395,088 0Local Appropriation
28,105,282 28,490,916 385,634State Revenue
140,148 141,594 1,446Federal ARRA Funds 84.395 Race to the Top
1,433,259 1,417,700 -15,559Federal Revenue 84.010 Title I
767,087 753,757 -13,330Federal Revenue 84.027 IDEA
1,602,628 2,056,701 454,073Other Federal Funds
104,000 189,389 85,389Other Local Revenue
1,091,405 1,091,405 0Other Resources/Transfers
42,638,897 897,653Total 43,536,550
Actual Expenditures by Assurance Area
1,050,256Standards and Assessments
1,282,063Data Systems to Support Instruction
21,214,378Great Teachers and Leaders
2,375,629Turning Around Lowest Performing Schools
16,120,233Mandatory Costs of Doing Business
1,493,991Other items deemed necessary by the Local Board of Education
Actual Expenditure Examples
Instructional Staff 12,778,642
Building Operations and Maintenance 3,089,137
Fringe Benefits 7,389,021
Note: The Current and Prior Year Reports reflects each school system's total budget and allocates expenditures to one of four assurance areas. Expenditures are illustrative of those reported in the Master Plan Update Finance Section and are not intended to sum to the total. The reports are not intended to be prepared according to GAAP. Aggregation prepared by MSDE.
Somerset County Public Schools
52
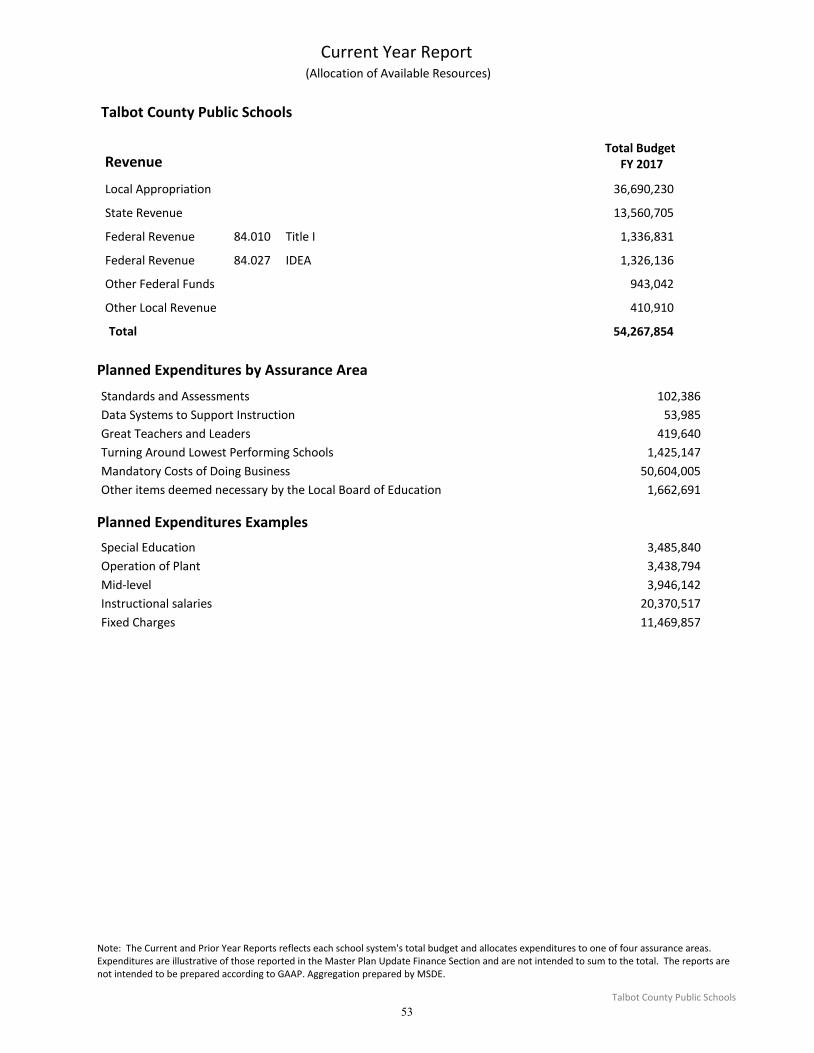
Talbot County Public Schools
RevenueTotal Budget
FY 2017
Current Year Report (Allocation of Available Resources)
36,690,230Local Appropriation
13,560,705State Revenue
1,336,831Federal Revenue 84.010 Title I
1,326,136Federal Revenue 84.027 IDEA
943,042Other Federal Funds
410,910Other Local Revenue
54,267,854Total
Planned Expenditures by Assurance Area
Standards and Assessments 102,386
Data Systems to Support Instruction 53,985
Great Teachers and Leaders 419,640
Turning Around Lowest Performing Schools 1,425,147
Mandatory Costs of Doing Business 50,604,005
Other items deemed necessary by the Local Board of Education 1,662,691
Planned Expenditures Examples
Special Education 3,485,840
Operation of Plant 3,438,794
Mid-level 3,946,142
Instructional salaries 20,370,517
Fixed Charges 11,469,857
Prior Year Comparison Report
Note: The Current and Prior Year Reports reflects each school system's total budget and allocates expenditures to one of four assurance areas. Expenditures are illustrative of those reported in the Master Plan Update Finance Section and are not intended to sum to the total. The reports are not intended to be prepared according to GAAP. Aggregation prepared by MSDE.
Talbot County Public Schools
53
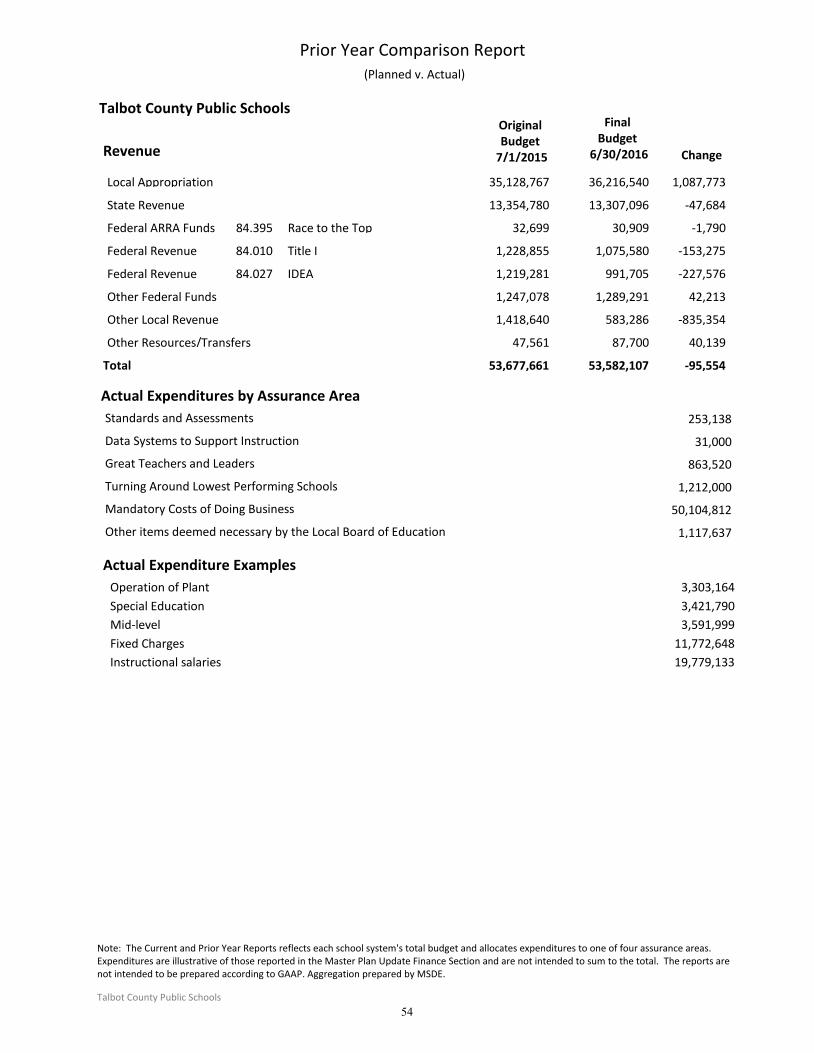
Original Budget
7/1/2015
Final Budget
6/30/2016 ChangeRevenue
Talbot County Public Schools
Prior Year Comparison Report (Planned v. Actual)
35,128,767 36,216,540 1,087,773Local Appropriation
13,354,780 13,307,096 -47,684State Revenue
32,699 30,909 -1,790Federal ARRA Funds 84.395 Race to the Top
1,228,855 1,075,580 -153,275Federal Revenue 84.010 Title I
1,219,281 991,705 -227,576Federal Revenue 84.027 IDEA
1,247,078 1,289,291 42,213Other Federal Funds
1,418,640 583,286 -835,354Other Local Revenue
47,561 87,700 40,139Other Resources/Transfers
53,677,661 -95,554Total 53,582,107
Actual Expenditures by Assurance Area
253,138Standards and Assessments
31,000Data Systems to Support Instruction
863,520Great Teachers and Leaders
1,212,000Turning Around Lowest Performing Schools
50,104,812Mandatory Costs of Doing Business
1,117,637Other items deemed necessary by the Local Board of Education
Actual Expenditure Examples
Operation of Plant 3,303,164
Special Education 3,421,790
Mid-level 3,591,999
Fixed Charges 11,772,648
Instructional salaries 19,779,133
Note: The Current and Prior Year Reports reflects each school system's total budget and allocates expenditures to one of four assurance areas. Expenditures are illustrative of those reported in the Master Plan Update Finance Section and are not intended to sum to the total. The reports are not intended to be prepared according to GAAP. Aggregation prepared by MSDE.
Talbot County Public Schools
54
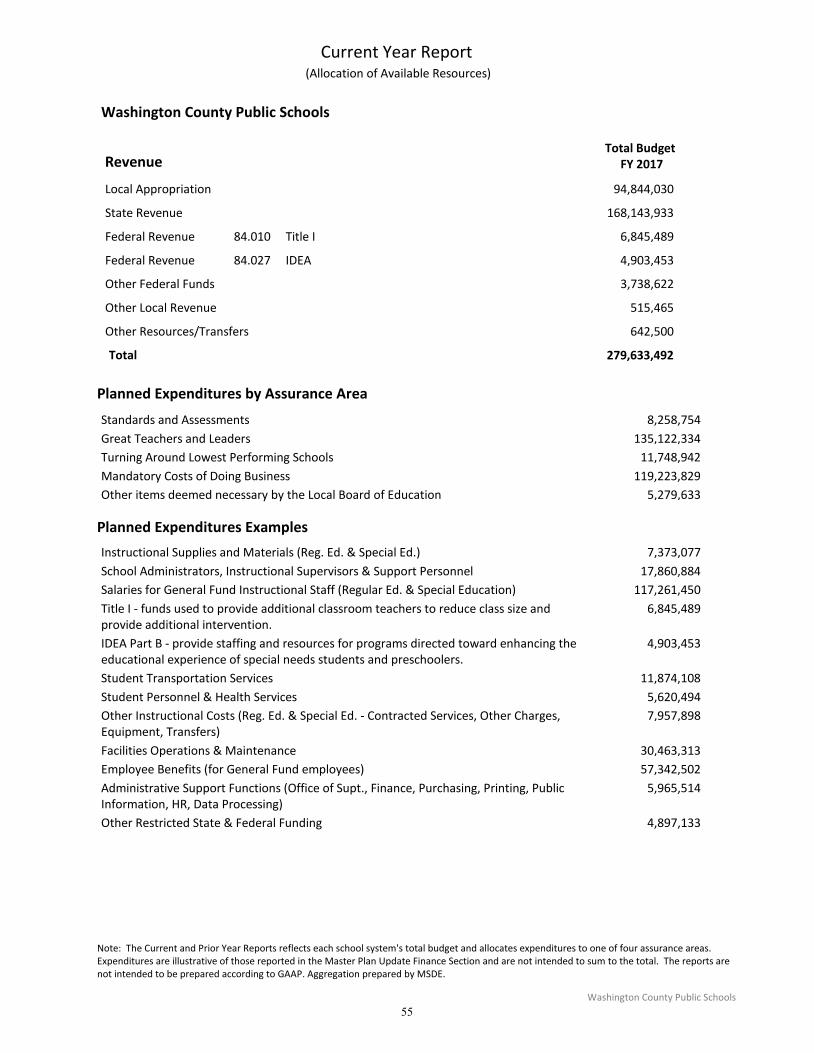
Washington County Public Schools
RevenueTotal Budget
FY 2017
Current Year Report (Allocation of Available Resources)
94,844,030Local Appropriation
168,143,933State Revenue
6,845,489Federal Revenue 84.010 Title I
4,903,453Federal Revenue 84.027 IDEA
3,738,622Other Federal Funds
515,465Other Local Revenue
642,500Other Resources/Transfers
279,633,492Total
Planned Expenditures by Assurance Area
Standards and Assessments 8,258,754
Great Teachers and Leaders 135,122,334
Turning Around Lowest Performing Schools 11,748,942
Mandatory Costs of Doing Business 119,223,829
Other items deemed necessary by the Local Board of Education 5,279,633
Planned Expenditures Examples
Instructional Supplies and Materials (Reg. Ed. & Special Ed.) 7,373,077
School Administrators, Instructional Supervisors & Support Personnel 17,860,884
Salaries for General Fund Instructional Staff (Regular Ed. & Special Education) 117,261,450
Title I - funds used to provide additional classroom teachers to reduce class size and provide additional intervention.
6,845,489
IDEA Part B - provide staffing and resources for programs directed toward enhancing the educational experience of special needs students and preschoolers.
4,903,453
Student Transportation Services 11,874,108
Student Personnel & Health Services 5,620,494
Other Instructional Costs (Reg. Ed. & Special Ed. - Contracted Services, Other Charges, Equipment, Transfers)
7,957,898
Facilities Operations & Maintenance 30,463,313
Employee Benefits (for General Fund employees) 57,342,502
Administrative Support Functions (Office of Supt., Finance, Purchasing, Printing, Public Information, HR, Data Processing)
5,965,514
Other Restricted State & Federal Funding 4,897,133
Prior Year Comparison Report
Note: The Current and Prior Year Reports reflects each school system's total budget and allocates expenditures to one of four assurance areas. Expenditures are illustrative of those reported in the Master Plan Update Finance Section and are not intended to sum to the total. The reports are not intended to be prepared according to GAAP. Aggregation prepared by MSDE.
Washington County Public Schools
55
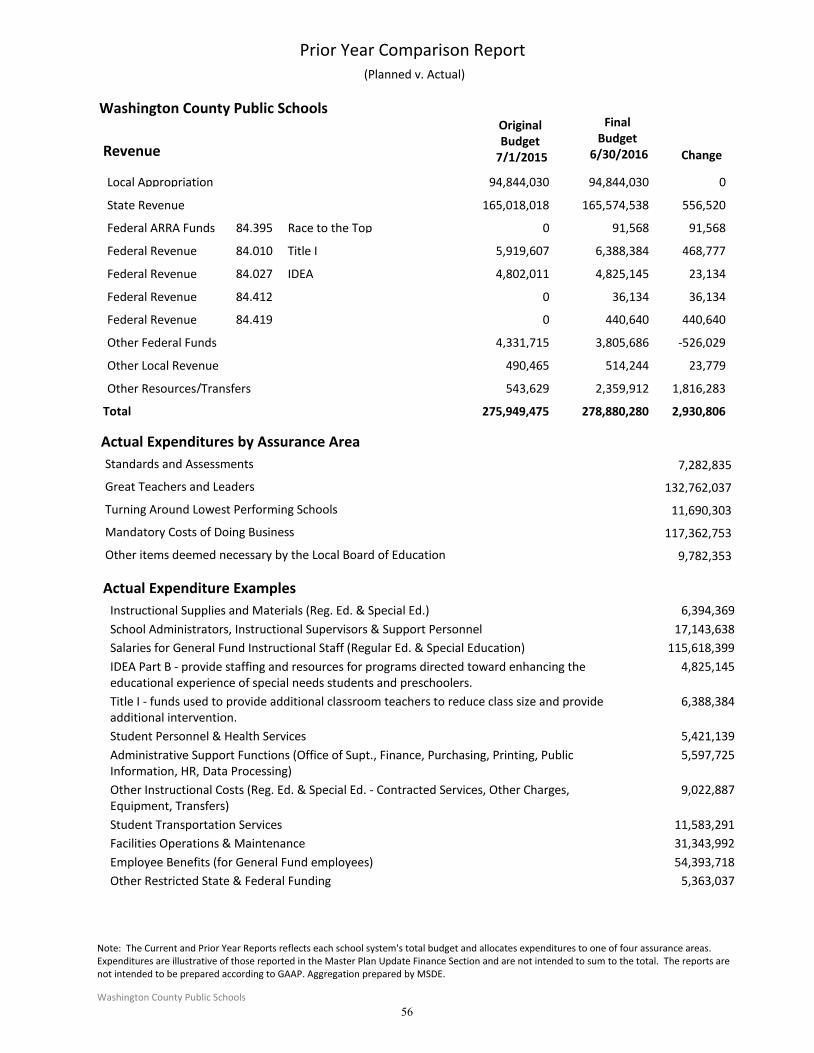
Original Budget
7/1/2015
Final Budget
6/30/2016 ChangeRevenue
Washington County Public Schools
Prior Year Comparison Report (Planned v. Actual)
94,844,030 94,844,030 0Local Appropriation
165,018,018 165,574,538 556,520State Revenue
0 91,568 91,568Federal ARRA Funds 84.395 Race to the Top
5,919,607 6,388,384 468,777Federal Revenue 84.010 Title I
4,802,011 4,825,145 23,134Federal Revenue 84.027 IDEA
0 36,134 36,134Federal Revenue 84.412
0 440,640 440,640Federal Revenue 84.419
4,331,715 3,805,686 -526,029Other Federal Funds
490,465 514,244 23,779Other Local Revenue
543,629 2,359,912 1,816,283Other Resources/Transfers
275,949,475 2,930,806Total 278,880,280
Actual Expenditures by Assurance Area
7,282,835Standards and Assessments
132,762,037Great Teachers and Leaders
11,690,303Turning Around Lowest Performing Schools
117,362,753Mandatory Costs of Doing Business
9,782,353Other items deemed necessary by the Local Board of Education
Actual Expenditure Examples
Instructional Supplies and Materials (Reg. Ed. & Special Ed.) 6,394,369
School Administrators, Instructional Supervisors & Support Personnel 17,143,638
Salaries for General Fund Instructional Staff (Regular Ed. & Special Education) 115,618,399
IDEA Part B - provide staffing and resources for programs directed toward enhancing the educational experience of special needs students and preschoolers.
4,825,145
Title I - funds used to provide additional classroom teachers to reduce class size and provide additional intervention.
6,388,384
Student Personnel & Health Services 5,421,139
Administrative Support Functions (Office of Supt., Finance, Purchasing, Printing, Public Information, HR, Data Processing)
5,597,725
Other Instructional Costs (Reg. Ed. & Special Ed. - Contracted Services, Other Charges, Equipment, Transfers)
9,022,887
Student Transportation Services 11,583,291
Facilities Operations & Maintenance 31,343,992
Employee Benefits (for General Fund employees) 54,393,718
Other Restricted State & Federal Funding 5,363,037
Note: The Current and Prior Year Reports reflects each school system's total budget and allocates expenditures to one of four assurance areas. Expenditures are illustrative of those reported in the Master Plan Update Finance Section and are not intended to sum to the total. The reports are not intended to be prepared according to GAAP. Aggregation prepared by MSDE.
Washington County Public Schools
56
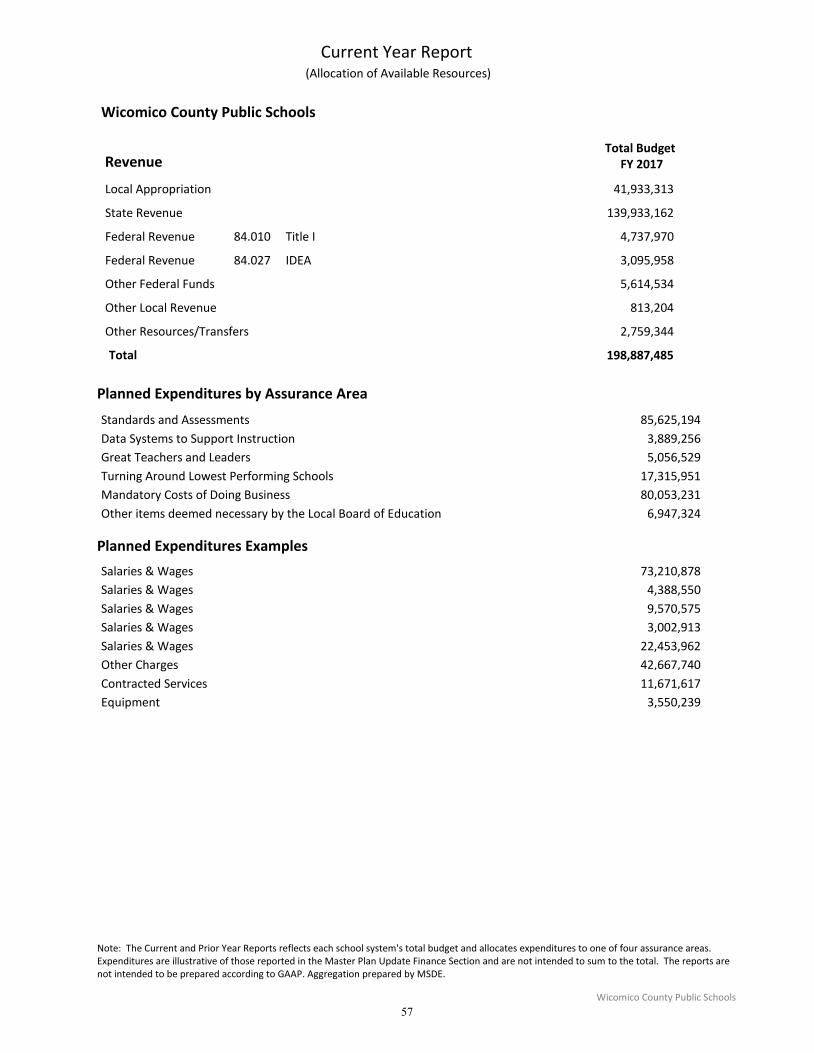
Wicomico County Public Schools
RevenueTotal Budget
FY 2017
Current Year Report (Allocation of Available Resources)
41,933,313Local Appropriation
139,933,162State Revenue
4,737,970Federal Revenue 84.010 Title I
3,095,958Federal Revenue 84.027 IDEA
5,614,534Other Federal Funds
813,204Other Local Revenue
2,759,344Other Resources/Transfers
198,887,485Total
Planned Expenditures by Assurance Area
Standards and Assessments 85,625,194
Data Systems to Support Instruction 3,889,256
Great Teachers and Leaders 5,056,529
Turning Around Lowest Performing Schools 17,315,951
Mandatory Costs of Doing Business 80,053,231
Other items deemed necessary by the Local Board of Education 6,947,324
Planned Expenditures Examples
Salaries & Wages 73,210,878
Salaries & Wages 4,388,550
Salaries & Wages 9,570,575
Salaries & Wages 3,002,913
Salaries & Wages 22,453,962
Other Charges 42,667,740
Contracted Services 11,671,617
Equipment 3,550,239
Prior Year Comparison Report
Note: The Current and Prior Year Reports reflects each school system's total budget and allocates expenditures to one of four assurance areas. Expenditures are illustrative of those reported in the Master Plan Update Finance Section and are not intended to sum to the total. The reports are not intended to be prepared according to GAAP. Aggregation prepared by MSDE.
Wicomico County Public Schools
57
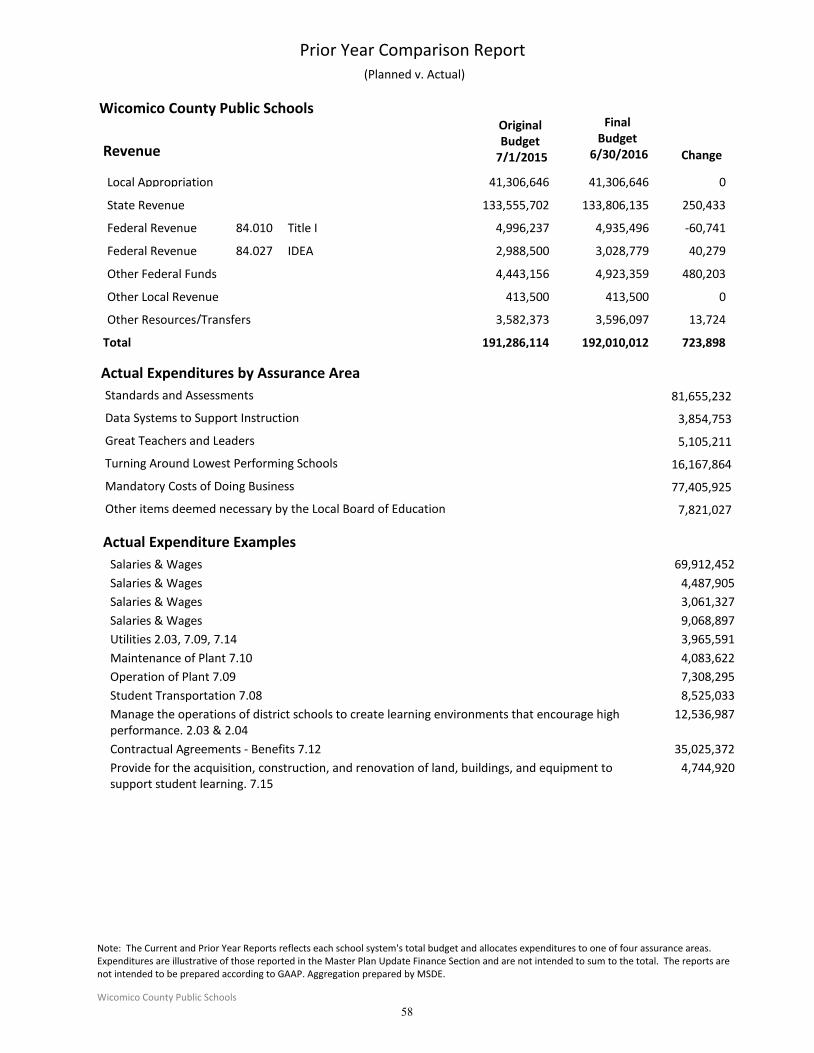
Original Budget
7/1/2015
Final Budget
6/30/2016 ChangeRevenue
Wicomico County Public Schools
Prior Year Comparison Report (Planned v. Actual)
41,306,646 41,306,646 0Local Appropriation
133,555,702 133,806,135 250,433State Revenue
4,996,237 4,935,496 -60,741Federal Revenue 84.010 Title I
2,988,500 3,028,779 40,279Federal Revenue 84.027 IDEA
4,443,156 4,923,359 480,203Other Federal Funds
413,500 413,500 0Other Local Revenue
3,582,373 3,596,097 13,724Other Resources/Transfers
191,286,114 723,898Total 192,010,012
Actual Expenditures by Assurance Area
81,655,232Standards and Assessments
3,854,753Data Systems to Support Instruction
5,105,211Great Teachers and Leaders
16,167,864Turning Around Lowest Performing Schools
77,405,925Mandatory Costs of Doing Business
7,821,027Other items deemed necessary by the Local Board of Education
Actual Expenditure Examples
Salaries & Wages 69,912,452
Salaries & Wages 4,487,905
Salaries & Wages 3,061,327
Salaries & Wages 9,068,897
Utilities 2.03, 7.09, 7.14 3,965,591
Maintenance of Plant 7.10 4,083,622
Operation of Plant 7.09 7,308,295
Student Transportation 7.08 8,525,033
Manage the operations of district schools to create learning environments that encourage high performance. 2.03 & 2.04
12,536,987
Contractual Agreements - Benefits 7.12 35,025,372
Provide for the acquisition, construction, and renovation of land, buildings, and equipment to support student learning. 7.15
4,744,920
Note: The Current and Prior Year Reports reflects each school system's total budget and allocates expenditures to one of four assurance areas. Expenditures are illustrative of those reported in the Master Plan Update Finance Section and are not intended to sum to the total. The reports are not intended to be prepared according to GAAP. Aggregation prepared by MSDE.
Wicomico County Public Schools
58
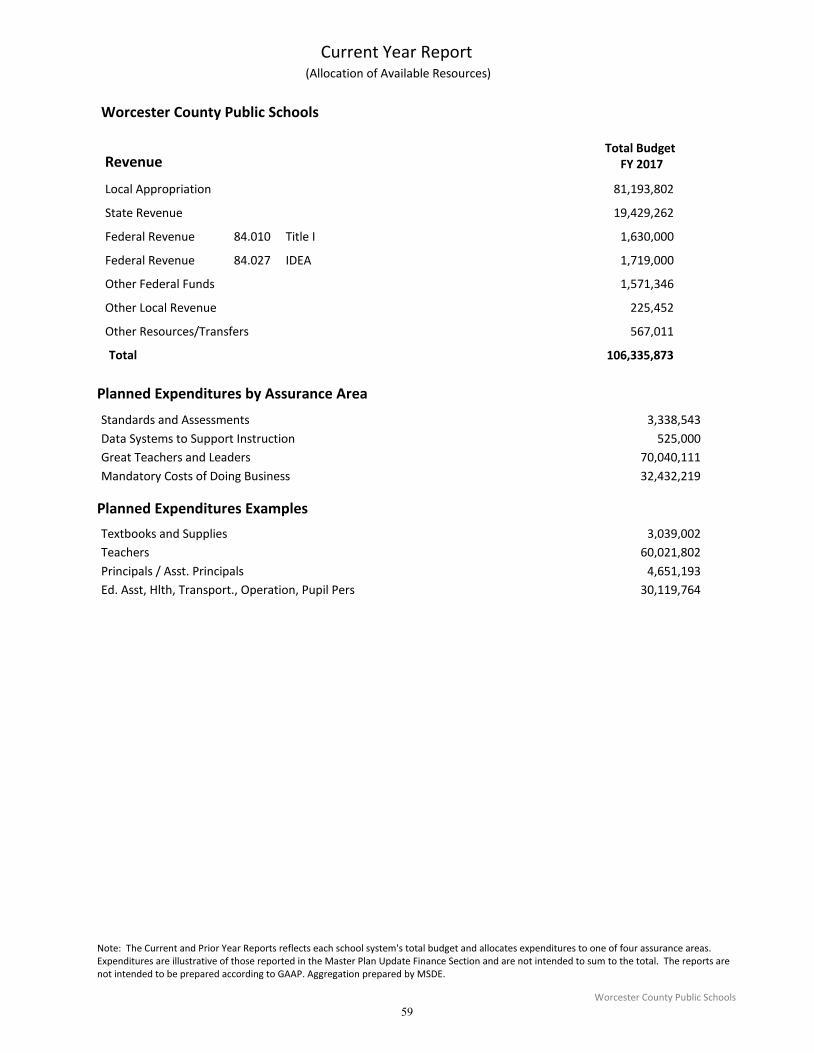
Worcester County Public Schools
RevenueTotal Budget
FY 2017
Current Year Report (Allocation of Available Resources)
81,193,802Local Appropriation
19,429,262State Revenue
1,630,000Federal Revenue 84.010 Title I
1,719,000Federal Revenue 84.027 IDEA
1,571,346Other Federal Funds
225,452Other Local Revenue
567,011Other Resources/Transfers
106,335,873Total
Planned Expenditures by Assurance Area
Standards and Assessments 3,338,543
Data Systems to Support Instruction 525,000
Great Teachers and Leaders 70,040,111
Mandatory Costs of Doing Business 32,432,219
Planned Expenditures Examples
Textbooks and Supplies 3,039,002
Teachers 60,021,802
Principals / Asst. Principals 4,651,193
Ed. Asst, Hlth, Transport., Operation, Pupil Pers 30,119,764
Prior Year Comparison Report
Note: The Current and Prior Year Reports reflects each school system's total budget and allocates expenditures to one of four assurance areas. Expenditures are illustrative of those reported in the Master Plan Update Finance Section and are not intended to sum to the total. The reports are not intended to be prepared according to GAAP. Aggregation prepared by MSDE.
Worcester County Public Schools
59
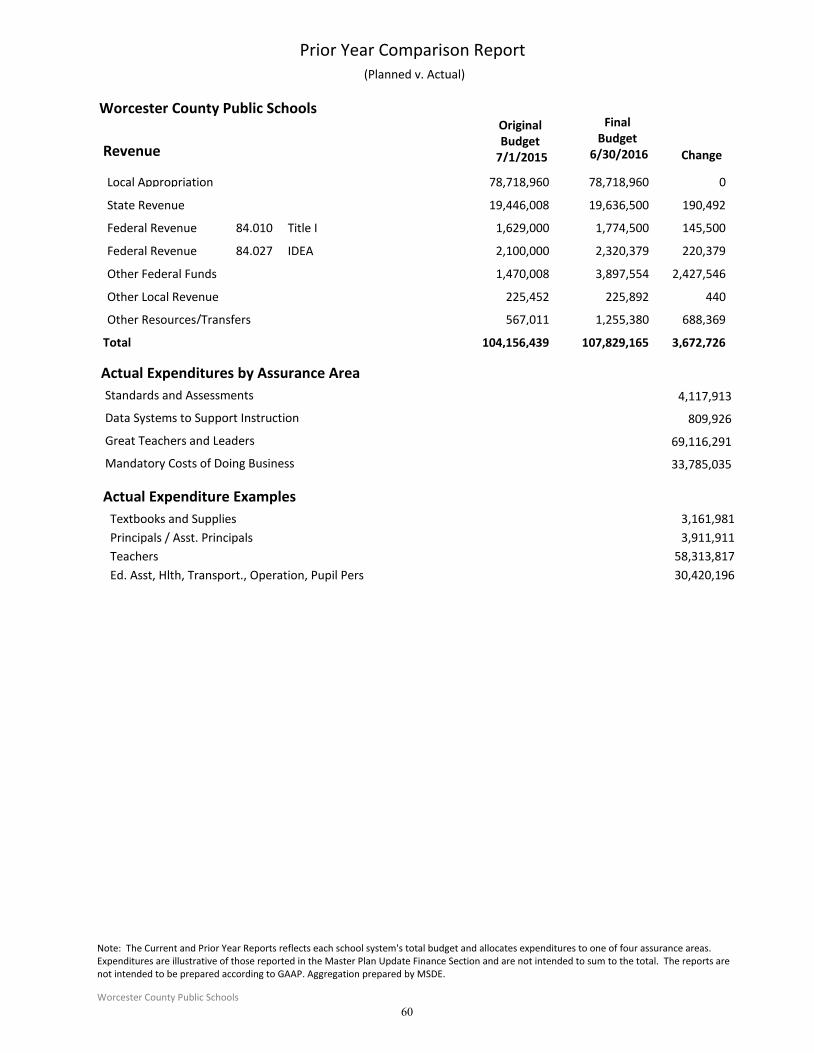
Original Budget
7/1/2015
Final Budget
6/30/2016 ChangeRevenue
Worcester County Public Schools
Prior Year Comparison Report (Planned v. Actual)
78,718,960 78,718,960 0Local Appropriation
19,446,008 19,636,500 190,492State Revenue
1,629,000 1,774,500 145,500Federal Revenue 84.010 Title I
2,100,000 2,320,379 220,379Federal Revenue 84.027 IDEA
1,470,008 3,897,554 2,427,546Other Federal Funds
225,452 225,892 440Other Local Revenue
567,011 1,255,380 688,369Other Resources/Transfers
104,156,439 3,672,726Total 107,829,165
Actual Expenditures by Assurance Area
4,117,913Standards and Assessments
809,926Data Systems to Support Instruction
69,116,291Great Teachers and Leaders
33,785,035Mandatory Costs of Doing Business
Actual Expenditure Examples
Textbooks and Supplies 3,161,981
Principals / Asst. Principals 3,911,911
Teachers 58,313,817
Ed. Asst, Hlth, Transport., Operation, Pupil Pers 30,420,196
Note: The Current and Prior Year Reports reflects each school system's total budget and allocates expenditures to one of four assurance areas. Expenditures are illustrative of those reported in the Master Plan Update Finance Section and are not intended to sum to the total. The reports are not intended to be prepared according to GAAP. Aggregation prepared by MSDE.
Worcester County Public Schools
60
Recommended