The 43rd European Congress of the Regional Science Association Jyväskylä, Finland
27th-30th August 2003
The Economic and Spatial Peripherality of Border Regions in Southeastern Europe
Gülden ERKUT Professor of Regional Planning, Istanbul Technical University
Department of Urban and Regional Planning, Regional Planning Section Taşkışla cd. Taşkışla/Taksim, 80191, İstanbul/Turkey Tel. +90 212 2931300/2326, Fax: +90 212 5144895
e-mail: [email protected]
Ceren ÖZGEN Research Asisstant,Istanbul Technical University
Department of Urban and Regional Planning, Regional Planning Section e-mail: [email protected]
Abstract
The aim of this paper is to analyse the core-periphery pattern of Europe with a special interest to the economic and spatial peripherality of border regions in South-eastern Europe. In this respect, some statistical calculations and data in NUTS II level are used to examine the regional disparities between the countries and regions. The result is that there are serious regional inequalities that are deepened after enlargement and are supporting the continuity of well-known core-periphery pattern in Europe. The most depressed areas in South-eastern Europe are the border regions to the detriment of poor infrastructure and undeveloped economic activities. The Capitals and metropolitan cities are the certain foci of high value-added economic activities and take the highest share of GDP. On the contrary, employment by the agricultural sector is mostly in the border regions, which means economic peripherality has an impact upon spatial peripherality. In respect to these findings promoting programs to constitute cross-border co-operations in the South-eastern Europe has a key role to develop the relations among these countries and to overcome the inequalities in the region both in economic and spatial terms. Key words: core-periphery, cross-border co-operations, South-eastern Europe

1. INTRODUCTION
The changes in the economic trends of the world, especially after 1980s, with the increase
in the flows of capital, human resources, goods and knowledge moves upon the
reorganisation of the socio-economic and spatial structure of the regions both in global
and local context. These flows created a room for the economic and political
organisations that are more complex, dynamic and interdependent to each other. Hence,
the increase of interaction among regions generated a need for restructuring the political
and instutitional environment in regard to the local issues. In this process, regions that
can adapt to these new conditions took the advantages of the new economic system and
had the chance to catch up with the leading regions while others did not. The changes in
the new production system have created many specialised areas that can corporate for
various activities both in inter-regional and intra-regional scale. Thus, while the
opportunities provided by flexible production lead to spatial concentration, on the other
hand in intra-regional level spatial clusters, that are in various location, functionally
differentiated, and organisationally distinct enterprises, lead to spatial agglomeration that
lowers the transaction costs and provoke migration of new producers in some certain
regions as Coffey and Bailley (1994) mentioned in their earlier work.
Some of the regions grow rapidly than others. There are many regions that their gross
domestic product (GDP) values are higher than their national average such as Karlsruhe
(Germany), Antwerpen (Belgium), Ile de France (France), Wien, (Austria), and Inner
London (United Kingdom). The regions developing in this particular trend influenced the
growth pattern of other regions. Accordingly, the existing gap among countries and
regions widened and inequalities constitute serious problems for many countries both in
economic and geographic space.
Openness of the economies to the world markets with technological improvements both
in communication and transportation (infrastructure) accelerated the unequal
development of regions (Erkut, G., 1997). The increase in the accessibility speed up the
development of regions. Regions having better initial conditions such as skilled labour,

natural resources, cheaper land values, and being geographically closer to leading
regions/core areas developed faster than others and the socio-economic divergence
among regions widened. While core became the certain foci of economic and political
decision-making, remote regions including border areas were mostly in a process of
stagnation.
During recent decades world moved towards integration. Borderland have become
important for nation-states as significant interlinks. One of the most significant binding of
this integration is the transportation networks which lead the mobility of people, freight,
and oil among the regions. Therefore, the cross connections of the networks and stops
become the appropriate settlements for the development of selected peripherial regions.
These connections not only provide an opportunity for economic activities, it can also be
a transit route for that of intensive movements through the border areas.
This study discusses the depressed situation of the border regions that are mainly the
periphery of the countries and are supported by community financial instruments in order
to improve their lagging situation in the European territory. In this respect, it is argued
that whether economic peripherality moves the spatial peripherality and affects the
spatial agglomeration of population and economic activities. After discussing the detailed
theoretical background by using GDP, population, labour force, unemployment values,
these arguments will be measured. Than, the role of border regions in the enlargement
and socio-economic integration process will be explained in reference to the European
Spatial Development Perspective. Moreover, special concern will be paid to South-
eastern Europe (Bulgaria, Greece, Romania, Turkey) and to the regions displaying
economic difficulties in border areas. In conclusion, in the European context the finding
is that peripherality is not only an economic, but also a spatial concept. In the study area
peripheral regions are one of the basic concerns and their disadvantaged situaton is tried
to be overcome in every level of authority by implying regional and local level supports,
especially considering the key role of the border regions which are primary gates of
countries to the international area.
2. CORE-PERIPHERY CONCEPT and EUROPEAN INTEGRATION
As mentioned introductory session, increasing regional disparities in the world
constituted the core-periphery concept becomes the main issue for a plenty of socio-
economic studies in the late twenty first century.
Conventional core-periphery concepts underlines the dualist structure of economic and
spatial development among most of the regions. This stiuation is affected by the
economic polarisation which inevitably leads to geographical polarisation which is
formed by the investment booms in certain places (Copus, 2001). This means
peripherality is not only an economic but also a spatial concept. The regions having
stronger economic structure, accessible to the world markets and feed by relatively
better/cheaper transportation links realise two basic adequacy of being a core. “The
important role of transport infrastructure for spatial development in its most simplified
form implies that areas with better access to the locations of input materials and markets
will, ceteris paribus, be more productive, more competitive and hence more successful
than more remote and isolated areas” (Linneker, 1997).
From this point of view, according to the opinion of many researchers the core-periphery
concept is widely measured by accessibility: 1. lower transportation costs and 2. the
volume of the economic activitiy. Lash&Urry, in 1994, interprets the transfomation of
core from the beginning of the century to-day as: “the old Fordist, organized capitalist
core was characterized by a set of producer networks clustered around a heavy-industrial
hub of the motor, chemicals, electrical and steel industries. Finance, services and
distribution functions were either subordinate to, or driven by, this industrial production
function. This old order has been significantly undermined by two processes. The first is
the disintegration of the old core with finance, distribution, property, service and
knowledge and R&D functions each taking on their autonomy. The second is the
formation of a new core, one in which ‘the post-industrial tail of the old order begins
effectively to wag the Fordist and industrial dog’. The new core is clustered around
information, communication and the advanced producer services, as well as other

services, such as telecommunications, airlines and important parts of tourism and leisure.
Spatially many of these services are centred around global cities, located in vast
agglomerations, whose industries feed these services. In terms of economic significance,
the most important development in the localization is what we may call ‘globalized
localization’”.
Thus, it is clear that in today’s world the core is dominant and reshapes the periphery
through institutional changes in the form of “structural differentiation and functional
integration (Lash&Urry)”. Core is mostly the place where new trends and images are
created and disseminated, in addition they are the gates through which the countries get
in contact with the world markets. Moreover, today’s economic order does not offer so
many opportunities for the states in order to overcome the regional inequalities. On the
contrary, the periphery that can adapt to new conditions of the world system grow with or
in relation to core areas, yet this is not the case for whole underdeveloped areas having
“weak agglomerative economies, poor R&D sector, dependency on primary sector etc.
(Copus, 2001)”.
One of the main reasons for the political and economic integration attempts of states that
are affected by globalisation is to improve the economic situation of the countries and to
overcome the existing regional disparities in a more comprehensive way. European
Union is an attempt for such kind of integration that aims the development of European
economy and it interprets this consolidation as a basic need for economic and cultural
prosperity of Europe. Even there exist many socio-economic disparities and cultural
diversity among the European countries, the EU is aiming to create the cohesion. The
main reason as stated in Maastricht Treaty for integration is that the authorities believe
the cohesion between societies will contribute to the economic development of the EU.
An extensive literature search was undertaken in support of the data analysis on
economic and social cohesion in the Central and European Countries (CEECs) and the
effects of enlargement. Cohesion is not a straightforward concept and can be interpreted
in various ways. For some, it implies a level of stability in territorial and social relations;

for others, it involves a process of convergence in disparities between regions and social
groups. The features of EU regional socio-economic patterns are well-known: regional
dis-parities across the EU are wide by international standards, and there is a significant
core-periphery disparity in regional GDP per head and (partly) in regional unemploy-
ment. ("Enlargement and Cohesion"–Background Study for the 2nd Cohesion Report,
2001)
Population, GDP and unemployment values are the main indicators mostly used to
explain the peripherality. In reference to 2nd Cohesion Report, the values in the Table 1
determine the situation in the core and periphery regions of the EU27 in NUTS
(Nomenclature of Statistical Territorial Units) II level. Indicators for regions are grouped
according to the peripheral states in terms of economic and spatial pattern of EU27. The
core of Europe is defined as the area covering the western Germany, North-eastern
France, Belgium, Netherlands, central and South-eastern England or in other terms ‘the
pentagon defined by London, Paris, Milan, Munich and Hamburg’ (ESDP, 1999).
Figure 1: The Core and The Peripheral Regions in Europe
EUROPEAN UNION
CORE REGIONS London, Paris, Milan, Munich and Hamburg (The pentagon defined by these regions)
PERIPHERIAL REGIONS
Portugal, Spain, Finland, Sweden, Greece, Southern Italy, Ireland, Northern England, Poland, Latvia, Lithuania, Estonia, Czech Republic, Slovakia, Slovenia, Turkey, Bulgaria, Romania,

Map 1: Central and Peripheral Regions of Europe
Source: "Enlargement and Cohesion" – Background Study for the 2nd Cohesion Report, 2001
Some parts of the countries and also some of the countries that are not metioned in
Figure 1 are the areas that are in the intermediate level of socio-economic situation and
are defined as “other regions”. In addition, the eastern side is also an intermediate tone
between two primary colors that is; the cultures of East and West.
The European Union has had a number of demographic surprises over the last 30 years.
Fertility levels have dropped dramatically (EU15: from ±2.4 to almost 1.4 children per
woman), life expectancy has continued to increase strongly (EU15: for males from 68.4
to almost 75 years, and for females from 74.7 to 81 years) and all Member States of the
EU have become immigration countries.

Even the central area in km2 is covering only 14% of total land, the amount of
population, that is more or less close to that of periphery, is more than one third of the
total EU’s in the centre. Therefore, the density (269 person per km2) and growth rate of
population (0.4% between 1991-1999) that is mostly rised due to immigration in the
central regions are significantly higher than that of periphery.
Map 2: Regional Population Growth by NUTS II Level
Source: Cruijsen, Eding, Gjaltema, 2002

For example in Belgium, population growth was the consequence of a net migration
exceeding any natural decrease. Similar situations were recorded in Germany’s Hannover
region where natural increase is negative but net migration is positive (Eurostat, Theme
1-6/2002).
Table 1: The Indicators of Core&Periphery Regions in the EU27
Source: "Enlargement and Cohesion" – Background Study for the 2nd Cohesion Report, 2001

By the time being the population is stagnating at the peripheral regions. On the other
hand, density of population in the core is seven times larger than the periphery, and yet
the total area in the periphery is four times larger than that of the core. The concentration
of population in certain areas is a unique demographical development pattern of the EU
both in member states and in candidate countries.
In addition, the indicators of the GDP values (in NUTS II level) in centre is almost twice
as the periphery and 50% of the EU’s total GDP, even the amount of population living in
these areas is almost same. While the economic activities are carried out by the service
sector in the core, in peripheral regions significant number of people are employed by
agricultural sector that is a less value-added economic activity.
As we can see in the map below agricultural employment is much higher at the periphery;
along the Eastern border of EU27 and in Portugal with the Southern Spain and Southern
Italy. Industrial employment is obviously high in the Central Europe. It is also highest in
Central Romania and Bulgaria which are producing heavy industrial materials. On the
contrary, employment in services are concentrated in core regions of the EU as
mentioned previously and along the Southern France, Italy and Spain.
This differences between core and periphery affects the spatial characteritics of the
regions. The national boundaries of states are one of the obstacles aganist the betterment
of the periphery because of the fragmented spatial pattern created by the existance of
borders. Added to this, lack of poor transport infrastructure badly affects the economic
advancement of candidate countries and the regional disparities among regions expand.
In contrast, the core is an attractive place for the investments due to the developed
infrstructure and well-educated human capital. On the other hand, peripheral areas have
“comperative price advantages of production factors” (Keeble, 1988). For instance,
between 1997-2000 FDI flows received by the CCs doubled,and Poland, the Czech
Republic, Turkey and Hungary were the main recipients of FDI. In 1997, they were the
target of 69% (Eurostat, 2002) of the total among the candidate countries.

Map3: Employment by Sector in Europe
Source: First Progress Report on Cohesion, January 2002
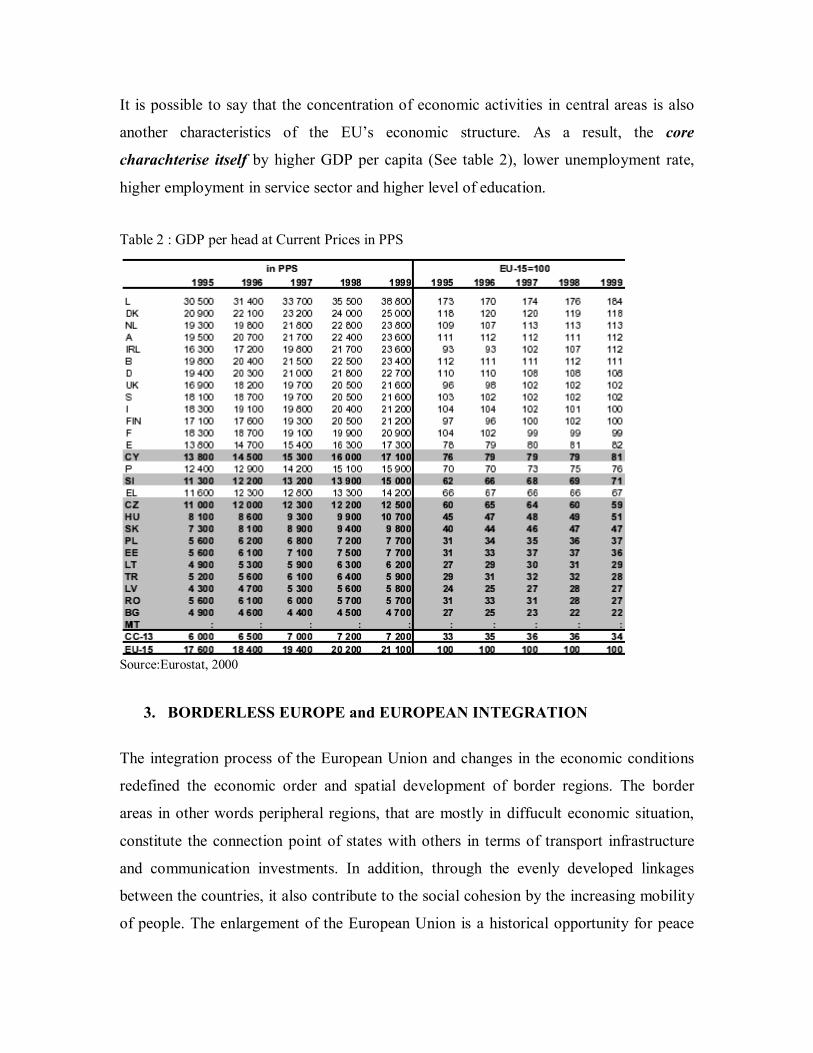
It is possible to say that the concentration of economic activities in central areas is also
another characteristics of the EU’s economic structure. As a result, the core
charachterise itself by higher GDP per capita (See table 2), lower unemployment rate,
higher employment in service sector and higher level of education.
Table 2 : GDP per head at Current Prices in PPS
Source:Eurostat, 2000
3. BORDERLESS EUROPE and EUROPEAN INTEGRATION
The integration process of the European Union and changes in the economic conditions
redefined the economic order and spatial development of border regions. The border
areas in other words peripheral regions, that are mostly in diffucult economic situation,
constitute the connection point of states with others in terms of transport infrastructure
and communication investments. In addition, through the evenly developed linkages
between the countries, it also contribute to the social cohesion by the increasing mobility
of people. The enlargement of the European Union is a historical opportunity for peace

and prosperity in Europe (European Commission, 2000). Discussions on the key role of
border regions in the prosperity of Europe in terms of disadvantaged socio-economic
situation of border regions affects the political desicion-makers in terms of enhancing the
importance of these areas.
Political internationalisation in the European territory created a room for co-operation
between the regions of different countries. The reasons to focus on such kind of co-
operation are first the aim towards regional development and, secondly, European
integration (Van der Veen, A., Boot, D.J., 1995). The new approach of regional
development ‘based on network relationships among various urban centres and indicate
new development trends’ whereas these relationships essential the complementarity and
specialisation of each individual region (Cappellin, R., 1993). In this respect, border areas
that are the primary gates of countries openning to the international area have become the
major links, although they are traditionally in depressed economic situation and in
‘geographically peripheral position’(Van der Veen, A., Boot, D.J., 1995).
The removal of national barriers within the European Community (EC), and the
development of economic and political relationships within the European countries
external to the EC, imply a new geo-economic order in Europe and a change in the
hierarchical relationships between the various regional and urban production system. The
cross-border co-operation-national co-operations will lead to a change in the spatial
organisation of Europe (Cappellin, R., 1993). The transformation of production system
will reorganise the distribution of economic activities. As regional disparities among the
countries became a serious problem especially after enlargement, cross-border co-
operation-national co-operation is regarded as the new economic organisation
contributing the elemination of disparities. Hence, the new spatial dimension of border
regions might improve the disadvantaged situation of these areas that are charachterising
peripheral features especially at the Eastern side of European Union. The flows such as
‘cross-border migration refers mainly to commuting for work purposes between two
regions of different countries. With the high differences income at most of the national
borders, cross border migrants are supposed to be mainly motivated by economic reasons.

Space, making it attractive to combine low levels of cost of living standarts with high
income from neighbouring wealtier regions’ (Danube Space Study, July 2000).
The openning of the internal market will lead to increase the competition. Border regions
will intensively be affected more by enlargement than the other regions, their proximity
to candidate countries will offer new possibilities (Danube Space Study, July 2000).
While the diversification of activities at the borders will progress the economic situation,
the increasing cross-border co-operations will lead to the agglomeration of population
and economic activities in these regions that are defined as the periphery suffering from
‘low densities of population’ (Illeris, S.,1995) and that of economic activities. Finally,
Border regions could thus become new growth areas with positive
spread effects on both sides of the border*
* European Commission, 2000,” Community Action for Border Regions”
Community initiatives INTERREG, and its approach to ‘co-operation beyond national
borders’ (ESDP, 1999) is the key role of applying the ESDP increases the prominance of
interaction between neighbouring regions.
Despite the growing opportunities for border regions in terms of generating their
economic relations, the economic gap/divide, that is an obstacle in the development
process, is especially visible along large parts of the EU’s border with candidate countries
(European Commission, 2000). The improvement of the disadvantaged situation of
border areas are based on two main necessities such as:
1. socio-economic situation of border regions
2. the need for strengthening the competitiveness of border regions
Compared to EU average, border regions are characterised by lower density of
population, higher unemployment rate of young population, a higher concentration of
employment in agriculture, an avreage concentration in industry and a lower

concentration in services. According to the Second Background Study for the Cohesion
Report, socio-economic indicators for border regions determine distinctively the
demographic and economic differences of the member states’ and candidate countries’
borders.
Map 4: Border Regions in Europe
Source: "Enlargement and Cohesion" – Background Study for the 2nd Cohesion Report, 20

Tabl
e 3:
Soc
io-e
cono
mic
Indi
cato
rs fo
r Bor
der R
egio
ns
So
urce
: "En
larg
emen
t and
Coh
esio
n" –
Bac
kgro
und
Stud
y fo
r the
2nd
Coh
esio
n Re
port,
200
1

The borders with the external states are the most deteriorating areas. The regions that can
develop co-operations beyond the borders improve thier economic situation while other
cannot benefit from this new organisation pattern. One distinct observation is that there
are substantial differences in terms of economic situation and transportation between the
Eastern and Western sides of the border of European Union and candidate countries.
On the other hand, candidates bordering the EU benefited from the locational advantage
considerably more than the others. Proximity to the EU stimulated markets and
European Union Candidate Countries Population is less in the border areas
Most of the population lives in the border areas
Population Population living in the border regions is located within the EU-15 border
Population living in the border regions is located along the EU-15 border
Population density is the highest in non-border regions
Population density is the highest in non-border regions Population
Density Population is highly populated along the borders with candidate countries
Population is highly populated along the borders with candidate countries
Unemployment rate of the EU-15 is below the average of the EU-27 (9.4%-9.6%) Unemployment rate is lower along the borders within EU-15 Unemployment
The highest unemployment rate is along the borders with other (non-European) countries (13.0%)
Unemployment rate of the CEEC is above the average of the EU-27 (10.3%-9.6%)
The highest value belongs to the non-border regions
There is not significant differences of the values between border and non-border regions GDP per head
PPS, EU26=100 The lowest GDP value, which is below the EU-26, is along the border regions with other countries
The GDP value is considerably higher in all borders with EU
The highest value of length of the motorways is in the non-border regions that is in the territory of internal EU-15
The highest value of length of the motorways is in the non-border regions that is in the territory of internal CEEC
The motorways are evenly constructed in the EU-15 territory
The lowest value in length of the motorways are in borders with other candidate countries
Transportation
The length of the motorways in all of the borders of the EU with candidates is almost 3 times higher than candidate countries’ borders with EU
encouraged investments into these areas. For instance, in 1999 Czech Republic took 25%
of total inward FDI into the candidate countries. (Eurostat, Theme 2-3/2002) Added to
these Community financial instruments and transport network projects aim to provide
better connectivity among the candidates and the EU member countries. In respect to
these developments, in the next part the demographic and economic situation in South-
eastern Europe will be discussed in terms of its peripherality in Europe.
4. THE CASE: SOUTH-EASTERN EUROPE (SEE)
The reason to focus on SEE (Greece, Bulgaria, Romania and Turkey) is to examine one
of the most peripheral regions of the EU territory and to examine how they are trying to
integrate to the West in regard to the border regions’ development. In this part, the
concern of the course is the demographic and economic situation of SEE and how it is
differentiated from western Europe. Secondly, the economic situation of the border
regions in the SEE territory will be explained with its development trends by the impact
of trans-European Networks and Commission initiatives in the region. In conclusion, the
benefits of the cross-border co-opretions will be discussed considering the development
and betterment of the area which is also a historical trade route from past to-day.
From prehistoric times to present, this route is used to be the main axle for traders who
introduce the richness of the east to the diversity of the west. Although SEE is on this
historical transit route, there are some infrastructural challenges which the European
Union is trying to overcome by investing in transportation projects such as Trans-
European Networks (TENs) that will enhance the interconnectedness among the regions.
The indicators of South-eastern Europe point out that the region determines peripheral
characteristics in regard to the EU. In reference to the findings of many studies such as
Keeble, Wegener&Spierkermann, Talaat&Schürmann and Copus, who used GDP,
unemployment, population, accessibility and the volume of the economic activity, the
countries located in this region have values mostly lower than the average values of
European Union.

In South-eastern European countries, while the population and economic activity are
concentrated in the capitals, other regions, especially most of the border areas, are
suffering from emigration, low density of population, high unemployment rates –young
and women-, low GDP and low accessiblity values that can also used to define the
peripherality considering the indicators of European Union countries.
It is important to explain that the border regions closer to the EU15 border are not in
unfortunate position as the regions having borders with the other non-European
countries. The economic development of the EU countries spread to areas which catch
the chance to take the advantage of being close to its developed neighbour. For instance,
at the Western border of Slovakia, that is also a Central and Eastern European Country,
there is significant improvements at the Slovakian border that is the neighbour of Austria
and benefits from the permability among the borders. At the end of 1999 investments per
capita increased four times (83,761) that of in 1985 (21,06) in Bratislava.
The SEE covering the 20% of population of the EU28 (including Turkey) has a polarised
socio-economic structure. The differences between urban and rural areas leads unequal
spatial development. The rural areas and border regions are deteriorating economically
and demographically whereas big cities are growing and are being the foci of
investments. The capital cities are inhabiting the highest share of national population. In
especially Bulgaria and Romania that were in transition period after 1990s, migration and
the concentration of population in capitals have significantly increased.
Table 4: The Share of Population in Capital Cities of SEE Country Capital City Year Share of Population % Bulgaria Sofia 1999 14,8Greece Attica 2000 38Romania Bucharest 1998 10,2Turkey Istanbul** 2000 14* Source: Petrakos, G., Economou, D., 2002
*National Statistics Institute, 2002 , **In Turkey the highest share of population is concentrated in Istanbul,
even though it is not the capital city but the capital of Ottoman Empire for centuries. The capital city
Ankara also takes high share from the distribution of population.

The population, most of them well-educated and young- migrated from rural to urban
areas in order to find jobs and to have better living standarts. In this period the only
population increase occured in Sofia, though the general trend of population growth is
minus in all regions from the beginning of the 1990s. “Bulgaria and Romania had
enormous emigration losses in the transtion period. More than 500 000 Romanian
citizens left their country (...) due to the unfavourable economic situation. Romania has
also became a gateway for migrants from the Third World whose destination is Western
Europe” (Danube Space Study, 2001). In addition, in Bulgaria between 1989 and 1996,
650 000 emigrants have left the country.
The situation in Turkey is different from other countries. The natural growth rate (1.8%)
is still increasing even it slowed down in recent years. In Istanbul, that takes the highest
share of population in the country, the natural increase of population decelerated, on the
contrary, immigration strongly affects the growth of population Until 1980s, immigration
form Eastern periphery to the metropolitan cities and abroad was the main characteristics
of the growth pattern of population. After 1980s although the mobility of population
stabilised, the concentration of population in certain cities increased the existing core-
periphery dualism of the country to the detriment of the Eastern borders that have
severe socio-economic problems and lack of opportunities.
The similar immigration pattern which “caused a very uneven geographical distribution
of Greek industry” occured in Greece that “between 1970-1980 1.7 million people moved
to two major cities, Athens and Thessaloniki” (Siriopulos, Asteriou, 2001). As seen in the
Table 4, the concentration of population in Attica creates a significant demographic and
spatial seperation between this city and the rest of the country.
The dominant core-periphery pattern keep up the increasing regional disparities in the
South-eastern Europe and the unfavourable situation of border regions. The border
regions that are especially neighbouring the non-European countries worsen in terms of
population declines and economic difficulty. As a result, the capital regions are
developing whereas the others are stagnating. The dualist structure of economic

development is a great challange in terms of integration of the South-eastern Europe to
the European Union. Accordingly, the regional disparities between the regions of the area
are deepening.
Table 5: MAX/MIN GDP per capita Ratio in NUTS II Level COUNTRY 1998 1999 2000 BULGARIA 1,14 1,61 1,59 ROMANIA 1,86 1,88 2,96 GREECE 1,62 1,62 1,69 TURKEY 4,89 - 5,92 Source: Eurostat, 2000
The GDP per capita between the richest and the poorest regions of the countries can be
followed from Table 5, the general trend points out the increasing disparities between
regions, even the calculation has made for a short term. The regions that have the
minimum GDP per capita values are at the eastern borders of these countries. except
Greece. The poorest region of Greece is at the western border neighbouring South-eastern
Albania called Iperios in NUTS II level. Although Bulgaria seems to go to a financial
stabilisation, values should be taken cautiously.
Table 6: The regional disparities in the period of 1997-2000 in NUTS II Level
Country Wealthiest Region Poorest Region
GDP p.c. 1997 National Av.= 100
GDP per capita 1997 EU15=100
National Spread (1) Wealthiest Region
Poorest Region
GDP p.c. 2000 National Av.= 100
GDP per capita 2000 EU15=100
National Spread (2)
BULGARIA Yugozapaden (sw) 103,4 23,4 4,1 Yugozapaden (sw) 130,3 34 47,7 YuzhenTsentralen ** 99,3 22,5 YuzhenTsentralen** 82,6 21 ROMANIA Bucuresti 141,6 43 60,1 Bucuresti 206,5 48 136,6 Nord-Est 80,5 24,4 Nord-Est 69,8 16 GREECE* Sterea Ellada 127 84 63,7 Notio Aigaio 117 80 47,3 Iperios 63,3 42 Iperios 69,7 47 TURKEY Istanbul 202 58,8 160,5 Kocaeli 244,3 61,1 203 Van 41,5 12 Mardin 41,3 10,3 Sorce: The 1997 values are obtained from "Enlargement and Cohesion"- Background Study for the 2nd Cohesion Report” (1) Difference between wealthiest and poorest region (in percentage points of national average) in 1997 (2) Difference between wealthiest and poorest region (in percentage points of national average) in 2000 * The values belong to the year of 1998 **nc: north -central/sw: south-west

The values determine that the regional economic polarisation in the SEE countries exist
and continue to increase. The wealthiest regions are advancing the betterment of their
economic situation, on the other hand the poorest are getting poorer. In Turkey, the
poorest regions, in the table, are the border areas and located at the Eastern periphery of
the country whereas the wealthiest regions are located at the northwest. According to the
comparision of all regions in the European level, the indicators points out that all of the
South-eastern European regions are below the EU average.
Figure 3: The share of national GDP (PPS) by regions in Nuts II Level
BULGARIA
0,000,050,100,150,200,250,300,350,40
SEVEROIZTOCHEN
SEVEREN TSENTRALEN
SEVEROZAPADEN
YUGOIZTOCHEN
UZHEN TSENTRALEN
YUGOZAPADEN
GDP 1998 (PPS)% GDP 1999 (PPS)% GDP 2000 (PPS)%
Source: Eurostat
In regard to the Figures 3,4,5 the dominant pattern of SEE indicates the dual economic
development. The capitals and metropolitans take the highest share from the total GDP of
their respective countries and this pattern persists after 1990s. Particularly, the highest
share of national GDP is sucked by one region and the rest take considerably what is
remained. In recent years, the rapidity of this trend has increased and the relatively equal
distribution of activities depressed to the detriment of remote regions in transition
countriees.

Figure 4: The share of national GDP (PPS) by regions in Nuts II Level
ROMANIA
0,000,050,100,150,200,250,300,350,40
NORD-EST
SUD-EST
SUD
SUD-VEST
VEST
NORD-VEST
CENTRU
BUCURESTI
GDP 1998 (PPS)% GDP 1999 (PPS)% GDP 2000 (PPS)%
Source: Eurostat
Figure 5: The share of national GDP (PPS) by regions in Nuts II Level
ELLADA
0,000,050,100,150,200,250,300,350,40
ANA TOLIKI MA KEDONIA,THRA KI
KENTRIKI MA KEDONIA
DY TIKI MA KEDONIA
THESSALIA
IPERIOS
IONIA NISIA
ADY TIKI ELLA DASTEREA ELLA DA
PELOPONNISOS
ATTIKI
VOREIO AIGAIO
NOTIO AIGAIO
KRITI
GDP 2000 (PPS)%
Source: Eurostat
*Even the same calculations are made for Ellada, only year of 2000 is shown in the graphic. Because the regions except Kentriki Ma Kedonia, Sterea Ella da, all others are stagnating or slightly declining. Thus, the lines are overlapping and it’s getting harder to follow the changes by years.

5. EVALUATION and DISCUSSIONS
Regional disparities that ensure the continuity of the core-periphery pattern are
increasing, in addition, most of the border regions are depressed areas in the SEE and
their disadvantaged situation is highly affected by the countinuity of this unequal
economic and spatial pattern. The agglomeration of population and high value-added
economic activity concentrated in the core areas. This situation badly affects the
distribution of investments and spatial development of border regions that are mostly
located in the periphery of the countries.
In this respect, besides the similarities the situation of Turkey is differentiating from
South-eastern European countries due to its wider geographical area, higher growth rate
of population, fertility rate, and unemployment with significant regional disparities. As
mentioned previously, Turkey with its 67 million inhabitants is a candidate to be the one
of the most populated countries in Europe, whereas the growth rate of population has
started to fall down in Turkey. In addition to the existing problems the increase of
population creates new challanges to the authorities. Regional disparities that are very
significant in the country scale constitute a seperation between Eastern and Western
sides. The developing West is taking the highest share of GDP per capita from the total,
on the other hand the Eastern side -border regions of the country continue to move
backward. Therefore, the poorest five and the richest five regions have not changed
between 1997-2000. (See Annex I)
For the prosperity of Europe in peace and welfare the elimination of regional inequalities
will be the basic concern of authorities. Cross-border co-operations create a room in order
to increase the socio-economic relations in the local context, and it is a prominent policy
in order to decrease the regional inequalities in regard to the integrated Europe. At the
time being, the European statistical system –NUTS- is newly developing in Turkey, so
this study provides a framework to see the regional disparities in NUTS II level in the
European scale and to compare the European Union’s regional GDP values with that of
Turkey. (SeeAnnex II)

References:
• ALDEN, J., BOLAND, P., 1996, “Regional Development Strategies, A European Perspective”, The Cromwell Press Ltd., Great Britain
• ARTOBOLEVSKY, S.S., 1996, “Regional Policy in Europe”, Athenaeum Press, Great Britain
• BEHRENS, A., 2000, “Per capita GDP Below 75% of the EU Average in 50 of the 211 EU Regions”, Statistics in Focus, General Statistics, Theme 1-1/2000, Eurostat
• CAPPELIN, R., BATEY, P.W.J., 1993, “Regional Networks, Border Regions, European Integration”, Pion Limited, London
• COFFEY, W., BAILLY S. A., 1992, “Producer Services and Systems of Flexible Production”, Urban Studies, Vol. 29, No. 6, 857-868, Carfax Publishing, Oxfordshire
• COPUS, K. A., 1999, “A New Peripherality Index for The NUTS III Regions of European Union”, A Report for the European Commission, Directorate General XVI.A.4 (Regional Policy and Cohesion)
• COPUS, K. A., 2001, “From Core-periphery to Polycentric Development Concepts of Spatial and Aspatial Peripherality”, European Planning Studies, Vol. 9, No.4, Carfax Publishing
• COPUS, K. A., 2001, “Integrated Conceptual Framework and Set of Operational Definitions (AsP)”, AsPIRE EU Fifth Framework Programme
• EC, 1999, “European Spatial Development Perspective”, Potsdam • EC, 2000, “ Community Action for Border Regions”, ___ • EC, 2000,“The Danube Space Study”, July 2000,___ • EC, 2001,“European Transport Networks”, Belgium • ENYEDI, G., 1992, “Urbanisation in East Central Europe: Social Processes and
Societal Responses in the State Socialist System”, Urban Studies Vol. 29, No:6, 869-880, Carfax Publishing, Oxfordshire
• ERKUT, G., 1997, “The Regional Technological Transformation of Mediterranean Settlements: The Turkish Case”, ERSA 97 Congress (T-4, CD-ROM ERSA 97), Rome
• ESKELINEN, H., SNICARS, F., 1995, “Competitive European Peripheries? An Introduction”, Competitive European Peripheries, Stockholm
• GORZELAK, G., JALOWIECKI, B., 2002, “European Boundaries: Unity or Division of the Continent?”, Regional Studies, Vol. 36.4, pp. 409-419, Carfax Publishing
• HADJIMICHALIS, C., 1994,”The Fringes of Europe and EU Integration: A View Point from the South”, European Urban&Regional Studies, Vol. 1, Number 1, 1994, Copyright Licensing Agency Ltd., London
• ILLERIS, S., 1992, “Peripherality and European Integration: The Challange Facing Nordic Countries”, Competitive European Peripheries, Stockholm
• JENSEN-BUTLER, C., 1991, “Rural Industrialisation in Denmark and the Role of Public Policy”, Urban Studies, Vol. 29, No:6, 881-904, Carfax Publishing, Oxfordshire

• KEEBLE, D., OFFORD, J. and WALKER, S., 1988, “Peripheral Regions in a Community of Twelve member states”, Luxembourg: Office for Official Publications of the European Communities.
• LASH, S., URRY, J., 1994, “Economies of Sings&Space”, Sade Publications Ltd., London
• LOVINO, I, 2002, “Foreign Direct Investment in the Candidate Countries: sector and country composition”, General Statistics, Economy and Finance, Theme 2-55/2002, Eurostat
• MEIJER, M., 1992, “Growth and Decline of European Cities: Changing Position of Cities in Europe”, Urban Studies, Vol. 30, No. 6, 1993, 981-990, Carfax Publishing, Oxfordshire
• NIJKAMP, P., 1995, “The European Network Economy: Opportunities and Impediments”, Competitive European Peripheries, Stockholm
• SCHÜRMANN, C., TALAAT, A., 2002, “The European Peripherality Index”, paper presented at the 42nd Congress of the European Regional Science Association (ERSA), Dortmund, 27-31 August 2002
• SPIEKERMANN, K., NEUBAUER, J., 2002, “European Accessibility and Peripherality: Concepts, Models and Indicators”, Nordregio – Nordic Centre for Spatial Development, Stockholm
• SIRIOPOULOS, C., ASTERIOU, 2001, “Testing for Convergence Across the Greek Regions”, Regional Studies, Vol. 32, pp. 573-546
• STAPEL, S., 2001, “The GDP of the Candidates Countries”, Statistics in Focus, Economy and Finance, Theme 2-28/2001, Eurostat
• VAN der VEEN, A., BOOT, D., 1995, “Cross-border Co-opreation and the European Regional Policy”, Competitive European Peripheries, Stockholm
• WEISE, C., BACHTLER, J., DOWNES, R., McMASTER, I., TOEPEL, K., 2001, “The Impact of EU Enlargement on Cohesion”, Background Study for the 2nd Cohesion Report, Berlin and Glasgow
• WILLIAMS, A., BALAZ, V., BODRNAROVA, B., 2001, “Border Regions and Trans-border Mobility: Slovakia in Economic Transition”, Regional Studies, Vol. 35.9, pp. 831-846

ANNEX I
Table 1: Turkey's the Poorest Five and the Richest Five Regions in NUTS II Level
1997 2000 1 Van Mardin 2 Ağrı Van 3 Mardin Ağrı 4 Erzurum Erzurum
The Poorest
5 Şanlıurfa Şanlıurfa 1 İstanbul Kocaeli 2 Kocaeli İstanbul 3 İzmir İzmir 4 Tekirdağ Ankara
The Richest
5 Ankara Tekirdağ Source: State Institute of Statistics, 2000
Table 2: GDP per capita of Turkey in NUTS II Level
(NUTS II, 2000) GDP (PPS) EU-15=100
Kocaeli 61,1 İstanbul 48,0 İzmir 46,7 Ankara 45,0 Tekirdağ 41,2 Bursa 37,6 Aydın 36,2 Adana 35,7 Balıkesir 34,1 Antalya 28,0 Konya 27,4 Zonguldak 26,7 Kırıkkale 26,5 Manisa 25,3 Türkiye 25,0 Samsun 22,9 Trabzon 21,6 Hatay 21,5 Kastamonu 21,3 Gaziantep 20,5 Malatya 19,5 Kayseri 19,2 Şanlıurfa 16,2 Erzurum 15,5 Ağrı 11,4 Van 10,4 Mardin 10,3
Source: State Institute of Statistics, 2000

ANNEX II
GDP per capita in Southeastern European Countries in NUTS II Level, 2000
GDP per capita (PPS) EU-15=100
<35
35-50
50-75
>75
Other Countries
PPS : Purchasing power parities represent the relationship between the amounts of national currency needed to purchase a comparable and representative basket of goods in the countries concerned
GDP per capita (PPS) EU-15=100
<35
35-50
50-75
>75
Other Countries
PPS : Purchasing power parities represent the relationship between the amounts of national currency needed to purchase a comparable and representative basket of goods in the countries concerned
Recommended