The Development of a New Self-Report
Psychometric Measure to Assess Psychological
Practitioner Workplace Wellbeing
Elisabeth Summers, Trainee Clinical Psychologist: [email protected] ; [email protected]
Academic Supervisor – Dr Reg Morris: [email protected]
External Supervisor – Dr Gita Bhutani: [email protected]

The Importance of Psychological
Practitioner Wellbeing
Strong links between staff well-being and the delivery of dignified and safe
patient care.
Boorman (2009)
Organisations prioritising staff WB show improved patient satisfaction and better
outcomes.
Poor levels of health-care staff WB linked with low levels of staff retention,
burnout and higher rates of sickness absence.
The Francis report (2013) - lack of compassionate care and a vicious cycle of
both staff and patient welfare being compromised within the NHS.

The New Savoy Partnership (NSP) and
DCP Background
2009
• Following the first year of national roll-out of IAPT services, the NSP set out to measure the wellbeing of psychological therapies staff – based on European Social Survey (NEF, 2009)
2014
• Joint initiative between The NSP and the Leadership and Management Faculty of the BPS, DCP.
• Core objectives of the collaboration include conducting annual measure of wellbeing in psychological services, developing a charter of well-being, developing a strategic framework and well-being tool and establishing a Collaborative Learning Network to share good practice and drive the well-being agenda.
• The NSP and DCP disseminated their first national well-being survey to a range of professional networks.
2015 and 2016
• Further development of the measure, to include subscales from the Work Related Quality of Life scale (WRQoL) (Van Laar, Edwards, & Easton, 2007).

Rationale for Creating a New Psychometric
Measure
Growing evidence base
links between practitioner WB and patient care
psychological practitioners experiencing high levels of
depression and long-term chronic health conditions
NSP and DCP psychometric measures have been evolving,
but have not been scientifically validated psychometric
measures
No validated tools to specifically measure subjective
wellbeing of psychological practitioners
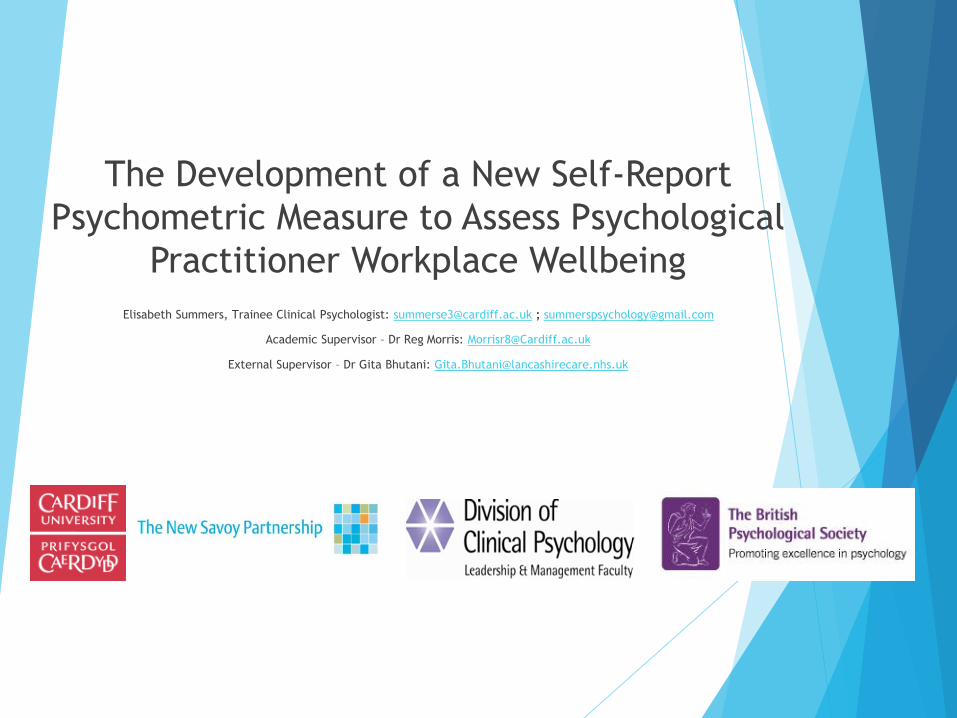
PPWW Measure ©(Summers, McLellan, Morris & Bhutani, 2017)
Psychological Practitioner Workplace Wellbeing Measure
1. I do not feel there is always someone there for me when I need personal support
2. I feel I can seek support from my colleagues
3. I feel a sense of belonging to the service/organisation in which I work
4. Flexible working arrangements are supported in my service/organisation
5. I feel supported by my line-manager to take positive risks without fear of reproach
6. I work in an environment where my colleagues are caring and supportive towards each other
7. I feel I can balance less fulfilling aspects of my job with more enjoyable aspects
8. I cannot see how the service/organisation in which I work can ever be delivered effectively
9. The clinical supervision I receive is containing and safe
10. I am enabled to manage and organise my workload and diary
11. I am clear about my role in relation to other professionals with whom I work
12. I feel confident the service/organisation in which I work can adapt to meet future service demands
13. Clinical supervision meets my support needs
14. My colleagues have realistic expectations of my professional role
15. The physical environment and facilities in my workplace enable me to work efficiently and effectively
16. My colleagues value my professional contribution
17. I have a good work/life balance
18. I do not feel included in service/organisational decisions that affect me
19. The personal support I receive from family and/or friends meets my needs
20. My line-manager is approachable and responsive
21. My continuing professional development needs are supported
22. I am encouraged and supported to develop my skill-set and knowledge
23. I am expected to reach unrealistic or unattainable targets
24. The physical environment and/or facilities in my workplace adversely affect my workplace wellbeing
25. I feel service/organisational targets are meaningful
26. My specific skills as a psychological practitioner add value to the service/team/organisation
Using the scale,
indicate your
agreement with each
item. Answer items
based on your
current workplace
wellbeing, rather
than any historical
experiences.
Items are scored using
a Likert scale where:
1 = strongly disagree
2 = disagree
3 = neither agree or
disagree/neutral
4 = agree
5 = strongly agree
Reverse items: 1, 8,
18, 23, 24
Workforce Wellbeing Survey 2014 - 2017
Project Team
Amra Rao, Jeremy Clarke, Gita Bhutani, Neelam Dosanjh,
Esther Cohen-Tovee, and Adrian Neal
A joint Initiative – British Psychological Society, Division of Clinical Psychology
& New Savoy Conference
6

What is the Workforce Wellbeing Survey? 2009 Staff Wellbeing Tool based on European Social Survey Questionnaire
(NEF 2009)
Survey promoted through professional networks
Survey focused on feelings about work as well as collecting demographic information
Participants increased from 852 (in 2014) to 1106 (in 2015) to 1227 (in 2016) to 1678 (in 2017)
7

The 2017 Workforce Wellbeing Survey Psychological Practitioner Workplace Wellbeing Measure
New measure developed to be psychometrically robust
6 factors
Additional questions Self-reported feelings of depression and failure
Bullying & harassment
Safety of services
Comparable to 2014 and 2015
Demographic and professional information Age, gender, sexual orientation, long-term condition
Professional role, banding, hours worked, paid & unpaid overtime
Online survey Snowball sampling
December 2017 to February 2018
8
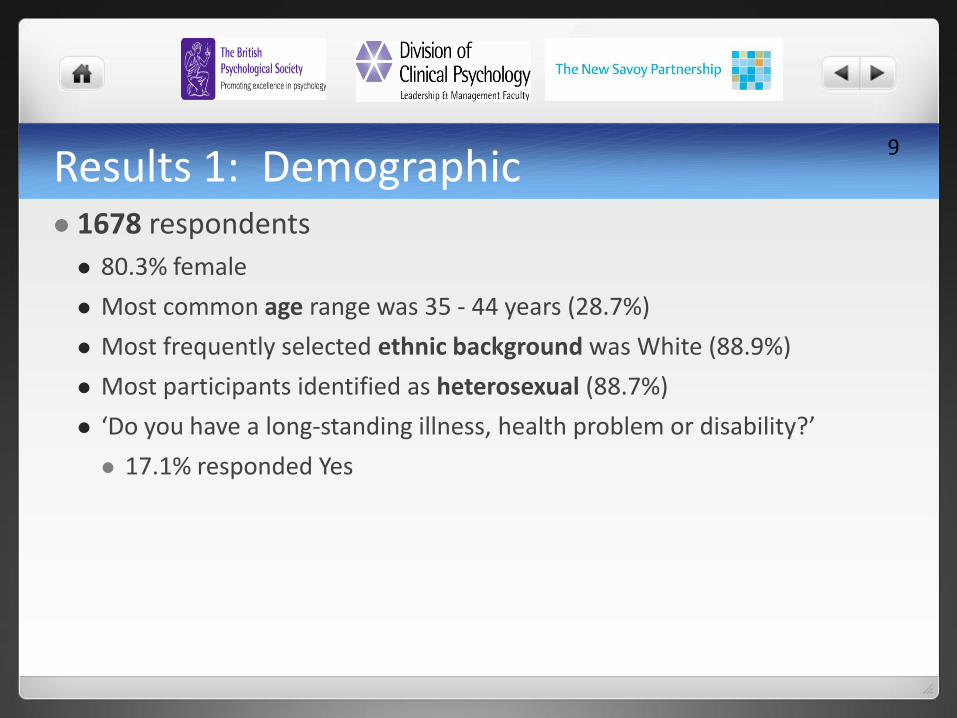
Results 1: Demographic 1678 respondents
80.3% female
Most common age range was 35 - 44 years (28.7%)
Most frequently selected ethnic background was White (88.9%)
Most participants identified as heterosexual (88.7%)
‘Do you have a long-standing illness, health problem or disability?’
17.1% responded Yes
9

Results 2 Comparisons across the years Demographics No significant differences found in:
Gender
Sexual Orientation
Age (over past two years)
Significant differences found in
Reported disability increased 2014 to 2015 and has decreased since although not to 2014 levels.
Increase in non-white groups completing the survey from 2014 to 2017 (2015 highest at 24%, 2017 17%)
10
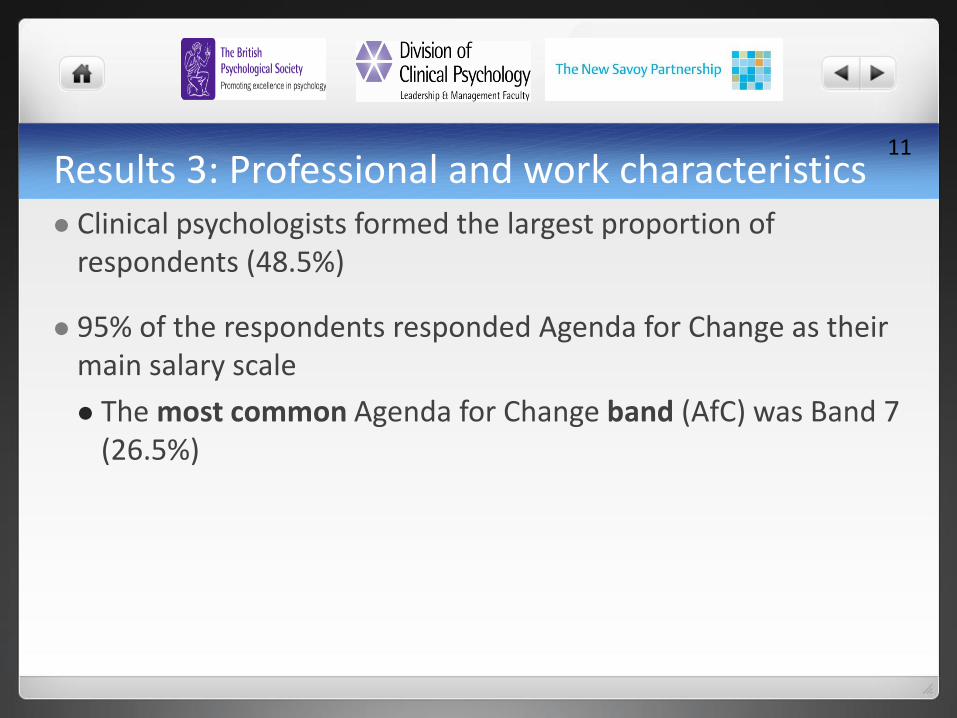
Results 3: Professional and work characteristics Clinical psychologists formed the largest proportion of
respondents (48.5%)
95% of the respondents responded Agenda for Change as their main salary scale
The most common Agenda for Change band (AfC) was Band 7 (26.5%)
11
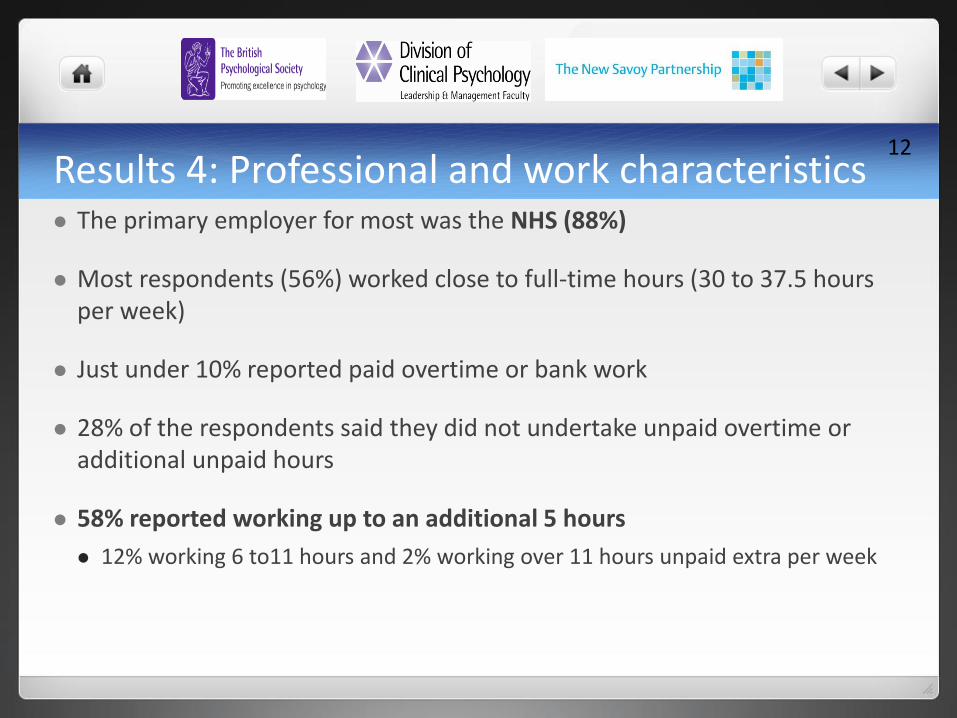
Results 4: Professional and work characteristics The primary employer for most was the NHS (88%)
Most respondents (56%) worked close to full-time hours (30 to 37.5 hours per week)
Just under 10% reported paid overtime or bank work
28% of the respondents said they did not undertake unpaid overtime or additional unpaid hours
58% reported working up to an additional 5 hours
12% working 6 to11 hours and 2% working over 11 hours unpaid extra per week
12

Results 5: Professional and work characteristics Significant differences
Professional role
Banding
Employer
No significant differences
Hours worked
Paid overtime
Unpaid overtime
13
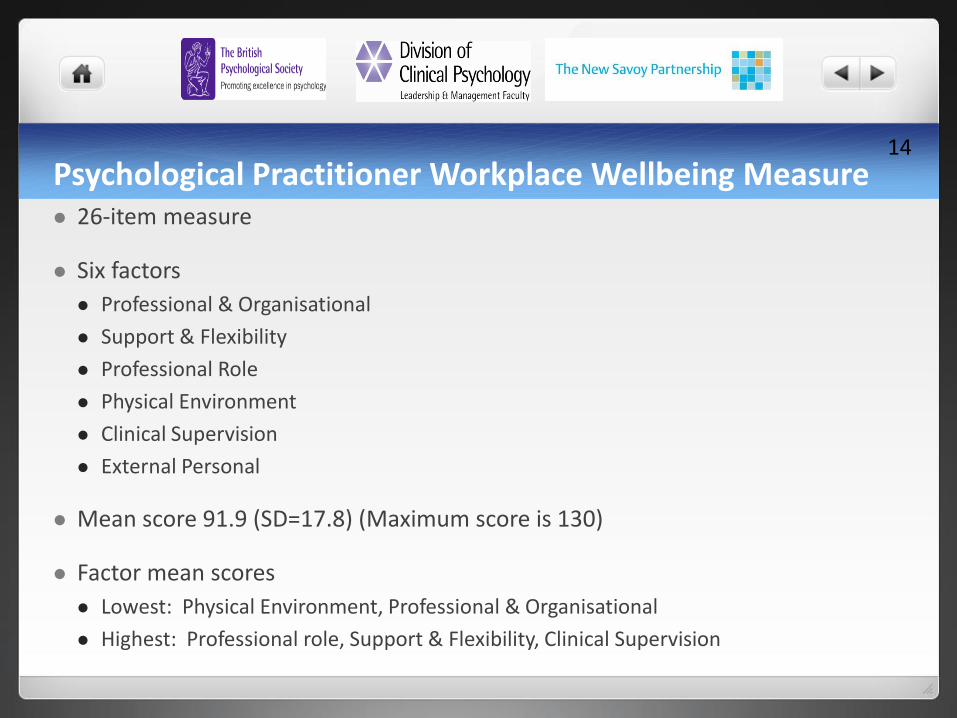
Psychological Practitioner Workplace Wellbeing Measure 26-item measure
Six factors
Professional & Organisational
Support & Flexibility
Professional Role
Physical Environment
Clinical Supervision
External Personal
Mean score 91.9 (SD=17.8) (Maximum score is 130)
Factor mean scores
Lowest: Physical Environment, Professional & Organisational
Highest: Professional role, Support & Flexibility, Clinical Supervision
14

Results 6: NEW Questions Has the service in which you work lost any senior staff, whether
due to reorganisation, re-tendering, cost saving or other reasons, such that you don’t have confidence it can be delivered safely and effectively?
33% said Yes
Do you consider the service in which you work has enough staff to meet demand/ its contractual requirements to deliver care to your patients safely and effectively?
72% said No
15
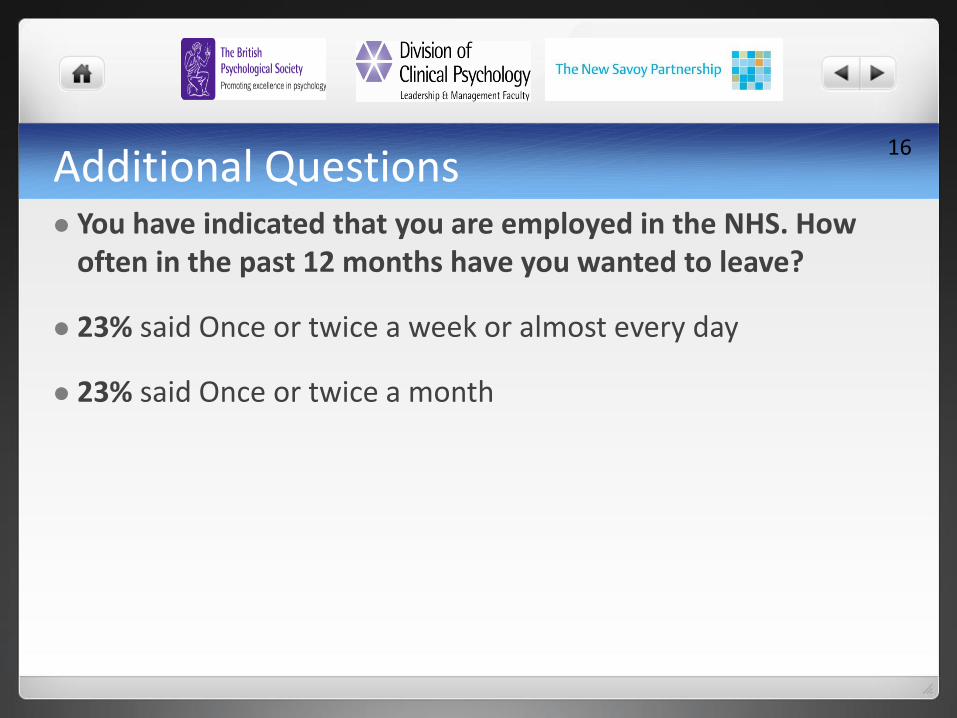
Additional Questions You have indicated that you are employed in the NHS. How
often in the past 12 months have you wanted to leave?
23% said Once or twice a week or almost every day
23% said Once or twice a month
16

Results 7: Additional Questions
43% indicated that they had felt depressed Some of the time or more frequently over the past week.
42% had felt like a failure over the past week Some of the time, Often or all the time.
17

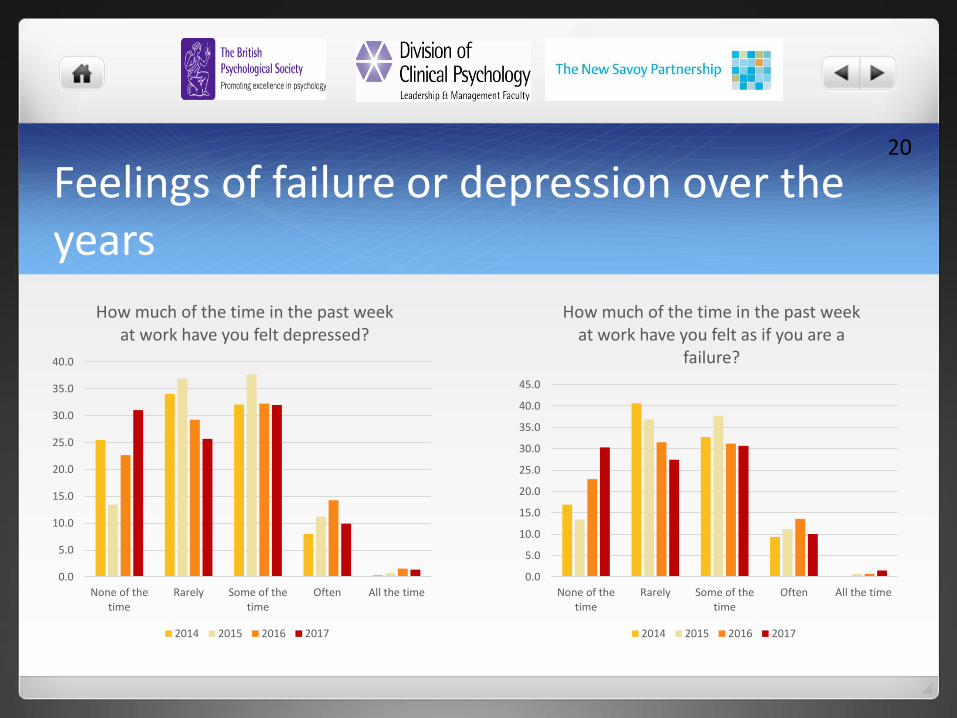
How much of the time in the past week at work have you felt depressed?
Levels of reported depression have were higher in 2015 and 2016
In 2014, 40% reported feeling depressed Some of the time, Often, All the time
In 2015, this was 46%
In 2016, this was 48%
In 2017, this was 43%
18

How much of the time in the past week at work have you felt as if you are a failure? Reported feelings of failure were
higher in 2015 compared to other years
In 2014, 42% had felt like a failure Some of the time, Often or all the time
In 2015, this was 50%
In 2016, this was 46%
In 2017, this was 42%
…despite significant differences, levels are high and of concern
19
Feelings of failure or depression over the years
20
0.0
5.0
10.0
15.0
20.0
25.0
30.0
35.0
40.0
None of thetime
Rarely Some of thetime
Often All the time
How much of the time in the past week at work have you felt depressed?
2014 2015 2016 2017
0.0
5.0
10.0
15.0
20.0
25.0
30.0
35.0
40.0
45.0
None of thetime
Rarely Some of thetime
Often All the time
How much of the time in the past week at work have you felt as if you are a
failure?
2014 2015 2016 2017

Results 8: Experience of bullying or discrimination at work
28% reported bullying and harassment occurring more than once in the past 12 months from patients, service users, their relatives or other members of the public
13% reported bullying and harassment from managers occurring once or twice in the past 12 months.
34% felt colleagues at work had been subjected to harassment through bullying Some of the time, Often or All the time with 37% saying none of the time.
4.1% said they had been accused of bullying and/or harassment, highest reporting over the years
21

In the last 12 months have you personally experienced discrimination at work from any of the following? Patients / service users, their relatives or other members of the
public
6% responded Yes
Manager / team leader or other colleagues
11% responded Yes
Main reasons reported were Age, Ethnic Background and Gender
22
Feeling subjected to bullying and harassment Highest levels of reporting found in 2015.
Lowest levels of reporting found in 2017.
No significant differences found between 2014 and 2016
Unclear why this should be the case but may be informed by qualitative analysis
23

Accused of bullying and harassment - increase
The numbers accused of bullying and harassment as a percentage of the sample has increased significantly.
In 2014, this was 1.2%
In 2015, this was 2.2%
In 2016, this was 3.5%
In 2017, this was 4.1%
24

Results: SWEMWBS Short Warwick Edinburgh Mental Wellbeing Scale
7 item, 5 point response scale
Population measure focusing more on psychological and eudaimonic wellbeing rather than hedonic
The mean score on the SWEMBS was 22.2 (SD=3.92).
This was compared with the population norms for England in 2011 (mean = 23.61, SD=3.90)
A significant difference was found Scores on the SWEMWBS were better in 2017
25

Summary of the Workforce Wellbeing Survey Mostly NHS respondents and mostly female
Increasing proportion of clinical psychologists – perhaps reflecting sampling methods
26

Findings of the Workforce Wellbeing Survey Reports of respondents feeling depressed (Some of the time, Often, All the
time) have decreased in the past year to 42% from 40% (2014) to 46% (2015) to 48% (2016)
Feeling as if you are a failure has also decreased in the past year to 42% from 42% (2014) to 49.5% (2015) and 46% in 2016
Less people reporting bullying by managers in 2017 (13%) compared 18% in 2016
An increase in people being accused of bullying
The respondents are in the bottom 61 – 80% based on their average scores on the SWEMWBS suggesting lower wellbeing in this group
27

Qualitative Findings : questions asked2 questions asked as part of 2017 survey:
Do you have any additional comments that you would like to share relating to the above questions? n=466
Please use this section for any additional comments or information about your wellbeing that you would like to share, either anonymously or otherwise. n=216
28
Qualitative Findings – differences over the years Decrease in word rate and rate of respondents adding qualitative
information in 2017
Comment rate rose each year 29.6% participants commenting (2014) to 49% (2015) to 84% (2016) to a drop 41% in 2017
Average number of words per comment had increased over 3 years (49 to over 100) (2014, 2015 & 2016) and declined to 44 in 2017
2016 we asked for comments on 4 questions, e.g.Any key issues or factors that you think may be negatively impacting on staff wellbeing?’
‘Any key changes or initiatives that you think would help improve staff wellbeing?’
29

Qualitative Findings - Themes30
Waiting further analysis but preliminary highlights for most commented areas:
Target driven cultures is still at the top
Less depression more stress, hopelessness and anxiety
Cuts to resources impacting leadership posts, CPD and delivery on quality of care and activity
Lack of leadership/management engagement & containment
More reporting on sickness, health and personal losses
Qualitative Findings -Themes Higher expression of wanting to leave NHS earlier in career and lack of
career progression
Posts being down banded
More on threat focused system- complaints, grievances, culture of fear & threat
Acknowledgement of dual status & of personal vulnerability.
Distinction drawn between work related & personal stress
Comment on self care encouraged BUT productivity still dealised
A few negative comments on the design of the questionnaire
31
Qualitative Findings – negative quotes
’’IAPT seems to have become the dumping ground for all things mental health. People are forgetting we only see mild-moderate cases “
“often feel that wellbeing of PWPs is overlooked in a lot of services. Staff wellbeing should be paramount and instead we focus too much on targets etc at the expense of our colleagues. PWPs are often disempowered which affects morale and are looked down upon and not allowed to make relevant decisions”
"I have not felt depressed as much as frustrated and hopeless about things ever improving in my service. I also think it would be helpful to ask questions about career progression as that is one of the main reasons I think about leaving the NHS so often”
32

Qualitative Findings – negative quotes "My experience is that the NHS is a toxic and unsustainable environment
within which to work. I have lost faith in managerial leadership. They are in denial about capacity of the workforce”
“The NHS is very punitive towards its workforce. It is also riddled with inconsistency, mismanagement and corruption at managerial and directorship level. It does not care for its workforce’”
"The services are being destroyed. It is so depressing”
33
Qualitative Findings – positive quotes
"Very supportive service. Would benefit more time for CPD and learning. Targets can be relentless”
“I really enjoy my role in IAPT and feel very supported. My service puts lots of thought and action into supporting our wellbeing”
‘I really enjoy my role in IAPT and feel very supported. My service puts lots of thought and action into supporting our wellbeing”
34

Methodological Issues Self-selected snowball sampling method
Not comprehensive or weighted
New Psychometrically valid questionnaire used Valid scale
Factors within the scale
Questions have changed over the years
Data quality has improved Better online design
Qualitative data Very rich responses
Next steps Consideration of the sampling methodology
35
Conclusions Despite the methodological limitations, surveys have consistently
demonstrated levels of distress in the psychological workforce
This is consistent with findings from surveys of NHS staff generally or other staff groups
Participant numbers have increased
In 2017, reductions in both levels of distress and bullying were found. However, levels are still high
Not clear what the reduction reflects – sampling, workforce changes
Qualitative analysis will enable further assessment of this
36

Thank You and Contacts Gita Bhutani : [email protected]
Neelam Dosanjh: [email protected]
Amra Rao: [email protected]
Jeremy Clarke : [email protected]
Adrian Neal: [email protected]
Esther Cohen-Tovée: [email protected]
Elizabeth Summers - [email protected]
37

Former Minister for mental health, Rt. Hon. Norman Lamb MP
“If three quarters of doctors said they couldn’t operate safely and effectively there would be a public outcry and immediate action from the Government. We need parity of esteem between mental health and physical health – the New Savoy’s findings are shocking and serve to highlight just how neglected our mental health services are.”
38
Recommended