Florida International UniversityFIU Digital Commons
FIU Electronic Theses and Dissertations University Graduate School
11-23-1992
The development and validation of a preschoolscreening instrument for the identification oflanguage impaired and educable mentallyhandicapped Head Start childrenSamuel CorradoFlorida International University
DOI: 10.25148/etd.FI14061520Follow this and additional works at: https://digitalcommons.fiu.edu/etd
Part of the Special Education and Teaching Commons
This work is brought to you for free and open access by the University Graduate School at FIU Digital Commons. It has been accepted for inclusion inFIU Electronic Theses and Dissertations by an authorized administrator of FIU Digital Commons. For more information, please contact [email protected].
Recommended CitationCorrado, Samuel, "The development and validation of a preschool screening instrument for the identification of language impaired andeducable mentally handicapped Head Start children" (1992). FIU Electronic Theses and Dissertations. 2588.https://digitalcommons.fiu.edu/etd/2588
ABSTRACT OF THE DISSERTATION
The Development and Validation of a Preschool Screening Instrument for
The Identification of Language Impaired and Educable Mentally
Handicapped Head Start Children
by
Samuel Corrado
Florida International University, 1992
Miami, Florida
Professor Stephen S. Strichart, Major Professor
This study developed and validated a preschool screening instrument designed to identify children, enrolled in the Dade County Head Start program, who would be found eligible for placement in a language impaired or educable mentally handicapped program in the Dade County Public Schools (DCPS) system. Previously used commercial screening instruments were demonstrated to have unsatisfactory predictive validity. The new screening instrument was developed by utilizing already existing test items from a developmental skills assessment instrument, the Learning Accomplishment Profile-Diagnostic. These items were selected on the basis of their sensitivity and specificity hit rate scores. The reliability of the new screening instrument was established by using the test-retest and interrater methods. Predictive validity was established by using a double sample technique of 600 Head Start children for each sample and the classification or hit rate method following a comprehensive evaluation process. The new screening instrument was found to be a more accurate predictor of the need for exceptional student education services than the commercial screening instruments. The results showed that predictions could be made with confidence when a preschool screening instrument is developed which clearly defines; a) the population to be screened; b) the population to be identified; c) the criteria to determine who will be referred for comprehensive assessment; and, d) the criteria for determining who is eligible for intervention services.
FLORIDA INTERNATIONAL UNIVERSITY
Miami, Florida
The Development and Validation of a Preschool Screening Instrument for
The Identification of Language Impaired and Educable Mentally
Handicapped Head Start Children
A dissertation, submitted in partial satisfaction of the requirements for the
degree of Doctor of Education in Special Education
by
Samuel Corrado
1992
To Professors Barry Greenberg, Philip Lazarus, and Stephen S. Strichart,
Major Professor:
This dissertation, having been approved in respect to form and mechanical
execution, is referred to you for judgement upon its substantial merit.
Dean I. Ira GoldenbergCollege of Education
The dissertation of Samuel Corrado is approved.
Barry Greenberg
Philip Lazarus
Stephen S. Strichart, Major Professor
Date of Examination: November 23, 1992
Dean Richard L. Campbell Division of Graduate Studies
Florida International University, 1992

DEDICATION
This work is dedicated to my parents,
Samuel G. and Anna Mae Corrado
ACKNOWLEDGMENTS
The completion of this doctoral project was made possible by the many
contributions of committee members, colleagues, and friends. First and
foremost I would like to extend my most sincere expression of appreciation
to Dr. Stephen Strichart, committee chairperson, for his guidance and
assistance throughout the study. Dr. Strichart gave me the direction and
helped me to remain focused during this long project and for this I will
always be grateful. I would also like to extend my appreciation to Dr. Philip
Lazarus and Dr. Barry Greenberg for their willingness to serve as committee
members and for their encouragement and guidance throughout these years.
A special expression of appreciation is extended to Dr. Carole Abbott,
for her scholarly assistance, critical insights, and inspiration.
Special mention is due to many people for their assistance with this
project such as: Grace Laskis, Special Needs Coordinator for the Dade
County Head Start program, who helped in scheduling and organizing the
many mass screenings; Drs. Keith and Marcia Scott and Dr. Susan Gold,
University of Miami Mailman Center for Child Development, who provided
support in terms of personnel and equipment for the mass screenings;
(iv)
Dr. Eleanor Levine, Project Director of FDLRS/South, who as my
supervisor provided much support for the project; Dr. Eydie Sloan,
Enabling Technology Specialist at FDLRS/South, for her assistance with
technology; Linda Bicky, Speech and Language Pathologist at the Hearing
and Speech Center of Florida, who coordinated all of the language
evaluations for the study; and finally all of the graduate assistants from the
University of Miami and the School Psychology Interns from Florida
International University whose work was invaluable for the completion of
the project.
(v)
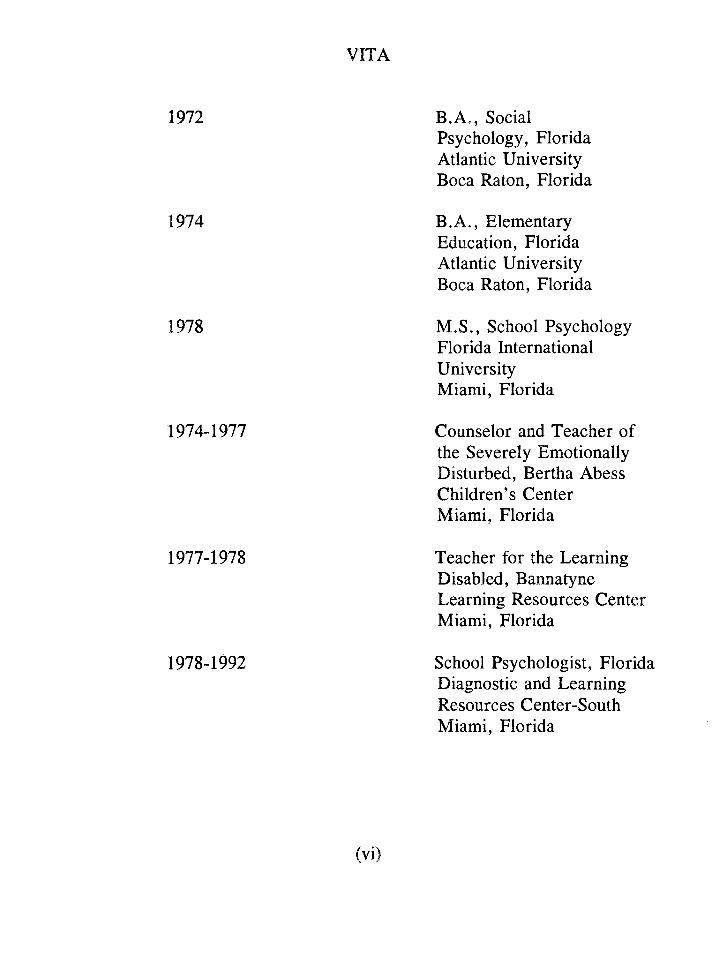
VITA
1972
1974
1978
19744977
19774978
19784992
B.A., Social Psychology, Florida Atlantic University Boca Raton, Florida
B.A., Elementary Education, Florida Atlantic University Boca Raton, Florida
M.S., School Psychology Florida International University Miami, Florida
Counselor and Teacher of the Severely Emotionally Disturbed, Bertha Abess Children's Center Miami, Florida
Teacher for the Learning Disabled, Bannatyne Learning Resources Center Miami, Florida
School Psychologist, Florida Diagnostic and Learning Resources Center-South Miami, Florida
(Vi)
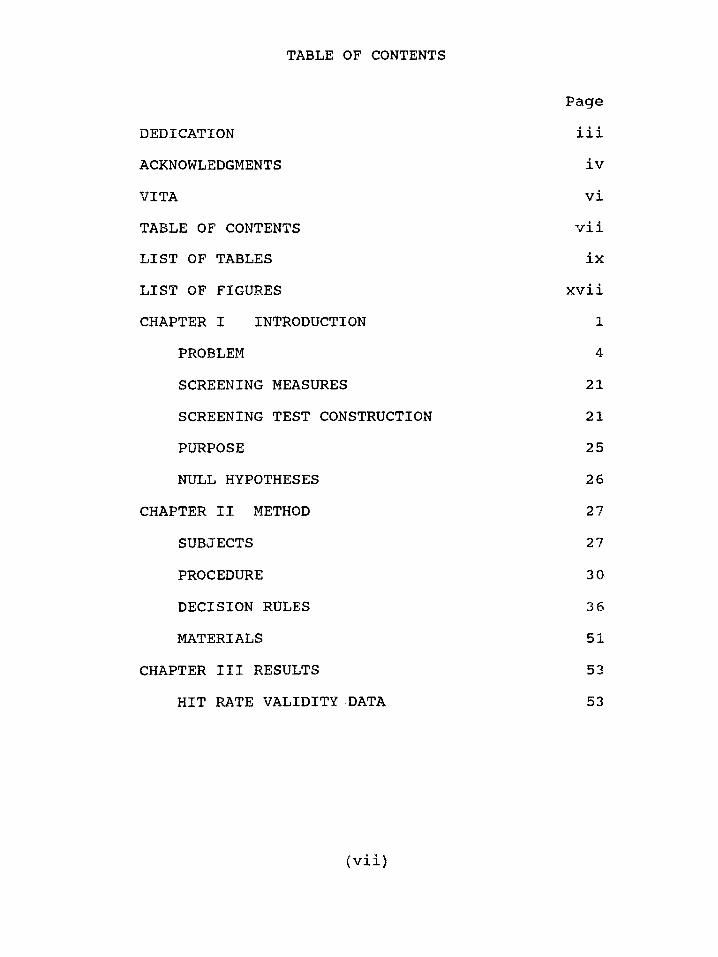
TABLE OF CONTENTS
PageDEDICATION iiiACKNOWLEDGMENTS ivVITA viTABLE OF CONTENTS viiLIST OF TABLES ixLIST OF FIGURES xviiCHAPTER I INTRODUCTION 1
PROBLEM 4SCREENING MEASURES 21SCREENING TEST CONSTRUCTION 21PURPOSE 25NULL HYPOTHESES 26
CHAPTER II METHOD 27SUBJECTS 27PROCEDURE 30DECISION RULES 36MATERIALS 51
CHAPTER III RESULTS 53HIT RATE VALIDITY -DATA 53
( v i i )
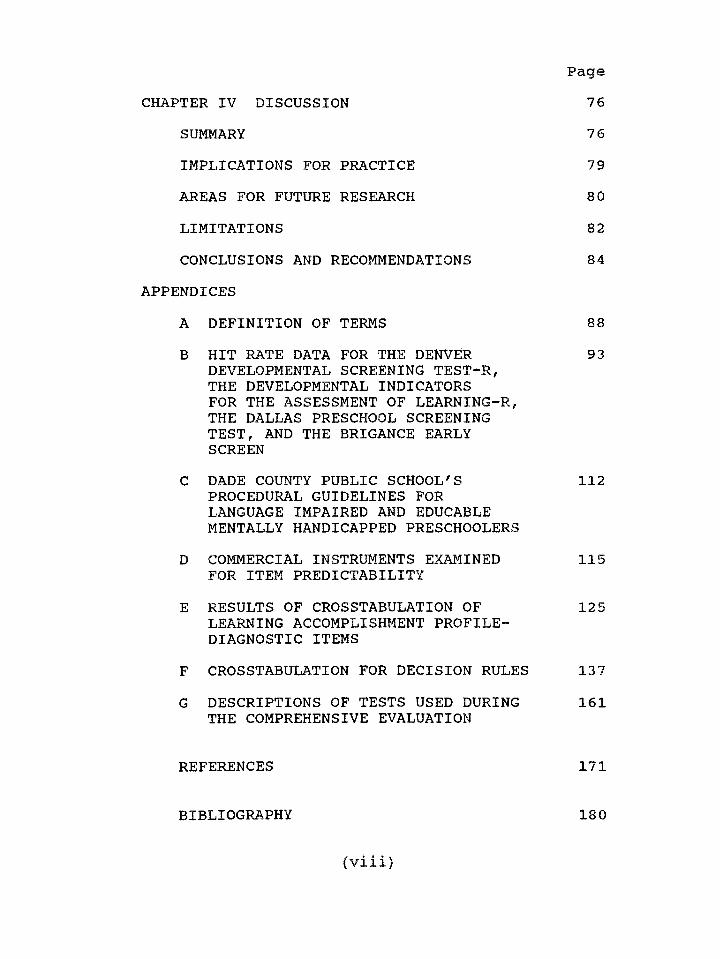
PageCHAPTER IV DISCUSSION
SUMMARYIMPLICATIONS FOR PRACTICEAREAS FOR FUTURE RESEARCHLIMITATIONSCONCLUSIONS AND RECOMMENDATIONS
APPENDICESA DEFINITION OF TERMSB HIT RATE DATA FOR THE DENVER
DEVELOPMENTAL SCREENING TEST-R,THE DEVELOPMENTAL INDICATORS FOR THE ASSESSMENT OF LEARNING-R, THE DALLAS PRESCHOOL SCREENING TEST, AND THE BRIGANCE EARLY SCREEN
C DADE COUNTY PUBLIC SCHOOL'S PROCEDURAL GUIDELINES FOR LANGUAGE IMPAIRED AND EDUCABLE MENTALLY HANDICAPPED PRESCHOOLERS
D COMMERCIAL INSTRUMENTS EXAMINED FOR ITEM PREDICTABILITY
E RESULTS OF CROSSTABULATION OFLEARNING ACCOMPLISHMENT PROFILE- DIAGNOSTIC ITEMS
F CROSSTABULATION FOR DECISION RULESG DESCRIPTIONS OF TESTS USED DURING
THE COMPREHENSIVE EVALUATION
REFERENCES
BIBLIOGRAPHY
76767980 82 84
8893
112
115
125
137161
171
180
( v i i i )
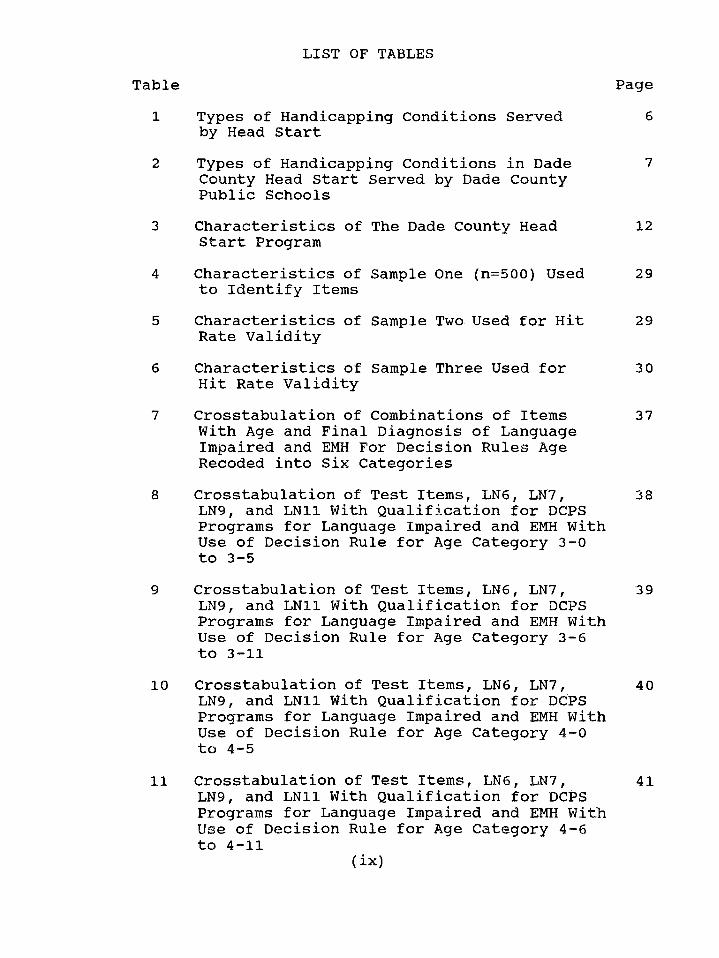
LIST OF TABLES
1 Types of Handicapping Conditions Served by Head Start
2 Types of Handicapping Conditions in Dade County Head Start Served by Dade County Public Schools
3 Characteristics of The Dade County Head Start Program
4 Characteristics of Sample One (n=500) Used to Identify Items
5 Characteristics of Sample Two Used for Hit Rate Validity
6 Characteristics of Sample Three Used for Hit Rate Validity
7 Crosstabulation of Combinations of Items With Age and Final Diagnosis of Language Impaired and EMH For Decision Rules Age Recoded into Six Categories
8 Crosstabulation of Test Items, LN6, LN7,LN9, and LN11 With Qualification for DCPS Programs for Language Impaired and EMH With Use of Decision Rule for Age Category 3-0 to 3-5
9 Crosstabulation of Test Items, LN6, LN7,LN9, and LN11 With Qualification for DCPS Programs for Language Impaired and EMH With Use of Decision Rule for Age Category 3-6 to 3-11
10 Crosstabulation of Test Items, LN6, LN7,LN9, and LN11 With Qualification for DCPS Programs for Language Impaired and EMH With Use of Decision Rule for Age Category 4-0 to 4-5
11 Crosstabulation of Test Items, LN6, LN7 ,LN9, and LN11 With Qualification for DCPS Programs for Language Impaired and EMH With Use of Decision Rule for Age Category 4-6 to 4-11
Table
(ix)
6
7
12
29
29
30
37
38
39
40
41
Page
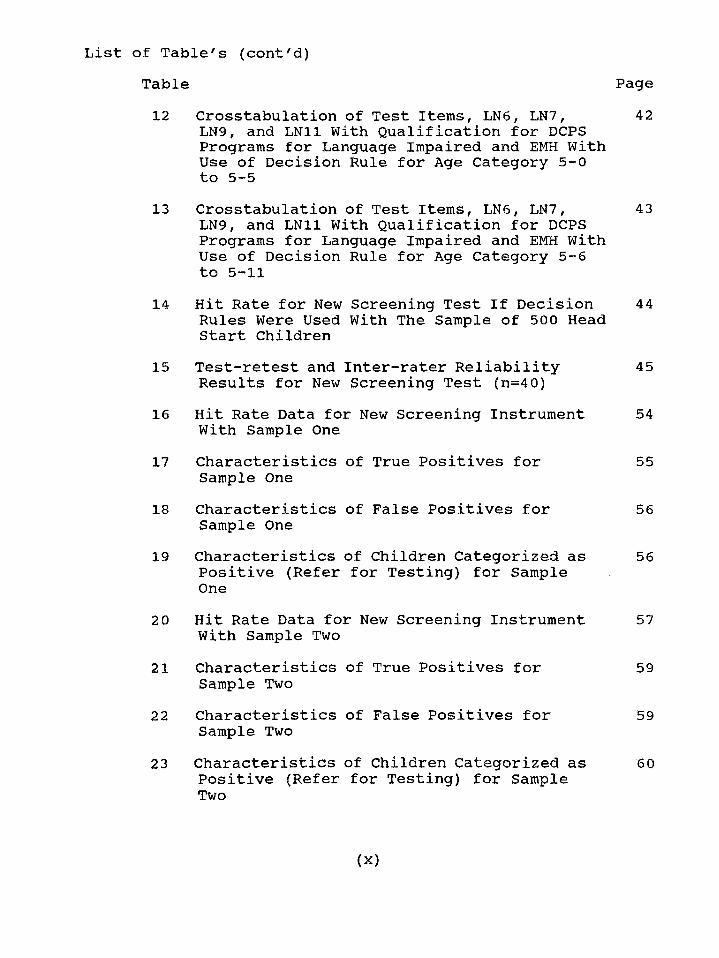
List of Table's (cont'd)Table12
13
14
15
16
17
18
19
20
21
22
23
Crosstabulation of Test Items, LNS, LN7,LN9, and LN11 With Qualification for DCPS Programs for Language Impaired and EMH With Use of Decision Rule for Age Category 5-0 to 5-5Crosstabulation of Test Items, LN6, LN7,LN9, and LN11 With Qualification for DCPS Programs for Language Impaired and EMH With Use of Decision Rule for Age Category 5-6 to 5-11Hit Rate for New Screening Test If Decision Rules Were Used With The Sample of 500 Head Start ChildrenTest-retest and Inter-rater Reliability Results for New Screening Test (n=40)Hit Rate Data for New Screening Instrument With Sample OneCharacteristics of True Positives for Sample OneCharacteristics of False Positives for Sample OneCharacteristics of Children Categorized as Positive (Refer for Testing) for Sample OneHit Rate Data for New Screening Instrument With Sample TwoCharacteristics of True Positives for Sample TwoCharacteristics of False Positives for Sample TwoCharacteristics of Children Categorized as Positive (Refer for Testing) for Sample Two
42
43
44
45
54
55
56
56
57
59
59
60
Page
(X)
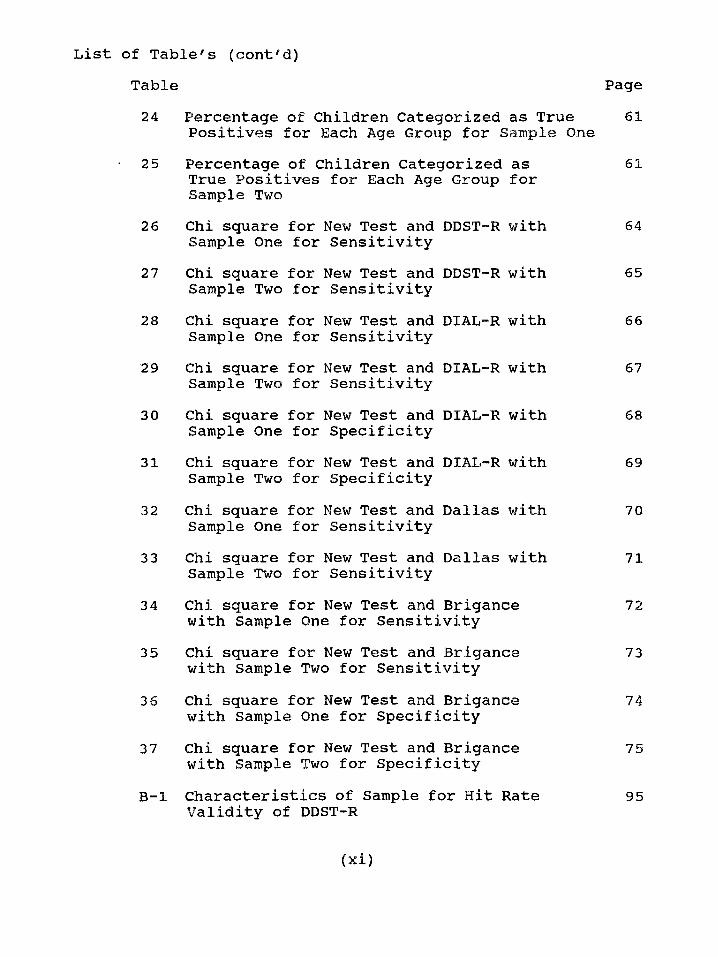
Table24 Percentage of Children Categorized as True
Positives for Each Age Group for Samp1e One25 Percentage of Children Categorized as
True Positives for Each Age Group for Sample Two
26 Chi square for New Test and DDST-R with Sample One for Sensitivity
27 Chi square for New Test and DDST-R with Sample Two for Sensitivity
28 Chi square for New Test and DIAL-R with Sample One for Sensitivity
29 Chi square for New Test and DIAL-R with Sample Two for Sensitivity
30 Chi square for New Test and DIAL-R with Sample One for Specificity
31 Chi square for New Test and DIAL-R with Sample Two for Specificity
32 Chi square for New Test and Dallas with Sample One for Sensitivity
33 Chi square for New Test and Dallas with Sample Two for Sensitivity
34 Chi square for New Test and Brigance with Sample One for Sensitivity
35 Chi square for New Test and Brigance with Sample Two for Sensitivity
36 Chi square for New Test and Brigance with Sample One for Specificity
37 Chi square for New Test and Brigance with Sample Two for Specificity
B-l Characteristics of Sample for Hit Rate Validity of DDST-R
List of Table's (cont'd)
61
61
64
65
66
67
68
69
70
71
72
73
74
75
95
Page
( x i )
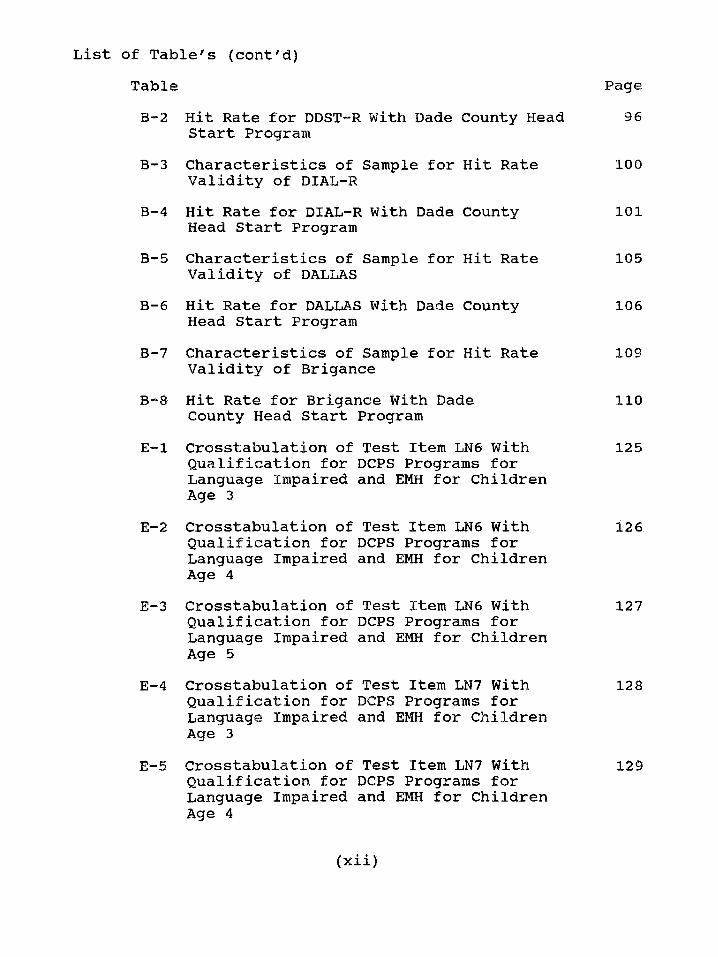
List of Table's (cont'd)TableB-2 Hit Rate for DDST-R With Dade County Head
Start ProgramB-3 Characteristics of Sample for Hit Rate
Validity of DIAL-RB—4 Hit Rate for DIAL-R With Dade County
Head Start ProgramB-5 Characteristics of Sample for Hit Rate
Validity of DALLASB-6 Hit Rate for DALLAS With Dade County
Head Start ProgramB-7 Characteristics of Sample for Hit Rate
Validity of BriganceB—8 Hit Rate for Brigance With Dade
County Head Start ProgramE-l Crosstabulation of Test Item LN6 With
Qualification for DCPS Programs for Language Impaired and EMH for Children Age 3
E-2 Crosstabulation of Test Item LN6 With Qualification for DCPS Programs for Language Impaired and EMH for Children Age 4
E-3 Crosstabulation of Test Item LN6 With Qualification for DCPS Programs for Language Impaired and EMH for Children Age 5
E-4 Crosstabulation of Test Item LN7 With Qualification for DCPS Programs for Language Impaired and EMH for Children Age 3
E-5 Crosstabulation of Test Item LN7 With Qualification for DCPS Programs for Language Impaired and EMH for Children Age 4
96
100
101
105
106
109
110
125
126
127
128
129
Page
(Xii)
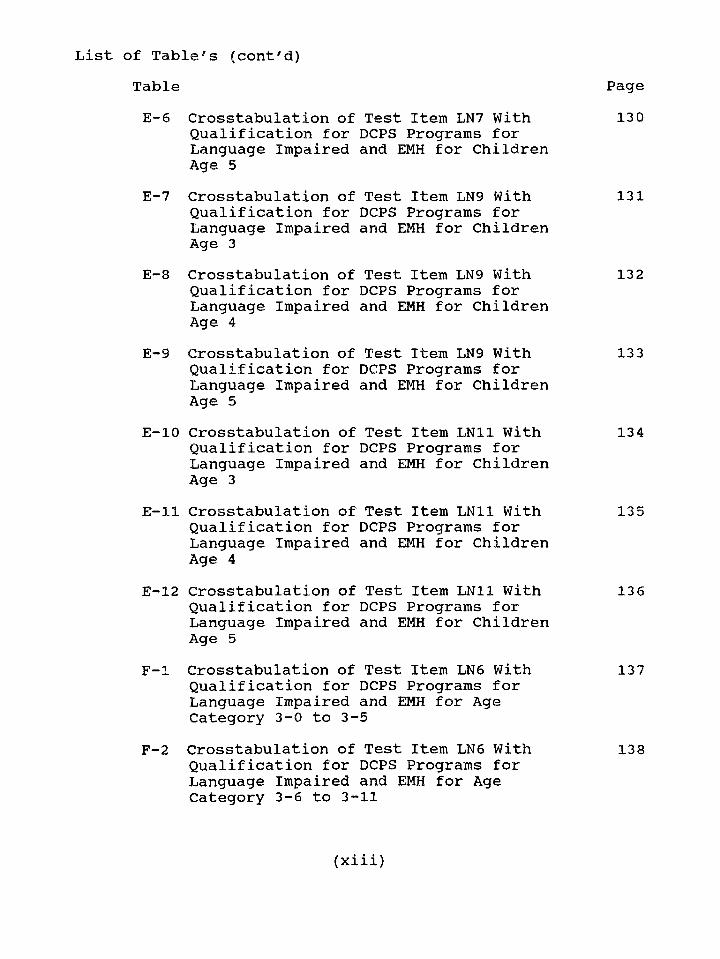
List of Table's (cont'd)TableE-6 Crosstabulation of Test Item LN7 With
Qualification for DCPS Programs for Language Impaired and EMH for Children Age 5
E-7 Crosstabulation of Test Item LN9 With Qualification for DCPS Programs for Language Impaired and EMH for Children Age 3
E-8 Crosstabulation of Test Item LN9 With Qualification for DCPS Programs for Language Impaired and EMH for Children Age 4
E-9 Crosstabulation of Test Item LN9 With Qualification for DCPS Programs for Language Impaired and EMH for Children Age 5
E-10 Crosstabulation of Test Item LN11 With Qualification for DCPS Programs for Language Impaired and EMH for Children Age 3
E-ll Crosstabulation of Test Item LN11 With Qualification for DCPS Programs for Language Impaired and EMH for Children Age 4
£-12 Crosstabulation of Test Item LN11 With Qualification for DCPS Programs for Language Impaired and EMH for Children Age 5
F-l Crosstabulation of Test Item LN6 With Qualification for DCPS Programs for Language Impaired and EMH for Age Category 3-0 to 3-5
F-2 Crosstabulation of Test Item LN6 With Qualification for DCPS Programs for Language Impaired and EMH for Age Category 3-6 to 3-11
130
131
132
133
134
135
136
137
138
Page
(xiii)
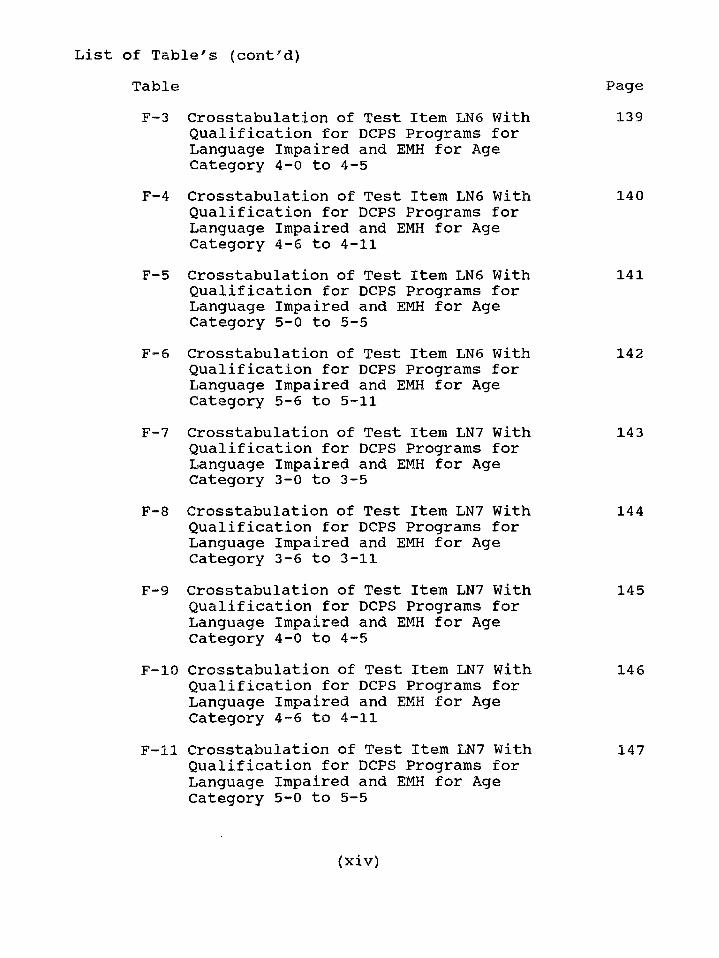
TableF-3 Crosstabulation of Test Item LN6 With
Qualification for DCPS Programs for Language Impaired and EMH for Age Category 4-0 to 4-5
F-4 Crosstabulation of Test Item LN6 With Qualification for DCPS Programs for Language Impaired and EMH for Age Category 4-6 to 4-11
F-5 Crosstabulation of Test Item LN6 With Qualification for DCPS Programs for Language Impaired and EMH for Age Category 5-0 to 5-5
F-6 Crosstabulation of Test Item LN6 With Qualification for DCPS Programs for Language Impaired and EMH for Age Category 5-6 to 5-11
F-7 Crosstabulation of Test Item LN7 With Qualification for DCPS Programs for Language Impaired and EMH for Age Category 3-0 to 3-5
F-8 Crosstabulation of Test Item LN7 With Qualification for DCPS Programs for Language Impaired and EMH for Age Category 3-6 to 3-11
F-9 Crosstabulation of Test Item LN7 With Qualification for DCPS Programs for Language Impaired and EMH for Age Category 4-0 to 4-5
F-10 Crosstabulation of Test Item LN7 With Qualification for DCPS Programs for Language Impaired and EMH for Age Category 4-6 to 4-11
F-ll Crosstabulation of Test Item LN7 With Qualification for DCPS Programs for Language Impaired and EMH for Age Category 5-0 to 5-5
List of Table's (cont'd)
139
140
141
142
143
144
145
146
147
Page
(xiv)
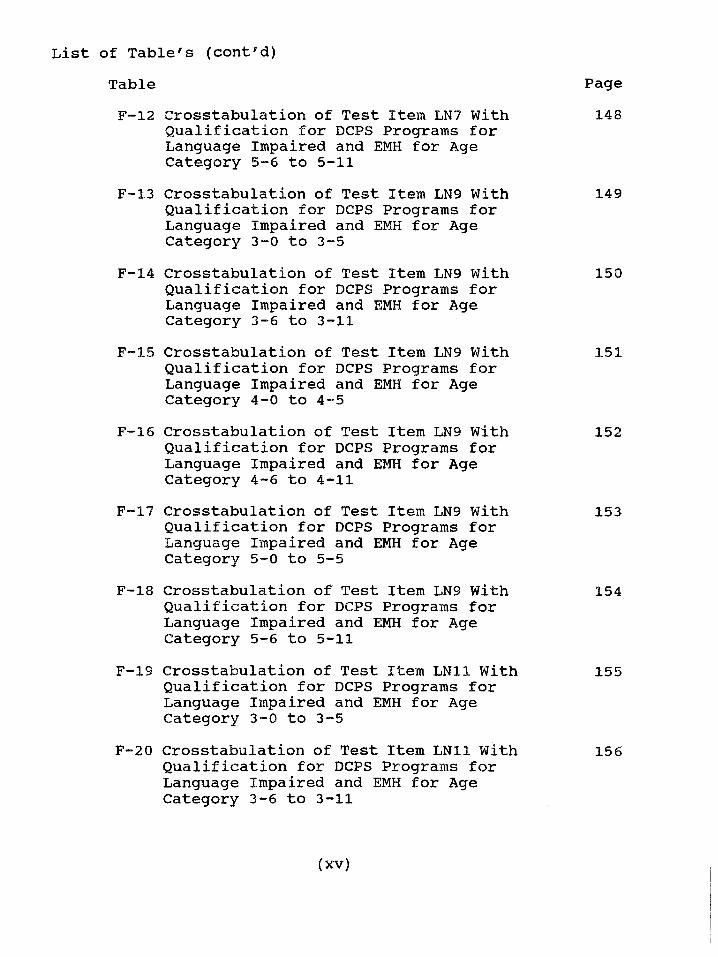
TableF-12 Crosstabulation of Test Item LN7 With
Qualification for DCPS Programs for Language Impaired and EMH for Age Category 5-6 to 5-11
F-13 Crosstabulation of Test Item LN9 With Qualification for DCPS Programs for Language Impaired and EMH for Age Category 3-0 to 3-5
F-14 Crosstabulation of Test Item LN9 With Qualification for DCPS Programs for Language Impaired and EMH for Age Category 3-6 to 3-11
F-15 Crosstabulation of Test Item LN9 With Qualification for DCPS Programs for Language Impaired and EMH for Age Category 4-0 to 4-5
F—16 Crosstabulation of Test Item LN9 With Qualification for DCPS Programs for Language Impaired and EMH for Age Category 4-6 to 4-11
F-17 Crosstabulation of Test Item LN9 With Qualification for DCPS Programs for Language Impaired and EMH for Age Category 5-0 to 5-5
F-18 Crosstabulation of Test Item LN9 With Qualification for DCPS Programs for Language Impaired and EMH for Age Category 5-6 to 5-11
F-19 Crosstabulation of Test Item LN11 With Qualification for DCPS Programs for Language Impaired and EMH for Age Category 3-0 to 3-5
F-20 Crosstabulation of Test Item LN11 With Qualification for DCPS Programs for Language Impaired and EMH for Age Category 3-6 to 3-11
List of Table's (cont'd)
148
149
150
151
152
153
154
155
156
Page
(XV)
List of Table's ( c o n t 'd )
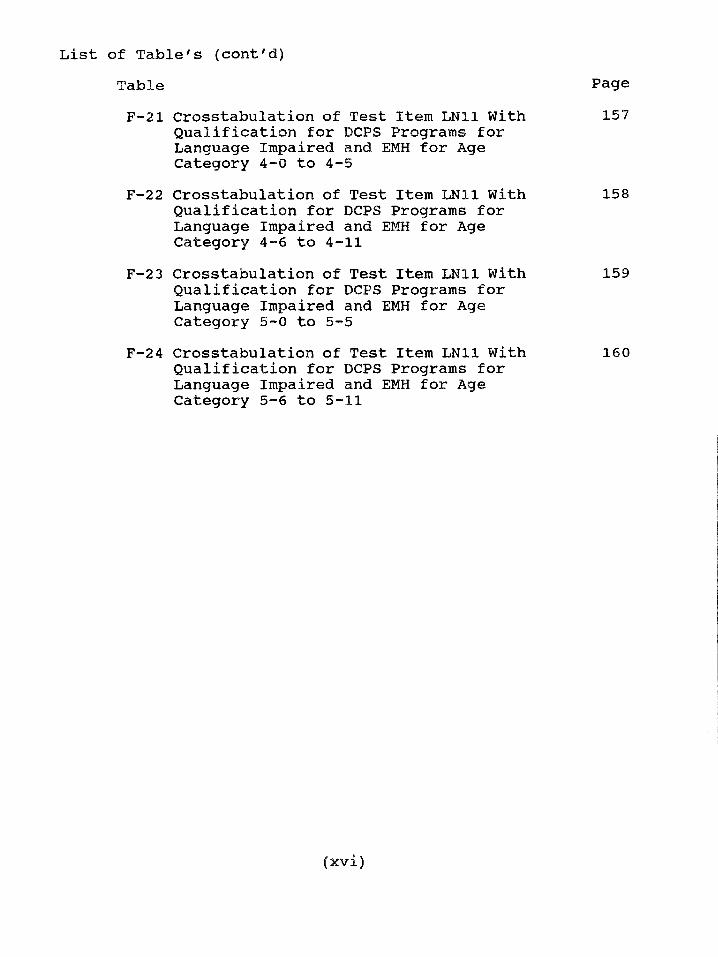
TableF-21 Crosstabulation of Test Item LN11 With
Qualification for DCPS Programs for Language Impaired and EMH for Age Category 4-0 to 4-5
F-22 Crosstabulation of Test Item LN11 With Qualification for DCPS Programs for Language Impaired and EMH for Age Category 4-6 to 4-11
F-23 Crosstabulation of Test Item LN11 With Qualification for DCPS Programs for Language Impaired and EMH for Age Category 5-0 to 5-5
F-24 Crosstabulation of Test Item LN11 With Qualification for DCPS Programs for Language Impaired and EMH for Age Category 5-6 to 5-11
157
158
159
160
Page
( x v i )

LIST OF FIGURES
Figure Page
1 The Hit Rate Model for Evaluating 17Screening Decisions Based on a Particular Screening Instrument
2 Dade County Public School Screening 20and Evaluation Procedure for Dade County Head Start Program
3 Example of Crosstabulation Procedure 31Used to Identify A Test Item for The New Screening Test
4 Crosstabulation Results for The Four 34LAP-D Items With Significant Sensitivity and Specificity Scores
5 Evaluation Procedure for Validation of 47Screening Decisions
( x v i i )
CHAPTER I
Introduction
The nation has been expressing concern about the large number of
children who are not satisfactorily progressing in school. An estimated 12
percent of the school age population, in the United States, have physical,
mental, or emotional difficulties that hinder their chances of having a
positive school experience (Lichtenstein & Ireton, 1991). Another segment
of the school age population, who do not achieve their potential because of
mild learning problems or disadvantaged environments, could also be
included in the estimation of the students who are not meeting with success
in school. Frequently, these children continue to fall further and further
behind in their academics with each successive school year (McNulty, Smith
& Soper, 1983). Many of these children reveal early indications of a need
for some type of special assistance in school (Adelman, 1982). Most local
and state education departments have implemented preschool screening
programs to assist in the early identification process (Ysseldyke &
O'Sullivan, 1987). Preschool screening is a brief, inexpensive procedure that
aims "to identify those children in the general population who may be at-risk
for a specific disability, or who may otherwise need special services or
l
programs in order to develop to their maximum potential" (Barnes, 1932,
p. 11).
Early intervention literature indicates that identifying children at-risk,
through a preschool screening program, is a positive policy to practice
(Castro & Mastropieri, 1986). Edmiaston and Mowder (1985) reviewed a
series of reports on preschool intervention projects for "at risk" children
which included diverse handicapping conditions and children with all
degrees of impairments. They concluded that early intervention was
effective, and that the earlier it began, the greater was the long term
financial savings. Fewell & Oelwein (1991), using data from 14 sites which
utilize a Model Preschool Program for Children with Down Syndrome and
Other Developmental Delays, reported evidence for the effectiveness of
early intervention. Lazar and Darlington (1982), who reported on pooled
data from 12 studies, concluded that there were immediate and long term
educational and attitudinal benefits from early intervention programs.
"Prevention and intervention in the earliest stages of a problem are seen as
having the potential for being more effective and economical than later
remediation" (Adelman, 1982, p. 256). The importance of early
identification and intervention is the reason for the increase in preschool
2
screening programs. Meisels, Harbin, & Modigliani (1988) conducted a
survey and found that to be in compliance with P.L. 94-142 more than half
of the 50 states mandate screening for children between the ages of three
and six.
To "screen" is defined as a transitive verb meaning: To separate from
a group those individuals showing indications of, or tendencies toward,
mental or physical incapacity for specified activities. (Funk & Wagnall,
1965). Preschool screening is the "process of early detection, usually
involving observation and measurement procedures, of all preschool children
(children between the ages of 3 and 5 years), who, for a variety of reasons
(social, emotional, intellectual, biological, physical, linguistic, environmental
or any combination of such), will be unable to attain optimum growth and/or
normal development" (Barnes, 1982, p. 7).
Screening is the first step in the evaluation process. At this first step, "a
large group is assessed with brief, simple, low-cost procedures to sort out
those individuals who might have a problem (i.e., who are at risk) from
those individuals who apparently do not need a follow-up evaluation at the
time" (Lichtestein & Ireton, 1984, p. 9). Individuals who are sorted out or
identified as a result of the screening proceed to the next step, evaluation for
3
the purpose of placement or diagnosis. This involves more extensive and
definitive procedures utilizing standardized preschool psychoeducational
assessment instruments to determine whether the indicated problem or
problems in question are actually present. As a result, this diagnostic-
evaluation process is more costly and time-consuming than screening. Only
those children identified at the screening step continue on to a more
comprehensive evaluation. When the results of the evaluation support the
hypothesis that a problem is present, a diagnosis is then made and
intervention strategies are recommended and implemented.
Problem
The problem considered in this study is that too many children enrolled
in the Dade County Head Start Program are incorrectly identified by
commercial screening tests as at-risk or not at-risk for language impaired or
educable mentally handicapped programs. The incompatibility of commercial
standardized preschool screening measures with the local Head Start
population and the quantitative criteria used for placement in the Dade
County Public Schools Preschool Programs have contributed heavily to these
screening inefficiencies (see p. 16 thru 18 and Appendix B). Consequently,
too many Head Start students are unnecessarily being administered complete
4
psychological evaluations while other children are being overlooked and are
not receiving the services they need.
Head Start is a nationally important program for early intervention. It
is a federally funded program that serves low income young children ages
three thru five years. The Dade County Head Start Program, which serves
approximately 4,000 children, works jointly with the University of Miami
and the Dade County Public School System (DCPS) in providing services
to the youngsters enrolled. These services include screening, evaluation, and
intervention for children who are identified as impaired or delayed. Table
1 shows the handicapping conditions served by Head Start and their rate of
prevalence on a national level based on the Head Start criteria.
As Table 1 indicates, an overwhelming percentage of the Head Start
children identified as handicapped are those identified as having a speech
impairment. The category of speech impairment, as defined nationally by
Head Start, also includes language impairment
5
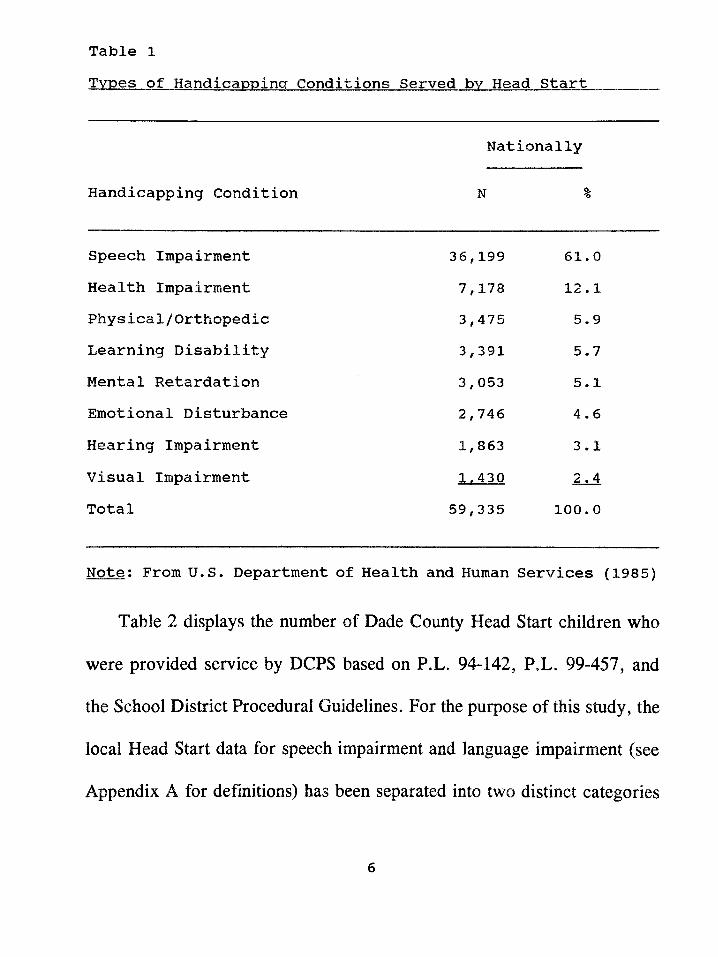
Table 1Types of Handicapping Conditions Served bv Head Start
Handicapping Condition
Nationally
N %
Speech Impairment 36,199 61 * 0Health Impairment 7,178 12 .1Physical/Orthopedic 3,475 5.9Learning Disability 3,391 5.7Mental Retardation 3,053 5.1Emotional Disturbance 2,746 4.6Hearing Impairment 1,863 3.1Visual Impairment 1^430 2.4Total 59,335 100. 0
Note: From U.S. Department of Health and Human Services (1985)
Table 2 displays the number of Dade County Head Start children who
were provided service by DCPS based on P.L. 94-142, P.L. 99-457, and
the School District Procedural Guidelines. For the purpose of this study, the
local Head Start data for speech impairment and language impairment (see
Appendix A for definitions) has been separated into two distinct categories
6
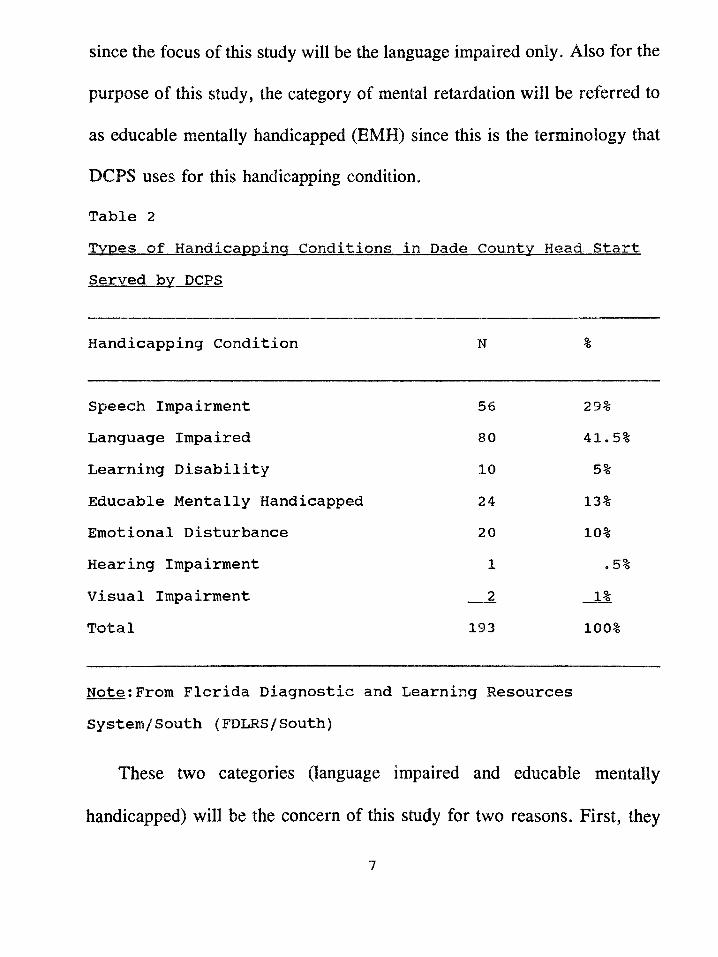
since the focus of this study will be the language impaired only. Also for the
purpose of this study, the category of mental retardation will be referred to
as educable mentally handicapped (EMH) since this is the terminology that
DCPS uses for this handicapping condition.
Table 2
Served bv DCPS
Handicapping Condition N %
Speech Impairment 56 29%Language Impaired 80 41*5%Learning Disability 10 5%Educable Mentally Handicapped 24 13%Emotional Disturbance 20 10%Hearing Impairment 1 .5%Visual Impairment 2 1%Total 193 100%
Note:From Florida Diagnostic and Learning Resources System/South (FDLRS/South)
These two categories (language impaired and educable mentally
handicapped) will be the concern of this study for two reasons. First, they
are similar developmental areas or constructs. Lichtenstein and Ireton (1984)
state that "... language is difficult to distinguish from the cognitive area,
since a major part of cognitive functioning involves processing of verbal
material and relies upon comprehension of language." (p. 52). Also, most
young children with mild mental retardation exhibit problems in language
development (Thurman & Widerstrom, 1985). Second, these two categories
generate the highest number of children for exceptional education from
preschool screenings except for speech impairment (29%). The category of
language impaired accounts for 41.5% of the total DCPS preschool
exceptional student population while the category of educable mentally
handicapped accounts for 13% (see Table 2). The category of speech
impairment will not be a concern of this study because "... it is essentially
a disorder of speech articulation ... and other nonlinguistic and linguistic
areas of functioning are generally within normal limits." (Cantwell & Baker,
1987, p. 76).
The potential for preschool screening programs to improve the provision
of early identification services is enormous. However, results of screening
programs often fall short of expectations. One of the factors which
contributes to these short falls has to do with accuracy of the screening
8
instruments.
Inaccurate screening instruments may lead to identification or
classification errors. There are two types of identification or classification
errors: a) when a child is referred for farther testing when it is not
necessary (false positive) and b) when a child with a problem is not
identified and is thus not provided services (false negative). These
classification errors most frequently occur because of the incompatibility of
the commercial screening instruments with both the actual population being
screened and with the local procedural criteria for diagnosis.
Scott and Hogan (1982) identified criteria to be considered when
selecting a screening instrument:
1) Conditions for which screening is performed should be well
defined.
2) Instruments should have demonstrated reliability and predictive
validity.
3) Administration should be accomplished easily, quickly, and
economically.
4) Data on the number of false positives and false negatives should
be available and at an acceptable ratio for sensitivity and
9
human cost, (see page 15 for definitions of false positive and false negative)
5) Procedures should be acceptable to both the professional and lay
community.
Most screening processes rely upon a multidimensional screening test,
e.g., Developmental Indicators for the Assessment of Learning-Revised
(DIAL-R), Denver Developmental Screening Test-Revised (DDST-R),
Dallas Preschool Screening Test, or the Brigance Preschool Screen.
Screening is essentially a matter of translating the results of a child’s
performance on a screening instrument into a screening recommendation.
The screening recommendation is based upon the decision rale (e.g., cutoff
score) that is supplied by the publisher of the screening instrument. The user
makes no decisions regarding an appropriate referral rate, but simply accepts
what the instrument offers. The problem with this approach is that a given
decision rale cannot be optimal for all situations and settings, and the user
may or may not find the results appropriate when applied to local criteria for
obtaining early intervention services.
When choosing a screening instrument to be used for a particular
population it is important to consider the percentage of the normative sample
referred by the decision rale and the composition of the screening
10
instrument’s normative sample (e.g., ethnicity, and social economic status).
Standardized screening instruments typically provide normative data
indicating what percentage of the instrument’s normative sample is referred
by recommended decision rales or cutoff scores. However, normative data
are of limited value to the user if the nature of the normative sample and the
local population differ. For this reason it is preferable to select a measure
developed with a sample similar to the population which will be screened.
The population with which this study is concerned is the children enrolled
in the Dade County Head Start Program.
The normative samples used for commercial screening instruments are
not comparable to the population that is enrolled in Head Start in the Dade
County area. This can be seen by comparing Table 3, which illustrates the
ethnic make up of Head Start’s population in Dade County, with the
normative information for commercial instruments. These instruments are
described in Appendix B. The Head Start Program in Dade County has 52
school sites and serves approximately 4,000 children. These Head Start sites
are in disadvantaged areas of Dade County and serve both the rural and
urban sections of the county forming an extremely diverse population.
ii
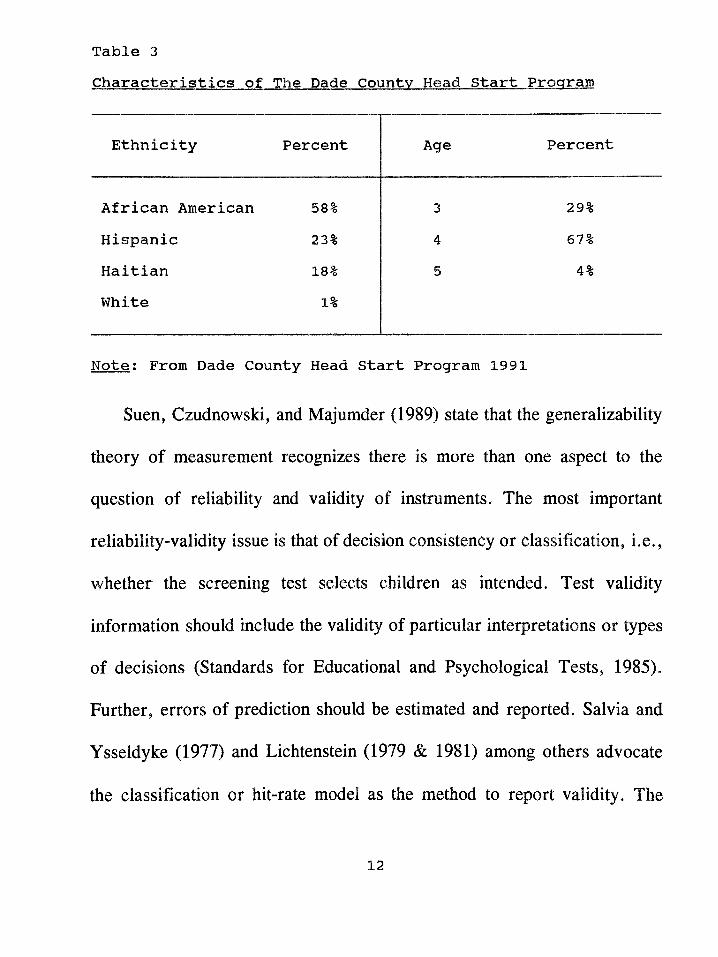
Table 3Characteristics of The Dade Countv Head Start Program
Ethnicity Percent Age Percent
African American 58% 3 29%Hispanic 23% 4 67%Haitian 18% 5 4%White 1%
Note; From Dade County Head Start Program 1991
Suen, Czudnowski, and Majumder (1989) state that the generalizability
theory of measurement recognizes there is more than one aspect to the
question of reliability and validity of instruments. The most important
reliability-validity issue is that of decision consistency or classification, i.e.,
whether the screening test selects children as intended. Test validity
information should include the validity of particular interpretations or types
of decisions (Standards for Educational and Psychological Tests, 1985).
Further, errors of prediction should be estimated and reported. Salvia and
Ysseldyke (1977) and Lichtenstein (1979 & 1981) among others advocate
the classification or hit-rate model as the method to report validity. The
12
classification or hit rate model summarizes the relationship between
outcomes of a screening instrument and the "actual status" of children in a
given population. The actual status is arrived at through an in-depth
psychoeducational evaluation. Terminology used with this model are:
1) Hit Rate - This is the proportion of accurate screening decisions out
of the total number of screening decisions. Originally proposed by Meehl &
Rosen (1955), it has influenced the work of a number of researchers
(Barnes, 1982; Lichtenstein, 1981; and Satz & Fletcher, 1979). Hit rate is
expressed as a percentage that provides an index of the accuracy of a
screening instrument. (Lichtenstein & Ireton, 1984)
2) Base Rate - This is the prevalence of the problem to be identified.
It provides an estimate of the existing problem that the screening instrument
seeks to identify. (Lichtenstein & Ireton, 1984)
3) Referral Rate - This is the total number of children referred for
testing by a particular screening instrument. It is expressed as a percentage
that should be higher than the base rate and that will thus index the
possibility that all of the target group children would have been identified.
(Lichtenstein & Ireton, 1984)
13
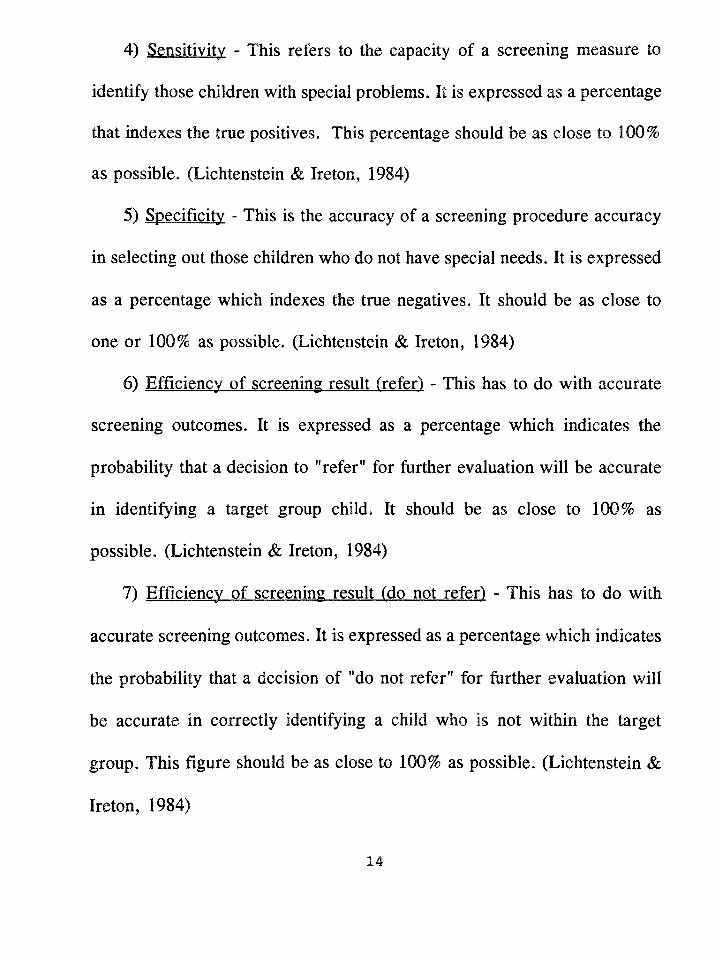
4) Sensitivity - This refers to the capacity of a screening measure to
identify those children with special problems. It is expressed as a percentage
that indexes the true positives. This percentage should be as close to 100%
as possible. (Lichtenstein & Ireton, 1984)
5) Specificity - This is the accuracy of a screening procedure accuracy
in selecting out those children who do not have special needs. It is expressed
as a percentage which indexes the true negatives. It should be as close to
one or 100% as possible. (Lichtenstein & Ireton, 1984)
6) Efficiency of screening result (refer) - This has to do with accurate
screening outcomes. It is expressed as a percentage which indicates the
probability that a decision to "refer" for further evaluation will be accurate
in identifying a target group child. It should be as close to 100% as
possible. (Lichtenstein & Ireton, 1984)
1) Efficiency of screening result (do not refer) - This has to do with
accurate screening outcomes. It is expressed as a percentage which indicates
the probability that a decision of "do not refer" for further evaluation will
be accurate in correctly identifying a child who is not within the target
group. This figure should be as close to 100% as possible. (Lichtenstein &
Ireton, 1984)
14
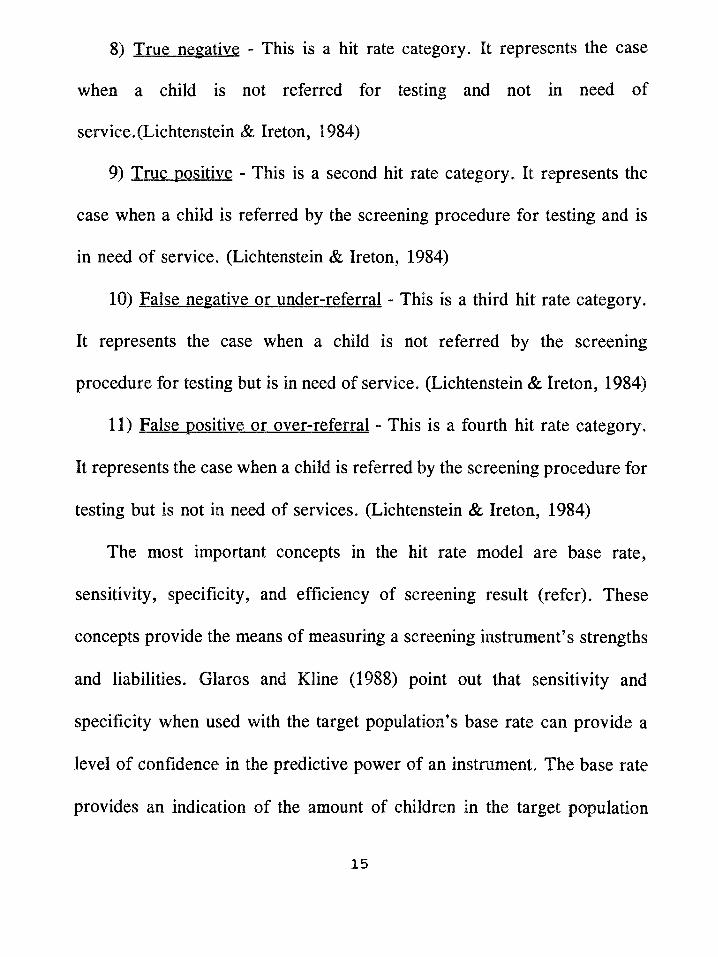
8) True negative - This is a hit rate category. It represents the case
when a child is not referred for testing and not in need of
service.(Lichtenstein & Ireton, 1984)
9) True positive - This is a second hit rate category. It represents the
case when a child is referred by the screening procedure for testing and is
in need of service. (Lichtenstein & Ireton, 1984)
10) False negative or under-referral - This is a third hit rate category.
It represents the case when a child is not referred by the screening
procedure for testing but is in need of service. (Lichtenstein & Ireton, 1984)
11) False positive or over-referral - This is a fourth hit rate category.
It represents the case when a child is referred by the screening procedure for
testing but is not in need of services. (Lichtenstein & Ireton, 1984)
The most important concepts in the hit rate model are base rate,
sensitivity, specificity, and efficiency of screening result (refer). These
concepts provide the means of measuring a screening instrument's strengths
and liabilities. Glares and Kline (1988) point out that sensitivity and
specificity when used with the target population’s base rate can provide a
level of confidence in the predictive power of an instrument. The base rate
provides an indication of the amount of children in the target population
15
while the sensitivity and specificity scores indicate how accurate the
instrument is in identifying the target population. The efficiency of screening
result (refer) provides an estimate of the possibility that a screening referral
will prove accurate.
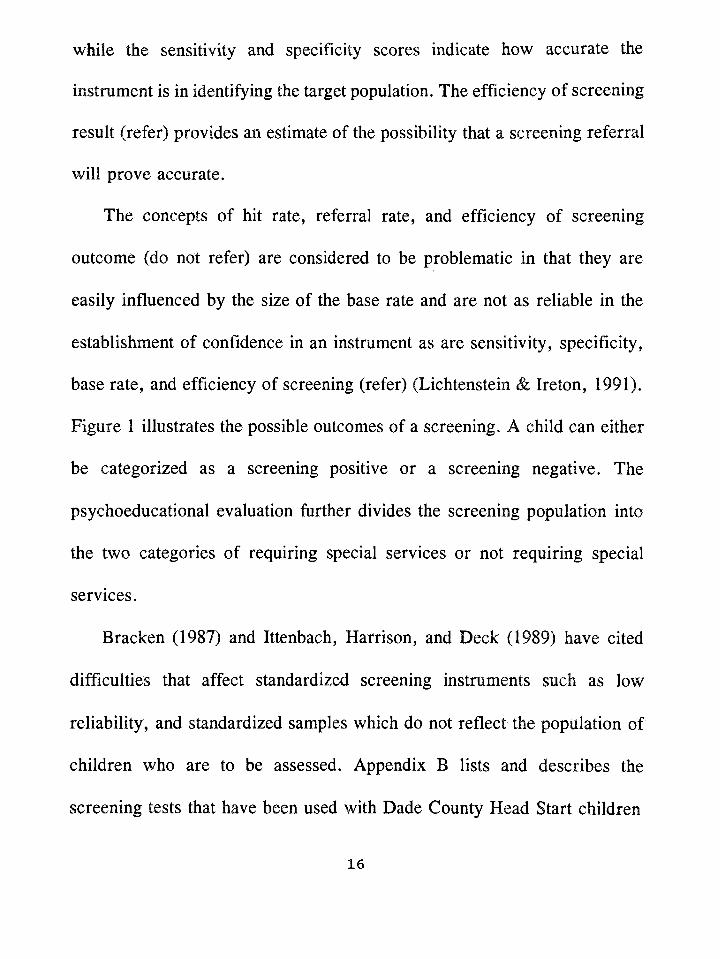
The concepts of hit rate, referral rate, and efficiency of screening
outcome (do not refer) are considered to be problematic in that they are
easily influenced by the size of the base rate and are not as reliable in the
establishment of confidence in an instrument as are sensitivity, specificity,
base rate, and efficiency of screening (refer) (Lichtenstein & Ireton, 1991).
Figure 1 illustrates the possible outcomes of a screening. A child can either
be categorized as a screening positive or a screening negative. The
psychoeducational evaluation farther divides the screening population into
the two categories of requiring special services or not requiring special
services.
Bracken (1987) and Ittenbach, Harrison, and Deck (1989) have cited
difficulties that affect standardized screening instruments such as low
reliability, and standardized samples which do not reflect the population of
children who are to be assessed. Appendix B lists and describes the
screening tests that have been used with Dade County Head Start children
16
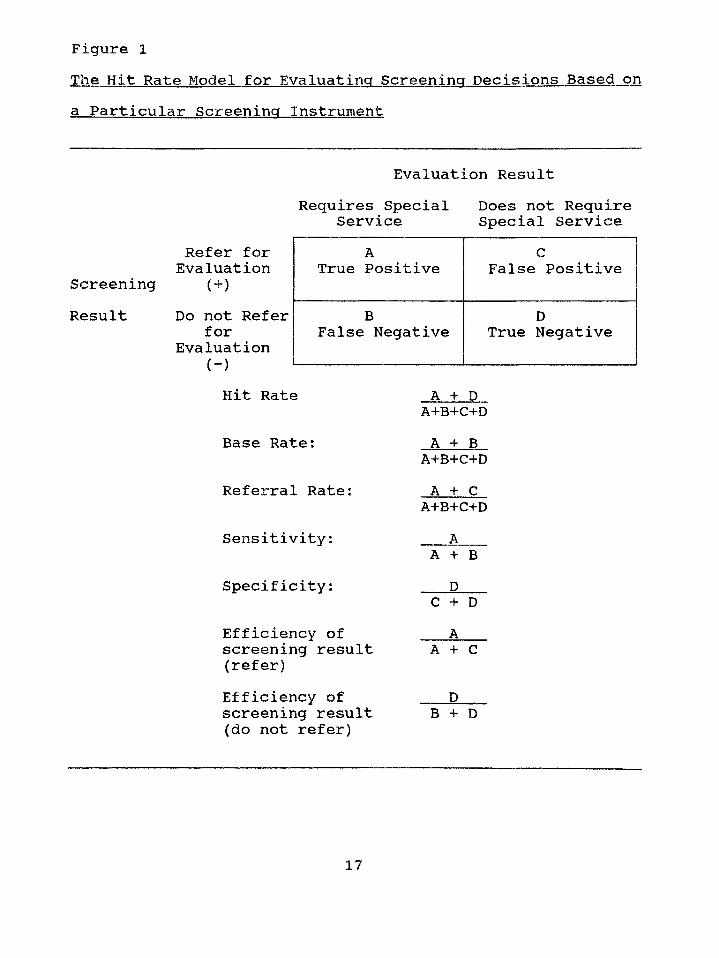
Figure 1The Hit Rate Model for Evaluating Screening Decisions Based on a Particular Screening Instrument
Evaluation ResultRequires Special
ServiceDoes not Require Special Service
ScreeningResult
Refer for Evaluation
( + )
Do not Refer for
Evaluation (-)
ATrue Positive
cFalse Positive
BFalse Negative
DTrue Negative
Hit Rate
Base Rate:
Referral Rate:
Sensitivity:
Specificity:
Efficiency of screening result (refer)Efficiency of screening result (do not refer)
A + D A+B+C+DA + B
A+B+C+DA + C
A+B+C+DA
A + B D
C + D A
A + C
DB + D
17
by DCPS. Descriptions of each test’s norms, validity, and reliability
information are included along with the hit rate data for Dade County Head
Start. The difficulties that the incompatibility of the commercial screening
tests have presented when used with the Dade County Head Start population
is documented in Appendix B. Low hit rates, large amounts of false
positives, and some false negatives have occurred.
Another factor which leads to classification errors concerns the local
procedural guidelines or criteria that are used by various agencies such as
DCPS (see Appendix C for DCPS criteria). Harrison (1992) writes that
"...agencies utilize numerous types of criteria to determine children who are
eligible for intervention services as a result of comprehensive assessment..."
(p. 10). Consequently, limitations occur when trying to utilize commercial
screening instruments. The commercial screening instruments are not based
upon the criteria of specific agencies. The primary characteristics of a
screening program are who is to be identified and for what purpose. Wilson
and Reichmuth (1985), in a review of the literature on predictive
effectiveness of identification of at-risk, learners, suggest that the most
important factor in this regard is to "...specify the state we are attempting
to predict", (p. 184) The purpose of the DCPS Preschool Screening Program
18
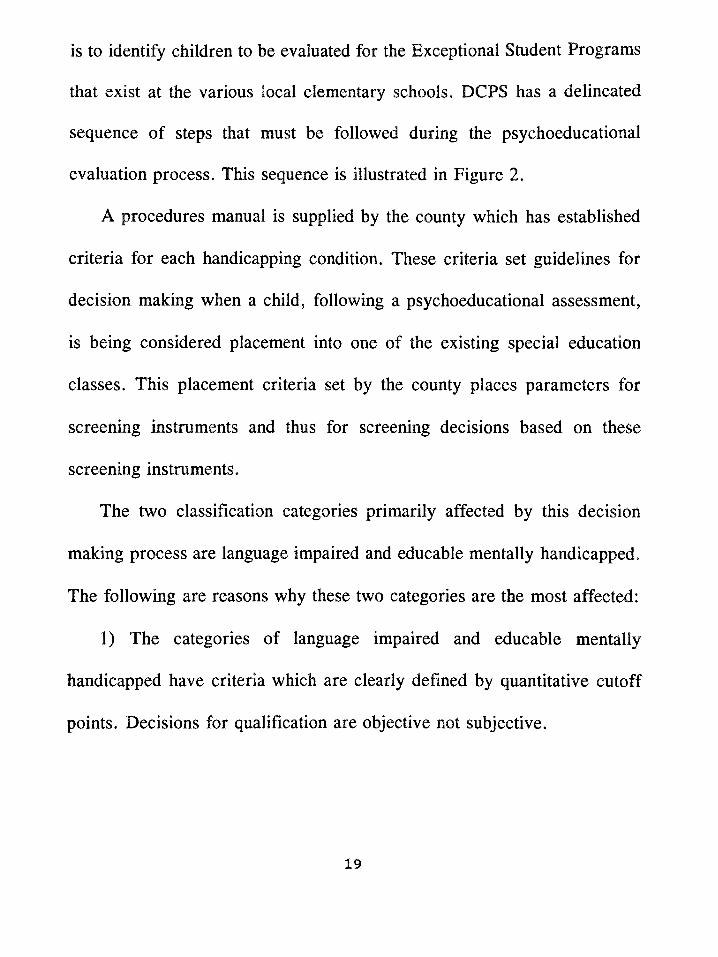
is to identify children to be evaluated for the Exceptional Student Programs
that exist at the various local elementary schools. DCPS has a delineated
sequence of steps that must be followed during the psychoeducational
evaluation process. This sequence is illustrated in Figure 2.
A procedures manual is supplied by the county which has established
criteria for each handicapping condition. These criteria set guidelines for
decision making when a child, following a psychoeducational assessment,
is being considered placement into one of the existing special education
classes. This placement criteria set by the county places parameters for
screening instruments and thus for screening decisions based on these
screening instruments.
The two classification categories primarily affected by this decision
making process are language impaired and educable mentally handicapped.
The following are reasons why these two categories are the most affected:
1) The categories of language impaired and educable mentally
handicapped have criteria which are clearly defined by quantitative cutoff
points. Decisions for qualification are objective not subjective.
19
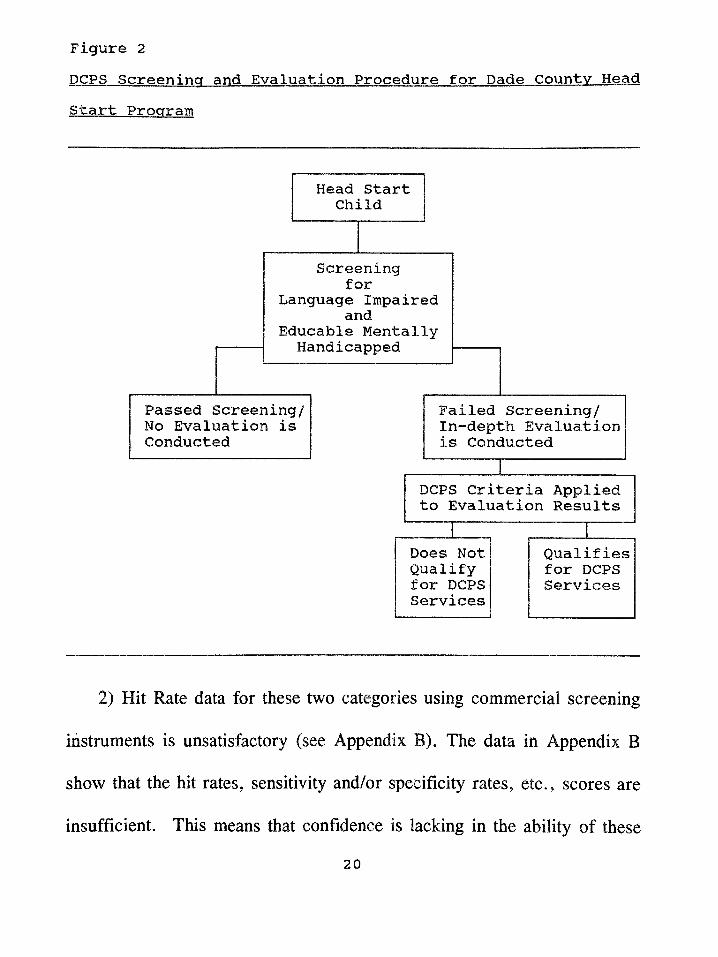
Figure 2DCPS Screening and Evaluation Procedure for Dade County Head Start Program
2) Hit Rate data for these two categories using commercial screening
instruments is unsatisfactory (see Appendix B). The data in Appendix B
show that the hit rates, sensitivity and/or specificity rates, etc., scores are
insufficient. This means that confidence is lacking in the ability of these
screening instruments to accurately predict positives and negatives.
Screening Measures
The effectiveness of screening measures can be evaluated in two ways:
a) how well they have been constructed and standardized and b) how
accurately their scores predict to certain outcome measures (Barnes, 1982).
In addition, a screening measure must possess high acceptability to the
professionals providing the diagnostic follow-ups, and the children taking the
test must be able to relate to the items. Barnes (1982) states that "The
screening test should be simple in design. To be maximally effective for the
large-scale screenings it should require little or no equipment, be simple to
administer and score, be relatively short duration in time and capable of
being given in a wide variety of settings'1, (p. 27)
Screening Test Construction
Since currently available screening instruments are not providing
adequate validity data for the target population being considered in this
study, the development of a new screening instrument is warranted.
Item selection and analysis are important concepts in the construction of
a new screening test. The actual items selected, for a screening test, depend
on the content specifications established and the target population. In this
21
study language and cognitive skills are the focus; therefore item content will
emphasize these areas.
One of the methods by which items are selected is to draw from other
measures which are presently used to assess the target population. This type
of item selection technique aids in item validity. Items for screening tests
should meet the following criteria (Barnes, 1982):
1) Fair and appropriate
2) Free from ambiguity
3) Free from cultural/response bias
4) Should not be too easy or too difficult.
A screening test should also have uniformity of test materials and their
presentation. These uniformities are ensured by precise instructions as to
how the instrument is to be administered, scored, and interpreted. The
standardization process of screening test construction is a two-fold problem.
The first problem concerns the standardization of test procedures and
materials, including establishing the reliability and validity of the test. The
second problem concerns the selection of a sample population. By choosing
appropriate items from already existing tests and using samples of children
from the population that the screening test will be serving, these problems
22
can be minimized.
The reliability of a screening instrument is a major factor. It is
important to demonstrate that the measure will be consistent from one
administration to another. If a test is not reliable, than the judgement or
decision of the screener will be tentative. Reliability or consistency is
usually estimated by the test-retest method. This method is accomplished by
the technique of repeated measurement (two measures of a child in the same
representative group). A coefficient of correlation between the two sets of
scores is then calculated.
Another type of reliability measure which is essential is inter-rater
reliability. This type of reliability coefficient estimates the ability of different
examiners to judge accurately and consistently the performance of a child
on each item. Inter-rater reliability is established by having examiners
observe and evaluate a number of children at the same time. The scores
reported by each examiner are then correlated and the resulting coefficient
yields an estimate of inter-rater reliability.
The validity of a screening instrument is concerned with the soundness
of all the interpretations or decisions (refer or do not refer) the examiner
makes based on the test results (pass or fail). Content and predictive validity
23
are a concern of all tests.
Content validity estimates how well the items actually contain the subject
matter on which the test focuses. Content validity centers on the test
materials and the item domain. In this study the domain is language and
cognitive skills and materials and items will require demonstration of skills
in these areas.
Construct validity has to do with the measurement of the trait, skill, or
ability the test is trying to measure. In this study the abilities are
cognitive/language abilities. The literature on these abilities states that they
are closely related and overlap. The use of already existing items from tests
that measure these two areas will fulfill the construct validity concept.
Predictive validity will be the main focus of this study. In predictive
validity there is always an external criterion involved which establishes the
standard or direct measure of the characteristics or behavior in question. In
this study predictive validity will be concerned with the new screening
instrument's ability to predict to the criteria for qualification into a Dade
County Public School Program for language impaired or educable mentally
handicapped children. This validity is estimated mainly through the use of
the classification or hit rate model previously discussed on
24
pages 12 thru 17.
Purpose
The purpose of this study Is to develop a more accurate preschool
screening Instrument for Identifying Dade County Head Start children who
are language Impaired or educable mentally handicapped children (EMH)
according to the (DCPS) criteria. The new screening Instrument will be
considered more accurate only If both the sensitivity and the specificity
scores of the new test are significantly higher than the sensitivity and
specificity scores of the previously used commercial screening tests.
25

Null Hypotheses
Null Hypothesis 1: There is no significant difference between the
sensitivity scores of the new screening instrument
and the sensitivity scores of the previously used
commercial screening instruments when used to
identify Dade County Head Start children for
placement into a Dade County Public School program
for the language impaired or the educable mentally
handicapped.
Null Hypothesis 2: There is no significant difference between the
specificity scores of the new screening instrument
and the specificity scores of the previously used
commercial screening instruments when used to
identify Dade County Head Start children for
placement into a Dade County Public School program
for the language impaired or the educable mentally
handicapped.
26
CHAPTER II
Method
Subjects
The subjects used to form the new screening Instrument were all
children enrolled In the Dade County Head Start Program. A total of 1,700
children were involved In the test construction procedure.
Of these 1,700 children, three separate samples were used. The first
sample consisted of 500 children (n=500). This group of children was used
to select items that would potentially be used to construct the screening
Instrument. Test protocols from these subjects, who had previously been
referred and administered a comprehensive evaluation for possible placement
Into a Dade County Public School program for the language Impaired or the
educable mentally handicapped, were examined by using a crosstabulation
technique. The outcome (pass or fail) of each response to an Item, made by
each child and recorded on the test protocols, was stored on a computer file.
Also stored on the computer file was the following: age In years, age In
months, sex, ethnicity, qualification for a Dade County Public School
program (yes or no), and diagnosis (no service recommended, language
Impaired, or EMH).
27
The second and third randomly selected samples consisted of 600
children (n=600) each. These groups of children were used to determine the
effectiveness of the new screening instrument (i.e. Hit Rate). The results of
this validation procedure were recorded in a computer file and consisted of
the following data: age, age in months, sex, ethnicity, performance on each
item (pass or fail), total screening test result (pass or fail), qualification for
a Dade County Public School program (yes or no), and diagnosis (regular
education, language impaired, or EMH).
The children in each sample were within the age range of 3 to 5 years,
were of a low socioeconomic level, and displayed ethnic diversity. Tables
4, 5, and 6 describe the characteristics of each sample. Each of these
samples were similar in ethnic composition to the total Dade County Head
Start population as depicted in Table 3 on page 12. There was a majority of
African Americans, a smaller number of Hispanics and Haitians, and a still
smaller number of Whites.
28
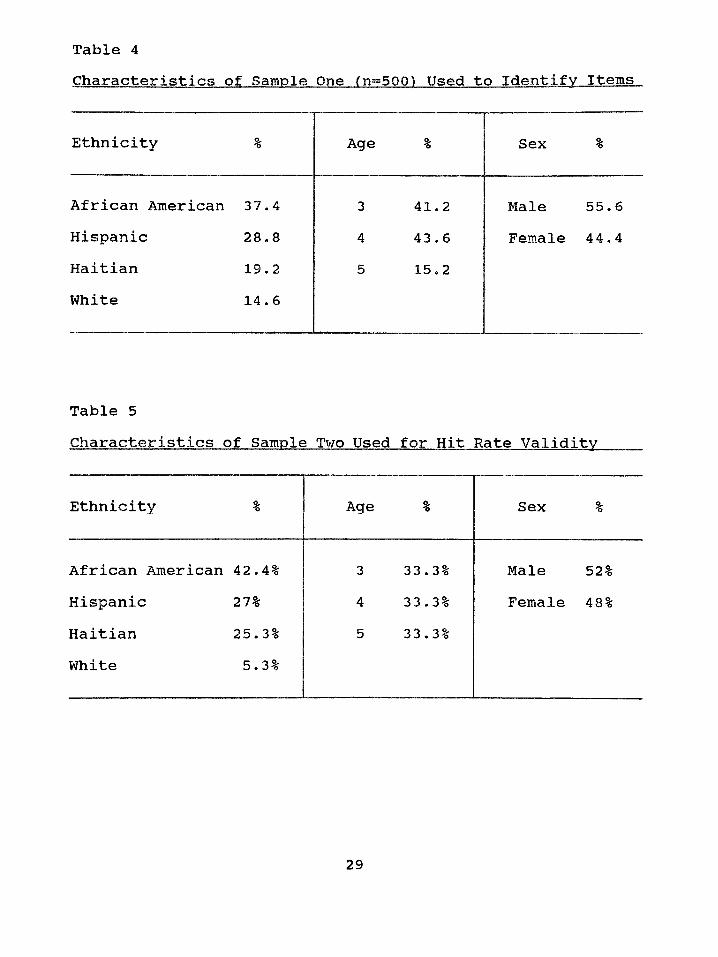
Table 4Characteristics of Sample One (n=500) Used to Identify Items
Ethnicity % Age % Sex %
African American 37.4 3 41.2 Male 55. 6Hispanic 28.8 4 43.6 Female 44.4Haitian 19.2 5 15.2White 14.6
Table 5Characteristics of Sample Two Used for Hit Rate Validity
Ethnicity % Age % Sex %
African American 42. 4% 3 33 .3% Male 52%Hispanic 27% 4 33 .3% Female 48%Haitian 25. 3% 5 33 .3%White 5.3%
29
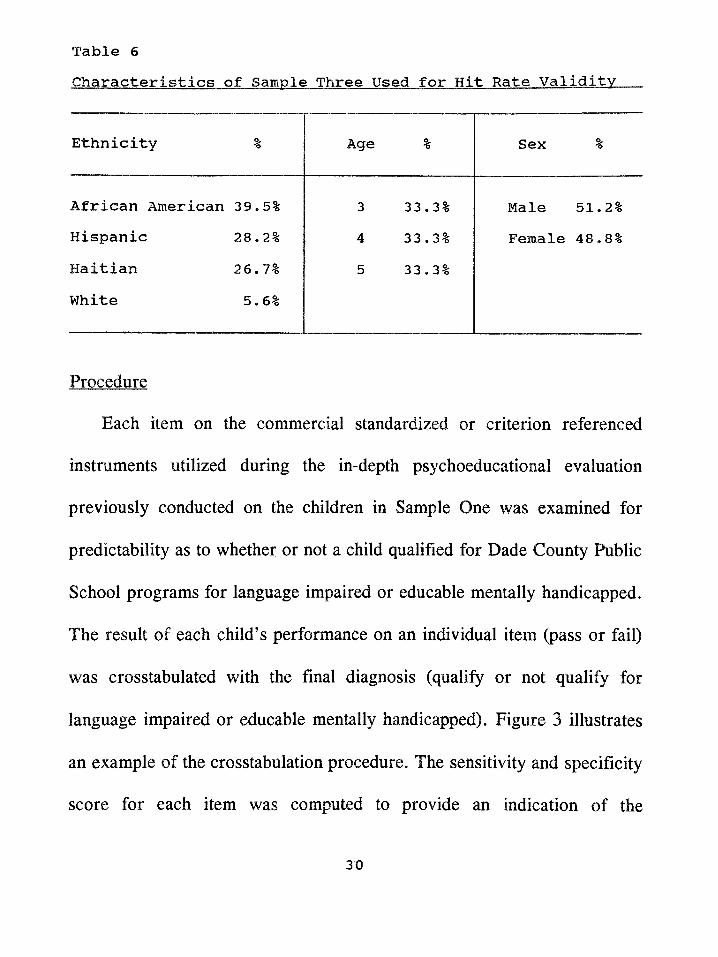
Table 6Characteristics of Sample Three Used for Hit Rate Validity
Ethnicity % Age % Sex %
African American 39.5% 3 33 . 3% Male 51.2%Hispanic 28.2% 4 33 . 3% Female 48.8%Haitian 26.7% 5 33.3%White 5.6%
Procedure
Each item on the commercial standardized or criterion referenced
instruments utilized during the in-depth psychoeducational evaluation
previously conducted on the children in Sample One was examined for
predictability as to whether or not a child qualified for Dade County Public
School programs for language impaired or educable mentally handicapped.
The result of each child’s performance on an individual item (pass or fail)
was crosstabulated with the final diagnosis (qualify or not qualify for
language impaired or educable mentally handicapped). Figure 3 illustrates
an example of the crosstabulation procedure. The sensitivity and specificity
score for each item was computed to provide an indication of the
30
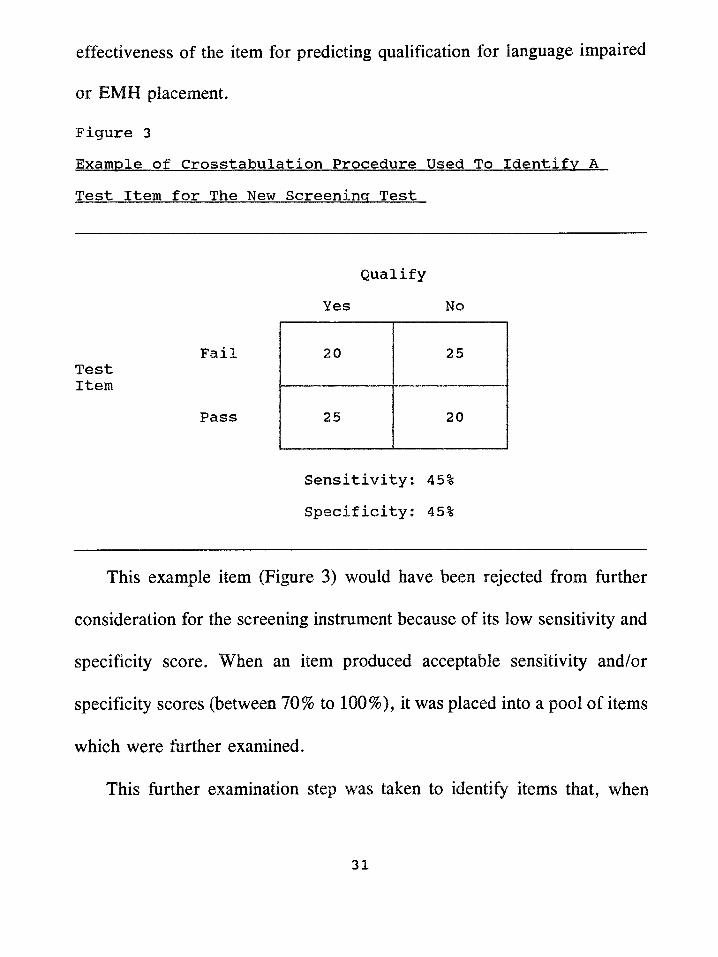
effectiveness of the item for predicting qualification for language impaired
or EMH placement.
Figure 3Example of Crosstabulation Procedure Used To Identify A Test Item for The New Screening Test
FailTestItem
Pass
Qualify Yes No
20 25
25 20
Sensitivity: 45% Specificity: 45%
This example item (Figure 3) would have been rejected from further
consideration for the screening instrument because of its low sensitivity and
specificity score. When an item produced acceptable sensitivity and/or
specificity scores (between 70% to 100%), it was placed into a pool of items
which were further examined.
This further examination step was taken to identify items that, when
31
combined into a screening test would meet the following criteria:
1)Ease of Administration - Items that trained personnel could readily
administer.
2)Ease of scoring - Items that trained personnel would find easy to score
and interpret as a pass or fail.
3)Items that require only readily available materials.
4)Items that together could be administered by trained personnel in a
very limited amount of time appropriate for mass screenings of
children (five to ten minutes per child).
All the items from the following instruments (see Appendix D for a
description of each test), which were previously utilized during the in-depth
psychoeducational evaluations, were examined In the crosstabulation
procedure:
1)Expressive One Word Picture Vocabulary Test (EOWPVT)
2)Learning Accomplishment Profile - Diagnostic (LAP-D)
3)Leiter International Performance Scale - Arthur Adaptation (LIPS)
4)Menill-Palmer Test Of Mental Scales
5)Peabody Picture Vocabulary Test - Revised (PPVT-R)
6)Zimmerman Preschool Language Scale (PLS)
32
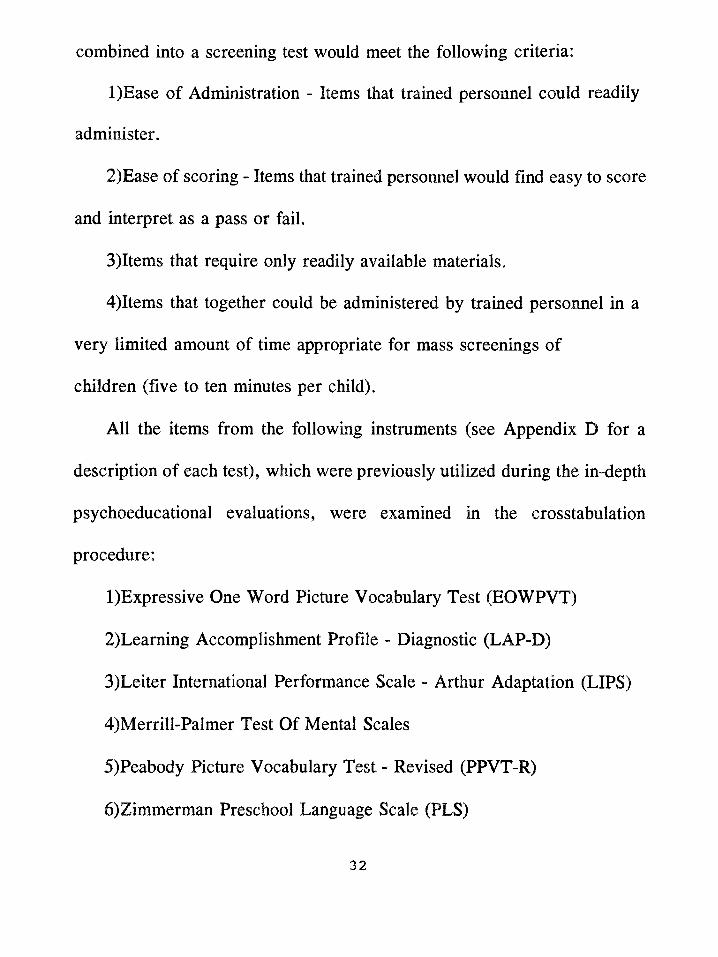
The items that best predicted the final diagnosis of language impaired
or EMH, either alone or in combination, were four items from the Learning
Accomplishment Profile - Diagnostic (LAP-D) subtest of
Language/Cognitive Naming (LN). Figure 4 lists the crosstabulation tables
for each of these four items with their sensitivity and specificity scores (also
see Appendix E for crosstabulation tables for each item in each of the age
ranges 3, 4, and 5 years of age). None of the other instruments that were
examined yielded items that were significant predictors of qualification for
a Dade County Public School program for language impairment or educable
mentally handicapped.
The four items from the Learning Accomplishment Profile - Diagnostic
that were selected to compile the new screening instrument were the
following:
l)Item LN6 - "Names use of three common objects11 (spoon, cup,
pencil, book, scissors). The child must be able to correctly state the use of
at least three of the five items in order to pass. For example, when shown
the spoon and asked, "What do we do with this?" the child responds, "eat".
Any reasonable response can be accepted by the examiner (e.g. for book a
child may say "look at pictures" or "read" or "turn pages"). This item is
33
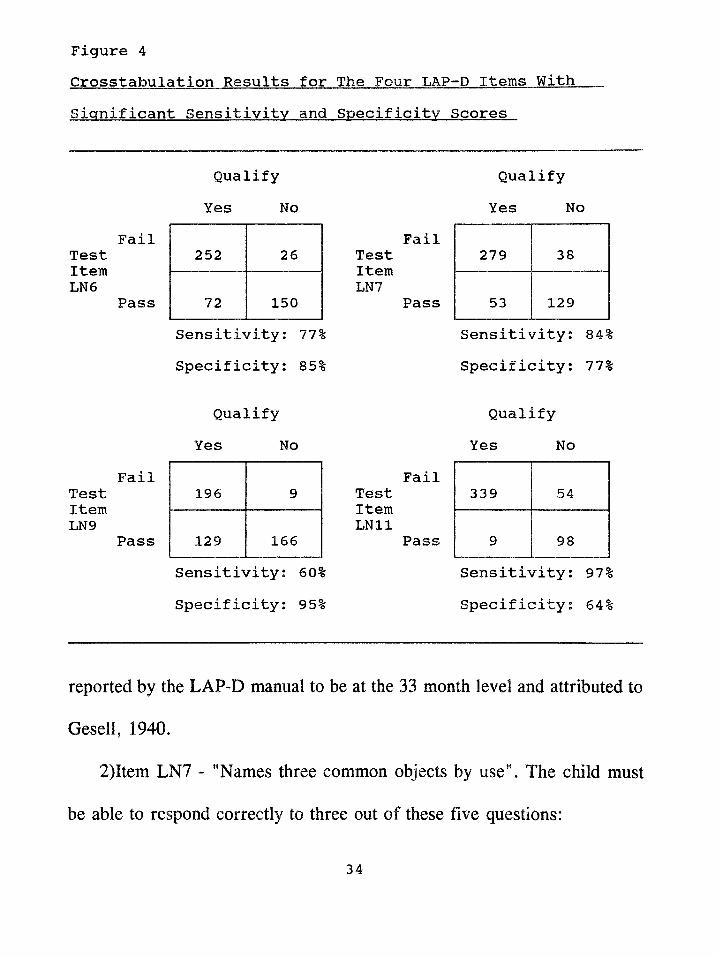
Figure 4Crosstabulation Results for The Four LAP-D Items With Significant Sensitivity and Specificity Scores
TestItemLN6
TestItemLN9
Qualify Yes No
Fail252 26
Pass 72 150
Sensitivity: 771
Specificity: 851
Qualify Yes No
Fail196 9
Pass 129 166Sensitivity: 60% Specificity: 95%
TestItemLN7
Fail
Pass
TestItem
Fail
Pass
Qualify Yes No
279 38
53 129Sensitivity: 84% Specificity: 77%
Qualify Yes No
339 54
9 98Sensitivity: 97% Specificity: 64%
reported by the LAP-D manual to be at the 33 month level and attributed to
Gesell, 1940.
2)Item LN7 - "Names three common objects by use". The child must
be able to respond correctly to three out of these five questions:
34
A - What do we sit on?
B - What do we ride in?
C - What do we sleep in?
D - What do we cook on?
E - What do we wear on our head?
Any reasonable response to these questions can be accepted, e.g. for
question "A" a correct answer would be "chair", "sofa", "seat", etc.
This item is reported in the LAP-D manual to be at the 36 month level
and attributed to Griffin, 1975.
3)Item LN9 - "Names ten pictures of common objects" (dog, ball, car,
house, snake, wagon, fish, bed, shoe, light, flowers, fire, tree, banana,
airplane, candy, turtle, rabbit). There is a total of eighteen pictures. This
item is reported in the LAP-D manual to be at the 42 month level and
attributed to Cattell, 1950.
4)Item LN11- "Names eight actions in pictures" (swimming, running,
writing, eating, riding, jumping, sleeping, throwing, climbing, and reading).
There is a total of ten pictures and the child must be able to name the action
in at least eight pictures. This item is reported in the LAP-D manual to be
at the 48 month level and attributed to Gesell, 1940.
35
Decision Rules
Decision rules for the new screening instrument, (i.e. to determine
whether a child passed the screening and did not need to be referred for
further testing or failed the screening and should be referred for an in-depth
psychoeducational evaluation) were arrived at by using the crosstabulation
data that produced the items for the test. The data for the four items from
the LAP-D (LN6, LN7, LN9, and LN11) and their level of predictability
were crosstabulated with age in half year intervals (i.e. 3-0 to 3-5, 3-6 to 3-
11, 4-0 to 4-6, 4-6 to 4-11, 5-0 to 5-6, 5-6 to 5-11) (see Appendix F for
tables). This step consisted of combining the significant items and then
crosstabulating with age and final diagnosis of language impaired or EMH.
This procedure is illustrated in Table 7.
Table 7 illustrates the crosstabulation of the sampled children who passed
items LN6, 7, and 9 but failed item LN11 and either qualified (yes) or did
not qualify (no) for language impaired or EMH programs. Item LN11 seems
to be very effective with children in the age categories 5-0 to 5-5 (5) and 5-
6 to 5-11 (6). However, in the other age categories (1 thru 4) it does not
have any predictability power. Therefore from this crosstabulation example
item LN11 would not be used alone in the decision rale for children in the
36
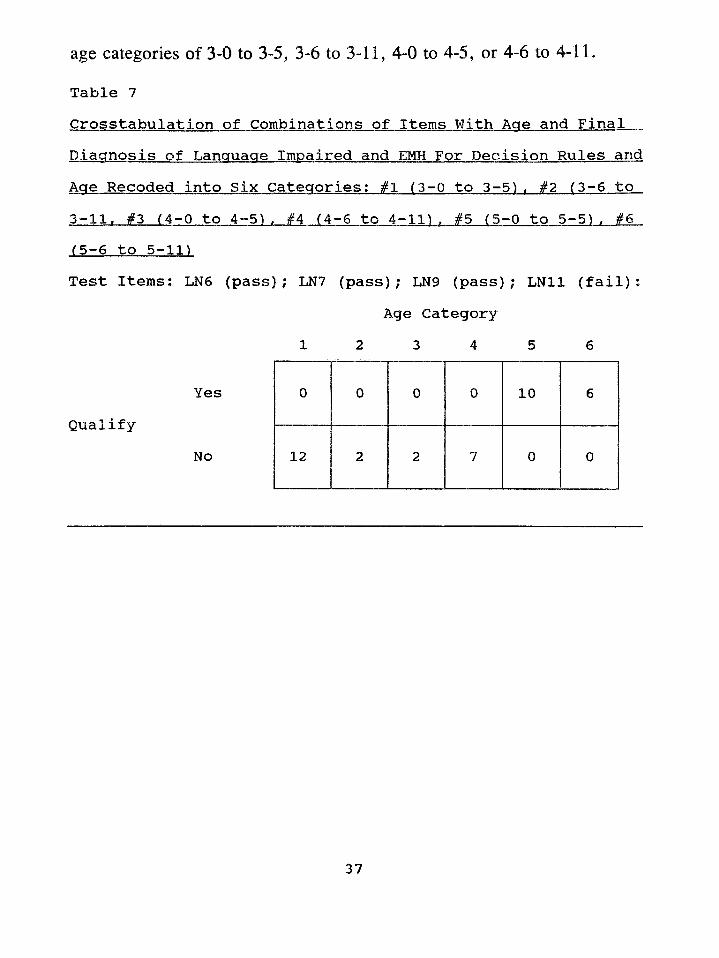
age categories of 3-0 to 3-5, 3-6 to 3-11, 4-0 to 4-5, or 4-6 to 4-11.
Table 7Crosstabulation of Combinations of Items With Aae and Final Diagnosis of Language Impaired and EMH For Decision Rules and Aae Recoded into Six Categories; #1 (3-0 to 3-5). #2 (3-6 to 3-11» #3 (4-0 to 4-5). #4 (4-6 to 4-11). #5 (5-0 to 5 - 5 1 , #6 (5-6 to 5-11)Test Items: LN6 (pass); LN7 (pass); LN9 (pass); LN11 (fail):
YesQualify
No
Age Category 1 2 3 4 5 6
0 0 0 0 10 6
12 2 2 7 0 0
37
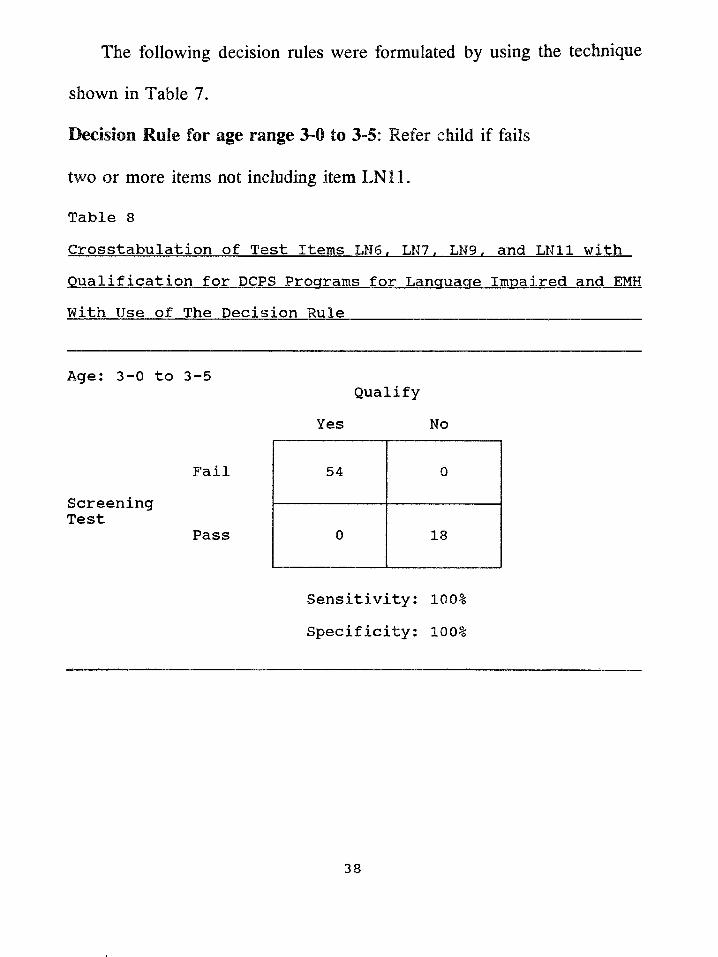
The following decision rales were formulated by using the technique
shown in Table 7.
Decision Rule for age range 3-0 to 3-5: Refer child if fails
two or more Items not including Item LN11.
Table 8Crosstabulation of Test Items LN6, LN7. LN9, and LN11 with Qualification for DCPS Programs for Language Impaired and EMH With Use of The Decision Rule__________________
Age: 3-0 to 3-5
FailScreeningTest
Pass
Sensitivity: 100% Specificity: 100%
Qualify Yes No
54 0
0 18
38
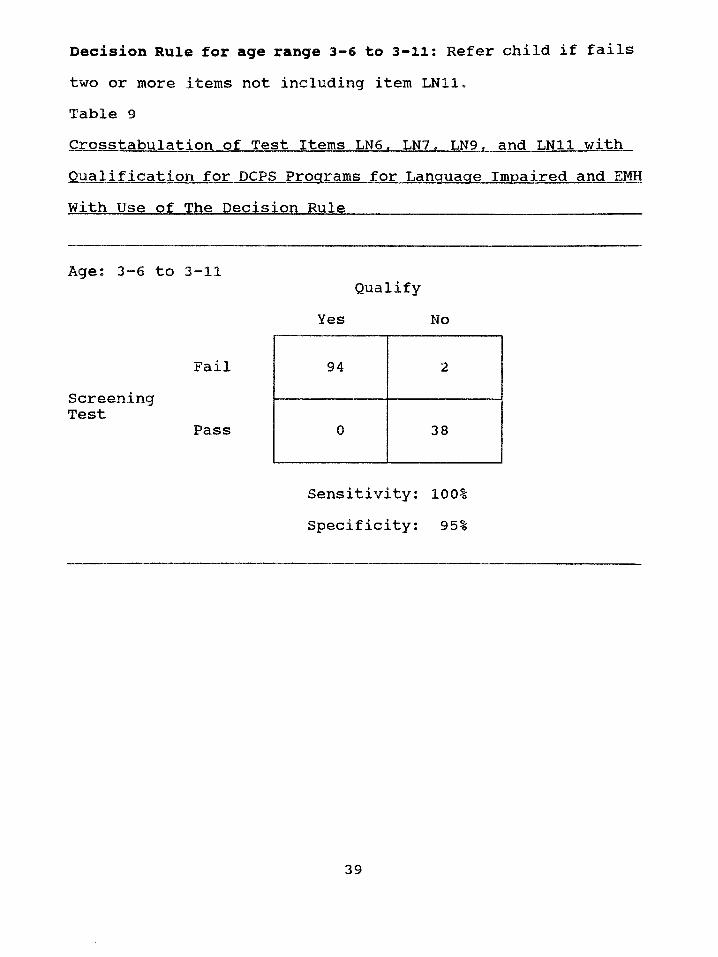
Table 9Crosstabulation of Test Items LN6. LN7, LN9. and LN11 with Qualification for DCPS Programs for Language Impaired and EMH With Use of The Decision Rule_______________________________ _
Decision Rule for age range 3-6 to 3-11: Refer child if failstwo or more items not including item LN11.
Age: 3-6 to 3-11
FailScreeningTest
Pass
Sensitivity: 100% Specificity: 95%
Qualify Yes No
94 2
0 38
39
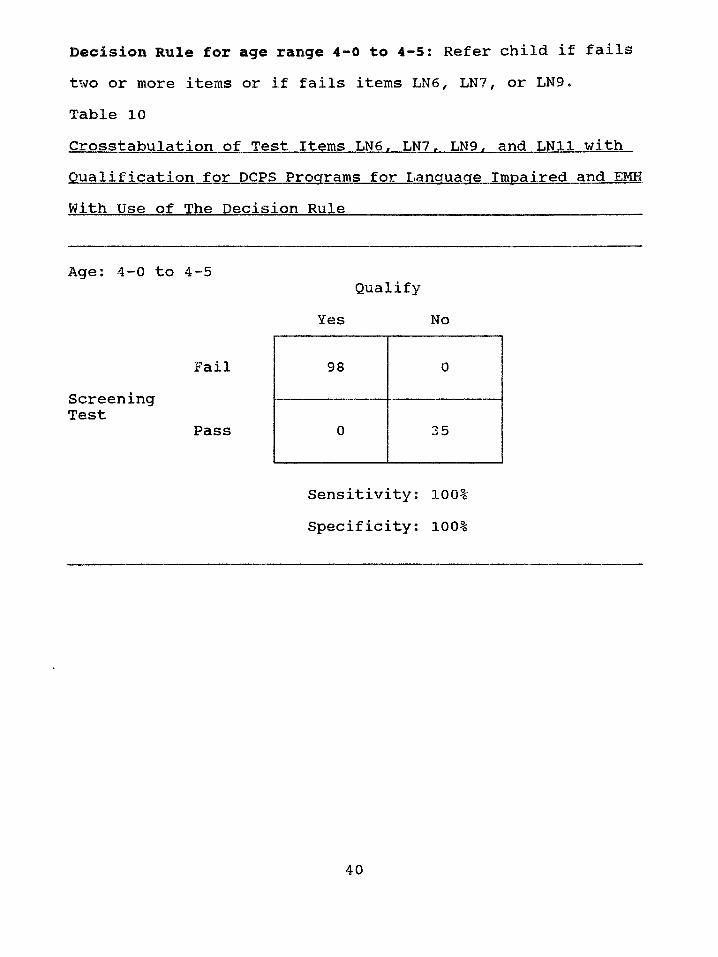
Table 10Crosstabulation of Test Items LN6, LN7. LN9. and LN11 with Qualification for DCPS Programs for Language Impaired and EMH With Use of The Decision Rule ______________ _________
Decision Rule for age range 4-0 to 4-5: Refer child if failstwo or more items or if fails items LN6, LN7, or LN9.
Age: 4-0 to 4-5
FailScreeningTest
Pass
Sensitivity: 100% Specificity: 100%
Qualify Yes No
98 0
0 35
40
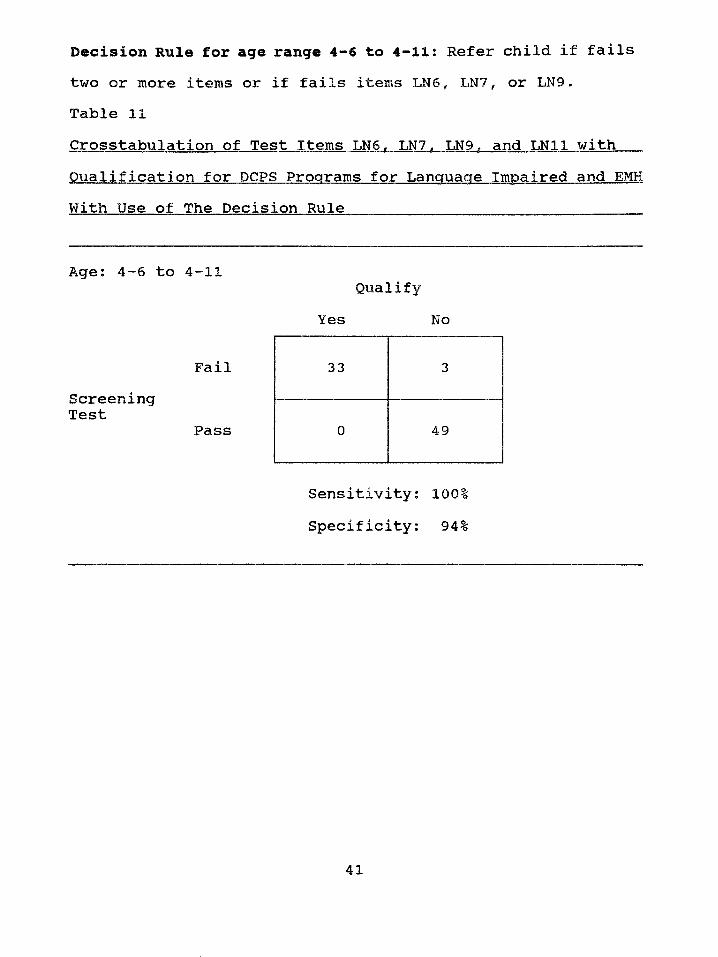
Table 11Crosstabulation of Test Items LN6. LN7. LN9. and LN11 with Qualification for DCPS Programs for Language Impaired and EMH With Use of The Decision Rule
Decision Rule for age range 4-6 to 4 - 11 : Refer child if failstwo or more items or if fails items LN6, LN7, or LN9.
Age: 4-6 to 4-11
FailScreeningTest
Pass
Sensitivity: 100% Specificity: 94%
Qualify Yes No
33 3
0 49
41
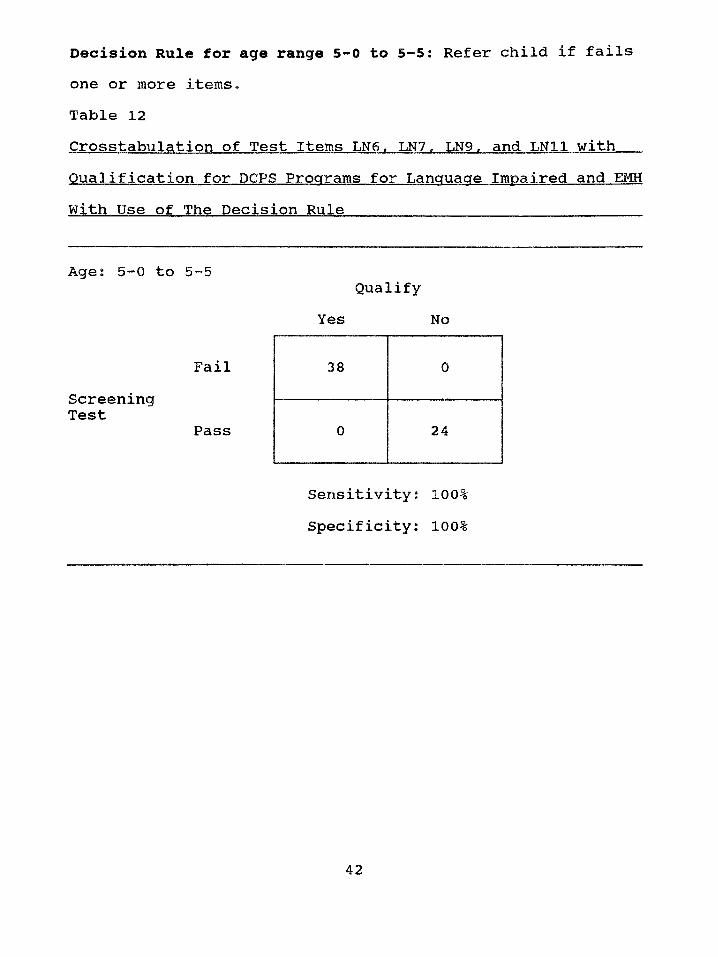
Table 12Crosstabulation of Test Items LN6. LN7. LN9. and LN11 with Qualification for DCPS Programs for Language Impaired and EMH With Use of The Decision Rule____________________________ ____
Decision Rule for age range 5-0 to 5-5: Refer child if failsone or more items.
Age: 5-0 to 5-5
FailScreeningTest
Pass
Sensitivity: 100% Specificity: 100%
Qualify Yes No
38 0
0 24
42
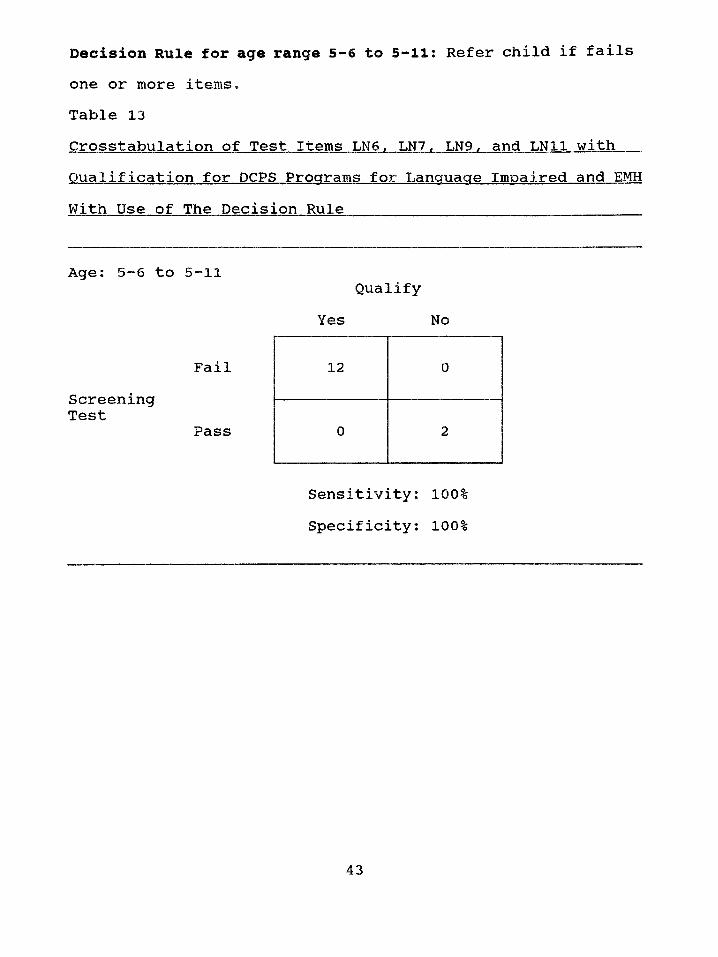
Table 13Crosstabulation of Test Items LN6. LN7. LN9. and LN11 with Qualification for DCPS Programs for Language Impaired and EMH With Use of The Decision Rule________________________________ _
Decision Rule for age range 5-6 to 5 - 11 : Refer child if failsone or more items*
Age: 5-6 to 5-11
FailScreeningTest
Pass
Sensitivity; 100% Specificity: 100%
Qualify Yes No
12 0
0 2
43
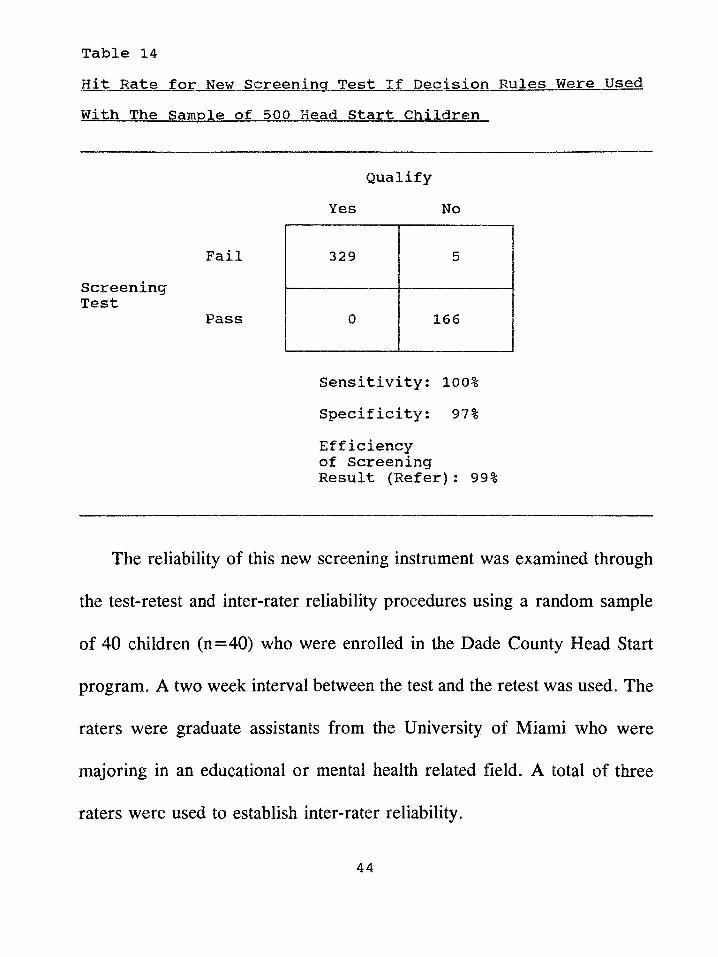
Hit: Rate for New Screening Test If Decision Rules Were Used With The Sample of 500 Head Start Children
Table 14
ScreeningTest
Fail
Pass
Qualify Yes No
329 5
0 166
Sensitivity: 100%Specificity: 97%Efficiency of Screening Result (Refer): 99%
The reliability of this new screening instrument was examined through
the test-retest and inter-rater reliability procedures using a random sample
of 40 children (n=40) who were enrolled in the Dade County Head Start
program. A two week interval between the test and the retest was used. The
raters were graduate assistants from the University of Miami who were
majoring in an educational or mental health related field. A total of three
raters were used to establish inter-rater reliability.
44
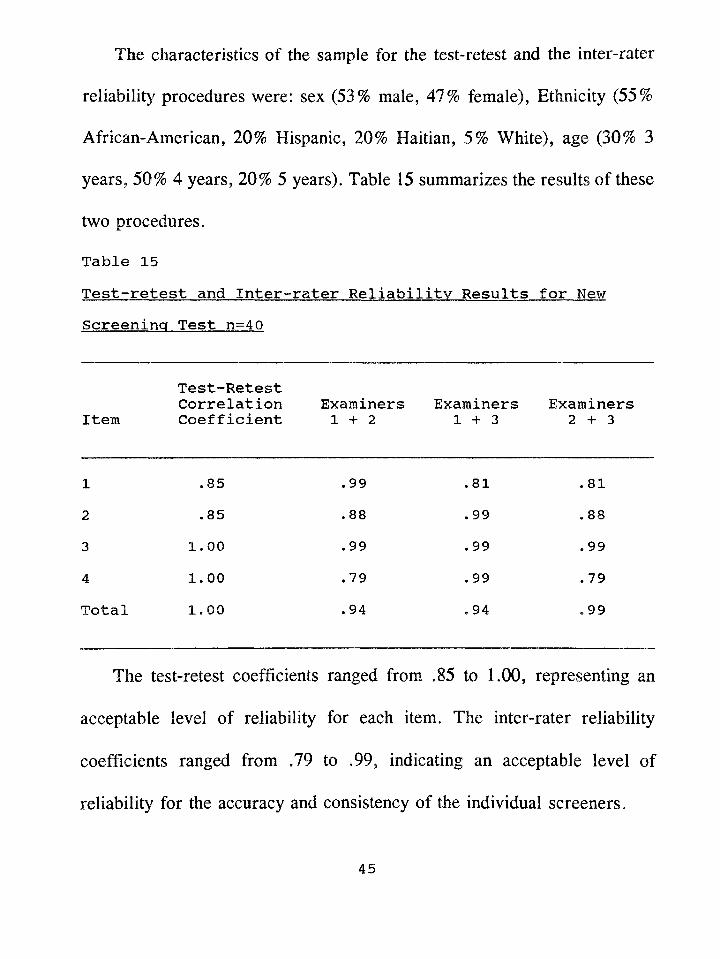
The characteristics of the sample for the test-retest and the inter-rater
reliability procedures were: sex (53% male, 47% female), Ethnicity (55%
African-American, 20% Hispanic, 20% Haitian, 5% White), age (30% 3
years, 50% 4 years, 20% 5 years). Table 15 summarizes the results of these
two procedures.
Table 15Test-retest and Inter-rater Reliability Results for New Screening Test n=4Q
ItemTest-RetestCorrelationCoefficient
Examiners 1 + 2
Examiners 1 + 3
Examiners 2 + 3
1 . 85 .99 .81 .812 .85 .88 .99 .883 1.00 .99 .99 .994 1.00 .79 .99 .79Total 1.00 .94 .94 .99
The test-retest coefficients ranged from .85 to 1.00, representing an
acceptable level of reliability for each item. The inter-rater reliability
coefficients ranged from .79 to .99, indicating an acceptable level of
reliability for the accuracy and consistency of the individual screeners.
45
The validity of the new screening instrument was accomplished by using
a double sample technique incorporating the two previously described
samples of 600 randomly selected children enrolled in the Dade County
Head Start Program. Each of the children in the two samples were put
through the same evaluation procedure to obtain the classification or hit rate
information for the new screening test. Figure 5 illustrates this procedure.
46
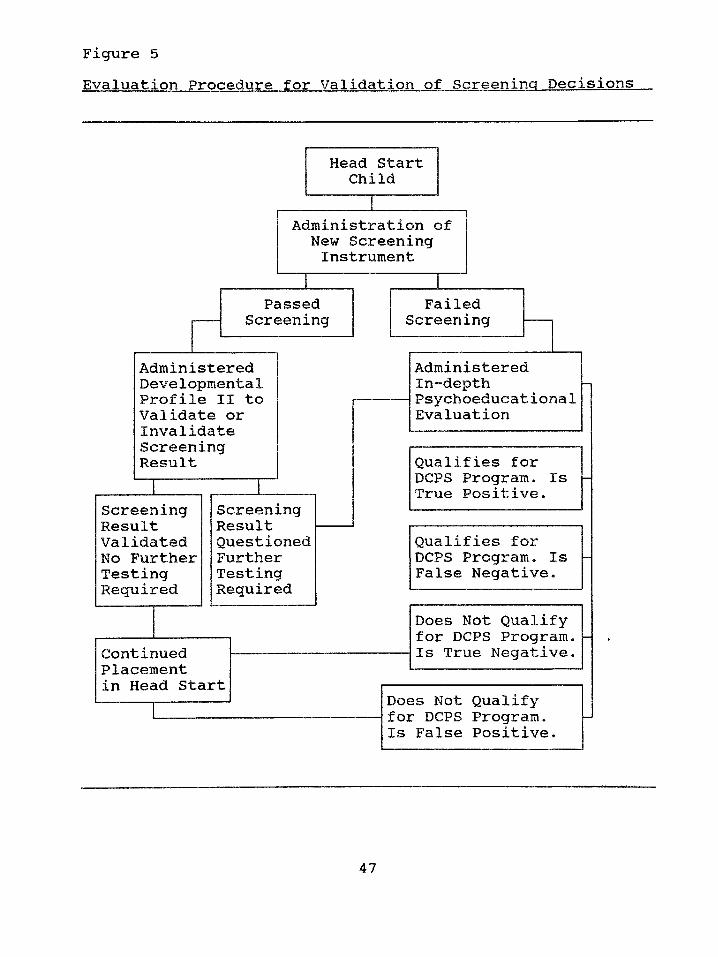
Figure 5Evaluation Procedure for Validation of Screening Decisions
47
The administration of the new screening instrument yielded a decision
of pass (no farther evaluation recommended) or fail (farther evaluation is
recommended). The children in the sample who earned a decision of pass
were then administered a widely used popular standardized developmental
inventory, the Developmental Profile II (DP II)( see Appendix G for
description) to confirm or deny the result of the new screening instrument.
The manual states that "the Developmental Profile II offers five
developmental age scores ... and is equally valid for use with ... Black and
White children from all social classes." (Alpern, Boll, & Shearer, 1980,
p .37). The manual also states that the DP II can be used to "determine
eligibility for receiving special education and/or related services..." (p. 1).
The DP II may be administered in the following ways: a) an Interview with
parents, b) an interview and direct testing of the child, or c) self-interview
completed by the teacher. If the results of the DP II indicated that farther
testing was needed, an in-depth evaluation was then conducted. If the result
of the DP II indicated no need for farther testing, the child’s passing score
on the new screening instrument was considered to be validated.
Although the DP II standardization group is disimilar to the population
found in the Dade County Head Start program, the fact that the instrument
48
was administered by a combination of teacher interview and direct testing
of the child alleviated this limitation. If any child displayed difficulties in
any of the developmental areas measured by the DP II then the child was
administered a comprehensive evaluation.
The children whose score indicated failure on the new screening test
were administered in-depth psychoeducational evaluations which included a
minimum of one test for intelligence, a test for developmental skill levels,
and tests for language skills. Tests selected from the following pool were
used to accomplish the evaluation (see Appendix G for descriptions of tests):
1) Tests of Intelligence
A) Differential Abilities Scale (DAS)
B) Leiter International Performance Scale (LIPS) (Arthur Adaptation)
C) Merrill-Palmer Scales of Mental Tests
D) Stanford-Binet IV
E) Wechsler Preschool and Primary Scale of Intelligence (WPPSI)
F) Wechsler Preschool and Primary Scale of Intelligence - Revised
(WPPSI-R)
2) Tests of Developmental Skills
A) Developmental Profile II (DPII)
B) Learning Accomplishment Profile - Diagnostic (LAP-D)
3) Tests of Language
A) Expressive One Word Picture Vocabulary Test (EOWPVT)
B) Peabody Picture Vocabulary Test - Revised (PPVT-R)
C) Preschool Language Scale (PLS)
4) Test of Adaptive Behavior
A) Scales of Independent Behavior (SIB)
Following the evaluation the Dade County Public School criteria for
placement were applied to the results. The child was either found eligible
or ineligible for acceptance into a DCPS program for the language impaired
or for the educable mentally handicapped. In this manner the new screening
test’s decision was validated or not validated.
The screenings and the administration of the Developmental Profile II
were conducted by trained personnel provided by the University of Miami
Mailman Center for Child Development. These screeners were graduate
students who were pursuing degrees in an educational or a mental health
related field.
The in-depth psychoeducational evaluations were conducted utilizing a
team approach. School Psychology interns from Florida International
50
University, who also assisted during the screenings, provided the testing of
intelligence and developmental skill levels. The interns also administered the
adaptive behavior inventory to the parent or guardian of the child.
Speech/Language Pathologists from the Hearing and Speech Center of
Florida provided the testing in the area of language.
Bilingual personnel were utilized for the screenings with the children
whose ethnic background was either Hispanic or Haitian. Bilingual
examiners were used when an in-depth psychoeducational evaluation was
performed for the Hispanic children. A Creole translator assisted the
examiners of Haitian children.
Materials
The four items from the LAP-D were assembled into a booklet to be
used at screenings. Item LN6 includes the following common objects which
are provided with the LAP-D: spoon, cup, pencil, book, and scissors. The
pictures provided with the LAP-D for items LN9 and LN11 were included
in the booklet. Item LN7, which is comprised of questions, does not require
a stimulus for the child. Therefore, for LN7 the questions list from the
LAP-D was placed in the booklet. When booklets were not available, the
complete LAP-D kit was used and only the four items which constituted the
51
screening instrument were administered. When Hispanic and Haitian
children were tested bilingual personnel used Spanish and Creole versions
of the new screening instrument.
52
CHAPTER III
Results
Hit Rate Validity Data
The screenings and evaluations of the randomly selected children for
each sample were accomplished from September thru May during the school
years of 1990 - 1991 and 1991 - 1992. Sample One data was collected from
September 1990 thru May 1991. Sample Two data was collected from
September 1991 thru May 1992. Each child was evaluated within a month
of receiving the screening.
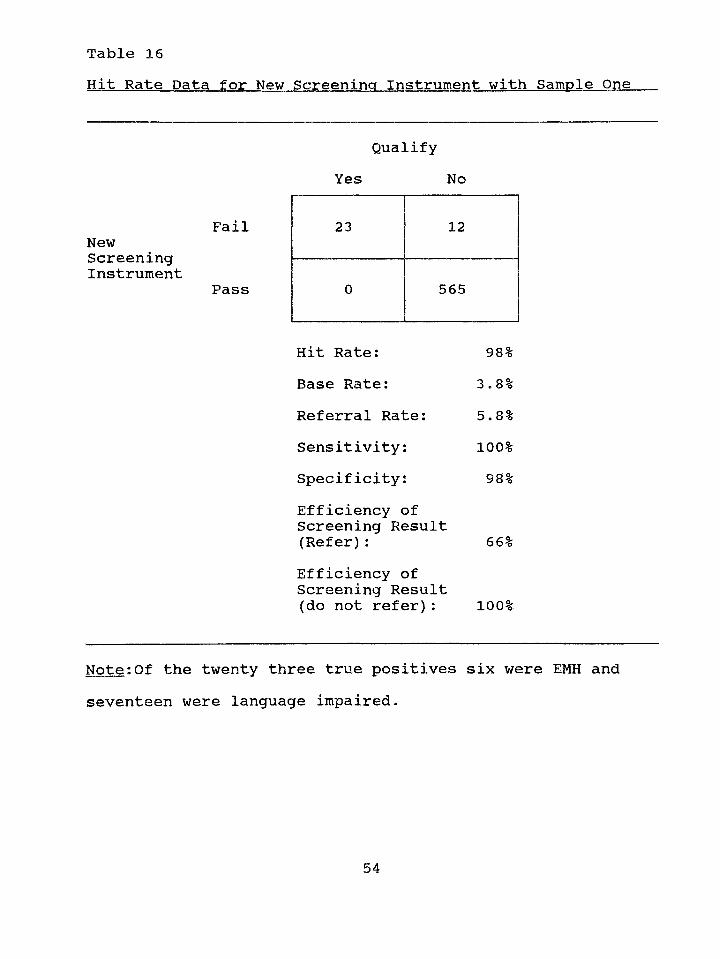
The hit rate results for the new screening instrument with each sample
can be seen in Tables 16 and 20. Sensitivity, specificity, and efficiency of
screening result (refer) scores are listed along with other hit rate scores.
Tables 17 thru 19 and 21 thru 23 provide a description of the characteristics
of the children who were categorized as true positives and false positives.
For Sample One the sensitivity and specificity scores were 100% and
98% respectively. The sensitivity score means that none of the children who
passed the screening test were eventually identified as language impaired or
educable mentally handicapped. The specificity score means that only a
small percentage of the children screened (2%) who did not qualify for
53
Hit Rate Data for New Screening Instrument with Sample OneTable 16
Qualify Yes No
FailNewScreeningInstrument
Pass
Hit Rate: 98%Base Rate: 3.8%Referral Rate: 5.8%Sensitivity: 100%Specificity: 98%Efficiency of Screening Result (Refer): 66%Efficiency ofScreening Result(do not refer): 100%
Note:Of the twenty three true positives six were EMH and seventeen were language impaired.
23 12
0 565
54
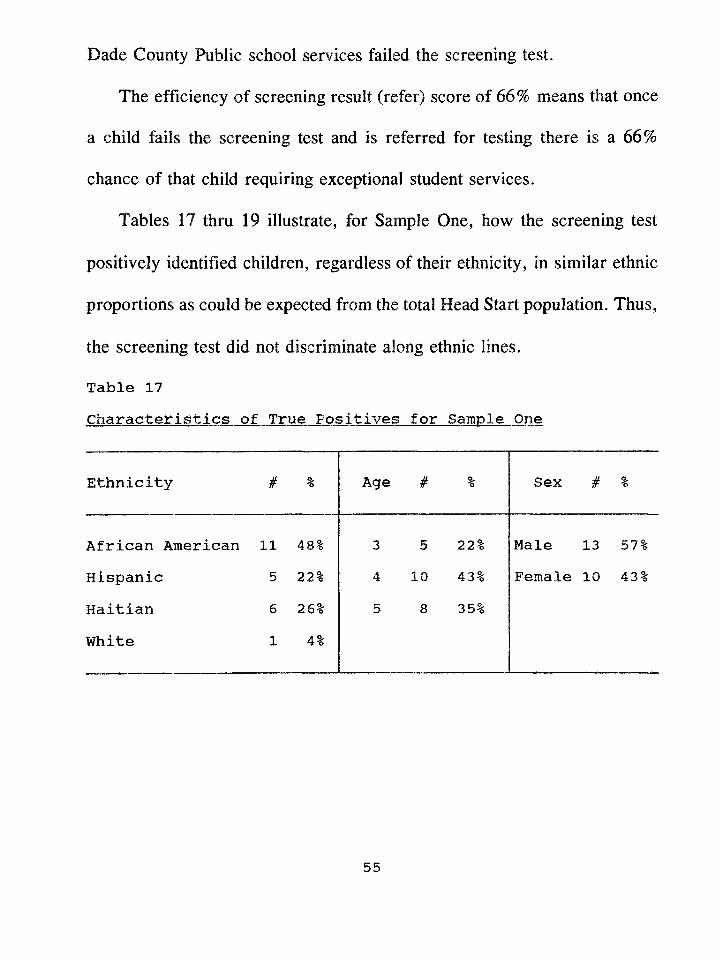
Dade County Public school services failed the screening test.
The efficiency of screening result (refer) score of 66% means that once
a child fails the screening test and is referred for testing there is a 66%
chance of that child requiring exceptional student services.
Tables 17 thru 19 illustrate, for Sample One, how the screening test
positively identified children, regardless of their ethnicity, in similar ethnic
proportions as could be expected from the total Head Start population. Thus,
the screening test did not discriminate along ethnic lines.
Table 17Characteristics of True Positives for Sample One
Ethnicity # % Age # % Sex # %
African American 11 48% 3 5 22% Male 13 57%Hispanic 5 22% 4 10 43% Female 10 43%
Haitian 6 26% 5 8 35%
White 1 4%
55
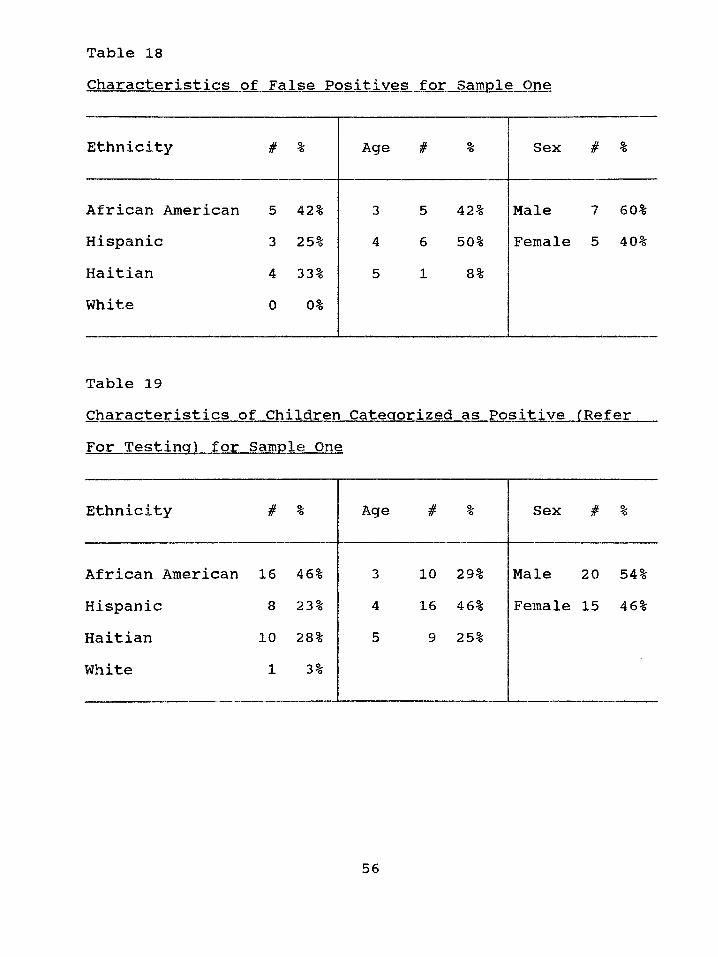
Table 18Characteristics of False Positives for Sample One
Ethnicity Jtfr % Age # % Sex # %
African American 5 42% 3 5 42% Male 7 60%Hispanic 3 25% 4 6 50% Female 5 40%Haitian 4 33% 5 1 8 %White 0 0%
Table 19Characteristics of Children Categorized as Positive (Refer For Testing) for Sample One
Ethnicity # % Age # % Sex # 5*
African American 16 46% 3 10 29% Male 20 54%Hispanic 8 23% 4 16 46% Female 15 46%Haitian 10 28% 5 9 25%White 1 3%
56
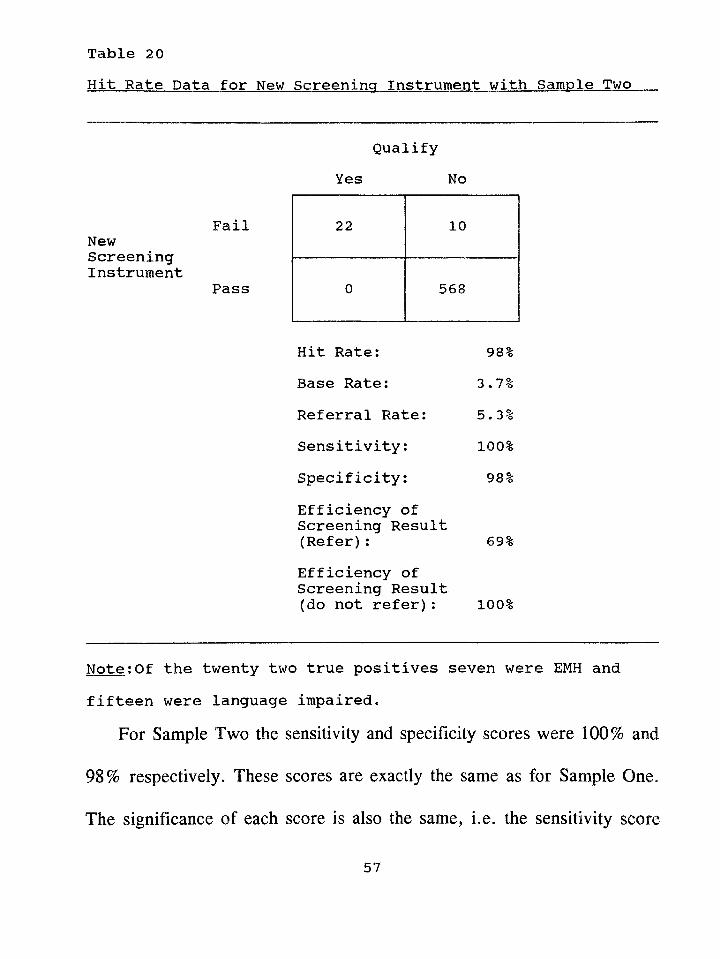
Hit Rate Data for New Screening Instrument with Sample TwoTable 20
FailNewScreeningInstrument
Pass
Qualify Yes No
22 10
0 568
Hit Rate: 98%Base Rate: 3*7%Referral Rate: 5*3%Sensitivity: 100%Specificity: 98%Efficiency of Screening Result (Refer): 69%Efficiency ofScreening Result(do not refer): 100%
Note:Of the twenty two true positives seven were EMH and fifteen were language impaired*
For Sample Two the sensitivity and specificity scores were 100% and
98% respectively. These scores are exactly the same as for Sample One.
The significance of each score Is also the same, i.e. the sensitivity score
57
means that none of the children who passed the screening test were
eventually identified as language impaired or educable mentally handicapped
and the specificity score means that only a small percentage of the children
screened (2%) who did not qualify for Dade County Public school services
failed the screening test.
The efficiency of screening result (refer) score of 69% means that once
a child fails the screening test and is referred for testing there is a 69%
chance of that child requiring exceptional student services. This score for
Sample Two was similar to the score obtained for Sample One (66%).
Tables 21 thru 23 illustrate, for Sample Two, how the screening test
positively identified children for testing, regardless of their ethnicity, in
similar ethnic proportions as in the Head Start population. Thus, once again,
the screening test did not discriminate along ethnic lines.
58
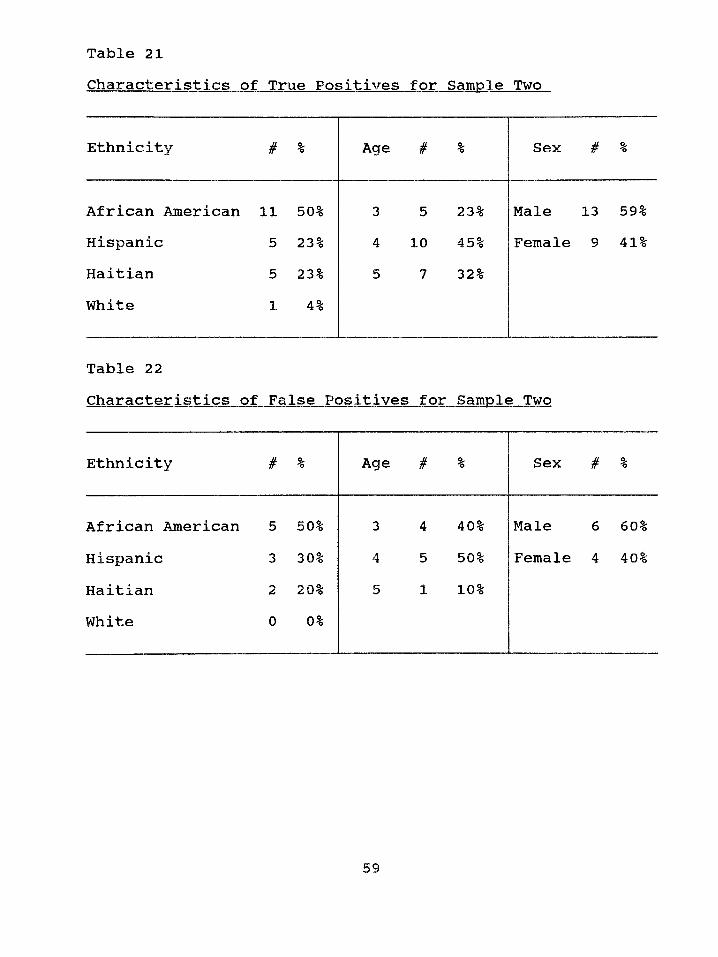
Table 21Characteristics of True Positives for Sample Two
Ethnicity # % Age # % Sex # %
African American 11 50% 3 5 23% Male 13 59%Hispanic 5 23% 4 10 45% Female 9 41%Haitian 5 23% 5 7 32%White 1 4%
Table 22Characteristics of False Positives for Sample Two
Ethnicity # % Age # % Sex # %
African American 5 50% 3 4 40% Male 6 60%Hispanic 3 30% 4 5 50% Female 4 40%Haitian 2 20% 5 1 10%White 0 0%
59
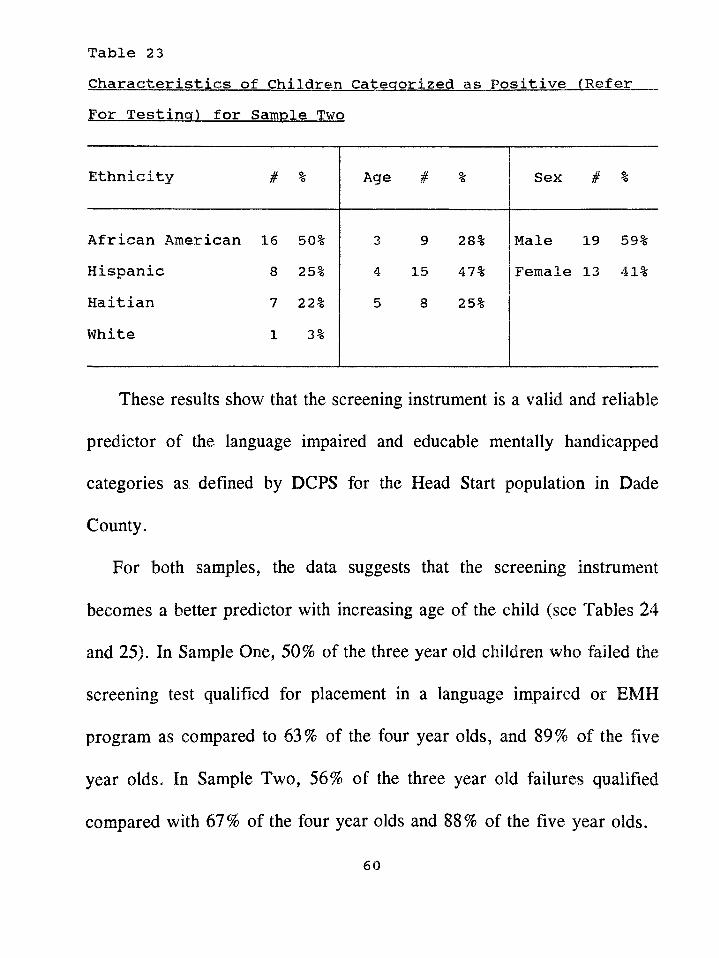
Table 23Characteristics of Children Categorized as Positive (ReferFor Testing) for Sample Two
Ethnicity # % Age # % Sex # %
African American 16 50% 3 9 28% Male 19 59%Hispanic 8 25% 4 15 47% Female 13 41%Haitian 7 22% 5 8 25%White 1 3%
These results show that the screening instrument is a valid and reliable
predictor of the language impaired and educable mentally handicapped
categories as defined by DCPS for the Head Start population in Dade
County.
For both samples, the data suggests that the screening instrument
becomes a better predictor with increasing age of the child (see Tables 24
and 25). In Sample One, 50% of the three year old children who failed the
screening test qualified for placement in a language impaired or EMH
program as compared to 63% of the four year olds, and 89% of the five
year olds. In Sample Two, 56% of the three year old failures qualified
compared with 67% of the four year olds and 88% of the five year olds.
60
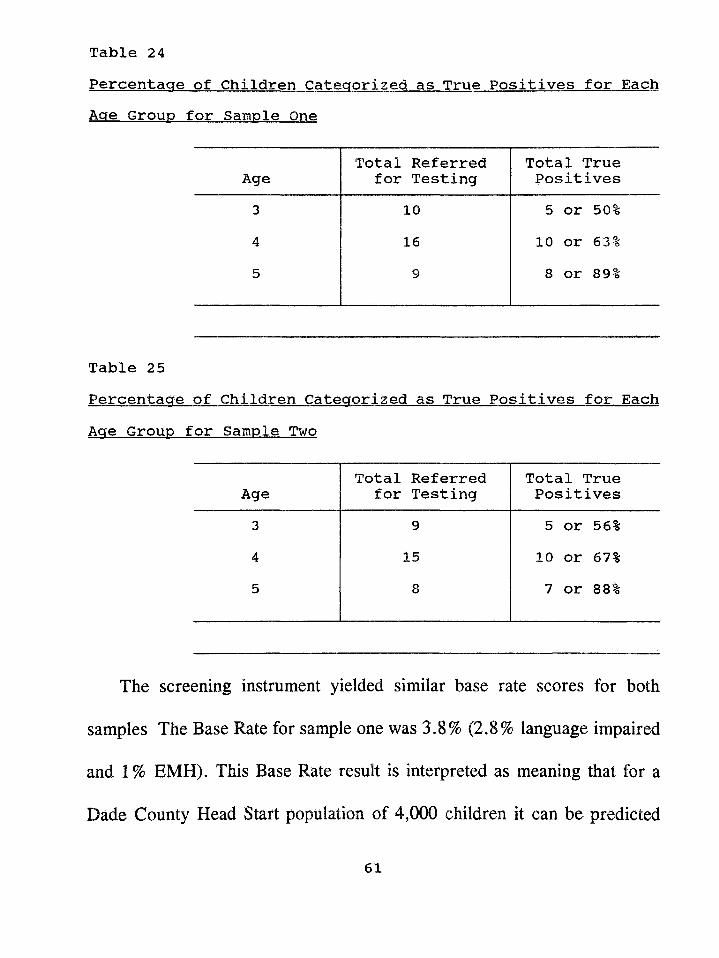
Percentage of Children Categorized as True Positives for Each Age Group for Sample One
Table 24
AgeTotal Referred
for TestingTotal True Positives
3 10 5 or 50%4 16 10 or 63%5 9 8 or 89%
Table 25Percentage of Children Categorized as True Positives for Each Age Group for Sample Two
AgeTotal Referred
for TestingTotal True Positives
3 9 5 or 56%4 15 10 or 67%5 8 7 or 88%
The screening instrument yielded similar base rate scores for both
samples The Base Rate for sample one was 3.8% (2.8% language impaired
and 1% EMH). This Base Rate result is interpreted as meaning that for a
Dade County Head Start population of 4,000 children it can be predicted
61
that 112 would be identified as language impaired (4,000 x .028) and 40
would be identified as educable mentally handicapped (4,000 x .01). The
Base Rate for Sample Two was 3.7% (2.5% language impaired and 1.2%
EMH). This Base Rate result is interpreted as meaning that for a Dade
County Head Start population of 4,000 children it can be expected that 100
would be identified as language impaired (4,000 x .025) and 48 would be
identified as educable mentally handicapped (4,000 x .012). These base rate
scores were similar to the base rate scores achieved by the previously
administered screening test reported in Appendix B (Denver = 3.5%, DIAL
= 3%, Dallas = 2.5%, and Brigance = 3.5%). These similar base rates
indicate a consistency in the amount of language impaired and educable
mentally handicapped children actually present in the Dade County Head
Start program. This means that we can be certain of the percentage of
language impaired and EMH children (as defined by DCPS) that are in the
local Head Start program. A study by Stewart, Hester, and Taylor (1986)
found a similar base rate for the prevalence of language disorders in an
urban preschool Head Start population. In their study a base rate of 2.6%
was obtained.
The null hypotheses were tested by using the chi square, a
62
nonparametric test of significance. The Fisher’s Exact Test (one tail) was
computed when the cell counts were less than twenty. This procedure was
used to show whether the new test was more accurate than the previously
utilized commercial screening tests. Tables 26 through 37 display the results
of this procedure. The sensitivity counts from each of the four commercial
screening tests were compared to the sensitivity counts of the new screening
test. The specificity counts of only two of the commercial screening tests
(Developmental Inventories for the Assessment of Learning-Revised and the
Brigance Early Screen) were compared to the specificity counts of the new
screening test because the specificity counts of the other two commercial
tests (Denver Developmental Screening Test-Revised and Dallas Preschool
Screening Test) yielded a score of 100%.
Table 26 displays the results of the chi square procedure comparing the
new test’s sensitivity count (for Sample One) with the sensitivity count of
the DDST-R. The result of the chi square and the Fisher’s Exact Test
indicates that there was a significant difference between the new test’s ability
to identify the target population when compared to the DDST-R. This result
means that the new test is significantly better at identifying the target
population children than the DDST-R.
63
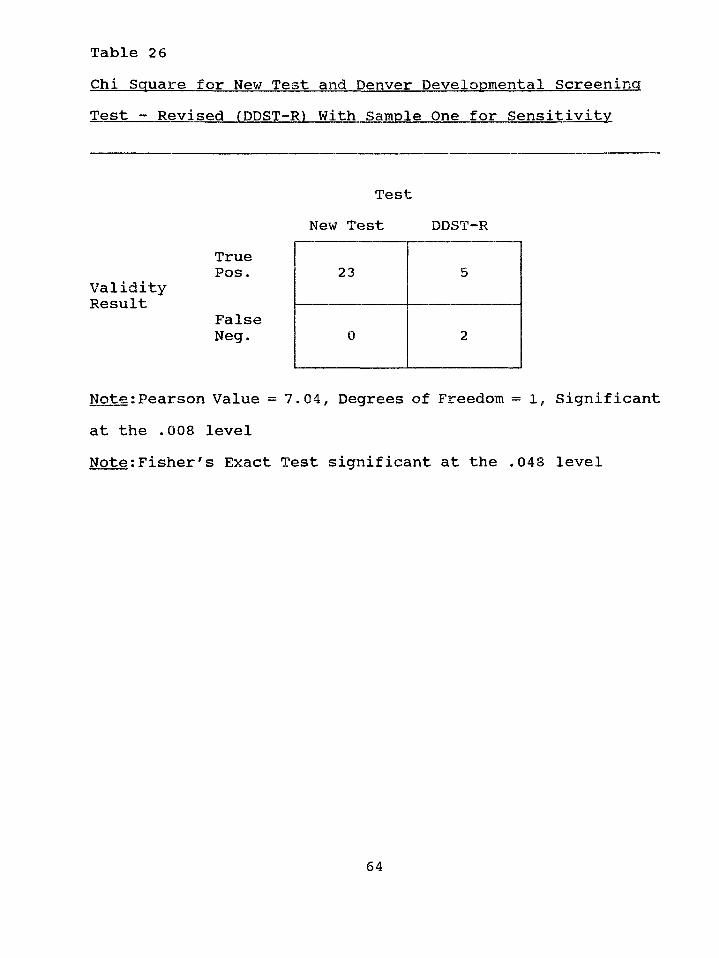
Chi Square for New Test and Denver Developmental ScreeningTable 26
Test - Revised (DDST-R) With Sample One for Sensitivity
TruePos.
ValidityResult
FalseNeg.
Note;Pearson Value = 7.04, Degrees of Freedom = 1 , Significant at the .008 levelNote:Fisher's Exact Test significant at the .048 level
TestNew Test DDST-R
23 5
0 2
64
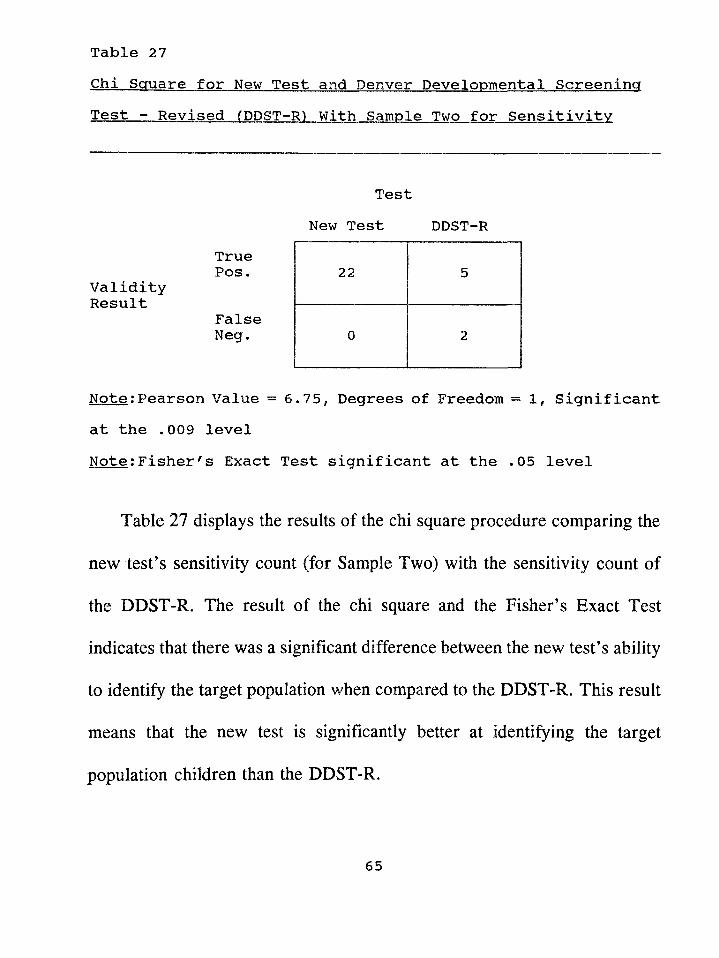
Chi Square for New Test and Denver Developmental Screening Test - Revised (DDST-R) With Sample Two for Sensitivity
Table 27
TestNew Test DDST-R
True Pos.
Validity Result
False Neg.
Note;Pearson Value = 6*75, Degrees of Freedom = 1, Significant at the .009 levelNote:Fisher's Exact Test significant at the .05 level
Table 27 displays the results of the chi square procedure comparing the
new test's sensitivity count (for Sample Two) with the sensitivity count of
the DDST-R. The result of the chi square and the Fisher’s Exact Test
indicates that there was a significant difference between the new test’s ability
to identify the target population when compared to the DDST-R. This result
means that the new test is significantly better at identifying the target
population children than the DDST-R.
65
22 5
0 2
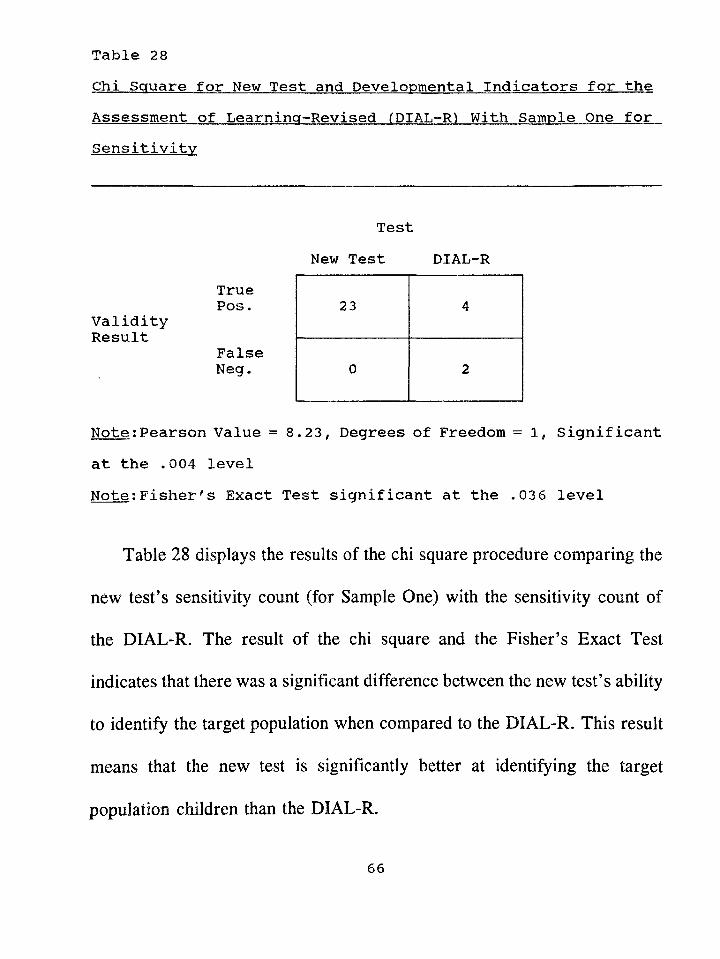
Table 28Chi Square for New Test and Developmental Indicators for theAssessment of Learning-Revised (DIAL-R) With Sample One forSensitivity
TruePos.
ValidityResult
FalseNeg.
Note:Pearson Value = 8.23, Degrees of Freedom = 1 , Significant at the .004 levelNote:Fisher's Exact Test significant at the .036 level
Table 28 displays the results of the chi square procedure comparing the
new test’s sensitivity count (for Sample One) with the sensitivity count of
the DIAL-R. The result of the chi square and the Fisher’s Exact Test
indicates that there was a significant difference between the new test’s ability
to identify the target population when compared to the DIAL-R. This result
means that the new test is significantly better at identifying the target
population children than the DIAL-R.
66
TestNew Test DIAL-R
23 4
0 2
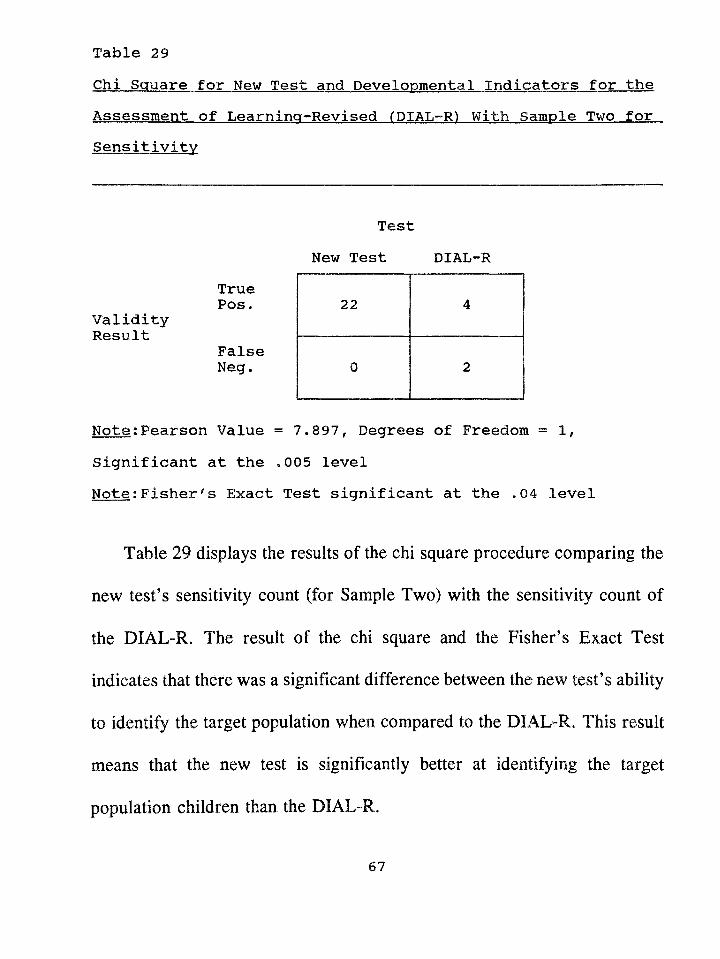
Table 23Chi Square for New Test and Developmental Indicators for theAssessment of Learning-Revised (DIAL-R) With Sample Two forSensitivity
TruePos.
ValidityResult
FalseNeg.
Note;Pearson Value = 7.897, Degrees of Freedom = 1, Significant at the .005 levelNote:Fisher's Exact Test significant at the *04 level
Table 29 displays the results of the chi square procedure comparing the
new test's sensitivity count (for Sample Two) with the sensitivity count of
the DIAL-R. The result of the chi square and the Fisher’s Exact Test
indicates that there was a significant difference between the new test’s ability
to identify the target population when compared to the DIAL-R. This result
means that the new test is significantly better at identifying the target
population children than the DIAL-R.
67
TestNew Test DIAL-R
22 4
0 2
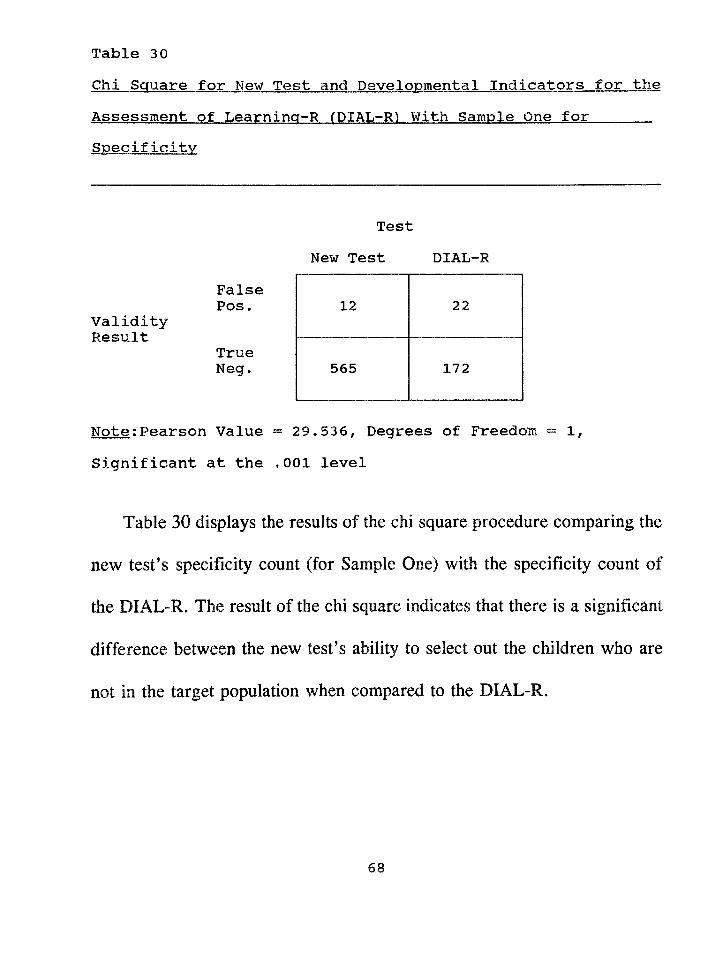
Table 30Chi Square for New Test and Developmental Indicators for theAssessment of Learninq-R (DIAL-R) With Sample One forSpecificity
FalsePos.
ValidityResult
TrueNeg.
Note;Pearson Value = 29.536, Degrees of Freedom = 1 ,
Significant at the .001 level
Table 30 displays the results of the chi square procedure comparing the
new test’s specificity count (for Sample One) with the specificity count of
the DIAL-R. The result of the chi square indicates that there is a significant
difference between the new test’s ability to select out the children who are
not in the target population when compared to the DIAL-R.
TestNew Test DIAL-R
12 22
565 172
68
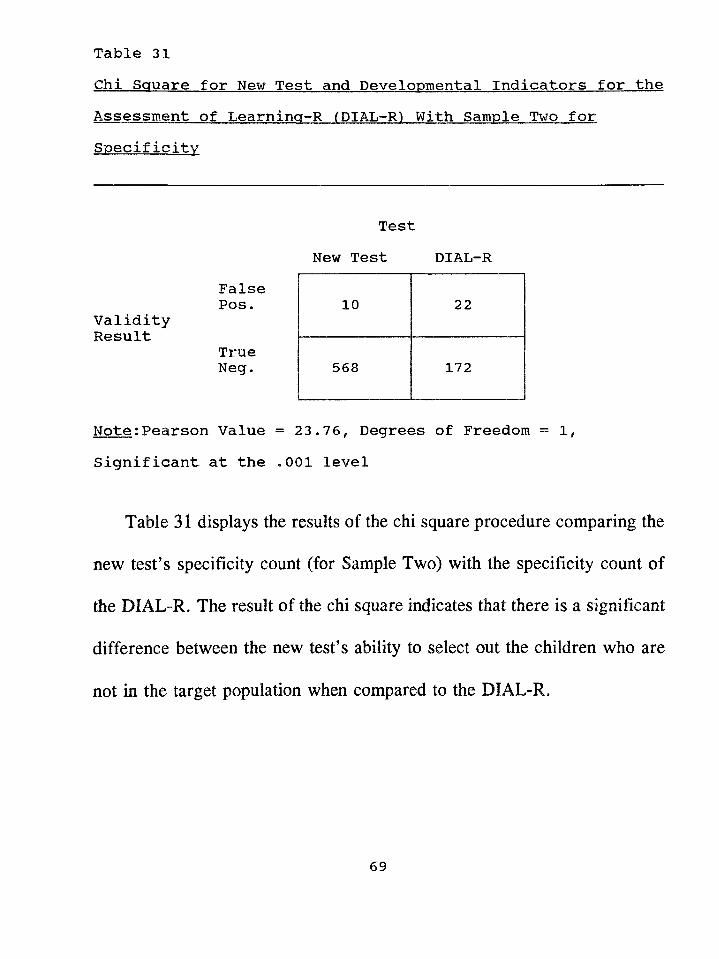
Table 31Chi Square for New Test and Developmental Indicators for theAssessment of Learninq-R (DIAL-R) With Sample Two forSpecificity
FalsePos.
ValidityResult
TrueNeg.
Note;Pearson Value = 23.76, Degrees of Freedom = 1, Significant at the .001 level
Table 31 displays the results of the chi square procedure comparing the
new test's specificity count (for Sample Two) with the specificity count of
the DIAL-R. The result of the chi square indicates that there is a significant
difference between the new test’s ability to select out the children who are
not in the target population when compared to the DIAL-R.
TestNew Test DIAL-R
10 22
568 172
69
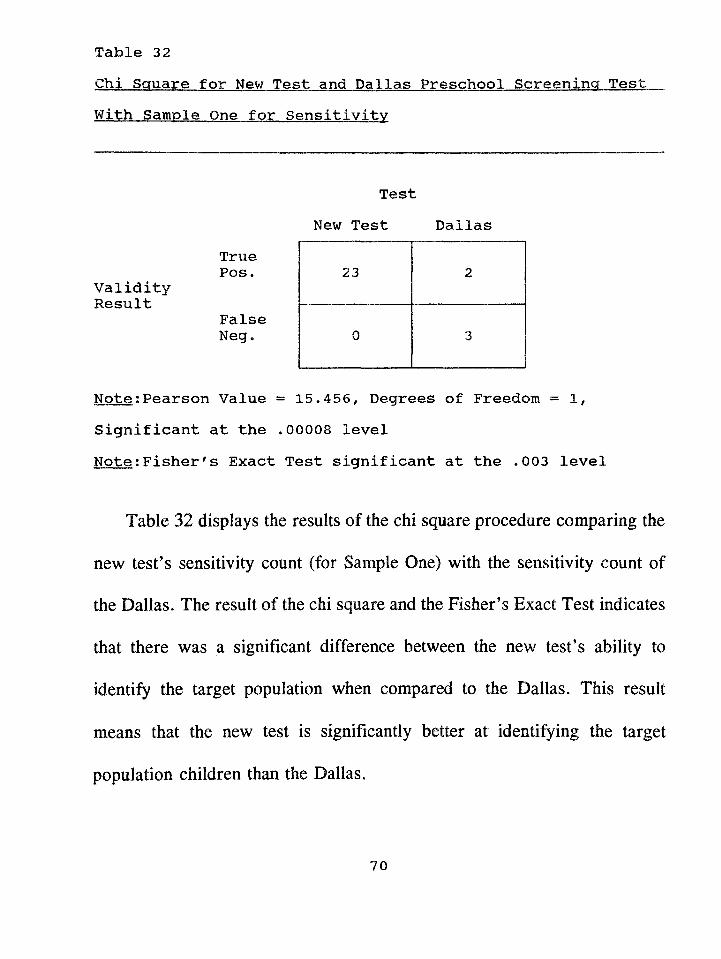
Table 32Chi Square for New Test and Dallas Preschool Screening TestWith Sample One for Sensitivity
TruePos*
ValidityResult
FalseNeg.
Note;Pearson Value = 15.456, Degrees of Freedom = 1, Significant at the .00008 levelNote;Fisher's Exact Test significant at the .003 level
Table 32 displays the results of the chi square procedure comparing the
new test’s sensitivity count (for Sample One) with the sensitivity count of
the Dallas. The result of the chi square and the Fisher’s Exact Test indicates
that there was a significant difference between the new test’s ability to
identify the target population when compared to the Dallas. This result
means that the new test is significantly better at identifying the target
population children than the Dallas.
TestNew Test Dallas
23 2
0 3
70
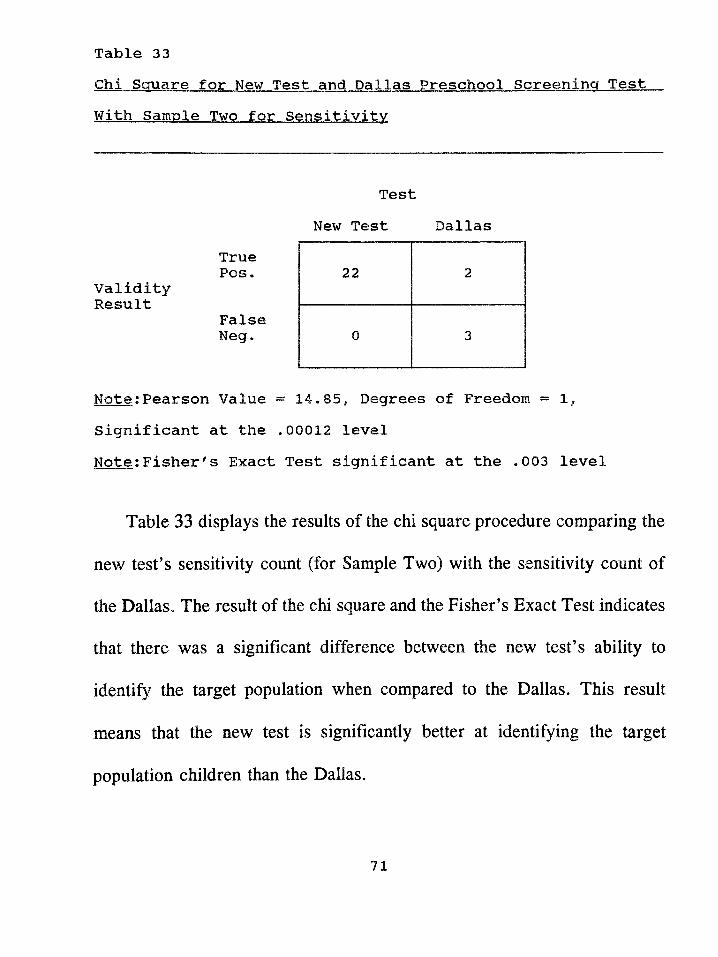
Table 33Chi Square for New Test and Dallas Preschool Screening TestWith Sample Two for Sensitivity
TruePos.
ValidityResult
FalseNeg.
Note:Pearson Value = 14.85, Degrees of Freedom = 1, Significant at the *00012 levelNote:Fisher's Exact Test significant at the *003 level
Table 33 displays the results of the chi square procedure comparing the
new test's sensitivity count (for Sample Two) with the sensitivity count of
the Dallas. The result of the chi square and the Fisher's Exact Test indicates
that there was a significant difference between the new test's ability to
identify the target population when compared to the Dallas. This result
means that the new test is significantly better at identifying the target
population children than the Dallas.
TestNew Test Dallas
22 2
0 3
71
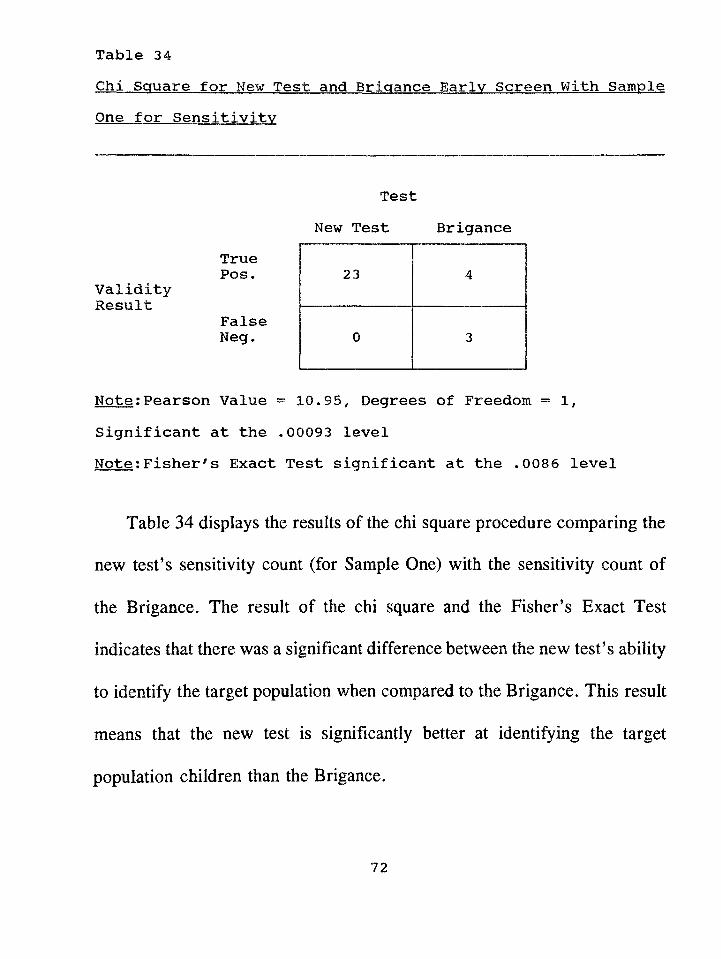
Table 34Chi Square for New Test and Brigance Earlv Screen With SampleOne for Sensitivity
TruePos.
ValidityResult
FalseNeg.
Note:Pearson Value = 10*95, Degrees of Freedom = 1, Significant at the .00093 levelNote:Fisher's Exact Test significant at the .0086 level
Table 34 displays the results of the chi square procedure comparing the
new test's sensitivity count (for Sample One) with the sensitivity count of
the Brigance. The result of the chi square and the Fisher's Exact Test
indicates that there was a significant difference between the new test's ability
to identify the target population when compared to the Brigance. This result
means that the new test is significantly better at identifying the target
population children than the Brigance.
TestNew Test Brigance
23 4
0 3
72
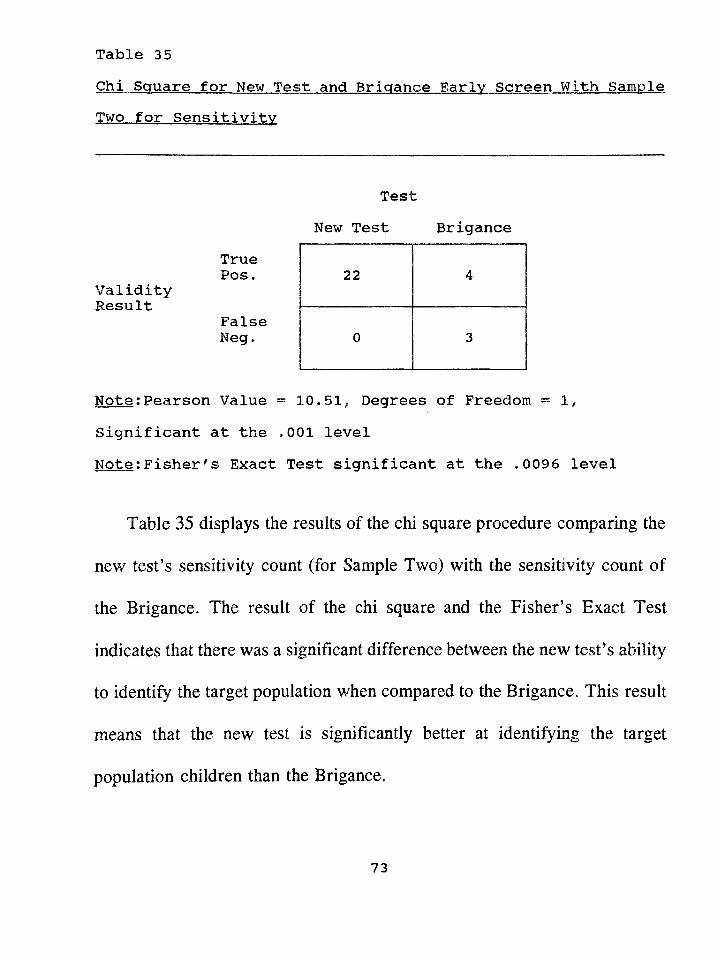
Table 35Chi Square for New Test and Brigance Earlv Screen With SampleTwo for Sensitivity
TruePos.
ValidityResult
FalseNeg.
Note;Pearson Value = 10.51, Degrees of Freedom = 1 ,
Significant at the .001 levelNote;Fisher's Exact Test significant at the .0096 level
Table 35 displays the results of the chi square procedure comparing the
new test's sensitivity count (for Sample Two) with the sensitivity count of
the Brigance. The result of the chi square and the Fisher’s Exact Test
indicates that there was a significant difference between the new test’s ability
to identify the target population when compared to the Brigance. This result
means that the new test is significantly better at identifying the target
population children than the Brigance.
TestNew Test Brigance
22 4
0 3
73

Table 36Chi Square for New Test and Brigance Earlv Screen With SampleOne for Specificity
FalsePos.
ValidityResult
TrueNeg.
Note;Pearson Value = 8.2, Degrees of Freedom = 1,Significant at the .004 level
Table 36 displays the results of the chi square procedure comparing the
new test’s specificity count (for Sample One) with the specificity count of
the Brigance. The result of the chi square indicates that there is a significant
difference between the new test’s ability to select out the children who are
not in the target population when compared to the Brigance.
TestNew Test Brigance
12 12
565 181
74
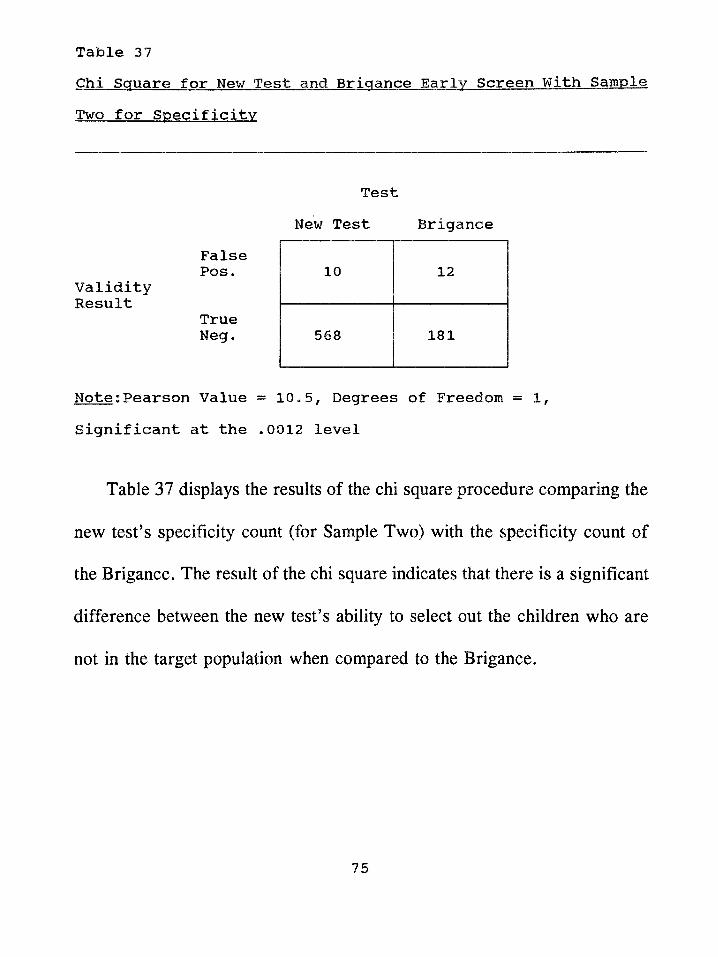
Table 37Chi Square for New Test and Brigance Early Screen With SampleTwo for Specificity
TestNew Test Brigance
False Pos.
Validity Result
True Neg.
Note;Pearson Value = 10*5, Degrees of Freedom = 1, Significant at the *0012 level
Table 37 displays the results of the chi square procedure comparing the
new test’s specificity count (for Sample Two) with the specificity count of
the Brigance. The result of the chi square indicates that there is a significant
difference between the new test’s ability to select out the children who are
not in the target population when compared to the Brigance.
10 12
568 181
75
CHAPTER IV
Discussion
Summary
This study investigated the accuracy of a newly constructed screening
instrument in identifying children, three to five years of age, in the Dade
County Head Start Program, who qualify for placement into an exceptional
student program for the language impaired or educable mentally handicapped
(EMH) in the Dade County Public School (DCPS) system. Previously used
commercial screening instruments were demonstrated to be unsatisfactory for
this purpose.
The new screening instrument was constructed by utilizing existing test
items from the Learning Accomplishment Profile - Diagnostic (LAP-D), an
assessment tool designed to estimate the developmental level of young
children in the following areas: fine & gross motor, cognitive, language, and
self-help. The new instrument consisted of four items from the Language
Naming subtest of the LAP-D: LN6 (names use of three common objects),
LN7 (names three common objects by use), LN9 (names ten pictures of
common objects), and LN11 (names eight actions in pictures). These items
had been identified as being highly predictive of whether a child qualified
76
for DCPS programs in the categories of language impaired or EMH through
a detailed crosstabulation process. This process consisted of examining the
test protocols of 500 previously evaluated Head Start children by
crosstabulating each child's performance (pass or fail) with Ms or her
ultimate qualification for special services (qualify or not qualify for language
impaired or EMH placement) based upon a comprehensive
psychoeducational assessment.
The new screening instrument was demonstrated to be both reliable and
valid for the classification purposes for which it was designed. The
reliability of the screening instrument was shown by test-retest coefficients
ranging from .85 to LOO and inter rater reliability coefficients ranging from
.79 to 1.00 using a random sample of Head Start children.
The new screening instrument was validated using a double sample
technique as recommended by Lichtenstein & Ireton (1984). Two samples,
each consisting of 600 randomly sampled children from the Dade County
Head Start program, were utilized for the validation procedure. Each child
was administered the screening instrument and then processed through a
psychoeducational evaluation procedure in order to obtain the hit rate data.
The double sample hit rate data demonstrated consistency in assigning
77
children to the hit rate categories. The sensitivity and specificity scores for
each of the samples was 100% and 98% respectively with Chi square values
also indicating a significant difference. Therefore, the null hypotheses were
rejected, i.e. null hypothesis one: there is no significant difference between
the sensitivity scores of the new screening instrument and the sensitivity
scores of the previously used commercial screening tests for the
identification of language impaired and educable mentally handicapped Head
Start children for Dade County Public School programs; and null hypothesis
two: there is no significant difference between the specificity scores of the
new screening instrument and the specificity scores of the previously used
commercial screening tests for the identification of language impaired and
educable mentally handicapped Head Start children for Dade County Public
School programs.
Further, the new screening instrument was characterized by features
which lent themselves to validity and reliability. The instrument consisted
of uniform materials and precise instructions as to how it was to be
administered, scored, and interpreted. The establishment of local decision
rales by using data from the same population on which the screening
instrument was to be used ensured a fairness in the process and enhanced the
78
ability to conduct direct comparisons between samples.
The acceptability of the screening instrument to other professionals and
administrators was not a factor since the LAP-D is a highly reputable
instrument which is widely used throughout the United States. As previously
indicated, the Dade County Public School System not only uses the LAP-D
during the assessment of potentially handicapped children to obtain
developmental skill age levels, but also uses the LAP-D as the basis for
writing a child’s IEP (Individual Educational Program). The study was
successful because of the clear definitions of: a) population to be screened,
b) population to be identified, c) criteria to determine who will be referred
for a comprehensive assessment, and d) criteria for determining who is
eligible for intervention services. The DCPS eligibility criteria places strict
parameters upon the comprehensive evaluation step of the district’s early
intervention process. These DCPS guidelines for services have defined the
categories or constructs to the point that make a high level of prediction
possible.
Implications for Practice
The development of the new screening instrument has two important
implications. The first implication relates to the high degree of accuracy of
79
the new instrument. The instrument’s capability of accurately identifying all
Dade County Head Start children who will qualify as language impaired or
EMH insures that these children will receive the special services they
require.
The second implication relates in two ways to the efficiency of the new
instrument. First, the new instrument takes approximately half the time to
administer as does the previously used procedure. This allows for a more
cost-effective screening program. Since the DCPS screening program
screens 4,000 Head Start children each school year, the screening period can
be cut from eight months to four months. Second, the capability of the
instrument to select out those children who do not have special needs means
that children will not go on for an unnecessary psychoeducational
evaluation. This represents another saving of time and personnel utilization
for DCPS.
Areas for Future Research
Future research related to this study may focus on a number of areas.
First, other localities or school districts that may be starting a preschool
screening program or that may be interested in improving the efficiency of
their current screening program may want to consider a similar type of
80
process for developing an instrument. The new instrument developed in this
study was successful because it was targeted for a particular population.
Before developing a local screening test, school districts and preschool
screening programs must take into consideration the characteristics of their
own population and the children they are interested in identifying when
formulating goals and objectives.
Second, research should focus on the monitoring of the continual
effectiveness of this new instrument. The possibility exists that the nature of
the Head Start population may change,in ethnic make-up, possibly resulting
in the predictive power of the four items used for the test being reduced.
Therefore, each year, the sensitivity and specificity of the new instrument
should be evaluated. In the event that the instrument is found to lose its
predictive ability to a significant extent, there would need to be a re
examination of the items passed and failed during the comprehensive
evaluation step.
Third, the long-term predictive validity of the new instrument could be
evaluated. This would involve following over time children who had been
given the screening instrument to determine if their status (i.e. true positive,
false positive, true negative, false negative) held up as the children
81
progressed through school.
Limitations
The limitations of this study are related to what made this study
successful. A target population was identified and clearly defined, and an
instrument was constructed for this target population based on their actual
responses on an assessment instrument. Therefore, use of this new screening
instrument should be limited to the children in the Dade County Head Start
program who are being considered for possible placement in the DCPS for
language impaired or educable mentally handicapped services.
This study focused on children with substantial language problems and
mild cognitive problems. In this population, identification can occur at an
early point in time. However, for young children with lesser degrees of
difficulties (e.g., mild problems in language areas), early identification is
more difficult. The existing literature focuses on the necessity to utilize such
means as spontaneous language sampling (Allen, 1989) and more
comprehensive language screening tests (Sommers, 1989) in early
identification. However, these methods require highly trained professionals
for administration and interpretation. This would put a great deal of pressure
on a mass preschool screening program, such as the one that exists in
82

DCPS, in terms of cost and time efficiency.
Lichtenstein and Ireton (1991), following a review of the early
identification literature, state that although there are limits on prediction
when it is applied to the relationship between developmental assessment and
future development, there can be expected to be a stronger relationship
between preschool screening and in-depth developmental assessment.
Although, this new screening instrument was able to predict which children
would be eligible for language impaired and educable mentally handicapped
placement as defined by DCPS system, this does not preclude the possibility
that some of the children who passed the screening will encounter school
difficulties in the future.
Finally, the demonstrated effectiveness of the new instrument is limited
to identifying Head Start children who will be found eligible for language
impaired or educable mentally handicapped placement. No evidence was
presented to extend the usefulness of the instrument to other categories of
exceptional student education.
83
Conclusions and Recommendations
The results of this study lead to a number of conclusions and
recommendations concerning the DCPS preschool screening program and
preschool screenings in general. First, the goals of screening and the
population to be screened must be clearly defined. These definitions, in turn,
shape specific plans about overall screening procedures including the choice
of screening instruments, decision rales, and the need for conducting
comprehensive evaluations of children. In this study the population to be
screened was clearly defined as the children enrolled in the Dade County
Head Start program and the task was clearly defined as identifying language
impaired and educable mentally handicapped children based upon the Dade
County Public School system’s procedural guidelines. This clarity
contributed to the development of a screening instrument that accurately
referred children for a complete psychoeducational evaluation.
Second, three essential elements in screening must be determined for
ensuring that valid decisions are made in an efficient manner: a) the base
rate, b) the decision rales or process, and c) the accuracy of the outcomes.
The screening planner should be aware of the expected frequency of the
specific disabilities that occur in the targeted population, should have a
84
thorough understanding of the screening decision rales and the
comprehensive evaluation criteria, and should have a system in place that
evaluates the screening results. This study: a) established the base rate for
the target population as being, on average, 3.3%; b) established decision
rales that were easy to follow and were directly related to the evaluation
criteria; and, c) provided validity results for the new screening instrument
by using the hit rate model.
Consequently, it is recommended that the new screening instrument be
used with the Dade County Head Start program and all the private preschool
and day care centers in Dade County with similar populations because of it’s
accuracy and cost-effectiveness. Other early intervention programs, such as
preschools and day care centers with different types of populations than the
one used in this study (e.g., different ethnic and social economic status), are
encouraged to follow similar procedures as used in this study to develop a
valid instrument for screening their children. If this is not possible, a
screening planner should select an instrument best suited for the purpose of
the screening, know the instrument’s limitations, and be prepared to
supplement or substitute for the instrument when it becomes necessary*
Third, cost-effectiveness must be considered* "The screening process
85
must be sufficiently thorough to produce valid results, yet brief enough not
to be prohibitive in cost." (Lichtenstein & Ireton, 1991, p. 507). It must be
efficient in terms of both time and personnel. In relation to time, the new
screening instrument cut in half the time required to screen each child. In
relation to personnel, because the instrument did not require professionals
to administer, score, or interpret the results, paraprofessionals could be
utilized, thereby reducing the cost.
Other conclusions relate to preschool screening in general. Preschool
screening should be offered according to a schedule that allows children to
proceed expeditiously from screening to follow-up assessment. Screening
should be available to young children (early three year olds) and offered
thereafter on a periodic or continuous basis because: a) the rate of skill
development varies from child to child and b) following some school
experience and the effects of maturation more qualified decisions about
development can be made.
Preschool screening is an important part of an early child development
evaluation process within a comprehensive educational system. It is
imperative that the screening process meet the needs and match the
population on which it is being used. The new screening instrument
86
developed in this study accomplishes and fulfills these requirements.
87
APPENDIX A
Definition of Terms
Base Rate - The prevalence of the problem to be identified.
In this study it is the amount of children in the
Head Start population who are truly language impaired or
educable mentally handicapped. A numerical figure calculated
by a formula. This formula yields an estimate of the
existing problem that the screening instrument wants to identify.
(Lichtenstein & Ireton, 1984)
Classification method - Validity of screening instrument
is measured by "actual" status of child as determined
by some criterion measure. Also known as "hit-rate"
model. (Lichtenstein & Ireton, 1984)
Efficiency of screening result (refer) - Accurate screening
outcome. Is calculated by a formula. This formula yields
a figure that is converted to a percentage. This
percentage indicates the probability that a decision
of "refer" will be accurate in identifying a target group
child. (Lichtenstein & Ireton, 1984)
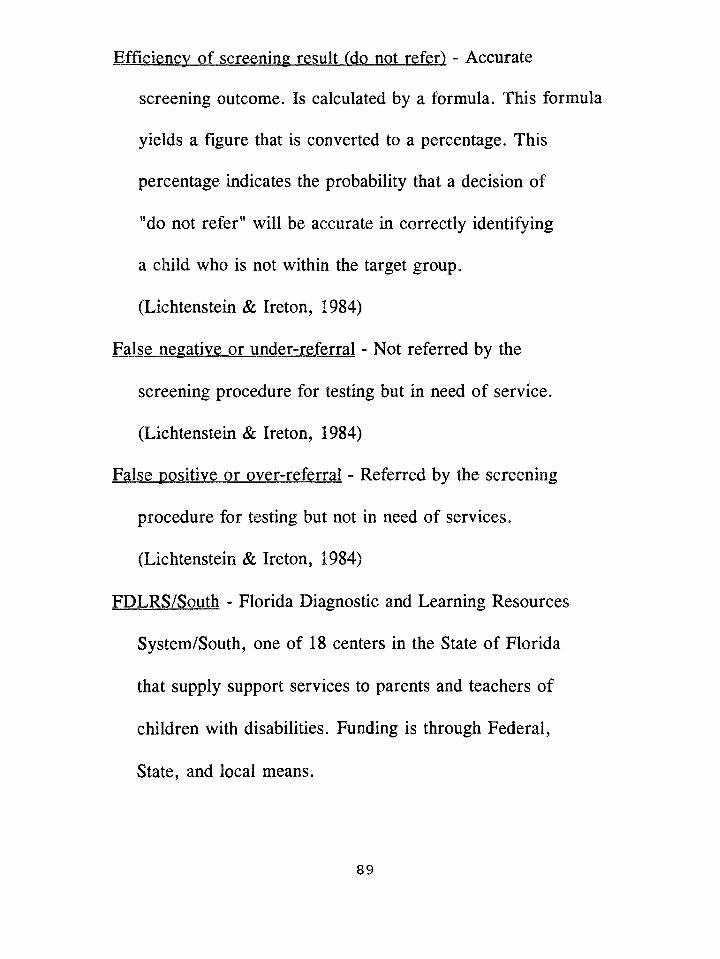
Efficiency of screening result (do not refer) - Accurate
screening outcome. Is calculated by a formula. This formula
yields a figure that is converted to a percentage. This
percentage indicates the probability that a decision of
"do not refer" will be accurate in correctly identifying
a child who is not within the target group.
(Lichtenstein & Ireton, 1984)
False negative or under-referral - Not referred by the
screening procedure for testing but in need of service.
(Lichtenstein & Ireton, 1984)
False positive or over-referral - Referred by the screening
procedure for testing but not in need of services.
(Lichtenstein & Ireton, 1984)
FDLRS/South - Florida Diagnostic and Learning Resources
System/South, one of 18 centers in the State of Florida
that supply support services to parents and teachers of
children with disabilities. Funding is through Federal,
State, and local means.
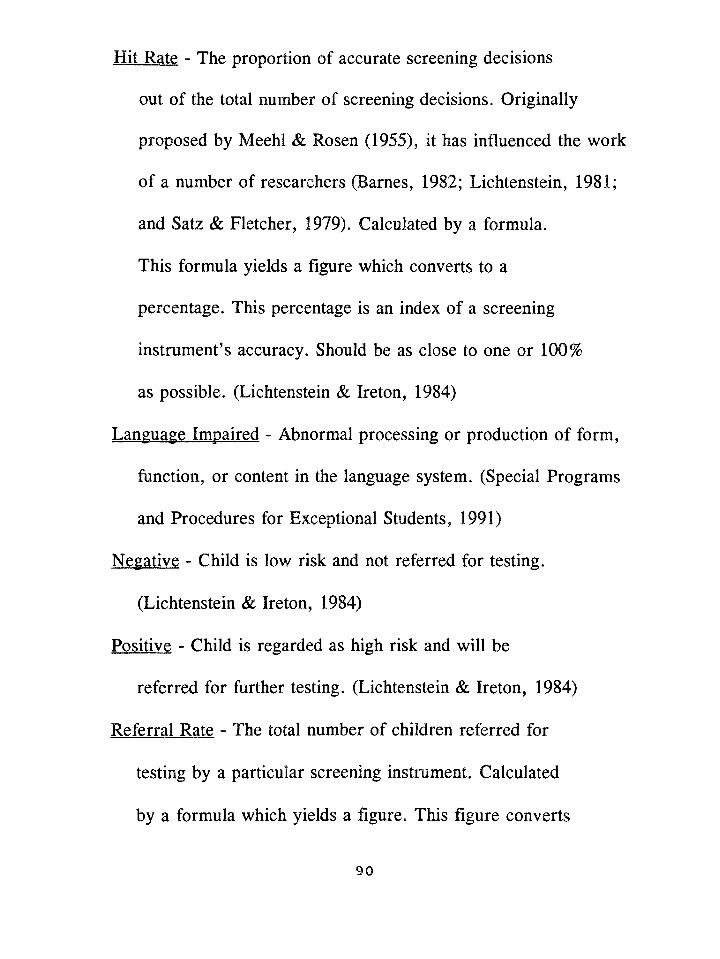
Hit Rate - The proportion of accurate screening decisions
out of the total number of screening decisions. Originally
proposed by Meehl & Rosen (1955), it has influenced the work
of a number of researchers (Barnes, 1982; Lichtenstein, 1981;
and Satz & Fletcher, 1979). Calculated by a formula.
This formula yields a figure which converts to a
percentage. This percentage is .an index of a screening
instrument’s accuracy. Should be as close to one or 100%
as possible. (Lichtenstein & Ireton, 1984)
Language Impaired - Abnormal processing or production of form,
function, or content in the language system. (Special Programs
and Procedures for Exceptional Students, 1991)
Negative - Child is low risk and not referred for testing.
(Lichtenstein & Ireton, 1984)
Positive - Child is regarded as high risk and will be
referred for farther testing. (Lichtenstein & Ireton, 1984)
Referral Rate - The total number of children referred for
testing by a particular screening instrument. Calculated
by a formula which yields a figure. This figure converts
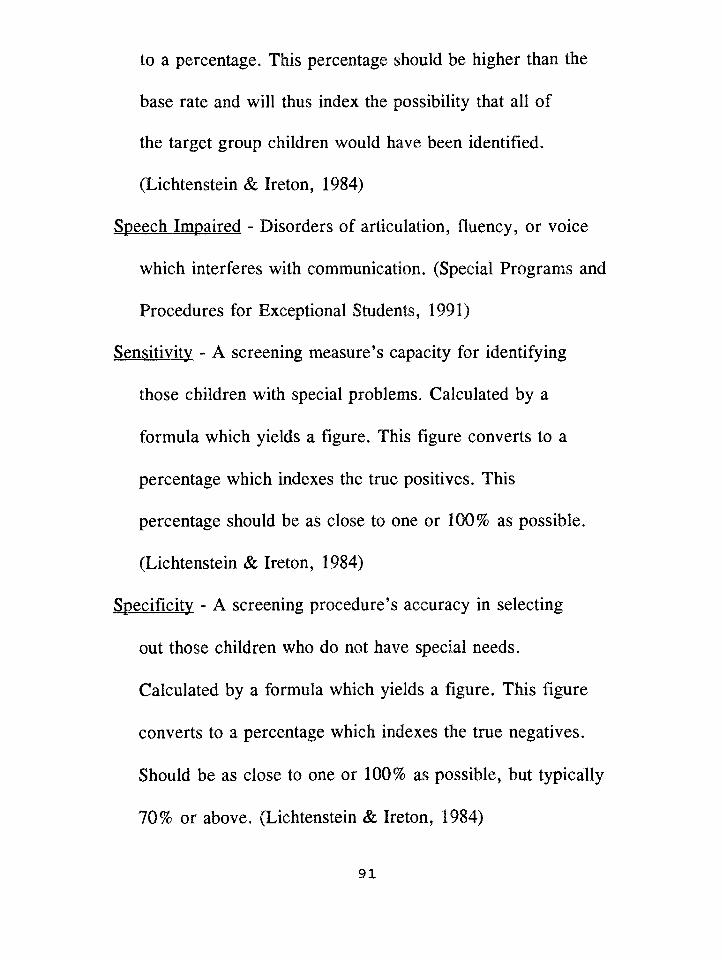
to a percentage. This percentage should be higher than the
base rate and will thus index the possibility that all of
the target group children would have been identified.
(Lichtenstein & Ireton, 1984)
Speech Impaired - Disorders of articulation, fluency, or voice
which interferes with communication. (Special Programs and
Procedures for Exceptional Students, 1991)
Sensitivity - A screening measure’s capacity for identifying
those children with special problems. Calculated by a
formula which yields a figure. This figure converts to a
percentage which indexes the true positives. This
percentage should be as close to one or 100% as possible.
(Lichtenstein & Ireton, 1984)
Specificity - A screening procedure’s accuracy in selecting
out those children who do not have special needs.
Calculated by a formula which yields a figure. This figure
converts to a percentage which indexes the true negatives.
Should be as close to one or 100% as possible, but typically
70% or above. (Lichtenstein & Ireton, 1984)
91
True negative - Not referred by the screening procedure for
testing and not in need of services. (Lichtenstein & Ireton, 1984)
True positive - Referred by the screening procedure for
testing and in need of service. (Lichtenstein & Ireton, 1984)
92
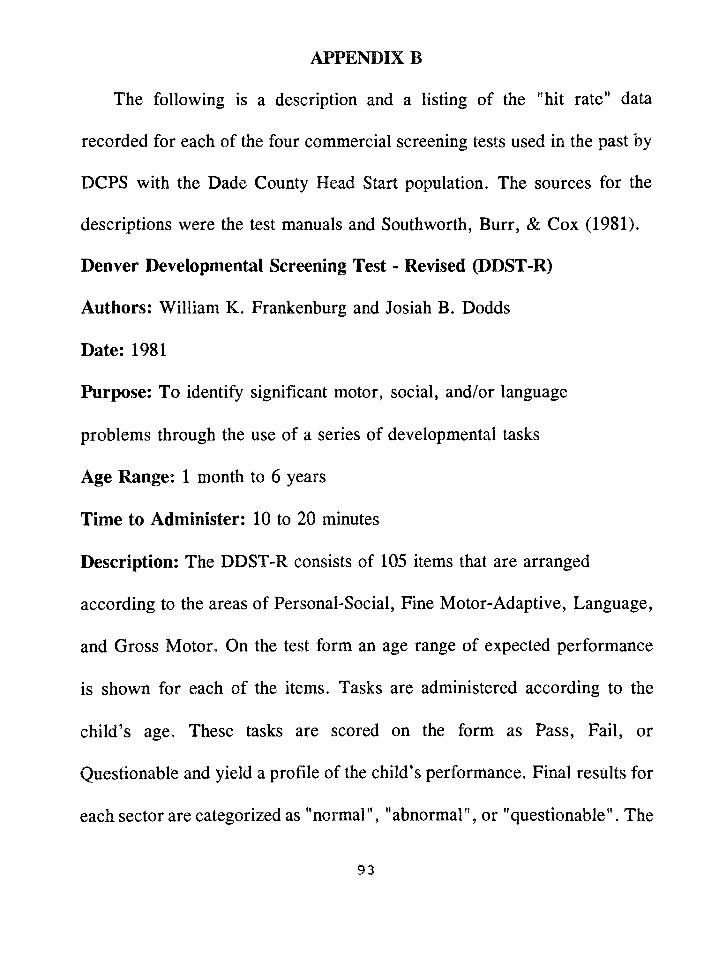
APPENDIX B
The following is a description and a listing of the "hit rate" data
recorded for each of the four commercial screening tests used in the past by
DCPS with the Dade County Head Start population. The sources for the
descriptions were the test manuals and Southworth, Burr, & Cox (1981).
Denver Developmental Screening Test - Revised (DDST-R)
Authors: William K. Frankenburg and Josiah B. Dodds
Date: 1981
Purpose: To identify significant motor, social, and/or language
problems through the use of a series of developmental tasks
Age Range: 1 month to 6 years
Time to Administer: 10 to 20 minutes
Description: The DDST-R consists of 105 items that are arranged
according to the areas of Personal-Social, Fine Motor-Adaptive, Language,
and Gross Motor. On the test form an age range of expected performance
is shown for each of the items. Tasks are administered according to the
child’s age. These tasks are scored on the form as Pass, Fail, or
Questionable and yield a profile of the child’s performance. Final results for
each sector are categorized as "normal", 11 abnormal", or "questionable". The
93
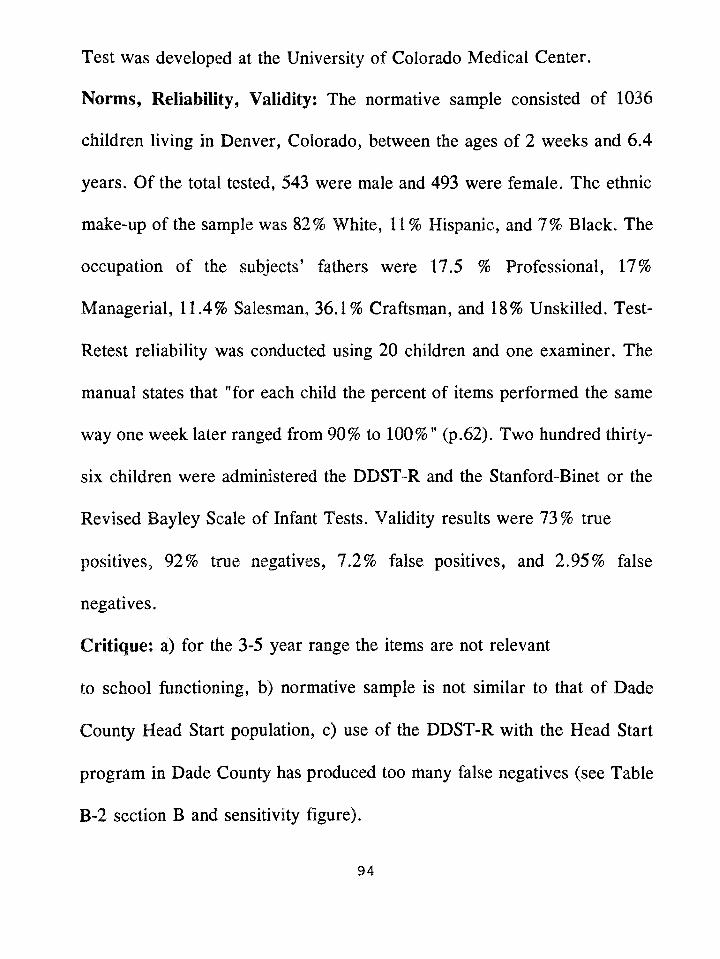
Test was developed at the University of Colorado Medical Center.
Norm s, Reliability, Validity; The normative sample consisted of 1036
children living in Denver, Colorado, between the ages of 2 weeks and 6.4
years. Of the total tested, 543 were male and 493 were female. The ethnic
make-up of the sample was 82% White, 11% Hispanic, and 7% Black. The
occupation of the subjects' fathers were 17.5 % Professional, 17%
Managerial, 11.4% Salesman, 36.1% Craftsman, and 18% Unskilled. Test-
Retest reliability was conducted using 20 children and one examiner. The
manual states that "for each child the percent of items performed the same
way one week later ranged from 90% to 100%" (p.62). Two hundred thirty-
six children were administered the DDST-R and the Stanford-BInet or the
Revised Bayley Scale of Infant Tests. Validity results were 73% true
positives, 92% true negatives, 7.2% false positives, and 2.95% false
negatives.
Critique; a) for the 3-5 year range the items are not relevant
to school functioning, b) normative sample is not similar to that of Dade
County Head Start population, c) use of the DDST-R with the Head Start
program in Dade County has produced too many false negatives (see Table
B-2 section B and sensitivity figure).
94
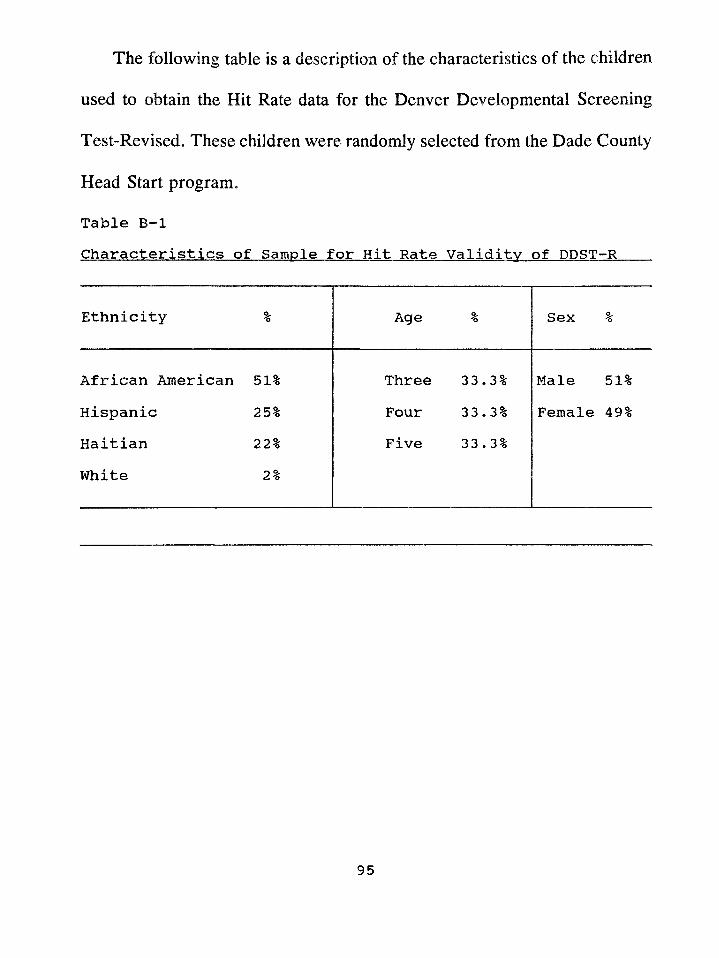
The following table is a description of the characteristics of the children
used to obtain the Hit Rate data for the Denver Developmental Screening
Test-Revised. These children were randomly selected from the Dade County
Head Start program.
Table B-lCharacteristics of Sample for Hit Rate Validity of DDST-R
Ethnicity % Age % Sex %
African American 51% Three 33*3% Male 51%Hispanic 25% Four 33*3% Female 49%Haitian 22% Five 33 . 3%White 2%
95
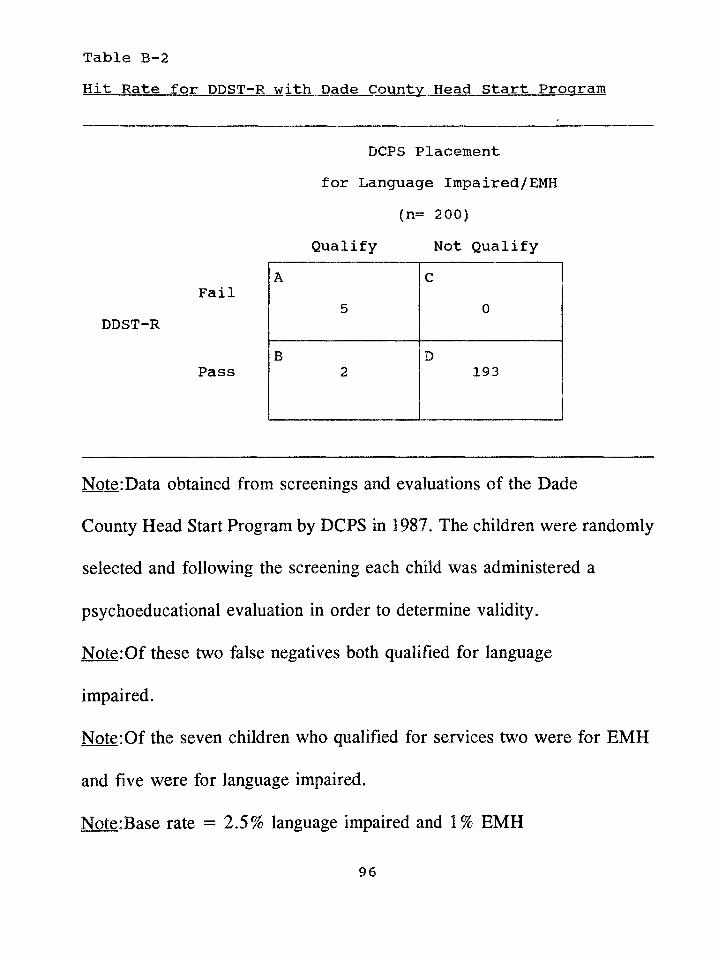
Hit Rate for DDST-R with Dade County Head Start ProgramTable B-2
DCPS Placement for Language Impaired/EMH
(n= 200)Qualify Not Qualify
FailDDST-R
Pass
Note:Data obtained from screenings and evaluations of the Dade
County Head Start Program by DCPS in 1987. The children were randomly
selected and following the screening each child was administered a
psychoeducational evaluation in order to determine validity.
Note:Of these two false negatives both qualified for language
impaired.
Note:Of the seven children who qualified for services two were for EMH
and five were for language impaired.
Note:Base rate = 2.5% language impaired and 1% EMH
96
A5
C0
B2
D193
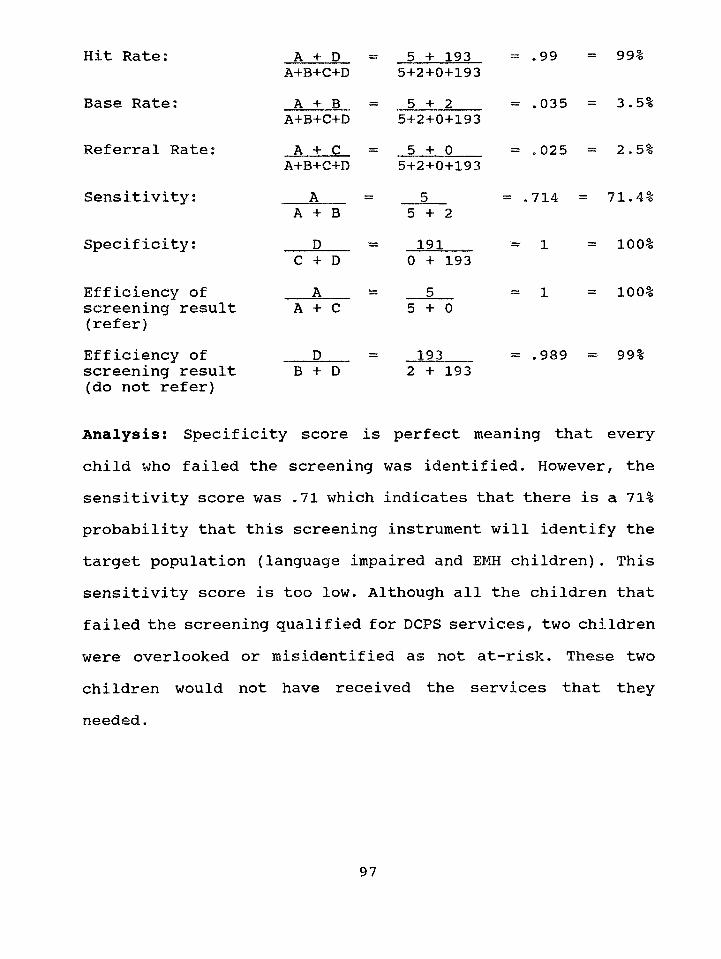
Hit Rate:
Base Rate;
Referral Rate
Sensitivity;
Specificity;
Efficiency of screening result (refer)Efficiency of screening result (do not refer)
A + D A+B+C+DA + B
A+B+C+DA + C
A+B+C+DA
A + B D
C + D A
A + C
B + D
5 + 193 5+2+0+1935 + 2
5+2+0+1935 + 0
5+2+0+193
5 + 2191
0 + 1935
5 + 0
193 2 + 193
= .99
= .035
= .025
= .714 =
= 1
= 1
= 99%
= 3.5%
= 2.5%
71.4%
= 100%
= 100%
= .989 = 99%
Analysis: Specificity score is perfect meaning that everychild who failed the screening was identified. However, the sensitivity score was .71 which indicates that there is a 71% probability that this screening instrument will identify the target population (language impaired and EMH children). This sensitivity score is too low. Although all the children that failed the screening qualified for DCPS services, two children were overlooked or misidentified as not at-risk. These two children would not have received the services that they needed.
97
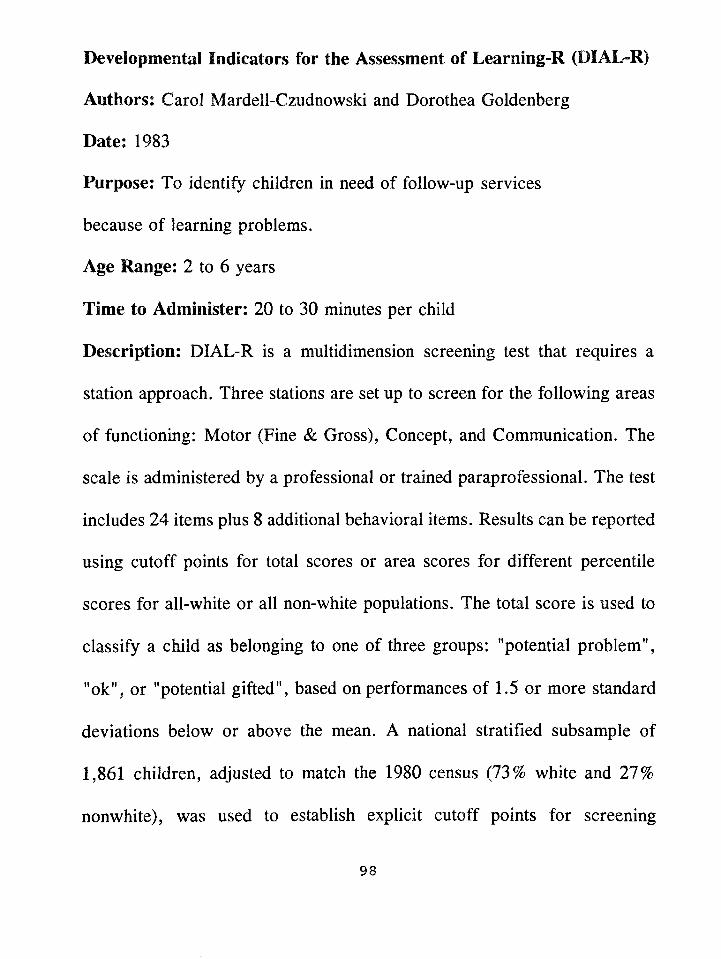
Developmental Indicators for the Assessment of Learning-R (DIAL-R)
Authors: Carol Mardell-Czudnowski and Dorothea Goldenberg
Date: 1983
Purpose: To identify children in need of follow-up services
because of learning problems.
Age Range: 2 to 6 years
Time to Administer: 20 to 30 minutes per child
Description: DIAL-R is a multidimension screening test that requires a
station approach. Three stations are set up to screen for the following areas
of functioning: Motor (Fine & Gross), Concept, and Communication. The
scale is administered by a professional or trained paraprofessional. The test
includes 24 items plus 8 additional behavioral items. Results can be reported
using cutoff points for total scores or area scores for different percentile
scores for all-white or all non-white populations. The total score is used to
classify a child as belonging to one of three groups: "potential problem",
11 ok", or "potential gifted", based on performances of 1.5 or more standard
deviations below or above the mean. A national stratified subsample of
1,861 children, adjusted to match the 1980 census (73% white and 27%
nonwhite), was used to establish explicit cutoff points for screening
98
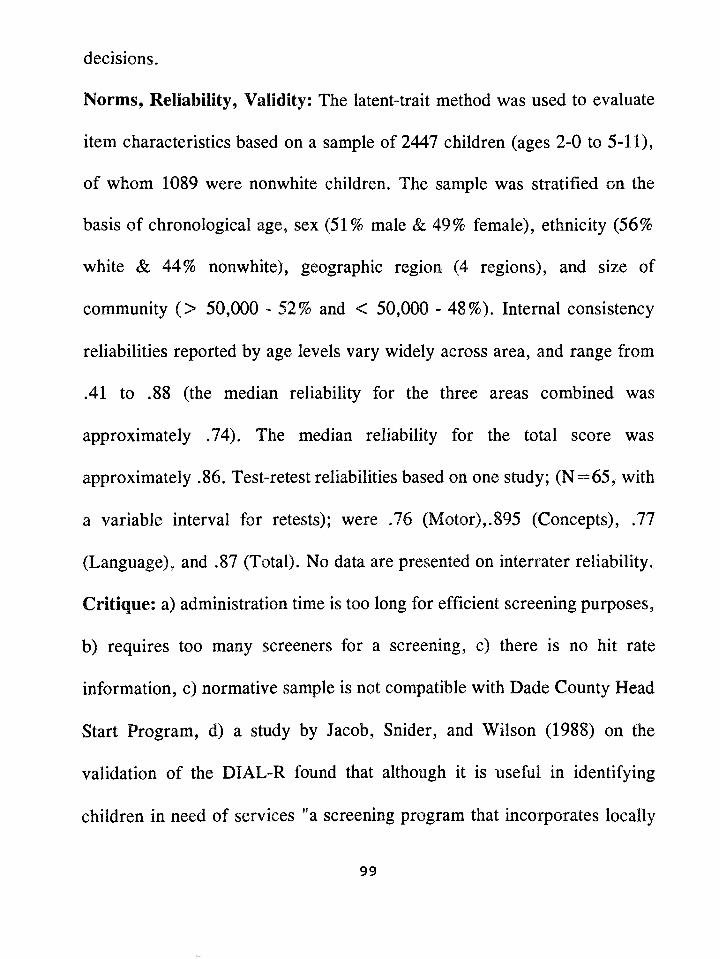
decisions.
Norms, Reliability, Validity: The latent-trait method was used to evaluate
item characteristics based on a sample of 2447 children (ages 2-0 to 5-11),
of whom 1089 were nonwhite children. The sample was stratified on the
basis of chronological age, sex (51% male & 49% female), ethnicity (56%
white & 44% nonwhite), geographic region (4 regions), and size of
community (> 50,000 - 52% and < 50,000 - 48%). Internal consistency
reliabilities reported by age levels vary widely across area, and range from
.41 to .88 (the median reliability for the three areas combined was
approximately .74). The median reliability for the total score was
approximately .86. Test-retest reliabilities based on one study; (N =65, with
a variable interval for retests); were .76 (Motor),.895 (Concepts), .77
(Language), and .87 (Total). No data are presented on interrater reliability.
Critique: a) administration time is too long for efficient screening purposes,
b) requires too many screeners for a screening, c) there is no hit rate
information, c) normative sample is not compatible with Dade County Head
Start Program, d) a study by Jacob, Snider, and Wilson (1988) on the
validation of the DIAL-R found that although it is useful in identifying
children in need of services "a screening program that incorporates locally
99
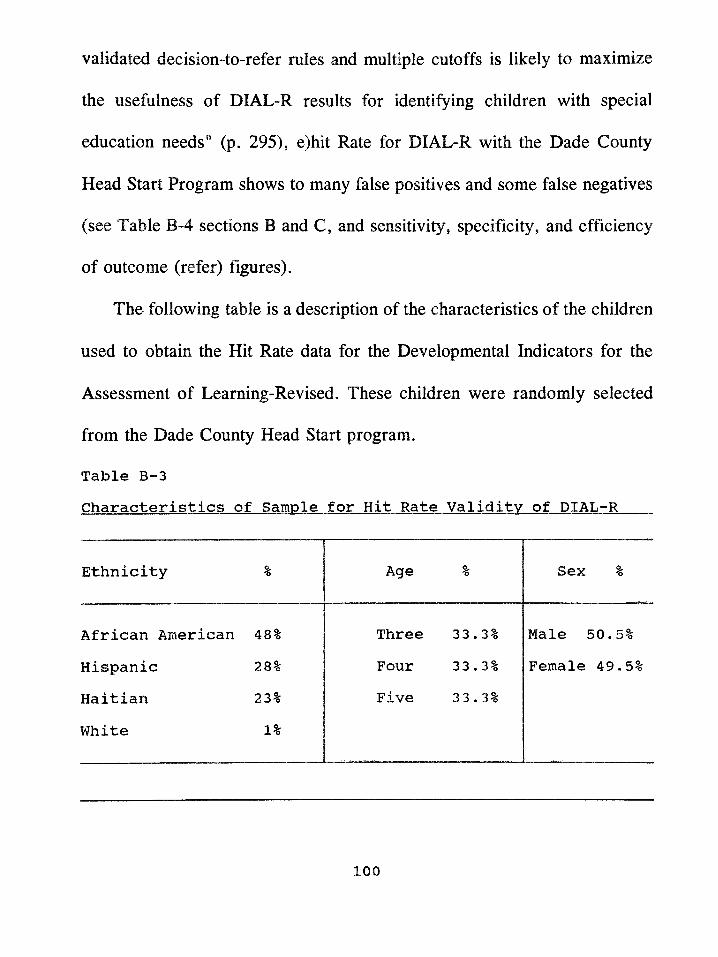
validated decision-to-refer rales and multiple cutoffs is likely to maximize
the usefulness of DIAL-R results for identifying children with special
education needs" (p. 295), e)hit Rate for DIAL-R with the Dade County
Head Start Program shows to many false positives and some false negatives
(see Table B-4 sections B and C, and sensitivity, specificity, and efficiency
of outcome (refer) figures).
The following table is a description of the characteristics of the children
used to obtain the Hit Rate data for the Developmental Indicators for the
Assessment of Learning-Revised. These children were randomly selected
from the Dade County Head Start program.
Table B-3Characteristics of Sample for Hit Rate Validity of DIAL-R
Ethnicity % Age % Sex %
African American 48% Three 33 . 3% Male 50*5%
Hispanic 28% Four 33 . 3% Female 49*5%
Haitian 23% Five 33*3%
White 1%
100
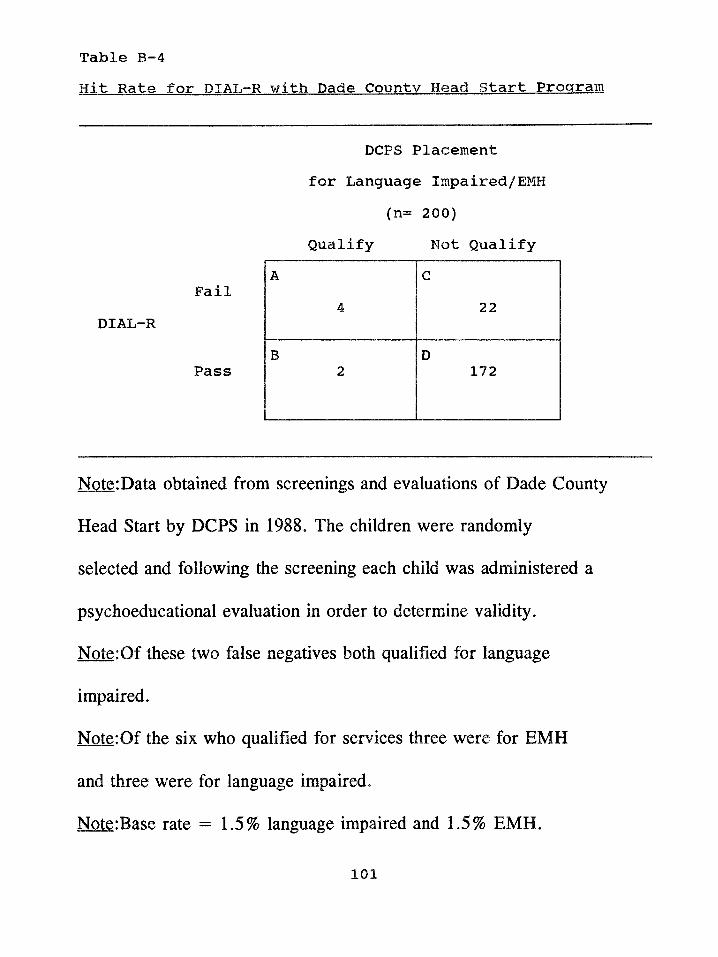
Hit Rate for DIAL-R with Dade County Head Start ProgramTable B-4
DCPS Placement for Language Impaired/EMH
(n= 200)
Qualify Not Qualify
FailDIAL-R
Pass
Note:Data obtained from screenings and evaluations of Dade County
Head Start by DCPS in 1988. The children were randomly
selected and following the screening each child was administered a
psychoeducational evaluation in order to determine validity.
Note:Of these two false negatives both qualified for language
impaired.
Note:Of the six who qualified for services three were for EMH
and three were for language impaired.
Note:Base rate = 1.5% language impaired and 1.5% EMH.
101
A4
C22
B2
D172
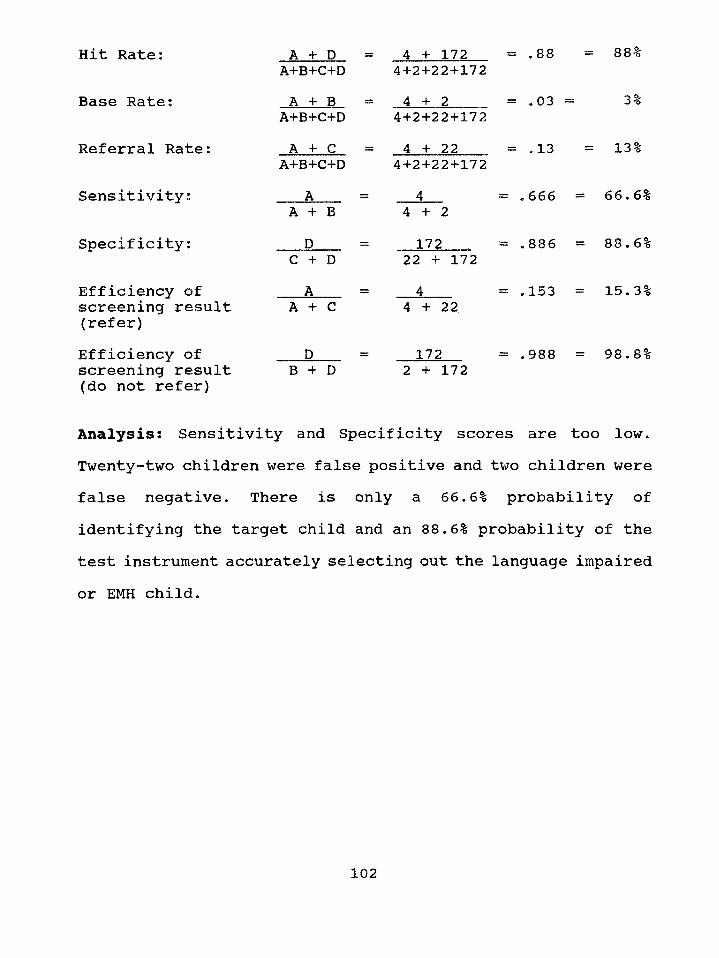
Hit Rate:
Base Rate:
Referral Rate:
Sensitivity:
Specificity:
Efficiency of screening result (refer)Efficiency of screening result (do not refer)
A + D A+B+C+DA + B
A+B+C+DA + C
A+B+C+DA ,
A + BD ,
C + DA
A + C
DB + D
4 + 172 4+2+22+1724 + 2
4+2+22+1724 + 22
4+2+22+172
= .88
= .03 =
= .13
= 88%
3%
= 13%
66.6%4 + 2172
22 + 172 4
4 + 22
172
= . 6 6 6 =
= .886 = 88.6%
= .153 = 15.3%
= .988 = 98.8%2 + 172
Analysis: Sensitivity and Specificity scores are too low.Twenty-two children were false positive and two children were false negative. There is only a 66.6% probability of identifying the target child and an 88.6% probability of the test instrument accurately selecting out the language impaired
or EMH child.
102
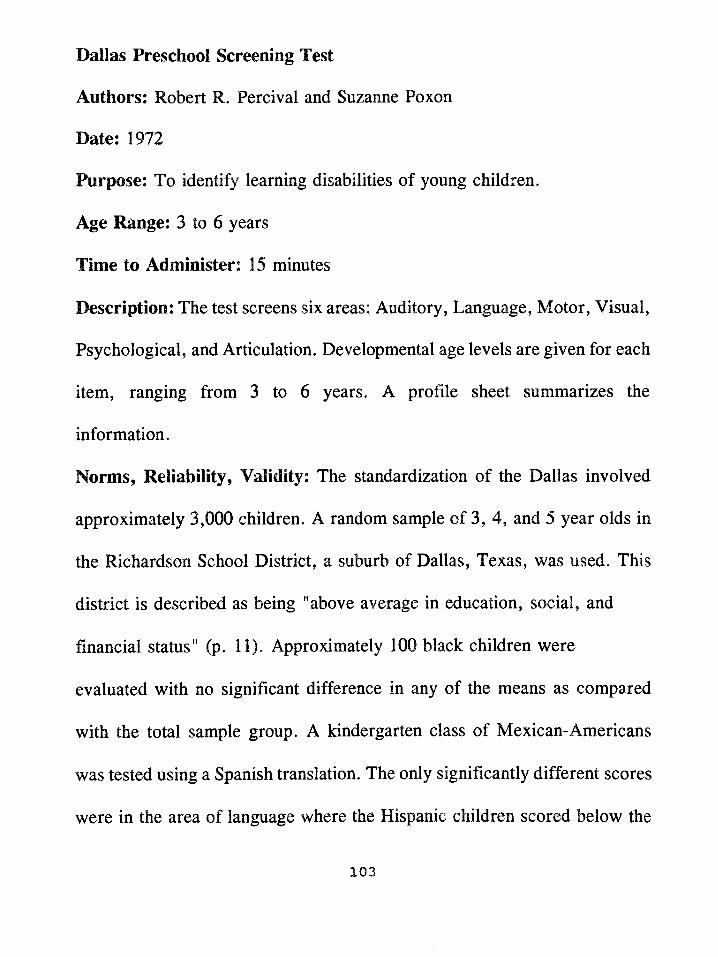
Dallas Preschool Screening Test
Authors: Robert R. Percival and Suzanne Poxon
Date: 1972
Purpose: To identify learning disabilities of young children.
Age Range: 3 to 6 years
Time to Administer: 15 minutes
Description: The test screens six areas: Auditory, Language, Motor, Visual,
Psychological, and Articulation. Developmental age levels are given for each
item, ranging from 3 to 6 years. A profile sheet summarizes the
information.
Norm s, Reliability, Validity: The standardization of the Dallas involved
approximately 3,000 children. A random sample of 3, 4, and'5 year olds in
the Richardson School District, a suburb of Dallas, Texas, was used. This
district is described as being "above average in education, social, and
financial status" (p. 11). Approximately 100 black children were
evaluated with no significant difference in any of the means as compared
with the total sample group. A kindergarten class of Mexican-Americans
was tested using a Spanish translation. The only significantly different scores
were in the area of language where the Hispanic children scored below the
103
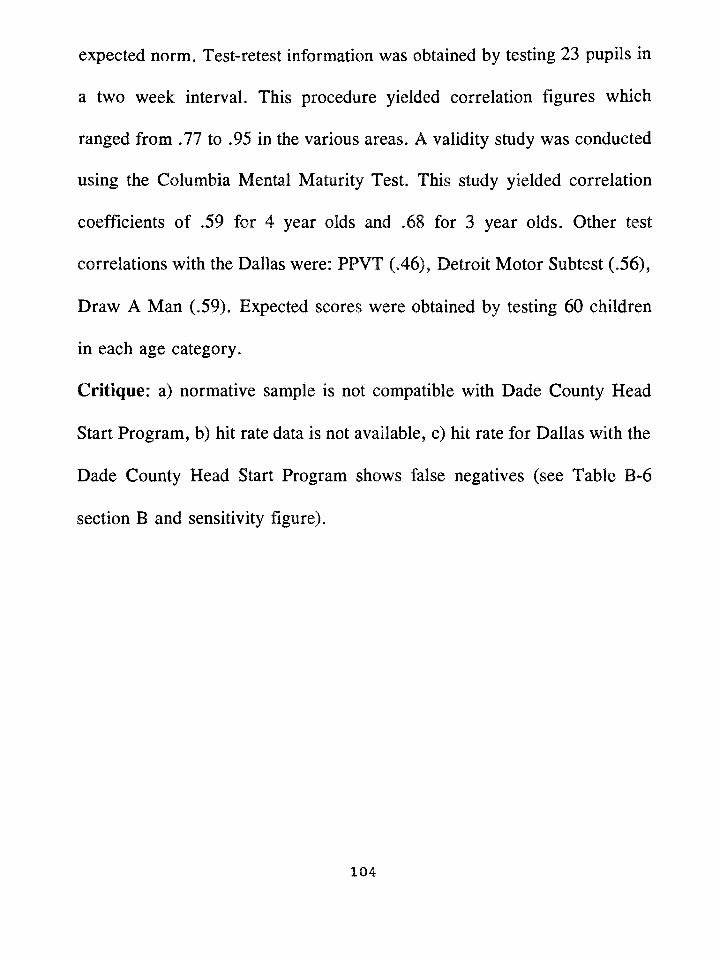
expected norm. Test-retest information was obtained by testing 23 pupils in
a two week interval. This procedure yielded correlation figures which
ranged from .77 to .95 in the various areas. A validity study was conducted
using the Columbia Mental Maturity Test. This study yielded correlation
coefficients of .59 for 4 year olds and .68 for 3 year olds. Other test
correlations with the Dallas were: PPVT (.46), Detroit Motor Subtest (.56),
Draw A Man (.59). Expected scores were obtained by testing 60 children
in each age category.
Critique: a) normative sample is not compatible with Dade County Head
Start Program, b) hit rate data is not available, c) hit rate for Dallas with the
Dade County Head Start Program shows false negatives (see Table B-6
section B and sensitivity figure).
104
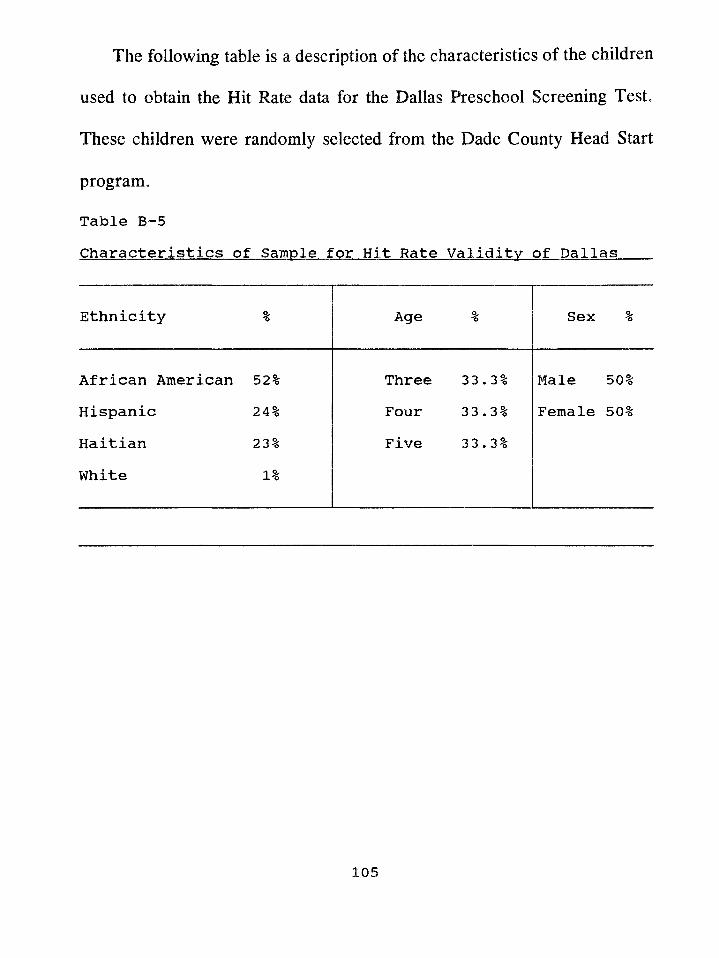
The following table is a description of the characteristics of the children
used to obtain the Hit Rate data for the Dallas Preschool Screening Test.
These children were randomly selected from the Dade County Head Start
program.
Table B-5Characteristics of Sample for Hit Rate Validity of Dallas
Ethnicity % Age % Sex %
African American 52% Three 33.3% Male 50%Hispanic 24% Four 33*3% Female 50%Haitian 23% Five 33.3%White 1%
105
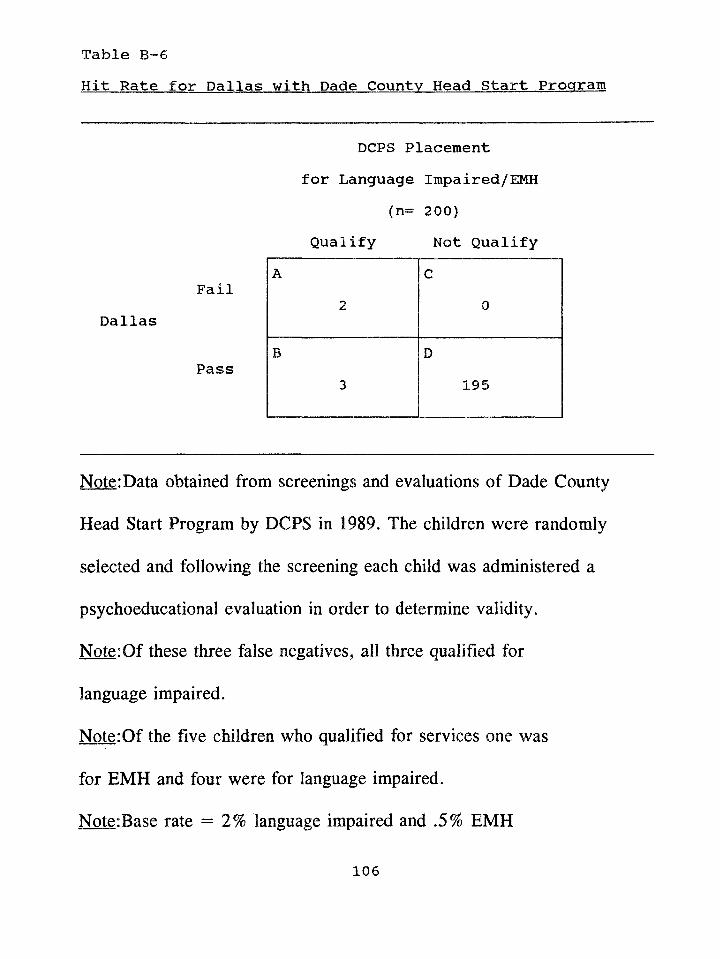
Table B-6Hit Rate for Dallas with Dade County Head Start Program
DCPS Placement for Language Impaired/EMH
(n= 200)Qualify Not Qualify
FailDallas
Pass
Note:Data obtained from screenings and evaluations of Dade County
Head Start Program by DCPS in 1989. The children were randomly
selected and following the screening each child was administered a
psychoeducational evaluation in order to determine validity.
Note:Of these three false negatives, all three qualified for
language impaired.
Note:Of the five children who qualified for services one was
for EMH and four were for language impaired.
Note:Base rate = 2% language impaired and .5% EMH
106
A2
C0
B3
D195
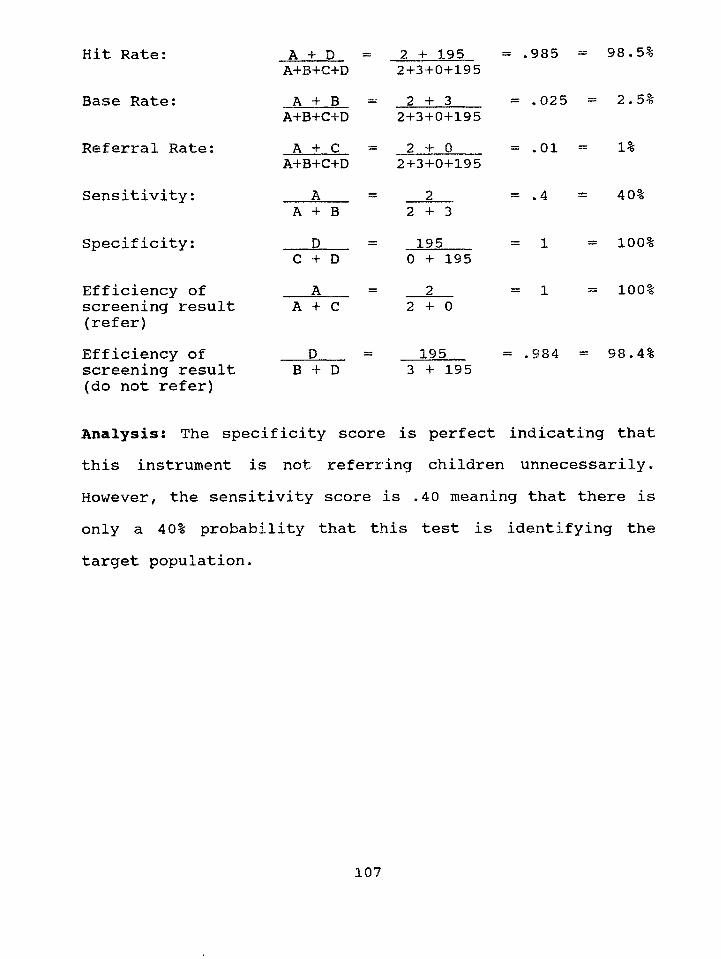
Hit Rate:
Base Rate:
Referral Rate:
Sensitivity:
Specificity:
Efficiency of screening result (refer)Efficiency of screening result (do not refer)
A + D A+B+C+DA + B
A+B+C+DA + C
A+B+C+DA
A + B D
C + D A
A + C
DB + D
= 2 + 1952+3+0+195
= 2 + 32+3+0+195
= 2 + 02+3+0+195
2 + 3— 1 9 5 __________
0 + 1952
2 + 0
1953 + 195
= .985 =
= .025
= .01 =
98.5%
= 2.5%
1%
= .4
= 1
40%
= 100%
= 100%
= .984 = 98,4%
Analysis! The specificity score is perfect indicating that this instrument is not referring children unnecessarily. However, the sensitivity score is .40 meaning that there is only a 40% probability that this test is identifying the target population.
107
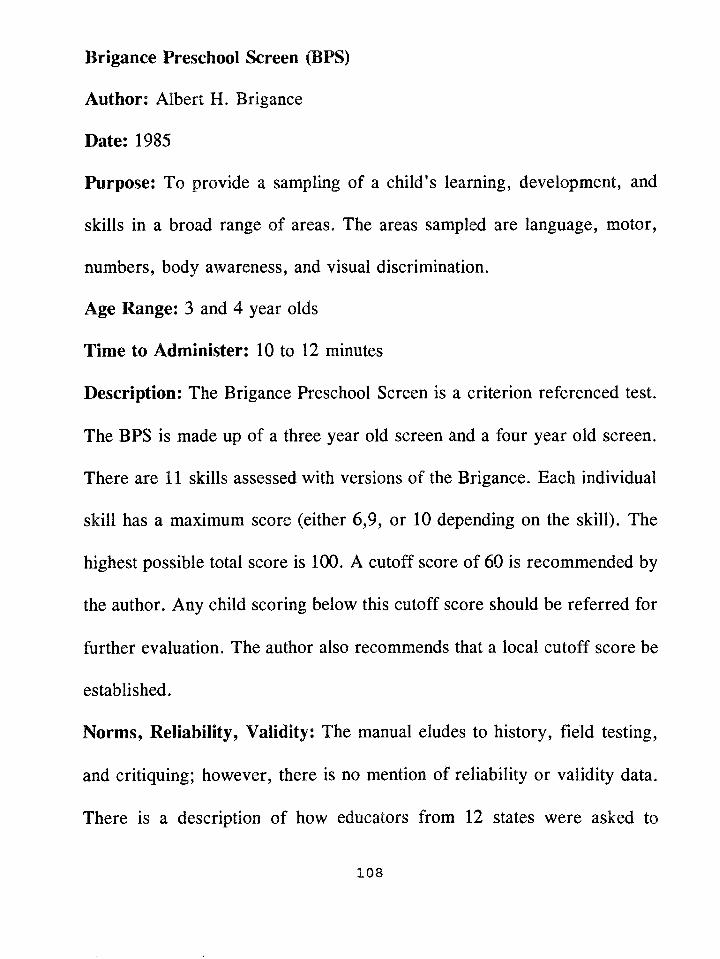
Brigance Preschool Screen (BPS)
Author: Albert H. Brigance
Date: 1985
Purpose: To provide a sampling of a child’s learning, development, and
skills in a broad range of areas. The areas sampled are language, motor,
numbers, body awareness, and visual discrimination.
Age Range: 3 and 4 year olds
Time to Administer: 10 to 12 minutes
Description: The Brigance Preschool Screen is a criterion referenced test.
The BPS is made up of a three year old screen and a four year old screen.
There are 11 skills assessed with versions of the Brigance. Each individual
skill has a maximum score (either 6,9, or 10 depending on the skill). The
highest possible total score is 100. A cutoff score of 60 is recommended by
the author. Any child scoring below this cutoff score should be referred for
farther evaluation. The author also recommends that a local cutoff score be
established.
Norms, Reliability, Validity: The manual eludes to history, field testing,
and critiquing; however, there is no mention of reliability or validity data.
There is a description of how educators from 12 states were asked to
108
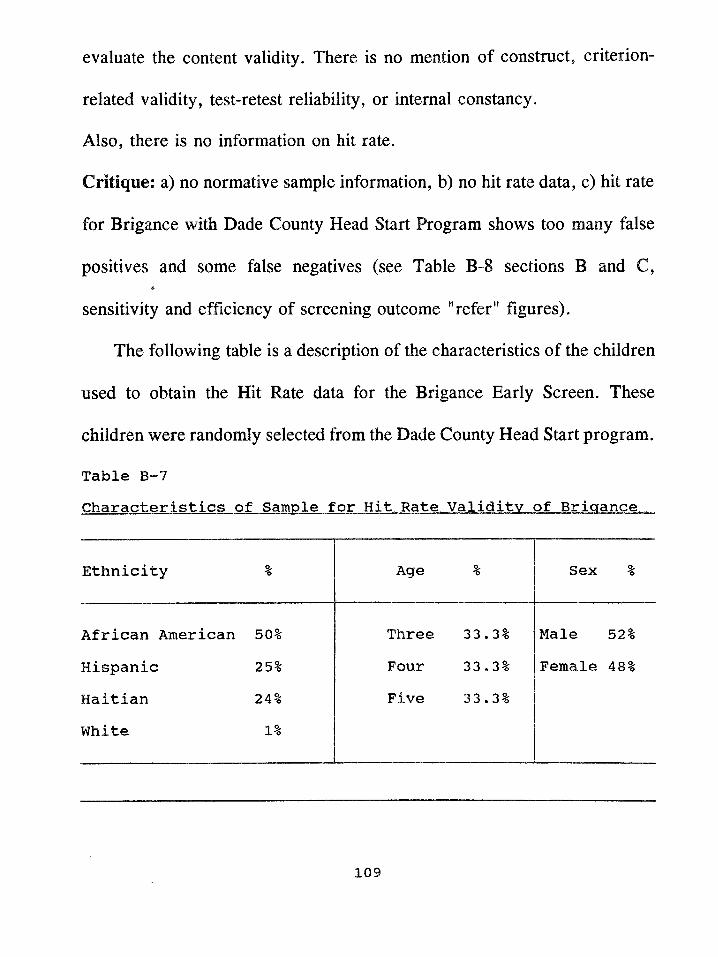
evaluate the content validity. There is no mention of construct, criterion™
related validity, test-retest reliability, or internal constancy.
Also, there is no information on hit rate.
Critique: a) no normative sample information, b) no hit rate data, c) hit rate
for Brigance with Dade County Head Start Program shows too many false
positives and some false negatives (see Table B-8 sections B and C,
sensitivity and efficiency of screening outcome "refer" figures).
The following table is a description of the characteristics of the children
used to obtain the Hit Rate data for the Brigance Early Screen. These
children were randomly selected from the Dade County Head Start program.
Table B-7Characteristics of Sample for Hit Rate Validity of Brigance
Ethnicity % Age % Sex %
African American 50% Three 33.3% Male 52%
Hispanic 25% Four 33.3% Female 48%
Haitian 24% Five 33.3%
White 1%
109
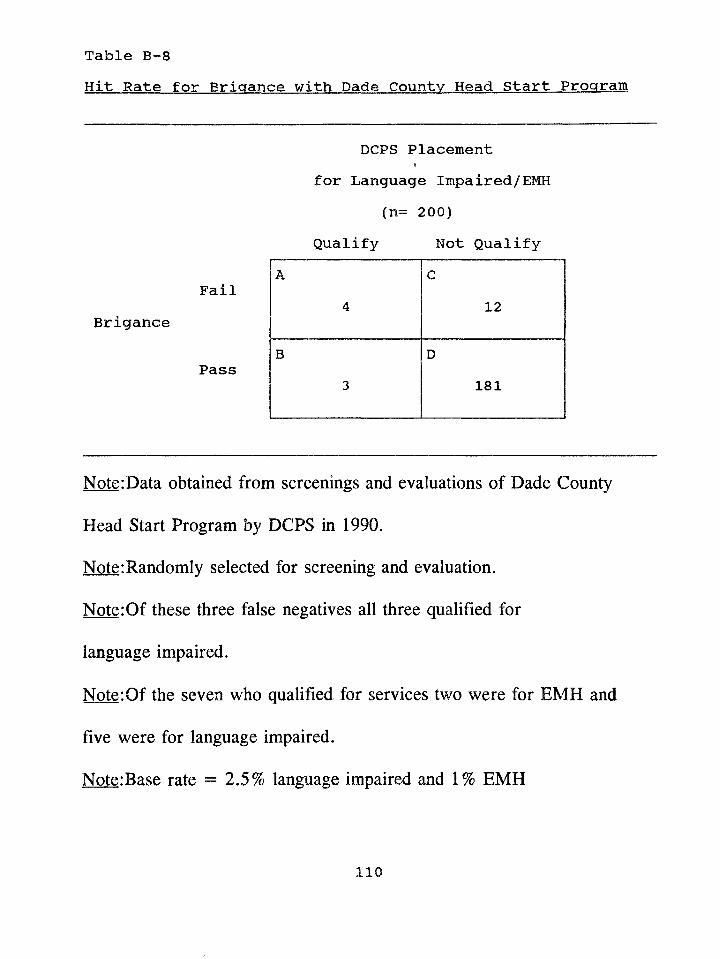
Hit Rate for Brigance with Dade County Head Start ProgramTable B-8
DCPS Placement for Language Impaired/EMH
(n= 200)Qualify Not Qualify
FailBrigance
Pass
Note:Data obtained from screenings and evaluations of Dade County
Head Start Program by DCPS in 1990.
Note:Randomly selected for screening and evaluation.
Note:Of these three false negatives all three qualified for
language impaired.
Note:Of the seven who qualified for services two were for EMH and
five were for language impaired.
Note:Base rate = 2.5% language impaired and 1% EMH
A4
C12
B3
D181
n o
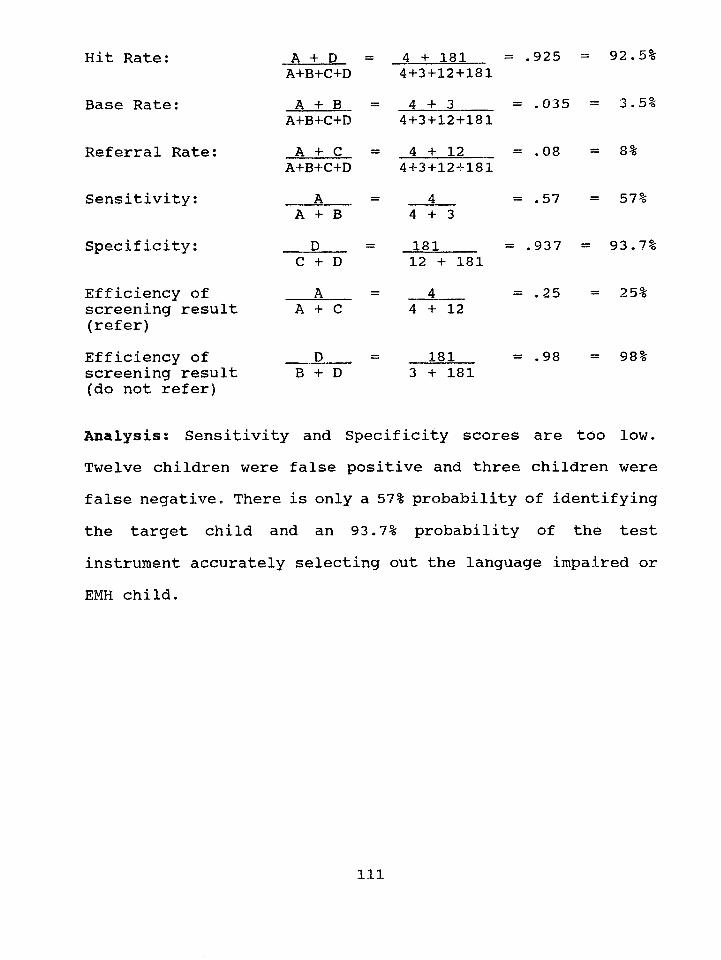
Hit Rate;
Base Rate:
Referral Rate:
Sensitivity:
Specificity;
Efficiency of screening result (refer)Efficiency of screening result (do not refer)
A + D A+B+C+DA + B
A+B+C+DA + C
A+B+C+D_ A _ A + B
DC + D A
A + C
B + D
4 + 181 4+3+12+1814 + 3
4+3+12+1814 + 12
4+3+12+181
= .925 =
= .035
= .08
= .574 + 3181 12 + 1814
4 + 12
181 3 + 181
= .937 =
= .25
= .98
92.5%
= 3.5%
= 8%
= 57%
93.7%
= 25%
= 98%
Analysisi Sensitivity and Specificity scores are too low. Twelve children were false positive and three children were false negative. There is only a 57% probability of identifying the target child and an 93.7% probability of the test instrument accurately selecting out the language impaired or EMH child.
Ill
APPENDIX C
The following is a compressed version of the Dade County Public
Schools procedural guidelines for the two handicapping conditions
considered in this study.
I. Language Impaired
A. Children below age 5.
1. There is a significant difference between language
performance and other developmental behaviors.
Significant difference is defined as greater than
one standard deviation or 30% or more difference
between language age scores and other developmental
behavior scores (e.g., mental age, fine motor, gross motor,
self-help, adaptive behavior).
or
2. There is a significant difference between receptive
and expressive language abilities. Significant
difference is defined as 30% or more difference
between receptive language age scores and expressive
language are scores.
112
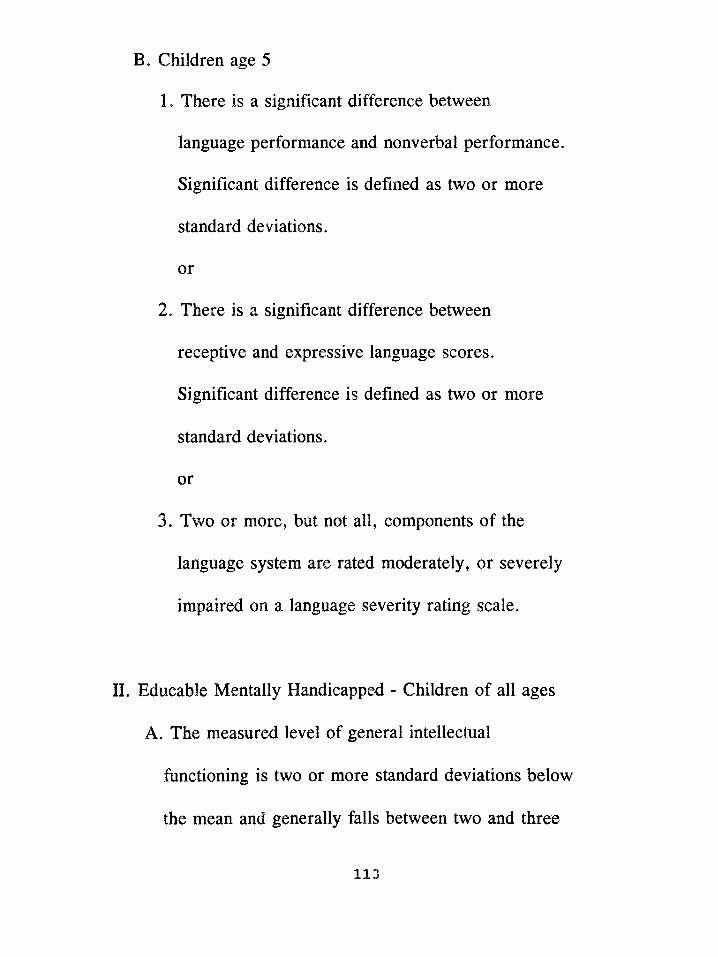
1. There is a significant difference between
language performance and nonverbal performance.
Significant difference is defined as two or more
standard deviations.
or
2. There is a significant difference between
receptive and expressive language scores.
Significant difference is defined as two or more
standard deviations.
or
3. Two or more, but not all, components of the
language system are rated moderately, or severely
impaired on a language severity rating scale.
II. Educable Mentally Handicapped - Children of all ages
A. The measured level of general intellectual
functioning is two or more standard deviations below
the mean and generally falls between two and three
B. Children age 5
113
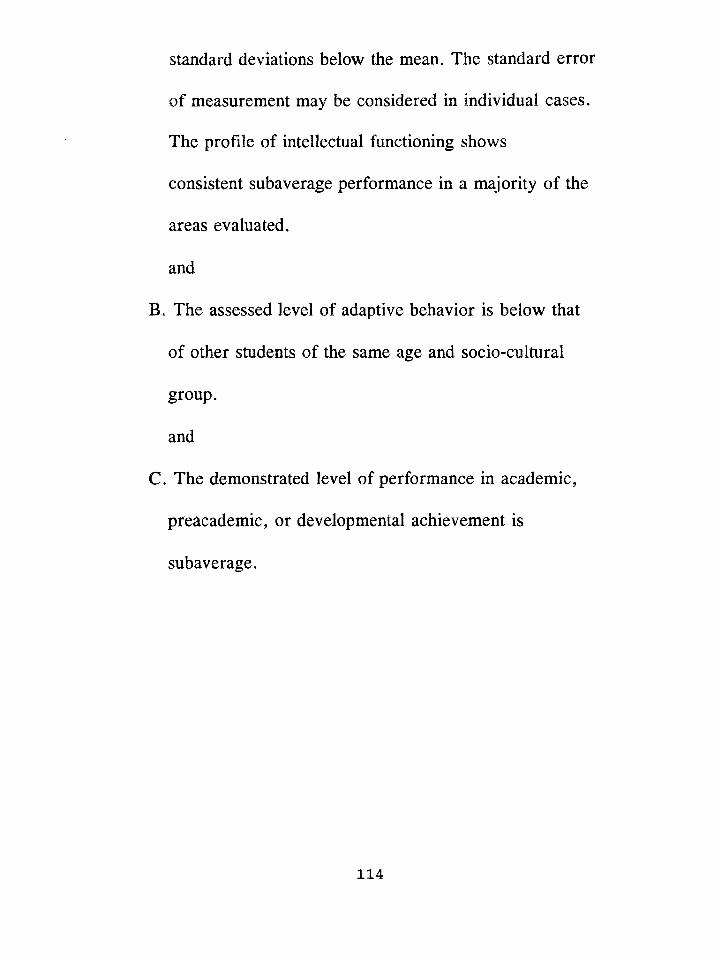
standard deviations below the mean. The standard error
of measurement may be considered in individual cases.
The profile of intellectual functioning shows
consistent subaverage performance in a majority of the
areas evaluated,
and
B. The assessed level of adaptive behavior is below that
of other students of the same age and socio-cultural
group.
and
C. The demonstrated level of performance in academic,
preacademic, or developmental achievement is
subaverage.
114
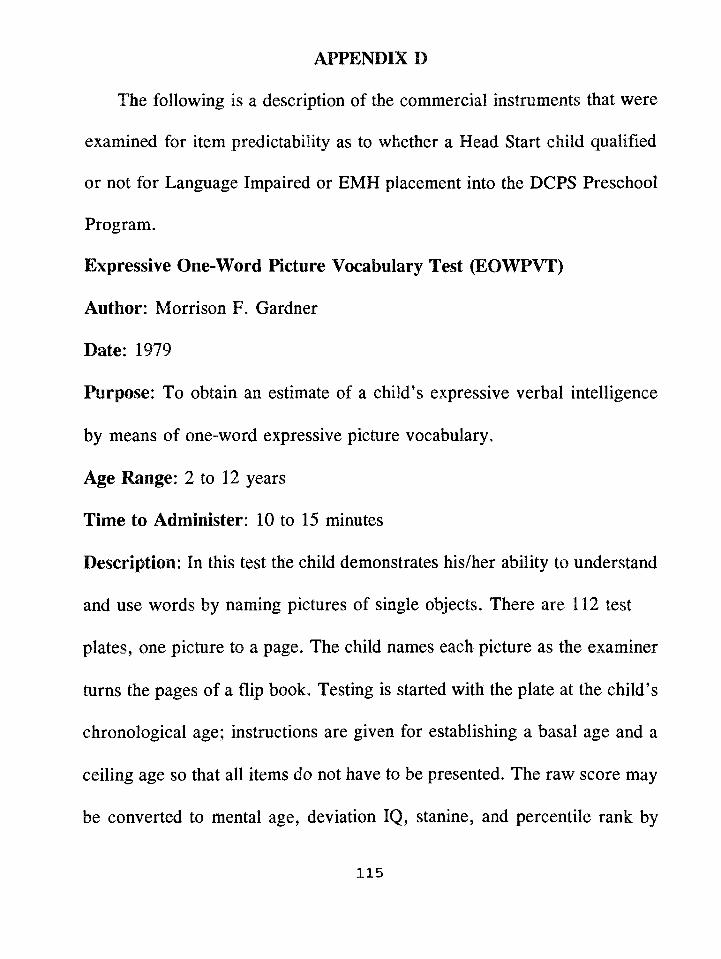
APPENDIX D
The following is a description of the commercial instruments that were
examined for item predictability as to whether a Head Start child qualified
or not for Language Impaired or EMH placement into the DCPS Preschool
Program.
Expressive One-W ord Picture Vocabulary Test (EOWPVT)
Author: Morrison F. Gardner
Date: 1979
Purpose: To obtain an estimate of a child's expressive verbal intelligence
by means of one-word expressive picture vocabulary.
Age Range: 2 to 12 years
Time to Administer: 10 to 15 minutes
Description: In this test the child demonstrates his/her ability to understand
and use words by naming pictures of single objects. There are 112 test
plates, one picture to a page. The child names each picture as the examiner
turns the pages of a flip book. Testing is started with the plate at the child's
chronological age; instructions are given for establishing a basal age and a
ceiling age so that all items do not have to be presented. The raw score may
be converted to mental age, deviation IQ, stanine, and percentile rank by
115
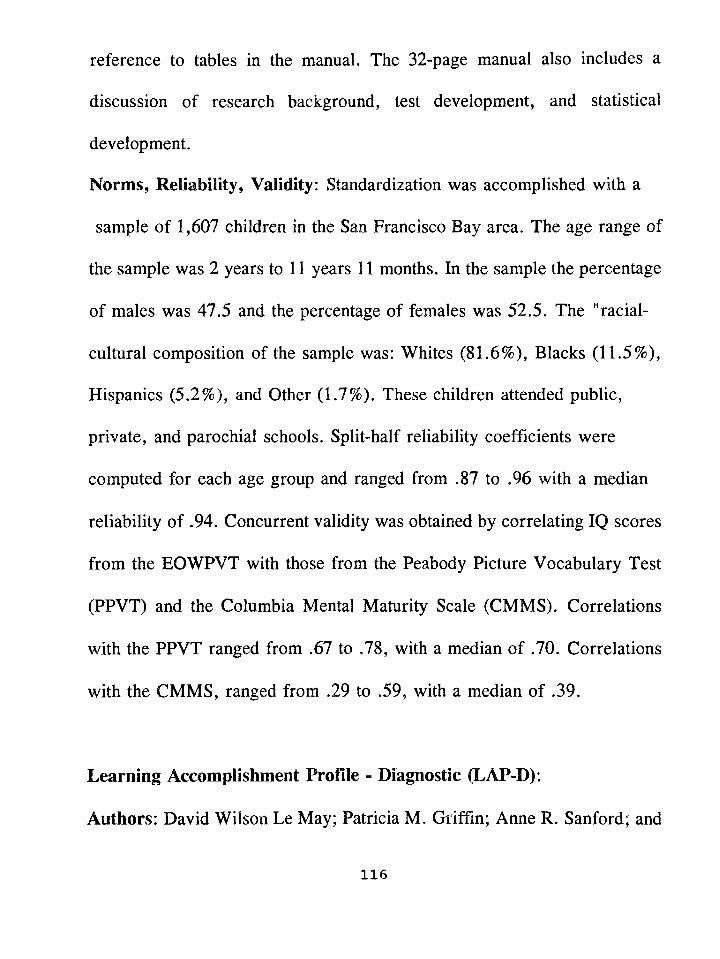
reference to tables in the manual. The 32-page manual also includes a
discussion of research background, test development, and statistical
development.
Norms, Reliability, Validity: Standardization was accomplished with a
sample of 1,607 children in the San Francisco Bay area. The age range of
the sample was 2 years to 11 years 11 months. In the sample the percentage
of males was 47.5 and the percentage of females was 52.5. The "racial-
cultural composition of the sample was: Whites (81.6%), Blacks (11.5%),
Hispanics (5.2%), and Other (1.7%). These children attended public,
private, and parochial schools. Split-half reliability coefficients were
computed for each age group and ranged from .87 to .96 with a median
reliability of .94. Concurrent validity was obtained by correlating IQ scores
from the EOWPVT with those from the Peabody Picture Vocabulary Test
(PPVT) and the Columbia Mental Maturity Scale (CMMS). Correlations
with the PPVT ranged from .67 to .78, with a median of .70. Correlations
with the CMMS, ranged from .29 to .59, with a median of .39.
Learning Accomplishment Profile - Diagnostic (LAP-D):
Authors: David Wilson Le May; Patricia M. Griffin; Anne R. Sanford; and
116
The Chapel Hill Training-Outreach Project, Chapel Hill, North Carolina.
The LAP-D was produced from funding by the Office of Child
Development and the Bureau of Education for the Handicapped,
Department of Health, Education, and Welfare.
Date: 1977
Purpose: To evaluate the child’s level of skill before entering an
instructional program, evaluate the child’s exit skills following an
instructional program, and validate the effectiveness of an instructional
program.
Age Range: 3 months to 72 months
Time to Administer: 45 minutes to one hour
Description: The LAP-D is a developmental skill diagnostic assessment
instrument based on the task analysis model. In this type of model, skill
development is considered a continuum, moving upward from fundamental
behaviors, to complex and learned behaviors. It was made available to the
public in 1977. The LAP-D measures the child’s developmental skill level
in five areas (each area has two subscales except Self-Help which has five).
The five areas and subscales with examples of tasks for children between the
ages of three years and five years are:
117
1)Fine Motor
A)Manipulation - string beads, complete puzzles (six & eight piece)
B)Writing - copy circle, trace diamond
2)Cognitive
A)Matching - match colors, patterns, and pictures
B)Counting - count by rote (1-3), recite numbers (1-10)
3)Language/Cognitive
A)Naming - Name three common objects, name pictures
B)Comprehension - point to pictures named, point to numbers named
4)Gross Motor
A)Body Movement - Jump, balance, run, skip
B)Object Movement - catch, kick, throw a ball
5)Self-Help
A)Eating
B)Dressing
C)Toileting
D)Grooming
E)Self-Direction
The LAP-D items in each subscale are task-analytically arranged in an
118
ascending order of difficulty. Each task Is listed with a corresponding
developmental age (e.g. Item: Names six body parts - 30 months). The tasks
and task-developmental age associations were obtained from and based on
cumulative research findings In the area of early childhood development by
Cattell (1950), Gesell (1940), Griffin (1975), Hammill (1974), Illg and
Ames (1955), Lillie (1975), and Sanford (1970). A developmental age score
for each subscale is arrived at by computing a basal (3 Items correct in a
row) and a celling (3 out of 5 Items Incorrect). The total number of items
Incorrect is subtracted from the total number of correct Items. The number
computed by this mathematical process Is considered the total number of
Items successfully completed In the subscale. This total number Is then
converted to a developmental age score, for each subscale, by using a
developmental profile scoring sheet.
Norm s, Reliability, Validity: The reliability of the LAP-D was
accomplished with the test-retest procedure. Correlation coefficients ranged
from .82 to .98. Inter-rater reliability coefficients were obtained by using
three examiners and ranged from .76 to .98. Validity data is not listed In the
manual.
119
Leiter International Performance Scale (LIPS) (A rthur Adaptation):
Author: Grace Arthur
Date: 1980
Purpose: To measure nonverbal intelligence
Age Range: 3 thru 7.99 years
Time to Administer: 30 minutes
Description: The Leiter is a point scale which yields a mental age and an
I.Q. It does not require verbalization on the part of the examiner or
respondent and it does not have time limits. The Leiter contains sixty items.
The materials consist of a wooden response frame with an adjustable card
holder. All tests are administered by attaching the appropriate picture card
to the frame. Directions are pantomimed. The child chooses the matching
blocks and Inserts them into the frame in an appropriate slot. The types of
tasks range from matching of colors and forms to completion of patterns,
analogous designs, classification of objects.
Norm s, Reliability, Validity: The test was standardized on 289 children.
These children were all from "middle class" America. No validity or
reliability data is available in the manual.
120
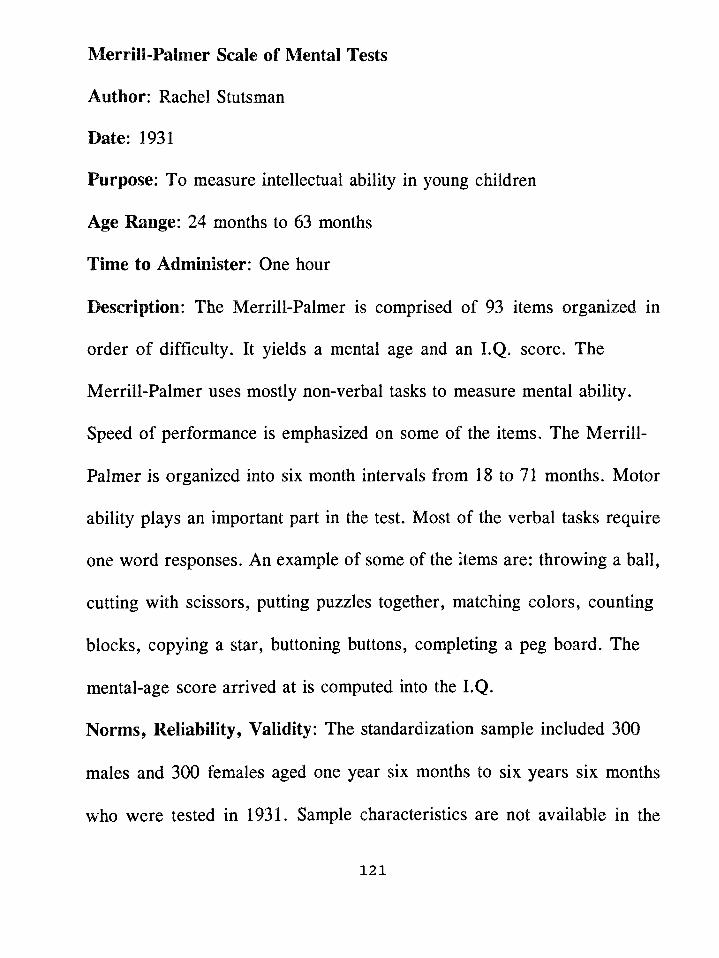
Merrill-Palmer Scale of Mental Tests
Author: Rachel Stutsman
Date: 1931
Purpose: To measure intellectual ability in young children
Age Range: 24 months to 63 months
Time to Administer: One hour
Description: The Merrill-Palmer is comprised of 93 items organized in
order of difficulty. It yields a mental age and an I.Q. score. The
Merrill-Palmer uses mostly non-verbal tasks to measure mental ability.
Speed of performance is emphasized on some of the items. The Merrill-
Palmer is organized into six month intervals from 18 to 71 months. Motor
ability plays an important part in the test. Most of the verbal tasks require
one word responses. An example of some of the items are: throwing a ball,
cutting with scissors, putting puzzles together, matching colors, counting
blocks, copying a star, buttoning buttons, completing a peg board. The
mental-age score arrived at is computed into the I.Q.
Norm s, Reliability, Validity: The standardization sample included 300
males and 300 females aged one year six months to six years six months
who were tested in 1931. Sample characteristics are not available in the
121
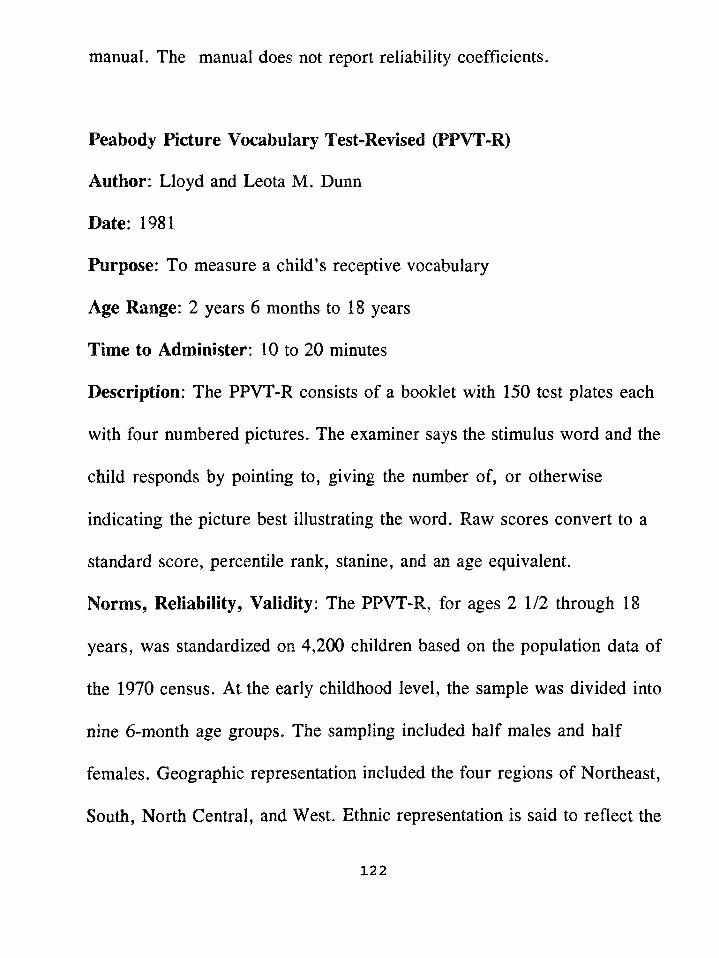
manual. The manual does not report reliability coefficients.
Peabody Picture Vocabulary Test-Revised (PPVT-R)
Author: Lloyd and Leota M. Dunn
Date: 1981
Purpose: To measure a child’s receptive vocabulary
Age Range: 2 years 6 months to 18 years
Time to Administer: 10 to 20 minutes
Description: The PPVT-R consists of a booklet with 150 test plates each
with four numbered pictures. The examiner says the stimulus word and the
child responds by pointing to, giving the number of, or otherwise
indicating the picture best illustrating the word. Raw scores convert to a
standard score, percentile rank, stanine, and an age equivalent.
Norm s, Reliability, Validity: The PPVT-R, for ages 2 1/2 through 18
years, was standardized on 4,200 children based on the population data of
the 1970 census. At the early childhood level, the sample was divided into
nine 6-month age groups. The sampling included half males and half
females. Geographic representation included the four regions of Northeast,
South, North Central, and West. Ethnic representation is said to reflect the
122
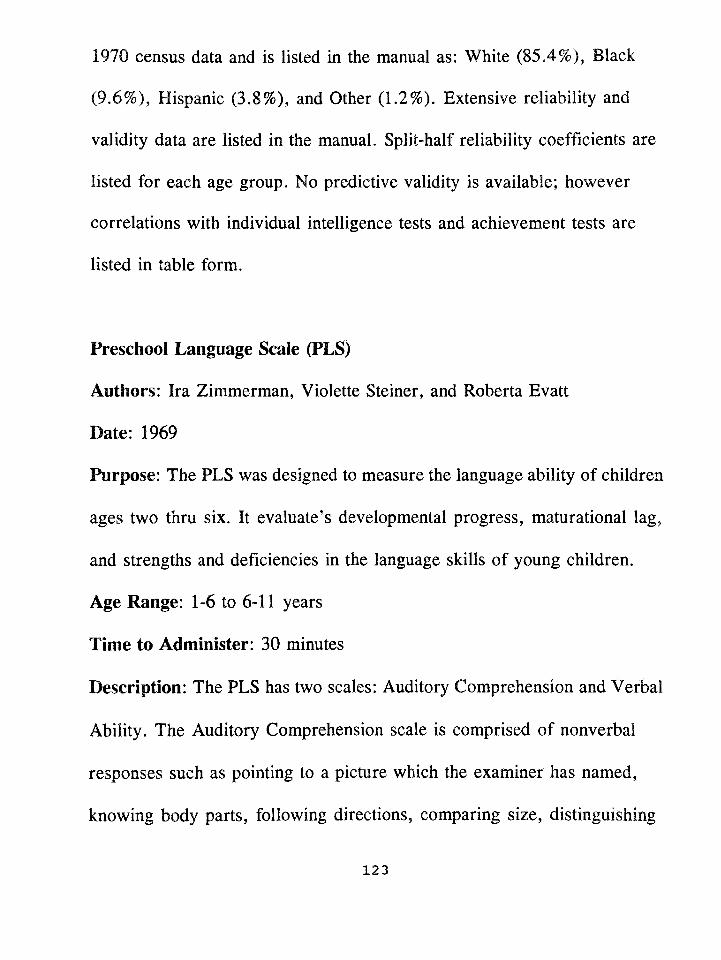
1970 census data and is listed in the manual as: White (85.4%), Black
(9.6%), Hispanic (3.8%), and Other (1.2%). Extensive reliability and
validity data are listed in the manual. Split-half reliability coefficients are
listed for each age group. No predictive validity is available; however
correlations with individual intelligence tests and achievement tests are
listed in table form.
Preschool Language Scale (PLS)
Authors: Ira Zimmerman, Violette Steiner, and Roberta Evatt
Bate: 1969
Purpose: The PLS was designed to measure the language ability of children
ages two thru six. It evaluate’s developmental progress, maturational lag,
and strengths and deficiencies in the language skills of young children.
Age Range: 1-6 to 6-11 years
Time to Administer: 30 minutes
Description: The PLS has two scales: Auditory Comprehension and Verbal
Ability. The Auditory Comprehension scale is comprised of nonverbal
responses such as pointing to a picture which the examiner has named,
knowing body parts, following directions, comparing size, distinguishing
123
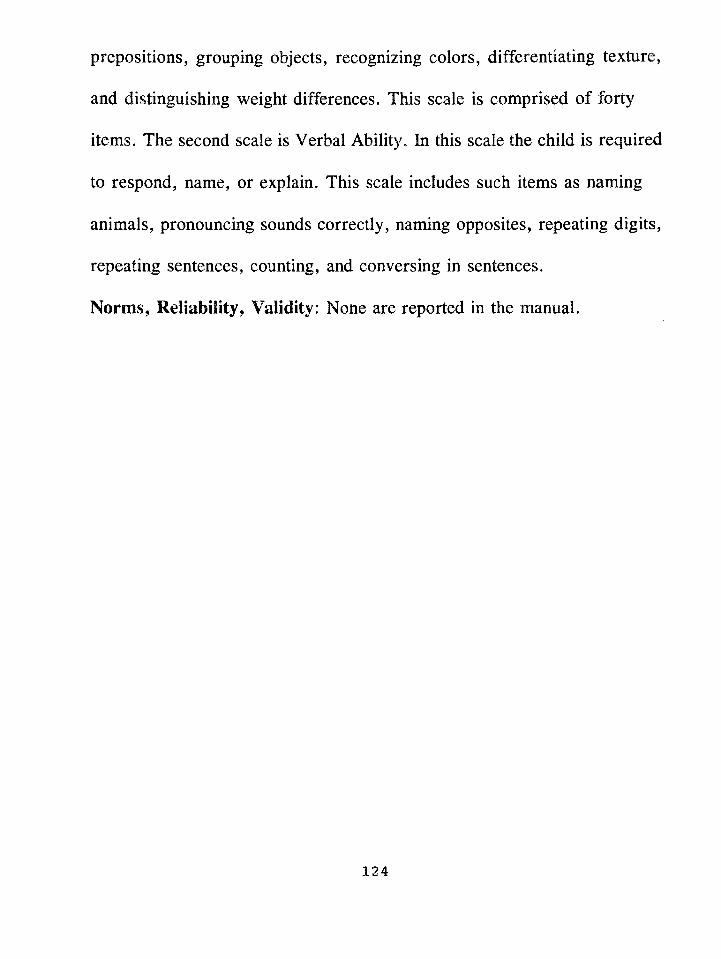
prepositions, grouping objects, recognizing colors, differentiating texture,
and distinguishing weight differences. This scale is comprised of forty
items. The second scale is Verbal Ability. In this scale the child is required
to respond, name, or explain. This scale includes such items as naming
animals, pronouncing sounds correctly, naming opposites, repeating digits,
repeating sentences, counting, and conversing in sentences.
Norms, Reliability, Validity: None are reported in the manual.
124
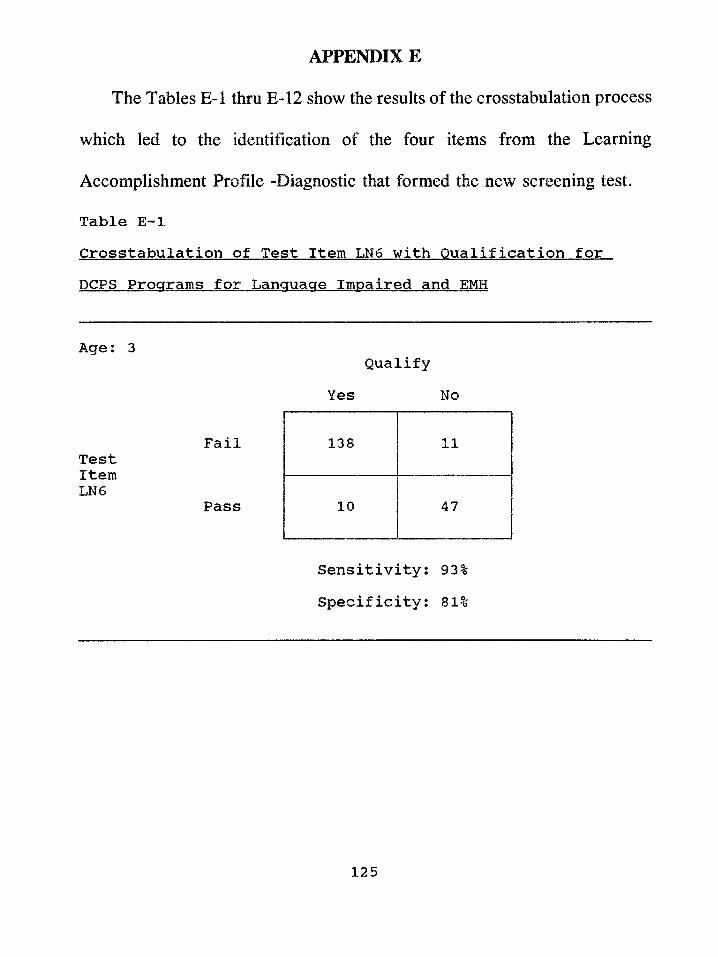
APPENDIX E
The Tables E-l thru E-12 show the results of the crosstabulation process
which led to the identification of the four items from the Learning
Accomplishment Profile -Diagnostic that formed the new screening test.
Table E-lCrosstabulation of Test Item LN6 with Qualification for DCPS Programs for Language Impaired and EMH
Age: 3
FailTestItemLN6
Pass
Sensitivity: 93% Specificity: 81%
Qualify Yes No
138 11
10 47
125
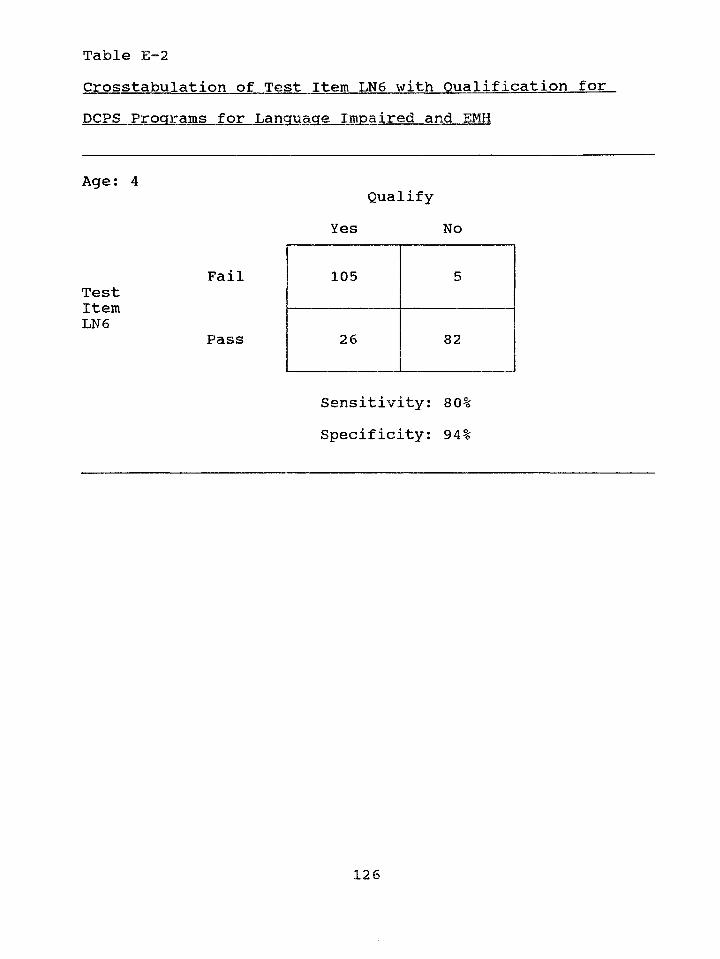
Table E-2Crosstabulation of Test Item LN6 with Qualification forDCPS Programs for Language Impaired and EMH
Age; 4
FailTestItemLN6
Pass
Sensitivity: 80% Specificity; 94%
Qualify Yes No
105 5
26 82
1 O ̂ J L Z D
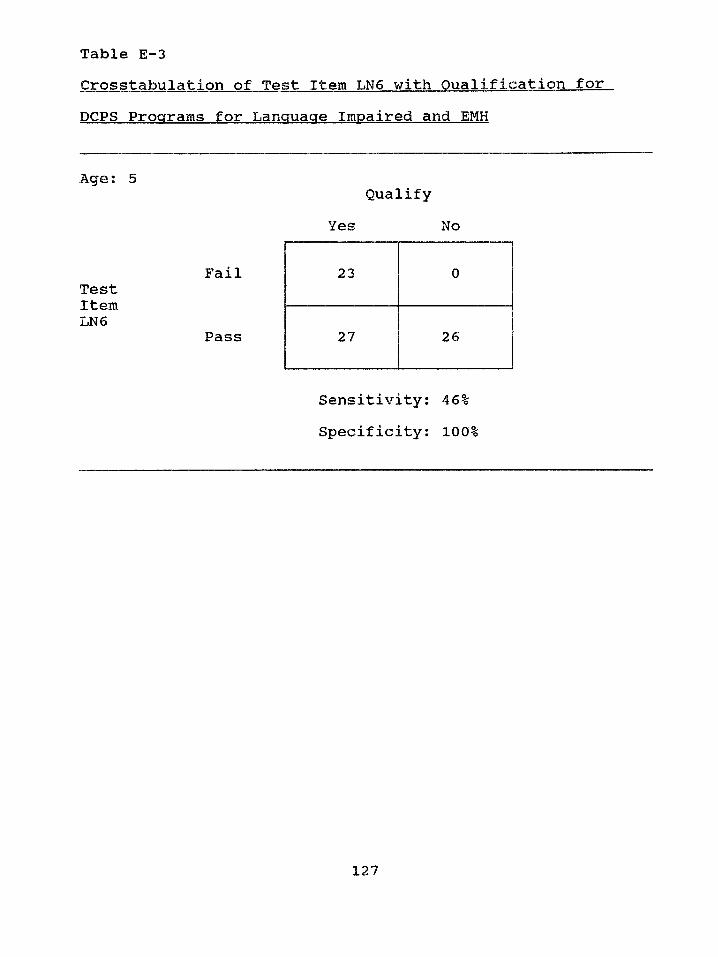
Table E-3Crosstabulation of Test Item LN6 with Qualification forDCPS Programs for Language Impaired and EMH
Age: 5
FailTestItemLN6
Pass
Specificity: 100%
Qualify Yes No
23 0
27 26
Sensitivity: 46%
127
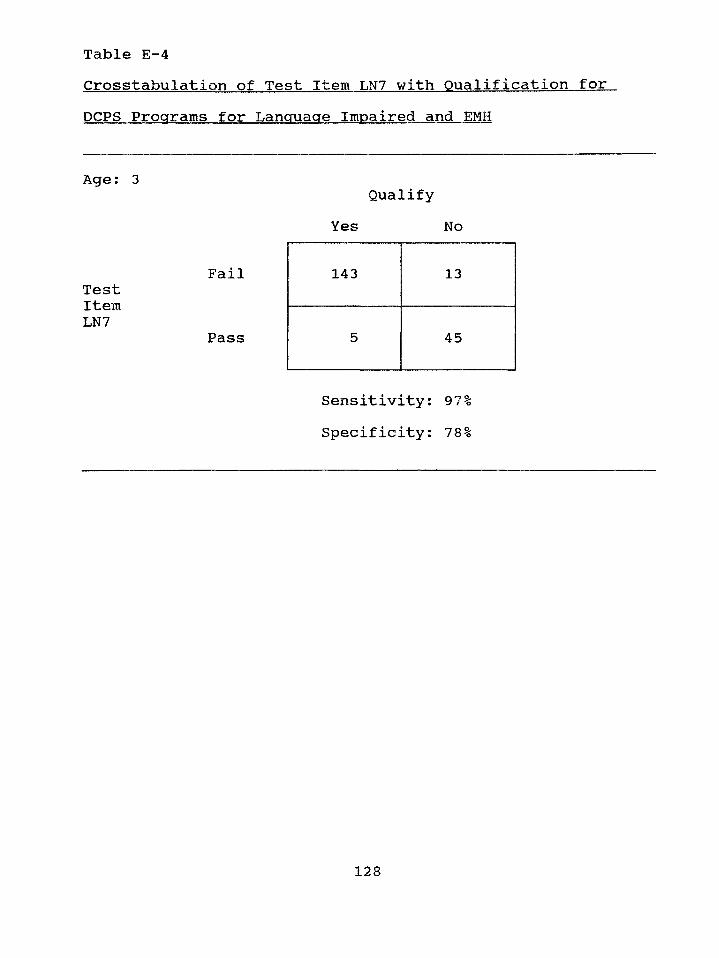
Table E-4Crosstabulation of Test Item LN7 with Qualification for.DCPS Programs for Language Impaired and EMH
Age: 3
FailTestItemLN7
Pass
Sensitivity: 97% Specificity: 78%
Qualify Yes No
143 13
5 45
128
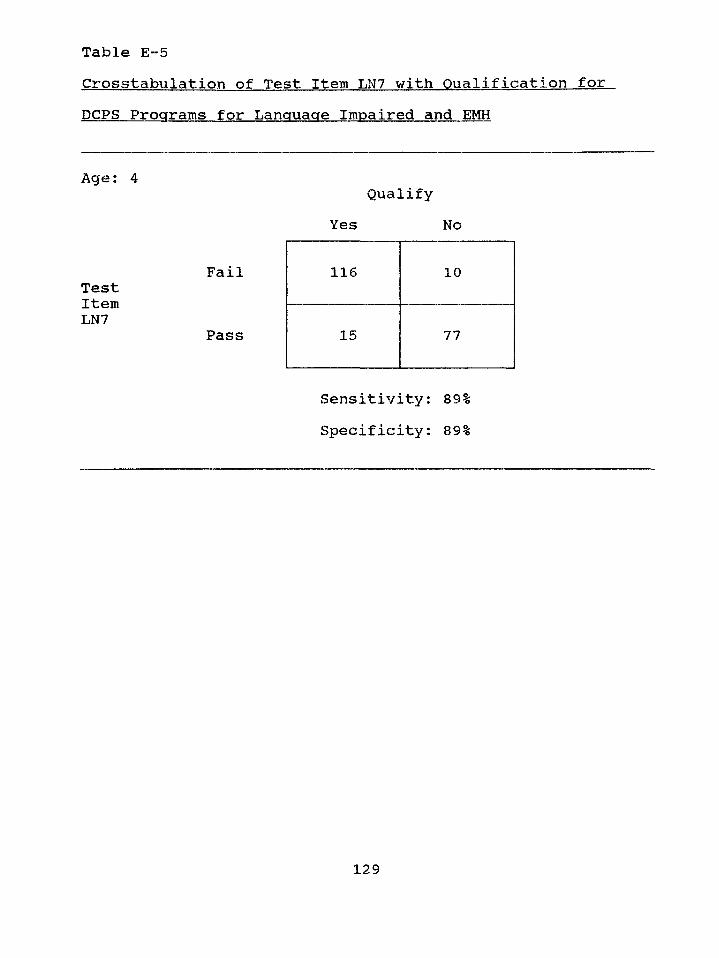
Table E-5Crosstabulation of Test Item LN7 with Qualification forDCPS Programs for Language Impaired and EMH
Age: 4
FailTestItemLN7
Pass
Sensitivity: 89% Specificity: 89%
Qualify Yes No
116 10
15 77
129
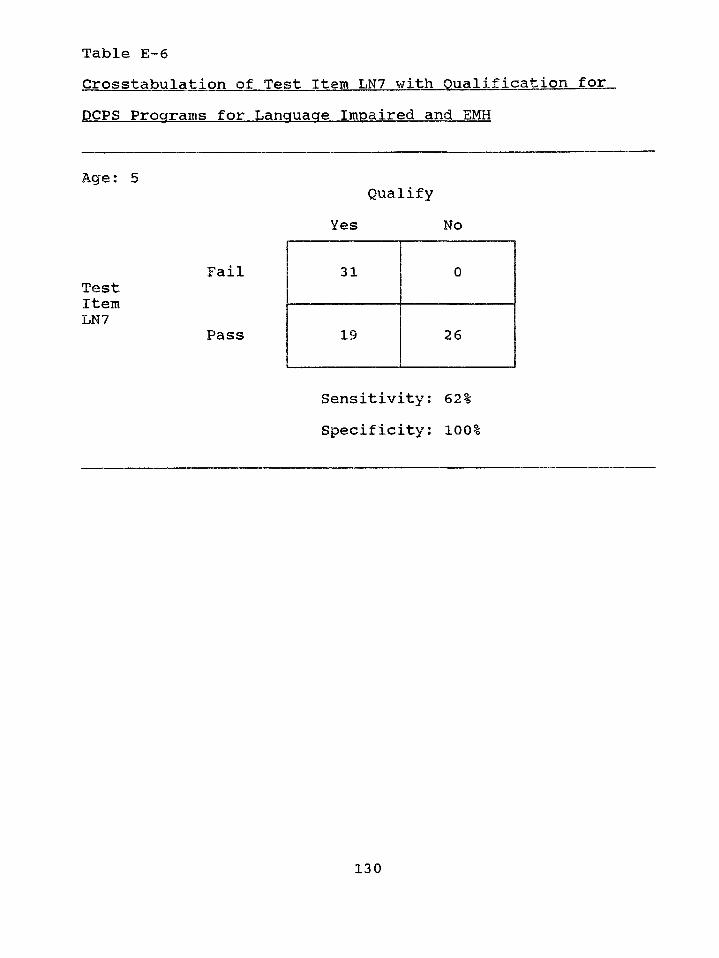
Table E—6Crosstabulation of Test Item LN7 with Qualification for DCPS Programs for Language Impaired and EMH
Age: 5Qualify
Yes No
FailTestItemLN7
Pass
Sensitivity: 62% Specificity: 100%
31 0
19 26
130
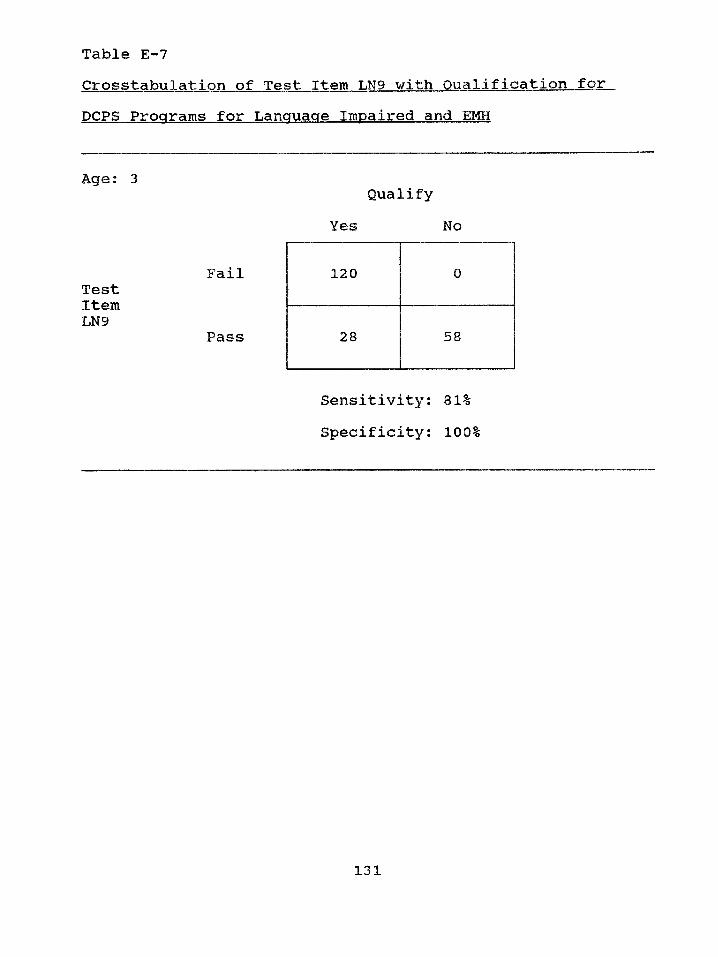
Table E-7Crosstabulation of Test Item LN9 with Qualification for.DCPS Programs for Language Impaired and EMH
Age: 3
FailTestItemLN9
Pass
Sensitivity: 81% Specificity: 100%
Qualify Yes No
120 0
28 58
131
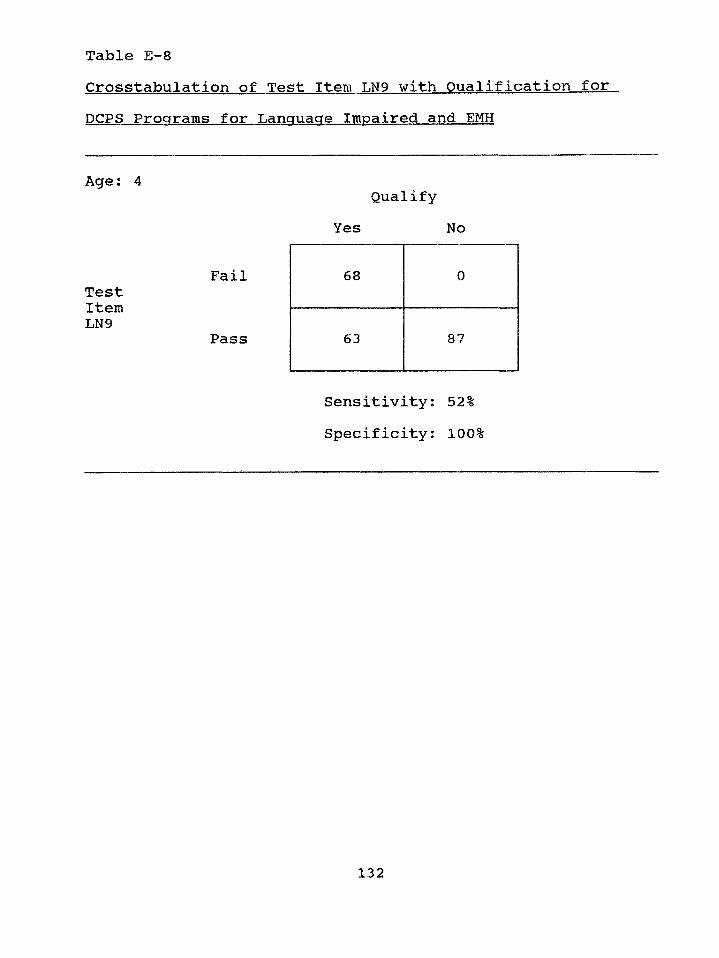
Table E-8Crosstabulation of Test Item LN9 with Qualification forDCPS Programs for Language Impaired and EMH
Age: 4Qualify
Yes No
FailTestItemLN9
Pass
Sensitivity; 52% Specificity: 100%
68 0
63 87
132

Table E—9Crosstabulation of Test Item LN9 with Qualification forDCPS Programs for Language Impaired and EMH
Age: 5Qualify
Yes No
FailTestItemLN9
Pass
Sensitivity: 66% Specificity: 100%
20 0
30 26
13 3
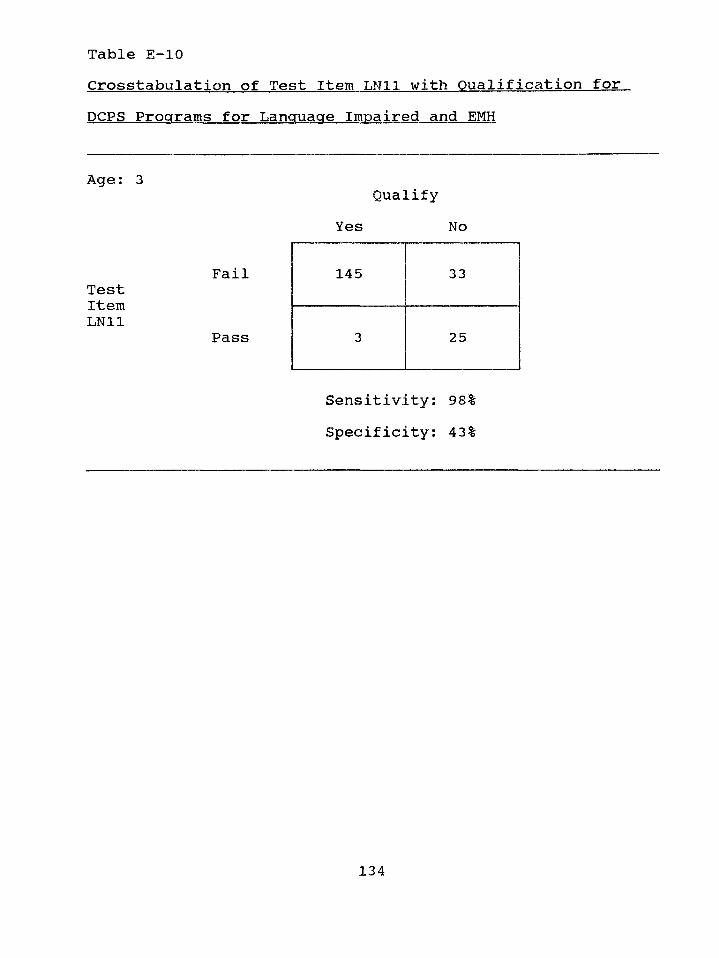
Table E-10Crosstabulation of Test Item LN11 with Qualification forDCPS Programs for Language Impaired and EMH
Age: 3Qualify
Yes No
FailTestItemLN11
Pass
Sensitivity: 98% Specificity: 43%
145 33
3 25
134
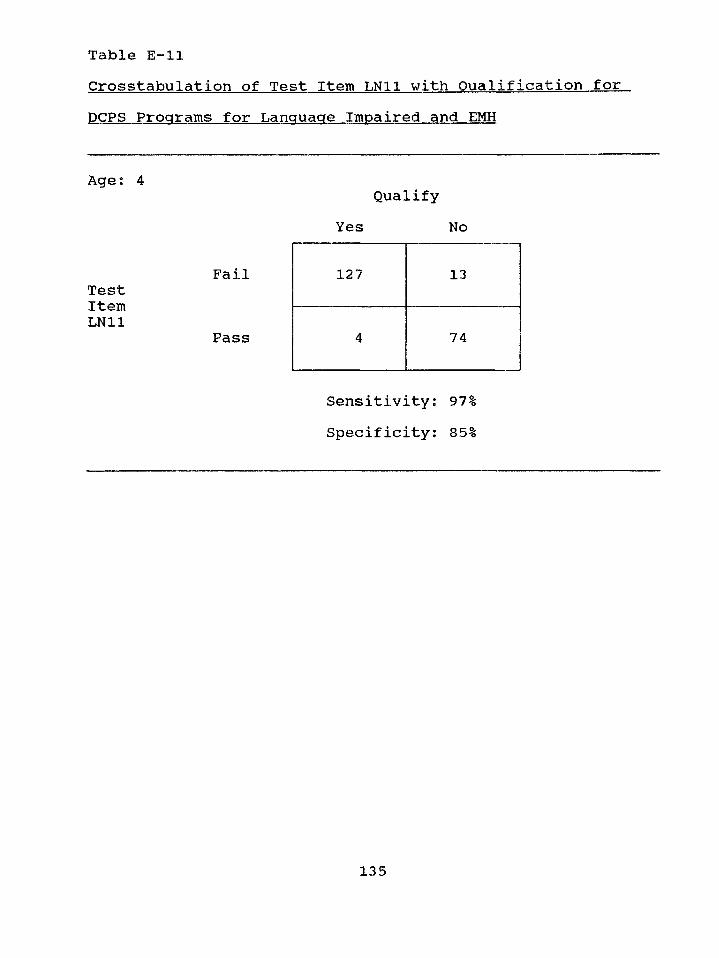
Table E-llCrosstabulation of Test Item LN11 with Qualification forDCPS Programs for Language Impaired and. EMH
Age: 4Qualify
Yes No
FailTestItemLN11
Pass
Sensitivity: 97% Specificity: 85%
127 13
4 74
135
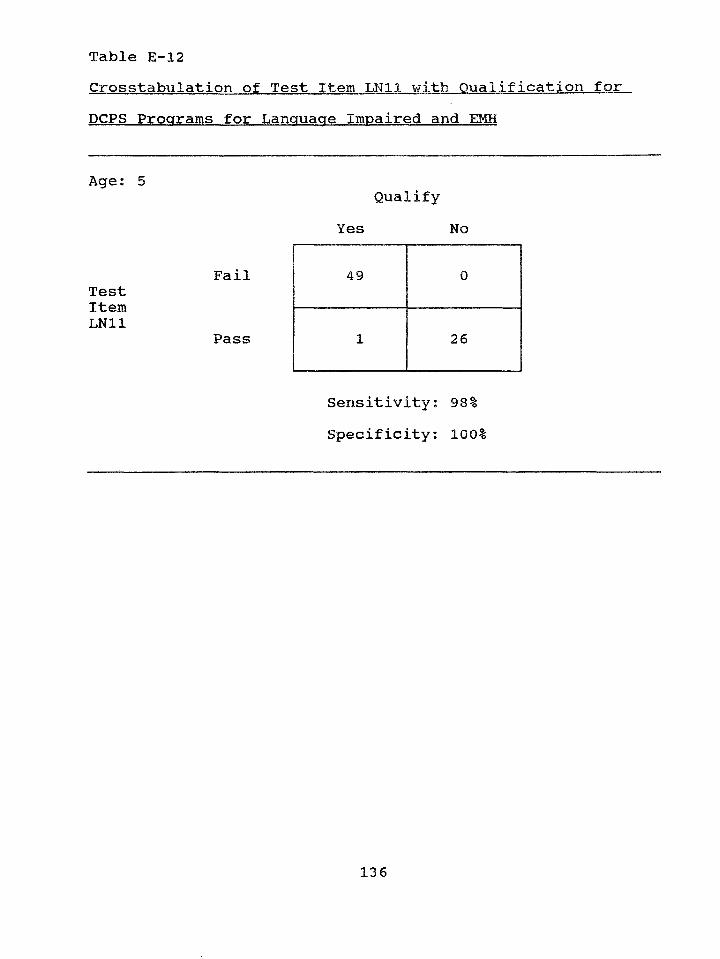
Table E-12Crosstabulation of Test Item LN11 with Qualification forDCPS Programs for Language Impaired and EMH
Age; 5
FailTestItemLN11
Pass
Sensitivity: 98% Specificity: 100%
Qualify Yes No
49 0
1 26
136
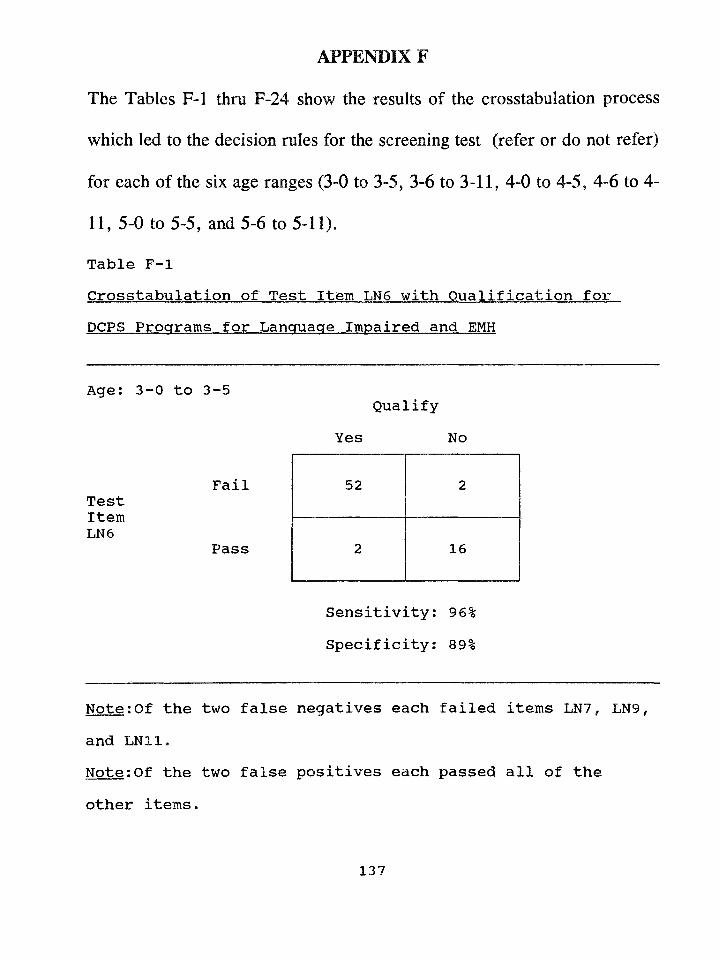
APPENDIX F
The Tables F-l thru F-24 show the results of the crosstabulation process
which led to the decision rules for the screening test (refer or do not refer)
for each of the six age ranges (3-0 to 3-5, 3-6 to 3-11, 4-0 to 4-5, 4-6 to 4-
11, 5-0 to 5-5, and 5-6 to 5-11).
Table F-lCrosstabulation of Test Item LN6 with Qualification for DCPS Programs for Language Impaired and EMH
Age: 3-0 to 3-5
FailTestItemLN6
Pass
Note:Of the two false negatives each failed items LN7, LN9, and LN11.Note:Of the two false positives each passed all of the
other items.
QualifyYes No
52 2
2 16
Sensitivity: 96% Specificity: 89%
137
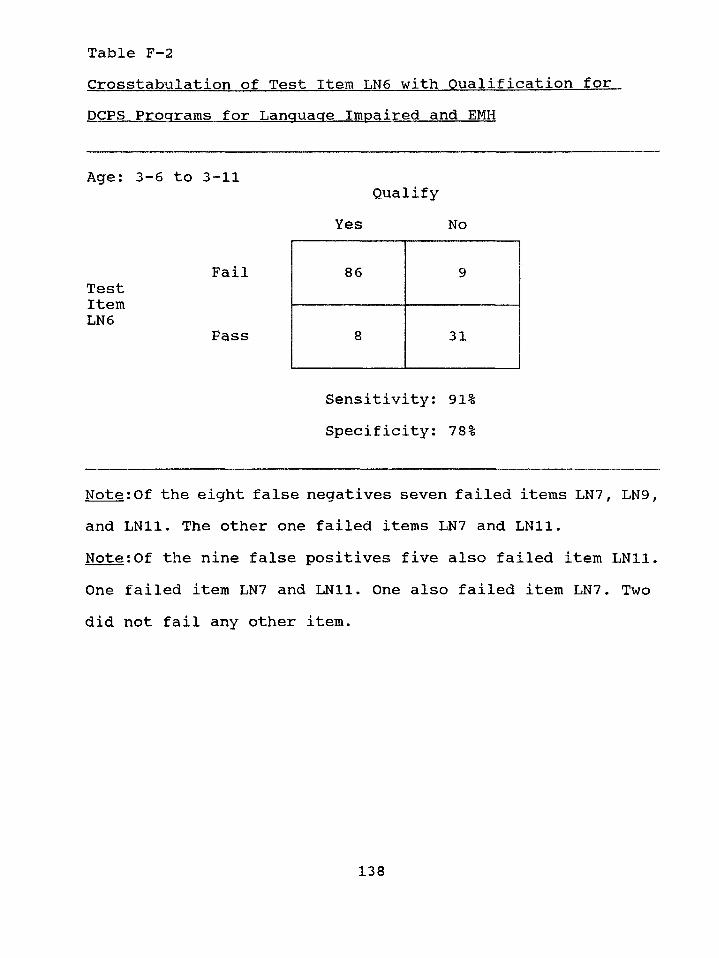
Table F-2Crosstabulation of Test Item LN6 with Qualification forDCPS Programs for Language Impaired and EMH
Age: 3-6 to 3-11
FailTestItemLN6
Pass
Note:Of the eight false negatives seven failed items LN7, LN9, and LN11. The other one failed items LN7 and LN11.Note:Of the nine false positives five also failed item LN11. One failed item LN7 and LN11. One also failed item LN7. Two did not fail any other item.
QualifyYes No
86 9
8 31
Sensitivity: 91% Specificity: 78%
138
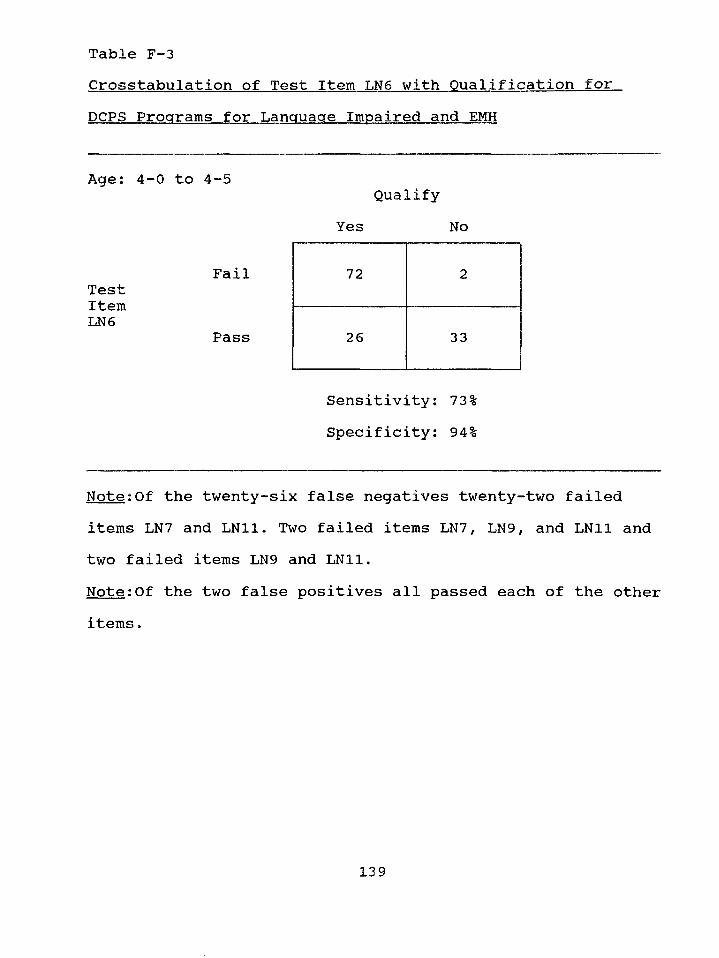
Table F-3Crosstabulation of Test Item LN6 with Qualification forDCPS Programs for Language Impaired and EMH
Age: 4-0 to 4-5
FailTestItemLN6
Pass
Note:Of the twenty-six false negatives twenty-two failed items LN7 and LN11. Two failed items LN7, LN9, and LN11 and two failed items LN9 and LN11.Note:Of the two false positives all passed each of the other items.
QualifyYes No
72 2
26 33
Sensitivity: 73% Specificity: 94%
139
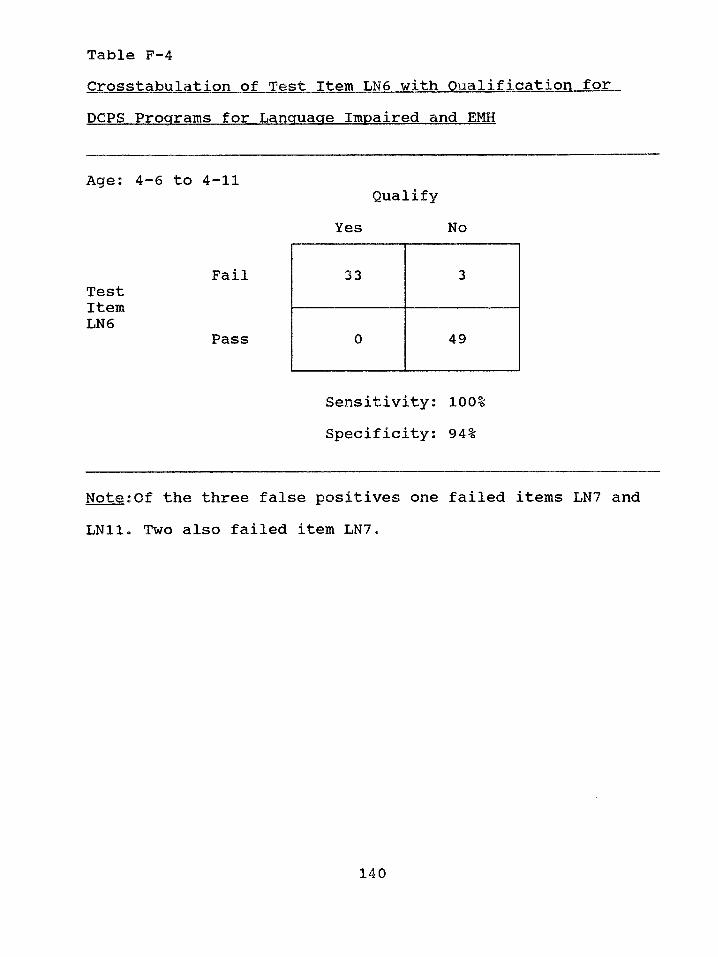
Table F-4Crosstabulation of Test Item LN6 with Qualification forDCPS Programs for Language Impaired and EMH
Age: 4-6 to 4-11
FailTestItemLN6
Pass
Note:Of the three false positives one failed items LN7 and LN11. Two also failed item LN7.
QualifyYes No
33 3
0 49
Sensitivity: 100% Specificity: 94%
140
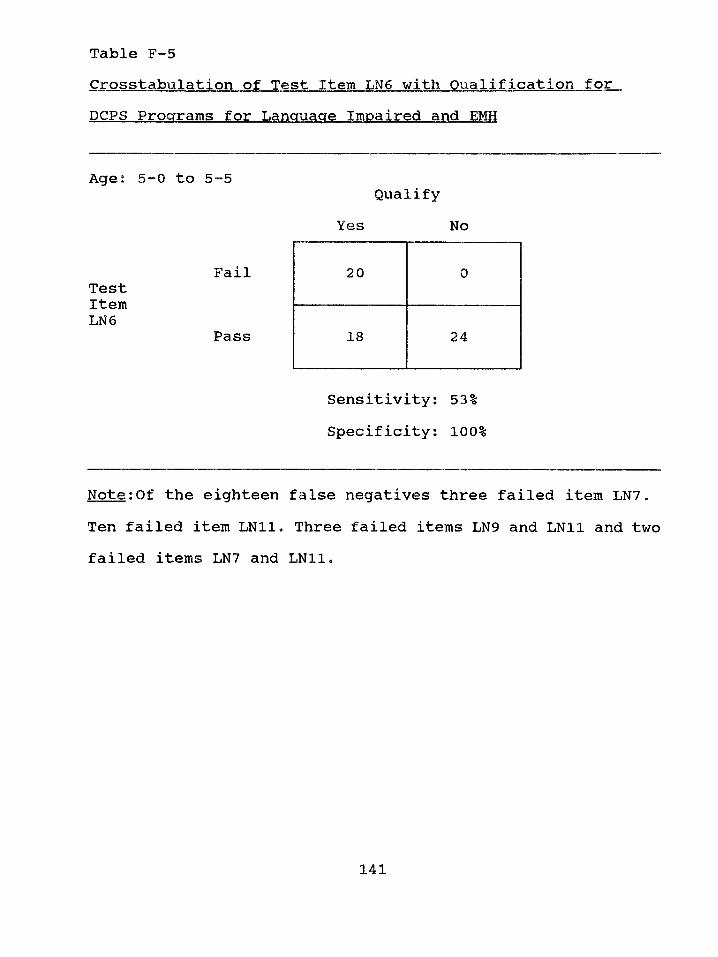
Table F-5Crosstabulation of Test Item LN6 with Qualification forDCPS Programs for Language Impaired and EMH
Age: 5-0 to 5-5
FailTestItemLN6
Pass
Note:Of the eighteen false negatives three failed item LN7. Ten failed item LN11. Three failed items LN9 and LN11 and two failed items LN7 and LN11.
QualifyYes No
20 0
18 24
Sensitivity: 53% Specificity: 100%
141
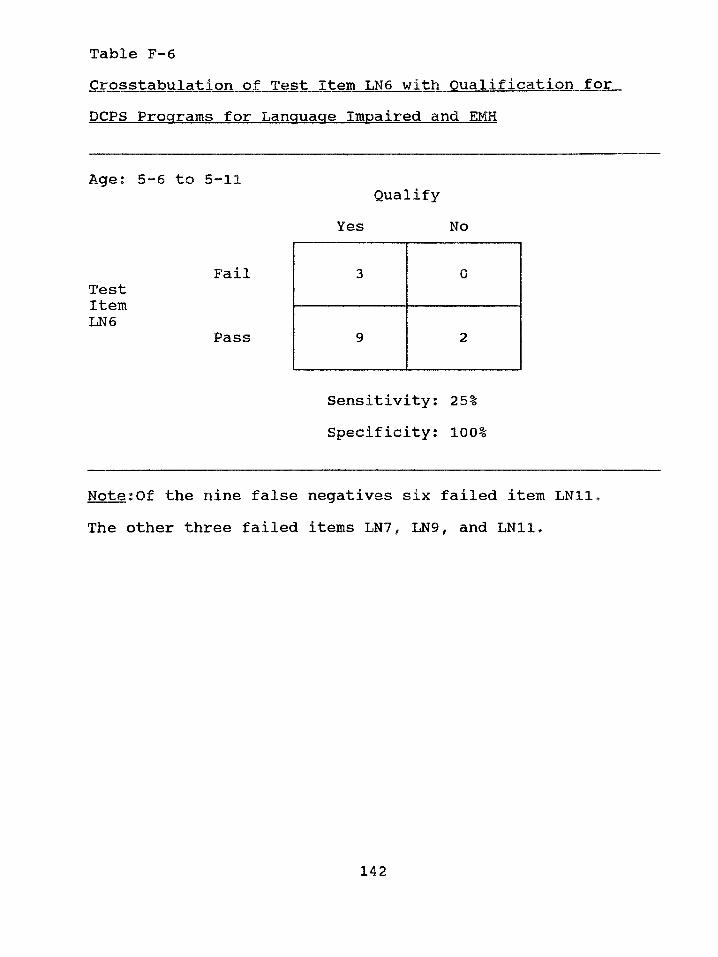
Table F-6Crosstabulation of Test Item LN6 with Qualification forDCPS Programs for Language Impaired and EMH
Age; 5-6 to 5-11
FailTestItemLN6
Pass
Note;Of the nine false negatives six failed item LN11. The other three failed items LN7, LN9, and LN11.
QualifyYes No
3 0
9 2
Sensitivity; 25% Specificity; 100%
142
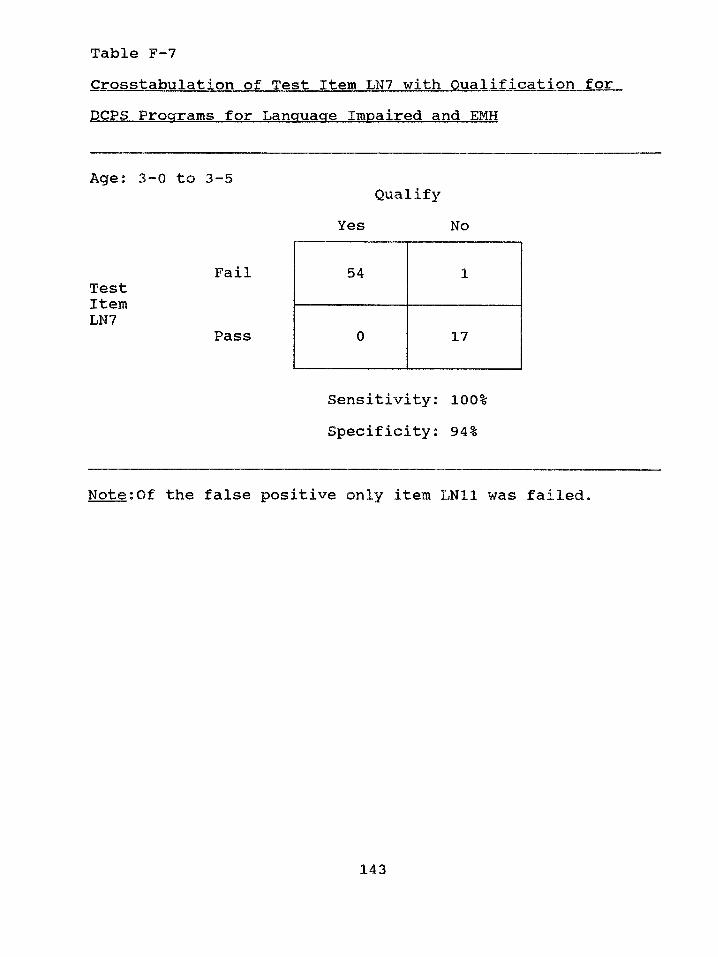
Table F-7
Crosstabulation of Test Item LN7 with Qualification forDCPS Programs for Language Impaired and EMH
Age: 3-0 to 3-5
FailTestItemLN7
Pass
Note:Of the false positive only item LN11 was failed*
QualifyYes No
54 1
0 17
Sensitivity: 100% Specificity: 94%
143
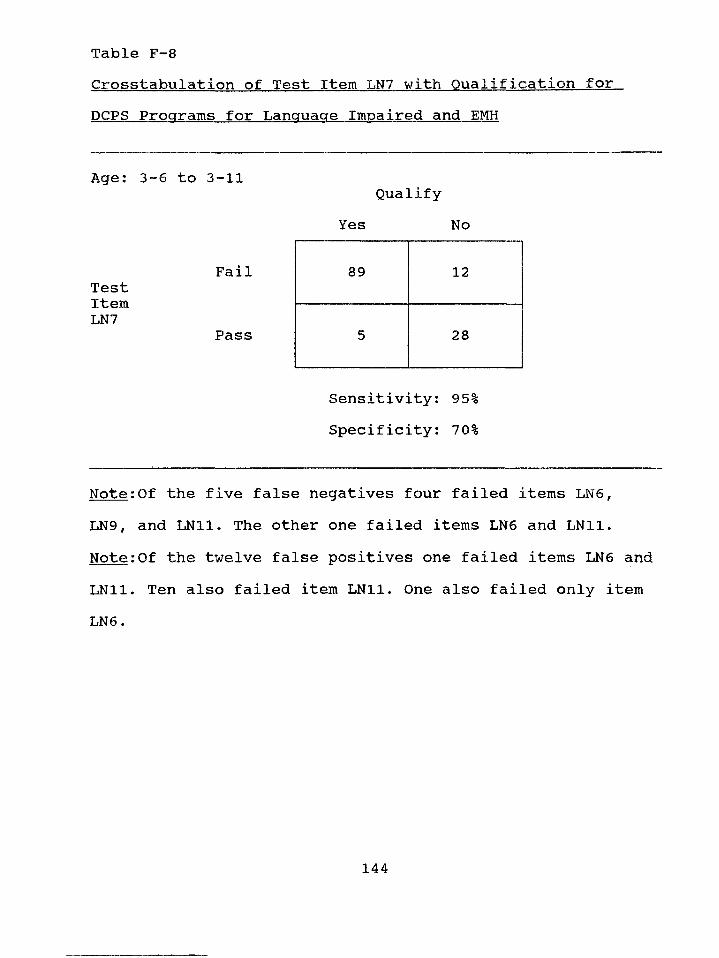
Table F-8Crosstabulation of Test Item LN7 with Qualification forDCPS Programs for Language Impaired and EMH
Age: 3-6 to 3-11
FailTestItemLN7
Pass
Note:Of the five false negatives four failed items LN6,LN9 f and LN11. The other one failed items LN6 and LN11. Note:Of the twelve false positives one failed items LN6 and LN11. Ten also failed item LN11. One also failed only item LN6.
QualifyYes No
89 12
5 28
Sensitivity: 95% Specificity: 70%
144
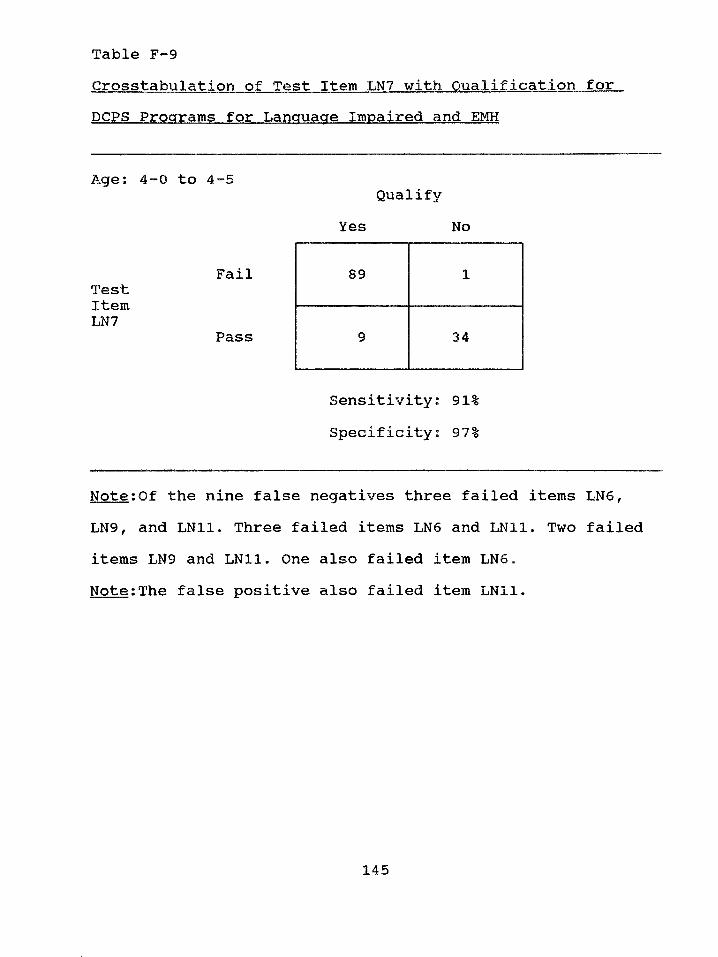
Table F-9Crosstabulation of Test Item LN7 with Qualification forDCPS Programs for Language Impaired and EMH
Age: 4—0 to 4—5
FailTestItemLN7
Pass
Note:Of the nine false negatives three failed items LN6 , LN9, and LN11. Three failed items LN6 and LN11. Two failed items LN9 and LN11. One also failed item LN6 .Note:The false positive also failed item LN11.
QualifyYes No
89 1
9 34
Sensitivity: 91% Speclflclty^« 97-s
145
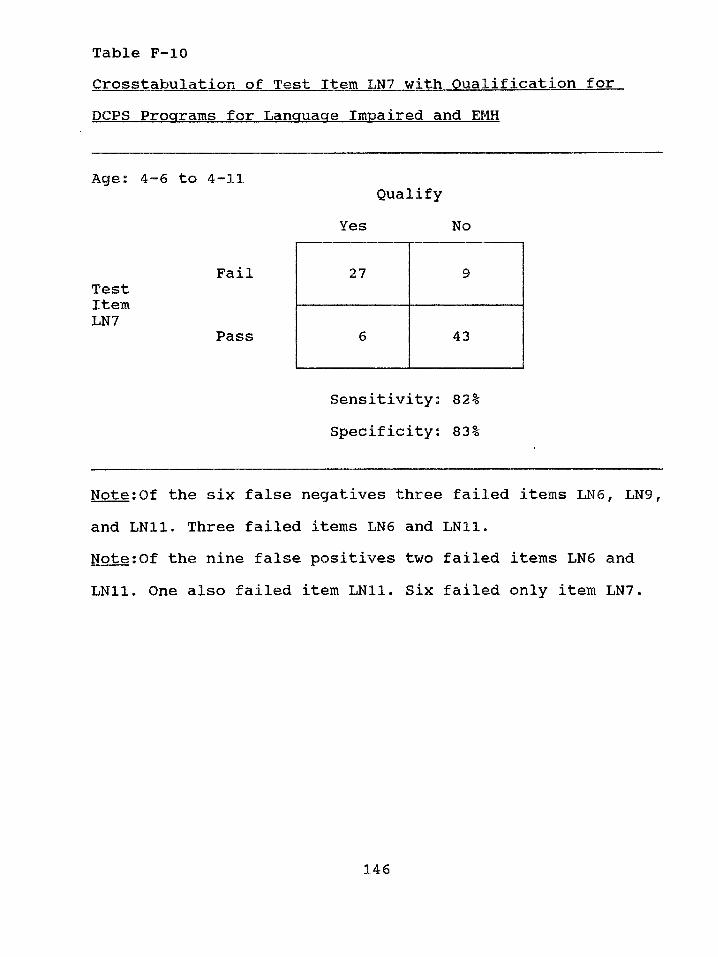
Table F-10Crosstabulation of Test Item LN7 with Qualification forDCPS Programs for Language Impaired and EMH
Age: 4-6 to 4-11
FailTestItemLN7
Pass
Note:Of the six false negatives three failed items LN6 , LN9, and LN11. Three failed items LN6 and LN11.Note:Of the nine false positives two failed items LN6 and LN11. One also failed item LN11. Six failed only item LN7.
QualifyYes No
2 7 9
6 43
Sensitivity: 82% Specificity: 83%
146
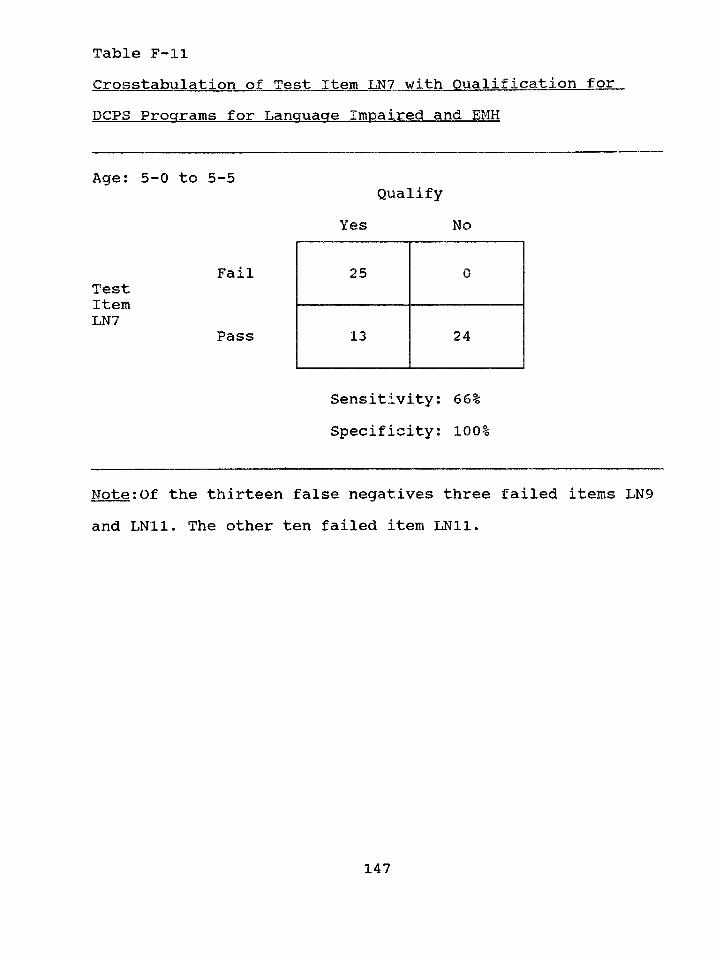
Table F-llCrosstabulation of Test Item LN7 with Qualification forDCPS Programs for Language Impaired and EMH
Age: 5-0 to 5-5
FailTestItemLN7
Pass
Note:Of the thirteen false negatives three failed items LN9 and LN11. The other ten failed item LN11.
QualifyYes No
25 0
13 24
Sensitivity: 66% Specificity: 100%
147
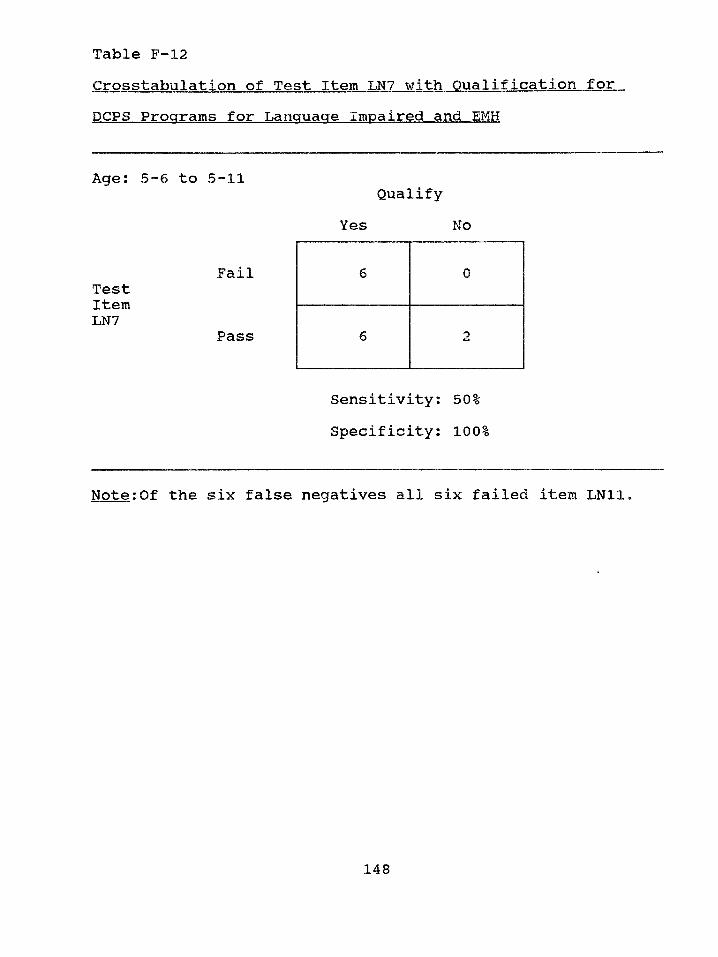
Table F-12
Crosstabulation of Test Item LN7 with Qualification forDCPS Programs for Language Impaired and EMH
Age: 5-6 to 5-11Qualify
Yes No
FailTestItemLN7
Pass
Note:Of the six false negatives all six failed item LN11.
Sensitivity; 50% Specificity: 100%
148
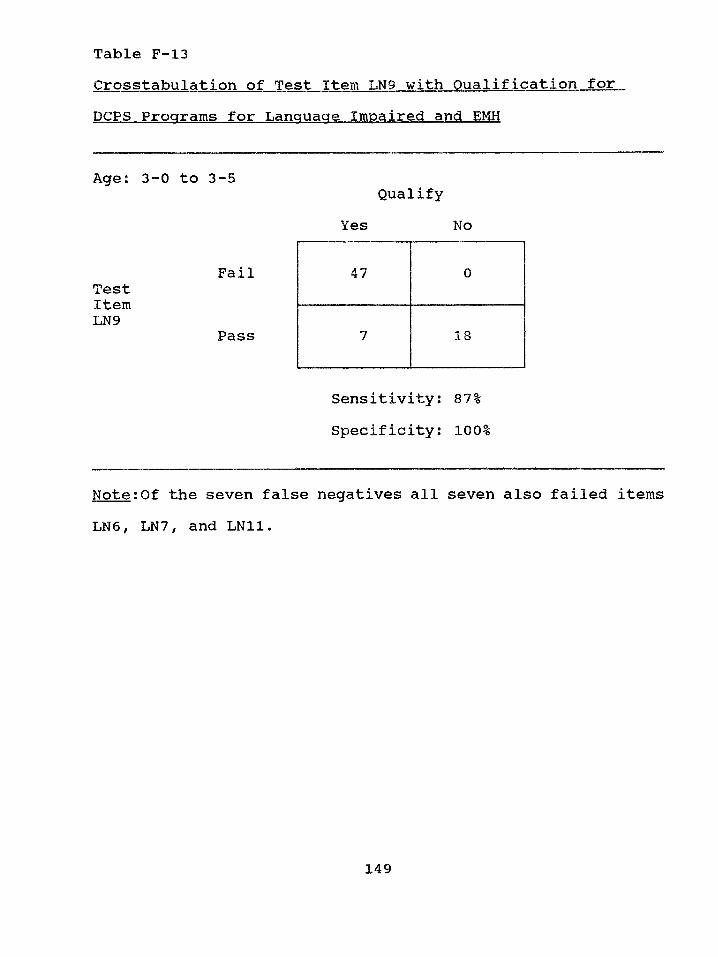
Table F-13Crosstabulation of Test Item LN9 with Qualification forDCPS Programs for Language Impaired and EMH
Age: 3-0 to 3-5
FailTestItemLN9
Pass
Note:Of the seven false negatives all seven also failed items LN6 , LN7, and LN11.
QualifyYes No
47 0
7 18
Sensitivity: 87% Specificity: 100%
149
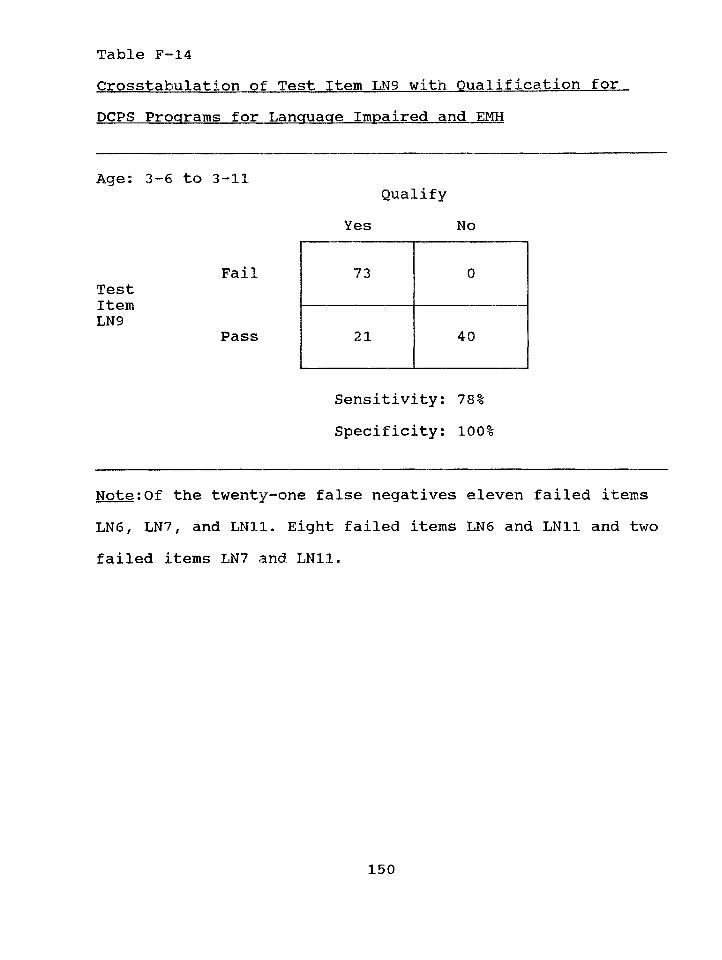
Table F-14Crosstabulation of Test Item LN9 with Qualification for.DCPS Programs for Language Impaired and EMH
FailTestItemLN9
Pass
Sensitivity: 78% Specificity: 100%
Note:Of the twenty-one false negatives eleven failed items LN6 , LN7, and LN11. Eight failed items LN6 and LN11 and two failed items LN7 a n d LN11.
Qualify Yes No
73 0
21 40
150
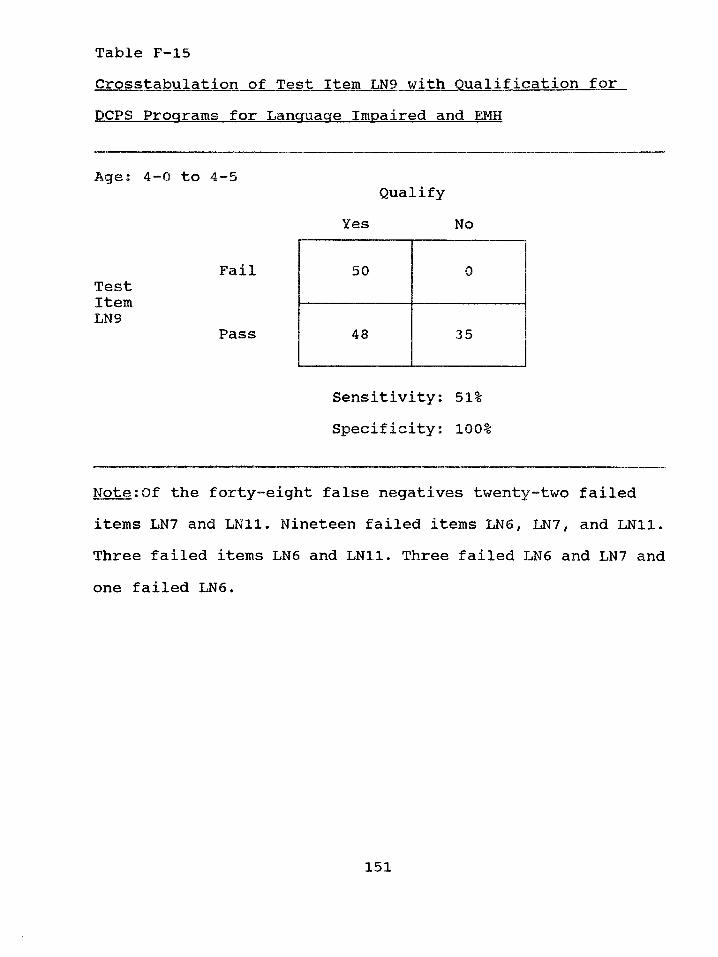
Table F-15Crosstabulation of Test Item LN9 with Qualification forDCPS Programs for Language Impaired and EMH
Age: 4-0 to 4-5
FailTestItemLN9
Pass
Note:Of the forty-eight false negatives twenty-two failed items LN7 and LN11• Nineteen failed items LN6 1 LN7 f and LN11. Three failed items LN6 and LN11. Three failed LN6 and LN7 and one failed LN6 .
QualifyYes No
50 0
48 3 5
Sensitivity: 51% Specificity: 100%
151
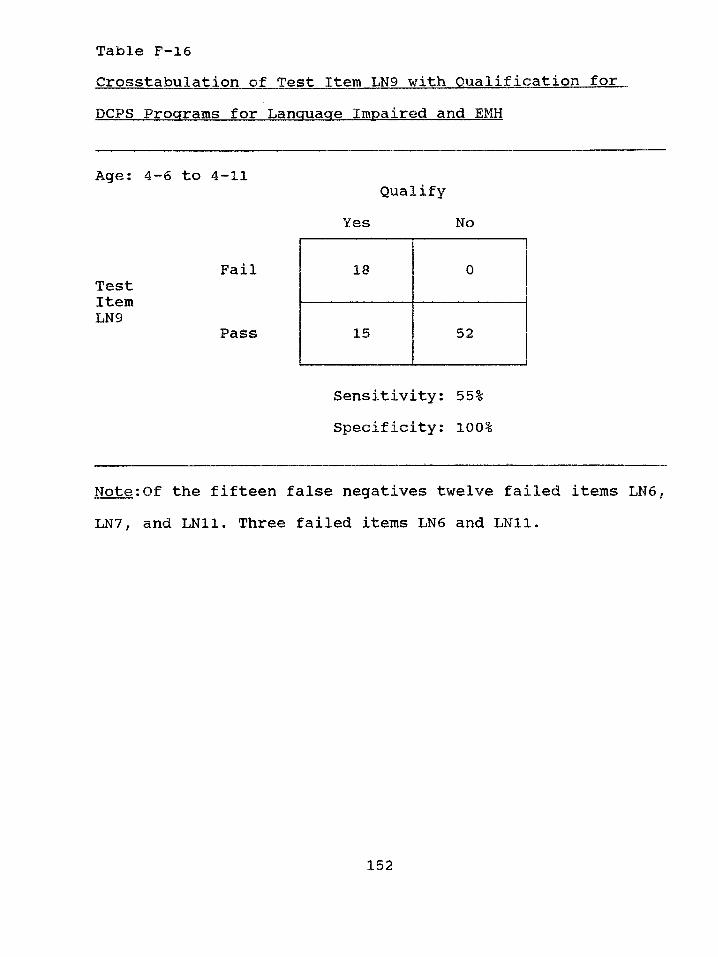
Table F-16Crosstabulation of Test Item LN9 with Qualification forDCPS Programs for Language Impaired and EMH
Age: 4-6 to 4-11
FailTestItem
Pass
Note:Of the fifteen false negatives twelve failed items LN6 , LN7, and LN11. Three failed items LN6 and LN11.
QualifyYes No
18 0
15 52
Sensitivity: 55% Specificity: 100%
152
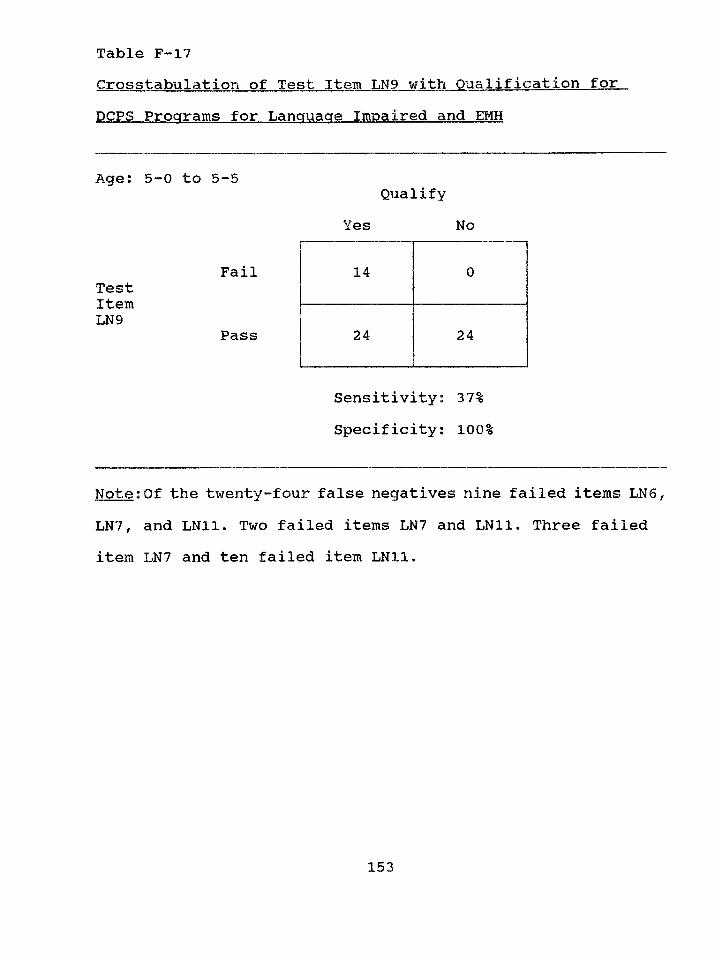
Table F-17Crosstabulation of Test Item LN9 with Qualification forDCPS Programs for Language Impaired and EMH
Age: 5-0 to 5-5
FailTestItemLN9
Pass
Note:Of the twenty-four false negatives nine failed items LN6 ,
LN7, and LN11. Two failed items LN7 and LN11. Three failed item LN7 and ten failed item LN11.
QualifyYes No
14 0
24 24
Sensitivity; 37% Specificity: 100%
153
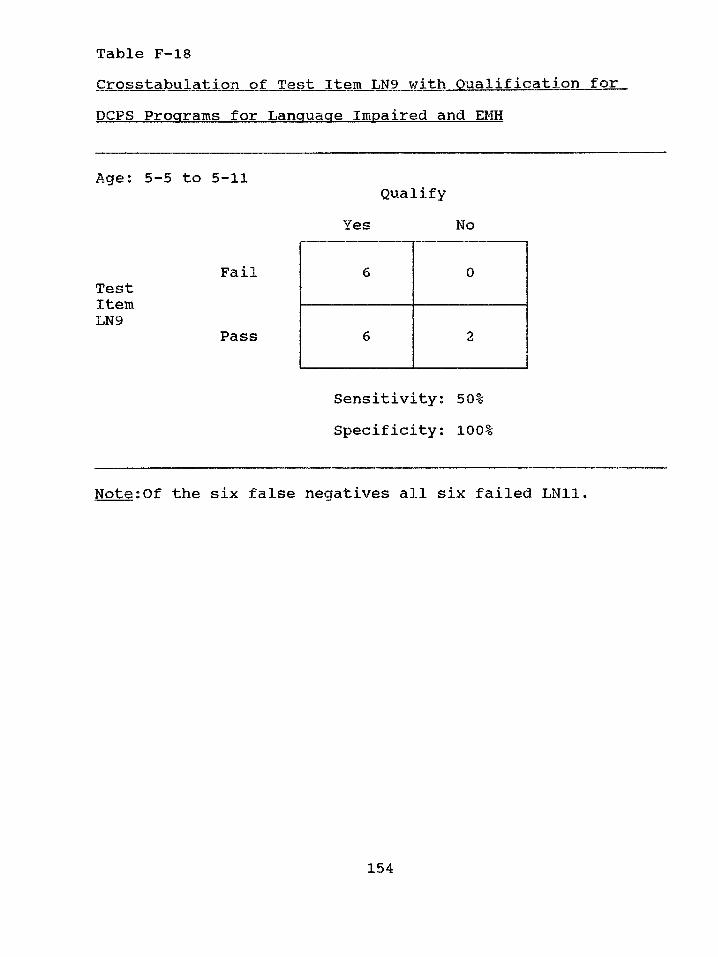
Table F-18Crosstabulation of Test Item LN9 with Qualification forDCPS Programs for Language Impaired and EMH
Age: 5-5 to 5-11
FailTestItemLN9
Pass
Note:Of the six false negatives all six failed LN11.
QualifyYes No
6 0
6 2
Sensitivity: 50% Specificity: 100%
154
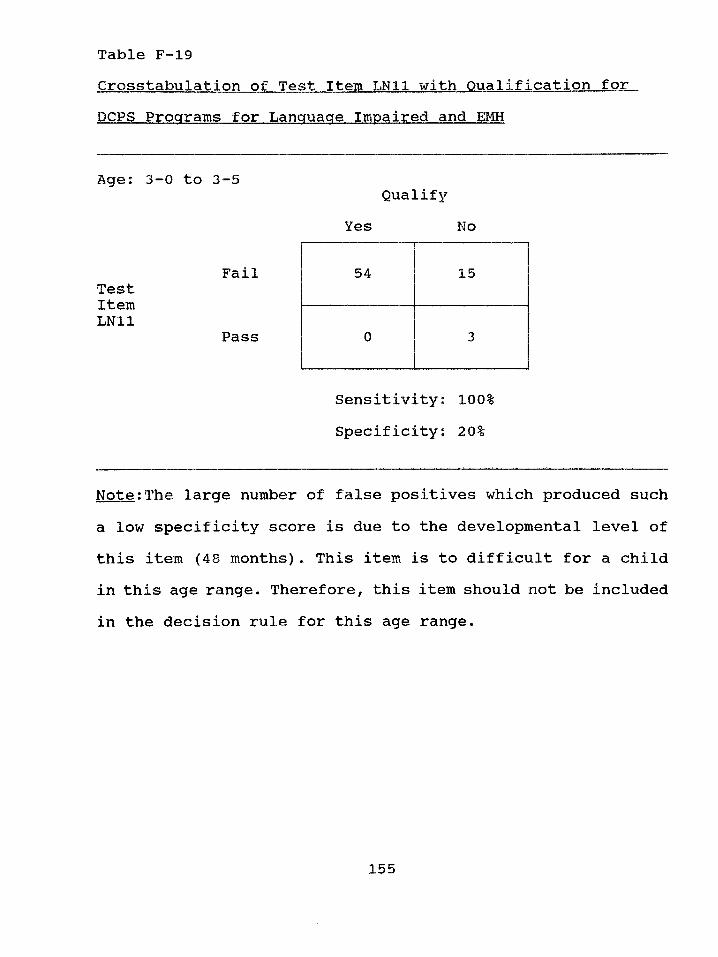
Table F-19
Crosstabulation of Test Item LN11 with Qualification forDCPS Programs for Language Impaired and EMH
Age: 3-0 to 3-5
FailTestItemLN11
Pass
Note:The large number of false positives which produced such a low specificity score is due to the developmental level of this item (48 months). This item is to difficult for a child in this age range. Therefore, this item should not be included in the decision rule for this age range.
QualifyYes No
54 15
0 3
Sensitivity: 100% Specificity: 20%
155
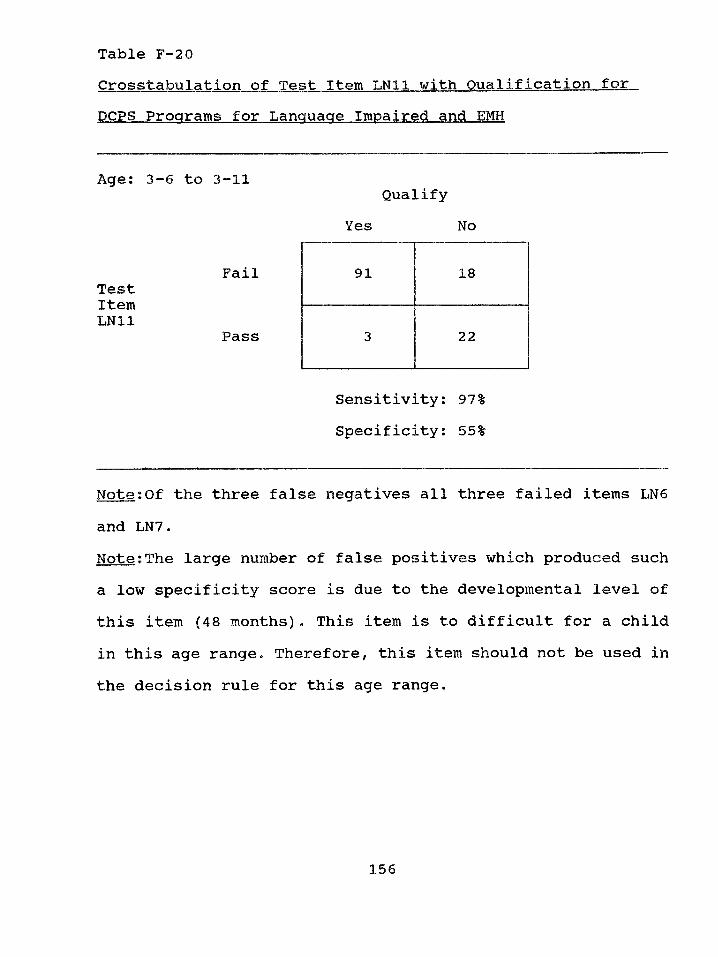
Table F-20Crosstabulation of Test Item LN11 with QualificationforDCPS Programs for Language Impaired and EMH
Age: 3-6 to 3-11
FailTestItemLN11
Pass
Note:Of the three false negatives all three failed items LN6
and LN7.Note:The large number of false positives which produced such a low specificity score is due to the developmental level of this item (48 months). This item is to difficult for a child in this age range* Therefore, this item should not be used in the decision rule for this age range.
QualifyYes No
91 18
3 22
Sensitivity: 97% Specificity: 55%
156
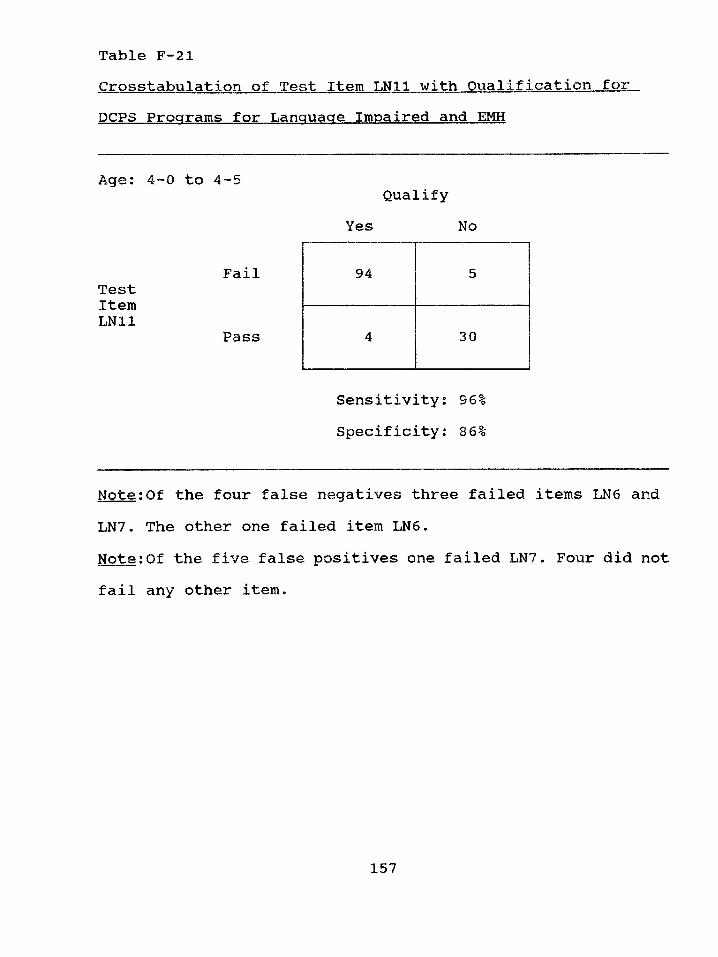
Table F-21Crosstabulation of Test Item LN11 with QualificationforDCPS Programs for Language Impaired and EMH
Age: 4 0 to 4—5
FailTestItemLN11
Pass
Note:Of the four false negatives three failed items LN6 and LN7. The other one failed item LN6 .Note:Of the five false positives one failed LN7. Four did not fail any other item.
QualifyYes No
94 5
4 30
Sensitivity: 96% Specificity: 86%
157
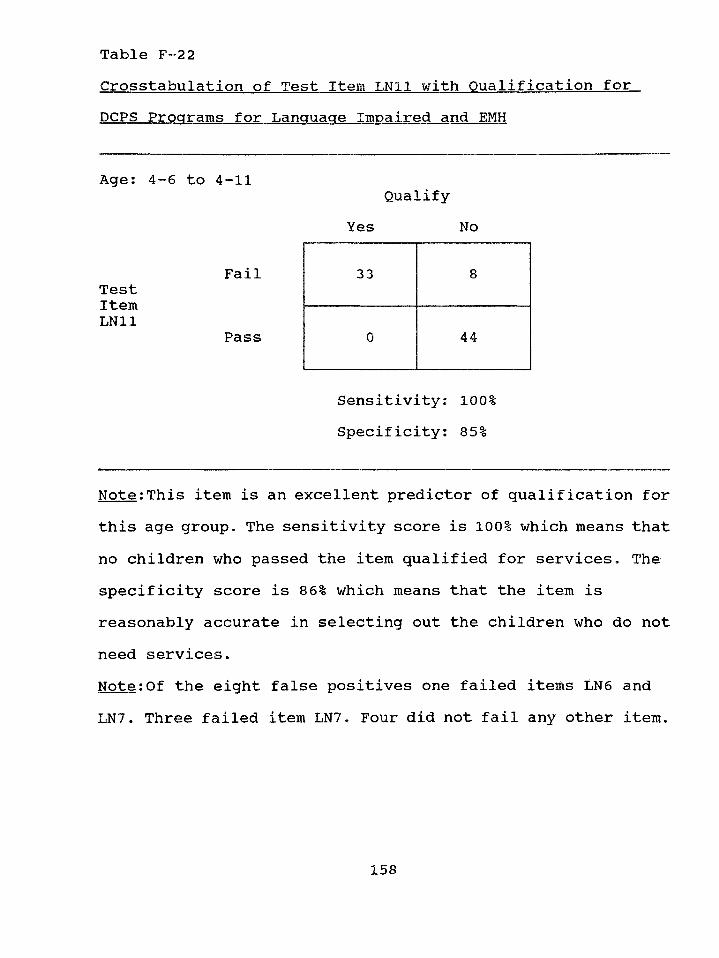
Table F-22Crosstabulation of Test Item LN11 with. Qualification forDCPS Programs for Language Impaired and EMH
Age: 4-6 to 4-11
FailTestItemLN11
Pass
Note:This item is an excellent predictor of qualification for this age group. The sensitivity score is 100% which means that no children who passed the item qualified for services. The specificity score is 86% which means that the item is reasonably accurate in selecting out the children who do not need services.Note:Of the eight false positives one failed items LN6 and LN7. Three failed item LN7. Four did not fail any other item.
QualifyYes No
33 8
0 44
Sensitivity: 100% Specificity: 85%
158
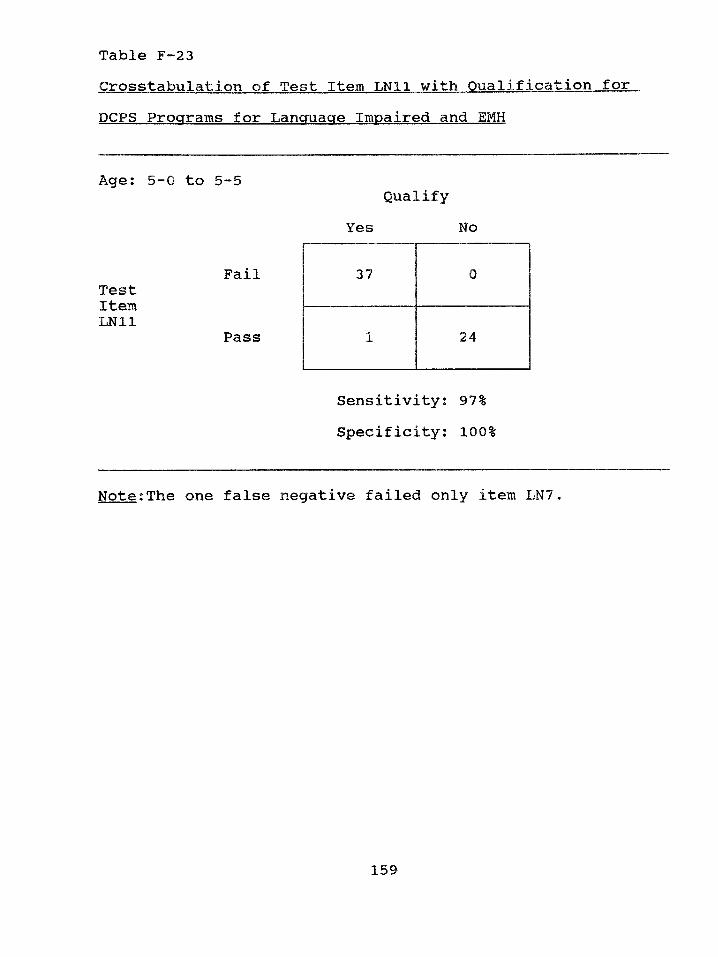
Table F-23Crosstabulation of Test Item LN11 with Qualification forDCPS Programs for Language Impaired and EMH
Age: 5-0 to 5-5Qualify
Yes No
FailTestItemLN11
Pass
Note:The one false negative failed only item LN7.
37 0
1 24
Sensitivity: 97% Specificity: 100%
159
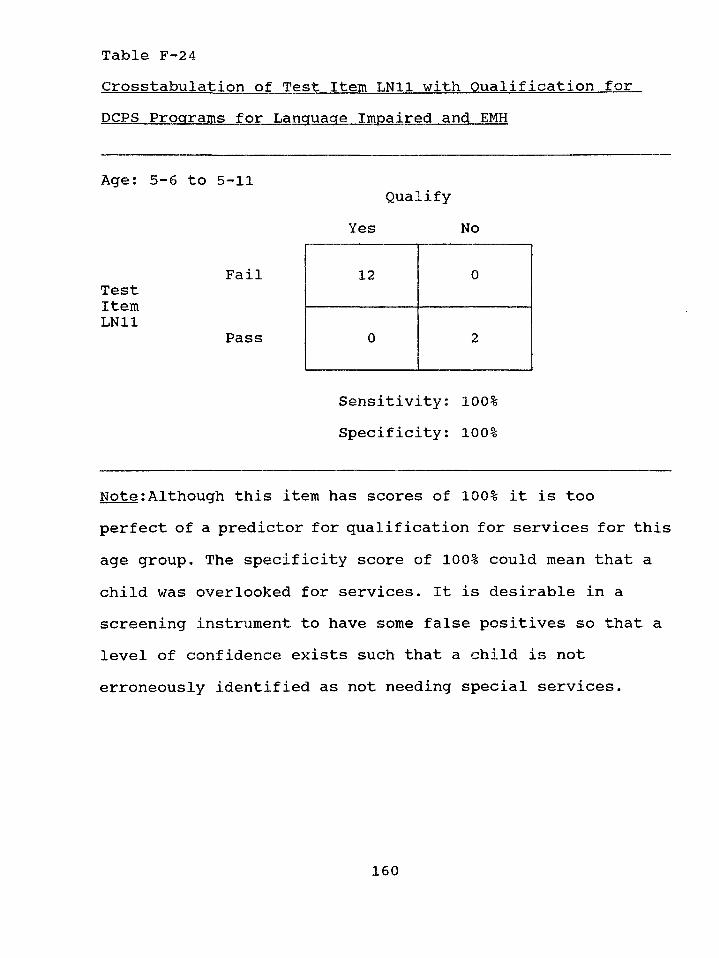
Table F-24Crosstabulation of Test Item LN11 with Qualification forDCPS Programs for Language Impaired and EMH
Age; 5-6 to 5-11
FailTestItemLN11
Pass
Note;Although this item has scores of 100% it is too perfect of a predictor for qualification for services for this age group. The specificity score of 100% could mean that a child was overlooked for services. It is desirable in a screening instrument to have some false positives so that a level of confidence exists such that a child is not erroneously identified as not needing special services.
QualifyYes No
12 0
0 2
Sensitivity: 100% Specificity: 100%
160
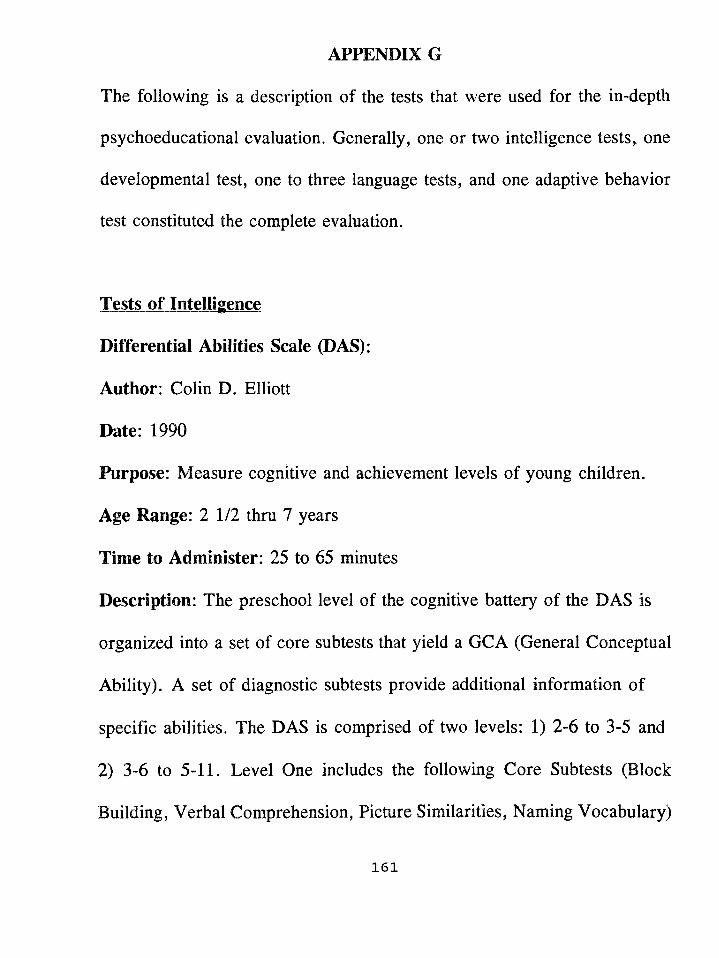
APPENDIX G
The following is a description of the tests that were used for the in-depth
psychoeducational evaluation. Generally, one or two intelligence tests, one
developmental test, one to three language tests, and one adaptive behavior
test constituted the complete evaluation.
Tests of Intelligence
Differential Abilities Seale (DAS):
Author: Colin D. Elliott
Date: 1990
Purpose: Measure cognitive and achievement levels of young children.
Age Mange: 2 1/2 thru 7 years
Time to Administer: 25 to 65 minutes
Description: The preschool level of the cognitive battery of the DAS is
organized into a set of core subtests that yield a GCA (General Conceptual
Ability). A set of diagnostic subtests provide additional information of
specific abilities. The DAS is comprised of two levels: 1) 2-6 to 3-5 and
2) 3-6 to 5-11. Level One includes the following Core Subtests (Block
Building, Verbal Comprehension, Picture Similarities, Naming Vocabulary)
161
and the following Diagnostic Subtests (Recall of Digits, Recognition of
Pictures). Level Two includes the following Core Subtests (Verbal
Comprehension, Naming Vocabulary, Picture Similarities, Pattern
Construction, Copying, Early Number Concepts) and Diagnostic Subtests
(Block Building, Matching Letter-Like Forms, Recall of Objects, Recall of
Digits, Recognition of Pictures). Raw scores are converted to T scores and
percentiles. Subtest T scores are summed and converted to normalized
standard scores.
Norms, Reliability, Validity: The DAS was standardized using 1,175
children. Each age group was evenly divided between males and females.
Four ethnic categories were used: White, Black, Hispanic, and Other. The
sample was stratified according to four regions: Northeast, North Central,
South, and West. Internal reliability coefficients range from .66 to .98.
Standard errors of measurement for the GCA range from 4.39 to 4.73 for
the various age groups. Test-retest reliability coefficients range from .38 to
.90 for the subtests and GCA. Inter-rater reliability coefficients ranged from
.74 to .98. Validity studies with other tests are listed in the manual. The
DAS correlated .81 with the WPPSI-R and .77 with the Standford-Binet IV.
Letter International Performance Scale (LIPS)(Arthur Adaptation): (see
Appendix D)
M errill-Palm er Scales of Mental Tests: (see Appendix D)
Stanford-Binet IV:
Authors: Robert L. Thorndike, Elizabeth P. Hagen, Jerome M. Sattler
Date: 1986
Purpose: Measure intelligence
Age Range: 2 thru adult
Time to Administer: one hour
Description: The Stanford-Binet IV contains four designated areas: Verbal
Reasoning, Abstract/Visual Reasoning, Quantitative Reasoning, and Short-
Term Memory. These four areas are measured by the use of fifteen
subtests. Only eight of the subtests are administered to preschoolers:
Vocabulary, Comprehension, Absurdities, Pattern Analysis, Copying,
Quantitative, Bead Memory, and Memory for Sentences. Raw scores are
converted to three types of standard scores: standard age scores for the
subtests, Area Scores, and a Composite Score.
Norms, Reliability, Validity: The standardization sample consisted of
5,013 individuals in 17 age groups. The sample was selected based on the
163
1980 census data. Stratification variables included geographic region,
community size, ethnic group, age, gender, and socioeconomic status.
Internal consistency reliabilities for the composite score range from .95 to
.99 for the 17 different age groups. Reliability coefficients for the various
subtests range from .66 to ,96. The technical manual includes test-retest
data along with validity data.
Wechsler Preschool and Prim ary Scales of Intelligence (WPPSI):
Author: David Wechsler
Date: 1967
Purpose: Measure intelligence of young children
Age Range: 4 to 6 1/2 years
Time to Administer: 45 minutes to one hour
Description: The WPPSI contains eleven subtests: Information,
Vocabulary, Arithmetic, Similarities, Comprehension, Picture Completion,
Mazes, Block Design, Sentences, Animal House, and Geometric Design.
It uses a deviation IQ which has a mean of 100 and a standard deviation
of 15 for three types of IQ’s: Verbal, Performance, and Full Scale. Raw
scores for each subtest are converted to scaled scores.
Norms, Reliability, Validity: The WPPSI was standardized on 1200
164
children. The selection of children was based on the U.S. census data for
1960. Internal consistency reliabilities for each of the three IQ’s range
from .91 to .96. Subtest reliabilities range from .77 to .87. Standard errors
of measurement for the three IQ’s are: Full Scale (2.88), Verbal (3.57),
and Performance (3.85). Test-retest reliability for the three scales are: Full
Scale (.91), Verbal (.86), and Performance (.89). Validity data is limited
in the manual.
W echsler Preschool and Prim ary Scales of Intelligence-Revised
(WPPSI-R):
Author: David Wechsler
Date: 1989
Purpose: Measure intelligence of young children
Age Range: 3 thru 7 years
Time to Administer: 45 to 60 minutes
Description: The WPPSI-R contains twelve subtests (6 verbal and 6
performance). The WPPSI-R Is organized similarly to the WPPSI.
Norms, Reliability, Validity: The WPPSI-R was standardized on 1700
children with an equal number of males and females. Four major
geographical regions are represented: Northeast, North Central, South, and
165
West. Ethnic groups (White, Black, Hispanic, and Others) are included on
a percentage basis similar to what is reported in the 1986 census survey.
Internal consistency reliabilities for each of the three IQs range from .85 to
.97. Subtest reliabilities range from .54 to .90. Standard errors of
measurement for the three IQs range from 2.81 to 4.98. Test-retest
reliability for the three scales are: Full Scale (.91), Verbal (.89), and
Performance (.87). Validity data, reported in the manual, correlates the
WPPSI-R with the WPPSI. Coefficients between the three scales are Full
Scale (.87), Verbal (.82), and Performance (.82). The validity correlation
reported between the WPPSI-R and the Stanford-Binet IV is .74, while that
between the WPPSI-R and the McCarthy Scales of Children's Abilities is
.81.
Tests of Development
Developmental Profile II (DPII):
Authors: Gerald Alpern, Thomas Boll, and Marsha Shearer
Date: 1980
Purpose: Estimate developmental level of children
Age Range: Birth to 9 years
166
Time to Administer: 20 to 30 minutes
Description: The Developmental Profile II includes five scales: Physical
Skills, Self-Help, Social, Academic, and Communication. The DP II can be
used to determine eligibility for receiving special education and/or related
services, as a planning tool to develop IEP’s, a measure of a child’s
progress, and as a method of evaluating an entire educational program. The
DP II can be administered either through direct observation of the child or
from a third party Interview. The administration involves determining If the
child does or does not have skills listed In each scale. The child receives
credit in months for each developmental skill passed in an area. These
passes are added and this total corresponds to the developmental age score
for the scale.
Norm s, Reliability, Validity: The standardization subjects (3,008) were
from Indiana and Washington. The sample characteristics are: Males
(1527), Females (1481), Whites (2525), Blacks (424), Other (54). Racial
data was available on only 3003 of the 3008 subjects. Reliability and
Validity information in the manual refers to the correspondence of the test
results and reports from parents and teachers and performance of the child.
A reliability study Is reported in the manual using Head Start teachers for
167
both test-retest and interrater reliability information. The conclusions from
these reliability studies is that the "...Developmental Profile generates scores
with extremely high scorer, reporter, and test-retest reliability." (Alpern,
Boll, & Shearer, 1980, p .36). The validity study reported in the manual was
based on 100 children (88 whites and 12 Blacks) with age ranges from 3
months to 12 years. The manual reports a high percentage of agreement
between mother’s reporting of child’s developmental level and the child’s
actual performance on the DP II.
Learning Accomplishment Profile-Diagnostic (LAP-D): (see Appendix D)
Tests of Language
Expressive One-Word Picture Vocabulary Test (EOWPVT): (see
Appendix D)
Peabody Picture Vocabulary Test-Revised (PPVT-R): (see Appendix D)
Preschool Language Scale (PLS) (PLS): (see Appendix D)
168
Test of Adaptive Behavior
Scales of Independent Behavior (SIB):
Authors: Robert H. Bruininks, Richard W. Woodcock, Richard F.
Weatherman, Bradley K. Hill
Date: 1984
Purpose: Measure functional independence and adaptive behavior of
children and adults.
Age Range: Infants to adults
Time to Administer: 20 to 30 minutes
Description: The SIB consists of four adaptive behavior skill clusters
encompassing fourteen subscales. The four clusters are: Motor Skills,
Social Interaction and Communication Skills, Personal Living Skills, and
Community Living Skills. These four clusters are combined to form the
Broad Independence Scale. The SIB also has a problem behavior scale that
yields four maladaptive indexes. The SIB is administered to a third party
who knows the examinee well, such as a parent or teacher. An easel is
used during administration and the informant is shown possible responses
to items on the easel pages. The SIB yields age equivalents, percentile
ranks, standard scores, and normal curve equivalents.
169
Norms, Reliability, Validity: A sample of 1,764 individuals was used for
standardization. The sample was stratified according to sex, community
size, geographic location, socioeconomic status, and race. Internal
consistency estimates range from .64 to .95. Test-retest coefficients range
from .78 to .91 and inter-rater reliability estimates from .74 to .86.
170
References
Adelman, H. S. (1982). Identifying learning problems at an early age: A
critical appraisal. Journal of Clinical Child Psychology. 11.
255-261.
Allen, D. A. (1989). Developmental language disorders in preschool
children: Clinical subtypes and syndromes. School Psychology Review,
is, 442-451.
Alpern, G., Boll, T., & Shearer, M. (1980). Developmental Profile II.
Aspen, Colorado: Psychological Development Publishers.
American Psychiatric Association, (1985). Standards for educational and
psychological testing (2nd ed.). Washington, DC: Author.
Arthur, G. (1952). Arthur adaptation of the Leiter International
Performance Scale. Los Angeles, California: Western Psychological
Services.
Barnes, K. E. (1982). Preschool screening. Springfield, Illinois: Charles C.
Thomas.
Bracken, B. A. (1987). Limitations of preschool instruments and standards
for minimal levels of technical adequacy. Journal of Psychoeducational
Assessment. 4, 313-326.
171
Bruiniks, R. H., Woodcock, R. W.» Weatherman, R. F., & Hill, B. K.,
(1984). Scales of Independent Behavior. Allen, Texas: DLM Teaching
Resources, Inc.
Brigance, A. H. (1985). Brigance Preschool Screen. North Billerica,
Massachusetts: Curriculum Associates.
Castro, G., & Mastropieri, M. A. (1986). The efficiency of early
intervention programs for handicapped children: a meta-analysis.
Exceptional Children. 52. 417-424.
Cantwell, D. P. & Baker, L. (1987). Developmental speech and language
disorders. New York, New York: The Guilford Press.
Cattell, P. (1950). Measurement of intelligence of infants and young
children. New York, New York: The Psychological Corporation.
Dade County Public Schools. (1991). Special programs and procedures for
exceptional students. Miami, FL: Author.
Dunn, L. M ., & Dunn, L. M. (1981). Peabody Picture Vocabulary Test.
Circle Pines, Minnesota: American Guidance Service.
Edmiaston, R. K., & Mowder, B. A. (1985). Early intervention for
handicapped children: Efficacy issues and data for school psychologists.
Psychology in the Schools. 22, 171-178.
Elliott, C. D. (1990). Differential Abilities Scale. New York, New York:
Harcourt Brace lovanovich, Inc.
Fewell, R. R., & Oelwein, P. L. (1991). Effective early intervention:
Results from the model preschool program for children with down
syndrome and other developmental delays. Topics in Early Childhood
Special Education. 11(1). 56-68.
Frankenburg, W. K., & Dodds, J. B. (1981). Denver Developmental
Screening Test-Revised. Denver, Colorado: University of Colorado
Medical Center.
Funk and Wagnall (1965). Standard dictionary. Britannica World Language
Edition. Chicago: Encyclopedia Britannica, Inc., Vol. II.
Gardner, M. F. (1979). Expressive One-Word Picture Vocabulary Test.
Novato, California: Academic Therapy Publications.
Gesell, A.L. (1940). The first five years of life: A guide to
the study of the preschool child. New York, New York: Harper.
Glaros, A. G., & Kline, R. B. (1988). Understanding the accuracy of tests
with cutting scores: The sensitivity, specificity, and predictive value
model. Journal of Clinical Psychology. 44, 1013-1023.
173
Griffin, P. M., & Sanford, A. R. (1975). Learning Accomplishment Profile
for Infants. Lewisville, North Carolina: Kaplan Press.
Hammill, D. D. (1974). Evaluating children for instructional purposes.
In Jones, R. L.» (ED.), Special education in transition. Boston,
Massachusetts: Allyn.
Harrison, P.L. (1992). Planning and Evaluating Preschool Screening and
Assessment Programs. Child Assessment News. 2(3), 7-12.
Ilg, F. L., & Ames, L. B. (1955). The Gesell Institute's child behavior
from birth to ten. New York, New York: Harper.
Ittenbach, R.F., Harrison, P.L., & Deck, M.D. (1989). Issues in preschool
screening. Alabama A.C.D. Journal. 15(2). 37-44.
Jacob, S., Snider , K. P., & Wilson, J. F, (1988). Validity of the DIAL-R
for identifying children with special education needs and predicting early
reading achievement. Journal of Psychoeducational Assessment. 6 ,
289-297.
Lazar, I., & Darlington, R. (1982). Lasting effects of early education: A
report from the consortium for longitudinal studies. Monographs of the
Society for Research in Child Development. 47(2-3). Serial No. 195.
174
Le May, D. W., Griffin, P. M., & Sanford, A. R. (1977). Learning
Accomplishment Profile Diagnostic Edition. Chapel Hill, North Carolina:
Chapel Hill Training Outreach Project.
Lichtenstein, R. (1979). Classificational methods for the psychometric
evaluation of screening procedures. Paper presented at the Society for
Research in Child Development, San Francisco, California.
Lichtenstein, R. (1981). Comparative validity of two preschool screening
tests: Correlational and classificational approaches. Journal of Learning
Disabilities. 14. 68-73.
Lichtenstein, R. & Ireton, H. (1984). Preschool screening. Philadelphia,
Pennsylvania: Grune & Stratton, Inc.
Lichtenstein, R., & Ireton, H. (1991). Preschool screening for development
and educational problems. In B. Bracken (Ed.), The psychoeducational
assessment of preschool children. (2nd ed.). 486-513. Needham Heights,
Massachusetts: Allyn & Bacon.
Lillie, D. L. (1975). Early childhood education. Chicago, Illinois: Science
Research Associates.
175
Mardell-Czudnowski, C., & Goldenberg, D. (1983). Developmental.
Indicators for the Assessment of Learning-Revised. Circle Pines,
Minnesota: American Guidance Services,
McNulty, B. A., Smith, D. B., & Soper, E. W. (1983). Appendix to
effectiveness of early special education for handicapped children. Report
commissioned by the Colorado General Assembly: Colorado State
Publications Depository and Distribution Center.
Meehl, P. E. & Rosen, A. (1955). Antecedent probability and the efficiency
of psychometric signs, patterns, or cutting scores. Psychological Bulletin.
52, 194-216.
Meisels, S. J., Harbin, G., & Modigliani, K. (1988). Formulating optimal
state early childhood intervention policies. Exceptional Children. 55.
159-165.
Percival, R. R., & Poxon, S. (1972). Dallas Preschool Screening Test.
Dallas, Texas: Dallas Educational Services.
Salvia, J., & Ysseldyke, J. E. (1977). Assessment in special and remedial
education. Boston, Massachusetts: Houghton Mifflin.
Sanford, A. R. (1970). The Learning Accomplishment Profile. Winston-
Salem, North Carolina: Kaplan Press.
176
Satz, P., & Fletcher, J.M. (1979). Early screening tests: Some uses and
abuses. Journal of Learning Disabilities. 12. 65-69.
Scott, K., & Hogan, A. (1982). Methods for the identification of high-risk
and handicapped infants. In C. Ramey, & P. Trohanis (Eds.), Finding and
educating high risk and handicapped infants. 213-242. Baltimore,
Maryland: University Park Press.
Sommers, R. K. (1989). Language Assessment: Issues in the use and
interpretations of tests and measures. School Psychology Review. 18.
452-462.
South worth, L. E., Burr, R. L., & Cox, A. E. (1981). Screening and
evaluating the young child: A handbook of instruments to use from
infancy to six years. Springfield, Illinois: Charles C. Thomas.
Stewart, J. M., Hester, E. J., & Taylor, O. L. (1986). Prevalence of
language, speech, and hearing disorders in an urban preschool black
population. Journal of Childhood Communication Disorders. 9, 107-123.
Stutsman, R. (1931). Merrill-Palmer Scale of Mental Tests. Los Angeles,
California: Stoelting Publishers.
177
Suen, H. K., Mardell -Czudnowski, C., & Gollenberg, D. S. (1989).
Classification reliability of the DIAL -R preschool screening test.
Educational and Psychological Measurement. 49. 673-680,
Thorndike, R. L., Hagen, E. P., & Sattler, J. M. (1986). Stanford-Binet
IV. Chicago, Illinois: The Riverside Publishing Company.
Thurman, S. K., & Widerstrom, A. H. (1985). Young children with special
needs: A developmental and ecological approach. Boston, Massachusetts:
Allyn and Bacon.
Wechsler, D. (1967). Wechsler Preschool and Primary Scales of
Intelligence-Revised. New York, New York: Harcourt Brace Jovanovich,
Inc.
Wechsler, D. (1989). Wechsler Preschool and Primary Scales of
Intelligence-Re'vised. New York, New York: Harcourt Brace Jovanovich,
Inc.
Wilson, B. J., & Reichmuth, Sr. M. (1985). Early-screening programs:
When is predictive accuracy sufficient? Learning Disabilities Quarterly.
8 , 182-188.
178
Ysseldyke, J. E., & O’Sullivan, P. J. (1987). Predicting preschool
screening referral rates from district demographic data. Journal of
School Psychology. 25. 119-29.
Zimmerman, I., Steiner, V., & Evatt, R. (1969). Preschool Language
Scale. New York, New York: Harcourt Brace Jovanovich, Inc.
179
Bibliography
Allen, D. & Bliss, L. S. (1987). Concurrent validity of two language
screening tests. Journal of Communication Disorders. 20. 305-317.
Anastasi, A. (1988). Psychological testing. New York, New York:
Macmillan.
Barnes, K. E. (1978). The Jansky Predictive Index. In W.K.
Frankenburg (Ed.), Proceedings of the second international
conference on developmental screening. Denver, Colorado: University of
Colorado.
Barnett, D. W., Faust, J., & Sarmir, M. A. (1988). A validity study
of two preschool screening instruments: The LAP-D and DIAL-R.
Contemporary Educational Psychology. 13, 26-32.
Buck, A., & Gart, J. (1966). Comparison of a screening test and a reference
test in epidemiological studies. American Journal of Epidemiology. 83.
586-592.
Burr, R. L., Cox, A. E., & Southworth, L. E. (1980). Screening and
evaluating the young child. Springfield, Illinois: Charles C. Thomas.
180
Byrne, J.M., Smith, D. I., & Backman, J. E. (1987). Cognitive
impairment in preschoolers: Identification using the Personality Inventory
for Children-Revised. Journal of Abnormal Psychology. 15. 239-246.
Carnine, D. W., & Kameenui, E. J. (1990). The general education initiative
and children with special needs: A false dilemma in the face of true
problems. Journal of Learning Disabilities. 23. 141-144, 148.
Deiner, P. L., & Peters D. L. (1987). The reality of early childhood: Head
start and the child development associate (CDA). Topics in Early
Childhood Special Education. 7(3), 1-58.
Diamond, K. E., & Le Furgy, W. G. (1988). Screening for developmental
handicaps: Outcomes from an early childhood screening program.
Physical and Occupational Therapy in Pediatrics. 8(1), 43-59.
Fletcher, J. M. (1979). Early screening tests: Some uses and abuses.
Journal of Learning Disabilities. 12(1). 65-69.
Frankenburg, W. K. (1974). Selection of diseases and tests in pediatric
screening. Pediatrics. 54, 612-616.
Gallagher, J. J., & Bradley, R. H. (1972). Early identification of
developmental difficulty. In I. J. Gordon (Ed.), Early childhood
education. Chicago: University of Chicago Press. 291-303.
181
Gesell , A.L., & Amatruda, C.S., (1941). Developmental Diagnosis. New
York, New York: Paul B. Hoeber.
Goodwin, L. D.» & Goodwin, W. L. (1991). Using generalizability theory
in early childhood special education. Journal of Early Intervention. 15.
193-204.
Greenberg, B. (1987). Using microcomputers and mainframes for data
analysis in the social sciences. New York, New York: Merrill.
Harrington, R. G. (1984). Preschool screening: The school psychologist's
perspective. School Psychology Review. 13. 363-374.
Hasenstab, S. M. (1980). Language assessment of the preschool child with
language delay. Paper presented at the Annual International Convention
of The Council for Exceptional Children, Philadelphia, Pennsylvania.
Hicks, C.P. (1982). Fundamental concepts in the design of experiments.
Fort Worth, Texas: Holt, Rinehart, & Winston, Inc.
Jansky, J., & de Hirsch, K. (1972). Preventing reading failure: prediction,
diagnosis, intervention. New York, New York: Harper & Row.
Johnson, H. W. (1980). Preschool test description. Springfield,
Illinois: Charles C. Thomas.
182
Keogh, B. K. (1983). Early identification: One component of
comprehensive services for at-risk children. Topics In Childhood Special
Education. 3(3), 7-16.
Kerlinger,F.N. (1973). Foundations of behavioral research. Fort Worth,
Texas: Holt, Rinehart, & Winston, Inc.
Kerns, G. M., & Mallory, B. L. (1988). Consequences of categorical
labeling of preschool children. Topics In Early Childhood Special
Education. 8(3), 39-50.
Lindsay, G. A., & Wedell, K. (1982). The early identification of
educationally at risk children revisited. Journal of Learning Disabilities.
15, 212-217.
McCauley, R., & Swisher, L. (1984). Psychometric review of language
and articulation tests for preschool children. Journal of Speech and
Hearing Disorders. 49. 34-41.
Meisels, S. J. (1978). Developmental screening in early childhood: A
guide. Washington, D.C.: National Association for the Education of
Young Children.
183
Meisels, S. J. (1984). Prediction, prevention and developmental screening
in the EPSDT program. In H. W. Stevenson and A. E. Siegal (Eds.).
Child development research and social policy. 267-317, VI. Chicago,
Illinois: University of Chicago Press.
Meisels, S. I. (1989). Can developmental screening tests identify children
who are developmentally at risk, Pediatrics. 83. 578-585.
Mercer, C. D., Algozzine, B., & Trifiletti, J. (1979). Early
identification - An analysis of the research. Learning Disability
Quarterly. 2(2), 12-24.
Miller, L. J., & Sprong, T. A. (1986). Psychometric & qualitative
comparison of four preschool screening instruments. Journal of Learning
Disabilities. 19. 480-484.
O’Sullivan P. J., & Ysseldyke, J. E. (1987). Predicting preschool
screening referral rates from district demographic data. Journal of
School Psychology. 25. 119-129.
Paget, K.D., & Nagle, R. J. (1986). A conceptual model of
preschool assessment. School Psychology. Review. 15, 154-65.
Salvia, J., & Ysseldyke, J. E. (1991). Assessment, (5th ed.).
Boston, Massachusetts: Houghton Mifflin.
184
Sattler, J. M. (1988). Assessment of children. San Diego, California:
Jerome M. Sattler.
Satz, P., & Fletcher, J.M. (1988). Early identification of learning disabled
children: An old problem revisited. Journal of Consulting and Clinical
Psychology. 56. 824-829.
Sheehan, R., & Sites, J. (1989). Implications of P. L. 99-457 for
assessment. Topics in Early Childhood Special Education. 9, 103-115.
Slavin, R. E., Madden, N. A., Karweit, N. L., Dolan, L., Wasik, B. A.,
Shaw, A., Mainzer, K. L., & Haxby, B. (1991). Never streaming:
Prevention and early intervention as an alternative to special education.
Journal of Learning Disabilities. 24. 373-378.
Stevenson, J. (1984). Predictive value of speech and language screening.
Developmental Medicine & Child Neurology. 26. 528-538.
Ysseldyke, J. E. (1985). Current screening and diagnostic practices for
identifying young handicapped children. Early Childhood Assessment
Project Research Report #2. Minnesota University, Minneapolis. (ERIC
Document Reproduction Service No. ED 269 951).
185
Recommended