THE DETERMINANTS OF FINANCING OBSTACLES
Thorsten Beck, Aslı Demirgüç-Kunt, Luc Laeven, and Vojislav Maksimovic*
Keywords: Financing Constraints, Investment Models
JEL Classification: E22, G30, O16
World Bank Policy Research Working Paper 3204, February 2004 The Policy Research Working Paper Series disseminates the findings of work in progress to encourage the exchange of ideas about development issues. An objective of the series is to get the findings out quickly, even if the presentations are less than fully polished. The papers carry the names of the authors and should be cited accordingly. The findings, interpretations, and conclusions expressed in this paper are entirely those of the authors. They do not necessarily represent the view of the World Bank, its Executive Directors, or the countries they represent. Policy Research Working Papers are available online at http://econ.worldbank.org. * Beck, Demirguc-Kunt and Laeven: World Bank; Maksimovic: Robert H. Smith School of Business at the University of Maryland. We would like to thank two anonymous referees for useful comments and suggestions.

1
THE DETERMINANTS OF FINANCING OBSTACLES
Abstract: We use survey data on a sample of over 10,000 firms from 80 countries to assess
(i) how successful a priori classifications are in distinguishing between financially
constrained and unconstrained firms, and (ii) more generally, the determinants of financing
obstacles of firms. We find that older, larger, and foreign-owned firms report less
financing obstacles. Our findings thus confirm the usefulness of size, age and ownership as
a priori classifications of financing constraints, while they shed doubts on other
classifications used in the literature. Our results also suggest that institutional development
is the most important country characteristic explaining cross-country variation in firms’
financing obstacles.
2
1. Introduction
Since a seminal paper by Fazzari, Hubbard and Petersen (1988) [henceforth, FHP], a
large body of empirical literature has emerged to estimate financing constraints of firms
(see the surveys by Schiantarelli 1995, Blundell, Bond and Meghir 1996, Hubbard 1998,
and Bond and Van Reenen 1999). This literature relies on the assumption that external
finance is more costly than internal finance due to asymmetric information and agency
problems, and that the “premium” on external finance is an inverse function of a
borrower’s net worth. A firm is defined to be financially constrained if a windfall increase
in the supply of internal funds results in a higher level of investment spending.
Following FHP, it is usually assumed that there are cross-sectional differences in
effects of internal funds on firms’ investment, so that investment follows the optimal path
for a priori unconstrained firms but a sub-optimal path for constrained firms. Subsequently,
researchers have applied different a priori classifications of firms to distinguish financially
constrained and unconstrained firms.
In this paper, we use a unique firm-level survey database to focus on two questions.
First, how successful are these a priori classifications in distinguishing between financially
constrained and unconstrained firms? Second, and more generally, what are the
determinants of financing obstacles of firms? The World Business Environment Survey
(WBES) is a unique firm-level survey database, which offers a number of advantages.
First, the database provides information on the firm’s perception of the degree to which it is
financially constrained or not. Therefore, unlike previous studies that inferred financing
constraints from company financial statements using different methodologies, we can
measure firms’ financing obstacles directly from the data. Second, the database contains
3
information on a broad cross-section of different types of firms in a large number of
countries, including a large number of small and medium-sized enterprises. Therefore,
unlike previous studies that focused either on a sample of large, listed firms, or on firms in
a limited number of countries, we are able to study how financing obstacles differ not only
across countries, but also across firm size. As smaller firms are generally considered to face
larger financing obstacles, it seems particularly important to investigate this largely ignored
segment of the firm population.
Our results indicate that many of the previously used a priori groupings are indeed
effective in classifying financially constrained firms. However, we find that certain
groupings are more effective than others. Specifically, age, size and ownership structure
are effective categorizations of firms when studying financing obstacles; older, larger and
foreign-owned firms report lower financing obstacles. Variables capturing these firm
characteristics not only enter statistically significant in the regressions, but also explain
large variations in firms’ financing obstacles.
We also explore whether financial and economic development helps alleviate the
financing obstacles of the firms that report to be most constrained. While we find that
firms in countries with higher levels of financial intermediary development, stock market
development, legal system efficiency and higher GDP per capita report, on average, lower
financing obstacles, the underlying institutions driving both financial and economic
development seem to be the most important country characteristic explaining cross-country
variation in firms’ financing obstacles.
While we explore the determinants of self-reported financing obstacles, we do not
explore the relation between financing obstacles and the actual firm growth. While firms
report and rate certain obstacles, not all of them might actually be binding constraints.
4
Beck, Demirguc-Kunt and Maksimovic (2004) assess the importance of self-reported
financing, legal and corruption obstacles for firm growth using the same data and find that
many of these obstacles are indeed binding. They also explore the effect of firm size and
financial and institutional development on the relation between the reported obstacles and
growth. However, while Beck, Demirguc-Kunt and Maksimovic (2004) focus on the role
of country-level financial and institutional development in overcoming the constraining
effect of financing obstacles, we analyze firm characteristics that explain differences in
reported financing obstacles.
The remainder of the paper is organized as follows. Section 2 presents the related
literature and the motivation for our analysis. In section 3 we discuss the data and report
summary statistics. Section 4 discusses the empirical methodology. Section 5 explores the
firm characteristics that predict financing obstacles. Section 6 explores the effect of
country-level financial and institutional development on financing obstacles and section 7
concludes.
2. Related Literature and Motivation
Since the work by FHP, several methodologies have been suggested to test
empirically the presence of financing constraints. Following FHP, most studies derive an
empirical specification from the firm’s investment Euler equation that describes the firm’s
optimal investment pattern. One model is the q-model of investment, pioneered by Tobin
(1969) and extended to models of investment by Hayashi (1982). Financial frictions are
introduced to the model by adding financial variables such as cash flow. An alternative
approach, introduced by Abel (1980), is to derive an empirical specification from the firm’s
investment Euler equation describing the firm’s optimal investment pattern. The Euler

5
model of investment has been applied and further developed by Abel and Blanchard
(1986), Bond and Meghir (1994), and Gilchrist and Himmelberg (1994, 1998), among
others. A third approach, introduced by Demirgüç-Kunt and Maksimovic (1998), estimates
a financial planning model to obtain the maximum growth rate firms can attain without
access to external finance. By comparing these growth rates with the actual growth rates of
firms, they are able to infer the degree to which firms are financially constrained.
The first two approaches basically imply that financially constrained firms have high
investment-cash flow sensitivity. Kaplan and Zingales (1997, 2000) question the validity of
this interpretation. They show that under certain assumptions, investment-cash flow
sensitivities may increase as financing constraints are relaxed. Almeida and Campello
(2001) draw similar conclusions. Povel and Raith (2002) find a U-shaped relationship
between cash flow and investment, further adding to the controversy about the
interpretation of cash-flow sensitivities. There also exist a number of methodological
problems with these two approaches. For example, Gomes (2001) shows that if cash flow is
a good proxy for future investment opportunities, significant investment-cash flow
sensitivities could arise even in the absence of financial frictions. More generally, Bond
and Van Reenen (1999) point out that investment-cash flow sensitivities could also be
indicating other sources of misspecification in the underlying investment models.
Following FHP it is usually assumed that there are cross-sectional differences in
effects of internal funds on firms’ investment, so that the investment equation should hold
across adjacent periods for a priori unconstrained firms but be violated for constrained
firms. This has led researchers to develop different a priori classifications of firms to
distinguish financially constrained and unconstrained firms. From a theoretical point of
view such sorting criteria should focus on a firm’s characteristics that are associated with
6
information costs. At the firm level, empirical studies have grouped firms by dividend
payouts (FHP), business group affiliation (Hoshi, Kashyap, and Scharfstein 1991), size and
age (Devereux and Schiantarelli 1990), the presence of bond ratings (Whited 1992), the
degree of shareholder concentration, or the pattern of insider trading (Oliner and
Rudebusch 1992). Previous work has also identified a number of determinants of financing
constraints at the country level. Demirgüç-Kunt and Maksimovic (1998) find that financing
constraints are lower in countries with more efficient legal systems. Love (2003) finds a
strong negative relationship between the sensitivity of investment to the availability of
internal funds and an indicator of financial market development, and concludes that
financial development reduces the effect of financing constraints on investment. Laeven
(2003) and Gelos and Werner (2002) find that financial liberalization relaxes financing
constraints of firms, in particular for smaller firms.
Kaplan and Zingales (1997) classify firms into categories of “not financially
constrained” to “financially constrained” based upon statements contained in annual
reports. They classify firms as being severely financially constrained if these companies are
in violation of debt covenants, have been cut out of their usual source of credit, are
renegotiating debt payments, or declare that they are forced to reduce investments because
of liquidity problems. Unfortunately, the problem with their analysis is that it is difficult to
make such classifications based on information contained in annual reports. Fazzari,
Hubbard and Petersen (2000) note that the firm-years Kaplan and Zingales (1997) classify
as most financially constrained are actually observations from years when firms are
financially distressed.
Our analysis contributes to the existing literature in two ways. First, by using survey
data on a firm’s perceived level of financing obstacles, we avoid having to imperfectly
7
infer financing constraints from financial statements of firms as in FHP and Kaplan and
Zingales (1997). This allows us to not only test the validity of the a priori group
classifications used in the literature to distinguish between financially constrained and
unconstrained firms, but also to assess more accurately the determinants of financing
obstacles. Second, as the database includes firms of all sizes from a large number of
countries with different levels of institutional development, we can determine more
precisely the most important firm-level predictors of financing obstacles.
The WBES includes a number of firm characteristics that we will relate to financing
obstacles as reported by the firms themselves. Each of the firm characteristics we focus on
in our tests has been used in the literature as proxy for information asymmetries or agency
costs to split samples of firms a priori into groups of financially constrained and
unconstrained firms. First, we will test whether size or age predicts financing obstacles.
The literature has proposed that smaller and younger firms are financially more
constrained. For example, Gertler (1988) argues that information asymmetries are likely to
be especially large for young and newly-established firms, because creditors have not had
enough time to monitor such firms and because such firms have not had enough time to
build long-term relationships with suppliers of finance. Devereux and Schiantarelli (1990)
and Oliner and Rudebusch (1992), among others, have used age and size as a criteria to
classify firms into groups of financially constrained and unconstrained firms. Schiffer and
Weder (2001) have used the WBES survey to study how obstacles to doing business vary
across firms of different size and report, among others, that perceived financing obstacles
8
are higher for small firms than for large firms.1 We measure size by either the log of sales
or dummy variables indicating whether the firm is small, medium or large.
We also test whether stock market listing or business-group affiliation is correlated
with financing obstacles. The literature has proposed that information asymmetries of
listed firms are smaller on average due to the listing and reporting requirements of stock
exchanges (Oliner and Rudebusch 1992), and we therefore expect that firms that are listed
on a stock exchange face lower financing obstacles. Firms that belong to a business group
are conjectured to face lower financing obstacles, because these firms have access to the
internal cash flow of the group (Shin and Park 1999) and because these firms are more
likely to have close ties with banks (Hoshi, Kashyap, and Scharfstein 1991).
We also test whether geographical activity or ownership can explain differences in
the reporting of financing obstacles. Multinational or foreign-owned enterprises have easier
access to international sources of external financing and are therefore expected to report
lower financing obstacles (Sembenelli and Schiantarelli 1996, and Harrison and McMillan
2003). Government-owned enterprises are also expected to report lower financing obstacles
since in many countries they receive direct budgetary support from the government and
preferential treatment by government-owned financial institutions (Harrison and McMillan
2003, and Laeven 2003).
Since the WBES does not provide information on firms’ dividend payouts, we
unfortunately cannot test whether firms with higher dividend payouts report lower
financing obstacles, as presumed a priori in FHP. To control for the fact that country- or
sector-specific characteristics might drive the responses of the firms, we will include sector
1 Schiffer and Weder consider the relation between firm size and different obstacles, such as financing, corruption, infrastructure and macroeconomic policies. Unlike them, we focus on financing obstacles and unlike them we consider a wide array of firm characteristics.
9
and country dummies in the regression analysis and allow for correlation between error
terms of firms within countries.
Our methodology has the disadvantage of relying on unaudited self-reporting by
firms. Thus, it is possible that while firms report financing obstacles, they are actually not
constrained by them. However, Beck, Demirguc-Kunt and Maksimovic (2004) show that
many of these financing obstacles are related to firms’ growth rates, in the sense that firms
that report financing obstacles tend to be growth-constrained. In order to distinguish the
self-reported constraints from actual constraints, we will refer to the former as obstacles.
3. Data
The firm-level data are taken from the World Business Environment Survey
(WBES) which is a major firm-level survey conducted in 1999 and 2000 in 80 developing
and developed countries around the world and led by the World Bank.2 The main purpose
of the survey was to identify obstacles to firm performance and growth around the world.
Thus, the survey contains a large number of questions on the nature and severity of
obstacles, such as infrastructure, crime, macroeconomic policies, corruption, legal system
deficiencies and financing. The database also has information on firms’ characteristics,
such as ownership, sales, employment, and growth. The data also indicate whether a firm is
a multinational enterprise, i.e. whether it has operations in other countries, and the sector in
which the firm is producing. In total, over 10,000 firms were surveyed, with the number
varying across countries but with a minimum of 100 firms per country. The sample of
2 The World Bank created the steering committee of the WBES and many other developed and developing country agencies were involved under the supervision of EBRD and Harvard Center for International Development.

10
surveyed firms in each country was constructed to reflect the sectoral, ownership and size
structure. Data were mostly collected through personal interviews.3
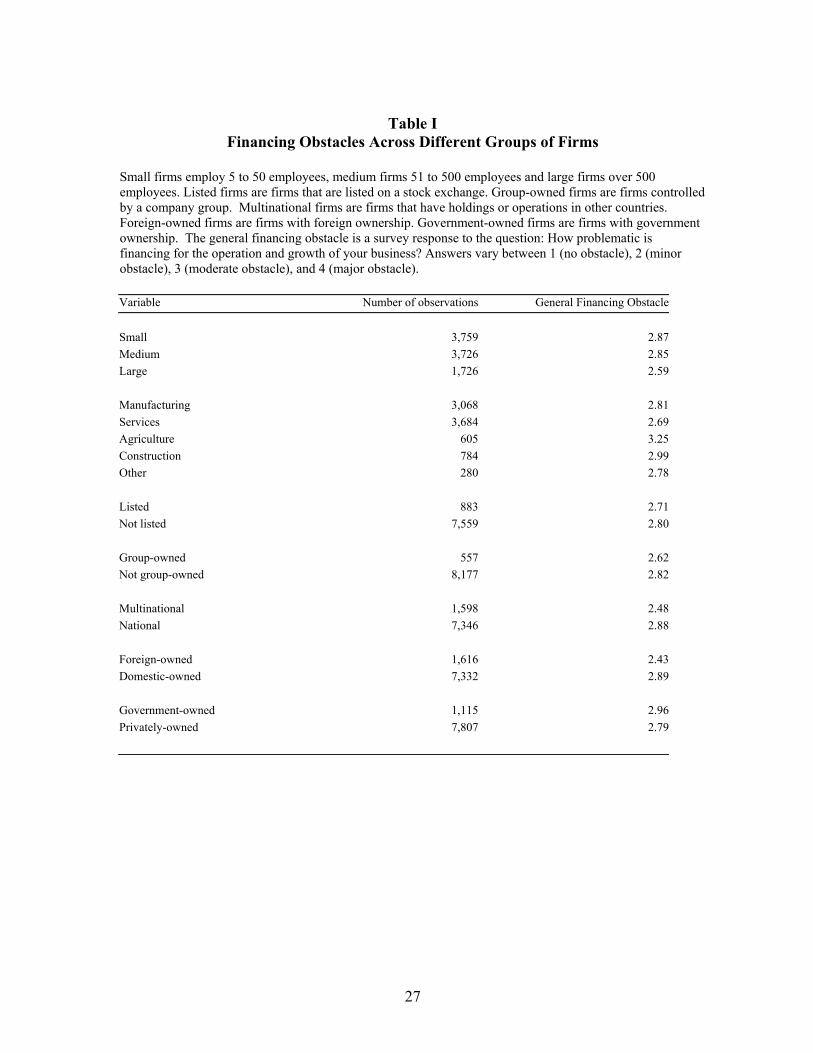
Table I reports the composition of our sample according to size, ownership and other
firm characteristics. An important strength of the database is its broad coverage of small
and medium firms; 80 percent of the firms included in the survey are classified as small (5
to 50 employees) or medium (51 to 500 employees), while 20 percent are classified as large
(more than 500 employees). Nearly 40 percent of our firms are in the service sector, while
more than 30 percent are in the manufacturing sector. Only 10 percent of the firms are
listed and even less are owned by business groups. Around 18 percent are multinational
enterprises and a similar number of firms are foreign owned. Around 12 percent of all
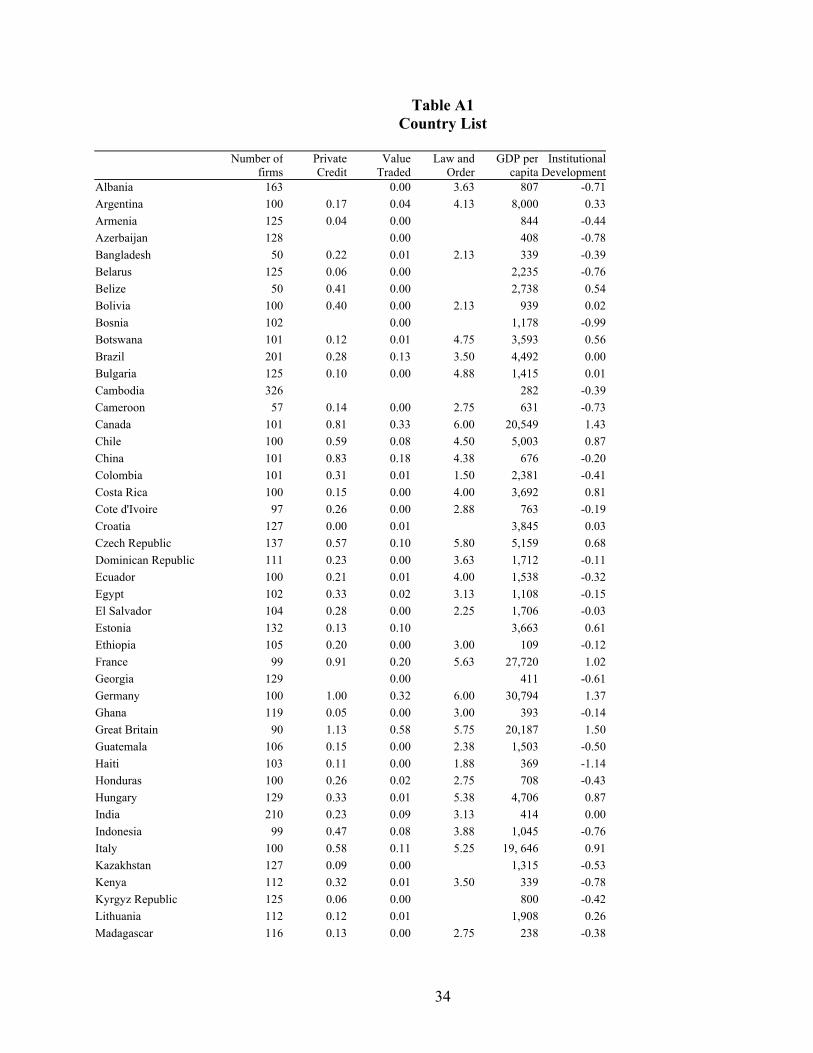
firms are government owned. Table A1 reports the number of firms for each country in our
sample.
In Table I we also report the average reported financing obstacle for each firm group.
Management of the surveyed firms was asked to rate how problematic financing is for the
operation and growth of their business. The perceived severity of the obstacles was
quantified by assigning them values between 4, major obstacle, and 1, no obstacle. 36% of
all firms rate financing as major obstacle, 27% as moderate, 18% as minor and 19% as no
obstacle. On average, larger, agricultural, non-listed, non-group-owned, national,
domestically owned and government-owned firms report larger financing constraints.
Some of these differences are also economically significant. Take the example of
firm size. The “average financing obstacle” for small and medium firms is 2.87 and 2.85,
respectively, while it is 2.59 for large firms. This translates into a 38.5% (37.7%)
probability for small (medium) firms that they rate financing as major obstacle, while it
3 For a more detailed discussion of the survey, see Batra, Kaufmann and Stone (2002). The data and documentation are available at http://info.worldbank.org/governance/wbes/index.html#wbes.

11
translates into a 28.5% probability for large firms.4 Of course, this simulation does not
control for other firm characteristics.
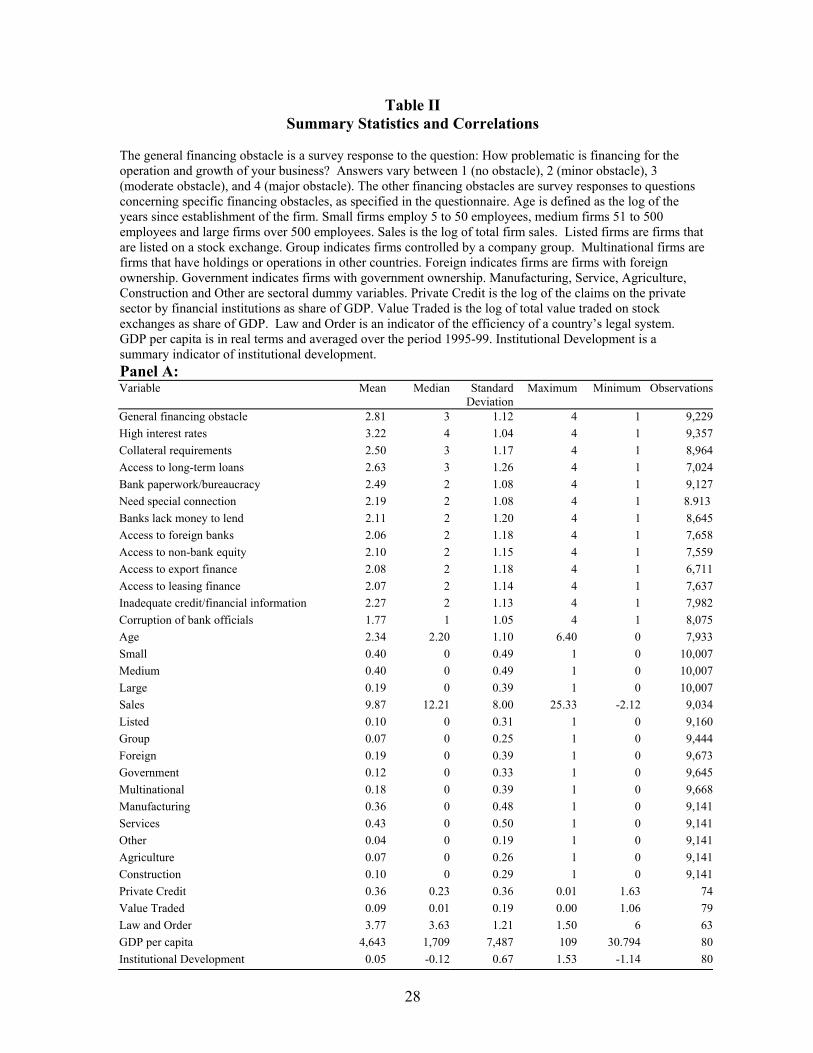
Table II provides summary statistics. In addition to the financial obstacle described
above, firms were also asked more detailed questions to understand the nature of obstacles
in the financial sector better. These questions relate to: (a) collateral requirements of banks
and financial institutions, (b) bank paperwork and bureaucracy, (c) high interest rates, (d)
need for special connections with banks and financial institutions, (e) banks’ lack of money
to lend, (f) access to foreign banks, (g) access to non-bank equity, (h) access to export
finance, (i) access to financing for leasing equipment, (j) inadequate credit and financial
information on customers, (k) access to long-term loans, and (l) whether corruption of bank
officials creates a problem.
High interest rates top the lists of specific financial obstacles, followed by the lack of
access to long-term loans.5 More than half of the firms in our sample rate high interest rates
as a major obstacle. Corruption of bank officials, on the other hand, is rated as only a
minor obstacle. More than half of all surveyed firms rate it as no obstacle.
We also include several country-level variables in our analysis, all of which are
averaged over the period 1995-99. As indicators of financial development we use private
credit, value traded and law and order. Private credit is an indicator of financial
intermediary development and equals the claims of financial institutions on the private 4 To obtain these probabilities, we run an ordered probit regression on dummy variables for small and medium firms and then calculate the probability that small, medium and large firms report financing as major obstacle. 5 To assess whether the responses to the survey question on interest rates simply reflect high interest rates in general (both deposit and lending rates) or a high wedge between deposit and lending rates, we explore correlations with bank- and country-level indicators of interest margins and spreads. The correlation between high interest rates and the net interest rate margins as share of assets is 50%, significant at the 1% level. The correlation with the interest spread, the difference between average lending and average deposit rate, is 55%. This significant relationship holds even after controlling for the level of real lending interest rates. Data on margins and spreads are from Bankscope and International Financial Statistics, respectively.
12
sector as a share of GDP. Value traded is an indicator of stock market development and
equals the total volume traded on stock exchanges relative to GDP. Both private credit and
value traded have been shown to have a causal relation with economic growth (Beck,
Levine, and Loayza 2000 and Beck and Levine 2003). Law and order is an indicator of the
efficiency of the legal systems and indicates the degree to which citizens of a country trust
the legal system to resolve disputes. Institutional development is an aggregate indicator of
the institutional environment in which firms operate. The underlying data are from
Kaufman, Kraay and Mastruzzi (2003) and include information on voice and accountability
in the political system, the quality and consistency of regulations and regulatory
enforcement in the country, political stability, the rule of law, the lack of official
corruption, and the effectiveness the government bureaucracy.6 Both law and order and
institutional development increase in legal system efficiency and institutional development,
respectively. Finally, we include GDP per capita to measure economic development.
Table A1 lists the values for all five variables for the countries in our sample. Table II
shows that there is a large variation in financial development across countries, ranging
from Ukraine (0.01) to the U.S. (1.63) for the case of private credit.
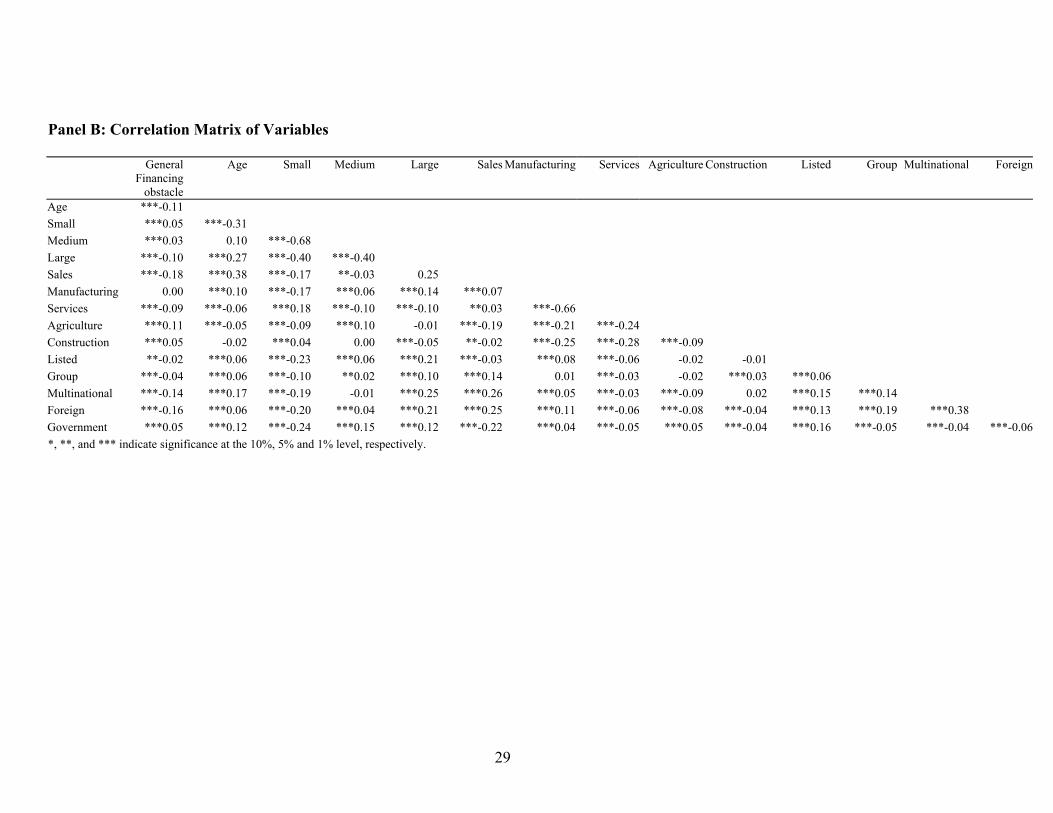
Panel B of Table II shows the correlation matrix between the general financing
obstacle and the different firm characteristics we are considering.7 Small and medium
firms report significantly higher financing obstacles than large firms, while financing
obstacles decrease in the age of the enterprise. Agricultural and construction firms seem to
face higher obstacles, whereas service firms report significantly lower financing obstacles.
The reported obstacles are significantly lower for listed firms, group-owned firms,
6 Unlike law and order, which focuses on legal system efficiency, institutional development is a much broader indicator. 7 We do not include the correlations between the country characteristics, which are all positively and significantly correlated with each other.

13
multinationals, foreign-owned and privately-owned firms. However, we also note that
many of these firm characteristics are correlated with each other. Firms in manufacturing
tend to be larger, as are listed firms and enterprises that are part of a business group. Older
firms tend to be larger, in manufacturing rather than in the service or construction industry,
more likely to be listed, part of a business group, a multinational enterprise and foreign or
government-owned firm. Listed firms are more likely to be owned by foreign owners or the
government. In order to determine which firm characteristics explain variation in financing
obstacles, we therefore conduct multivariate analysis.
4. Empirical Model
The simple statistics presented in section 3 indicate that there are significant
relations between firms’ financing obstacles and their characteristics. While these simple
correlations are suggestive, they do not control for potentially confounding variables. We
assume that the enterprise’s underlying response can be described by the following
equation:
Financing Obstaclei,k = α + β Firm Characteristicsi,k + γ Countryk+ εi,k, (1)
where financing obstacle is either the general financing obstacle or one of the specific
obstacles mentioned above, as reported by firm i in country k, and firm characteristics is a
vector of firm attributes. These attributes include the log of age, firm size (log of sales or
size dummies), sectoral dummy variables, and dummy variables for government-owned
firms, foreign-owned firms, multinational enterprises, listed firms, and business group
firms. Country is a vector of country dummies that allow us to control for unobserved
country-specific factors that might drive firms’ responses.
14
Given that financing obstacle is a polychotomous dependent variable with a natural
order, we use the ordered probit model to estimate regression (1). We assume that the
disturbance parameter ε has normal distribution and use standard maximum likelihood
estimation.8 Since omitted country characteristics might cause error terms to be correlated
for firms within countries, we allow for clustered error terms.
In a second step, we explore whether financial, institutional and economic
development helps alleviate financing obstacles. We therefore replace the country
dummies with the country-level variables described above.
5. Which firms report financing obstacles?
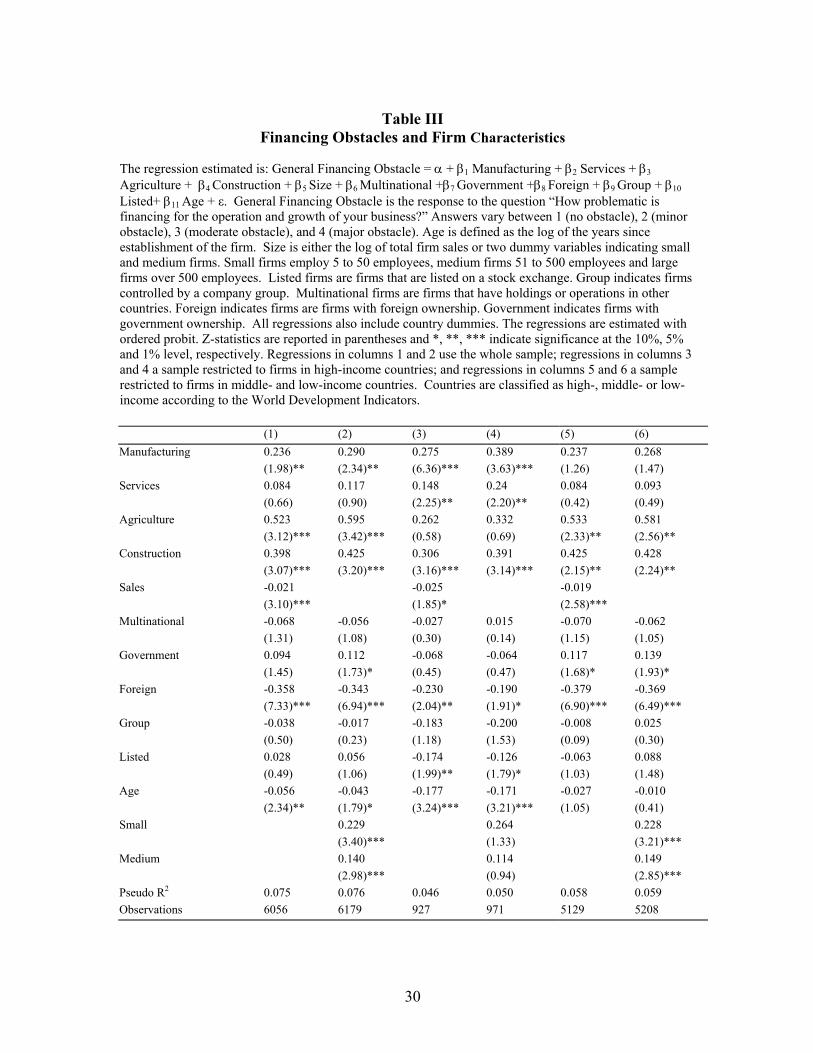
The regressions in columns 1 and 2 of Table III indicate that the size, age and
foreign ownership are the most robust predictors of financing obstacles. Since we include
country and sectoral dummies in all regressions, we control for country- and sector-specific
characteristics that might influence firms’ responses in the survey. We present results using
both the log of sales and dummy variables for small and medium firms as indicators of firm
size. Both the log of sales and the dummy variables for small and medium enterprises enter
significantly even when controlling for other firm characteristics that are conjectured to
determine financing obstacles. Small firms report significantly higher financing obstacles
than medium firms, and both report higher financing obstacles than large firms.9 Reported
financing obstacles decrease in the age of the enterprise. Foreign-owned firms report
significantly lower financing obstacles, even when controlling for other firm
8 Alternatively, we can assume a logistic function for the distribution of ε, resulting in the application of the logit model. However, it is difficult to justify the preference of one over the other, and in reality, the two models seem to give very similar results. See Greene (1997). 9 We test whether the coefficients of small and medium firms in column 2 in Table III are significantly different from each other. The null hypothesis of no difference between the coefficients is rejected at the 10% level, suggesting that there is a significant difference between the coefficients of small and medium firms in column 2.
15
characteristics. While firms that are not listed, are part of a company group or are
multinational enterprises also report lower financing obstacles, the coefficients are not
significant. We also find that government-owned firms report higher financing obstacles;
this result is only significant at the 10% level and in only one specification, however.
Finally, we note that manufacturing, agricultural and construction firms report larger
financing obstacles.
The regressions in columns 3-6 of Table III show significant differences between
firms in developed and developing countries. The regressions in columns 3 and 4 use a
sample restricted to high-income countries, while the regressions in columns 5 and 6 use a
sample restricted to middle- and low-income countries. In developed economies, size
seems to be less important in predicting firms’ financing obstacles, while age seems to be a
robust predictor; sales enters significantly only at the 10% level and neither of the two size
dummies enters significantly, while age enters significantly at the 1% level. There is weak
evidence that foreign-owned and listed firms report lower financing obstacles, both
variables enter negatively and significantly at the 5%-level in column 3 and significantly at
the 10% level in column 4. For firms in developing countries size is a robust predictor of
financing obstacles, while age is not. Foreign-owned firms in developing countries face
lower financing obstacles, while there is weak evidence (10%) that government-owned
firms face higher financing obstacles.
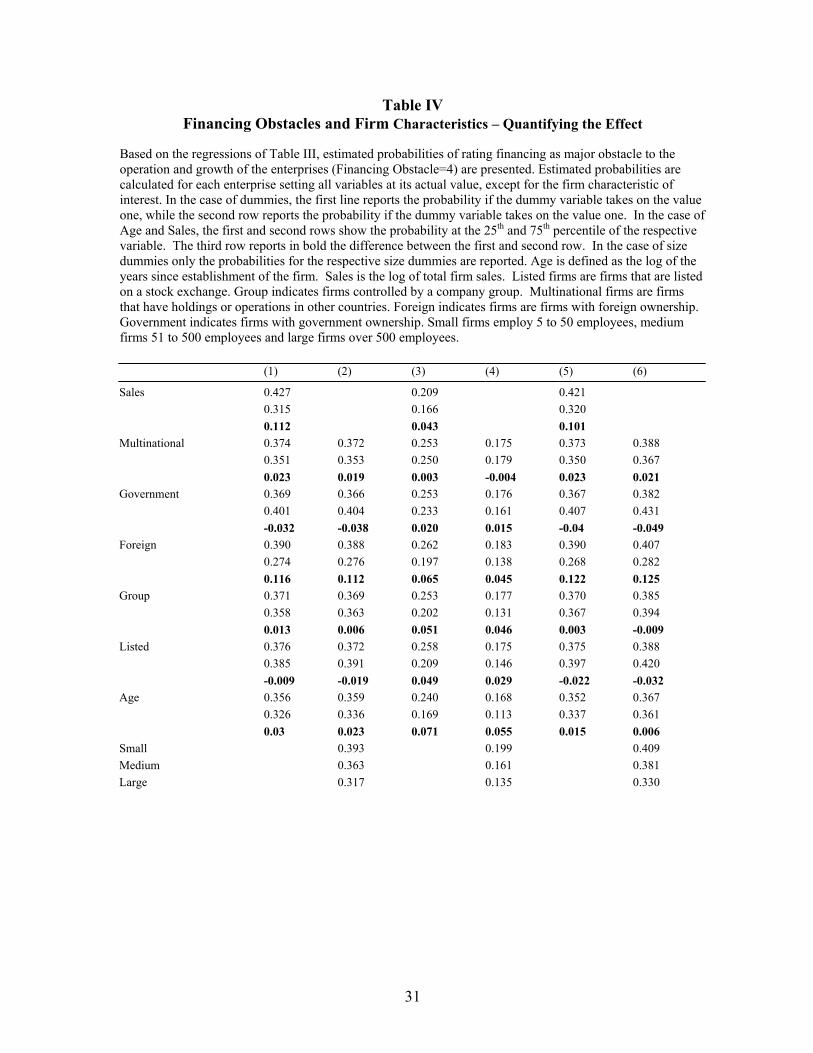
Table IV shows the economic significance of firm characteristics for their financing
obstacles. We report the estimated probability that a firm describes financing as a major
obstacle depending on its characteristics. Specifically, we set all variables at their actual
16
value, except for the firm characteristic of interest.10 In the case of dummy variables we
first report the estimated probability for firms for which the dummy takes on the value one
and then the estimated probability for firms for which the dummy takes on the value zero.
In the case of continuous variables, such as sales and age, we compare firms at the 25th and
the 75th percentile. In the overall sample and the developing country sample, foreign
ownership and size (as measured by sales) can each explain more than a 10 percentage
point difference in the probability that a firm describes financing as a major obstacle; this
seems substantial given that 36% of all firms in the sample rate financing as a major
obstacle. Considering the size dummies instead of the log of sales still yields substantial
differences between small and large firms, of around 6 to 7 percentage points.11 The
differences are significantly smaller for developed countries. Age, on the other hand, seems
to be the economically most important predictor of financing obstacles in developed
economies; moving from the 25th to the 75th percentile predicts at least 5.5 percentage point
decrease in the probability that a firm will describe financing as a major obstacle.
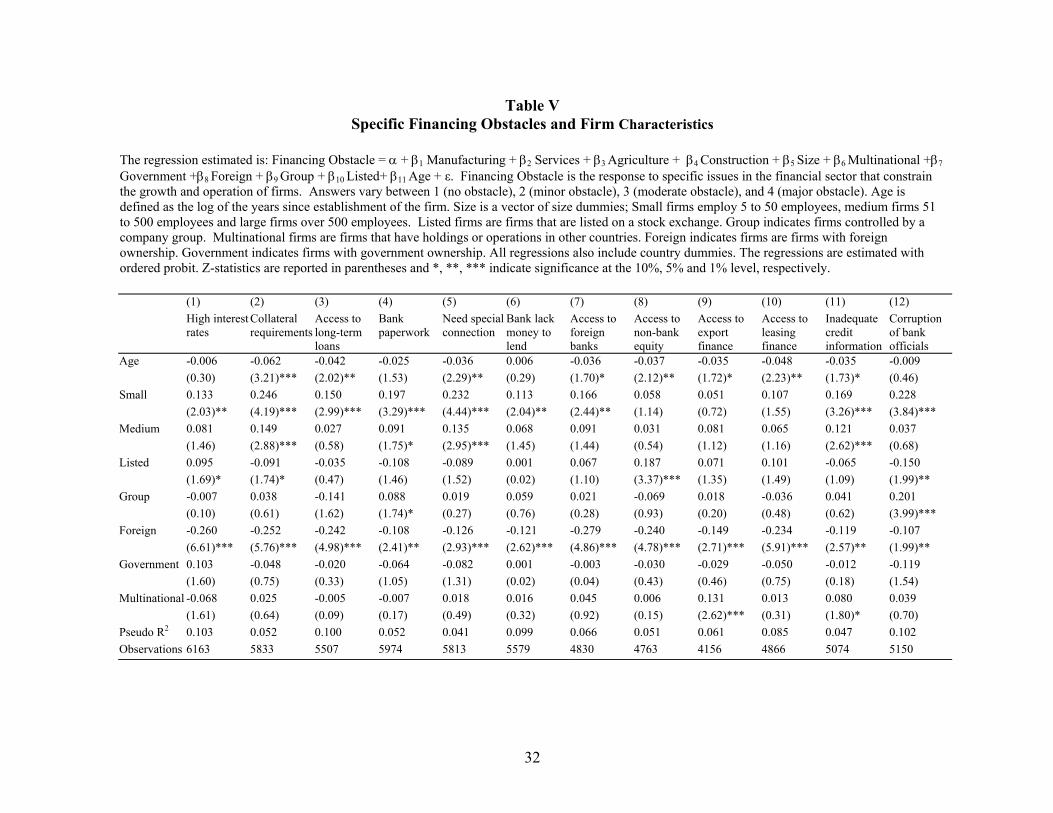
Table V confirms the findings that larger, older and foreign-owned firms report
lower obstacles. Here we report the results for regressions of specific financing obstacles
on firm characteristics. As before we control for country and sectoral dummies, although
we do not report them. Here, we only report results using size dummies as size indicators;
estimations using the log of sales yield similar results and are available on request. The
small firm dummy enters positively and significantly in most regressions, with the
exception of access to non-bank finance, export finance and leasing finance. Medium-sized
firms report higher obstacles than large firms due to collateral requirements, paperwork
10 Due to the non-linear nature of the estimation, we cannot interpret the regression coefficients as marginal effects. 11 This is of course smaller than the effects reported in section 3, since here we control for other firm characteristics.
17
(10%), the need for special connection, and credit information. Older firms seem to face
fewer obstacles in most areas, but not all. Specifically, age does not predict the degree of
obstacles of high interest rates, paperwork and bureaucracy, banks’ lack of money and
corrupt bank officials. As in Table III, foreign firms report significantly lower obstacles in
all sub-categories, while multinational enterprises do not seem to face lower obstacles,
except when it comes to access to export finance and inadequate credit information (10%),
where they actually report higher obstacles. Interestingly, while we did not find a
significant relation between the general financing obstacle and the fact that a firm is listed
or not, when controlling for other firm characteristics, we do find that listed firms report
facing significantly less obstacles when it comes to collateral requirements (10%) and
corruption of bank officials. Surprisingly, listed firms report higher obstacles in their access
to non-bank equity and interest rates (10%). Finally, firms that belong to company groups
report facing higher obstacles due to corruption of bank officials and paperwork and
bureaucracy (10%).
Overall, the results in Tables III, IV and V consistently point to the young, small
and domestically owned firms as facing higher obstacles than other firms. These results are
consistent with some of the findings in the financing constraints literature. For example,
using age as a criterion for grouping firms, both Devereux and Schiantarelli (1990) and
Oliner and Rudebusch (1992) find that younger firms have higher investment-cash flow
sensitivity, suggesting these firms face higher financing constraints. However, using size as
attribute has led to mixed results. For example, Oliner and Rudebusch (1992) do not find
significantly different investment-cash flow sensitivities for small and large firms, and
Devereux and Schiantarelli (1990) even find that large firms have higher investment-cash
flow sensitivities than small firms. Our result that domestic firms face higher obstacles than
18
foreign firms is consistent with Harrison and McMillan (2003) who find that investment-
cash flow sensitivity is higher for domestic firms than for foreign firms.
While Hoshi, Kashyap and Scharfstein (1991) and Shin and Park (1999) find lower
investment-cash flow sensitivities for firms that belong to a business group, suggesting
these firms face lower financing constraints, we do not find that firms that belong to a
business group report lower financing obstacles. We also do not find that being listed
affects the level of financing obstacles, although Oliner and Rudebusch (1992) have used
listing as a criteria for grouping firms and have found that listed firms have lower
investment-cash flow sensitivities, suggesting these firms face lower financing constraints.
We note, however, that the fact that our sample includes only few listed firms and firms
that belong to a business group, might bias our results toward insignificant coefficients on
these two firm characteristics. Finally, we do not find that being a multinational or being
state-owned significantly affects the level of financing obstacles reported, although
Harrison and McMillan (2003) find that multinational and state-owned firms were less
financially constrained than other domestic enterprises as measured by investment-cash
flow sensitivities.
Our findings indicate that sorting firms according to their size, age and ownership
structure (foreign versus domestic ownership) in order to test the effect of financing
obstacles leads to reasonable classifications. Classification criteria such as being listed,
being a multinational enterprise or belonging to a business group might be misleading,
since they might represent spurious correlations. This also suggests that classification
criteria based on size, age, and ownership are most useful in testing the presence of
financing constraints and identifying financially constrained firms.
19
6. Firms’ Financing Obstacles and Country Characteristics
So far we have considered firm-level characteristics and their relation with
financing obstacles. As described in section 2, previous research has shown that financial
and legal system development alleviates financing obstacles. We therefore assess whether
variation in firms’ financing obstacles can be explained by cross-country variation in (i)
financial intermediary development, (ii) stock market development, and (iii) legal system
efficiency. Since financial development, however, is highly correlated with economic and
institutional development, we include both GDP per capita and a summary indicator of
institutional development, which is broader than legal system efficiency. Including
country-level variables not only allows for testing the effect of specific country
characteristics on firms’ financing obstacles, but also constitutes a robustness test for the
firm-level regressions that only controlled for country-specific effects, but not country-
specific variables.
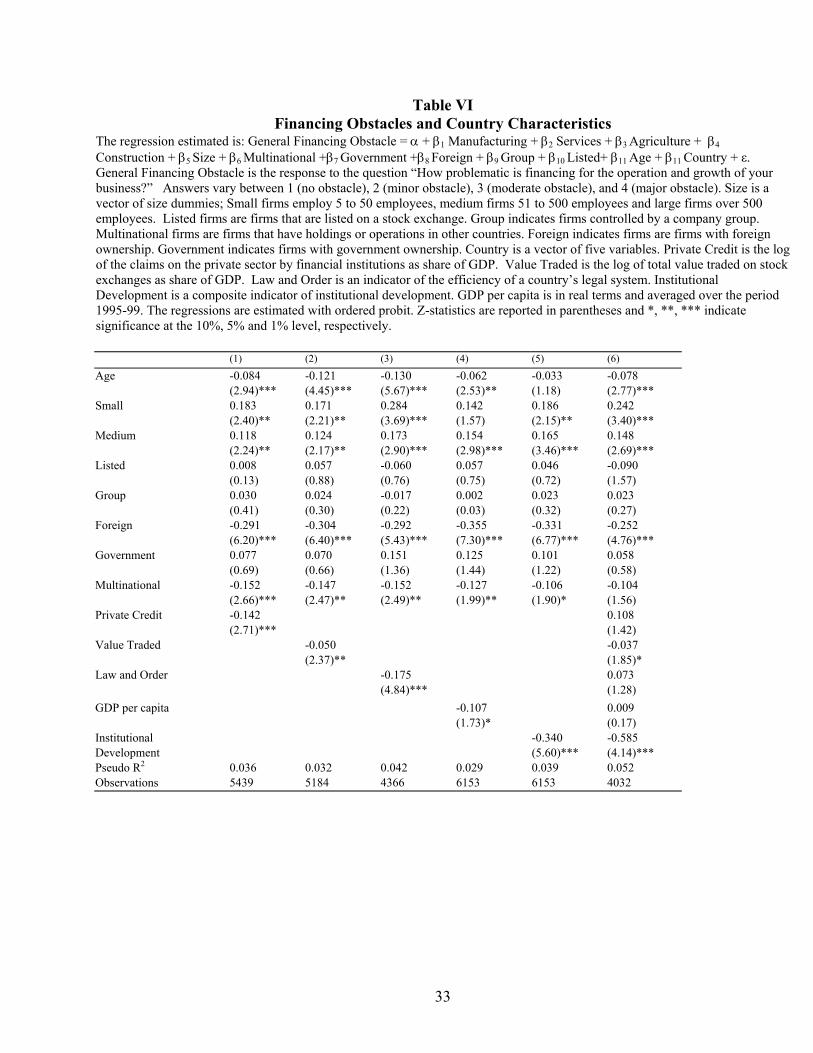
The Table VI results indicate that firms in countries with higher levels of (i)
financial intermediary development, (ii) stock market development, (iii) legal system
efficiency, (iv) GDP per capita and (v) institutional development report lower financing
obstacles. Private credit, law and order, and institutional development enter negatively and
significantly at the 1% level, while value traded enters negatively and significantly at the
5% level and GDP per capita negatively and significantly at the 10% level. When we
include the five variables simultaneously, however, only institutional development enters
negatively and significantly at the 1% level; value traded enters negatively and
significantly at the 10% level. Since these results might be driven by the high correlation
between the country variables and thus multicollinearity, we tried different combinations of
the country characteristics; only institutional development enters significantly at the 1%
20
level when controlling for other country characteristics. The results also hold when we use
sales as the size indicator instead of the size dummies.12
The effect of institutional development is not only statistically, but also
economically significant. According to the estimates (column 5), firms in Uruguay (75th
percentile of institutional development) face a 12% point lower probability of rating
financing as a major obstacle than in Kyrgyz Republic (25th percentile). Overall, these
results seem to indicate that broad institutional development is important in alleviating
firms’ financing obstacles. While firms in financially and economically more developed
countries face lower financing obstacles, the underlying institutions driving both economic
and financial development seem to be the most important country characteristic explaining
firms’ financing obstacles. These findings also suggest that it is hard to distinguish the
effects of financial, legal and economic development from the underlying institutional
development.
When we include country-level variables, the firm characteristics we previously
found to be significant in predicting firms’ financing obstacles continue to enter
significantly; larger, older and foreign-owned firms report lower obstacles. Unlike in the
Table III regressions, multinational also enters negatively and significantly in all but one
regression, indicating that multinational companies face lower financing obstacles; this
effect, however, is due to the smaller sample, which we utilize in Table VI compared to
Table III.13
12 We also ran regressions controlling for growth, inflation and their respective volatility. The significance of institutional development is not affected, while none of the macroeconomic variables enters significantly. 13 When we re-run the Table III regressions with the sample limited to countries for which we have the country-level variables, multinational enters significantly.
21
7. Conclusions
In this paper we explore the firm characteristics that predict firms’ financing
obstacles. We find that age, size and ownership predict financing obstacles best; younger,
smaller and domestic firms report higher obstacles. Categorizing firms by their age, size
and ownership is therefore most useful when considering the effect of financial and
institutional development on firms’ financing obstacles.
Our results show that some of the a priori classifications used in the literature to
distinguish between financially constrained and unconstrained firms are more useful than
others. Importantly, some of these a priori groupings appear to be misleading as they
represent spurious correlations with other firm attributes. Given the limitations of existing
methods to estimate financing constraints directly from firm-level data, our results based
on survey data are an important contribution in improving our understanding of which firm
attributes best predict firms’ financing obstacles.
We also consider the effect of country characteristics on firms’ financing obstacles.
We find that firms in countries with higher levels of financial intermediary development,
more liquid stock markets, more efficient legal systems and higher GDP per capita report
lower financing obstacles. The most important country characteristic explaining cross-
country variation in firms’ financing obstacles, however, seems to be overall institutional
development.
22
References
Abel, A. (1980), “Empirical Investment Equations: An Integrative Framework”, in: K.
Brunner and A. Meltzer (eds.), On the State of Macroeconomics, Carnegie-
Rochester Conference Series 12, pp. 39-93.
Abel, A. and O. Blanchard (1986), “The Present Value of Profits and Cyclical
Movements in Investment”, Econometrica 54, 249-274.
Almeida, H. and M. Campello (2001), “Financial Constraints and Investment-Cash
Flow Sensitivities: New Research Directions”, mimeo, New York University.
Batra, G., Kaufmann, D and A. Stone (2002): Voices of the Firms 2000: Investment
Climate and Governance Findings of the World Business Environment Survey
(WBES), World Bank mimeo.
Beck, T., A. Demirgüç-Kunt, and V. Maksimovic (2004), “Financial and Legal
Constraints to Firm Growth: Does Size Matter?”, Journal of Finance, forthcoming.
Beck, T., R. Levine, and N. Loayza (2000), “Finance and the Sources of Growth”, Journal
of Financial Economics 58, 261-300.
Beck, T. and R. Levine (2003), “Stock Markets, Banks and Growth: Panel Evidence”,
Journal of Banking and Finance, forthcoming.
Blundell, R., S. R. Bond and C. Meghir (1996), “Econometric Models of Company
Investment”, in: Matyas, L. and P. Sevestre (ed.), The Econometrics of Panel Data:
A Handbook of the Theory with Applications, Advanced Studies in Theoretical and
Applied Econometrics, Volume 33, Kluwer Academic Publishers.
Bond, S. R. and C. Meghir (1994), “Dynamic Investment models and the Firm’s
Financial Policy”, Review of Economic Studies 61, 197-222.

23
Bond, S. and J. Van Reenen (1999), “Microeconomic Models of Investment and
Employment”, Forthcoming In: J. J. Heckman and E. E. Leamer (eds.), Handbook
of Econometrics, Volume 5, Elsevier Science, North-Holland, Amsterdam.
Demirgüç-Kunt, A. and V. Maksimovic (1998), “Law, Finance, and Firm Growth”,
Journal of Finance 53, 2107-2137.
Devereux, M. and F. Schiantarelli (1990), “Investment, Financial Factors and Cash Flow
from U.K. Panel Data”, in: G. Hubbard (ed.), Information, Capital Markets and
Investment, Chicago, IL: University of Chicago Press.
Fazzari, S., G. Hubbard and B. Petersen (1988), “Financing Constraints and Corporate
Investment”, Brookings Papers on Economic Activity 1, 141-95.
________________________________ (2000), “Investment-Cash Flow Sensitivities are
Useful: A Comment on Kaplan and Zingales”, Quarterly Journal of Economics
115, 695-705.
Gelos, G. and A. Werner (2002), “Financial Liberalization, Credit Constraints, and
Collateral: Investment in the Mexican Manufacturing Sector”, Journal of
Development Economics 67(1), 1-27.
Gertler, Mark (1988), “Financial Structure and Aggregate Economic Activity: An
Overview”, Journal of Money, Credit, and Banking 20, 559-596.
Gilchrist, S. and C. Himmelberg (1995), “Evidence on the Role of Cash Flow for
Investment”, Journal of Monetary Economics 36, 541-572.
__________________________ (1998), “Investment, Fundamentals and Finance”,
NBER Macroeconomics Annual: MIT Press.

24
Gomes, J. F. (2001), “Financing Investment”, American Economic Review 91(5), 1263-
1285.
Greene, W.H. (1997), Econometric Analysis, Third Edition, Upper Saddle River, New
Jersey: Prentice Hall.
Harrison, A. and M. McMillan (2003), “Does Direct Foreign Investment Affect Domestic
Firm Credit Constraints?”, Journal of International Economics 61(1), 73-100.
Hayashi, F. (1982), “Tobin’s Marginal q and Average q: A Neoclassical Interpretation”,
Econometrica 50(1), 213-224.
Hoshi, T., A. Kashyap, and D. Scharfstein (1991), “Corporate Structure, Liquidity and
Investment: Evidence from Japanese Industrial Groups”, Quarterly Journal of
Economics 106(1), 33-60.
Hubbard, G. (1998), “Capital Market Imperfections and Investment”, Journal of
Economic Literature 36(3), 193-225.
Kaplan, S. and L. Zingales (1997), “Do Investment-Cash Flow Sensitivities Provide
Useful Measures of Financing Constraints?”, Quarterly Journal of Economics 112,
169-215.
_____________________ (2000), “Investment-Cash Flow Sensitivities Are Not Valid
Measures of Financing Constraints”, Quarterly Journal of Economics 115, 707-
712.
Kaufman, D., Kraay, A. and M. Mastruzzi. (2003). “Governance Matters III: Governance
Indicators for 1996-2002”. World Bank Policy Research Working Paper 2196.
Laeven, L. (2003), “Does Financial Liberalization Reduce Financing Constraints?”,

25
Financial Management 32(1), 5-34.
Lamont, O. (1997), “Cash Flow and Investment: Evidence from Internal Capital
Markets”, Journal of Finance 52(1), 83-109.
Love, I. (2003), “Financial Development and Financing Constraints: International
Evidence from the Structural Investment Model”, Review of Financial Studies 16(3),
765-791.
Oliner, S. D. and G. D. Rudebusch (1992), “Sources of the Financing Hierarchy for
Business Investment”, Review of Economics and Statistics 74(2), 643-54.
Povel, P. and M. Raith (2002), “Optimal Investment Under Financial Constraints: the Roles
of Internal Funds and Asymmetric Information”, mimeo, Universities of Minnesota
and Rochester, July 2002.
Sembenelli, A. and F. Schiantarelli (1996), “Form of Ownership and Financial
Constraints”, Working Paper No. 1629, World Bank.
Schiantarelli, F. (1995), “Financial Constraints and Investment: A Critical Review of
Methodological Issues and International Evidence”, in: J. Peek and E. Rosengren
(eds.), Is Bank Lending Important for the Transmission of Monetary Policy?,
Boston, MA: Federal Reserve Bank of Boston.
Schiffer, M. and B. Weder (2001), “Firm Size and the Business Environment: Worldwide
Survey Results”, Discussion Paper No. 43, International Finance Corporation,
Washington, D.C., August 2001.
Shin, H.-H. and Y. S. Park (1999), “Financing Constraints and Internal Capital Markets:
Evidence from Korean ‘Chaebols’”, Journal of Corporate Finance 5(2), 169-191.
Tobin, J. (1969), “A General Equilibrium Approach to Monetary Theory”, Journal of

26
Money, Credit, and Banking 1(1), 15-29.
Whited, T. (1992), “Debt, Liquidity Constraints, and Corporate Investment: Evidence
from Panel Data”, Journal of Finance 47(4), 1425-60.
27
Table I
Financing Obstacles Across Different Groups of Firms
Small firms employ 5 to 50 employees, medium firms 51 to 500 employees and large firms over 500 employees. Listed firms are firms that are listed on a stock exchange. Group-owned firms are firms controlled by a company group. Multinational firms are firms that have holdings or operations in other countries. Foreign-owned firms are firms with foreign ownership. Government-owned firms are firms with government ownership. The general financing obstacle is a survey response to the question: How problematic is financing for the operation and growth of your business? Answers vary between 1 (no obstacle), 2 (minor obstacle), 3 (moderate obstacle), and 4 (major obstacle). Variable Number of observations General Financing Obstacle Small 3,759 2.87Medium 3,726 2.85Large 1,726 2.59 Manufacturing 3,068 2.81Services 3,684 2.69Agriculture 605 3.25Construction 784 2.99Other 280 2.78 Listed 883 2.71Not listed 7,559 2.80 Group-owned 557 2.62Not group-owned 8,177 2.82 Multinational 1,598 2.48National 7,346 2.88 Foreign-owned 1,616 2.43Domestic-owned 7,332 2.89 Government-owned 1,115 2.96Privately-owned 7,807 2.79
28
Table II Summary Statistics and Correlations
The general financing obstacle is a survey response to the question: How problematic is financing for the operation and growth of your business? Answers vary between 1 (no obstacle), 2 (minor obstacle), 3 (moderate obstacle), and 4 (major obstacle). The other financing obstacles are survey responses to questions concerning specific financing obstacles, as specified in the questionnaire. Age is defined as the log of the years since establishment of the firm. Small firms employ 5 to 50 employees, medium firms 51 to 500 employees and large firms over 500 employees. Sales is the log of total firm sales. Listed firms are firms that are listed on a stock exchange. Group indicates firms controlled by a company group. Multinational firms are firms that have holdings or operations in other countries. Foreign indicates firms are firms with foreign ownership. Government indicates firms with government ownership. Manufacturing, Service, Agriculture, Construction and Other are sectoral dummy variables. Private Credit is the log of the claims on the private sector by financial institutions as share of GDP. Value Traded is the log of total value traded on stock exchanges as share of GDP. Law and Order is an indicator of the efficiency of a country’s legal system. GDP per capita is in real terms and averaged over the period 1995-99. Institutional Development is a summary indicator of institutional development. Panel A: Variable Mean Median Standard
DeviationMaximum Minimum Observations
General financing obstacle 2.81 3 1.12 4 1 9,229High interest rates 3.22 4 1.04 4 1 9,357Collateral requirements 2.50 3 1.17 4 1 8,964Access to long-term loans 2.63 3 1.26 4 1 7,024Bank paperwork/bureaucracy 2.49 2 1.08 4 1 9,127Need special connection 2.19 2 1.08 4 1 8.913Banks lack money to lend 2.11 2 1.20 4 1 8,645Access to foreign banks 2.06 2 1.18 4 1 7,658Access to non-bank equity 2.10 2 1.15 4 1 7,559Access to export finance 2.08 2 1.18 4 1 6,711Access to leasing finance 2.07 2 1.14 4 1 7,637Inadequate credit/financial information 2.27 2 1.13 4 1 7,982Corruption of bank officials 1.77 1 1.05 4 1 8,075Age 2.34 2.20 1.10 6.40 0 7,933Small 0.40 0 0.49 1 0 10,007Medium 0.40 0 0.49 1 0 10,007Large 0.19 0 0.39 1 0 10,007Sales 9.87 12.21 8.00 25.33 -2.12 9,034Listed 0.10 0 0.31 1 0 9,160Group 0.07 0 0.25 1 0 9,444Foreign 0.19 0 0.39 1 0 9,673Government 0.12 0 0.33 1 0 9,645Multinational 0.18 0 0.39 1 0 9,668Manufacturing 0.36 0 0.48 1 0 9,141Services 0.43 0 0.50 1 0 9,141Other 0.04 0 0.19 1 0 9,141Agriculture 0.07 0 0.26 1 0 9,141Construction 0.10 0 0.29 1 0 9,141Private Credit 0.36 0.23 0.36 0.01 1.63 74Value Traded 0.09 0.01 0.19 0.00 1.06 79Law and Order 3.77 3.63 1.21 1.50 6 63GDP per capita 4,643 1,709 7,487 109 30.794 80Institutional Development 0.05 -0.12 0.67 1.53 -1.14 80
29
Panel B: Correlation Matrix of Variables
General Financing
obstacle
Age Small Medium Large Sales Manufacturing Services Agriculture Construction Listed Group Multinational Foreign
Age ***-0.11Small ***0.05 ***-0.31Medium ***0.03 0.10 ***-0.68Large ***-0.10 ***0.27 ***-0.40 ***-0.40Sales ***-0.18 ***0.38 ***-0.17 **-0.03 0.25Manufacturing 0.00 ***0.10 ***-0.17 ***0.06 ***0.14 ***0.07Services ***-0.09 ***-0.06 ***0.18 ***-0.10 ***-0.10 **0.03 ***-0.66 Agriculture ***0.11 ***-0.05 ***-0.09 ***0.10 -0.01 ***-0.19 ***-0.21 ***-0.24Construction ***0.05 -0.02 ***0.04 0.00 ***-0.05 **-0.02 ***-0.25 ***-0.28 ***-0.09Listed **-0.02 ***0.06 ***-0.23 ***0.06 ***0.21 ***-0.03 ***0.08 ***-0.06 -0.02 -0.01Group ***-0.04 ***0.06 ***-0.10 **0.02 ***0.10 ***0.14 0.01 ***-0.03 -0.02 ***0.03 ***0.06Multinational ***-0.14 ***0.17 ***-0.19 -0.01 ***0.25 ***0.26 ***0.05 ***-0.03 ***-0.09 0.02 ***0.15 ***0.14Foreign ***-0.16 ***0.06 ***-0.20 ***0.04 ***0.21 ***0.25 ***0.11 ***-0.06 ***-0.08 ***-0.04 ***0.13 ***0.19 ***0.38Government ***0.05 ***0.12 ***-0.24 ***0.15 ***0.12 ***-0.22 ***0.04 ***-0.05 ***0.05 ***-0.04 ***0.16 ***-0.05 ***-0.04 ***-0.06*, **, and *** indicate significance at the 10%, 5% and 1% level, respectively.
30
Table III
Financing Obstacles and Firm Characteristics The regression estimated is: General Financing Obstacle = α + β1 Manufacturing + β2 Services + β3
Agriculture + β4 Construction + β5 Size + β6 Multinational +β7 Government +β8 Foreign + β9 Group + β10
Listed+ β11 Age + ε. General Financing Obstacle is the response to the question “How problematic is financing for the operation and growth of your business?” Answers vary between 1 (no obstacle), 2 (minor obstacle), 3 (moderate obstacle), and 4 (major obstacle). Age is defined as the log of the years since establishment of the firm. Size is either the log of total firm sales or two dummy variables indicating small and medium firms. Small firms employ 5 to 50 employees, medium firms 51 to 500 employees and large firms over 500 employees. Listed firms are firms that are listed on a stock exchange. Group indicates firms controlled by a company group. Multinational firms are firms that have holdings or operations in other countries. Foreign indicates firms are firms with foreign ownership. Government indicates firms with government ownership. All regressions also include country dummies. The regressions are estimated with ordered probit. Z-statistics are reported in parentheses and *, **, *** indicate significance at the 10%, 5% and 1% level, respectively. Regressions in columns 1 and 2 use the whole sample; regressions in columns 3 and 4 a sample restricted to firms in high-income countries; and regressions in columns 5 and 6 a sample restricted to firms in middle- and low-income countries. Countries are classified as high-, middle- or low-income according to the World Development Indicators. (1) (2) (3) (4) (5) (6) Manufacturing 0.236 0.290 0.275 0.389 0.237 0.268 (1.98)** (2.34)** (6.36)*** (3.63)*** (1.26) (1.47) Services 0.084 0.117 0.148 0.24 0.084 0.093 (0.66) (0.90) (2.25)** (2.20)** (0.42) (0.49) Agriculture 0.523 0.595 0.262 0.332 0.533 0.581 (3.12)*** (3.42)*** (0.58) (0.69) (2.33)** (2.56)** Construction 0.398 0.425 0.306 0.391 0.425 0.428 (3.07)*** (3.20)*** (3.16)*** (3.14)*** (2.15)** (2.24)** Sales -0.021 -0.025 -0.019 (3.10)*** (1.85)* (2.58)*** Multinational -0.068 -0.056 -0.027 0.015 -0.070 -0.062 (1.31) (1.08) (0.30) (0.14) (1.15) (1.05) Government 0.094 0.112 -0.068 -0.064 0.117 0.139 (1.45) (1.73)* (0.45) (0.47) (1.68)* (1.93)* Foreign -0.358 -0.343 -0.230 -0.190 -0.379 -0.369 (7.33)*** (6.94)*** (2.04)** (1.91)* (6.90)*** (6.49)*** Group -0.038 -0.017 -0.183 -0.200 -0.008 0.025 (0.50) (0.23) (1.18) (1.53) (0.09) (0.30) Listed 0.028 0.056 -0.174 -0.126 -0.063 0.088 (0.49) (1.06) (1.99)** (1.79)* (1.03) (1.48) Age -0.056 -0.043 -0.177 -0.171 -0.027 -0.010 (2.34)** (1.79)* (3.24)*** (3.21)*** (1.05) (0.41) Small 0.229 0.264 0.228 (3.40)*** (1.33) (3.21)*** Medium 0.140 0.114 0.149 (2.98)*** (0.94) (2.85)*** Pseudo R2 0.075 0.076 0.046 0.050 0.058 0.059 Observations 6056 6179 927 971 5129 5208
31
Table IV Financing Obstacles and Firm Characteristics – Quantifying the Effect
Based on the regressions of Table III, estimated probabilities of rating financing as major obstacle to the operation and growth of the enterprises (Financing Obstacle=4) are presented. Estimated probabilities are calculated for each enterprise setting all variables at its actual value, except for the firm characteristic of interest. In the case of dummies, the first line reports the probability if the dummy variable takes on the value one, while the second row reports the probability if the dummy variable takes on the value one. In the case of Age and Sales, the first and second rows show the probability at the 25th and 75th percentile of the respective variable. The third row reports in bold the difference between the first and second row. In the case of size dummies only the probabilities for the respective size dummies are reported. Age is defined as the log of the years since establishment of the firm. Sales is the log of total firm sales. Listed firms are firms that are listed on a stock exchange. Group indicates firms controlled by a company group. Multinational firms are firms that have holdings or operations in other countries. Foreign indicates firms are firms with foreign ownership. Government indicates firms with government ownership. Small firms employ 5 to 50 employees, medium firms 51 to 500 employees and large firms over 500 employees. (1) (2) (3) (4) (5) (6)
Sales 0.427 0.209 0.421 0.315 0.166 0.320 0.112 0.043 0.101 Multinational 0.374 0.372 0.253 0.175 0.373 0.388 0.351 0.353 0.250 0.179 0.350 0.367 0.023 0.019 0.003 -0.004 0.023 0.021 Government 0.369 0.366 0.253 0.176 0.367 0.382 0.401 0.404 0.233 0.161 0.407 0.431 -0.032 -0.038 0.020 0.015 -0.04 -0.049 Foreign 0.390 0.388 0.262 0.183 0.390 0.407 0.274 0.276 0.197 0.138 0.268 0.282 0.116 0.112 0.065 0.045 0.122 0.125 Group 0.371 0.369 0.253 0.177 0.370 0.385 0.358 0.363 0.202 0.131 0.367 0.394 0.013 0.006 0.051 0.046 0.003 -0.009 Listed 0.376 0.372 0.258 0.175 0.375 0.388 0.385 0.391 0.209 0.146 0.397 0.420 -0.009 -0.019 0.049 0.029 -0.022 -0.032 Age 0.356 0.359 0.240 0.168 0.352 0.367 0.326 0.336 0.169 0.113 0.337 0.361 0.03 0.023 0.071 0.055 0.015 0.006 Small 0.393 0.199 0.409 Medium 0.363 0.161 0.381 Large 0.317 0.135 0.330
32
Table V Specific Financing Obstacles and Firm Characteristics
The regression estimated is: Financing Obstacle = α + β1 Manufacturing + β2 Services + β3 Agriculture + β4 Construction + β5 Size + β6 Multinational +β7
Government +β8 Foreign + β9 Group + β10 Listed+ β11 Age + ε. Financing Obstacle is the response to specific issues in the financial sector that constrain the growth and operation of firms. Answers vary between 1 (no obstacle), 2 (minor obstacle), 3 (moderate obstacle), and 4 (major obstacle). Age is defined as the log of the years since establishment of the firm. Size is a vector of size dummies; Small firms employ 5 to 50 employees, medium firms 51 to 500 employees and large firms over 500 employees. Listed firms are firms that are listed on a stock exchange. Group indicates firms controlled by a company group. Multinational firms are firms that have holdings or operations in other countries. Foreign indicates firms are firms with foreign ownership. Government indicates firms with government ownership. All regressions also include country dummies. The regressions are estimated with ordered probit. Z-statistics are reported in parentheses and *, **, *** indicate significance at the 10%, 5% and 1% level, respectively. (1) (2) (3) (4) (5) (6) (7) (8) (9) (10) (11) (12) High interest
rates Collateral requirements
Access to long-term loans
Bank paperwork
Need special connection
Bank lack money to lend
Access to foreign banks
Access to non-bank equity
Access to export finance
Access to leasing finance
Inadequate credit information
Corruption of bank officials
Age -0.006 -0.062 -0.042 -0.025 -0.036 0.006 -0.036 -0.037 -0.035 -0.048 -0.035 -0.009 (0.30) (3.21)*** (2.02)** (1.53) (2.29)** (0.29) (1.70)* (2.12)** (1.72)* (2.23)** (1.73)* (0.46) Small 0.133 0.246 0.150 0.197 0.232 0.113 0.166 0.058 0.051 0.107 0.169 0.228 (2.03)** (4.19)*** (2.99)*** (3.29)*** (4.44)*** (2.04)** (2.44)** (1.14) (0.72) (1.55) (3.26)*** (3.84)*** Medium 0.081 0.149 0.027 0.091 0.135 0.068 0.091 0.031 0.081 0.065 0.121 0.037 (1.46) (2.88)*** (0.58) (1.75)* (2.95)*** (1.45) (1.44) (0.54) (1.12) (1.16) (2.62)*** (0.68) Listed 0.095 -0.091 -0.035 -0.108 -0.089 0.001 0.067 0.187 0.071 0.101 -0.065 -0.150 (1.69)* (1.74)* (0.47) (1.46) (1.52) (0.02) (1.10) (3.37)*** (1.35) (1.49) (1.09) (1.99)** Group -0.007 0.038 -0.141 0.088 0.019 0.059 0.021 -0.069 0.018 -0.036 0.041 0.201 (0.10) (0.61) (1.62) (1.74)* (0.27) (0.76) (0.28) (0.93) (0.20) (0.48) (0.62) (3.99)*** Foreign -0.260 -0.252 -0.242 -0.108 -0.126 -0.121 -0.279 -0.240 -0.149 -0.234 -0.119 -0.107 (6.61)*** (5.76)*** (4.98)*** (2.41)** (2.93)*** (2.62)*** (4.86)*** (4.78)*** (2.71)*** (5.91)*** (2.57)** (1.99)** Government 0.103 -0.048 -0.020 -0.064 -0.082 0.001 -0.003 -0.030 -0.029 -0.050 -0.012 -0.119 (1.60) (0.75) (0.33) (1.05) (1.31) (0.02) (0.04) (0.43) (0.46) (0.75) (0.18) (1.54) Multinational -0.068 0.025 -0.005 -0.007 0.018 0.016 0.045 0.006 0.131 0.013 0.080 0.039 (1.61) (0.64) (0.09) (0.17) (0.49) (0.32) (0.92) (0.15) (2.62)*** (0.31) (1.80)* (0.70) Pseudo R2 0.103 0.052 0.100 0.052 0.041 0.099 0.066 0.051 0.061 0.085 0.047 0.102 Observations 6163 5833 5507 5974 5813 5579 4830 4763 4156 4866 5074 5150
33
Table VI Financing Obstacles and Country Characteristics
The regression estimated is: General Financing Obstacle = α + β1 Manufacturing + β2 Services + β3 Agriculture + β4
Construction + β5 Size + β6 Multinational +β7 Government +β8 Foreign + β9 Group + β10 Listed+ β11 Age + β11 Country + ε. General Financing Obstacle is the response to the question “How problematic is financing for the operation and growth of your business?” Answers vary between 1 (no obstacle), 2 (minor obstacle), 3 (moderate obstacle), and 4 (major obstacle). Size is a vector of size dummies; Small firms employ 5 to 50 employees, medium firms 51 to 500 employees and large firms over 500 employees. Listed firms are firms that are listed on a stock exchange. Group indicates firms controlled by a company group. Multinational firms are firms that have holdings or operations in other countries. Foreign indicates firms are firms with foreign ownership. Government indicates firms with government ownership. Country is a vector of five variables. Private Credit is the log of the claims on the private sector by financial institutions as share of GDP. Value Traded is the log of total value traded on stock exchanges as share of GDP. Law and Order is an indicator of the efficiency of a country’s legal system. Institutional Development is a composite indicator of institutional development. GDP per capita is in real terms and averaged over the period 1995-99. The regressions are estimated with ordered probit. Z-statistics are reported in parentheses and *, **, *** indicate significance at the 10%, 5% and 1% level, respectively.
(1) (2) (3) (4) (5) (6)
Age -0.084 -0.121 -0.130 -0.062 -0.033 -0.078 (2.94)*** (4.45)*** (5.67)*** (2.53)** (1.18) (2.77)*** Small 0.183 0.171 0.284 0.142 0.186 0.242 (2.40)** (2.21)** (3.69)*** (1.57) (2.15)** (3.40)*** Medium 0.118 0.124 0.173 0.154 0.165 0.148 (2.24)** (2.17)** (2.90)*** (2.98)*** (3.46)*** (2.69)*** Listed 0.008 0.057 -0.060 0.057 0.046 -0.090 (0.13) (0.88) (0.76) (0.75) (0.72) (1.57) Group 0.030 0.024 -0.017 0.002 0.023 0.023 (0.41) (0.30) (0.22) (0.03) (0.32) (0.27) Foreign -0.291 -0.304 -0.292 -0.355 -0.331 -0.252 (6.20)*** (6.40)*** (5.43)*** (7.30)*** (6.77)*** (4.76)*** Government 0.077 0.070 0.151 0.125 0.101 0.058 (0.69) (0.66) (1.36) (1.44) (1.22) (0.58) Multinational -0.152 -0.147 -0.152 -0.127 -0.106 -0.104 (2.66)*** (2.47)** (2.49)** (1.99)** (1.90)* (1.56) Private Credit -0.142 0.108 (2.71)*** (1.42) Value Traded -0.050 -0.037 (2.37)** (1.85)* Law and Order -0.175 0.073 (4.84)*** (1.28) GDP per capita -0.107 0.009 (1.73)* (0.17) Institutional -0.340 -0.585 Development (5.60)*** (4.14)*** Pseudo R2 0.036 0.032 0.042 0.029 0.039 0.052 Observations 5439 5184 4366 6153 6153 4032
34
Table A1 Country List
Number of
firmsPrivate Credit
Value Traded
Law and Order
GDP per capita
Institutional Development
Albania 163 0.00 3.63 807 -0.71 Argentina 100 0.17 0.04 4.13 8,000 0.33 Armenia 125 0.04 0.00 844 -0.44 Azerbaijan 128 0.00 408 -0.78 Bangladesh 50 0.22 0.01 2.13 339 -0.39 Belarus 125 0.06 0.00 2,235 -0.76 Belize 50 0.41 0.00 2,738 0.54 Bolivia 100 0.40 0.00 2.13 939 0.02 Bosnia 102 0.00 1,178 -0.99 Botswana 101 0.12 0.01 4.75 3,593 0.56 Brazil 201 0.28 0.13 3.50 4,492 0.00 Bulgaria 125 0.10 0.00 4.88 1,415 0.01 Cambodia 326 282 -0.39 Cameroon 57 0.14 0.00 2.75 631 -0.73 Canada 101 0.81 0.33 6.00 20,549 1.43 Chile 100 0.59 0.08 4.50 5,003 0.87 China 101 0.83 0.18 4.38 676 -0.20 Colombia 101 0.31 0.01 1.50 2,381 -0.41 Costa Rica 100 0.15 0.00 4.00 3,692 0.81 Cote d'Ivoire 97 0.26 0.00 2.88 763 -0.19 Croatia 127 0.00 0.01 3,845 0.03 Czech Republic 137 0.57 0.10 5.80 5,159 0.68 Dominican Republic 111 0.23 0.00 3.63 1,712 -0.11 Ecuador 100 0.21 0.01 4.00 1,538 -0.32 Egypt 102 0.33 0.02 3.13 1,108 -0.15 El Salvador 104 0.28 0.00 2.25 1,706 -0.03 Estonia 132 0.13 0.10 3,663 0.61 Ethiopia 105 0.20 0.00 3.00 109 -0.12 France 99 0.91 0.20 5.63 27,720 1.02 Georgia 129 0.00 411 -0.61 Germany 100 1.00 0.32 6.00 30,794 1.37 Ghana 119 0.05 0.00 3.00 393 -0.14 Great Britain 90 1.13 0.58 5.75 20,187 1.50 Guatemala 106 0.15 0.00 2.38 1,503 -0.50 Haiti 103 0.11 0.00 1.88 369 -1.14 Honduras 100 0.26 0.02 2.75 708 -0.43 Hungary 129 0.33 0.01 5.38 4,706 0.87 India 210 0.23 0.09 3.13 414 0.00 Indonesia 99 0.47 0.08 3.88 1,045 -0.76 Italy 100 0.58 0.11 5.25 19, 646 0.91 Kazakhstan 127 0.09 0.00 1,315 -0.53 Kenya 112 0.32 0.01 3.50 339 -0.78 Kyrgyz Republic 125 0.06 0.00 800 -0.42 Lithuania 112 0.12 0.01 1,908 0.26 Madagascar 116 0.13 0.00 2.75 238 -0.38
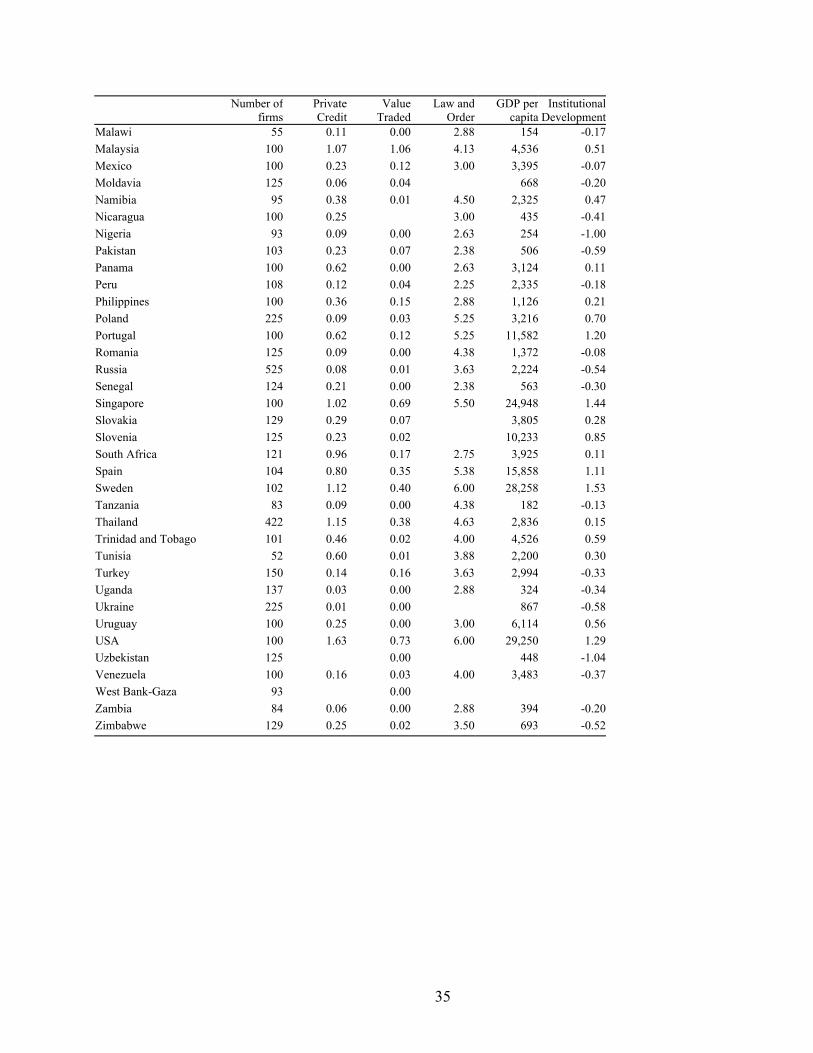
35
Number of firms
Private Credit
Value Traded
Law and Order
GDP per capita
Institutional Development
Malawi 55 0.11 0.00 2.88 154 -0.17 Malaysia 100 1.07 1.06 4.13 4,536 0.51 Mexico 100 0.23 0.12 3.00 3,395 -0.07 Moldavia 125 0.06 0.04 668 -0.20 Namibia 95 0.38 0.01 4.50 2,325 0.47 Nicaragua 100 0.25 3.00 435 -0.41 Nigeria 93 0.09 0.00 2.63 254 -1.00 Pakistan 103 0.23 0.07 2.38 506 -0.59 Panama 100 0.62 0.00 2.63 3,124 0.11 Peru 108 0.12 0.04 2.25 2,335 -0.18 Philippines 100 0.36 0.15 2.88 1,126 0.21 Poland 225 0.09 0.03 5.25 3,216 0.70 Portugal 100 0.62 0.12 5.25 11,582 1.20 Romania 125 0.09 0.00 4.38 1,372 -0.08 Russia 525 0.08 0.01 3.63 2,224 -0.54 Senegal 124 0.21 0.00 2.38 563 -0.30 Singapore 100 1.02 0.69 5.50 24,948 1.44 Slovakia 129 0.29 0.07 3,805 0.28 Slovenia 125 0.23 0.02 10,233 0.85 South Africa 121 0.96 0.17 2.75 3,925 0.11 Spain 104 0.80 0.35 5.38 15,858 1.11 Sweden 102 1.12 0.40 6.00 28,258 1.53 Tanzania 83 0.09 0.00 4.38 182 -0.13 Thailand 422 1.15 0.38 4.63 2,836 0.15 Trinidad and Tobago 101 0.46 0.02 4.00 4,526 0.59 Tunisia 52 0.60 0.01 3.88 2,200 0.30 Turkey 150 0.14 0.16 3.63 2,994 -0.33 Uganda 137 0.03 0.00 2.88 324 -0.34 Ukraine 225 0.01 0.00 867 -0.58 Uruguay 100 0.25 0.00 3.00 6,114 0.56 USA 100 1.63 0.73 6.00 29,250 1.29 Uzbekistan 125 0.00 448 -1.04 Venezuela 100 0.16 0.03 4.00 3,483 -0.37 West Bank-Gaza 93 0.00 Zambia 84 0.06 0.00 2.88 394 -0.20 Zimbabwe 129 0.25 0.02 3.50 693 -0.52
Recommended