Q3 2015
October 2015
The Deloitte CFO Survey
AuthorsIan StewartChief Economist020 7007 [email protected]
Debapratim DeSenior Economic Analyst020 7303 [email protected]
Alex ColeEconomic Analyst020 7007 [email protected]
ContactsIan StewartChief Economist020 7007 [email protected]
Richard MuschampCFO Programme Leader020 7007 [email protected]
For current and past copies of the survey, historical data and coverage of the survey in the media and elsewhere, please visit:
www.deloitte.co.uk/cfosurvey
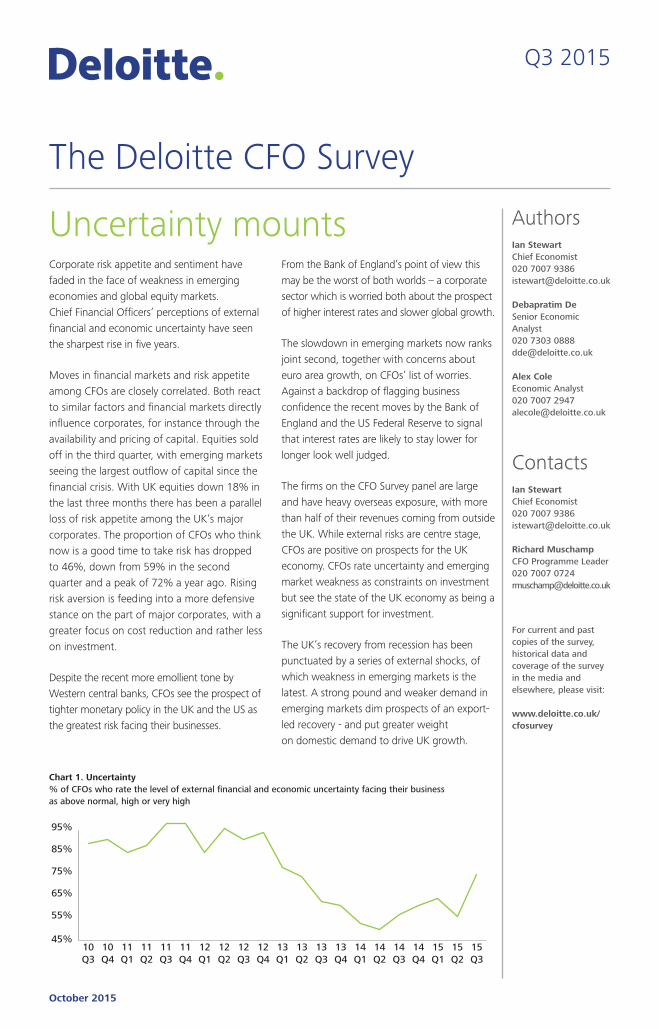
Uncertainty mountsCorporate risk appetite and sentiment have faded in the face of weakness in emerging economies and global equity markets. Chief Financial Officers’ perceptions of external financial and economic uncertainty have seen the sharpest rise in five years.
Moves in financial markets and risk appetite among CFOs are closely correlated. Both react to similar factors and financial markets directly influence corporates, for instance through the availability and pricing of capital. Equities sold off in the third quarter, with emerging markets seeing the largest outflow of capital since the financial crisis. With UK equities down 18% in the last three months there has been a parallel loss of risk appetite among the UK’s major corporates. The proportion of CFOs who think now is a good time to take risk has dropped to 46%, down from 59% in the second quarter and a peak of 72% a year ago. Rising risk aversion is feeding into a more defensive stance on the part of major corporates, with a greater focus on cost reduction and rather less on investment.
Despite the recent more emollient tone by Western central banks, CFOs see the prospect of tighter monetary policy in the UK and the US as the greatest risk facing their businesses.
From the Bank of England’s point of view this may be the worst of both worlds – a corporate sector which is worried both about the prospect of higher interest rates and slower global growth.
The slowdown in emerging markets now ranks joint second, together with concerns about euro area growth, on CFOs’ list of worries. Against a backdrop of flagging business confidence the recent moves by the Bank of England and the US Federal Reserve to signal that interest rates are likely to stay lower for longer look well judged.
The firms on the CFO Survey panel are large and have heavy overseas exposure, with more than half of their revenues coming from outside the UK. While external risks are centre stage, CFOs are positive on prospects for the UK economy. CFOs rate uncertainty and emerging market weakness as constraints on investment but see the state of the UK economy as being a significant support for investment.
The UK’s recovery from recession has been punctuated by a series of external shocks, of which weakness in emerging markets is the latest. A strong pound and weaker demand in emerging markets dim prospects of an export-led recovery - and put greater weight on domestic demand to drive UK growth.
Chart 1. Uncertainty% of CFOs who rate the level of external financial and economic uncertainty facing their business as above normal, high or very high
45%
55%
65%
75%
85%
95%
15Q3
15Q2
15Q1
14Q4
14Q3
14Q2
14Q1
13Q4
13Q3
13Q2
13Q1
12Q4
12Q3
12Q2
12Q1
11Q4
11Q3
11Q2
11Q1
10Q4
10Q3
Risk appetite down
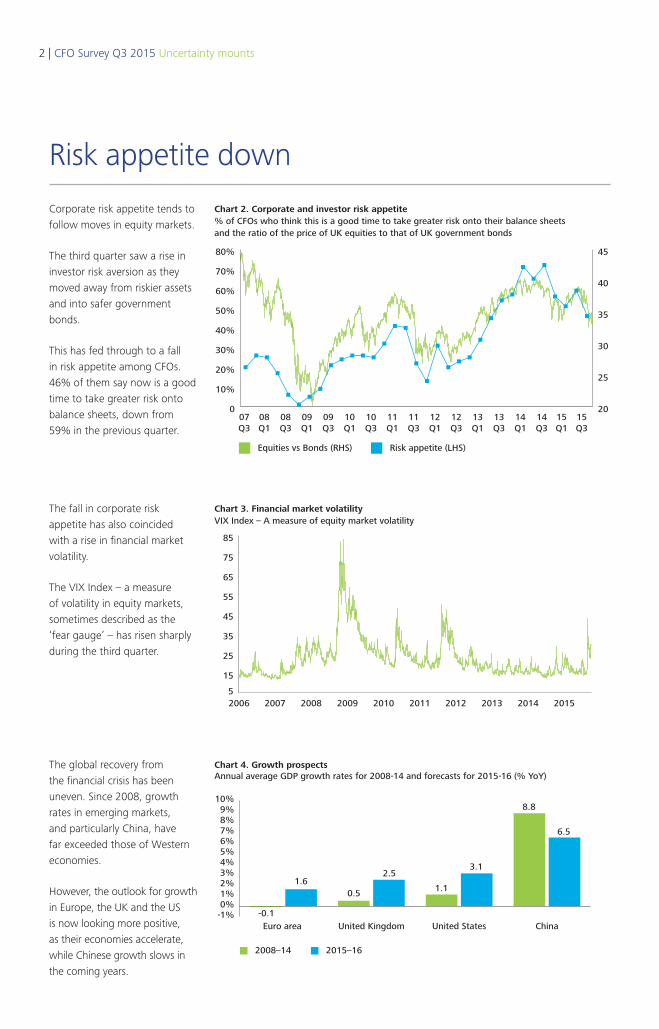
Corporate risk appetite tends to follow moves in equity markets.
The third quarter saw a rise in investor risk aversion as they moved away from riskier assets and into safer government bonds.
This has fed through to a fall in risk appetite among CFOs. 46% of them say now is a good time to take greater risk onto balance sheets, down from 59% in the previous quarter.
Chart 2. Corporate and investor risk appetite% of CFOs who think this is a good time to take greater risk onto their balance sheets and the ratio of the price of UK equities to that of UK government bonds
20
25
30
35
40
45
0
10%
20%
30%
40%
50%
60%
70%
80%
15Q3
15Q1
14Q3
14Q1
13Q3
13Q1
12Q3
12Q1
11Q3
11Q1
10Q3
10Q1
09Q3
09Q1
08Q3
08Q1
07Q3
Equities vs Bonds (RHS) Risk appetite (LHS)
The fall in corporate risk appetite has also coincided with a rise in financial market volatility.
The VIX Index – a measure of volatility in equity markets, sometimes described as the ‘fear gauge’ – has risen sharply during the third quarter.
Chart 3. Financial market volatilityVIX Index – A measure of equity market volatility
5
15
25
35
45
55
65
75
85
2015201420132012201120102009200820072006
The global recovery from the financial crisis has been uneven. Since 2008, growth rates in emerging markets, and particularly China, have far exceeded those of Western economies.
However, the outlook for growth in Europe, the UK and the US is now looking more positive, as their economies accelerate, while Chinese growth slows in the coming years.
Chart 4. Growth prospectsAnnual average GDP growth rates for 2008-14 and forecasts for 2015-16 (% YoY)
-1%0%1%2%3%4%5%6%7%8%9%
10%
ChinaUnited StatesUnited KingdomEuro area
2008–14 2015–16
-0.1
1.60.5
2.53.1
8.8
6.5
1.1
2 | CFO Survey Q3 2015 Uncertainty mounts

Rate rise biggest risk to business
Consumer confidence and business sentiment, which tend to move in the same direction, have diverged lately.
The large UK corporates on our survey panel are more exposed than consumers to weakness in emerging markets.
While consumer confidence is near a 15-year high in the UK, reflecting low inflation and rising wages, CFOs are far less optimistic about the financial prospects of their companies.
Chart 5. Business and confidenceNet % of CFOs who are more optimistic about financial prospects for their company now than three months ago
-70%
-50%
-30%
-10%
10%
30%
50%
70%
15Q3
15Q1
14Q3
14Q1
13Q3
13Q1
12Q3
12Q1
11Q3
11Q1
10Q3
10Q1
09Q3
09Q1
08Q3
08Q1
07Q3
Mor
e op
tim
isti
cLe
ss o
ptim
isti
c
1050
-5-10-15-20-25-30-35-40
Business confidence (LHS)
Consumer confidence (RHS)
Despite the recent more emollient tone by Western central banks, CFOs see the prospect of tighter monetary policy in the UK and the US as the greatest risk facing their businesses.
Concerns over weakness and volatility in emerging markets have also risen sharply in the third quarter, and CFOs now rate it as the second biggest risk to their businesses.
By contrast, concerns over the UK economy such as weak productivity, planned cuts in public spending, and the risk of asset price bubbles are at the bottom of CFOs’ worry list.
Chart 6. Risk to business posed by the following factorsWeighted average ratings on a scale of 0 - 100 where 0 stands for no risk and 100 stands for the highest possible risk
30 35 40 45 50
Poor productivity/weak competitiveness in the UK economy
Planned cuts in UK public expenditure in this parliament
A bubble in housing and/or other real and financial assets and the
risk of higher inflation
The UK referendum on membership of the EU
Weak demand in the UK
Deflation and economic weakness in the euro area, and the possibility
of a renewed euro crisis
Weakness and/or volatility in emerging markets and rising geopolitical risks
in Middle East/Ukraine
The prospect of higher interest rates and a general tightening of monetary
conditions in the UK and US
2015 Q3 2015 Q2
48
49
43
47
49
44
45
42
45
42
41
34
35
40
38
47
CFO Survey Q3 2015 Uncertainty mounts | 3
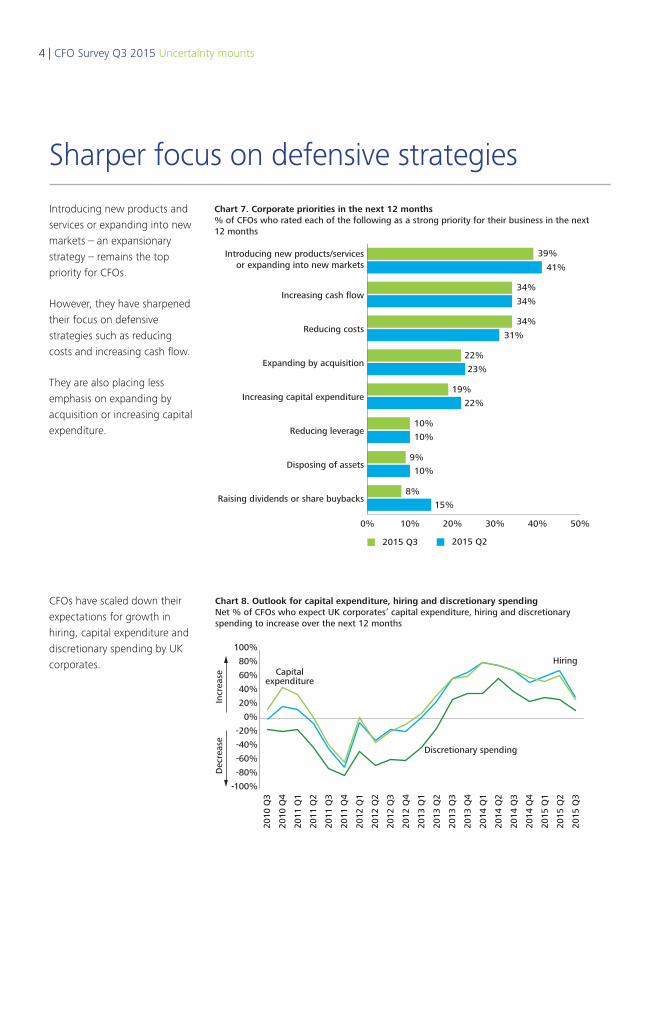
Sharper focus on defensive strategies
Introducing new products and services or expanding into new markets – an expansionary strategy – remains the top priority for CFOs.
However, they have sharpened their focus on defensive strategies such as reducing costs and increasing cash flow.
They are also placing less emphasis on expanding by acquisition or increasing capital expenditure.
2015 Q22015 Q3
22%
19%
23%
22%
10%
10%
9%
10%
15%
8%
34%
34%
31%
34%
41%
39%
Chart 7. Corporate priorities in the next 12 months% of CFOs who rated each of the following as a strong priority for their business in the next 12 months
0% 10% 20% 30% 40% 50%
Raising dividends or share buybacks
Disposing of assets
Reducing leverage
Increasing capital expenditure
Expanding by acquisition
Reducing costs
Increasing cash flow
Introducing new products/servicesor expanding into new markets
CFOs have scaled down their expectations for growth in hiring, capital expenditure and discretionary spending by UK corporates.
-100%
-80%
-60%
-40%
-20%
0%
20%
40%
60%
80%
100%
2015
Q2
2015
Q3
2015
Q1
2014
Q4
2014
Q3
2014
Q2
2014
Q1
2013
Q4
2013
Q3
2013
Q2
2013
Q1
2012
Q4
2012
Q3
2012
Q2
2012
Q1
2011
Q4
2011
Q3
2011
Q2
2011
Q1
2010
Q4
2010
Q3
HiringCapital
expenditure
Discretionary spending
Incr
ease
Dec
reas
e
Chart 8. Outlook for capital expenditure, hiring and discretionary spendingNet % of CFOs who expect UK corporates’ capital expenditure, hiring and discretionary spending to increase over the next 12 months
4 | CFO Survey Q3 2015 Uncertainty mounts

Uncertainty weighing on investment plans
Chart 9 compares the effect of nine key factors on corporate investment plans between Q3 2014 and now. The further the coloured lines in the chart are from the centre, the more the factor acts to support investment. Readings below five indicate that the factor acts as a depressant on investment.
Uncertainty continues to be the greatest constraint on investment plans.
Fiscal consolidation in the UK and weakness in emerging markets are the next biggest depressants. CFOs are particularly concerned about the slowdown in China. In response to another question, 60% of them said that it will have modest to significant negative effects on their business over the next 12 months.
Easy access to external funding, the state of the UK economy and rising demand for businesses’ products and services remain the main drivers of investment.
CFOs’ assessment of the effect of each of the following factors on their investment plans:Chart 9. Factors affecting corporate investment plans
On a 10-point scale where 0 implies the most negative effect and 10 the most positive
2014 Q3 - Effect over last 12 months2015 Q3 - Effect over last 12 months
Uncertainty about the economic and financial environment
Fiscal consolidation in the UK (tax rises, cuts in public spending)
Actual or expected levels of economic activity/GDP growth in the euro area
Actual or expected levels of economic activity/GDP growth in emerging markets
Actual or expected levels of economic activity/GDP growth in the rest of the world (including the US, Japan and Asia-Pacific)
Mor
e po
siti
ve
Availability of internal finance
Cost and availability of external finance
Actual or expected levels of economic activity/GDP growth
in the UK
Secular or long-term growth for products or services
2
01
456789
10
3
CFO Survey Q3 2015 Uncertainty mounts | 5

Financing conditions benign
The large corporates on our survey panel continue to have easy access to credit. The cost of credit remains close to its lowest level in eight years while credit availability is just shy of an eight-year high.
CFOs also rate debt finance – bank borrowing and bond issuance – as the most attractive source of external funding.
Chart 10. Cost and availability of creditNet % of CFOs reporting credit is costly and credit is easily available
-100%
-80%
-60%
-40%
-20%
0%
20%
40%
60%
80%
100%
15Q3
15Q1
14Q3
14Q1
13Q3
13Q1
12Q3
12Q1
11Q3
11Q1
10Q3
10Q1
09Q3
09Q1
08Q3
08Q1
07Q3
Cre
dit
is c
ostl
yC
red
it is
che
ap
Cred
it is available
Cost of credit (LHS)
Cost of credit (LHS)
Availability of credit (RHS)
Availability of credit (RHS)
Cred
it is hard to get
-100%
-80%
-60%
-40%
-20%
0%
20%
40%
60%
80%
100%
A majority of CFOs expect inflation to hover around the Bank of England’s 2.0% target in two years’ time.
However, a growing proportion anticipate considerably lower inflation, with almost 40% expecting it to be between 0 and 1.5%.
Chart 11. Inflation expectations% of CFOs who expect consumer price inflation in the UK to lie between the following ranges in two years’ time
0%
10%
20%
30%
40%
50%
60%
70%
Above 2.5%1.6%-2.5%0-1.5%
2015 Q2 2015 Q3
39%
31%
64%
5% 5%
56%
Markets have responded to recent communications from the US Federal Reserve and the Bank of England by pushing back their expectations for the timing of rate rises.
Over the third quarter, futures traders significantly lowered their interest rate expectations for the end of next year.
0.8
1.0
1.2
1.4
1.6
1.8
2.0
2.2
Sep-14 Nov-14 July-15 Sep-15Jan-14 Mar-15 May-15
Chart 12. Interest rate expectationsMarket expectations for 90-day sterling LIBOR in December 2016 (%)
6 | CFO Survey Q3 2015 Uncertainty mounts
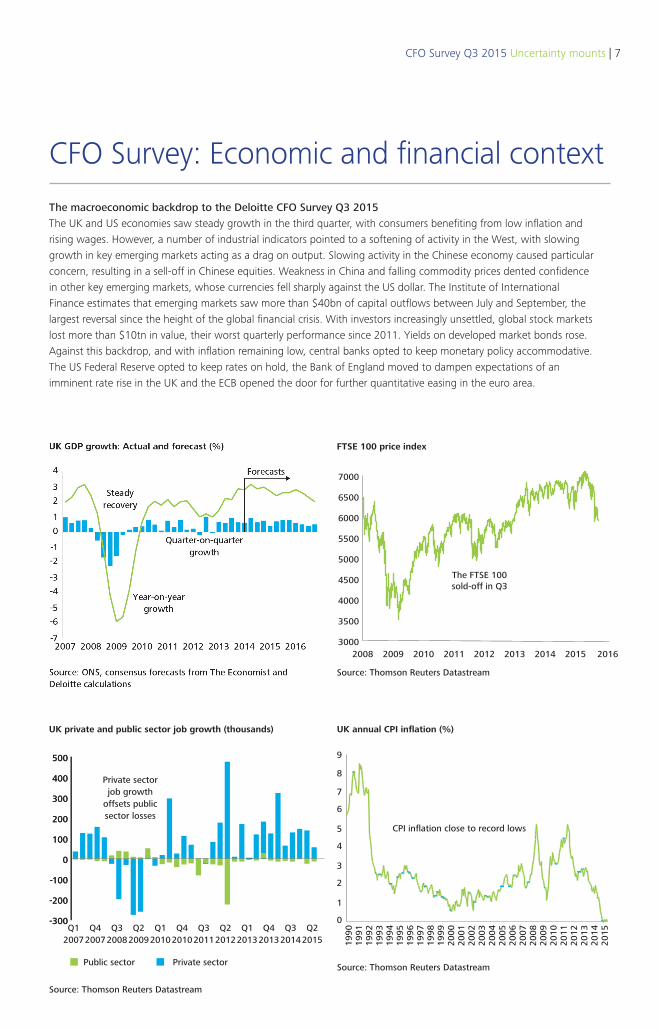
CFO Survey: Economic and financial context
The macroeconomic backdrop to the Deloitte CFO Survey Q3 2015The UK and US economies saw steady growth in the third quarter, with consumers benefiting from low inflation and rising wages. However, a number of industrial indicators pointed to a softening of activity in the West, with slowing growth in key emerging markets acting as a drag on output. Slowing activity in the Chinese economy caused particular concern, resulting in a sell-off in Chinese equities. Weakness in China and falling commodity prices dented confidence in other key emerging markets, whose currencies fell sharply against the US dollar. The Institute of International Finance estimates that emerging markets saw more than $40bn of capital outflows between July and September, the largest reversal since the height of the global financial crisis. With investors increasingly unsettled, global stock markets lost more than $10tn in value, their worst quarterly performance since 2011. Yields on developed market bonds rose. Against this backdrop, and with inflation remaining low, central banks opted to keep monetary policy accommodative. The US Federal Reserve opted to keep rates on hold, the Bank of England moved to dampen expectations of an imminent rate rise in the UK and the ECB opened the door for further quantitative easing in the euro area.
FTSE 100 price index
Source: Thomson Reuters Datastream
3000
3500
4000
4500
5000
5500
6000
6500
7000
201620152014201320122011201020092008
The FTSE 100sold-off in Q3
Private sector
UK private and public sector job growth (thousands)
Source: Thomson Reuters Datastream
Public sector
-300
-200
-100
0
100
200
300
400
500
Q22015
Q32014
Q42013
Q12013
Q22012
Q32011
Q42010
Q12010
Q22009
Q32008
Q42007
Q12007
-300
-200
-100
0
100
200
300
400
500
Private sectorjob growth
offsets publicsector losses
CPI inflation close to record lows
0
1
2
3
4
5
6
7
8
9
UK annual CPI inflation (%)
Source: Thomson Reuters Datastream
1990
1991
1992
1993
1994
1995
1996
1997
1998
1999
2000
2001
2002
2003
2004
2005
2006
2007
2008
2009
2010
2011
2012
2013
2014
2015
CFO Survey Q3 2015 Uncertainty mounts | 7

Deloitte refers to one or more of Deloitte Touche Tohmatsu Limited (“DTTL”), a UK private company limited by guarantee, and its network of member firms, each of which is a legally separate and independent entity. Please see www.deloitte.co.uk/about for a detailed description of the legal structure of DTTL and its member firms.
Deloitte LLP is the United Kingdom member firm of DTTL.
This publication has been written in general terms and therefore cannot be relied on to cover specific situations; application of the principles set out will depend upon the particular circumstances involved and we recommend that you obtain professional advice before acting or refraining from acting on any of the contents of this publication. Deloitte LLP would be pleased to advise readers on how to apply the principles set out in this publication to their specific circumstances. Deloitte LLP accepts no duty of care or liability for any loss occasioned to any person acting or refraining from action as a result of any material in this publication.
© 2015 Deloitte LLP. All rights reserved.
Deloitte LLP is a limited liability partnership registered in England and Wales with registered number OC303675 and its registered office at 2 New Street Square, London EC4A 3BZ, United Kingdom. Tel: +44 (0) 20 7936 3000 Fax: +44 (0) 20 7583 1198.
Designed and produced by The Creative Studio at Deloitte, London. J1723
Two-chart summary of key survey messages
About the surveyThis is the 33rd quarterly survey of Chief Financial Officers and Group Finance Directors of major companies in the UK. The 2015 third quarter survey took place between 9th and 28th September. 122 CFOs participated, including the CFOs of 23 FTSE 100 and 56 FTSE 250 companies. The rest were CFOs of other UK-listed companies, large private companies and UK subsidiaries of major companies listed overseas. The combined market value of the 80 UK-listed companies surveyed is £393 billion, or approximately 19% of the UK quoted equity market. The Deloitte CFO Survey is the only survey of major corporate users of capital that gauges attitudes to valuations, risk and financing. To join our panel of CFO respondents and for additional copies of this report, please contact Anthea Neagle on 020 7303 0116 or email [email protected].
Business and consumer confidenceNet % of CFOs who are more optimistic about financial prospects for their company now than three months ago and the GfK consumer confidence index
-70%
-50%
-30%
-10%
10%
30%
50%
70%
15Q3
15Q1
14Q3
14Q1
13Q3
13Q1
12Q3
12Q1
11Q3
11Q1
10Q3
10Q1
09Q3
09Q1
08Q3
08Q1
07Q3
Mor
e op
tim
isti
cLe
ss o
ptim
isti
c
1050
-5-10-15-20-25-30-35-40
Business confidence (LHS)
Consumer confidence (RHS)
Corporate and investor risk appetite% of CFOs who think this is a good time to take greater risk onto their balance sheets and the ratio of the price of UK equities to that of UK government bonds
20
25
30
35
40
45
0
10%
20%
30%
40%
50%
60%
70%
80%
15Q3
15Q1
14Q3
14Q1
13Q3
13Q1
12Q3
12Q1
11Q3
11Q1
10Q3
10Q1
09Q3
09Q1
08Q3
08Q1
07Q3
Equities vs Bonds (RHS) Risk appetite (LHS)
8 | CFO Survey Q3 2015 Uncertainty mounts
Recommended