International Journal of Animal Health and Livestock Production Research
Vol.2, No.1, pp.18-38, February 2016
___Published by European Centre for Research Training and Development UK (www.eajournals.org)
18
THE COMPETITIVENESS OF DAIRY FARMERS BASED FRESH MILK
MARKETING ON AGRO-TOURISM
Andina Oktariani, Arief Daryanto, Idqan Fahmi
Departement of Economic Science, Faculty of Economics and Management, Postgraduate
Bogor Agricultural University
ABSTRACT: The development of the fresh milk marketing becomes an important point in
capturing the unreached domestic market by using creative economy approach through agro-
tourism. This study aimed to analyze the competitiveness of dairy farmers on fresh milk
marketing to agro-tourism based milk processing companies; and analyze the impact of agro-
tourism based fresh milk marketing and the impact of government policies on the
competitiveness of the dairy farmers that market fresh milk to agro-tourism based milk
processing companies. The analysis method was the Policy Analysis Matrix. The research
results showed that dairy farmers have been profitable and have competitive and comparative
advantages. The policies impact to input-output still could not maximize profits at the farmer
level. The sensitivity analysis showed that agro-tourism effects increase both competitive and
comparative advantages despite of raising the feed prices up to 30% at the same time. The
agro-tourism based dairy agribusiness needs to be developed.
KEYWORDS: Competitiveness, Dairy farmers, Fresh Milk Marketing, Agro-Tourism, PAM
INTRODUCTION
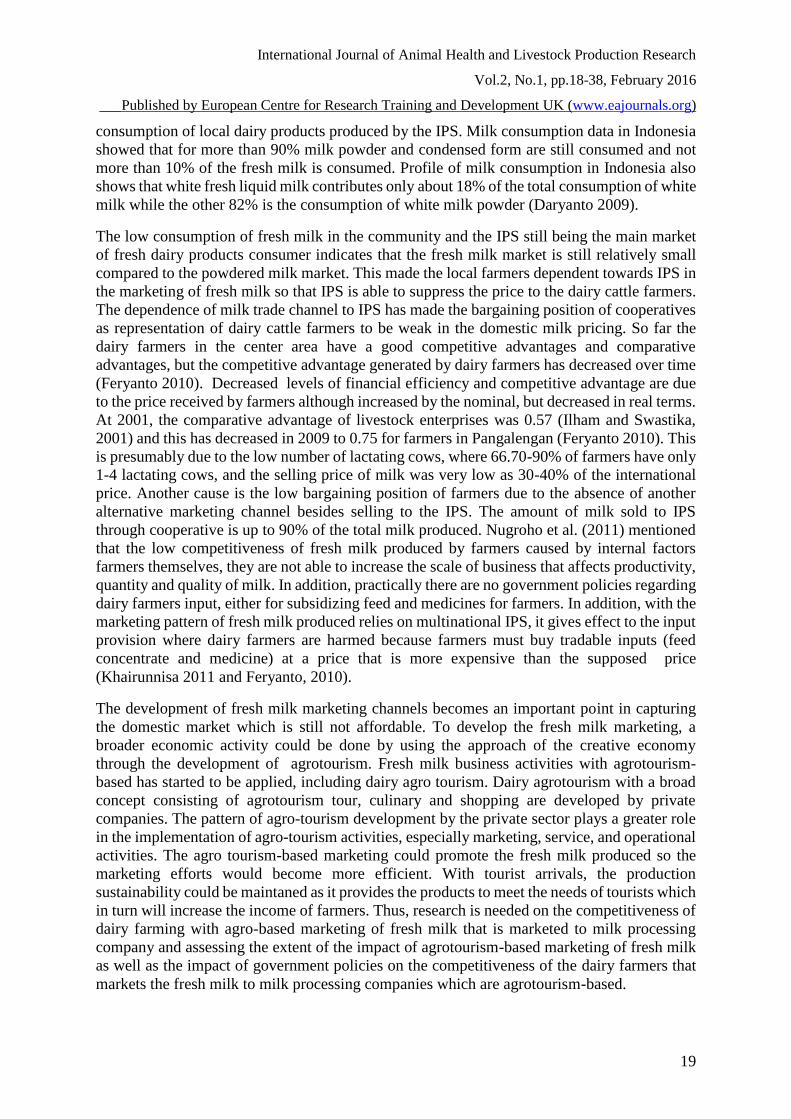
Dairy farmers profile is described by the condition that in Indonesia, it is still dominated by the
small scale business with possession of less than four cattles by 80%, a medium-scale business
with ownership of four to seven cattles as much as 17%, and large-scale business ownership
with more than seven cattles only 3% (Erwidodo 1998 and Swastika 2005). This condition
indicates that approximately 64% of national milk production comes from small-scale dairy
farmers, the remaining 28% is produced by the medium scale dairy farmers, and 8% of large
scale dairy farmers. This business profile describes that the condition of the existing farm dairy
farmers in Indonesia is still managed as a sideline business and the management is still far from
the principles of good farming practices (GAP). The data census results of breed cattle, dairy
cattle, buffalo (PSKP) in 2011 also showed that the total business unit of dairy cattle in
Indonesia reaches 188 098. Of these, 187 563 are domestic dairy farmers, and the remaining
are dairy farmers for commercial purposes. This condition indicates that the populations of
dairy cattles are mostly in farming households, which generally have only 2-5 cows. Bessant
(2005) mentioned that the ideal standard of business feasibility is if the farmers could reach the
scale of business with ownership of more than 10 cattles. It can be said dairy farm business
activities of the people is still not efficient and has not able to produce good milk quality
standards to be processed into dairy products. It can be said dairy farm business activities is
still the small scale business and not efficient who have not been able to produce good milk
quality standards to be processed into dairy products. Another existing condition of the dairy
farmers in Indonesia could be seen from the main consumers of fresh milk products produced
by farmers is large scale Milk Processing Industry (IPS). Around 80-90% of milk production
is supplied to the IPS Indonesian farmers and end consumers that have higher preference for
International Journal of Animal Health and Livestock Production Research
Vol.2, No.1, pp.18-38, February 2016
___Published by European Centre for Research Training and Development UK (www.eajournals.org)
19
consumption of local dairy products produced by the IPS. Milk consumption data in Indonesia
showed that for more than 90% milk powder and condensed form are still consumed and not
more than 10% of the fresh milk is consumed. Profile of milk consumption in Indonesia also
shows that white fresh liquid milk contributes only about 18% of the total consumption of white
milk while the other 82% is the consumption of white milk powder (Daryanto 2009).
The low consumption of fresh milk in the community and the IPS still being the main market
of fresh dairy products consumer indicates that the fresh milk market is still relatively small
compared to the powdered milk market. This made the local farmers dependent towards IPS in
the marketing of fresh milk so that IPS is able to suppress the price to the dairy cattle farmers.
The dependence of milk trade channel to IPS has made the bargaining position of cooperatives
as representation of dairy cattle farmers to be weak in the domestic milk pricing. So far the
dairy farmers in the center area have a good competitive advantages and comparative
advantages, but the competitive advantage generated by dairy farmers has decreased over time
(Feryanto 2010). Decreased levels of financial efficiency and competitive advantage are due
to the price received by farmers although increased by the nominal, but decreased in real terms.
At 2001, the comparative advantage of livestock enterprises was 0.57 (Ilham and Swastika,
2001) and this has decreased in 2009 to 0.75 for farmers in Pangalengan (Feryanto 2010). This
is presumably due to the low number of lactating cows, where 66.70-90% of farmers have only
1-4 lactating cows, and the selling price of milk was very low as 30-40% of the international
price. Another cause is the low bargaining position of farmers due to the absence of another
alternative marketing channel besides selling to the IPS. The amount of milk sold to IPS
through cooperative is up to 90% of the total milk produced. Nugroho et al. (2011) mentioned
that the low competitiveness of fresh milk produced by farmers caused by internal factors
farmers themselves, they are not able to increase the scale of business that affects productivity,
quantity and quality of milk. In addition, practically there are no government policies regarding
dairy farmers input, either for subsidizing feed and medicines for farmers. In addition, with the
marketing pattern of fresh milk produced relies on multinational IPS, it gives effect to the input
provision where dairy farmers are harmed because farmers must buy tradable inputs (feed
concentrate and medicine) at a price that is more expensive than the supposed price
(Khairunnisa 2011 and Feryanto, 2010).
The development of fresh milk marketing channels becomes an important point in capturing
the domestic market which is still not affordable. To develop the fresh milk marketing, a
broader economic activity could be done by using the approach of the creative economy
through the development of agrotourism. Fresh milk business activities with agrotourism-
based has started to be applied, including dairy agro tourism. Dairy agrotourism with a broad
concept consisting of agrotourism tour, culinary and shopping are developed by private
companies. The pattern of agro-tourism development by the private sector plays a greater role
in the implementation of agro-tourism activities, especially marketing, service, and operational
activities. The agro tourism-based marketing could promote the fresh milk produced so the
marketing efforts would become more efficient. With tourist arrivals, the production
sustainability could be maintaned as it provides the products to meet the needs of tourists which
in turn will increase the income of farmers. Thus, research is needed on the competitiveness of
dairy farming with agro-based marketing of fresh milk that is marketed to milk processing
company and assessing the extent of the impact of agrotourism-based marketing of fresh milk
as well as the impact of government policies on the competitiveness of the dairy farmers that
markets the fresh milk to milk processing companies which are agrotourism-based.
International Journal of Animal Health and Livestock Production Research
Vol.2, No.1, pp.18-38, February 2016
___Published by European Centre for Research Training and Development UK (www.eajournals.org)
20
LITERATURE
Definition and Concept of Competitiveness
Some experts argued that the concept of competitiveness is based on the concept of
comparative advantage of Ricardo which is an economic concept (Krugman 1994). However,
some other experts argue that the concept of competitiveness or competitive advantage is not
an economic concept, but a concept of politics and business which are used as the basis for
many strategic analyzes to improve corporate performance (Lall 2001 in Gonarsyah 2007 ,
Saptana 2010). The next development from the economists (Barkema, Drabenstotti, Tweeten,
and Sharples) defines competitive advantage as a result of a combination of market distortion
and comparative advantage. According Simatupang (1991) and Sudaryanto and Simatupang
(1993) concept of comparative advantage is a measure of competitiveness (excellence)
potential in terms of competitiveness that will be achieved if the economy is not distorted at
all. Commodities that have comparative advantage also said to have an economic efficiency.
Competitive advantage or revealed competitive advantage (RCA) is a measure of the
competitiveness of an activity on the actual economic conditions. Related to the concept of
comparative advantage is economic viability, and competitive advantage is related to the
financial feasibility of an activity.
Analysis of competitive advantage is a tool to measure the benefit of private profitability or
feasibility of an activity which is calculated based on market prices and official exchange rate.
In this case, a country will be able to compete in international markets if the country has a
competitive advantage in producing a commodity assuming the existence of marketing system
of government intervention. These conditions resulted in a country that does not have a
comparative advantage was found to have a competitive advantage because the government
provides protection to the commodity produced in the economic activity, for example through
price guarantees, ease of licensing and other convenience facilities (Sudaryanto and
Simatupang 1993). Nevertheless, the concept of competitive advantage is not interchangeable
towards comparative advantage, but the concepts are mutually complementary.
So far the dairy farmerses in the center area have a good competitive advantages and
comparative advantages, but the competitive advantage generated by dairy farmers has
decreased over time (Feryanto 2010). Decreased levels of financial efficiency and competitive
advantage are due to the price received by farmers although increased by the nominal, but
decreased in real terms. At 2001, the comparative advantage of livestock enterprises was 0.57
(Ilham and Swastika, 2001) and this has decreased in 2009 to 0.75 for farmers in Pangalengan
(Feryanto 2010). This is presumably due to the low number of lactating cows, where 66.70-
90% of farmers have only 1-4 lactating cows, and the selling price of milk was very low as 30-
40% of the international price. Another cause is the low bargaining position of farmers due to
the absence of another alternative marketing channel besides selling to the IPS. The amount of
milk sold to IPS through cooperative is up to 90% of the total milk produced. Nugroho et al.
(2011) mentioned that the low competitiveness of fresh milk produced by farmers caused by
internal factors farmers themselves, they are not able to increase the scale of business that
affects productivity, quantity and quality of milk. In addition, practically there are no
government policies regarding dairy farmers input, either for subsidizing feed and medicines
for farmers. In addition, with the marketing pattern of fresh milk produced relies on
multinational IPS, it gives effect to the input provision where dairy farmers are harmed because
farmers must buy tradable inputs (feed concentrate and medicine) at a price that is more
expensive than the supposed price (Khairunnisa 2011 and Feryanto, 2010).
International Journal of Animal Health and Livestock Production Research
Vol.2, No.1, pp.18-38, February 2016
___Published by European Centre for Research Training and Development UK (www.eajournals.org)
21
In this case the competitiveness approach used is the level of profit generated and the efficiency
of the operation of the commodities described by the comparative advantage and competitive
advantage. The concept of comparative advantage is used to describe a country's specialization
in producing goods and services, while competitive advantage is a tool to measure the
competitiveness of an activity based on actual economic conditions (Salvator, 1994).
Dairy Farmers
Sutardi (1981) stated that the dairy farm business in Indonesia lies in the two extreme regions,
namely: (1) areas with low natural physical condition but have high socio-economic conditions
and (2) areas with high natural conditions but have low socio-economic conditions. Basically,
the type (1) is located in the lowlands around the major cities with hot temperature while the
type (2) describes the rural highlands with cool temperatures. Some disadvantages arising from
these characteristics is the low supply of forage and low production performance on the region
type (1) and the lack of supply of concentrates and milk marketing chain in region type (2).
Areas suitable for the development of dairy farm business in Indonesia are mountainous land
with a minimum height of 800 meters above sea level. The study of the relationship of milk
production of dairy cattle with the area topography showed that the difference in height of 100
meters is closely related to differences in yield average about 4%.
The next characteristic that reflects the dairy farmers in Indonesia is the relatively small scale
of business. Dairy farm business is divided into two forms based on the Minister of Agriculture
No. 751 / Kpts / Um / 10/1982 on Development and Business Development of Domestic Milk
Production Enhancement, namely dairy farmers by individual and corporate dairy farm.
Individual dairy farmers is organized as a side business that has fewer than 10 dairy lactation
cows (adult) or has a total number of less than 20 dairy cows. The company is a dairy farmers
for commercial purposes with the main production of cattle’s milk, which has 10 lactation cows
(adult) or more or have a total number of 20 dairy cows or more (Sudono 2002).
Mubyarto (1989) describes that farms based on the cattle based farming patterns in Indonesia
are classified into three groups, namely: individual farm, semi-commercial farm and
commercial farms.
1. Individual farm with traditional practices. Maintenance are performed using the
traditional way every day by members of the family farmer with simple skills and using
local breeding stock in limited quantity and quality. The primary goal of breeding the
cattle is having cattle resource for farm cultivation.
2. Semi-commercial farms with enough farming skills. The use of quality seeds, medicines,
and food tends to increase. The main purpose of maintenance is to increase family income
and personal consumption.
3. Commercial farm run by farmers who have the capacity in terms of capital, means of
production, with a fairly modern technology. The entire labor are paid and fodder
purchased from outside in large numbers.
Definition and Concept of Agrotourism
Based on the joint Decree (SK) between the Minister of Tourism, Post and
Telecommunications and the Minister of Agriculture No. KM.47 / PW.DOW / MPPT-89 and
No. 204 / KPTS- / HK / 050/4/1989, agro-tourism as part of the tourism object is defined as a
International Journal of Animal Health and Livestock Production Research
Vol.2, No.1, pp.18-38, February 2016
___Published by European Centre for Research Training and Development UK (www.eajournals.org)
22
form of activity that utilizes agro business as an attraction to expanding the knowledge, leisure
experience and business relations in agriculture. Agro-tourism is defined as tourist objects that
utilize agricultural (Tirtawinata and Fachruddin 1996). Formally Budiasa Wolfe and Bullen
(2011) defines agro-tourism as an activity, or business venture that combines elements and
main features of agriculture and tourism and provides an experience to the visitors and
encourage economic activity and the impact on farm incomes. Agro-tourism also can provide
more economic activity to farmers and rural communities, and that includes the provision of
services and agro-touristic products to the visitor
Various agro-tourism activities that are often encountered by Wolfe and Bullen in Budiasa
(2011) is a fee-based hunting and fishing, festivals and exhibits farm (agriculture related
festivals and fairs), a farm tour, tourist picking vegetables and fruits (U-pick vegetables and
fruit), horseback riding, farmers / on-farm retail markets, on farm vacations, on-farm bed and
breakfasts, wineries, on-farm petting zoos / bird watching, on-farm picnic areas, biking / hiking
trails, on-farm educational programs. If Agro-tourism is developed correctly, the farmer’s hope
to increase their welfare could be realized. Sutjipta (2001) detailing the expectations of farmers
with agro-tourism development are as follows:
1. Marketing of agricultural products: it is expected with the later development of
agricultural tourism can be absorbed in this sector.
2. Dynamic technology: the development of tourism would also developing agricultural
technologies because of the demands of tourism.
3. The availability of the means of production.
4. Agricultural production Incentives, with the development of tourism prices of
agricultural products is expected to be valued quite feasible that farmers’ passion for
working would increase.
5. Transport, infrastructure built for tourism can also be utilized by the agricultural sector.
Prior Research Studies
Earlier research that has been the reference and comparison in this study are as follows:
Khairunnisa (2011) presented a study on competitiveness analysis and the impact of
government policies on the dairy farmers (case study: the farmer members of the milk cattle
cooperative in Kunak Bogor, West Java ) "with the methods used were PAM (Policy Analysis
Matrix) and sensitivity analysis. Samples from this study were members of farmer in the farm
business (Kunak) KPS Bogor Pamijahan District and Cibungbulang District Bogor. PAM
results indicate that dairy farmers in Kunak, KPS Bogor were efficient and profitable both
financially and economically viable and prospective to be developed. Dairy farmers in Kunak
also has a competitive advantage and comparative advantage. PCR for breeders residing in
Cibungbulang District and Pamijahan District Bogor, ranged about 0.77-0.98. Feryanto (2010)
conducted a study related to the analysis of the competitiveness and the impact of government
policy on local dairy cattle commodities in West Java by using analytical tools PAM (Policy
Analysis Matrix) and a sensitivity analysis of changes in output and input prices on the
competitiveness of the dairy farm. Research sites that were selected in this study is the
Lembang District, Pangalengan District, and Cikajang District. The results showed that the
operation of dairy cattles to produce fresh dairy products in the province of West Java in general
is profitable and financially efficient and economic.
International Journal of Animal Health and Livestock Production Research
Vol.2, No.1, pp.18-38, February 2016
___Published by European Centre for Research Training and Development UK (www.eajournals.org)
23
The utilization of dairy cattle to produce fresh dairy products in the province of West Java also
has a comparative advantage and competitive advantage with PCR values ranging from 0.79-
0.94. Farmers that was examined in this study had the aim of fresh milk marketing to be
supplied to the IPS. Previous research also mentions the tendency of rising prices of production
inputs (feed, medicine) and also the helpless farmers / cooperatives due to the weak bargaining
position of the input providers and buyers of milk (IPS). These conditions will have
implications for the declining competitive advantage possessed by agribusiness dairy cattles,
whereas in the short-term and long-term milk commodity and exploitation of fresh milk has a
great comparative advantage. Fresh milk marketing purposes in previous studies is that the
fresh milk produced by farmers could be supplied to IPS. Meanwhile, this study examines the
competitiveness of farmers with the purpose of direct marketing of fresh milk to agro-tourism
based milk processing companies.
METHODOLOGY
Types and Sources of Data
The data used in this study are primary data and secondary data. The primary data obtained
through interviews, questionnaires and direct observation in the field. Interviews were
conducted to farmers as the study object and several respondents associated with this field.
Secondary data were collected from relevant literature that can support and help to the
availability of data. Location research is purposive in the Village Cibeureum, District Cisarua,
Bogor.
Respondents Retrieval Techniques
Respondents used in this study were breeders who are members of Giri Farmers cooperatives
who sell fresh milk to IPS PT. Cisarua Mountain Diary (Cimory) as agro-tourism based dairy
company. Cimory as local fresh milk-based company is not only limited to dairy products and
the derivatives, but also in the form of agro-tourism. In this case, the company developed
Cimory Dairy Tour which is a joint program between education and entertainment, or often
known as 'edutainment' as well as culinary tourism by developing restaurant that serves food
made from milk located in the region of farm and milk processing plant.Sampling was done
using the simple random sampling of the members who have been previously selected in the
group of farmers. The numbers of farmers who sell their fresh milk to a agro-tourism based
dairy company required to be sampled in this study were 59 breeders. It is based on the
population size or the number of farmer members of KUD Tani Giri as much as 149 farmers
and consists of:
Farmers in this study were divided into three scales based on their scale of business, which are
the small-scale, medium-scale, and large-scale. Referring to Mandaka (2005), the division of
business scale is based on the number of lactating dairy cattle ownership, where small-scale
farmers have less than four cows, medium-scale farmers have four to seven cows and large
scale farmers have more than seven cows. Sampling was done using the simple random
sampling of the members who have been previously selected in the group of farmers. The
numbers of farmers who sell their fresh milk to a agro-tourism based dairy company required
to be sampled in this study were 59 breeders. It is based on the population size or the number
of farmer members of KUD Tani Giri as much as 149 farmers and consists of:
International Journal of Animal Health and Livestock Production Research
Vol.2, No.1, pp.18-38, February 2016
___Published by European Centre for Research Training and Development UK (www.eajournals.org)
24
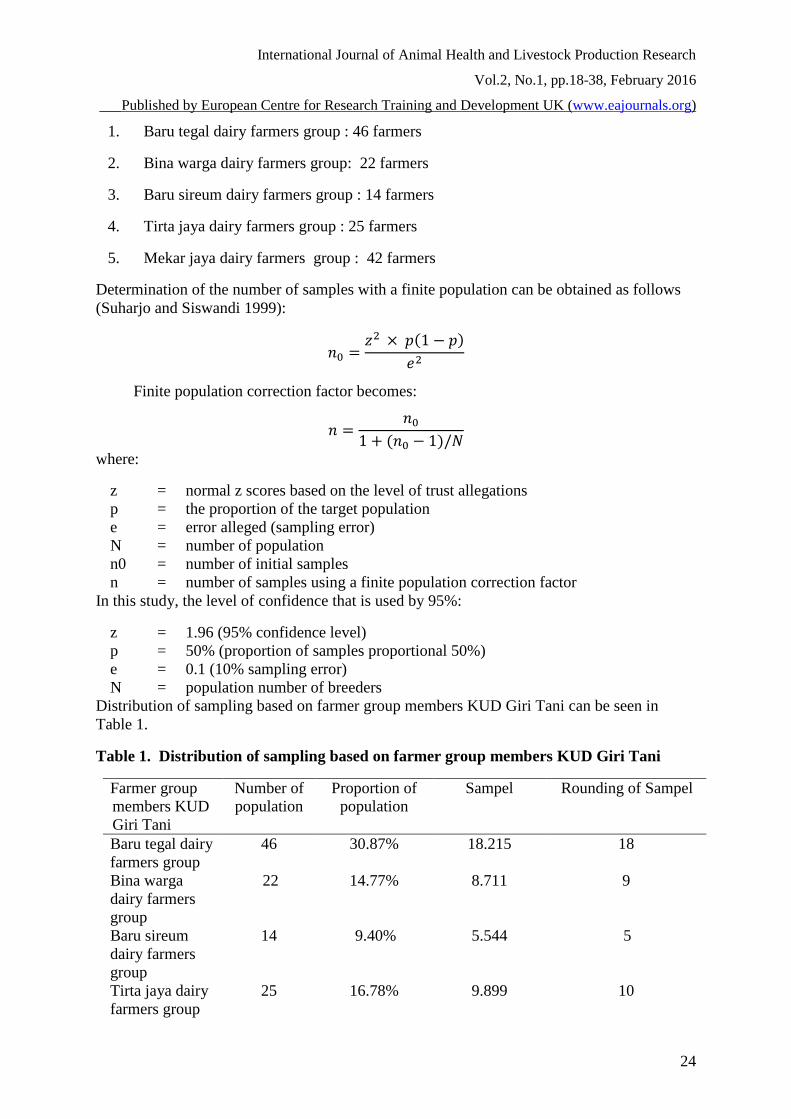
1. Baru tegal dairy farmers group : 46 farmers
2. Bina warga dairy farmers group: 22 farmers
3. Baru sireum dairy farmers group : 14 farmers
4. Tirta jaya dairy farmers group : 25 farmers
5. Mekar jaya dairy farmers group : 42 farmers
Determination of the number of samples with a finite population can be obtained as follows
(Suharjo and Siswandi 1999):
𝑛0 =𝑧2 × 𝑝(1 − 𝑝)
𝑒2
Finite population correction factor becomes:
𝑛 =𝑛0
1 + (𝑛0 − 1)/𝑁
where:
z = normal z scores based on the level of trust allegations
p = the proportion of the target population
e = error alleged (sampling error)
N = number of population
n0 = number of initial samples
n = number of samples using a finite population correction factor
In this study, the level of confidence that is used by 95%:
z = 1.96 (95% confidence level)
p = 50% (proportion of samples proportional 50%)
e = 0.1 (10% sampling error)
N = population number of breeders
Distribution of sampling based on farmer group members KUD Giri Tani can be seen in
Table 1.
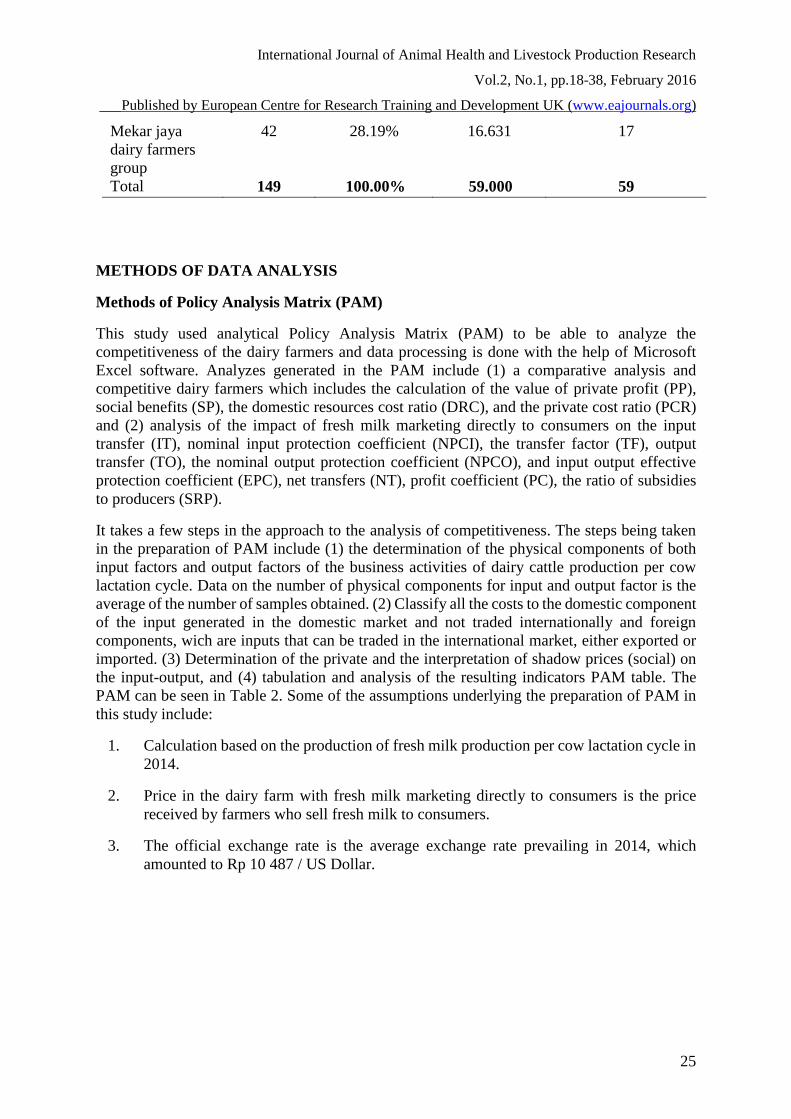
Table 1. Distribution of sampling based on farmer group members KUD Giri Tani
Farmer group
members KUD
Giri Tani
Number of
population
Proportion of
population
Sampel Rounding of Sampel
Baru tegal dairy
farmers group
46 30.87% 18.215 18
Bina warga
dairy farmers
group
22 14.77% 8.711 9
Baru sireum
dairy farmers
group
14 9.40% 5.544 5
Tirta jaya dairy
farmers group
25 16.78% 9.899 10
International Journal of Animal Health and Livestock Production Research
Vol.2, No.1, pp.18-38, February 2016
___Published by European Centre for Research Training and Development UK (www.eajournals.org)
25
Mekar jaya
dairy farmers
group
42 28.19% 16.631 17
Total 149 100.00% 59.000 59
METHODS OF DATA ANALYSIS
Methods of Policy Analysis Matrix (PAM)
This study used analytical Policy Analysis Matrix (PAM) to be able to analyze the
competitiveness of the dairy farmers and data processing is done with the help of Microsoft
Excel software. Analyzes generated in the PAM include (1) a comparative analysis and
competitive dairy farmers which includes the calculation of the value of private profit (PP),
social benefits (SP), the domestic resources cost ratio (DRC), and the private cost ratio (PCR)
and (2) analysis of the impact of fresh milk marketing directly to consumers on the input
transfer (IT), nominal input protection coefficient (NPCI), the transfer factor (TF), output
transfer (TO), the nominal output protection coefficient (NPCO), and input output effective
protection coefficient (EPC), net transfers (NT), profit coefficient (PC), the ratio of subsidies
to producers (SRP).
It takes a few steps in the approach to the analysis of competitiveness. The steps being taken
in the preparation of PAM include (1) the determination of the physical components of both
input factors and output factors of the business activities of dairy cattle production per cow
lactation cycle. Data on the number of physical components for input and output factor is the
average of the number of samples obtained. (2) Classify all the costs to the domestic component
of the input generated in the domestic market and not traded internationally and foreign
components, wich are inputs that can be traded in the international market, either exported or
imported. (3) Determination of the private and the interpretation of shadow prices (social) on
the input-output, and (4) tabulation and analysis of the resulting indicators PAM table. The
PAM can be seen in Table 2. Some of the assumptions underlying the preparation of PAM in
this study include:
1. Calculation based on the production of fresh milk production per cow lactation cycle in
2014.
2. Price in the dairy farm with fresh milk marketing directly to consumers is the price
received by farmers who sell fresh milk to consumers.
3. The official exchange rate is the average exchange rate prevailing in 2014, which
amounted to Rp 10 487 / US Dollar.
International Journal of Animal Health and Livestock Production Research
Vol.2, No.1, pp.18-38, February 2016
___Published by European Centre for Research Training and Development UK (www.eajournals.org)
26
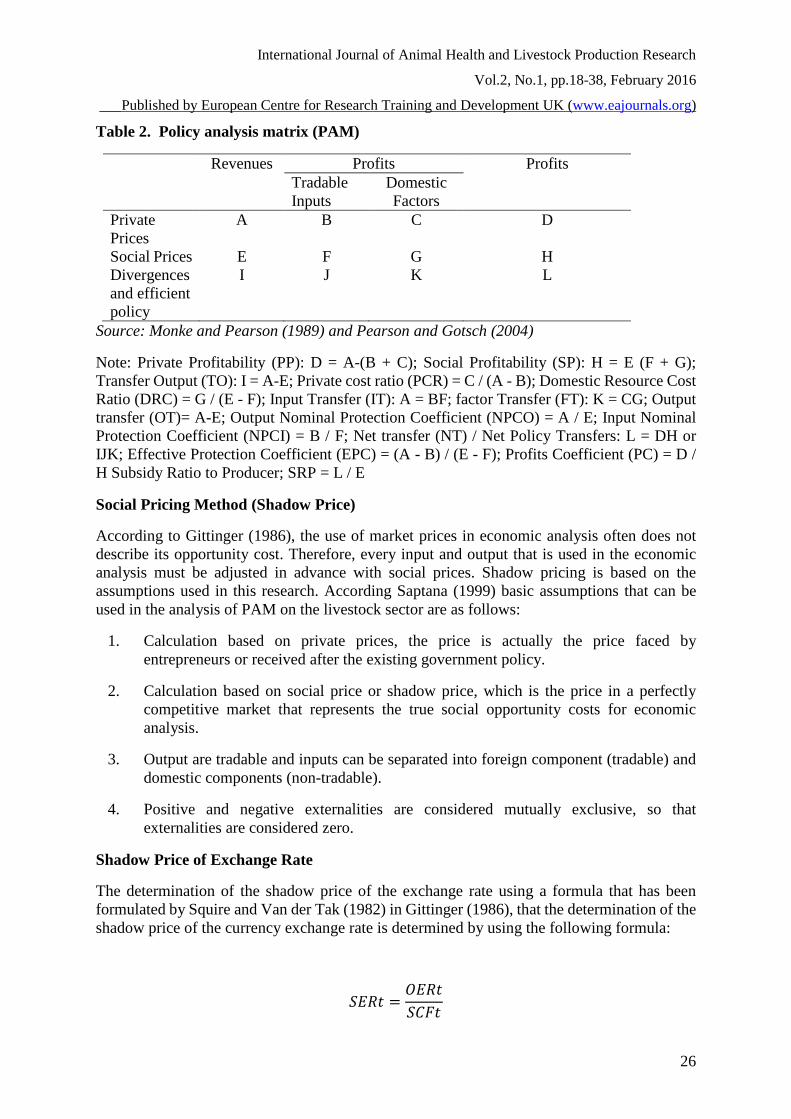
Table 2. Policy analysis matrix (PAM)
Revenues Profits Profits
Tradable
Inputs
Domestic
Factors
Private
Prices
A B C D
Social Prices E F G H
Divergences
and efficient
policy
I J K L
Source: Monke and Pearson (1989) and Pearson and Gotsch (2004)
Note: Private Profitability (PP): D = A-(B + C); Social Profitability (SP): H = E (F + G);
Transfer Output (TO): I = A-E; Private cost ratio (PCR) = C / (A - B); Domestic Resource Cost
Ratio (DRC) = G / (E - F); Input Transfer (IT): A = BF; factor Transfer (FT): K = CG; Output
transfer (OT)= A-E; Output Nominal Protection Coefficient (NPCO) = A / E; Input Nominal
Protection Coefficient (NPCI) = B / F; Net transfer (NT) / Net Policy Transfers: L = DH or
IJK; Effective Protection Coefficient (EPC) = (A - B) / (E - F); Profits Coefficient (PC) = D /
H Subsidy Ratio to Producer; SRP = L / E
Social Pricing Method (Shadow Price)
According to Gittinger (1986), the use of market prices in economic analysis often does not
describe its opportunity cost. Therefore, every input and output that is used in the economic
analysis must be adjusted in advance with social prices. Shadow pricing is based on the
assumptions used in this research. According Saptana (1999) basic assumptions that can be
used in the analysis of PAM on the livestock sector are as follows:
1. Calculation based on private prices, the price is actually the price faced by
entrepreneurs or received after the existing government policy.
2. Calculation based on social price or shadow price, which is the price in a perfectly
competitive market that represents the true social opportunity costs for economic
analysis.
3. Output are tradable and inputs can be separated into foreign component (tradable) and
domestic components (non-tradable).
4. Positive and negative externalities are considered mutually exclusive, so that
externalities are considered zero.
Shadow Price of Exchange Rate
The determination of the shadow price of the exchange rate using a formula that has been
formulated by Squire and Van der Tak (1982) in Gittinger (1986), that the determination of the
shadow price of the currency exchange rate is determined by using the following formula:
𝑆𝐸𝑅𝑡 =𝑂𝐸𝑅𝑡
𝑆𝐶𝐹𝑡
International Journal of Animal Health and Livestock Production Research
Vol.2, No.1, pp.18-38, February 2016
___Published by European Centre for Research Training and Development UK (www.eajournals.org)
27
Specification:
SERt : Shadow Exchange Rate (USD/US $)
OERt : Official Exchange Rate (USD/US $)
SCFt : Standard conversion factor
Value of the standard conversion factor is the ratio of the value of imports and exports plus
taxes can be determined as follows:
𝑆𝐶𝐹𝑡 =Xt + Mt
(Xt − Txt) + (Mt + Tmt)
Keterangan :
SCFt : standard conversion factor for year t
Xt : Indonesia's export value for the year t (Rp)
Mt : Indonesian import value for year t (Rp)
Txt : Government revenues from export taxes for year t (Rp)
Tmt : Government revenue from import tax for the year t (Rp)
By using the average exchange rate of the rupiah against the dollar (OER) in 2014 valued at
USD 10,487 / Euro 2014 SER value is Rp 10 702 and SCF value is equal to 98%.
The Shadow Price of Output
The calculation of the shadow price of output in this study is the price cif (cost insurance
freight) or shadow prices for imported products. Shadow prices using the price cif (cost
insurance freight) was first converted using the exchange rate shadow prices SER (Shadow
Exchange Rate) at that time with the marketing costs for the imported product. Calculation
formula can be written as follows [(cif x SER) + cost trade system]. The calculation of the
world milk price equivalent with local milk price was using a formulation that refers to
Erwidodo and Sayaka in Atien et al (2009).
This formulation uses the approach where the world milk price is calculated on the basis of the
price of a kilogram of Full Cream Milk Powder (FCMP) is equivalent to eight kilograms of
fresh milk. Approximately 80% of the cost of a kilogram of fresh milk FCMP is the cost, plus
the cost of trade procedures (cost of transportation and handling / loading and unloading) from
the port up to the breeder that is equal to 2.5%. FCMP milk price calculation is based on data
on the average milk price in January-March 2014 (Global Dairy Trade 2014). Average price
per liter of milk FCMP after converted is Rp 6983, where the price includes shipping and
administrative costs. Shadow price of milk used is USD 7 157.57 / liter of milk, the value is
derived from the price of imported milk multiplied by the SER and 2.5% additional business
administration fee.
International Journal of Animal Health and Livestock Production Research
Vol.2, No.1, pp.18-38, February 2016
___Published by European Centre for Research Training and Development UK (www.eajournals.org)
28
The Shadow Price of Input
Shadow price of feed consisting of forage, tofu and tempe residues are determined based on
the prices prevailing in the market. This is because since 2000 the subsidy for feed has been
revoked by the government. However, the shadow price is determined based on the
concentrations of the international market price of cattle feed cif price plus the costs of other
trade expenditures. Shadow prices for medicines and vitamins despite being produced locally,
but most of their raw materials come from imports so that the shadow prices for medicines and
vitamins are determined based on the CIF price. After that, adjustment was done by adding or
reducing the cost of transportation or marketing.
The Shadow Price of Labor
Labors which are used to help farmers are not permanent and generally not well educated so
that the shadow price of labor is performed using the calculation approach by Yusdja (2001)
and Suryana (1980) in Emilya (2001) that is equal to 80% of the wage rate in the study area.
The Shadow Price of Land, Working Capital, Tax
Shadow price of land in the location of this study is the use of the land rental value, because it
is difficult to measure the value of a farm / other businesses in a certain land. Shadow price of
capital interest is earned from the total cost of production of breeder multiplied by the
applicable deposit rates at commercial banks namely about 7% in 2013, which the bank
reference used is BRI (Bank Rakyat Indonesia). Shadow price of tax for this study excluded in
the calculation of the social price. Therefore, the financial price for the land and building tax
(PBB) in the calculation of the fee is calculated as a private or financial calculation.
Determination of Trade Administration Cost
Trade administration costs incurred in this study is the cost of transporting food from producers
to the breeder. Shadow price of the trade system to feed and milk transport costs used is the
market price plus the cost of the subsidy from fuel (BBM) by 33%.
Sensitivity Analysis
After analysis of PAM it is necessary to conduct sensitivity analysis of output price changes
due to agro-tourism and elimination of import tariff policies and changes in input prices due to
the policy of the feed prices raised up to 30% in 2008. In seeing the impact of agro-tourism on
the competitiveness of the dairy farmers were used the number of visitors increased proxy by
25% that are based on the last five years of visitor growth data in Cimory, an agro-tourism
based milk processing company. Increasing the number of visitors will increase demand for
fresh milk at the farm level that will increase the price received by farmers. Import tariff of 0%
is government policy that is expected to be implemented at the time of free trade was introduced
to examine the extent of the impact of the import tariff policy on the competitiveness of the
dairy farmers who sells the fresh milk to agro-tourism based milk processing company.
Feed as an indicator of changes in the sensitivity analysis is considered because feed is the
largest cost component incurred breeders. The increase of fuel prices in 2008 had an immediate
impact on the operation of dairy cattle. It is evident that the increase in fuel price has increased
the cost of transportation causing feed prices rose an average of 30% for 2008. The purpose of
International Journal of Animal Health and Livestock Production Research
Vol.2, No.1, pp.18-38, February 2016
___Published by European Centre for Research Training and Development UK (www.eajournals.org)
29
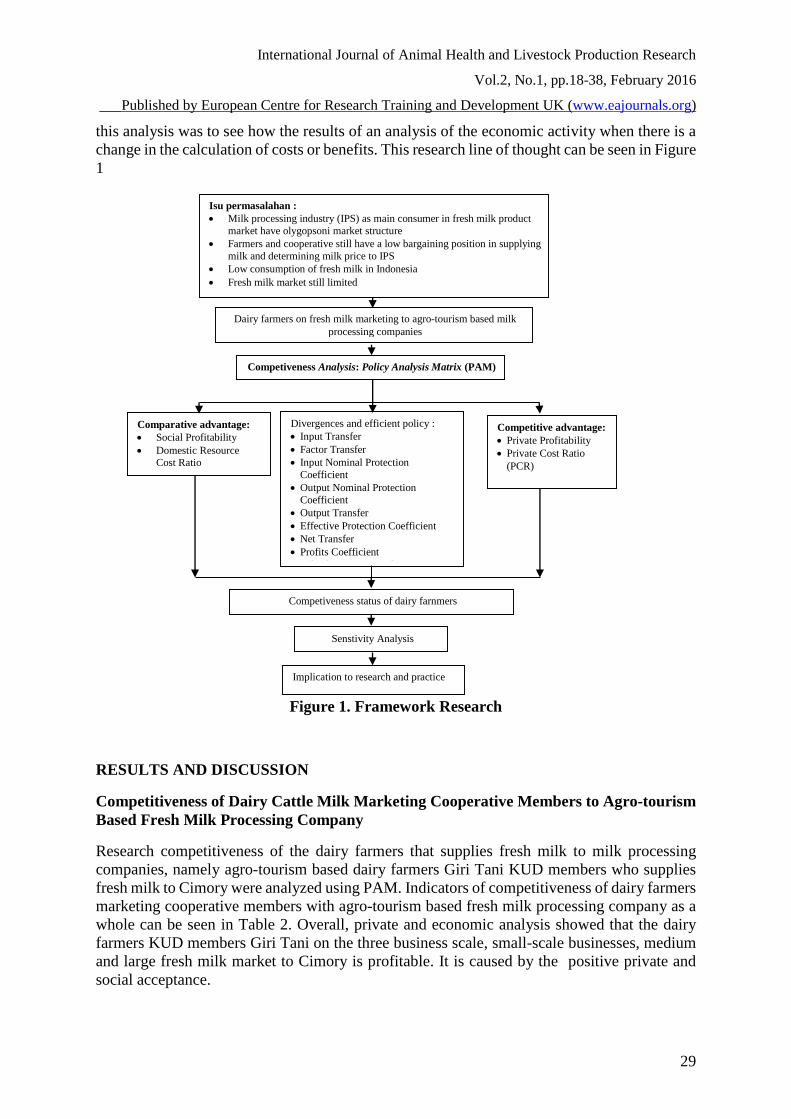
this analysis was to see how the results of an analysis of the economic activity when there is a
change in the calculation of costs or benefits. This research line of thought can be seen in Figure
1
Figure 1. Framework Research
RESULTS AND DISCUSSION
Competitiveness of Dairy Cattle Milk Marketing Cooperative Members to Agro-tourism
Based Fresh Milk Processing Company
Research competitiveness of the dairy farmers that supplies fresh milk to milk processing
companies, namely agro-tourism based dairy farmers Giri Tani KUD members who supplies
fresh milk to Cimory were analyzed using PAM. Indicators of competitiveness of dairy farmers
marketing cooperative members with agro-tourism based fresh milk processing company as a
whole can be seen in Table 2. Overall, private and economic analysis showed that the dairy
farmers KUD members Giri Tani on the three business scale, small-scale businesses, medium
and large fresh milk market to Cimory is profitable. It is caused by the positive private and
social acceptance.
Comparative advantage:
Social Profitability
Domestic Resource Cost Ratio
Competitive advantage:
Private Profitability
Private Cost Ratio
(PCR)
Isu permasalahan :
Milk processing industry (IPS) as main consumer in fresh milk product
market have olygopsoni market structure
Farmers and cooperative still have a low bargaining position in supplying
milk and determining milk price to IPS
Low consumption of fresh milk in Indonesia
Fresh milk market still limited
Divergences and efficient policy :
Input Transfer
Factor Transfer
Input Nominal Protection
Coefficient
Output Nominal Protection
Coefficient
Output Transfer
Effective Protection Coefficient
Net Transfer
Profits Coefficient
Subsidy Ratio to Producer
Implication to research and practice
Competiveness Analysis: Policy Analysis Matrix (PAM)
Dairy farmers on fresh milk marketing to agro-tourism based milk
processing companies
Senstivity Analysis
Competiveness status of dairy farnmers
International Journal of Animal Health and Livestock Production Research
Vol.2, No.1, pp.18-38, February 2016
___Published by European Centre for Research Training and Development UK (www.eajournals.org)
30
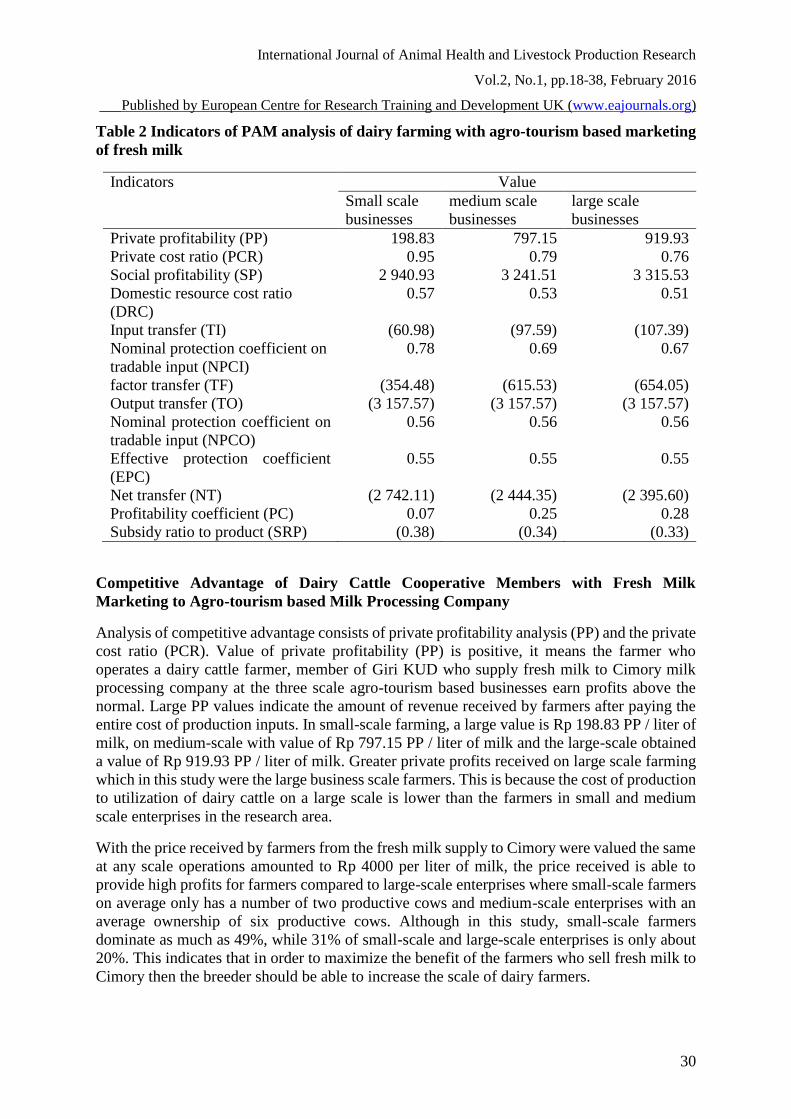
Table 2 Indicators of PAM analysis of dairy farming with agro-tourism based marketing
of fresh milk
Indicators Value
Small scale
businesses
medium scale
businesses
large scale
businesses
Private profitability (PP) 198.83 797.15 919.93
Private cost ratio (PCR) 0.95 0.79 0.76
Social profitability (SP) 2 940.93 3 241.51 3 315.53
Domestic resource cost ratio
(DRC)
0.57 0.53 0.51
Input transfer (TI) (60.98) (97.59) (107.39)
Nominal protection coefficient on
tradable input (NPCI)
0.78 0.69 0.67
factor transfer (TF) (354.48) (615.53) (654.05)
Output transfer (TO) (3 157.57) (3 157.57) (3 157.57)
Nominal protection coefficient on
tradable input (NPCO)
0.56 0.56 0.56
Effective protection coefficient
(EPC)
0.55 0.55 0.55
Net transfer (NT) (2 742.11) (2 444.35) (2 395.60)
Profitability coefficient (PC) 0.07 0.25 0.28
Subsidy ratio to product (SRP) (0.38) (0.34) (0.33)
Competitive Advantage of Dairy Cattle Cooperative Members with Fresh Milk
Marketing to Agro-tourism based Milk Processing Company
Analysis of competitive advantage consists of private profitability analysis (PP) and the private
cost ratio (PCR). Value of private profitability (PP) is positive, it means the farmer who
operates a dairy cattle farmer, member of Giri KUD who supply fresh milk to Cimory milk
processing company at the three scale agro-tourism based businesses earn profits above the
normal. Large PP values indicate the amount of revenue received by farmers after paying the
entire cost of production inputs. In small-scale farming, a large value is Rp 198.83 PP / liter of
milk, on medium-scale with value of Rp 797.15 PP / liter of milk and the large-scale obtained
a value of Rp 919.93 PP / liter of milk. Greater private profits received on large scale farming
which in this study were the large business scale farmers. This is because the cost of production
to utilization of dairy cattle on a large scale is lower than the farmers in small and medium
scale enterprises in the research area.
With the price received by farmers from the fresh milk supply to Cimory were valued the same
at any scale operations amounted to Rp 4000 per liter of milk, the price received is able to
provide high profits for farmers compared to large-scale enterprises where small-scale farmers
on average only has a number of two productive cows and medium-scale enterprises with an
average ownership of six productive cows. Although in this study, small-scale farmers
dominate as much as 49%, while 31% of small-scale and large-scale enterprises is only about
20%. This indicates that in order to maximize the benefit of the farmers who sell fresh milk to
Cimory then the breeder should be able to increase the scale of dairy farmers.
International Journal of Animal Health and Livestock Production Research
Vol.2, No.1, pp.18-38, February 2016
___Published by European Centre for Research Training and Development UK (www.eajournals.org)
31
Determination of the price received by the farmer is the same at every scale of business due to
the marketing of fresh milk to Cimory through cooperatives Giri Tani going through the whole
process of mixing fresh milk at KUD. This is done by cooperatives in order to meet the
minimum amount set by Cimory. KUD also provide flexibility to the breeder to send directly
to Cimory if it has sufficient requirements set by Cimory. However, the farmer members of
KUD Giri Tani are generally small scale farmers so it is not allowed for direct delivery of fresh
milk to supply because it doesn’t met the requirements set by Cimory. Although there are
farmers who have medium and large scale businesses, they do not met the quota of Cimory so
that both of the farmers join the cooperative to supply fresh milk to Cimory. PCR values on the
three business scale have a value smaller than one. PCR value on small-scale farming is 0.95,
medium-scale farming is 0.79, and large-scale farming is 0.76. These values indicate that the
dairy farmers Giri Tani KUD members who supply fresh milk to Cimory milk processing
company is considered as privately efficient agro-tourism based milk processing company and
have a competitive advantage.
Comparative Advantage of Dairy Cattle Cooperative Members with Fresh Milk
Marketing to Agro-tourism based Milk Processing Company
Analysis of the comparative advantages of a commodity is determined by the value of the social
benefits (SP) and domestic resource cost ratio (DRC). SP value on small-scale farming,
medium and large respectively is 2 940.93 USD, USD 3 241.51, and USD 3 315.53/ liter of
milk. SP value is positive, greater than zero (> 0), on the three business scales indicate that the
business of dairy cattle in producing fresh milk may generate economic benefits to the state
without the intervention of a policy. Value of social benefits (SP) in the dairy farmers Giri Tani
KUD members who supply fresh milk to Cimory has greater value than the value of the private
benefit (PP) on the three business scale. This is because the social price of fresh milk has higher
value of USD 7 157.57 compared with the corresponding private price of Rp 4000 per liter of
milk. In this study, the social price of milk is calculated based on the price of imported milk
that is higher than the local milk. It means that the fresh milk produced by farmer members of
KUD Tani Giri Cimory could only valued at Rp 4000.
The DRC value that is less than one; 0.57 for small-scale business, 0.53 for medium-scale, and
0.51 for the large scale showed that fresh milk supply from Giri Tani KUD members to Cimory
socially have a comparative advantage. This condition indicates that the domestic needs of both
commodities would be better produced locally rather than having to import milk from other
countries. This is because the cost to produce fresh milk is relatively inexpensive when
compared to import milk powder so it will be able to save government income. Although based
on PAM Analysis, DRC indicator shows that it would be more efficient to produce local fresh
milk, but in fact the national farmers is only able to meet 30% of the total national demand.
Thus the government and relevant parties need to pay serious attention in order to increase the
national production of fresh milk to fulfill the domestic milk demand. Increased production
through the improvement of the upstream and downstream system of dairy agribusiness
becomes a necessity, and thus required responsibilities from related parties, especially the
government to issue policies that support this program.
Impact on Input of Dairy Cattle Cooperative Members with Fresh Milk Marketing to
Agro-tourism based Milk Processing Company
Transfer value input on all of the three business scale is negative. The negative TI value means
that the dairy farmers cooperative members who supply fresh milk to Cimory as agro-tourism
International Journal of Animal Health and Livestock Production Research
Vol.2, No.1, pp.18-38, February 2016
___Published by European Centre for Research Training and Development UK (www.eajournals.org)
32
based milk processing company gain tradable inputs of Rp 60.98 / liter of milk (small-scale
farmers), USD 97.66 / liter of milk (medium-sized scale farmers), and Rp 107.39 / liter of milk
(large business scale farmers). This is due to the efforts of the cooperative to subsidize the price
of feed / concentrate, and medicines with lower prices which is shared by farmers through
cooperatives based on fees and profits earned by cooperative. Negative TI also shows that there
is a decrease in income transfer from farmers to producers of tradable inputs of Rp 60.98 / liter
of milk (small scale farming), USD 97.66/ liter of milk (medium-scale farming), and Rp
107.39/ liter of milk (large scale farming).
NPCI values on all of the three business scale is negative (NPCI <1), respectively 0.78 (small-
scale farming), 0.69 (medium-scale farming), and 0.67 (large business scale). The negative
NPCI value on all three scale indicate that there is a protection policy to the input consumer
(farmers) in the form of financial aid that cause input prices lower than its shadow price.
Although the government's policy has been revoked the feed and medicine subsidies since
2000, but the existence of KUD Tani Giri has been able to provide the means of production
with a lower price. Therefore, farmers cooperative who sell fresh milk to Cimory could
overcome the fodder producers that tend to be oligopoly who could determine that the private
feed price is higher than the social price. The negative transfer value of factors on all of the
three business scale means that the acquisition of domestic inputs farmers benefited by Rp
354.48 / liter of milk, medium-scale farmers benefit of Rp 615.53 and large-scale farmers
benefit of Rp 654.05 / liter of milk.
Impact on Output of Dairy Cattle Cooperative Members with Fresh Milk Marketing to
Agro-tourism based Milk Processing Company
TO has negative value on al of the three business scale farmers, amounting to Rp 3 157.57
means that there is a divergence in which the private market price of fresh milk output produced
by dairy cattle farmers who supply to agro-tourism based milk processing company is lower
than the social price. The same TO value on any scale of business due to the price received by
farmers from the fresh milk market to Cimory ie Rp 4000 per liter of milk. Negative TO values
on all of the three business scale showed a divergence in which the private market price of
output produced fresh milk dairy farmers that supply fresh milk to agro-tourism based milk
processing company is lower than their social price. The social price of milk is calculated based
on the higher price of imported milk price than the price of local milk. NPCO value of 0.56
indicates that the price farmers received is 44% lower than its social price. NPCO value less
than one indicates that farmers who sell fresh milk to Cimory still valued at a price lower than
its social prices. Cimory policies that provide price incentives have not been effective to
increase the revenue of farmers, same as the government policy to raise import tariffs of 5%
has not been effective so there is still a reduction in revenues of farmers.
Impact on Input Output of Dairy Cooperative Members with Fresh Milk Marketing to
Agro-tourism based Milk Processing Company
EPC values obtained in this study are less than one at 0.55 that the input-output policies have
not been able to provide protection to the local farmers in fresh milk production. This is because
fresh milk produced by farmers is still valued at a price lower than the social price. Negative
NT value in all three scale farmers; USD 2 742.11/ liter of milk (small scale), USD 2 444.35/
liter of milk (medium scale) and Rp 2 395.60/ liter of milk (large scale) means a reduction in
the amount of NT breeder surplus on each of the business scale.
International Journal of Animal Health and Livestock Production Research
Vol.2, No.1, pp.18-38, February 2016
___Published by European Centre for Research Training and Development UK (www.eajournals.org)
33
PC value of 0.07 for small-scale farmers and 0.25 for medium-scale farmers, while the large-
scale have PC value of 0.28 means that the profit of small-scale farmers on private prices is
93% lower than the profits in social price, medium scale profit at private prices is 75% lower
than the profit in social price, and large-scale gain 72% on private prices lower than the gains
in social price. SRP value is negative; 0.38 small scale, 0.34 medium scale, and 0.33 large scale
means that Giri Tani KUD farmer members who supply milk to Cimory lower the gross income
of 38% for small-scale farmer, 34% for medium-scale farmer, and 33% for large scale farmer.
PAM results of the impact on output input showed that fresh milk supply to Cimory as a whole
has not been able to optimize the benefit of farmers. It can be seen from the fresh milk price
received by farmers is lower than the social price. Therefore, the partnership between farmer
members of Giri Tani KUD with Cimory should be limited to price of output incentives which
must be accompanied by technical assistance of dairy cattle breeding to improve the quality of
fresh milk. Moreover, most of the farmers have mindset that does not consider improving the
quality of fresh milk in long-term, the most important for farmers is to gain benefit by selling
milk with the existing quality. It's hard for farmers to think of carrying on business of dairy
cattle towards the business that add quality or value added so generally farmers are difficult to
replace a better quality feed. Most of the farmers are satisfied with the current quality, while in
the other hand the farmers continue to expect getting better prices. Therefore, more
comprehensive partnerships are necessary so that the vertical integration of upstream to
downstream and vice versa provide benefits to the entire farming subsystem.
When compared with the condition where farmers still supply fresh milk to the IPS market
other than agro-tourism milk processing company, IPS is a large-scale so the farmers’ benefit
is still far below the standard price of milk. Based on research of Bessant (2005), before the
agro-tourism based milk processing company has not been established, farmers still supply
fresh milk into a large-scale IPS, while the cost of production of fresh milk in small scale Rp 1
900.41 per liter of milk, medium scale Rp 1 779.68 per liter of milk, and large-scale Rp 1
614.19 per liter of milk, while the milk price received by farmers only Rp 1 526.89 per liter for
small-scale enterprises, Rp 1 593.94 for medium-scale and Rp 1 594.44 per liter milk for large-
scale. These conditions show that the current price cannot provide benefits to the farmers
because the price of milk is far below feasible. The research of Bessant (2005) showed that the
average milk price received by farmers can not cover the cost of production. It can be concluded
that the price received by farmers is one of the obstacles for dairy farm sustainability in Bogor
area.
Impact of Agro-tourism Based Fresh Milk Marketing and Impact of Government Policies
on the Competitiveness of Dairy Cooperative Members with Fresh Milk Marketing to
Agro-tourism based Milk Processing Company Based on Sensitivity Analysis
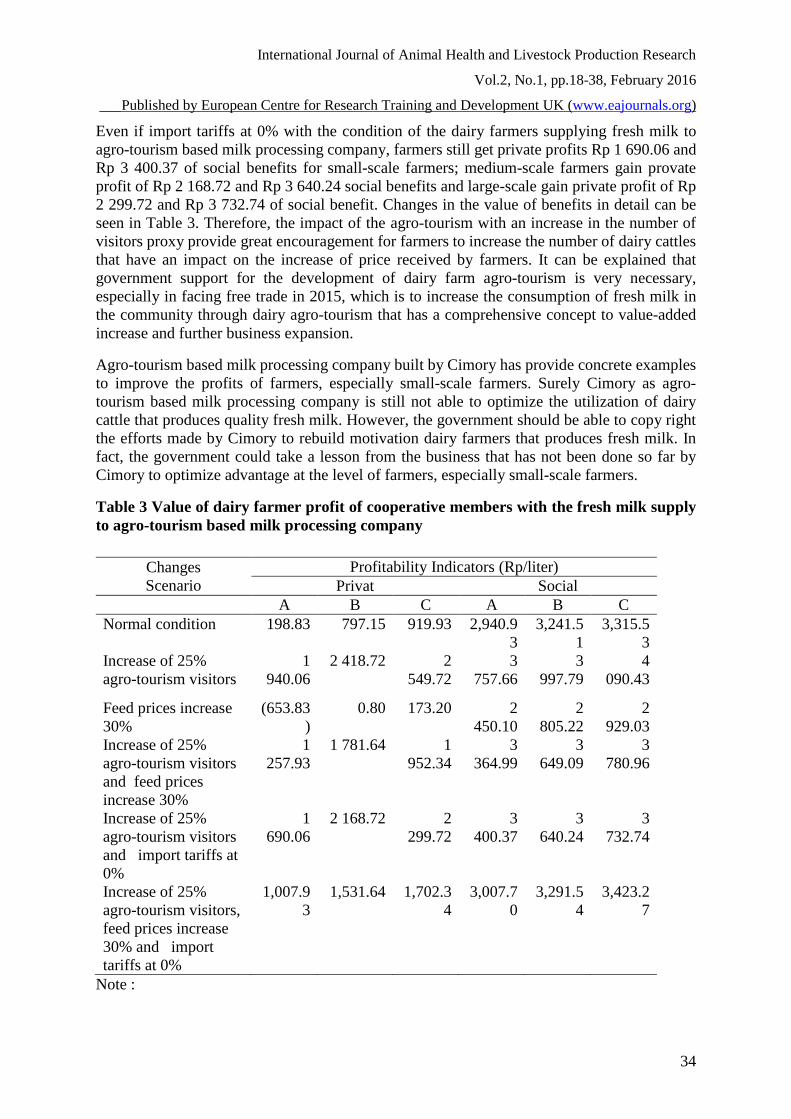
The results of the sensitivity analysis, the visitors increase from the presence of agrotourism
provide the biggest benefit to farmers on the three scales, both on the value of private profits
and social benefits. If there is an increase of 25% visitors then small-scale farmers gain private
profits of Rp 1 940.06 and social benefits of Rp 3 757.66; medium-scale farmers gain private
profits of Rp 2 418.72 and social benefits of Rp 3 997.79; and large-scale farmers gain private
profit of Rp 2 549.72 and social benefits of Rp 4 090.43. If the feed prices increase 30% and
visitor increase of 25%, small-scale farmers are still able to gain private profit of Rp 1 257.93
and Rp 3 364.99 social benefits; medium-scale farmers gain private profit of Rp 1 781.64 and
Rp 3 649.09 social benefits and large-scale gain private profit of Rp 1 952.34 and social benefits
Rp 3 780.96.
International Journal of Animal Health and Livestock Production Research
Vol.2, No.1, pp.18-38, February 2016
___Published by European Centre for Research Training and Development UK (www.eajournals.org)
34
Even if import tariffs at 0% with the condition of the dairy farmers supplying fresh milk to
agro-tourism based milk processing company, farmers still get private profits Rp 1 690.06 and
Rp 3 400.37 of social benefits for small-scale farmers; medium-scale farmers gain provate
profit of Rp 2 168.72 and Rp 3 640.24 social benefits and large-scale gain private profit of Rp
2 299.72 and Rp 3 732.74 of social benefit. Changes in the value of benefits in detail can be
seen in Table 3. Therefore, the impact of the agro-tourism with an increase in the number of
visitors proxy provide great encouragement for farmers to increase the number of dairy cattles
that have an impact on the increase of price received by farmers. It can be explained that
government support for the development of dairy farm agro-tourism is very necessary,
especially in facing free trade in 2015, which is to increase the consumption of fresh milk in
the community through dairy agro-tourism that has a comprehensive concept to value-added
increase and further business expansion.
Agro-tourism based milk processing company built by Cimory has provide concrete examples
to improve the profits of farmers, especially small-scale farmers. Surely Cimory as agro-
tourism based milk processing company is still not able to optimize the utilization of dairy
cattle that produces quality fresh milk. However, the government should be able to copy right
the efforts made by Cimory to rebuild motivation dairy farmers that produces fresh milk. In
fact, the government could take a lesson from the business that has not been done so far by
Cimory to optimize advantage at the level of farmers, especially small-scale farmers.
Table 3 Value of dairy farmer profit of cooperative members with the fresh milk supply
to agro-tourism based milk processing company
Note :
Changes
Scenario
Profitability Indicators (Rp/liter)
Privat Social
A B C A B C
Normal condition 198.83 797.15 919.93 2,940.9
3
3,241.5
1
3,315.5
3
Increase of 25%
agro-tourism visitors
1
940.06
2 418.72 2
549.72
3
757.66
3
997.79
4
090.43
Feed prices increase
30%
(653.83
)
0.80 173.20 2
450.10
2
805.22
2
929.03
Increase of 25%
agro-tourism visitors
and feed prices
increase 30%
1
257.93
1 781.64 1
952.34
3
364.99
3
649.09
3
780.96
Increase of 25%
agro-tourism visitors
and import tariffs at
0%
1
690.06
2 168.72 2
299.72
3
400.37
3
640.24
3
732.74
Increase of 25%
agro-tourism visitors,
feed prices increase
30% and import
tariffs at 0%
1,007.9
3
1,531.64 1,702.3
4
3,007.7
0
3,291.5
4
3,423.2
7
International Journal of Animal Health and Livestock Production Research
Vol.2, No.1, pp.18-38, February 2016
___Published by European Centre for Research Training and Development UK (www.eajournals.org)
35
A : Small scale businesses
B : medium scale businesses
C : large scale businesses
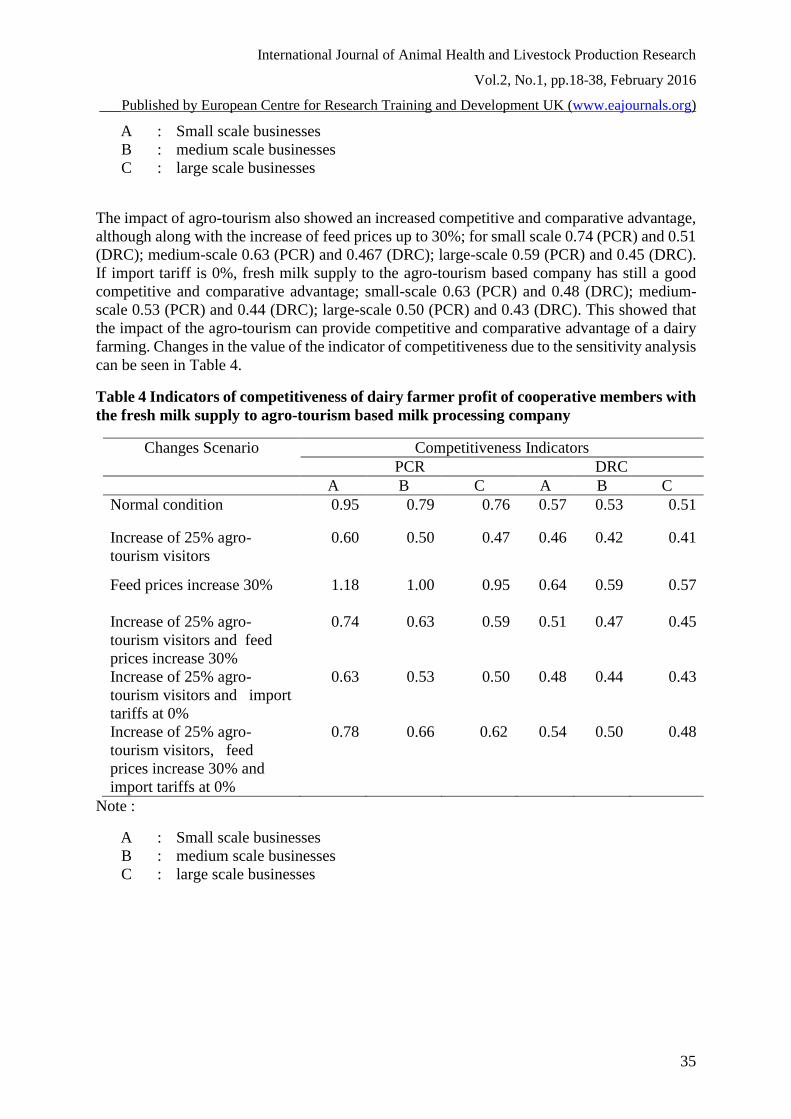
The impact of agro-tourism also showed an increased competitive and comparative advantage,
although along with the increase of feed prices up to 30%; for small scale 0.74 (PCR) and 0.51
(DRC); medium-scale 0.63 (PCR) and 0.467 (DRC); large-scale 0.59 (PCR) and 0.45 (DRC).
If import tariff is 0%, fresh milk supply to the agro-tourism based company has still a good
competitive and comparative advantage; small-scale 0.63 (PCR) and 0.48 (DRC); medium-
scale 0.53 (PCR) and 0.44 (DRC); large-scale 0.50 (PCR) and 0.43 (DRC). This showed that
the impact of the agro-tourism can provide competitive and comparative advantage of a dairy
farming. Changes in the value of the indicator of competitiveness due to the sensitivity analysis
can be seen in Table 4.
Table 4 Indicators of competitiveness of dairy farmer profit of cooperative members with
the fresh milk supply to agro-tourism based milk processing company
Note :
A : Small scale businesses
B : medium scale businesses
C : large scale businesses
Changes Scenario Competitiveness Indicators
PCR DRC
A B C A B C
Normal condition 0.95 0.79 0.76 0.57 0.53 0.51
Increase of 25% agro-
tourism visitors
0.60 0.50 0.47 0.46 0.42 0.41
Feed prices increase 30% 1.18 1.00 0.95 0.64 0.59 0.57
Increase of 25% agro-
tourism visitors and feed
prices increase 30%
0.74 0.63 0.59 0.51 0.47 0.45
Increase of 25% agro-
tourism visitors and import
tariffs at 0%
0.63 0.53 0.50 0.48 0.44 0.43
Increase of 25% agro-
tourism visitors, feed
prices increase 30% and
import tariffs at 0%
0.78 0.66 0.62 0.54 0.50 0.48
International Journal of Animal Health and Livestock Production Research
Vol.2, No.1, pp.18-38, February 2016
___Published by European Centre for Research Training and Development UK (www.eajournals.org)
36
IMPLICATION TO RESEARCH AND PRACTICE
Competitiveness Policy Strategies of Dairy Farmers with Fresh Milk Marketing to Milk-
Based Agro Processing Company
Based on the analysis of PAM that the dairy farmers in the area of research has a comparative
advantage to the DRC value less than one. This indicates that the government should produce
domestic milk without importing from abroad. However, in reality the national milk production
now is only able to meet 30% of the total national demand. Therefore, it is necessary to correct
existing policies and establish policies that are in favor of dairy farmers to improve the system
of dairy farm. Policies can be done in the form of technical and non-technical, or with tariff
and non-tariff to create a profitable and sustainable dairy farm.Based on the sensitivity analysis,
agro-tourism is able to increase competitive and comparative advantage of dairy farm so this
agro-tourism based business needs to be developed. This is also supported by the partnerships
of farmers with agro-tourism based milk processing company which is able to improve the
continuity of fresh milk marketing and certainty to farmers as well as assisting postharvest
handling of fresh milk. In addition, the partnership has also been able to provide favorable input
transfer for farmers because the price of tradable inputs received by farmers on private prices
will be lower than its social prices.
Although based on the analysis of PAM, the fresh milk supply to agro-tourism based milk
processing companies have not been able to maximize the benefit of farmers. Agro-based milk
processing company should seek to maximize profits with the farmers by directly involve
farmers in the development of dairy agro-tourism. Therefore, partnership should be improved
by not only in the form of price incentives to farmers that can increase the quantity of fresh
milk produced by farmers, but also the direction of incentives in terms of technical operation
by the provision of inputs and medicines for farmers, provision of superior cows with AI
technology (Artificial Insemination), mentoring programs, and farming extensions.In addition,
the current government policy and input and medicines subsidies for farmers have not shown
concrete steps. Thus, based on this study government could copy right the success that has been
done by the agro-tourism based milk processing company to improve the competitiveness of
local dairy farmers and the government can also take lessons from the shortcomings that have
not been done by the agro-tourism based dairy processing companies in optimizing the
competitiveness of the dairy farm. Development of this dairy agro-tourism requires substantial
investment, not only sufficient land but also the technology and professionals human resources.
Therefore, efforts are needed to attract investors towards the development of dairy agro-tourism
based company.
CONCLUSION
Conclusion
The conclusion obtained in this study is the dairy farm that supply fresh milk to agro-tourism
based milk processing company is profitable also private and socially efficient. In addition, this
dairy farmers is also competitive with a competitive advantage shown by PRC values <1 and
the comparative advantage of the DRC value <1. The transfer input value of dairy farm that
supply fresh milk to agro-tourism milk processing company is negative, where the price of
tradable inputs received by farmers on private prices will be lower than its social prices. TO,
International Journal of Animal Health and Livestock Production Research
Vol.2, No.1, pp.18-38, February 2016
___Published by European Centre for Research Training and Development UK (www.eajournals.org)
37
NPCO, EPC, NT, PC and SRP of dairy farmers shows it has not been able to maximize the
gross income increase. Based on sensitivity analysis, the impact of agro-tourism which is
measured through visitor proxy increase provide the greatest advantage and competitiveness
of farmers had increased. In fact, even with an increase in feed prices up to 30%,the competitive
and comparative advantage still shows good value.
Suggestion
The farmers who supply fresh milk to agro-tourism based company should increase the
livestock in terms of quality and quantity to increase the income of farmers. Farmers are also
expected to accept and implicate a variety of new technologies for dairy farming as well as
improve the management of maintenance so that the cattle can produce milk with good quality
in order to increase the selling price. While the agro-tourism based milk processing company
should do a partnership with the farmers not only limited to the price incentive received by
farmers, but also to the management of dairy farms in order to produce a quality fresh milk and
accompanied by farm extensions and assistance to the farmers to produce fresh milk with good
quality. The Government supports dairy farming by issue policies in terms of inputs and outputs
that can improve the efficiency and competitiveness of the dairy farms. In addition, the
government should support and develop dairy agro-tourism through a large investment.
FUTURE RESEARCH
Future research could analyse investment of dairy agro-tourism development by benchmarking
the agro-tourism based milk processing companies (Cimory) as reference for the government.
Other than that, future research could also analyse preference of Cimory visitor on consuming
fresh milk or milk products.
REFERENCES
Bessant, BTW. (2005) Analisis Usaha Peternakan Sapi Perah Rakyat Dalam Kaitannya Dengan
Kesejahteraan Peternak di Kabupaten dan Kota Bogor [tesis], Bogor Agricultural
University, Bogor.
[Statistics Indonesia and Directorate of Livestock] Badan Pusat Statistik dan Direktorat
Jenderal Peternakan dan Kesehatan Hewan. (2011) Pendataan Sapi Potong, Sapi Perah,
dan Kerbau 2011, Statistics Indonesia. Jakarta.
Budiasa, IW. (2011) Konsep dan Potensi Pengembangan Agrowisata di Bali, Dwijenagro,
Dwijendra University, Denpasar
Daryanto, A. (2009) Dinamika Daya Saing Industri Peternakan, IPB Press, Bogor.
Emilya. (2001) Analisis Keunggulan Komparatif dan Kompetitif serta Dampak Kebijakan
Pemerintah pada Pengusahaan Komoditas Tanaman Pangan di Provinsi Riau [tesis],
Bogor Agricultural University, Bogor
Erwidodo. (1998) Dampak Krisis Moneter dan Reformasi Ekonomi terhadap Industri
Persusuan Indonesia, Prociding. Agricultural Ministry, Jakarta.
Feryanto. (2010) Analisis Daya Saing dan Dampak Kebijakan Pemerintah terhadap Komoditas
Susu Sapi Lokal di Jawa Barat [tesis], Bogor Agricultural University, Bogor.
Gittinger, JP. (1986) Analisa Ekonomi Proyek-Proyek Pertanian (2nd Ed), UI Press, Jakarta.
International Journal of Animal Health and Livestock Production Research
Vol.2, No.1, pp.18-38, February 2016
___Published by European Centre for Research Training and Development UK (www.eajournals.org)
38
Global Dairy Trade. (2014) Whole Milk Powder Prices, Available at
http://www.globaldairytrade.info/en/product-results/whole-milk-powder/, [Accesed
April 22, 2014].
Khairunnisa, R. (2011) Analisis Daya Saing dan Dampak Kebijakan Pemerintah terhadap
Usaha Peternakan Sapi Perah (Studi Kasus: Peternak Anggota Koperasi Produksi Susu
dan Usaha Peternakan Bogor Kunak, Jawa Barat [skripsi], Bogor Agricultural University,
Bogor.
Krugman, PR. (1994) Competitiveness : A Dangerous Obsession. Foreign Affairs : 73-2.
Monke, EA and Pearson SR. (1989) The Policy Analysis Matriks for Agriculture Development,
Cornell University Press, London.
Mubyarto. (1989) Pengantar Ekonomi Pertanian, LP3ES, Jakarta.
Nugroho, SWP., Pudjotomo, D and Tifan, TK. (2011) Analisa Penyebab Penurunan Daya
Saing Produk Susu Sapi Dalam Negeri terhadap Susu Sapi Impor pada Industri
Pengolahan Susu dengan Metode Fault Tree Analysis dan Barrier Analysis, Jurnal
Teknik Industri, VI (2), pp. 71-80.
Pearson, S and Gotsch, C. (2004) Aplikasi Policy Analysis Matrix pada Pertanian
Indonesia,Translate, Yayasan Obor Indonesia, Jakarta.
Saptana. (1999) Dampak Krisis Moneter dan Kebijaksanaan Pemerintah terhadap Profitabilitas
dan Dayasaing Sistem Komoditi Ayam Ras di Jawa Barat [tesis]. Bogor Agricultural
University, Bogor.
Saptana. (2010) Tinjauan konseptual Mikro-Makro Daya Saing dan Strategi Pembangunan
Pertanian, Forum Penelitian Agro Ekonomi, 28(1), pp. 1-18.
Salvator. (1994) Ekonomi Internasional, Penerbit Erlangga, Jakarta.
Simatupang, P. (1991) The Conception of Domestic Resources Cost and Net Economic Benefit
for Competitive Advantage Analysis.), Agribusiness Division Working Paper 2/91,
Centre for Agro-Socioeconomic Research, Bogor.
Suharjo, B and Siswandi. (1999) Analisis eksplorasi data peubah gand, FMIPA, Bogor.
Sudaryanto, T and Simatupang P. (1993) Arah Pengembangan Agribisnis: Suatu Catatan
Kerangka Analisis. Di dalam: Perspektif Pengembangan Agribisnis di Indonesia.
ICASEPS, Agricultural Ministry. Bogor.
Sudono, A. (2002) Budi daya Sapi Perah. Bogor Agricultural University, Bogor.
Suryana, A. (1980) Keuntungan Komparatif dalam Produksi Ubi Kayu dan Jagung di Jawa
Timur dan Lampung dengan Analisa Penghematan Biaya Sumberdaya Domestik [tesis],
Bogor Agricultural University, Bogor.
Sutardi, T. (1981) Sapi Perah dan Pemberian Makanannya, Bogor Agricultural University,
Bogor.
Sutjipta IN. (2001) Agrowisata, Udayana University, Denpasar.
Swastika DKS. (2005) Dampak Krisis Ekonomi Terhadap Prospek Pengembangan Peternakan
Sapi Perah.Research Result Report. ICASEPS, Agricultural Ministry. Bogor.
Tirtawinata MR and Fachrudin L. (1999). Daya Tarik dan Pengelolaan Agrowisata.,
Penebar Swadaya, Jakarta.
Yusdja, Y and Rusastra, IW. (2001) Industri Agribisnis Sapi Perah Nasional Menantang Masa
Depan, Jurnal Agro Ekonomi 19, pp. 33-42.
Recommended