NASA Technical Memorandum 112211
The Challenges of Field Testingthe Traffic Management Advisor(TMA) in an Operational AirTraffic Control Facility
Ty Hoang and Harry N. Swenson
August1997
National Aeronautics andSpace Administration
https://ntrs.nasa.gov/search.jsp?R=19970028778 2020-03-28T17:27:38+00:00Z


NASATechnicalMemorandum112211
The Challenges of Field Testingthe Traffic Management Advisor(TMA) in an Operational AirTraffic Control Facility
Ty Hoang, Harry N. Swenson, Ames Research Center, Moffett Field, California
August1997
National Aeronautics andSpace Administration
Ames Research CenterMoffett Field, California 94035-1000


The Challenges of Field Testing the Traffic Management Advisor(TMA) in an Operational Air Traffic Control Facility
TY HOANG and HARRY N. SWENSON
Ames Research Center
Summary
The Traffic Management Advisor (TMA), the sequenceand schedule tool of the CentertTRACON Automation
System (CTAS), was evaluated at the Fort Worth Center
(ZFW) in the summer of 1996. This paper describes the
challenges encountered during the various phases of the
TMA field evaluation, which included system (hardware
and software) installation, personnel training, and data
collection. Operational procedures were developed and
applied to the evaluation process that would ensure air
safety. The five weeks of field evaluation imposed
minimal impact on the hosting facility and provided
valuable engineering and human factors data. The
collection of data was very much an opportunistic affair,
due to dynamic traffic conditions. One measure of thesuccess of the TMA evaluation is that, rather than
remove TMA after the evaluation until it could be fully
implemented, the prototype TMA is in continual use at
ZP'W as the fully operational version is readied for
implementation.
Introduction
This paper describes the challenges of conducting a field
evaluation of a modern air traffic management tool at an
operational Air Route Traffic Control Center (ARTCC)
facility. The tool is the TMA. TMA is being developed
by the NASA Ames Research Center and the FederalAviation Administration (FAA) under the Center-
Terminal Radar Approach CONtrol (TRACON)
Automation System program (ref. 1). The CTAS
program was created to develop advanced air trafficcontrol decision support tools. The test facility was theFort Worth ARTCC or ZFW. The field test evaluated the
functionality and usability of the human-computer
interface, and the acceptance of the TMA tool by the
ZFW facility. The test also validated the usefulness and
acceptability of the TMA system by ZFW controllers
and traffic management coordinators (TMCs). The paper
details the operational impact TMA had on the ZFW
facility. An in-depth analysis of the data collected during
the test is presented in follow-up papers by Swenson
(ref. 2), and Sanford and Lee (ref. 3).
Participation by the ZFW and Dallas/Ft. Worth (DFW)-
TRACON facilities, FAA William J. Hughes Technical
Center and the FAA CTAS Program Office, as well asvarious FAA contractors made this field evaluation a
successful venture. Special thanks go out to the Fort
Worth Center TMCs, Danny Vincent, Tommy Sanders,
and Dutch Daugherty, our National Air Traffic
Controllers Association (NATCA) representative, Jim
Karlovich, and DFW-TRACON TMC- Jerry Saunders.
Their participation and enthusiasm helped see this
project through and greatly eased our transition intoZFW and the air traffic control environment.
Air Traffic Coordination and Terminology
As a coordinator of air traffic management, a TMC
estimates and predicts the demand of air traffic and a
facility's capacity to absorb it. Demand describes the
number of aircraft destined for a common airspace, be ita sector or an Air Traffic Control (ATC) facility, within
a specified block of time. Capacity defines the maximum
number of aircraft that can be safely accommodated and
controlled within an airspace and during a given period.
The capacity level of a facility is very dynamic and is
heavily influenced by weather conditions, the
availability of runways and meter gates, capacity
fluctuations of adjacent ATC facilities, and the staffing
level at the facility. A "rush" period refers to a period oftime when the demand of traffic exceeds the handling
capacity of the ATC facility. During a rush period, flowmanagement methods are implemented to insure a safe
and expeditious flow of air traffic. The flow control
methods consist of any combination of the following
techniques: aircraft route modifications, redistribution of
time and distance separation between aircraft, speed
control,altitudecontrol,headingcontrol(vectoring),andmetering.Meteringistheprocessofcontrollingaircraftsothattheyflyoverorcrosspredefinedlocationsatascheduledtimewhilemaintainingsequence.Theamountoftimeanaircrafthastoincurtomeetsequencingorderandschedulingtimeiscalleda"delayabsorption"ordelaytime.
TheTMCdevelopsandinitiatesflowmanagementplansthatmitigatethedifferencebetweentheexpecteddemandandestimatedcapacityofthefacility.Designedasastrategicflowmanagementtool,TMAhelpsTMCsworkthecongestedtrafficbyprovidingapredictionofnear-futuretrafficconditions.OthertrafficmanagementtoolsarealsoavailabletotheTMC.ATMCuseshistoricalknowledgeoftraffic,aspatiallyorienteddisplay,aplanviewdisplay(PVD),andtheArrivalSequencingProgram(ASP)tooltomanagetheflowoftraffic.PriortoTMA,ASPwasusedasameteringtool.ASPgeneratedmeteringtimesanddelayvaluesforusebyboththeTMCsandsectorcontrollers.KnowledgegainedfrompreviousrushesgivesTMCsalimitedabilitytopredictfuturetrafficconditions.
ControllersexecutetheflowmanagementstrategypreparedbytheTMC.A controllermonitorsandcontrolstrafficfromasectorcontrolstation.EachsectorstationhousesaPVDscopeandvariouscommunicationandinformationconsoles.SectorcontrollersusethePVDtovisualizeaircraftpositionandspacing.ThePVDdisplaysamapofthesectorairspace,asequencelist,andsymbolsforallaircraftwithinthatsector.Asequencelistisatableof textshowingthepreferredcrossingtimeandsequenceanaircraftistobeassigned.Acontrollerthenexecutesdifferenttacticaldelaymaneuverssothattheaircraftcanreachthemeteringlocationatthedesiredtime.MeteringensuresairsafetybydeliveringaconsistentandpredictableflowoftrafficintotheTRACONairspace.Theimplementationofflowcontroltechniquessuchasmeteringtypicallyimposesdelaysonaircrafttomeetspacingrestrictions,andtosatisfysequenceandscheduledtimesofarrival(STA).
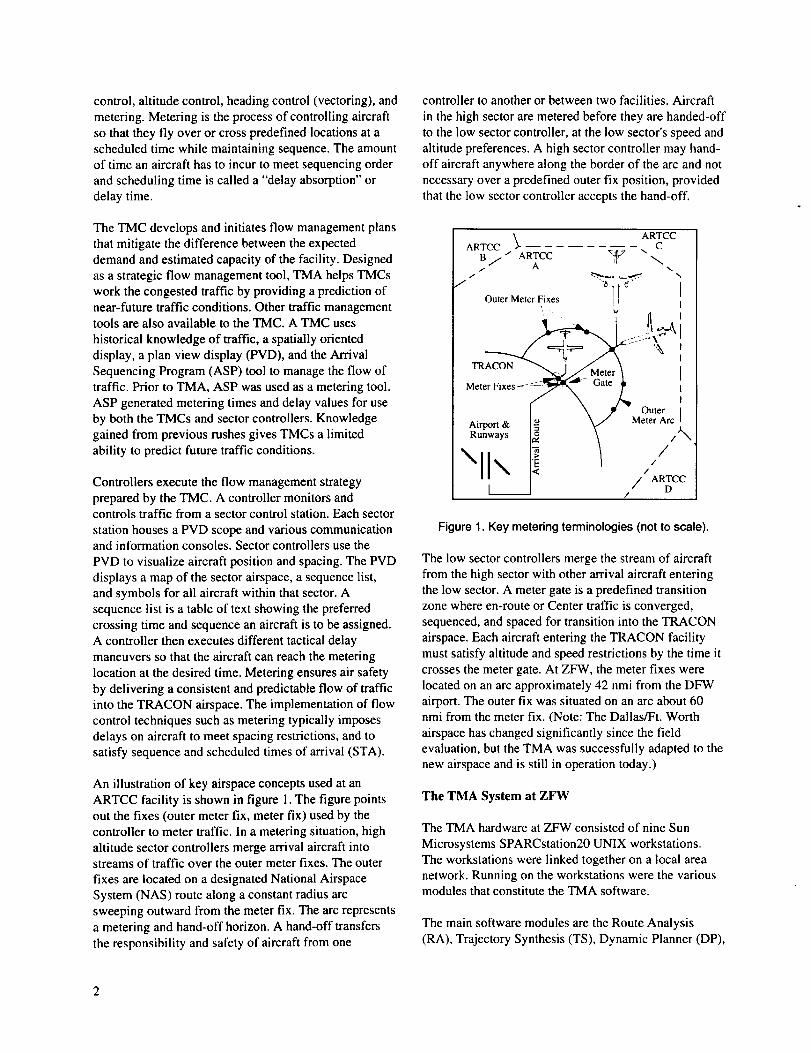
AnillustrationofkeyairspaceconceptsusedatanARTCCfacilityisshownin figure1.Thefigurepointsoutthefixes(outermeterfix,meterfix)usedbythecontrollertometertraffic.Inameteringsituation,highaltitudesectorcontrollersmergearrivalaircraftintostreamsoftrafficovertheoutermeterfixes.TheouterfixesarelocatedonadesignatedNationalAirspaceSystem(NAS)routealongaconstantradiusarcsweepingoutwardfromthemeterfix.Thearcrepresentsameteringandhand-offhorizon.A hand-offtransferstheresponsibilityandsafetyofaircraftfromone
controllertoanotherorbetweentwofacilities.Aircraftinthehighsectoraremeteredbeforetheyarehanded-offtothelowsectorcontroller,atthelowsector'sspeedandaltitudepreferences.A highsectorcontrollermayhand-offaircraftanywherealongtheborderofthearcandnotnecessaryoverapredefinedouterfix position,providedthatthelowsectorcontrolleracceptsthehand-off.
ARTCC _" ARTCCcARTCC _4X \
B// A I_l
Outer Meter Fixes ! i I
Runways 12 _'t" N
\ll,x /
Figure 1. Key metering terminologies (not to scale).
The low sector controllers merge the stream of aircraft
from the high sector with other arrival aircraft enteringthe low sector. A meter gate is a predefined transition
zone where en-route or Center traffic is converged,
sequenced, and spaced for transition into the TRACON
airspace. Each aircraft entering the TRACON facility
must satisfy altitude and speed restrictions by the time it
crosses the meter gate. At ZFW, the meter fixes were
located on an arc approximately 42 nmi from the DFW
airport. The outer fix was situated on an arc about 60nmi from the meter fix. (Note: The Dallas/Ft. Worth
airspace has changed significantly since the fieldevaluation, but the TMA was successfully adapted to the
new airspace and is still in operation today.)
The TMA System at ZFW
The TMA hardware at ZFW consisted of nine Sun
Microsystems SPARCstation20 UNIX workstations.
The workstations were linked together on a local area
network. Running on the workstations were the variousmodules that constitute the TMA software.
The main software modules are the Route Analysis
(RA), Trajectory Synthesis (TS), Dynamic Planner (DP),

TMAGraphicalUserInterface(TGUI),thePlanviewGUI(PGUI),andtheCommunicationsManager(CM).TheRAgeneratesaircraftroutinginformationusinga3-dimensionalpathfromtheaircraft'scurrentlocationtothemeterfix andeacheligiblerunway(ref.4).TheTScalculatesaccurate4-dimensionaltrajectorypredictionsusingroutinginputsfromtheRAandothervariableslikeaircraftperformancemodels,windinformation,andinitialandend-stateconditions (altitude, speed, position)
(ref. 4). TS produces vertical flight profiles, horizontal
trajectories, and aircraft estimated times of arrivals
(ETAs) at the outer fix, meter fix, and runway threshold.
The DP module calculates optimal aircraft sequences
and schedules to the outer arc, meter fix, and all eligible
runways. DP applies capacity restrictions of wake vortex
separation requirement, Airport Acceptance Rate
(AAR), miles-in-trail separation to the TS-generated
ETA times to produce conflict-free STA (ref. 5). TheTGUI is a time-based flow visualization tool, displaying
ETA and STA sequences on vertical timelines. It is the
primary tool of the TMC for interfacing with the TMA.The TMC enters flow control constraints into the TMA
system via the TGUI (ref. 6). A second flowvisualization tool available to the TMC is the PGUI.
It displays aircraft tracks, sequences and delay value
information on a computer-generated airspace map(ref. 7). Lastly, the CM module provides the underlying
communication and messaging infrastructure that
supports the other software modules (ref. 8).
TMA in the Traffic Management Unit (TMU)
The TMU consists of a group of TMCs working in
concert to coordinate all traffic within the facility. The
TMCs are presented with two flow visualization tools,
the PGUI and TGUI. These tools provide the TMC with
different visual representations of the arrival traffic. The
PGUI shows a planview of the Center airspace (fig. 2).
Aircraft radar tracks within the Center boundary and as
far as 400 nmi from the meter fix can be displayed on
the PGUI. The PGUI allows the TMC to quickly and
easily query aircraft information via aircraft datablock
tags. Alternatively, the PGUI can display aircraft in the
sequence-list format similar to that displayed on the
PVD. TMA was used in place of an existing tool, ASP,
which provided a sequence list format on the PVD. Oneof the conditions imposed by the TMCs was that thisformat be available in TMA as well.
*.l u ZFW Air.-l_¢e _ Aircraft S_l_nee Li$1
_'_ _ _'._
-,_.q, n,. o,.
Figure 2. Aircraft tracks and sequence list, as displayedon the PGUI.
The TGU'I uses a timeline format to represent scheduling
and sequencing information, and delay values for aircraftas far as 90 minutes from the meter fix estimated arrival
time. Figure 3 shows a runway threshold timeline,
showing aircraft from all meter fixes that are landing on
runways 13R and 18R. The timeline is read from bottom
to top, with current time (in minutes after the hour) at the
bottom. As time elapses, the aircraft symbol and time
value moves down the timeline. For example, aircraftAALI712 has a threshold STA time of 13.5 minutes
after the hour. It has two minutes of delay, and is landing
on runway 18R.
Figure 3. Threshold timeline with aircraft tags and STAtimes.

Aircraft sequences are frozen as each aircraft's ETA
passes the freeze horizon. The freeze horizon is a user-defined temporal parameter that determines when (inminutes, before an aircraft reaches the reference point,
generally a meter fix) aircraft schedule, sequence andSTA time should be fixed. Frozen sequences and delay
values are displayed in a list format on the controller's
PVD scope. The frozen schedules give the controller astable list to control aircraft. From the TGUI timelines,
the TMC can predict when and where a rush will arrive.
The predictive capability permits the TMC to produce an
effective traffic plan.
In addition to traffic planning, ZFW and DFW-TRACON TMCs used TMA as a collaborative decision
making tool. Because Center can provide TRACON withan accurate characteristic of the impending rush traffic,
the TMCs can negotiate an AAR that is acceptable toboth facilities.
TMA at the Radar Positions
Use of TMA had minimal impact on the controllers.
Under ASP, the STA metering times and delay values
were displayed on the controller's PVD in a table-likeformat called a sequence list. TMA emulated the format
of the ASP sequence list to display advisory times.From the controller's perspective, the TMA-generated
sequence list varied little from the ASP list. Thevariation included the outer arc reference for high
altitude controller and tactical sequence control.
For all intents, TMA usage was made transparent to the
sector controllers. The only indication given to the
controller is a header message indicating TMA was
operational instead of ASP. The header message, located
at the top of the sequence list, indicates the AAR along
with a text message displaying "CTAS."
Scope of the Field Evaluation
Engineering Evaluations
The field evaluation was conducted in two stages, one
week of engineering evaluation and four weeks of
operational evaluation in which quantitative and
qualitative data was gathered. The primary objective
of the engineering evaluation was to establish a secured
two-way (bi-directional) communication link between
the ZFW Host computer system and the TMA system.
The two-way communication allowed for the broad-
casting of TMA advisory times onto the controllers'
PVD. Operational data collection depended on the
successful completion of the engineering evaluation.
Other testing criteria were assessed during the
engineering evaluation period. Accuracy of STA timesand delay values at the outer fix and meter fix were
scrutinized. The sequencing of arrival aircraft to each
meter fix and runway was checked for efficiency.
Another goal of the evaluation was to check for
assurances that all available landing slots were occupied
and loading of the runways was balanced.
Operational Evaluations
The objective of the second stage of the evaluation was
geared toward the collection of engineering and human
factors data. Operationally, TMA metered multiple rush
traffic throughout the day. An in-depth analysis of the
engineering data is detailed by Swenson (ref. 2).
Engineering data collected during the operational period
were very similar to those collected during the
engineering evaluation period, i.e., aircraft sequencing
and accuracy of STAand delay values. Human factorsassessments are addressed by Sanford and Lee (ref. 3).
Human factors issues included human-computer
interface and workload factor as perceived by both
controllers and TMC during rush periods.
ZFW rush traffic hours were known to occur at: 8, 9, and
11 AM, 12 Noon, 1,2, 5, and 7 PM local time. Due to
resource constraints, but for quantitative comparisons,TMA was used to meter two occurrences of the same
rush hour traffic. Table 1 shows the rush traffic that was
recorded during the engineering and operational
evaluation periods. When time permitted, additionalshadow files (see "Shadow Data Collection") were
collected to expand the shadow-file database. A total of
39 operational periods were recorded. As shown, TMA
metered multiple rush hours throughout the day.

Table1.Fieldevaluationtestmatrix.
CSTBIMN
W
CentralStandardTime(localtime)Baselinedatarecording(shadowdata)RecordedanunscheduledrushScheduledmeteringperiod(usingTMA)Rushfailedtomaterializeduringscheduledperiod,datanotrecordedWeatheraffecting"normal"trafficresultinginabnormaltrafficpattern
The Data Set and Recording
For each of the 39 recorded rushes, an engineering anda human factors data set was recorded. The TMA
evaluation team held a debriefing after each rush period
to clarify any system and traffic anomalies encounteredduring that rush. Together, the two data sets formed a
complimentary view of how traffic was controlled, theworkload involved in controlling it, and the factors that
influenced traffic management decisions.
The engineering data set consisted of three data files: a
radar file, a TMA data file, and a log file. The radar file
records ground track history, flight plans, routing
information, and TMA-Host messaging information.
The TMA system is capable of automatically recordingan extensive amount of data, 151 different variables.
Example data include: aircraft position, ground and air
speeds, beacon code, call sign identifications, flight plan,winds aloft information, and ETAs and STAs to variousfixes.
The log file documents all information pertinent to each
evaluation period not included in the radar file or
accessible by the TMA data file (i.e., real-time data
recorded manually). The types of data recorded include
airport weather condition, visibility, airport flow
configuration and acceptance rate, and the number of
available runways. Additionally, any anomalous traffic
characteristics, strange aircraft behavior, and traffic
resolution procedures were recorded.
Questionnaires were used to collect human factors data.
Controllers and TMCs were asked to complete the
questionnaires after each metering period. Controllers
rated TMA features such as aircraft sequence, the
aircraft swapping function and the quality of the
advisory times. The questionnaires gave controllers an
opportunity to express their opinion about the TMA
system and its impact on their workload level. The
TMCs rated the performance and acceptability of the
TMA system. TMC-related workload level and ease-of-
use of the human-computer interface were addressed in
the questionnaire (ref. 3). Initial responses fromcontrollers and TMCs showed a favorable inclination
toward the usage of TMA to meter traffic.
A Sample Rush Period
Ground track history of a typical noon hour rush is
plotted in figure 4. The airport arrival rate was set at 108
aircraft per hour for this particular period. Note the four
convergent streams of traffic located near the center of
the picture. The convergence represents the transition of
aircraft from the Center into the TRACON airspace.Each of the traffic streams delivers aircraft over a meter
gate. (Note: the scale for figs. 4 and 5 is in nmi.)
yVS. X_71t 114_ ¢_'W*n_
200 400 600
Figure 4. Aircraft tracks in center airspace,

Figure 5 shows aircraft tracks inside the TRACON
airspace, from the airport out to the meter gates. This is
a close-up of figure 4. Starting from the upper right
(North-East) and proceeding clockwise, the metering
gates at DFW were: Blue Ridge (BUJ), Scurry (SCY),Acton (AQN), and Bridgeport (BPR). The parallel
runways are located in the middle of the picture. Asouth-flow landing configuration is readily discernible.
!/.
TRACON t,=ek=
Figure 5. Aircraft tracks in TRACON airspace.
Figure 6 plots the predicted aircraft throughput (flow) as
a function of time. The throughput peaked at 30 aircraft
about 16:30 UTC (or 17,000 seconds after TMA started).
The TMA aircraft-count parameter was set to countaircraft within a 10-minute sliding window. With 30
aircraft per 10-minute interval and at an AAR of 108,
which is equivalent to 18 aircraft per 10 minute interval,
demand easily exceeded airport capacity. The figure
plots arrival aircraft for both DFW--solid line and DallasLove Field (DAL)-dotted line, airports. Currently, only
TMA generated scheduling times and sequences foraircraft landing at the primary airport (DFW) are used
and not at any satellite airports (i.e., DAL).
Projected Throughput
!
i
o
• • . • • o o
Figure 6. Projected airport throughput diagram.
The number of aircraft landed during this rush period is
graphed in figure 7. The figure identifies three
distinctive flow characteristics. At the beginning of the
rush, a front-loading period is established, followed by a
sustained period where TMA scheduled the propernumber of aircraft to meet the desired airport arrival rate
of 108 per hour. The rush ended with a drop-off period,
where demand dissipated. "Front-Load" allowsTRACON to land more aircraft than the AAR, at the
beginning of the rush when a higher capacity is allowed.
The amount of traffic that exists before front-loading is
comparable to the drop-off period. Figure 7 represents a
typical rush period with front loading.
Threshold Aircraft Count of Sample Rush
FronI-Load
Susl_ned AAR • 108
:4g :r_UTC
Figure 7. Threshold aircraft count.
Challenges and Limitations
Many challenges were encountered during the pre-
evaluation and formal evaluation period at ZFW. The
challenges and limitations varied in scope, ranging from
system checkout to training of facility personnel, and

installationofthesystematthetestsite.Inthefield,proceduresofconductweredevelopedforoperationaluseanddatacollection.
Challenges Prior to the Field Evaluation
Human-in-the-Loop Computer Simulation
Extensive preparatory work was done to support the
field evaluation. The human-in-the-loop computer
simulations employed pilots and controllers to evaluate
the TMA software. Controllers used TMA-generated
sector airspace maps to give advisories to the pilots, who
flew simulated aircraft that had six degrees of freedom
dynamics (ref. 9). The simulations duplicated most
controller and pilot interactions and exercised most
TMA functions. However, the human-in-the-loopsimulations conducted at NASA Ames could not
simulate the two-way, bi-directional communication
protocol that takes place between the TMA and Host
Computer System (Host) at the Center. The testing of the
two-way communication was performed at the FAATC
in New Jersey.
The FAATC facility has the capability to duplicate the
operational environment at ZFW. The simulation
permitted interaction between the Host computer, TMA,and controllers. FAATC simulations examined controller
issues, verified non-interference, and allowed for an
overall system checkout. Issues that controllers looked
for included the quality and usefulness of the human-
computer interface, and testing of new controller-
specific functions. Checks for non-interference
compliance were extensively conducted to insure
communication integrity with the Host. In two-waymode, the Host transmits TMA-generated times to be
displayed on the PVD scope of all metering sectors.
Without exception, TMA had to gain non-interference
approval from the FAATC before operational evaluationat Z FW.
Shadow Data Collection
A series of live traffic recordings or "shadow" data files
were collected before and during the field evaluation.
These shadow files formed the baseline model against
which the data collected during field evaluation was to
be compared. The shadow files captured STA time,
delay value, and aircraft sequence data that were
generated by the ASP metering program. These filesshow the traffic handling capability at ZFW under ASP.
A method of assuring a statistical match between the
baseline and field test data set was to record a large
sample of baseline data. It was anticipated that matching
data sets could be found between similar rush periods.
Challenges at the Field Site
TMA System Requirements
In support of the field evaluation, the ZFW facility
created a new traffic management area called the CTAS-
TMU. The CTAS-TMU used TMA to construct a plan to
meter traffic. When the CTAS-TMU is operational, the
existing ZFW TMU acts as a secondary unit. In theevent of a CTAS-TMU emergency, the ZFW TMU
would supersede as the primary TMU. The CTAS-TMU
area housed TMA and the supporting hardware (fig. 8).
Five Sun SPARCstation20 workstations, video displays,
a PVD, and the TMC communication station werelocated in the CTAS-TMU area. Five additional UNIX
workstations were situated at another location, but all
were connected on the same network. The complimentof nine workstations is considered a minimal hardware
configuration required for operational use and to conductthe field evaluation. The TMC monitors all arrival traffic
via the PVD, PGUI, and TGUI displays. Thecommunication station allows the TMC to contact other
TMCs, sector controllers, and ATC facilities.
Figure 8. CTAS-TMU, TMA engineer (background), and
TMC with PVD scope (foreground).
Personnel Requirements
A team of eight ATC and TMA specialists conducted thefield evaluation. The team consisted of two ZFW TMCs,
a NATCA representative, three research engineers, and
two human factors specialists. By using TMA to guide
traffic, the TMCs evaluated the performance of the
system.TheNATCArepresentativeactedasaliaisonbetweenthecontrollersatthesectorcontrolstationsandtheevaluationteamattheCTAS-TMUduringthetesting.Theengineersensuredanorderlyfieldevaluation,monitoredthehealthofthesystemandcollectedengineeringdata.
ArrangementsweremadebytheNATCArepresentativewiththelocalunionchaptertoallowthehumanfactorsspecialiststomonitorandcollectdataatthevarioussectorstations.After each observation period, the
human factors specialists handed out and collected
questionnaires from controllers and TMCs. Disruptions
to the controllers were minimized by using the NATCA
liaison as a point of contact between the controllers andthe evaluation team. When testing certain TMA
functionalities, the arrangement with the controllers was
also made by the liaison.
Although not a part of the evaluation team, the TMCsat the TRACON facility also assisted with the field
evaluation. They were instrumental in providingfeedback to the evaluation team. The feedback included
comments on the quality and quantity of aircraft
delivered into the TRACON airspace. This allowed the
ZFW TMCs to update their traffic plans, and to adjust
the flow characteristics of subsequent rush periods.
Operational Procedures
An operational procedure for the field evaluation was
developed with inputs from ZFW management and
controllers. The procedure described when, who, andunder what conditions the TMA system should be
engaged to meter traffic. These procedural limitationswere necessary to ensure air safety. A fundamentalconstraint stated that under no circumstances shall the
TMA system interfere with the Host computer system.
In a worst case scenario, where the TMA system
malfunctioned while metering traffic, a safety procedure
was developed that allowed the ZFW facility to revert
back to the ASP program for metering advisories.
Several simulations of this procedure showed that it took
less than one minute to accomplish the transition. The
ZFW facility found the transition time acceptable.
Although this was an unlikely scenario, the test team had
to demonstrate this capability to gain the confidence of
the personnel involved and ZFW management.
The operational procedure required that the engagement
of the TMA system be conducted under the supervisionof a TMC who was trained on the TMA system. The
TMC would determine if metering was necessary, when
to meter, and the duration of the metering period.
Ultimately, the TMC is accountable for flow control
decisions that affect all aircraft within the facility's
airspace. If necessary, the TMC had the ability to
override any and all TMA generated advisories. In
addition, a TMA engineer was required to be present
during each metering session to monitor the health of
the system.
The evaluation also stipulated that the testing exact
minimal impact on normal facility operations. As an
example, prior to engaging the TMA system, the air
traffic automation staff (who maintains the Host
computer) was asked to enable two software "switches"that allowed TMA to communicate with the Host
computer. The same switches were used to disconnect
TMA from the Host computer. The toggling of the
switches could be accomplished by one person and
required little supervision by the automation staff,
thereby minimizing facility support of TMA.
Training Issues
To operate TMA efficiently and effectively, TMCs
unfamiliar with TMA were required to attend a training
session. The training required one day of classroom
instruction and several weeks of on-the-job training
(OJT). The new TMCs were trained by a TMC on theevaluation staff. The classroom instruction introduced
the trainees to TMA capabilities. The OJT allowed the
trainees to exercise TMA functionality and varied induration for each TMC.
The TMCs were not required to get formal certificationon the TMA system, but it was critical that they got fully
acquainted with the capability of the system. Decisions
made by the TMC have a rippling effect throughout the
facility, affecting high sector and low sector controllers,
and the delivery of traffic into the TRACON facility.
As mentioned previously, training of sector controllers
on the interpretation of the sequence list was minimal.
The similarity of the format of the ASP vs. TMA lists
required little controller training and expedited the
acceptance of the TMA system. The minimal
requirement in training was significant, considering the
number of controllers working at the facility. Many
controllers work the rush traffic, with up to three
controllers per sector and a minimum of eight sectors.
Throughout the evaluation period, TMA was used to
meter traffic during different hours of the day with atleast one change of controller work-shift. Each work
shift change has the potential to introduce new variables
into the test system, in terms of aircraft handling
preference and style. Nevertheless, it was critical that the

controllerswerecomfortablewiththesequencelistandemployedit tocontrolledaircrafttomeetSTAs.
Inadditiontothesequencelist,controllersweretrainedontheuseofanewaircrafthandlingtechniquerequestedtobeincludedinTMAbythecontrollers.Theaircraftswappingfunctionallowsthecontrollertoswapthesequenceoftwosimilartypeaircraftflyingoverthesamemetergate(i.e.,twojetscrossingtheBridgeportgate).Theswappingofsequencesgivescontrollersanadditionalaircrafthandlingtechnique,inadditiontospeed,altitude,andvector.
Data Collection Procedure and Conduct
As the anticipated rush period approached, the
atmosphere inside the air traffic facility became more
tense. In this high stress environment, the evaluationteam collected engineering and human factors data. The
high pressure environment increased the complexity of
data gathering.
The collection of data was very much an opportunistic
affair. Although the test matrix provided a data gathering
schedule, the behavior of the rush traffic was uncertain.
An example of this opportunistic activity can be seen in
the data collection made on July 23rd (see Table 1).
Three data recording periods were planned for that
evening but the rush traffic did not appear. Earlier in the
day, a thunder storm encroached on the Dallas/Ft. Worth
area and forced traffic to divert to adjacent ATC
facilities. The diversion dispersed enough aircraft that
the anticipated 6:00 and 8:00 PM rushes never
materialized. Whereas on July 24th, a rush periodformed an hour earlier than the scheduled 3:00 PM rush.
By the time the 3:00 PM hour arrived, there was not
enough traffic to require metering. The test team wasalert to traffic conditions and data collection was
initiated when warranted.
The diverse traffic collected in the data files was
classified using attributes common to each rush. The
data file contained information such as airport flow
configuration, AAR, weather conditions, and delay
classification. From the amount of delay imposed upon
the aircraft in the system, the rush traffic could be
classified as light (delay less than 5 minutes), medium
(less than 15 min.) or heavy (greater than 15 rain.).
These attributes were used to catalog and classify the
type of rush traffic, as well as database search
parameters. The same cataloging method was applied to
the shadow files. Although each recorded rush was
unique, the cataloging scheme provided a means of
comparing similarly configured operational and baselinedata files.
At the sector stations, the objective of the data collectors
was to collect accurate log of traffic while keeping
controller-interrupts to a minimum. To insure accuracy,
it is preferable to document traffic situations as they
unfold rather than from memory. Clarification of trafficanomalies was more accessible at the CTAS-TMU than
at the sector stations, due to high controller workload.
Human factors data were collected at randomly chosensector stations and at the CTAS-TMU, where
engineering data was also collected.
Concluding Remarks
Many challenges were encountered in preparation for theTMA field evaluation at ZFW, from the construction of
the baseline database to the non-interference testing at
the FAATC. These challenges included: installation ofthe system at the test site, training of the TMCs and
controllers, development of operational procedures
including fall-back plans in the event of a TMA failure,
matching the display format of a previously used
metering aid and establishing data collection protocols.
The hurdles were overcome via a high degree of
coordination and cooperation between ZFW manage-ment, controllers, and the TMA evaluation team.
The field evaluation itself is a challenge. Unlike thecontrolled environment of a simulation test where
specific cases can be created and arrival patterns can be
duplicated exactly, gathering data in the field is strictly
opportunistic. Matching ensembles of data sets collected
with TMA in use to "equivalent" rush periods when
TMA was not in use was a painstaking process,
involving developing a categorization based on rushattributes. Careful collection of human factors data at
radar positions involved creation of data collection
forms, completion of controller questionnaires, as well
as intensive observation of the rush period.
Overall, the field evaluation was considered a
tremendous success. The field evaluation imposed
minimal impact on the hosting facility and provided
valuable engineering and human factors data. The
success of the project was realized when the ZFWfacility requested to have TMA operational during all
metering periods.
9

References
1. Erzberger, H., Davis, T.J., and Green, S.M.: "Design
of Center-TRACON Automation System."
Proceedings of the AGARD Guidance and
Control Panel 56th Symposium on Machine
Intelligence in Air Traffic Management, Berlin,
Germany, 1993, pp. 11-1-11-12.
2. Swenson, H.N., Hoang, T., Engelland, S., Vincent, D.,
Sanders, T., Sanford, B., and Heere, K.:
"Design and Operational Evaluation of the
Traffic Management Advisor at the Ft. WorthAir Route Traffic Control Center," to be
published as a NASA Technical Memorandum.
3. Sanford, B. and Lee, K.: "Traffic Management
Advisor: An Operational Human Factors
Evaluation," to be published as a NASATechnical Memorandum.
4. Davis, T.J., Krzeczowski, K.J., and Bergh, C.: "The
Final Approach Spacing Tool." Proceedings of
the 13th IFAC Symposium on Automatic
Control in Aerospace-Aerospace Control, Palo
Alto, CA, 1994, pp. 70-76.
5. Wong, G.: "The Dynamic Planner," to be published asa NASA Technical Memorandum.
6. Air Traffic Management Branch: "TMA Procedure
Summaries, Release 4.2.1 t," NASA Ames
Research Center, Moffett Field, CA, July 1995.
7. Air Traffic Management Branch: "Traffic
Management Advisor, PGUI Addendum,
Release 4.3.0t," NASA Ames Research Center,
Moffett Field, CA, August 1996.
8. Air Traffic Management Branch: "Two Way Interface
(TWI) Developer's Guide, PreliminaryRelease." NASA Ames Research Center,
Moffett Field, CA, January 1997.
9. Weske, R.A and Danek, G.L.: "Pseudo Aircraft
Systems: A Multi-Aircraft Simulation System
for Air Traffic Control Research." Proceedings
of the AIAA Flight Simulation TechnologiesConference, Monterey, CA, August 1993.
10

Form Approved
REPORT DOCUMENTATION PAGE oMBNo.ozo4-o18o
Public reporting burden for this collection of information is estimated to average 1 hour per response, including the time tOT reviewing instructions, searching existing data sources,
gatheringand maintainingthe data needed, and completingand reviewingthe collectionof information. Send commentsregardingthis burdenestimate or any other aspect of thiscollection of information, including suggestions lOT reducing this burden, to Washington Headquarters Services, Directorate for information Operations and Reports, 1215 Jefferson
Davis Highway, Suite 1204, Arlington,VA 22202-4302, end tothe Office of Management and Budget,Paperwork ReductionProject(0704-0188), Washington, DC 20503.
1. AGENCY USE ONLY (Leave blank) 2. REPORT DATE 3. REPORT TYPE AND DATES COVERED
August 1997 Technical Memorandum4. TITLE AND SUBTITLE 5. FUNDING NUMBERS
The Challenges of Field Testing the Traffic Management Advisor (TMA)
in an Operational Air Traffic Control Facility
6. AUTHOR(S)
Ty Hoang and Harry N. Swenson
7. PERFORMING ORGANIZATION NAME(S) AND ADDRESS(ES)
Ames Research Center
Moffett Field, CA 94035-1000
9. SPONSORING/MONITORINGAGENCYNAME(S)ANDADDRESS(ES)
National Aeronautics and Space Administration
Washington, DC 20546-0001
8. PERFORMING ORGANIZATIONREPORT NUMBER
A-977300
10. SPONSORING/MONITORINGAGENCY REPORT NUMBER
NASA TM- 112211
11. SUPPLEMENTARY NOTES
Point of Contact: Ty Hoang, Ames Research Center, MS 210-9, Moffett Field, CA 94035-1000(650) 604-1980
12a. DISTRIBUTION/AVAILABILITY STATEMENT
Unclassified-Unlimited
Subject Category-03
12b. DISTRIBUTION CODE
13. ABSTRACT (Maximum 200 words)
The Traffic Management Advisor (TMA), the sequence and schedule tool of the Center/TRACONAutomation System (CTAS), was evaluated at the Fort Worth Center (ZFW) in the summer of1996. This paper describes the challenges encountered during the various phases of the TMA fieldevaluation, which included system (hardware and software) installation, personnel training, and datacollection. Operational procedures were developed and applied to the evaluation process that wouldensure air safety. The five weeks of field evaluation imposed minimal impact on the hosting facilityand provided valuable engineering and human factors data. The collection of data was very much anopportunistic affair, due to dynamic traffic conditions. One measure of the success of the TMAevaluation is that, rather than remove TMA after the evaluation until it could be fully implemented,
the prototype TMA is in continual use at ZFW as the fully operational version is readied for imple-mentation.
14. SUBJECTTERMS
Traffic Management Advisor (TMA), ZFW ARTCC, Field testing
17. SECURITY CLASSIFICATIONOF REPORT
Unclassified
NSN 7540-01-280-5500
18. SECURITY CLASSIFICATIONOF THIS PAGE
Unclassified
19. SECURITY CLASSIFICATIONOF ABSTRACT
15. NUMBER OF PAGES
1416. PRICE CODE
A03
20. LIMITATION OF ABSTRACT
Standard Form 298 (Rev. 2-89)Prescribed by ANSI Std. Z39-18
298 - 102
Recommended