THE BARRIOUS OIL WRAPPING SYSTEM (BOWS), A DIETARY SUPPLEMENT
TO AID IN THE TREATMENT OF OBESITY
A THESIS SUBMITTED TO THE GRADUATE DIVISION OF THE UNIVERSITYOF HAWAI'I IN PARTIAL FULFILLMENT OF THE REQUIREMENTS FOR THE
DEGREE OF
MASTER OF SCIENCE
IN
MOLECULAR BIOSCIENCES AND BIOENGINEERING
DECEMBER 2004
ByNatalie Kong
Thesis Committee:
Harry Ako, ChairpersonPratibha NerurkarC. Alan Titchenal
Clyde Tamaru
ACKNOWLEDGEMENTS
We would like to thank the Barrious Laboratories and the
HaumanaJMARC program for support with this project. The author would like to
thank Dr. Harry Ako for always demanding excellence, Dr. Clyde Tamaru for
help with statistics, fellow lab mates for helping in many different aspects of this
project and the Kong family for being a source of unending support.
E ala mai kakou e nil kini, nil mamo 0 ka 'ilina aloha . .. e paepae hou 'ia
ka p6haku i pa 'a maila ke kahua hale hou. No kiikou e nil pua e ho 'olulu ai.
Ua Ao Hawai 'i, Larry Kimura
111
ABSTRACT
The Barrious Oil Wrapping System (BOWS), a commercial dietary
supplement, was tested. Using in vitro titrimetric assays with olive oil (100 mg),
BOWS caused a 50% decrease in pancreatic lipase activity between 50 and 75
mg. This is consistent with BOWS blocking the action of lipase by sequestering
the oil out of solution. Juvenile rats fed 24% fat containing 10% BOWS diets
weighed significantly less than rats fed control. Rats fed 10% fat with 5 or 10%
BOWS had significantly less intraperitoneal fat than rats eating a 10% fat diet.
Rats fed 20% fat with 15% BOWS diets gained significantly less weight than rats
eating the control diet. BOWS was associated with decreased blood glucose
levels suggesting that BOWS could playa role in managing type 2 diabetes. It
was concluded that BOWS could be effective in weight loss programs that also
include social support and/or satiety maximizing diets.
IV
TABLE OF CONTENTS
Acknowledgements .iii
Abstract .iv
List of Tables vi
List of Figures vii
Chapter 1: Introduction 1
Chapter 2: Methods 6
Chapter 3: Results .16
Chapter 4: Discussion 28
Appendix 36
References 38
v
LIST OF TABLES
1. Ingredient formulation of diets in Trial 1 (giiOO g ofdiet) IO
2. Nutrient composition and energy content of diets in Trial 1 (giiOO f of diet) ... 10
3. Ingredient formulation ofreformulated diets during follow up experiment (gil 00g food) 12
4. Nutrient composition and energy content of reformulated diets (giiOO g ofdiet) 12
5. Ingredient formulation of diets in Trial 2 (giiOO g diet) 13
6. Nutrient Composition and Energy Content of Diets in Trial 2 (giiOO g of diet) 14
7. Average food (g) and energy (kJ) consumed in Trial 1 (± S.E.) 19
8. Average food (g) and energy (kJ) consumed (± SE) for rats eating 10% fat diets or10% fat diets plus 5% or 10% BOWS .21
9. Average food (g) and energy (kJ) consumed (± SE) for rats eating 20% fat diets or20% fat diets plus 5% or 10% BOWS '" " 22
10. Effect of BOWS on plasma eicosapentaenoic acid (EPA), docosahexanoic acid(DHA) and total plasma fatty acids of rats fed control, HF and HF plus 10%BOWS diets (mg/IOOmg) 24
11. Effect ofBOWS on blood triglyceride (TG) and glucose levels in rats fed 20% fatdiet or the 20% fat diet with 7.5% and 15% BOWS in Trial 2 25
12. Effect ofBOWS on the average weight (g) of intraperitoneal fad pads in rats fedthe 10% fat diet or the 10% fat diet plus 5% or 10% BOWS .26
13. Effect ofBOWS on the average weight (g) of intraperitoneal fad pads in rats fedthe 20% fat diet or the 20% fat diet plus 7.5% or 15% BOWS 27
VI
LIST OF FIGURES
Figure
1. Triacylglyceride emulsion by a bile salt .4
2. Hydrolysis oftriacylglycrerides by pancreatic lipase 7
3. Individual housing of Long-Evans rats in the Biomedical animal facilities duringanimal studies , 8
4. Preparation ofhigh fat (HF) and BOWS diets 9
5. Effect of the bile salt taurodeoxycholate on lipase activity 16
6. Effect of taurodeoxycholate on pure lipase activity in the presence and absence ofcolipase at pH 7.81 '" 17
7. Effect ofBOWS on crude lipase activity at pH 7.81 18
8. Effects ofBOWS on body weight in Long-Evans rats fed control, high-fat (HF)and 10% BOWS diets 20
9. Effect of BOWS on body weight in Long-Evans rats fed 10% fat diet or 10% fatdiet plus 5% and 10% BOWS .21
10. Effect ofBOWS on body weight in Long-Evans rats fed a 20% fat diet or 20% fatdiets with 7.5% or 15% BOWS 23
11. Intraperitoneal fat in a Long-Evans rat fed the 20% Fat Diet in Trial 2 .25
12. Demonstration of the gel formed by BOWS. Olive oil is sequestered from amixture of BOWS and water (a) into a gel (b) 28
Vll
CHAPTER 1: INTRODUCTION
The Barrious Oil Wrapping System, or BOWS, is a popular dietary supplement
from Japan. Advertisers call it a fat blocker that "wraps" fat in microcapsules to keep it
away from intestinal or blood vessel walls!. There is anecdotal evidence that BOWS
effectively causes weight loss and even the owners of the company reported using the
product and losing weight (C. Yamamoto, personal communication). Barrious
Laboratories wanted a rigorous scientific examination of their product in order to
manufacture and sell BOWS as a food supplement in the United States. This study was
accepted under the condition of complete freedom to report the results.
The problem area for the current research is obesity. Obesity is commonly
defined by the body mass index (BMI) which is a measurement of body fat calculated
from a person's weight in kilograms divided by the square of their height in meters
(kg/m2). A person is overweight if their BMI is between 25 and 30 and obese if their
BMI is above 302• Currently, almost 30% of adults and 10-15% of children in the United
States are obese2.
One treatment for obesity is Orlistat, or tetrahydrolipstatin. Orlistat covalently
binds to the active site of gastric, pancreatic and carboxy ester lipases3. These enzymes
digest dietary lipids, or triacylglycerides, and are activated when food passes through the
stomach and into the duodenum. Digested triacylglycerides are repackaged along with
proteins into chylomicrons or other particles and transported in the lymph and blood to
tissues. In tissues, tissue lipases attack stored triacylglycerides and hydrolyze them into
free fatty acids which are degraded by ~-oxidation in tissues to generate energl. By
covalently binding to the digestive lipases, Orlistat is a potent inhibitor of fat digestion
1
and therefore fat absorption. As a consequence, patients taking Orlistat lose an average
of 9% of their body weight, show improvement in blood lipid profiles including
decreased cholesterol and low-density lipoprotein (LDL) levels and show improvement in
blood pressure and fasting blood glucose levels3,5. One case study also showed
histopathologic improvement of fatty liver in a patient taking Orlistat5. In other human
studies other markers of impaired fat digestion due to Orlistat included increased fecal fat
content6 and gastrointestinal symptoms like fecal urgency and oily stools.
It is possible that inhibition of dietary fat digestion by something like Orlistat
could cause an increase in lipolysis in adipocytes and lead to an increase in blood lipids.
The enzyme responsible for mobilizing stored triacylglycerides out of adipose tissue is
hormone-sensitive lipase7,8. Studies show that when blood lipids are low in the
postprandial or fasted state, hormone-sensitive lipase is activated by catecholamines and
hydrolyzes triacylglycerides from the fat droplet in adipocytes9. Free fatty acids from
this hydrolysis are again resynthesized to triacylglycerides, packaged into chylomicrons
or other particles and transported to tissues where they are degraded by lipoprotein
lipases and ~-oxidation to provide energy.
In contrast to prescription Orlistat, commercial dietary supplements are available
to all consumers and may also promote weight loss. One such supplement is chitosan, an
alkaline hydrolysate of chitin from the exoskeleton of shellfish that is also advertised as a
fat blocker. A study by Han et a1. IO showed that chitosan inhibited lipase activity in vitro
when the substrate (triolein) was emulsified with phosphatidylcholine (but not with
Triton X-lOa or gum arabic). Inhibition was competitive which does not fit a fat,
blocking model mode of action of chitosan. Mice were fed lab pellet chow plus 40% fat
2
(beef tallow) or this high fat chow with 3%, 7% and 15% chitosan in their diets. Mice on
the chitosan diets showed significantly less weight gain and lower liver weight and
uterine fat presumably due to lipase inhibition causing less fat digestion. Serum
triglyceride, cholesterol and free fatty acids also decreased in mice fed the chitosan diets.
Mice on the 7 and 15% chitosan diets had higher fecal fat content than mice fed the high
fat diet consistent with inhibition of lipid digestion. Studies with humans have had mixed
results. Aranda et al. 11 showed a significant increase in fecal fat content in people taking
2100 mg of chitosan plus 300 mg ofpsyllium. Again, this is consistent with inhibition of
fat digestion causing an increase in excretion of undigested fat. Another study by Gades
and Stem12 showed that normal, healthy males eating about 120 g fat/day and following
package directions of 5.25 g of chitosan per day did not show an increase in fecal fat
content. The difference between these studies may be one of doses. In the mice study,
chitosan made up 7.5%, 18.8% and 37.5% ofthe fat content ofthe diet. In the Gades and
Stem study chitosan made up 4.2% of the dietary fat content. Thus there was a large
difference in the proportion of chitosan to fat supplied to the mice compared to humans.
In the Aranda et al. study, chitosan made up 2.6% of the dietary fat content but, unlike
the Gades and Stem study, did cause an increase in fecal fat content. This may be due to
the fact that psyllium was included in the Aranda et al. formulation of chitosan.
The purpose in this project was to determine whether or not BOWS inhibits fat
digestion similarly to Orlistat and chitosan. The first part of the study was done in vitro
and related to pancreatic lipase inhibition. Lipid digestion is complex because pancreatic
lipases are water-soluble but fats are not. Thus emulsification is required for digestion
and in the body this is achieved by bile salts. Bile salts have a hydrophilic and a
3
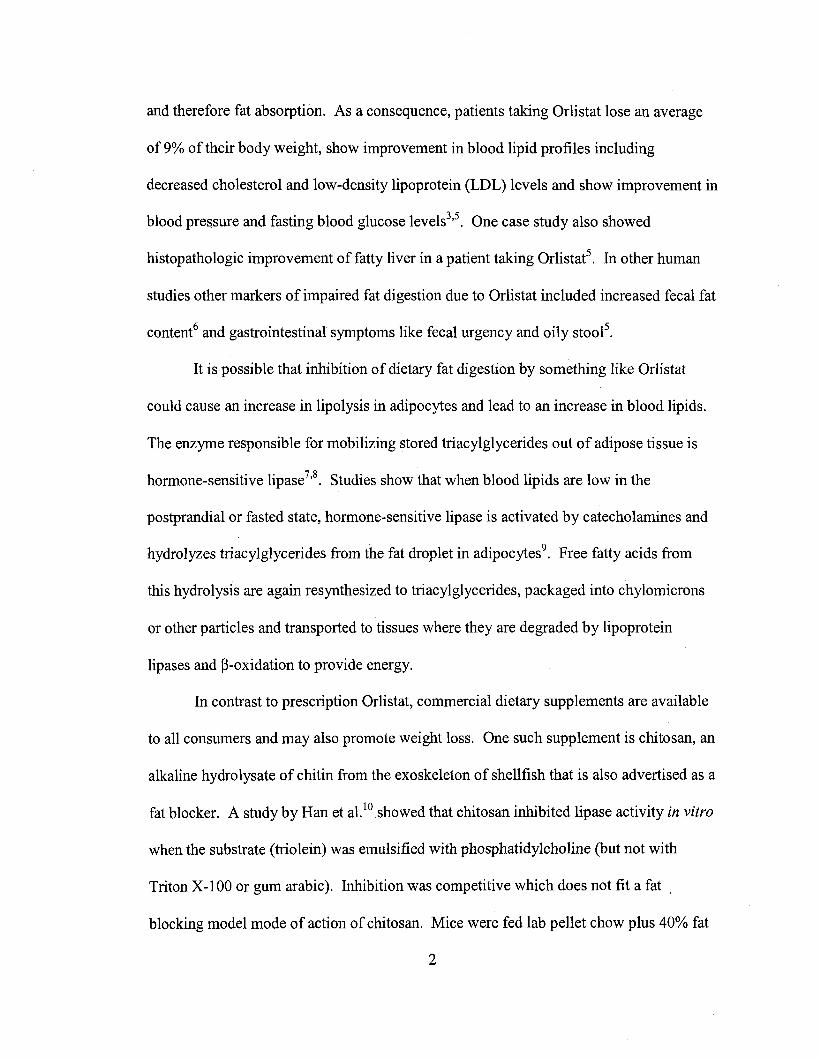
hydrophobic surface as shown in Figure 1. The hydrophobic face associates with water
insoluble triacylglycerides and the hydrophilic portion interacts with aqueous solvent to
form a structure called a micelle. The hydrophilic surface of the micelle facilitates the
binding ofpancreatic lipase and its cofactor, colipase4.
Fig. 1. Triacylglyceride emulsion by a bile salt4. The hydrophilic and
hydrophobic faces of bile salts facilitate the reaction of soluble lipases and
insoluble lipids.
Fat digestion is further complicated because there are two different pancreatic
lipases. Pancreatic triglyceride lipase hydrolyzes triglycerides but does not have high
affinity for phospholipids, cholesterol esters or galactolipids13. This lipase has been
studied for many years I3,14,15,16. More recently, another enzyme called pancreatic lipase
related protein 2 has shown hydrolytic activity against triglycerides as well as
phospholipids and galactolipids13• Both lipases are activated by the protein colipase
especially in the presence ofbile salts13•17
. These issues were addressed by in vitro
experiments.
4
The second part of the study tested whether BOWS was active in vivo. As in
studies with Orlistat and chitosan, weight gain was tested as a marker of fat digestion.
Blood plasma was tested to detect a decrease in lipids due to inhibition of fat digestion
and absorption and fecal lipids were tested as measures of undigested fat being excreted.
Intraperitoneal fat and blood glucose levels were also monitored. These latter two
markers of fat digestion inhibition and health can be more direct indicators of health than
weight loss itself.
5
CHAPTER 2. METHODS
Lipase assays
Titrimetric assays were used to measure the rate ofhydrolysis oftriacylglycerols
by pancreatic lipases. Assays were based on the method ofBrockman16 and Borgstrom
and Erlansson14 with buffer containing 2 mM Tris-HCI, 1 mM CaCh and 150 mM NaCI
adjusted to pH 7.8. A manual titrimetric technique with a pH meter was used instead of a
pH stat. Olive oil was used as the substrate. Crude lipase and purified lipase with and
without colipase were tested. Purified lipase (1.9 mg) and colipase (0.5 mg) purchased
from Sigma Chemical Co. (St. Louis, MO, USA) were dissolved in buffer and stored at
-15°C. Dilutions of the pure lipase stock were used in the assays. In assays with
colipase, purified lipase was preincubated with colipase for three minutes before
beginning the assay. Crude lipase (Sigma Chemical Co., St. Louis, MO, USA) was made
fresh daily by dissolving the powdered enzyme in buffer to a final concentration of 10
mg/mL. The enzyme preparation was stored at 5°C and discarded at the end of the day.
Assays were conducted as follows at room temperature. In a 10 mL beaker, olive
oil (l00 J!L) and taurodeoxycholate (as aliquots of a 300 mM stock solution to give
different concentrations) were added in buffer to yield a final volume of7 mL. The
solution was stirred on a stir plate on the highest setting with a small magnetic stir bar or
"flea." The pH was adjusted to pH 7.81 with 50 mM NaOH. Stirring continued for 4
minutes then the stir rate was lowered to a "medium" setting. In assays with purified
lipase, 20 J!L of a lO-fold dilution of pure lipase stock with or without 114 J!L of a 0.5
J!g/J!L concentration of colipase was added to start the assay. In assays with crude lipase,
100 J!L ofcrude lipase was added to start the assay. When the pH dropped 0.01 units an
6
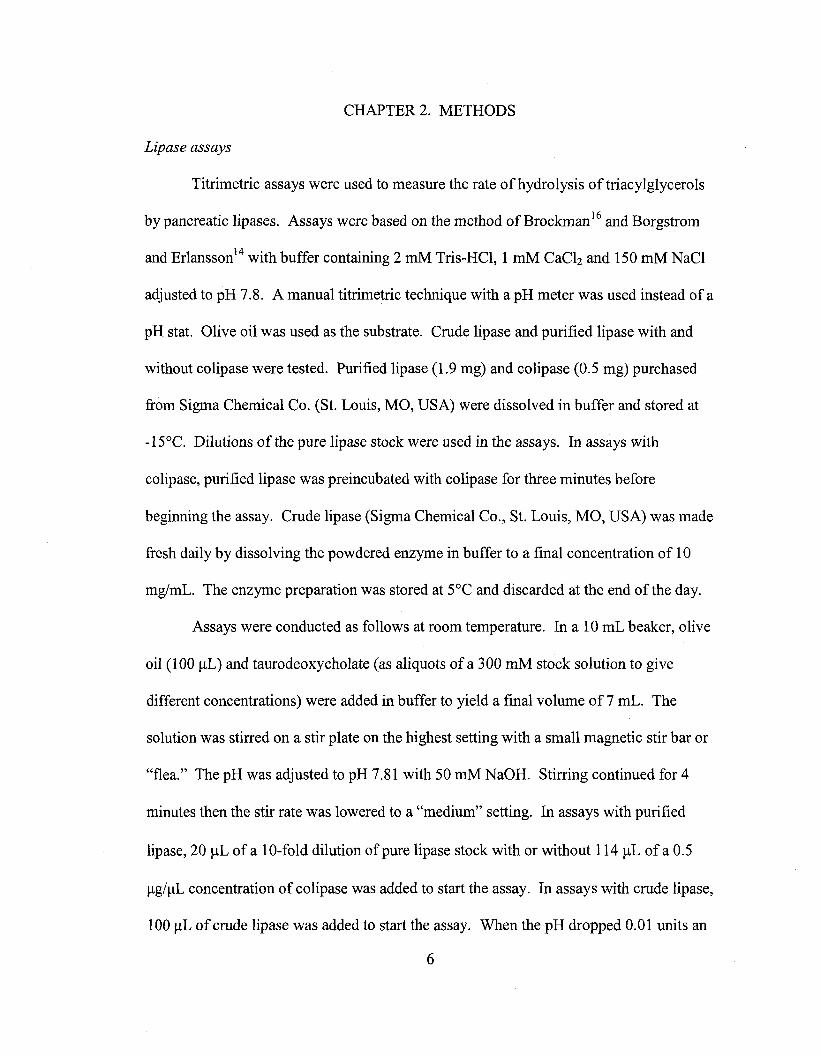
aliquot ofNaOH (10 I-lL) was added to the solution to restore pH. Temporal additions of
base were the measures of enzyme activity and reaction rates (in I-lmol/min) were
calculated as a least squares line via Excel spreadsheet. An example of an assay is shown
in Figure 2.
5432
y =0.088x + 0.0048
R2 =0.9867
1
0.45'CG>'C 0.4'Cco 0.35J:o 0.3coZ 0.25'0 0.2UlG>'0 0.15
E 0.12(,) 0.05i
O+----r-----,-----.---r-----.o
Time (min)
Figure 2. Hydrolysis oftriacylglycrerides by pancreatic lipase. In titrimetric
assays, hydrolysis oftriacylglycerides by lipase produces fatty acids that decrease
pH. Lipase activity is determined by calculating the amount ofNaOH needed to
maintain pH over time (y = reaction rate, R2 = regression coefficient).
In assays with BOWS, different amounts ofBOWS were mixed into the assay
solution before adding lipase.
Results ofpure lipase with colipase and crude lipase assays were similar
indicating that there was little difference between enzyme preparations. Thus, later
experiments were conducted with crude lipase only. It was also found that enzyme
activity decreased with time in assay buffer containing detergent (bile salt). Hence each
7
individual assay was started with a fresh aliquot of the enzyme preparation in a new
reaction vessel.
Animals and diets
Trial 1. Rat studies were based on the model of Woods et al. 18• Male Long
Evans rats (35 animals, age 4 weeks, weighing 74-117 g) were purchased and housed
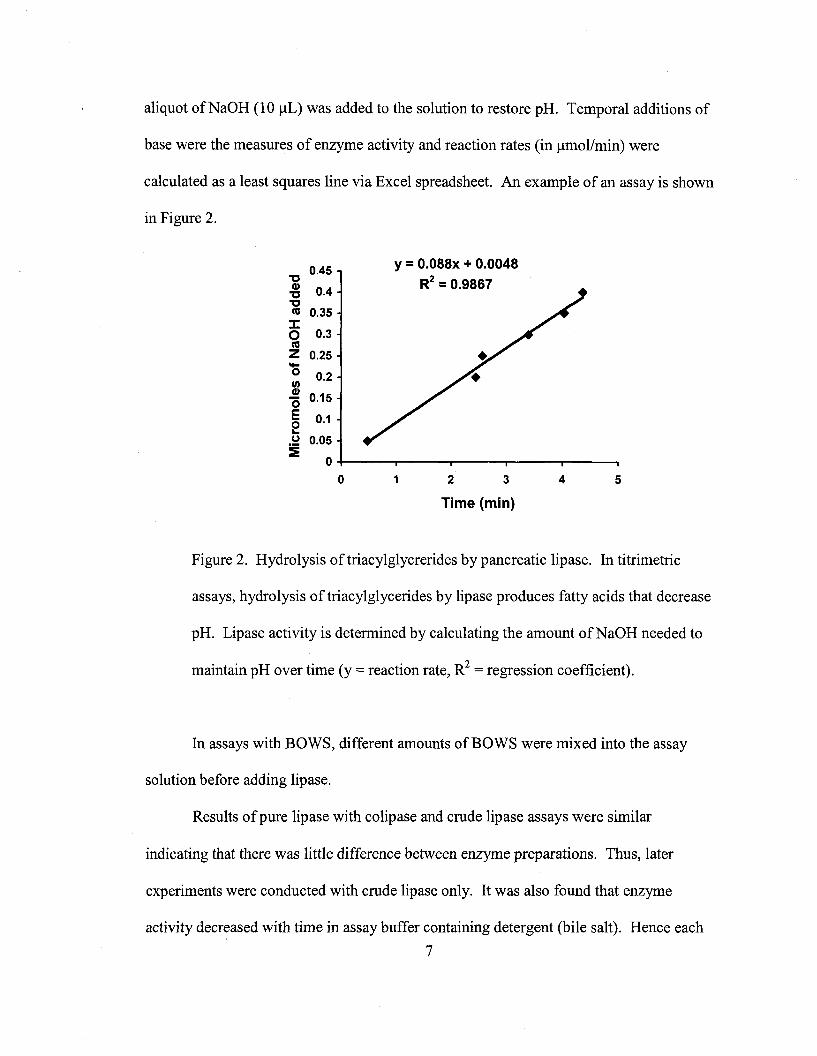
individually at the Biomedical animal facility at the University of Hawai'i (Fig. 3).
Room temperatures during the study ranged from 20-22°C. Relative humidity was 58
71 % and a 12/12 on/off light cycle was maintained. Air changes were made 10-15 times
an hour. Cage beddings were changed once a week and water bottles were checked daily
and replaced once a week. The university's Institutional Animal Care and Use
Committee approved the rat studies.
Fig 3. Individual housing of Long-Evans rats in the Biomedical animal facilities
during animal studies.
In Trial 1, rats were fed standard powdered rat chow for one week (LabDiets
#5001). Then they were divided into three diet groups. One group was fed a control diet
8
of the standard rat chow above. A second group was fed a high fat (HF) diet which is the
rat chow made up by weight to 20% fat with menhaden fish oil (Sigma Chemical Co., St.
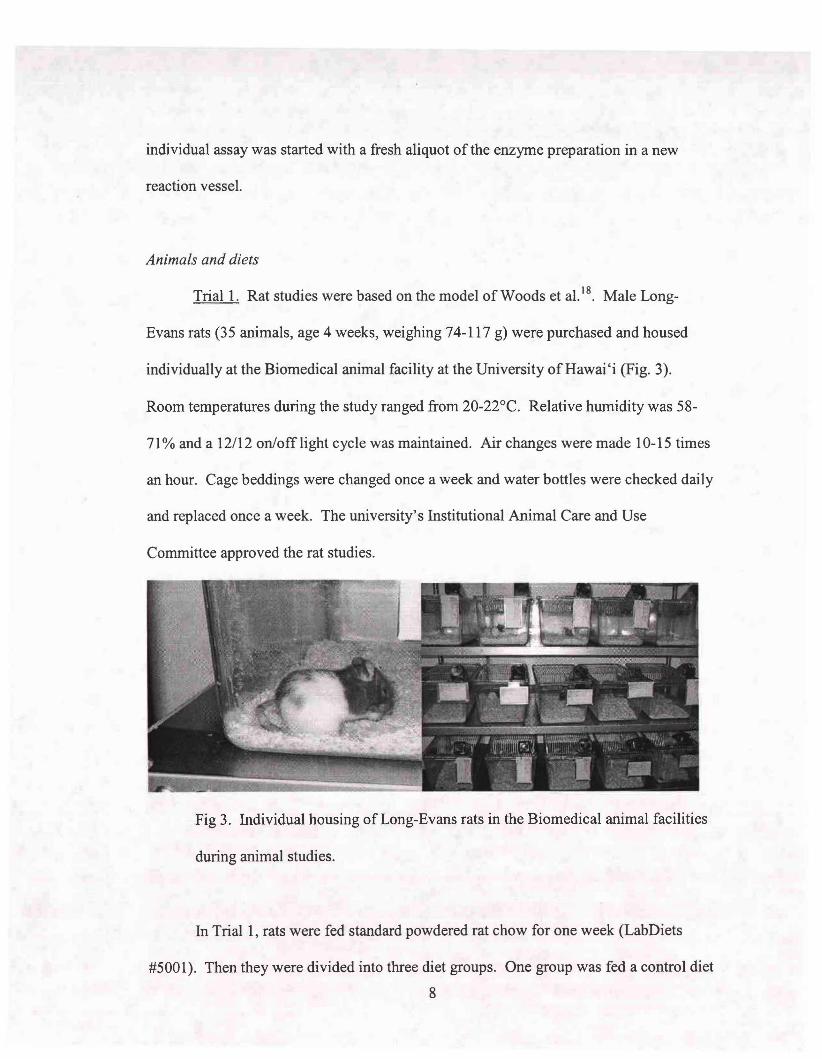
Louis, MO, USA). A third group was fed the HF diet with BOWS (10%) added (Fig. 4).
Diet ingredients and nutrient compositions are shown in Tables 1 and 2. According to the
packaging, BOWS contains fiber, phospholipids and galacto oligosaccharides, however,
exact composition is proprietary.
Figure 4. Preparation ofhigh fat (HF) and BOWS diets. For animal diets,
menhaden fish oil was mixed into rat chow to make high fat diets. BOWS was
added to batches of the HF diet to make BOWS diets.
9
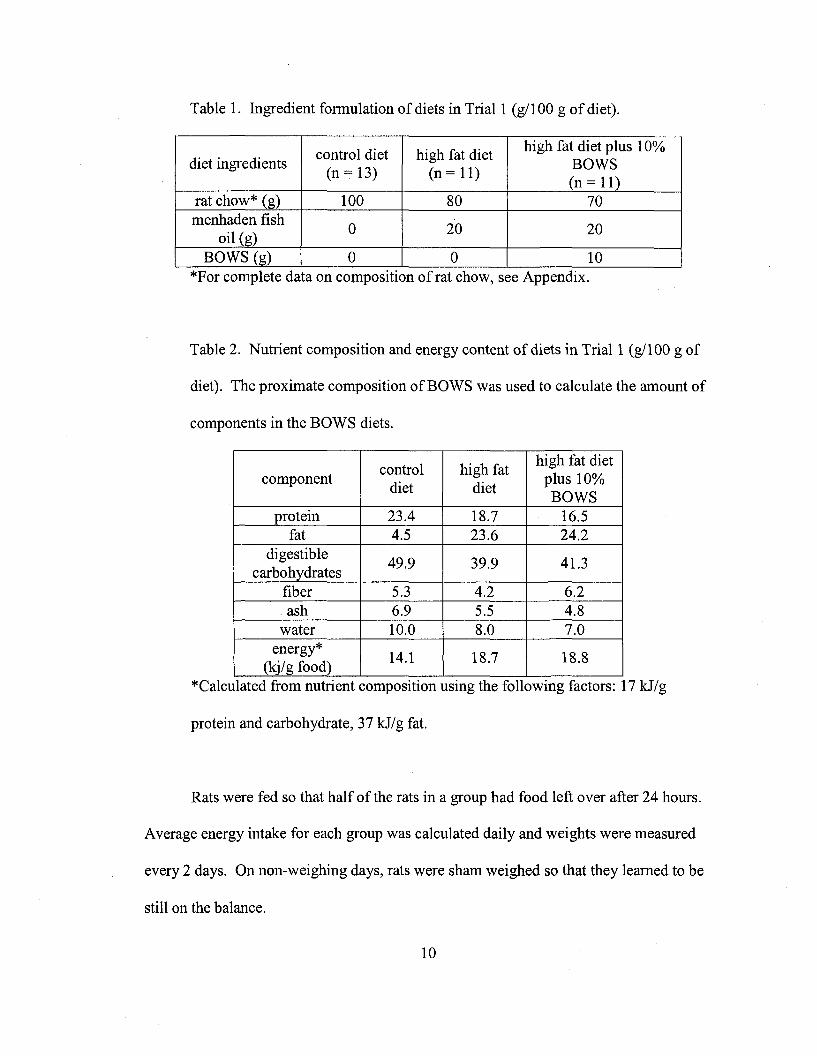
Table 1. Ingredient fonnulation of diets in Trial 1 (gl100 g of diet).
control diet high fat diethigh fat diet plus 10%
diet ingredients(n = 13) (n = 11)
BOWS(n = 11)
rat chow* (g) 100 80 70menhaden fish
0 20 20oil (g)
BOWS (g) 0 0 10*For complete data on composition ofrat chow, see Appendix.
Table 2. Nutrient composition and energy content of diets in Trial 1 (gl100 g of
diet). The proximate composition of BOWS was used to calculate the amount of
components in the BOWS diets.
control high fathigh fat diet
componentdiet diet
plus 10%BOWS
protein 23.4 18.7 16.5fat 4.5 23.6 24.2
digestible49.9 39.9 41.3
carbohydratesfiber 5.3 4.2 6.2ash 6.9 5.5 4.8
water 10.0 8.0 7.0energy*
14.1 18.7 18.8(kj/g food) ..
*Calculated from nutnent composItIon usmg the followmg factors: 17 kJ/g
protein and carbohydrate, 37 kJ/g fat.
Rats were fed so that half of the rats in a group had food left over after 24 hours.
Average energy intake for each group was calculated daily and weights were measured
every 2 days. On non-weighing days, rats were sham weighed so that they learned to be
still on the balance.
10
Tissue sampling began on Day 15. Three rats per group were sacrificed by C02
gas immersion and blood (3-5 mL) was taken by heart puncture. The blood was collected
in tubes with 200 JlL EDTA (3.5%, pH 7.4) so that the final concentration of EDTA was
1 mg/mL. The tubes were centrifuged at 3400 RPM for 30 minutes. The supernate
(plasma) was collected and lyophilized. The samples were ground with mortar and pestle
and subjected to fatty acid analysis after the method of Tamaru et al. 19. Fecal samples (8
pellets) were collected from 3 animals per group on Day 35. Samples were cleaned of
cage shavings, lyophilized, ground with mortar and pestle and subjected to fatty acid
analysis.
In a follow up experiment using the surviving rats, diets were reformulated (Table
3 and 4). Mixing the standard rat chow with 5.5% fish oil made a 10% total fat diet that
served as the control diet. Two other diets were made by adding 5% and 10% BOWS to
the 10% total fat diet. Rats were carried over from their previous dietary assignments so
that those that had been eating the control diet were fed the reformulated 10% fat control
diet. Rats that had been eating the HF diet and the HF diet plus 10% BOWS were fed the
reformulated 10% fat diet plus 5% and 10% BOWS diets respectively.
11
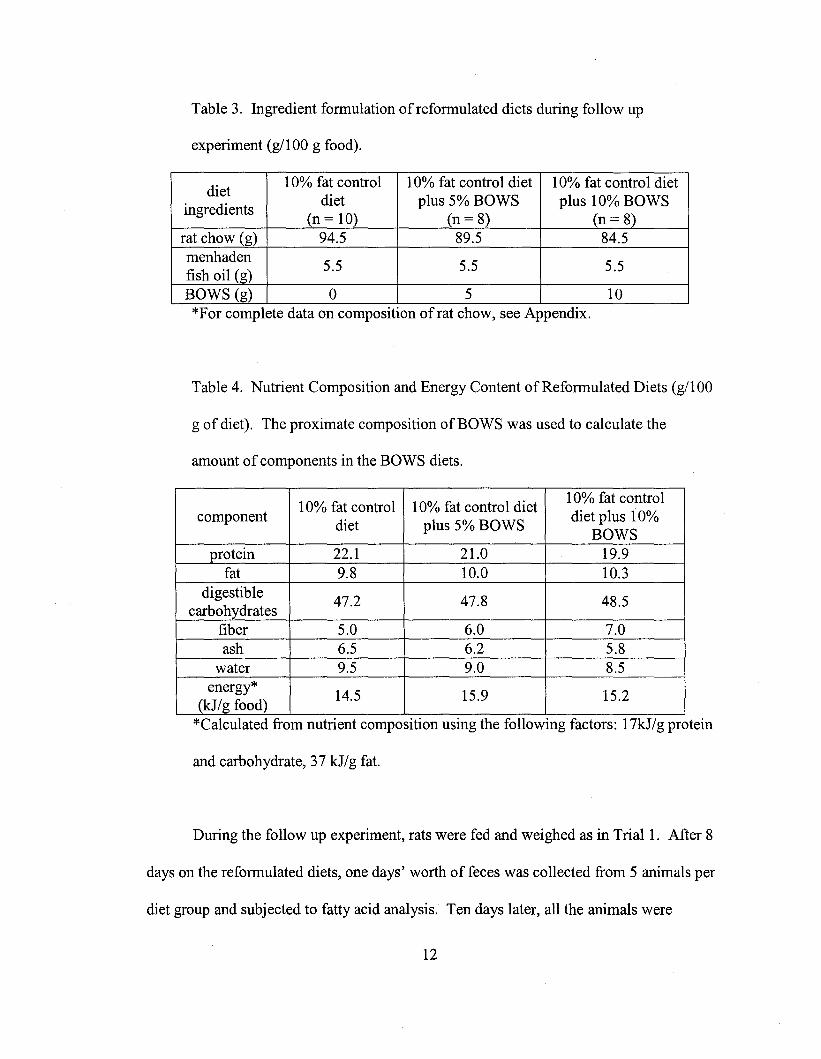
Table 3. Ingredient formulation of reformulated diets during follow up
experiment (g/100 g food).
*For complete data on composItIon of rat chow, see AppendIx.
diet10% fat control 10% fat control diet 10% fat control diet
ingredientsdiet plus 5% BOWS plus 10% BOWS
(n = 10) (n= 8) (n= 8)rat chow (g) 94.5 89.5 84.5menhaden
5.5 5.5 5.5fish oil (g)BOWS (g) 0 5 10..
Table 4. Nutrient Composition and Energy Content of Reformulated Diets (g/100
g of diet). The proximate composition ofBOWS was used to calculate the
amount of components in the BOWS diets.
10% fat control 10% fat control diet10% fat control
componentdiet plus 5% BOWS
diet plus 10%BOWS
protein 22.1 21.0 19.9fat 9.8 10.0 10.3
digestible47.2 47.8 48.5
carbohydratesfiber 5.0 6.0 7.0ash 6.5 6.2 5.8
water 9.5 9.0 8.5energy*
14.5 15.9 15.2(kJ/g food)
*Calculated from nutrient composition using the following factors: 17kJ/g protein
and carbohydrate, 37 kJ/g fat.
During the follow up experiment, rats were fed and weighed as in Trial 1. After 8
days on the reformulated diets, one days' worth of feces was collected from 5 animals per
diet group and subjected to fatty acid analysis. Ten days later, all the animals were
12
euthanized with CO2. Five animals per group were dissected and liver, stomach and
intestines were removed so that intraperitoneal fat pads behind the kidneys were
accessible. The fat pads were excised and weighed to quantify intraperitoneal fat
deposition.
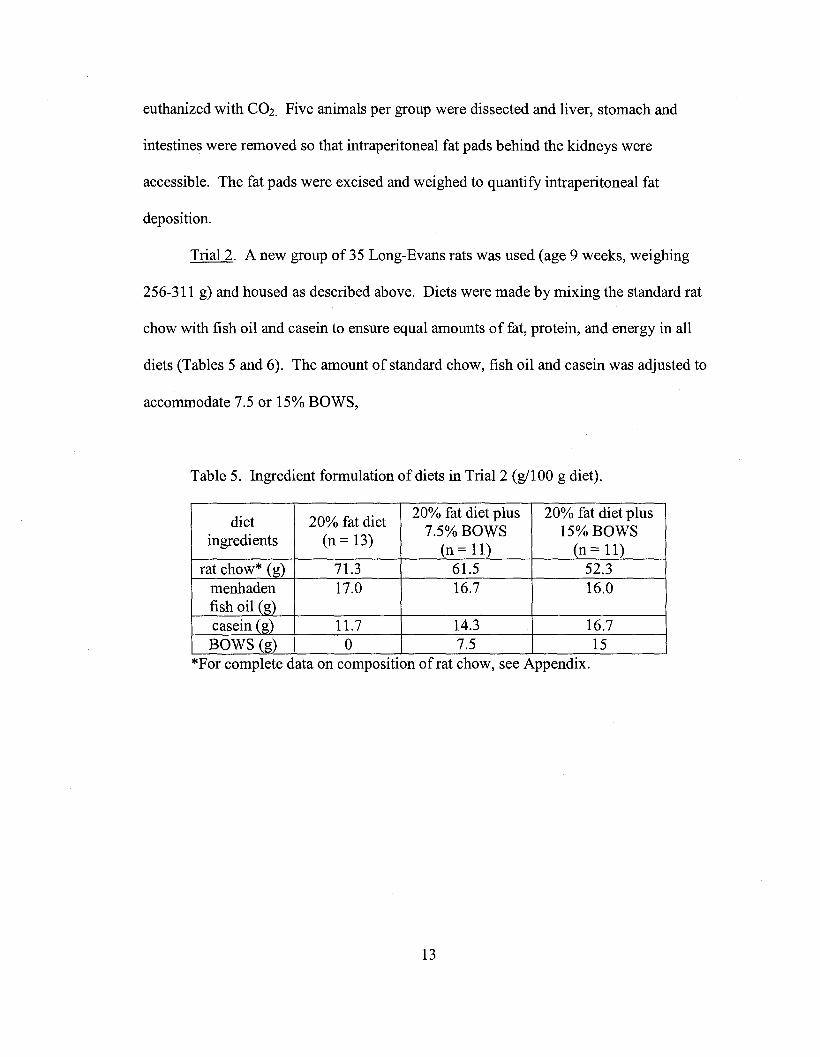
Trial 2. A new group of 35 Long-Evans rats was used (age 9 weeks, weighing
256-311 g) and housed as described above. Diets were made by mixing the standard rat
chow with fish oil and casein to ensure equal amounts of fat, protein, and energy in all
diets (Tables 5 and 6). The amount of standard chow, fish oil and casein was adjusted to
accommodate 7.5 or 15% BOWS,
Table 5. Ingredient formulation of diets in Trial 2 (gl100 g diet).
diet 20% fat diet20% fat diet plus 20% fat diet plus
ingredients (n = 13)7.5% BOWS 15% BOWS
(n = 11) (n = 11)rat chow* (g) 71.3 61.5 52.3
menhaden 17.0 16.7 16.0fish oil (g)casein (g) 11.7 14.3 16.7BOWS (g) 0 7.5 15
*For complete data on composition ofrat chow, see Appendix.
13
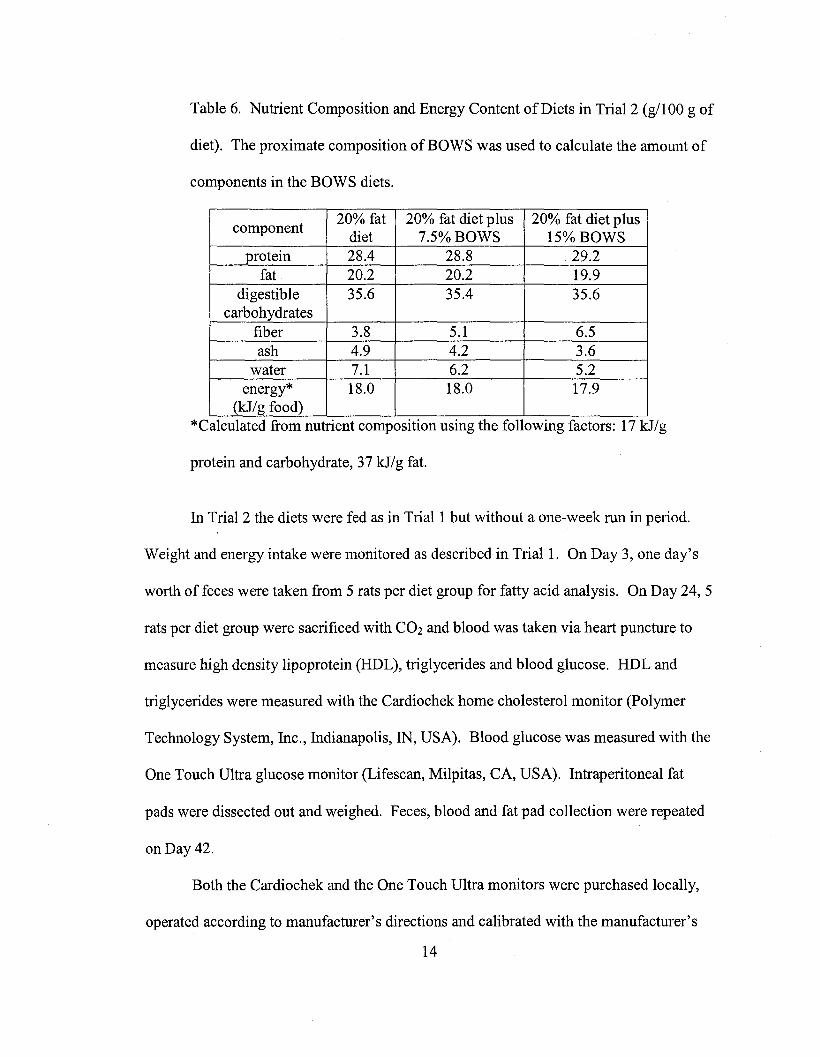
Table 6. Nutrient Composition and Energy Content ofDiets in Trial 2 (g/100 g of
diet). The proximate composition of BOWS was used to calculate the amount of
components in the BOWS diets.
component20% fat 20% fat diet plus 20% fat diet plus
diet 7.5% BOWS 15% BOWSprotein 28.4 28.8 29.2
fat 20.2 20.2 19.9digestible 35.6 35.4 35.6
carbohydratesfiber 3.8 5.1 6.5ash 4.9 4.2 3.6
water 7.1 6.2 5.2energy* 18.0 18.0 17.9
(kJ/g food)*Calculated from nutrient composition using the following factors: 17 kJ/g
protein and carbohydrate, 37 kJ/g fat.
In Trial 2 the diets were fed as in Trial 1 but without a one-week run in period.
Weight and energy intake were monitored as described in Trial 1. On Day 3, one day's
worth of feces were taken from 5 rats per diet group for fatty acid analysis. On Day 24, 5
rats per diet group were sacrificed with C02 and blood was taken via heart puncture to
measure high density lipoprotein (HDL), triglycerides and blood glucose. HDL and
triglycerides were measured with the Cardiochek home cholesterol monitor (Polymer
Technology System, Inc., Indianapolis, IN, USA). Blood glucose was measured with the
One Touch Ultra glucose monitor (Lifescan, Milpitas, CA, USA). Intraperitoneal fat
pads were dissected out and weighed. Feces, blood and fat pad collection were repeated
on Day 42.
Both the Cardiochek and the One Touch Ultra monitors were purchased locally,
operated according to manufacturer's directions and calibrated with the manufacturer's
14
standards. The Cardiochek monitor was validated in hamsters in another study using an
Infinity Triglycerides and Cholesterol assay (ThermoDMA, Louisvill, CO, USA. P.
Nerurkar, personal communication). Triglyceride levels detected in this study fell within
the range given for Long-Evans rats by Taconic2o• Commercial glucose monitors have
been validated in other studies21,22 and the One Touch Ultra was validated in this lab with
standards of pure glucose in distilled water. A linear dose response was seen though the
sensitivity was lower than with the manufacturer's supplied standards. The manufacturer
also reported this decreased sensitivity with pure glucose.
Statistical analyses
Results are expressed as means ± standard error (S.E.). Analysis for body weight
was done with ANOVA and Tukey-Kramer which were part of a software package with
Excel. Body weight was also tested by an analysis of covariance model in the statistical
program SYSTAT (1985).
15
CHAPTER 3. RESULTS
Lipase assays
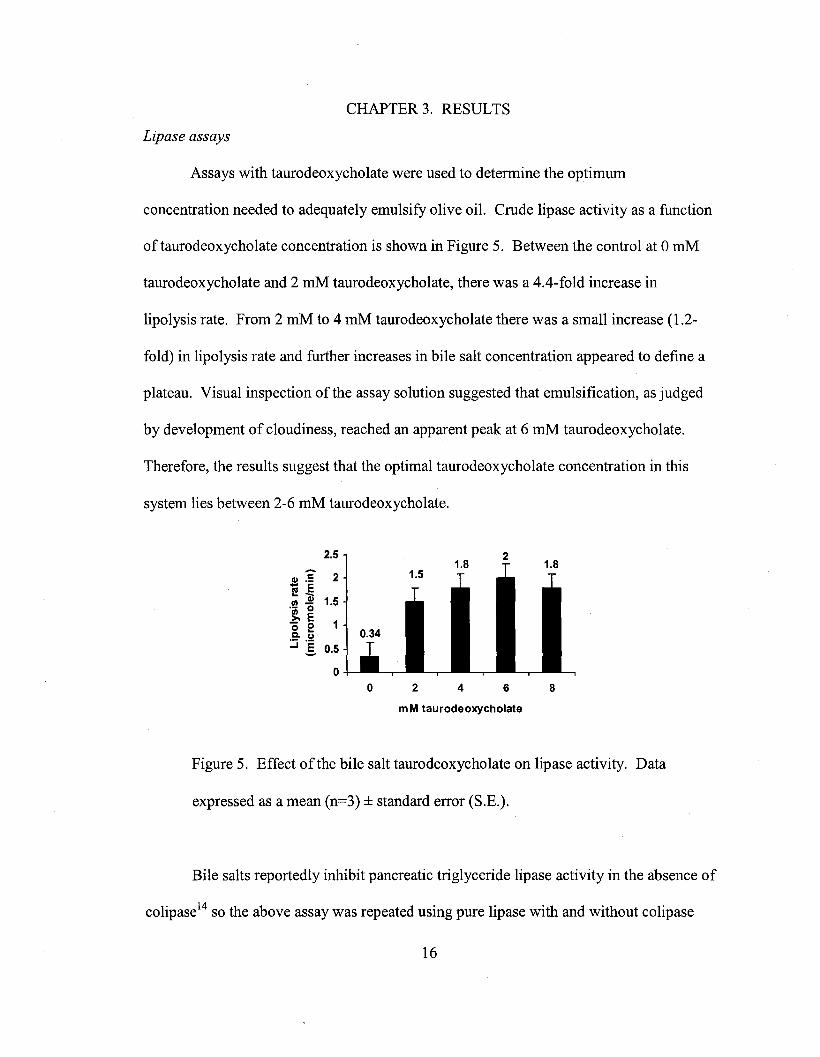
Assays with taurodeoxycholate were used to determine the optimum
concentration needed to adequately emulsify olive oil. Crude lipase activity as a function
oftaurodeoxycholate concentration is shown in Figure 5. Between the control at 0 mM
taurodeoxycholate and 2 mM taurodeoxycholate, there was a 4.4-fold increase in
lipolysis rate. From 2 mM to 4 mM taurodeoxycholate there was a small increase (1.2-
fold) in lipolysis rate and further increases in bile salt concentration appeared to define a
plateau. Visual inspection of the assay solution suggested that emulsification, as judged
by development of cloudiness, reached an apparent peak at 6 mM taurodeoxycholate.
Therefore, the results suggest that the optimal taurodeoxycholate concentration in this
system lies between 2-6 mM taurodeoxycholate.
2.5
CI):E 2.... Ee _1/1 .2! 1.5.- 0!e. E
1'0 eQ, Col
:::i:§. 0.5
00 2 4 6 8
m M taurodeoxycholate
Figure 5. Effect of the bile salt taurodeoxycholate on lipase activity. Data
expressed as a mean (n=3) ± standard error (S.E.).
Bile salts reportedly inhibit pancreatic triglyceride lipase activity in the absence of
colipase14 so the above assay was repeated using pure lipase with and without colipase
16
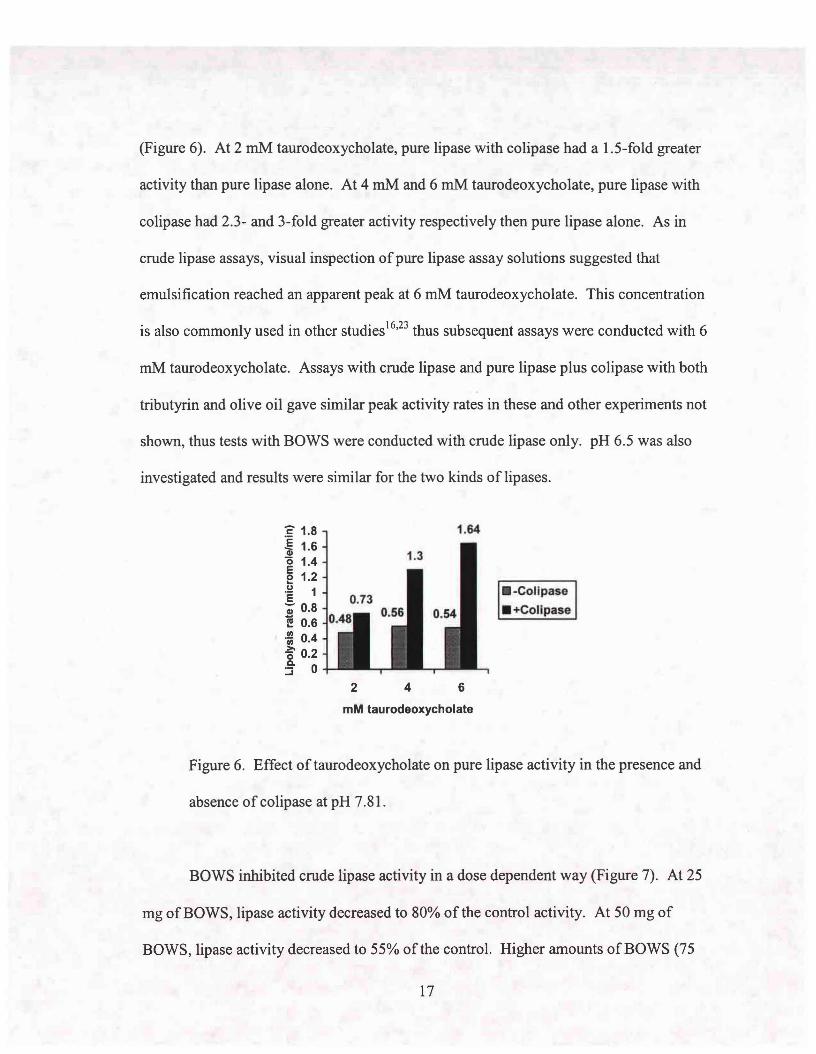
(Figure 6). At 2 mM taurodeoxycholate, pure lipase with colipase had a 1.5-fold greater
activity than pure lipase alone. At 4 mM and 6 mM taurodeoxycholate, pure lipase with
colipase had 2.3- and 3-fold greater activity respectively then pure lipase alone. As in
crude lipase assays, visual inspection of pure lipase assay solutions suggested that
emulsification reached an apparent peak at 6 mM taurodeoxycholate. This concentration
is also commonly used in other studiesl6•23 thus subsequent assays were conducted with 6
mM taurodeoxycholate. Assays with crude lipase and pure lipase plus colipase with both
tributyrin and olive oil gave similar peak activity rates in these and other experiments not
shown, thus tests with BOWS were conducted with crude lipase only. pH 6.5 was also
investigated and results were similar for the two kinds of lipases.
:5 1.8i 1.6~ 1.4e 1.2.2 1E-; 0.8f 0.6.~ 0.4-5' 0.2:3" 0
1.64
.-Collpase
.+Colipase
2 4 6
mM taurodeoxycholate
Figure 6. Effect oftaurodeoxycholate on pure lipase activity in the presence and
absence of colipase at pH 7.81.
BOWS inhibited crude lipase activity in a dose dependent way (Figure 7). At 25
mg of BOWS, lipase activity decreased to 80% of the control activity. At 50 mg of
BOWS, lipase activity decreased to 55% of the control. Higher amounts of BOWS (75
17
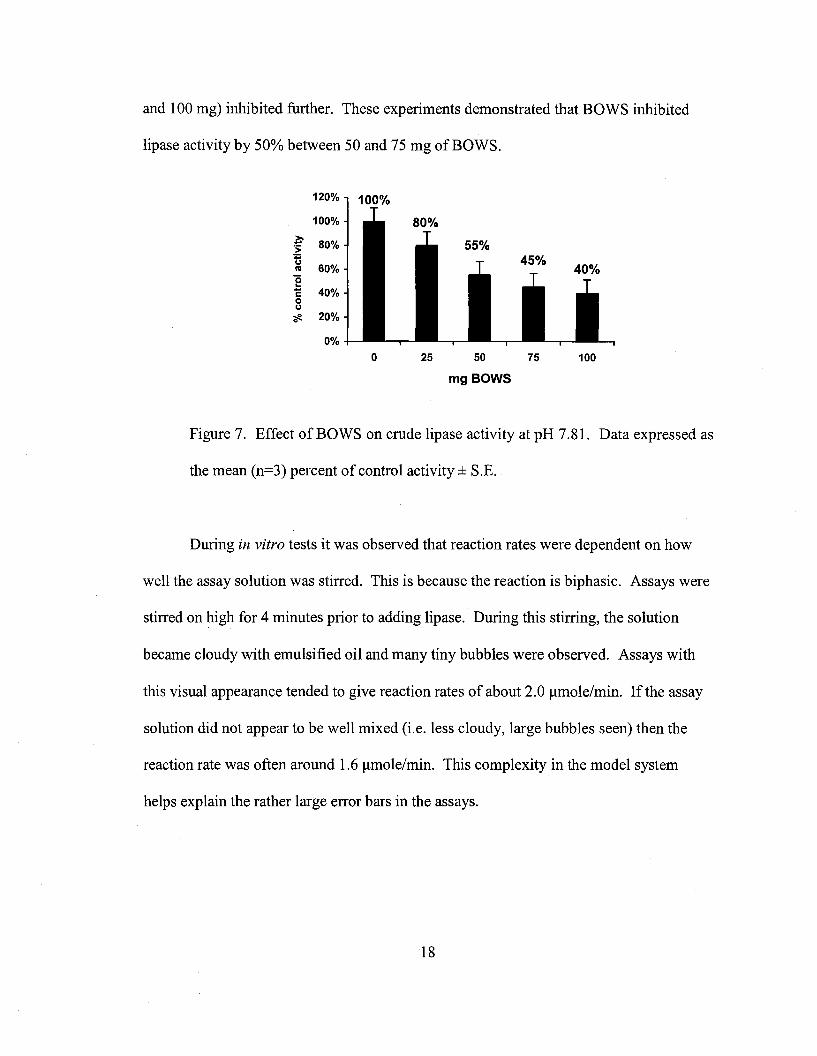
and 100 mg) inhibited further. These experiments demonstrated that BOWS inhibited
lipase activity by 50% between 50 and 75 mg of BOWS.
120% 100%
100%
~ 80%'S;;lu
60%CIl
'0..- 40%I:0U
~ 20%0
0%
0 25 50 75 100
mgBOWS
Figure 7. Effect of BOWS on crude lipase activity at pH 7.81. Data expressed as
the mean (n=3) percent of control activity ± S.E.
During in vitro tests it was observed that reaction rates were dependent on how
well the assay solution was stirred. This is because the reaction is biphasic. Assays were
stirred on high for 4 minutes prior to adding lipase. During this stirring, the solution
became cloudy with emulsified oil and many tiny bubbles were observed. Assays with
this visual appearance tended to give reaction rates of about 2.0 /lmole/min. Ifthe assay
solution did not appear to be well mixed (i.e. less cloudy, large bubbles seen) then the
reaction rate was often around 1.6 /lmole/min. This complexity in the model system
helps explain the rather large error bars in the assays.
18
Rat studies
In Trial 1, rats in the different diet groups ate different amounts of food but their
caloric intake was not significantly different (Table 7).
Table 7. Average food (g) and energy (kJ) consumed in Tria11 (± S.E.).
control diet high fat diethigh fat diet plus
10% BOWSave. food
20.5 ± 0.29 15.5 ± 0.25 15.6 ± 0.25eaten (g)
ave. kJ eaten 287 ± 4.65 286 ± 6.05 290 ± 5.75
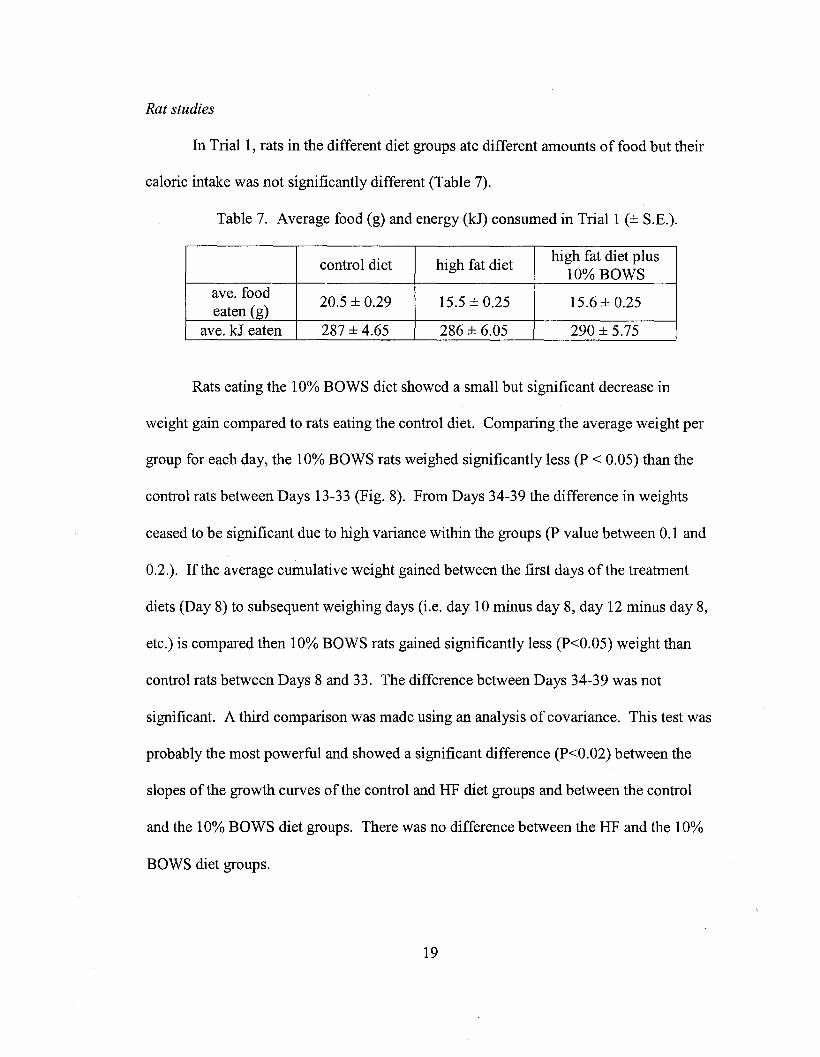
Rats eating the 10% BOWS diet showed a small but significant decrease in
weight gain compared to rats eating the control diet. Comparing the average weight per
group for each day, the 10% BOWS rats weighed significantly less (P < 0.05) than the
control rats between Days 13-33 (Fig. 8). From Days 34-39 the difference in weights
ceased to be significant due to high variance within the groups (P value between 0.1 and
0.2.). If the average cumulative weight gained between the first days of the treatment
diets (Day 8) to subsequent weighing days (i.e. day 10 minus day 8, day 12 minus day 8,
etc.) is compared then 10% BOWS rats gained significantly less (P<0.05) weight than
control rats between Days 8 and 33. The difference between Days 34-39 was not
significant. A third comparison was made using an analysis of covariance. This test was
probably the most powerful and showed a significant difference (P<0.02) between the
slopes of the growth curves of the control and HF diet groups and between the control
and the 10% BOWS diet groups. There was no difference between the HF and the 10%
BOWS diet groups.
19
300
250
Oi 200--.cC)
'i;: 150
100
4 10 14 19 23 27 31 35 39
Day
-o-control
--Q- high fat
-l::r-10% BOWS
Figure 8. Effects ofBOWS on body weight in Long-Evans rats fed control, high-
fat (HF) and 10% BOWS diets. Results are expressed as means ± S.E. of 11-13
rats. Rats on the 10% BOWS diet were significantly different (P<0.05) from
those ofthe control group between days 13-33.
When the diets were reformulated to be isonitrogenous and isocaloric, the rats
again ate roughly isocalorically (Table 8).
20
Table 8. Average food (g) and energy (kJ) consumed (± SE) for rats eating 10%
fat diets or 10% fat diets plus 5% or 10% BOWS.
10% fat 10% fat diet 10% fat diet pluscontrol diet plus 5% BOWS 10% BOWS
ave. food eaten20.1 ± 0.12 19.4 ± 0.34 20.0 ± 0.19
(g)ave. kJ eaten 302 ± 2.32 293 ± 5.12 303 ± 2.81
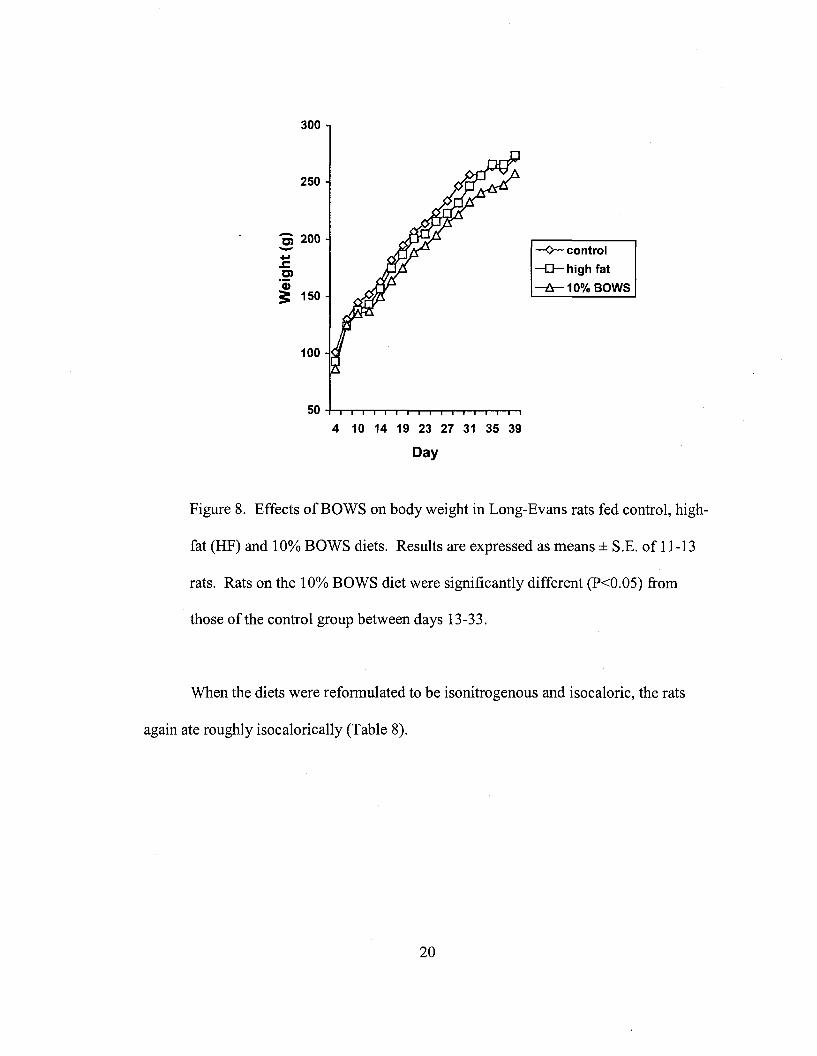
The 10% fat plus 10% BOWS rats continued to weigh less than the other groups but the
variance was too large for the difference to be statistically significant (P=0.27-0.38, Fig.
9).
325
:§ 300.....cC)'Q)3: 275
--¢-10% fat control
-D-5%BOWS
--6-10% BOWS
250 +--r-.......,.---,---r---r--,---,r---.,
39 41 43 45 47 49 51 53Day
Figure 9. Effect of BOWS on body weight in Long-Evans rats fed 10% fat diet or
10% fat diet plus 5% and 10% BOWS. Results are expressed as means ± S.B. of
8-10 rats. Body weight was not significantly different between the groups.
In Trial 2 the diets were isonitrogenous and isocaloric and the rats ate roughly
isocalorically (Table 9).
21
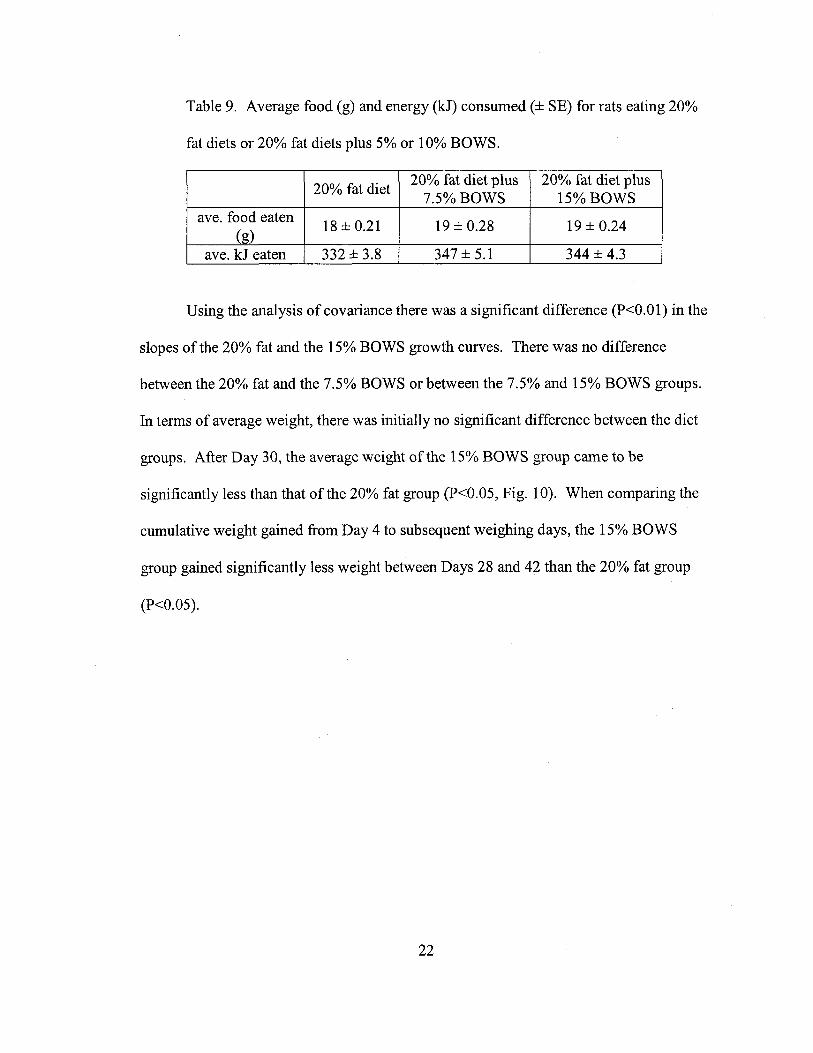
Table 9. Average food (g) and energy (kJ) consumed (± SE) for rats eating 20%
fat diets or 20% fat diets plus 5% or 10% BOWS.
20% fat diet20% fat diet plus 20% fat diet plus
7.5% BOWS 15% BOWSave. food eaten
18 ± 0.21 19 ± 0.28 19 ± 0.24(g)
ave. kJ eaten 332 ± 3.8 347 ± 5.1 344 ± 4.3
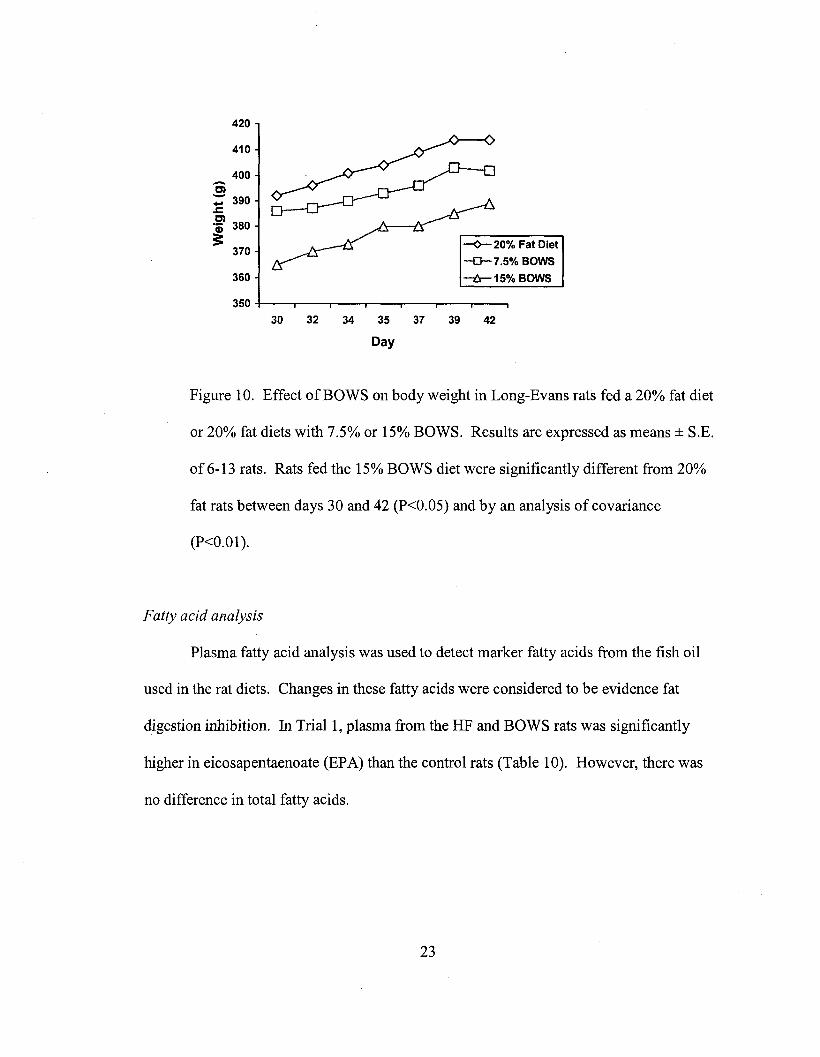
Using the analysis of covariance there was a significant difference (P<O.Ol) in the
slopes of the 20% fat and the 15% BOWS growth curves. There was no difference
between the 20% fat and the 7.5% BOWS or between the 7.5% and 15% BOWS groups.
In terms of average weight, there was initially no significant difference between the diet
groups. After Day 30, the average weight of the 15% BOWS group came to be
significantly less than that of the 20% fat group (P<0.05, Fig. 10). When comparing the
cumulative weight gained from Day 4 to subsequent weighing days, the 15% BOWS
group gained significantly less weight between Days 28 and 42 than the 20% fat group
(P<0.05).
22
420
410
400-en=- 390.c::.2' 380
~370
360
-<>- 20% Fat Diet-0-7.5% BOWS
-A-15%BOWS
350 +--.........- .........- .........-...----.....--.....---.30 32 34 35 37 39 42
Day
Figure 10. Effect ofBOWS on body weight in Long-Evans rats fed a 20% fat diet
or 20% fat diets with 7.5% or 15% BOWS. Results are expressed as means ± S.E.
of 6-13 rats. Rats fed the 15% BOWS diet were significantly different from 20%
fat rats between days 30 and 42 (P<0.05) and by an analysis of covariance
(P<0.01).
Fatty acid analysis
Plasma fatty acid analysis was used to detect marker fatty acids from the fish oil
used in the rat diets. Changes in these fatty acids were considered to be evidence fat
digestion inhibition. In Trial 1, plasma from the HF and BOWS rats was significantly
higher in eicosapentaenoate (EPA) than the control rats (Table 10). However, there was
no difference in total fatty acids.
23
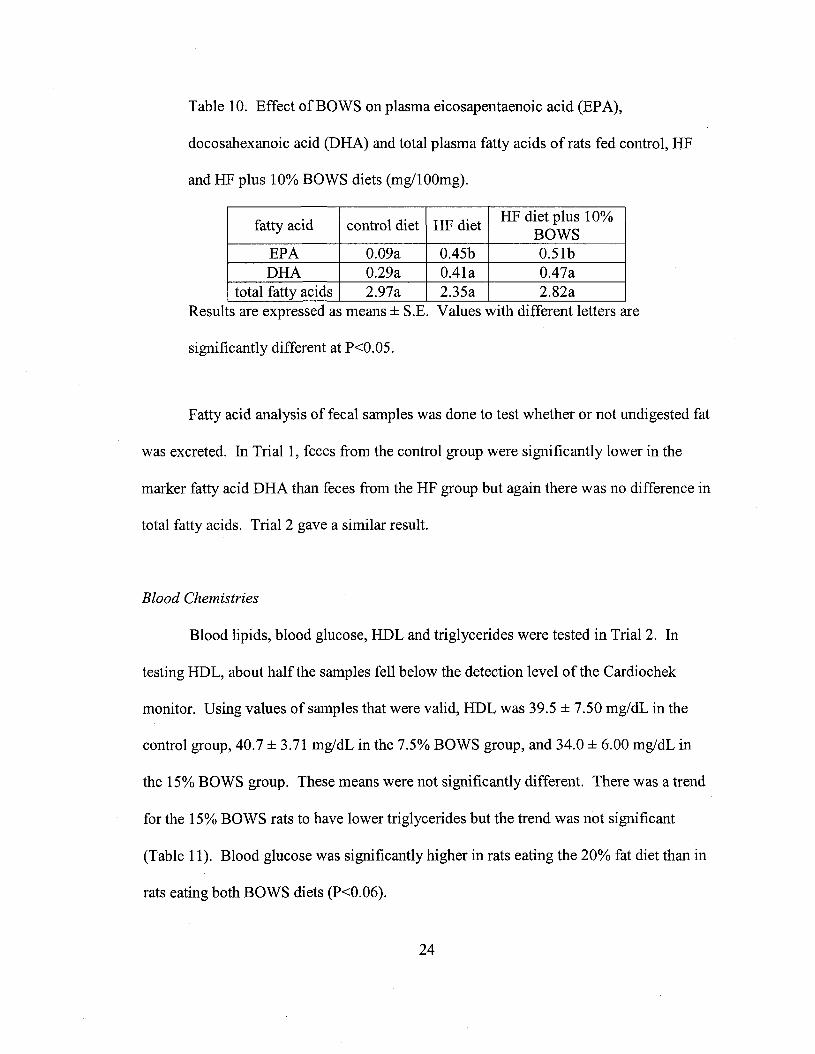
Table 10. Effect ofBOWS on plasma eicosapentaenoic acid (EPA),
docosahexanoic acid (DHA) and total plasma fatty acids of rats fed control, HF
and HF plus 10% BOWS diets (mg/l00mg).
fatty acid control diet HF dietHF diet plus 10%
BOWSEPA 0.09a OA5b 0.51bDHA 0.29a 0.41a 0.47a
total fatty acids 2.97a 2.35a 2.82aResults are expressed as means ± S.B. Values with different letters are
significantly different at P<0.05.
Fatty acid analysis of fecal samples was done to test whether or not undigested fat
was excreted. In Trial 1, feces from the control group were significantly lower in the
marker fatty acid DHA than feces from the HF group but again there was no difference in
total fatty acids. Trial 2 gave a similar result.
Blood Chemistries
Blood lipids, blood glucose, HDL and triglycerides were tested in Trial 2. In
testing HDL, about half the samples fell below the detection level ofthe Cardiochek
monitor. Using values of samples that were valid, HDL was 39.5 ± 7.50 mg/dL in the
control group, 40.7 ± 3.71 mg/dL in the 7.5% BOWS group, and 34.0 ± 6.00 mg/dL in
the 15% BOWS group. These means were not significantly different. There was a trend
for the 15% BOWS rats to have lower triglycerides but the trend was not significant
(Table 11). Blood glucose was significantly higher in rats eating the 20% fat diet than in
rats eating both BOWS diets (P<0.06).
24
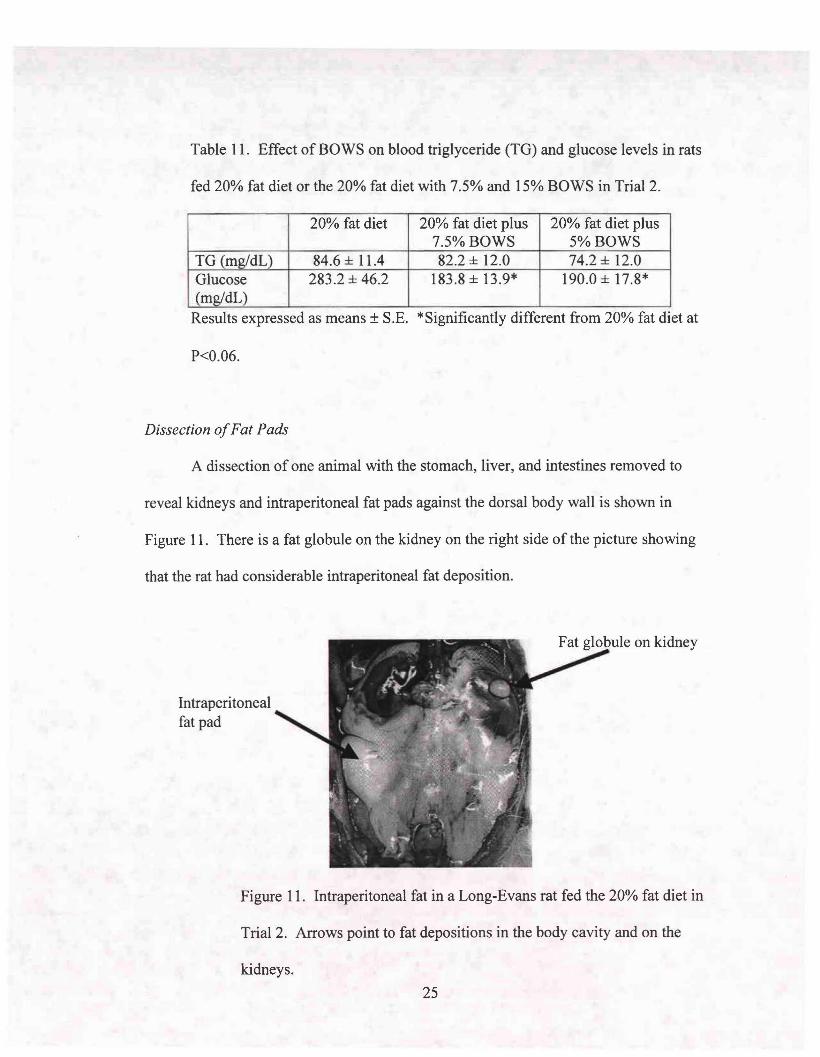
Table 11. Effect of BOWS on blood triglyceride (TG) and glucose levels in rats
fed 20% fat diet or the 20% fat diet with 7.5% and 15% BOWS in Trial 2.
20% fat diet 20% fat diet plus 20% fat diet plus7.5% BOWS 5% BOWS
TG (mg/dL) 84.6 ± 11.4 82.2 ± 12.0 74.2 ± 12.0Glucose 283.2 ± 46.2 183.8 ± 13.9* 190.0 ± 17.8*(mg/dL)
Results expressed as means ± S.E. *Significantly different from 20% fat diet at
P<0.06.
Dissection ofFat Pads
A dissection of one animal with the stomach, liver, and intestines removed to
reveal kidneys and intraperitoneal fat pads against the dorsal body wall is shown in
Figure 11. There is a fat globule on the kidney on the right side of the picture showing
that the rat had considerable intraperitoneal fat deposition.
Intraperitonealfat pad
Figure 11. Intraperitoneal fat in a Long-Evans rat fed the 20% fat diet in
Trial 2. Arrows point to fat depositions in the body cavity and on the
kidneys.
25
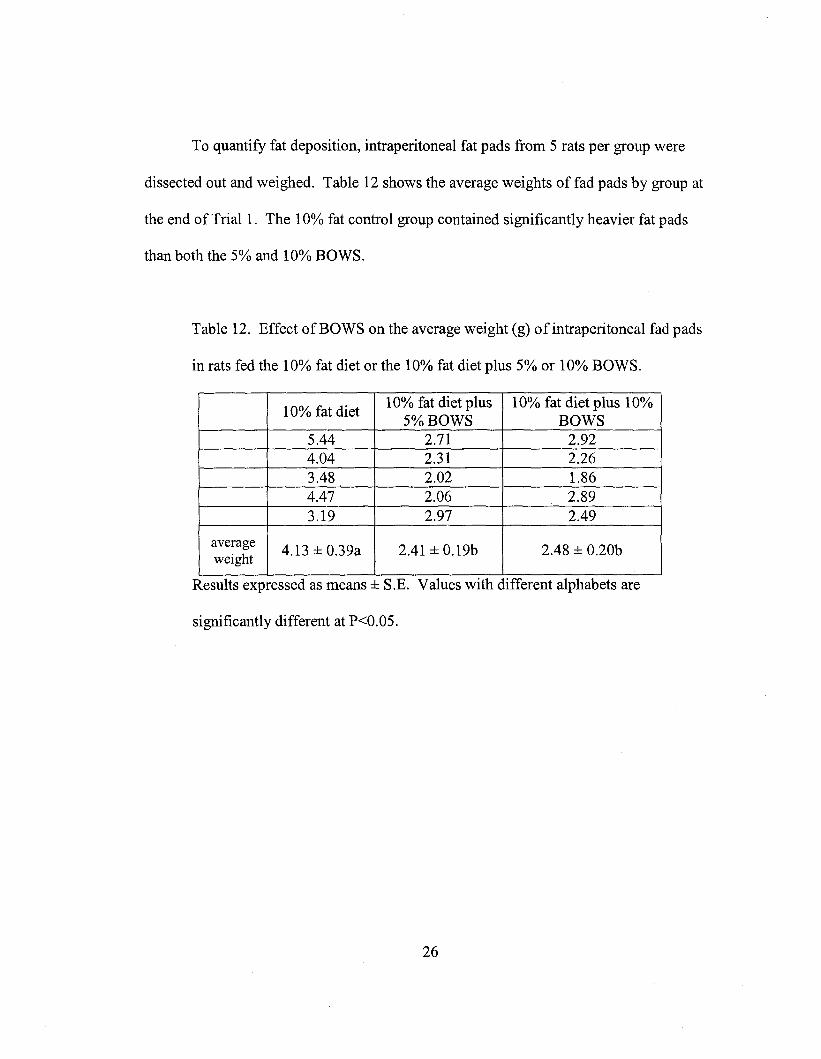
To quantify fat deposition, intraperitoneal fat pads from 5 rats per group were
dissected out and weighed. Table 12 shows the average weights of fad pads by group at
the end of Tria11. The 10% fat control group contained significantly heavier fat pads
than both the 5% and 10% BOWS.
Table 12. Effect of BOWS on the average weight (g) of intraperitoneal fad pads
in rats fed the 10% fat diet or the 10% fat diet plus 5% or 10% BOWS.
10% fat diet10% fat diet plus 10% fat diet plus 10%
5% BOWS BOWS5.44 2.71 2.924.04 2.31 2.263.48 2.02 1.864.47 2.06 2.893.19 2.97 2.49
average4.13 ± 0.39a 2.41 ± 0.19b 2.48 ± 0.20b
weight
Results expressed as means ± S.E. Values WIth different alphabets are
significantly different at P<0.05.
26
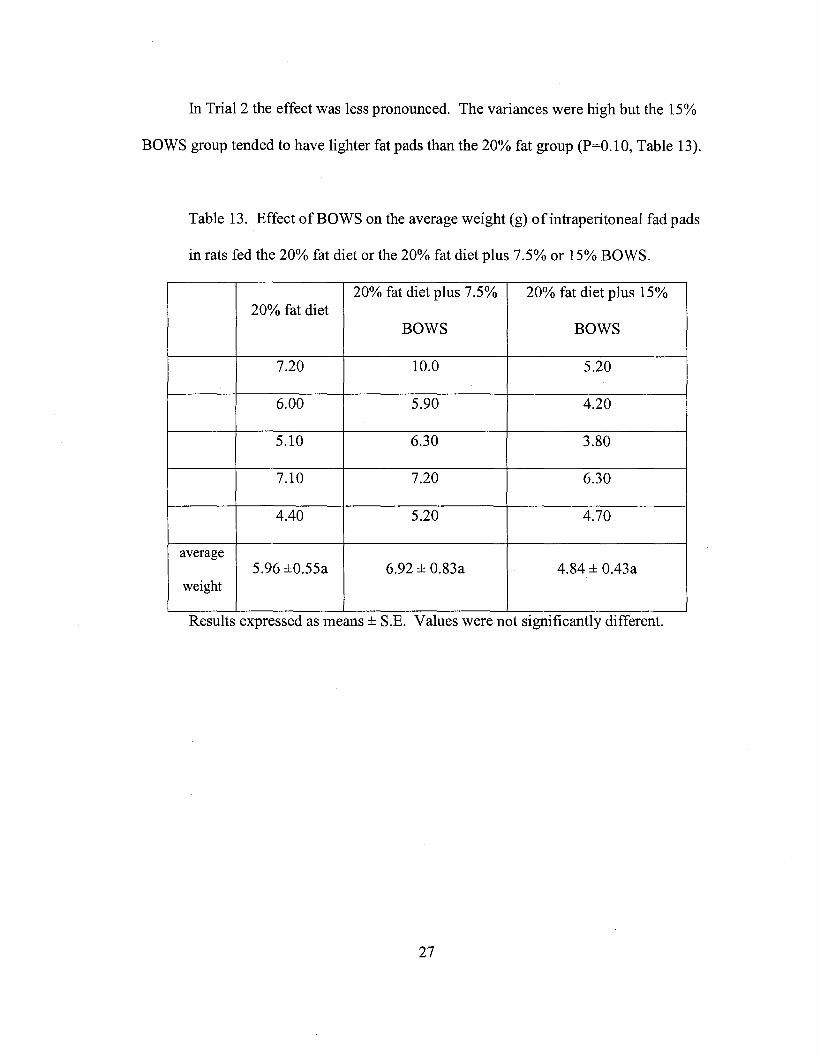
In Trial 2 the effect was less pronounced. The variances were high but the 15%
BOWS group tended to have lighter fat pads than the 20% fat group (P=O.l 0, Table 13).
Table 13. Effect of BOWS on the average weight (g) ofintraperitoneal fad pads
in rats fed the 20% fat diet or the 20% fat diet plus 7.5% or 15% BOWS.
20% fat diet plus 7.5% 20% fat diet plus 15%20% fat diet
BOWS BOWS
7.20 10.0 5.20
6.00 5.90 4.20
5.10 6.30 3.80
7.10 7.20 6.30
4.40 5.20 4.70
average5.96 ±0.55a 6.92 ± 0.83a 4.84 ± 0.43a
weight
Results expressed as means ± S.E. Values were not significantly different.
27
CHAPTER 4. DISCUSSION
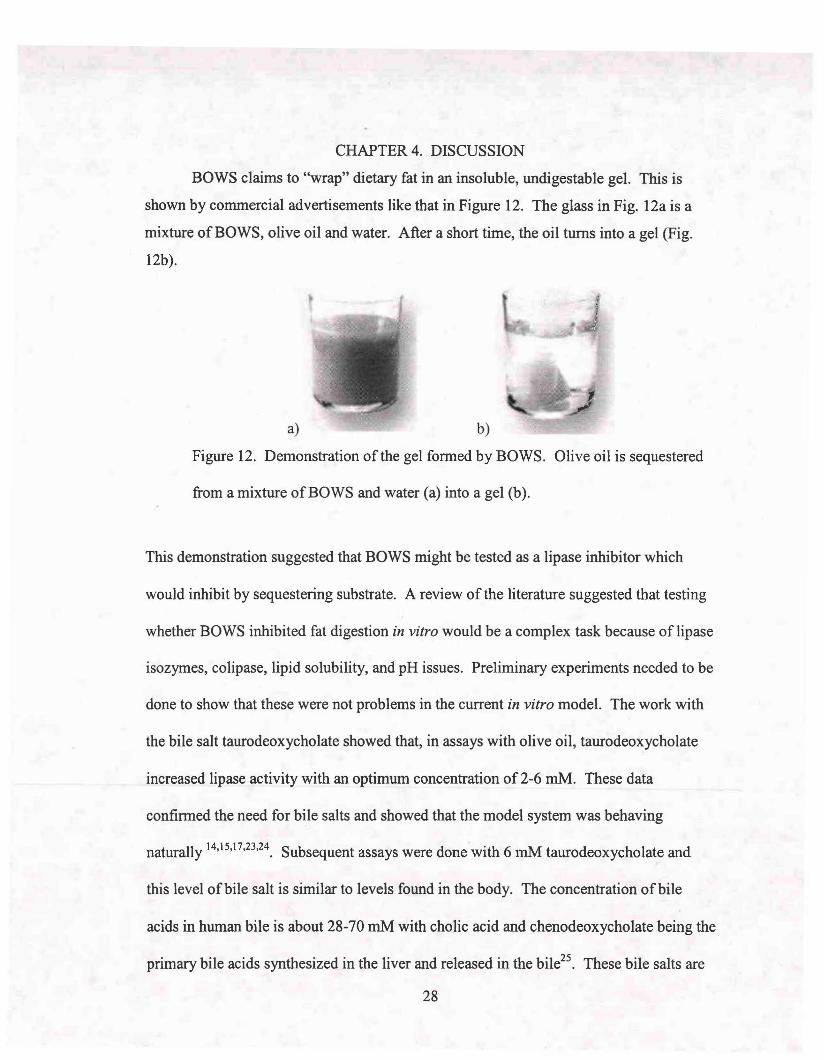
BOWS claims to "wrap" dietary fat in an insoluble, undigestable gel. This is
shown by commercial advertisements like that in Figure 12. The glass in Fig. 12a is a
mixture of BOWS, olive oil and water. After a short time, the oil turns into a gel (Fig.
12b).
a) b)
Figure 12. Demonstration of the gel formed by BOWS. Olive oil is sequestered
from a mixture ofBOWS and water (a) into a gel (b).
This demonstration suggested that BOWS might be tested as a lipase inhibitor which
would inhibit by sequestering substrate. A review of the literature suggested that testing
whether BOWS inhibited fat digestion in vitro would be a complex task because of lipase
isozymes, colipase, lipid solubility, and pH issues. Preliminary experiments needed to be
done to show that these were not problems in the current in vitro model. The work with
the bile salt taurodeoxycholate showed that, in assays with olive oil, taurodeoxycholate
increased lipase activity with an optimum concentration of 2-6 roM. These data
confirmed the need for bile salts and showed that the model system was behaving
naturally 14,15,17,23,24. Subsequent assays were done with 6 roM taurodeoxycholate and
this level ofbile salt is similar to levels found in the body. The concentration ofbile
acids in human bile is about 28-70 roM with cholic acid and chenodeoxycholate being the
primary bile acids synthesized in the liver and released in the bile25. These bile salts are
28
diluted by chyme from the stomach and pancreatic juice for digestion of a meal. These
are later modified by bacteria lower in the intestine into other bile salts like deoxycholate
whose concentration is similar to that of the primary bile salts. Other issues in the in
vitro system were thorough mixing and enzyme instability in the assay solution where the
bile salt was acting as a detergent and denaturant.
Having established the parameters of the fat digestion model, it was found that
BOWS inhibited crude lipase in a dose dependent way with 50% inhibition between 50
mg and 75 mg ofproduct with 100 mg of olive oil as substrate. Based on observations
during in vitro tests, it is likely that BOWS inhibits lipase activity by sequestering oil
away from the enzyme in a gel. This would inhibit fat digestion and lead to a decrease in
calorie intake, as undigested fat is not absorbed. As previously mentioned, inhibition of
fat digestion by Orlistat or chitosan leads to a decrease in body weight and the effect of
BOWS is similar. The components ofBOWS are proprietary and future work should
include detetmining which of the components is responsible for lipase inhibition. The in
vitro results obtained here predicted that BOWS would need to make up 50-75% of the
fat content of a particular diet in order to inhibit fat digestion by 50%. Based on this,
feeding trials in rats were done to provide an in vivo assessment ofBOWS.
Rat studies were done in two feeding trials. In Trial 1 juvenile rats were used.
The high fat (HF) plus 10% BOWS diet had a BOWS to fat ratio of 0.4 and should have
inhibited fat digestion by about 41 %. One way this inhibition should have been detected
was as a decrease in marker fatty acids in blood plasma and an increase in fecal fat
content. However, fatty acid analysis of rat plasma and feces showed no evidence of
inhibition, which suggests that there was less inhibition occurring in vivo than predicted
29
by in vitro tests. Insignificant changes in plasma lipids may also be due to lipid
mobilization from adipose tissue by hormone-sensitive lipase in response to low plasma
lipids as a consequence of fat digestion inhibition as discussed earlier. In contrast, in Trial
I weight gain was significantly less in the BOWS fed rats, which is consistent with slight
.but significant fat digestion inhibition.
Because the rats were juveniles and in a rapid growth phase at the start of the
study, it could be argued that rats eating the 10% BOWS diet were lighter because they
were consuming less protein. To eliminate this possibility, the diets were reformulated at
the end ofTrial I so that they would contain the same amount ofprotein. The BOWS to
fat ratio for these diets was 0.5 and 1.0 in accordance with in vitro studies. Rats eating
the 10% fat diet plus 10% BOWS diet remained lighter than the 10% fat diet rats in this
follow up study.
In Trial 2, adult rats were used so that another stage of growth could be tested.
Diets were isonitrogenous and isocaloric. The BOWS to fat ratios for the 7.5% and 15%
BOWS diets were 0.36 and 0.75 respectively. The 15% BOWS rats were significantly
lighter than those eating the 20% fat diet confirming that BOWS causes a difference in
weight gain that is consistent with fat digestion inhibition. Fatty acid analysis again
showed that the effect of BOWS in vivo is much less dramatic than that in vitro.
Overall health effects are more than just body weight so fat deposition in fat pads
and blood glucose were also considered important in rat studies. In both Trials 1 and 2
rats fed BOWS diets had less intraperitioneal fat than rats fed control diets.
Intraperitoneal fat in rats is equivalent to central or visceral fat in humans. This type of
fat is distributed in the abdomen and upper body and, unlike gynoidfat that is distributed
30
in the hips and thighs, is associated with the diseases of obesitI6,27. Thus, BOWS may
improve this marker of health.
In addition, rats fed the 15% BOWS diet showed significantly lower blood
glucose levels than rats fed the 20% fat diet. High blood glucose is associated with
obesity and may involve the adipocyte hormone, adiponectin. Adiponectin enhances the
effect of insulin and studies show that, as subjects become obese they secrete less
adiponectin28,29. Lower adiponectin levels lead to decreased glucose transport rates and
glucose clearance in response to insulin infusions28,29. This failure of insulin to reduce
glucose levels, called insulin resistance, is a hallmark of non-insulin dependent or type 2
diabetes, the disease most often associated with obesityo. Weight loss due to BOWS
may help reverse the obesity-induced decrease in adiponectin secretion and therefore help
reduce blood glucose. This possible mode of action might be hopeful for type 2
diabetics.
It can therefore be asked what the appropriate BOWS to fat ratio might be. In
Trials 1 and 2, less weight gain was seen at BOWS to fat ratios as low as 0.4 (lOg
BOWS/24 g fat) and 0.75 (15 g BOWS/20 g fat). Decreased intraperitoneal fat was seen
at BOWS to fat ratios as low as 0.5. Decreased blood glucose was seen at BOWS to fat
ratios as low as 0.37. These effects suggest a BOWS to fat ratio of about 0.5 for
physiological effect. For humans the question becomes how much fat is consumed at
each meal. In Japan a typical meal might consist of 100-200 g offish, rice and pickled
vegetables. Based on fatty acid analysis of fish from this laboratory or from the USDA,
the percent fat of such fish is about 2%, though 8% fat aquacultured fish have been seen.
Based on the results presented here, between 4 and 16g of fat would be present in a 200 g
31
meal of fish. This would call for between 2 and 8 g of BOWS. Each sachet of BOWS
contains 3 g. Barrious Laboratories recommends taking 1 sachet of BOWS after the
highest calorie meal of the day. Thus the experimental doses follow those of the
manufacturer. Other estimates put the amount of fat in the Japanese diet as 10-20% of
the daily calories3l. This may be an overestimate because the fat level was probably
determined by proximate analysis. It would suggest however, that a 2000-calorie diet
would contain 22-44 g of fat daily. This would require 4-7 packets of BOWS a day to
achieve weight loss and other positive physiological effects.
Treating obesity is difficult and diet aids like Orlistat may be considered a good
model because, as noted previously, Orlistat's mode of action is clear. It inactivates
lipases by covalently binding to the enzyme's active site3• It also has all the in situ
markers of its mode of action such as oily stool and dramatic weight 10SS5. Biologically
speaking, Orlistat might be considered perfect for weight loss. BOWS could also be a
diet aid as it too decreases lipase activity in vitro and decreases weight gain in vivo. In
reality, neither Orlistat nor BOWS is perfect because the body opposes weight loss.
With Orlistat, weight loss peaks after six months and, not surprisingly, patients
who stop taking the drug begin to gain weights. However, human subjects given a high
fat plus Orlistat preload (in yogurt) consumed significantly more energy at a buffet than
subjects given high-fat only preloads6. This suggests that the effect of dietary fat on
satiety is significant. This was shown in two studies. First, high fat, low carbohydrate
diets significantly increased levels ofthe satiety hormone cholecystokinin over low fat,
high carbohydrate diets32. Second, pure fat test meals also caused greater cholecystokinin
32
release than fat free and 29% fat test meals33. Thus patients consume more calories when
they lose this satiating effect of fat while taking Orlistat.
When it works, Orlistat is helped by social interactions. Patients using Orlistat
presumably must see their doctor regularly during treatment. This may provide progress
reports, encouragement when treatment is successful and helpful strategies when there
are slips. This was shown in the Diabetes Treatment Program where 223 people recently
diagnosed with type 2 diabetes were able to maintain an average 9-kg weight loss for six
years30. The success of the study was due in part to monthly contact with a physician and
a dietitian during the first six months of the study and then every three months for 6
years30. Social support is also important for people on conventional diets. Dieting
groups like Jenny Craig, Curves and a host of others provide a supportive, motivating
atmosphere for people trying to lose weight. This type of social support is shown by the
Waianae Diet which advocates ethnic food choices along with eating meals together,
family style34. This approach provides encouragement to continue clinical contact and to
make dietary changes at home34.
Another helpful approach to weight loss is to eat foods that make positive or
synergistic use of endocrine and gut hormones. Satiety hormones are secreted during a
meal and signal people to stop eating. These signals include peptide YY, pancreatic
polypeptide and oxyntomodulin35. The best-studied satiety hormone is cholecystokinin,
which is secreted in response to foods containing soluble fibers, protein and fats36. As
discussed above, high fat and pure fat meals increased cholecystokinin and soluble fibers
and proteins have a similar effect. For example, cholecystokinin levels increased when
fiber from white bean flakes, B-glucan and guar gum were included in test diets37,38,39,4o.
33
Proteins like whey and casein also increased cholecystokinin and feelings of fullness
whereas amino acids themselves did noe7,42. When antagonists like lorglumide sodium
block cholecystokinin receptors, the satiating effects of casein are reversed42. Satiety
may be the basis of the low carbohydrate, high protein, high fat diets that are currently
popular. Research has shown that people eating the high protein, high fat Atkins diet lost
significantly more weight than those on high carbohydrate, low fat, low calorie diets43.
However, once people go off the diet they begin to gain weight. Low calorie diets also
caused significant weight loss regardless of the macronutrients involved. Subjects on a
high protein, low fat and high carbohydrate, low fat diets both lost weight and showed
decreases in total cholesterollevels44• Furthermore, subjects on both diets showed greater
insulin sensitivity. Daily energy intake for both diets was 70-75% of that needed to
maintain weight. However, subjects on the high carbohydrate, low fat plan reported
increased feelings of hunger which would hinder the success of a weight loss program.
In the long term however, adipocyte hormones control body weight. The most
important of these is leptin which is secreted by fat cells. Leptin works on adrenergic
systems to increase metabolism and also works via cholecystokinin to decrease
appetite45,46. As fat cells grow due to weight gain, more leptin is secreted and
metabolism and satiety should increase and cause people to eat less. This was shown in a
study where mice injected with leptin ate less than rats not given leptin47• As fat cells
become smaller due to weight loss less leptin is secreted and this should cause an
increase in hunger feelings. Thus leptin responds to changes in weight. Another
important adipocyte hormone is adiponectin, which, as mentiond previously, is important
in glucose homeostasis28,29.
34
As shown here, obesity is a chronic disease with no easy treatments. Diet aids
like Orlistat and BOWS are valuable to help decrease calorie intake but they cannot work
alone. Social factors like those provided by weight loss programs or by physicians and
dietitians can help patients stick to their chosen weight loss strategy. Diets containing
satiety-maximizing foods help decrease hunger making it more likely that patients will
adhere to their diet plan. Combinations of these approaches to weight loss may have a
positive influence on long-term adipocyte hormones like leptin and adiponectin and
therefore promote long-term weight loss and improved health.
35
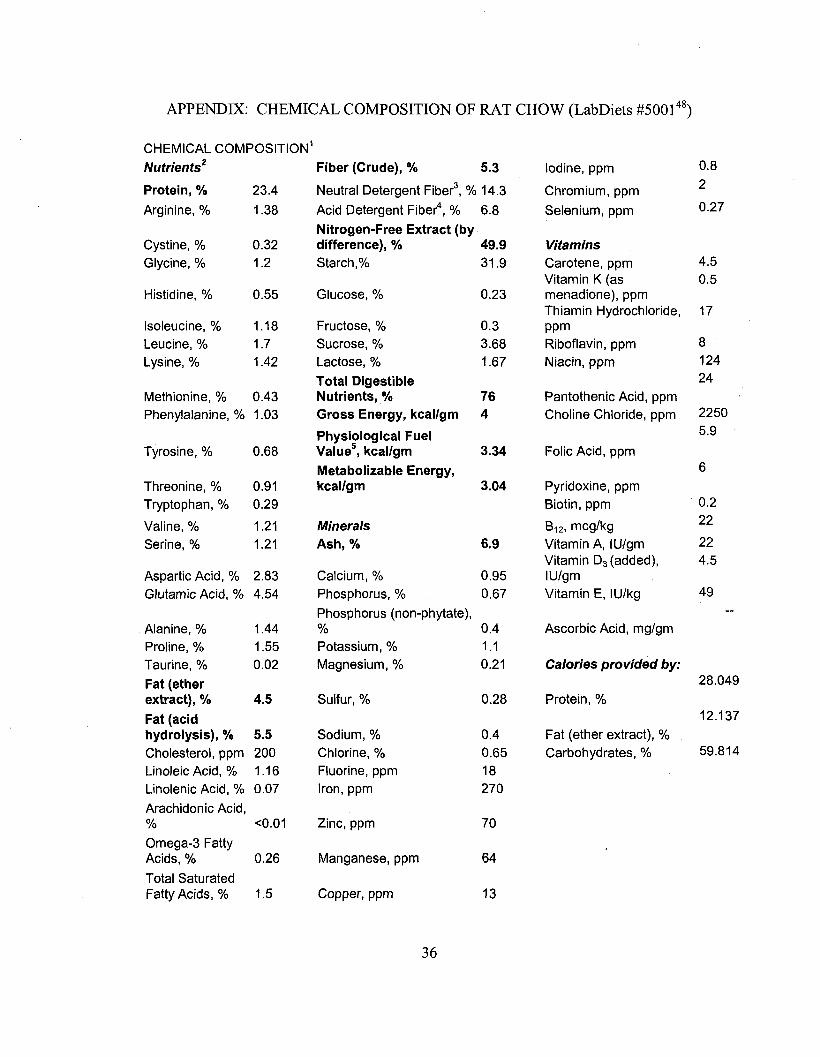
APPENDIX: CHEMICAL COMPOSITION OF RAT CHOW (LabDiets #5001 48)
CHEMICAL COMPOSITION 1
Nutrients2 Fiber (Crude), % 5.3 Iodine, ppm 0.8
Protein, % 23.4 Neutral Detergent Fiber3, % 14.3 Chromium, ppm 2
Arginine, % 1.38 Acid Detergent Fiber4, % 6.8 Selenium, ppm 0.27
Nitrogen-Free Extract (byCystine, % 0.32 difference), % 49.9 VitaminsGlycine, % 1.2 Starch,% 31.9 Carotene, ppm 4.5
Vitamin K (as 0.5Histidine, % 0.55 Glucose, % 0.23 menadione), ppm
Thiamin Hydrochloride, 17Isoleucine, % 1.18 Fructose, % 0.3 ppmLeucine, % 1.7 Sucrose, % 3.68 Riboflavin, ppm 8
Lysine, % 1.42 Lactose, % 1.67 Niacin, ppm 124
Total Digestible 24Methionine, % 0.43 Nutrients, % 76 Pantothenic Acid, ppmPhenylalanine, % 1.03 Gross Energy, kcal/gm 4 Choline Chloride, ppm 2250
Physiological Fuel 5.9
Tyrosine, % 0.68 Value5, kcal/gm 3.34 Folic Acid, ppm
Metabolizable Energy, 6
Threonine, % 0.91 kcal/gm 3.04 Pyridoxine, ppmTryptophan, % 0.29 Biotin, ppm 0.2
Valine, % 1.21 Minerals B12, meg/kg 22
Serine, % 1.21 Ash, % 6.9 Vitamin A, IU/gm 22Vitamin D3 (added), 4.5
Aspartic Acid, % 2.83 Calcium, % 0.95 IUlgmGlutamic Acid, % 4.54 Phosphorus, % 0.67 Vitamin E, IU/kg 49
Phosphorus (non-phytate),Alanine, % 1.44 % 0.4 Ascorbic Acid, mg/gmProline, % 1.55 Potassium, % 1.1
Taurine, % 0.02 Magnesium, % 0.21 Calories provided by:
Fat (ether 28.049
extract), % 4.5 Sulfur, % 0.28 Protein, %
Fat (acid 12.137
hydrolysis), % 5.5 Sodium, % 0.4 Fat (ether extract), %Cholesterol, ppm 200 Chlorine, % 0.65 Carbohydrates, % 59.814
Linoleic Acid, % 1.16 Fluorine, ppm 18Linolenic Acid, % 0.07 Iron, ppm 270
Arachidonic Acid,% <0.01 Zinc, ppm 70
Omega-3 FattyAcids, % 0.26 Manganese, ppm 64
Total SaturatedFatty Acids, % 1.5 Copper, ppm 13
36
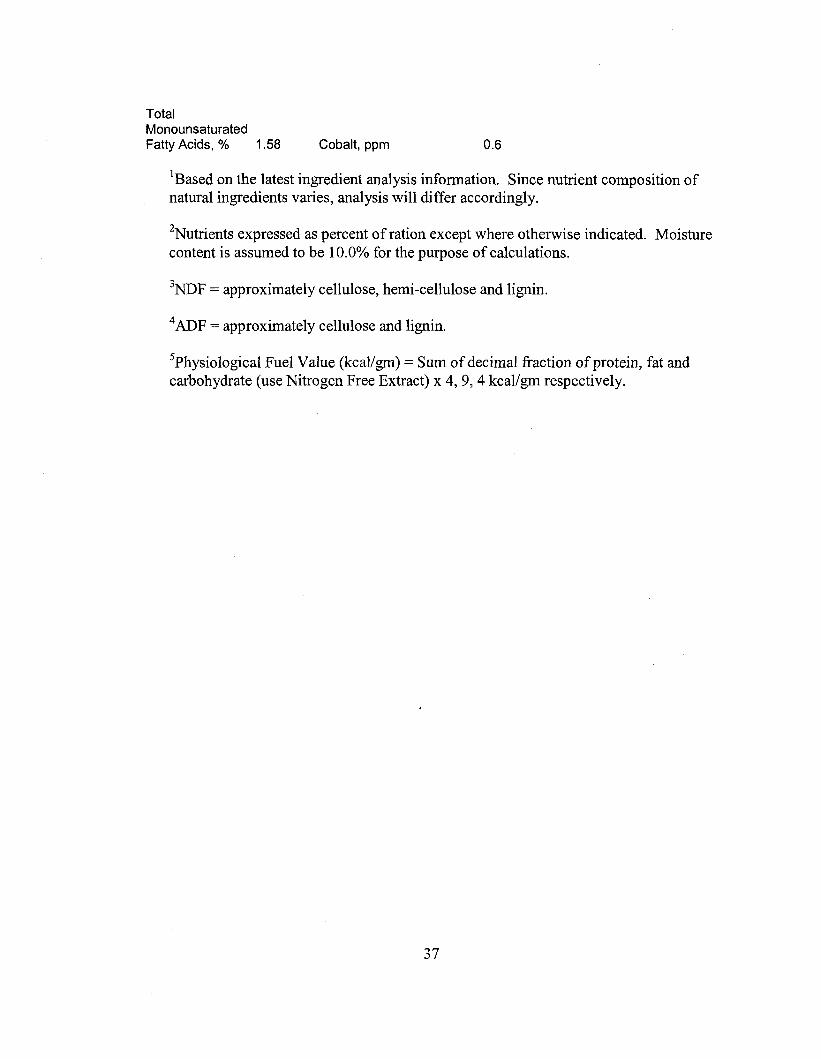
TotalMonounsaturatedFatty Acids, % 1.58 Cobalt, ppm 0.6
IBased on the latest ingredient analysis information. Since nutrient composition ofnatural ingredients varies, analysis will differ accordingly.
2Nutrients expressed as percent of ration except where otherwise indicated. Moisturecontent is assumed to be 10.0% for the purpose of calculations.
3NDF = approximately cellulose, hemi-cellulose and lignin.
4ADF = approximately cellulose and lignin.
5physiological Fuel Value (kcal/gm) = Sum ofdecimal fraction of protein, fat andcarbohydrate (use Nitrogen Free Extract) x 4, 9, 4 kcal/gm respectively.
37
LITERATURE CITED
1. BOWS website [Internet]. Available from: http://bows
style.comlsrc/experiment.html
2. Ogden CL, Carrol MD, Flegal KM. Epidemiologic trends in overweight and
obesity. Endocrinol Metab Clin North Am 2003; 32: 741-60.
3. Sternby B, Hartmann D, Borgstrom B, Nilsson A. Degree of in vivo inhibition of
human gastric and pancreatic lipases by Orlistat (Tetrahydrolipstatin, THL) in the
stomach and small intestine. Clinical Nutrition 2002; 5: 395-402.
4. Mathews CK vanHolde KE and Ahem KG. Biochemistry 2000. Third Edition,
Addison Wesley, Longman, San Francisco, 1186 pp.
5. Thearle M, Aronne LJ. Obesity and pharmacologic therapy. Endocrinol Metab
Clin North Am 2003; 32: 1005-24.
6. O'Donovan D, Feinle-Bisset C, Wishart J, Horowitz M. Lipase inhibition
attenuates the acute inhibitory effects of oral fat on food intake in healthy
subjects. Br J Nutr 2003; 90: 849-852.
7. Annuzzi G, De Natale C, Iovine C, Patti L, De Marino L, Coppola S, Del Prato S,
Riccardi G, Rivellese A. Insulin Resistance is independently associated with
postprandial alterations of triglyceride-rich lipoproteins in type 2 diabetes
mellitus. Arteriosclerosis, Thrombosis, and Vascular Biology 2004; 24: 1-6.
8. Large V, Amer P. Regulation oflipolysis in humans. Pahtophysiological
modulation in obesity, diabetes, and hyperlipidaemia. Diabetes & Metabolism
(Paris) 1998; 24: 409-418.
38
9. Haemmerle G, Zimmermann R, Strauss J, Kratky D, Riederer M, Knipping G,
Zechner R. Hormone-sensitive lipase deficiency in mice changes the plasma lipid
profile by affecting the tissue-specific expression pattern of lipoprotein lipase in
adipose tissue and muscle. J Biological Chemistry 2002; 277(15): 12946-12952.
10. Han LK, Kimura Y, Okuda H. Reduction in fat storage during chitin-chitosan
treatment in mice fed a high-fat diet. Int JObes Relat Metab Disord 1999; 23:
174-9.
11. Aranda JB, Contreras F, Bagchi D, Preuss HG. Efficacy of a novel Chitosan
formulation on fecal fat excretion: A double-blind, crossover, placebo-controlled
study. J Med 2002; 33: 209-225.
12. Gades M, Stern J. Chitosan supplementation does not affect fat absorption in
healthy males fed a high-fat diet, a pilot study. Int JObes Relat Metab Disord
2002; 26(1): 119-22.
13. Lowe M. The triglyceride lipases of the pancreas. J Lipid Research 2002; 43:
2007-2016.
14. Borgstrom B, Erlanson C. Pancreatic lipase and colipase, Interactions and effects
ofbile salts and other detergents. Eur J Biochem 1973; 37: 60-8.
15. Borgstrom B. On the interactions between pancreatic lipase and colipase and the
substrate, and the importance ofbile salts. J Lipid Research 1975; 16: 411-417.
16. Brockman H. Triglyceride lipase from porcine pancreas. Methods in Enzymology
1981; 71: 619-627.
17. Yang Y, Lowe M. The open lid mediates pancreatic lipase function. J Lipid
Research 2000; 41: 48-57.
39
18. Woods S, Seeley R, Rushing P, D'Alessio D, Tso P. A controlled high-fat diet
induces an obese syndrome in rats. J Nutr. 2003; 133: 1081-1087.
19. Tamaru CS, Ako H, Lee CS. Fatty acid and amino acid profiles from spawned
eggs of the striped mullet, Mugil cephalis L. Aquaculture 1992; 105: 83-94.
20. Taconic; Taconic Technical Library [Internet]. Taconic;2002. Available from:
http://www.taconic.com/healthr/hematology/leheme.htm
21. Tang Z, Lee JH, Louie RF, Kost GJ. Effects of different hematocrit levels on
glucose measurements with handheld meters for point-of-care testing. Arch
Pathol Lab Med 2000; 124: 1135-1140.
22. Kost GJ, Vu HT, Lee JH et al. Multicenter study of oxygen-insensitive handheld
glucose point-of-care testing in critical care/hospitallambulatory patients in the
United States and Canada. Crit Care Med 1998; 26(3): 581-590.
23. Wickham M, Garrood M, Leney J, Wilson P, Tillery-Travis A. Modification ofa
phospholipid emulsion interface by bile salt: effect on pancreatic lipase activity. J
Lipid Research 1998; 39: 623-632.
24. Patton J, Carey M. Inhibition of human pancreatic lipase-colipase activity by
mixed bile salt-phospholipid micelles. Am J Physiol1981; 241: G328-36.
25. Street JM, Trafford DJH, Makin HLF. The quantitative estimation of bile acids
and their conjugates in human biological fluids. J Lipid Research 1983; 24: 491
511.
26. EI-Atat F, Aneja A, Mcfarlane S, Sowers J. Obesity and hypertension.
Endocrinol Metab Clin North Am 2003; 32: 823-54.
40
27. Bray GA. Risks of Obesity. Endocrinol Metab Clin North Am 2003; 32: 787
804.
28. Hotta K, Funahashi T, Bodkin N, Ortmeyre H, Arita Y, Hansen B, Matsuzawa Y.
Circulating concentrations of the adipocyte protein adiponectin are decreased in
parallel with reduced insulin sensitivity during the progression to type 2 diabetes
in Rhesus monkeys. Diabetes 2001; 50: 1126-1133.
29. Weyer C, Funahashi T, Tanaka S, Hotta K, Matsuzawa Y, Pratley R, Tataranni P.
Hypoadiponectinemia in Obesity and type 2 Diabetes: Close Association with
Insulin Resistance and Hyperinsulinemia. Journal ofClinical Endocrinology and
Metabolism 2001; 86: 1930-1935.
30. Maggio CA, Pi-Sumyer FX. Obesity and type 2 diabetes. Endocrinol Metab Clin
North Am 2003; 32: 805-22.
31. Weisburger JH. Dietary fat and risk of chronic disease: mechanistic insights from
experimental studies. JAm Diet Assoc. 1997; 97(7 Suppl): S16-23.
32. Wells AS, Read NW, Uvnas-Moberg K, Alster P. Influences on fat and
carbohydrate on postprandial sleepiness, mood and hormones. Physiol Behav
1996; 61: 679-86.
33. Froehlich MA, Gonvers JJ, Fried M. Role of nutrient fat and cholecystokinin in
regulation of gallbladder emptying in man. Digestive Diseases Sci. 1995; 40(3):
529-533.
34. Shintani T, Beckham S, O'Connor HK, Hughes C, Sato A. The Waianae Diet
Program: A culturally sensitive, community-based obesity and clinical
41
intervention program for the Native Hawaiian population. Hawaii Medical
Journal 1994; 53:136-147.
35. Druce MR, Small CJ, Bloom SR. Gut Peptides regulating satiety. Endocrinology
2004; 145: 2660-5.
36. Woods SC. Gastrointestinal Satiety Signals. Am J Physiol Gastrointest Liver
Physiol2004, 286: G7-G13.
37. Bourdon 1., Yokoyama W, Davis P, Hudson C, Backus R, Richter D, Knuc1es B,
Schneeman BO. Postprandial lipid, glucose, insulin and cholecystokinin
responses in men fed barley pasta enriched with B-glucan. Am J Clin Nutr 1999;
69: 55-63.
38. Bourdon I, Olson B, Backus R, Richter DB, Davis PA, Schneeman BO. Beans, as
a source of dietary fiber, increase cholecystokinin and apolipoproteinB48
response to test meals in men. J Nutr 2001; 131: 1485-90.
39. Meir R, Beglinger C, Schneider H, Rowedder A, Gyr K. Effect of a liquid diet
with and without soluble fiber supplementation on intestinal transit and
cholecystokinin release in volunteers. JPEN J Parenter Enteral Nutr 1993; 17:
231-5.
40. Heini AF, Lara-Castro C, Schneider H, Kirk KA, Considine RV, Weinsier RL.
Effect of hydrolyzed guar gum fiber on fasting and postprandial satiety and satiety
hormones: A double-blind, placebo-controlled trial during controlled weight loss.
Int JObes 1998; 22: 906-9.
42
41. Hall WL, Millward DJ, Long SJ, Morgan LM. Casein and whey exert different
effects on plasma amino acid profiles, gastrointestinal hormone secretion and
appetite. Br J Nutr 2002; 89: 239-248.
42. Froetschel MA, Azain MJ, Edwards GL, Barb CR, Amos HE. Opioid and
cholecystokinin antagonists alleviate gastric inhibition of food intake by premeal
loads of casein in meal-fed rats. J Nutr 2001; 131: 3270-6.
43. Foster GD, Wyatt HR, Hill JO, McGuckin BG, Brill C, Mohammed BS, Szapary
PO, Rader DJ, Edman JS, Klein S. A randomized trial of a low-carbohydrate diet
for obesity. N Engl J Med 2003; 348: 2082-2090.
44. Johnston CS, Tjonn SL, Swan PD. High-protein, Low-fat diets are effective for
weight loss and favorably alter biomarkers in healthy adults. J Nutr 2004; 134:
586-91.
45. Minokoshi Y, Kim YB, Peroni aD, Fryer LG, Muller C, Kahn BB. Leptin
stimulates fatty acidstty-acid oxidation by activating AMP-activated protein
kinase. Nature 2002; 415: 339-43.
46. Guilmeau S, Buyse M, Tsocas A, Laigneau JP, Bado A. Duodenalleptin
stimulates cholecystokinin secretion: evidence of a positive leptin-cho1ecystokinin
feedback loop. Diabetes 2003; 52: 1664-72.
47. Van Heek M. Diet-induced obese mice develop peripheral, but not central,
resistance to leptin. J Clin Invest 1997; 99: 385-90.
48. LabDiets website [Internet]. Available from:
http://www.1abdiet.com/productsfrm.htm
43
Recommended