Analyst Meeting – 3Q2016
November 14, 2016
The Bangchak Petroleum PLC
AGENDA
2
1 Performance Summary
2 Investment Update
4 Appendix
3 Bangchak Retail Non-Oil Business
AGENDA
3
1 Performance Summary
2 Investment Update
4 Appendix
3 Bangchak Retail Non-Oil Business

BCP Group Performance
4The Bangchak Petroleum Plc
Q3/16 Performance Snapshots
9M/16
EBITDA PerformanceUnit: THB Million
Refinery• Consistent high level of crude run • Softer market GRM
Marketing• Maintain 2nd market share• 11% retail sales volume growth (Jan-Sep 16/15) • Satisfied marketing margin
Green Power Plant• BCPG listing on schedule• COD 8.8 MWac of solar power business in Japan
Biofuel• COD of Biodiesel Plant 2 and Ethanol Plant (BBE)• Affected by the government reduced the portion
of B100 mixing with diesel from 7% to 3%
E&P• Galoc oil field recorded an Uptime of 99.3%• Cost reduction continue
4
Refinery51%
Marketing20%
Solar Power21%
Biofuel-2%
E&P6%
EBITDA
2,798THB Million
Q3/16
Refinery42%
Marketing31%
Solar Power22%
Biofuel2%
E&P3%
EBITDA
8,076THB Million

Q3/15 Q2/16 Q3/16
Accounting Operating
EBITDA Performance - BCP Group
5The Bangchak Petroleum Plc
Unit: THB Million
EBITDA Performance
28% YoY
-32% QoQ
Accounting EBITDA
-21% YoY
-10% QoQ
Operating EBITDA2,184
3,5674,085
3,143 2,798 2,833
Refinery Marketing Solar Power Biofuel E&P
Q3/16 EBITDA Performance Compare to Target by Business Unit
Target
1,503MB
607MB
612MB
-65MB
171MB
5
2,833
2,798
0 1,000 2,000 3,000 4,000 5,000
Operating
Accounting
Target3,700
Unit: THB Million

EBITDA Performance - BCP Group
0%
50%
100%
150%
200%
0.5 1.5 2.5 3.5 4.5 5.5
Solar Power1,765
Marketing2,531
Refinery3,389
Biofuel195 E&P
252
9M/16 Performance Compare to Target by Business Unit
Accounting EBITDA 8,076 Million Baht
Unit: THB Million
Target100%
6The Bangchak Petroleum Plc 6

BCP Group Portfolios
7The Bangchak Petroleum Plc
Green Power Plant Biofuel E&PRefinery Marketing
7

Refinery Performance: Smooth Operation
8The Bangchak Petroleum Plc
Q3/15 Q2/16 Q3/16
Domestic Import
16% 13% 12%1%
53% 53% 55%
10% 11% 11%
19% 20% 19%
2% 2% 3%
Q3/15 Q2/16 Q3/16
Crude SourcingUnit: KBD
Product YieldUnit: %
LPG
Gasoline
Jet
Diesel
Fuel OilUCO
117 112 115
59%
41%
65%
35%
52%
48%
100 96 101 101 98
48
97 102109 112 117 114
64
112 116
83% 80% 84% 84% 82%
40%
81%85%
91% 93% 97% 95%
53%
93% 96%
0%
20%
40%
60%
80%
100%
0102030405060708090
100110120130140
Q1/13 Q2/13 Q3/13 Q4/13 Q1/14 Q2/14 Q3/14 Q4/14 Q1/15 Q2/15 Q3/15 Q4/15 Q1/16 Q2/16 Q3/16
Crude Run UtilizationRefinery Crude RunUnit: KBD
TAMTAM
8
Refinery Performance
9The Bangchak Petroleum Plc
0
2
4
0
20
40
60
80
100
Q3/15 Q4 Q1/16 Q2 Q3
DB DTD/DB
Crude Price & Crack Spreads ($/BBL)
-10
-5
0
5
10
15
20
Q3/15 Q4 Q1/16 Q2 Q3
GO/DB
UNL95/DB
FO/DB
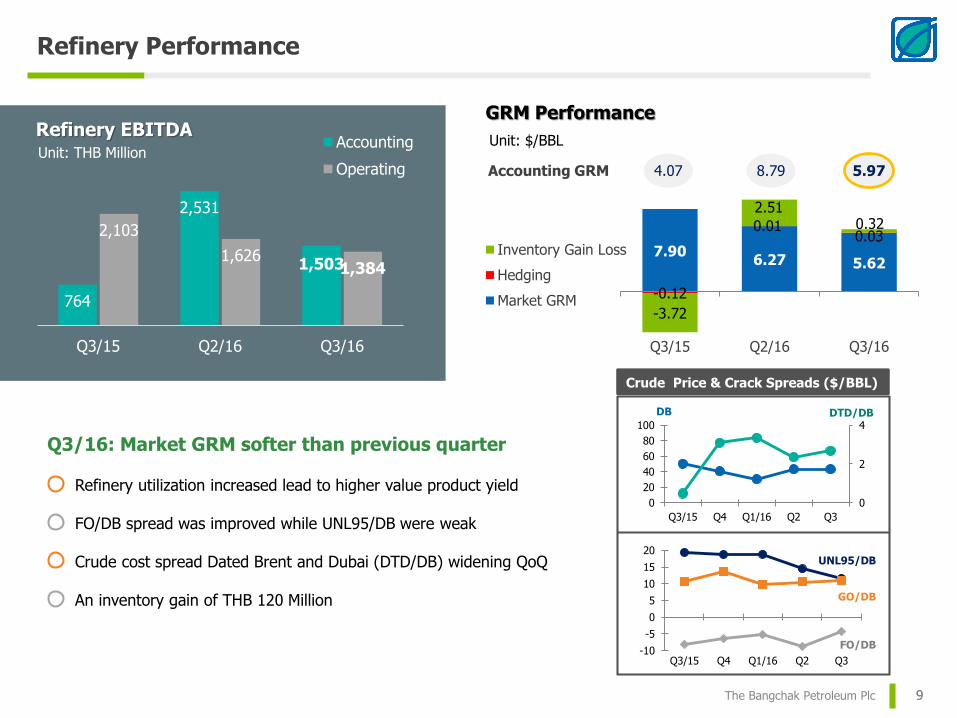
7.906.27 5.62
-0.12
0.010.03
-3.72
2.510.32
Q3/15 Q2/16 Q3/16
Inventory Gain Loss
Hedging
Market GRM
Accounting GRM 4.07 8.79 5.97
GRM Performance
Q3/16: Market GRM softer than previous quarter
Refinery utilization increased lead to higher value product yield
FO/DB spread was improved while UNL95/DB were weak
Crude cost spread Dated Brent and Dubai (DTD/DB) widening QoQ
An inventory gain of THB 120 Million
764
2,531
1,503
2,103
1,6261,384
Q3/15 Q2/16 Q3/16
Accounting
Operating
Refinery EBITDAUnit: $/BBL
Unit: THB Million
9

0
200
400
600
800
1,000Retail Market
Industrial Market
Export
Wholesales
Distribution channel: Retail market is our main priority
10
Refined Petroleum Products: % Portion of total sales volume Q3/2016
Marketing Business
RetailMarket
IndustrialMarket
Wholesales
Export
46%
27%
14%
13%
Q3/15 = 45%, Q2/16 = 48% Q3/15 = 26%, Q2/16 = 28% Q3/15 = 9%, Q2/16 = 14% Q3/15 = 19%, Q2/16 = 12%
Unit: Million Litre
Total Sales Volume
670706
754777
851879
921
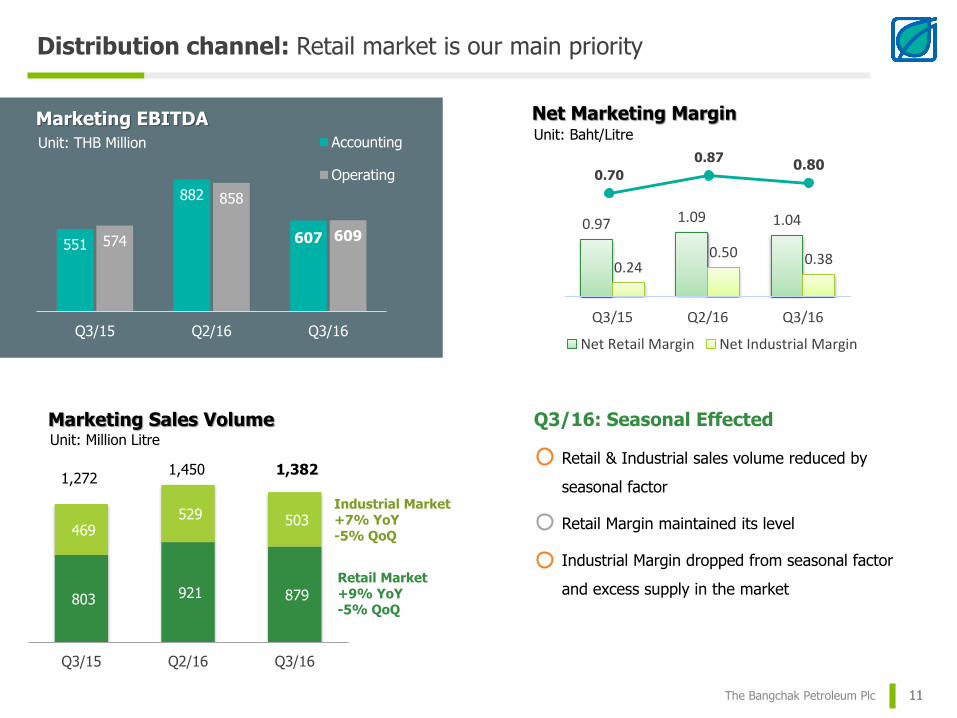
Distribution channel: Retail market is our main priority
11The Bangchak Petroleum Plc
803 921 879
469 529 503
Q3/15 Q2/16 Q3/16
Marketing Sales VolumeUnit: Million Litre
1,2721,450 1,382
Industrial Market+7% YoY-5% QoQ
Retail Market+9% YoY-5% QoQ
551
882
607574
858
609
Q3/15 Q2/16 Q3/16
Accounting
Operating
Marketing EBITDA
Unit: THB Million
11
0.97 1.09 1.04
0.24 0.50 0.38
Q3/15 Q2/16 Q3/16
Net Retail Margin Net Industrial Margin
0.70
0.870.80
Net Marketing MarginUnit: Baht/Litre
Retail & Industrial sales volume reduced by
seasonal factor
Retail Margin maintained its level
Industrial Margin dropped from seasonal factor
and excess supply in the market
Q3/16: Seasonal Effected

0
50
100
150
200
250
300
100
200
300
400
500
600
700
12
Marketing NetworkIncrease Thruput per S/S by Network Expansion
BCP - BGN S/S
Major M7 Oil excl. BCP
433
Unit: K.Litre/Station/ Month
Thruput per station
595
554
463
180
200
220
240
260
280
300
320
340
JAN FEB MAR APR MAY JUN JUL AUG SEP OCT NOV DEC
FY2012
FY2013
FY2014
FY2015
FY2016
+11% Average YoY Growth Unit: Million Litre/ Month
Retail Sales VolumeY2015 Jan-Sep 16 ∆
37.1% 37.0%
15.0% 15.0%
13.6% 12.9%
13.0% 12.9%
6.0% 5.7%
5.2% 5.0%
1.5% 1.8%
6.9% 7.9%
1.6% 1.6%
Market Share (Retail Channel)
BCP - Co-Op Type
BCP – Dealer Type
Standard TypeSmall Type
Minor M7 Oil
146
114

R&M PerformanceRefinery and Marketing business are the main source of overall earnings
13
8.345.88 6.96
9.055.80
3.31
2.683.47
3.53
3.90
2012 2013 2014 2015 9M2016
Net MKM
Market GRM
Unit: $/BBL
Normalize Integrated Margin
11.66 8.56 10.43 12.58 9.70
7,026 6,579 7,167
12,838
5,471
2,973 2,6083,562
4,134
3,731
2012 2013 2014 2015 9M2016
Unit: THB Million
R&M being fully integrated model, the profit can be optimized through business cycle
Refinery Business earning was volatile due to market conditions and Turnaround maintenance (TAM)
Marketing Business Captures a Demand Surge During Low Oil Price Environment
Net MKM
Market GRM

BCP Group Portfolios
14
Green Power Plant Biofuel E&PRefinery Marketing
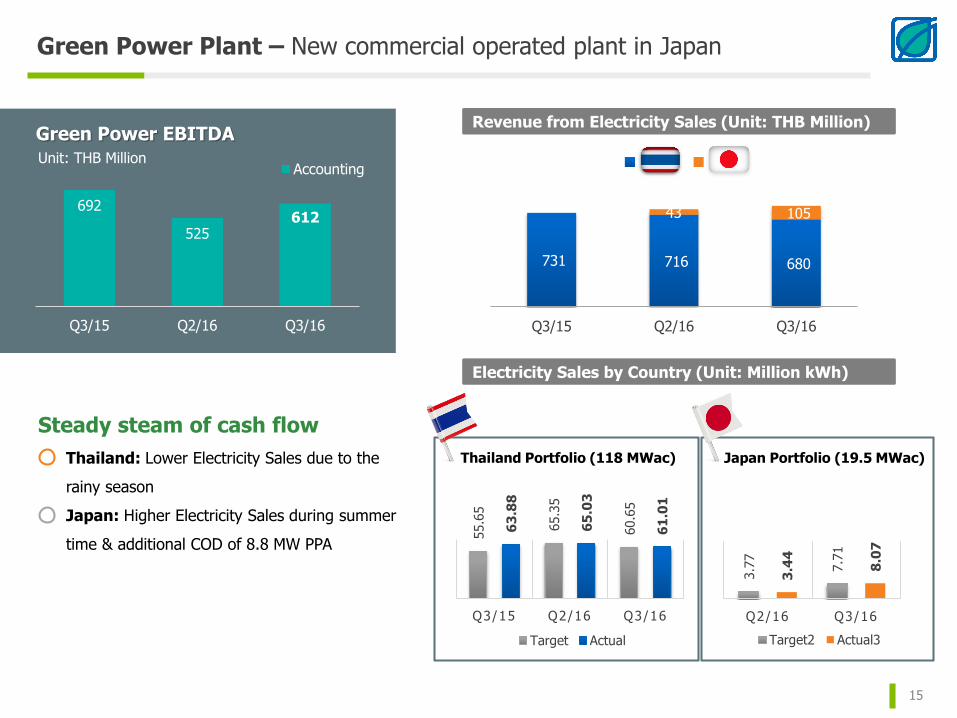
3.7
7
7.7
1
3.4
4
8.0
7
Q2/16 Q3/16
Target2 Actual3
55.6
5
65.3
5
60.6
5
63
.88
65
.03
61
.01
Q3/15 Q2/16 Q3/16
Target Actual
Green Power Plant – New commercial operated plant in Japan
15
Thailand Portfolio (118 MWac)
Electricity Sales by Country (Unit: Million kWh)
Revenue from Electricity Sales (Unit: THB Million)
Steady steam of cash flow
Thailand: Lower Electricity Sales due to the
rainy season
Japan: Higher Electricity Sales during summer
time & additional COD of 8.8 MW PPA
692
525612
Q3/15 Q2/16 Q3/16
Accounting
Green Power EBITDA
Unit: THB Million
731 716 680
43 105
Q3/15 Q2/16 Q3/16
TH JP
Japan Portfolio (19.5 MWac)

Biofuel Business – Increased capacity from new biodiesel plant
16
366 387452
568
741
478
Q3/15 Q2/16 Q3/16
Daily Production Sales Volume
Capacity expanded from 2nd Biodiesel plant’s COD
Lower demand of Biodiesel (government’s policy of decreasing
the portion of B100 mixing with diesel from 7% in to 3%)
Biodiesel plants recorded a 56% utilization rate, current
capacity increased to 810 K. Litre / day
Short term CPO & B100 price fluctuation hence to an
inventory loss
Biodiesel Plant: Daily Production and Sales Volume
Unit: K. Litre per day
62
113
-65
83101 89
Q3/15 Q2/16 Q3/16
Accounting
Operating
Biofuel EBITDA
Unit: THB Million
B7 to B5 in July B5 to B3 in Aug
28
30
32
34
36
38
40
42
CPO Price B100 Price
(Baht / Kg.) (Baht / Litre)
Average Monthly CPO and B100 product price
Source: Department of Energy Business, Ministry of Energy
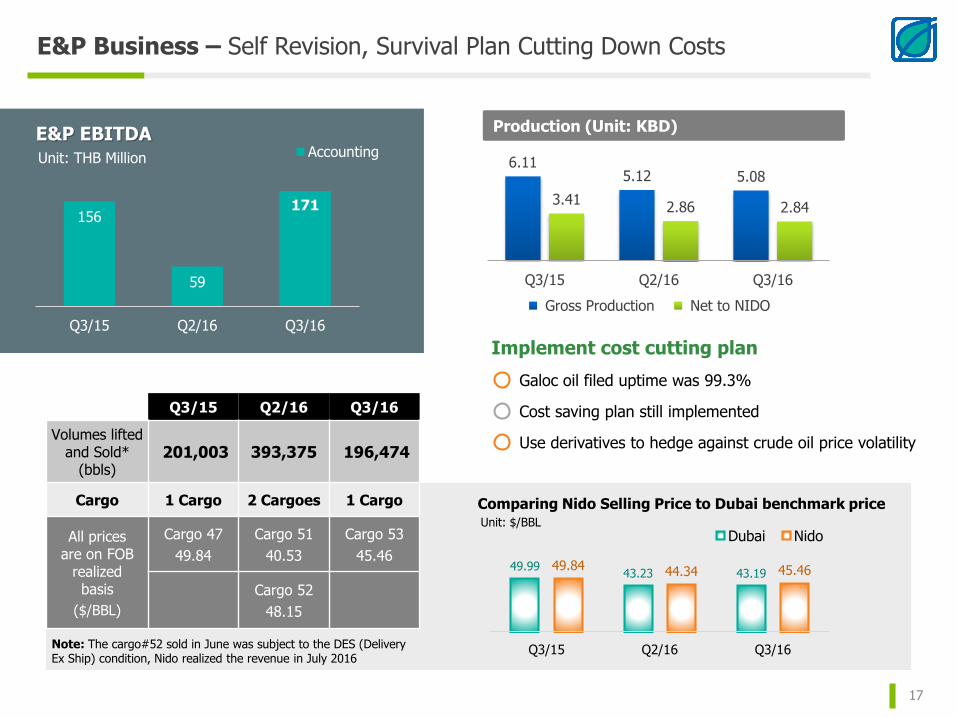
E&P Business – Self Revision, Survival Plan Cutting Down Costs
17
6.115.12 5.08
3.412.86 2.84
Q3/15 Q2/16 Q3/16
Gross Production Net to NIDO
Production (Unit: KBD)
Q3/15 Q2/16 Q3/16
Volumes lifted and Sold*
(bbls)201,003 393,375 196,474
Cargo 1 Cargo 2 Cargoes 1 Cargo
All prices are on FOB
realized basis
($/BBL)
Cargo 47
49.84
Cargo 51
40.53
Cargo 53
45.46
Cargo 52
48.15
49.9943.23 43.19
49.84 44.34 45.46
Q3/15 Q2/16 Q3/16
Dubai Nido
Comparing Nido Selling Price to Dubai benchmark priceUnit: $/BBL
Note: The cargo#52 sold in June was subject to the DES (Delivery Ex Ship) condition, Nido realized the revenue in July 2016
Implement cost cutting plan
Galoc oil filed uptime was 99.3%
Cost saving plan still implemented
Use derivatives to hedge against crude oil price volatility
156
59
171
Q3/15 Q2/16 Q3/16
AccountingE&P EBITDA
Unit: THB Million

AGENDA
18
1 Performance Summary
2 Investment Update
4 Appendix
3 Bangchak Retail Non-Oil Business

New Co-Gen Power Plant
3E Project – Project Progress
19
Y2016 Y2017 Y2018 Y2019 Y2020
Completion
Project Timeline
New Co-Gen Power Plant (≈12 MW)
Under Construction
Continuous Catalyst Regeneration Unit (CCR)
(Extend Maintenance Cycle)
FEED&ITB Preparation for Enlarge Capacity
Debottlenecking
(For light end products)
Basic Design Preparation
Completion EPC Award
Completion EPC AwardNPU and ISOU
Boiler Stack/ Structure HRSGOverall Site
Progress: 86%
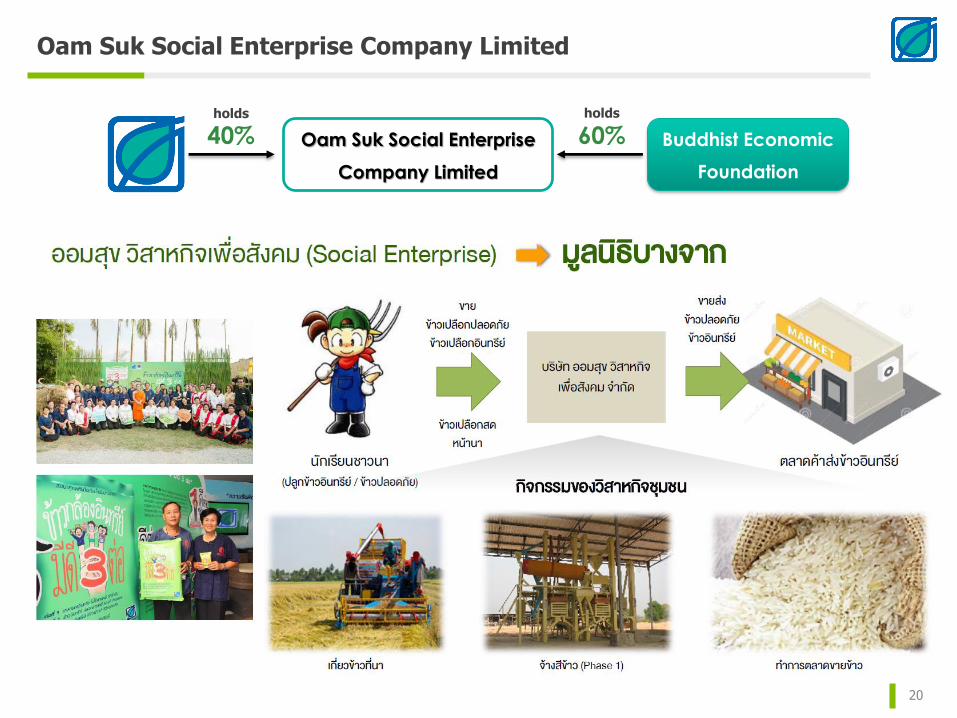
Oam Suk Social Enterprise Company Limited
20
Oam Suk Social Enterprise
Company Limited
Buddhist Economic
Foundation
40%holds
60%holds

Resources Business
21
E&P
Increase of registered share capital from USD 91.31 million to USD 111.41 million for appraisal wells program in the Mid-Galoc area (GMA) of Galoc oil field in Philippines
Nido’s budgeted participating interest share of well costs is estimated to be A$24.0 million (US$18.5 million)
2P – 4.1MMstb2C – 7.4MMstb
Galoc Reserves & Resources1/
1/Reserves estimates as at 31 December 2015 and Contingent Resources estimates as at 1 August 2016
If successfully developed:
Production & Cost Saving
expected to start production in 2019
would save Galoc total cost by 30%
Optimal timing
• Enough time window for GMA to be developed before decommissioning of Galoc Field and related infrastructure
• Lower global oil price reduced drilling & developing cost by almost 50%
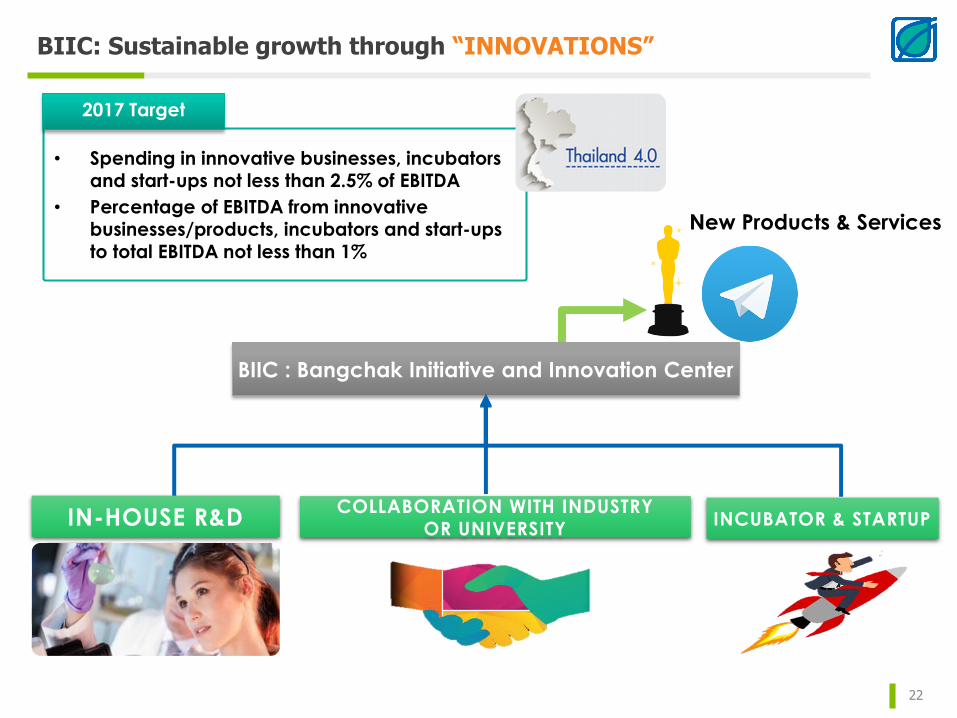
BIIC: Sustainable growth through “INNOVATIONS”
22
BIIC : Bangchak Initiative and Innovation Center
IN-HOUSE R&DCOLLABORATION WITH INDUSTRY
OR UNIVERSITYINCUBATOR & STARTUP
New Products & Services
• Spending in innovative businesses, incubators and start-ups not less than 2.5% of EBITDA
• Percentage of EBITDA from innovative businesses/products, incubators and start-ups to total EBITDA not less than 1%
2017 Target
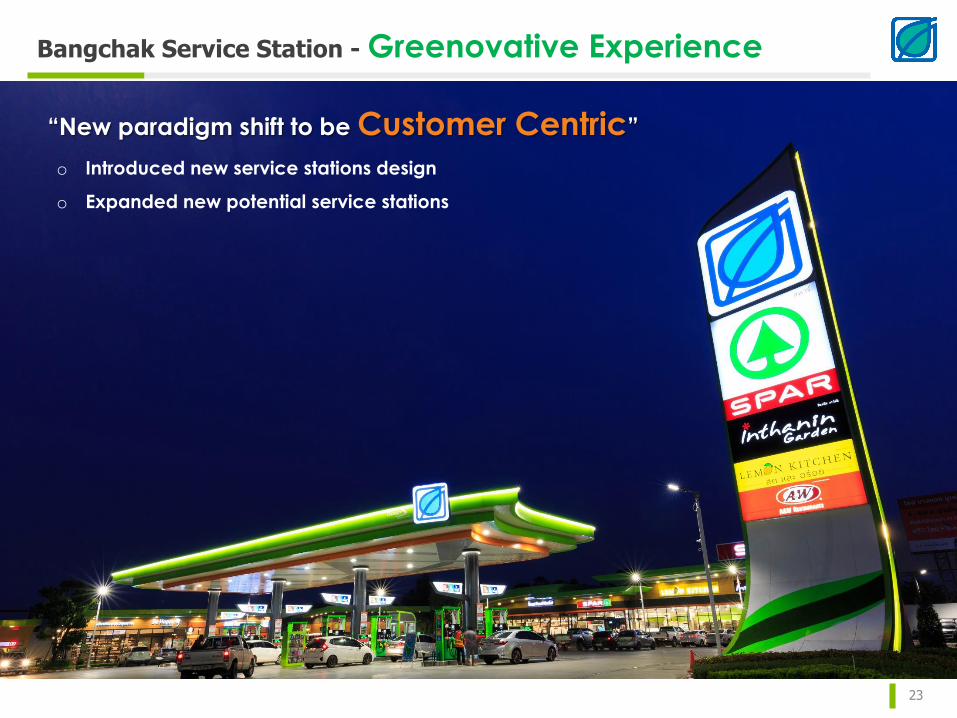
Bangchak Service Station - Greenovative Experience
23
“New paradigm shift to be Customer Centric”
o Introduced new service stations design
o Expanded new potential service stations

New Service Station Design
24
Greenovative Experience
Developed Non oil one roof concept

AGENDA
25
1 Performance Summary
2 Investment Update
4 Appendix
3 Bangchak Retail Non-Oil Business

26
Disclaimer : The information contained herein is being furnished on a confidential basis for discussion purposes only and only for the use of the
recipient, and may be subject to completion or amendment through the delivery of additional documentation. Except as otherwise provided
herein, this document does not constitute an offer to sell or purchase any security or engage in any transaction. The information contained herein
has been obtained from sources that The Bangchak Petroleum Public Company Limited (“BCP”) considers to be reliable; however, BCP makes no
representation as to, and accepts no responsibility or liability for, the accuracy or completeness of the information contained herein. Any
projections, valuations and statistical analyses contained herein have been provided to assist the recipient in the evaluation of the matters
described herein; such projections, valuations and analyses may be based on subjective assessments and assumptions and may utilize one among
alternative methodologies that produce differing results; accordingly, such projections, valuations and statistical analyses are not to be viewed as
facts and should not be relied upon as an accurate representation of future events. The recipient should make an independent evaluation and
judgment with respect to the matters contained herein.
Thank You
Q&A
Recommended