Commonwealth of Kentucky Department of Highways
THE APPLICATION OF KENTUCKY FLEXIBLE PAVEMENT DESIGN METHOD TO W ASHO TEST ROAD CONDITIONS
by
W. B. Drake Senior Research Engineer
A Report Pre sen ted at the Kentucky Highway Conference, University of Kentucky, Lexington, March 29, 1956.
Highway Materials Research Laboratory Lexington, Kentucky
March, 1956
INTRODUCTION
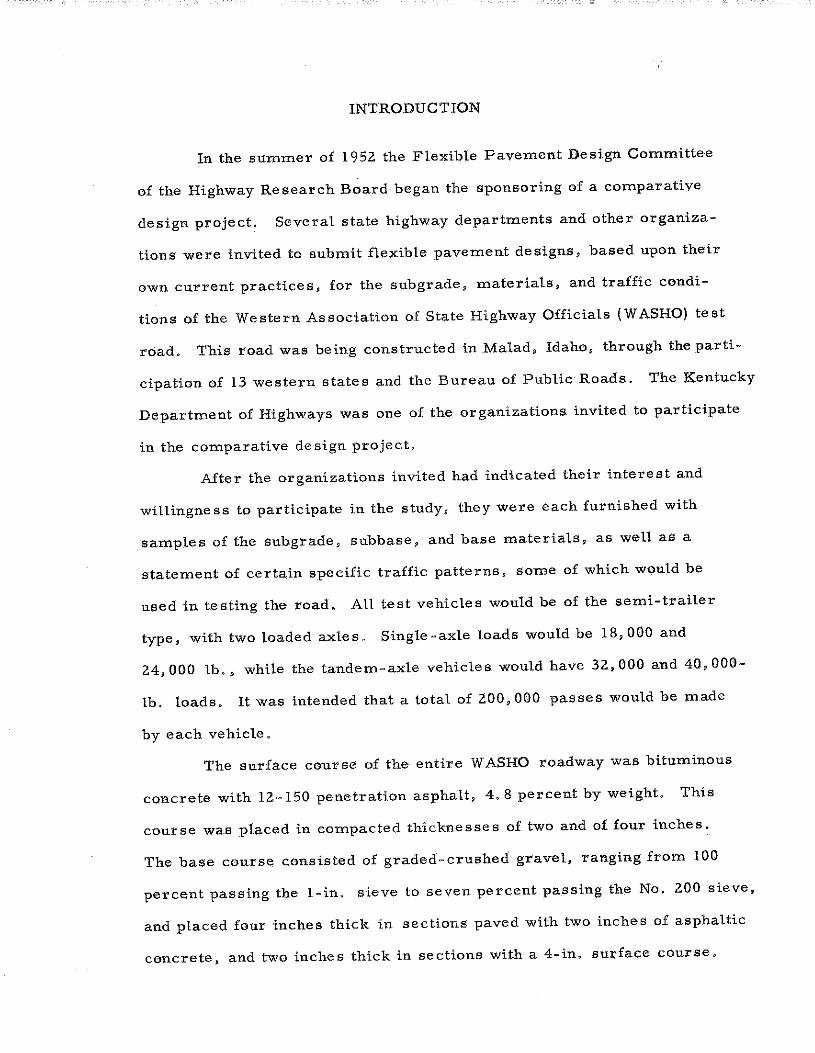
In the summer of 1952 the Flexible Pavement Design Committee
of the Highway Research Board began the sponsoring of a comparative
design project. Several state highway departments and other organiza
tions were invited to submit flexible pavement designs, based upon their
own current practices, for the subgrade, materials, and traffic condi-
tions of the Western Association of State Highway Officials (WASHO) test
road. This road was being constructed in Malad, Idaho, through the parti
cipation of 13 western states and the Bureau of Public Roads. The Kentucky
Department of Highways was one of the organizations invited to participate
in the comparative design project.
After the organizations invited had indicated their interest and
willingness to participate in the study, they were each furnished with
samples of the subgrade, subbase, and base materials, as well as a
statement of certain specific traffic patterns, s01ne of which would be
used in testing the road. All test vehicles would be of the semi-trailer
type, with two loaded axles. Single-axle loads would be 18,000 and
24,000 lb., while the tandem-axle vehicles would have 32,000 and 40,000-
lb, loads. It was intended that a total of 200,000 passes would be made
by each vehicle.
The surface course of the entire W ASHO roadway was bituminous
concrete with 12-150 penetration asphalt, 4, 8 percent by weight. This
course was placed in compacted thicknesses of two and of four inches.
The base course consisted of graded-crushed gravel, ranging from 100
percent passing the l-in. sieve to seven percent passing the No. 200 sieve,
and placed four inches thick in sections paved with two inches of asphaltic
concrete, and two inches thick in sections with a 4-in. surface course.
The gravel for the subbase was pit run, with 100 percent passing the 2-in.
sieve and five percent passing the No. ZOO sieve.
There were two specific objectives for the design project:
a.) To determine the pavement thickness indicated necessary by
the methods of the various participating organizations for a given type of
subgrade soil, given pavement materials, and for definite patterns of
traffic.
b.) To compare the designs obtained in (a..) with those indicated
to be adequate under the actual traffic imposed upon the WASHO test
pavement by the .four test axle loads.
The Design Problem
The problem of design for the organizations participating in the
study was actually three fold. It consisted of determining, with their own
construction standards but for conditions at the Idaho test site, the
following:
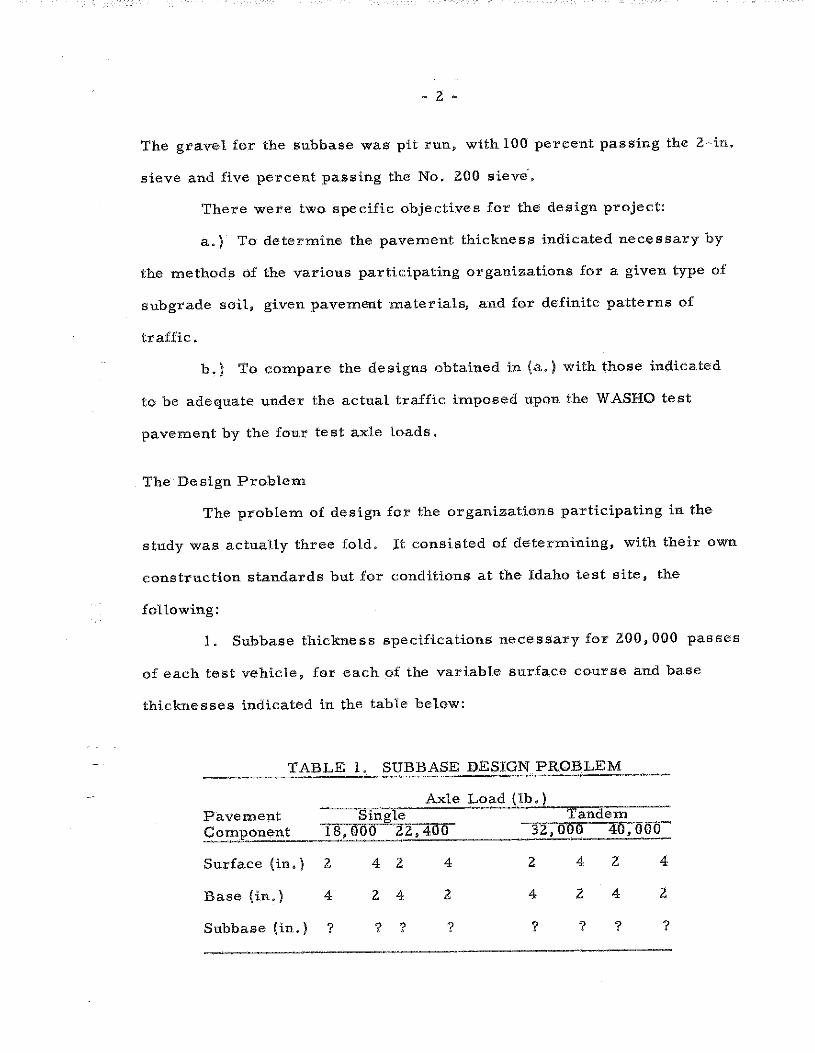
1. Subbase thickness specifications necessary for 200,000 passes
of each test vehicle, for each of the variable surface course and base
thicknesses indicated in the table below:
TABLE l. SUBBASE DESIGN PROBLEM
Axle L~ad (lb.) Pavement Siri~1e Tandem Component 18,000 ~~~400 _?2,000 40,000
Surface (in.) 2 4 2 4 2 4 2 4
Base (in.) 4 2 4 2 4 2 4 2
Subbase (in.) ? ? ? ? ? ? ? ?

Z. The number of trips of vehicles with each of the four axle
loadings required to produce failure for the following designs:
TABLE 2. W ASHO TEST PAVEMENT DESIGNS ..,_,_.,."' __ . --~=~.~~~~--'-.--·~--. --~--
Compon.~t Thickness in ln.ches
Surface 2 2 2 2 2 4 4 4 4 4
Base 4 4 4 4 4 2 2 2 2 2
Subbase 0 4 8 12 16 0 4 8 12 16 .. -· ~---~··-~-~----~.....-.~ - . -- --Total 6 10 14 18 22 6 10 14 18 22 -~, . .., __
'-~~~-~~-·-· __ ,_...~.
3. The pavement thickness necessary for the climatic conditions
where the particular design procedure is normally used (in this depart~
ment's case, for Kentucky) but for certain specified traffic conditions.
Thicknesses of surface, base, and subbase were to be selected as thought
necessary. The traffic conditions specified included the already detailed
WASHO pattern, with the ZOO, 000 passes of each vehicle; as well as
certain other traffic patterns as indicated in the table below:
TABLE 3. COMPOSITE TRAFFIC PATTERNS --Pattern ---pattern-----pattern Pattern
·~~--"( a=l., _______ Jbl lcl ( d'"-) __
Passenger Cars (No. of Vehicles/Day)
Commercial Vehicles (No, Axles/Day)
10, 000 lb. or less 12,000 lb. 14,000 lb. 16,000 lb. 18,000 lb.
80
10 4 3 2 1
800 3200 1000
100 400 600 40 160 800 30 120 1000 20 80 520 10 40 80
13,587,000 63,734,000

Ke~ky Desig~,
Kentucky Flexible Pavement Design is based on a modification of
the CBR method. Traffic is evaluated by the equivalent 5000~lb. wheel
load method (EWL). The pavement design curves are based on Kentucky's
experience, having been developed from the results of a comprehensive
study made by the Department of Highways in 1947 and 1948. These curves
have since been extended and modified to provide for the greater volumes
and weights of present and expected traffic. The curves in Fig. 1 show
the combined thickness of high-type macadam base and asphaltic-concrete
pavement required for certain CBR values and various traffic ranges.
Anticipated axle loads of 10,000 lb. and greater are converted to the equi
valent number of 5000-lb. wheel loads. A 10,000-lb. axle is equal to
one 5000-lb. wheel load, while a 12,000-lb. axle is equivalent to two
5000-lb. wheel loads and an 18, 000-lb. axle equal to sixteen 10, 000-lb.
axles. The table of equivalents was worked up by the California Depart
ment of Public Works and is generally accepted, Total 20-yr. antici-
pated traffic is calculated in EWL values.
The CBR method for determining bearing values of soil has been
modified for Kentucky use. This value is determined in the laboratory
for subgrade samples from the pt"oject.
Subgrade, subbase, and base !>amples from the WASHO test track
were tested in the Highway Department's testing laboratory by the Divi
sion of Materials. The sub grade soil was found to have a CBR of 5. 5
percent. The crushed- gravel base was found to be about equal in bearing
value to Kentucky macadam base, while the uncrushed-gravel subbase
had only 80 percent of the bearing value of the crushed material (tested

(J) w ::I:
2
0 4 z
1-.:" 6 z w ~ 8 w > ~ 10
0 z 12 <1:
w (J)
<1: ro I
(J) (J) w z ~
14
i 16
18 I
0 20 ") J: 1-
0 22 w z ro 24 ~ 0 0 26
MINIMUM LABORATORY C 8 R VALUE
3 4 5 6 7 8 9 10 20 ~0 4 o e 0 ,o 70 090 .00
~--~-----
--(,A) ----
v v ~ !---- -~--~ v 1-- f..---' Curve Limiting E WL v v ~ - (million) /
t-
/ v v v v v-- - lA Less than 112
(ii}_ / v v 1-- --- --- I Less than I
~ / / v --- II 1-2 -
L_ v v --- Ill 2-3
/ / ·" -- ---- w 3-6 -- -
~ ~ v / --- v 6-10
/ 1-" - ---- VI 10-20 // / --- VII 20-40 - t-
VL X // _/
/' -- ---- VIII 40-80 /® v/ -v -- IX B0-160 / ./ ---- X 160 -"320 t-
v/ ~ v / / --
/ ----------v v,...._ _/ / --v/ -~ /"
v/ / V...-= /
v/ v~ v"'
"/ . fv\
~---/"
vy
~/ PC' 1~5 ,.
Kentucky Department of Highways Materials Research Lob ora lory
FLEXIBLE PAVEMENT DESIGN CURVES
Fig. l. Kentucky Flexible Pavement Design Curves.

by the CBR method). Because of these evaluations, crushed-gravel
base thickness was determined in the designs on an equal basis with
macadam; while the subbase material, when used, was increased 25 per~
cent in thickness, to compensate fo!' its lower quality. Consideration in
the overall design was given for the 4~in. asphaltic concrete thickness
versus the 2-in. surface. The thickness required was lowered somewhat
for the 4-in. surfaced sections.
The pavement designs and failure estil:nations determined by the
Kentucky Department of Highways for the problems are shown in the
following tables. Table 4 contains the subbase designs for the first por-
tion of the prob tern.
TABLE 4. SUBBASE DESIGNS ~~----= -~-----~~------~.,......._--=--~
Pavement Component Single Axle Tandem Axle
(in.) Ts, ooo lb-.-··-zz,_4oo_!~~_g, ooo lb. 40,000 lb.
Surface 2 4 2 4 2 4 2 4
Base 4 z 4 2 4 2 4 2
Subbase 12 11 17 16 12 11 17 16 " --..
Total 18 17 23 22 18 17 23 22 ___......_,3 ______ _______.,-~~--
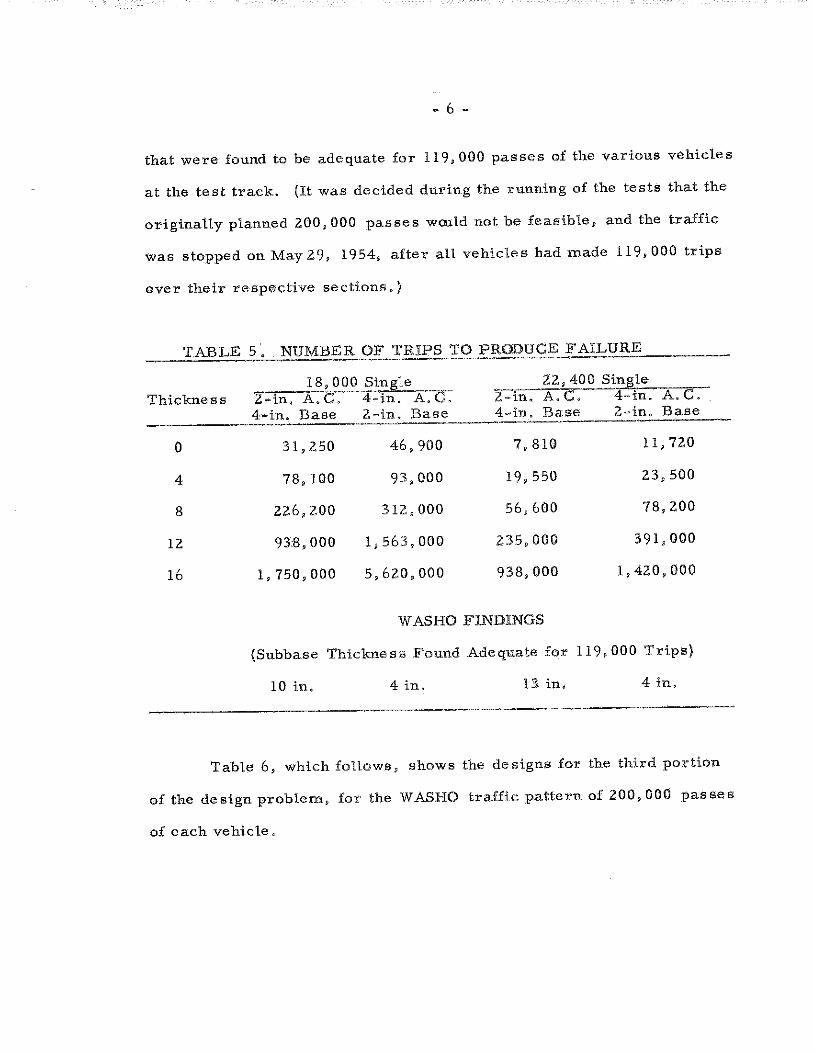
Table 5 below, presents the findings for the second portion, list-
ing the number of passes of the various vehicles which each of the pave~
ment designs used in the test track was calculated to withstand adequately.
These values were determined from the Kentucky flexible pavement design
curves. At the bottom of the table are listed the subbase thickness values
- 6 -
that were found to be adequate for 119,000 passes of the various vehicles
at the test track. (It was decided during the running of the tests that the
originally planned 200,000 passes wruld not be feasible, and the traffic
was stopped on May 29, 1954, after all vehicles had made 119,000 trips
over their respective sections.)
TABLE 5. NUMBER OF TRIPS TO PRODUCE FAILURE ' ' ·- :.==.;;:_c.;;;;;:_ ___ _
Thickness 18,000 Single
Z·in. A-:c-:--:;r::in. A.c: 22, 40 0 Single ·-,;--,.,.--
:;r:'in. A.C. 4-in. A.C.
4-in. Base 2.~in. Base 4-in. Base _____ __;:__;:c;;;c:_: ·-~-· ---·----
2-in. Base
0 31,250 46,900 7,810 11,720
4 78,100 93,000 19,550 23,500
8 226,200 312,000 56,600 78,200
12 93:8,000 1,563,000 235,000 391,000
16 1,750,000 5,620,000 938,000 1,420,000
W ASHO FINDINGS
(Subbase Thickness Found Adequate for 119,000 Trips)
10 in. 4 in. 13 in. 4 in,
Table 6, which follows, shows the designs for the third portion
of the design problem, for the WASHO traffic pattern of 200,000 passes
of each vehicle.

TABLE 6', PAVE:MEN'l' l),ESlGNS :Ji'G!l 'I'!li>TAL 'I'HlCKMESS (UI!ins Anr S.el~~>.eted Qogrroplllcl1e:Jlt l?liekael!ll}
Pavem.e:J\t <l:lllmp~neJI,t
(i:J\d
Bas.e
3
4
ll
3
6 4
3
6
13 -18 Zl 19
Fig, Z indic.ates. gr.aph.ically .the deroigas .l!elec.ted by each l'£ .tM
p~.ticipatl.ag agenciel! .£91 this pcn:tiq,a af .the p:e~b!em, i.a which the i:n•
dlyidl!lal thickll.esaea Q! atl cpmpl!lnents were 1e!t till the chc>i<.!,e 111£ the
de.~~:igne:r~ The Kel!.tncky tllltal thiekne.aroe!l wne made '!I.P e£ .tM e.Gm•
ponen~s already ~~~ in Ta'l;illil 6.
Tal:!t!!> 7 1 betQw, El.hows ib.e design$ fQr ~he cempP!iite traffic
patti!! tn!l Ul111ted l.n Table l) fe.r the .ihird porthm .~.J£ tne pl:'C!blem,
TAB:L)l: 7., . PAVEMENT. ~ESIGNS. :11'011. COJ\i!P0$!TE. 'I'ItMFtO PA'l'T.Ell.NS .
:Pave'm.ent QC!Impllflilijl!n~
(J):I,.J Pattel:'n Pa~e:t:n Pat~e:rn
Jci) PaUe:rn
Ia! {!) __ ,d)
z z~s Z,15 3
Bas.e z 4 4 6
5 7 Ul '**"'
11 zt tM.
9 13,5 16.75 zo

":! .... (IQ
N
<:'1:1 (D llJ ::r<: , .... (D 0 ~s AI (D (D ,_,;:; ro " .... 0 ij·O ~0 "' <1> 0 . m ,... 0
(IQ >;:l
0 ,....m <:d .... " en ~i;! 0 & s s or '0 .... r 0 ... I'TI)g ;::l rti (D 0.. -l<i ;J AII'TI ... c-..,.'<!
_s: ::r ...
""tJI'TI .... ::r CJ)2
~(D :e-l ;:l ('") (D 0
--I Ol I
-l:::t: Ol 0
:I:-
"'0 ==~ .. <1>
:!! " J>2
(D ~ CJ)I'TI
" .... :::t:Ul (D ;J oUl Ol(IQ
(D > 3: ,....(IQ l> <1> (D
~;:l -1
Cll () I'TI
0.. .... AI <1>
"""' l>
'<! H> r ..,.o Ul ::r" (D N o.,O roo ... .... a (IQO ;::l 0 (D
" ..
0 (JI
Thickness in Inches
0 (JI ro 0
ro (JI
(JJ
0 0 (JI
Thickness in Inches
0 (JI ro 0
ro (JI
MorTland T I T hlar:vVand I 11
Alabama I CJd North Caro inq I Colorado ro Washinaltm -
(JJ 0
Woslunof> n i 0 Colorado !» i
Pverfo Ri o 0 Alabama g Oelaware ~ Kentucky 1... 0 Colif"ornio Ill California l r Kenfuckv 1'-, ,..-1 Oe/oWQre I CA:l, Ill /Vorl"hCar Jina 1 ..!.. l> Pvt~l"fo Ric'p R Ul NewMex/cb I ~ (1)0 ~ Ne":Mexic 2 ArizOntll I I'TI Artzono I ~
I Wyom,;;;; T 3: W_yoming I ~ I'TI west v/iain Ia T l> l> West Vir.oi ~T I ~ l> TeJ<as _I . I~ ~ Te_xos . ,8 X MISS 0 ur/1 a I'TI MISS OUT/ CD ~
~ m CD N m • w.
Mqr_y/and I Maryland I Aloham<t I Wqshmgta I Norfh Carl> tina I North Core 1/n.q I Wa.shinof< n I ~ Kentuckv ~- ro Kentucky !<, o Arizona II ro.!'l Delaware I rJ,o Alabama - • .!!> Puerto R i o 1'\1 0 Callforl'lla g Arizona b; Colorqda r California NewMe~ricl:o I Ill New MexiCio i;! Pverfo Ri(jt> I :... Ul Colorado T 2 f)elaware 1 h z WyomiiiQ I IJ ~ West v,·rgi iq I l> ~ Wesf Vi~o1 ia I l> ""' Wvomin<t I ;ii I'TI < ~ ~
reurs . l ~ l> Tuqs . 1 ,g l> MisstJvNi I 0 X MIS.Soun I CD X
~ r r CD fl1 !J) I'TI
w -b -=

W ASHO FINDINGS
During the period from November, 195Z, through May, 1954,
the test track was subjected to 119,0()0 trips of the test vehicles on
atl t~;>st sections,
The minimum total thicknesses that were found to withstand
adequately the 119,000 vehicle passe~; in the outer wheel path, for the
2-in. surfacing of asphaltic concrete, were 16 in. for the 18,000 lb.
single axle, 19 in, for the 22,400 lb. single axle, 17 in. for the 32,000
lb. tandem; and ZO in. for the 40,000 lb. tandem,
In the inner wheel path, the 1~-in thick pavement sections were
undamaged by any of the four loading~. Comparable values found for
the 4-in. asphaltic concrete pavement, outer wheel path, H) in .. for
the first three loadings and 14 in. for the 40,000 lb. tandem .axle load.
For the inner path they were 6 in. for the two single axle loading and
10 in. for the two tandem axle loads.
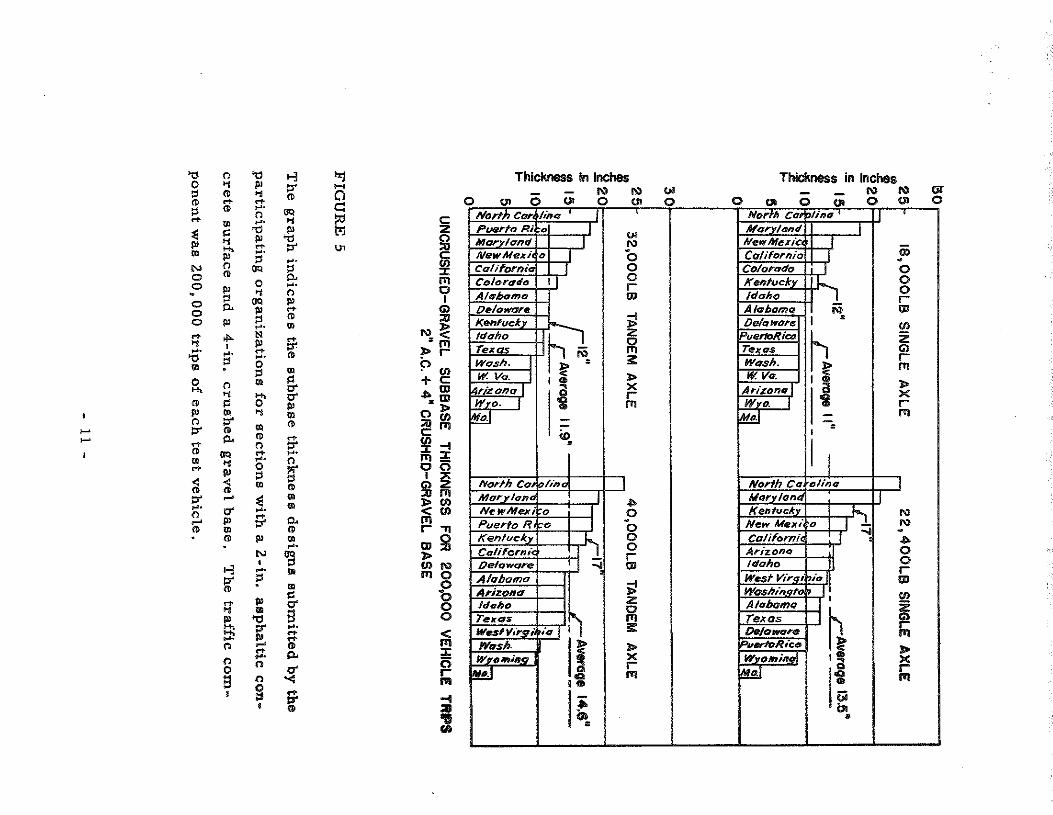
In the section of this report w}lich J'ollows, graphs are used to
present a comparison between the findings of the WASHO test and the
designs submitted by the participatin$ organizations. The Kentucky
designs are indicated on each of the graphs.
- 8 -
5- IB,OOOLB SINGLE AXLE - 22,400LB SINGLE AXLE 2
0 1--
r-16"
0
5-~ .--II" 1--' rAverage 12.3"
1--1-- - 0 J .-Average 10" --·"' ·~ .!!f-r-"' 0 ~ " I~ 0
I~ -~ ·~ 0 ~ •I-·~ "·- ~ 0 ~ .~ ~" .e • ~1}1--1-. " " ~ "' ~ ~ 0 ' ~ ~ ~
Q: " " ~ ~ 0 ·- £ 5-f >!e "' 0 ~~ 1-- ~~
, ~
,. 0 ·~ " ~ ~ ~~ ~"§ .., 0 ~~ lj ~~ ' !:',j' ... .., ~li ... .~....~ • ~~ ~ I~ l~ ~ •' ~s: til~ " ~ ~~ 8~ ~ ~~ ~ 0 ~ ... ~Q "'li\ ~ ~~ 'I( u "' ?~~~~ Cl. ~~
3 0
E~ 32,000LB TANDEM AXLE - 40,000LB TANDEM AXLE 2 ., 1! ~ 2 01--
f--1-- ..-16 .5
"' .. ., 1-_
51-r-11" J.
#Avera~e 13.4"
<:
~ 10 :E 1--
f- [Average 10.6" -• LJ 0
'.,'>I-~ 0 Q; • ·- 0 ° ~ 1.?
(.,J bt~" -.l(
5,~~~~~$!~~~%2~~~ f1 -Ei~ 0 0 ~ ~ 0 " .s ~ 1--~
~.: ~ 3 ~ ~ ~ ~ h 1i :.i ~ ~ ~ ~ 0
0
·~ ~ 0
~ " ~. "~ ' 0 0 -»1~ ... " -:: ~ '"' •• ~~ ~Q
fo ·-~ ··~ I) IJ I~ 1--~ ~ 0
" ~ 0 :s: ~ -2" ·~ ~<:: ·- "' ·~~ ... ~~ ~ ~ J " ~ "5~ ~ ... ~ • • < "'"' '1:- l: ... :
UNCRUSHED-GRAVEL SUBBASE THICKNESS FOR 200,000 VEHICLE TRIPS 4" A.C. + 2" CRUSHED GRAVEL BASE
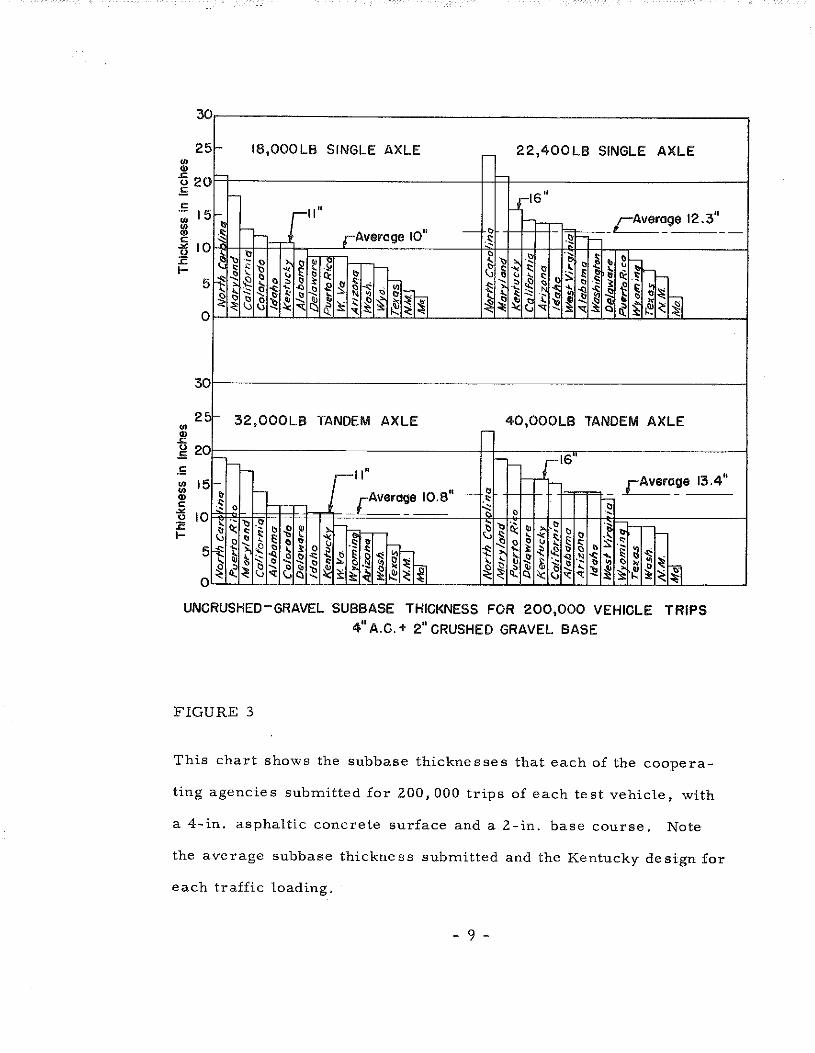
FIGURE 3
This chart shows the subbase thicknesses that each of the coopera-
ting agencies submitted for 200, 000 trips of each test vehicle, with
a 4-in. asphaltic concrete surface and a 2-in. base course. Note
the average subbase thickness submitted and the Kentucky design for
each traffic loading.
- 9 -

v~
25 18,000LB SINGLE AXLE 22,400LB SIN.GLE AXL..E
f-1- WASHO 4" r-16" WASHO 4"
15 I" f-1 "r=--~r:!ge J2.~'-f--e-~.1 J\, 0 ..
I -~•v •vv I ,, ~~~~ l"! I ~~~ '"' ~·. 1'-' ~ I~ ;:: I"' ~~ 1~1 1:!: IG
~ . . V
.25 f- 32,000LS TANDEM AXLE 40,000LB TANDEM AXLE r-
2v_ -tau
- WASHO 4" -f-_j WASHO .8" 1.5-
'- 11" ___LAver.pge .1$.4" c- I , ,(""""''u~v 10.8 - ,- --.-.--
10 ~ _d I~
a: ·~ 1-':' F ..
!1 0 ~ ~~~ ~ ~· .~ li~ l:: <:I >I§ I "' UNCRUSHED-GRAVEL SUBBASE THICKNESS FOR 200,000 V.EHI.CL..E :!"RIP$
4" A. C.+ 2" CRUSHED GRAVEL BASE
FIGURE 4
W ASHO adequate thicknesses for 119, 000 vehicle trips plotted on
chart showing designs submitted by the agencies for ZOO,OOO vehicle
trips. A 3-in. band 1-1/Z in. above and below the determined value
is shown.
~ 10 -
--
'1:1 0 ;:I
"' ;:I ... :;; Ill
"' N 0 0 . 0 0 0
..... .... .... '1:1
"' 0 .....
"' Ill (l .,. ,..,. "' m ... ~ .,. .... (l ,.... "'
(l .... "' ,..,. "' "' t= .... ~ (l
"' ~ 0.
Ill
>1>-1 ,.... ;:I
(l .... t= "' ~ 0.
OQ .... Ill
~ .... <:T Ill .. Ill
~
~ ::r I» s (l
(l
;
'1:1 Ill .., ... .... (l .... "' Ill ... 5"
OQ
0 ,., OQ
~ .... " Ill ... ,.... g .. 8' .... .. "' (l ... ,... 0 ;:I .. :;; .... s; Ill N • .... ;:I
10 .. "' ;:r !!. :::. n n g •
~ .,. "' OQ .... ~ .,. .... 5. .... (l
10 ... Ill
"' ... ::T
"' "' ~ Ill ., Ill
s; .... ~ "' .. ., 0.
"' .. ,... I§ .. "' ~ .... ... S" !l..
~ i
"1 ..... C'l c:: ::>;; t'l \J1
c :z £ ~ 11!
9 G> ;;lll
1\)~ •m
J>r ~(I> +C ~01
·~ ow ~11! !{!-I 11!;!; 00 .,. G>:Z ::011'1 )>(I> <VJ PI r"'!
01£ )> II) I\) PIO
~ 0 0
iii ~ Ill
i
Thickness In Inches - - 1\) 1\)
0 010 (J1 0 01 Norih CorJ;Jint:~ _j Puert-o Rico _j Maryland _j NewMexi(Jc __j California _j Colorado ~ Alahamo Delaware
;;; =
IVorfh Co!iohnc Marylon( NewMexko :---T Puerto R ~" I I K enfvckY! I J..
AFizona ltloho
~+.;~;.,--+,.-,J I
II "" I~
'
"' 1\)
b 0 0 r til
~ z ~ 3:
I
)> X r PI
~ 0 0 0 0 r til
~ z 0 PI 3: )> X r PI
(.pi
0
Thickness in Inches - - 1\) 1\)
0UIO(JI0UI Norlh CDJ Alo!:J:!.and NewMexiC4 California Colorado Kentuc!q_ Idaho Alabama De/a wore
r.:uei10Rim TII!)(OS
Wash. W.Va.
1//no
_j _j
1J,. l ;;;
I
h i !. I
11
•
Norlh Caf-olina
lJ _j
Maryland! , J l Ken tu clc:y I I 1-.
l -.I
Arizono Idaho
West V!Yq1£io Washin.qto. I Alabam11 Texas Delawt:u·e ~
~~~ ~ ~
01 . 0 0 0 r 01
!!.! z G> r ITl
)> )( r ITI
_j
1\) 1\)
~ 0 0 r til
U>
! )> X r ITI
(jl 0

j .E .. I 1-
25~ IS,OOOLB SINGLE AXLE r- 22,400LB SINGLE AXLE
r-1- WASHO 10" riT
WASHO 13" 15
1 12" 1- 13.5~
1-r-r-.:1. Average II~ - ~ 10
I~ r-
·~ :~ 11 I~
I~ 5
.~ ] ; I~ ~. ~~· Iii 0
~v
25 3 2,000LB TANDEM AXLE 40,000LB TANDEM AXLE -~v r
1-t--t ·•~v• ov I(' -~--- r-17' 14'
14.6":J 1 12" 1-' 15r~ 11.9'~
~ 10 !l
~~~~
li -::-r- I~ ti? ·"
5~ ~ll I~ _lj
11~ li ·~ I~ 1~11 ~ 'I( ~ v
UNCRUSHED-GRAVEL SUBBASE THICKNESS FOR 200,000 VEHICLE TRIPS 2" A.C.+ 4" CRUSHED-GRAVEL BASE
FIGURE 6
WASHO adequate thickness for 119,000 vehicle trips is plotted here
on the chart which shows de signs for 200, 000 trips. The average
thickness submitted and the WASHO findings are each shown by a
horizontal line,· and the shaded area represents a band of 1-1/2 in.
on each side of the test-determined thickness.
- 12 -
- 13 -
The Kentucky Department of Highways welcomed the oppor
tunity to participate in the design correlation study and to evaluate itEI
design method in the light of the controlled traffic and performance
data. The results of the road test and o£ the companion studies have
been most helpful in evaluating Kentucky procedures and will un
doubtedly aid in future Kentucky flexible pavement designs.
Recommended