The Application of Genetic Algorithms to
Parameter Estimation in Lead-Acid Battery
Equivalent Circuit Models
Thesis submitted in accordance with the requirements of
the University of Birmingham for the degree of Master of Philosophy
in
School of Electronic Electrical amp Computer Engineering
by
Shen Guo
May 2010
University of Birmingham Research Archive
e-theses repository This unpublished thesisdissertation is copyright of the author andor third parties The intellectual property rights of the author or third parties in respect of this work are as defined by The Copyright Designs and Patents Act 1988 or as modified by any successor legislation Any use made of information contained in this thesisdissertation must be in accordance with that legislation and must be properly acknowledged Further distribution or reproduction in any format is prohibited without the permission of the copyright holder
1
to my parents
2
Acknowledgements
First and foremost I would like to express my sincere appreciation to my
supervisors Dr Stuart Hillmansen and Dr Jihong Wang for their support
guidance inspiration and patience during my MPhil study I have greatly
benefited from their knowledge and experience
I am also grateful to Dr Jianlin Wei and Dr Nan Jia for their support and advices
during my research and to Dr Leonid Shpanin for his assistance in my laboratory
experiments Many thanks to Mr Bo Fan Mr Shaofeng Lu and Mr Lei Chen for
their valuable ideas shared with me I would also like to thank Mr Hao Sun Mr
Xing Luo as well as all the other colleagues for their discussions and their kind
assistant during my study
Finally I would like to thank my family and all my friends Without their
encouragement support and understanding this thesis would not have been
possible
3
Abstract
Batteries are becoming increasingly important to our life as they are applied in a
range of different areas Therefore the reliability of battery is a critical issue in
these battery applications It has been noticed that most batteries have limited
cycle durability that is the total capacity drops when a battery is charged and
discharged for a number of cycles If a battery is too weak to offer sufficient
energy it should be replaced at the right time But current problem is that there is
no reliable method available to quantify the capacity loss and to estimate whether
the remaining capacity of battery Complete discharge which is the only way of
capacity estimation has a negative effect to the battery plates therefore it cannot
be used too frequently
This thesis summarises the research work in the development of the battery status
estimation algorithm The work initially focused on the mathematical descriptions
of lead acid batteries and a mathematical model based on this study was then
developed and implemented to describe the process of battery discharge Genetic
Algorithms (GAs) were used as a tool to identify the parameters related to the
battery including the internal resistances state of charge and capacity The
relevant simulation results show that the model is able to adequately simulate the
battery discharge process
The aforementioned models were extended to a further investigation of the
batteries state of health It was noticed that there is a link between the status of
4
battery health and the internal resistance In this project six batteries were
discharged and charged in several times in order to simulate the capacity loss that
occurs in normal operation This capacity loss is related to the state of health and
the parameter estimation was able to adequately distinguish between different
state of health
These results indicate that the internal resistance increases when the state of health
of a lead-acid battery decreases This progress is at first very slow when the
battery is new but the change becomes faster when the remaining capacity of
battery drops to about 75 of the initial It is found in the thesis that the value of
internal resistance is increased by 25 approximately when the state of health is
brought down to about 50 meaning that the battery cannot offer enough energy
as new and should be replaced for safety consideration
The method described within this thesis performed adequately in the limited tests
performed during the experimental work Further investigations are recommended
in order to refine the method which is potentially suitable for online
implementation in battery condition monitoring systems
5
Contents
Chapter 1 Background and Objectives of the Project 1
11 Overview 1
12 Review of Energy Storage Systems 2
121 Applications of the Energy Storage Systems 2
122 Review of the Existing Energy Storage Devices 4
123 Review of Batteries 7
124 The Management of Batteries 11
13 Project Objectives 12
14 Outline of the thesis 13
Chapter 2 Introduction of Lead-acid Batteries 15
21 A General Overview of the Lead-acid Battery 15
22 Configuration of Lead-acid Batteries 18
221 Electrochemical Principles 18
222 Lead-Acid Battery Types and Technologies 20
223 Battery Designs for Different Applications 22
23 Mathematical Descriptions of Lead-acid Batteries 23
231 Capacity 23
232 Electromotive force 24
233 State of Charge and Depth of Charge 26
234 Internal Resistance and State of Health 27
235 Multi-Cell Lead-Acid Batteries 29
24 Summary 29
6
Chapter 3 Equivalent Circuit Modelling of Lead-acid Batteries 31
31 Requirements for the Battery Model 31
32 Overview of Battery Model Techniques 32
321 Electrochemical Model 32
322 Physical Models 33
323 Equivalent Circuit Model 34
324 Discussion of Different Battery Model Methods 35
33 Introduction of the Existing Equivalent Circuit Models 37
331 Simple Battery Model 37
332 Advanced Simple Battery Model 39
333 Thevenin Battery Model 40
334 Dynamic Battery Model 42
335 Fourth Order Dynamic Model 43
336 Improved Battery Model 44
34 Mathematical Model of the Lead-acid Batteries 44
341 Capacity 45
342 Electric Networks 48
343 State of Charge and Depth of Discharge 50
344 Electromotive Force of the Battery 50
345 Internal Resistance of a Battery 51
346 The Behaviour of Parasitic Branch 52
347 Main Branch Capacitance 53
348 Thermal Behaviour of a Battery 55
35 Mathematical Model of the Lead-acid Batteries 56
7
36 Summary and Discussion 57
Chapter 4 Experimental System Set up and Improved Battery Model Simulation
Implementation 59
41 The Experimental System 59
42 Improvements of the Battery Model 61
421 The Change of τ in Different Charge Status 63
422 Analysis in Variations of the Internal Resistance 64
423 Improved Lead-Acid Battery Mathematical Model 66
43 Simulation Study 68
44 Summary and Discussion 72
Chapter 5 Model Parameter Identification and Model Validation 73
51 Need for the Optimization Algorithms 73
52 Overview of the Optimization Algorithms 74
53 The Study of the Genetic Algorithms 77
531 Working Principle of GAs 77
532 Simulation Studies of Genetic Algorithms 81
54 Model Parameter Identification 87
541 Implementation of Genetic Algorithms and Experimental Data sets
87
542 Parameters of Battery Model 90
543 Battery Model Validation 92
55 Summary and Discussions 95
Chapter 6 The Analysis of State of Health (SOH) in association with the Internal
Resistance 97
8
61 Methodology 97
62 The identification of C0 R00 and R10 100
63 Summary and Discussions 108
Chapter 7 Conclusions and Future Research 110
71 Summary 110
72 Limitations 111
73 Future Research Works 112
9
List of Figures
Figure 1-1 Power density vs energy density plot 7
Figure 2-1 Working Principle of Lead-Acid Batteries (a) shows the battery when
discharging and (b) is when charging with a DC charger 18
Figure 3-1 Simple Battery Model 38
Figure 3-2 I-V chart of the Simple Battery Model 39
Figure 3-3 I-V Chart in different SOC 40
Figure 3-4 Sketch to show battery discharge behaviours in typical tests 41
Figure 3-5 Thevenin Battery Model 42
Figure 3-6 Fourth-order Battery Model43
Figure 3-7 Improved Battery Model 44
Figure 3-8 Battery Capacity vs Discharge Current 47
Figure 3-9 Lead-acid Battery Equivalent Network 48
Figure 3-10 The Equivalent Network with the Approximated mZ 49
Figure 3-11 R-C block 53
Figure 4-1 Equivalent Circuit of the Experimental Test Rig 60
Figure 4-2 Experimental Test Rig61
Figure 4-3 Test of constant-impedance load discharge 62
Figure 4-4 Test of two-load discharge 62
Figure 4-5 Structure of model for SIMULINK Implementation69
Figure 4-6 Terminal Voltage of Battery 71
Figure 5-1 Flowchart of a Simple Genetic Algorithm78
Figure 5-2 2-dimensional Rastrigins function83
Figure 5-3 Contour plot of Rastrigins function84
10
Figure 5-4 GA performance (Rastrigrinrsquos function) 85
Figure 5-5 2-dimensional Rosenbrock function 86
Figure 5-6 GA performance (Rosenbrock function) 87
Figure 5-7 Progress of Parameter Identification 88
Figure 5-8 Measured and Simulated Result after Parameter Identification 91
Figure 5-9 Mean and the Best Fitness Values in Each Generation 92
Figure 5-10 Measured and Simulated Terminal Voltage 93
Figure 5-11 Measured and Simulated Terminal Voltage 94
Figure 6-1 Experimental and Simulated Terminal Voltage of Test 1 (SOH = 100)
102
Figure 6-2 Experimental and Simulated Terminal Voltage of Test 2 (SOH=9314)
103
Figure 6-3 Experimental and Simulated Terminal Voltage of Test 3 (SOH=7889)
104
Figure 6-4 Experimental and Simulated Terminal Voltage of Test 4 (SOH=7019)
104
Figure 6-5 Experimental and Simulated Terminal Voltage of Test 5 (SOH=6354)
105
Figure 6-6 Experimental and Simulated Terminal Voltage of Test 6 (SOH=5306)
106
Figure 6-7 Change of Internal Resistance in Different State of Health (Battery 1)
107
Figure 6-8 Change of Internal Resistance in all 6 Batteries 108
1
Chapter 1
Background and Objectives of
the Project
11 Overview
Fossil fuels have been the main energy resource in recent human history although
their continuing use has been shown to have a detrimental effect on the
environment The principal problem for fossil fuels is that they cannot be
reproduced within a short period of time so it is a finite energy supply source If
current consumption rate continues they will be exhausted in a few generations
from now Fossil fuel has never been considered as a clean-resource because there
is an emission of noxious gasses including CO CO2 NOx SOx and HC into the
atmosphere With all the pressure from the problems associated with the fossil
fuel exploration of the usage of renewable energy is becoming an increasingly
important issue
Wind energy hydro energy and solar energy are three of the most important
renewable energy sources and they have been implemented on a large scale wind
energy has produced a annual global total of 65019 times 1012 Wmiddoth
(74223 MWtimes24htimes365 days) (Anon 2006) energy in the year 2006 and hydro
2
energy is about 304 times 1015 Wmiddoth (30404 times 1012 Wmiddoth) (Anon 2007) Solar energy
resources are estimated at about 10694times1015 Wmiddoth (3850times1021 J) (Smil 2007) To
compare with the worldwide energy consumption of 13097times1015 Wmiddoth in the year
2007 it is clear that renewable energies have a significant role to play (Anon
2007)
However the problem of the implementation of the renewable energy is that the
electricity generated is intermittent and the power systems are experiencing the
problem of rapidly changing power demand Therefore the management of the
energy is an important issue Devices of energy storage should solve these
problems in theory
12 Review of Energy Storage Systems
Not only giving a large scale energy solution energy storage devices are also
commonly used in a range of applications related to everybody Different energy
storage technologies are suited to different applications and consideration must be
made in order to select the correct solution for each application This section will
give an overview of the existing energy storage systems
121 Applications of the Energy Storage Systems
Large scale energy storage systems which are also called grid energy storage
refer to the methods used to large-scale store electricity within an electrical power
grid Off-peak energy is stored during times when production (from power plants)
3
exceeds consumption and the stores are utilized at times when consumption
exceeds production In this way electricity production need not be drastically
scaled up and down to meet momentary consumption ndash instead production is
maintained at a more constant level
Despite the applications in grid scale the energy storage systems are also popular
in a number of areas For example they are usually used to optimize the energy
generated from the engine in modern electrical hybrid vehicles One such
application is in a shunter locomotive A shunter is a small railroad locomotive
intended for assembling trains ready for a road locomotive to take over
disassembling a train that has been brought in and switching a train to another rail
at the rail terminals The duty cycle of a shunter is characterised by short duration
high power demands (accelerating a rake of vehicles) and the long periods of
idling while the train waits for other operations Comparing to traditional shunter
locomotive that use diesel engines only for the whole duty cycle hybrid shunter
locomotives with energy storage devices can have a 40-70 reduction in fuel use
(RailPower Hybrid Technologies nd) This saving is made by operating the prime
mover at its optimum
Another application of energy storage in the vehicle technologies is the
regenerative braking system which is used to save the braking energy of vehicle
The potential of this technology to save energy for a vehicle is depends on the
duty cycle (Lu Meegahawatte et al 2008) which is characterized by storing the
energy generated when the vehicle is decelerating and releasing when accelerating
4
Energy storage devices are also very popular in stationary applications also
known as the Uninterruptible Power Supply (UPS) systems This system is
designed to meet the power demand when problems like power failure happen and
it is important especially in the applications where power failures could have
serious consequences for example in hospitals and computer centres (Berndt
2009)
The energy storage devices in the UPS system are often used to achieve
ldquouninterruptiblerdquo in a short period before the secondary power supply started
When a power problem occurs the energy storage device starts to supply
electricity immediately and at the same time the generator begins to start When
the generator is ready to supply sufficient power the energy storage device stops
providing power When the grid power is recovered the energy storage device can
be recharged until full
122 Review of the Existing Energy Storage Devices
There are various kinds of energy storage systems including pumped hydro
compressed air flywheel supercapacitors electrochemical and also
superconducting magnetic Each technology is suited to different applications and
careful consideration must be made in order to select the correct solution for each
application
Pumped hydro is the oldest and the most effective kind of large scale energy
storage method which have been used for nearly a century since 1929 (Juvonen
5
2003) Two large reservoirs at different altitudes with a pump a turbine a motor
and a generator are employed to collect the off-peak energy The water is released
from the higher one through a turbine to generate electricity during peak load
period
Compressed air is a pneumatic energy storage method that refers to the air kept
under a certain pressure This system can be used in grid energy storage that the
air can be stored by compressors during periods with low power demand This
compressed air can be released to a generator to meet the high power demand
during peak time (Glendenning 1981 Ter-Gazarian 1994 Juvonen 2003) In some
applications the compressed air is released through a combustor mixed with
natural gas to obtain a higher overall efficiency
A capacitor is an electrical device that can store energy in an electric field
between a pair of conductors and is often used in circuits for short term energy
storage It blocks the circuit to hold DC voltage Supercapacitors are energy
storage devices with the same principle but with a higher energy density The
power density of the supercapacitor systems can be very high but the energy is
often released in a very short duration (Ter-Gazarian 1994) As a result the
supercapacitors are usually used in applications of an energy burst
Superconducting magnetic energy storage system stores energy in the magnetic
field generated by direct current in a coil Instead of traditional wires like copper
superconductors are employed to avoid the energy consumptions as heat because
of the resistance A problem is that the optimal operating temperature for
6
superconductors is 50-77K a refrigerator is therefore necessary in the system for
cooling down
Flywheels are considered as a method of storing mechanical kinetic energy by
accelerating a flywheel to a very high speed to store the energy and decelerating
to release the energy Flywheels are very efficient for short duration storage cycles
due to their fast response speed These energy storage devices are used mainly in
applications that demand kinetic energy storage and high numbers of deep
discharge cycles
Electrochemical energy storage stands for the device capable of converting
chemical and electrical energy to each other by chemical reactions Batteries are
the most common technology of electrochemical energy storage methods The
oxidation and reduction reactions in the two electrodes of battery lead to the
current through the external circuit when discharging to provide energy The
secondary battery can be recharged by applying electrical current which reverses
the chemical reactions that occur during the discharge
Fuel cell is another technology with very high energy density that converts the
chemical energy in a source fuel into an electrical current The fuel cells are
considered as the ldquoenvironmental friendlyrdquo as the only by-product is water The
working principle of fuel cells when discharging is the same as the batteries but
unlike the batteries the fuel cells do not need recharge as they only provide
electrical energy while the active chemicals are supplied to the electrodes (Mantell
1984 MPowerSolutionsLtd nd)
7
Figure 1-shows the Ragone chart of the energy and power density of some energy
storage systems
Figure 1-1 Power density vs energy density plot (MPowerSolutionsLtd nd)
123 Review of Batteries
The preceding discussion has identified that energy storage devices are becoming
increasingly important in both stationary and mobile applications Battery as the
most popular energy storage device is studied in this section
There are two different types of batteries applied in a large range of areas now
Primary batteries and Rechargeable batteries Primary batteries which are also
called disposable batteries often have higher energy densities than the
rechargeable ones and they have a lower self-discharge (Ter-Gazarian 1994)
8
However as the chemical reactions in these batteries are not reversible and the
active materials cannot be restored to their initial forms these batteries cannot be
reliably recharged The primary batteries are intended to be used once and then
discarded therefore they are not suitable for the energy storage systems
Rechargeable battery is the other type of the electrochemical batteries which is
also known as secondary battery because their electrochemical reactions are
electrically reversible There are many different rechargeable battery technologies
in which only four of them are leading the world market nickel-cadmium nickel-
hydride lead-acid and lithium-ion (Berndt 1993 Berndt 2009)
The Nickel-cadmium (NiCd) battery is a kind of rechargeable battery that uses
nickel oxide hydroxide and metallic cadmium as electrodes and an alkaline
electrolyte (often potassium hydroxide) (Mantell 1984) As designed to compete
the primary batteries the NiCd batteries are often manufactured in the same size
and they are used in the consumer market as primary batteries for example in
clocks toys radios and cordless tools However when the NiCds are substituted
for primary cells the lower terminal voltage and smaller ampere-hour capacity
may reduce performance as compared to primary cells The most attractive feature
of the nickel-cadmium batteries is that they are more difficult to damage
comparing with other batteries during deep discharge cycles They can also
sustain more cycles and the lower internal resistance can also help achieve a
higher maximum discharge rate A problem preventing the large scale application
of this battery technology is that the nickel-cadmium batteries suffers faster self
discharge rate than other rechargeable batteries and the cadmium used as the
9
active material in one of the electrodes is toxic and expensive (Zhang Liu et al
2010) Furthermore the capacity loss caused by the continuously discharge and
recharge to the same state of charge called ldquomemory effectrdquo is also a very
important issue of the nickel-cadmium batteries (Sato Takeuchi et al 2001)
The nickel-metal hydride (NiMH) battery is a type of secondary electrochemical
battery that designed to substitute for the nickel-cadmium cells They have a
similar size and a similar cell voltage but with more advantages By using
hydrogen-absorbing alloy as negative electrode instead of cadmium this
electrochemical technology is considered as ldquoenvironmental friendlyrdquo because of
the absence of toxic cadmium (Berndt 1993) The nickel-metal hydride batteries
also have low internal resistance and the high cycle durability as the NiCds and a
NiMH battery can have two to three times the capacity of an equivalent size
nickel-cadmium battery However the nickel-metal hydride batteries also have a
similar high self-discharge rate as the nickel-cadmium batteries (Lee Lee et al
1996) and it also cannot afford complete discharges Memory effect from
repeated partial discharge can occur in a NiMH battery but this is reversible
through charge cycling (Berndt 2009)
The lead-acid batteries are the oldest type of rechargeable battery with a history of
over 150 years but they are still the most popular battery chemistry for
applications such as engine starting or backup power systems as there is no
cheaper alternative when weight is not a factor This technology uses lead and
lead dioxide as electrodes and an acid electrolyte of sulphuric acid and the
advantage of this configuration is that the electrolyte takes part in reactions of
10
both electrodes and both electrodes turn into lead sulphate when discharging
(Berndt 1993 Berndt 2009) The lead-acid batteries can be designed for not only
deep discharge cycles but high discharge rate or compromise of the two cycles
They have a lower self-discharge rate compared with the nickel batteries and they
also do not suffer from the memory effect (Mantell 1984 Berndt 2009) However
as the energy density of lead-acid battery is not high it is seldom applied in the
portable electronics Another important problem is that the lead-acid batteries
must be recycled as the active material ldquoleadrdquo is toxic to both the environment and
the human bodies (Bernardes Espinosa et al 2004)
The lithium-ion (Li-ion) batteries are almost the perfect cell chemistry and are
currently used a wide range of consumer electronics products including cameras
cell phones laptops etc They have many attractive performance advantages
which make them also ideal for higher power applications such as automotive and
standby power First of all the lithium-ion batteries have the highest energy
density in all the rechargeable battery now which is about 4 times better than
lead-acid (Jacobi 2009) They are also capable for deep discharge and high
discharge rate with a relatively slow self discharge There is no liquid electrolyte
in the lithium-ion batteries which means they are immune from leaking However
just opposite to the lead-acid batteries the most serious problem that discourages
the lithium-ion batteries is the low economic efficiency comparing with the lead-
acid batteries Other factors like the stability of the chemicals and the recycling of
lithium should also be concerned because of the chemical activeness of lithium
Table 1-1 is gives some basic properties of the four major rechargeable batteries
11
introduced above There are also some less common battery chemistries used by
rechargeable batteries in addition to these technologies including nickel-zinc
(NiZn) nickel-iron (NiFe) etc but they have a small market share For the four
major battery chemistries lead-acid batteries with their low price and high
flexibility is adopted in a wide range of application areas
Table 1-1 properties of the rechargeable batteries (Wikipedia nd)
Type Voltage
(V)
Energy Density (Whkg)
Power Density (Wkg)
Self Discharge
rate
Cycle Durability
Nickel-Cadmium
12 40-60 150 20 1500
Nickel-Metal-Hydride
12 30-80 250-1000
20 1000
Lead-Acid 21 30-40 180 3-4 500-800
Lithium-ion 36 160 1800 5-10 1000-1200
124 The Management of Batteries
In the areas that batteries are employed as the energy storage device it is a critical
issue to consider that whether there is enough energy in the battery to meet the
demand However batteries do have the problem in limited cycle durability that
is when a battery is charged and discharged for a number of cycles its total
capacity decreases If the battery cannot offer sufficient powerenergy it should be
replaced at the right time But the problem is that it is difficult to quantify the
capacity loss and when the capacity of battery is no longer sufficient for a
particular application Due to the limitation of batteries it is essential to develop a
method to determine the capacity of battery that subjected to various duty cycles
in a number of applications
12
13 Project Objectives
The main objective of the project is to develop a method which can determine the
key parameters of batteries from the discharge tests The proposed methodology is
a model based approach that is to develop a mathematical model of the battery
which can represent the dynamic performance and battery status and
characteristics can be investigated through the analysis of the model
The first step of the project is to build a mathematical model of battery The
dynamic model is expected to reflect the relevant behaviours of battery when
being discharged including the characteristics of State of Charge Depth of Charge
Electromotive force Terminal Voltage The unknown parameters in the model are
identified by using Genetic Algorithms (GAs) with the laboratory experimental
data Afterwards some batteries are tested in experiments and the parameters in
different state of health are recorded to analyze the battery in different status of
battery
The focus of this work is to develop a suitable method for parameter identification
for common battery systems The lead-acid battery has been chosen because it has
relatively well defined properties and there is a wealth of literature describing the
performance of these types of batteries From an experimental view point they are
also readily available of low cost
13
14 Outline of the thesis
The thesis is organized into seven chapters and the first chapter presents the
background and motivation of the research project The remaining chapters are
briefly described as follows
Chapter 2 gives an overview of lead-acid batteries including the development
working principle and also some modern battery designs and technologies In the
second part of chapter 2 important concepts for a battery including electromotive
force capacity state of charge internal resistance and state of health are
introduced and some mathematical descriptions of these concepts are discussed
Chapter 3 starts from some requirements of the mathematical model designed for
this project and several different methods of battery model approaches are
discussed Afterwards some details of the dynamic mathematical model are
analyzed The initial battery model is described in the last part of this chapter that
summarized the equations of the battery
Chapter 4 is mainly focused on some improvement of the mathematical model
described in chapter 3 In the first section of chapter 4 the experimental test rig in
the project is introduced Some findings in the experimental tests is then listed and
studied and integrated into the improved model Finally the SIMULINK
implementation and a simulation study are given
Chapter 5 presents a method of model parameter identification The principle of
14
Genetic Algorithms is studied at first Then this algorithm is employed in the
model and the parameters of the model are identified with the help of
experimental tests This chapter also includes the validation of battery model
using two other groups of test results
Chapter 6 develops an algorithm that can reflect the state of health of a lead-acid
battery In this chapter the internal resistance parameters are measured under
different state of health through a group of continuous experimental tests The
change of internal resistance under a specific working condition is then related to
the battery state of health
Finally Chapter 7 gives a summary and the conclusions of the project Also the
future works that can be improved are proposed in this chapter
15
Chapter 2
Introduction of Lead-acid
Batteries
This chapter gives an overview of lead-acid batteries including background
knowledge working principles explanation of terminologies technologies and
applications encountered for this technology The chapter presents the
fundamental knowledge and prepares for the project work to be reported in the
following chapters
21 A General Overview of the
Lead-acid Battery
The lead-acid battery is the oldest type of rechargeable battery The first example
of a lead-acid battery can be attributed to the German physicist Sinsteden who
published the performance data of this battery system in 1854 (Berndt 1993)
Later in 1859 the French physicist Planteacute realized that a plate construction was
required to achieve a much larger effective surface area and he produced the first
rechargeable battery which was marketed for commercial use by alternately
charging and discharging lead sheets immersed in sulphuric acid This method
has remained unchanged and still in use today in stationary applications (Berndt
16
1993 Wikipedia nd) One of the first applications of lead-acid batteries was for
storing electrical energy for telegraphy systems The capacity required for these
applications was low and the battery at that time was not yet suited to high power
industrial applications (TNI_Ltd 2007)
In 1880 a French chemical engineer Faureacute significantly improved the design of
the lead-acid battery by producing the active materials separately His method was
to coat the lead plate with a paste of lead oxides sulphuric acid and water in a
warm humid atmosphere The paste then changed into a mixture of lead sulphates
which adhered to the lead plate as an electrochemically active material As a result
of this technology the Faureacute cells are able to achieve much higher capacity with
the first charge in comparison with the Planteacute ones (Berndt 1993 TNI_Ltd 2007)
The problem of these plates is that they are not very durable and become weak
only after a few dischargecharge cycles The lead grid alloyed with antimony or
calcium was developed to improve the mechanical characteristics The holes on
the grid are able to achieve improved bonding thus the batteries may have a longer
lifetime This advantage led to the industrial manufacturing of lead-acid batteries
In 1881 a lead electrode with a ribbed surface was designed in order to have a
large effective surface of the active material and this was the pioneer of the large
surface plates which are still common today (Berndt 1993 TNI_Ltd 2007
Wikipedia nd)
In the beginning lead-acid batteries were operated in open jars The advantage of
this feature was that the electrode can be cleaned and exchanged easily but faced
the problem of water evaporation Therefore the early batteries have to refill water
17
in order to continue normal use However this problem can be dramatically
reduced when the cells were fitted with covers to limit the evaporation (Berndt
1993) This kind of battery design is known as a lsquoflooded lead-acid batteryrsquo
In the 1950s a new type of battery which was aimed to become spill-proof was
designed and manufactured on a large scale This type of battery is characterized
by an immobilized electrolyte however this kind of spill-proof battery was only
manufactured in small sizes up to about 10 Ah (Berndt 2001) Later the
combination of a valve improved the characteristic features of the lead-acid
battery and this kind of battery is still common today and is known as the Gel
Lead-acid battery (Berndt 1993) In the 1970s micron diameter glass fibres
originally designed for air filters were used in glass mats which absorbed the
electrolyte and acted as separator Soon this kind of Absorbent Glass Mat (AGM)
battery appeared in market for stationary application
Currently Valve Regulated Lead Acid (VRLA) batteries based on both AGM and
Gel electrolytes are available in a large range of capacities for both stationary and
mobile power applications with a range of different designs for each type of
application Arguably the most important application of lead-acid batteries is for
vehicle engine starting The battery employed in this application which is called
Starting Lighting and Ignition (SLI) batteries are designed to deliver bursts of
energy usually in a discharge current as large as several hundred amperes in a
very short time A different type of battery construction can produce batteries
capable of deep cycling which are more suited to slow discharge cycles (Tuck
1991 Anon 2007)
18
22 Configuration of Lead-acid Batteries
This section gives a brief description of the working principles of lead-acid
batteries and how the battery can be configured to suit different applications
221 Electrochemical Principles
The lead-acid battery comprises two electrodes and the electrolyte The structure
of the lead-acid battery is shown in Figure 2-1 in which one electrode is Cathode
and the other is Anode The active matter in the positive plate is made of lead
dioxide (PbO2) and that in the negative plate is made of lead (Pb) and the
electrolyte is sulphuric acid One electrode can serve either as a Cathode or as an
Anode depending on which process the battery is experiencing - charging or
discharging With this structure a battery could convert electrical energy into
chemical energy and back again which is associated with the process of charging
and discharging
(a) (b)
Figure 2-1 Working Principle of Lead-Acid Batteries (a) shows the battery when
19
discharging and (b) is when charging with a DC charger
For the discharging process as shown in Figure 2-1 (a) the negative plate acts as
the anode and the positive plate is the cathode If a wire is connected between the
two the excess electrons from the anode will travel through the wire as a current
to the cathode where they are needed to complete the electron deficient reaction
there The chemical reactions in a lead-acid battery when discharging are
described as follow
Negative plate reaction (Anode)
+minusminus+rarrminus+ HPbSO2eHSOPb 44
Positive Plate reaction (Cathode)
O2HPbSO2e3HHSOPbO 2442 +rarr+++minus+minus
For the charging process an external power source is connected to the two
electrodes with the voltage as shown in Figure 2-1(b) In this way the flow of
electrons is forced backwards against the electropotential and the reactions are
driven backwards changing the lead sulphate back into lead and lead dioxide on
the negative and the positive plates and restoring the sulphuric acid to the liquid
electrolyte The anode when a battery is charging is the positive plate and the
cathode is the negative plate and the chemical reactions in a lead-acid battery
when charging are described as
Positive plate reaction (Anode)
+minusminus++rarrminus+ 3HHSOPbO2eO2HPbSO 4224
Negative plate reaction (Cathode)
minusminus++rarr++ 44 HSOPb2eHPbSO
20
The thermodynamic heat effects caused by the reactions are small in the lead-acid
battery because the difference between the enthalpy and the free enthalpy is very
small The rate of reversible heat effect in the reaction is 132 kJ per mol of the
cell reaction which corresponds to about 35 of the total energy converted when
the lead-acid battery is discharging or charged This amount of energy is relatively
small and is generated over a comparatively long period of time so it is usually
easily dissipated through radiation and convection (Berndt 1993)
222 Lead-Acid Battery Types and Technologies
The flooded battery is the simplest type of lead-acid battery in use Flooded
batteries are common for some traction applications despite the requirement in
high maintenance They are also very common for large capacity backup power
supplies for telecommunication computer centres grid energy storage and off-
grid household electric power systems Since the flooded batteries are not sealed
they must be kept upright to avoid acid spills and water must be periodically
added to top up the liquid electrolyte The most attractive feature of the flooded
battery is that they are able to withstand certain level of overcharging without
damage providing proper maintenance is carried out
The Valve Regulated Lead-Acid (VRLA) battery which is often colloquially
called the sealed lead-acid battery is becoming more and more popular in many
applications Because VRLA batteries are mostly sealed the electrolyte
evaporation will be reduced and spillage can be largely avoided when
overcharging which are very common in flooded batteries The electrolyte of the
21
VRLA battery is designed to be immobilized so the VRLA batteries will not leak
if inverted pierced or if the container is broken They can be mounted in any
orientation and position even immersed in water The immobilization of the
VRLA electrolyte can be achieved by using an absorbent mat separator as well as
gelling materials
In Absorbent Glass Mat (AGM) battery the electrolyte is absorbed into a mat of
fine glass fibres in order to immobilize the electrolyte In addition the pores in the
mats are fine enough to prevent the lead dendrites in the cathode from growing
through as a separator and only glass is wetted enough by sulphuric acid can soak
the separators The glass mats can therefore be used to insulate the electrodes
Gelling is another way to immobilize the electrolyte and this gelling technology at
present is only applied for lead-acid batteries The idea is to mix the sulphuric acid
with silica fume (SO2) which makes the electrolyte gel-like The mixture is stable
over a long term environmental safe and easy to work technically (Berndt 1993)
The sulphuric acid bound by the gel can also insulate electrodes as a separator
similarly with that in an AGM battery
VRLA batteries including both gel and AGM batteries are able to recombine and
reduce the emission of gases during overcharge so the requirement for the room
ventilation is reduced and there is no acid fume emission during normal discharge
(Berndt 1993 Anon 2007 Wikipedia nd) Although the generation of hydrogen
can be slowed down it cannot be avoided completely As a result a valve
regulation safety system is employed in VRLA batteries which vents the gases in
22
the battery only during over pressure faults (Tuck 1991 Berndt 1993)
However the VRLA batteries do have some drawbacks First of all the VRLA
batteries tend to have a lower specific energy density than flooded batteries and
they are also more expensive An accurate charging control is very important for a
VRLA battery especially when charging under high temperature environments
since it is not possible to cure the damage caused by overcharge
223 Battery Designs for Different Applications
Lead-acid batteries are deployed in a range of applications Different designs are
therefore required due to the different working environments and duty cycles SLI
batteries are designed for a burst of energy for cold-cranking an engine A SLI
battery is supposed to provide power only in the first few seconds when starting
an engine and will be recharged immediately once the engine is started In this
kind of lead-acid batteries a larger surface area of the electrode plates is used to
provide high electric current in a short period However repeated deep discharge
may shorten the battery lifetime
On the other hand deep cycle batteries are designed for applications where the
batteries are regularly discharged The plates of the deep cycle batteries are often
very thick in order to withstand the frequent and deep discharge cycles The plate
surface area of a deep cycle battery is not as large as a SLI battery and as a result
it is not possible to offer great power
23
Marine batteries are a compromise between a SLI battery and a deep cycle battery
Standby batteries can be classified as marine batteries which are used for backup
power supplies and providing the power in emergency situations They are
designed for a long lifetime and a large capacity but repeated discharges and high
current drain are not the intended application Traction batteries are designed for
higher current drain and repeated deep discharge cycles They are usually bigger
and heavier than other types of lead acid for the same voltage and capacity but
that is the cost of durability
23 Mathematical Descriptions of Lead-acid
Batteries
In order to investigate the relationship between the battery behaviour and
remaining lifetime for a lead-acid battery initial studies have been carried out and
are described in this chapter Concepts including Capacity State of Charge (SOC)
Depth of Charge (DOC) State of Health (SOH) and internal resistance are
introduced and quantitative descriptions of these concepts are listed
231 Capacity
The capacity of a lead-acid battery represents how much charged energy the
battery can offer which is usually described in Ampere-hours (Ah) The charge
capacity of a battery is decided by the construction factors of a battery cell This
includes the materials contained in the electrodes and the acid solution In
addition the capacity of a battery is not a fixed quantity but varies according to
24
how quickly it is discharged This is known as Peukertrsquos law (Ceraolo 2000
Dhameja 2001 Rand Moseley et al 2004)
tICk
p = (21)
where pC is the capacity on one-ampere discharge rate which is a constant
I is the discharge current (A)
t is the time of discharge (h)
k is the Peukert constant and for a lead-acid battery with the value
between 11 and 13 (varies for each individual battery)
It is common to refer to ldquoCnrdquo as the capacity of battery in Amp-Hours which
corresponds to complete discharge of the battery in n hours ldquonrdquo is a subscript that
represents the discharge rate In industry the capacity under ten-hour discharge
rate (C10) is always taken as the nominal capacity
232 Electromotive force
The electromotive force of a battery cell is the difference between the electric
potential of the two electrodes of each cell (Rand Moseley et al 2004) The
potential of each electrode which is called half cell potential is decided by the
chemical reaction and the relative activities of the solution and can be obtained
from Nernstrsquos equation (Crompton 2000)
25
Ox
Redln0
α
α
zF
RTEE minus= (22)
where E is the half-cell potential (V)
0E is the standard half-cell potential (V)
α is the relative activity of the oxidizer (α Ox) and reducer (α Red)
z is the number of electrons transferred in the cell reaction
R is the universal gas constant which is 8314472 JKminus1molminus1
T is the absolute temperature
F is the Faraday constant the number of coulombs per mole of electrons
and F = 964853399times104 Cmolminus1
At room temperature RTF is a constant of 25693mV for cells therefore
Ox
Redlog
z
V05910
Ox
Redln
z
mV69325
Ox
Redln 10
α
α
α
α
α
α==
nF
RT
The Nernstrsquos Equation therefore can be expressed by
Ox
Redlog
V0591010
0
α
α
zEE minus= (23)
The electromotive force could be calculated by the difference of the electric
potential
cathodeanode EEEMF minus= (24)
When a lead-battery is discharging the electromotive force can be written as
26
O)(H
)(SO)(Hlog
V05910
2
2
24
10
00
α
ααminus+
+minus=z
EEEMF cathodeanode (25)
The standard half-cell potential of the anode 0
anodeE is equal to 1685 (PbO2-
PbSO4SO42-) and that of cathode
0
cathodeE is -0356 (Pb-PbSO4SO42-) which are
constants for the same battery chemistry And the number of electrons transferred
( n ) is 2 for a lead-acid battery
Therefore the electromotive force of a lead-acid cell can be obtained by
O)(H
)(SO)(HlogV029600412
O)(H
)(SO)(HlogV02960)3560(6851
2
2
24
10
2
2
24
10
α
αα
α
αα
minus+
minus+
+=
+minusminus=EMF
(26)
This electromotive force of a battery cell is numerically equal to the open circuit
voltage which means that the terminal voltage of a single cell battery when it is
disconnected from the external load For a lead-acid cell the electrochemical
force at fully charged is between 210-213V per cell
233 State of Charge and Depth of Charge
State of charge (SOC) and depth of charge (DOC) are variables that can describe
the battery charge The main difference is that the SOC describes the percentage
of remaining charge relative to the nominal capacity while the DOC represents
that relative to the actual capacity under a specific discharge current These two
27
variables can be obtained by calculating the charge consumed and the battery
capacity
101 CQSOC eminus= (27)
Ie CQDOC 1minus= (28)
where Qe is the charge consumed by the load (Ah)
C is the nominal capacity (Ah)
CI is the actual capacity under the discharge current I (Ah)
234 Internal Resistance and State of Health
The internal resistance of a lead acid cell is the physical resistance of the cell The
value of the internal resistance is decided by many different factors But it could
be obtained by a simple equation
I
VVr tOC minus
= (29)
where Voc is the open circuit voltage (V)
Vt is the terminal voltage when discharging (V)
I is the discharge current (A)
However the factors in this equation are only a method of calculating the internal
resistance but not the determinants It is shown in applications that the internal
resistance of a lead-acid battery will increase when discharging as the SOC and
28
the DOC drops
It is common for batteries to suffer a capacity loss when discharged and charged
in a number of duty cycles even when idle Aged batteries are often weak and
sometimes not able to offer enough charges Therefore they should be replaced or
maintained State of health is a defined variable that is important for a weak
battery This variable is to show how weak the battery is and represents the
percentage of remaining capacity to the initial capacity when the battery is brand
new (Okoshi Yamada et al 2006) as shown in the equation
new
weak
C
CSOH = (210)
where Cweak is the remaining capacity of a weak battery (Ah)
Cnew is the capacity when the battery is brand new (Ah)
The reason for the capacity loss is complex but is usually due to the sulphation
Sulphation is a process when the amorphous lead sulphate which is easily
converted back to lead lead oxide and sulphuric acid converts to a stable
crystalline form coating the electrodes This form of lead sulphate cannot conduct
electricity and cannot be converted back to lead lead dioxide and lead sulphate
under normal charging conditions The internal resistance of a lead-acid battery
therefore increases and less charge can be provided when discharging Complete
or repeated deep discharges of a battery at low current densities that lead
excessive utilization of the active material are the most critical reason for
29
capacity loss for example a discharge of a traction battery that draws more than
80 of its nominal capacity (Berndt 1993)
235 Multi-Cell Lead-Acid Batteries
In most applications of batteries the voltage of an individual cell is not enough to
provide the sufficient voltage and power supply The solution is usually to series
connect a number of cells in a battery in order to achieve a higher battery voltage
The electromotive force of a series of lead-acid battery cells is directly related to
the cell numbers as well as the charge state of each cell For a six-cell lead-acid
battery which is a standard for most common usages the fully charged
electromotive force is about 128V The internal resistance of a multi cell battery
however is also equal to the sum of the internal resistances of each cell
Usually all the cells in a multi-cell battery should be constructed in the same
manner and in particular the capacity should be consistent because the capacity of
a multi-cell battery will be limited to the cell with the lowest capacity If one of
the cells fails it is not possible for the current to flow through the cell and the
battery is therefore disconnected from its internal cell loss Also if the SOC of one
particular cell drops faster than others in a battery the electromotive force of that
cell may affect the whole behaviour of the battery
24 Summary
The technology development of lead-acid batteries has been continuous over the
30
last 150 years From the earliest open cell batteries different advanced battery
configurations are now available which have been adopted in a wide range of
applications Meanwhile a number of solutions have been developed to address
the battery problems encountered in applications such as electrolyte evaporation
spillage and the electrolysis of electrolyte when charging However there are still
issues affecting the efficient and safe use of lead-acid batteries for example
determination of the SOH which if addressed in a robust manner would lead to
significant improved battery management system performance This chapter has
presented the essential fundamental knowledge technology terms and working
principles of lead-acid batteries which is served as a preparation for further study
reported in the following chapters of the thesis
In order to reveal the dynamic behaviour of a battery under different SOH and
identify the suitable strategy for SOH determination the mathematical modelling
study is carried out and an equivalent circuit model is derived in the next chapter
The key concepts of the battery model are explained and the fundamental analysis
is given for the concepts introduced
31
Chapter 3
Equivalent Circuit Modelling
of Lead-acid Batteries
In order to estimate the status of a battery a model based approach is adopted in
the project A mathematical model for lead-acid batteries should be developed
with a suitable level of abstraction This chapter describes the requirements to the
model to serve the project objectives and reviews the available model
technologies An improved mathematical model for lead-acid batteries is
introduced in the late part of this chapter
31 Requirements for the Battery Model
The main objective of the project is to develop an algorithm that can determine
the battery health by monitoring the battery status during discharge cycles This
algorithm is designed for implementation in a battery health monitoring system
with life-time prediction capabilities This prediction system is intended to work
on applications where the battery performance is of great importance for instance
hospital UPS systems and vehicle ignition systems To achieve the objective the
requirements to the mathematical model can be defined as
Requirement 1 The model should be able to calculate the evolution of key
battery parameters including terminal voltage cell temperature the state of health
32
and the internal resistance which describe the condition of the battery for
dynamical discharging It should also be able to adequately represent dynamic
processes while the battery is discharging
Requirement 2 The complexity of the model must be sufficient to satisfy the
requirement 1 but must also be executable in real-time for a model-based
condition monitoring system
Requirement 3 The output of the battery model should be understandable to the
battery operators and technicians as well as meaningful to those who do not have
any background in battery technologies
32 Overview of Battery Model Techniques
A number of different types of battery models have been used to serve as a tool in
solving a range of problems (GONG 2005) These include Electrochemical
Models Computational Fluid Dynamics Models Finite Element Models and
Equivalent Circuit Models This section gives an overview to the above named
four different types of battery models and the problems which are addressed by
each of them In Section 324 every battery model technology is assessed against
the overall requirements
321 Electrochemical Model
Electrochemistry is a branch of chemistry that studies chemical reactions which
33
take place in a solution at the interface of an electron conductor (a metal or a
semiconductor) and an ionic conductor (the electrolyte) The reactions involve
electrons transfering between the electrode and the electrolyte or species in
solution The application of electrochemistry research directly leads to the
development of the lead-acid batteries
Behaviour of a battery depends not only on how the battery is used but also on a
number of construction factors (Ruetschi 2004) These factors include but are not
limited to the thickness of the plates the active mass density of the active
material the concentration of the acid solution and the geometry of the electrodes
(Berndt 2001 Ruetschi 2004)
The electrochemical model is mainly focused on the oxidationreduction reactions
between the electrolytes and the electrodes By analyzing the consistency of each
matter in the solution and the electrochemical reaction caused by the connection
of electrodes to external circuit it is possible to represent the dynamic behaviour
of the battery (Crompton 2000)
322 Physical Models
The finite element method is a numerical analysis technique for finding
approximate solutions of partial differential equations as well as of integral
equations The basic principle of the Finite Element Model (FEM) is to divide the
problem into elements and each element is a smaller problem to be solved so that
they could be analyzed separately The lsquoelementsrsquo are then be assembled together
34
to restore the initial problem
Finite element is a very popular method of analysis in those areas with a complex
geometry and it is good at stress and thermal analysis For batteries the Finite
Element Models can help with a good understanding of the heat loss and that for
vibration problem in mobile applications There are also attempts to analyze the
current density on the positive grid bar in a lead-acid battery using FEM (Ball
Evans et al 2002)
Computational Fluid Dynamics (CFD) technology is a well-established tool for
physical analysis and optimization of fluid flow mass and heat transfer and
related phenomena (eg chemical reactions) that may simultaneously take place in
a complex system (Liaw Gu et al 1997) Computers are used to perform millions
of calculations required to simulate the interactions of fluids and gases with the
complex surfaces used in engineering
In a CFD Model of a battery the dynamic governing equations are solved with
respect to time space and all the physical time and space dependent properties
Acid concentration and potential distribution across the cell for instance can be
obtained Therefore such a modelling is able to give a very good understanding to
battery parameters and detailed characteristic of battery dynamics
323 Equivalent Circuit Model
An equivalent circuit refers to the simplest form of a circuit that retains all of the
35
electrical characteristics of the original (and more complex) circuit In its most
common form an equivalent circuit is made up of linear passive elements
However more complex equivalent circuits are used to approximate nonlinear
behaviours of the original circuit as well
In electrical engineering it is often useful to use an equivalent circuit model to
describe the non-ideal operation of a device For electrical engineers electrical
models are intuitive useful and easy to handle especially when they can be used
in circuit simulators and alongside application circuits
324 Discussion of Different Battery Model Methods
The electrochemical model focuses on the electrochemical reactions and the
activities in the battery which is very popular in the applications for the
constructional and design purpose However many electrochemical factors
contained in the electrochemical model are irrelevant to the external circuit and
some of the important parameters like the internal resistance are hard to describe
in an electrochemical model Therefore this model technology is not able to meet
the project Requirement 1 As the calculations in the electrochemical model are
not complicated Requirement 2 can be therefore satisfied by an electrochemical
model of battery Requirement 3 might be difficult to obtain for an
electrochemical model because the understanding of the outputs for an
electrochemical model usually need some background knowledge of the battery
chemistry As a result the electrochemical model is not chosen for the project
36
Physical models can give good understanding to the battery important parameters
so that Requirement 1 of the project can be satisfied The Requirement 3 can be
also met as the terminal voltage can be calculated as the output with the
knowledge of these parameters One significant disadvantage is that the physical
models involves huge amount of calculation in analysis which is quite time
consuming In finite element or CFD methods a large nonlinear system of
equations is solved iteratively and that could take excessive CPU time especially
for when the system is more than 2 dimensions As a result the physical
modelling methods cannot meet the Requirement 2 of fast response required by
the project (Esfahanian Torabi et al 2008)
In an equivalent circuit model most of the characteristic required by the project
can be reached in a reasonable level It is able to reflect the dynamic behaviour of
battery using simple circuit blocks such as voltage sources resistors and
capacitors (Chen and Rincacuteon-Mora 2006) That is to say the Requirement 1 of
the project can be satisfied by the equivalent circuit model And the model
simplicity causes its low computational time as Requirement 2 and therefore it
can be suited to the online implementation (Esfahanian Torabi et al 2008)
Additionally basic battery parameters like internal resistance terminal voltage
and SOC etc can be chosen as the main output of the model to meet the
Requirement 3
Table 3-1 summarized a comparison of all the three model methods on the
satisfaction of the requirements for the project
37
Table 3-1 Satisfaction of the Requirements in different Model Methods
Requirement 1 Requirement 2 Requirement 3
Electrochemical Model times radic times
Physical Model radic times radic
Equivalent Circuit Model radic radic radic
33 Introduction of the Existing Equivalent
Circuit Models
Section 32 introduced three different types of battery models to serve for different
research purposes each with different features and strengths It has been shown
that the equivalent circuit model that pays attention to the relationship between the
internal circuit and the external characteristics can adequately meet all the
requirements of the project Therefore further studies of battery models have been
carried out and six equivalent circuit battery models with different merits and
complexity are presented while the technique improvements are briefly described
in this section
331 Simple Battery Model
The Simple Battery Model is the simplest battery model As shown in Figure 3-1
this model consists of only ideal battery mE as the electromotive force of a battery
and a resistor r in series connection as the internal resistance bV in the figure is
the terminal voltage of the battery
38
Figure 3-1 Simple Battery Model
The Em in Figure 3-1 stands for the electromotive force of the battery while r
represents the internal resistance and Vb is the Terminal Voltage This model is
only applicable in some circuits where the state of charge is of little importance
because it does not consider the varying characteristic of the internal resistance in
different states of charge The model is often used in circuits where the battery
does not have major influences to the circuit analysis But without being able to
describe the battery behaviours in details this model is not suitable for the
research purpose In the Simple Battery Model the electromotive force mE can be
obtained by open circuit measurement and r can be calculated by measurement
with connecting a load to the battery after taking an open circuit measurement
For a battery with a terminal voltage of 13V and the internal resistance of 05Ω
the change of terminal voltage in a Simple Battery Model as the discharge current
increases can be given as Figure 3-2
39
Terminal
Voltage
Discharge
Current
0
10V
13V
Figure 3-2 I-V chart of the Simple Battery Model
332 Advanced Simple Battery Model
This model is developed based on the Simple Battery Model and has the same
block diagram as the Simple Battery Model The only difference is that this model
employs a variable resistor which depends on the state of charge (CUN
FIORINA et al Durr Cruden et al 2006) The relationship between the value of
the variable resistance and the state of charge is as follow
aSOC
Rr 0
= (31)
where 0R is the resistance of the battery when it is fully charged
a is the capacity coefficient
SOC is the state of charge of battery from 0 (completely discharged) to 1
(fully charged)
6A
40
The most important improvement of this model is that instead of a constant
internal resistor the value of the internal resistance is expressed as equation
function of SOC For the same battery described in section 331 the I-V chart in
different SOCs can be concluded as shown in Figure 3-3
Terminal
Voltage
Discharge
Current
0
10V
13V
SOC=1
SOC=60
Figure 3-3 I-V Chart in different SOC
333 Thevenin Battery Model
The previous models do not account for any transient behaviour of batteries
Figure 3-4 shows the gradual change in battery characteristics when external loads
are connected or disconnected to the battery
6A
41
011
14
125
Terminal
Voltage
t
Figure 3-4 Sketch to show battery discharge behaviours in typical tests
Thevenin Battery Model is one commonly used model which consists of an ideal
battery electromotive force ( mE ) internal resistance (0R ) overvoltage resistance
(1R ) and capacitance (
1C ) and the equivalent circuit is shown in Figure 3-5
(Casacca and Salameh 1992 Salameh Casacca et al 1992 Chan and Sutanto
2000) 1C represents the actual capacitance of battery and
1R represents the
resistance contributed by the contact resistance of the plate and the electrolyte
(Durr Cruden et al 2006) The capacitance in the Thevenin Battery Model can
overcome the trend of terminal voltage shown in Figure 3-4
No load No load Load
42
Figure 3-5 Thevenin Battery Model
The main disadvantage of this Thevenin Battery Model is that all the parameter
values are assumed to be constant but in fact they are strongly dependent on the
state of charge and discharge rate and some other discharge characteristics
334 Dynamic Battery Model
This model is developed based on the Thevenin Battery Model Similar to the
improvements made by the Advanced Simple Model comparing with the Simple
Battery Model the most important difference is that it takes into account the non-
linear characteristic of the open circuit voltage and internal resistance represented
by SOCK (Jayne and Morgan 1986 Sims 1990)
ISOC
KRVV bocb )( +minus= (32)
where bV is the terminal voltage of battery
ocV is the open circuit voltage
bR is the battery terminal resistor typically 01Ω
43
K is the polarization constant
I is the discharge current
335 Fourth Order Dynamic Model
This is a more accurate and sophisticated model The current pI flows through
pR (electrolyte reaction) dR (Ohmic effect) and its associated leakage
capacitance dC and wR (waste of energy) and its associated leakage
capacitance wC Current sI flowing through the resistor sR represents the
behaviour of self discharge (Gillioli and Cerolo 1990 Chan and Sutanto 2000)
The main drawback of this model just as its name indicates is that there are
fourth order equations due to consideration of the paralleled R-C blocks in the
circuit and therefore it takes more time for the computation Another drawback is
that a number of empirical parameters are contained in the model
Figure 3-6 Fourth-order Battery Model
44
336 Improved Battery Model
The most popular Equivalent Circuit Model used by researchers is the Improved
Battery Model (Casacca and Salameh 1992 Salameh Casacca et al 1992) This
model is simple but meets most requirements for a good battery model It contains
most non-linear characteristics and is linked to the state of charge Most elements
included in this model are the functions of the state of charge or the open circuit
voltage which is also related to the state of charge The improved model is
studied in this chapter and implemented in MatlabSIMULINK environment
Figure 3-7 Improved Battery Model
34 Mathematical Model of the Lead-acid
Batteries
As the Improved Battery Model is able to reflect the major dynamic behaviours of
a battery and does not take much computation time it meets the requirements for
45
the project Therefore the mathematical model developed in this project is based
on the Improved Battery Model by involving the components of variable voltage
sources as the electromotive force ( EMF equal to the open circuit voltage OCV )
variable resistors as internal resistance and overvoltage resistance and a capacitor
as the capacitance of battery The description and the detailed analysis of the
model are given in this section
341 Capacity
Based on the Peukertrsquos law introduced in Chapter 2 the relationship of capacity
with different discharge currents is obtained below
2121
2211
)( ttII
tItIC
k
kk
p
=
== (33)
And following the definition of battery capacity the capacity is
12
1
2111
1
21121121121222 )()())(()( I
kkkk
I CIItIIItIIIIItIIItICminusminus
=====
12
1
21 )( I
k
I CIICminus
=there4 (34)
where Cp is the one ampere capacity
CI2 CI1 is the capacity under the discharge current I2 I1
k is a constant that related to the battery
The equation of calculating the capacity by the discharging current can be
46
obtained through experiments (Ceraolo 2000 Barsali and Ceraolo 2002) An
experimental result is given as
m
c
c
IIK
CKIC
))(1(1)( 0
0minus+
= (35)
where )(00 ICC = which stands for the capacity when discharging at the rated
discharge rate usually the nominal capacity C10
cK is empirical coefficient and is 118 for lead-acid batteries
m is empirical coefficient of 120
This equation overcomes the inadequacies of the Peukertrsquos law The capacity
calculated by the Peukertrsquos law in a low discharge current is much larger than that
experimentally obtained (Ceraolo 2000)
With the parameters of 20118124420 ==== kKAIAhC c the simulation
study indicated that the capacities of low discharge rate (lt30A) in different
equations are quite similar as shown in Figure 3-8
47
0 5 10 15 20 25 30 35 40 45 500
10
20
30
40
50
60
70
80
Discharge Current (A)
Actu
al C
apacity (
Ah)
Based on Peukerts law
Based on the Equation 35
Based on the Equation 35
Based on thePeukerts Law
Figure 3-8 Battery Capacity vs Discharge Current
Variations of the cell temperature also affect the battery capacity The effect of
temperature on the battery capacity is described by the following equation
(Ceraolo 2000 Barsali and Ceraolo 2002)
ε
θ
θθ
minus+=
f
ICIC 1)()( 0 (36)
where fθ is the electrolyte freezing temperature and is equal to -40˚C
θ is the cell temperature
)(0 IC is the capacity of battery under the discharge current I at 0˚C
ε is a constant that equals to 129
48
Therefore
m
c
f
c
IIK
CK
IC))(1(1
1
)(
0
minus+
+
=
ε
θ
θ
θ (37)
342 Electric Networks
Figure 3-9 (Ceraolo 2000 Barsali and Ceraolo 2002) shows an adaptation of
electric network based on the improved battery model shown in Figure 3-7 The
major change of this equivalent circuit is that the self-discharge is not taken into
account because the self discharge is usually less than 10 per month in modern
technologies which can be ignored in normal applications
Figure 3-9 Lead-acid Battery Equivalent Network
In the figure mE in this the main branch represents the electromotive force of the
battery and Vb stands for the terminal voltage The mZ in the figure stands for the
internal impedance that can be approximated by two R-C blocks
49
Battery is an energy storage device but not all the energy that the battery gets
from the charger can be stored when a battery is charged Part of this energy is
lost for different reasons like water electrolysis A parasitic branch is therefore
added to the model to represent the energy loss This part is claimed to work only
when the battery is being charged (Ceraolo 2000 Barsali and Ceraolo 2002) In
this project the current of the parasitic branch pI in the figure can be described as
an equation of the voltage of the parasitic branch PNV instead of a simple resistor
pR because of the nonlinear character of the parasitic branch This issue will be
discussed in later sections
As a result of these factors an equivalent electric network of in Figure 3-9 is
designed as shown in Figure 3-10 in which 1C 1R and 0R are the elements of the
internal impedance mZ It is used in the whole project as the electric network of
mathematical model
Figure 3-10 The Equivalent Network with the Approximated mZ
50
343 State of Charge and Depth of Discharge
In Chapter 2 Equations 27 and 28 show the definitions of SOC and DOC of a
battery In the model the nominal capacity can be treated as C(0θ) while the
actual capacity is C(Iavg θ) therefore
)0(1 θCQSOC eminus= (38)
)(1 θavge ICQDOC minus= (39)
where σσ dItQt
e int=0
)()( is the charge already drained from the battery
)0( θC is the nominal capacity of battery
)( θavgIC stands for the actual capacity under the specific discharge
current
344 Electromotive Force of the Battery
The electromotive force of a battery which is Em in Figure 3-10 is the difference
between the electric potential of the two electrodes and can be calculated by the
Nernstrsquos equation (Eq 26)
)(
)()(log029600412
2
2
24
10OH
SOHEMF
α
ααminus+
+=
This equation gives a description of the electromotive force by the activity of
different matter in the sulphuric acid which is described as lsquoαrsquo When the battery
51
is being charged or discharged the electrolyte concentration changes and the
activity value of H+ SO42- and H2O in the Nernstrsquos equation changes which can
be found by the study of battery that is the EMF of battery will change as the
result of the change of state of charge The relationship between SOC and the
activity α is unknown but it is obviously that when the state of charge increases
the quotient of )(
)()(
2
2
24
OH
SOH
α
ααminus+
also increases This shows that the EMF rises
when the state of charge is increasing
From the literatures (Ceraolo 2000 Barsali and Ceraolo 2002) the electromotive
force is described simply as the following equation
)1)(273(0 SOCKEE Emm minusminusminusminus++++minusminusminusminus==== θ (310)
where 0mE and EK are constants for a battery
θ is the temperature of the cell
SOC is the state of charge of the battery
345 Internal Resistance of a Battery
The resistances of a battery as shown in Figure 3-10 can be calculated by the
equations (Ceraolo 2000 Barsali and Ceraolo 2002)
)]1(1[ 0000 SOCARR minus+= (311)
)ln(101 DOCRR minus= (312)
52
)exp(1 22
)]1([
202
21
IIA
eRR
m
SOCA
+=
minus
(313)
where 0A 21A and 22A are constants for a battery while 00R 10R 20R are
parameters related to the SOH which will be discussed in later chapters For the
model 020 asympR and can be omitted when a battery is discharging
Therefore the internal resistance of a cell when discharging is
)ln()]1(1[ 1000010 DOCRSOCARRRr minusminus+=+= (314)
346 The Behaviour of Parasitic Branch
When the battery is being charged there are some losses as represented by the
parasitic current This current depends on the electrolyte temperature and the
voltage at the parasitic branch (Ceraolo 2000)
Because the behaviour of parasitic branch is non-linear Tafel gassing-current
relationship is used instead of a simple resistance pR (Ceraolo 2000)
minus+= )1(exp
0
0
f
p
P
PNPPNp A
V
VGVI
θ
θ (315)
where pI is the current of the parasitic branch
PNV is the voltage of the parasitic branch
53
0PG is a constant in seconds
0PV is a constant in volt
pA is a constant
θ is the electrolyte temperature
fθ is the electrolyte freezing temperature and is equal to -40˚C
When the battery is being discharged 0asymppI the parasitic branch could be
omitted from the model in simulation if the charging behaviour is not necessary
to discuss
347 Main Branch Capacitance
In the electric network of the model there is an R-C circuit as shown in Figure
3-11
Figure 3-11 R-C block
where Im is the discharge current
IC1 is the current flow through the capacity branch
54
I1 is the current of R1
VR1 is the voltage over the R-C block
This branch can be solved by
))(
()( 11111111
dt
tdVCIRIIRIRV R
mCmR minusminusminusminus====minusminusminusminus====sdotsdotsdotsdot==== (316)
)()()(
111
11 tIRtVdt
tdVCR mR
R====++++ (317)
This is the differential equation that represents the main branch behaviour
Laplace transform is employed to solve this problem
)()( 1111 sIRsVSCR mR sdotsdotsdotsdot====sdotsdotsdotsdotsdotsdotsdotsdotsdotsdotsdotsdot (318)
1
)(
11
11
++++
sdotsdotsdotsdot====
SCR
sIRV m
R (319)
++++
====++++
========
SCR
C
SCR
R
I
VsG R
11
1
11
11
1
1
1)( (320)
where τ=11CR is the time constant that represents the double layer capacitance
When the current has a shape like a step and the initial voltage of the capacitor is
equal zero the solution in time becomes
m
t
R IeRtV )1()( 11τ
minus
minus= (321)
55
It is obviously that this equation is the typical form of the voltage with an R-C
circuit
348 Thermal Behaviour of a Battery
When the battery is charging or discharging there is a current flow through the
battery so that it produces heat due to the Joules law
0
2
1
2
12 RIRVIVVIP RPNps sdot++sdot+sdot= (322)
When discharging the parasitic branch and R2 are omitted the equation becomes
0
2
1
2
1 RIRVP Rs sdot+= (323)
The dynamic equation of cell temperature and the power is (Ceraolo 2000)
s
a PRdt
dC +
minus=
θ
θ
θθθ (324)
where θC is the thermal capacitance
θR is the thermal resistance between the battery and the environment
θ is the cell temperature and aθ is the environment temperature
56
35 Mathematical Model of the Lead-acid
Batteries
Considering the behaviour of capacity state of charge and depth of discharge
electromotive force and internal resistance an Improved Battery Model based on
the equivalent circuit shown in Figure 3-10 was introduced in previous sections
The battery model for the complete discharging progress can be derived as the
following equations
m
c
f
c
IIK
CK
IC))(1(1
)1(
)(
0
minus+
+
=
ε
θ
θ
θ (325)
σσ dItQt
e int=0
)()( (326)
)0(1 θCQSOC eminusminusminusminus==== (327)
)(1 θavge ICQDOC minusminusminusminus==== (328)
)1)(273(0 SOCKEE Emm minus+minus= θ (329)
)]1(1[ 0000 SOCARR minus+= (330)
)ln(101 DOCRR minus= (331)
1
1R
Cτ
= (332)
IeRtV
t
R sdotminussdot=minus
)1()( 11τ (333)
0
2
1
2
1 RIRVP Rs sdot+= (334)
57
sa P
Rdt
dC +
minus=
θ
θ
θθθ
(335)
)( θIC in the equations is the expression of capacity of battery when discharging
under the discharge current I and at a temperature of θ 0C stands for the
capacitance when discharging at the rated discharge current I while parameters
fθ and ε are constants in this model )(tQe represents the charge already
consumed while the equation of mE indicates the mathematical description of
electromotive force corresponding to the SOC and the cell temperature in which
0mE EK are constants for a battery 00R 10R are parameters related to the SOH
and the discharge current can also affect them τ in the equations are the time
constant of the R-C circuit which represents the time it takes the systems step
response to reach ( 6311 asympminus e ) of its asymptotic value The last two equations
represent the thermal dynamic of battery in which sP is the Joule heat generated
by the internal resistance θC is the thermal capacitance and θR is the thermal
resistance between the battery and the environment
36 Summary and Discussion
The Improved Battery Model based on the electric equivalent circuit is presented
in this chapter and it is proved that it can satisfy all the three requirements to serve
the project objectives This battery model consists of a variable voltage source
several R-C blocks and a parasitic branch as its electric network and the elements
are described as a variable related to the capacitance the charge consumption and
58
the cell temperature as well
However experimental tests show that the behaviour of the battery is much more
complicated can be represented by this equivalent circuit model For example the
internal resistance varies when discharging under different current and the time
constant of the R-C circuit at the beginning and end of discharge as well
Therefore the model has to be improved The next chapter overcomes these
problems found in the experimental tests and some improvements of the model
are described
59
Chapter 4
Experimental System Set up and
Improved Battery Model
Simulation Implementation
Experimental tests based on a 12V-13 Ah lead-acid battery are carried out and the
test system is introduced at the beginning of this chapter Some of the
characteristics of the battery can be found in the tests which has shown that the
battery model described previously is not accurate enough and improvements
have to be implemented into the model This chapter will focus on the analysis of
the battery characteristics and the description of the improvements implemented
In the last part of this chapter a finalised version of the battery model used in this
project is given and implemented in the MatlabSIMULINK environment for
simulation study
41 The Experimental System
In this experimental test system a variable resistor is used as the load of the
battery Three sensors are employed in the whole experiment process two current
sensors and one voltage sensor The equivalent circuit of the test rig designed for
the research purpose is shown in Figure 4-1
60
Figure 4-1 Equivalent Circuit of the Experimental Test Rig
In this figure the ideal voltage source EMF accompanying with the internal
resistance r acts as a lead-acid battery with 6 cells (12V) the terminals of the
battery are connected in parallel to a voltage sensor Switch Krsquo is employed to
control the voltage sensor connection so that the sensor can be disconnected from
the battery when the experiment is not being in progress to avoid an unnecessary
discharge The circuit break in Figure 4-1 can be used as a main controller which
decides whether the load is engaged to the battery to discharge or not Switch K
in the experiment is to vary the load of the system This experimental test system
is mainly designed for two different experimental tests of a battery in this study
constant-impedance load discharge and two-load discharge Figure 4-2 shows the
actual laboratory test rig used in the project
61
Figure 4-2 Experimental Test Rig
The data is collected and recorded every half second by a data acquisition card
PCI-6251 from National Instruments with the software environment of LabVIEW
and a 12V-13Ah lead-acid battery (marked in the red-dashed square in Figure 4-2)
is employed in the project as test batteries for the battery performance study
42 Improvements of the Battery Model
Figure 4-3 and Figure 4-4 show the typical data collected from the experimental
test rig Figure 4-3 is the result of a constant-impedance load discharge test with a
discharge current of 075A approximately and Figure 4-4 shows two-load
discharge with the discharge currents of 075A and 12A respectively
62
0 500 1000 1500 2000 2500 3000 3500 4000 4500 5000-02
0
02
04
06
08
1
12
Time (s)
Dis
charg
e C
urr
ent
(A)
0 500 1000 1500 2000 2500 3000 3500 4000 4500 5000105
11
115
12
125
13
Time (s)
Term
inal V
oltage (
V)
Figure 4-3 Test of constant-impedance load discharge top figure shows the discharge current of the experimental test and the bottom one shows the terminal
voltage 1τ is the time parameter of the R-C block at the beginning of the
discharge and 2τ is that when the discharge stopped
0 200 400 600 800 1000 1200 1400
0
05
1
15
Time (s)
Dis
charg
e C
urr
ent
(A)
0 200 400 600 800 1000 1200 1400118
12
122
124
126
128
Time (s)
Term
inal V
oltage (
V)
Figure 4-4 Test of two-load discharge top figure shows the discharge current of the experimental test and the bottom one shows the terminal voltage
I(t)RI1 and I(t)RI2 represent the voltage drop across the internal resistance value under different discharge current
1τ 2τ
I(t)RI1
I(t)RI2
I(t)RI1
63
421 The Change of τ in Different Charge Status
From analyzing these figures it is easy to find that it takes quite a long time for
the battery to have the steady terminal voltage when the discharge of battery stops
and it is longer than the time taken from the beginning of the discharge This
difference means that when the battery starts to discharge the time parameter
11CR=τ in the main branch equation (332) is not equal to that when the
discharge has just stopped In Figure 4-3 it is shown that when the discharge stops
the time parameterτ is longer than that when the discharge starts
As a result of this experimental feature a switch is employed to implement the
change of time parameter to match those described in the mathematical model of
the battery The switch is used to control the value of the time parameter τ in
different discharge currents When the battery is discharging the discharge current
is a positive value and the time parameter τ is equal to 1τ When the battery is
not discharging the discharge current is equal to 0 in theory and the time
parameter has a different value 2τ
Although the discharge current should be equal to 0 theoretically it is hard to
achieve this in the real experimental measurement because of the inaccuracy of
the current sensor reading due to the inaccuracy occurred in the power supply to
the sensor Therefore the trigger of the switch in the model is set to be 01 A that
is when the discharge current is greater than 01 A the time parameter is set to be
1τ as the battery is in its discharging segment By contrast the value of time
64
parameter is set to be 2τ and the discharge current is considered as the error
caused by the sensors when that current is less than 01 A
422 Analysis in Variations of the Internal Resistance
Another important issue found through analyzing the experimental test result is
that the internal resistance for a specific battery in a specific state of health (SOH)
is not a constant when the discharging current changes This difference is more
significant than the effect caused by the state of charge
For example in the two-load discharge results shown in Figure 4-4 when the
battery is not discharging the initial voltage is equal to the electromotive force
(EMF1) When the battery began to discharge at the discharge current I1 the
terminal voltage dropped to V1 After the discharge stopped for a while the value
of the terminal voltage is equal to the electromotive force (EMF2) at that state of
charge (SOC2) Then the discharge of the battery starts again at a current of I2 and
the terminal voltage dropped to V2 The discharge progress is then stopped for
certain of a time period to get the steady terminal voltage (EMF3) at that state of
charge (SOC3) After that the test of discharge at the I3 = I1 was repeated again
and get another terminal voltage of V3 The last discharge test is done to provide
the evidence for the fact that this change in the internal resistance is not caused by
the change of the state of charge (SOC)
The value of electromotive force in a discharging battery is equal to the sum of the
terminal voltage and the voltage that the internal resistance takes that is
65
nnnn IrVEMF sdot+=
Therefore the internal resistance can be calculated by
n
nnn
I
VEMFr
minus= (41)
From the data collected in the experiment the key parameter values for the graphs
shown in Figure 4-4 can be found as listed in Table 4-1
Table 4-1 Approximate Internal Resistance Calculating
n 1 2 3
Electromotive Force (EMFn) 1260V 1252V 1238V
Discharge Current (In) 078A 114A 076A
Terminal Voltage (Vn) 1219V 1203V 1197V
Substituting these values into Equation 41 the internal resistance can be
calculated Ω=Ω=Ω= 539043005260 321 rrr
This change of the internal resistance can cause quite a significant effect in the
discharge progress This problem can be possibly solved in a number of ways
One possible choice is to find a curve of the internal resistance change and the
discharge current for a specific battery after a certain numbers of experimental
tests But this method needs huge efforts in conducting experimental tests and the
result is not very meaningful for the project considering the time cost Another
possibility is to conduct the experimental tests with a constant load Therefore the
change of internal resistance caused by the change of discharge current could be
ignored As a result in the whole process of this project the same load is
66
employed either in the constant-impedance load discharge or in the two-load
discharge tests
In order to implement the different internal resistance value when discharging
under different load a switch that can control the parameters R00 and R10 is
employed This switch is controlled by the discharge current which is the main
input of the mathematical model In the two-load discharge tests when the switch
K in Figure 4-1 is switched off there is only one load is connected to the battery
terminals and the discharge current is lower the values of R00 and R10 are
switched to the first set of parameters R001 and R101 To the contrast when K is
switched on the discharge current is higher and the values are switched to the
second set R002 and R102
423 Improved Lead-Acid Battery Mathematical Model
From the model described in Chapter 3 and the improvements studied in this
chapter the mathematical model of lead-acid battery when discharging in different
discharge currents can be described as the following equations
m
c
f
c
IIK
CK
IC))(1(1
)1(
)(
0
minus+
+
=
ε
θ
θ
θ (42)
ττ dItQt
e int=0
)()( (43)
)0(1 θCQSOC eminusminusminusminus==== (44)
)(1 θavge ICQDOC minusminusminusminus==== (45)
67
)1)(273(0 SOCKEE Emm minusminusminusminus++++minusminusminusminus==== θ (46)
)]1(1[ 0000 SOCARR minusminusminusminus++++==== (47)
)ln(101 DOCRR minusminusminusminus==== (48)
11
RC
τ= (49)
IeRtV
t
R sdotminussdot=minus
)1()( 11τ (410)
RIRVP Rs sdot+=2
12
1 (411)
sa P
Rdt
dC +
minus=
θ
θ
θθθ
(412)
)(
)(
2
1
002
001
00Load
Load
R
RR
= (413)
)(
)(
2
1
102
101
10Load
Load
R
RR
= (414)
)10(
)10(
2
1
AI
AI
lt
gt
=τ
ττ (415)
001R 002R 101R 202R and 1τ 2τ in the equations stand for different parameter
values of 10R 20R and τ when the load and charge status changes in order to
reflect the improvements described in this chapter For a two-load discharge test
there are ten important unknown parameters in the equations of the mathematical
model which are unknown for a specific battery 0C 0mE EK 001R 002R 101R
102R 1τ 2τ and 0A As the internal resistance R00 and R10 vary only when the
load changes they can be treated as constants in the constant-impedance load
68
discharge tests the key parameters are therefore 21100000 ττRRKEC Em
and 0A In this project the study of state of health is based on constant-impedance
load discharge The identification of these unknown parameters will be discussed
in Chapter 5
43 Simulation Study
The processes described above have been implemented in SIMULINK as a
simulation model for computer based analysis The simulation program consists of
two main function blocks circuit block and thermal block The structure of the
SIMULINK implementation is described in Figure 4-5
69
Figure 4-5 Structure of model for SIMULINK Implementation
70
As shown in the figure there are mainly two inputs in the model the discharge
current and the discharge time The actual capacity of battery can be then
calculated with the knowledge of rated capacity and the discharge current The
actual capacity is also influenced by the cell temperature At the beginning of
discharge the cell temperature is the same as the surrounding temperature
Integrating the discharge current with respect to time is the capacity consumed in
the discharge progress and then the state of charge and the depth of charge can be
obtained It is shown that the electromotive force and the internal resistance vary
as a result of changing in the state of charge and the depth of charge and the
terminal voltage can be calculated
In the thermal block of the model the heat generated by the current and the
internal resistance are calculated by the Joules law Then this energy is
transferred to calculate the thermal temperature of the cell and the cell
temperature is given back to the circuit block to affect the actual capacity
71
0 1000 2000 3000 4000 5000 6000 7000
0
02
04
06
08
1
Time (s)
Dis
charg
e C
urr
ent
(A)
0 1000 2000 3000 4000 5000 6000 7000105
11
115
12
125
13
Time (s)
Term
inal V
oltage (
V)
Figure 4-6 Terminal Voltage of Battery (Constant Discharge Current SIMULINK)
The result in Figure 4-6 shows the terminal voltage of a battery which discharges
under the current of 08A in a simulation study Since the discharge begins the
voltage drops due to the internal resistance and the change of state of charge (SOC)
and it climbs up when the discharge stops However the voltage changes
gradually because of the time parameter τ This result shows a good qualitative
agreement with the experimental test results
72
44 Summary and Discussion
This chapter introduces the laboratory test system designed for the project and the
limitation of the mathematical model described in Chapter 3 Switches on the time
parameter τ and the internal resistance parameters R00 and R10 have been added to
the model so that the model is able to represent the change of these parameters
found in the experimental tests The implementation of the model under the
MatlabSIMULINK environment is described and the simulation study shows a
good qualitative agreement with the experimental test results
The next chapter will focus on the identification of those unknown parameters of
the battery model that are important for revealing the battery characteristics
including 20100000 τARRKEC Em and 1τ
73
Chapter 5
Model Parameter Identification
and Model Validation
The identification of the unknown parameters 20100000 τARRKEC Em and 1τ
in the mathematical model will be introduced in this chapter
51 Need for the Optimization Algorithms
In those equations of the battery model described previously some parameters are
unknown and some of them are difficult to derive from physics or engineering
principles or to be obtained through experimental tests Therefore the
identification of the model unknown parameters becomes an important part for the
project Parameter identification is an optimization process that adjusts the
parameters to enable the simulation results to show the best agreement with the
results acquired by the experimental tests There are many algorithms available
for optimization and the principle of the optimization process for the project is to
minimize the objective function The objective function is formed by the absolute
value of the difference between the simulated and experimental results at each
time point The set of parameters to achieve the least value of the objective
function is considered to be the fittest set
74
There are two basic requirements of the optimization in this project First of all as
the problem for the solutions trapped to the local minima is a very important and
challenging issue in many linear optimization solvers the optimization algorithm
used in this project must be able to find the global minimum Secondly the
optimization algorithm not only should find the minimum value of the objective
function but also can tell the values of the parameters that result in the best fitness
which is needed for the analysis purpose in this project Finally the time cost is
also an important factor in selection of a suitable optimization algorithm
It needs to point that the objective here is to identify the unknown parameters of a
model with an already known structure If the objective is to identify or
approximate unknown model structures the selection of optimisation methods
will be quite different In the case of latter Neural Network Genetic
Programming and Fuzzy Logical will be more suitable choices To concentrate on
the objective of the project the thesis will focus on optimisation algorithms for
parameter identification
52 Overview of the Optimization Algorithms
Brute-force search is the most basic direct search algorithm that is used to find the
minimum value In the brute-force search the initial guess is the minimum
possibility of parameters and increasesdecreases The parameter
increasesdecreases step by step in each iteration and the best solution can be
75
searched This algorithm is the simplest but its disadvantage is also obvious that
is it is the slowest optimization method especially when used in the identification
of more than two parameters and the results are largely dependent on the initial
guesses
Linear search is an optimization method to solve the linear optimization problem
the preference function of which is linear and the feasible domain is defined by a
linear constraint function The linear constraints define a convex polyhedron
geometrically which is called the feasible region The algorithm is to construct an
admission solution at a vertex of the polyhedron and then along edges of the
polyhedron to vertices with successively higher values of the objective function
until the optimum is reached
Besides the basic optimization methods evolution computation technology is
becoming increasingly popular A range of different evolution computation
technologies can solve the optimization problem in this project including genetic
algorithms (GAs) particle swarm optimization (PSO)
Genetic Algorithms are direct search algorithms inspired from the process of
evolution in nature the natural selection Based on the principle of survival of the
fittest the GAs can produce better and better approximations to the global optimal
solution in a number of generations In each generation a new group of solutions
is created by the fitness level in the problem of every individual in the last
generation The solutions are then bred together to lead to the evolution of
individuals
76
Particle swarm optimization is a stochastic population-based computer algorithm
modelled on swarm intelligence that searches for a solution to an optimization
problem in a search space Based on the social psychological principles each
individual called lsquoparticlersquo in PSO is able to provide information to others and
also learn the success from the local best and the global best The movement of
each particle through the search space are guided by these successes and the
solution can be found after a number of generations
It has been proved by Dr Jianlin in his PhD Thesis (Wei 2007) that both Genetic
Algorithm and Particle Swarm optimization are capable of the model parameter
identification But the Particle Swarm optimization is a new algorithm that first
described in 1995 and it is not as common as Genetic Algorithm in the research
areas
The purpose of this research work is to find a method for parameter estimation
Genetic algorithms are well proven solution for complicated optimisation
problems and have been applied successfully in a range of similar problems (Wei
2007 Wei Wang et al 2007) Genetic algorithms are also well suited to problems
with many local minima In the current work the exact form of the fitness
function is unknown and it is therefore important to select a robust technique
which can identify good overall solutions For these reasons GA was selected to
give the best possible chance of satisfying the overall project objectives within the
limited timeframe of the project
77
53 The Study of the Genetic Algorithms
The process of Genetic Algorithm is reviewed in this section to provide an insight
into how GAs work and simulation study of two bench mark functions are carried
out
531 Working Principle of GAs
There are many methods used to implement a GA process and usually a GA is at
least composed of three common genetic operators Selection Crossover and
Mutation (Pham and Karaboga 1998) The flowchart of a simple GA process is
given in Figure 5-1
As a preparation to start the optimization process a GA requires a group of initial
solutions as the first generation The first generation is usually a group of
randomly produced solutions created by a random number generator The
population which is the number of individuals in a generation should be big
enough so that there could be a reasonable amount of genetic diversity in the
population Also it should be small enough for each generation to be computed in
a reasonable period of time using the computer resources available Typically a
population includes individuals between 20 and 100 (Chipperfield Fleming et al
1994A)
78
Figure 5-1 Flowchart of a Simple Genetic Algorithm (Pham and Karaboga 1998)
The fitness function is evaluated to measure how close that the individuals fit the
desired result A fitness function could be either complex or simple depending on
the optimization problem addressed In a case of minimization problem the most
fitted individuals will have the lowest numerical value of the associated fitness
function
No
Yes
Selection
Crossover
Mutation
Find the Best Individual
Generate initial population
Results
Evaluate fitness values
Operators of generating new
generation
Gengt 100
Evaluation
Start
79
Individuals are selected according to a fitness-based process The operator of
selection is made up of ranking and selection progress by which more copies of
the individuals that fit the optimization problem better will be produced in the
next generation In GAs there are mainly two ways to select a new population
Roulette Wheel Selection (RWS) and Stochastic Universal Sampling (SUS)
The individuals will be recombined (crossover) after the selection This operation
is to produce two new individuals from two existing individuals selected by the
operator of selection by cutting them at one or more position and exchanging the
parts following the cut The new individuals therefore can inherit some parts of
both parentsrsquo genetic material There are usually four ways of doing this one-
point crossover two-point crossover cycle crossover and uniform crossover
(Pham and Karaboga 1998) Figure 5-2 (a) shows an example of the two-point
crossover progress
Mutation is another operator to produce new individuals The difference is that the
new individual is produced from a single old one In this operation the bit values
of each individual are randomly reversed according to a specified property A
mutation can also helps the GA to avoid local optimums and find the global best
solution Figure 5-2 (b) represents how the mutation operator works
80
Figure 5-2 (a) Crossover operation (b) Mutation operation
The group of individuals produced after the mutation is the second generation
Then the fitness value of each individual in the second generation is computed
again This cycle will not stop until the result is close enough or after a certain
generation
Three major Matlab toolboxes are applied in the current market for application
purpose they are Genetic Algorithms Toolbox V12 (Chipperfield Fleming et al
1994B) the Genetic Algorithms Optimization Toolbox V11 (Houck Joines et al
1995) Genetic Algorithm Direct Search Toolbox V102 (MathWorks Inc 2004)
In this project the official toolbox in Matlab form Mathworks Inc is employed
The property settings for the project based on Dr Weirsquos thesis (Wei 2007) are
shown in Table 5-1
Parent 1 1 1 0 0 1 0 1 1 0 1 0 1 1
Parent 2 0 1 1 0 1 1 0 0 1 0 1 0 0
Offspring 1 1 1 0 0 1 1 0 0 1 1 0 1 1
Offspring 2 0 1 1 0 1 0 1 1 0 0 1 0 0
(a)
Parent 1 1 0 0 1 1 0 0 1 1 0 1 1
Offspring 1 1 0 0 1 0 0 0 1 1 0 1 1
(b)
81
Table 5-1 The property settings for Genetic Algorithms
Name of the GA properties Value of the GA properties
Number of generations 100
Population size 20
Fitness assignment Rank-base fitness assignment
Selection Stochastic universal sampling
Crossover Scattered crossover
Crossover rate 07
Mutation function Uniform mutation
Mutation rate 01
Population size specifies how many individuals there are in each generation With
a large population size the genetic algorithm searches the solution space more
thoroughly and the gives more possibility to return the global minimum The
number of generations specifies the maximum number of iterations for the genetic
algorithm to perform If this number is too low the genetic algorithm is not able
convergence to the global solution However either a large population size or a
large number of generations can cause the algorithm to run more slowly The
crossover rate and the mutation rate are properties that control the crossover and
mutation operator High rate of these values means that the genetic algorithm has
a higher opportunity of producing new offspring but it can be easy to miss the
current best solution if these values are too big
Initial tests of genetic algorithms on different properties show that the values
shown in table 5-1 are able to find an adequate solution Similar results would be
82
obtained if the values of the generations and the population size are larger but
costing more CPU time The crossover rate and the mutation rate would not affect
the result significantly if only varies in a small range But it is impossible to prove
that these two values are the best choice due to the strong randomness
532 Simulation Studies of Genetic Algorithms
In order to test and demonstrate that Genetic Algorithms are able to meet the
requirements of the project simulation studies have been carried out Two
benchmark functions that are commonly used in evaluating evolutionary
computation algorithms are employed for the simulation studies They are
1) Rastrigin function
Rastrigin function is a typical example of non-linear multimodal function with
many local minima The problem of looking for the global minimum is quite
difficult due to its large search space and its large number of local minima The
function is shown as
))2cos(10(10)(1
2sum=
sdotsdotminus+sdot=
n
i
ii xxnXf πr
where n is the dimension of the problem and 1x ~ nx are the coefficients to be
identified Figure 5-2 shows a 2-dimensional Rastriginrsquos function while figure 5-3
is a contour plot of Rastrigins function shows the alternating maxima and minima
83
The global minimum of the Rastriginrsquos function is 0)( =Xfr
when
021 ==== nxxx L
Figure 5-2 2-dimensional Rastrigins function (MathWorks Inc 2004)
84
Figure 5-3 Contour plot of Rastrigins function (MathWorks Inc 2004)
In the simulation study a ten dimensional Rastriginrsquos function is adopted Figure
5-4 shows the best optimization performance of the Rastriginrsquos function in each
generation It is shown that after 700 generations a global optimal value is
obtained
85
0 100 200 300 400 500 600 700 800 900 10000
10
20
30
40
50
60
70
80Best 00099429
Generation
Fitness v
alu
e
Best f itness
Figure 5-4 GA performance (Rastrigrinrsquos function)
2) Rosenbrock function
Rosenbrock function is another mathematical function used as a test problem for
optimization algorithms The global minimum is inside a long narrow parabolic
shaped flat valley To find the valley is trivial but to converge to the global
minimum is difficult The Rosenbrock function is defined by
sum=
+ minus+minus=
n
i
iii xxxXf
1
2221 ))1()(100()(
r
where n is the dimension of the problem and 1x ~ nx are the coefficients to be
identified Figure 5-5 shows a 2-dimensional Rosenbrock function
86
The global minimum of the Rosenbrock function is 0)( =Xfr
when
121 ==== nxxx L The same as the Rastriginrsquos function a ten dimensional
Rosenbrock function is adopted for the simulation study Figure 5-6 is the GA
performance to the Rosenbrock function It can be found that the optimization
converges and get the global optimal value after 300 generations
Figure 5-5 2-dimensional Rosenbrock function (MathWorks Inc 2004)
87
0 100 200 300 400 500 600 700 800 900 10000
200
400
600
800
1000
1200Best 060113
Generation
Fitness v
alu
e
Best fitness
Figure 5-6 GA performance (Rosenbrock function)
54 Model Parameter Identification
541 Implementation of Genetic Algorithms and
Experimental Data sets
In this project the Genetic Algorithm Direct Search Toolbox V102 developed by
Mathworks Inc is employed to identify the parameters of the battery model The
process is shown in Figure 5-7
88
Figure 5-7 Progress of Parameter Identification
The fitness function is used in the project and the parameter identification is to
minimize the fitness function so that the model output can fit the experimental
result The fitness function is given as
sum
sum sumsum
minussdot=
minussdot++minussdot+minussdot=
minus
1
0
2
1 1
1
0
))()(()(
)()()(
exp
expexp2exp1
t
t
sim
t
t
t
t
simnsim
t
t
sim
tVtVabstW
VVabsWVVabsWVVabsWfitnessn
n
L
where Vexp is the experimental terminal voltage data
Vsim is the simulated terminal voltage
Wt is the weights of the difference in the simulated and experimental
results
This fitness function represents the sum of the error values at each time interval
Mathematical Model of a six-cell
Lead Acid Battery
Experimental Test
Results
Fitness
Function
Discharge Current
Simulation
Output
Terminal Voltage
Simulation
Input
lt fmin
Genetic Algorithms (Selection Crossover and Mutation
etc)
Parameter Update
Yes
No
Stop
89
considered ( ntt minus0 ) The weight coefficients Wt indicates how important the
weighted part is in the optimization and how much it contribute to the
optimisation process Periods with bigger tW values are more important because
the sum of errors will give big value contribution to the fitness function value and
the optimisation process will pay more attention to the higher weighted error parts
In the experiments and optimization process it is found that the results were more
important when the discharge of a battery at the stage of stopping Therefore the
weight in this period is greater than that of the others The weighting coefficient
values in this project are determined by the results of the first several attempts of
parameter identification The period of simulation data that fails to fit the test
result means that the weight value is not big enough until the overall performance
of simulation is reasonable
Following the objective fitness function unknown coefficients of the battery
model are identified using experimental data The mathematical model of a six-
cell lead-acid battery in the figure is described in Chapter 4 and the parameters are
to be identified by Genetic Algorithms are 210100000 ττARRKEC Em
Three sets of experimental tests have been carried out for the purpose of
parameter identification and the validation of the mathematical model These three
experimental results are based on a lead-acid battery with the ideal capacity of 13
Ampere-hours under the discharge current of 08A
90
542 Parameters of Battery Model
The parameters of the mathematical model of a lead-acid battery are identified
using Genetic Algorithms and the predicted battery responses using the identified
parameters are compared with the simulated results One set of typical values of
parameters identified are listed in Table 5-2
Table 5-2 Identified parameters identified by the Genetic
Algorithms in the model of 12V-13Ah lead-acid battery Parameter Value Parameter Value
0C 48198 (Amp-Sec) 0mE 21465 (V)
EK 0001109 (V) 0A 29895
00R 001038 (Ohm) 10R 012196 (Ohm)
1τ 21052 (s) 2τ 17565 (s)
Figure 5-8 shows the simulation results using the Improved Battery Model and the
change of weights defined for this set of result described in the fitness function
The top subplot of Figure 5-8 shows the weight value of the GA fitness function
described before while the middle figure is the discharge current of the
experimental test which is also the input of the mathematical model In the
following test results in this and next chapter the changes of weight value are
similar so they are not shown in the figures
The blue line marked as ldquoExperimental Terminal Voltagerdquo in the bottom figure
represents the measured outputs while the other one (Simulated Terminal Voltage)
represents the simulation results The simulation results are ldquonoisyrdquo because
experimental discharge current is used as the input of model in the simulation
91
progress It is obviously that Figure 5-8 shows a good overall agreement of the
results although some slope when discharging is not perfect
0 500 1000 1500 2000 2500 3000 3500
1
15
Time (s)
Weig
ht
0 500 1000 1500 2000 2500 3000 3500114
116
118
12
122
124
126
128
13
Time (s)
Term
inal V
oltage (
V)
Experimental Terminal Voltage
Simulated Terminal Voltage
0 500 1000 1500 2000 2500 3000 3500
0
05
1
Time (s)
Dis
charg
e C
urr
ent
Simulated Terminal Voltage
Experimental Terminal Voltage
Figure 5-8 Measured and Simulated Result after Parameter Identification
Figure 5-9 shows the mean fitness value and the best in each generation It can be
seen that the best fitness in each generation is decreasing The mean fitness is
unstable because of the mutation operator in the GA that can attempt to find better
solutions
92
0 10 20 30 40 50 60 70 80 90 100100
150
200
250
300
350
400
450
500
550
Generation
Fitness v
alu
e
Best 1075521 Mean 1312731
Best f itness
Mean fitness
Figure 5-9 Mean and the Best Fitness Values in Each Generation
543 Battery Model Validation
In order to validate the battery mathematical model two sets of experimental tests
have been adopted to compare with the simulation results
The inputs of the discharge current and the validation results using two
experimental tests are shown in Figure 5-10 and Figure 5-11
93
0 500 1000 1500 2000 2500 3000114
116
118
12
122
124
126
128
13
Time (s)
Term
inal V
oltage (
V)
Simulated Terminal Voltage
Experimental Terminal Voltage
Simulated Terminal Voltage
Experimental Terminal Voltage
Figure 5-10 Measured and Simulated Terminal Voltage (Validation data 1)
In the simulation that shows in Figure 5-10 the discharge of battery begins at the
time of 700s and the simulation result shows a reasonable agreement with the
experimental result despite the noise of signal caused by the error of the sensors
It is noticed that at the beginning of the discharge there is a difference between
the simulated and experimental terminal voltages for about 100 seconds This
difference is studied and so called lsquocoup de fouetrsquo which often takes place at the
beginning of a discharge test when the SOC of battery is high (Perrin Delaille et
al 2006) However this lsquocoup de fouetrsquo behaviour cannot be described in this
model The discharge period lasts for about 1200 seconds and then stops and after
that the simulation has the similar result with the experiment
94
0 1000 2000 3000 4000 5000 600011
112
114
116
118
12
122
124
126
128
13
Time (s)
Term
inal V
oltage (
V)
Simulated Terminal Voltage
Experimental Terminal Voltage
Simulated Terminal Voltage
Experiment Terminal Voltage
Figure 5-11 Measured and Simulated Terminal Voltage (Validation data 2)
Figure 5-11 shows another group of experimental test to validate the battery
model At the beginning of the experiment the terminal voltage from the
experiment is dropping without any discharge behaviour of battery and that is
because of the experiment was carried out when the terminal voltage of lead-acid
battery is not steady enough after being charged and that also causes the
deviations in the discharge at about 1000-2000 seconds In this period the lsquocoup
de fouetrsquo appears again After the first period the battery is disconnected from the
load until the terminal voltage become steady and the simulation result in this
period fits the experiment result well In the second discharge of this test it is
shown that the lsquocoup de fouetrsquo does not occur because the SOC is not high For
the similar reason in the first discharge in this group of the test results there are
95
also some deviations in this period Finally the simulation result in the last part of
figure fits the experimental result is highly satisfied
The average error of the simulated outputs of the simulation studies and the
measured results are studied Absolute Error and Relative Error is defined as the
following equations
sum
sum
=
=
minus=
minus=
N
i
sim
N
i
sim
iV
iViV
NRelError
iViVN
AbsError
1 exp
exp
1
exp
)(
)()(1
)()(1
The absolute error and relative error are summarised in Table 5-3
Table 5-3 AbsError and RelError of Model Validation
Absolute Error Relative Error discharging relaxing overall discharging relaxing overall
Experimental Test 1 (Identification)
00229V 00207V 00217V 01833 01724 01776
Experimental Test 2 (Validation data 1)
00536V 00484V 00492V 04453 03872 04024
Experimental Test 1 (Validation data 2)
00724V 00372V 00485V 06352 03013 05025
55 Summary and Discussions
Identification of the unknown model parameters is discussed in this chapter and a
range of possibly suitable methods are reviewed in brief In this project Genetic
Algorithm is adopted GAs working principle and its implementation has been
96
introduced in details in this chapter The simulation study of two benchmark
functions that are commonly used in evaluating evolutionary computation
algorithms are employed in order to show the capability of GAs The parameter
identification by tests of a brand new 13Ah lead-acid battery is carried out and is
validated by two sets of other experimental test results under the same working
condition of the same battery
97
Chapter 6
The Analysis of State of Health
(SOH) in association with the
Internal Resistance
61 Methodology
As the number of discharge cycles of battery increases in applications the
maximum charges that a battery can offer will decrease In other words the SOH
battery is deteriorating But this drop of capacity is not linear and it is also a long
progress At the beginning of the use of battery the change of capacity is very
slow and it is not obvious After a number of cycles of discharge and charge this
change will get faster and relatively significant
There are no reliable methods now to calculate the remaining charge capacity
which is the only one determinant of the state of health The normal method is
simply to measure the voltage on its terminals But this measurement is not
accurate on an aged battery A battery in poor state of health but sufficiently
charged can also offer sufficient voltage to appear normal The only way to
determine the capacity accurately is to integrate the discharge current of battery in
a full deep discharge but this method cannot be used too frequently because deep
98
discharge is harmful for the battery
In the project six lead-acid batteries were tested using the test system described in
Chapter 4 These batteries were repeatedly discharged and charged for their whole
life time so that the information related to different state of health can be revealed
as soon as possible Even though the batteries works frequently it still takes more
than 6 months to make the battery become weak The testing experiments were
carried out and the data was recorded every 2-3 weeks so that important value of
state of health is not missed However as the change of capacity is a long progress
and it is nonlinear not all the data collected can be used in this project
Referring the literature (Coleman Lee et al 2006 Lakhdari and Midoun 2007
Coleman Hurley et al 2008) an important factor that reflects the change of state
of health of a lead-acid battery is the internal resistance Not only the state of
health but also other factors (SOC DOC discharge current etc) can result in
variations in internal resistance a new alternative method that based on the
Improved Battery Model in Chapter 4 is adopted in the project
From the model study in Chapter 4 the internal resistance can be divided into two
parts expressed by )]1(1[ 0000 SOCARR minusminusminusminus++++==== (Eq 47) and )ln(101 DOCRR minusminusminusminus====
(Eq 48) These equations show that the internal resistance is affected by the state
of charge (SOC) and depth of charge (DOC) in a discharge cycle In real
applications batteries are seldom discharged to the full range because a deep
discharge could cause some damage to the battery They are also seldom to be
charged to full to prevent the possibility of overcharge that could also bring some
99
negative effects Although this issue is not very significant in a valve regulated
lead acid battery it is better to control the working range of depth of charge from
50 to 80 approximately In this project the internal resistance of battery in the
depth of charge of 65 is studied as a most important factor that related to the
state of health As a little inaccurate of SOC and DOC will induce a comparative
big difference in the internal resistance the method of measuring the internal
resistance accurately by an external circuit is discarded
In Equation 47 and Equation 48 the author found that there are two other factors
that influence the internal resistance besides the SOC and the DOC R00 and R10
Therefore in the project the values of R00 and R10 in a specific discharge current
are very important to study the internal resistance The values of these two factors
are used in Equation 47 and Equation 48 to calculate the internal resistance per
cell of the battery The depth of charge is assumed to be 65 for a normal
working battery as described previously In chapter 3 the SOC and the DOC are
defined as )0(1 θCQSOC eminus= (Eq 44) and )(1 θavge ICQDOC minus= (Eq
45) The Capacity is also defined as equation 42
k
c
fc
IIK
CK
IC))(1(1
)1(
)(
0
minusminusminusminus++++
++++
====
ε
θ
θ
θ (61)
in which Kc = 118 k = 120 and 6 II avg times= in this project The relationship
between the actual capacity under discharge current Iavg and the nominal capacity
is
100
62
1
))(1(1
1
)0)(1(1
1
))(1(1
1
)0(
)(asymp
minus+=
minus+
minus+=
k
avgck
c
k
avgcavg
IIK
IK
IIK
C
IC
θ
θ (62)
Therefore the SOC when the DOC is 65 is
586))0(62(1)0(1 asympsdotminus=minus= θθ CQCQSOC ee (63)
As described in chapter 5 30 asympA therefore the internal resistance of an
individual cell can be obtained by
10001000010 43041)ln()]1(1[ RRDOCRSOCARRRrcell sdot+sdotasympminusminus+=+= (64)
and for a six-cell lead-acid battery the internal resistance
1000 582486 RRrr cellbattery sdot+sdot=times= (65)
62 The identification of C0 R00 and R10
In the eight parameters identified previously in Chapter 5 there are only three
parameters can be affected by the change of battery conditions Therefore the
other five parameters ( 2100 ττAKE Em ) can be treated as a constant for a battery
The parameters that related to the battery condition 0010 RR and 0C are the key
problems which the project focused on 0C represents the state of health while
the 0010 RR stands for the internal resistance parameters Here again the Genetic
algorithm is adopted to identify these three parameters
In this project the battery have been discharged and charged in hundreds of cycles
to simulate the capacity loss in the normal applications which is described by the
101
state of health in this project In order to find out the different behaviour of
internal resistance in different state of health experimental tests have been carried
out in different state of health of the battery
The first test is carried out when the battery is brand new and the data is also used
to identify the other parameters of the battery model as described in the previous
chapter The second group of data is collected after 300 discharge cycles
approximately and the third test took place after 200 more cycles The number of
discharge cycles between the last four tests is only about 50 because the change of
State of Health is more significant The identified parameters of a battery in
different state of health are shown in table 6-1
Table 6-1 Battery Remaining Capacity and Internal Resistance
Remaining
Capacity C0 (Amps)
SOH R00 R10 RelError Internal
Resistance (Ohm)
Test 1 48198 100 00609 00220 01756 05683
Test 2 44861 9314 00654 00103 07428 05759
Test 3 38025 7889 00635 00191 02812 05827
Test 4 33830 7019 00573 00509 07265 06126
Test 5 30625 6354 00604 00582 04340 06575
Test 6 26072 5306 00703 00368 01342 06855
And the terminal voltages simulated and measured are shown as the following
figures The same as previous figures the blue lines represent the measured
outputs while the red lines represent the simulation results
The test shows in figure 6-1 the same as the test which is used to describe the
genetic algorithms and the battery parameter identification in chapter 5 Detailed
102
description and analysis are given in chapter 5
0 500 1000 1500 2000 2500 3000 350011
112
114
116
118
12
122
124
126
128
13
Time (s)
Term
inal voltage (
V)
Experimental Terminal Voltage
Simulated Terminal Voltage
Experimental Terminal Voltage
Simulated Terminal Voltage
Figure 6-1 Experimental and Simulated Terminal Voltage of Test 1 (SOH = 100)
103
0 1000 2000 3000 4000 5000 600011
112
114
116
118
12
122
124
126
128
13
Time (s)
Term
inal V
oltage (
V)
Simulated Terminal Voltage
Experimental Terminal Voltage
Simulated Terminal Voltage
Experimental Terminal Voltage
Figure 6-2 Experimental and Simulated Terminal Voltage of Test2 (SOH= 9314)
The experiment shown in figure 6-2 is tested several months after the first
experimental test In the period that the first discharge begins the experimental
result shows a different slope in terminal voltage The reason is probably that the
battery have just charged to full by a charger and itrsquos the capacitor had not fully
discharged After that when the discharge stopped there is a deviation in the
simulation voltage In the authorrsquos opinion that is because of the accuracy of R10
and R00 If the value of R10 is greater and that of R00 is smaller the simulation
result should fit the experimental result In the second discharge period of the
discharge test there is also a little difference in the experimental and simulation
result caused by the inaccuracy of battery parameters But it shows a good
agreement when the discharge stopped
104
0 500 1000 1500 2000 2500 3000 3500 400011
112
114
116
118
12
122
124
126
128
13
Time (s)
Term
inal V
oltage (
V)
Simulated Terminal Voltage
Experimental Terminal Voltage
Simulated Terminal Voltage
Experimental Terminal Voltage
Figure 6-3 Experimental and Simulated Terminal Voltage of Test3 (SOH= 7889)
0 500 1000 1500 2000 2500 3000 3500 4000 4500 500011
112
114
116
118
12
122
124
126
128
13
Time (s)
Term
inal V
oltage (
V)
Simulated Terminal Voltage
Experimental Terminal Voltage
Simulated Terminal Voltage
Experimental Terminal Voltage
Figure 6-4 Experimental and Simulated Terminal Voltage of Test4 (SOH= 7019)
105
0 1000 2000 3000 4000 5000 600011
112
114
116
118
12
122
124
126
128
13
Time (s)
Term
inal V
oltage (
V)
Experimental Terminal Voltage
Simulated Terminal Voltage
Simulated Terminal Voltage
Experimental Terminal Voltage
Figure 6-5 Experimental and Simulated Terminal Voltage of Test5 (SOH= 6354)
Figure 6-3 figure 6-4 and figure 6-5 show the test results of the battery when the
SOH drops to its 80 70 and 60 It is shown that the simulation result in
figure 6-3 fits the experimental result until the end of test when the discharge of
battery has just stopped The inaccuracy of the R10 and R00 is also the main cause
of the deviation The overall simulation result in figure 6-4 figure 6-5 are good to
express the battery behaviour
106
0 500 1000 1500 2000 2500 3000 3500 400011
112
114
116
118
12
122
124
126
128
13
Time (s)
Term
inal V
oltage (
V)
Experimental Terminal Voltage
Simulated Terminal Voltage
Experimental Terminal Voltage
Simulated Terminal Voltage
Figure 6-6 Experimental and Simulated Terminal Voltage of Test6 (SOH= 5306)
In the parameter identification of test shown in figure 6-6 the remaining capacity
is only about 12 of the initial capacity when the battery is brand new During the
discharge period the simulation and experimental result is not fitting very well
and the slopes of them are not the same This is probably also caused by
insufficient idle time after being charged and the capacitor had not fully
discharged
Figure 6-7 represents the internal resistance value in different state of health as
described in table 6-1
107
100 95 90 85 80 75 70 65 60 55 5004
045
05
055
06
065
07
075
08
State of Health
Inte
rnal R
esis
tance (
Ohm
)
r vs SOH
Approximation
Figure 6-7 Change of Internal Resistance in Different State of Health (Battery 1)
It is shown that the internal resistance is increasing when the state of health of a
lead-acid battery decreases This progress is at first very slow when the battery is
new But after a number of discharge cycles the remaining capacity of battery
drops to about 75 of the initial capacity when the battery is new and the
increase of internal resistance become faster When the state of health is brought
down to about 50 which means that the battery cannot offer enough energy as
new the value of internal resistance is increased by 30 approximately At
present there is not a published quantitative description of the internal resistance
when the capacity changes yet but it has been agreed that the internal resistance
increases while the battery health deteriorates
Similar tests have been carried out on 5 other batteries with the same nominal
108
capacity and the changes of their internal resistances are given as figure 6-8 It is
not possible to deduce a statistical approximation equation only based on the
existing data but it can be seen from the figure that the performance of internal
resistance under different state of health shows an agreement in a certain extent
100 95 90 85 80 75 70 65 60 55 5003
04
05
06
07
08
09
State of Health
Inte
rnal R
esis
tance (
Ohm
)
r vs SOH (Battery 1)
r vs SOH (Battery 2)
r vs SOH (Battery 3)
r vs SOH (Battery 4)
r vs SOH (Battery 5)
r vs SOH (Battery 6)
Figure 6-8 Change of Internal Resistance in all 6 Batteries
63 Summary and Discussions
The determination of battery remaining capacity accurately is becoming
increasingly important in modern battery managements This currently is mostly
obtained by integrating the discharge current of a full discharge but this progress
usually causes a negative effect on most of the batteries There is also a view that
109
the state of health which represents the percentage of remaining capacity of a
weak battery compared with the initial capacity when brand new can affect the
internal resistance therefore the battery state of health can be obtained by the
study of battery internal resistance However from the analysis based on the
mathematical model and the experimental results it can be concluded that other
parameters can also cause variations of the internal resistance which make the
estimation of the state of health more challenging
This chapter describes a new alternative method that based on the Improved
Battery Model and the key parameters of the model The remaining maximum
capacity of a used battery which represents the SOH of the battery is related in
the internal resistance under the depth of charge of 65 which is expressed by
the parameters of R00 and R10 These parameters can be identified by genetic
algorithms A result that quantifies the change of internal resistance in different
SOH values has been concluded based on the analysis of a series of experimental
tests
110
Chapter 7
Conclusions and Future
Research
This chapter summarizes the major achievements of the presented research work
in the field of battery modelling and state of health analysis Possible direction of
further research work is also described briefly in this chapter
71 Summary
Lead-acid batteries are used in various industrial sectors and are irreplaceable due
to their low price In areas where lead-acid batteries are employed as an energy
storage device the capacity loss caused by the repeated dischargecharge cycles is
very common This drop of capacity can neither be avoided nor be repaired by
using current technologies As a result it is essential to know whether the battery
is able to meet the demand and if it should be replaced on time
In this thesis a study on the capacity status of a battery and its relation to the
internal resistance had been conducted and this thesis established a novel model
based method to quantify the battery health An Equivalent Circuit Mathematical
model for the discharging progress of a lead-acid battery has been developed for
this purpose and is implemented under MatlabSIMULINK software environment
111
The model involves most of the important concepts of a battery to reflect the
dynamic response of terminal voltage when discharging
A series of experimental tests have been carried out during the project for the
model validation and the study of the state of health Six 12V-13Ah lead-acid
batteries with the same rated capacity are discharged and recharged from brand
new to obtain different values of state of health Genetic algorithm has been
employed to identify the unknown parameters of the battery model in each state of
health and the identified parameters are used as the factors that reflecting the state
of health and the internal resistance The internal resistances corresponding
different state of health have been collected and recorded A result was found in
the thesis that for the 12V-13Ah lead-acid battery which is used in the
experimental tests the value of internal resistance is increased by 25
approximately if the SOH of battery drops to 50
72 Limitations
The key limitation of the method introduced in this thesis is that it is based on the
parameter identifications of the model which means a test is still needed in order
to obtain the state of health The major reason is that the mathematical model does
not include the charging progress of battery which is also an important period of
the battery duty cycle Another limitation is that all the tests of the state of health
estimation are carried out at the same discharge rate because of the variation of
the internal resistance in different discharge rate as discussed in chapter 4 Finally
112
The lsquocoup de fouetrsquo behaviour that of took place at the beginning of discharge
when batteries are full is not able to be simulated in the current version of
mathematical model
73 Future Research Work
Following the limitations of the project some future research can be carried out in
three steps based on the model improvements and the practical applications of the
algorithm
First of all improvements of the discharging battery model can be carried out
which can mainly focus on the study of the battery internal resistance in different
discharge rates Equations of internal resistances that can withstand the change of
discharge rate will make the model capable for online applications Studies on the
relationship between the electromotive force and the state of charge can also lead
to a solution of the lsquocoup de fouetrsquo behaviour and a better simulation result
Another research work on the model modification is that the behaviour of battery
to the mathematical model when a battery is being charged can be involved by
which the monitoring system of battery can be implemented in the whole duty
cycles This part of work can be focused on the parasitic branch in the
mathematical model described in chapter 3
Further work should also reveal the variations of state of health in different duty
113
cycles and an algorithm based on this change should be designed to estimate the
remaining life-time of a lead-acid battery The value of current state of health and
the estimated raining life-time should also be considered as major outputs in this
period of work It is also possible to design an online management device of
battery to estimate the life-time and the state of health
114
References
Anon (2006) Global Wind Energy Council (GWEC) statistics [online] from
httpwwwgwecnetuploadsmedia07-
02_PR_Global_Statistics_2006pdf
Anon (2007) Battery Types Flooded versus AGM and Gel [online]
Retrieved February 13 2007 from
httpwwwvonwentzelnetBattery01Type
Anon (2007) BP Statistical Review of World Energy June 2007 [online] from
httpwwwbpcomliveassetsbp_internetglobalbpglobalbp_uk_englishr
eports_and_publicationsstatistical_energy_review_2007STAGINGlocal_
assetsdownloadsspreadsheetsstatistical_review_full_report_workbook_2
007xls
Anon (2007) International Energy Outlook 2007 [online] from
httpwwweiadoegovoiafieohighlightshtml
Ball R J Evans R and Stevens R (2002) Finite element (FE) modelling of
current density on the valve regulated leadacid battery positive grid
Journal of Power Sources 103(2) 213-222
Bernardes A M Espinosa D C R and Tenoacuterio J A S (2004) Recycling of
batteries a review of current processes and technologies Journal of
Power Sources 130(1-2) 291-298
Berndt D (1993) Maintenance-Free Batteries -- A Handbook of Battery
Technology Somerset Research Studies Press Ltd
Berndt D (2001) Valve-regulated lead-acid batteries Journal of Power
Sources 100(1-2) 29-46
115
Berndt D (2009) Electrochemical Energy Storage Battery Technology
Handbook CRC Press
Casacca M A and Salameh Z M (1992) Determination of lead-acid battery
capacity via mathematical modeling techniques Energy Conversion
IEEE Transaction on 7(3) 442-446
Ceraolo M (2000) New dynamical models of lead-acid batteries Ieee
Transactions on Power Systems 15(4) 1184-1190
Chan H L and Sutanto D (2000) A new battery model for use with Battery
Energy Storage Systems and Electric Vehicles Power Systems 2000 Ieee
Power Engineering Society Winter Meeting - Vols 1-4 Conference
Proceedings 470-475
Chen M and Rincacuteon-Mora G A (2006) Accurate electrical battery model
capable of predicting runtime and I-V performance IEEE
TRANSACTIONS ON ENERGY CONVERSION VOL 21( NO 2)
504-511
Chipperfield A J Fleming P J and Fonseca C M (1994A) Genetic algorithm
tools for control systems engineering Adaptive computing in
engineering design and control Plymouth UK
Chipperfield A J Fleming P J Pohlherim H and Fonseca C M (1994B)
Genetic algorithm toolbox for use with Matlab Department of automatic
control and systems engineering University of Sheffield
Crompton T R (2000) Battery Reference Book Third Edition Oxford
Elsevier Newnes
Cun J P Fiorina J N Fraisse M Mabboux H A and Mabboux H The
116
experience of a UPS company in advanced battery monitoring
Telecommunications Energy Conference 1996 INTELEC 96 18th
International 646 - 653
Durr M Cruden A Gair S and McDonald J R (2006) Dynamic model of a
lead acid battery for use in a domestic fuel cell system Journal of Power
Sources 161(2) 1400-1411
Esfahanian V Torabi F and Mosahebi (2008) An innovative computational
algorithm for simulation of lead-acid batteries Journal of Power
Sources 176(1) 373-380
Gillioli R and Cerolo P (1990) Charge and discharge fourth order dynamic
model of the lead battery 10th
intl Electric Vehicle Symposium Hong
Kong p1-9
Glendenning I (1981) Compressed air storage Physics in Technology 12(3)
103-10
GONG Q (2005) Modeling study of a vehicle traction battery model
CHINESE LABAT MAN 2005 Vol 42 Numb 2 issu 155 pages 76-79
Houck C Joines J and Kay M (1995) A Genetic Algorithm for Function
Optimization A Matlab Implementation NCSU-IE TR 95-09
Jacobi W (2009) Lithium Batteries Battery Technology Handbook CRC Press
Jayne M G and Morgan C (1986) a new mathematical model of lead acid
battery for electric vehicles Eighth Intl electric vehicle conference
Washington DC
Juvonen M (2003) Large-Scale Energy Storage Systems [online] from
httpwwwdocicacuk~mattiise2grpenergystorage_reportstoragehtml
117
Lee J H Lee K Y and Lee J Y (1996) Self-discharge behaviour of sealed
Ni-MH batteries using MmNi33+xCo07Al10-x anodes Journal of
Alloys and Compounds 232(1-2) 197-203
Liaw B Y Gu W B and Wang C Y (1997) Numerical simulation of coupled
electrochemical and transport processes in battery systems Proceedings
of the Intersociety Energy Conversion Engineering Conference
Honolulu HI USA IEEE
Lu S Meegahawatte D H Guo S Hillmansen S Roberts C and Goodman
C J (2008) Analysis of energy storage devices in hybrid railway vehicles
Railway Engineering - Challenges for Railway Transportation in
Information Age 2008 ICRE 2008 International Conference on
Mantell C L (1984) Batteries and energy systems Second Edition McGraw-
Hill Inc
MathWorks Inc (2004) Genetic Algorithm Direct Search Toolbox V102
MathWorksInc
MPowerSolutionsLtd (nd) Alternative Energy Storage Methods [online]
from httpwwwmpowerukcom
Okoshi T Yamada K Hirasawa T and Emori A (2006) Battery condition
monitoring (BCM) technologies about lead-acid batteries Journal of
Power Sources 158(2) 874-878
Perrin M Delaille A Huet F and Hernout L (2006) Study of the coup de
fouet of lead-acid cells as a function of their state-of-charge and state-of-
health Journal of Power Sources 158(2) 1019-28
Pham D T and Karaboga D (1998) Intelligent Optimisation Techniques
118
Genetic Algorithms Tabu Search Simulated Annealing and Neural
Networks New York Springer-Verlag New York Inc
RailPower Hybrid Technologies C (nd) Benifits of Hybrid Locomotives
[online] from httpwwwrailpowercomproducts_hl_benefitshtml
Rand D A J Moseley P T and Garche J (2004) Valve-Regulated Lead-Acid
Batteries Elsevier
Ruetschi P (2004) Aging mechanisms and service life of lead-acid batteries
Journal of Power Sources 127 (1-2) 33-44 Switzerland Elsevier
Salameh Z M Casacca M A and Lynch W A (1992) A mathematical model
for lead-acid batteries IEEE Trans on Energy conversion Vol7 No 1
Sato Y Takeuchi S and Kobayakawa K (2001) Cause of the memory effect
observed in alkaline secondary batteries using nickel electrode Journal
of Power Sources 93(1-2) 20-24
Sims R I Carnes J C Dzieciuch M A and Fenton J E (1990) Computer
modeling of Automotive lead acid batteries Ford Research Laboratories
Technical Report
Smil V (2007) Energy at the Crossroads Massachusetts Achorn Graphic
Services Inc
Ter-Gazarian A (1994) Energy storage for power systems London Peter
Peregrinus Ltd
TNI_Ltd (2007) Battery history [online] from
httpwwweuropulsecombattery_historybattery_historyhtm
Tuck C D S (1991) Modern Battery Technology Ellis Horwood Ltd
Wei J (2007) Development of Coal Mill and Aggregate Load Area Models in
119
Power Systems using Genetic Algorithms University of Liverpool PhD
Wikipedia (nd) Lead-Acid Battery [online] from
httpenwikipediaorgwikiLead-acid
Wikipedia (nd) Rechargeable Batteries [online] from
httpenwikipediaorgwikiRechargeable_battery
Wikipedia (nd) VRLA [online] from httpenwikipediaorgwikiVRLA
Zhang Y L Liu P H Zhang Q Y and Cheng W (2010) Separation of
cadmium(ii) from spent nickelcadmium battery by emulsion liquid
membrane Canadian Journal of Chemical Engineering 88(1) 95-100
120
Appendix I SIMULINK Diagrams of Battery Model
Figure A-1 SIMULINK Diagrams of ldquoMain Blockrdquo
121
Figure A-2 SIMULINK Diagrams of ldquoTerminal Voltage Calculationrdquo
122
Figure A-3 SIMULINK Diagrams of ldquoThermal Behaviourrdquo
123
Figure A-4 SIMULINK Diagrams of ldquoBattery Capacityrdquo
Figure A-5 SIMULINK Diagrams of ldquoBattery State of Chargerdquo
Figure A-6 SIMULINK Diagrams of ldquoBattery Depth of Chargerdquo
124
Figure A-7 SIMULINK Diagrams of ldquoBattery Electromotive Forcerdquo
(a)
(b)
Figure A-8 SIMULINK Diagrams of ldquoBattery Internal Resistancerdquo
125
Appendix II
List of Publications
S Hillmansen S Lu D H Meegahawatte S Guo C Roberts and C J
Goodman Analysis of Energy Storage Devices in Hybrid Railway Vehicles International Conference on Railway Engineering 2008 p68-73 Hong Kong China 25-28 March 2008
Y Yin X Luo S Guo Z Zhou J Wang A battery charging control strategy for
renewable energy generation systems The Proceedings of World Congress on Engineering 2008 Vol 1 pp356-361 London UK 2-4 July 2008
S Guo S Hillmansen Y Yin J Wang State of Health Monitoring of Lead-acid
Batteries Proceedings of the 14th International Conference on Automation amp Computing pp250-254 Brunel University West London UK 6 September 2008
Y Yin C Li Z Zhou Q Liu S Guo X Luo J Wang Design and Realization of a
PS2 Keyboard Interface in Embedded system Proceedings of the 14th International Conference on Automation amp Computing pp160-163 Brunel University West London UK 6 September 2008
Yin Y Wang J Luo X Guo S Development of a battery charging management
unit for renewable power generation a book chapter in Advances in
Electrical Engineering and Computational Science Edited by Sio-Long Ao and Len Gelman pp33-46 Springer 2009
Wang J Wei JL Guo S Condition monitoring of power plant milling process
using intelligent optimization and model based techniques accepted as a chapter in the book of Fault Detection in March 2009
S Guo S Hillmansen J Wang Model Based Analysis of Battery State of Health
using Genetic Algorithms accepted by the International Conference on Systems Engineering (ICSE) Coventry 8-10 September 2009

1
to my parents
2
Acknowledgements
First and foremost I would like to express my sincere appreciation to my
supervisors Dr Stuart Hillmansen and Dr Jihong Wang for their support
guidance inspiration and patience during my MPhil study I have greatly
benefited from their knowledge and experience
I am also grateful to Dr Jianlin Wei and Dr Nan Jia for their support and advices
during my research and to Dr Leonid Shpanin for his assistance in my laboratory
experiments Many thanks to Mr Bo Fan Mr Shaofeng Lu and Mr Lei Chen for
their valuable ideas shared with me I would also like to thank Mr Hao Sun Mr
Xing Luo as well as all the other colleagues for their discussions and their kind
assistant during my study
Finally I would like to thank my family and all my friends Without their
encouragement support and understanding this thesis would not have been
possible
3
Abstract
Batteries are becoming increasingly important to our life as they are applied in a
range of different areas Therefore the reliability of battery is a critical issue in
these battery applications It has been noticed that most batteries have limited
cycle durability that is the total capacity drops when a battery is charged and
discharged for a number of cycles If a battery is too weak to offer sufficient
energy it should be replaced at the right time But current problem is that there is
no reliable method available to quantify the capacity loss and to estimate whether
the remaining capacity of battery Complete discharge which is the only way of
capacity estimation has a negative effect to the battery plates therefore it cannot
be used too frequently
This thesis summarises the research work in the development of the battery status
estimation algorithm The work initially focused on the mathematical descriptions
of lead acid batteries and a mathematical model based on this study was then
developed and implemented to describe the process of battery discharge Genetic
Algorithms (GAs) were used as a tool to identify the parameters related to the
battery including the internal resistances state of charge and capacity The
relevant simulation results show that the model is able to adequately simulate the
battery discharge process
The aforementioned models were extended to a further investigation of the
batteries state of health It was noticed that there is a link between the status of
4
battery health and the internal resistance In this project six batteries were
discharged and charged in several times in order to simulate the capacity loss that
occurs in normal operation This capacity loss is related to the state of health and
the parameter estimation was able to adequately distinguish between different
state of health
These results indicate that the internal resistance increases when the state of health
of a lead-acid battery decreases This progress is at first very slow when the
battery is new but the change becomes faster when the remaining capacity of
battery drops to about 75 of the initial It is found in the thesis that the value of
internal resistance is increased by 25 approximately when the state of health is
brought down to about 50 meaning that the battery cannot offer enough energy
as new and should be replaced for safety consideration
The method described within this thesis performed adequately in the limited tests
performed during the experimental work Further investigations are recommended
in order to refine the method which is potentially suitable for online
implementation in battery condition monitoring systems
5
Contents
Chapter 1 Background and Objectives of the Project 1
11 Overview 1
12 Review of Energy Storage Systems 2
121 Applications of the Energy Storage Systems 2
122 Review of the Existing Energy Storage Devices 4
123 Review of Batteries 7
124 The Management of Batteries 11
13 Project Objectives 12
14 Outline of the thesis 13
Chapter 2 Introduction of Lead-acid Batteries 15
21 A General Overview of the Lead-acid Battery 15
22 Configuration of Lead-acid Batteries 18
221 Electrochemical Principles 18
222 Lead-Acid Battery Types and Technologies 20
223 Battery Designs for Different Applications 22
23 Mathematical Descriptions of Lead-acid Batteries 23
231 Capacity 23
232 Electromotive force 24
233 State of Charge and Depth of Charge 26
234 Internal Resistance and State of Health 27
235 Multi-Cell Lead-Acid Batteries 29
24 Summary 29
6
Chapter 3 Equivalent Circuit Modelling of Lead-acid Batteries 31
31 Requirements for the Battery Model 31
32 Overview of Battery Model Techniques 32
321 Electrochemical Model 32
322 Physical Models 33
323 Equivalent Circuit Model 34
324 Discussion of Different Battery Model Methods 35
33 Introduction of the Existing Equivalent Circuit Models 37
331 Simple Battery Model 37
332 Advanced Simple Battery Model 39
333 Thevenin Battery Model 40
334 Dynamic Battery Model 42
335 Fourth Order Dynamic Model 43
336 Improved Battery Model 44
34 Mathematical Model of the Lead-acid Batteries 44
341 Capacity 45
342 Electric Networks 48
343 State of Charge and Depth of Discharge 50
344 Electromotive Force of the Battery 50
345 Internal Resistance of a Battery 51
346 The Behaviour of Parasitic Branch 52
347 Main Branch Capacitance 53
348 Thermal Behaviour of a Battery 55
35 Mathematical Model of the Lead-acid Batteries 56
7
36 Summary and Discussion 57
Chapter 4 Experimental System Set up and Improved Battery Model Simulation
Implementation 59
41 The Experimental System 59
42 Improvements of the Battery Model 61
421 The Change of τ in Different Charge Status 63
422 Analysis in Variations of the Internal Resistance 64
423 Improved Lead-Acid Battery Mathematical Model 66
43 Simulation Study 68
44 Summary and Discussion 72
Chapter 5 Model Parameter Identification and Model Validation 73
51 Need for the Optimization Algorithms 73
52 Overview of the Optimization Algorithms 74
53 The Study of the Genetic Algorithms 77
531 Working Principle of GAs 77
532 Simulation Studies of Genetic Algorithms 81
54 Model Parameter Identification 87
541 Implementation of Genetic Algorithms and Experimental Data sets
87
542 Parameters of Battery Model 90
543 Battery Model Validation 92
55 Summary and Discussions 95
Chapter 6 The Analysis of State of Health (SOH) in association with the Internal
Resistance 97
8
61 Methodology 97
62 The identification of C0 R00 and R10 100
63 Summary and Discussions 108
Chapter 7 Conclusions and Future Research 110
71 Summary 110
72 Limitations 111
73 Future Research Works 112
9
List of Figures
Figure 1-1 Power density vs energy density plot 7
Figure 2-1 Working Principle of Lead-Acid Batteries (a) shows the battery when
discharging and (b) is when charging with a DC charger 18
Figure 3-1 Simple Battery Model 38
Figure 3-2 I-V chart of the Simple Battery Model 39
Figure 3-3 I-V Chart in different SOC 40
Figure 3-4 Sketch to show battery discharge behaviours in typical tests 41
Figure 3-5 Thevenin Battery Model 42
Figure 3-6 Fourth-order Battery Model43
Figure 3-7 Improved Battery Model 44
Figure 3-8 Battery Capacity vs Discharge Current 47
Figure 3-9 Lead-acid Battery Equivalent Network 48
Figure 3-10 The Equivalent Network with the Approximated mZ 49
Figure 3-11 R-C block 53
Figure 4-1 Equivalent Circuit of the Experimental Test Rig 60
Figure 4-2 Experimental Test Rig61
Figure 4-3 Test of constant-impedance load discharge 62
Figure 4-4 Test of two-load discharge 62
Figure 4-5 Structure of model for SIMULINK Implementation69
Figure 4-6 Terminal Voltage of Battery 71
Figure 5-1 Flowchart of a Simple Genetic Algorithm78
Figure 5-2 2-dimensional Rastrigins function83
Figure 5-3 Contour plot of Rastrigins function84
10
Figure 5-4 GA performance (Rastrigrinrsquos function) 85
Figure 5-5 2-dimensional Rosenbrock function 86
Figure 5-6 GA performance (Rosenbrock function) 87
Figure 5-7 Progress of Parameter Identification 88
Figure 5-8 Measured and Simulated Result after Parameter Identification 91
Figure 5-9 Mean and the Best Fitness Values in Each Generation 92
Figure 5-10 Measured and Simulated Terminal Voltage 93
Figure 5-11 Measured and Simulated Terminal Voltage 94
Figure 6-1 Experimental and Simulated Terminal Voltage of Test 1 (SOH = 100)
102
Figure 6-2 Experimental and Simulated Terminal Voltage of Test 2 (SOH=9314)
103
Figure 6-3 Experimental and Simulated Terminal Voltage of Test 3 (SOH=7889)
104
Figure 6-4 Experimental and Simulated Terminal Voltage of Test 4 (SOH=7019)
104
Figure 6-5 Experimental and Simulated Terminal Voltage of Test 5 (SOH=6354)
105
Figure 6-6 Experimental and Simulated Terminal Voltage of Test 6 (SOH=5306)
106
Figure 6-7 Change of Internal Resistance in Different State of Health (Battery 1)
107
Figure 6-8 Change of Internal Resistance in all 6 Batteries 108
1
Chapter 1
Background and Objectives of
the Project
11 Overview
Fossil fuels have been the main energy resource in recent human history although
their continuing use has been shown to have a detrimental effect on the
environment The principal problem for fossil fuels is that they cannot be
reproduced within a short period of time so it is a finite energy supply source If
current consumption rate continues they will be exhausted in a few generations
from now Fossil fuel has never been considered as a clean-resource because there
is an emission of noxious gasses including CO CO2 NOx SOx and HC into the
atmosphere With all the pressure from the problems associated with the fossil
fuel exploration of the usage of renewable energy is becoming an increasingly
important issue
Wind energy hydro energy and solar energy are three of the most important
renewable energy sources and they have been implemented on a large scale wind
energy has produced a annual global total of 65019 times 1012 Wmiddoth
(74223 MWtimes24htimes365 days) (Anon 2006) energy in the year 2006 and hydro
2
energy is about 304 times 1015 Wmiddoth (30404 times 1012 Wmiddoth) (Anon 2007) Solar energy
resources are estimated at about 10694times1015 Wmiddoth (3850times1021 J) (Smil 2007) To
compare with the worldwide energy consumption of 13097times1015 Wmiddoth in the year
2007 it is clear that renewable energies have a significant role to play (Anon
2007)
However the problem of the implementation of the renewable energy is that the
electricity generated is intermittent and the power systems are experiencing the
problem of rapidly changing power demand Therefore the management of the
energy is an important issue Devices of energy storage should solve these
problems in theory
12 Review of Energy Storage Systems
Not only giving a large scale energy solution energy storage devices are also
commonly used in a range of applications related to everybody Different energy
storage technologies are suited to different applications and consideration must be
made in order to select the correct solution for each application This section will
give an overview of the existing energy storage systems
121 Applications of the Energy Storage Systems
Large scale energy storage systems which are also called grid energy storage
refer to the methods used to large-scale store electricity within an electrical power
grid Off-peak energy is stored during times when production (from power plants)
3
exceeds consumption and the stores are utilized at times when consumption
exceeds production In this way electricity production need not be drastically
scaled up and down to meet momentary consumption ndash instead production is
maintained at a more constant level
Despite the applications in grid scale the energy storage systems are also popular
in a number of areas For example they are usually used to optimize the energy
generated from the engine in modern electrical hybrid vehicles One such
application is in a shunter locomotive A shunter is a small railroad locomotive
intended for assembling trains ready for a road locomotive to take over
disassembling a train that has been brought in and switching a train to another rail
at the rail terminals The duty cycle of a shunter is characterised by short duration
high power demands (accelerating a rake of vehicles) and the long periods of
idling while the train waits for other operations Comparing to traditional shunter
locomotive that use diesel engines only for the whole duty cycle hybrid shunter
locomotives with energy storage devices can have a 40-70 reduction in fuel use
(RailPower Hybrid Technologies nd) This saving is made by operating the prime
mover at its optimum
Another application of energy storage in the vehicle technologies is the
regenerative braking system which is used to save the braking energy of vehicle
The potential of this technology to save energy for a vehicle is depends on the
duty cycle (Lu Meegahawatte et al 2008) which is characterized by storing the
energy generated when the vehicle is decelerating and releasing when accelerating
4
Energy storage devices are also very popular in stationary applications also
known as the Uninterruptible Power Supply (UPS) systems This system is
designed to meet the power demand when problems like power failure happen and
it is important especially in the applications where power failures could have
serious consequences for example in hospitals and computer centres (Berndt
2009)
The energy storage devices in the UPS system are often used to achieve
ldquouninterruptiblerdquo in a short period before the secondary power supply started
When a power problem occurs the energy storage device starts to supply
electricity immediately and at the same time the generator begins to start When
the generator is ready to supply sufficient power the energy storage device stops
providing power When the grid power is recovered the energy storage device can
be recharged until full
122 Review of the Existing Energy Storage Devices
There are various kinds of energy storage systems including pumped hydro
compressed air flywheel supercapacitors electrochemical and also
superconducting magnetic Each technology is suited to different applications and
careful consideration must be made in order to select the correct solution for each
application
Pumped hydro is the oldest and the most effective kind of large scale energy
storage method which have been used for nearly a century since 1929 (Juvonen
5
2003) Two large reservoirs at different altitudes with a pump a turbine a motor
and a generator are employed to collect the off-peak energy The water is released
from the higher one through a turbine to generate electricity during peak load
period
Compressed air is a pneumatic energy storage method that refers to the air kept
under a certain pressure This system can be used in grid energy storage that the
air can be stored by compressors during periods with low power demand This
compressed air can be released to a generator to meet the high power demand
during peak time (Glendenning 1981 Ter-Gazarian 1994 Juvonen 2003) In some
applications the compressed air is released through a combustor mixed with
natural gas to obtain a higher overall efficiency
A capacitor is an electrical device that can store energy in an electric field
between a pair of conductors and is often used in circuits for short term energy
storage It blocks the circuit to hold DC voltage Supercapacitors are energy
storage devices with the same principle but with a higher energy density The
power density of the supercapacitor systems can be very high but the energy is
often released in a very short duration (Ter-Gazarian 1994) As a result the
supercapacitors are usually used in applications of an energy burst
Superconducting magnetic energy storage system stores energy in the magnetic
field generated by direct current in a coil Instead of traditional wires like copper
superconductors are employed to avoid the energy consumptions as heat because
of the resistance A problem is that the optimal operating temperature for
6
superconductors is 50-77K a refrigerator is therefore necessary in the system for
cooling down
Flywheels are considered as a method of storing mechanical kinetic energy by
accelerating a flywheel to a very high speed to store the energy and decelerating
to release the energy Flywheels are very efficient for short duration storage cycles
due to their fast response speed These energy storage devices are used mainly in
applications that demand kinetic energy storage and high numbers of deep
discharge cycles
Electrochemical energy storage stands for the device capable of converting
chemical and electrical energy to each other by chemical reactions Batteries are
the most common technology of electrochemical energy storage methods The
oxidation and reduction reactions in the two electrodes of battery lead to the
current through the external circuit when discharging to provide energy The
secondary battery can be recharged by applying electrical current which reverses
the chemical reactions that occur during the discharge
Fuel cell is another technology with very high energy density that converts the
chemical energy in a source fuel into an electrical current The fuel cells are
considered as the ldquoenvironmental friendlyrdquo as the only by-product is water The
working principle of fuel cells when discharging is the same as the batteries but
unlike the batteries the fuel cells do not need recharge as they only provide
electrical energy while the active chemicals are supplied to the electrodes (Mantell
1984 MPowerSolutionsLtd nd)
7
Figure 1-shows the Ragone chart of the energy and power density of some energy
storage systems
Figure 1-1 Power density vs energy density plot (MPowerSolutionsLtd nd)
123 Review of Batteries
The preceding discussion has identified that energy storage devices are becoming
increasingly important in both stationary and mobile applications Battery as the
most popular energy storage device is studied in this section
There are two different types of batteries applied in a large range of areas now
Primary batteries and Rechargeable batteries Primary batteries which are also
called disposable batteries often have higher energy densities than the
rechargeable ones and they have a lower self-discharge (Ter-Gazarian 1994)
8
However as the chemical reactions in these batteries are not reversible and the
active materials cannot be restored to their initial forms these batteries cannot be
reliably recharged The primary batteries are intended to be used once and then
discarded therefore they are not suitable for the energy storage systems
Rechargeable battery is the other type of the electrochemical batteries which is
also known as secondary battery because their electrochemical reactions are
electrically reversible There are many different rechargeable battery technologies
in which only four of them are leading the world market nickel-cadmium nickel-
hydride lead-acid and lithium-ion (Berndt 1993 Berndt 2009)
The Nickel-cadmium (NiCd) battery is a kind of rechargeable battery that uses
nickel oxide hydroxide and metallic cadmium as electrodes and an alkaline
electrolyte (often potassium hydroxide) (Mantell 1984) As designed to compete
the primary batteries the NiCd batteries are often manufactured in the same size
and they are used in the consumer market as primary batteries for example in
clocks toys radios and cordless tools However when the NiCds are substituted
for primary cells the lower terminal voltage and smaller ampere-hour capacity
may reduce performance as compared to primary cells The most attractive feature
of the nickel-cadmium batteries is that they are more difficult to damage
comparing with other batteries during deep discharge cycles They can also
sustain more cycles and the lower internal resistance can also help achieve a
higher maximum discharge rate A problem preventing the large scale application
of this battery technology is that the nickel-cadmium batteries suffers faster self
discharge rate than other rechargeable batteries and the cadmium used as the
9
active material in one of the electrodes is toxic and expensive (Zhang Liu et al
2010) Furthermore the capacity loss caused by the continuously discharge and
recharge to the same state of charge called ldquomemory effectrdquo is also a very
important issue of the nickel-cadmium batteries (Sato Takeuchi et al 2001)
The nickel-metal hydride (NiMH) battery is a type of secondary electrochemical
battery that designed to substitute for the nickel-cadmium cells They have a
similar size and a similar cell voltage but with more advantages By using
hydrogen-absorbing alloy as negative electrode instead of cadmium this
electrochemical technology is considered as ldquoenvironmental friendlyrdquo because of
the absence of toxic cadmium (Berndt 1993) The nickel-metal hydride batteries
also have low internal resistance and the high cycle durability as the NiCds and a
NiMH battery can have two to three times the capacity of an equivalent size
nickel-cadmium battery However the nickel-metal hydride batteries also have a
similar high self-discharge rate as the nickel-cadmium batteries (Lee Lee et al
1996) and it also cannot afford complete discharges Memory effect from
repeated partial discharge can occur in a NiMH battery but this is reversible
through charge cycling (Berndt 2009)
The lead-acid batteries are the oldest type of rechargeable battery with a history of
over 150 years but they are still the most popular battery chemistry for
applications such as engine starting or backup power systems as there is no
cheaper alternative when weight is not a factor This technology uses lead and
lead dioxide as electrodes and an acid electrolyte of sulphuric acid and the
advantage of this configuration is that the electrolyte takes part in reactions of
10
both electrodes and both electrodes turn into lead sulphate when discharging
(Berndt 1993 Berndt 2009) The lead-acid batteries can be designed for not only
deep discharge cycles but high discharge rate or compromise of the two cycles
They have a lower self-discharge rate compared with the nickel batteries and they
also do not suffer from the memory effect (Mantell 1984 Berndt 2009) However
as the energy density of lead-acid battery is not high it is seldom applied in the
portable electronics Another important problem is that the lead-acid batteries
must be recycled as the active material ldquoleadrdquo is toxic to both the environment and
the human bodies (Bernardes Espinosa et al 2004)
The lithium-ion (Li-ion) batteries are almost the perfect cell chemistry and are
currently used a wide range of consumer electronics products including cameras
cell phones laptops etc They have many attractive performance advantages
which make them also ideal for higher power applications such as automotive and
standby power First of all the lithium-ion batteries have the highest energy
density in all the rechargeable battery now which is about 4 times better than
lead-acid (Jacobi 2009) They are also capable for deep discharge and high
discharge rate with a relatively slow self discharge There is no liquid electrolyte
in the lithium-ion batteries which means they are immune from leaking However
just opposite to the lead-acid batteries the most serious problem that discourages
the lithium-ion batteries is the low economic efficiency comparing with the lead-
acid batteries Other factors like the stability of the chemicals and the recycling of
lithium should also be concerned because of the chemical activeness of lithium
Table 1-1 is gives some basic properties of the four major rechargeable batteries
11
introduced above There are also some less common battery chemistries used by
rechargeable batteries in addition to these technologies including nickel-zinc
(NiZn) nickel-iron (NiFe) etc but they have a small market share For the four
major battery chemistries lead-acid batteries with their low price and high
flexibility is adopted in a wide range of application areas
Table 1-1 properties of the rechargeable batteries (Wikipedia nd)
Type Voltage
(V)
Energy Density (Whkg)
Power Density (Wkg)
Self Discharge
rate
Cycle Durability
Nickel-Cadmium
12 40-60 150 20 1500
Nickel-Metal-Hydride
12 30-80 250-1000
20 1000
Lead-Acid 21 30-40 180 3-4 500-800
Lithium-ion 36 160 1800 5-10 1000-1200
124 The Management of Batteries
In the areas that batteries are employed as the energy storage device it is a critical
issue to consider that whether there is enough energy in the battery to meet the
demand However batteries do have the problem in limited cycle durability that
is when a battery is charged and discharged for a number of cycles its total
capacity decreases If the battery cannot offer sufficient powerenergy it should be
replaced at the right time But the problem is that it is difficult to quantify the
capacity loss and when the capacity of battery is no longer sufficient for a
particular application Due to the limitation of batteries it is essential to develop a
method to determine the capacity of battery that subjected to various duty cycles
in a number of applications
12
13 Project Objectives
The main objective of the project is to develop a method which can determine the
key parameters of batteries from the discharge tests The proposed methodology is
a model based approach that is to develop a mathematical model of the battery
which can represent the dynamic performance and battery status and
characteristics can be investigated through the analysis of the model
The first step of the project is to build a mathematical model of battery The
dynamic model is expected to reflect the relevant behaviours of battery when
being discharged including the characteristics of State of Charge Depth of Charge
Electromotive force Terminal Voltage The unknown parameters in the model are
identified by using Genetic Algorithms (GAs) with the laboratory experimental
data Afterwards some batteries are tested in experiments and the parameters in
different state of health are recorded to analyze the battery in different status of
battery
The focus of this work is to develop a suitable method for parameter identification
for common battery systems The lead-acid battery has been chosen because it has
relatively well defined properties and there is a wealth of literature describing the
performance of these types of batteries From an experimental view point they are
also readily available of low cost
13
14 Outline of the thesis
The thesis is organized into seven chapters and the first chapter presents the
background and motivation of the research project The remaining chapters are
briefly described as follows
Chapter 2 gives an overview of lead-acid batteries including the development
working principle and also some modern battery designs and technologies In the
second part of chapter 2 important concepts for a battery including electromotive
force capacity state of charge internal resistance and state of health are
introduced and some mathematical descriptions of these concepts are discussed
Chapter 3 starts from some requirements of the mathematical model designed for
this project and several different methods of battery model approaches are
discussed Afterwards some details of the dynamic mathematical model are
analyzed The initial battery model is described in the last part of this chapter that
summarized the equations of the battery
Chapter 4 is mainly focused on some improvement of the mathematical model
described in chapter 3 In the first section of chapter 4 the experimental test rig in
the project is introduced Some findings in the experimental tests is then listed and
studied and integrated into the improved model Finally the SIMULINK
implementation and a simulation study are given
Chapter 5 presents a method of model parameter identification The principle of
14
Genetic Algorithms is studied at first Then this algorithm is employed in the
model and the parameters of the model are identified with the help of
experimental tests This chapter also includes the validation of battery model
using two other groups of test results
Chapter 6 develops an algorithm that can reflect the state of health of a lead-acid
battery In this chapter the internal resistance parameters are measured under
different state of health through a group of continuous experimental tests The
change of internal resistance under a specific working condition is then related to
the battery state of health
Finally Chapter 7 gives a summary and the conclusions of the project Also the
future works that can be improved are proposed in this chapter
15
Chapter 2
Introduction of Lead-acid
Batteries
This chapter gives an overview of lead-acid batteries including background
knowledge working principles explanation of terminologies technologies and
applications encountered for this technology The chapter presents the
fundamental knowledge and prepares for the project work to be reported in the
following chapters
21 A General Overview of the
Lead-acid Battery
The lead-acid battery is the oldest type of rechargeable battery The first example
of a lead-acid battery can be attributed to the German physicist Sinsteden who
published the performance data of this battery system in 1854 (Berndt 1993)
Later in 1859 the French physicist Planteacute realized that a plate construction was
required to achieve a much larger effective surface area and he produced the first
rechargeable battery which was marketed for commercial use by alternately
charging and discharging lead sheets immersed in sulphuric acid This method
has remained unchanged and still in use today in stationary applications (Berndt
16
1993 Wikipedia nd) One of the first applications of lead-acid batteries was for
storing electrical energy for telegraphy systems The capacity required for these
applications was low and the battery at that time was not yet suited to high power
industrial applications (TNI_Ltd 2007)
In 1880 a French chemical engineer Faureacute significantly improved the design of
the lead-acid battery by producing the active materials separately His method was
to coat the lead plate with a paste of lead oxides sulphuric acid and water in a
warm humid atmosphere The paste then changed into a mixture of lead sulphates
which adhered to the lead plate as an electrochemically active material As a result
of this technology the Faureacute cells are able to achieve much higher capacity with
the first charge in comparison with the Planteacute ones (Berndt 1993 TNI_Ltd 2007)
The problem of these plates is that they are not very durable and become weak
only after a few dischargecharge cycles The lead grid alloyed with antimony or
calcium was developed to improve the mechanical characteristics The holes on
the grid are able to achieve improved bonding thus the batteries may have a longer
lifetime This advantage led to the industrial manufacturing of lead-acid batteries
In 1881 a lead electrode with a ribbed surface was designed in order to have a
large effective surface of the active material and this was the pioneer of the large
surface plates which are still common today (Berndt 1993 TNI_Ltd 2007
Wikipedia nd)
In the beginning lead-acid batteries were operated in open jars The advantage of
this feature was that the electrode can be cleaned and exchanged easily but faced
the problem of water evaporation Therefore the early batteries have to refill water
17
in order to continue normal use However this problem can be dramatically
reduced when the cells were fitted with covers to limit the evaporation (Berndt
1993) This kind of battery design is known as a lsquoflooded lead-acid batteryrsquo
In the 1950s a new type of battery which was aimed to become spill-proof was
designed and manufactured on a large scale This type of battery is characterized
by an immobilized electrolyte however this kind of spill-proof battery was only
manufactured in small sizes up to about 10 Ah (Berndt 2001) Later the
combination of a valve improved the characteristic features of the lead-acid
battery and this kind of battery is still common today and is known as the Gel
Lead-acid battery (Berndt 1993) In the 1970s micron diameter glass fibres
originally designed for air filters were used in glass mats which absorbed the
electrolyte and acted as separator Soon this kind of Absorbent Glass Mat (AGM)
battery appeared in market for stationary application
Currently Valve Regulated Lead Acid (VRLA) batteries based on both AGM and
Gel electrolytes are available in a large range of capacities for both stationary and
mobile power applications with a range of different designs for each type of
application Arguably the most important application of lead-acid batteries is for
vehicle engine starting The battery employed in this application which is called
Starting Lighting and Ignition (SLI) batteries are designed to deliver bursts of
energy usually in a discharge current as large as several hundred amperes in a
very short time A different type of battery construction can produce batteries
capable of deep cycling which are more suited to slow discharge cycles (Tuck
1991 Anon 2007)
18
22 Configuration of Lead-acid Batteries
This section gives a brief description of the working principles of lead-acid
batteries and how the battery can be configured to suit different applications
221 Electrochemical Principles
The lead-acid battery comprises two electrodes and the electrolyte The structure
of the lead-acid battery is shown in Figure 2-1 in which one electrode is Cathode
and the other is Anode The active matter in the positive plate is made of lead
dioxide (PbO2) and that in the negative plate is made of lead (Pb) and the
electrolyte is sulphuric acid One electrode can serve either as a Cathode or as an
Anode depending on which process the battery is experiencing - charging or
discharging With this structure a battery could convert electrical energy into
chemical energy and back again which is associated with the process of charging
and discharging
(a) (b)
Figure 2-1 Working Principle of Lead-Acid Batteries (a) shows the battery when
19
discharging and (b) is when charging with a DC charger
For the discharging process as shown in Figure 2-1 (a) the negative plate acts as
the anode and the positive plate is the cathode If a wire is connected between the
two the excess electrons from the anode will travel through the wire as a current
to the cathode where they are needed to complete the electron deficient reaction
there The chemical reactions in a lead-acid battery when discharging are
described as follow
Negative plate reaction (Anode)
+minusminus+rarrminus+ HPbSO2eHSOPb 44
Positive Plate reaction (Cathode)
O2HPbSO2e3HHSOPbO 2442 +rarr+++minus+minus
For the charging process an external power source is connected to the two
electrodes with the voltage as shown in Figure 2-1(b) In this way the flow of
electrons is forced backwards against the electropotential and the reactions are
driven backwards changing the lead sulphate back into lead and lead dioxide on
the negative and the positive plates and restoring the sulphuric acid to the liquid
electrolyte The anode when a battery is charging is the positive plate and the
cathode is the negative plate and the chemical reactions in a lead-acid battery
when charging are described as
Positive plate reaction (Anode)
+minusminus++rarrminus+ 3HHSOPbO2eO2HPbSO 4224
Negative plate reaction (Cathode)
minusminus++rarr++ 44 HSOPb2eHPbSO
20
The thermodynamic heat effects caused by the reactions are small in the lead-acid
battery because the difference between the enthalpy and the free enthalpy is very
small The rate of reversible heat effect in the reaction is 132 kJ per mol of the
cell reaction which corresponds to about 35 of the total energy converted when
the lead-acid battery is discharging or charged This amount of energy is relatively
small and is generated over a comparatively long period of time so it is usually
easily dissipated through radiation and convection (Berndt 1993)
222 Lead-Acid Battery Types and Technologies
The flooded battery is the simplest type of lead-acid battery in use Flooded
batteries are common for some traction applications despite the requirement in
high maintenance They are also very common for large capacity backup power
supplies for telecommunication computer centres grid energy storage and off-
grid household electric power systems Since the flooded batteries are not sealed
they must be kept upright to avoid acid spills and water must be periodically
added to top up the liquid electrolyte The most attractive feature of the flooded
battery is that they are able to withstand certain level of overcharging without
damage providing proper maintenance is carried out
The Valve Regulated Lead-Acid (VRLA) battery which is often colloquially
called the sealed lead-acid battery is becoming more and more popular in many
applications Because VRLA batteries are mostly sealed the electrolyte
evaporation will be reduced and spillage can be largely avoided when
overcharging which are very common in flooded batteries The electrolyte of the
21
VRLA battery is designed to be immobilized so the VRLA batteries will not leak
if inverted pierced or if the container is broken They can be mounted in any
orientation and position even immersed in water The immobilization of the
VRLA electrolyte can be achieved by using an absorbent mat separator as well as
gelling materials
In Absorbent Glass Mat (AGM) battery the electrolyte is absorbed into a mat of
fine glass fibres in order to immobilize the electrolyte In addition the pores in the
mats are fine enough to prevent the lead dendrites in the cathode from growing
through as a separator and only glass is wetted enough by sulphuric acid can soak
the separators The glass mats can therefore be used to insulate the electrodes
Gelling is another way to immobilize the electrolyte and this gelling technology at
present is only applied for lead-acid batteries The idea is to mix the sulphuric acid
with silica fume (SO2) which makes the electrolyte gel-like The mixture is stable
over a long term environmental safe and easy to work technically (Berndt 1993)
The sulphuric acid bound by the gel can also insulate electrodes as a separator
similarly with that in an AGM battery
VRLA batteries including both gel and AGM batteries are able to recombine and
reduce the emission of gases during overcharge so the requirement for the room
ventilation is reduced and there is no acid fume emission during normal discharge
(Berndt 1993 Anon 2007 Wikipedia nd) Although the generation of hydrogen
can be slowed down it cannot be avoided completely As a result a valve
regulation safety system is employed in VRLA batteries which vents the gases in
22
the battery only during over pressure faults (Tuck 1991 Berndt 1993)
However the VRLA batteries do have some drawbacks First of all the VRLA
batteries tend to have a lower specific energy density than flooded batteries and
they are also more expensive An accurate charging control is very important for a
VRLA battery especially when charging under high temperature environments
since it is not possible to cure the damage caused by overcharge
223 Battery Designs for Different Applications
Lead-acid batteries are deployed in a range of applications Different designs are
therefore required due to the different working environments and duty cycles SLI
batteries are designed for a burst of energy for cold-cranking an engine A SLI
battery is supposed to provide power only in the first few seconds when starting
an engine and will be recharged immediately once the engine is started In this
kind of lead-acid batteries a larger surface area of the electrode plates is used to
provide high electric current in a short period However repeated deep discharge
may shorten the battery lifetime
On the other hand deep cycle batteries are designed for applications where the
batteries are regularly discharged The plates of the deep cycle batteries are often
very thick in order to withstand the frequent and deep discharge cycles The plate
surface area of a deep cycle battery is not as large as a SLI battery and as a result
it is not possible to offer great power
23
Marine batteries are a compromise between a SLI battery and a deep cycle battery
Standby batteries can be classified as marine batteries which are used for backup
power supplies and providing the power in emergency situations They are
designed for a long lifetime and a large capacity but repeated discharges and high
current drain are not the intended application Traction batteries are designed for
higher current drain and repeated deep discharge cycles They are usually bigger
and heavier than other types of lead acid for the same voltage and capacity but
that is the cost of durability
23 Mathematical Descriptions of Lead-acid
Batteries
In order to investigate the relationship between the battery behaviour and
remaining lifetime for a lead-acid battery initial studies have been carried out and
are described in this chapter Concepts including Capacity State of Charge (SOC)
Depth of Charge (DOC) State of Health (SOH) and internal resistance are
introduced and quantitative descriptions of these concepts are listed
231 Capacity
The capacity of a lead-acid battery represents how much charged energy the
battery can offer which is usually described in Ampere-hours (Ah) The charge
capacity of a battery is decided by the construction factors of a battery cell This
includes the materials contained in the electrodes and the acid solution In
addition the capacity of a battery is not a fixed quantity but varies according to
24
how quickly it is discharged This is known as Peukertrsquos law (Ceraolo 2000
Dhameja 2001 Rand Moseley et al 2004)
tICk
p = (21)
where pC is the capacity on one-ampere discharge rate which is a constant
I is the discharge current (A)
t is the time of discharge (h)
k is the Peukert constant and for a lead-acid battery with the value
between 11 and 13 (varies for each individual battery)
It is common to refer to ldquoCnrdquo as the capacity of battery in Amp-Hours which
corresponds to complete discharge of the battery in n hours ldquonrdquo is a subscript that
represents the discharge rate In industry the capacity under ten-hour discharge
rate (C10) is always taken as the nominal capacity
232 Electromotive force
The electromotive force of a battery cell is the difference between the electric
potential of the two electrodes of each cell (Rand Moseley et al 2004) The
potential of each electrode which is called half cell potential is decided by the
chemical reaction and the relative activities of the solution and can be obtained
from Nernstrsquos equation (Crompton 2000)
25
Ox
Redln0
α
α
zF
RTEE minus= (22)
where E is the half-cell potential (V)
0E is the standard half-cell potential (V)
α is the relative activity of the oxidizer (α Ox) and reducer (α Red)
z is the number of electrons transferred in the cell reaction
R is the universal gas constant which is 8314472 JKminus1molminus1
T is the absolute temperature
F is the Faraday constant the number of coulombs per mole of electrons
and F = 964853399times104 Cmolminus1
At room temperature RTF is a constant of 25693mV for cells therefore
Ox
Redlog
z
V05910
Ox
Redln
z
mV69325
Ox
Redln 10
α
α
α
α
α
α==
nF
RT
The Nernstrsquos Equation therefore can be expressed by
Ox
Redlog
V0591010
0
α
α
zEE minus= (23)
The electromotive force could be calculated by the difference of the electric
potential
cathodeanode EEEMF minus= (24)
When a lead-battery is discharging the electromotive force can be written as
26
O)(H
)(SO)(Hlog
V05910
2
2
24
10
00
α
ααminus+
+minus=z
EEEMF cathodeanode (25)
The standard half-cell potential of the anode 0
anodeE is equal to 1685 (PbO2-
PbSO4SO42-) and that of cathode
0
cathodeE is -0356 (Pb-PbSO4SO42-) which are
constants for the same battery chemistry And the number of electrons transferred
( n ) is 2 for a lead-acid battery
Therefore the electromotive force of a lead-acid cell can be obtained by
O)(H
)(SO)(HlogV029600412
O)(H
)(SO)(HlogV02960)3560(6851
2
2
24
10
2
2
24
10
α
αα
α
αα
minus+
minus+
+=
+minusminus=EMF
(26)
This electromotive force of a battery cell is numerically equal to the open circuit
voltage which means that the terminal voltage of a single cell battery when it is
disconnected from the external load For a lead-acid cell the electrochemical
force at fully charged is between 210-213V per cell
233 State of Charge and Depth of Charge
State of charge (SOC) and depth of charge (DOC) are variables that can describe
the battery charge The main difference is that the SOC describes the percentage
of remaining charge relative to the nominal capacity while the DOC represents
that relative to the actual capacity under a specific discharge current These two
27
variables can be obtained by calculating the charge consumed and the battery
capacity
101 CQSOC eminus= (27)
Ie CQDOC 1minus= (28)
where Qe is the charge consumed by the load (Ah)
C is the nominal capacity (Ah)
CI is the actual capacity under the discharge current I (Ah)
234 Internal Resistance and State of Health
The internal resistance of a lead acid cell is the physical resistance of the cell The
value of the internal resistance is decided by many different factors But it could
be obtained by a simple equation
I
VVr tOC minus
= (29)
where Voc is the open circuit voltage (V)
Vt is the terminal voltage when discharging (V)
I is the discharge current (A)
However the factors in this equation are only a method of calculating the internal
resistance but not the determinants It is shown in applications that the internal
resistance of a lead-acid battery will increase when discharging as the SOC and
28
the DOC drops
It is common for batteries to suffer a capacity loss when discharged and charged
in a number of duty cycles even when idle Aged batteries are often weak and
sometimes not able to offer enough charges Therefore they should be replaced or
maintained State of health is a defined variable that is important for a weak
battery This variable is to show how weak the battery is and represents the
percentage of remaining capacity to the initial capacity when the battery is brand
new (Okoshi Yamada et al 2006) as shown in the equation
new
weak
C
CSOH = (210)
where Cweak is the remaining capacity of a weak battery (Ah)
Cnew is the capacity when the battery is brand new (Ah)
The reason for the capacity loss is complex but is usually due to the sulphation
Sulphation is a process when the amorphous lead sulphate which is easily
converted back to lead lead oxide and sulphuric acid converts to a stable
crystalline form coating the electrodes This form of lead sulphate cannot conduct
electricity and cannot be converted back to lead lead dioxide and lead sulphate
under normal charging conditions The internal resistance of a lead-acid battery
therefore increases and less charge can be provided when discharging Complete
or repeated deep discharges of a battery at low current densities that lead
excessive utilization of the active material are the most critical reason for
29
capacity loss for example a discharge of a traction battery that draws more than
80 of its nominal capacity (Berndt 1993)
235 Multi-Cell Lead-Acid Batteries
In most applications of batteries the voltage of an individual cell is not enough to
provide the sufficient voltage and power supply The solution is usually to series
connect a number of cells in a battery in order to achieve a higher battery voltage
The electromotive force of a series of lead-acid battery cells is directly related to
the cell numbers as well as the charge state of each cell For a six-cell lead-acid
battery which is a standard for most common usages the fully charged
electromotive force is about 128V The internal resistance of a multi cell battery
however is also equal to the sum of the internal resistances of each cell
Usually all the cells in a multi-cell battery should be constructed in the same
manner and in particular the capacity should be consistent because the capacity of
a multi-cell battery will be limited to the cell with the lowest capacity If one of
the cells fails it is not possible for the current to flow through the cell and the
battery is therefore disconnected from its internal cell loss Also if the SOC of one
particular cell drops faster than others in a battery the electromotive force of that
cell may affect the whole behaviour of the battery
24 Summary
The technology development of lead-acid batteries has been continuous over the
30
last 150 years From the earliest open cell batteries different advanced battery
configurations are now available which have been adopted in a wide range of
applications Meanwhile a number of solutions have been developed to address
the battery problems encountered in applications such as electrolyte evaporation
spillage and the electrolysis of electrolyte when charging However there are still
issues affecting the efficient and safe use of lead-acid batteries for example
determination of the SOH which if addressed in a robust manner would lead to
significant improved battery management system performance This chapter has
presented the essential fundamental knowledge technology terms and working
principles of lead-acid batteries which is served as a preparation for further study
reported in the following chapters of the thesis
In order to reveal the dynamic behaviour of a battery under different SOH and
identify the suitable strategy for SOH determination the mathematical modelling
study is carried out and an equivalent circuit model is derived in the next chapter
The key concepts of the battery model are explained and the fundamental analysis
is given for the concepts introduced
31
Chapter 3
Equivalent Circuit Modelling
of Lead-acid Batteries
In order to estimate the status of a battery a model based approach is adopted in
the project A mathematical model for lead-acid batteries should be developed
with a suitable level of abstraction This chapter describes the requirements to the
model to serve the project objectives and reviews the available model
technologies An improved mathematical model for lead-acid batteries is
introduced in the late part of this chapter
31 Requirements for the Battery Model
The main objective of the project is to develop an algorithm that can determine
the battery health by monitoring the battery status during discharge cycles This
algorithm is designed for implementation in a battery health monitoring system
with life-time prediction capabilities This prediction system is intended to work
on applications where the battery performance is of great importance for instance
hospital UPS systems and vehicle ignition systems To achieve the objective the
requirements to the mathematical model can be defined as
Requirement 1 The model should be able to calculate the evolution of key
battery parameters including terminal voltage cell temperature the state of health
32
and the internal resistance which describe the condition of the battery for
dynamical discharging It should also be able to adequately represent dynamic
processes while the battery is discharging
Requirement 2 The complexity of the model must be sufficient to satisfy the
requirement 1 but must also be executable in real-time for a model-based
condition monitoring system
Requirement 3 The output of the battery model should be understandable to the
battery operators and technicians as well as meaningful to those who do not have
any background in battery technologies
32 Overview of Battery Model Techniques
A number of different types of battery models have been used to serve as a tool in
solving a range of problems (GONG 2005) These include Electrochemical
Models Computational Fluid Dynamics Models Finite Element Models and
Equivalent Circuit Models This section gives an overview to the above named
four different types of battery models and the problems which are addressed by
each of them In Section 324 every battery model technology is assessed against
the overall requirements
321 Electrochemical Model
Electrochemistry is a branch of chemistry that studies chemical reactions which
33
take place in a solution at the interface of an electron conductor (a metal or a
semiconductor) and an ionic conductor (the electrolyte) The reactions involve
electrons transfering between the electrode and the electrolyte or species in
solution The application of electrochemistry research directly leads to the
development of the lead-acid batteries
Behaviour of a battery depends not only on how the battery is used but also on a
number of construction factors (Ruetschi 2004) These factors include but are not
limited to the thickness of the plates the active mass density of the active
material the concentration of the acid solution and the geometry of the electrodes
(Berndt 2001 Ruetschi 2004)
The electrochemical model is mainly focused on the oxidationreduction reactions
between the electrolytes and the electrodes By analyzing the consistency of each
matter in the solution and the electrochemical reaction caused by the connection
of electrodes to external circuit it is possible to represent the dynamic behaviour
of the battery (Crompton 2000)
322 Physical Models
The finite element method is a numerical analysis technique for finding
approximate solutions of partial differential equations as well as of integral
equations The basic principle of the Finite Element Model (FEM) is to divide the
problem into elements and each element is a smaller problem to be solved so that
they could be analyzed separately The lsquoelementsrsquo are then be assembled together
34
to restore the initial problem
Finite element is a very popular method of analysis in those areas with a complex
geometry and it is good at stress and thermal analysis For batteries the Finite
Element Models can help with a good understanding of the heat loss and that for
vibration problem in mobile applications There are also attempts to analyze the
current density on the positive grid bar in a lead-acid battery using FEM (Ball
Evans et al 2002)
Computational Fluid Dynamics (CFD) technology is a well-established tool for
physical analysis and optimization of fluid flow mass and heat transfer and
related phenomena (eg chemical reactions) that may simultaneously take place in
a complex system (Liaw Gu et al 1997) Computers are used to perform millions
of calculations required to simulate the interactions of fluids and gases with the
complex surfaces used in engineering
In a CFD Model of a battery the dynamic governing equations are solved with
respect to time space and all the physical time and space dependent properties
Acid concentration and potential distribution across the cell for instance can be
obtained Therefore such a modelling is able to give a very good understanding to
battery parameters and detailed characteristic of battery dynamics
323 Equivalent Circuit Model
An equivalent circuit refers to the simplest form of a circuit that retains all of the
35
electrical characteristics of the original (and more complex) circuit In its most
common form an equivalent circuit is made up of linear passive elements
However more complex equivalent circuits are used to approximate nonlinear
behaviours of the original circuit as well
In electrical engineering it is often useful to use an equivalent circuit model to
describe the non-ideal operation of a device For electrical engineers electrical
models are intuitive useful and easy to handle especially when they can be used
in circuit simulators and alongside application circuits
324 Discussion of Different Battery Model Methods
The electrochemical model focuses on the electrochemical reactions and the
activities in the battery which is very popular in the applications for the
constructional and design purpose However many electrochemical factors
contained in the electrochemical model are irrelevant to the external circuit and
some of the important parameters like the internal resistance are hard to describe
in an electrochemical model Therefore this model technology is not able to meet
the project Requirement 1 As the calculations in the electrochemical model are
not complicated Requirement 2 can be therefore satisfied by an electrochemical
model of battery Requirement 3 might be difficult to obtain for an
electrochemical model because the understanding of the outputs for an
electrochemical model usually need some background knowledge of the battery
chemistry As a result the electrochemical model is not chosen for the project
36
Physical models can give good understanding to the battery important parameters
so that Requirement 1 of the project can be satisfied The Requirement 3 can be
also met as the terminal voltage can be calculated as the output with the
knowledge of these parameters One significant disadvantage is that the physical
models involves huge amount of calculation in analysis which is quite time
consuming In finite element or CFD methods a large nonlinear system of
equations is solved iteratively and that could take excessive CPU time especially
for when the system is more than 2 dimensions As a result the physical
modelling methods cannot meet the Requirement 2 of fast response required by
the project (Esfahanian Torabi et al 2008)
In an equivalent circuit model most of the characteristic required by the project
can be reached in a reasonable level It is able to reflect the dynamic behaviour of
battery using simple circuit blocks such as voltage sources resistors and
capacitors (Chen and Rincacuteon-Mora 2006) That is to say the Requirement 1 of
the project can be satisfied by the equivalent circuit model And the model
simplicity causes its low computational time as Requirement 2 and therefore it
can be suited to the online implementation (Esfahanian Torabi et al 2008)
Additionally basic battery parameters like internal resistance terminal voltage
and SOC etc can be chosen as the main output of the model to meet the
Requirement 3
Table 3-1 summarized a comparison of all the three model methods on the
satisfaction of the requirements for the project
37
Table 3-1 Satisfaction of the Requirements in different Model Methods
Requirement 1 Requirement 2 Requirement 3
Electrochemical Model times radic times
Physical Model radic times radic
Equivalent Circuit Model radic radic radic
33 Introduction of the Existing Equivalent
Circuit Models
Section 32 introduced three different types of battery models to serve for different
research purposes each with different features and strengths It has been shown
that the equivalent circuit model that pays attention to the relationship between the
internal circuit and the external characteristics can adequately meet all the
requirements of the project Therefore further studies of battery models have been
carried out and six equivalent circuit battery models with different merits and
complexity are presented while the technique improvements are briefly described
in this section
331 Simple Battery Model
The Simple Battery Model is the simplest battery model As shown in Figure 3-1
this model consists of only ideal battery mE as the electromotive force of a battery
and a resistor r in series connection as the internal resistance bV in the figure is
the terminal voltage of the battery
38
Figure 3-1 Simple Battery Model
The Em in Figure 3-1 stands for the electromotive force of the battery while r
represents the internal resistance and Vb is the Terminal Voltage This model is
only applicable in some circuits where the state of charge is of little importance
because it does not consider the varying characteristic of the internal resistance in
different states of charge The model is often used in circuits where the battery
does not have major influences to the circuit analysis But without being able to
describe the battery behaviours in details this model is not suitable for the
research purpose In the Simple Battery Model the electromotive force mE can be
obtained by open circuit measurement and r can be calculated by measurement
with connecting a load to the battery after taking an open circuit measurement
For a battery with a terminal voltage of 13V and the internal resistance of 05Ω
the change of terminal voltage in a Simple Battery Model as the discharge current
increases can be given as Figure 3-2
39
Terminal
Voltage
Discharge
Current
0
10V
13V
Figure 3-2 I-V chart of the Simple Battery Model
332 Advanced Simple Battery Model
This model is developed based on the Simple Battery Model and has the same
block diagram as the Simple Battery Model The only difference is that this model
employs a variable resistor which depends on the state of charge (CUN
FIORINA et al Durr Cruden et al 2006) The relationship between the value of
the variable resistance and the state of charge is as follow
aSOC
Rr 0
= (31)
where 0R is the resistance of the battery when it is fully charged
a is the capacity coefficient
SOC is the state of charge of battery from 0 (completely discharged) to 1
(fully charged)
6A
40
The most important improvement of this model is that instead of a constant
internal resistor the value of the internal resistance is expressed as equation
function of SOC For the same battery described in section 331 the I-V chart in
different SOCs can be concluded as shown in Figure 3-3
Terminal
Voltage
Discharge
Current
0
10V
13V
SOC=1
SOC=60
Figure 3-3 I-V Chart in different SOC
333 Thevenin Battery Model
The previous models do not account for any transient behaviour of batteries
Figure 3-4 shows the gradual change in battery characteristics when external loads
are connected or disconnected to the battery
6A
41
011
14
125
Terminal
Voltage
t
Figure 3-4 Sketch to show battery discharge behaviours in typical tests
Thevenin Battery Model is one commonly used model which consists of an ideal
battery electromotive force ( mE ) internal resistance (0R ) overvoltage resistance
(1R ) and capacitance (
1C ) and the equivalent circuit is shown in Figure 3-5
(Casacca and Salameh 1992 Salameh Casacca et al 1992 Chan and Sutanto
2000) 1C represents the actual capacitance of battery and
1R represents the
resistance contributed by the contact resistance of the plate and the electrolyte
(Durr Cruden et al 2006) The capacitance in the Thevenin Battery Model can
overcome the trend of terminal voltage shown in Figure 3-4
No load No load Load
42
Figure 3-5 Thevenin Battery Model
The main disadvantage of this Thevenin Battery Model is that all the parameter
values are assumed to be constant but in fact they are strongly dependent on the
state of charge and discharge rate and some other discharge characteristics
334 Dynamic Battery Model
This model is developed based on the Thevenin Battery Model Similar to the
improvements made by the Advanced Simple Model comparing with the Simple
Battery Model the most important difference is that it takes into account the non-
linear characteristic of the open circuit voltage and internal resistance represented
by SOCK (Jayne and Morgan 1986 Sims 1990)
ISOC
KRVV bocb )( +minus= (32)
where bV is the terminal voltage of battery
ocV is the open circuit voltage
bR is the battery terminal resistor typically 01Ω
43
K is the polarization constant
I is the discharge current
335 Fourth Order Dynamic Model
This is a more accurate and sophisticated model The current pI flows through
pR (electrolyte reaction) dR (Ohmic effect) and its associated leakage
capacitance dC and wR (waste of energy) and its associated leakage
capacitance wC Current sI flowing through the resistor sR represents the
behaviour of self discharge (Gillioli and Cerolo 1990 Chan and Sutanto 2000)
The main drawback of this model just as its name indicates is that there are
fourth order equations due to consideration of the paralleled R-C blocks in the
circuit and therefore it takes more time for the computation Another drawback is
that a number of empirical parameters are contained in the model
Figure 3-6 Fourth-order Battery Model
44
336 Improved Battery Model
The most popular Equivalent Circuit Model used by researchers is the Improved
Battery Model (Casacca and Salameh 1992 Salameh Casacca et al 1992) This
model is simple but meets most requirements for a good battery model It contains
most non-linear characteristics and is linked to the state of charge Most elements
included in this model are the functions of the state of charge or the open circuit
voltage which is also related to the state of charge The improved model is
studied in this chapter and implemented in MatlabSIMULINK environment
Figure 3-7 Improved Battery Model
34 Mathematical Model of the Lead-acid
Batteries
As the Improved Battery Model is able to reflect the major dynamic behaviours of
a battery and does not take much computation time it meets the requirements for
45
the project Therefore the mathematical model developed in this project is based
on the Improved Battery Model by involving the components of variable voltage
sources as the electromotive force ( EMF equal to the open circuit voltage OCV )
variable resistors as internal resistance and overvoltage resistance and a capacitor
as the capacitance of battery The description and the detailed analysis of the
model are given in this section
341 Capacity
Based on the Peukertrsquos law introduced in Chapter 2 the relationship of capacity
with different discharge currents is obtained below
2121
2211
)( ttII
tItIC
k
kk
p
=
== (33)
And following the definition of battery capacity the capacity is
12
1
2111
1
21121121121222 )()())(()( I
kkkk
I CIItIIItIIIIItIIItICminusminus
=====
12
1
21 )( I
k
I CIICminus
=there4 (34)
where Cp is the one ampere capacity
CI2 CI1 is the capacity under the discharge current I2 I1
k is a constant that related to the battery
The equation of calculating the capacity by the discharging current can be
46
obtained through experiments (Ceraolo 2000 Barsali and Ceraolo 2002) An
experimental result is given as
m
c
c
IIK
CKIC
))(1(1)( 0
0minus+
= (35)
where )(00 ICC = which stands for the capacity when discharging at the rated
discharge rate usually the nominal capacity C10
cK is empirical coefficient and is 118 for lead-acid batteries
m is empirical coefficient of 120
This equation overcomes the inadequacies of the Peukertrsquos law The capacity
calculated by the Peukertrsquos law in a low discharge current is much larger than that
experimentally obtained (Ceraolo 2000)
With the parameters of 20118124420 ==== kKAIAhC c the simulation
study indicated that the capacities of low discharge rate (lt30A) in different
equations are quite similar as shown in Figure 3-8
47
0 5 10 15 20 25 30 35 40 45 500
10
20
30
40
50
60
70
80
Discharge Current (A)
Actu
al C
apacity (
Ah)
Based on Peukerts law
Based on the Equation 35
Based on the Equation 35
Based on thePeukerts Law
Figure 3-8 Battery Capacity vs Discharge Current
Variations of the cell temperature also affect the battery capacity The effect of
temperature on the battery capacity is described by the following equation
(Ceraolo 2000 Barsali and Ceraolo 2002)
ε
θ
θθ
minus+=
f
ICIC 1)()( 0 (36)
where fθ is the electrolyte freezing temperature and is equal to -40˚C
θ is the cell temperature
)(0 IC is the capacity of battery under the discharge current I at 0˚C
ε is a constant that equals to 129
48
Therefore
m
c
f
c
IIK
CK
IC))(1(1
1
)(
0
minus+
+
=
ε
θ
θ
θ (37)
342 Electric Networks
Figure 3-9 (Ceraolo 2000 Barsali and Ceraolo 2002) shows an adaptation of
electric network based on the improved battery model shown in Figure 3-7 The
major change of this equivalent circuit is that the self-discharge is not taken into
account because the self discharge is usually less than 10 per month in modern
technologies which can be ignored in normal applications
Figure 3-9 Lead-acid Battery Equivalent Network
In the figure mE in this the main branch represents the electromotive force of the
battery and Vb stands for the terminal voltage The mZ in the figure stands for the
internal impedance that can be approximated by two R-C blocks
49
Battery is an energy storage device but not all the energy that the battery gets
from the charger can be stored when a battery is charged Part of this energy is
lost for different reasons like water electrolysis A parasitic branch is therefore
added to the model to represent the energy loss This part is claimed to work only
when the battery is being charged (Ceraolo 2000 Barsali and Ceraolo 2002) In
this project the current of the parasitic branch pI in the figure can be described as
an equation of the voltage of the parasitic branch PNV instead of a simple resistor
pR because of the nonlinear character of the parasitic branch This issue will be
discussed in later sections
As a result of these factors an equivalent electric network of in Figure 3-9 is
designed as shown in Figure 3-10 in which 1C 1R and 0R are the elements of the
internal impedance mZ It is used in the whole project as the electric network of
mathematical model
Figure 3-10 The Equivalent Network with the Approximated mZ
50
343 State of Charge and Depth of Discharge
In Chapter 2 Equations 27 and 28 show the definitions of SOC and DOC of a
battery In the model the nominal capacity can be treated as C(0θ) while the
actual capacity is C(Iavg θ) therefore
)0(1 θCQSOC eminus= (38)
)(1 θavge ICQDOC minus= (39)
where σσ dItQt
e int=0
)()( is the charge already drained from the battery
)0( θC is the nominal capacity of battery
)( θavgIC stands for the actual capacity under the specific discharge
current
344 Electromotive Force of the Battery
The electromotive force of a battery which is Em in Figure 3-10 is the difference
between the electric potential of the two electrodes and can be calculated by the
Nernstrsquos equation (Eq 26)
)(
)()(log029600412
2
2
24
10OH
SOHEMF
α
ααminus+
+=
This equation gives a description of the electromotive force by the activity of
different matter in the sulphuric acid which is described as lsquoαrsquo When the battery
51
is being charged or discharged the electrolyte concentration changes and the
activity value of H+ SO42- and H2O in the Nernstrsquos equation changes which can
be found by the study of battery that is the EMF of battery will change as the
result of the change of state of charge The relationship between SOC and the
activity α is unknown but it is obviously that when the state of charge increases
the quotient of )(
)()(
2
2
24
OH
SOH
α
ααminus+
also increases This shows that the EMF rises
when the state of charge is increasing
From the literatures (Ceraolo 2000 Barsali and Ceraolo 2002) the electromotive
force is described simply as the following equation
)1)(273(0 SOCKEE Emm minusminusminusminus++++minusminusminusminus==== θ (310)
where 0mE and EK are constants for a battery
θ is the temperature of the cell
SOC is the state of charge of the battery
345 Internal Resistance of a Battery
The resistances of a battery as shown in Figure 3-10 can be calculated by the
equations (Ceraolo 2000 Barsali and Ceraolo 2002)
)]1(1[ 0000 SOCARR minus+= (311)
)ln(101 DOCRR minus= (312)
52
)exp(1 22
)]1([
202
21
IIA
eRR
m
SOCA
+=
minus
(313)
where 0A 21A and 22A are constants for a battery while 00R 10R 20R are
parameters related to the SOH which will be discussed in later chapters For the
model 020 asympR and can be omitted when a battery is discharging
Therefore the internal resistance of a cell when discharging is
)ln()]1(1[ 1000010 DOCRSOCARRRr minusminus+=+= (314)
346 The Behaviour of Parasitic Branch
When the battery is being charged there are some losses as represented by the
parasitic current This current depends on the electrolyte temperature and the
voltage at the parasitic branch (Ceraolo 2000)
Because the behaviour of parasitic branch is non-linear Tafel gassing-current
relationship is used instead of a simple resistance pR (Ceraolo 2000)
minus+= )1(exp
0
0
f
p
P
PNPPNp A
V
VGVI
θ
θ (315)
where pI is the current of the parasitic branch
PNV is the voltage of the parasitic branch
53
0PG is a constant in seconds
0PV is a constant in volt
pA is a constant
θ is the electrolyte temperature
fθ is the electrolyte freezing temperature and is equal to -40˚C
When the battery is being discharged 0asymppI the parasitic branch could be
omitted from the model in simulation if the charging behaviour is not necessary
to discuss
347 Main Branch Capacitance
In the electric network of the model there is an R-C circuit as shown in Figure
3-11
Figure 3-11 R-C block
where Im is the discharge current
IC1 is the current flow through the capacity branch
54
I1 is the current of R1
VR1 is the voltage over the R-C block
This branch can be solved by
))(
()( 11111111
dt
tdVCIRIIRIRV R
mCmR minusminusminusminus====minusminusminusminus====sdotsdotsdotsdot==== (316)
)()()(
111
11 tIRtVdt
tdVCR mR
R====++++ (317)
This is the differential equation that represents the main branch behaviour
Laplace transform is employed to solve this problem
)()( 1111 sIRsVSCR mR sdotsdotsdotsdot====sdotsdotsdotsdotsdotsdotsdotsdotsdotsdotsdotsdot (318)
1
)(
11
11
++++
sdotsdotsdotsdot====
SCR
sIRV m
R (319)
++++
====++++
========
SCR
C
SCR
R
I
VsG R
11
1
11
11
1
1
1)( (320)
where τ=11CR is the time constant that represents the double layer capacitance
When the current has a shape like a step and the initial voltage of the capacitor is
equal zero the solution in time becomes
m
t
R IeRtV )1()( 11τ
minus
minus= (321)
55
It is obviously that this equation is the typical form of the voltage with an R-C
circuit
348 Thermal Behaviour of a Battery
When the battery is charging or discharging there is a current flow through the
battery so that it produces heat due to the Joules law
0
2
1
2
12 RIRVIVVIP RPNps sdot++sdot+sdot= (322)
When discharging the parasitic branch and R2 are omitted the equation becomes
0
2
1
2
1 RIRVP Rs sdot+= (323)
The dynamic equation of cell temperature and the power is (Ceraolo 2000)
s
a PRdt
dC +
minus=
θ
θ
θθθ (324)
where θC is the thermal capacitance
θR is the thermal resistance between the battery and the environment
θ is the cell temperature and aθ is the environment temperature
56
35 Mathematical Model of the Lead-acid
Batteries
Considering the behaviour of capacity state of charge and depth of discharge
electromotive force and internal resistance an Improved Battery Model based on
the equivalent circuit shown in Figure 3-10 was introduced in previous sections
The battery model for the complete discharging progress can be derived as the
following equations
m
c
f
c
IIK
CK
IC))(1(1
)1(
)(
0
minus+
+
=
ε
θ
θ
θ (325)
σσ dItQt
e int=0
)()( (326)
)0(1 θCQSOC eminusminusminusminus==== (327)
)(1 θavge ICQDOC minusminusminusminus==== (328)
)1)(273(0 SOCKEE Emm minus+minus= θ (329)
)]1(1[ 0000 SOCARR minus+= (330)
)ln(101 DOCRR minus= (331)
1
1R
Cτ
= (332)
IeRtV
t
R sdotminussdot=minus
)1()( 11τ (333)
0
2
1
2
1 RIRVP Rs sdot+= (334)
57
sa P
Rdt
dC +
minus=
θ
θ
θθθ
(335)
)( θIC in the equations is the expression of capacity of battery when discharging
under the discharge current I and at a temperature of θ 0C stands for the
capacitance when discharging at the rated discharge current I while parameters
fθ and ε are constants in this model )(tQe represents the charge already
consumed while the equation of mE indicates the mathematical description of
electromotive force corresponding to the SOC and the cell temperature in which
0mE EK are constants for a battery 00R 10R are parameters related to the SOH
and the discharge current can also affect them τ in the equations are the time
constant of the R-C circuit which represents the time it takes the systems step
response to reach ( 6311 asympminus e ) of its asymptotic value The last two equations
represent the thermal dynamic of battery in which sP is the Joule heat generated
by the internal resistance θC is the thermal capacitance and θR is the thermal
resistance between the battery and the environment
36 Summary and Discussion
The Improved Battery Model based on the electric equivalent circuit is presented
in this chapter and it is proved that it can satisfy all the three requirements to serve
the project objectives This battery model consists of a variable voltage source
several R-C blocks and a parasitic branch as its electric network and the elements
are described as a variable related to the capacitance the charge consumption and
58
the cell temperature as well
However experimental tests show that the behaviour of the battery is much more
complicated can be represented by this equivalent circuit model For example the
internal resistance varies when discharging under different current and the time
constant of the R-C circuit at the beginning and end of discharge as well
Therefore the model has to be improved The next chapter overcomes these
problems found in the experimental tests and some improvements of the model
are described
59
Chapter 4
Experimental System Set up and
Improved Battery Model
Simulation Implementation
Experimental tests based on a 12V-13 Ah lead-acid battery are carried out and the
test system is introduced at the beginning of this chapter Some of the
characteristics of the battery can be found in the tests which has shown that the
battery model described previously is not accurate enough and improvements
have to be implemented into the model This chapter will focus on the analysis of
the battery characteristics and the description of the improvements implemented
In the last part of this chapter a finalised version of the battery model used in this
project is given and implemented in the MatlabSIMULINK environment for
simulation study
41 The Experimental System
In this experimental test system a variable resistor is used as the load of the
battery Three sensors are employed in the whole experiment process two current
sensors and one voltage sensor The equivalent circuit of the test rig designed for
the research purpose is shown in Figure 4-1
60
Figure 4-1 Equivalent Circuit of the Experimental Test Rig
In this figure the ideal voltage source EMF accompanying with the internal
resistance r acts as a lead-acid battery with 6 cells (12V) the terminals of the
battery are connected in parallel to a voltage sensor Switch Krsquo is employed to
control the voltage sensor connection so that the sensor can be disconnected from
the battery when the experiment is not being in progress to avoid an unnecessary
discharge The circuit break in Figure 4-1 can be used as a main controller which
decides whether the load is engaged to the battery to discharge or not Switch K
in the experiment is to vary the load of the system This experimental test system
is mainly designed for two different experimental tests of a battery in this study
constant-impedance load discharge and two-load discharge Figure 4-2 shows the
actual laboratory test rig used in the project
61
Figure 4-2 Experimental Test Rig
The data is collected and recorded every half second by a data acquisition card
PCI-6251 from National Instruments with the software environment of LabVIEW
and a 12V-13Ah lead-acid battery (marked in the red-dashed square in Figure 4-2)
is employed in the project as test batteries for the battery performance study
42 Improvements of the Battery Model
Figure 4-3 and Figure 4-4 show the typical data collected from the experimental
test rig Figure 4-3 is the result of a constant-impedance load discharge test with a
discharge current of 075A approximately and Figure 4-4 shows two-load
discharge with the discharge currents of 075A and 12A respectively
62
0 500 1000 1500 2000 2500 3000 3500 4000 4500 5000-02
0
02
04
06
08
1
12
Time (s)
Dis
charg
e C
urr
ent
(A)
0 500 1000 1500 2000 2500 3000 3500 4000 4500 5000105
11
115
12
125
13
Time (s)
Term
inal V
oltage (
V)
Figure 4-3 Test of constant-impedance load discharge top figure shows the discharge current of the experimental test and the bottom one shows the terminal
voltage 1τ is the time parameter of the R-C block at the beginning of the
discharge and 2τ is that when the discharge stopped
0 200 400 600 800 1000 1200 1400
0
05
1
15
Time (s)
Dis
charg
e C
urr
ent
(A)
0 200 400 600 800 1000 1200 1400118
12
122
124
126
128
Time (s)
Term
inal V
oltage (
V)
Figure 4-4 Test of two-load discharge top figure shows the discharge current of the experimental test and the bottom one shows the terminal voltage
I(t)RI1 and I(t)RI2 represent the voltage drop across the internal resistance value under different discharge current
1τ 2τ
I(t)RI1
I(t)RI2
I(t)RI1
63
421 The Change of τ in Different Charge Status
From analyzing these figures it is easy to find that it takes quite a long time for
the battery to have the steady terminal voltage when the discharge of battery stops
and it is longer than the time taken from the beginning of the discharge This
difference means that when the battery starts to discharge the time parameter
11CR=τ in the main branch equation (332) is not equal to that when the
discharge has just stopped In Figure 4-3 it is shown that when the discharge stops
the time parameterτ is longer than that when the discharge starts
As a result of this experimental feature a switch is employed to implement the
change of time parameter to match those described in the mathematical model of
the battery The switch is used to control the value of the time parameter τ in
different discharge currents When the battery is discharging the discharge current
is a positive value and the time parameter τ is equal to 1τ When the battery is
not discharging the discharge current is equal to 0 in theory and the time
parameter has a different value 2τ
Although the discharge current should be equal to 0 theoretically it is hard to
achieve this in the real experimental measurement because of the inaccuracy of
the current sensor reading due to the inaccuracy occurred in the power supply to
the sensor Therefore the trigger of the switch in the model is set to be 01 A that
is when the discharge current is greater than 01 A the time parameter is set to be
1τ as the battery is in its discharging segment By contrast the value of time
64
parameter is set to be 2τ and the discharge current is considered as the error
caused by the sensors when that current is less than 01 A
422 Analysis in Variations of the Internal Resistance
Another important issue found through analyzing the experimental test result is
that the internal resistance for a specific battery in a specific state of health (SOH)
is not a constant when the discharging current changes This difference is more
significant than the effect caused by the state of charge
For example in the two-load discharge results shown in Figure 4-4 when the
battery is not discharging the initial voltage is equal to the electromotive force
(EMF1) When the battery began to discharge at the discharge current I1 the
terminal voltage dropped to V1 After the discharge stopped for a while the value
of the terminal voltage is equal to the electromotive force (EMF2) at that state of
charge (SOC2) Then the discharge of the battery starts again at a current of I2 and
the terminal voltage dropped to V2 The discharge progress is then stopped for
certain of a time period to get the steady terminal voltage (EMF3) at that state of
charge (SOC3) After that the test of discharge at the I3 = I1 was repeated again
and get another terminal voltage of V3 The last discharge test is done to provide
the evidence for the fact that this change in the internal resistance is not caused by
the change of the state of charge (SOC)
The value of electromotive force in a discharging battery is equal to the sum of the
terminal voltage and the voltage that the internal resistance takes that is
65
nnnn IrVEMF sdot+=
Therefore the internal resistance can be calculated by
n
nnn
I
VEMFr
minus= (41)
From the data collected in the experiment the key parameter values for the graphs
shown in Figure 4-4 can be found as listed in Table 4-1
Table 4-1 Approximate Internal Resistance Calculating
n 1 2 3
Electromotive Force (EMFn) 1260V 1252V 1238V
Discharge Current (In) 078A 114A 076A
Terminal Voltage (Vn) 1219V 1203V 1197V
Substituting these values into Equation 41 the internal resistance can be
calculated Ω=Ω=Ω= 539043005260 321 rrr
This change of the internal resistance can cause quite a significant effect in the
discharge progress This problem can be possibly solved in a number of ways
One possible choice is to find a curve of the internal resistance change and the
discharge current for a specific battery after a certain numbers of experimental
tests But this method needs huge efforts in conducting experimental tests and the
result is not very meaningful for the project considering the time cost Another
possibility is to conduct the experimental tests with a constant load Therefore the
change of internal resistance caused by the change of discharge current could be
ignored As a result in the whole process of this project the same load is
66
employed either in the constant-impedance load discharge or in the two-load
discharge tests
In order to implement the different internal resistance value when discharging
under different load a switch that can control the parameters R00 and R10 is
employed This switch is controlled by the discharge current which is the main
input of the mathematical model In the two-load discharge tests when the switch
K in Figure 4-1 is switched off there is only one load is connected to the battery
terminals and the discharge current is lower the values of R00 and R10 are
switched to the first set of parameters R001 and R101 To the contrast when K is
switched on the discharge current is higher and the values are switched to the
second set R002 and R102
423 Improved Lead-Acid Battery Mathematical Model
From the model described in Chapter 3 and the improvements studied in this
chapter the mathematical model of lead-acid battery when discharging in different
discharge currents can be described as the following equations
m
c
f
c
IIK
CK
IC))(1(1
)1(
)(
0
minus+
+
=
ε
θ
θ
θ (42)
ττ dItQt
e int=0
)()( (43)
)0(1 θCQSOC eminusminusminusminus==== (44)
)(1 θavge ICQDOC minusminusminusminus==== (45)
67
)1)(273(0 SOCKEE Emm minusminusminusminus++++minusminusminusminus==== θ (46)
)]1(1[ 0000 SOCARR minusminusminusminus++++==== (47)
)ln(101 DOCRR minusminusminusminus==== (48)
11
RC
τ= (49)
IeRtV
t
R sdotminussdot=minus
)1()( 11τ (410)
RIRVP Rs sdot+=2
12
1 (411)
sa P
Rdt
dC +
minus=
θ
θ
θθθ
(412)
)(
)(
2
1
002
001
00Load
Load
R
RR
= (413)
)(
)(
2
1
102
101
10Load
Load
R
RR
= (414)
)10(
)10(
2
1
AI
AI
lt
gt
=τ
ττ (415)
001R 002R 101R 202R and 1τ 2τ in the equations stand for different parameter
values of 10R 20R and τ when the load and charge status changes in order to
reflect the improvements described in this chapter For a two-load discharge test
there are ten important unknown parameters in the equations of the mathematical
model which are unknown for a specific battery 0C 0mE EK 001R 002R 101R
102R 1τ 2τ and 0A As the internal resistance R00 and R10 vary only when the
load changes they can be treated as constants in the constant-impedance load
68
discharge tests the key parameters are therefore 21100000 ττRRKEC Em
and 0A In this project the study of state of health is based on constant-impedance
load discharge The identification of these unknown parameters will be discussed
in Chapter 5
43 Simulation Study
The processes described above have been implemented in SIMULINK as a
simulation model for computer based analysis The simulation program consists of
two main function blocks circuit block and thermal block The structure of the
SIMULINK implementation is described in Figure 4-5
69
Figure 4-5 Structure of model for SIMULINK Implementation
70
As shown in the figure there are mainly two inputs in the model the discharge
current and the discharge time The actual capacity of battery can be then
calculated with the knowledge of rated capacity and the discharge current The
actual capacity is also influenced by the cell temperature At the beginning of
discharge the cell temperature is the same as the surrounding temperature
Integrating the discharge current with respect to time is the capacity consumed in
the discharge progress and then the state of charge and the depth of charge can be
obtained It is shown that the electromotive force and the internal resistance vary
as a result of changing in the state of charge and the depth of charge and the
terminal voltage can be calculated
In the thermal block of the model the heat generated by the current and the
internal resistance are calculated by the Joules law Then this energy is
transferred to calculate the thermal temperature of the cell and the cell
temperature is given back to the circuit block to affect the actual capacity
71
0 1000 2000 3000 4000 5000 6000 7000
0
02
04
06
08
1
Time (s)
Dis
charg
e C
urr
ent
(A)
0 1000 2000 3000 4000 5000 6000 7000105
11
115
12
125
13
Time (s)
Term
inal V
oltage (
V)
Figure 4-6 Terminal Voltage of Battery (Constant Discharge Current SIMULINK)
The result in Figure 4-6 shows the terminal voltage of a battery which discharges
under the current of 08A in a simulation study Since the discharge begins the
voltage drops due to the internal resistance and the change of state of charge (SOC)
and it climbs up when the discharge stops However the voltage changes
gradually because of the time parameter τ This result shows a good qualitative
agreement with the experimental test results
72
44 Summary and Discussion
This chapter introduces the laboratory test system designed for the project and the
limitation of the mathematical model described in Chapter 3 Switches on the time
parameter τ and the internal resistance parameters R00 and R10 have been added to
the model so that the model is able to represent the change of these parameters
found in the experimental tests The implementation of the model under the
MatlabSIMULINK environment is described and the simulation study shows a
good qualitative agreement with the experimental test results
The next chapter will focus on the identification of those unknown parameters of
the battery model that are important for revealing the battery characteristics
including 20100000 τARRKEC Em and 1τ
73
Chapter 5
Model Parameter Identification
and Model Validation
The identification of the unknown parameters 20100000 τARRKEC Em and 1τ
in the mathematical model will be introduced in this chapter
51 Need for the Optimization Algorithms
In those equations of the battery model described previously some parameters are
unknown and some of them are difficult to derive from physics or engineering
principles or to be obtained through experimental tests Therefore the
identification of the model unknown parameters becomes an important part for the
project Parameter identification is an optimization process that adjusts the
parameters to enable the simulation results to show the best agreement with the
results acquired by the experimental tests There are many algorithms available
for optimization and the principle of the optimization process for the project is to
minimize the objective function The objective function is formed by the absolute
value of the difference between the simulated and experimental results at each
time point The set of parameters to achieve the least value of the objective
function is considered to be the fittest set
74
There are two basic requirements of the optimization in this project First of all as
the problem for the solutions trapped to the local minima is a very important and
challenging issue in many linear optimization solvers the optimization algorithm
used in this project must be able to find the global minimum Secondly the
optimization algorithm not only should find the minimum value of the objective
function but also can tell the values of the parameters that result in the best fitness
which is needed for the analysis purpose in this project Finally the time cost is
also an important factor in selection of a suitable optimization algorithm
It needs to point that the objective here is to identify the unknown parameters of a
model with an already known structure If the objective is to identify or
approximate unknown model structures the selection of optimisation methods
will be quite different In the case of latter Neural Network Genetic
Programming and Fuzzy Logical will be more suitable choices To concentrate on
the objective of the project the thesis will focus on optimisation algorithms for
parameter identification
52 Overview of the Optimization Algorithms
Brute-force search is the most basic direct search algorithm that is used to find the
minimum value In the brute-force search the initial guess is the minimum
possibility of parameters and increasesdecreases The parameter
increasesdecreases step by step in each iteration and the best solution can be
75
searched This algorithm is the simplest but its disadvantage is also obvious that
is it is the slowest optimization method especially when used in the identification
of more than two parameters and the results are largely dependent on the initial
guesses
Linear search is an optimization method to solve the linear optimization problem
the preference function of which is linear and the feasible domain is defined by a
linear constraint function The linear constraints define a convex polyhedron
geometrically which is called the feasible region The algorithm is to construct an
admission solution at a vertex of the polyhedron and then along edges of the
polyhedron to vertices with successively higher values of the objective function
until the optimum is reached
Besides the basic optimization methods evolution computation technology is
becoming increasingly popular A range of different evolution computation
technologies can solve the optimization problem in this project including genetic
algorithms (GAs) particle swarm optimization (PSO)
Genetic Algorithms are direct search algorithms inspired from the process of
evolution in nature the natural selection Based on the principle of survival of the
fittest the GAs can produce better and better approximations to the global optimal
solution in a number of generations In each generation a new group of solutions
is created by the fitness level in the problem of every individual in the last
generation The solutions are then bred together to lead to the evolution of
individuals
76
Particle swarm optimization is a stochastic population-based computer algorithm
modelled on swarm intelligence that searches for a solution to an optimization
problem in a search space Based on the social psychological principles each
individual called lsquoparticlersquo in PSO is able to provide information to others and
also learn the success from the local best and the global best The movement of
each particle through the search space are guided by these successes and the
solution can be found after a number of generations
It has been proved by Dr Jianlin in his PhD Thesis (Wei 2007) that both Genetic
Algorithm and Particle Swarm optimization are capable of the model parameter
identification But the Particle Swarm optimization is a new algorithm that first
described in 1995 and it is not as common as Genetic Algorithm in the research
areas
The purpose of this research work is to find a method for parameter estimation
Genetic algorithms are well proven solution for complicated optimisation
problems and have been applied successfully in a range of similar problems (Wei
2007 Wei Wang et al 2007) Genetic algorithms are also well suited to problems
with many local minima In the current work the exact form of the fitness
function is unknown and it is therefore important to select a robust technique
which can identify good overall solutions For these reasons GA was selected to
give the best possible chance of satisfying the overall project objectives within the
limited timeframe of the project
77
53 The Study of the Genetic Algorithms
The process of Genetic Algorithm is reviewed in this section to provide an insight
into how GAs work and simulation study of two bench mark functions are carried
out
531 Working Principle of GAs
There are many methods used to implement a GA process and usually a GA is at
least composed of three common genetic operators Selection Crossover and
Mutation (Pham and Karaboga 1998) The flowchart of a simple GA process is
given in Figure 5-1
As a preparation to start the optimization process a GA requires a group of initial
solutions as the first generation The first generation is usually a group of
randomly produced solutions created by a random number generator The
population which is the number of individuals in a generation should be big
enough so that there could be a reasonable amount of genetic diversity in the
population Also it should be small enough for each generation to be computed in
a reasonable period of time using the computer resources available Typically a
population includes individuals between 20 and 100 (Chipperfield Fleming et al
1994A)
78
Figure 5-1 Flowchart of a Simple Genetic Algorithm (Pham and Karaboga 1998)
The fitness function is evaluated to measure how close that the individuals fit the
desired result A fitness function could be either complex or simple depending on
the optimization problem addressed In a case of minimization problem the most
fitted individuals will have the lowest numerical value of the associated fitness
function
No
Yes
Selection
Crossover
Mutation
Find the Best Individual
Generate initial population
Results
Evaluate fitness values
Operators of generating new
generation
Gengt 100
Evaluation
Start
79
Individuals are selected according to a fitness-based process The operator of
selection is made up of ranking and selection progress by which more copies of
the individuals that fit the optimization problem better will be produced in the
next generation In GAs there are mainly two ways to select a new population
Roulette Wheel Selection (RWS) and Stochastic Universal Sampling (SUS)
The individuals will be recombined (crossover) after the selection This operation
is to produce two new individuals from two existing individuals selected by the
operator of selection by cutting them at one or more position and exchanging the
parts following the cut The new individuals therefore can inherit some parts of
both parentsrsquo genetic material There are usually four ways of doing this one-
point crossover two-point crossover cycle crossover and uniform crossover
(Pham and Karaboga 1998) Figure 5-2 (a) shows an example of the two-point
crossover progress
Mutation is another operator to produce new individuals The difference is that the
new individual is produced from a single old one In this operation the bit values
of each individual are randomly reversed according to a specified property A
mutation can also helps the GA to avoid local optimums and find the global best
solution Figure 5-2 (b) represents how the mutation operator works
80
Figure 5-2 (a) Crossover operation (b) Mutation operation
The group of individuals produced after the mutation is the second generation
Then the fitness value of each individual in the second generation is computed
again This cycle will not stop until the result is close enough or after a certain
generation
Three major Matlab toolboxes are applied in the current market for application
purpose they are Genetic Algorithms Toolbox V12 (Chipperfield Fleming et al
1994B) the Genetic Algorithms Optimization Toolbox V11 (Houck Joines et al
1995) Genetic Algorithm Direct Search Toolbox V102 (MathWorks Inc 2004)
In this project the official toolbox in Matlab form Mathworks Inc is employed
The property settings for the project based on Dr Weirsquos thesis (Wei 2007) are
shown in Table 5-1
Parent 1 1 1 0 0 1 0 1 1 0 1 0 1 1
Parent 2 0 1 1 0 1 1 0 0 1 0 1 0 0
Offspring 1 1 1 0 0 1 1 0 0 1 1 0 1 1
Offspring 2 0 1 1 0 1 0 1 1 0 0 1 0 0
(a)
Parent 1 1 0 0 1 1 0 0 1 1 0 1 1
Offspring 1 1 0 0 1 0 0 0 1 1 0 1 1
(b)
81
Table 5-1 The property settings for Genetic Algorithms
Name of the GA properties Value of the GA properties
Number of generations 100
Population size 20
Fitness assignment Rank-base fitness assignment
Selection Stochastic universal sampling
Crossover Scattered crossover
Crossover rate 07
Mutation function Uniform mutation
Mutation rate 01
Population size specifies how many individuals there are in each generation With
a large population size the genetic algorithm searches the solution space more
thoroughly and the gives more possibility to return the global minimum The
number of generations specifies the maximum number of iterations for the genetic
algorithm to perform If this number is too low the genetic algorithm is not able
convergence to the global solution However either a large population size or a
large number of generations can cause the algorithm to run more slowly The
crossover rate and the mutation rate are properties that control the crossover and
mutation operator High rate of these values means that the genetic algorithm has
a higher opportunity of producing new offspring but it can be easy to miss the
current best solution if these values are too big
Initial tests of genetic algorithms on different properties show that the values
shown in table 5-1 are able to find an adequate solution Similar results would be
82
obtained if the values of the generations and the population size are larger but
costing more CPU time The crossover rate and the mutation rate would not affect
the result significantly if only varies in a small range But it is impossible to prove
that these two values are the best choice due to the strong randomness
532 Simulation Studies of Genetic Algorithms
In order to test and demonstrate that Genetic Algorithms are able to meet the
requirements of the project simulation studies have been carried out Two
benchmark functions that are commonly used in evaluating evolutionary
computation algorithms are employed for the simulation studies They are
1) Rastrigin function
Rastrigin function is a typical example of non-linear multimodal function with
many local minima The problem of looking for the global minimum is quite
difficult due to its large search space and its large number of local minima The
function is shown as
))2cos(10(10)(1
2sum=
sdotsdotminus+sdot=
n
i
ii xxnXf πr
where n is the dimension of the problem and 1x ~ nx are the coefficients to be
identified Figure 5-2 shows a 2-dimensional Rastriginrsquos function while figure 5-3
is a contour plot of Rastrigins function shows the alternating maxima and minima
83
The global minimum of the Rastriginrsquos function is 0)( =Xfr
when
021 ==== nxxx L
Figure 5-2 2-dimensional Rastrigins function (MathWorks Inc 2004)
84
Figure 5-3 Contour plot of Rastrigins function (MathWorks Inc 2004)
In the simulation study a ten dimensional Rastriginrsquos function is adopted Figure
5-4 shows the best optimization performance of the Rastriginrsquos function in each
generation It is shown that after 700 generations a global optimal value is
obtained
85
0 100 200 300 400 500 600 700 800 900 10000
10
20
30
40
50
60
70
80Best 00099429
Generation
Fitness v
alu
e
Best f itness
Figure 5-4 GA performance (Rastrigrinrsquos function)
2) Rosenbrock function
Rosenbrock function is another mathematical function used as a test problem for
optimization algorithms The global minimum is inside a long narrow parabolic
shaped flat valley To find the valley is trivial but to converge to the global
minimum is difficult The Rosenbrock function is defined by
sum=
+ minus+minus=
n
i
iii xxxXf
1
2221 ))1()(100()(
r
where n is the dimension of the problem and 1x ~ nx are the coefficients to be
identified Figure 5-5 shows a 2-dimensional Rosenbrock function
86
The global minimum of the Rosenbrock function is 0)( =Xfr
when
121 ==== nxxx L The same as the Rastriginrsquos function a ten dimensional
Rosenbrock function is adopted for the simulation study Figure 5-6 is the GA
performance to the Rosenbrock function It can be found that the optimization
converges and get the global optimal value after 300 generations
Figure 5-5 2-dimensional Rosenbrock function (MathWorks Inc 2004)
87
0 100 200 300 400 500 600 700 800 900 10000
200
400
600
800
1000
1200Best 060113
Generation
Fitness v
alu
e
Best fitness
Figure 5-6 GA performance (Rosenbrock function)
54 Model Parameter Identification
541 Implementation of Genetic Algorithms and
Experimental Data sets
In this project the Genetic Algorithm Direct Search Toolbox V102 developed by
Mathworks Inc is employed to identify the parameters of the battery model The
process is shown in Figure 5-7
88
Figure 5-7 Progress of Parameter Identification
The fitness function is used in the project and the parameter identification is to
minimize the fitness function so that the model output can fit the experimental
result The fitness function is given as
sum
sum sumsum
minussdot=
minussdot++minussdot+minussdot=
minus
1
0
2
1 1
1
0
))()(()(
)()()(
exp
expexp2exp1
t
t
sim
t
t
t
t
simnsim
t
t
sim
tVtVabstW
VVabsWVVabsWVVabsWfitnessn
n
L
where Vexp is the experimental terminal voltage data
Vsim is the simulated terminal voltage
Wt is the weights of the difference in the simulated and experimental
results
This fitness function represents the sum of the error values at each time interval
Mathematical Model of a six-cell
Lead Acid Battery
Experimental Test
Results
Fitness
Function
Discharge Current
Simulation
Output
Terminal Voltage
Simulation
Input
lt fmin
Genetic Algorithms (Selection Crossover and Mutation
etc)
Parameter Update
Yes
No
Stop
89
considered ( ntt minus0 ) The weight coefficients Wt indicates how important the
weighted part is in the optimization and how much it contribute to the
optimisation process Periods with bigger tW values are more important because
the sum of errors will give big value contribution to the fitness function value and
the optimisation process will pay more attention to the higher weighted error parts
In the experiments and optimization process it is found that the results were more
important when the discharge of a battery at the stage of stopping Therefore the
weight in this period is greater than that of the others The weighting coefficient
values in this project are determined by the results of the first several attempts of
parameter identification The period of simulation data that fails to fit the test
result means that the weight value is not big enough until the overall performance
of simulation is reasonable
Following the objective fitness function unknown coefficients of the battery
model are identified using experimental data The mathematical model of a six-
cell lead-acid battery in the figure is described in Chapter 4 and the parameters are
to be identified by Genetic Algorithms are 210100000 ττARRKEC Em
Three sets of experimental tests have been carried out for the purpose of
parameter identification and the validation of the mathematical model These three
experimental results are based on a lead-acid battery with the ideal capacity of 13
Ampere-hours under the discharge current of 08A
90
542 Parameters of Battery Model
The parameters of the mathematical model of a lead-acid battery are identified
using Genetic Algorithms and the predicted battery responses using the identified
parameters are compared with the simulated results One set of typical values of
parameters identified are listed in Table 5-2
Table 5-2 Identified parameters identified by the Genetic
Algorithms in the model of 12V-13Ah lead-acid battery Parameter Value Parameter Value
0C 48198 (Amp-Sec) 0mE 21465 (V)
EK 0001109 (V) 0A 29895
00R 001038 (Ohm) 10R 012196 (Ohm)
1τ 21052 (s) 2τ 17565 (s)
Figure 5-8 shows the simulation results using the Improved Battery Model and the
change of weights defined for this set of result described in the fitness function
The top subplot of Figure 5-8 shows the weight value of the GA fitness function
described before while the middle figure is the discharge current of the
experimental test which is also the input of the mathematical model In the
following test results in this and next chapter the changes of weight value are
similar so they are not shown in the figures
The blue line marked as ldquoExperimental Terminal Voltagerdquo in the bottom figure
represents the measured outputs while the other one (Simulated Terminal Voltage)
represents the simulation results The simulation results are ldquonoisyrdquo because
experimental discharge current is used as the input of model in the simulation
91
progress It is obviously that Figure 5-8 shows a good overall agreement of the
results although some slope when discharging is not perfect
0 500 1000 1500 2000 2500 3000 3500
1
15
Time (s)
Weig
ht
0 500 1000 1500 2000 2500 3000 3500114
116
118
12
122
124
126
128
13
Time (s)
Term
inal V
oltage (
V)
Experimental Terminal Voltage
Simulated Terminal Voltage
0 500 1000 1500 2000 2500 3000 3500
0
05
1
Time (s)
Dis
charg
e C
urr
ent
Simulated Terminal Voltage
Experimental Terminal Voltage
Figure 5-8 Measured and Simulated Result after Parameter Identification
Figure 5-9 shows the mean fitness value and the best in each generation It can be
seen that the best fitness in each generation is decreasing The mean fitness is
unstable because of the mutation operator in the GA that can attempt to find better
solutions
92
0 10 20 30 40 50 60 70 80 90 100100
150
200
250
300
350
400
450
500
550
Generation
Fitness v
alu
e
Best 1075521 Mean 1312731
Best f itness
Mean fitness
Figure 5-9 Mean and the Best Fitness Values in Each Generation
543 Battery Model Validation
In order to validate the battery mathematical model two sets of experimental tests
have been adopted to compare with the simulation results
The inputs of the discharge current and the validation results using two
experimental tests are shown in Figure 5-10 and Figure 5-11
93
0 500 1000 1500 2000 2500 3000114
116
118
12
122
124
126
128
13
Time (s)
Term
inal V
oltage (
V)
Simulated Terminal Voltage
Experimental Terminal Voltage
Simulated Terminal Voltage
Experimental Terminal Voltage
Figure 5-10 Measured and Simulated Terminal Voltage (Validation data 1)
In the simulation that shows in Figure 5-10 the discharge of battery begins at the
time of 700s and the simulation result shows a reasonable agreement with the
experimental result despite the noise of signal caused by the error of the sensors
It is noticed that at the beginning of the discharge there is a difference between
the simulated and experimental terminal voltages for about 100 seconds This
difference is studied and so called lsquocoup de fouetrsquo which often takes place at the
beginning of a discharge test when the SOC of battery is high (Perrin Delaille et
al 2006) However this lsquocoup de fouetrsquo behaviour cannot be described in this
model The discharge period lasts for about 1200 seconds and then stops and after
that the simulation has the similar result with the experiment
94
0 1000 2000 3000 4000 5000 600011
112
114
116
118
12
122
124
126
128
13
Time (s)
Term
inal V
oltage (
V)
Simulated Terminal Voltage
Experimental Terminal Voltage
Simulated Terminal Voltage
Experiment Terminal Voltage
Figure 5-11 Measured and Simulated Terminal Voltage (Validation data 2)
Figure 5-11 shows another group of experimental test to validate the battery
model At the beginning of the experiment the terminal voltage from the
experiment is dropping without any discharge behaviour of battery and that is
because of the experiment was carried out when the terminal voltage of lead-acid
battery is not steady enough after being charged and that also causes the
deviations in the discharge at about 1000-2000 seconds In this period the lsquocoup
de fouetrsquo appears again After the first period the battery is disconnected from the
load until the terminal voltage become steady and the simulation result in this
period fits the experiment result well In the second discharge of this test it is
shown that the lsquocoup de fouetrsquo does not occur because the SOC is not high For
the similar reason in the first discharge in this group of the test results there are
95
also some deviations in this period Finally the simulation result in the last part of
figure fits the experimental result is highly satisfied
The average error of the simulated outputs of the simulation studies and the
measured results are studied Absolute Error and Relative Error is defined as the
following equations
sum
sum
=
=
minus=
minus=
N
i
sim
N
i
sim
iV
iViV
NRelError
iViVN
AbsError
1 exp
exp
1
exp
)(
)()(1
)()(1
The absolute error and relative error are summarised in Table 5-3
Table 5-3 AbsError and RelError of Model Validation
Absolute Error Relative Error discharging relaxing overall discharging relaxing overall
Experimental Test 1 (Identification)
00229V 00207V 00217V 01833 01724 01776
Experimental Test 2 (Validation data 1)
00536V 00484V 00492V 04453 03872 04024
Experimental Test 1 (Validation data 2)
00724V 00372V 00485V 06352 03013 05025
55 Summary and Discussions
Identification of the unknown model parameters is discussed in this chapter and a
range of possibly suitable methods are reviewed in brief In this project Genetic
Algorithm is adopted GAs working principle and its implementation has been
96
introduced in details in this chapter The simulation study of two benchmark
functions that are commonly used in evaluating evolutionary computation
algorithms are employed in order to show the capability of GAs The parameter
identification by tests of a brand new 13Ah lead-acid battery is carried out and is
validated by two sets of other experimental test results under the same working
condition of the same battery
97
Chapter 6
The Analysis of State of Health
(SOH) in association with the
Internal Resistance
61 Methodology
As the number of discharge cycles of battery increases in applications the
maximum charges that a battery can offer will decrease In other words the SOH
battery is deteriorating But this drop of capacity is not linear and it is also a long
progress At the beginning of the use of battery the change of capacity is very
slow and it is not obvious After a number of cycles of discharge and charge this
change will get faster and relatively significant
There are no reliable methods now to calculate the remaining charge capacity
which is the only one determinant of the state of health The normal method is
simply to measure the voltage on its terminals But this measurement is not
accurate on an aged battery A battery in poor state of health but sufficiently
charged can also offer sufficient voltage to appear normal The only way to
determine the capacity accurately is to integrate the discharge current of battery in
a full deep discharge but this method cannot be used too frequently because deep
98
discharge is harmful for the battery
In the project six lead-acid batteries were tested using the test system described in
Chapter 4 These batteries were repeatedly discharged and charged for their whole
life time so that the information related to different state of health can be revealed
as soon as possible Even though the batteries works frequently it still takes more
than 6 months to make the battery become weak The testing experiments were
carried out and the data was recorded every 2-3 weeks so that important value of
state of health is not missed However as the change of capacity is a long progress
and it is nonlinear not all the data collected can be used in this project
Referring the literature (Coleman Lee et al 2006 Lakhdari and Midoun 2007
Coleman Hurley et al 2008) an important factor that reflects the change of state
of health of a lead-acid battery is the internal resistance Not only the state of
health but also other factors (SOC DOC discharge current etc) can result in
variations in internal resistance a new alternative method that based on the
Improved Battery Model in Chapter 4 is adopted in the project
From the model study in Chapter 4 the internal resistance can be divided into two
parts expressed by )]1(1[ 0000 SOCARR minusminusminusminus++++==== (Eq 47) and )ln(101 DOCRR minusminusminusminus====
(Eq 48) These equations show that the internal resistance is affected by the state
of charge (SOC) and depth of charge (DOC) in a discharge cycle In real
applications batteries are seldom discharged to the full range because a deep
discharge could cause some damage to the battery They are also seldom to be
charged to full to prevent the possibility of overcharge that could also bring some
99
negative effects Although this issue is not very significant in a valve regulated
lead acid battery it is better to control the working range of depth of charge from
50 to 80 approximately In this project the internal resistance of battery in the
depth of charge of 65 is studied as a most important factor that related to the
state of health As a little inaccurate of SOC and DOC will induce a comparative
big difference in the internal resistance the method of measuring the internal
resistance accurately by an external circuit is discarded
In Equation 47 and Equation 48 the author found that there are two other factors
that influence the internal resistance besides the SOC and the DOC R00 and R10
Therefore in the project the values of R00 and R10 in a specific discharge current
are very important to study the internal resistance The values of these two factors
are used in Equation 47 and Equation 48 to calculate the internal resistance per
cell of the battery The depth of charge is assumed to be 65 for a normal
working battery as described previously In chapter 3 the SOC and the DOC are
defined as )0(1 θCQSOC eminus= (Eq 44) and )(1 θavge ICQDOC minus= (Eq
45) The Capacity is also defined as equation 42
k
c
fc
IIK
CK
IC))(1(1
)1(
)(
0
minusminusminusminus++++
++++
====
ε
θ
θ
θ (61)
in which Kc = 118 k = 120 and 6 II avg times= in this project The relationship
between the actual capacity under discharge current Iavg and the nominal capacity
is
100
62
1
))(1(1
1
)0)(1(1
1
))(1(1
1
)0(
)(asymp
minus+=
minus+
minus+=
k
avgck
c
k
avgcavg
IIK
IK
IIK
C
IC
θ
θ (62)
Therefore the SOC when the DOC is 65 is
586))0(62(1)0(1 asympsdotminus=minus= θθ CQCQSOC ee (63)
As described in chapter 5 30 asympA therefore the internal resistance of an
individual cell can be obtained by
10001000010 43041)ln()]1(1[ RRDOCRSOCARRRrcell sdot+sdotasympminusminus+=+= (64)
and for a six-cell lead-acid battery the internal resistance
1000 582486 RRrr cellbattery sdot+sdot=times= (65)
62 The identification of C0 R00 and R10
In the eight parameters identified previously in Chapter 5 there are only three
parameters can be affected by the change of battery conditions Therefore the
other five parameters ( 2100 ττAKE Em ) can be treated as a constant for a battery
The parameters that related to the battery condition 0010 RR and 0C are the key
problems which the project focused on 0C represents the state of health while
the 0010 RR stands for the internal resistance parameters Here again the Genetic
algorithm is adopted to identify these three parameters
In this project the battery have been discharged and charged in hundreds of cycles
to simulate the capacity loss in the normal applications which is described by the
101
state of health in this project In order to find out the different behaviour of
internal resistance in different state of health experimental tests have been carried
out in different state of health of the battery
The first test is carried out when the battery is brand new and the data is also used
to identify the other parameters of the battery model as described in the previous
chapter The second group of data is collected after 300 discharge cycles
approximately and the third test took place after 200 more cycles The number of
discharge cycles between the last four tests is only about 50 because the change of
State of Health is more significant The identified parameters of a battery in
different state of health are shown in table 6-1
Table 6-1 Battery Remaining Capacity and Internal Resistance
Remaining
Capacity C0 (Amps)
SOH R00 R10 RelError Internal
Resistance (Ohm)
Test 1 48198 100 00609 00220 01756 05683
Test 2 44861 9314 00654 00103 07428 05759
Test 3 38025 7889 00635 00191 02812 05827
Test 4 33830 7019 00573 00509 07265 06126
Test 5 30625 6354 00604 00582 04340 06575
Test 6 26072 5306 00703 00368 01342 06855
And the terminal voltages simulated and measured are shown as the following
figures The same as previous figures the blue lines represent the measured
outputs while the red lines represent the simulation results
The test shows in figure 6-1 the same as the test which is used to describe the
genetic algorithms and the battery parameter identification in chapter 5 Detailed
102
description and analysis are given in chapter 5
0 500 1000 1500 2000 2500 3000 350011
112
114
116
118
12
122
124
126
128
13
Time (s)
Term
inal voltage (
V)
Experimental Terminal Voltage
Simulated Terminal Voltage
Experimental Terminal Voltage
Simulated Terminal Voltage
Figure 6-1 Experimental and Simulated Terminal Voltage of Test 1 (SOH = 100)
103
0 1000 2000 3000 4000 5000 600011
112
114
116
118
12
122
124
126
128
13
Time (s)
Term
inal V
oltage (
V)
Simulated Terminal Voltage
Experimental Terminal Voltage
Simulated Terminal Voltage
Experimental Terminal Voltage
Figure 6-2 Experimental and Simulated Terminal Voltage of Test2 (SOH= 9314)
The experiment shown in figure 6-2 is tested several months after the first
experimental test In the period that the first discharge begins the experimental
result shows a different slope in terminal voltage The reason is probably that the
battery have just charged to full by a charger and itrsquos the capacitor had not fully
discharged After that when the discharge stopped there is a deviation in the
simulation voltage In the authorrsquos opinion that is because of the accuracy of R10
and R00 If the value of R10 is greater and that of R00 is smaller the simulation
result should fit the experimental result In the second discharge period of the
discharge test there is also a little difference in the experimental and simulation
result caused by the inaccuracy of battery parameters But it shows a good
agreement when the discharge stopped
104
0 500 1000 1500 2000 2500 3000 3500 400011
112
114
116
118
12
122
124
126
128
13
Time (s)
Term
inal V
oltage (
V)
Simulated Terminal Voltage
Experimental Terminal Voltage
Simulated Terminal Voltage
Experimental Terminal Voltage
Figure 6-3 Experimental and Simulated Terminal Voltage of Test3 (SOH= 7889)
0 500 1000 1500 2000 2500 3000 3500 4000 4500 500011
112
114
116
118
12
122
124
126
128
13
Time (s)
Term
inal V
oltage (
V)
Simulated Terminal Voltage
Experimental Terminal Voltage
Simulated Terminal Voltage
Experimental Terminal Voltage
Figure 6-4 Experimental and Simulated Terminal Voltage of Test4 (SOH= 7019)
105
0 1000 2000 3000 4000 5000 600011
112
114
116
118
12
122
124
126
128
13
Time (s)
Term
inal V
oltage (
V)
Experimental Terminal Voltage
Simulated Terminal Voltage
Simulated Terminal Voltage
Experimental Terminal Voltage
Figure 6-5 Experimental and Simulated Terminal Voltage of Test5 (SOH= 6354)
Figure 6-3 figure 6-4 and figure 6-5 show the test results of the battery when the
SOH drops to its 80 70 and 60 It is shown that the simulation result in
figure 6-3 fits the experimental result until the end of test when the discharge of
battery has just stopped The inaccuracy of the R10 and R00 is also the main cause
of the deviation The overall simulation result in figure 6-4 figure 6-5 are good to
express the battery behaviour
106
0 500 1000 1500 2000 2500 3000 3500 400011
112
114
116
118
12
122
124
126
128
13
Time (s)
Term
inal V
oltage (
V)
Experimental Terminal Voltage
Simulated Terminal Voltage
Experimental Terminal Voltage
Simulated Terminal Voltage
Figure 6-6 Experimental and Simulated Terminal Voltage of Test6 (SOH= 5306)
In the parameter identification of test shown in figure 6-6 the remaining capacity
is only about 12 of the initial capacity when the battery is brand new During the
discharge period the simulation and experimental result is not fitting very well
and the slopes of them are not the same This is probably also caused by
insufficient idle time after being charged and the capacitor had not fully
discharged
Figure 6-7 represents the internal resistance value in different state of health as
described in table 6-1
107
100 95 90 85 80 75 70 65 60 55 5004
045
05
055
06
065
07
075
08
State of Health
Inte
rnal R
esis
tance (
Ohm
)
r vs SOH
Approximation
Figure 6-7 Change of Internal Resistance in Different State of Health (Battery 1)
It is shown that the internal resistance is increasing when the state of health of a
lead-acid battery decreases This progress is at first very slow when the battery is
new But after a number of discharge cycles the remaining capacity of battery
drops to about 75 of the initial capacity when the battery is new and the
increase of internal resistance become faster When the state of health is brought
down to about 50 which means that the battery cannot offer enough energy as
new the value of internal resistance is increased by 30 approximately At
present there is not a published quantitative description of the internal resistance
when the capacity changes yet but it has been agreed that the internal resistance
increases while the battery health deteriorates
Similar tests have been carried out on 5 other batteries with the same nominal
108
capacity and the changes of their internal resistances are given as figure 6-8 It is
not possible to deduce a statistical approximation equation only based on the
existing data but it can be seen from the figure that the performance of internal
resistance under different state of health shows an agreement in a certain extent
100 95 90 85 80 75 70 65 60 55 5003
04
05
06
07
08
09
State of Health
Inte
rnal R
esis
tance (
Ohm
)
r vs SOH (Battery 1)
r vs SOH (Battery 2)
r vs SOH (Battery 3)
r vs SOH (Battery 4)
r vs SOH (Battery 5)
r vs SOH (Battery 6)
Figure 6-8 Change of Internal Resistance in all 6 Batteries
63 Summary and Discussions
The determination of battery remaining capacity accurately is becoming
increasingly important in modern battery managements This currently is mostly
obtained by integrating the discharge current of a full discharge but this progress
usually causes a negative effect on most of the batteries There is also a view that
109
the state of health which represents the percentage of remaining capacity of a
weak battery compared with the initial capacity when brand new can affect the
internal resistance therefore the battery state of health can be obtained by the
study of battery internal resistance However from the analysis based on the
mathematical model and the experimental results it can be concluded that other
parameters can also cause variations of the internal resistance which make the
estimation of the state of health more challenging
This chapter describes a new alternative method that based on the Improved
Battery Model and the key parameters of the model The remaining maximum
capacity of a used battery which represents the SOH of the battery is related in
the internal resistance under the depth of charge of 65 which is expressed by
the parameters of R00 and R10 These parameters can be identified by genetic
algorithms A result that quantifies the change of internal resistance in different
SOH values has been concluded based on the analysis of a series of experimental
tests
110
Chapter 7
Conclusions and Future
Research
This chapter summarizes the major achievements of the presented research work
in the field of battery modelling and state of health analysis Possible direction of
further research work is also described briefly in this chapter
71 Summary
Lead-acid batteries are used in various industrial sectors and are irreplaceable due
to their low price In areas where lead-acid batteries are employed as an energy
storage device the capacity loss caused by the repeated dischargecharge cycles is
very common This drop of capacity can neither be avoided nor be repaired by
using current technologies As a result it is essential to know whether the battery
is able to meet the demand and if it should be replaced on time
In this thesis a study on the capacity status of a battery and its relation to the
internal resistance had been conducted and this thesis established a novel model
based method to quantify the battery health An Equivalent Circuit Mathematical
model for the discharging progress of a lead-acid battery has been developed for
this purpose and is implemented under MatlabSIMULINK software environment
111
The model involves most of the important concepts of a battery to reflect the
dynamic response of terminal voltage when discharging
A series of experimental tests have been carried out during the project for the
model validation and the study of the state of health Six 12V-13Ah lead-acid
batteries with the same rated capacity are discharged and recharged from brand
new to obtain different values of state of health Genetic algorithm has been
employed to identify the unknown parameters of the battery model in each state of
health and the identified parameters are used as the factors that reflecting the state
of health and the internal resistance The internal resistances corresponding
different state of health have been collected and recorded A result was found in
the thesis that for the 12V-13Ah lead-acid battery which is used in the
experimental tests the value of internal resistance is increased by 25
approximately if the SOH of battery drops to 50
72 Limitations
The key limitation of the method introduced in this thesis is that it is based on the
parameter identifications of the model which means a test is still needed in order
to obtain the state of health The major reason is that the mathematical model does
not include the charging progress of battery which is also an important period of
the battery duty cycle Another limitation is that all the tests of the state of health
estimation are carried out at the same discharge rate because of the variation of
the internal resistance in different discharge rate as discussed in chapter 4 Finally
112
The lsquocoup de fouetrsquo behaviour that of took place at the beginning of discharge
when batteries are full is not able to be simulated in the current version of
mathematical model
73 Future Research Work
Following the limitations of the project some future research can be carried out in
three steps based on the model improvements and the practical applications of the
algorithm
First of all improvements of the discharging battery model can be carried out
which can mainly focus on the study of the battery internal resistance in different
discharge rates Equations of internal resistances that can withstand the change of
discharge rate will make the model capable for online applications Studies on the
relationship between the electromotive force and the state of charge can also lead
to a solution of the lsquocoup de fouetrsquo behaviour and a better simulation result
Another research work on the model modification is that the behaviour of battery
to the mathematical model when a battery is being charged can be involved by
which the monitoring system of battery can be implemented in the whole duty
cycles This part of work can be focused on the parasitic branch in the
mathematical model described in chapter 3
Further work should also reveal the variations of state of health in different duty
113
cycles and an algorithm based on this change should be designed to estimate the
remaining life-time of a lead-acid battery The value of current state of health and
the estimated raining life-time should also be considered as major outputs in this
period of work It is also possible to design an online management device of
battery to estimate the life-time and the state of health
114
References
Anon (2006) Global Wind Energy Council (GWEC) statistics [online] from
httpwwwgwecnetuploadsmedia07-
02_PR_Global_Statistics_2006pdf
Anon (2007) Battery Types Flooded versus AGM and Gel [online]
Retrieved February 13 2007 from
httpwwwvonwentzelnetBattery01Type
Anon (2007) BP Statistical Review of World Energy June 2007 [online] from
httpwwwbpcomliveassetsbp_internetglobalbpglobalbp_uk_englishr
eports_and_publicationsstatistical_energy_review_2007STAGINGlocal_
assetsdownloadsspreadsheetsstatistical_review_full_report_workbook_2
007xls
Anon (2007) International Energy Outlook 2007 [online] from
httpwwweiadoegovoiafieohighlightshtml
Ball R J Evans R and Stevens R (2002) Finite element (FE) modelling of
current density on the valve regulated leadacid battery positive grid
Journal of Power Sources 103(2) 213-222
Bernardes A M Espinosa D C R and Tenoacuterio J A S (2004) Recycling of
batteries a review of current processes and technologies Journal of
Power Sources 130(1-2) 291-298
Berndt D (1993) Maintenance-Free Batteries -- A Handbook of Battery
Technology Somerset Research Studies Press Ltd
Berndt D (2001) Valve-regulated lead-acid batteries Journal of Power
Sources 100(1-2) 29-46
115
Berndt D (2009) Electrochemical Energy Storage Battery Technology
Handbook CRC Press
Casacca M A and Salameh Z M (1992) Determination of lead-acid battery
capacity via mathematical modeling techniques Energy Conversion
IEEE Transaction on 7(3) 442-446
Ceraolo M (2000) New dynamical models of lead-acid batteries Ieee
Transactions on Power Systems 15(4) 1184-1190
Chan H L and Sutanto D (2000) A new battery model for use with Battery
Energy Storage Systems and Electric Vehicles Power Systems 2000 Ieee
Power Engineering Society Winter Meeting - Vols 1-4 Conference
Proceedings 470-475
Chen M and Rincacuteon-Mora G A (2006) Accurate electrical battery model
capable of predicting runtime and I-V performance IEEE
TRANSACTIONS ON ENERGY CONVERSION VOL 21( NO 2)
504-511
Chipperfield A J Fleming P J and Fonseca C M (1994A) Genetic algorithm
tools for control systems engineering Adaptive computing in
engineering design and control Plymouth UK
Chipperfield A J Fleming P J Pohlherim H and Fonseca C M (1994B)
Genetic algorithm toolbox for use with Matlab Department of automatic
control and systems engineering University of Sheffield
Crompton T R (2000) Battery Reference Book Third Edition Oxford
Elsevier Newnes
Cun J P Fiorina J N Fraisse M Mabboux H A and Mabboux H The
116
experience of a UPS company in advanced battery monitoring
Telecommunications Energy Conference 1996 INTELEC 96 18th
International 646 - 653
Durr M Cruden A Gair S and McDonald J R (2006) Dynamic model of a
lead acid battery for use in a domestic fuel cell system Journal of Power
Sources 161(2) 1400-1411
Esfahanian V Torabi F and Mosahebi (2008) An innovative computational
algorithm for simulation of lead-acid batteries Journal of Power
Sources 176(1) 373-380
Gillioli R and Cerolo P (1990) Charge and discharge fourth order dynamic
model of the lead battery 10th
intl Electric Vehicle Symposium Hong
Kong p1-9
Glendenning I (1981) Compressed air storage Physics in Technology 12(3)
103-10
GONG Q (2005) Modeling study of a vehicle traction battery model
CHINESE LABAT MAN 2005 Vol 42 Numb 2 issu 155 pages 76-79
Houck C Joines J and Kay M (1995) A Genetic Algorithm for Function
Optimization A Matlab Implementation NCSU-IE TR 95-09
Jacobi W (2009) Lithium Batteries Battery Technology Handbook CRC Press
Jayne M G and Morgan C (1986) a new mathematical model of lead acid
battery for electric vehicles Eighth Intl electric vehicle conference
Washington DC
Juvonen M (2003) Large-Scale Energy Storage Systems [online] from
httpwwwdocicacuk~mattiise2grpenergystorage_reportstoragehtml
117
Lee J H Lee K Y and Lee J Y (1996) Self-discharge behaviour of sealed
Ni-MH batteries using MmNi33+xCo07Al10-x anodes Journal of
Alloys and Compounds 232(1-2) 197-203
Liaw B Y Gu W B and Wang C Y (1997) Numerical simulation of coupled
electrochemical and transport processes in battery systems Proceedings
of the Intersociety Energy Conversion Engineering Conference
Honolulu HI USA IEEE
Lu S Meegahawatte D H Guo S Hillmansen S Roberts C and Goodman
C J (2008) Analysis of energy storage devices in hybrid railway vehicles
Railway Engineering - Challenges for Railway Transportation in
Information Age 2008 ICRE 2008 International Conference on
Mantell C L (1984) Batteries and energy systems Second Edition McGraw-
Hill Inc
MathWorks Inc (2004) Genetic Algorithm Direct Search Toolbox V102
MathWorksInc
MPowerSolutionsLtd (nd) Alternative Energy Storage Methods [online]
from httpwwwmpowerukcom
Okoshi T Yamada K Hirasawa T and Emori A (2006) Battery condition
monitoring (BCM) technologies about lead-acid batteries Journal of
Power Sources 158(2) 874-878
Perrin M Delaille A Huet F and Hernout L (2006) Study of the coup de
fouet of lead-acid cells as a function of their state-of-charge and state-of-
health Journal of Power Sources 158(2) 1019-28
Pham D T and Karaboga D (1998) Intelligent Optimisation Techniques
118
Genetic Algorithms Tabu Search Simulated Annealing and Neural
Networks New York Springer-Verlag New York Inc
RailPower Hybrid Technologies C (nd) Benifits of Hybrid Locomotives
[online] from httpwwwrailpowercomproducts_hl_benefitshtml
Rand D A J Moseley P T and Garche J (2004) Valve-Regulated Lead-Acid
Batteries Elsevier
Ruetschi P (2004) Aging mechanisms and service life of lead-acid batteries
Journal of Power Sources 127 (1-2) 33-44 Switzerland Elsevier
Salameh Z M Casacca M A and Lynch W A (1992) A mathematical model
for lead-acid batteries IEEE Trans on Energy conversion Vol7 No 1
Sato Y Takeuchi S and Kobayakawa K (2001) Cause of the memory effect
observed in alkaline secondary batteries using nickel electrode Journal
of Power Sources 93(1-2) 20-24
Sims R I Carnes J C Dzieciuch M A and Fenton J E (1990) Computer
modeling of Automotive lead acid batteries Ford Research Laboratories
Technical Report
Smil V (2007) Energy at the Crossroads Massachusetts Achorn Graphic
Services Inc
Ter-Gazarian A (1994) Energy storage for power systems London Peter
Peregrinus Ltd
TNI_Ltd (2007) Battery history [online] from
httpwwweuropulsecombattery_historybattery_historyhtm
Tuck C D S (1991) Modern Battery Technology Ellis Horwood Ltd
Wei J (2007) Development of Coal Mill and Aggregate Load Area Models in
119
Power Systems using Genetic Algorithms University of Liverpool PhD
Wikipedia (nd) Lead-Acid Battery [online] from
httpenwikipediaorgwikiLead-acid
Wikipedia (nd) Rechargeable Batteries [online] from
httpenwikipediaorgwikiRechargeable_battery
Wikipedia (nd) VRLA [online] from httpenwikipediaorgwikiVRLA
Zhang Y L Liu P H Zhang Q Y and Cheng W (2010) Separation of
cadmium(ii) from spent nickelcadmium battery by emulsion liquid
membrane Canadian Journal of Chemical Engineering 88(1) 95-100
120
Appendix I SIMULINK Diagrams of Battery Model
Figure A-1 SIMULINK Diagrams of ldquoMain Blockrdquo
121
Figure A-2 SIMULINK Diagrams of ldquoTerminal Voltage Calculationrdquo
122
Figure A-3 SIMULINK Diagrams of ldquoThermal Behaviourrdquo
123
Figure A-4 SIMULINK Diagrams of ldquoBattery Capacityrdquo
Figure A-5 SIMULINK Diagrams of ldquoBattery State of Chargerdquo
Figure A-6 SIMULINK Diagrams of ldquoBattery Depth of Chargerdquo
124
Figure A-7 SIMULINK Diagrams of ldquoBattery Electromotive Forcerdquo
(a)
(b)
Figure A-8 SIMULINK Diagrams of ldquoBattery Internal Resistancerdquo
125
Appendix II
List of Publications
S Hillmansen S Lu D H Meegahawatte S Guo C Roberts and C J
Goodman Analysis of Energy Storage Devices in Hybrid Railway Vehicles International Conference on Railway Engineering 2008 p68-73 Hong Kong China 25-28 March 2008
Y Yin X Luo S Guo Z Zhou J Wang A battery charging control strategy for
renewable energy generation systems The Proceedings of World Congress on Engineering 2008 Vol 1 pp356-361 London UK 2-4 July 2008
S Guo S Hillmansen Y Yin J Wang State of Health Monitoring of Lead-acid
Batteries Proceedings of the 14th International Conference on Automation amp Computing pp250-254 Brunel University West London UK 6 September 2008
Y Yin C Li Z Zhou Q Liu S Guo X Luo J Wang Design and Realization of a
PS2 Keyboard Interface in Embedded system Proceedings of the 14th International Conference on Automation amp Computing pp160-163 Brunel University West London UK 6 September 2008
Yin Y Wang J Luo X Guo S Development of a battery charging management
unit for renewable power generation a book chapter in Advances in
Electrical Engineering and Computational Science Edited by Sio-Long Ao and Len Gelman pp33-46 Springer 2009
Wang J Wei JL Guo S Condition monitoring of power plant milling process
using intelligent optimization and model based techniques accepted as a chapter in the book of Fault Detection in March 2009
S Guo S Hillmansen J Wang Model Based Analysis of Battery State of Health
using Genetic Algorithms accepted by the International Conference on Systems Engineering (ICSE) Coventry 8-10 September 2009

2
Acknowledgements
First and foremost I would like to express my sincere appreciation to my
supervisors Dr Stuart Hillmansen and Dr Jihong Wang for their support
guidance inspiration and patience during my MPhil study I have greatly
benefited from their knowledge and experience
I am also grateful to Dr Jianlin Wei and Dr Nan Jia for their support and advices
during my research and to Dr Leonid Shpanin for his assistance in my laboratory
experiments Many thanks to Mr Bo Fan Mr Shaofeng Lu and Mr Lei Chen for
their valuable ideas shared with me I would also like to thank Mr Hao Sun Mr
Xing Luo as well as all the other colleagues for their discussions and their kind
assistant during my study
Finally I would like to thank my family and all my friends Without their
encouragement support and understanding this thesis would not have been
possible
3
Abstract
Batteries are becoming increasingly important to our life as they are applied in a
range of different areas Therefore the reliability of battery is a critical issue in
these battery applications It has been noticed that most batteries have limited
cycle durability that is the total capacity drops when a battery is charged and
discharged for a number of cycles If a battery is too weak to offer sufficient
energy it should be replaced at the right time But current problem is that there is
no reliable method available to quantify the capacity loss and to estimate whether
the remaining capacity of battery Complete discharge which is the only way of
capacity estimation has a negative effect to the battery plates therefore it cannot
be used too frequently
This thesis summarises the research work in the development of the battery status
estimation algorithm The work initially focused on the mathematical descriptions
of lead acid batteries and a mathematical model based on this study was then
developed and implemented to describe the process of battery discharge Genetic
Algorithms (GAs) were used as a tool to identify the parameters related to the
battery including the internal resistances state of charge and capacity The
relevant simulation results show that the model is able to adequately simulate the
battery discharge process
The aforementioned models were extended to a further investigation of the
batteries state of health It was noticed that there is a link between the status of
4
battery health and the internal resistance In this project six batteries were
discharged and charged in several times in order to simulate the capacity loss that
occurs in normal operation This capacity loss is related to the state of health and
the parameter estimation was able to adequately distinguish between different
state of health
These results indicate that the internal resistance increases when the state of health
of a lead-acid battery decreases This progress is at first very slow when the
battery is new but the change becomes faster when the remaining capacity of
battery drops to about 75 of the initial It is found in the thesis that the value of
internal resistance is increased by 25 approximately when the state of health is
brought down to about 50 meaning that the battery cannot offer enough energy
as new and should be replaced for safety consideration
The method described within this thesis performed adequately in the limited tests
performed during the experimental work Further investigations are recommended
in order to refine the method which is potentially suitable for online
implementation in battery condition monitoring systems
5
Contents
Chapter 1 Background and Objectives of the Project 1
11 Overview 1
12 Review of Energy Storage Systems 2
121 Applications of the Energy Storage Systems 2
122 Review of the Existing Energy Storage Devices 4
123 Review of Batteries 7
124 The Management of Batteries 11
13 Project Objectives 12
14 Outline of the thesis 13
Chapter 2 Introduction of Lead-acid Batteries 15
21 A General Overview of the Lead-acid Battery 15
22 Configuration of Lead-acid Batteries 18
221 Electrochemical Principles 18
222 Lead-Acid Battery Types and Technologies 20
223 Battery Designs for Different Applications 22
23 Mathematical Descriptions of Lead-acid Batteries 23
231 Capacity 23
232 Electromotive force 24
233 State of Charge and Depth of Charge 26
234 Internal Resistance and State of Health 27
235 Multi-Cell Lead-Acid Batteries 29
24 Summary 29
6
Chapter 3 Equivalent Circuit Modelling of Lead-acid Batteries 31
31 Requirements for the Battery Model 31
32 Overview of Battery Model Techniques 32
321 Electrochemical Model 32
322 Physical Models 33
323 Equivalent Circuit Model 34
324 Discussion of Different Battery Model Methods 35
33 Introduction of the Existing Equivalent Circuit Models 37
331 Simple Battery Model 37
332 Advanced Simple Battery Model 39
333 Thevenin Battery Model 40
334 Dynamic Battery Model 42
335 Fourth Order Dynamic Model 43
336 Improved Battery Model 44
34 Mathematical Model of the Lead-acid Batteries 44
341 Capacity 45
342 Electric Networks 48
343 State of Charge and Depth of Discharge 50
344 Electromotive Force of the Battery 50
345 Internal Resistance of a Battery 51
346 The Behaviour of Parasitic Branch 52
347 Main Branch Capacitance 53
348 Thermal Behaviour of a Battery 55
35 Mathematical Model of the Lead-acid Batteries 56
7
36 Summary and Discussion 57
Chapter 4 Experimental System Set up and Improved Battery Model Simulation
Implementation 59
41 The Experimental System 59
42 Improvements of the Battery Model 61
421 The Change of τ in Different Charge Status 63
422 Analysis in Variations of the Internal Resistance 64
423 Improved Lead-Acid Battery Mathematical Model 66
43 Simulation Study 68
44 Summary and Discussion 72
Chapter 5 Model Parameter Identification and Model Validation 73
51 Need for the Optimization Algorithms 73
52 Overview of the Optimization Algorithms 74
53 The Study of the Genetic Algorithms 77
531 Working Principle of GAs 77
532 Simulation Studies of Genetic Algorithms 81
54 Model Parameter Identification 87
541 Implementation of Genetic Algorithms and Experimental Data sets
87
542 Parameters of Battery Model 90
543 Battery Model Validation 92
55 Summary and Discussions 95
Chapter 6 The Analysis of State of Health (SOH) in association with the Internal
Resistance 97
8
61 Methodology 97
62 The identification of C0 R00 and R10 100
63 Summary and Discussions 108
Chapter 7 Conclusions and Future Research 110
71 Summary 110
72 Limitations 111
73 Future Research Works 112
9
List of Figures
Figure 1-1 Power density vs energy density plot 7
Figure 2-1 Working Principle of Lead-Acid Batteries (a) shows the battery when
discharging and (b) is when charging with a DC charger 18
Figure 3-1 Simple Battery Model 38
Figure 3-2 I-V chart of the Simple Battery Model 39
Figure 3-3 I-V Chart in different SOC 40
Figure 3-4 Sketch to show battery discharge behaviours in typical tests 41
Figure 3-5 Thevenin Battery Model 42
Figure 3-6 Fourth-order Battery Model43
Figure 3-7 Improved Battery Model 44
Figure 3-8 Battery Capacity vs Discharge Current 47
Figure 3-9 Lead-acid Battery Equivalent Network 48
Figure 3-10 The Equivalent Network with the Approximated mZ 49
Figure 3-11 R-C block 53
Figure 4-1 Equivalent Circuit of the Experimental Test Rig 60
Figure 4-2 Experimental Test Rig61
Figure 4-3 Test of constant-impedance load discharge 62
Figure 4-4 Test of two-load discharge 62
Figure 4-5 Structure of model for SIMULINK Implementation69
Figure 4-6 Terminal Voltage of Battery 71
Figure 5-1 Flowchart of a Simple Genetic Algorithm78
Figure 5-2 2-dimensional Rastrigins function83
Figure 5-3 Contour plot of Rastrigins function84
10
Figure 5-4 GA performance (Rastrigrinrsquos function) 85
Figure 5-5 2-dimensional Rosenbrock function 86
Figure 5-6 GA performance (Rosenbrock function) 87
Figure 5-7 Progress of Parameter Identification 88
Figure 5-8 Measured and Simulated Result after Parameter Identification 91
Figure 5-9 Mean and the Best Fitness Values in Each Generation 92
Figure 5-10 Measured and Simulated Terminal Voltage 93
Figure 5-11 Measured and Simulated Terminal Voltage 94
Figure 6-1 Experimental and Simulated Terminal Voltage of Test 1 (SOH = 100)
102
Figure 6-2 Experimental and Simulated Terminal Voltage of Test 2 (SOH=9314)
103
Figure 6-3 Experimental and Simulated Terminal Voltage of Test 3 (SOH=7889)
104
Figure 6-4 Experimental and Simulated Terminal Voltage of Test 4 (SOH=7019)
104
Figure 6-5 Experimental and Simulated Terminal Voltage of Test 5 (SOH=6354)
105
Figure 6-6 Experimental and Simulated Terminal Voltage of Test 6 (SOH=5306)
106
Figure 6-7 Change of Internal Resistance in Different State of Health (Battery 1)
107
Figure 6-8 Change of Internal Resistance in all 6 Batteries 108
1
Chapter 1
Background and Objectives of
the Project
11 Overview
Fossil fuels have been the main energy resource in recent human history although
their continuing use has been shown to have a detrimental effect on the
environment The principal problem for fossil fuels is that they cannot be
reproduced within a short period of time so it is a finite energy supply source If
current consumption rate continues they will be exhausted in a few generations
from now Fossil fuel has never been considered as a clean-resource because there
is an emission of noxious gasses including CO CO2 NOx SOx and HC into the
atmosphere With all the pressure from the problems associated with the fossil
fuel exploration of the usage of renewable energy is becoming an increasingly
important issue
Wind energy hydro energy and solar energy are three of the most important
renewable energy sources and they have been implemented on a large scale wind
energy has produced a annual global total of 65019 times 1012 Wmiddoth
(74223 MWtimes24htimes365 days) (Anon 2006) energy in the year 2006 and hydro
2
energy is about 304 times 1015 Wmiddoth (30404 times 1012 Wmiddoth) (Anon 2007) Solar energy
resources are estimated at about 10694times1015 Wmiddoth (3850times1021 J) (Smil 2007) To
compare with the worldwide energy consumption of 13097times1015 Wmiddoth in the year
2007 it is clear that renewable energies have a significant role to play (Anon
2007)
However the problem of the implementation of the renewable energy is that the
electricity generated is intermittent and the power systems are experiencing the
problem of rapidly changing power demand Therefore the management of the
energy is an important issue Devices of energy storage should solve these
problems in theory
12 Review of Energy Storage Systems
Not only giving a large scale energy solution energy storage devices are also
commonly used in a range of applications related to everybody Different energy
storage technologies are suited to different applications and consideration must be
made in order to select the correct solution for each application This section will
give an overview of the existing energy storage systems
121 Applications of the Energy Storage Systems
Large scale energy storage systems which are also called grid energy storage
refer to the methods used to large-scale store electricity within an electrical power
grid Off-peak energy is stored during times when production (from power plants)
3
exceeds consumption and the stores are utilized at times when consumption
exceeds production In this way electricity production need not be drastically
scaled up and down to meet momentary consumption ndash instead production is
maintained at a more constant level
Despite the applications in grid scale the energy storage systems are also popular
in a number of areas For example they are usually used to optimize the energy
generated from the engine in modern electrical hybrid vehicles One such
application is in a shunter locomotive A shunter is a small railroad locomotive
intended for assembling trains ready for a road locomotive to take over
disassembling a train that has been brought in and switching a train to another rail
at the rail terminals The duty cycle of a shunter is characterised by short duration
high power demands (accelerating a rake of vehicles) and the long periods of
idling while the train waits for other operations Comparing to traditional shunter
locomotive that use diesel engines only for the whole duty cycle hybrid shunter
locomotives with energy storage devices can have a 40-70 reduction in fuel use
(RailPower Hybrid Technologies nd) This saving is made by operating the prime
mover at its optimum
Another application of energy storage in the vehicle technologies is the
regenerative braking system which is used to save the braking energy of vehicle
The potential of this technology to save energy for a vehicle is depends on the
duty cycle (Lu Meegahawatte et al 2008) which is characterized by storing the
energy generated when the vehicle is decelerating and releasing when accelerating
4
Energy storage devices are also very popular in stationary applications also
known as the Uninterruptible Power Supply (UPS) systems This system is
designed to meet the power demand when problems like power failure happen and
it is important especially in the applications where power failures could have
serious consequences for example in hospitals and computer centres (Berndt
2009)
The energy storage devices in the UPS system are often used to achieve
ldquouninterruptiblerdquo in a short period before the secondary power supply started
When a power problem occurs the energy storage device starts to supply
electricity immediately and at the same time the generator begins to start When
the generator is ready to supply sufficient power the energy storage device stops
providing power When the grid power is recovered the energy storage device can
be recharged until full
122 Review of the Existing Energy Storage Devices
There are various kinds of energy storage systems including pumped hydro
compressed air flywheel supercapacitors electrochemical and also
superconducting magnetic Each technology is suited to different applications and
careful consideration must be made in order to select the correct solution for each
application
Pumped hydro is the oldest and the most effective kind of large scale energy
storage method which have been used for nearly a century since 1929 (Juvonen
5
2003) Two large reservoirs at different altitudes with a pump a turbine a motor
and a generator are employed to collect the off-peak energy The water is released
from the higher one through a turbine to generate electricity during peak load
period
Compressed air is a pneumatic energy storage method that refers to the air kept
under a certain pressure This system can be used in grid energy storage that the
air can be stored by compressors during periods with low power demand This
compressed air can be released to a generator to meet the high power demand
during peak time (Glendenning 1981 Ter-Gazarian 1994 Juvonen 2003) In some
applications the compressed air is released through a combustor mixed with
natural gas to obtain a higher overall efficiency
A capacitor is an electrical device that can store energy in an electric field
between a pair of conductors and is often used in circuits for short term energy
storage It blocks the circuit to hold DC voltage Supercapacitors are energy
storage devices with the same principle but with a higher energy density The
power density of the supercapacitor systems can be very high but the energy is
often released in a very short duration (Ter-Gazarian 1994) As a result the
supercapacitors are usually used in applications of an energy burst
Superconducting magnetic energy storage system stores energy in the magnetic
field generated by direct current in a coil Instead of traditional wires like copper
superconductors are employed to avoid the energy consumptions as heat because
of the resistance A problem is that the optimal operating temperature for
6
superconductors is 50-77K a refrigerator is therefore necessary in the system for
cooling down
Flywheels are considered as a method of storing mechanical kinetic energy by
accelerating a flywheel to a very high speed to store the energy and decelerating
to release the energy Flywheels are very efficient for short duration storage cycles
due to their fast response speed These energy storage devices are used mainly in
applications that demand kinetic energy storage and high numbers of deep
discharge cycles
Electrochemical energy storage stands for the device capable of converting
chemical and electrical energy to each other by chemical reactions Batteries are
the most common technology of electrochemical energy storage methods The
oxidation and reduction reactions in the two electrodes of battery lead to the
current through the external circuit when discharging to provide energy The
secondary battery can be recharged by applying electrical current which reverses
the chemical reactions that occur during the discharge
Fuel cell is another technology with very high energy density that converts the
chemical energy in a source fuel into an electrical current The fuel cells are
considered as the ldquoenvironmental friendlyrdquo as the only by-product is water The
working principle of fuel cells when discharging is the same as the batteries but
unlike the batteries the fuel cells do not need recharge as they only provide
electrical energy while the active chemicals are supplied to the electrodes (Mantell
1984 MPowerSolutionsLtd nd)
7
Figure 1-shows the Ragone chart of the energy and power density of some energy
storage systems
Figure 1-1 Power density vs energy density plot (MPowerSolutionsLtd nd)
123 Review of Batteries
The preceding discussion has identified that energy storage devices are becoming
increasingly important in both stationary and mobile applications Battery as the
most popular energy storage device is studied in this section
There are two different types of batteries applied in a large range of areas now
Primary batteries and Rechargeable batteries Primary batteries which are also
called disposable batteries often have higher energy densities than the
rechargeable ones and they have a lower self-discharge (Ter-Gazarian 1994)
8
However as the chemical reactions in these batteries are not reversible and the
active materials cannot be restored to their initial forms these batteries cannot be
reliably recharged The primary batteries are intended to be used once and then
discarded therefore they are not suitable for the energy storage systems
Rechargeable battery is the other type of the electrochemical batteries which is
also known as secondary battery because their electrochemical reactions are
electrically reversible There are many different rechargeable battery technologies
in which only four of them are leading the world market nickel-cadmium nickel-
hydride lead-acid and lithium-ion (Berndt 1993 Berndt 2009)
The Nickel-cadmium (NiCd) battery is a kind of rechargeable battery that uses
nickel oxide hydroxide and metallic cadmium as electrodes and an alkaline
electrolyte (often potassium hydroxide) (Mantell 1984) As designed to compete
the primary batteries the NiCd batteries are often manufactured in the same size
and they are used in the consumer market as primary batteries for example in
clocks toys radios and cordless tools However when the NiCds are substituted
for primary cells the lower terminal voltage and smaller ampere-hour capacity
may reduce performance as compared to primary cells The most attractive feature
of the nickel-cadmium batteries is that they are more difficult to damage
comparing with other batteries during deep discharge cycles They can also
sustain more cycles and the lower internal resistance can also help achieve a
higher maximum discharge rate A problem preventing the large scale application
of this battery technology is that the nickel-cadmium batteries suffers faster self
discharge rate than other rechargeable batteries and the cadmium used as the
9
active material in one of the electrodes is toxic and expensive (Zhang Liu et al
2010) Furthermore the capacity loss caused by the continuously discharge and
recharge to the same state of charge called ldquomemory effectrdquo is also a very
important issue of the nickel-cadmium batteries (Sato Takeuchi et al 2001)
The nickel-metal hydride (NiMH) battery is a type of secondary electrochemical
battery that designed to substitute for the nickel-cadmium cells They have a
similar size and a similar cell voltage but with more advantages By using
hydrogen-absorbing alloy as negative electrode instead of cadmium this
electrochemical technology is considered as ldquoenvironmental friendlyrdquo because of
the absence of toxic cadmium (Berndt 1993) The nickel-metal hydride batteries
also have low internal resistance and the high cycle durability as the NiCds and a
NiMH battery can have two to three times the capacity of an equivalent size
nickel-cadmium battery However the nickel-metal hydride batteries also have a
similar high self-discharge rate as the nickel-cadmium batteries (Lee Lee et al
1996) and it also cannot afford complete discharges Memory effect from
repeated partial discharge can occur in a NiMH battery but this is reversible
through charge cycling (Berndt 2009)
The lead-acid batteries are the oldest type of rechargeable battery with a history of
over 150 years but they are still the most popular battery chemistry for
applications such as engine starting or backup power systems as there is no
cheaper alternative when weight is not a factor This technology uses lead and
lead dioxide as electrodes and an acid electrolyte of sulphuric acid and the
advantage of this configuration is that the electrolyte takes part in reactions of
10
both electrodes and both electrodes turn into lead sulphate when discharging
(Berndt 1993 Berndt 2009) The lead-acid batteries can be designed for not only
deep discharge cycles but high discharge rate or compromise of the two cycles
They have a lower self-discharge rate compared with the nickel batteries and they
also do not suffer from the memory effect (Mantell 1984 Berndt 2009) However
as the energy density of lead-acid battery is not high it is seldom applied in the
portable electronics Another important problem is that the lead-acid batteries
must be recycled as the active material ldquoleadrdquo is toxic to both the environment and
the human bodies (Bernardes Espinosa et al 2004)
The lithium-ion (Li-ion) batteries are almost the perfect cell chemistry and are
currently used a wide range of consumer electronics products including cameras
cell phones laptops etc They have many attractive performance advantages
which make them also ideal for higher power applications such as automotive and
standby power First of all the lithium-ion batteries have the highest energy
density in all the rechargeable battery now which is about 4 times better than
lead-acid (Jacobi 2009) They are also capable for deep discharge and high
discharge rate with a relatively slow self discharge There is no liquid electrolyte
in the lithium-ion batteries which means they are immune from leaking However
just opposite to the lead-acid batteries the most serious problem that discourages
the lithium-ion batteries is the low economic efficiency comparing with the lead-
acid batteries Other factors like the stability of the chemicals and the recycling of
lithium should also be concerned because of the chemical activeness of lithium
Table 1-1 is gives some basic properties of the four major rechargeable batteries
11
introduced above There are also some less common battery chemistries used by
rechargeable batteries in addition to these technologies including nickel-zinc
(NiZn) nickel-iron (NiFe) etc but they have a small market share For the four
major battery chemistries lead-acid batteries with their low price and high
flexibility is adopted in a wide range of application areas
Table 1-1 properties of the rechargeable batteries (Wikipedia nd)
Type Voltage
(V)
Energy Density (Whkg)
Power Density (Wkg)
Self Discharge
rate
Cycle Durability
Nickel-Cadmium
12 40-60 150 20 1500
Nickel-Metal-Hydride
12 30-80 250-1000
20 1000
Lead-Acid 21 30-40 180 3-4 500-800
Lithium-ion 36 160 1800 5-10 1000-1200
124 The Management of Batteries
In the areas that batteries are employed as the energy storage device it is a critical
issue to consider that whether there is enough energy in the battery to meet the
demand However batteries do have the problem in limited cycle durability that
is when a battery is charged and discharged for a number of cycles its total
capacity decreases If the battery cannot offer sufficient powerenergy it should be
replaced at the right time But the problem is that it is difficult to quantify the
capacity loss and when the capacity of battery is no longer sufficient for a
particular application Due to the limitation of batteries it is essential to develop a
method to determine the capacity of battery that subjected to various duty cycles
in a number of applications
12
13 Project Objectives
The main objective of the project is to develop a method which can determine the
key parameters of batteries from the discharge tests The proposed methodology is
a model based approach that is to develop a mathematical model of the battery
which can represent the dynamic performance and battery status and
characteristics can be investigated through the analysis of the model
The first step of the project is to build a mathematical model of battery The
dynamic model is expected to reflect the relevant behaviours of battery when
being discharged including the characteristics of State of Charge Depth of Charge
Electromotive force Terminal Voltage The unknown parameters in the model are
identified by using Genetic Algorithms (GAs) with the laboratory experimental
data Afterwards some batteries are tested in experiments and the parameters in
different state of health are recorded to analyze the battery in different status of
battery
The focus of this work is to develop a suitable method for parameter identification
for common battery systems The lead-acid battery has been chosen because it has
relatively well defined properties and there is a wealth of literature describing the
performance of these types of batteries From an experimental view point they are
also readily available of low cost
13
14 Outline of the thesis
The thesis is organized into seven chapters and the first chapter presents the
background and motivation of the research project The remaining chapters are
briefly described as follows
Chapter 2 gives an overview of lead-acid batteries including the development
working principle and also some modern battery designs and technologies In the
second part of chapter 2 important concepts for a battery including electromotive
force capacity state of charge internal resistance and state of health are
introduced and some mathematical descriptions of these concepts are discussed
Chapter 3 starts from some requirements of the mathematical model designed for
this project and several different methods of battery model approaches are
discussed Afterwards some details of the dynamic mathematical model are
analyzed The initial battery model is described in the last part of this chapter that
summarized the equations of the battery
Chapter 4 is mainly focused on some improvement of the mathematical model
described in chapter 3 In the first section of chapter 4 the experimental test rig in
the project is introduced Some findings in the experimental tests is then listed and
studied and integrated into the improved model Finally the SIMULINK
implementation and a simulation study are given
Chapter 5 presents a method of model parameter identification The principle of
14
Genetic Algorithms is studied at first Then this algorithm is employed in the
model and the parameters of the model are identified with the help of
experimental tests This chapter also includes the validation of battery model
using two other groups of test results
Chapter 6 develops an algorithm that can reflect the state of health of a lead-acid
battery In this chapter the internal resistance parameters are measured under
different state of health through a group of continuous experimental tests The
change of internal resistance under a specific working condition is then related to
the battery state of health
Finally Chapter 7 gives a summary and the conclusions of the project Also the
future works that can be improved are proposed in this chapter
15
Chapter 2
Introduction of Lead-acid
Batteries
This chapter gives an overview of lead-acid batteries including background
knowledge working principles explanation of terminologies technologies and
applications encountered for this technology The chapter presents the
fundamental knowledge and prepares for the project work to be reported in the
following chapters
21 A General Overview of the
Lead-acid Battery
The lead-acid battery is the oldest type of rechargeable battery The first example
of a lead-acid battery can be attributed to the German physicist Sinsteden who
published the performance data of this battery system in 1854 (Berndt 1993)
Later in 1859 the French physicist Planteacute realized that a plate construction was
required to achieve a much larger effective surface area and he produced the first
rechargeable battery which was marketed for commercial use by alternately
charging and discharging lead sheets immersed in sulphuric acid This method
has remained unchanged and still in use today in stationary applications (Berndt
16
1993 Wikipedia nd) One of the first applications of lead-acid batteries was for
storing electrical energy for telegraphy systems The capacity required for these
applications was low and the battery at that time was not yet suited to high power
industrial applications (TNI_Ltd 2007)
In 1880 a French chemical engineer Faureacute significantly improved the design of
the lead-acid battery by producing the active materials separately His method was
to coat the lead plate with a paste of lead oxides sulphuric acid and water in a
warm humid atmosphere The paste then changed into a mixture of lead sulphates
which adhered to the lead plate as an electrochemically active material As a result
of this technology the Faureacute cells are able to achieve much higher capacity with
the first charge in comparison with the Planteacute ones (Berndt 1993 TNI_Ltd 2007)
The problem of these plates is that they are not very durable and become weak
only after a few dischargecharge cycles The lead grid alloyed with antimony or
calcium was developed to improve the mechanical characteristics The holes on
the grid are able to achieve improved bonding thus the batteries may have a longer
lifetime This advantage led to the industrial manufacturing of lead-acid batteries
In 1881 a lead electrode with a ribbed surface was designed in order to have a
large effective surface of the active material and this was the pioneer of the large
surface plates which are still common today (Berndt 1993 TNI_Ltd 2007
Wikipedia nd)
In the beginning lead-acid batteries were operated in open jars The advantage of
this feature was that the electrode can be cleaned and exchanged easily but faced
the problem of water evaporation Therefore the early batteries have to refill water
17
in order to continue normal use However this problem can be dramatically
reduced when the cells were fitted with covers to limit the evaporation (Berndt
1993) This kind of battery design is known as a lsquoflooded lead-acid batteryrsquo
In the 1950s a new type of battery which was aimed to become spill-proof was
designed and manufactured on a large scale This type of battery is characterized
by an immobilized electrolyte however this kind of spill-proof battery was only
manufactured in small sizes up to about 10 Ah (Berndt 2001) Later the
combination of a valve improved the characteristic features of the lead-acid
battery and this kind of battery is still common today and is known as the Gel
Lead-acid battery (Berndt 1993) In the 1970s micron diameter glass fibres
originally designed for air filters were used in glass mats which absorbed the
electrolyte and acted as separator Soon this kind of Absorbent Glass Mat (AGM)
battery appeared in market for stationary application
Currently Valve Regulated Lead Acid (VRLA) batteries based on both AGM and
Gel electrolytes are available in a large range of capacities for both stationary and
mobile power applications with a range of different designs for each type of
application Arguably the most important application of lead-acid batteries is for
vehicle engine starting The battery employed in this application which is called
Starting Lighting and Ignition (SLI) batteries are designed to deliver bursts of
energy usually in a discharge current as large as several hundred amperes in a
very short time A different type of battery construction can produce batteries
capable of deep cycling which are more suited to slow discharge cycles (Tuck
1991 Anon 2007)
18
22 Configuration of Lead-acid Batteries
This section gives a brief description of the working principles of lead-acid
batteries and how the battery can be configured to suit different applications
221 Electrochemical Principles
The lead-acid battery comprises two electrodes and the electrolyte The structure
of the lead-acid battery is shown in Figure 2-1 in which one electrode is Cathode
and the other is Anode The active matter in the positive plate is made of lead
dioxide (PbO2) and that in the negative plate is made of lead (Pb) and the
electrolyte is sulphuric acid One electrode can serve either as a Cathode or as an
Anode depending on which process the battery is experiencing - charging or
discharging With this structure a battery could convert electrical energy into
chemical energy and back again which is associated with the process of charging
and discharging
(a) (b)
Figure 2-1 Working Principle of Lead-Acid Batteries (a) shows the battery when
19
discharging and (b) is when charging with a DC charger
For the discharging process as shown in Figure 2-1 (a) the negative plate acts as
the anode and the positive plate is the cathode If a wire is connected between the
two the excess electrons from the anode will travel through the wire as a current
to the cathode where they are needed to complete the electron deficient reaction
there The chemical reactions in a lead-acid battery when discharging are
described as follow
Negative plate reaction (Anode)
+minusminus+rarrminus+ HPbSO2eHSOPb 44
Positive Plate reaction (Cathode)
O2HPbSO2e3HHSOPbO 2442 +rarr+++minus+minus
For the charging process an external power source is connected to the two
electrodes with the voltage as shown in Figure 2-1(b) In this way the flow of
electrons is forced backwards against the electropotential and the reactions are
driven backwards changing the lead sulphate back into lead and lead dioxide on
the negative and the positive plates and restoring the sulphuric acid to the liquid
electrolyte The anode when a battery is charging is the positive plate and the
cathode is the negative plate and the chemical reactions in a lead-acid battery
when charging are described as
Positive plate reaction (Anode)
+minusminus++rarrminus+ 3HHSOPbO2eO2HPbSO 4224
Negative plate reaction (Cathode)
minusminus++rarr++ 44 HSOPb2eHPbSO
20
The thermodynamic heat effects caused by the reactions are small in the lead-acid
battery because the difference between the enthalpy and the free enthalpy is very
small The rate of reversible heat effect in the reaction is 132 kJ per mol of the
cell reaction which corresponds to about 35 of the total energy converted when
the lead-acid battery is discharging or charged This amount of energy is relatively
small and is generated over a comparatively long period of time so it is usually
easily dissipated through radiation and convection (Berndt 1993)
222 Lead-Acid Battery Types and Technologies
The flooded battery is the simplest type of lead-acid battery in use Flooded
batteries are common for some traction applications despite the requirement in
high maintenance They are also very common for large capacity backup power
supplies for telecommunication computer centres grid energy storage and off-
grid household electric power systems Since the flooded batteries are not sealed
they must be kept upright to avoid acid spills and water must be periodically
added to top up the liquid electrolyte The most attractive feature of the flooded
battery is that they are able to withstand certain level of overcharging without
damage providing proper maintenance is carried out
The Valve Regulated Lead-Acid (VRLA) battery which is often colloquially
called the sealed lead-acid battery is becoming more and more popular in many
applications Because VRLA batteries are mostly sealed the electrolyte
evaporation will be reduced and spillage can be largely avoided when
overcharging which are very common in flooded batteries The electrolyte of the
21
VRLA battery is designed to be immobilized so the VRLA batteries will not leak
if inverted pierced or if the container is broken They can be mounted in any
orientation and position even immersed in water The immobilization of the
VRLA electrolyte can be achieved by using an absorbent mat separator as well as
gelling materials
In Absorbent Glass Mat (AGM) battery the electrolyte is absorbed into a mat of
fine glass fibres in order to immobilize the electrolyte In addition the pores in the
mats are fine enough to prevent the lead dendrites in the cathode from growing
through as a separator and only glass is wetted enough by sulphuric acid can soak
the separators The glass mats can therefore be used to insulate the electrodes
Gelling is another way to immobilize the electrolyte and this gelling technology at
present is only applied for lead-acid batteries The idea is to mix the sulphuric acid
with silica fume (SO2) which makes the electrolyte gel-like The mixture is stable
over a long term environmental safe and easy to work technically (Berndt 1993)
The sulphuric acid bound by the gel can also insulate electrodes as a separator
similarly with that in an AGM battery
VRLA batteries including both gel and AGM batteries are able to recombine and
reduce the emission of gases during overcharge so the requirement for the room
ventilation is reduced and there is no acid fume emission during normal discharge
(Berndt 1993 Anon 2007 Wikipedia nd) Although the generation of hydrogen
can be slowed down it cannot be avoided completely As a result a valve
regulation safety system is employed in VRLA batteries which vents the gases in
22
the battery only during over pressure faults (Tuck 1991 Berndt 1993)
However the VRLA batteries do have some drawbacks First of all the VRLA
batteries tend to have a lower specific energy density than flooded batteries and
they are also more expensive An accurate charging control is very important for a
VRLA battery especially when charging under high temperature environments
since it is not possible to cure the damage caused by overcharge
223 Battery Designs for Different Applications
Lead-acid batteries are deployed in a range of applications Different designs are
therefore required due to the different working environments and duty cycles SLI
batteries are designed for a burst of energy for cold-cranking an engine A SLI
battery is supposed to provide power only in the first few seconds when starting
an engine and will be recharged immediately once the engine is started In this
kind of lead-acid batteries a larger surface area of the electrode plates is used to
provide high electric current in a short period However repeated deep discharge
may shorten the battery lifetime
On the other hand deep cycle batteries are designed for applications where the
batteries are regularly discharged The plates of the deep cycle batteries are often
very thick in order to withstand the frequent and deep discharge cycles The plate
surface area of a deep cycle battery is not as large as a SLI battery and as a result
it is not possible to offer great power
23
Marine batteries are a compromise between a SLI battery and a deep cycle battery
Standby batteries can be classified as marine batteries which are used for backup
power supplies and providing the power in emergency situations They are
designed for a long lifetime and a large capacity but repeated discharges and high
current drain are not the intended application Traction batteries are designed for
higher current drain and repeated deep discharge cycles They are usually bigger
and heavier than other types of lead acid for the same voltage and capacity but
that is the cost of durability
23 Mathematical Descriptions of Lead-acid
Batteries
In order to investigate the relationship between the battery behaviour and
remaining lifetime for a lead-acid battery initial studies have been carried out and
are described in this chapter Concepts including Capacity State of Charge (SOC)
Depth of Charge (DOC) State of Health (SOH) and internal resistance are
introduced and quantitative descriptions of these concepts are listed
231 Capacity
The capacity of a lead-acid battery represents how much charged energy the
battery can offer which is usually described in Ampere-hours (Ah) The charge
capacity of a battery is decided by the construction factors of a battery cell This
includes the materials contained in the electrodes and the acid solution In
addition the capacity of a battery is not a fixed quantity but varies according to
24
how quickly it is discharged This is known as Peukertrsquos law (Ceraolo 2000
Dhameja 2001 Rand Moseley et al 2004)
tICk
p = (21)
where pC is the capacity on one-ampere discharge rate which is a constant
I is the discharge current (A)
t is the time of discharge (h)
k is the Peukert constant and for a lead-acid battery with the value
between 11 and 13 (varies for each individual battery)
It is common to refer to ldquoCnrdquo as the capacity of battery in Amp-Hours which
corresponds to complete discharge of the battery in n hours ldquonrdquo is a subscript that
represents the discharge rate In industry the capacity under ten-hour discharge
rate (C10) is always taken as the nominal capacity
232 Electromotive force
The electromotive force of a battery cell is the difference between the electric
potential of the two electrodes of each cell (Rand Moseley et al 2004) The
potential of each electrode which is called half cell potential is decided by the
chemical reaction and the relative activities of the solution and can be obtained
from Nernstrsquos equation (Crompton 2000)
25
Ox
Redln0
α
α
zF
RTEE minus= (22)
where E is the half-cell potential (V)
0E is the standard half-cell potential (V)
α is the relative activity of the oxidizer (α Ox) and reducer (α Red)
z is the number of electrons transferred in the cell reaction
R is the universal gas constant which is 8314472 JKminus1molminus1
T is the absolute temperature
F is the Faraday constant the number of coulombs per mole of electrons
and F = 964853399times104 Cmolminus1
At room temperature RTF is a constant of 25693mV for cells therefore
Ox
Redlog
z
V05910
Ox
Redln
z
mV69325
Ox
Redln 10
α
α
α
α
α
α==
nF
RT
The Nernstrsquos Equation therefore can be expressed by
Ox
Redlog
V0591010
0
α
α
zEE minus= (23)
The electromotive force could be calculated by the difference of the electric
potential
cathodeanode EEEMF minus= (24)
When a lead-battery is discharging the electromotive force can be written as
26
O)(H
)(SO)(Hlog
V05910
2
2
24
10
00
α
ααminus+
+minus=z
EEEMF cathodeanode (25)
The standard half-cell potential of the anode 0
anodeE is equal to 1685 (PbO2-
PbSO4SO42-) and that of cathode
0
cathodeE is -0356 (Pb-PbSO4SO42-) which are
constants for the same battery chemistry And the number of electrons transferred
( n ) is 2 for a lead-acid battery
Therefore the electromotive force of a lead-acid cell can be obtained by
O)(H
)(SO)(HlogV029600412
O)(H
)(SO)(HlogV02960)3560(6851
2
2
24
10
2
2
24
10
α
αα
α
αα
minus+
minus+
+=
+minusminus=EMF
(26)
This electromotive force of a battery cell is numerically equal to the open circuit
voltage which means that the terminal voltage of a single cell battery when it is
disconnected from the external load For a lead-acid cell the electrochemical
force at fully charged is between 210-213V per cell
233 State of Charge and Depth of Charge
State of charge (SOC) and depth of charge (DOC) are variables that can describe
the battery charge The main difference is that the SOC describes the percentage
of remaining charge relative to the nominal capacity while the DOC represents
that relative to the actual capacity under a specific discharge current These two
27
variables can be obtained by calculating the charge consumed and the battery
capacity
101 CQSOC eminus= (27)
Ie CQDOC 1minus= (28)
where Qe is the charge consumed by the load (Ah)
C is the nominal capacity (Ah)
CI is the actual capacity under the discharge current I (Ah)
234 Internal Resistance and State of Health
The internal resistance of a lead acid cell is the physical resistance of the cell The
value of the internal resistance is decided by many different factors But it could
be obtained by a simple equation
I
VVr tOC minus
= (29)
where Voc is the open circuit voltage (V)
Vt is the terminal voltage when discharging (V)
I is the discharge current (A)
However the factors in this equation are only a method of calculating the internal
resistance but not the determinants It is shown in applications that the internal
resistance of a lead-acid battery will increase when discharging as the SOC and
28
the DOC drops
It is common for batteries to suffer a capacity loss when discharged and charged
in a number of duty cycles even when idle Aged batteries are often weak and
sometimes not able to offer enough charges Therefore they should be replaced or
maintained State of health is a defined variable that is important for a weak
battery This variable is to show how weak the battery is and represents the
percentage of remaining capacity to the initial capacity when the battery is brand
new (Okoshi Yamada et al 2006) as shown in the equation
new
weak
C
CSOH = (210)
where Cweak is the remaining capacity of a weak battery (Ah)
Cnew is the capacity when the battery is brand new (Ah)
The reason for the capacity loss is complex but is usually due to the sulphation
Sulphation is a process when the amorphous lead sulphate which is easily
converted back to lead lead oxide and sulphuric acid converts to a stable
crystalline form coating the electrodes This form of lead sulphate cannot conduct
electricity and cannot be converted back to lead lead dioxide and lead sulphate
under normal charging conditions The internal resistance of a lead-acid battery
therefore increases and less charge can be provided when discharging Complete
or repeated deep discharges of a battery at low current densities that lead
excessive utilization of the active material are the most critical reason for
29
capacity loss for example a discharge of a traction battery that draws more than
80 of its nominal capacity (Berndt 1993)
235 Multi-Cell Lead-Acid Batteries
In most applications of batteries the voltage of an individual cell is not enough to
provide the sufficient voltage and power supply The solution is usually to series
connect a number of cells in a battery in order to achieve a higher battery voltage
The electromotive force of a series of lead-acid battery cells is directly related to
the cell numbers as well as the charge state of each cell For a six-cell lead-acid
battery which is a standard for most common usages the fully charged
electromotive force is about 128V The internal resistance of a multi cell battery
however is also equal to the sum of the internal resistances of each cell
Usually all the cells in a multi-cell battery should be constructed in the same
manner and in particular the capacity should be consistent because the capacity of
a multi-cell battery will be limited to the cell with the lowest capacity If one of
the cells fails it is not possible for the current to flow through the cell and the
battery is therefore disconnected from its internal cell loss Also if the SOC of one
particular cell drops faster than others in a battery the electromotive force of that
cell may affect the whole behaviour of the battery
24 Summary
The technology development of lead-acid batteries has been continuous over the
30
last 150 years From the earliest open cell batteries different advanced battery
configurations are now available which have been adopted in a wide range of
applications Meanwhile a number of solutions have been developed to address
the battery problems encountered in applications such as electrolyte evaporation
spillage and the electrolysis of electrolyte when charging However there are still
issues affecting the efficient and safe use of lead-acid batteries for example
determination of the SOH which if addressed in a robust manner would lead to
significant improved battery management system performance This chapter has
presented the essential fundamental knowledge technology terms and working
principles of lead-acid batteries which is served as a preparation for further study
reported in the following chapters of the thesis
In order to reveal the dynamic behaviour of a battery under different SOH and
identify the suitable strategy for SOH determination the mathematical modelling
study is carried out and an equivalent circuit model is derived in the next chapter
The key concepts of the battery model are explained and the fundamental analysis
is given for the concepts introduced
31
Chapter 3
Equivalent Circuit Modelling
of Lead-acid Batteries
In order to estimate the status of a battery a model based approach is adopted in
the project A mathematical model for lead-acid batteries should be developed
with a suitable level of abstraction This chapter describes the requirements to the
model to serve the project objectives and reviews the available model
technologies An improved mathematical model for lead-acid batteries is
introduced in the late part of this chapter
31 Requirements for the Battery Model
The main objective of the project is to develop an algorithm that can determine
the battery health by monitoring the battery status during discharge cycles This
algorithm is designed for implementation in a battery health monitoring system
with life-time prediction capabilities This prediction system is intended to work
on applications where the battery performance is of great importance for instance
hospital UPS systems and vehicle ignition systems To achieve the objective the
requirements to the mathematical model can be defined as
Requirement 1 The model should be able to calculate the evolution of key
battery parameters including terminal voltage cell temperature the state of health
32
and the internal resistance which describe the condition of the battery for
dynamical discharging It should also be able to adequately represent dynamic
processes while the battery is discharging
Requirement 2 The complexity of the model must be sufficient to satisfy the
requirement 1 but must also be executable in real-time for a model-based
condition monitoring system
Requirement 3 The output of the battery model should be understandable to the
battery operators and technicians as well as meaningful to those who do not have
any background in battery technologies
32 Overview of Battery Model Techniques
A number of different types of battery models have been used to serve as a tool in
solving a range of problems (GONG 2005) These include Electrochemical
Models Computational Fluid Dynamics Models Finite Element Models and
Equivalent Circuit Models This section gives an overview to the above named
four different types of battery models and the problems which are addressed by
each of them In Section 324 every battery model technology is assessed against
the overall requirements
321 Electrochemical Model
Electrochemistry is a branch of chemistry that studies chemical reactions which
33
take place in a solution at the interface of an electron conductor (a metal or a
semiconductor) and an ionic conductor (the electrolyte) The reactions involve
electrons transfering between the electrode and the electrolyte or species in
solution The application of electrochemistry research directly leads to the
development of the lead-acid batteries
Behaviour of a battery depends not only on how the battery is used but also on a
number of construction factors (Ruetschi 2004) These factors include but are not
limited to the thickness of the plates the active mass density of the active
material the concentration of the acid solution and the geometry of the electrodes
(Berndt 2001 Ruetschi 2004)
The electrochemical model is mainly focused on the oxidationreduction reactions
between the electrolytes and the electrodes By analyzing the consistency of each
matter in the solution and the electrochemical reaction caused by the connection
of electrodes to external circuit it is possible to represent the dynamic behaviour
of the battery (Crompton 2000)
322 Physical Models
The finite element method is a numerical analysis technique for finding
approximate solutions of partial differential equations as well as of integral
equations The basic principle of the Finite Element Model (FEM) is to divide the
problem into elements and each element is a smaller problem to be solved so that
they could be analyzed separately The lsquoelementsrsquo are then be assembled together
34
to restore the initial problem
Finite element is a very popular method of analysis in those areas with a complex
geometry and it is good at stress and thermal analysis For batteries the Finite
Element Models can help with a good understanding of the heat loss and that for
vibration problem in mobile applications There are also attempts to analyze the
current density on the positive grid bar in a lead-acid battery using FEM (Ball
Evans et al 2002)
Computational Fluid Dynamics (CFD) technology is a well-established tool for
physical analysis and optimization of fluid flow mass and heat transfer and
related phenomena (eg chemical reactions) that may simultaneously take place in
a complex system (Liaw Gu et al 1997) Computers are used to perform millions
of calculations required to simulate the interactions of fluids and gases with the
complex surfaces used in engineering
In a CFD Model of a battery the dynamic governing equations are solved with
respect to time space and all the physical time and space dependent properties
Acid concentration and potential distribution across the cell for instance can be
obtained Therefore such a modelling is able to give a very good understanding to
battery parameters and detailed characteristic of battery dynamics
323 Equivalent Circuit Model
An equivalent circuit refers to the simplest form of a circuit that retains all of the
35
electrical characteristics of the original (and more complex) circuit In its most
common form an equivalent circuit is made up of linear passive elements
However more complex equivalent circuits are used to approximate nonlinear
behaviours of the original circuit as well
In electrical engineering it is often useful to use an equivalent circuit model to
describe the non-ideal operation of a device For electrical engineers electrical
models are intuitive useful and easy to handle especially when they can be used
in circuit simulators and alongside application circuits
324 Discussion of Different Battery Model Methods
The electrochemical model focuses on the electrochemical reactions and the
activities in the battery which is very popular in the applications for the
constructional and design purpose However many electrochemical factors
contained in the electrochemical model are irrelevant to the external circuit and
some of the important parameters like the internal resistance are hard to describe
in an electrochemical model Therefore this model technology is not able to meet
the project Requirement 1 As the calculations in the electrochemical model are
not complicated Requirement 2 can be therefore satisfied by an electrochemical
model of battery Requirement 3 might be difficult to obtain for an
electrochemical model because the understanding of the outputs for an
electrochemical model usually need some background knowledge of the battery
chemistry As a result the electrochemical model is not chosen for the project
36
Physical models can give good understanding to the battery important parameters
so that Requirement 1 of the project can be satisfied The Requirement 3 can be
also met as the terminal voltage can be calculated as the output with the
knowledge of these parameters One significant disadvantage is that the physical
models involves huge amount of calculation in analysis which is quite time
consuming In finite element or CFD methods a large nonlinear system of
equations is solved iteratively and that could take excessive CPU time especially
for when the system is more than 2 dimensions As a result the physical
modelling methods cannot meet the Requirement 2 of fast response required by
the project (Esfahanian Torabi et al 2008)
In an equivalent circuit model most of the characteristic required by the project
can be reached in a reasonable level It is able to reflect the dynamic behaviour of
battery using simple circuit blocks such as voltage sources resistors and
capacitors (Chen and Rincacuteon-Mora 2006) That is to say the Requirement 1 of
the project can be satisfied by the equivalent circuit model And the model
simplicity causes its low computational time as Requirement 2 and therefore it
can be suited to the online implementation (Esfahanian Torabi et al 2008)
Additionally basic battery parameters like internal resistance terminal voltage
and SOC etc can be chosen as the main output of the model to meet the
Requirement 3
Table 3-1 summarized a comparison of all the three model methods on the
satisfaction of the requirements for the project
37
Table 3-1 Satisfaction of the Requirements in different Model Methods
Requirement 1 Requirement 2 Requirement 3
Electrochemical Model times radic times
Physical Model radic times radic
Equivalent Circuit Model radic radic radic
33 Introduction of the Existing Equivalent
Circuit Models
Section 32 introduced three different types of battery models to serve for different
research purposes each with different features and strengths It has been shown
that the equivalent circuit model that pays attention to the relationship between the
internal circuit and the external characteristics can adequately meet all the
requirements of the project Therefore further studies of battery models have been
carried out and six equivalent circuit battery models with different merits and
complexity are presented while the technique improvements are briefly described
in this section
331 Simple Battery Model
The Simple Battery Model is the simplest battery model As shown in Figure 3-1
this model consists of only ideal battery mE as the electromotive force of a battery
and a resistor r in series connection as the internal resistance bV in the figure is
the terminal voltage of the battery
38
Figure 3-1 Simple Battery Model
The Em in Figure 3-1 stands for the electromotive force of the battery while r
represents the internal resistance and Vb is the Terminal Voltage This model is
only applicable in some circuits where the state of charge is of little importance
because it does not consider the varying characteristic of the internal resistance in
different states of charge The model is often used in circuits where the battery
does not have major influences to the circuit analysis But without being able to
describe the battery behaviours in details this model is not suitable for the
research purpose In the Simple Battery Model the electromotive force mE can be
obtained by open circuit measurement and r can be calculated by measurement
with connecting a load to the battery after taking an open circuit measurement
For a battery with a terminal voltage of 13V and the internal resistance of 05Ω
the change of terminal voltage in a Simple Battery Model as the discharge current
increases can be given as Figure 3-2
39
Terminal
Voltage
Discharge
Current
0
10V
13V
Figure 3-2 I-V chart of the Simple Battery Model
332 Advanced Simple Battery Model
This model is developed based on the Simple Battery Model and has the same
block diagram as the Simple Battery Model The only difference is that this model
employs a variable resistor which depends on the state of charge (CUN
FIORINA et al Durr Cruden et al 2006) The relationship between the value of
the variable resistance and the state of charge is as follow
aSOC
Rr 0
= (31)
where 0R is the resistance of the battery when it is fully charged
a is the capacity coefficient
SOC is the state of charge of battery from 0 (completely discharged) to 1
(fully charged)
6A
40
The most important improvement of this model is that instead of a constant
internal resistor the value of the internal resistance is expressed as equation
function of SOC For the same battery described in section 331 the I-V chart in
different SOCs can be concluded as shown in Figure 3-3
Terminal
Voltage
Discharge
Current
0
10V
13V
SOC=1
SOC=60
Figure 3-3 I-V Chart in different SOC
333 Thevenin Battery Model
The previous models do not account for any transient behaviour of batteries
Figure 3-4 shows the gradual change in battery characteristics when external loads
are connected or disconnected to the battery
6A
41
011
14
125
Terminal
Voltage
t
Figure 3-4 Sketch to show battery discharge behaviours in typical tests
Thevenin Battery Model is one commonly used model which consists of an ideal
battery electromotive force ( mE ) internal resistance (0R ) overvoltage resistance
(1R ) and capacitance (
1C ) and the equivalent circuit is shown in Figure 3-5
(Casacca and Salameh 1992 Salameh Casacca et al 1992 Chan and Sutanto
2000) 1C represents the actual capacitance of battery and
1R represents the
resistance contributed by the contact resistance of the plate and the electrolyte
(Durr Cruden et al 2006) The capacitance in the Thevenin Battery Model can
overcome the trend of terminal voltage shown in Figure 3-4
No load No load Load
42
Figure 3-5 Thevenin Battery Model
The main disadvantage of this Thevenin Battery Model is that all the parameter
values are assumed to be constant but in fact they are strongly dependent on the
state of charge and discharge rate and some other discharge characteristics
334 Dynamic Battery Model
This model is developed based on the Thevenin Battery Model Similar to the
improvements made by the Advanced Simple Model comparing with the Simple
Battery Model the most important difference is that it takes into account the non-
linear characteristic of the open circuit voltage and internal resistance represented
by SOCK (Jayne and Morgan 1986 Sims 1990)
ISOC
KRVV bocb )( +minus= (32)
where bV is the terminal voltage of battery
ocV is the open circuit voltage
bR is the battery terminal resistor typically 01Ω
43
K is the polarization constant
I is the discharge current
335 Fourth Order Dynamic Model
This is a more accurate and sophisticated model The current pI flows through
pR (electrolyte reaction) dR (Ohmic effect) and its associated leakage
capacitance dC and wR (waste of energy) and its associated leakage
capacitance wC Current sI flowing through the resistor sR represents the
behaviour of self discharge (Gillioli and Cerolo 1990 Chan and Sutanto 2000)
The main drawback of this model just as its name indicates is that there are
fourth order equations due to consideration of the paralleled R-C blocks in the
circuit and therefore it takes more time for the computation Another drawback is
that a number of empirical parameters are contained in the model
Figure 3-6 Fourth-order Battery Model
44
336 Improved Battery Model
The most popular Equivalent Circuit Model used by researchers is the Improved
Battery Model (Casacca and Salameh 1992 Salameh Casacca et al 1992) This
model is simple but meets most requirements for a good battery model It contains
most non-linear characteristics and is linked to the state of charge Most elements
included in this model are the functions of the state of charge or the open circuit
voltage which is also related to the state of charge The improved model is
studied in this chapter and implemented in MatlabSIMULINK environment
Figure 3-7 Improved Battery Model
34 Mathematical Model of the Lead-acid
Batteries
As the Improved Battery Model is able to reflect the major dynamic behaviours of
a battery and does not take much computation time it meets the requirements for
45
the project Therefore the mathematical model developed in this project is based
on the Improved Battery Model by involving the components of variable voltage
sources as the electromotive force ( EMF equal to the open circuit voltage OCV )
variable resistors as internal resistance and overvoltage resistance and a capacitor
as the capacitance of battery The description and the detailed analysis of the
model are given in this section
341 Capacity
Based on the Peukertrsquos law introduced in Chapter 2 the relationship of capacity
with different discharge currents is obtained below
2121
2211
)( ttII
tItIC
k
kk
p
=
== (33)
And following the definition of battery capacity the capacity is
12
1
2111
1
21121121121222 )()())(()( I
kkkk
I CIItIIItIIIIItIIItICminusminus
=====
12
1
21 )( I
k
I CIICminus
=there4 (34)
where Cp is the one ampere capacity
CI2 CI1 is the capacity under the discharge current I2 I1
k is a constant that related to the battery
The equation of calculating the capacity by the discharging current can be
46
obtained through experiments (Ceraolo 2000 Barsali and Ceraolo 2002) An
experimental result is given as
m
c
c
IIK
CKIC
))(1(1)( 0
0minus+
= (35)
where )(00 ICC = which stands for the capacity when discharging at the rated
discharge rate usually the nominal capacity C10
cK is empirical coefficient and is 118 for lead-acid batteries
m is empirical coefficient of 120
This equation overcomes the inadequacies of the Peukertrsquos law The capacity
calculated by the Peukertrsquos law in a low discharge current is much larger than that
experimentally obtained (Ceraolo 2000)
With the parameters of 20118124420 ==== kKAIAhC c the simulation
study indicated that the capacities of low discharge rate (lt30A) in different
equations are quite similar as shown in Figure 3-8
47
0 5 10 15 20 25 30 35 40 45 500
10
20
30
40
50
60
70
80
Discharge Current (A)
Actu
al C
apacity (
Ah)
Based on Peukerts law
Based on the Equation 35
Based on the Equation 35
Based on thePeukerts Law
Figure 3-8 Battery Capacity vs Discharge Current
Variations of the cell temperature also affect the battery capacity The effect of
temperature on the battery capacity is described by the following equation
(Ceraolo 2000 Barsali and Ceraolo 2002)
ε
θ
θθ
minus+=
f
ICIC 1)()( 0 (36)
where fθ is the electrolyte freezing temperature and is equal to -40˚C
θ is the cell temperature
)(0 IC is the capacity of battery under the discharge current I at 0˚C
ε is a constant that equals to 129
48
Therefore
m
c
f
c
IIK
CK
IC))(1(1
1
)(
0
minus+
+
=
ε
θ
θ
θ (37)
342 Electric Networks
Figure 3-9 (Ceraolo 2000 Barsali and Ceraolo 2002) shows an adaptation of
electric network based on the improved battery model shown in Figure 3-7 The
major change of this equivalent circuit is that the self-discharge is not taken into
account because the self discharge is usually less than 10 per month in modern
technologies which can be ignored in normal applications
Figure 3-9 Lead-acid Battery Equivalent Network
In the figure mE in this the main branch represents the electromotive force of the
battery and Vb stands for the terminal voltage The mZ in the figure stands for the
internal impedance that can be approximated by two R-C blocks
49
Battery is an energy storage device but not all the energy that the battery gets
from the charger can be stored when a battery is charged Part of this energy is
lost for different reasons like water electrolysis A parasitic branch is therefore
added to the model to represent the energy loss This part is claimed to work only
when the battery is being charged (Ceraolo 2000 Barsali and Ceraolo 2002) In
this project the current of the parasitic branch pI in the figure can be described as
an equation of the voltage of the parasitic branch PNV instead of a simple resistor
pR because of the nonlinear character of the parasitic branch This issue will be
discussed in later sections
As a result of these factors an equivalent electric network of in Figure 3-9 is
designed as shown in Figure 3-10 in which 1C 1R and 0R are the elements of the
internal impedance mZ It is used in the whole project as the electric network of
mathematical model
Figure 3-10 The Equivalent Network with the Approximated mZ
50
343 State of Charge and Depth of Discharge
In Chapter 2 Equations 27 and 28 show the definitions of SOC and DOC of a
battery In the model the nominal capacity can be treated as C(0θ) while the
actual capacity is C(Iavg θ) therefore
)0(1 θCQSOC eminus= (38)
)(1 θavge ICQDOC minus= (39)
where σσ dItQt
e int=0
)()( is the charge already drained from the battery
)0( θC is the nominal capacity of battery
)( θavgIC stands for the actual capacity under the specific discharge
current
344 Electromotive Force of the Battery
The electromotive force of a battery which is Em in Figure 3-10 is the difference
between the electric potential of the two electrodes and can be calculated by the
Nernstrsquos equation (Eq 26)
)(
)()(log029600412
2
2
24
10OH
SOHEMF
α
ααminus+
+=
This equation gives a description of the electromotive force by the activity of
different matter in the sulphuric acid which is described as lsquoαrsquo When the battery
51
is being charged or discharged the electrolyte concentration changes and the
activity value of H+ SO42- and H2O in the Nernstrsquos equation changes which can
be found by the study of battery that is the EMF of battery will change as the
result of the change of state of charge The relationship between SOC and the
activity α is unknown but it is obviously that when the state of charge increases
the quotient of )(
)()(
2
2
24
OH
SOH
α
ααminus+
also increases This shows that the EMF rises
when the state of charge is increasing
From the literatures (Ceraolo 2000 Barsali and Ceraolo 2002) the electromotive
force is described simply as the following equation
)1)(273(0 SOCKEE Emm minusminusminusminus++++minusminusminusminus==== θ (310)
where 0mE and EK are constants for a battery
θ is the temperature of the cell
SOC is the state of charge of the battery
345 Internal Resistance of a Battery
The resistances of a battery as shown in Figure 3-10 can be calculated by the
equations (Ceraolo 2000 Barsali and Ceraolo 2002)
)]1(1[ 0000 SOCARR minus+= (311)
)ln(101 DOCRR minus= (312)
52
)exp(1 22
)]1([
202
21
IIA
eRR
m
SOCA
+=
minus
(313)
where 0A 21A and 22A are constants for a battery while 00R 10R 20R are
parameters related to the SOH which will be discussed in later chapters For the
model 020 asympR and can be omitted when a battery is discharging
Therefore the internal resistance of a cell when discharging is
)ln()]1(1[ 1000010 DOCRSOCARRRr minusminus+=+= (314)
346 The Behaviour of Parasitic Branch
When the battery is being charged there are some losses as represented by the
parasitic current This current depends on the electrolyte temperature and the
voltage at the parasitic branch (Ceraolo 2000)
Because the behaviour of parasitic branch is non-linear Tafel gassing-current
relationship is used instead of a simple resistance pR (Ceraolo 2000)
minus+= )1(exp
0
0
f
p
P
PNPPNp A
V
VGVI
θ
θ (315)
where pI is the current of the parasitic branch
PNV is the voltage of the parasitic branch
53
0PG is a constant in seconds
0PV is a constant in volt
pA is a constant
θ is the electrolyte temperature
fθ is the electrolyte freezing temperature and is equal to -40˚C
When the battery is being discharged 0asymppI the parasitic branch could be
omitted from the model in simulation if the charging behaviour is not necessary
to discuss
347 Main Branch Capacitance
In the electric network of the model there is an R-C circuit as shown in Figure
3-11
Figure 3-11 R-C block
where Im is the discharge current
IC1 is the current flow through the capacity branch
54
I1 is the current of R1
VR1 is the voltage over the R-C block
This branch can be solved by
))(
()( 11111111
dt
tdVCIRIIRIRV R
mCmR minusminusminusminus====minusminusminusminus====sdotsdotsdotsdot==== (316)
)()()(
111
11 tIRtVdt
tdVCR mR
R====++++ (317)
This is the differential equation that represents the main branch behaviour
Laplace transform is employed to solve this problem
)()( 1111 sIRsVSCR mR sdotsdotsdotsdot====sdotsdotsdotsdotsdotsdotsdotsdotsdotsdotsdotsdot (318)
1
)(
11
11
++++
sdotsdotsdotsdot====
SCR
sIRV m
R (319)
++++
====++++
========
SCR
C
SCR
R
I
VsG R
11
1
11
11
1
1
1)( (320)
where τ=11CR is the time constant that represents the double layer capacitance
When the current has a shape like a step and the initial voltage of the capacitor is
equal zero the solution in time becomes
m
t
R IeRtV )1()( 11τ
minus
minus= (321)
55
It is obviously that this equation is the typical form of the voltage with an R-C
circuit
348 Thermal Behaviour of a Battery
When the battery is charging or discharging there is a current flow through the
battery so that it produces heat due to the Joules law
0
2
1
2
12 RIRVIVVIP RPNps sdot++sdot+sdot= (322)
When discharging the parasitic branch and R2 are omitted the equation becomes
0
2
1
2
1 RIRVP Rs sdot+= (323)
The dynamic equation of cell temperature and the power is (Ceraolo 2000)
s
a PRdt
dC +
minus=
θ
θ
θθθ (324)
where θC is the thermal capacitance
θR is the thermal resistance between the battery and the environment
θ is the cell temperature and aθ is the environment temperature
56
35 Mathematical Model of the Lead-acid
Batteries
Considering the behaviour of capacity state of charge and depth of discharge
electromotive force and internal resistance an Improved Battery Model based on
the equivalent circuit shown in Figure 3-10 was introduced in previous sections
The battery model for the complete discharging progress can be derived as the
following equations
m
c
f
c
IIK
CK
IC))(1(1
)1(
)(
0
minus+
+
=
ε
θ
θ
θ (325)
σσ dItQt
e int=0
)()( (326)
)0(1 θCQSOC eminusminusminusminus==== (327)
)(1 θavge ICQDOC minusminusminusminus==== (328)
)1)(273(0 SOCKEE Emm minus+minus= θ (329)
)]1(1[ 0000 SOCARR minus+= (330)
)ln(101 DOCRR minus= (331)
1
1R
Cτ
= (332)
IeRtV
t
R sdotminussdot=minus
)1()( 11τ (333)
0
2
1
2
1 RIRVP Rs sdot+= (334)
57
sa P
Rdt
dC +
minus=
θ
θ
θθθ
(335)
)( θIC in the equations is the expression of capacity of battery when discharging
under the discharge current I and at a temperature of θ 0C stands for the
capacitance when discharging at the rated discharge current I while parameters
fθ and ε are constants in this model )(tQe represents the charge already
consumed while the equation of mE indicates the mathematical description of
electromotive force corresponding to the SOC and the cell temperature in which
0mE EK are constants for a battery 00R 10R are parameters related to the SOH
and the discharge current can also affect them τ in the equations are the time
constant of the R-C circuit which represents the time it takes the systems step
response to reach ( 6311 asympminus e ) of its asymptotic value The last two equations
represent the thermal dynamic of battery in which sP is the Joule heat generated
by the internal resistance θC is the thermal capacitance and θR is the thermal
resistance between the battery and the environment
36 Summary and Discussion
The Improved Battery Model based on the electric equivalent circuit is presented
in this chapter and it is proved that it can satisfy all the three requirements to serve
the project objectives This battery model consists of a variable voltage source
several R-C blocks and a parasitic branch as its electric network and the elements
are described as a variable related to the capacitance the charge consumption and
58
the cell temperature as well
However experimental tests show that the behaviour of the battery is much more
complicated can be represented by this equivalent circuit model For example the
internal resistance varies when discharging under different current and the time
constant of the R-C circuit at the beginning and end of discharge as well
Therefore the model has to be improved The next chapter overcomes these
problems found in the experimental tests and some improvements of the model
are described
59
Chapter 4
Experimental System Set up and
Improved Battery Model
Simulation Implementation
Experimental tests based on a 12V-13 Ah lead-acid battery are carried out and the
test system is introduced at the beginning of this chapter Some of the
characteristics of the battery can be found in the tests which has shown that the
battery model described previously is not accurate enough and improvements
have to be implemented into the model This chapter will focus on the analysis of
the battery characteristics and the description of the improvements implemented
In the last part of this chapter a finalised version of the battery model used in this
project is given and implemented in the MatlabSIMULINK environment for
simulation study
41 The Experimental System
In this experimental test system a variable resistor is used as the load of the
battery Three sensors are employed in the whole experiment process two current
sensors and one voltage sensor The equivalent circuit of the test rig designed for
the research purpose is shown in Figure 4-1
60
Figure 4-1 Equivalent Circuit of the Experimental Test Rig
In this figure the ideal voltage source EMF accompanying with the internal
resistance r acts as a lead-acid battery with 6 cells (12V) the terminals of the
battery are connected in parallel to a voltage sensor Switch Krsquo is employed to
control the voltage sensor connection so that the sensor can be disconnected from
the battery when the experiment is not being in progress to avoid an unnecessary
discharge The circuit break in Figure 4-1 can be used as a main controller which
decides whether the load is engaged to the battery to discharge or not Switch K
in the experiment is to vary the load of the system This experimental test system
is mainly designed for two different experimental tests of a battery in this study
constant-impedance load discharge and two-load discharge Figure 4-2 shows the
actual laboratory test rig used in the project
61
Figure 4-2 Experimental Test Rig
The data is collected and recorded every half second by a data acquisition card
PCI-6251 from National Instruments with the software environment of LabVIEW
and a 12V-13Ah lead-acid battery (marked in the red-dashed square in Figure 4-2)
is employed in the project as test batteries for the battery performance study
42 Improvements of the Battery Model
Figure 4-3 and Figure 4-4 show the typical data collected from the experimental
test rig Figure 4-3 is the result of a constant-impedance load discharge test with a
discharge current of 075A approximately and Figure 4-4 shows two-load
discharge with the discharge currents of 075A and 12A respectively
62
0 500 1000 1500 2000 2500 3000 3500 4000 4500 5000-02
0
02
04
06
08
1
12
Time (s)
Dis
charg
e C
urr
ent
(A)
0 500 1000 1500 2000 2500 3000 3500 4000 4500 5000105
11
115
12
125
13
Time (s)
Term
inal V
oltage (
V)
Figure 4-3 Test of constant-impedance load discharge top figure shows the discharge current of the experimental test and the bottom one shows the terminal
voltage 1τ is the time parameter of the R-C block at the beginning of the
discharge and 2τ is that when the discharge stopped
0 200 400 600 800 1000 1200 1400
0
05
1
15
Time (s)
Dis
charg
e C
urr
ent
(A)
0 200 400 600 800 1000 1200 1400118
12
122
124
126
128
Time (s)
Term
inal V
oltage (
V)
Figure 4-4 Test of two-load discharge top figure shows the discharge current of the experimental test and the bottom one shows the terminal voltage
I(t)RI1 and I(t)RI2 represent the voltage drop across the internal resistance value under different discharge current
1τ 2τ
I(t)RI1
I(t)RI2
I(t)RI1
63
421 The Change of τ in Different Charge Status
From analyzing these figures it is easy to find that it takes quite a long time for
the battery to have the steady terminal voltage when the discharge of battery stops
and it is longer than the time taken from the beginning of the discharge This
difference means that when the battery starts to discharge the time parameter
11CR=τ in the main branch equation (332) is not equal to that when the
discharge has just stopped In Figure 4-3 it is shown that when the discharge stops
the time parameterτ is longer than that when the discharge starts
As a result of this experimental feature a switch is employed to implement the
change of time parameter to match those described in the mathematical model of
the battery The switch is used to control the value of the time parameter τ in
different discharge currents When the battery is discharging the discharge current
is a positive value and the time parameter τ is equal to 1τ When the battery is
not discharging the discharge current is equal to 0 in theory and the time
parameter has a different value 2τ
Although the discharge current should be equal to 0 theoretically it is hard to
achieve this in the real experimental measurement because of the inaccuracy of
the current sensor reading due to the inaccuracy occurred in the power supply to
the sensor Therefore the trigger of the switch in the model is set to be 01 A that
is when the discharge current is greater than 01 A the time parameter is set to be
1τ as the battery is in its discharging segment By contrast the value of time
64
parameter is set to be 2τ and the discharge current is considered as the error
caused by the sensors when that current is less than 01 A
422 Analysis in Variations of the Internal Resistance
Another important issue found through analyzing the experimental test result is
that the internal resistance for a specific battery in a specific state of health (SOH)
is not a constant when the discharging current changes This difference is more
significant than the effect caused by the state of charge
For example in the two-load discharge results shown in Figure 4-4 when the
battery is not discharging the initial voltage is equal to the electromotive force
(EMF1) When the battery began to discharge at the discharge current I1 the
terminal voltage dropped to V1 After the discharge stopped for a while the value
of the terminal voltage is equal to the electromotive force (EMF2) at that state of
charge (SOC2) Then the discharge of the battery starts again at a current of I2 and
the terminal voltage dropped to V2 The discharge progress is then stopped for
certain of a time period to get the steady terminal voltage (EMF3) at that state of
charge (SOC3) After that the test of discharge at the I3 = I1 was repeated again
and get another terminal voltage of V3 The last discharge test is done to provide
the evidence for the fact that this change in the internal resistance is not caused by
the change of the state of charge (SOC)
The value of electromotive force in a discharging battery is equal to the sum of the
terminal voltage and the voltage that the internal resistance takes that is
65
nnnn IrVEMF sdot+=
Therefore the internal resistance can be calculated by
n
nnn
I
VEMFr
minus= (41)
From the data collected in the experiment the key parameter values for the graphs
shown in Figure 4-4 can be found as listed in Table 4-1
Table 4-1 Approximate Internal Resistance Calculating
n 1 2 3
Electromotive Force (EMFn) 1260V 1252V 1238V
Discharge Current (In) 078A 114A 076A
Terminal Voltage (Vn) 1219V 1203V 1197V
Substituting these values into Equation 41 the internal resistance can be
calculated Ω=Ω=Ω= 539043005260 321 rrr
This change of the internal resistance can cause quite a significant effect in the
discharge progress This problem can be possibly solved in a number of ways
One possible choice is to find a curve of the internal resistance change and the
discharge current for a specific battery after a certain numbers of experimental
tests But this method needs huge efforts in conducting experimental tests and the
result is not very meaningful for the project considering the time cost Another
possibility is to conduct the experimental tests with a constant load Therefore the
change of internal resistance caused by the change of discharge current could be
ignored As a result in the whole process of this project the same load is
66
employed either in the constant-impedance load discharge or in the two-load
discharge tests
In order to implement the different internal resistance value when discharging
under different load a switch that can control the parameters R00 and R10 is
employed This switch is controlled by the discharge current which is the main
input of the mathematical model In the two-load discharge tests when the switch
K in Figure 4-1 is switched off there is only one load is connected to the battery
terminals and the discharge current is lower the values of R00 and R10 are
switched to the first set of parameters R001 and R101 To the contrast when K is
switched on the discharge current is higher and the values are switched to the
second set R002 and R102
423 Improved Lead-Acid Battery Mathematical Model
From the model described in Chapter 3 and the improvements studied in this
chapter the mathematical model of lead-acid battery when discharging in different
discharge currents can be described as the following equations
m
c
f
c
IIK
CK
IC))(1(1
)1(
)(
0
minus+
+
=
ε
θ
θ
θ (42)
ττ dItQt
e int=0
)()( (43)
)0(1 θCQSOC eminusminusminusminus==== (44)
)(1 θavge ICQDOC minusminusminusminus==== (45)
67
)1)(273(0 SOCKEE Emm minusminusminusminus++++minusminusminusminus==== θ (46)
)]1(1[ 0000 SOCARR minusminusminusminus++++==== (47)
)ln(101 DOCRR minusminusminusminus==== (48)
11
RC
τ= (49)
IeRtV
t
R sdotminussdot=minus
)1()( 11τ (410)
RIRVP Rs sdot+=2
12
1 (411)
sa P
Rdt
dC +
minus=
θ
θ
θθθ
(412)
)(
)(
2
1
002
001
00Load
Load
R
RR
= (413)
)(
)(
2
1
102
101
10Load
Load
R
RR
= (414)
)10(
)10(
2
1
AI
AI
lt
gt
=τ
ττ (415)
001R 002R 101R 202R and 1τ 2τ in the equations stand for different parameter
values of 10R 20R and τ when the load and charge status changes in order to
reflect the improvements described in this chapter For a two-load discharge test
there are ten important unknown parameters in the equations of the mathematical
model which are unknown for a specific battery 0C 0mE EK 001R 002R 101R
102R 1τ 2τ and 0A As the internal resistance R00 and R10 vary only when the
load changes they can be treated as constants in the constant-impedance load
68
discharge tests the key parameters are therefore 21100000 ττRRKEC Em
and 0A In this project the study of state of health is based on constant-impedance
load discharge The identification of these unknown parameters will be discussed
in Chapter 5
43 Simulation Study
The processes described above have been implemented in SIMULINK as a
simulation model for computer based analysis The simulation program consists of
two main function blocks circuit block and thermal block The structure of the
SIMULINK implementation is described in Figure 4-5
69
Figure 4-5 Structure of model for SIMULINK Implementation
70
As shown in the figure there are mainly two inputs in the model the discharge
current and the discharge time The actual capacity of battery can be then
calculated with the knowledge of rated capacity and the discharge current The
actual capacity is also influenced by the cell temperature At the beginning of
discharge the cell temperature is the same as the surrounding temperature
Integrating the discharge current with respect to time is the capacity consumed in
the discharge progress and then the state of charge and the depth of charge can be
obtained It is shown that the electromotive force and the internal resistance vary
as a result of changing in the state of charge and the depth of charge and the
terminal voltage can be calculated
In the thermal block of the model the heat generated by the current and the
internal resistance are calculated by the Joules law Then this energy is
transferred to calculate the thermal temperature of the cell and the cell
temperature is given back to the circuit block to affect the actual capacity
71
0 1000 2000 3000 4000 5000 6000 7000
0
02
04
06
08
1
Time (s)
Dis
charg
e C
urr
ent
(A)
0 1000 2000 3000 4000 5000 6000 7000105
11
115
12
125
13
Time (s)
Term
inal V
oltage (
V)
Figure 4-6 Terminal Voltage of Battery (Constant Discharge Current SIMULINK)
The result in Figure 4-6 shows the terminal voltage of a battery which discharges
under the current of 08A in a simulation study Since the discharge begins the
voltage drops due to the internal resistance and the change of state of charge (SOC)
and it climbs up when the discharge stops However the voltage changes
gradually because of the time parameter τ This result shows a good qualitative
agreement with the experimental test results
72
44 Summary and Discussion
This chapter introduces the laboratory test system designed for the project and the
limitation of the mathematical model described in Chapter 3 Switches on the time
parameter τ and the internal resistance parameters R00 and R10 have been added to
the model so that the model is able to represent the change of these parameters
found in the experimental tests The implementation of the model under the
MatlabSIMULINK environment is described and the simulation study shows a
good qualitative agreement with the experimental test results
The next chapter will focus on the identification of those unknown parameters of
the battery model that are important for revealing the battery characteristics
including 20100000 τARRKEC Em and 1τ
73
Chapter 5
Model Parameter Identification
and Model Validation
The identification of the unknown parameters 20100000 τARRKEC Em and 1τ
in the mathematical model will be introduced in this chapter
51 Need for the Optimization Algorithms
In those equations of the battery model described previously some parameters are
unknown and some of them are difficult to derive from physics or engineering
principles or to be obtained through experimental tests Therefore the
identification of the model unknown parameters becomes an important part for the
project Parameter identification is an optimization process that adjusts the
parameters to enable the simulation results to show the best agreement with the
results acquired by the experimental tests There are many algorithms available
for optimization and the principle of the optimization process for the project is to
minimize the objective function The objective function is formed by the absolute
value of the difference between the simulated and experimental results at each
time point The set of parameters to achieve the least value of the objective
function is considered to be the fittest set
74
There are two basic requirements of the optimization in this project First of all as
the problem for the solutions trapped to the local minima is a very important and
challenging issue in many linear optimization solvers the optimization algorithm
used in this project must be able to find the global minimum Secondly the
optimization algorithm not only should find the minimum value of the objective
function but also can tell the values of the parameters that result in the best fitness
which is needed for the analysis purpose in this project Finally the time cost is
also an important factor in selection of a suitable optimization algorithm
It needs to point that the objective here is to identify the unknown parameters of a
model with an already known structure If the objective is to identify or
approximate unknown model structures the selection of optimisation methods
will be quite different In the case of latter Neural Network Genetic
Programming and Fuzzy Logical will be more suitable choices To concentrate on
the objective of the project the thesis will focus on optimisation algorithms for
parameter identification
52 Overview of the Optimization Algorithms
Brute-force search is the most basic direct search algorithm that is used to find the
minimum value In the brute-force search the initial guess is the minimum
possibility of parameters and increasesdecreases The parameter
increasesdecreases step by step in each iteration and the best solution can be
75
searched This algorithm is the simplest but its disadvantage is also obvious that
is it is the slowest optimization method especially when used in the identification
of more than two parameters and the results are largely dependent on the initial
guesses
Linear search is an optimization method to solve the linear optimization problem
the preference function of which is linear and the feasible domain is defined by a
linear constraint function The linear constraints define a convex polyhedron
geometrically which is called the feasible region The algorithm is to construct an
admission solution at a vertex of the polyhedron and then along edges of the
polyhedron to vertices with successively higher values of the objective function
until the optimum is reached
Besides the basic optimization methods evolution computation technology is
becoming increasingly popular A range of different evolution computation
technologies can solve the optimization problem in this project including genetic
algorithms (GAs) particle swarm optimization (PSO)
Genetic Algorithms are direct search algorithms inspired from the process of
evolution in nature the natural selection Based on the principle of survival of the
fittest the GAs can produce better and better approximations to the global optimal
solution in a number of generations In each generation a new group of solutions
is created by the fitness level in the problem of every individual in the last
generation The solutions are then bred together to lead to the evolution of
individuals
76
Particle swarm optimization is a stochastic population-based computer algorithm
modelled on swarm intelligence that searches for a solution to an optimization
problem in a search space Based on the social psychological principles each
individual called lsquoparticlersquo in PSO is able to provide information to others and
also learn the success from the local best and the global best The movement of
each particle through the search space are guided by these successes and the
solution can be found after a number of generations
It has been proved by Dr Jianlin in his PhD Thesis (Wei 2007) that both Genetic
Algorithm and Particle Swarm optimization are capable of the model parameter
identification But the Particle Swarm optimization is a new algorithm that first
described in 1995 and it is not as common as Genetic Algorithm in the research
areas
The purpose of this research work is to find a method for parameter estimation
Genetic algorithms are well proven solution for complicated optimisation
problems and have been applied successfully in a range of similar problems (Wei
2007 Wei Wang et al 2007) Genetic algorithms are also well suited to problems
with many local minima In the current work the exact form of the fitness
function is unknown and it is therefore important to select a robust technique
which can identify good overall solutions For these reasons GA was selected to
give the best possible chance of satisfying the overall project objectives within the
limited timeframe of the project
77
53 The Study of the Genetic Algorithms
The process of Genetic Algorithm is reviewed in this section to provide an insight
into how GAs work and simulation study of two bench mark functions are carried
out
531 Working Principle of GAs
There are many methods used to implement a GA process and usually a GA is at
least composed of three common genetic operators Selection Crossover and
Mutation (Pham and Karaboga 1998) The flowchart of a simple GA process is
given in Figure 5-1
As a preparation to start the optimization process a GA requires a group of initial
solutions as the first generation The first generation is usually a group of
randomly produced solutions created by a random number generator The
population which is the number of individuals in a generation should be big
enough so that there could be a reasonable amount of genetic diversity in the
population Also it should be small enough for each generation to be computed in
a reasonable period of time using the computer resources available Typically a
population includes individuals between 20 and 100 (Chipperfield Fleming et al
1994A)
78
Figure 5-1 Flowchart of a Simple Genetic Algorithm (Pham and Karaboga 1998)
The fitness function is evaluated to measure how close that the individuals fit the
desired result A fitness function could be either complex or simple depending on
the optimization problem addressed In a case of minimization problem the most
fitted individuals will have the lowest numerical value of the associated fitness
function
No
Yes
Selection
Crossover
Mutation
Find the Best Individual
Generate initial population
Results
Evaluate fitness values
Operators of generating new
generation
Gengt 100
Evaluation
Start
79
Individuals are selected according to a fitness-based process The operator of
selection is made up of ranking and selection progress by which more copies of
the individuals that fit the optimization problem better will be produced in the
next generation In GAs there are mainly two ways to select a new population
Roulette Wheel Selection (RWS) and Stochastic Universal Sampling (SUS)
The individuals will be recombined (crossover) after the selection This operation
is to produce two new individuals from two existing individuals selected by the
operator of selection by cutting them at one or more position and exchanging the
parts following the cut The new individuals therefore can inherit some parts of
both parentsrsquo genetic material There are usually four ways of doing this one-
point crossover two-point crossover cycle crossover and uniform crossover
(Pham and Karaboga 1998) Figure 5-2 (a) shows an example of the two-point
crossover progress
Mutation is another operator to produce new individuals The difference is that the
new individual is produced from a single old one In this operation the bit values
of each individual are randomly reversed according to a specified property A
mutation can also helps the GA to avoid local optimums and find the global best
solution Figure 5-2 (b) represents how the mutation operator works
80
Figure 5-2 (a) Crossover operation (b) Mutation operation
The group of individuals produced after the mutation is the second generation
Then the fitness value of each individual in the second generation is computed
again This cycle will not stop until the result is close enough or after a certain
generation
Three major Matlab toolboxes are applied in the current market for application
purpose they are Genetic Algorithms Toolbox V12 (Chipperfield Fleming et al
1994B) the Genetic Algorithms Optimization Toolbox V11 (Houck Joines et al
1995) Genetic Algorithm Direct Search Toolbox V102 (MathWorks Inc 2004)
In this project the official toolbox in Matlab form Mathworks Inc is employed
The property settings for the project based on Dr Weirsquos thesis (Wei 2007) are
shown in Table 5-1
Parent 1 1 1 0 0 1 0 1 1 0 1 0 1 1
Parent 2 0 1 1 0 1 1 0 0 1 0 1 0 0
Offspring 1 1 1 0 0 1 1 0 0 1 1 0 1 1
Offspring 2 0 1 1 0 1 0 1 1 0 0 1 0 0
(a)
Parent 1 1 0 0 1 1 0 0 1 1 0 1 1
Offspring 1 1 0 0 1 0 0 0 1 1 0 1 1
(b)
81
Table 5-1 The property settings for Genetic Algorithms
Name of the GA properties Value of the GA properties
Number of generations 100
Population size 20
Fitness assignment Rank-base fitness assignment
Selection Stochastic universal sampling
Crossover Scattered crossover
Crossover rate 07
Mutation function Uniform mutation
Mutation rate 01
Population size specifies how many individuals there are in each generation With
a large population size the genetic algorithm searches the solution space more
thoroughly and the gives more possibility to return the global minimum The
number of generations specifies the maximum number of iterations for the genetic
algorithm to perform If this number is too low the genetic algorithm is not able
convergence to the global solution However either a large population size or a
large number of generations can cause the algorithm to run more slowly The
crossover rate and the mutation rate are properties that control the crossover and
mutation operator High rate of these values means that the genetic algorithm has
a higher opportunity of producing new offspring but it can be easy to miss the
current best solution if these values are too big
Initial tests of genetic algorithms on different properties show that the values
shown in table 5-1 are able to find an adequate solution Similar results would be
82
obtained if the values of the generations and the population size are larger but
costing more CPU time The crossover rate and the mutation rate would not affect
the result significantly if only varies in a small range But it is impossible to prove
that these two values are the best choice due to the strong randomness
532 Simulation Studies of Genetic Algorithms
In order to test and demonstrate that Genetic Algorithms are able to meet the
requirements of the project simulation studies have been carried out Two
benchmark functions that are commonly used in evaluating evolutionary
computation algorithms are employed for the simulation studies They are
1) Rastrigin function
Rastrigin function is a typical example of non-linear multimodal function with
many local minima The problem of looking for the global minimum is quite
difficult due to its large search space and its large number of local minima The
function is shown as
))2cos(10(10)(1
2sum=
sdotsdotminus+sdot=
n
i
ii xxnXf πr
where n is the dimension of the problem and 1x ~ nx are the coefficients to be
identified Figure 5-2 shows a 2-dimensional Rastriginrsquos function while figure 5-3
is a contour plot of Rastrigins function shows the alternating maxima and minima
83
The global minimum of the Rastriginrsquos function is 0)( =Xfr
when
021 ==== nxxx L
Figure 5-2 2-dimensional Rastrigins function (MathWorks Inc 2004)
84
Figure 5-3 Contour plot of Rastrigins function (MathWorks Inc 2004)
In the simulation study a ten dimensional Rastriginrsquos function is adopted Figure
5-4 shows the best optimization performance of the Rastriginrsquos function in each
generation It is shown that after 700 generations a global optimal value is
obtained
85
0 100 200 300 400 500 600 700 800 900 10000
10
20
30
40
50
60
70
80Best 00099429
Generation
Fitness v
alu
e
Best f itness
Figure 5-4 GA performance (Rastrigrinrsquos function)
2) Rosenbrock function
Rosenbrock function is another mathematical function used as a test problem for
optimization algorithms The global minimum is inside a long narrow parabolic
shaped flat valley To find the valley is trivial but to converge to the global
minimum is difficult The Rosenbrock function is defined by
sum=
+ minus+minus=
n
i
iii xxxXf
1
2221 ))1()(100()(
r
where n is the dimension of the problem and 1x ~ nx are the coefficients to be
identified Figure 5-5 shows a 2-dimensional Rosenbrock function
86
The global minimum of the Rosenbrock function is 0)( =Xfr
when
121 ==== nxxx L The same as the Rastriginrsquos function a ten dimensional
Rosenbrock function is adopted for the simulation study Figure 5-6 is the GA
performance to the Rosenbrock function It can be found that the optimization
converges and get the global optimal value after 300 generations
Figure 5-5 2-dimensional Rosenbrock function (MathWorks Inc 2004)
87
0 100 200 300 400 500 600 700 800 900 10000
200
400
600
800
1000
1200Best 060113
Generation
Fitness v
alu
e
Best fitness
Figure 5-6 GA performance (Rosenbrock function)
54 Model Parameter Identification
541 Implementation of Genetic Algorithms and
Experimental Data sets
In this project the Genetic Algorithm Direct Search Toolbox V102 developed by
Mathworks Inc is employed to identify the parameters of the battery model The
process is shown in Figure 5-7
88
Figure 5-7 Progress of Parameter Identification
The fitness function is used in the project and the parameter identification is to
minimize the fitness function so that the model output can fit the experimental
result The fitness function is given as
sum
sum sumsum
minussdot=
minussdot++minussdot+minussdot=
minus
1
0
2
1 1
1
0
))()(()(
)()()(
exp
expexp2exp1
t
t
sim
t
t
t
t
simnsim
t
t
sim
tVtVabstW
VVabsWVVabsWVVabsWfitnessn
n
L
where Vexp is the experimental terminal voltage data
Vsim is the simulated terminal voltage
Wt is the weights of the difference in the simulated and experimental
results
This fitness function represents the sum of the error values at each time interval
Mathematical Model of a six-cell
Lead Acid Battery
Experimental Test
Results
Fitness
Function
Discharge Current
Simulation
Output
Terminal Voltage
Simulation
Input
lt fmin
Genetic Algorithms (Selection Crossover and Mutation
etc)
Parameter Update
Yes
No
Stop
89
considered ( ntt minus0 ) The weight coefficients Wt indicates how important the
weighted part is in the optimization and how much it contribute to the
optimisation process Periods with bigger tW values are more important because
the sum of errors will give big value contribution to the fitness function value and
the optimisation process will pay more attention to the higher weighted error parts
In the experiments and optimization process it is found that the results were more
important when the discharge of a battery at the stage of stopping Therefore the
weight in this period is greater than that of the others The weighting coefficient
values in this project are determined by the results of the first several attempts of
parameter identification The period of simulation data that fails to fit the test
result means that the weight value is not big enough until the overall performance
of simulation is reasonable
Following the objective fitness function unknown coefficients of the battery
model are identified using experimental data The mathematical model of a six-
cell lead-acid battery in the figure is described in Chapter 4 and the parameters are
to be identified by Genetic Algorithms are 210100000 ττARRKEC Em
Three sets of experimental tests have been carried out for the purpose of
parameter identification and the validation of the mathematical model These three
experimental results are based on a lead-acid battery with the ideal capacity of 13
Ampere-hours under the discharge current of 08A
90
542 Parameters of Battery Model
The parameters of the mathematical model of a lead-acid battery are identified
using Genetic Algorithms and the predicted battery responses using the identified
parameters are compared with the simulated results One set of typical values of
parameters identified are listed in Table 5-2
Table 5-2 Identified parameters identified by the Genetic
Algorithms in the model of 12V-13Ah lead-acid battery Parameter Value Parameter Value
0C 48198 (Amp-Sec) 0mE 21465 (V)
EK 0001109 (V) 0A 29895
00R 001038 (Ohm) 10R 012196 (Ohm)
1τ 21052 (s) 2τ 17565 (s)
Figure 5-8 shows the simulation results using the Improved Battery Model and the
change of weights defined for this set of result described in the fitness function
The top subplot of Figure 5-8 shows the weight value of the GA fitness function
described before while the middle figure is the discharge current of the
experimental test which is also the input of the mathematical model In the
following test results in this and next chapter the changes of weight value are
similar so they are not shown in the figures
The blue line marked as ldquoExperimental Terminal Voltagerdquo in the bottom figure
represents the measured outputs while the other one (Simulated Terminal Voltage)
represents the simulation results The simulation results are ldquonoisyrdquo because
experimental discharge current is used as the input of model in the simulation
91
progress It is obviously that Figure 5-8 shows a good overall agreement of the
results although some slope when discharging is not perfect
0 500 1000 1500 2000 2500 3000 3500
1
15
Time (s)
Weig
ht
0 500 1000 1500 2000 2500 3000 3500114
116
118
12
122
124
126
128
13
Time (s)
Term
inal V
oltage (
V)
Experimental Terminal Voltage
Simulated Terminal Voltage
0 500 1000 1500 2000 2500 3000 3500
0
05
1
Time (s)
Dis
charg
e C
urr
ent
Simulated Terminal Voltage
Experimental Terminal Voltage
Figure 5-8 Measured and Simulated Result after Parameter Identification
Figure 5-9 shows the mean fitness value and the best in each generation It can be
seen that the best fitness in each generation is decreasing The mean fitness is
unstable because of the mutation operator in the GA that can attempt to find better
solutions
92
0 10 20 30 40 50 60 70 80 90 100100
150
200
250
300
350
400
450
500
550
Generation
Fitness v
alu
e
Best 1075521 Mean 1312731
Best f itness
Mean fitness
Figure 5-9 Mean and the Best Fitness Values in Each Generation
543 Battery Model Validation
In order to validate the battery mathematical model two sets of experimental tests
have been adopted to compare with the simulation results
The inputs of the discharge current and the validation results using two
experimental tests are shown in Figure 5-10 and Figure 5-11
93
0 500 1000 1500 2000 2500 3000114
116
118
12
122
124
126
128
13
Time (s)
Term
inal V
oltage (
V)
Simulated Terminal Voltage
Experimental Terminal Voltage
Simulated Terminal Voltage
Experimental Terminal Voltage
Figure 5-10 Measured and Simulated Terminal Voltage (Validation data 1)
In the simulation that shows in Figure 5-10 the discharge of battery begins at the
time of 700s and the simulation result shows a reasonable agreement with the
experimental result despite the noise of signal caused by the error of the sensors
It is noticed that at the beginning of the discharge there is a difference between
the simulated and experimental terminal voltages for about 100 seconds This
difference is studied and so called lsquocoup de fouetrsquo which often takes place at the
beginning of a discharge test when the SOC of battery is high (Perrin Delaille et
al 2006) However this lsquocoup de fouetrsquo behaviour cannot be described in this
model The discharge period lasts for about 1200 seconds and then stops and after
that the simulation has the similar result with the experiment
94
0 1000 2000 3000 4000 5000 600011
112
114
116
118
12
122
124
126
128
13
Time (s)
Term
inal V
oltage (
V)
Simulated Terminal Voltage
Experimental Terminal Voltage
Simulated Terminal Voltage
Experiment Terminal Voltage
Figure 5-11 Measured and Simulated Terminal Voltage (Validation data 2)
Figure 5-11 shows another group of experimental test to validate the battery
model At the beginning of the experiment the terminal voltage from the
experiment is dropping without any discharge behaviour of battery and that is
because of the experiment was carried out when the terminal voltage of lead-acid
battery is not steady enough after being charged and that also causes the
deviations in the discharge at about 1000-2000 seconds In this period the lsquocoup
de fouetrsquo appears again After the first period the battery is disconnected from the
load until the terminal voltage become steady and the simulation result in this
period fits the experiment result well In the second discharge of this test it is
shown that the lsquocoup de fouetrsquo does not occur because the SOC is not high For
the similar reason in the first discharge in this group of the test results there are
95
also some deviations in this period Finally the simulation result in the last part of
figure fits the experimental result is highly satisfied
The average error of the simulated outputs of the simulation studies and the
measured results are studied Absolute Error and Relative Error is defined as the
following equations
sum
sum
=
=
minus=
minus=
N
i
sim
N
i
sim
iV
iViV
NRelError
iViVN
AbsError
1 exp
exp
1
exp
)(
)()(1
)()(1
The absolute error and relative error are summarised in Table 5-3
Table 5-3 AbsError and RelError of Model Validation
Absolute Error Relative Error discharging relaxing overall discharging relaxing overall
Experimental Test 1 (Identification)
00229V 00207V 00217V 01833 01724 01776
Experimental Test 2 (Validation data 1)
00536V 00484V 00492V 04453 03872 04024
Experimental Test 1 (Validation data 2)
00724V 00372V 00485V 06352 03013 05025
55 Summary and Discussions
Identification of the unknown model parameters is discussed in this chapter and a
range of possibly suitable methods are reviewed in brief In this project Genetic
Algorithm is adopted GAs working principle and its implementation has been
96
introduced in details in this chapter The simulation study of two benchmark
functions that are commonly used in evaluating evolutionary computation
algorithms are employed in order to show the capability of GAs The parameter
identification by tests of a brand new 13Ah lead-acid battery is carried out and is
validated by two sets of other experimental test results under the same working
condition of the same battery
97
Chapter 6
The Analysis of State of Health
(SOH) in association with the
Internal Resistance
61 Methodology
As the number of discharge cycles of battery increases in applications the
maximum charges that a battery can offer will decrease In other words the SOH
battery is deteriorating But this drop of capacity is not linear and it is also a long
progress At the beginning of the use of battery the change of capacity is very
slow and it is not obvious After a number of cycles of discharge and charge this
change will get faster and relatively significant
There are no reliable methods now to calculate the remaining charge capacity
which is the only one determinant of the state of health The normal method is
simply to measure the voltage on its terminals But this measurement is not
accurate on an aged battery A battery in poor state of health but sufficiently
charged can also offer sufficient voltage to appear normal The only way to
determine the capacity accurately is to integrate the discharge current of battery in
a full deep discharge but this method cannot be used too frequently because deep
98
discharge is harmful for the battery
In the project six lead-acid batteries were tested using the test system described in
Chapter 4 These batteries were repeatedly discharged and charged for their whole
life time so that the information related to different state of health can be revealed
as soon as possible Even though the batteries works frequently it still takes more
than 6 months to make the battery become weak The testing experiments were
carried out and the data was recorded every 2-3 weeks so that important value of
state of health is not missed However as the change of capacity is a long progress
and it is nonlinear not all the data collected can be used in this project
Referring the literature (Coleman Lee et al 2006 Lakhdari and Midoun 2007
Coleman Hurley et al 2008) an important factor that reflects the change of state
of health of a lead-acid battery is the internal resistance Not only the state of
health but also other factors (SOC DOC discharge current etc) can result in
variations in internal resistance a new alternative method that based on the
Improved Battery Model in Chapter 4 is adopted in the project
From the model study in Chapter 4 the internal resistance can be divided into two
parts expressed by )]1(1[ 0000 SOCARR minusminusminusminus++++==== (Eq 47) and )ln(101 DOCRR minusminusminusminus====
(Eq 48) These equations show that the internal resistance is affected by the state
of charge (SOC) and depth of charge (DOC) in a discharge cycle In real
applications batteries are seldom discharged to the full range because a deep
discharge could cause some damage to the battery They are also seldom to be
charged to full to prevent the possibility of overcharge that could also bring some
99
negative effects Although this issue is not very significant in a valve regulated
lead acid battery it is better to control the working range of depth of charge from
50 to 80 approximately In this project the internal resistance of battery in the
depth of charge of 65 is studied as a most important factor that related to the
state of health As a little inaccurate of SOC and DOC will induce a comparative
big difference in the internal resistance the method of measuring the internal
resistance accurately by an external circuit is discarded
In Equation 47 and Equation 48 the author found that there are two other factors
that influence the internal resistance besides the SOC and the DOC R00 and R10
Therefore in the project the values of R00 and R10 in a specific discharge current
are very important to study the internal resistance The values of these two factors
are used in Equation 47 and Equation 48 to calculate the internal resistance per
cell of the battery The depth of charge is assumed to be 65 for a normal
working battery as described previously In chapter 3 the SOC and the DOC are
defined as )0(1 θCQSOC eminus= (Eq 44) and )(1 θavge ICQDOC minus= (Eq
45) The Capacity is also defined as equation 42
k
c
fc
IIK
CK
IC))(1(1
)1(
)(
0
minusminusminusminus++++
++++
====
ε
θ
θ
θ (61)
in which Kc = 118 k = 120 and 6 II avg times= in this project The relationship
between the actual capacity under discharge current Iavg and the nominal capacity
is
100
62
1
))(1(1
1
)0)(1(1
1
))(1(1
1
)0(
)(asymp
minus+=
minus+
minus+=
k
avgck
c
k
avgcavg
IIK
IK
IIK
C
IC
θ
θ (62)
Therefore the SOC when the DOC is 65 is
586))0(62(1)0(1 asympsdotminus=minus= θθ CQCQSOC ee (63)
As described in chapter 5 30 asympA therefore the internal resistance of an
individual cell can be obtained by
10001000010 43041)ln()]1(1[ RRDOCRSOCARRRrcell sdot+sdotasympminusminus+=+= (64)
and for a six-cell lead-acid battery the internal resistance
1000 582486 RRrr cellbattery sdot+sdot=times= (65)
62 The identification of C0 R00 and R10
In the eight parameters identified previously in Chapter 5 there are only three
parameters can be affected by the change of battery conditions Therefore the
other five parameters ( 2100 ττAKE Em ) can be treated as a constant for a battery
The parameters that related to the battery condition 0010 RR and 0C are the key
problems which the project focused on 0C represents the state of health while
the 0010 RR stands for the internal resistance parameters Here again the Genetic
algorithm is adopted to identify these three parameters
In this project the battery have been discharged and charged in hundreds of cycles
to simulate the capacity loss in the normal applications which is described by the
101
state of health in this project In order to find out the different behaviour of
internal resistance in different state of health experimental tests have been carried
out in different state of health of the battery
The first test is carried out when the battery is brand new and the data is also used
to identify the other parameters of the battery model as described in the previous
chapter The second group of data is collected after 300 discharge cycles
approximately and the third test took place after 200 more cycles The number of
discharge cycles between the last four tests is only about 50 because the change of
State of Health is more significant The identified parameters of a battery in
different state of health are shown in table 6-1
Table 6-1 Battery Remaining Capacity and Internal Resistance
Remaining
Capacity C0 (Amps)
SOH R00 R10 RelError Internal
Resistance (Ohm)
Test 1 48198 100 00609 00220 01756 05683
Test 2 44861 9314 00654 00103 07428 05759
Test 3 38025 7889 00635 00191 02812 05827
Test 4 33830 7019 00573 00509 07265 06126
Test 5 30625 6354 00604 00582 04340 06575
Test 6 26072 5306 00703 00368 01342 06855
And the terminal voltages simulated and measured are shown as the following
figures The same as previous figures the blue lines represent the measured
outputs while the red lines represent the simulation results
The test shows in figure 6-1 the same as the test which is used to describe the
genetic algorithms and the battery parameter identification in chapter 5 Detailed
102
description and analysis are given in chapter 5
0 500 1000 1500 2000 2500 3000 350011
112
114
116
118
12
122
124
126
128
13
Time (s)
Term
inal voltage (
V)
Experimental Terminal Voltage
Simulated Terminal Voltage
Experimental Terminal Voltage
Simulated Terminal Voltage
Figure 6-1 Experimental and Simulated Terminal Voltage of Test 1 (SOH = 100)
103
0 1000 2000 3000 4000 5000 600011
112
114
116
118
12
122
124
126
128
13
Time (s)
Term
inal V
oltage (
V)
Simulated Terminal Voltage
Experimental Terminal Voltage
Simulated Terminal Voltage
Experimental Terminal Voltage
Figure 6-2 Experimental and Simulated Terminal Voltage of Test2 (SOH= 9314)
The experiment shown in figure 6-2 is tested several months after the first
experimental test In the period that the first discharge begins the experimental
result shows a different slope in terminal voltage The reason is probably that the
battery have just charged to full by a charger and itrsquos the capacitor had not fully
discharged After that when the discharge stopped there is a deviation in the
simulation voltage In the authorrsquos opinion that is because of the accuracy of R10
and R00 If the value of R10 is greater and that of R00 is smaller the simulation
result should fit the experimental result In the second discharge period of the
discharge test there is also a little difference in the experimental and simulation
result caused by the inaccuracy of battery parameters But it shows a good
agreement when the discharge stopped
104
0 500 1000 1500 2000 2500 3000 3500 400011
112
114
116
118
12
122
124
126
128
13
Time (s)
Term
inal V
oltage (
V)
Simulated Terminal Voltage
Experimental Terminal Voltage
Simulated Terminal Voltage
Experimental Terminal Voltage
Figure 6-3 Experimental and Simulated Terminal Voltage of Test3 (SOH= 7889)
0 500 1000 1500 2000 2500 3000 3500 4000 4500 500011
112
114
116
118
12
122
124
126
128
13
Time (s)
Term
inal V
oltage (
V)
Simulated Terminal Voltage
Experimental Terminal Voltage
Simulated Terminal Voltage
Experimental Terminal Voltage
Figure 6-4 Experimental and Simulated Terminal Voltage of Test4 (SOH= 7019)
105
0 1000 2000 3000 4000 5000 600011
112
114
116
118
12
122
124
126
128
13
Time (s)
Term
inal V
oltage (
V)
Experimental Terminal Voltage
Simulated Terminal Voltage
Simulated Terminal Voltage
Experimental Terminal Voltage
Figure 6-5 Experimental and Simulated Terminal Voltage of Test5 (SOH= 6354)
Figure 6-3 figure 6-4 and figure 6-5 show the test results of the battery when the
SOH drops to its 80 70 and 60 It is shown that the simulation result in
figure 6-3 fits the experimental result until the end of test when the discharge of
battery has just stopped The inaccuracy of the R10 and R00 is also the main cause
of the deviation The overall simulation result in figure 6-4 figure 6-5 are good to
express the battery behaviour
106
0 500 1000 1500 2000 2500 3000 3500 400011
112
114
116
118
12
122
124
126
128
13
Time (s)
Term
inal V
oltage (
V)
Experimental Terminal Voltage
Simulated Terminal Voltage
Experimental Terminal Voltage
Simulated Terminal Voltage
Figure 6-6 Experimental and Simulated Terminal Voltage of Test6 (SOH= 5306)
In the parameter identification of test shown in figure 6-6 the remaining capacity
is only about 12 of the initial capacity when the battery is brand new During the
discharge period the simulation and experimental result is not fitting very well
and the slopes of them are not the same This is probably also caused by
insufficient idle time after being charged and the capacitor had not fully
discharged
Figure 6-7 represents the internal resistance value in different state of health as
described in table 6-1
107
100 95 90 85 80 75 70 65 60 55 5004
045
05
055
06
065
07
075
08
State of Health
Inte
rnal R
esis
tance (
Ohm
)
r vs SOH
Approximation
Figure 6-7 Change of Internal Resistance in Different State of Health (Battery 1)
It is shown that the internal resistance is increasing when the state of health of a
lead-acid battery decreases This progress is at first very slow when the battery is
new But after a number of discharge cycles the remaining capacity of battery
drops to about 75 of the initial capacity when the battery is new and the
increase of internal resistance become faster When the state of health is brought
down to about 50 which means that the battery cannot offer enough energy as
new the value of internal resistance is increased by 30 approximately At
present there is not a published quantitative description of the internal resistance
when the capacity changes yet but it has been agreed that the internal resistance
increases while the battery health deteriorates
Similar tests have been carried out on 5 other batteries with the same nominal
108
capacity and the changes of their internal resistances are given as figure 6-8 It is
not possible to deduce a statistical approximation equation only based on the
existing data but it can be seen from the figure that the performance of internal
resistance under different state of health shows an agreement in a certain extent
100 95 90 85 80 75 70 65 60 55 5003
04
05
06
07
08
09
State of Health
Inte
rnal R
esis
tance (
Ohm
)
r vs SOH (Battery 1)
r vs SOH (Battery 2)
r vs SOH (Battery 3)
r vs SOH (Battery 4)
r vs SOH (Battery 5)
r vs SOH (Battery 6)
Figure 6-8 Change of Internal Resistance in all 6 Batteries
63 Summary and Discussions
The determination of battery remaining capacity accurately is becoming
increasingly important in modern battery managements This currently is mostly
obtained by integrating the discharge current of a full discharge but this progress
usually causes a negative effect on most of the batteries There is also a view that
109
the state of health which represents the percentage of remaining capacity of a
weak battery compared with the initial capacity when brand new can affect the
internal resistance therefore the battery state of health can be obtained by the
study of battery internal resistance However from the analysis based on the
mathematical model and the experimental results it can be concluded that other
parameters can also cause variations of the internal resistance which make the
estimation of the state of health more challenging
This chapter describes a new alternative method that based on the Improved
Battery Model and the key parameters of the model The remaining maximum
capacity of a used battery which represents the SOH of the battery is related in
the internal resistance under the depth of charge of 65 which is expressed by
the parameters of R00 and R10 These parameters can be identified by genetic
algorithms A result that quantifies the change of internal resistance in different
SOH values has been concluded based on the analysis of a series of experimental
tests
110
Chapter 7
Conclusions and Future
Research
This chapter summarizes the major achievements of the presented research work
in the field of battery modelling and state of health analysis Possible direction of
further research work is also described briefly in this chapter
71 Summary
Lead-acid batteries are used in various industrial sectors and are irreplaceable due
to their low price In areas where lead-acid batteries are employed as an energy
storage device the capacity loss caused by the repeated dischargecharge cycles is
very common This drop of capacity can neither be avoided nor be repaired by
using current technologies As a result it is essential to know whether the battery
is able to meet the demand and if it should be replaced on time
In this thesis a study on the capacity status of a battery and its relation to the
internal resistance had been conducted and this thesis established a novel model
based method to quantify the battery health An Equivalent Circuit Mathematical
model for the discharging progress of a lead-acid battery has been developed for
this purpose and is implemented under MatlabSIMULINK software environment
111
The model involves most of the important concepts of a battery to reflect the
dynamic response of terminal voltage when discharging
A series of experimental tests have been carried out during the project for the
model validation and the study of the state of health Six 12V-13Ah lead-acid
batteries with the same rated capacity are discharged and recharged from brand
new to obtain different values of state of health Genetic algorithm has been
employed to identify the unknown parameters of the battery model in each state of
health and the identified parameters are used as the factors that reflecting the state
of health and the internal resistance The internal resistances corresponding
different state of health have been collected and recorded A result was found in
the thesis that for the 12V-13Ah lead-acid battery which is used in the
experimental tests the value of internal resistance is increased by 25
approximately if the SOH of battery drops to 50
72 Limitations
The key limitation of the method introduced in this thesis is that it is based on the
parameter identifications of the model which means a test is still needed in order
to obtain the state of health The major reason is that the mathematical model does
not include the charging progress of battery which is also an important period of
the battery duty cycle Another limitation is that all the tests of the state of health
estimation are carried out at the same discharge rate because of the variation of
the internal resistance in different discharge rate as discussed in chapter 4 Finally
112
The lsquocoup de fouetrsquo behaviour that of took place at the beginning of discharge
when batteries are full is not able to be simulated in the current version of
mathematical model
73 Future Research Work
Following the limitations of the project some future research can be carried out in
three steps based on the model improvements and the practical applications of the
algorithm
First of all improvements of the discharging battery model can be carried out
which can mainly focus on the study of the battery internal resistance in different
discharge rates Equations of internal resistances that can withstand the change of
discharge rate will make the model capable for online applications Studies on the
relationship between the electromotive force and the state of charge can also lead
to a solution of the lsquocoup de fouetrsquo behaviour and a better simulation result
Another research work on the model modification is that the behaviour of battery
to the mathematical model when a battery is being charged can be involved by
which the monitoring system of battery can be implemented in the whole duty
cycles This part of work can be focused on the parasitic branch in the
mathematical model described in chapter 3
Further work should also reveal the variations of state of health in different duty
113
cycles and an algorithm based on this change should be designed to estimate the
remaining life-time of a lead-acid battery The value of current state of health and
the estimated raining life-time should also be considered as major outputs in this
period of work It is also possible to design an online management device of
battery to estimate the life-time and the state of health
114
References
Anon (2006) Global Wind Energy Council (GWEC) statistics [online] from
httpwwwgwecnetuploadsmedia07-
02_PR_Global_Statistics_2006pdf
Anon (2007) Battery Types Flooded versus AGM and Gel [online]
Retrieved February 13 2007 from
httpwwwvonwentzelnetBattery01Type
Anon (2007) BP Statistical Review of World Energy June 2007 [online] from
httpwwwbpcomliveassetsbp_internetglobalbpglobalbp_uk_englishr
eports_and_publicationsstatistical_energy_review_2007STAGINGlocal_
assetsdownloadsspreadsheetsstatistical_review_full_report_workbook_2
007xls
Anon (2007) International Energy Outlook 2007 [online] from
httpwwweiadoegovoiafieohighlightshtml
Ball R J Evans R and Stevens R (2002) Finite element (FE) modelling of
current density on the valve regulated leadacid battery positive grid
Journal of Power Sources 103(2) 213-222
Bernardes A M Espinosa D C R and Tenoacuterio J A S (2004) Recycling of
batteries a review of current processes and technologies Journal of
Power Sources 130(1-2) 291-298
Berndt D (1993) Maintenance-Free Batteries -- A Handbook of Battery
Technology Somerset Research Studies Press Ltd
Berndt D (2001) Valve-regulated lead-acid batteries Journal of Power
Sources 100(1-2) 29-46
115
Berndt D (2009) Electrochemical Energy Storage Battery Technology
Handbook CRC Press
Casacca M A and Salameh Z M (1992) Determination of lead-acid battery
capacity via mathematical modeling techniques Energy Conversion
IEEE Transaction on 7(3) 442-446
Ceraolo M (2000) New dynamical models of lead-acid batteries Ieee
Transactions on Power Systems 15(4) 1184-1190
Chan H L and Sutanto D (2000) A new battery model for use with Battery
Energy Storage Systems and Electric Vehicles Power Systems 2000 Ieee
Power Engineering Society Winter Meeting - Vols 1-4 Conference
Proceedings 470-475
Chen M and Rincacuteon-Mora G A (2006) Accurate electrical battery model
capable of predicting runtime and I-V performance IEEE
TRANSACTIONS ON ENERGY CONVERSION VOL 21( NO 2)
504-511
Chipperfield A J Fleming P J and Fonseca C M (1994A) Genetic algorithm
tools for control systems engineering Adaptive computing in
engineering design and control Plymouth UK
Chipperfield A J Fleming P J Pohlherim H and Fonseca C M (1994B)
Genetic algorithm toolbox for use with Matlab Department of automatic
control and systems engineering University of Sheffield
Crompton T R (2000) Battery Reference Book Third Edition Oxford
Elsevier Newnes
Cun J P Fiorina J N Fraisse M Mabboux H A and Mabboux H The
116
experience of a UPS company in advanced battery monitoring
Telecommunications Energy Conference 1996 INTELEC 96 18th
International 646 - 653
Durr M Cruden A Gair S and McDonald J R (2006) Dynamic model of a
lead acid battery for use in a domestic fuel cell system Journal of Power
Sources 161(2) 1400-1411
Esfahanian V Torabi F and Mosahebi (2008) An innovative computational
algorithm for simulation of lead-acid batteries Journal of Power
Sources 176(1) 373-380
Gillioli R and Cerolo P (1990) Charge and discharge fourth order dynamic
model of the lead battery 10th
intl Electric Vehicle Symposium Hong
Kong p1-9
Glendenning I (1981) Compressed air storage Physics in Technology 12(3)
103-10
GONG Q (2005) Modeling study of a vehicle traction battery model
CHINESE LABAT MAN 2005 Vol 42 Numb 2 issu 155 pages 76-79
Houck C Joines J and Kay M (1995) A Genetic Algorithm for Function
Optimization A Matlab Implementation NCSU-IE TR 95-09
Jacobi W (2009) Lithium Batteries Battery Technology Handbook CRC Press
Jayne M G and Morgan C (1986) a new mathematical model of lead acid
battery for electric vehicles Eighth Intl electric vehicle conference
Washington DC
Juvonen M (2003) Large-Scale Energy Storage Systems [online] from
httpwwwdocicacuk~mattiise2grpenergystorage_reportstoragehtml
117
Lee J H Lee K Y and Lee J Y (1996) Self-discharge behaviour of sealed
Ni-MH batteries using MmNi33+xCo07Al10-x anodes Journal of
Alloys and Compounds 232(1-2) 197-203
Liaw B Y Gu W B and Wang C Y (1997) Numerical simulation of coupled
electrochemical and transport processes in battery systems Proceedings
of the Intersociety Energy Conversion Engineering Conference
Honolulu HI USA IEEE
Lu S Meegahawatte D H Guo S Hillmansen S Roberts C and Goodman
C J (2008) Analysis of energy storage devices in hybrid railway vehicles
Railway Engineering - Challenges for Railway Transportation in
Information Age 2008 ICRE 2008 International Conference on
Mantell C L (1984) Batteries and energy systems Second Edition McGraw-
Hill Inc
MathWorks Inc (2004) Genetic Algorithm Direct Search Toolbox V102
MathWorksInc
MPowerSolutionsLtd (nd) Alternative Energy Storage Methods [online]
from httpwwwmpowerukcom
Okoshi T Yamada K Hirasawa T and Emori A (2006) Battery condition
monitoring (BCM) technologies about lead-acid batteries Journal of
Power Sources 158(2) 874-878
Perrin M Delaille A Huet F and Hernout L (2006) Study of the coup de
fouet of lead-acid cells as a function of their state-of-charge and state-of-
health Journal of Power Sources 158(2) 1019-28
Pham D T and Karaboga D (1998) Intelligent Optimisation Techniques
118
Genetic Algorithms Tabu Search Simulated Annealing and Neural
Networks New York Springer-Verlag New York Inc
RailPower Hybrid Technologies C (nd) Benifits of Hybrid Locomotives
[online] from httpwwwrailpowercomproducts_hl_benefitshtml
Rand D A J Moseley P T and Garche J (2004) Valve-Regulated Lead-Acid
Batteries Elsevier
Ruetschi P (2004) Aging mechanisms and service life of lead-acid batteries
Journal of Power Sources 127 (1-2) 33-44 Switzerland Elsevier
Salameh Z M Casacca M A and Lynch W A (1992) A mathematical model
for lead-acid batteries IEEE Trans on Energy conversion Vol7 No 1
Sato Y Takeuchi S and Kobayakawa K (2001) Cause of the memory effect
observed in alkaline secondary batteries using nickel electrode Journal
of Power Sources 93(1-2) 20-24
Sims R I Carnes J C Dzieciuch M A and Fenton J E (1990) Computer
modeling of Automotive lead acid batteries Ford Research Laboratories
Technical Report
Smil V (2007) Energy at the Crossroads Massachusetts Achorn Graphic
Services Inc
Ter-Gazarian A (1994) Energy storage for power systems London Peter
Peregrinus Ltd
TNI_Ltd (2007) Battery history [online] from
httpwwweuropulsecombattery_historybattery_historyhtm
Tuck C D S (1991) Modern Battery Technology Ellis Horwood Ltd
Wei J (2007) Development of Coal Mill and Aggregate Load Area Models in
119
Power Systems using Genetic Algorithms University of Liverpool PhD
Wikipedia (nd) Lead-Acid Battery [online] from
httpenwikipediaorgwikiLead-acid
Wikipedia (nd) Rechargeable Batteries [online] from
httpenwikipediaorgwikiRechargeable_battery
Wikipedia (nd) VRLA [online] from httpenwikipediaorgwikiVRLA
Zhang Y L Liu P H Zhang Q Y and Cheng W (2010) Separation of
cadmium(ii) from spent nickelcadmium battery by emulsion liquid
membrane Canadian Journal of Chemical Engineering 88(1) 95-100
120
Appendix I SIMULINK Diagrams of Battery Model
Figure A-1 SIMULINK Diagrams of ldquoMain Blockrdquo
121
Figure A-2 SIMULINK Diagrams of ldquoTerminal Voltage Calculationrdquo
122
Figure A-3 SIMULINK Diagrams of ldquoThermal Behaviourrdquo
123
Figure A-4 SIMULINK Diagrams of ldquoBattery Capacityrdquo
Figure A-5 SIMULINK Diagrams of ldquoBattery State of Chargerdquo
Figure A-6 SIMULINK Diagrams of ldquoBattery Depth of Chargerdquo
124
Figure A-7 SIMULINK Diagrams of ldquoBattery Electromotive Forcerdquo
(a)
(b)
Figure A-8 SIMULINK Diagrams of ldquoBattery Internal Resistancerdquo
125
Appendix II
List of Publications
S Hillmansen S Lu D H Meegahawatte S Guo C Roberts and C J
Goodman Analysis of Energy Storage Devices in Hybrid Railway Vehicles International Conference on Railway Engineering 2008 p68-73 Hong Kong China 25-28 March 2008
Y Yin X Luo S Guo Z Zhou J Wang A battery charging control strategy for
renewable energy generation systems The Proceedings of World Congress on Engineering 2008 Vol 1 pp356-361 London UK 2-4 July 2008
S Guo S Hillmansen Y Yin J Wang State of Health Monitoring of Lead-acid
Batteries Proceedings of the 14th International Conference on Automation amp Computing pp250-254 Brunel University West London UK 6 September 2008
Y Yin C Li Z Zhou Q Liu S Guo X Luo J Wang Design and Realization of a
PS2 Keyboard Interface in Embedded system Proceedings of the 14th International Conference on Automation amp Computing pp160-163 Brunel University West London UK 6 September 2008
Yin Y Wang J Luo X Guo S Development of a battery charging management
unit for renewable power generation a book chapter in Advances in
Electrical Engineering and Computational Science Edited by Sio-Long Ao and Len Gelman pp33-46 Springer 2009
Wang J Wei JL Guo S Condition monitoring of power plant milling process
using intelligent optimization and model based techniques accepted as a chapter in the book of Fault Detection in March 2009
S Guo S Hillmansen J Wang Model Based Analysis of Battery State of Health
using Genetic Algorithms accepted by the International Conference on Systems Engineering (ICSE) Coventry 8-10 September 2009

3
Abstract
Batteries are becoming increasingly important to our life as they are applied in a
range of different areas Therefore the reliability of battery is a critical issue in
these battery applications It has been noticed that most batteries have limited
cycle durability that is the total capacity drops when a battery is charged and
discharged for a number of cycles If a battery is too weak to offer sufficient
energy it should be replaced at the right time But current problem is that there is
no reliable method available to quantify the capacity loss and to estimate whether
the remaining capacity of battery Complete discharge which is the only way of
capacity estimation has a negative effect to the battery plates therefore it cannot
be used too frequently
This thesis summarises the research work in the development of the battery status
estimation algorithm The work initially focused on the mathematical descriptions
of lead acid batteries and a mathematical model based on this study was then
developed and implemented to describe the process of battery discharge Genetic
Algorithms (GAs) were used as a tool to identify the parameters related to the
battery including the internal resistances state of charge and capacity The
relevant simulation results show that the model is able to adequately simulate the
battery discharge process
The aforementioned models were extended to a further investigation of the
batteries state of health It was noticed that there is a link between the status of
4
battery health and the internal resistance In this project six batteries were
discharged and charged in several times in order to simulate the capacity loss that
occurs in normal operation This capacity loss is related to the state of health and
the parameter estimation was able to adequately distinguish between different
state of health
These results indicate that the internal resistance increases when the state of health
of a lead-acid battery decreases This progress is at first very slow when the
battery is new but the change becomes faster when the remaining capacity of
battery drops to about 75 of the initial It is found in the thesis that the value of
internal resistance is increased by 25 approximately when the state of health is
brought down to about 50 meaning that the battery cannot offer enough energy
as new and should be replaced for safety consideration
The method described within this thesis performed adequately in the limited tests
performed during the experimental work Further investigations are recommended
in order to refine the method which is potentially suitable for online
implementation in battery condition monitoring systems
5
Contents
Chapter 1 Background and Objectives of the Project 1
11 Overview 1
12 Review of Energy Storage Systems 2
121 Applications of the Energy Storage Systems 2
122 Review of the Existing Energy Storage Devices 4
123 Review of Batteries 7
124 The Management of Batteries 11
13 Project Objectives 12
14 Outline of the thesis 13
Chapter 2 Introduction of Lead-acid Batteries 15
21 A General Overview of the Lead-acid Battery 15
22 Configuration of Lead-acid Batteries 18
221 Electrochemical Principles 18
222 Lead-Acid Battery Types and Technologies 20
223 Battery Designs for Different Applications 22
23 Mathematical Descriptions of Lead-acid Batteries 23
231 Capacity 23
232 Electromotive force 24
233 State of Charge and Depth of Charge 26
234 Internal Resistance and State of Health 27
235 Multi-Cell Lead-Acid Batteries 29
24 Summary 29
6
Chapter 3 Equivalent Circuit Modelling of Lead-acid Batteries 31
31 Requirements for the Battery Model 31
32 Overview of Battery Model Techniques 32
321 Electrochemical Model 32
322 Physical Models 33
323 Equivalent Circuit Model 34
324 Discussion of Different Battery Model Methods 35
33 Introduction of the Existing Equivalent Circuit Models 37
331 Simple Battery Model 37
332 Advanced Simple Battery Model 39
333 Thevenin Battery Model 40
334 Dynamic Battery Model 42
335 Fourth Order Dynamic Model 43
336 Improved Battery Model 44
34 Mathematical Model of the Lead-acid Batteries 44
341 Capacity 45
342 Electric Networks 48
343 State of Charge and Depth of Discharge 50
344 Electromotive Force of the Battery 50
345 Internal Resistance of a Battery 51
346 The Behaviour of Parasitic Branch 52
347 Main Branch Capacitance 53
348 Thermal Behaviour of a Battery 55
35 Mathematical Model of the Lead-acid Batteries 56
7
36 Summary and Discussion 57
Chapter 4 Experimental System Set up and Improved Battery Model Simulation
Implementation 59
41 The Experimental System 59
42 Improvements of the Battery Model 61
421 The Change of τ in Different Charge Status 63
422 Analysis in Variations of the Internal Resistance 64
423 Improved Lead-Acid Battery Mathematical Model 66
43 Simulation Study 68
44 Summary and Discussion 72
Chapter 5 Model Parameter Identification and Model Validation 73
51 Need for the Optimization Algorithms 73
52 Overview of the Optimization Algorithms 74
53 The Study of the Genetic Algorithms 77
531 Working Principle of GAs 77
532 Simulation Studies of Genetic Algorithms 81
54 Model Parameter Identification 87
541 Implementation of Genetic Algorithms and Experimental Data sets
87
542 Parameters of Battery Model 90
543 Battery Model Validation 92
55 Summary and Discussions 95
Chapter 6 The Analysis of State of Health (SOH) in association with the Internal
Resistance 97
8
61 Methodology 97
62 The identification of C0 R00 and R10 100
63 Summary and Discussions 108
Chapter 7 Conclusions and Future Research 110
71 Summary 110
72 Limitations 111
73 Future Research Works 112
9
List of Figures
Figure 1-1 Power density vs energy density plot 7
Figure 2-1 Working Principle of Lead-Acid Batteries (a) shows the battery when
discharging and (b) is when charging with a DC charger 18
Figure 3-1 Simple Battery Model 38
Figure 3-2 I-V chart of the Simple Battery Model 39
Figure 3-3 I-V Chart in different SOC 40
Figure 3-4 Sketch to show battery discharge behaviours in typical tests 41
Figure 3-5 Thevenin Battery Model 42
Figure 3-6 Fourth-order Battery Model43
Figure 3-7 Improved Battery Model 44
Figure 3-8 Battery Capacity vs Discharge Current 47
Figure 3-9 Lead-acid Battery Equivalent Network 48
Figure 3-10 The Equivalent Network with the Approximated mZ 49
Figure 3-11 R-C block 53
Figure 4-1 Equivalent Circuit of the Experimental Test Rig 60
Figure 4-2 Experimental Test Rig61
Figure 4-3 Test of constant-impedance load discharge 62
Figure 4-4 Test of two-load discharge 62
Figure 4-5 Structure of model for SIMULINK Implementation69
Figure 4-6 Terminal Voltage of Battery 71
Figure 5-1 Flowchart of a Simple Genetic Algorithm78
Figure 5-2 2-dimensional Rastrigins function83
Figure 5-3 Contour plot of Rastrigins function84
10
Figure 5-4 GA performance (Rastrigrinrsquos function) 85
Figure 5-5 2-dimensional Rosenbrock function 86
Figure 5-6 GA performance (Rosenbrock function) 87
Figure 5-7 Progress of Parameter Identification 88
Figure 5-8 Measured and Simulated Result after Parameter Identification 91
Figure 5-9 Mean and the Best Fitness Values in Each Generation 92
Figure 5-10 Measured and Simulated Terminal Voltage 93
Figure 5-11 Measured and Simulated Terminal Voltage 94
Figure 6-1 Experimental and Simulated Terminal Voltage of Test 1 (SOH = 100)
102
Figure 6-2 Experimental and Simulated Terminal Voltage of Test 2 (SOH=9314)
103
Figure 6-3 Experimental and Simulated Terminal Voltage of Test 3 (SOH=7889)
104
Figure 6-4 Experimental and Simulated Terminal Voltage of Test 4 (SOH=7019)
104
Figure 6-5 Experimental and Simulated Terminal Voltage of Test 5 (SOH=6354)
105
Figure 6-6 Experimental and Simulated Terminal Voltage of Test 6 (SOH=5306)
106
Figure 6-7 Change of Internal Resistance in Different State of Health (Battery 1)
107
Figure 6-8 Change of Internal Resistance in all 6 Batteries 108
1
Chapter 1
Background and Objectives of
the Project
11 Overview
Fossil fuels have been the main energy resource in recent human history although
their continuing use has been shown to have a detrimental effect on the
environment The principal problem for fossil fuels is that they cannot be
reproduced within a short period of time so it is a finite energy supply source If
current consumption rate continues they will be exhausted in a few generations
from now Fossil fuel has never been considered as a clean-resource because there
is an emission of noxious gasses including CO CO2 NOx SOx and HC into the
atmosphere With all the pressure from the problems associated with the fossil
fuel exploration of the usage of renewable energy is becoming an increasingly
important issue
Wind energy hydro energy and solar energy are three of the most important
renewable energy sources and they have been implemented on a large scale wind
energy has produced a annual global total of 65019 times 1012 Wmiddoth
(74223 MWtimes24htimes365 days) (Anon 2006) energy in the year 2006 and hydro
2
energy is about 304 times 1015 Wmiddoth (30404 times 1012 Wmiddoth) (Anon 2007) Solar energy
resources are estimated at about 10694times1015 Wmiddoth (3850times1021 J) (Smil 2007) To
compare with the worldwide energy consumption of 13097times1015 Wmiddoth in the year
2007 it is clear that renewable energies have a significant role to play (Anon
2007)
However the problem of the implementation of the renewable energy is that the
electricity generated is intermittent and the power systems are experiencing the
problem of rapidly changing power demand Therefore the management of the
energy is an important issue Devices of energy storage should solve these
problems in theory
12 Review of Energy Storage Systems
Not only giving a large scale energy solution energy storage devices are also
commonly used in a range of applications related to everybody Different energy
storage technologies are suited to different applications and consideration must be
made in order to select the correct solution for each application This section will
give an overview of the existing energy storage systems
121 Applications of the Energy Storage Systems
Large scale energy storage systems which are also called grid energy storage
refer to the methods used to large-scale store electricity within an electrical power
grid Off-peak energy is stored during times when production (from power plants)
3
exceeds consumption and the stores are utilized at times when consumption
exceeds production In this way electricity production need not be drastically
scaled up and down to meet momentary consumption ndash instead production is
maintained at a more constant level
Despite the applications in grid scale the energy storage systems are also popular
in a number of areas For example they are usually used to optimize the energy
generated from the engine in modern electrical hybrid vehicles One such
application is in a shunter locomotive A shunter is a small railroad locomotive
intended for assembling trains ready for a road locomotive to take over
disassembling a train that has been brought in and switching a train to another rail
at the rail terminals The duty cycle of a shunter is characterised by short duration
high power demands (accelerating a rake of vehicles) and the long periods of
idling while the train waits for other operations Comparing to traditional shunter
locomotive that use diesel engines only for the whole duty cycle hybrid shunter
locomotives with energy storage devices can have a 40-70 reduction in fuel use
(RailPower Hybrid Technologies nd) This saving is made by operating the prime
mover at its optimum
Another application of energy storage in the vehicle technologies is the
regenerative braking system which is used to save the braking energy of vehicle
The potential of this technology to save energy for a vehicle is depends on the
duty cycle (Lu Meegahawatte et al 2008) which is characterized by storing the
energy generated when the vehicle is decelerating and releasing when accelerating
4
Energy storage devices are also very popular in stationary applications also
known as the Uninterruptible Power Supply (UPS) systems This system is
designed to meet the power demand when problems like power failure happen and
it is important especially in the applications where power failures could have
serious consequences for example in hospitals and computer centres (Berndt
2009)
The energy storage devices in the UPS system are often used to achieve
ldquouninterruptiblerdquo in a short period before the secondary power supply started
When a power problem occurs the energy storage device starts to supply
electricity immediately and at the same time the generator begins to start When
the generator is ready to supply sufficient power the energy storage device stops
providing power When the grid power is recovered the energy storage device can
be recharged until full
122 Review of the Existing Energy Storage Devices
There are various kinds of energy storage systems including pumped hydro
compressed air flywheel supercapacitors electrochemical and also
superconducting magnetic Each technology is suited to different applications and
careful consideration must be made in order to select the correct solution for each
application
Pumped hydro is the oldest and the most effective kind of large scale energy
storage method which have been used for nearly a century since 1929 (Juvonen
5
2003) Two large reservoirs at different altitudes with a pump a turbine a motor
and a generator are employed to collect the off-peak energy The water is released
from the higher one through a turbine to generate electricity during peak load
period
Compressed air is a pneumatic energy storage method that refers to the air kept
under a certain pressure This system can be used in grid energy storage that the
air can be stored by compressors during periods with low power demand This
compressed air can be released to a generator to meet the high power demand
during peak time (Glendenning 1981 Ter-Gazarian 1994 Juvonen 2003) In some
applications the compressed air is released through a combustor mixed with
natural gas to obtain a higher overall efficiency
A capacitor is an electrical device that can store energy in an electric field
between a pair of conductors and is often used in circuits for short term energy
storage It blocks the circuit to hold DC voltage Supercapacitors are energy
storage devices with the same principle but with a higher energy density The
power density of the supercapacitor systems can be very high but the energy is
often released in a very short duration (Ter-Gazarian 1994) As a result the
supercapacitors are usually used in applications of an energy burst
Superconducting magnetic energy storage system stores energy in the magnetic
field generated by direct current in a coil Instead of traditional wires like copper
superconductors are employed to avoid the energy consumptions as heat because
of the resistance A problem is that the optimal operating temperature for
6
superconductors is 50-77K a refrigerator is therefore necessary in the system for
cooling down
Flywheels are considered as a method of storing mechanical kinetic energy by
accelerating a flywheel to a very high speed to store the energy and decelerating
to release the energy Flywheels are very efficient for short duration storage cycles
due to their fast response speed These energy storage devices are used mainly in
applications that demand kinetic energy storage and high numbers of deep
discharge cycles
Electrochemical energy storage stands for the device capable of converting
chemical and electrical energy to each other by chemical reactions Batteries are
the most common technology of electrochemical energy storage methods The
oxidation and reduction reactions in the two electrodes of battery lead to the
current through the external circuit when discharging to provide energy The
secondary battery can be recharged by applying electrical current which reverses
the chemical reactions that occur during the discharge
Fuel cell is another technology with very high energy density that converts the
chemical energy in a source fuel into an electrical current The fuel cells are
considered as the ldquoenvironmental friendlyrdquo as the only by-product is water The
working principle of fuel cells when discharging is the same as the batteries but
unlike the batteries the fuel cells do not need recharge as they only provide
electrical energy while the active chemicals are supplied to the electrodes (Mantell
1984 MPowerSolutionsLtd nd)
7
Figure 1-shows the Ragone chart of the energy and power density of some energy
storage systems
Figure 1-1 Power density vs energy density plot (MPowerSolutionsLtd nd)
123 Review of Batteries
The preceding discussion has identified that energy storage devices are becoming
increasingly important in both stationary and mobile applications Battery as the
most popular energy storage device is studied in this section
There are two different types of batteries applied in a large range of areas now
Primary batteries and Rechargeable batteries Primary batteries which are also
called disposable batteries often have higher energy densities than the
rechargeable ones and they have a lower self-discharge (Ter-Gazarian 1994)
8
However as the chemical reactions in these batteries are not reversible and the
active materials cannot be restored to their initial forms these batteries cannot be
reliably recharged The primary batteries are intended to be used once and then
discarded therefore they are not suitable for the energy storage systems
Rechargeable battery is the other type of the electrochemical batteries which is
also known as secondary battery because their electrochemical reactions are
electrically reversible There are many different rechargeable battery technologies
in which only four of them are leading the world market nickel-cadmium nickel-
hydride lead-acid and lithium-ion (Berndt 1993 Berndt 2009)
The Nickel-cadmium (NiCd) battery is a kind of rechargeable battery that uses
nickel oxide hydroxide and metallic cadmium as electrodes and an alkaline
electrolyte (often potassium hydroxide) (Mantell 1984) As designed to compete
the primary batteries the NiCd batteries are often manufactured in the same size
and they are used in the consumer market as primary batteries for example in
clocks toys radios and cordless tools However when the NiCds are substituted
for primary cells the lower terminal voltage and smaller ampere-hour capacity
may reduce performance as compared to primary cells The most attractive feature
of the nickel-cadmium batteries is that they are more difficult to damage
comparing with other batteries during deep discharge cycles They can also
sustain more cycles and the lower internal resistance can also help achieve a
higher maximum discharge rate A problem preventing the large scale application
of this battery technology is that the nickel-cadmium batteries suffers faster self
discharge rate than other rechargeable batteries and the cadmium used as the
9
active material in one of the electrodes is toxic and expensive (Zhang Liu et al
2010) Furthermore the capacity loss caused by the continuously discharge and
recharge to the same state of charge called ldquomemory effectrdquo is also a very
important issue of the nickel-cadmium batteries (Sato Takeuchi et al 2001)
The nickel-metal hydride (NiMH) battery is a type of secondary electrochemical
battery that designed to substitute for the nickel-cadmium cells They have a
similar size and a similar cell voltage but with more advantages By using
hydrogen-absorbing alloy as negative electrode instead of cadmium this
electrochemical technology is considered as ldquoenvironmental friendlyrdquo because of
the absence of toxic cadmium (Berndt 1993) The nickel-metal hydride batteries
also have low internal resistance and the high cycle durability as the NiCds and a
NiMH battery can have two to three times the capacity of an equivalent size
nickel-cadmium battery However the nickel-metal hydride batteries also have a
similar high self-discharge rate as the nickel-cadmium batteries (Lee Lee et al
1996) and it also cannot afford complete discharges Memory effect from
repeated partial discharge can occur in a NiMH battery but this is reversible
through charge cycling (Berndt 2009)
The lead-acid batteries are the oldest type of rechargeable battery with a history of
over 150 years but they are still the most popular battery chemistry for
applications such as engine starting or backup power systems as there is no
cheaper alternative when weight is not a factor This technology uses lead and
lead dioxide as electrodes and an acid electrolyte of sulphuric acid and the
advantage of this configuration is that the electrolyte takes part in reactions of
10
both electrodes and both electrodes turn into lead sulphate when discharging
(Berndt 1993 Berndt 2009) The lead-acid batteries can be designed for not only
deep discharge cycles but high discharge rate or compromise of the two cycles
They have a lower self-discharge rate compared with the nickel batteries and they
also do not suffer from the memory effect (Mantell 1984 Berndt 2009) However
as the energy density of lead-acid battery is not high it is seldom applied in the
portable electronics Another important problem is that the lead-acid batteries
must be recycled as the active material ldquoleadrdquo is toxic to both the environment and
the human bodies (Bernardes Espinosa et al 2004)
The lithium-ion (Li-ion) batteries are almost the perfect cell chemistry and are
currently used a wide range of consumer electronics products including cameras
cell phones laptops etc They have many attractive performance advantages
which make them also ideal for higher power applications such as automotive and
standby power First of all the lithium-ion batteries have the highest energy
density in all the rechargeable battery now which is about 4 times better than
lead-acid (Jacobi 2009) They are also capable for deep discharge and high
discharge rate with a relatively slow self discharge There is no liquid electrolyte
in the lithium-ion batteries which means they are immune from leaking However
just opposite to the lead-acid batteries the most serious problem that discourages
the lithium-ion batteries is the low economic efficiency comparing with the lead-
acid batteries Other factors like the stability of the chemicals and the recycling of
lithium should also be concerned because of the chemical activeness of lithium
Table 1-1 is gives some basic properties of the four major rechargeable batteries
11
introduced above There are also some less common battery chemistries used by
rechargeable batteries in addition to these technologies including nickel-zinc
(NiZn) nickel-iron (NiFe) etc but they have a small market share For the four
major battery chemistries lead-acid batteries with their low price and high
flexibility is adopted in a wide range of application areas
Table 1-1 properties of the rechargeable batteries (Wikipedia nd)
Type Voltage
(V)
Energy Density (Whkg)
Power Density (Wkg)
Self Discharge
rate
Cycle Durability
Nickel-Cadmium
12 40-60 150 20 1500
Nickel-Metal-Hydride
12 30-80 250-1000
20 1000
Lead-Acid 21 30-40 180 3-4 500-800
Lithium-ion 36 160 1800 5-10 1000-1200
124 The Management of Batteries
In the areas that batteries are employed as the energy storage device it is a critical
issue to consider that whether there is enough energy in the battery to meet the
demand However batteries do have the problem in limited cycle durability that
is when a battery is charged and discharged for a number of cycles its total
capacity decreases If the battery cannot offer sufficient powerenergy it should be
replaced at the right time But the problem is that it is difficult to quantify the
capacity loss and when the capacity of battery is no longer sufficient for a
particular application Due to the limitation of batteries it is essential to develop a
method to determine the capacity of battery that subjected to various duty cycles
in a number of applications
12
13 Project Objectives
The main objective of the project is to develop a method which can determine the
key parameters of batteries from the discharge tests The proposed methodology is
a model based approach that is to develop a mathematical model of the battery
which can represent the dynamic performance and battery status and
characteristics can be investigated through the analysis of the model
The first step of the project is to build a mathematical model of battery The
dynamic model is expected to reflect the relevant behaviours of battery when
being discharged including the characteristics of State of Charge Depth of Charge
Electromotive force Terminal Voltage The unknown parameters in the model are
identified by using Genetic Algorithms (GAs) with the laboratory experimental
data Afterwards some batteries are tested in experiments and the parameters in
different state of health are recorded to analyze the battery in different status of
battery
The focus of this work is to develop a suitable method for parameter identification
for common battery systems The lead-acid battery has been chosen because it has
relatively well defined properties and there is a wealth of literature describing the
performance of these types of batteries From an experimental view point they are
also readily available of low cost
13
14 Outline of the thesis
The thesis is organized into seven chapters and the first chapter presents the
background and motivation of the research project The remaining chapters are
briefly described as follows
Chapter 2 gives an overview of lead-acid batteries including the development
working principle and also some modern battery designs and technologies In the
second part of chapter 2 important concepts for a battery including electromotive
force capacity state of charge internal resistance and state of health are
introduced and some mathematical descriptions of these concepts are discussed
Chapter 3 starts from some requirements of the mathematical model designed for
this project and several different methods of battery model approaches are
discussed Afterwards some details of the dynamic mathematical model are
analyzed The initial battery model is described in the last part of this chapter that
summarized the equations of the battery
Chapter 4 is mainly focused on some improvement of the mathematical model
described in chapter 3 In the first section of chapter 4 the experimental test rig in
the project is introduced Some findings in the experimental tests is then listed and
studied and integrated into the improved model Finally the SIMULINK
implementation and a simulation study are given
Chapter 5 presents a method of model parameter identification The principle of
14
Genetic Algorithms is studied at first Then this algorithm is employed in the
model and the parameters of the model are identified with the help of
experimental tests This chapter also includes the validation of battery model
using two other groups of test results
Chapter 6 develops an algorithm that can reflect the state of health of a lead-acid
battery In this chapter the internal resistance parameters are measured under
different state of health through a group of continuous experimental tests The
change of internal resistance under a specific working condition is then related to
the battery state of health
Finally Chapter 7 gives a summary and the conclusions of the project Also the
future works that can be improved are proposed in this chapter
15
Chapter 2
Introduction of Lead-acid
Batteries
This chapter gives an overview of lead-acid batteries including background
knowledge working principles explanation of terminologies technologies and
applications encountered for this technology The chapter presents the
fundamental knowledge and prepares for the project work to be reported in the
following chapters
21 A General Overview of the
Lead-acid Battery
The lead-acid battery is the oldest type of rechargeable battery The first example
of a lead-acid battery can be attributed to the German physicist Sinsteden who
published the performance data of this battery system in 1854 (Berndt 1993)
Later in 1859 the French physicist Planteacute realized that a plate construction was
required to achieve a much larger effective surface area and he produced the first
rechargeable battery which was marketed for commercial use by alternately
charging and discharging lead sheets immersed in sulphuric acid This method
has remained unchanged and still in use today in stationary applications (Berndt
16
1993 Wikipedia nd) One of the first applications of lead-acid batteries was for
storing electrical energy for telegraphy systems The capacity required for these
applications was low and the battery at that time was not yet suited to high power
industrial applications (TNI_Ltd 2007)
In 1880 a French chemical engineer Faureacute significantly improved the design of
the lead-acid battery by producing the active materials separately His method was
to coat the lead plate with a paste of lead oxides sulphuric acid and water in a
warm humid atmosphere The paste then changed into a mixture of lead sulphates
which adhered to the lead plate as an electrochemically active material As a result
of this technology the Faureacute cells are able to achieve much higher capacity with
the first charge in comparison with the Planteacute ones (Berndt 1993 TNI_Ltd 2007)
The problem of these plates is that they are not very durable and become weak
only after a few dischargecharge cycles The lead grid alloyed with antimony or
calcium was developed to improve the mechanical characteristics The holes on
the grid are able to achieve improved bonding thus the batteries may have a longer
lifetime This advantage led to the industrial manufacturing of lead-acid batteries
In 1881 a lead electrode with a ribbed surface was designed in order to have a
large effective surface of the active material and this was the pioneer of the large
surface plates which are still common today (Berndt 1993 TNI_Ltd 2007
Wikipedia nd)
In the beginning lead-acid batteries were operated in open jars The advantage of
this feature was that the electrode can be cleaned and exchanged easily but faced
the problem of water evaporation Therefore the early batteries have to refill water
17
in order to continue normal use However this problem can be dramatically
reduced when the cells were fitted with covers to limit the evaporation (Berndt
1993) This kind of battery design is known as a lsquoflooded lead-acid batteryrsquo
In the 1950s a new type of battery which was aimed to become spill-proof was
designed and manufactured on a large scale This type of battery is characterized
by an immobilized electrolyte however this kind of spill-proof battery was only
manufactured in small sizes up to about 10 Ah (Berndt 2001) Later the
combination of a valve improved the characteristic features of the lead-acid
battery and this kind of battery is still common today and is known as the Gel
Lead-acid battery (Berndt 1993) In the 1970s micron diameter glass fibres
originally designed for air filters were used in glass mats which absorbed the
electrolyte and acted as separator Soon this kind of Absorbent Glass Mat (AGM)
battery appeared in market for stationary application
Currently Valve Regulated Lead Acid (VRLA) batteries based on both AGM and
Gel electrolytes are available in a large range of capacities for both stationary and
mobile power applications with a range of different designs for each type of
application Arguably the most important application of lead-acid batteries is for
vehicle engine starting The battery employed in this application which is called
Starting Lighting and Ignition (SLI) batteries are designed to deliver bursts of
energy usually in a discharge current as large as several hundred amperes in a
very short time A different type of battery construction can produce batteries
capable of deep cycling which are more suited to slow discharge cycles (Tuck
1991 Anon 2007)
18
22 Configuration of Lead-acid Batteries
This section gives a brief description of the working principles of lead-acid
batteries and how the battery can be configured to suit different applications
221 Electrochemical Principles
The lead-acid battery comprises two electrodes and the electrolyte The structure
of the lead-acid battery is shown in Figure 2-1 in which one electrode is Cathode
and the other is Anode The active matter in the positive plate is made of lead
dioxide (PbO2) and that in the negative plate is made of lead (Pb) and the
electrolyte is sulphuric acid One electrode can serve either as a Cathode or as an
Anode depending on which process the battery is experiencing - charging or
discharging With this structure a battery could convert electrical energy into
chemical energy and back again which is associated with the process of charging
and discharging
(a) (b)
Figure 2-1 Working Principle of Lead-Acid Batteries (a) shows the battery when
19
discharging and (b) is when charging with a DC charger
For the discharging process as shown in Figure 2-1 (a) the negative plate acts as
the anode and the positive plate is the cathode If a wire is connected between the
two the excess electrons from the anode will travel through the wire as a current
to the cathode where they are needed to complete the electron deficient reaction
there The chemical reactions in a lead-acid battery when discharging are
described as follow
Negative plate reaction (Anode)
+minusminus+rarrminus+ HPbSO2eHSOPb 44
Positive Plate reaction (Cathode)
O2HPbSO2e3HHSOPbO 2442 +rarr+++minus+minus
For the charging process an external power source is connected to the two
electrodes with the voltage as shown in Figure 2-1(b) In this way the flow of
electrons is forced backwards against the electropotential and the reactions are
driven backwards changing the lead sulphate back into lead and lead dioxide on
the negative and the positive plates and restoring the sulphuric acid to the liquid
electrolyte The anode when a battery is charging is the positive plate and the
cathode is the negative plate and the chemical reactions in a lead-acid battery
when charging are described as
Positive plate reaction (Anode)
+minusminus++rarrminus+ 3HHSOPbO2eO2HPbSO 4224
Negative plate reaction (Cathode)
minusminus++rarr++ 44 HSOPb2eHPbSO
20
The thermodynamic heat effects caused by the reactions are small in the lead-acid
battery because the difference between the enthalpy and the free enthalpy is very
small The rate of reversible heat effect in the reaction is 132 kJ per mol of the
cell reaction which corresponds to about 35 of the total energy converted when
the lead-acid battery is discharging or charged This amount of energy is relatively
small and is generated over a comparatively long period of time so it is usually
easily dissipated through radiation and convection (Berndt 1993)
222 Lead-Acid Battery Types and Technologies
The flooded battery is the simplest type of lead-acid battery in use Flooded
batteries are common for some traction applications despite the requirement in
high maintenance They are also very common for large capacity backup power
supplies for telecommunication computer centres grid energy storage and off-
grid household electric power systems Since the flooded batteries are not sealed
they must be kept upright to avoid acid spills and water must be periodically
added to top up the liquid electrolyte The most attractive feature of the flooded
battery is that they are able to withstand certain level of overcharging without
damage providing proper maintenance is carried out
The Valve Regulated Lead-Acid (VRLA) battery which is often colloquially
called the sealed lead-acid battery is becoming more and more popular in many
applications Because VRLA batteries are mostly sealed the electrolyte
evaporation will be reduced and spillage can be largely avoided when
overcharging which are very common in flooded batteries The electrolyte of the
21
VRLA battery is designed to be immobilized so the VRLA batteries will not leak
if inverted pierced or if the container is broken They can be mounted in any
orientation and position even immersed in water The immobilization of the
VRLA electrolyte can be achieved by using an absorbent mat separator as well as
gelling materials
In Absorbent Glass Mat (AGM) battery the electrolyte is absorbed into a mat of
fine glass fibres in order to immobilize the electrolyte In addition the pores in the
mats are fine enough to prevent the lead dendrites in the cathode from growing
through as a separator and only glass is wetted enough by sulphuric acid can soak
the separators The glass mats can therefore be used to insulate the electrodes
Gelling is another way to immobilize the electrolyte and this gelling technology at
present is only applied for lead-acid batteries The idea is to mix the sulphuric acid
with silica fume (SO2) which makes the electrolyte gel-like The mixture is stable
over a long term environmental safe and easy to work technically (Berndt 1993)
The sulphuric acid bound by the gel can also insulate electrodes as a separator
similarly with that in an AGM battery
VRLA batteries including both gel and AGM batteries are able to recombine and
reduce the emission of gases during overcharge so the requirement for the room
ventilation is reduced and there is no acid fume emission during normal discharge
(Berndt 1993 Anon 2007 Wikipedia nd) Although the generation of hydrogen
can be slowed down it cannot be avoided completely As a result a valve
regulation safety system is employed in VRLA batteries which vents the gases in
22
the battery only during over pressure faults (Tuck 1991 Berndt 1993)
However the VRLA batteries do have some drawbacks First of all the VRLA
batteries tend to have a lower specific energy density than flooded batteries and
they are also more expensive An accurate charging control is very important for a
VRLA battery especially when charging under high temperature environments
since it is not possible to cure the damage caused by overcharge
223 Battery Designs for Different Applications
Lead-acid batteries are deployed in a range of applications Different designs are
therefore required due to the different working environments and duty cycles SLI
batteries are designed for a burst of energy for cold-cranking an engine A SLI
battery is supposed to provide power only in the first few seconds when starting
an engine and will be recharged immediately once the engine is started In this
kind of lead-acid batteries a larger surface area of the electrode plates is used to
provide high electric current in a short period However repeated deep discharge
may shorten the battery lifetime
On the other hand deep cycle batteries are designed for applications where the
batteries are regularly discharged The plates of the deep cycle batteries are often
very thick in order to withstand the frequent and deep discharge cycles The plate
surface area of a deep cycle battery is not as large as a SLI battery and as a result
it is not possible to offer great power
23
Marine batteries are a compromise between a SLI battery and a deep cycle battery
Standby batteries can be classified as marine batteries which are used for backup
power supplies and providing the power in emergency situations They are
designed for a long lifetime and a large capacity but repeated discharges and high
current drain are not the intended application Traction batteries are designed for
higher current drain and repeated deep discharge cycles They are usually bigger
and heavier than other types of lead acid for the same voltage and capacity but
that is the cost of durability
23 Mathematical Descriptions of Lead-acid
Batteries
In order to investigate the relationship between the battery behaviour and
remaining lifetime for a lead-acid battery initial studies have been carried out and
are described in this chapter Concepts including Capacity State of Charge (SOC)
Depth of Charge (DOC) State of Health (SOH) and internal resistance are
introduced and quantitative descriptions of these concepts are listed
231 Capacity
The capacity of a lead-acid battery represents how much charged energy the
battery can offer which is usually described in Ampere-hours (Ah) The charge
capacity of a battery is decided by the construction factors of a battery cell This
includes the materials contained in the electrodes and the acid solution In
addition the capacity of a battery is not a fixed quantity but varies according to
24
how quickly it is discharged This is known as Peukertrsquos law (Ceraolo 2000
Dhameja 2001 Rand Moseley et al 2004)
tICk
p = (21)
where pC is the capacity on one-ampere discharge rate which is a constant
I is the discharge current (A)
t is the time of discharge (h)
k is the Peukert constant and for a lead-acid battery with the value
between 11 and 13 (varies for each individual battery)
It is common to refer to ldquoCnrdquo as the capacity of battery in Amp-Hours which
corresponds to complete discharge of the battery in n hours ldquonrdquo is a subscript that
represents the discharge rate In industry the capacity under ten-hour discharge
rate (C10) is always taken as the nominal capacity
232 Electromotive force
The electromotive force of a battery cell is the difference between the electric
potential of the two electrodes of each cell (Rand Moseley et al 2004) The
potential of each electrode which is called half cell potential is decided by the
chemical reaction and the relative activities of the solution and can be obtained
from Nernstrsquos equation (Crompton 2000)
25
Ox
Redln0
α
α
zF
RTEE minus= (22)
where E is the half-cell potential (V)
0E is the standard half-cell potential (V)
α is the relative activity of the oxidizer (α Ox) and reducer (α Red)
z is the number of electrons transferred in the cell reaction
R is the universal gas constant which is 8314472 JKminus1molminus1
T is the absolute temperature
F is the Faraday constant the number of coulombs per mole of electrons
and F = 964853399times104 Cmolminus1
At room temperature RTF is a constant of 25693mV for cells therefore
Ox
Redlog
z
V05910
Ox
Redln
z
mV69325
Ox
Redln 10
α
α
α
α
α
α==
nF
RT
The Nernstrsquos Equation therefore can be expressed by
Ox
Redlog
V0591010
0
α
α
zEE minus= (23)
The electromotive force could be calculated by the difference of the electric
potential
cathodeanode EEEMF minus= (24)
When a lead-battery is discharging the electromotive force can be written as
26
O)(H
)(SO)(Hlog
V05910
2
2
24
10
00
α
ααminus+
+minus=z
EEEMF cathodeanode (25)
The standard half-cell potential of the anode 0
anodeE is equal to 1685 (PbO2-
PbSO4SO42-) and that of cathode
0
cathodeE is -0356 (Pb-PbSO4SO42-) which are
constants for the same battery chemistry And the number of electrons transferred
( n ) is 2 for a lead-acid battery
Therefore the electromotive force of a lead-acid cell can be obtained by
O)(H
)(SO)(HlogV029600412
O)(H
)(SO)(HlogV02960)3560(6851
2
2
24
10
2
2
24
10
α
αα
α
αα
minus+
minus+
+=
+minusminus=EMF
(26)
This electromotive force of a battery cell is numerically equal to the open circuit
voltage which means that the terminal voltage of a single cell battery when it is
disconnected from the external load For a lead-acid cell the electrochemical
force at fully charged is between 210-213V per cell
233 State of Charge and Depth of Charge
State of charge (SOC) and depth of charge (DOC) are variables that can describe
the battery charge The main difference is that the SOC describes the percentage
of remaining charge relative to the nominal capacity while the DOC represents
that relative to the actual capacity under a specific discharge current These two
27
variables can be obtained by calculating the charge consumed and the battery
capacity
101 CQSOC eminus= (27)
Ie CQDOC 1minus= (28)
where Qe is the charge consumed by the load (Ah)
C is the nominal capacity (Ah)
CI is the actual capacity under the discharge current I (Ah)
234 Internal Resistance and State of Health
The internal resistance of a lead acid cell is the physical resistance of the cell The
value of the internal resistance is decided by many different factors But it could
be obtained by a simple equation
I
VVr tOC minus
= (29)
where Voc is the open circuit voltage (V)
Vt is the terminal voltage when discharging (V)
I is the discharge current (A)
However the factors in this equation are only a method of calculating the internal
resistance but not the determinants It is shown in applications that the internal
resistance of a lead-acid battery will increase when discharging as the SOC and
28
the DOC drops
It is common for batteries to suffer a capacity loss when discharged and charged
in a number of duty cycles even when idle Aged batteries are often weak and
sometimes not able to offer enough charges Therefore they should be replaced or
maintained State of health is a defined variable that is important for a weak
battery This variable is to show how weak the battery is and represents the
percentage of remaining capacity to the initial capacity when the battery is brand
new (Okoshi Yamada et al 2006) as shown in the equation
new
weak
C
CSOH = (210)
where Cweak is the remaining capacity of a weak battery (Ah)
Cnew is the capacity when the battery is brand new (Ah)
The reason for the capacity loss is complex but is usually due to the sulphation
Sulphation is a process when the amorphous lead sulphate which is easily
converted back to lead lead oxide and sulphuric acid converts to a stable
crystalline form coating the electrodes This form of lead sulphate cannot conduct
electricity and cannot be converted back to lead lead dioxide and lead sulphate
under normal charging conditions The internal resistance of a lead-acid battery
therefore increases and less charge can be provided when discharging Complete
or repeated deep discharges of a battery at low current densities that lead
excessive utilization of the active material are the most critical reason for
29
capacity loss for example a discharge of a traction battery that draws more than
80 of its nominal capacity (Berndt 1993)
235 Multi-Cell Lead-Acid Batteries
In most applications of batteries the voltage of an individual cell is not enough to
provide the sufficient voltage and power supply The solution is usually to series
connect a number of cells in a battery in order to achieve a higher battery voltage
The electromotive force of a series of lead-acid battery cells is directly related to
the cell numbers as well as the charge state of each cell For a six-cell lead-acid
battery which is a standard for most common usages the fully charged
electromotive force is about 128V The internal resistance of a multi cell battery
however is also equal to the sum of the internal resistances of each cell
Usually all the cells in a multi-cell battery should be constructed in the same
manner and in particular the capacity should be consistent because the capacity of
a multi-cell battery will be limited to the cell with the lowest capacity If one of
the cells fails it is not possible for the current to flow through the cell and the
battery is therefore disconnected from its internal cell loss Also if the SOC of one
particular cell drops faster than others in a battery the electromotive force of that
cell may affect the whole behaviour of the battery
24 Summary
The technology development of lead-acid batteries has been continuous over the
30
last 150 years From the earliest open cell batteries different advanced battery
configurations are now available which have been adopted in a wide range of
applications Meanwhile a number of solutions have been developed to address
the battery problems encountered in applications such as electrolyte evaporation
spillage and the electrolysis of electrolyte when charging However there are still
issues affecting the efficient and safe use of lead-acid batteries for example
determination of the SOH which if addressed in a robust manner would lead to
significant improved battery management system performance This chapter has
presented the essential fundamental knowledge technology terms and working
principles of lead-acid batteries which is served as a preparation for further study
reported in the following chapters of the thesis
In order to reveal the dynamic behaviour of a battery under different SOH and
identify the suitable strategy for SOH determination the mathematical modelling
study is carried out and an equivalent circuit model is derived in the next chapter
The key concepts of the battery model are explained and the fundamental analysis
is given for the concepts introduced
31
Chapter 3
Equivalent Circuit Modelling
of Lead-acid Batteries
In order to estimate the status of a battery a model based approach is adopted in
the project A mathematical model for lead-acid batteries should be developed
with a suitable level of abstraction This chapter describes the requirements to the
model to serve the project objectives and reviews the available model
technologies An improved mathematical model for lead-acid batteries is
introduced in the late part of this chapter
31 Requirements for the Battery Model
The main objective of the project is to develop an algorithm that can determine
the battery health by monitoring the battery status during discharge cycles This
algorithm is designed for implementation in a battery health monitoring system
with life-time prediction capabilities This prediction system is intended to work
on applications where the battery performance is of great importance for instance
hospital UPS systems and vehicle ignition systems To achieve the objective the
requirements to the mathematical model can be defined as
Requirement 1 The model should be able to calculate the evolution of key
battery parameters including terminal voltage cell temperature the state of health
32
and the internal resistance which describe the condition of the battery for
dynamical discharging It should also be able to adequately represent dynamic
processes while the battery is discharging
Requirement 2 The complexity of the model must be sufficient to satisfy the
requirement 1 but must also be executable in real-time for a model-based
condition monitoring system
Requirement 3 The output of the battery model should be understandable to the
battery operators and technicians as well as meaningful to those who do not have
any background in battery technologies
32 Overview of Battery Model Techniques
A number of different types of battery models have been used to serve as a tool in
solving a range of problems (GONG 2005) These include Electrochemical
Models Computational Fluid Dynamics Models Finite Element Models and
Equivalent Circuit Models This section gives an overview to the above named
four different types of battery models and the problems which are addressed by
each of them In Section 324 every battery model technology is assessed against
the overall requirements
321 Electrochemical Model
Electrochemistry is a branch of chemistry that studies chemical reactions which
33
take place in a solution at the interface of an electron conductor (a metal or a
semiconductor) and an ionic conductor (the electrolyte) The reactions involve
electrons transfering between the electrode and the electrolyte or species in
solution The application of electrochemistry research directly leads to the
development of the lead-acid batteries
Behaviour of a battery depends not only on how the battery is used but also on a
number of construction factors (Ruetschi 2004) These factors include but are not
limited to the thickness of the plates the active mass density of the active
material the concentration of the acid solution and the geometry of the electrodes
(Berndt 2001 Ruetschi 2004)
The electrochemical model is mainly focused on the oxidationreduction reactions
between the electrolytes and the electrodes By analyzing the consistency of each
matter in the solution and the electrochemical reaction caused by the connection
of electrodes to external circuit it is possible to represent the dynamic behaviour
of the battery (Crompton 2000)
322 Physical Models
The finite element method is a numerical analysis technique for finding
approximate solutions of partial differential equations as well as of integral
equations The basic principle of the Finite Element Model (FEM) is to divide the
problem into elements and each element is a smaller problem to be solved so that
they could be analyzed separately The lsquoelementsrsquo are then be assembled together
34
to restore the initial problem
Finite element is a very popular method of analysis in those areas with a complex
geometry and it is good at stress and thermal analysis For batteries the Finite
Element Models can help with a good understanding of the heat loss and that for
vibration problem in mobile applications There are also attempts to analyze the
current density on the positive grid bar in a lead-acid battery using FEM (Ball
Evans et al 2002)
Computational Fluid Dynamics (CFD) technology is a well-established tool for
physical analysis and optimization of fluid flow mass and heat transfer and
related phenomena (eg chemical reactions) that may simultaneously take place in
a complex system (Liaw Gu et al 1997) Computers are used to perform millions
of calculations required to simulate the interactions of fluids and gases with the
complex surfaces used in engineering
In a CFD Model of a battery the dynamic governing equations are solved with
respect to time space and all the physical time and space dependent properties
Acid concentration and potential distribution across the cell for instance can be
obtained Therefore such a modelling is able to give a very good understanding to
battery parameters and detailed characteristic of battery dynamics
323 Equivalent Circuit Model
An equivalent circuit refers to the simplest form of a circuit that retains all of the
35
electrical characteristics of the original (and more complex) circuit In its most
common form an equivalent circuit is made up of linear passive elements
However more complex equivalent circuits are used to approximate nonlinear
behaviours of the original circuit as well
In electrical engineering it is often useful to use an equivalent circuit model to
describe the non-ideal operation of a device For electrical engineers electrical
models are intuitive useful and easy to handle especially when they can be used
in circuit simulators and alongside application circuits
324 Discussion of Different Battery Model Methods
The electrochemical model focuses on the electrochemical reactions and the
activities in the battery which is very popular in the applications for the
constructional and design purpose However many electrochemical factors
contained in the electrochemical model are irrelevant to the external circuit and
some of the important parameters like the internal resistance are hard to describe
in an electrochemical model Therefore this model technology is not able to meet
the project Requirement 1 As the calculations in the electrochemical model are
not complicated Requirement 2 can be therefore satisfied by an electrochemical
model of battery Requirement 3 might be difficult to obtain for an
electrochemical model because the understanding of the outputs for an
electrochemical model usually need some background knowledge of the battery
chemistry As a result the electrochemical model is not chosen for the project
36
Physical models can give good understanding to the battery important parameters
so that Requirement 1 of the project can be satisfied The Requirement 3 can be
also met as the terminal voltage can be calculated as the output with the
knowledge of these parameters One significant disadvantage is that the physical
models involves huge amount of calculation in analysis which is quite time
consuming In finite element or CFD methods a large nonlinear system of
equations is solved iteratively and that could take excessive CPU time especially
for when the system is more than 2 dimensions As a result the physical
modelling methods cannot meet the Requirement 2 of fast response required by
the project (Esfahanian Torabi et al 2008)
In an equivalent circuit model most of the characteristic required by the project
can be reached in a reasonable level It is able to reflect the dynamic behaviour of
battery using simple circuit blocks such as voltage sources resistors and
capacitors (Chen and Rincacuteon-Mora 2006) That is to say the Requirement 1 of
the project can be satisfied by the equivalent circuit model And the model
simplicity causes its low computational time as Requirement 2 and therefore it
can be suited to the online implementation (Esfahanian Torabi et al 2008)
Additionally basic battery parameters like internal resistance terminal voltage
and SOC etc can be chosen as the main output of the model to meet the
Requirement 3
Table 3-1 summarized a comparison of all the three model methods on the
satisfaction of the requirements for the project
37
Table 3-1 Satisfaction of the Requirements in different Model Methods
Requirement 1 Requirement 2 Requirement 3
Electrochemical Model times radic times
Physical Model radic times radic
Equivalent Circuit Model radic radic radic
33 Introduction of the Existing Equivalent
Circuit Models
Section 32 introduced three different types of battery models to serve for different
research purposes each with different features and strengths It has been shown
that the equivalent circuit model that pays attention to the relationship between the
internal circuit and the external characteristics can adequately meet all the
requirements of the project Therefore further studies of battery models have been
carried out and six equivalent circuit battery models with different merits and
complexity are presented while the technique improvements are briefly described
in this section
331 Simple Battery Model
The Simple Battery Model is the simplest battery model As shown in Figure 3-1
this model consists of only ideal battery mE as the electromotive force of a battery
and a resistor r in series connection as the internal resistance bV in the figure is
the terminal voltage of the battery
38
Figure 3-1 Simple Battery Model
The Em in Figure 3-1 stands for the electromotive force of the battery while r
represents the internal resistance and Vb is the Terminal Voltage This model is
only applicable in some circuits where the state of charge is of little importance
because it does not consider the varying characteristic of the internal resistance in
different states of charge The model is often used in circuits where the battery
does not have major influences to the circuit analysis But without being able to
describe the battery behaviours in details this model is not suitable for the
research purpose In the Simple Battery Model the electromotive force mE can be
obtained by open circuit measurement and r can be calculated by measurement
with connecting a load to the battery after taking an open circuit measurement
For a battery with a terminal voltage of 13V and the internal resistance of 05Ω
the change of terminal voltage in a Simple Battery Model as the discharge current
increases can be given as Figure 3-2
39
Terminal
Voltage
Discharge
Current
0
10V
13V
Figure 3-2 I-V chart of the Simple Battery Model
332 Advanced Simple Battery Model
This model is developed based on the Simple Battery Model and has the same
block diagram as the Simple Battery Model The only difference is that this model
employs a variable resistor which depends on the state of charge (CUN
FIORINA et al Durr Cruden et al 2006) The relationship between the value of
the variable resistance and the state of charge is as follow
aSOC
Rr 0
= (31)
where 0R is the resistance of the battery when it is fully charged
a is the capacity coefficient
SOC is the state of charge of battery from 0 (completely discharged) to 1
(fully charged)
6A
40
The most important improvement of this model is that instead of a constant
internal resistor the value of the internal resistance is expressed as equation
function of SOC For the same battery described in section 331 the I-V chart in
different SOCs can be concluded as shown in Figure 3-3
Terminal
Voltage
Discharge
Current
0
10V
13V
SOC=1
SOC=60
Figure 3-3 I-V Chart in different SOC
333 Thevenin Battery Model
The previous models do not account for any transient behaviour of batteries
Figure 3-4 shows the gradual change in battery characteristics when external loads
are connected or disconnected to the battery
6A
41
011
14
125
Terminal
Voltage
t
Figure 3-4 Sketch to show battery discharge behaviours in typical tests
Thevenin Battery Model is one commonly used model which consists of an ideal
battery electromotive force ( mE ) internal resistance (0R ) overvoltage resistance
(1R ) and capacitance (
1C ) and the equivalent circuit is shown in Figure 3-5
(Casacca and Salameh 1992 Salameh Casacca et al 1992 Chan and Sutanto
2000) 1C represents the actual capacitance of battery and
1R represents the
resistance contributed by the contact resistance of the plate and the electrolyte
(Durr Cruden et al 2006) The capacitance in the Thevenin Battery Model can
overcome the trend of terminal voltage shown in Figure 3-4
No load No load Load
42
Figure 3-5 Thevenin Battery Model
The main disadvantage of this Thevenin Battery Model is that all the parameter
values are assumed to be constant but in fact they are strongly dependent on the
state of charge and discharge rate and some other discharge characteristics
334 Dynamic Battery Model
This model is developed based on the Thevenin Battery Model Similar to the
improvements made by the Advanced Simple Model comparing with the Simple
Battery Model the most important difference is that it takes into account the non-
linear characteristic of the open circuit voltage and internal resistance represented
by SOCK (Jayne and Morgan 1986 Sims 1990)
ISOC
KRVV bocb )( +minus= (32)
where bV is the terminal voltage of battery
ocV is the open circuit voltage
bR is the battery terminal resistor typically 01Ω
43
K is the polarization constant
I is the discharge current
335 Fourth Order Dynamic Model
This is a more accurate and sophisticated model The current pI flows through
pR (electrolyte reaction) dR (Ohmic effect) and its associated leakage
capacitance dC and wR (waste of energy) and its associated leakage
capacitance wC Current sI flowing through the resistor sR represents the
behaviour of self discharge (Gillioli and Cerolo 1990 Chan and Sutanto 2000)
The main drawback of this model just as its name indicates is that there are
fourth order equations due to consideration of the paralleled R-C blocks in the
circuit and therefore it takes more time for the computation Another drawback is
that a number of empirical parameters are contained in the model
Figure 3-6 Fourth-order Battery Model
44
336 Improved Battery Model
The most popular Equivalent Circuit Model used by researchers is the Improved
Battery Model (Casacca and Salameh 1992 Salameh Casacca et al 1992) This
model is simple but meets most requirements for a good battery model It contains
most non-linear characteristics and is linked to the state of charge Most elements
included in this model are the functions of the state of charge or the open circuit
voltage which is also related to the state of charge The improved model is
studied in this chapter and implemented in MatlabSIMULINK environment
Figure 3-7 Improved Battery Model
34 Mathematical Model of the Lead-acid
Batteries
As the Improved Battery Model is able to reflect the major dynamic behaviours of
a battery and does not take much computation time it meets the requirements for
45
the project Therefore the mathematical model developed in this project is based
on the Improved Battery Model by involving the components of variable voltage
sources as the electromotive force ( EMF equal to the open circuit voltage OCV )
variable resistors as internal resistance and overvoltage resistance and a capacitor
as the capacitance of battery The description and the detailed analysis of the
model are given in this section
341 Capacity
Based on the Peukertrsquos law introduced in Chapter 2 the relationship of capacity
with different discharge currents is obtained below
2121
2211
)( ttII
tItIC
k
kk
p
=
== (33)
And following the definition of battery capacity the capacity is
12
1
2111
1
21121121121222 )()())(()( I
kkkk
I CIItIIItIIIIItIIItICminusminus
=====
12
1
21 )( I
k
I CIICminus
=there4 (34)
where Cp is the one ampere capacity
CI2 CI1 is the capacity under the discharge current I2 I1
k is a constant that related to the battery
The equation of calculating the capacity by the discharging current can be
46
obtained through experiments (Ceraolo 2000 Barsali and Ceraolo 2002) An
experimental result is given as
m
c
c
IIK
CKIC
))(1(1)( 0
0minus+
= (35)
where )(00 ICC = which stands for the capacity when discharging at the rated
discharge rate usually the nominal capacity C10
cK is empirical coefficient and is 118 for lead-acid batteries
m is empirical coefficient of 120
This equation overcomes the inadequacies of the Peukertrsquos law The capacity
calculated by the Peukertrsquos law in a low discharge current is much larger than that
experimentally obtained (Ceraolo 2000)
With the parameters of 20118124420 ==== kKAIAhC c the simulation
study indicated that the capacities of low discharge rate (lt30A) in different
equations are quite similar as shown in Figure 3-8
47
0 5 10 15 20 25 30 35 40 45 500
10
20
30
40
50
60
70
80
Discharge Current (A)
Actu
al C
apacity (
Ah)
Based on Peukerts law
Based on the Equation 35
Based on the Equation 35
Based on thePeukerts Law
Figure 3-8 Battery Capacity vs Discharge Current
Variations of the cell temperature also affect the battery capacity The effect of
temperature on the battery capacity is described by the following equation
(Ceraolo 2000 Barsali and Ceraolo 2002)
ε
θ
θθ
minus+=
f
ICIC 1)()( 0 (36)
where fθ is the electrolyte freezing temperature and is equal to -40˚C
θ is the cell temperature
)(0 IC is the capacity of battery under the discharge current I at 0˚C
ε is a constant that equals to 129
48
Therefore
m
c
f
c
IIK
CK
IC))(1(1
1
)(
0
minus+
+
=
ε
θ
θ
θ (37)
342 Electric Networks
Figure 3-9 (Ceraolo 2000 Barsali and Ceraolo 2002) shows an adaptation of
electric network based on the improved battery model shown in Figure 3-7 The
major change of this equivalent circuit is that the self-discharge is not taken into
account because the self discharge is usually less than 10 per month in modern
technologies which can be ignored in normal applications
Figure 3-9 Lead-acid Battery Equivalent Network
In the figure mE in this the main branch represents the electromotive force of the
battery and Vb stands for the terminal voltage The mZ in the figure stands for the
internal impedance that can be approximated by two R-C blocks
49
Battery is an energy storage device but not all the energy that the battery gets
from the charger can be stored when a battery is charged Part of this energy is
lost for different reasons like water electrolysis A parasitic branch is therefore
added to the model to represent the energy loss This part is claimed to work only
when the battery is being charged (Ceraolo 2000 Barsali and Ceraolo 2002) In
this project the current of the parasitic branch pI in the figure can be described as
an equation of the voltage of the parasitic branch PNV instead of a simple resistor
pR because of the nonlinear character of the parasitic branch This issue will be
discussed in later sections
As a result of these factors an equivalent electric network of in Figure 3-9 is
designed as shown in Figure 3-10 in which 1C 1R and 0R are the elements of the
internal impedance mZ It is used in the whole project as the electric network of
mathematical model
Figure 3-10 The Equivalent Network with the Approximated mZ
50
343 State of Charge and Depth of Discharge
In Chapter 2 Equations 27 and 28 show the definitions of SOC and DOC of a
battery In the model the nominal capacity can be treated as C(0θ) while the
actual capacity is C(Iavg θ) therefore
)0(1 θCQSOC eminus= (38)
)(1 θavge ICQDOC minus= (39)
where σσ dItQt
e int=0
)()( is the charge already drained from the battery
)0( θC is the nominal capacity of battery
)( θavgIC stands for the actual capacity under the specific discharge
current
344 Electromotive Force of the Battery
The electromotive force of a battery which is Em in Figure 3-10 is the difference
between the electric potential of the two electrodes and can be calculated by the
Nernstrsquos equation (Eq 26)
)(
)()(log029600412
2
2
24
10OH
SOHEMF
α
ααminus+
+=
This equation gives a description of the electromotive force by the activity of
different matter in the sulphuric acid which is described as lsquoαrsquo When the battery
51
is being charged or discharged the electrolyte concentration changes and the
activity value of H+ SO42- and H2O in the Nernstrsquos equation changes which can
be found by the study of battery that is the EMF of battery will change as the
result of the change of state of charge The relationship between SOC and the
activity α is unknown but it is obviously that when the state of charge increases
the quotient of )(
)()(
2
2
24
OH
SOH
α
ααminus+
also increases This shows that the EMF rises
when the state of charge is increasing
From the literatures (Ceraolo 2000 Barsali and Ceraolo 2002) the electromotive
force is described simply as the following equation
)1)(273(0 SOCKEE Emm minusminusminusminus++++minusminusminusminus==== θ (310)
where 0mE and EK are constants for a battery
θ is the temperature of the cell
SOC is the state of charge of the battery
345 Internal Resistance of a Battery
The resistances of a battery as shown in Figure 3-10 can be calculated by the
equations (Ceraolo 2000 Barsali and Ceraolo 2002)
)]1(1[ 0000 SOCARR minus+= (311)
)ln(101 DOCRR minus= (312)
52
)exp(1 22
)]1([
202
21
IIA
eRR
m
SOCA
+=
minus
(313)
where 0A 21A and 22A are constants for a battery while 00R 10R 20R are
parameters related to the SOH which will be discussed in later chapters For the
model 020 asympR and can be omitted when a battery is discharging
Therefore the internal resistance of a cell when discharging is
)ln()]1(1[ 1000010 DOCRSOCARRRr minusminus+=+= (314)
346 The Behaviour of Parasitic Branch
When the battery is being charged there are some losses as represented by the
parasitic current This current depends on the electrolyte temperature and the
voltage at the parasitic branch (Ceraolo 2000)
Because the behaviour of parasitic branch is non-linear Tafel gassing-current
relationship is used instead of a simple resistance pR (Ceraolo 2000)
minus+= )1(exp
0
0
f
p
P
PNPPNp A
V
VGVI
θ
θ (315)
where pI is the current of the parasitic branch
PNV is the voltage of the parasitic branch
53
0PG is a constant in seconds
0PV is a constant in volt
pA is a constant
θ is the electrolyte temperature
fθ is the electrolyte freezing temperature and is equal to -40˚C
When the battery is being discharged 0asymppI the parasitic branch could be
omitted from the model in simulation if the charging behaviour is not necessary
to discuss
347 Main Branch Capacitance
In the electric network of the model there is an R-C circuit as shown in Figure
3-11
Figure 3-11 R-C block
where Im is the discharge current
IC1 is the current flow through the capacity branch
54
I1 is the current of R1
VR1 is the voltage over the R-C block
This branch can be solved by
))(
()( 11111111
dt
tdVCIRIIRIRV R
mCmR minusminusminusminus====minusminusminusminus====sdotsdotsdotsdot==== (316)
)()()(
111
11 tIRtVdt
tdVCR mR
R====++++ (317)
This is the differential equation that represents the main branch behaviour
Laplace transform is employed to solve this problem
)()( 1111 sIRsVSCR mR sdotsdotsdotsdot====sdotsdotsdotsdotsdotsdotsdotsdotsdotsdotsdotsdot (318)
1
)(
11
11
++++
sdotsdotsdotsdot====
SCR
sIRV m
R (319)
++++
====++++
========
SCR
C
SCR
R
I
VsG R
11
1
11
11
1
1
1)( (320)
where τ=11CR is the time constant that represents the double layer capacitance
When the current has a shape like a step and the initial voltage of the capacitor is
equal zero the solution in time becomes
m
t
R IeRtV )1()( 11τ
minus
minus= (321)
55
It is obviously that this equation is the typical form of the voltage with an R-C
circuit
348 Thermal Behaviour of a Battery
When the battery is charging or discharging there is a current flow through the
battery so that it produces heat due to the Joules law
0
2
1
2
12 RIRVIVVIP RPNps sdot++sdot+sdot= (322)
When discharging the parasitic branch and R2 are omitted the equation becomes
0
2
1
2
1 RIRVP Rs sdot+= (323)
The dynamic equation of cell temperature and the power is (Ceraolo 2000)
s
a PRdt
dC +
minus=
θ
θ
θθθ (324)
where θC is the thermal capacitance
θR is the thermal resistance between the battery and the environment
θ is the cell temperature and aθ is the environment temperature
56
35 Mathematical Model of the Lead-acid
Batteries
Considering the behaviour of capacity state of charge and depth of discharge
electromotive force and internal resistance an Improved Battery Model based on
the equivalent circuit shown in Figure 3-10 was introduced in previous sections
The battery model for the complete discharging progress can be derived as the
following equations
m
c
f
c
IIK
CK
IC))(1(1
)1(
)(
0
minus+
+
=
ε
θ
θ
θ (325)
σσ dItQt
e int=0
)()( (326)
)0(1 θCQSOC eminusminusminusminus==== (327)
)(1 θavge ICQDOC minusminusminusminus==== (328)
)1)(273(0 SOCKEE Emm minus+minus= θ (329)
)]1(1[ 0000 SOCARR minus+= (330)
)ln(101 DOCRR minus= (331)
1
1R
Cτ
= (332)
IeRtV
t
R sdotminussdot=minus
)1()( 11τ (333)
0
2
1
2
1 RIRVP Rs sdot+= (334)
57
sa P
Rdt
dC +
minus=
θ
θ
θθθ
(335)
)( θIC in the equations is the expression of capacity of battery when discharging
under the discharge current I and at a temperature of θ 0C stands for the
capacitance when discharging at the rated discharge current I while parameters
fθ and ε are constants in this model )(tQe represents the charge already
consumed while the equation of mE indicates the mathematical description of
electromotive force corresponding to the SOC and the cell temperature in which
0mE EK are constants for a battery 00R 10R are parameters related to the SOH
and the discharge current can also affect them τ in the equations are the time
constant of the R-C circuit which represents the time it takes the systems step
response to reach ( 6311 asympminus e ) of its asymptotic value The last two equations
represent the thermal dynamic of battery in which sP is the Joule heat generated
by the internal resistance θC is the thermal capacitance and θR is the thermal
resistance between the battery and the environment
36 Summary and Discussion
The Improved Battery Model based on the electric equivalent circuit is presented
in this chapter and it is proved that it can satisfy all the three requirements to serve
the project objectives This battery model consists of a variable voltage source
several R-C blocks and a parasitic branch as its electric network and the elements
are described as a variable related to the capacitance the charge consumption and
58
the cell temperature as well
However experimental tests show that the behaviour of the battery is much more
complicated can be represented by this equivalent circuit model For example the
internal resistance varies when discharging under different current and the time
constant of the R-C circuit at the beginning and end of discharge as well
Therefore the model has to be improved The next chapter overcomes these
problems found in the experimental tests and some improvements of the model
are described
59
Chapter 4
Experimental System Set up and
Improved Battery Model
Simulation Implementation
Experimental tests based on a 12V-13 Ah lead-acid battery are carried out and the
test system is introduced at the beginning of this chapter Some of the
characteristics of the battery can be found in the tests which has shown that the
battery model described previously is not accurate enough and improvements
have to be implemented into the model This chapter will focus on the analysis of
the battery characteristics and the description of the improvements implemented
In the last part of this chapter a finalised version of the battery model used in this
project is given and implemented in the MatlabSIMULINK environment for
simulation study
41 The Experimental System
In this experimental test system a variable resistor is used as the load of the
battery Three sensors are employed in the whole experiment process two current
sensors and one voltage sensor The equivalent circuit of the test rig designed for
the research purpose is shown in Figure 4-1
60
Figure 4-1 Equivalent Circuit of the Experimental Test Rig
In this figure the ideal voltage source EMF accompanying with the internal
resistance r acts as a lead-acid battery with 6 cells (12V) the terminals of the
battery are connected in parallel to a voltage sensor Switch Krsquo is employed to
control the voltage sensor connection so that the sensor can be disconnected from
the battery when the experiment is not being in progress to avoid an unnecessary
discharge The circuit break in Figure 4-1 can be used as a main controller which
decides whether the load is engaged to the battery to discharge or not Switch K
in the experiment is to vary the load of the system This experimental test system
is mainly designed for two different experimental tests of a battery in this study
constant-impedance load discharge and two-load discharge Figure 4-2 shows the
actual laboratory test rig used in the project
61
Figure 4-2 Experimental Test Rig
The data is collected and recorded every half second by a data acquisition card
PCI-6251 from National Instruments with the software environment of LabVIEW
and a 12V-13Ah lead-acid battery (marked in the red-dashed square in Figure 4-2)
is employed in the project as test batteries for the battery performance study
42 Improvements of the Battery Model
Figure 4-3 and Figure 4-4 show the typical data collected from the experimental
test rig Figure 4-3 is the result of a constant-impedance load discharge test with a
discharge current of 075A approximately and Figure 4-4 shows two-load
discharge with the discharge currents of 075A and 12A respectively
62
0 500 1000 1500 2000 2500 3000 3500 4000 4500 5000-02
0
02
04
06
08
1
12
Time (s)
Dis
charg
e C
urr
ent
(A)
0 500 1000 1500 2000 2500 3000 3500 4000 4500 5000105
11
115
12
125
13
Time (s)
Term
inal V
oltage (
V)
Figure 4-3 Test of constant-impedance load discharge top figure shows the discharge current of the experimental test and the bottom one shows the terminal
voltage 1τ is the time parameter of the R-C block at the beginning of the
discharge and 2τ is that when the discharge stopped
0 200 400 600 800 1000 1200 1400
0
05
1
15
Time (s)
Dis
charg
e C
urr
ent
(A)
0 200 400 600 800 1000 1200 1400118
12
122
124
126
128
Time (s)
Term
inal V
oltage (
V)
Figure 4-4 Test of two-load discharge top figure shows the discharge current of the experimental test and the bottom one shows the terminal voltage
I(t)RI1 and I(t)RI2 represent the voltage drop across the internal resistance value under different discharge current
1τ 2τ
I(t)RI1
I(t)RI2
I(t)RI1
63
421 The Change of τ in Different Charge Status
From analyzing these figures it is easy to find that it takes quite a long time for
the battery to have the steady terminal voltage when the discharge of battery stops
and it is longer than the time taken from the beginning of the discharge This
difference means that when the battery starts to discharge the time parameter
11CR=τ in the main branch equation (332) is not equal to that when the
discharge has just stopped In Figure 4-3 it is shown that when the discharge stops
the time parameterτ is longer than that when the discharge starts
As a result of this experimental feature a switch is employed to implement the
change of time parameter to match those described in the mathematical model of
the battery The switch is used to control the value of the time parameter τ in
different discharge currents When the battery is discharging the discharge current
is a positive value and the time parameter τ is equal to 1τ When the battery is
not discharging the discharge current is equal to 0 in theory and the time
parameter has a different value 2τ
Although the discharge current should be equal to 0 theoretically it is hard to
achieve this in the real experimental measurement because of the inaccuracy of
the current sensor reading due to the inaccuracy occurred in the power supply to
the sensor Therefore the trigger of the switch in the model is set to be 01 A that
is when the discharge current is greater than 01 A the time parameter is set to be
1τ as the battery is in its discharging segment By contrast the value of time
64
parameter is set to be 2τ and the discharge current is considered as the error
caused by the sensors when that current is less than 01 A
422 Analysis in Variations of the Internal Resistance
Another important issue found through analyzing the experimental test result is
that the internal resistance for a specific battery in a specific state of health (SOH)
is not a constant when the discharging current changes This difference is more
significant than the effect caused by the state of charge
For example in the two-load discharge results shown in Figure 4-4 when the
battery is not discharging the initial voltage is equal to the electromotive force
(EMF1) When the battery began to discharge at the discharge current I1 the
terminal voltage dropped to V1 After the discharge stopped for a while the value
of the terminal voltage is equal to the electromotive force (EMF2) at that state of
charge (SOC2) Then the discharge of the battery starts again at a current of I2 and
the terminal voltage dropped to V2 The discharge progress is then stopped for
certain of a time period to get the steady terminal voltage (EMF3) at that state of
charge (SOC3) After that the test of discharge at the I3 = I1 was repeated again
and get another terminal voltage of V3 The last discharge test is done to provide
the evidence for the fact that this change in the internal resistance is not caused by
the change of the state of charge (SOC)
The value of electromotive force in a discharging battery is equal to the sum of the
terminal voltage and the voltage that the internal resistance takes that is
65
nnnn IrVEMF sdot+=
Therefore the internal resistance can be calculated by
n
nnn
I
VEMFr
minus= (41)
From the data collected in the experiment the key parameter values for the graphs
shown in Figure 4-4 can be found as listed in Table 4-1
Table 4-1 Approximate Internal Resistance Calculating
n 1 2 3
Electromotive Force (EMFn) 1260V 1252V 1238V
Discharge Current (In) 078A 114A 076A
Terminal Voltage (Vn) 1219V 1203V 1197V
Substituting these values into Equation 41 the internal resistance can be
calculated Ω=Ω=Ω= 539043005260 321 rrr
This change of the internal resistance can cause quite a significant effect in the
discharge progress This problem can be possibly solved in a number of ways
One possible choice is to find a curve of the internal resistance change and the
discharge current for a specific battery after a certain numbers of experimental
tests But this method needs huge efforts in conducting experimental tests and the
result is not very meaningful for the project considering the time cost Another
possibility is to conduct the experimental tests with a constant load Therefore the
change of internal resistance caused by the change of discharge current could be
ignored As a result in the whole process of this project the same load is
66
employed either in the constant-impedance load discharge or in the two-load
discharge tests
In order to implement the different internal resistance value when discharging
under different load a switch that can control the parameters R00 and R10 is
employed This switch is controlled by the discharge current which is the main
input of the mathematical model In the two-load discharge tests when the switch
K in Figure 4-1 is switched off there is only one load is connected to the battery
terminals and the discharge current is lower the values of R00 and R10 are
switched to the first set of parameters R001 and R101 To the contrast when K is
switched on the discharge current is higher and the values are switched to the
second set R002 and R102
423 Improved Lead-Acid Battery Mathematical Model
From the model described in Chapter 3 and the improvements studied in this
chapter the mathematical model of lead-acid battery when discharging in different
discharge currents can be described as the following equations
m
c
f
c
IIK
CK
IC))(1(1
)1(
)(
0
minus+
+
=
ε
θ
θ
θ (42)
ττ dItQt
e int=0
)()( (43)
)0(1 θCQSOC eminusminusminusminus==== (44)
)(1 θavge ICQDOC minusminusminusminus==== (45)
67
)1)(273(0 SOCKEE Emm minusminusminusminus++++minusminusminusminus==== θ (46)
)]1(1[ 0000 SOCARR minusminusminusminus++++==== (47)
)ln(101 DOCRR minusminusminusminus==== (48)
11
RC
τ= (49)
IeRtV
t
R sdotminussdot=minus
)1()( 11τ (410)
RIRVP Rs sdot+=2
12
1 (411)
sa P
Rdt
dC +
minus=
θ
θ
θθθ
(412)
)(
)(
2
1
002
001
00Load
Load
R
RR
= (413)
)(
)(
2
1
102
101
10Load
Load
R
RR
= (414)
)10(
)10(
2
1
AI
AI
lt
gt
=τ
ττ (415)
001R 002R 101R 202R and 1τ 2τ in the equations stand for different parameter
values of 10R 20R and τ when the load and charge status changes in order to
reflect the improvements described in this chapter For a two-load discharge test
there are ten important unknown parameters in the equations of the mathematical
model which are unknown for a specific battery 0C 0mE EK 001R 002R 101R
102R 1τ 2τ and 0A As the internal resistance R00 and R10 vary only when the
load changes they can be treated as constants in the constant-impedance load
68
discharge tests the key parameters are therefore 21100000 ττRRKEC Em
and 0A In this project the study of state of health is based on constant-impedance
load discharge The identification of these unknown parameters will be discussed
in Chapter 5
43 Simulation Study
The processes described above have been implemented in SIMULINK as a
simulation model for computer based analysis The simulation program consists of
two main function blocks circuit block and thermal block The structure of the
SIMULINK implementation is described in Figure 4-5
69
Figure 4-5 Structure of model for SIMULINK Implementation
70
As shown in the figure there are mainly two inputs in the model the discharge
current and the discharge time The actual capacity of battery can be then
calculated with the knowledge of rated capacity and the discharge current The
actual capacity is also influenced by the cell temperature At the beginning of
discharge the cell temperature is the same as the surrounding temperature
Integrating the discharge current with respect to time is the capacity consumed in
the discharge progress and then the state of charge and the depth of charge can be
obtained It is shown that the electromotive force and the internal resistance vary
as a result of changing in the state of charge and the depth of charge and the
terminal voltage can be calculated
In the thermal block of the model the heat generated by the current and the
internal resistance are calculated by the Joules law Then this energy is
transferred to calculate the thermal temperature of the cell and the cell
temperature is given back to the circuit block to affect the actual capacity
71
0 1000 2000 3000 4000 5000 6000 7000
0
02
04
06
08
1
Time (s)
Dis
charg
e C
urr
ent
(A)
0 1000 2000 3000 4000 5000 6000 7000105
11
115
12
125
13
Time (s)
Term
inal V
oltage (
V)
Figure 4-6 Terminal Voltage of Battery (Constant Discharge Current SIMULINK)
The result in Figure 4-6 shows the terminal voltage of a battery which discharges
under the current of 08A in a simulation study Since the discharge begins the
voltage drops due to the internal resistance and the change of state of charge (SOC)
and it climbs up when the discharge stops However the voltage changes
gradually because of the time parameter τ This result shows a good qualitative
agreement with the experimental test results
72
44 Summary and Discussion
This chapter introduces the laboratory test system designed for the project and the
limitation of the mathematical model described in Chapter 3 Switches on the time
parameter τ and the internal resistance parameters R00 and R10 have been added to
the model so that the model is able to represent the change of these parameters
found in the experimental tests The implementation of the model under the
MatlabSIMULINK environment is described and the simulation study shows a
good qualitative agreement with the experimental test results
The next chapter will focus on the identification of those unknown parameters of
the battery model that are important for revealing the battery characteristics
including 20100000 τARRKEC Em and 1τ
73
Chapter 5
Model Parameter Identification
and Model Validation
The identification of the unknown parameters 20100000 τARRKEC Em and 1τ
in the mathematical model will be introduced in this chapter
51 Need for the Optimization Algorithms
In those equations of the battery model described previously some parameters are
unknown and some of them are difficult to derive from physics or engineering
principles or to be obtained through experimental tests Therefore the
identification of the model unknown parameters becomes an important part for the
project Parameter identification is an optimization process that adjusts the
parameters to enable the simulation results to show the best agreement with the
results acquired by the experimental tests There are many algorithms available
for optimization and the principle of the optimization process for the project is to
minimize the objective function The objective function is formed by the absolute
value of the difference between the simulated and experimental results at each
time point The set of parameters to achieve the least value of the objective
function is considered to be the fittest set
74
There are two basic requirements of the optimization in this project First of all as
the problem for the solutions trapped to the local minima is a very important and
challenging issue in many linear optimization solvers the optimization algorithm
used in this project must be able to find the global minimum Secondly the
optimization algorithm not only should find the minimum value of the objective
function but also can tell the values of the parameters that result in the best fitness
which is needed for the analysis purpose in this project Finally the time cost is
also an important factor in selection of a suitable optimization algorithm
It needs to point that the objective here is to identify the unknown parameters of a
model with an already known structure If the objective is to identify or
approximate unknown model structures the selection of optimisation methods
will be quite different In the case of latter Neural Network Genetic
Programming and Fuzzy Logical will be more suitable choices To concentrate on
the objective of the project the thesis will focus on optimisation algorithms for
parameter identification
52 Overview of the Optimization Algorithms
Brute-force search is the most basic direct search algorithm that is used to find the
minimum value In the brute-force search the initial guess is the minimum
possibility of parameters and increasesdecreases The parameter
increasesdecreases step by step in each iteration and the best solution can be
75
searched This algorithm is the simplest but its disadvantage is also obvious that
is it is the slowest optimization method especially when used in the identification
of more than two parameters and the results are largely dependent on the initial
guesses
Linear search is an optimization method to solve the linear optimization problem
the preference function of which is linear and the feasible domain is defined by a
linear constraint function The linear constraints define a convex polyhedron
geometrically which is called the feasible region The algorithm is to construct an
admission solution at a vertex of the polyhedron and then along edges of the
polyhedron to vertices with successively higher values of the objective function
until the optimum is reached
Besides the basic optimization methods evolution computation technology is
becoming increasingly popular A range of different evolution computation
technologies can solve the optimization problem in this project including genetic
algorithms (GAs) particle swarm optimization (PSO)
Genetic Algorithms are direct search algorithms inspired from the process of
evolution in nature the natural selection Based on the principle of survival of the
fittest the GAs can produce better and better approximations to the global optimal
solution in a number of generations In each generation a new group of solutions
is created by the fitness level in the problem of every individual in the last
generation The solutions are then bred together to lead to the evolution of
individuals
76
Particle swarm optimization is a stochastic population-based computer algorithm
modelled on swarm intelligence that searches for a solution to an optimization
problem in a search space Based on the social psychological principles each
individual called lsquoparticlersquo in PSO is able to provide information to others and
also learn the success from the local best and the global best The movement of
each particle through the search space are guided by these successes and the
solution can be found after a number of generations
It has been proved by Dr Jianlin in his PhD Thesis (Wei 2007) that both Genetic
Algorithm and Particle Swarm optimization are capable of the model parameter
identification But the Particle Swarm optimization is a new algorithm that first
described in 1995 and it is not as common as Genetic Algorithm in the research
areas
The purpose of this research work is to find a method for parameter estimation
Genetic algorithms are well proven solution for complicated optimisation
problems and have been applied successfully in a range of similar problems (Wei
2007 Wei Wang et al 2007) Genetic algorithms are also well suited to problems
with many local minima In the current work the exact form of the fitness
function is unknown and it is therefore important to select a robust technique
which can identify good overall solutions For these reasons GA was selected to
give the best possible chance of satisfying the overall project objectives within the
limited timeframe of the project
77
53 The Study of the Genetic Algorithms
The process of Genetic Algorithm is reviewed in this section to provide an insight
into how GAs work and simulation study of two bench mark functions are carried
out
531 Working Principle of GAs
There are many methods used to implement a GA process and usually a GA is at
least composed of three common genetic operators Selection Crossover and
Mutation (Pham and Karaboga 1998) The flowchart of a simple GA process is
given in Figure 5-1
As a preparation to start the optimization process a GA requires a group of initial
solutions as the first generation The first generation is usually a group of
randomly produced solutions created by a random number generator The
population which is the number of individuals in a generation should be big
enough so that there could be a reasonable amount of genetic diversity in the
population Also it should be small enough for each generation to be computed in
a reasonable period of time using the computer resources available Typically a
population includes individuals between 20 and 100 (Chipperfield Fleming et al
1994A)
78
Figure 5-1 Flowchart of a Simple Genetic Algorithm (Pham and Karaboga 1998)
The fitness function is evaluated to measure how close that the individuals fit the
desired result A fitness function could be either complex or simple depending on
the optimization problem addressed In a case of minimization problem the most
fitted individuals will have the lowest numerical value of the associated fitness
function
No
Yes
Selection
Crossover
Mutation
Find the Best Individual
Generate initial population
Results
Evaluate fitness values
Operators of generating new
generation
Gengt 100
Evaluation
Start
79
Individuals are selected according to a fitness-based process The operator of
selection is made up of ranking and selection progress by which more copies of
the individuals that fit the optimization problem better will be produced in the
next generation In GAs there are mainly two ways to select a new population
Roulette Wheel Selection (RWS) and Stochastic Universal Sampling (SUS)
The individuals will be recombined (crossover) after the selection This operation
is to produce two new individuals from two existing individuals selected by the
operator of selection by cutting them at one or more position and exchanging the
parts following the cut The new individuals therefore can inherit some parts of
both parentsrsquo genetic material There are usually four ways of doing this one-
point crossover two-point crossover cycle crossover and uniform crossover
(Pham and Karaboga 1998) Figure 5-2 (a) shows an example of the two-point
crossover progress
Mutation is another operator to produce new individuals The difference is that the
new individual is produced from a single old one In this operation the bit values
of each individual are randomly reversed according to a specified property A
mutation can also helps the GA to avoid local optimums and find the global best
solution Figure 5-2 (b) represents how the mutation operator works
80
Figure 5-2 (a) Crossover operation (b) Mutation operation
The group of individuals produced after the mutation is the second generation
Then the fitness value of each individual in the second generation is computed
again This cycle will not stop until the result is close enough or after a certain
generation
Three major Matlab toolboxes are applied in the current market for application
purpose they are Genetic Algorithms Toolbox V12 (Chipperfield Fleming et al
1994B) the Genetic Algorithms Optimization Toolbox V11 (Houck Joines et al
1995) Genetic Algorithm Direct Search Toolbox V102 (MathWorks Inc 2004)
In this project the official toolbox in Matlab form Mathworks Inc is employed
The property settings for the project based on Dr Weirsquos thesis (Wei 2007) are
shown in Table 5-1
Parent 1 1 1 0 0 1 0 1 1 0 1 0 1 1
Parent 2 0 1 1 0 1 1 0 0 1 0 1 0 0
Offspring 1 1 1 0 0 1 1 0 0 1 1 0 1 1
Offspring 2 0 1 1 0 1 0 1 1 0 0 1 0 0
(a)
Parent 1 1 0 0 1 1 0 0 1 1 0 1 1
Offspring 1 1 0 0 1 0 0 0 1 1 0 1 1
(b)
81
Table 5-1 The property settings for Genetic Algorithms
Name of the GA properties Value of the GA properties
Number of generations 100
Population size 20
Fitness assignment Rank-base fitness assignment
Selection Stochastic universal sampling
Crossover Scattered crossover
Crossover rate 07
Mutation function Uniform mutation
Mutation rate 01
Population size specifies how many individuals there are in each generation With
a large population size the genetic algorithm searches the solution space more
thoroughly and the gives more possibility to return the global minimum The
number of generations specifies the maximum number of iterations for the genetic
algorithm to perform If this number is too low the genetic algorithm is not able
convergence to the global solution However either a large population size or a
large number of generations can cause the algorithm to run more slowly The
crossover rate and the mutation rate are properties that control the crossover and
mutation operator High rate of these values means that the genetic algorithm has
a higher opportunity of producing new offspring but it can be easy to miss the
current best solution if these values are too big
Initial tests of genetic algorithms on different properties show that the values
shown in table 5-1 are able to find an adequate solution Similar results would be
82
obtained if the values of the generations and the population size are larger but
costing more CPU time The crossover rate and the mutation rate would not affect
the result significantly if only varies in a small range But it is impossible to prove
that these two values are the best choice due to the strong randomness
532 Simulation Studies of Genetic Algorithms
In order to test and demonstrate that Genetic Algorithms are able to meet the
requirements of the project simulation studies have been carried out Two
benchmark functions that are commonly used in evaluating evolutionary
computation algorithms are employed for the simulation studies They are
1) Rastrigin function
Rastrigin function is a typical example of non-linear multimodal function with
many local minima The problem of looking for the global minimum is quite
difficult due to its large search space and its large number of local minima The
function is shown as
))2cos(10(10)(1
2sum=
sdotsdotminus+sdot=
n
i
ii xxnXf πr
where n is the dimension of the problem and 1x ~ nx are the coefficients to be
identified Figure 5-2 shows a 2-dimensional Rastriginrsquos function while figure 5-3
is a contour plot of Rastrigins function shows the alternating maxima and minima
83
The global minimum of the Rastriginrsquos function is 0)( =Xfr
when
021 ==== nxxx L
Figure 5-2 2-dimensional Rastrigins function (MathWorks Inc 2004)
84
Figure 5-3 Contour plot of Rastrigins function (MathWorks Inc 2004)
In the simulation study a ten dimensional Rastriginrsquos function is adopted Figure
5-4 shows the best optimization performance of the Rastriginrsquos function in each
generation It is shown that after 700 generations a global optimal value is
obtained
85
0 100 200 300 400 500 600 700 800 900 10000
10
20
30
40
50
60
70
80Best 00099429
Generation
Fitness v
alu
e
Best f itness
Figure 5-4 GA performance (Rastrigrinrsquos function)
2) Rosenbrock function
Rosenbrock function is another mathematical function used as a test problem for
optimization algorithms The global minimum is inside a long narrow parabolic
shaped flat valley To find the valley is trivial but to converge to the global
minimum is difficult The Rosenbrock function is defined by
sum=
+ minus+minus=
n
i
iii xxxXf
1
2221 ))1()(100()(
r
where n is the dimension of the problem and 1x ~ nx are the coefficients to be
identified Figure 5-5 shows a 2-dimensional Rosenbrock function
86
The global minimum of the Rosenbrock function is 0)( =Xfr
when
121 ==== nxxx L The same as the Rastriginrsquos function a ten dimensional
Rosenbrock function is adopted for the simulation study Figure 5-6 is the GA
performance to the Rosenbrock function It can be found that the optimization
converges and get the global optimal value after 300 generations
Figure 5-5 2-dimensional Rosenbrock function (MathWorks Inc 2004)
87
0 100 200 300 400 500 600 700 800 900 10000
200
400
600
800
1000
1200Best 060113
Generation
Fitness v
alu
e
Best fitness
Figure 5-6 GA performance (Rosenbrock function)
54 Model Parameter Identification
541 Implementation of Genetic Algorithms and
Experimental Data sets
In this project the Genetic Algorithm Direct Search Toolbox V102 developed by
Mathworks Inc is employed to identify the parameters of the battery model The
process is shown in Figure 5-7
88
Figure 5-7 Progress of Parameter Identification
The fitness function is used in the project and the parameter identification is to
minimize the fitness function so that the model output can fit the experimental
result The fitness function is given as
sum
sum sumsum
minussdot=
minussdot++minussdot+minussdot=
minus
1
0
2
1 1
1
0
))()(()(
)()()(
exp
expexp2exp1
t
t
sim
t
t
t
t
simnsim
t
t
sim
tVtVabstW
VVabsWVVabsWVVabsWfitnessn
n
L
where Vexp is the experimental terminal voltage data
Vsim is the simulated terminal voltage
Wt is the weights of the difference in the simulated and experimental
results
This fitness function represents the sum of the error values at each time interval
Mathematical Model of a six-cell
Lead Acid Battery
Experimental Test
Results
Fitness
Function
Discharge Current
Simulation
Output
Terminal Voltage
Simulation
Input
lt fmin
Genetic Algorithms (Selection Crossover and Mutation
etc)
Parameter Update
Yes
No
Stop
89
considered ( ntt minus0 ) The weight coefficients Wt indicates how important the
weighted part is in the optimization and how much it contribute to the
optimisation process Periods with bigger tW values are more important because
the sum of errors will give big value contribution to the fitness function value and
the optimisation process will pay more attention to the higher weighted error parts
In the experiments and optimization process it is found that the results were more
important when the discharge of a battery at the stage of stopping Therefore the
weight in this period is greater than that of the others The weighting coefficient
values in this project are determined by the results of the first several attempts of
parameter identification The period of simulation data that fails to fit the test
result means that the weight value is not big enough until the overall performance
of simulation is reasonable
Following the objective fitness function unknown coefficients of the battery
model are identified using experimental data The mathematical model of a six-
cell lead-acid battery in the figure is described in Chapter 4 and the parameters are
to be identified by Genetic Algorithms are 210100000 ττARRKEC Em
Three sets of experimental tests have been carried out for the purpose of
parameter identification and the validation of the mathematical model These three
experimental results are based on a lead-acid battery with the ideal capacity of 13
Ampere-hours under the discharge current of 08A
90
542 Parameters of Battery Model
The parameters of the mathematical model of a lead-acid battery are identified
using Genetic Algorithms and the predicted battery responses using the identified
parameters are compared with the simulated results One set of typical values of
parameters identified are listed in Table 5-2
Table 5-2 Identified parameters identified by the Genetic
Algorithms in the model of 12V-13Ah lead-acid battery Parameter Value Parameter Value
0C 48198 (Amp-Sec) 0mE 21465 (V)
EK 0001109 (V) 0A 29895
00R 001038 (Ohm) 10R 012196 (Ohm)
1τ 21052 (s) 2τ 17565 (s)
Figure 5-8 shows the simulation results using the Improved Battery Model and the
change of weights defined for this set of result described in the fitness function
The top subplot of Figure 5-8 shows the weight value of the GA fitness function
described before while the middle figure is the discharge current of the
experimental test which is also the input of the mathematical model In the
following test results in this and next chapter the changes of weight value are
similar so they are not shown in the figures
The blue line marked as ldquoExperimental Terminal Voltagerdquo in the bottom figure
represents the measured outputs while the other one (Simulated Terminal Voltage)
represents the simulation results The simulation results are ldquonoisyrdquo because
experimental discharge current is used as the input of model in the simulation
91
progress It is obviously that Figure 5-8 shows a good overall agreement of the
results although some slope when discharging is not perfect
0 500 1000 1500 2000 2500 3000 3500
1
15
Time (s)
Weig
ht
0 500 1000 1500 2000 2500 3000 3500114
116
118
12
122
124
126
128
13
Time (s)
Term
inal V
oltage (
V)
Experimental Terminal Voltage
Simulated Terminal Voltage
0 500 1000 1500 2000 2500 3000 3500
0
05
1
Time (s)
Dis
charg
e C
urr
ent
Simulated Terminal Voltage
Experimental Terminal Voltage
Figure 5-8 Measured and Simulated Result after Parameter Identification
Figure 5-9 shows the mean fitness value and the best in each generation It can be
seen that the best fitness in each generation is decreasing The mean fitness is
unstable because of the mutation operator in the GA that can attempt to find better
solutions
92
0 10 20 30 40 50 60 70 80 90 100100
150
200
250
300
350
400
450
500
550
Generation
Fitness v
alu
e
Best 1075521 Mean 1312731
Best f itness
Mean fitness
Figure 5-9 Mean and the Best Fitness Values in Each Generation
543 Battery Model Validation
In order to validate the battery mathematical model two sets of experimental tests
have been adopted to compare with the simulation results
The inputs of the discharge current and the validation results using two
experimental tests are shown in Figure 5-10 and Figure 5-11
93
0 500 1000 1500 2000 2500 3000114
116
118
12
122
124
126
128
13
Time (s)
Term
inal V
oltage (
V)
Simulated Terminal Voltage
Experimental Terminal Voltage
Simulated Terminal Voltage
Experimental Terminal Voltage
Figure 5-10 Measured and Simulated Terminal Voltage (Validation data 1)
In the simulation that shows in Figure 5-10 the discharge of battery begins at the
time of 700s and the simulation result shows a reasonable agreement with the
experimental result despite the noise of signal caused by the error of the sensors
It is noticed that at the beginning of the discharge there is a difference between
the simulated and experimental terminal voltages for about 100 seconds This
difference is studied and so called lsquocoup de fouetrsquo which often takes place at the
beginning of a discharge test when the SOC of battery is high (Perrin Delaille et
al 2006) However this lsquocoup de fouetrsquo behaviour cannot be described in this
model The discharge period lasts for about 1200 seconds and then stops and after
that the simulation has the similar result with the experiment
94
0 1000 2000 3000 4000 5000 600011
112
114
116
118
12
122
124
126
128
13
Time (s)
Term
inal V
oltage (
V)
Simulated Terminal Voltage
Experimental Terminal Voltage
Simulated Terminal Voltage
Experiment Terminal Voltage
Figure 5-11 Measured and Simulated Terminal Voltage (Validation data 2)
Figure 5-11 shows another group of experimental test to validate the battery
model At the beginning of the experiment the terminal voltage from the
experiment is dropping without any discharge behaviour of battery and that is
because of the experiment was carried out when the terminal voltage of lead-acid
battery is not steady enough after being charged and that also causes the
deviations in the discharge at about 1000-2000 seconds In this period the lsquocoup
de fouetrsquo appears again After the first period the battery is disconnected from the
load until the terminal voltage become steady and the simulation result in this
period fits the experiment result well In the second discharge of this test it is
shown that the lsquocoup de fouetrsquo does not occur because the SOC is not high For
the similar reason in the first discharge in this group of the test results there are
95
also some deviations in this period Finally the simulation result in the last part of
figure fits the experimental result is highly satisfied
The average error of the simulated outputs of the simulation studies and the
measured results are studied Absolute Error and Relative Error is defined as the
following equations
sum
sum
=
=
minus=
minus=
N
i
sim
N
i
sim
iV
iViV
NRelError
iViVN
AbsError
1 exp
exp
1
exp
)(
)()(1
)()(1
The absolute error and relative error are summarised in Table 5-3
Table 5-3 AbsError and RelError of Model Validation
Absolute Error Relative Error discharging relaxing overall discharging relaxing overall
Experimental Test 1 (Identification)
00229V 00207V 00217V 01833 01724 01776
Experimental Test 2 (Validation data 1)
00536V 00484V 00492V 04453 03872 04024
Experimental Test 1 (Validation data 2)
00724V 00372V 00485V 06352 03013 05025
55 Summary and Discussions
Identification of the unknown model parameters is discussed in this chapter and a
range of possibly suitable methods are reviewed in brief In this project Genetic
Algorithm is adopted GAs working principle and its implementation has been
96
introduced in details in this chapter The simulation study of two benchmark
functions that are commonly used in evaluating evolutionary computation
algorithms are employed in order to show the capability of GAs The parameter
identification by tests of a brand new 13Ah lead-acid battery is carried out and is
validated by two sets of other experimental test results under the same working
condition of the same battery
97
Chapter 6
The Analysis of State of Health
(SOH) in association with the
Internal Resistance
61 Methodology
As the number of discharge cycles of battery increases in applications the
maximum charges that a battery can offer will decrease In other words the SOH
battery is deteriorating But this drop of capacity is not linear and it is also a long
progress At the beginning of the use of battery the change of capacity is very
slow and it is not obvious After a number of cycles of discharge and charge this
change will get faster and relatively significant
There are no reliable methods now to calculate the remaining charge capacity
which is the only one determinant of the state of health The normal method is
simply to measure the voltage on its terminals But this measurement is not
accurate on an aged battery A battery in poor state of health but sufficiently
charged can also offer sufficient voltage to appear normal The only way to
determine the capacity accurately is to integrate the discharge current of battery in
a full deep discharge but this method cannot be used too frequently because deep
98
discharge is harmful for the battery
In the project six lead-acid batteries were tested using the test system described in
Chapter 4 These batteries were repeatedly discharged and charged for their whole
life time so that the information related to different state of health can be revealed
as soon as possible Even though the batteries works frequently it still takes more
than 6 months to make the battery become weak The testing experiments were
carried out and the data was recorded every 2-3 weeks so that important value of
state of health is not missed However as the change of capacity is a long progress
and it is nonlinear not all the data collected can be used in this project
Referring the literature (Coleman Lee et al 2006 Lakhdari and Midoun 2007
Coleman Hurley et al 2008) an important factor that reflects the change of state
of health of a lead-acid battery is the internal resistance Not only the state of
health but also other factors (SOC DOC discharge current etc) can result in
variations in internal resistance a new alternative method that based on the
Improved Battery Model in Chapter 4 is adopted in the project
From the model study in Chapter 4 the internal resistance can be divided into two
parts expressed by )]1(1[ 0000 SOCARR minusminusminusminus++++==== (Eq 47) and )ln(101 DOCRR minusminusminusminus====
(Eq 48) These equations show that the internal resistance is affected by the state
of charge (SOC) and depth of charge (DOC) in a discharge cycle In real
applications batteries are seldom discharged to the full range because a deep
discharge could cause some damage to the battery They are also seldom to be
charged to full to prevent the possibility of overcharge that could also bring some
99
negative effects Although this issue is not very significant in a valve regulated
lead acid battery it is better to control the working range of depth of charge from
50 to 80 approximately In this project the internal resistance of battery in the
depth of charge of 65 is studied as a most important factor that related to the
state of health As a little inaccurate of SOC and DOC will induce a comparative
big difference in the internal resistance the method of measuring the internal
resistance accurately by an external circuit is discarded
In Equation 47 and Equation 48 the author found that there are two other factors
that influence the internal resistance besides the SOC and the DOC R00 and R10
Therefore in the project the values of R00 and R10 in a specific discharge current
are very important to study the internal resistance The values of these two factors
are used in Equation 47 and Equation 48 to calculate the internal resistance per
cell of the battery The depth of charge is assumed to be 65 for a normal
working battery as described previously In chapter 3 the SOC and the DOC are
defined as )0(1 θCQSOC eminus= (Eq 44) and )(1 θavge ICQDOC minus= (Eq
45) The Capacity is also defined as equation 42
k
c
fc
IIK
CK
IC))(1(1
)1(
)(
0
minusminusminusminus++++
++++
====
ε
θ
θ
θ (61)
in which Kc = 118 k = 120 and 6 II avg times= in this project The relationship
between the actual capacity under discharge current Iavg and the nominal capacity
is
100
62
1
))(1(1
1
)0)(1(1
1
))(1(1
1
)0(
)(asymp
minus+=
minus+
minus+=
k
avgck
c
k
avgcavg
IIK
IK
IIK
C
IC
θ
θ (62)
Therefore the SOC when the DOC is 65 is
586))0(62(1)0(1 asympsdotminus=minus= θθ CQCQSOC ee (63)
As described in chapter 5 30 asympA therefore the internal resistance of an
individual cell can be obtained by
10001000010 43041)ln()]1(1[ RRDOCRSOCARRRrcell sdot+sdotasympminusminus+=+= (64)
and for a six-cell lead-acid battery the internal resistance
1000 582486 RRrr cellbattery sdot+sdot=times= (65)
62 The identification of C0 R00 and R10
In the eight parameters identified previously in Chapter 5 there are only three
parameters can be affected by the change of battery conditions Therefore the
other five parameters ( 2100 ττAKE Em ) can be treated as a constant for a battery
The parameters that related to the battery condition 0010 RR and 0C are the key
problems which the project focused on 0C represents the state of health while
the 0010 RR stands for the internal resistance parameters Here again the Genetic
algorithm is adopted to identify these three parameters
In this project the battery have been discharged and charged in hundreds of cycles
to simulate the capacity loss in the normal applications which is described by the
101
state of health in this project In order to find out the different behaviour of
internal resistance in different state of health experimental tests have been carried
out in different state of health of the battery
The first test is carried out when the battery is brand new and the data is also used
to identify the other parameters of the battery model as described in the previous
chapter The second group of data is collected after 300 discharge cycles
approximately and the third test took place after 200 more cycles The number of
discharge cycles between the last four tests is only about 50 because the change of
State of Health is more significant The identified parameters of a battery in
different state of health are shown in table 6-1
Table 6-1 Battery Remaining Capacity and Internal Resistance
Remaining
Capacity C0 (Amps)
SOH R00 R10 RelError Internal
Resistance (Ohm)
Test 1 48198 100 00609 00220 01756 05683
Test 2 44861 9314 00654 00103 07428 05759
Test 3 38025 7889 00635 00191 02812 05827
Test 4 33830 7019 00573 00509 07265 06126
Test 5 30625 6354 00604 00582 04340 06575
Test 6 26072 5306 00703 00368 01342 06855
And the terminal voltages simulated and measured are shown as the following
figures The same as previous figures the blue lines represent the measured
outputs while the red lines represent the simulation results
The test shows in figure 6-1 the same as the test which is used to describe the
genetic algorithms and the battery parameter identification in chapter 5 Detailed
102
description and analysis are given in chapter 5
0 500 1000 1500 2000 2500 3000 350011
112
114
116
118
12
122
124
126
128
13
Time (s)
Term
inal voltage (
V)
Experimental Terminal Voltage
Simulated Terminal Voltage
Experimental Terminal Voltage
Simulated Terminal Voltage
Figure 6-1 Experimental and Simulated Terminal Voltage of Test 1 (SOH = 100)
103
0 1000 2000 3000 4000 5000 600011
112
114
116
118
12
122
124
126
128
13
Time (s)
Term
inal V
oltage (
V)
Simulated Terminal Voltage
Experimental Terminal Voltage
Simulated Terminal Voltage
Experimental Terminal Voltage
Figure 6-2 Experimental and Simulated Terminal Voltage of Test2 (SOH= 9314)
The experiment shown in figure 6-2 is tested several months after the first
experimental test In the period that the first discharge begins the experimental
result shows a different slope in terminal voltage The reason is probably that the
battery have just charged to full by a charger and itrsquos the capacitor had not fully
discharged After that when the discharge stopped there is a deviation in the
simulation voltage In the authorrsquos opinion that is because of the accuracy of R10
and R00 If the value of R10 is greater and that of R00 is smaller the simulation
result should fit the experimental result In the second discharge period of the
discharge test there is also a little difference in the experimental and simulation
result caused by the inaccuracy of battery parameters But it shows a good
agreement when the discharge stopped
104
0 500 1000 1500 2000 2500 3000 3500 400011
112
114
116
118
12
122
124
126
128
13
Time (s)
Term
inal V
oltage (
V)
Simulated Terminal Voltage
Experimental Terminal Voltage
Simulated Terminal Voltage
Experimental Terminal Voltage
Figure 6-3 Experimental and Simulated Terminal Voltage of Test3 (SOH= 7889)
0 500 1000 1500 2000 2500 3000 3500 4000 4500 500011
112
114
116
118
12
122
124
126
128
13
Time (s)
Term
inal V
oltage (
V)
Simulated Terminal Voltage
Experimental Terminal Voltage
Simulated Terminal Voltage
Experimental Terminal Voltage
Figure 6-4 Experimental and Simulated Terminal Voltage of Test4 (SOH= 7019)
105
0 1000 2000 3000 4000 5000 600011
112
114
116
118
12
122
124
126
128
13
Time (s)
Term
inal V
oltage (
V)
Experimental Terminal Voltage
Simulated Terminal Voltage
Simulated Terminal Voltage
Experimental Terminal Voltage
Figure 6-5 Experimental and Simulated Terminal Voltage of Test5 (SOH= 6354)
Figure 6-3 figure 6-4 and figure 6-5 show the test results of the battery when the
SOH drops to its 80 70 and 60 It is shown that the simulation result in
figure 6-3 fits the experimental result until the end of test when the discharge of
battery has just stopped The inaccuracy of the R10 and R00 is also the main cause
of the deviation The overall simulation result in figure 6-4 figure 6-5 are good to
express the battery behaviour
106
0 500 1000 1500 2000 2500 3000 3500 400011
112
114
116
118
12
122
124
126
128
13
Time (s)
Term
inal V
oltage (
V)
Experimental Terminal Voltage
Simulated Terminal Voltage
Experimental Terminal Voltage
Simulated Terminal Voltage
Figure 6-6 Experimental and Simulated Terminal Voltage of Test6 (SOH= 5306)
In the parameter identification of test shown in figure 6-6 the remaining capacity
is only about 12 of the initial capacity when the battery is brand new During the
discharge period the simulation and experimental result is not fitting very well
and the slopes of them are not the same This is probably also caused by
insufficient idle time after being charged and the capacitor had not fully
discharged
Figure 6-7 represents the internal resistance value in different state of health as
described in table 6-1
107
100 95 90 85 80 75 70 65 60 55 5004
045
05
055
06
065
07
075
08
State of Health
Inte
rnal R
esis
tance (
Ohm
)
r vs SOH
Approximation
Figure 6-7 Change of Internal Resistance in Different State of Health (Battery 1)
It is shown that the internal resistance is increasing when the state of health of a
lead-acid battery decreases This progress is at first very slow when the battery is
new But after a number of discharge cycles the remaining capacity of battery
drops to about 75 of the initial capacity when the battery is new and the
increase of internal resistance become faster When the state of health is brought
down to about 50 which means that the battery cannot offer enough energy as
new the value of internal resistance is increased by 30 approximately At
present there is not a published quantitative description of the internal resistance
when the capacity changes yet but it has been agreed that the internal resistance
increases while the battery health deteriorates
Similar tests have been carried out on 5 other batteries with the same nominal
108
capacity and the changes of their internal resistances are given as figure 6-8 It is
not possible to deduce a statistical approximation equation only based on the
existing data but it can be seen from the figure that the performance of internal
resistance under different state of health shows an agreement in a certain extent
100 95 90 85 80 75 70 65 60 55 5003
04
05
06
07
08
09
State of Health
Inte
rnal R
esis
tance (
Ohm
)
r vs SOH (Battery 1)
r vs SOH (Battery 2)
r vs SOH (Battery 3)
r vs SOH (Battery 4)
r vs SOH (Battery 5)
r vs SOH (Battery 6)
Figure 6-8 Change of Internal Resistance in all 6 Batteries
63 Summary and Discussions
The determination of battery remaining capacity accurately is becoming
increasingly important in modern battery managements This currently is mostly
obtained by integrating the discharge current of a full discharge but this progress
usually causes a negative effect on most of the batteries There is also a view that
109
the state of health which represents the percentage of remaining capacity of a
weak battery compared with the initial capacity when brand new can affect the
internal resistance therefore the battery state of health can be obtained by the
study of battery internal resistance However from the analysis based on the
mathematical model and the experimental results it can be concluded that other
parameters can also cause variations of the internal resistance which make the
estimation of the state of health more challenging
This chapter describes a new alternative method that based on the Improved
Battery Model and the key parameters of the model The remaining maximum
capacity of a used battery which represents the SOH of the battery is related in
the internal resistance under the depth of charge of 65 which is expressed by
the parameters of R00 and R10 These parameters can be identified by genetic
algorithms A result that quantifies the change of internal resistance in different
SOH values has been concluded based on the analysis of a series of experimental
tests
110
Chapter 7
Conclusions and Future
Research
This chapter summarizes the major achievements of the presented research work
in the field of battery modelling and state of health analysis Possible direction of
further research work is also described briefly in this chapter
71 Summary
Lead-acid batteries are used in various industrial sectors and are irreplaceable due
to their low price In areas where lead-acid batteries are employed as an energy
storage device the capacity loss caused by the repeated dischargecharge cycles is
very common This drop of capacity can neither be avoided nor be repaired by
using current technologies As a result it is essential to know whether the battery
is able to meet the demand and if it should be replaced on time
In this thesis a study on the capacity status of a battery and its relation to the
internal resistance had been conducted and this thesis established a novel model
based method to quantify the battery health An Equivalent Circuit Mathematical
model for the discharging progress of a lead-acid battery has been developed for
this purpose and is implemented under MatlabSIMULINK software environment
111
The model involves most of the important concepts of a battery to reflect the
dynamic response of terminal voltage when discharging
A series of experimental tests have been carried out during the project for the
model validation and the study of the state of health Six 12V-13Ah lead-acid
batteries with the same rated capacity are discharged and recharged from brand
new to obtain different values of state of health Genetic algorithm has been
employed to identify the unknown parameters of the battery model in each state of
health and the identified parameters are used as the factors that reflecting the state
of health and the internal resistance The internal resistances corresponding
different state of health have been collected and recorded A result was found in
the thesis that for the 12V-13Ah lead-acid battery which is used in the
experimental tests the value of internal resistance is increased by 25
approximately if the SOH of battery drops to 50
72 Limitations
The key limitation of the method introduced in this thesis is that it is based on the
parameter identifications of the model which means a test is still needed in order
to obtain the state of health The major reason is that the mathematical model does
not include the charging progress of battery which is also an important period of
the battery duty cycle Another limitation is that all the tests of the state of health
estimation are carried out at the same discharge rate because of the variation of
the internal resistance in different discharge rate as discussed in chapter 4 Finally
112
The lsquocoup de fouetrsquo behaviour that of took place at the beginning of discharge
when batteries are full is not able to be simulated in the current version of
mathematical model
73 Future Research Work
Following the limitations of the project some future research can be carried out in
three steps based on the model improvements and the practical applications of the
algorithm
First of all improvements of the discharging battery model can be carried out
which can mainly focus on the study of the battery internal resistance in different
discharge rates Equations of internal resistances that can withstand the change of
discharge rate will make the model capable for online applications Studies on the
relationship between the electromotive force and the state of charge can also lead
to a solution of the lsquocoup de fouetrsquo behaviour and a better simulation result
Another research work on the model modification is that the behaviour of battery
to the mathematical model when a battery is being charged can be involved by
which the monitoring system of battery can be implemented in the whole duty
cycles This part of work can be focused on the parasitic branch in the
mathematical model described in chapter 3
Further work should also reveal the variations of state of health in different duty
113
cycles and an algorithm based on this change should be designed to estimate the
remaining life-time of a lead-acid battery The value of current state of health and
the estimated raining life-time should also be considered as major outputs in this
period of work It is also possible to design an online management device of
battery to estimate the life-time and the state of health
114
References
Anon (2006) Global Wind Energy Council (GWEC) statistics [online] from
httpwwwgwecnetuploadsmedia07-
02_PR_Global_Statistics_2006pdf
Anon (2007) Battery Types Flooded versus AGM and Gel [online]
Retrieved February 13 2007 from
httpwwwvonwentzelnetBattery01Type
Anon (2007) BP Statistical Review of World Energy June 2007 [online] from
httpwwwbpcomliveassetsbp_internetglobalbpglobalbp_uk_englishr
eports_and_publicationsstatistical_energy_review_2007STAGINGlocal_
assetsdownloadsspreadsheetsstatistical_review_full_report_workbook_2
007xls
Anon (2007) International Energy Outlook 2007 [online] from
httpwwweiadoegovoiafieohighlightshtml
Ball R J Evans R and Stevens R (2002) Finite element (FE) modelling of
current density on the valve regulated leadacid battery positive grid
Journal of Power Sources 103(2) 213-222
Bernardes A M Espinosa D C R and Tenoacuterio J A S (2004) Recycling of
batteries a review of current processes and technologies Journal of
Power Sources 130(1-2) 291-298
Berndt D (1993) Maintenance-Free Batteries -- A Handbook of Battery
Technology Somerset Research Studies Press Ltd
Berndt D (2001) Valve-regulated lead-acid batteries Journal of Power
Sources 100(1-2) 29-46
115
Berndt D (2009) Electrochemical Energy Storage Battery Technology
Handbook CRC Press
Casacca M A and Salameh Z M (1992) Determination of lead-acid battery
capacity via mathematical modeling techniques Energy Conversion
IEEE Transaction on 7(3) 442-446
Ceraolo M (2000) New dynamical models of lead-acid batteries Ieee
Transactions on Power Systems 15(4) 1184-1190
Chan H L and Sutanto D (2000) A new battery model for use with Battery
Energy Storage Systems and Electric Vehicles Power Systems 2000 Ieee
Power Engineering Society Winter Meeting - Vols 1-4 Conference
Proceedings 470-475
Chen M and Rincacuteon-Mora G A (2006) Accurate electrical battery model
capable of predicting runtime and I-V performance IEEE
TRANSACTIONS ON ENERGY CONVERSION VOL 21( NO 2)
504-511
Chipperfield A J Fleming P J and Fonseca C M (1994A) Genetic algorithm
tools for control systems engineering Adaptive computing in
engineering design and control Plymouth UK
Chipperfield A J Fleming P J Pohlherim H and Fonseca C M (1994B)
Genetic algorithm toolbox for use with Matlab Department of automatic
control and systems engineering University of Sheffield
Crompton T R (2000) Battery Reference Book Third Edition Oxford
Elsevier Newnes
Cun J P Fiorina J N Fraisse M Mabboux H A and Mabboux H The
116
experience of a UPS company in advanced battery monitoring
Telecommunications Energy Conference 1996 INTELEC 96 18th
International 646 - 653
Durr M Cruden A Gair S and McDonald J R (2006) Dynamic model of a
lead acid battery for use in a domestic fuel cell system Journal of Power
Sources 161(2) 1400-1411
Esfahanian V Torabi F and Mosahebi (2008) An innovative computational
algorithm for simulation of lead-acid batteries Journal of Power
Sources 176(1) 373-380
Gillioli R and Cerolo P (1990) Charge and discharge fourth order dynamic
model of the lead battery 10th
intl Electric Vehicle Symposium Hong
Kong p1-9
Glendenning I (1981) Compressed air storage Physics in Technology 12(3)
103-10
GONG Q (2005) Modeling study of a vehicle traction battery model
CHINESE LABAT MAN 2005 Vol 42 Numb 2 issu 155 pages 76-79
Houck C Joines J and Kay M (1995) A Genetic Algorithm for Function
Optimization A Matlab Implementation NCSU-IE TR 95-09
Jacobi W (2009) Lithium Batteries Battery Technology Handbook CRC Press
Jayne M G and Morgan C (1986) a new mathematical model of lead acid
battery for electric vehicles Eighth Intl electric vehicle conference
Washington DC
Juvonen M (2003) Large-Scale Energy Storage Systems [online] from
httpwwwdocicacuk~mattiise2grpenergystorage_reportstoragehtml
117
Lee J H Lee K Y and Lee J Y (1996) Self-discharge behaviour of sealed
Ni-MH batteries using MmNi33+xCo07Al10-x anodes Journal of
Alloys and Compounds 232(1-2) 197-203
Liaw B Y Gu W B and Wang C Y (1997) Numerical simulation of coupled
electrochemical and transport processes in battery systems Proceedings
of the Intersociety Energy Conversion Engineering Conference
Honolulu HI USA IEEE
Lu S Meegahawatte D H Guo S Hillmansen S Roberts C and Goodman
C J (2008) Analysis of energy storage devices in hybrid railway vehicles
Railway Engineering - Challenges for Railway Transportation in
Information Age 2008 ICRE 2008 International Conference on
Mantell C L (1984) Batteries and energy systems Second Edition McGraw-
Hill Inc
MathWorks Inc (2004) Genetic Algorithm Direct Search Toolbox V102
MathWorksInc
MPowerSolutionsLtd (nd) Alternative Energy Storage Methods [online]
from httpwwwmpowerukcom
Okoshi T Yamada K Hirasawa T and Emori A (2006) Battery condition
monitoring (BCM) technologies about lead-acid batteries Journal of
Power Sources 158(2) 874-878
Perrin M Delaille A Huet F and Hernout L (2006) Study of the coup de
fouet of lead-acid cells as a function of their state-of-charge and state-of-
health Journal of Power Sources 158(2) 1019-28
Pham D T and Karaboga D (1998) Intelligent Optimisation Techniques
118
Genetic Algorithms Tabu Search Simulated Annealing and Neural
Networks New York Springer-Verlag New York Inc
RailPower Hybrid Technologies C (nd) Benifits of Hybrid Locomotives
[online] from httpwwwrailpowercomproducts_hl_benefitshtml
Rand D A J Moseley P T and Garche J (2004) Valve-Regulated Lead-Acid
Batteries Elsevier
Ruetschi P (2004) Aging mechanisms and service life of lead-acid batteries
Journal of Power Sources 127 (1-2) 33-44 Switzerland Elsevier
Salameh Z M Casacca M A and Lynch W A (1992) A mathematical model
for lead-acid batteries IEEE Trans on Energy conversion Vol7 No 1
Sato Y Takeuchi S and Kobayakawa K (2001) Cause of the memory effect
observed in alkaline secondary batteries using nickel electrode Journal
of Power Sources 93(1-2) 20-24
Sims R I Carnes J C Dzieciuch M A and Fenton J E (1990) Computer
modeling of Automotive lead acid batteries Ford Research Laboratories
Technical Report
Smil V (2007) Energy at the Crossroads Massachusetts Achorn Graphic
Services Inc
Ter-Gazarian A (1994) Energy storage for power systems London Peter
Peregrinus Ltd
TNI_Ltd (2007) Battery history [online] from
httpwwweuropulsecombattery_historybattery_historyhtm
Tuck C D S (1991) Modern Battery Technology Ellis Horwood Ltd
Wei J (2007) Development of Coal Mill and Aggregate Load Area Models in
119
Power Systems using Genetic Algorithms University of Liverpool PhD
Wikipedia (nd) Lead-Acid Battery [online] from
httpenwikipediaorgwikiLead-acid
Wikipedia (nd) Rechargeable Batteries [online] from
httpenwikipediaorgwikiRechargeable_battery
Wikipedia (nd) VRLA [online] from httpenwikipediaorgwikiVRLA
Zhang Y L Liu P H Zhang Q Y and Cheng W (2010) Separation of
cadmium(ii) from spent nickelcadmium battery by emulsion liquid
membrane Canadian Journal of Chemical Engineering 88(1) 95-100
120
Appendix I SIMULINK Diagrams of Battery Model
Figure A-1 SIMULINK Diagrams of ldquoMain Blockrdquo
121
Figure A-2 SIMULINK Diagrams of ldquoTerminal Voltage Calculationrdquo
122
Figure A-3 SIMULINK Diagrams of ldquoThermal Behaviourrdquo
123
Figure A-4 SIMULINK Diagrams of ldquoBattery Capacityrdquo
Figure A-5 SIMULINK Diagrams of ldquoBattery State of Chargerdquo
Figure A-6 SIMULINK Diagrams of ldquoBattery Depth of Chargerdquo
124
Figure A-7 SIMULINK Diagrams of ldquoBattery Electromotive Forcerdquo
(a)
(b)
Figure A-8 SIMULINK Diagrams of ldquoBattery Internal Resistancerdquo
125
Appendix II
List of Publications
S Hillmansen S Lu D H Meegahawatte S Guo C Roberts and C J
Goodman Analysis of Energy Storage Devices in Hybrid Railway Vehicles International Conference on Railway Engineering 2008 p68-73 Hong Kong China 25-28 March 2008
Y Yin X Luo S Guo Z Zhou J Wang A battery charging control strategy for
renewable energy generation systems The Proceedings of World Congress on Engineering 2008 Vol 1 pp356-361 London UK 2-4 July 2008
S Guo S Hillmansen Y Yin J Wang State of Health Monitoring of Lead-acid
Batteries Proceedings of the 14th International Conference on Automation amp Computing pp250-254 Brunel University West London UK 6 September 2008
Y Yin C Li Z Zhou Q Liu S Guo X Luo J Wang Design and Realization of a
PS2 Keyboard Interface in Embedded system Proceedings of the 14th International Conference on Automation amp Computing pp160-163 Brunel University West London UK 6 September 2008
Yin Y Wang J Luo X Guo S Development of a battery charging management
unit for renewable power generation a book chapter in Advances in
Electrical Engineering and Computational Science Edited by Sio-Long Ao and Len Gelman pp33-46 Springer 2009
Wang J Wei JL Guo S Condition monitoring of power plant milling process
using intelligent optimization and model based techniques accepted as a chapter in the book of Fault Detection in March 2009
S Guo S Hillmansen J Wang Model Based Analysis of Battery State of Health
using Genetic Algorithms accepted by the International Conference on Systems Engineering (ICSE) Coventry 8-10 September 2009

4
battery health and the internal resistance In this project six batteries were
discharged and charged in several times in order to simulate the capacity loss that
occurs in normal operation This capacity loss is related to the state of health and
the parameter estimation was able to adequately distinguish between different
state of health
These results indicate that the internal resistance increases when the state of health
of a lead-acid battery decreases This progress is at first very slow when the
battery is new but the change becomes faster when the remaining capacity of
battery drops to about 75 of the initial It is found in the thesis that the value of
internal resistance is increased by 25 approximately when the state of health is
brought down to about 50 meaning that the battery cannot offer enough energy
as new and should be replaced for safety consideration
The method described within this thesis performed adequately in the limited tests
performed during the experimental work Further investigations are recommended
in order to refine the method which is potentially suitable for online
implementation in battery condition monitoring systems
5
Contents
Chapter 1 Background and Objectives of the Project 1
11 Overview 1
12 Review of Energy Storage Systems 2
121 Applications of the Energy Storage Systems 2
122 Review of the Existing Energy Storage Devices 4
123 Review of Batteries 7
124 The Management of Batteries 11
13 Project Objectives 12
14 Outline of the thesis 13
Chapter 2 Introduction of Lead-acid Batteries 15
21 A General Overview of the Lead-acid Battery 15
22 Configuration of Lead-acid Batteries 18
221 Electrochemical Principles 18
222 Lead-Acid Battery Types and Technologies 20
223 Battery Designs for Different Applications 22
23 Mathematical Descriptions of Lead-acid Batteries 23
231 Capacity 23
232 Electromotive force 24
233 State of Charge and Depth of Charge 26
234 Internal Resistance and State of Health 27
235 Multi-Cell Lead-Acid Batteries 29
24 Summary 29
6
Chapter 3 Equivalent Circuit Modelling of Lead-acid Batteries 31
31 Requirements for the Battery Model 31
32 Overview of Battery Model Techniques 32
321 Electrochemical Model 32
322 Physical Models 33
323 Equivalent Circuit Model 34
324 Discussion of Different Battery Model Methods 35
33 Introduction of the Existing Equivalent Circuit Models 37
331 Simple Battery Model 37
332 Advanced Simple Battery Model 39
333 Thevenin Battery Model 40
334 Dynamic Battery Model 42
335 Fourth Order Dynamic Model 43
336 Improved Battery Model 44
34 Mathematical Model of the Lead-acid Batteries 44
341 Capacity 45
342 Electric Networks 48
343 State of Charge and Depth of Discharge 50
344 Electromotive Force of the Battery 50
345 Internal Resistance of a Battery 51
346 The Behaviour of Parasitic Branch 52
347 Main Branch Capacitance 53
348 Thermal Behaviour of a Battery 55
35 Mathematical Model of the Lead-acid Batteries 56
7
36 Summary and Discussion 57
Chapter 4 Experimental System Set up and Improved Battery Model Simulation
Implementation 59
41 The Experimental System 59
42 Improvements of the Battery Model 61
421 The Change of τ in Different Charge Status 63
422 Analysis in Variations of the Internal Resistance 64
423 Improved Lead-Acid Battery Mathematical Model 66
43 Simulation Study 68
44 Summary and Discussion 72
Chapter 5 Model Parameter Identification and Model Validation 73
51 Need for the Optimization Algorithms 73
52 Overview of the Optimization Algorithms 74
53 The Study of the Genetic Algorithms 77
531 Working Principle of GAs 77
532 Simulation Studies of Genetic Algorithms 81
54 Model Parameter Identification 87
541 Implementation of Genetic Algorithms and Experimental Data sets
87
542 Parameters of Battery Model 90
543 Battery Model Validation 92
55 Summary and Discussions 95
Chapter 6 The Analysis of State of Health (SOH) in association with the Internal
Resistance 97
8
61 Methodology 97
62 The identification of C0 R00 and R10 100
63 Summary and Discussions 108
Chapter 7 Conclusions and Future Research 110
71 Summary 110
72 Limitations 111
73 Future Research Works 112
9
List of Figures
Figure 1-1 Power density vs energy density plot 7
Figure 2-1 Working Principle of Lead-Acid Batteries (a) shows the battery when
discharging and (b) is when charging with a DC charger 18
Figure 3-1 Simple Battery Model 38
Figure 3-2 I-V chart of the Simple Battery Model 39
Figure 3-3 I-V Chart in different SOC 40
Figure 3-4 Sketch to show battery discharge behaviours in typical tests 41
Figure 3-5 Thevenin Battery Model 42
Figure 3-6 Fourth-order Battery Model43
Figure 3-7 Improved Battery Model 44
Figure 3-8 Battery Capacity vs Discharge Current 47
Figure 3-9 Lead-acid Battery Equivalent Network 48
Figure 3-10 The Equivalent Network with the Approximated mZ 49
Figure 3-11 R-C block 53
Figure 4-1 Equivalent Circuit of the Experimental Test Rig 60
Figure 4-2 Experimental Test Rig61
Figure 4-3 Test of constant-impedance load discharge 62
Figure 4-4 Test of two-load discharge 62
Figure 4-5 Structure of model for SIMULINK Implementation69
Figure 4-6 Terminal Voltage of Battery 71
Figure 5-1 Flowchart of a Simple Genetic Algorithm78
Figure 5-2 2-dimensional Rastrigins function83
Figure 5-3 Contour plot of Rastrigins function84
10
Figure 5-4 GA performance (Rastrigrinrsquos function) 85
Figure 5-5 2-dimensional Rosenbrock function 86
Figure 5-6 GA performance (Rosenbrock function) 87
Figure 5-7 Progress of Parameter Identification 88
Figure 5-8 Measured and Simulated Result after Parameter Identification 91
Figure 5-9 Mean and the Best Fitness Values in Each Generation 92
Figure 5-10 Measured and Simulated Terminal Voltage 93
Figure 5-11 Measured and Simulated Terminal Voltage 94
Figure 6-1 Experimental and Simulated Terminal Voltage of Test 1 (SOH = 100)
102
Figure 6-2 Experimental and Simulated Terminal Voltage of Test 2 (SOH=9314)
103
Figure 6-3 Experimental and Simulated Terminal Voltage of Test 3 (SOH=7889)
104
Figure 6-4 Experimental and Simulated Terminal Voltage of Test 4 (SOH=7019)
104
Figure 6-5 Experimental and Simulated Terminal Voltage of Test 5 (SOH=6354)
105
Figure 6-6 Experimental and Simulated Terminal Voltage of Test 6 (SOH=5306)
106
Figure 6-7 Change of Internal Resistance in Different State of Health (Battery 1)
107
Figure 6-8 Change of Internal Resistance in all 6 Batteries 108
1
Chapter 1
Background and Objectives of
the Project
11 Overview
Fossil fuels have been the main energy resource in recent human history although
their continuing use has been shown to have a detrimental effect on the
environment The principal problem for fossil fuels is that they cannot be
reproduced within a short period of time so it is a finite energy supply source If
current consumption rate continues they will be exhausted in a few generations
from now Fossil fuel has never been considered as a clean-resource because there
is an emission of noxious gasses including CO CO2 NOx SOx and HC into the
atmosphere With all the pressure from the problems associated with the fossil
fuel exploration of the usage of renewable energy is becoming an increasingly
important issue
Wind energy hydro energy and solar energy are three of the most important
renewable energy sources and they have been implemented on a large scale wind
energy has produced a annual global total of 65019 times 1012 Wmiddoth
(74223 MWtimes24htimes365 days) (Anon 2006) energy in the year 2006 and hydro
2
energy is about 304 times 1015 Wmiddoth (30404 times 1012 Wmiddoth) (Anon 2007) Solar energy
resources are estimated at about 10694times1015 Wmiddoth (3850times1021 J) (Smil 2007) To
compare with the worldwide energy consumption of 13097times1015 Wmiddoth in the year
2007 it is clear that renewable energies have a significant role to play (Anon
2007)
However the problem of the implementation of the renewable energy is that the
electricity generated is intermittent and the power systems are experiencing the
problem of rapidly changing power demand Therefore the management of the
energy is an important issue Devices of energy storage should solve these
problems in theory
12 Review of Energy Storage Systems
Not only giving a large scale energy solution energy storage devices are also
commonly used in a range of applications related to everybody Different energy
storage technologies are suited to different applications and consideration must be
made in order to select the correct solution for each application This section will
give an overview of the existing energy storage systems
121 Applications of the Energy Storage Systems
Large scale energy storage systems which are also called grid energy storage
refer to the methods used to large-scale store electricity within an electrical power
grid Off-peak energy is stored during times when production (from power plants)
3
exceeds consumption and the stores are utilized at times when consumption
exceeds production In this way electricity production need not be drastically
scaled up and down to meet momentary consumption ndash instead production is
maintained at a more constant level
Despite the applications in grid scale the energy storage systems are also popular
in a number of areas For example they are usually used to optimize the energy
generated from the engine in modern electrical hybrid vehicles One such
application is in a shunter locomotive A shunter is a small railroad locomotive
intended for assembling trains ready for a road locomotive to take over
disassembling a train that has been brought in and switching a train to another rail
at the rail terminals The duty cycle of a shunter is characterised by short duration
high power demands (accelerating a rake of vehicles) and the long periods of
idling while the train waits for other operations Comparing to traditional shunter
locomotive that use diesel engines only for the whole duty cycle hybrid shunter
locomotives with energy storage devices can have a 40-70 reduction in fuel use
(RailPower Hybrid Technologies nd) This saving is made by operating the prime
mover at its optimum
Another application of energy storage in the vehicle technologies is the
regenerative braking system which is used to save the braking energy of vehicle
The potential of this technology to save energy for a vehicle is depends on the
duty cycle (Lu Meegahawatte et al 2008) which is characterized by storing the
energy generated when the vehicle is decelerating and releasing when accelerating
4
Energy storage devices are also very popular in stationary applications also
known as the Uninterruptible Power Supply (UPS) systems This system is
designed to meet the power demand when problems like power failure happen and
it is important especially in the applications where power failures could have
serious consequences for example in hospitals and computer centres (Berndt
2009)
The energy storage devices in the UPS system are often used to achieve
ldquouninterruptiblerdquo in a short period before the secondary power supply started
When a power problem occurs the energy storage device starts to supply
electricity immediately and at the same time the generator begins to start When
the generator is ready to supply sufficient power the energy storage device stops
providing power When the grid power is recovered the energy storage device can
be recharged until full
122 Review of the Existing Energy Storage Devices
There are various kinds of energy storage systems including pumped hydro
compressed air flywheel supercapacitors electrochemical and also
superconducting magnetic Each technology is suited to different applications and
careful consideration must be made in order to select the correct solution for each
application
Pumped hydro is the oldest and the most effective kind of large scale energy
storage method which have been used for nearly a century since 1929 (Juvonen
5
2003) Two large reservoirs at different altitudes with a pump a turbine a motor
and a generator are employed to collect the off-peak energy The water is released
from the higher one through a turbine to generate electricity during peak load
period
Compressed air is a pneumatic energy storage method that refers to the air kept
under a certain pressure This system can be used in grid energy storage that the
air can be stored by compressors during periods with low power demand This
compressed air can be released to a generator to meet the high power demand
during peak time (Glendenning 1981 Ter-Gazarian 1994 Juvonen 2003) In some
applications the compressed air is released through a combustor mixed with
natural gas to obtain a higher overall efficiency
A capacitor is an electrical device that can store energy in an electric field
between a pair of conductors and is often used in circuits for short term energy
storage It blocks the circuit to hold DC voltage Supercapacitors are energy
storage devices with the same principle but with a higher energy density The
power density of the supercapacitor systems can be very high but the energy is
often released in a very short duration (Ter-Gazarian 1994) As a result the
supercapacitors are usually used in applications of an energy burst
Superconducting magnetic energy storage system stores energy in the magnetic
field generated by direct current in a coil Instead of traditional wires like copper
superconductors are employed to avoid the energy consumptions as heat because
of the resistance A problem is that the optimal operating temperature for
6
superconductors is 50-77K a refrigerator is therefore necessary in the system for
cooling down
Flywheels are considered as a method of storing mechanical kinetic energy by
accelerating a flywheel to a very high speed to store the energy and decelerating
to release the energy Flywheels are very efficient for short duration storage cycles
due to their fast response speed These energy storage devices are used mainly in
applications that demand kinetic energy storage and high numbers of deep
discharge cycles
Electrochemical energy storage stands for the device capable of converting
chemical and electrical energy to each other by chemical reactions Batteries are
the most common technology of electrochemical energy storage methods The
oxidation and reduction reactions in the two electrodes of battery lead to the
current through the external circuit when discharging to provide energy The
secondary battery can be recharged by applying electrical current which reverses
the chemical reactions that occur during the discharge
Fuel cell is another technology with very high energy density that converts the
chemical energy in a source fuel into an electrical current The fuel cells are
considered as the ldquoenvironmental friendlyrdquo as the only by-product is water The
working principle of fuel cells when discharging is the same as the batteries but
unlike the batteries the fuel cells do not need recharge as they only provide
electrical energy while the active chemicals are supplied to the electrodes (Mantell
1984 MPowerSolutionsLtd nd)
7
Figure 1-shows the Ragone chart of the energy and power density of some energy
storage systems
Figure 1-1 Power density vs energy density plot (MPowerSolutionsLtd nd)
123 Review of Batteries
The preceding discussion has identified that energy storage devices are becoming
increasingly important in both stationary and mobile applications Battery as the
most popular energy storage device is studied in this section
There are two different types of batteries applied in a large range of areas now
Primary batteries and Rechargeable batteries Primary batteries which are also
called disposable batteries often have higher energy densities than the
rechargeable ones and they have a lower self-discharge (Ter-Gazarian 1994)
8
However as the chemical reactions in these batteries are not reversible and the
active materials cannot be restored to their initial forms these batteries cannot be
reliably recharged The primary batteries are intended to be used once and then
discarded therefore they are not suitable for the energy storage systems
Rechargeable battery is the other type of the electrochemical batteries which is
also known as secondary battery because their electrochemical reactions are
electrically reversible There are many different rechargeable battery technologies
in which only four of them are leading the world market nickel-cadmium nickel-
hydride lead-acid and lithium-ion (Berndt 1993 Berndt 2009)
The Nickel-cadmium (NiCd) battery is a kind of rechargeable battery that uses
nickel oxide hydroxide and metallic cadmium as electrodes and an alkaline
electrolyte (often potassium hydroxide) (Mantell 1984) As designed to compete
the primary batteries the NiCd batteries are often manufactured in the same size
and they are used in the consumer market as primary batteries for example in
clocks toys radios and cordless tools However when the NiCds are substituted
for primary cells the lower terminal voltage and smaller ampere-hour capacity
may reduce performance as compared to primary cells The most attractive feature
of the nickel-cadmium batteries is that they are more difficult to damage
comparing with other batteries during deep discharge cycles They can also
sustain more cycles and the lower internal resistance can also help achieve a
higher maximum discharge rate A problem preventing the large scale application
of this battery technology is that the nickel-cadmium batteries suffers faster self
discharge rate than other rechargeable batteries and the cadmium used as the
9
active material in one of the electrodes is toxic and expensive (Zhang Liu et al
2010) Furthermore the capacity loss caused by the continuously discharge and
recharge to the same state of charge called ldquomemory effectrdquo is also a very
important issue of the nickel-cadmium batteries (Sato Takeuchi et al 2001)
The nickel-metal hydride (NiMH) battery is a type of secondary electrochemical
battery that designed to substitute for the nickel-cadmium cells They have a
similar size and a similar cell voltage but with more advantages By using
hydrogen-absorbing alloy as negative electrode instead of cadmium this
electrochemical technology is considered as ldquoenvironmental friendlyrdquo because of
the absence of toxic cadmium (Berndt 1993) The nickel-metal hydride batteries
also have low internal resistance and the high cycle durability as the NiCds and a
NiMH battery can have two to three times the capacity of an equivalent size
nickel-cadmium battery However the nickel-metal hydride batteries also have a
similar high self-discharge rate as the nickel-cadmium batteries (Lee Lee et al
1996) and it also cannot afford complete discharges Memory effect from
repeated partial discharge can occur in a NiMH battery but this is reversible
through charge cycling (Berndt 2009)
The lead-acid batteries are the oldest type of rechargeable battery with a history of
over 150 years but they are still the most popular battery chemistry for
applications such as engine starting or backup power systems as there is no
cheaper alternative when weight is not a factor This technology uses lead and
lead dioxide as electrodes and an acid electrolyte of sulphuric acid and the
advantage of this configuration is that the electrolyte takes part in reactions of
10
both electrodes and both electrodes turn into lead sulphate when discharging
(Berndt 1993 Berndt 2009) The lead-acid batteries can be designed for not only
deep discharge cycles but high discharge rate or compromise of the two cycles
They have a lower self-discharge rate compared with the nickel batteries and they
also do not suffer from the memory effect (Mantell 1984 Berndt 2009) However
as the energy density of lead-acid battery is not high it is seldom applied in the
portable electronics Another important problem is that the lead-acid batteries
must be recycled as the active material ldquoleadrdquo is toxic to both the environment and
the human bodies (Bernardes Espinosa et al 2004)
The lithium-ion (Li-ion) batteries are almost the perfect cell chemistry and are
currently used a wide range of consumer electronics products including cameras
cell phones laptops etc They have many attractive performance advantages
which make them also ideal for higher power applications such as automotive and
standby power First of all the lithium-ion batteries have the highest energy
density in all the rechargeable battery now which is about 4 times better than
lead-acid (Jacobi 2009) They are also capable for deep discharge and high
discharge rate with a relatively slow self discharge There is no liquid electrolyte
in the lithium-ion batteries which means they are immune from leaking However
just opposite to the lead-acid batteries the most serious problem that discourages
the lithium-ion batteries is the low economic efficiency comparing with the lead-
acid batteries Other factors like the stability of the chemicals and the recycling of
lithium should also be concerned because of the chemical activeness of lithium
Table 1-1 is gives some basic properties of the four major rechargeable batteries
11
introduced above There are also some less common battery chemistries used by
rechargeable batteries in addition to these technologies including nickel-zinc
(NiZn) nickel-iron (NiFe) etc but they have a small market share For the four
major battery chemistries lead-acid batteries with their low price and high
flexibility is adopted in a wide range of application areas
Table 1-1 properties of the rechargeable batteries (Wikipedia nd)
Type Voltage
(V)
Energy Density (Whkg)
Power Density (Wkg)
Self Discharge
rate
Cycle Durability
Nickel-Cadmium
12 40-60 150 20 1500
Nickel-Metal-Hydride
12 30-80 250-1000
20 1000
Lead-Acid 21 30-40 180 3-4 500-800
Lithium-ion 36 160 1800 5-10 1000-1200
124 The Management of Batteries
In the areas that batteries are employed as the energy storage device it is a critical
issue to consider that whether there is enough energy in the battery to meet the
demand However batteries do have the problem in limited cycle durability that
is when a battery is charged and discharged for a number of cycles its total
capacity decreases If the battery cannot offer sufficient powerenergy it should be
replaced at the right time But the problem is that it is difficult to quantify the
capacity loss and when the capacity of battery is no longer sufficient for a
particular application Due to the limitation of batteries it is essential to develop a
method to determine the capacity of battery that subjected to various duty cycles
in a number of applications
12
13 Project Objectives
The main objective of the project is to develop a method which can determine the
key parameters of batteries from the discharge tests The proposed methodology is
a model based approach that is to develop a mathematical model of the battery
which can represent the dynamic performance and battery status and
characteristics can be investigated through the analysis of the model
The first step of the project is to build a mathematical model of battery The
dynamic model is expected to reflect the relevant behaviours of battery when
being discharged including the characteristics of State of Charge Depth of Charge
Electromotive force Terminal Voltage The unknown parameters in the model are
identified by using Genetic Algorithms (GAs) with the laboratory experimental
data Afterwards some batteries are tested in experiments and the parameters in
different state of health are recorded to analyze the battery in different status of
battery
The focus of this work is to develop a suitable method for parameter identification
for common battery systems The lead-acid battery has been chosen because it has
relatively well defined properties and there is a wealth of literature describing the
performance of these types of batteries From an experimental view point they are
also readily available of low cost
13
14 Outline of the thesis
The thesis is organized into seven chapters and the first chapter presents the
background and motivation of the research project The remaining chapters are
briefly described as follows
Chapter 2 gives an overview of lead-acid batteries including the development
working principle and also some modern battery designs and technologies In the
second part of chapter 2 important concepts for a battery including electromotive
force capacity state of charge internal resistance and state of health are
introduced and some mathematical descriptions of these concepts are discussed
Chapter 3 starts from some requirements of the mathematical model designed for
this project and several different methods of battery model approaches are
discussed Afterwards some details of the dynamic mathematical model are
analyzed The initial battery model is described in the last part of this chapter that
summarized the equations of the battery
Chapter 4 is mainly focused on some improvement of the mathematical model
described in chapter 3 In the first section of chapter 4 the experimental test rig in
the project is introduced Some findings in the experimental tests is then listed and
studied and integrated into the improved model Finally the SIMULINK
implementation and a simulation study are given
Chapter 5 presents a method of model parameter identification The principle of
14
Genetic Algorithms is studied at first Then this algorithm is employed in the
model and the parameters of the model are identified with the help of
experimental tests This chapter also includes the validation of battery model
using two other groups of test results
Chapter 6 develops an algorithm that can reflect the state of health of a lead-acid
battery In this chapter the internal resistance parameters are measured under
different state of health through a group of continuous experimental tests The
change of internal resistance under a specific working condition is then related to
the battery state of health
Finally Chapter 7 gives a summary and the conclusions of the project Also the
future works that can be improved are proposed in this chapter
15
Chapter 2
Introduction of Lead-acid
Batteries
This chapter gives an overview of lead-acid batteries including background
knowledge working principles explanation of terminologies technologies and
applications encountered for this technology The chapter presents the
fundamental knowledge and prepares for the project work to be reported in the
following chapters
21 A General Overview of the
Lead-acid Battery
The lead-acid battery is the oldest type of rechargeable battery The first example
of a lead-acid battery can be attributed to the German physicist Sinsteden who
published the performance data of this battery system in 1854 (Berndt 1993)
Later in 1859 the French physicist Planteacute realized that a plate construction was
required to achieve a much larger effective surface area and he produced the first
rechargeable battery which was marketed for commercial use by alternately
charging and discharging lead sheets immersed in sulphuric acid This method
has remained unchanged and still in use today in stationary applications (Berndt
16
1993 Wikipedia nd) One of the first applications of lead-acid batteries was for
storing electrical energy for telegraphy systems The capacity required for these
applications was low and the battery at that time was not yet suited to high power
industrial applications (TNI_Ltd 2007)
In 1880 a French chemical engineer Faureacute significantly improved the design of
the lead-acid battery by producing the active materials separately His method was
to coat the lead plate with a paste of lead oxides sulphuric acid and water in a
warm humid atmosphere The paste then changed into a mixture of lead sulphates
which adhered to the lead plate as an electrochemically active material As a result
of this technology the Faureacute cells are able to achieve much higher capacity with
the first charge in comparison with the Planteacute ones (Berndt 1993 TNI_Ltd 2007)
The problem of these plates is that they are not very durable and become weak
only after a few dischargecharge cycles The lead grid alloyed with antimony or
calcium was developed to improve the mechanical characteristics The holes on
the grid are able to achieve improved bonding thus the batteries may have a longer
lifetime This advantage led to the industrial manufacturing of lead-acid batteries
In 1881 a lead electrode with a ribbed surface was designed in order to have a
large effective surface of the active material and this was the pioneer of the large
surface plates which are still common today (Berndt 1993 TNI_Ltd 2007
Wikipedia nd)
In the beginning lead-acid batteries were operated in open jars The advantage of
this feature was that the electrode can be cleaned and exchanged easily but faced
the problem of water evaporation Therefore the early batteries have to refill water
17
in order to continue normal use However this problem can be dramatically
reduced when the cells were fitted with covers to limit the evaporation (Berndt
1993) This kind of battery design is known as a lsquoflooded lead-acid batteryrsquo
In the 1950s a new type of battery which was aimed to become spill-proof was
designed and manufactured on a large scale This type of battery is characterized
by an immobilized electrolyte however this kind of spill-proof battery was only
manufactured in small sizes up to about 10 Ah (Berndt 2001) Later the
combination of a valve improved the characteristic features of the lead-acid
battery and this kind of battery is still common today and is known as the Gel
Lead-acid battery (Berndt 1993) In the 1970s micron diameter glass fibres
originally designed for air filters were used in glass mats which absorbed the
electrolyte and acted as separator Soon this kind of Absorbent Glass Mat (AGM)
battery appeared in market for stationary application
Currently Valve Regulated Lead Acid (VRLA) batteries based on both AGM and
Gel electrolytes are available in a large range of capacities for both stationary and
mobile power applications with a range of different designs for each type of
application Arguably the most important application of lead-acid batteries is for
vehicle engine starting The battery employed in this application which is called
Starting Lighting and Ignition (SLI) batteries are designed to deliver bursts of
energy usually in a discharge current as large as several hundred amperes in a
very short time A different type of battery construction can produce batteries
capable of deep cycling which are more suited to slow discharge cycles (Tuck
1991 Anon 2007)
18
22 Configuration of Lead-acid Batteries
This section gives a brief description of the working principles of lead-acid
batteries and how the battery can be configured to suit different applications
221 Electrochemical Principles
The lead-acid battery comprises two electrodes and the electrolyte The structure
of the lead-acid battery is shown in Figure 2-1 in which one electrode is Cathode
and the other is Anode The active matter in the positive plate is made of lead
dioxide (PbO2) and that in the negative plate is made of lead (Pb) and the
electrolyte is sulphuric acid One electrode can serve either as a Cathode or as an
Anode depending on which process the battery is experiencing - charging or
discharging With this structure a battery could convert electrical energy into
chemical energy and back again which is associated with the process of charging
and discharging
(a) (b)
Figure 2-1 Working Principle of Lead-Acid Batteries (a) shows the battery when
19
discharging and (b) is when charging with a DC charger
For the discharging process as shown in Figure 2-1 (a) the negative plate acts as
the anode and the positive plate is the cathode If a wire is connected between the
two the excess electrons from the anode will travel through the wire as a current
to the cathode where they are needed to complete the electron deficient reaction
there The chemical reactions in a lead-acid battery when discharging are
described as follow
Negative plate reaction (Anode)
+minusminus+rarrminus+ HPbSO2eHSOPb 44
Positive Plate reaction (Cathode)
O2HPbSO2e3HHSOPbO 2442 +rarr+++minus+minus
For the charging process an external power source is connected to the two
electrodes with the voltage as shown in Figure 2-1(b) In this way the flow of
electrons is forced backwards against the electropotential and the reactions are
driven backwards changing the lead sulphate back into lead and lead dioxide on
the negative and the positive plates and restoring the sulphuric acid to the liquid
electrolyte The anode when a battery is charging is the positive plate and the
cathode is the negative plate and the chemical reactions in a lead-acid battery
when charging are described as
Positive plate reaction (Anode)
+minusminus++rarrminus+ 3HHSOPbO2eO2HPbSO 4224
Negative plate reaction (Cathode)
minusminus++rarr++ 44 HSOPb2eHPbSO
20
The thermodynamic heat effects caused by the reactions are small in the lead-acid
battery because the difference between the enthalpy and the free enthalpy is very
small The rate of reversible heat effect in the reaction is 132 kJ per mol of the
cell reaction which corresponds to about 35 of the total energy converted when
the lead-acid battery is discharging or charged This amount of energy is relatively
small and is generated over a comparatively long period of time so it is usually
easily dissipated through radiation and convection (Berndt 1993)
222 Lead-Acid Battery Types and Technologies
The flooded battery is the simplest type of lead-acid battery in use Flooded
batteries are common for some traction applications despite the requirement in
high maintenance They are also very common for large capacity backup power
supplies for telecommunication computer centres grid energy storage and off-
grid household electric power systems Since the flooded batteries are not sealed
they must be kept upright to avoid acid spills and water must be periodically
added to top up the liquid electrolyte The most attractive feature of the flooded
battery is that they are able to withstand certain level of overcharging without
damage providing proper maintenance is carried out
The Valve Regulated Lead-Acid (VRLA) battery which is often colloquially
called the sealed lead-acid battery is becoming more and more popular in many
applications Because VRLA batteries are mostly sealed the electrolyte
evaporation will be reduced and spillage can be largely avoided when
overcharging which are very common in flooded batteries The electrolyte of the
21
VRLA battery is designed to be immobilized so the VRLA batteries will not leak
if inverted pierced or if the container is broken They can be mounted in any
orientation and position even immersed in water The immobilization of the
VRLA electrolyte can be achieved by using an absorbent mat separator as well as
gelling materials
In Absorbent Glass Mat (AGM) battery the electrolyte is absorbed into a mat of
fine glass fibres in order to immobilize the electrolyte In addition the pores in the
mats are fine enough to prevent the lead dendrites in the cathode from growing
through as a separator and only glass is wetted enough by sulphuric acid can soak
the separators The glass mats can therefore be used to insulate the electrodes
Gelling is another way to immobilize the electrolyte and this gelling technology at
present is only applied for lead-acid batteries The idea is to mix the sulphuric acid
with silica fume (SO2) which makes the electrolyte gel-like The mixture is stable
over a long term environmental safe and easy to work technically (Berndt 1993)
The sulphuric acid bound by the gel can also insulate electrodes as a separator
similarly with that in an AGM battery
VRLA batteries including both gel and AGM batteries are able to recombine and
reduce the emission of gases during overcharge so the requirement for the room
ventilation is reduced and there is no acid fume emission during normal discharge
(Berndt 1993 Anon 2007 Wikipedia nd) Although the generation of hydrogen
can be slowed down it cannot be avoided completely As a result a valve
regulation safety system is employed in VRLA batteries which vents the gases in
22
the battery only during over pressure faults (Tuck 1991 Berndt 1993)
However the VRLA batteries do have some drawbacks First of all the VRLA
batteries tend to have a lower specific energy density than flooded batteries and
they are also more expensive An accurate charging control is very important for a
VRLA battery especially when charging under high temperature environments
since it is not possible to cure the damage caused by overcharge
223 Battery Designs for Different Applications
Lead-acid batteries are deployed in a range of applications Different designs are
therefore required due to the different working environments and duty cycles SLI
batteries are designed for a burst of energy for cold-cranking an engine A SLI
battery is supposed to provide power only in the first few seconds when starting
an engine and will be recharged immediately once the engine is started In this
kind of lead-acid batteries a larger surface area of the electrode plates is used to
provide high electric current in a short period However repeated deep discharge
may shorten the battery lifetime
On the other hand deep cycle batteries are designed for applications where the
batteries are regularly discharged The plates of the deep cycle batteries are often
very thick in order to withstand the frequent and deep discharge cycles The plate
surface area of a deep cycle battery is not as large as a SLI battery and as a result
it is not possible to offer great power
23
Marine batteries are a compromise between a SLI battery and a deep cycle battery
Standby batteries can be classified as marine batteries which are used for backup
power supplies and providing the power in emergency situations They are
designed for a long lifetime and a large capacity but repeated discharges and high
current drain are not the intended application Traction batteries are designed for
higher current drain and repeated deep discharge cycles They are usually bigger
and heavier than other types of lead acid for the same voltage and capacity but
that is the cost of durability
23 Mathematical Descriptions of Lead-acid
Batteries
In order to investigate the relationship between the battery behaviour and
remaining lifetime for a lead-acid battery initial studies have been carried out and
are described in this chapter Concepts including Capacity State of Charge (SOC)
Depth of Charge (DOC) State of Health (SOH) and internal resistance are
introduced and quantitative descriptions of these concepts are listed
231 Capacity
The capacity of a lead-acid battery represents how much charged energy the
battery can offer which is usually described in Ampere-hours (Ah) The charge
capacity of a battery is decided by the construction factors of a battery cell This
includes the materials contained in the electrodes and the acid solution In
addition the capacity of a battery is not a fixed quantity but varies according to
24
how quickly it is discharged This is known as Peukertrsquos law (Ceraolo 2000
Dhameja 2001 Rand Moseley et al 2004)
tICk
p = (21)
where pC is the capacity on one-ampere discharge rate which is a constant
I is the discharge current (A)
t is the time of discharge (h)
k is the Peukert constant and for a lead-acid battery with the value
between 11 and 13 (varies for each individual battery)
It is common to refer to ldquoCnrdquo as the capacity of battery in Amp-Hours which
corresponds to complete discharge of the battery in n hours ldquonrdquo is a subscript that
represents the discharge rate In industry the capacity under ten-hour discharge
rate (C10) is always taken as the nominal capacity
232 Electromotive force
The electromotive force of a battery cell is the difference between the electric
potential of the two electrodes of each cell (Rand Moseley et al 2004) The
potential of each electrode which is called half cell potential is decided by the
chemical reaction and the relative activities of the solution and can be obtained
from Nernstrsquos equation (Crompton 2000)
25
Ox
Redln0
α
α
zF
RTEE minus= (22)
where E is the half-cell potential (V)
0E is the standard half-cell potential (V)
α is the relative activity of the oxidizer (α Ox) and reducer (α Red)
z is the number of electrons transferred in the cell reaction
R is the universal gas constant which is 8314472 JKminus1molminus1
T is the absolute temperature
F is the Faraday constant the number of coulombs per mole of electrons
and F = 964853399times104 Cmolminus1
At room temperature RTF is a constant of 25693mV for cells therefore
Ox
Redlog
z
V05910
Ox
Redln
z
mV69325
Ox
Redln 10
α
α
α
α
α
α==
nF
RT
The Nernstrsquos Equation therefore can be expressed by
Ox
Redlog
V0591010
0
α
α
zEE minus= (23)
The electromotive force could be calculated by the difference of the electric
potential
cathodeanode EEEMF minus= (24)
When a lead-battery is discharging the electromotive force can be written as
26
O)(H
)(SO)(Hlog
V05910
2
2
24
10
00
α
ααminus+
+minus=z
EEEMF cathodeanode (25)
The standard half-cell potential of the anode 0
anodeE is equal to 1685 (PbO2-
PbSO4SO42-) and that of cathode
0
cathodeE is -0356 (Pb-PbSO4SO42-) which are
constants for the same battery chemistry And the number of electrons transferred
( n ) is 2 for a lead-acid battery
Therefore the electromotive force of a lead-acid cell can be obtained by
O)(H
)(SO)(HlogV029600412
O)(H
)(SO)(HlogV02960)3560(6851
2
2
24
10
2
2
24
10
α
αα
α
αα
minus+
minus+
+=
+minusminus=EMF
(26)
This electromotive force of a battery cell is numerically equal to the open circuit
voltage which means that the terminal voltage of a single cell battery when it is
disconnected from the external load For a lead-acid cell the electrochemical
force at fully charged is between 210-213V per cell
233 State of Charge and Depth of Charge
State of charge (SOC) and depth of charge (DOC) are variables that can describe
the battery charge The main difference is that the SOC describes the percentage
of remaining charge relative to the nominal capacity while the DOC represents
that relative to the actual capacity under a specific discharge current These two
27
variables can be obtained by calculating the charge consumed and the battery
capacity
101 CQSOC eminus= (27)
Ie CQDOC 1minus= (28)
where Qe is the charge consumed by the load (Ah)
C is the nominal capacity (Ah)
CI is the actual capacity under the discharge current I (Ah)
234 Internal Resistance and State of Health
The internal resistance of a lead acid cell is the physical resistance of the cell The
value of the internal resistance is decided by many different factors But it could
be obtained by a simple equation
I
VVr tOC minus
= (29)
where Voc is the open circuit voltage (V)
Vt is the terminal voltage when discharging (V)
I is the discharge current (A)
However the factors in this equation are only a method of calculating the internal
resistance but not the determinants It is shown in applications that the internal
resistance of a lead-acid battery will increase when discharging as the SOC and
28
the DOC drops
It is common for batteries to suffer a capacity loss when discharged and charged
in a number of duty cycles even when idle Aged batteries are often weak and
sometimes not able to offer enough charges Therefore they should be replaced or
maintained State of health is a defined variable that is important for a weak
battery This variable is to show how weak the battery is and represents the
percentage of remaining capacity to the initial capacity when the battery is brand
new (Okoshi Yamada et al 2006) as shown in the equation
new
weak
C
CSOH = (210)
where Cweak is the remaining capacity of a weak battery (Ah)
Cnew is the capacity when the battery is brand new (Ah)
The reason for the capacity loss is complex but is usually due to the sulphation
Sulphation is a process when the amorphous lead sulphate which is easily
converted back to lead lead oxide and sulphuric acid converts to a stable
crystalline form coating the electrodes This form of lead sulphate cannot conduct
electricity and cannot be converted back to lead lead dioxide and lead sulphate
under normal charging conditions The internal resistance of a lead-acid battery
therefore increases and less charge can be provided when discharging Complete
or repeated deep discharges of a battery at low current densities that lead
excessive utilization of the active material are the most critical reason for
29
capacity loss for example a discharge of a traction battery that draws more than
80 of its nominal capacity (Berndt 1993)
235 Multi-Cell Lead-Acid Batteries
In most applications of batteries the voltage of an individual cell is not enough to
provide the sufficient voltage and power supply The solution is usually to series
connect a number of cells in a battery in order to achieve a higher battery voltage
The electromotive force of a series of lead-acid battery cells is directly related to
the cell numbers as well as the charge state of each cell For a six-cell lead-acid
battery which is a standard for most common usages the fully charged
electromotive force is about 128V The internal resistance of a multi cell battery
however is also equal to the sum of the internal resistances of each cell
Usually all the cells in a multi-cell battery should be constructed in the same
manner and in particular the capacity should be consistent because the capacity of
a multi-cell battery will be limited to the cell with the lowest capacity If one of
the cells fails it is not possible for the current to flow through the cell and the
battery is therefore disconnected from its internal cell loss Also if the SOC of one
particular cell drops faster than others in a battery the electromotive force of that
cell may affect the whole behaviour of the battery
24 Summary
The technology development of lead-acid batteries has been continuous over the
30
last 150 years From the earliest open cell batteries different advanced battery
configurations are now available which have been adopted in a wide range of
applications Meanwhile a number of solutions have been developed to address
the battery problems encountered in applications such as electrolyte evaporation
spillage and the electrolysis of electrolyte when charging However there are still
issues affecting the efficient and safe use of lead-acid batteries for example
determination of the SOH which if addressed in a robust manner would lead to
significant improved battery management system performance This chapter has
presented the essential fundamental knowledge technology terms and working
principles of lead-acid batteries which is served as a preparation for further study
reported in the following chapters of the thesis
In order to reveal the dynamic behaviour of a battery under different SOH and
identify the suitable strategy for SOH determination the mathematical modelling
study is carried out and an equivalent circuit model is derived in the next chapter
The key concepts of the battery model are explained and the fundamental analysis
is given for the concepts introduced
31
Chapter 3
Equivalent Circuit Modelling
of Lead-acid Batteries
In order to estimate the status of a battery a model based approach is adopted in
the project A mathematical model for lead-acid batteries should be developed
with a suitable level of abstraction This chapter describes the requirements to the
model to serve the project objectives and reviews the available model
technologies An improved mathematical model for lead-acid batteries is
introduced in the late part of this chapter
31 Requirements for the Battery Model
The main objective of the project is to develop an algorithm that can determine
the battery health by monitoring the battery status during discharge cycles This
algorithm is designed for implementation in a battery health monitoring system
with life-time prediction capabilities This prediction system is intended to work
on applications where the battery performance is of great importance for instance
hospital UPS systems and vehicle ignition systems To achieve the objective the
requirements to the mathematical model can be defined as
Requirement 1 The model should be able to calculate the evolution of key
battery parameters including terminal voltage cell temperature the state of health
32
and the internal resistance which describe the condition of the battery for
dynamical discharging It should also be able to adequately represent dynamic
processes while the battery is discharging
Requirement 2 The complexity of the model must be sufficient to satisfy the
requirement 1 but must also be executable in real-time for a model-based
condition monitoring system
Requirement 3 The output of the battery model should be understandable to the
battery operators and technicians as well as meaningful to those who do not have
any background in battery technologies
32 Overview of Battery Model Techniques
A number of different types of battery models have been used to serve as a tool in
solving a range of problems (GONG 2005) These include Electrochemical
Models Computational Fluid Dynamics Models Finite Element Models and
Equivalent Circuit Models This section gives an overview to the above named
four different types of battery models and the problems which are addressed by
each of them In Section 324 every battery model technology is assessed against
the overall requirements
321 Electrochemical Model
Electrochemistry is a branch of chemistry that studies chemical reactions which
33
take place in a solution at the interface of an electron conductor (a metal or a
semiconductor) and an ionic conductor (the electrolyte) The reactions involve
electrons transfering between the electrode and the electrolyte or species in
solution The application of electrochemistry research directly leads to the
development of the lead-acid batteries
Behaviour of a battery depends not only on how the battery is used but also on a
number of construction factors (Ruetschi 2004) These factors include but are not
limited to the thickness of the plates the active mass density of the active
material the concentration of the acid solution and the geometry of the electrodes
(Berndt 2001 Ruetschi 2004)
The electrochemical model is mainly focused on the oxidationreduction reactions
between the electrolytes and the electrodes By analyzing the consistency of each
matter in the solution and the electrochemical reaction caused by the connection
of electrodes to external circuit it is possible to represent the dynamic behaviour
of the battery (Crompton 2000)
322 Physical Models
The finite element method is a numerical analysis technique for finding
approximate solutions of partial differential equations as well as of integral
equations The basic principle of the Finite Element Model (FEM) is to divide the
problem into elements and each element is a smaller problem to be solved so that
they could be analyzed separately The lsquoelementsrsquo are then be assembled together
34
to restore the initial problem
Finite element is a very popular method of analysis in those areas with a complex
geometry and it is good at stress and thermal analysis For batteries the Finite
Element Models can help with a good understanding of the heat loss and that for
vibration problem in mobile applications There are also attempts to analyze the
current density on the positive grid bar in a lead-acid battery using FEM (Ball
Evans et al 2002)
Computational Fluid Dynamics (CFD) technology is a well-established tool for
physical analysis and optimization of fluid flow mass and heat transfer and
related phenomena (eg chemical reactions) that may simultaneously take place in
a complex system (Liaw Gu et al 1997) Computers are used to perform millions
of calculations required to simulate the interactions of fluids and gases with the
complex surfaces used in engineering
In a CFD Model of a battery the dynamic governing equations are solved with
respect to time space and all the physical time and space dependent properties
Acid concentration and potential distribution across the cell for instance can be
obtained Therefore such a modelling is able to give a very good understanding to
battery parameters and detailed characteristic of battery dynamics
323 Equivalent Circuit Model
An equivalent circuit refers to the simplest form of a circuit that retains all of the
35
electrical characteristics of the original (and more complex) circuit In its most
common form an equivalent circuit is made up of linear passive elements
However more complex equivalent circuits are used to approximate nonlinear
behaviours of the original circuit as well
In electrical engineering it is often useful to use an equivalent circuit model to
describe the non-ideal operation of a device For electrical engineers electrical
models are intuitive useful and easy to handle especially when they can be used
in circuit simulators and alongside application circuits
324 Discussion of Different Battery Model Methods
The electrochemical model focuses on the electrochemical reactions and the
activities in the battery which is very popular in the applications for the
constructional and design purpose However many electrochemical factors
contained in the electrochemical model are irrelevant to the external circuit and
some of the important parameters like the internal resistance are hard to describe
in an electrochemical model Therefore this model technology is not able to meet
the project Requirement 1 As the calculations in the electrochemical model are
not complicated Requirement 2 can be therefore satisfied by an electrochemical
model of battery Requirement 3 might be difficult to obtain for an
electrochemical model because the understanding of the outputs for an
electrochemical model usually need some background knowledge of the battery
chemistry As a result the electrochemical model is not chosen for the project
36
Physical models can give good understanding to the battery important parameters
so that Requirement 1 of the project can be satisfied The Requirement 3 can be
also met as the terminal voltage can be calculated as the output with the
knowledge of these parameters One significant disadvantage is that the physical
models involves huge amount of calculation in analysis which is quite time
consuming In finite element or CFD methods a large nonlinear system of
equations is solved iteratively and that could take excessive CPU time especially
for when the system is more than 2 dimensions As a result the physical
modelling methods cannot meet the Requirement 2 of fast response required by
the project (Esfahanian Torabi et al 2008)
In an equivalent circuit model most of the characteristic required by the project
can be reached in a reasonable level It is able to reflect the dynamic behaviour of
battery using simple circuit blocks such as voltage sources resistors and
capacitors (Chen and Rincacuteon-Mora 2006) That is to say the Requirement 1 of
the project can be satisfied by the equivalent circuit model And the model
simplicity causes its low computational time as Requirement 2 and therefore it
can be suited to the online implementation (Esfahanian Torabi et al 2008)
Additionally basic battery parameters like internal resistance terminal voltage
and SOC etc can be chosen as the main output of the model to meet the
Requirement 3
Table 3-1 summarized a comparison of all the three model methods on the
satisfaction of the requirements for the project
37
Table 3-1 Satisfaction of the Requirements in different Model Methods
Requirement 1 Requirement 2 Requirement 3
Electrochemical Model times radic times
Physical Model radic times radic
Equivalent Circuit Model radic radic radic
33 Introduction of the Existing Equivalent
Circuit Models
Section 32 introduced three different types of battery models to serve for different
research purposes each with different features and strengths It has been shown
that the equivalent circuit model that pays attention to the relationship between the
internal circuit and the external characteristics can adequately meet all the
requirements of the project Therefore further studies of battery models have been
carried out and six equivalent circuit battery models with different merits and
complexity are presented while the technique improvements are briefly described
in this section
331 Simple Battery Model
The Simple Battery Model is the simplest battery model As shown in Figure 3-1
this model consists of only ideal battery mE as the electromotive force of a battery
and a resistor r in series connection as the internal resistance bV in the figure is
the terminal voltage of the battery
38
Figure 3-1 Simple Battery Model
The Em in Figure 3-1 stands for the electromotive force of the battery while r
represents the internal resistance and Vb is the Terminal Voltage This model is
only applicable in some circuits where the state of charge is of little importance
because it does not consider the varying characteristic of the internal resistance in
different states of charge The model is often used in circuits where the battery
does not have major influences to the circuit analysis But without being able to
describe the battery behaviours in details this model is not suitable for the
research purpose In the Simple Battery Model the electromotive force mE can be
obtained by open circuit measurement and r can be calculated by measurement
with connecting a load to the battery after taking an open circuit measurement
For a battery with a terminal voltage of 13V and the internal resistance of 05Ω
the change of terminal voltage in a Simple Battery Model as the discharge current
increases can be given as Figure 3-2
39
Terminal
Voltage
Discharge
Current
0
10V
13V
Figure 3-2 I-V chart of the Simple Battery Model
332 Advanced Simple Battery Model
This model is developed based on the Simple Battery Model and has the same
block diagram as the Simple Battery Model The only difference is that this model
employs a variable resistor which depends on the state of charge (CUN
FIORINA et al Durr Cruden et al 2006) The relationship between the value of
the variable resistance and the state of charge is as follow
aSOC
Rr 0
= (31)
where 0R is the resistance of the battery when it is fully charged
a is the capacity coefficient
SOC is the state of charge of battery from 0 (completely discharged) to 1
(fully charged)
6A
40
The most important improvement of this model is that instead of a constant
internal resistor the value of the internal resistance is expressed as equation
function of SOC For the same battery described in section 331 the I-V chart in
different SOCs can be concluded as shown in Figure 3-3
Terminal
Voltage
Discharge
Current
0
10V
13V
SOC=1
SOC=60
Figure 3-3 I-V Chart in different SOC
333 Thevenin Battery Model
The previous models do not account for any transient behaviour of batteries
Figure 3-4 shows the gradual change in battery characteristics when external loads
are connected or disconnected to the battery
6A
41
011
14
125
Terminal
Voltage
t
Figure 3-4 Sketch to show battery discharge behaviours in typical tests
Thevenin Battery Model is one commonly used model which consists of an ideal
battery electromotive force ( mE ) internal resistance (0R ) overvoltage resistance
(1R ) and capacitance (
1C ) and the equivalent circuit is shown in Figure 3-5
(Casacca and Salameh 1992 Salameh Casacca et al 1992 Chan and Sutanto
2000) 1C represents the actual capacitance of battery and
1R represents the
resistance contributed by the contact resistance of the plate and the electrolyte
(Durr Cruden et al 2006) The capacitance in the Thevenin Battery Model can
overcome the trend of terminal voltage shown in Figure 3-4
No load No load Load
42
Figure 3-5 Thevenin Battery Model
The main disadvantage of this Thevenin Battery Model is that all the parameter
values are assumed to be constant but in fact they are strongly dependent on the
state of charge and discharge rate and some other discharge characteristics
334 Dynamic Battery Model
This model is developed based on the Thevenin Battery Model Similar to the
improvements made by the Advanced Simple Model comparing with the Simple
Battery Model the most important difference is that it takes into account the non-
linear characteristic of the open circuit voltage and internal resistance represented
by SOCK (Jayne and Morgan 1986 Sims 1990)
ISOC
KRVV bocb )( +minus= (32)
where bV is the terminal voltage of battery
ocV is the open circuit voltage
bR is the battery terminal resistor typically 01Ω
43
K is the polarization constant
I is the discharge current
335 Fourth Order Dynamic Model
This is a more accurate and sophisticated model The current pI flows through
pR (electrolyte reaction) dR (Ohmic effect) and its associated leakage
capacitance dC and wR (waste of energy) and its associated leakage
capacitance wC Current sI flowing through the resistor sR represents the
behaviour of self discharge (Gillioli and Cerolo 1990 Chan and Sutanto 2000)
The main drawback of this model just as its name indicates is that there are
fourth order equations due to consideration of the paralleled R-C blocks in the
circuit and therefore it takes more time for the computation Another drawback is
that a number of empirical parameters are contained in the model
Figure 3-6 Fourth-order Battery Model
44
336 Improved Battery Model
The most popular Equivalent Circuit Model used by researchers is the Improved
Battery Model (Casacca and Salameh 1992 Salameh Casacca et al 1992) This
model is simple but meets most requirements for a good battery model It contains
most non-linear characteristics and is linked to the state of charge Most elements
included in this model are the functions of the state of charge or the open circuit
voltage which is also related to the state of charge The improved model is
studied in this chapter and implemented in MatlabSIMULINK environment
Figure 3-7 Improved Battery Model
34 Mathematical Model of the Lead-acid
Batteries
As the Improved Battery Model is able to reflect the major dynamic behaviours of
a battery and does not take much computation time it meets the requirements for
45
the project Therefore the mathematical model developed in this project is based
on the Improved Battery Model by involving the components of variable voltage
sources as the electromotive force ( EMF equal to the open circuit voltage OCV )
variable resistors as internal resistance and overvoltage resistance and a capacitor
as the capacitance of battery The description and the detailed analysis of the
model are given in this section
341 Capacity
Based on the Peukertrsquos law introduced in Chapter 2 the relationship of capacity
with different discharge currents is obtained below
2121
2211
)( ttII
tItIC
k
kk
p
=
== (33)
And following the definition of battery capacity the capacity is
12
1
2111
1
21121121121222 )()())(()( I
kkkk
I CIItIIItIIIIItIIItICminusminus
=====
12
1
21 )( I
k
I CIICminus
=there4 (34)
where Cp is the one ampere capacity
CI2 CI1 is the capacity under the discharge current I2 I1
k is a constant that related to the battery
The equation of calculating the capacity by the discharging current can be
46
obtained through experiments (Ceraolo 2000 Barsali and Ceraolo 2002) An
experimental result is given as
m
c
c
IIK
CKIC
))(1(1)( 0
0minus+
= (35)
where )(00 ICC = which stands for the capacity when discharging at the rated
discharge rate usually the nominal capacity C10
cK is empirical coefficient and is 118 for lead-acid batteries
m is empirical coefficient of 120
This equation overcomes the inadequacies of the Peukertrsquos law The capacity
calculated by the Peukertrsquos law in a low discharge current is much larger than that
experimentally obtained (Ceraolo 2000)
With the parameters of 20118124420 ==== kKAIAhC c the simulation
study indicated that the capacities of low discharge rate (lt30A) in different
equations are quite similar as shown in Figure 3-8
47
0 5 10 15 20 25 30 35 40 45 500
10
20
30
40
50
60
70
80
Discharge Current (A)
Actu
al C
apacity (
Ah)
Based on Peukerts law
Based on the Equation 35
Based on the Equation 35
Based on thePeukerts Law
Figure 3-8 Battery Capacity vs Discharge Current
Variations of the cell temperature also affect the battery capacity The effect of
temperature on the battery capacity is described by the following equation
(Ceraolo 2000 Barsali and Ceraolo 2002)
ε
θ
θθ
minus+=
f
ICIC 1)()( 0 (36)
where fθ is the electrolyte freezing temperature and is equal to -40˚C
θ is the cell temperature
)(0 IC is the capacity of battery under the discharge current I at 0˚C
ε is a constant that equals to 129
48
Therefore
m
c
f
c
IIK
CK
IC))(1(1
1
)(
0
minus+
+
=
ε
θ
θ
θ (37)
342 Electric Networks
Figure 3-9 (Ceraolo 2000 Barsali and Ceraolo 2002) shows an adaptation of
electric network based on the improved battery model shown in Figure 3-7 The
major change of this equivalent circuit is that the self-discharge is not taken into
account because the self discharge is usually less than 10 per month in modern
technologies which can be ignored in normal applications
Figure 3-9 Lead-acid Battery Equivalent Network
In the figure mE in this the main branch represents the electromotive force of the
battery and Vb stands for the terminal voltage The mZ in the figure stands for the
internal impedance that can be approximated by two R-C blocks
49
Battery is an energy storage device but not all the energy that the battery gets
from the charger can be stored when a battery is charged Part of this energy is
lost for different reasons like water electrolysis A parasitic branch is therefore
added to the model to represent the energy loss This part is claimed to work only
when the battery is being charged (Ceraolo 2000 Barsali and Ceraolo 2002) In
this project the current of the parasitic branch pI in the figure can be described as
an equation of the voltage of the parasitic branch PNV instead of a simple resistor
pR because of the nonlinear character of the parasitic branch This issue will be
discussed in later sections
As a result of these factors an equivalent electric network of in Figure 3-9 is
designed as shown in Figure 3-10 in which 1C 1R and 0R are the elements of the
internal impedance mZ It is used in the whole project as the electric network of
mathematical model
Figure 3-10 The Equivalent Network with the Approximated mZ
50
343 State of Charge and Depth of Discharge
In Chapter 2 Equations 27 and 28 show the definitions of SOC and DOC of a
battery In the model the nominal capacity can be treated as C(0θ) while the
actual capacity is C(Iavg θ) therefore
)0(1 θCQSOC eminus= (38)
)(1 θavge ICQDOC minus= (39)
where σσ dItQt
e int=0
)()( is the charge already drained from the battery
)0( θC is the nominal capacity of battery
)( θavgIC stands for the actual capacity under the specific discharge
current
344 Electromotive Force of the Battery
The electromotive force of a battery which is Em in Figure 3-10 is the difference
between the electric potential of the two electrodes and can be calculated by the
Nernstrsquos equation (Eq 26)
)(
)()(log029600412
2
2
24
10OH
SOHEMF
α
ααminus+
+=
This equation gives a description of the electromotive force by the activity of
different matter in the sulphuric acid which is described as lsquoαrsquo When the battery
51
is being charged or discharged the electrolyte concentration changes and the
activity value of H+ SO42- and H2O in the Nernstrsquos equation changes which can
be found by the study of battery that is the EMF of battery will change as the
result of the change of state of charge The relationship between SOC and the
activity α is unknown but it is obviously that when the state of charge increases
the quotient of )(
)()(
2
2
24
OH
SOH
α
ααminus+
also increases This shows that the EMF rises
when the state of charge is increasing
From the literatures (Ceraolo 2000 Barsali and Ceraolo 2002) the electromotive
force is described simply as the following equation
)1)(273(0 SOCKEE Emm minusminusminusminus++++minusminusminusminus==== θ (310)
where 0mE and EK are constants for a battery
θ is the temperature of the cell
SOC is the state of charge of the battery
345 Internal Resistance of a Battery
The resistances of a battery as shown in Figure 3-10 can be calculated by the
equations (Ceraolo 2000 Barsali and Ceraolo 2002)
)]1(1[ 0000 SOCARR minus+= (311)
)ln(101 DOCRR minus= (312)
52
)exp(1 22
)]1([
202
21
IIA
eRR
m
SOCA
+=
minus
(313)
where 0A 21A and 22A are constants for a battery while 00R 10R 20R are
parameters related to the SOH which will be discussed in later chapters For the
model 020 asympR and can be omitted when a battery is discharging
Therefore the internal resistance of a cell when discharging is
)ln()]1(1[ 1000010 DOCRSOCARRRr minusminus+=+= (314)
346 The Behaviour of Parasitic Branch
When the battery is being charged there are some losses as represented by the
parasitic current This current depends on the electrolyte temperature and the
voltage at the parasitic branch (Ceraolo 2000)
Because the behaviour of parasitic branch is non-linear Tafel gassing-current
relationship is used instead of a simple resistance pR (Ceraolo 2000)
minus+= )1(exp
0
0
f
p
P
PNPPNp A
V
VGVI
θ
θ (315)
where pI is the current of the parasitic branch
PNV is the voltage of the parasitic branch
53
0PG is a constant in seconds
0PV is a constant in volt
pA is a constant
θ is the electrolyte temperature
fθ is the electrolyte freezing temperature and is equal to -40˚C
When the battery is being discharged 0asymppI the parasitic branch could be
omitted from the model in simulation if the charging behaviour is not necessary
to discuss
347 Main Branch Capacitance
In the electric network of the model there is an R-C circuit as shown in Figure
3-11
Figure 3-11 R-C block
where Im is the discharge current
IC1 is the current flow through the capacity branch
54
I1 is the current of R1
VR1 is the voltage over the R-C block
This branch can be solved by
))(
()( 11111111
dt
tdVCIRIIRIRV R
mCmR minusminusminusminus====minusminusminusminus====sdotsdotsdotsdot==== (316)
)()()(
111
11 tIRtVdt
tdVCR mR
R====++++ (317)
This is the differential equation that represents the main branch behaviour
Laplace transform is employed to solve this problem
)()( 1111 sIRsVSCR mR sdotsdotsdotsdot====sdotsdotsdotsdotsdotsdotsdotsdotsdotsdotsdotsdot (318)
1
)(
11
11
++++
sdotsdotsdotsdot====
SCR
sIRV m
R (319)
++++
====++++
========
SCR
C
SCR
R
I
VsG R
11
1
11
11
1
1
1)( (320)
where τ=11CR is the time constant that represents the double layer capacitance
When the current has a shape like a step and the initial voltage of the capacitor is
equal zero the solution in time becomes
m
t
R IeRtV )1()( 11τ
minus
minus= (321)
55
It is obviously that this equation is the typical form of the voltage with an R-C
circuit
348 Thermal Behaviour of a Battery
When the battery is charging or discharging there is a current flow through the
battery so that it produces heat due to the Joules law
0
2
1
2
12 RIRVIVVIP RPNps sdot++sdot+sdot= (322)
When discharging the parasitic branch and R2 are omitted the equation becomes
0
2
1
2
1 RIRVP Rs sdot+= (323)
The dynamic equation of cell temperature and the power is (Ceraolo 2000)
s
a PRdt
dC +
minus=
θ
θ
θθθ (324)
where θC is the thermal capacitance
θR is the thermal resistance between the battery and the environment
θ is the cell temperature and aθ is the environment temperature
56
35 Mathematical Model of the Lead-acid
Batteries
Considering the behaviour of capacity state of charge and depth of discharge
electromotive force and internal resistance an Improved Battery Model based on
the equivalent circuit shown in Figure 3-10 was introduced in previous sections
The battery model for the complete discharging progress can be derived as the
following equations
m
c
f
c
IIK
CK
IC))(1(1
)1(
)(
0
minus+
+
=
ε
θ
θ
θ (325)
σσ dItQt
e int=0
)()( (326)
)0(1 θCQSOC eminusminusminusminus==== (327)
)(1 θavge ICQDOC minusminusminusminus==== (328)
)1)(273(0 SOCKEE Emm minus+minus= θ (329)
)]1(1[ 0000 SOCARR minus+= (330)
)ln(101 DOCRR minus= (331)
1
1R
Cτ
= (332)
IeRtV
t
R sdotminussdot=minus
)1()( 11τ (333)
0
2
1
2
1 RIRVP Rs sdot+= (334)
57
sa P
Rdt
dC +
minus=
θ
θ
θθθ
(335)
)( θIC in the equations is the expression of capacity of battery when discharging
under the discharge current I and at a temperature of θ 0C stands for the
capacitance when discharging at the rated discharge current I while parameters
fθ and ε are constants in this model )(tQe represents the charge already
consumed while the equation of mE indicates the mathematical description of
electromotive force corresponding to the SOC and the cell temperature in which
0mE EK are constants for a battery 00R 10R are parameters related to the SOH
and the discharge current can also affect them τ in the equations are the time
constant of the R-C circuit which represents the time it takes the systems step
response to reach ( 6311 asympminus e ) of its asymptotic value The last two equations
represent the thermal dynamic of battery in which sP is the Joule heat generated
by the internal resistance θC is the thermal capacitance and θR is the thermal
resistance between the battery and the environment
36 Summary and Discussion
The Improved Battery Model based on the electric equivalent circuit is presented
in this chapter and it is proved that it can satisfy all the three requirements to serve
the project objectives This battery model consists of a variable voltage source
several R-C blocks and a parasitic branch as its electric network and the elements
are described as a variable related to the capacitance the charge consumption and
58
the cell temperature as well
However experimental tests show that the behaviour of the battery is much more
complicated can be represented by this equivalent circuit model For example the
internal resistance varies when discharging under different current and the time
constant of the R-C circuit at the beginning and end of discharge as well
Therefore the model has to be improved The next chapter overcomes these
problems found in the experimental tests and some improvements of the model
are described
59
Chapter 4
Experimental System Set up and
Improved Battery Model
Simulation Implementation
Experimental tests based on a 12V-13 Ah lead-acid battery are carried out and the
test system is introduced at the beginning of this chapter Some of the
characteristics of the battery can be found in the tests which has shown that the
battery model described previously is not accurate enough and improvements
have to be implemented into the model This chapter will focus on the analysis of
the battery characteristics and the description of the improvements implemented
In the last part of this chapter a finalised version of the battery model used in this
project is given and implemented in the MatlabSIMULINK environment for
simulation study
41 The Experimental System
In this experimental test system a variable resistor is used as the load of the
battery Three sensors are employed in the whole experiment process two current
sensors and one voltage sensor The equivalent circuit of the test rig designed for
the research purpose is shown in Figure 4-1
60
Figure 4-1 Equivalent Circuit of the Experimental Test Rig
In this figure the ideal voltage source EMF accompanying with the internal
resistance r acts as a lead-acid battery with 6 cells (12V) the terminals of the
battery are connected in parallel to a voltage sensor Switch Krsquo is employed to
control the voltage sensor connection so that the sensor can be disconnected from
the battery when the experiment is not being in progress to avoid an unnecessary
discharge The circuit break in Figure 4-1 can be used as a main controller which
decides whether the load is engaged to the battery to discharge or not Switch K
in the experiment is to vary the load of the system This experimental test system
is mainly designed for two different experimental tests of a battery in this study
constant-impedance load discharge and two-load discharge Figure 4-2 shows the
actual laboratory test rig used in the project
61
Figure 4-2 Experimental Test Rig
The data is collected and recorded every half second by a data acquisition card
PCI-6251 from National Instruments with the software environment of LabVIEW
and a 12V-13Ah lead-acid battery (marked in the red-dashed square in Figure 4-2)
is employed in the project as test batteries for the battery performance study
42 Improvements of the Battery Model
Figure 4-3 and Figure 4-4 show the typical data collected from the experimental
test rig Figure 4-3 is the result of a constant-impedance load discharge test with a
discharge current of 075A approximately and Figure 4-4 shows two-load
discharge with the discharge currents of 075A and 12A respectively
62
0 500 1000 1500 2000 2500 3000 3500 4000 4500 5000-02
0
02
04
06
08
1
12
Time (s)
Dis
charg
e C
urr
ent
(A)
0 500 1000 1500 2000 2500 3000 3500 4000 4500 5000105
11
115
12
125
13
Time (s)
Term
inal V
oltage (
V)
Figure 4-3 Test of constant-impedance load discharge top figure shows the discharge current of the experimental test and the bottom one shows the terminal
voltage 1τ is the time parameter of the R-C block at the beginning of the
discharge and 2τ is that when the discharge stopped
0 200 400 600 800 1000 1200 1400
0
05
1
15
Time (s)
Dis
charg
e C
urr
ent
(A)
0 200 400 600 800 1000 1200 1400118
12
122
124
126
128
Time (s)
Term
inal V
oltage (
V)
Figure 4-4 Test of two-load discharge top figure shows the discharge current of the experimental test and the bottom one shows the terminal voltage
I(t)RI1 and I(t)RI2 represent the voltage drop across the internal resistance value under different discharge current
1τ 2τ
I(t)RI1
I(t)RI2
I(t)RI1
63
421 The Change of τ in Different Charge Status
From analyzing these figures it is easy to find that it takes quite a long time for
the battery to have the steady terminal voltage when the discharge of battery stops
and it is longer than the time taken from the beginning of the discharge This
difference means that when the battery starts to discharge the time parameter
11CR=τ in the main branch equation (332) is not equal to that when the
discharge has just stopped In Figure 4-3 it is shown that when the discharge stops
the time parameterτ is longer than that when the discharge starts
As a result of this experimental feature a switch is employed to implement the
change of time parameter to match those described in the mathematical model of
the battery The switch is used to control the value of the time parameter τ in
different discharge currents When the battery is discharging the discharge current
is a positive value and the time parameter τ is equal to 1τ When the battery is
not discharging the discharge current is equal to 0 in theory and the time
parameter has a different value 2τ
Although the discharge current should be equal to 0 theoretically it is hard to
achieve this in the real experimental measurement because of the inaccuracy of
the current sensor reading due to the inaccuracy occurred in the power supply to
the sensor Therefore the trigger of the switch in the model is set to be 01 A that
is when the discharge current is greater than 01 A the time parameter is set to be
1τ as the battery is in its discharging segment By contrast the value of time
64
parameter is set to be 2τ and the discharge current is considered as the error
caused by the sensors when that current is less than 01 A
422 Analysis in Variations of the Internal Resistance
Another important issue found through analyzing the experimental test result is
that the internal resistance for a specific battery in a specific state of health (SOH)
is not a constant when the discharging current changes This difference is more
significant than the effect caused by the state of charge
For example in the two-load discharge results shown in Figure 4-4 when the
battery is not discharging the initial voltage is equal to the electromotive force
(EMF1) When the battery began to discharge at the discharge current I1 the
terminal voltage dropped to V1 After the discharge stopped for a while the value
of the terminal voltage is equal to the electromotive force (EMF2) at that state of
charge (SOC2) Then the discharge of the battery starts again at a current of I2 and
the terminal voltage dropped to V2 The discharge progress is then stopped for
certain of a time period to get the steady terminal voltage (EMF3) at that state of
charge (SOC3) After that the test of discharge at the I3 = I1 was repeated again
and get another terminal voltage of V3 The last discharge test is done to provide
the evidence for the fact that this change in the internal resistance is not caused by
the change of the state of charge (SOC)
The value of electromotive force in a discharging battery is equal to the sum of the
terminal voltage and the voltage that the internal resistance takes that is
65
nnnn IrVEMF sdot+=
Therefore the internal resistance can be calculated by
n
nnn
I
VEMFr
minus= (41)
From the data collected in the experiment the key parameter values for the graphs
shown in Figure 4-4 can be found as listed in Table 4-1
Table 4-1 Approximate Internal Resistance Calculating
n 1 2 3
Electromotive Force (EMFn) 1260V 1252V 1238V
Discharge Current (In) 078A 114A 076A
Terminal Voltage (Vn) 1219V 1203V 1197V
Substituting these values into Equation 41 the internal resistance can be
calculated Ω=Ω=Ω= 539043005260 321 rrr
This change of the internal resistance can cause quite a significant effect in the
discharge progress This problem can be possibly solved in a number of ways
One possible choice is to find a curve of the internal resistance change and the
discharge current for a specific battery after a certain numbers of experimental
tests But this method needs huge efforts in conducting experimental tests and the
result is not very meaningful for the project considering the time cost Another
possibility is to conduct the experimental tests with a constant load Therefore the
change of internal resistance caused by the change of discharge current could be
ignored As a result in the whole process of this project the same load is
66
employed either in the constant-impedance load discharge or in the two-load
discharge tests
In order to implement the different internal resistance value when discharging
under different load a switch that can control the parameters R00 and R10 is
employed This switch is controlled by the discharge current which is the main
input of the mathematical model In the two-load discharge tests when the switch
K in Figure 4-1 is switched off there is only one load is connected to the battery
terminals and the discharge current is lower the values of R00 and R10 are
switched to the first set of parameters R001 and R101 To the contrast when K is
switched on the discharge current is higher and the values are switched to the
second set R002 and R102
423 Improved Lead-Acid Battery Mathematical Model
From the model described in Chapter 3 and the improvements studied in this
chapter the mathematical model of lead-acid battery when discharging in different
discharge currents can be described as the following equations
m
c
f
c
IIK
CK
IC))(1(1
)1(
)(
0
minus+
+
=
ε
θ
θ
θ (42)
ττ dItQt
e int=0
)()( (43)
)0(1 θCQSOC eminusminusminusminus==== (44)
)(1 θavge ICQDOC minusminusminusminus==== (45)
67
)1)(273(0 SOCKEE Emm minusminusminusminus++++minusminusminusminus==== θ (46)
)]1(1[ 0000 SOCARR minusminusminusminus++++==== (47)
)ln(101 DOCRR minusminusminusminus==== (48)
11
RC
τ= (49)
IeRtV
t
R sdotminussdot=minus
)1()( 11τ (410)
RIRVP Rs sdot+=2
12
1 (411)
sa P
Rdt
dC +
minus=
θ
θ
θθθ
(412)
)(
)(
2
1
002
001
00Load
Load
R
RR
= (413)
)(
)(
2
1
102
101
10Load
Load
R
RR
= (414)
)10(
)10(
2
1
AI
AI
lt
gt
=τ
ττ (415)
001R 002R 101R 202R and 1τ 2τ in the equations stand for different parameter
values of 10R 20R and τ when the load and charge status changes in order to
reflect the improvements described in this chapter For a two-load discharge test
there are ten important unknown parameters in the equations of the mathematical
model which are unknown for a specific battery 0C 0mE EK 001R 002R 101R
102R 1τ 2τ and 0A As the internal resistance R00 and R10 vary only when the
load changes they can be treated as constants in the constant-impedance load
68
discharge tests the key parameters are therefore 21100000 ττRRKEC Em
and 0A In this project the study of state of health is based on constant-impedance
load discharge The identification of these unknown parameters will be discussed
in Chapter 5
43 Simulation Study
The processes described above have been implemented in SIMULINK as a
simulation model for computer based analysis The simulation program consists of
two main function blocks circuit block and thermal block The structure of the
SIMULINK implementation is described in Figure 4-5
69
Figure 4-5 Structure of model for SIMULINK Implementation
70
As shown in the figure there are mainly two inputs in the model the discharge
current and the discharge time The actual capacity of battery can be then
calculated with the knowledge of rated capacity and the discharge current The
actual capacity is also influenced by the cell temperature At the beginning of
discharge the cell temperature is the same as the surrounding temperature
Integrating the discharge current with respect to time is the capacity consumed in
the discharge progress and then the state of charge and the depth of charge can be
obtained It is shown that the electromotive force and the internal resistance vary
as a result of changing in the state of charge and the depth of charge and the
terminal voltage can be calculated
In the thermal block of the model the heat generated by the current and the
internal resistance are calculated by the Joules law Then this energy is
transferred to calculate the thermal temperature of the cell and the cell
temperature is given back to the circuit block to affect the actual capacity
71
0 1000 2000 3000 4000 5000 6000 7000
0
02
04
06
08
1
Time (s)
Dis
charg
e C
urr
ent
(A)
0 1000 2000 3000 4000 5000 6000 7000105
11
115
12
125
13
Time (s)
Term
inal V
oltage (
V)
Figure 4-6 Terminal Voltage of Battery (Constant Discharge Current SIMULINK)
The result in Figure 4-6 shows the terminal voltage of a battery which discharges
under the current of 08A in a simulation study Since the discharge begins the
voltage drops due to the internal resistance and the change of state of charge (SOC)
and it climbs up when the discharge stops However the voltage changes
gradually because of the time parameter τ This result shows a good qualitative
agreement with the experimental test results
72
44 Summary and Discussion
This chapter introduces the laboratory test system designed for the project and the
limitation of the mathematical model described in Chapter 3 Switches on the time
parameter τ and the internal resistance parameters R00 and R10 have been added to
the model so that the model is able to represent the change of these parameters
found in the experimental tests The implementation of the model under the
MatlabSIMULINK environment is described and the simulation study shows a
good qualitative agreement with the experimental test results
The next chapter will focus on the identification of those unknown parameters of
the battery model that are important for revealing the battery characteristics
including 20100000 τARRKEC Em and 1τ
73
Chapter 5
Model Parameter Identification
and Model Validation
The identification of the unknown parameters 20100000 τARRKEC Em and 1τ
in the mathematical model will be introduced in this chapter
51 Need for the Optimization Algorithms
In those equations of the battery model described previously some parameters are
unknown and some of them are difficult to derive from physics or engineering
principles or to be obtained through experimental tests Therefore the
identification of the model unknown parameters becomes an important part for the
project Parameter identification is an optimization process that adjusts the
parameters to enable the simulation results to show the best agreement with the
results acquired by the experimental tests There are many algorithms available
for optimization and the principle of the optimization process for the project is to
minimize the objective function The objective function is formed by the absolute
value of the difference between the simulated and experimental results at each
time point The set of parameters to achieve the least value of the objective
function is considered to be the fittest set
74
There are two basic requirements of the optimization in this project First of all as
the problem for the solutions trapped to the local minima is a very important and
challenging issue in many linear optimization solvers the optimization algorithm
used in this project must be able to find the global minimum Secondly the
optimization algorithm not only should find the minimum value of the objective
function but also can tell the values of the parameters that result in the best fitness
which is needed for the analysis purpose in this project Finally the time cost is
also an important factor in selection of a suitable optimization algorithm
It needs to point that the objective here is to identify the unknown parameters of a
model with an already known structure If the objective is to identify or
approximate unknown model structures the selection of optimisation methods
will be quite different In the case of latter Neural Network Genetic
Programming and Fuzzy Logical will be more suitable choices To concentrate on
the objective of the project the thesis will focus on optimisation algorithms for
parameter identification
52 Overview of the Optimization Algorithms
Brute-force search is the most basic direct search algorithm that is used to find the
minimum value In the brute-force search the initial guess is the minimum
possibility of parameters and increasesdecreases The parameter
increasesdecreases step by step in each iteration and the best solution can be
75
searched This algorithm is the simplest but its disadvantage is also obvious that
is it is the slowest optimization method especially when used in the identification
of more than two parameters and the results are largely dependent on the initial
guesses
Linear search is an optimization method to solve the linear optimization problem
the preference function of which is linear and the feasible domain is defined by a
linear constraint function The linear constraints define a convex polyhedron
geometrically which is called the feasible region The algorithm is to construct an
admission solution at a vertex of the polyhedron and then along edges of the
polyhedron to vertices with successively higher values of the objective function
until the optimum is reached
Besides the basic optimization methods evolution computation technology is
becoming increasingly popular A range of different evolution computation
technologies can solve the optimization problem in this project including genetic
algorithms (GAs) particle swarm optimization (PSO)
Genetic Algorithms are direct search algorithms inspired from the process of
evolution in nature the natural selection Based on the principle of survival of the
fittest the GAs can produce better and better approximations to the global optimal
solution in a number of generations In each generation a new group of solutions
is created by the fitness level in the problem of every individual in the last
generation The solutions are then bred together to lead to the evolution of
individuals
76
Particle swarm optimization is a stochastic population-based computer algorithm
modelled on swarm intelligence that searches for a solution to an optimization
problem in a search space Based on the social psychological principles each
individual called lsquoparticlersquo in PSO is able to provide information to others and
also learn the success from the local best and the global best The movement of
each particle through the search space are guided by these successes and the
solution can be found after a number of generations
It has been proved by Dr Jianlin in his PhD Thesis (Wei 2007) that both Genetic
Algorithm and Particle Swarm optimization are capable of the model parameter
identification But the Particle Swarm optimization is a new algorithm that first
described in 1995 and it is not as common as Genetic Algorithm in the research
areas
The purpose of this research work is to find a method for parameter estimation
Genetic algorithms are well proven solution for complicated optimisation
problems and have been applied successfully in a range of similar problems (Wei
2007 Wei Wang et al 2007) Genetic algorithms are also well suited to problems
with many local minima In the current work the exact form of the fitness
function is unknown and it is therefore important to select a robust technique
which can identify good overall solutions For these reasons GA was selected to
give the best possible chance of satisfying the overall project objectives within the
limited timeframe of the project
77
53 The Study of the Genetic Algorithms
The process of Genetic Algorithm is reviewed in this section to provide an insight
into how GAs work and simulation study of two bench mark functions are carried
out
531 Working Principle of GAs
There are many methods used to implement a GA process and usually a GA is at
least composed of three common genetic operators Selection Crossover and
Mutation (Pham and Karaboga 1998) The flowchart of a simple GA process is
given in Figure 5-1
As a preparation to start the optimization process a GA requires a group of initial
solutions as the first generation The first generation is usually a group of
randomly produced solutions created by a random number generator The
population which is the number of individuals in a generation should be big
enough so that there could be a reasonable amount of genetic diversity in the
population Also it should be small enough for each generation to be computed in
a reasonable period of time using the computer resources available Typically a
population includes individuals between 20 and 100 (Chipperfield Fleming et al
1994A)
78
Figure 5-1 Flowchart of a Simple Genetic Algorithm (Pham and Karaboga 1998)
The fitness function is evaluated to measure how close that the individuals fit the
desired result A fitness function could be either complex or simple depending on
the optimization problem addressed In a case of minimization problem the most
fitted individuals will have the lowest numerical value of the associated fitness
function
No
Yes
Selection
Crossover
Mutation
Find the Best Individual
Generate initial population
Results
Evaluate fitness values
Operators of generating new
generation
Gengt 100
Evaluation
Start
79
Individuals are selected according to a fitness-based process The operator of
selection is made up of ranking and selection progress by which more copies of
the individuals that fit the optimization problem better will be produced in the
next generation In GAs there are mainly two ways to select a new population
Roulette Wheel Selection (RWS) and Stochastic Universal Sampling (SUS)
The individuals will be recombined (crossover) after the selection This operation
is to produce two new individuals from two existing individuals selected by the
operator of selection by cutting them at one or more position and exchanging the
parts following the cut The new individuals therefore can inherit some parts of
both parentsrsquo genetic material There are usually four ways of doing this one-
point crossover two-point crossover cycle crossover and uniform crossover
(Pham and Karaboga 1998) Figure 5-2 (a) shows an example of the two-point
crossover progress
Mutation is another operator to produce new individuals The difference is that the
new individual is produced from a single old one In this operation the bit values
of each individual are randomly reversed according to a specified property A
mutation can also helps the GA to avoid local optimums and find the global best
solution Figure 5-2 (b) represents how the mutation operator works
80
Figure 5-2 (a) Crossover operation (b) Mutation operation
The group of individuals produced after the mutation is the second generation
Then the fitness value of each individual in the second generation is computed
again This cycle will not stop until the result is close enough or after a certain
generation
Three major Matlab toolboxes are applied in the current market for application
purpose they are Genetic Algorithms Toolbox V12 (Chipperfield Fleming et al
1994B) the Genetic Algorithms Optimization Toolbox V11 (Houck Joines et al
1995) Genetic Algorithm Direct Search Toolbox V102 (MathWorks Inc 2004)
In this project the official toolbox in Matlab form Mathworks Inc is employed
The property settings for the project based on Dr Weirsquos thesis (Wei 2007) are
shown in Table 5-1
Parent 1 1 1 0 0 1 0 1 1 0 1 0 1 1
Parent 2 0 1 1 0 1 1 0 0 1 0 1 0 0
Offspring 1 1 1 0 0 1 1 0 0 1 1 0 1 1
Offspring 2 0 1 1 0 1 0 1 1 0 0 1 0 0
(a)
Parent 1 1 0 0 1 1 0 0 1 1 0 1 1
Offspring 1 1 0 0 1 0 0 0 1 1 0 1 1
(b)
81
Table 5-1 The property settings for Genetic Algorithms
Name of the GA properties Value of the GA properties
Number of generations 100
Population size 20
Fitness assignment Rank-base fitness assignment
Selection Stochastic universal sampling
Crossover Scattered crossover
Crossover rate 07
Mutation function Uniform mutation
Mutation rate 01
Population size specifies how many individuals there are in each generation With
a large population size the genetic algorithm searches the solution space more
thoroughly and the gives more possibility to return the global minimum The
number of generations specifies the maximum number of iterations for the genetic
algorithm to perform If this number is too low the genetic algorithm is not able
convergence to the global solution However either a large population size or a
large number of generations can cause the algorithm to run more slowly The
crossover rate and the mutation rate are properties that control the crossover and
mutation operator High rate of these values means that the genetic algorithm has
a higher opportunity of producing new offspring but it can be easy to miss the
current best solution if these values are too big
Initial tests of genetic algorithms on different properties show that the values
shown in table 5-1 are able to find an adequate solution Similar results would be
82
obtained if the values of the generations and the population size are larger but
costing more CPU time The crossover rate and the mutation rate would not affect
the result significantly if only varies in a small range But it is impossible to prove
that these two values are the best choice due to the strong randomness
532 Simulation Studies of Genetic Algorithms
In order to test and demonstrate that Genetic Algorithms are able to meet the
requirements of the project simulation studies have been carried out Two
benchmark functions that are commonly used in evaluating evolutionary
computation algorithms are employed for the simulation studies They are
1) Rastrigin function
Rastrigin function is a typical example of non-linear multimodal function with
many local minima The problem of looking for the global minimum is quite
difficult due to its large search space and its large number of local minima The
function is shown as
))2cos(10(10)(1
2sum=
sdotsdotminus+sdot=
n
i
ii xxnXf πr
where n is the dimension of the problem and 1x ~ nx are the coefficients to be
identified Figure 5-2 shows a 2-dimensional Rastriginrsquos function while figure 5-3
is a contour plot of Rastrigins function shows the alternating maxima and minima
83
The global minimum of the Rastriginrsquos function is 0)( =Xfr
when
021 ==== nxxx L
Figure 5-2 2-dimensional Rastrigins function (MathWorks Inc 2004)
84
Figure 5-3 Contour plot of Rastrigins function (MathWorks Inc 2004)
In the simulation study a ten dimensional Rastriginrsquos function is adopted Figure
5-4 shows the best optimization performance of the Rastriginrsquos function in each
generation It is shown that after 700 generations a global optimal value is
obtained
85
0 100 200 300 400 500 600 700 800 900 10000
10
20
30
40
50
60
70
80Best 00099429
Generation
Fitness v
alu
e
Best f itness
Figure 5-4 GA performance (Rastrigrinrsquos function)
2) Rosenbrock function
Rosenbrock function is another mathematical function used as a test problem for
optimization algorithms The global minimum is inside a long narrow parabolic
shaped flat valley To find the valley is trivial but to converge to the global
minimum is difficult The Rosenbrock function is defined by
sum=
+ minus+minus=
n
i
iii xxxXf
1
2221 ))1()(100()(
r
where n is the dimension of the problem and 1x ~ nx are the coefficients to be
identified Figure 5-5 shows a 2-dimensional Rosenbrock function
86
The global minimum of the Rosenbrock function is 0)( =Xfr
when
121 ==== nxxx L The same as the Rastriginrsquos function a ten dimensional
Rosenbrock function is adopted for the simulation study Figure 5-6 is the GA
performance to the Rosenbrock function It can be found that the optimization
converges and get the global optimal value after 300 generations
Figure 5-5 2-dimensional Rosenbrock function (MathWorks Inc 2004)
87
0 100 200 300 400 500 600 700 800 900 10000
200
400
600
800
1000
1200Best 060113
Generation
Fitness v
alu
e
Best fitness
Figure 5-6 GA performance (Rosenbrock function)
54 Model Parameter Identification
541 Implementation of Genetic Algorithms and
Experimental Data sets
In this project the Genetic Algorithm Direct Search Toolbox V102 developed by
Mathworks Inc is employed to identify the parameters of the battery model The
process is shown in Figure 5-7
88
Figure 5-7 Progress of Parameter Identification
The fitness function is used in the project and the parameter identification is to
minimize the fitness function so that the model output can fit the experimental
result The fitness function is given as
sum
sum sumsum
minussdot=
minussdot++minussdot+minussdot=
minus
1
0
2
1 1
1
0
))()(()(
)()()(
exp
expexp2exp1
t
t
sim
t
t
t
t
simnsim
t
t
sim
tVtVabstW
VVabsWVVabsWVVabsWfitnessn
n
L
where Vexp is the experimental terminal voltage data
Vsim is the simulated terminal voltage
Wt is the weights of the difference in the simulated and experimental
results
This fitness function represents the sum of the error values at each time interval
Mathematical Model of a six-cell
Lead Acid Battery
Experimental Test
Results
Fitness
Function
Discharge Current
Simulation
Output
Terminal Voltage
Simulation
Input
lt fmin
Genetic Algorithms (Selection Crossover and Mutation
etc)
Parameter Update
Yes
No
Stop
89
considered ( ntt minus0 ) The weight coefficients Wt indicates how important the
weighted part is in the optimization and how much it contribute to the
optimisation process Periods with bigger tW values are more important because
the sum of errors will give big value contribution to the fitness function value and
the optimisation process will pay more attention to the higher weighted error parts
In the experiments and optimization process it is found that the results were more
important when the discharge of a battery at the stage of stopping Therefore the
weight in this period is greater than that of the others The weighting coefficient
values in this project are determined by the results of the first several attempts of
parameter identification The period of simulation data that fails to fit the test
result means that the weight value is not big enough until the overall performance
of simulation is reasonable
Following the objective fitness function unknown coefficients of the battery
model are identified using experimental data The mathematical model of a six-
cell lead-acid battery in the figure is described in Chapter 4 and the parameters are
to be identified by Genetic Algorithms are 210100000 ττARRKEC Em
Three sets of experimental tests have been carried out for the purpose of
parameter identification and the validation of the mathematical model These three
experimental results are based on a lead-acid battery with the ideal capacity of 13
Ampere-hours under the discharge current of 08A
90
542 Parameters of Battery Model
The parameters of the mathematical model of a lead-acid battery are identified
using Genetic Algorithms and the predicted battery responses using the identified
parameters are compared with the simulated results One set of typical values of
parameters identified are listed in Table 5-2
Table 5-2 Identified parameters identified by the Genetic
Algorithms in the model of 12V-13Ah lead-acid battery Parameter Value Parameter Value
0C 48198 (Amp-Sec) 0mE 21465 (V)
EK 0001109 (V) 0A 29895
00R 001038 (Ohm) 10R 012196 (Ohm)
1τ 21052 (s) 2τ 17565 (s)
Figure 5-8 shows the simulation results using the Improved Battery Model and the
change of weights defined for this set of result described in the fitness function
The top subplot of Figure 5-8 shows the weight value of the GA fitness function
described before while the middle figure is the discharge current of the
experimental test which is also the input of the mathematical model In the
following test results in this and next chapter the changes of weight value are
similar so they are not shown in the figures
The blue line marked as ldquoExperimental Terminal Voltagerdquo in the bottom figure
represents the measured outputs while the other one (Simulated Terminal Voltage)
represents the simulation results The simulation results are ldquonoisyrdquo because
experimental discharge current is used as the input of model in the simulation
91
progress It is obviously that Figure 5-8 shows a good overall agreement of the
results although some slope when discharging is not perfect
0 500 1000 1500 2000 2500 3000 3500
1
15
Time (s)
Weig
ht
0 500 1000 1500 2000 2500 3000 3500114
116
118
12
122
124
126
128
13
Time (s)
Term
inal V
oltage (
V)
Experimental Terminal Voltage
Simulated Terminal Voltage
0 500 1000 1500 2000 2500 3000 3500
0
05
1
Time (s)
Dis
charg
e C
urr
ent
Simulated Terminal Voltage
Experimental Terminal Voltage
Figure 5-8 Measured and Simulated Result after Parameter Identification
Figure 5-9 shows the mean fitness value and the best in each generation It can be
seen that the best fitness in each generation is decreasing The mean fitness is
unstable because of the mutation operator in the GA that can attempt to find better
solutions
92
0 10 20 30 40 50 60 70 80 90 100100
150
200
250
300
350
400
450
500
550
Generation
Fitness v
alu
e
Best 1075521 Mean 1312731
Best f itness
Mean fitness
Figure 5-9 Mean and the Best Fitness Values in Each Generation
543 Battery Model Validation
In order to validate the battery mathematical model two sets of experimental tests
have been adopted to compare with the simulation results
The inputs of the discharge current and the validation results using two
experimental tests are shown in Figure 5-10 and Figure 5-11
93
0 500 1000 1500 2000 2500 3000114
116
118
12
122
124
126
128
13
Time (s)
Term
inal V
oltage (
V)
Simulated Terminal Voltage
Experimental Terminal Voltage
Simulated Terminal Voltage
Experimental Terminal Voltage
Figure 5-10 Measured and Simulated Terminal Voltage (Validation data 1)
In the simulation that shows in Figure 5-10 the discharge of battery begins at the
time of 700s and the simulation result shows a reasonable agreement with the
experimental result despite the noise of signal caused by the error of the sensors
It is noticed that at the beginning of the discharge there is a difference between
the simulated and experimental terminal voltages for about 100 seconds This
difference is studied and so called lsquocoup de fouetrsquo which often takes place at the
beginning of a discharge test when the SOC of battery is high (Perrin Delaille et
al 2006) However this lsquocoup de fouetrsquo behaviour cannot be described in this
model The discharge period lasts for about 1200 seconds and then stops and after
that the simulation has the similar result with the experiment
94
0 1000 2000 3000 4000 5000 600011
112
114
116
118
12
122
124
126
128
13
Time (s)
Term
inal V
oltage (
V)
Simulated Terminal Voltage
Experimental Terminal Voltage
Simulated Terminal Voltage
Experiment Terminal Voltage
Figure 5-11 Measured and Simulated Terminal Voltage (Validation data 2)
Figure 5-11 shows another group of experimental test to validate the battery
model At the beginning of the experiment the terminal voltage from the
experiment is dropping without any discharge behaviour of battery and that is
because of the experiment was carried out when the terminal voltage of lead-acid
battery is not steady enough after being charged and that also causes the
deviations in the discharge at about 1000-2000 seconds In this period the lsquocoup
de fouetrsquo appears again After the first period the battery is disconnected from the
load until the terminal voltage become steady and the simulation result in this
period fits the experiment result well In the second discharge of this test it is
shown that the lsquocoup de fouetrsquo does not occur because the SOC is not high For
the similar reason in the first discharge in this group of the test results there are
95
also some deviations in this period Finally the simulation result in the last part of
figure fits the experimental result is highly satisfied
The average error of the simulated outputs of the simulation studies and the
measured results are studied Absolute Error and Relative Error is defined as the
following equations
sum
sum
=
=
minus=
minus=
N
i
sim
N
i
sim
iV
iViV
NRelError
iViVN
AbsError
1 exp
exp
1
exp
)(
)()(1
)()(1
The absolute error and relative error are summarised in Table 5-3
Table 5-3 AbsError and RelError of Model Validation
Absolute Error Relative Error discharging relaxing overall discharging relaxing overall
Experimental Test 1 (Identification)
00229V 00207V 00217V 01833 01724 01776
Experimental Test 2 (Validation data 1)
00536V 00484V 00492V 04453 03872 04024
Experimental Test 1 (Validation data 2)
00724V 00372V 00485V 06352 03013 05025
55 Summary and Discussions
Identification of the unknown model parameters is discussed in this chapter and a
range of possibly suitable methods are reviewed in brief In this project Genetic
Algorithm is adopted GAs working principle and its implementation has been
96
introduced in details in this chapter The simulation study of two benchmark
functions that are commonly used in evaluating evolutionary computation
algorithms are employed in order to show the capability of GAs The parameter
identification by tests of a brand new 13Ah lead-acid battery is carried out and is
validated by two sets of other experimental test results under the same working
condition of the same battery
97
Chapter 6
The Analysis of State of Health
(SOH) in association with the
Internal Resistance
61 Methodology
As the number of discharge cycles of battery increases in applications the
maximum charges that a battery can offer will decrease In other words the SOH
battery is deteriorating But this drop of capacity is not linear and it is also a long
progress At the beginning of the use of battery the change of capacity is very
slow and it is not obvious After a number of cycles of discharge and charge this
change will get faster and relatively significant
There are no reliable methods now to calculate the remaining charge capacity
which is the only one determinant of the state of health The normal method is
simply to measure the voltage on its terminals But this measurement is not
accurate on an aged battery A battery in poor state of health but sufficiently
charged can also offer sufficient voltage to appear normal The only way to
determine the capacity accurately is to integrate the discharge current of battery in
a full deep discharge but this method cannot be used too frequently because deep
98
discharge is harmful for the battery
In the project six lead-acid batteries were tested using the test system described in
Chapter 4 These batteries were repeatedly discharged and charged for their whole
life time so that the information related to different state of health can be revealed
as soon as possible Even though the batteries works frequently it still takes more
than 6 months to make the battery become weak The testing experiments were
carried out and the data was recorded every 2-3 weeks so that important value of
state of health is not missed However as the change of capacity is a long progress
and it is nonlinear not all the data collected can be used in this project
Referring the literature (Coleman Lee et al 2006 Lakhdari and Midoun 2007
Coleman Hurley et al 2008) an important factor that reflects the change of state
of health of a lead-acid battery is the internal resistance Not only the state of
health but also other factors (SOC DOC discharge current etc) can result in
variations in internal resistance a new alternative method that based on the
Improved Battery Model in Chapter 4 is adopted in the project
From the model study in Chapter 4 the internal resistance can be divided into two
parts expressed by )]1(1[ 0000 SOCARR minusminusminusminus++++==== (Eq 47) and )ln(101 DOCRR minusminusminusminus====
(Eq 48) These equations show that the internal resistance is affected by the state
of charge (SOC) and depth of charge (DOC) in a discharge cycle In real
applications batteries are seldom discharged to the full range because a deep
discharge could cause some damage to the battery They are also seldom to be
charged to full to prevent the possibility of overcharge that could also bring some
99
negative effects Although this issue is not very significant in a valve regulated
lead acid battery it is better to control the working range of depth of charge from
50 to 80 approximately In this project the internal resistance of battery in the
depth of charge of 65 is studied as a most important factor that related to the
state of health As a little inaccurate of SOC and DOC will induce a comparative
big difference in the internal resistance the method of measuring the internal
resistance accurately by an external circuit is discarded
In Equation 47 and Equation 48 the author found that there are two other factors
that influence the internal resistance besides the SOC and the DOC R00 and R10
Therefore in the project the values of R00 and R10 in a specific discharge current
are very important to study the internal resistance The values of these two factors
are used in Equation 47 and Equation 48 to calculate the internal resistance per
cell of the battery The depth of charge is assumed to be 65 for a normal
working battery as described previously In chapter 3 the SOC and the DOC are
defined as )0(1 θCQSOC eminus= (Eq 44) and )(1 θavge ICQDOC minus= (Eq
45) The Capacity is also defined as equation 42
k
c
fc
IIK
CK
IC))(1(1
)1(
)(
0
minusminusminusminus++++
++++
====
ε
θ
θ
θ (61)
in which Kc = 118 k = 120 and 6 II avg times= in this project The relationship
between the actual capacity under discharge current Iavg and the nominal capacity
is
100
62
1
))(1(1
1
)0)(1(1
1
))(1(1
1
)0(
)(asymp
minus+=
minus+
minus+=
k
avgck
c
k
avgcavg
IIK
IK
IIK
C
IC
θ
θ (62)
Therefore the SOC when the DOC is 65 is
586))0(62(1)0(1 asympsdotminus=minus= θθ CQCQSOC ee (63)
As described in chapter 5 30 asympA therefore the internal resistance of an
individual cell can be obtained by
10001000010 43041)ln()]1(1[ RRDOCRSOCARRRrcell sdot+sdotasympminusminus+=+= (64)
and for a six-cell lead-acid battery the internal resistance
1000 582486 RRrr cellbattery sdot+sdot=times= (65)
62 The identification of C0 R00 and R10
In the eight parameters identified previously in Chapter 5 there are only three
parameters can be affected by the change of battery conditions Therefore the
other five parameters ( 2100 ττAKE Em ) can be treated as a constant for a battery
The parameters that related to the battery condition 0010 RR and 0C are the key
problems which the project focused on 0C represents the state of health while
the 0010 RR stands for the internal resistance parameters Here again the Genetic
algorithm is adopted to identify these three parameters
In this project the battery have been discharged and charged in hundreds of cycles
to simulate the capacity loss in the normal applications which is described by the
101
state of health in this project In order to find out the different behaviour of
internal resistance in different state of health experimental tests have been carried
out in different state of health of the battery
The first test is carried out when the battery is brand new and the data is also used
to identify the other parameters of the battery model as described in the previous
chapter The second group of data is collected after 300 discharge cycles
approximately and the third test took place after 200 more cycles The number of
discharge cycles between the last four tests is only about 50 because the change of
State of Health is more significant The identified parameters of a battery in
different state of health are shown in table 6-1
Table 6-1 Battery Remaining Capacity and Internal Resistance
Remaining
Capacity C0 (Amps)
SOH R00 R10 RelError Internal
Resistance (Ohm)
Test 1 48198 100 00609 00220 01756 05683
Test 2 44861 9314 00654 00103 07428 05759
Test 3 38025 7889 00635 00191 02812 05827
Test 4 33830 7019 00573 00509 07265 06126
Test 5 30625 6354 00604 00582 04340 06575
Test 6 26072 5306 00703 00368 01342 06855
And the terminal voltages simulated and measured are shown as the following
figures The same as previous figures the blue lines represent the measured
outputs while the red lines represent the simulation results
The test shows in figure 6-1 the same as the test which is used to describe the
genetic algorithms and the battery parameter identification in chapter 5 Detailed
102
description and analysis are given in chapter 5
0 500 1000 1500 2000 2500 3000 350011
112
114
116
118
12
122
124
126
128
13
Time (s)
Term
inal voltage (
V)
Experimental Terminal Voltage
Simulated Terminal Voltage
Experimental Terminal Voltage
Simulated Terminal Voltage
Figure 6-1 Experimental and Simulated Terminal Voltage of Test 1 (SOH = 100)
103
0 1000 2000 3000 4000 5000 600011
112
114
116
118
12
122
124
126
128
13
Time (s)
Term
inal V
oltage (
V)
Simulated Terminal Voltage
Experimental Terminal Voltage
Simulated Terminal Voltage
Experimental Terminal Voltage
Figure 6-2 Experimental and Simulated Terminal Voltage of Test2 (SOH= 9314)
The experiment shown in figure 6-2 is tested several months after the first
experimental test In the period that the first discharge begins the experimental
result shows a different slope in terminal voltage The reason is probably that the
battery have just charged to full by a charger and itrsquos the capacitor had not fully
discharged After that when the discharge stopped there is a deviation in the
simulation voltage In the authorrsquos opinion that is because of the accuracy of R10
and R00 If the value of R10 is greater and that of R00 is smaller the simulation
result should fit the experimental result In the second discharge period of the
discharge test there is also a little difference in the experimental and simulation
result caused by the inaccuracy of battery parameters But it shows a good
agreement when the discharge stopped
104
0 500 1000 1500 2000 2500 3000 3500 400011
112
114
116
118
12
122
124
126
128
13
Time (s)
Term
inal V
oltage (
V)
Simulated Terminal Voltage
Experimental Terminal Voltage
Simulated Terminal Voltage
Experimental Terminal Voltage
Figure 6-3 Experimental and Simulated Terminal Voltage of Test3 (SOH= 7889)
0 500 1000 1500 2000 2500 3000 3500 4000 4500 500011
112
114
116
118
12
122
124
126
128
13
Time (s)
Term
inal V
oltage (
V)
Simulated Terminal Voltage
Experimental Terminal Voltage
Simulated Terminal Voltage
Experimental Terminal Voltage
Figure 6-4 Experimental and Simulated Terminal Voltage of Test4 (SOH= 7019)
105
0 1000 2000 3000 4000 5000 600011
112
114
116
118
12
122
124
126
128
13
Time (s)
Term
inal V
oltage (
V)
Experimental Terminal Voltage
Simulated Terminal Voltage
Simulated Terminal Voltage
Experimental Terminal Voltage
Figure 6-5 Experimental and Simulated Terminal Voltage of Test5 (SOH= 6354)
Figure 6-3 figure 6-4 and figure 6-5 show the test results of the battery when the
SOH drops to its 80 70 and 60 It is shown that the simulation result in
figure 6-3 fits the experimental result until the end of test when the discharge of
battery has just stopped The inaccuracy of the R10 and R00 is also the main cause
of the deviation The overall simulation result in figure 6-4 figure 6-5 are good to
express the battery behaviour
106
0 500 1000 1500 2000 2500 3000 3500 400011
112
114
116
118
12
122
124
126
128
13
Time (s)
Term
inal V
oltage (
V)
Experimental Terminal Voltage
Simulated Terminal Voltage
Experimental Terminal Voltage
Simulated Terminal Voltage
Figure 6-6 Experimental and Simulated Terminal Voltage of Test6 (SOH= 5306)
In the parameter identification of test shown in figure 6-6 the remaining capacity
is only about 12 of the initial capacity when the battery is brand new During the
discharge period the simulation and experimental result is not fitting very well
and the slopes of them are not the same This is probably also caused by
insufficient idle time after being charged and the capacitor had not fully
discharged
Figure 6-7 represents the internal resistance value in different state of health as
described in table 6-1
107
100 95 90 85 80 75 70 65 60 55 5004
045
05
055
06
065
07
075
08
State of Health
Inte
rnal R
esis
tance (
Ohm
)
r vs SOH
Approximation
Figure 6-7 Change of Internal Resistance in Different State of Health (Battery 1)
It is shown that the internal resistance is increasing when the state of health of a
lead-acid battery decreases This progress is at first very slow when the battery is
new But after a number of discharge cycles the remaining capacity of battery
drops to about 75 of the initial capacity when the battery is new and the
increase of internal resistance become faster When the state of health is brought
down to about 50 which means that the battery cannot offer enough energy as
new the value of internal resistance is increased by 30 approximately At
present there is not a published quantitative description of the internal resistance
when the capacity changes yet but it has been agreed that the internal resistance
increases while the battery health deteriorates
Similar tests have been carried out on 5 other batteries with the same nominal
108
capacity and the changes of their internal resistances are given as figure 6-8 It is
not possible to deduce a statistical approximation equation only based on the
existing data but it can be seen from the figure that the performance of internal
resistance under different state of health shows an agreement in a certain extent
100 95 90 85 80 75 70 65 60 55 5003
04
05
06
07
08
09
State of Health
Inte
rnal R
esis
tance (
Ohm
)
r vs SOH (Battery 1)
r vs SOH (Battery 2)
r vs SOH (Battery 3)
r vs SOH (Battery 4)
r vs SOH (Battery 5)
r vs SOH (Battery 6)
Figure 6-8 Change of Internal Resistance in all 6 Batteries
63 Summary and Discussions
The determination of battery remaining capacity accurately is becoming
increasingly important in modern battery managements This currently is mostly
obtained by integrating the discharge current of a full discharge but this progress
usually causes a negative effect on most of the batteries There is also a view that
109
the state of health which represents the percentage of remaining capacity of a
weak battery compared with the initial capacity when brand new can affect the
internal resistance therefore the battery state of health can be obtained by the
study of battery internal resistance However from the analysis based on the
mathematical model and the experimental results it can be concluded that other
parameters can also cause variations of the internal resistance which make the
estimation of the state of health more challenging
This chapter describes a new alternative method that based on the Improved
Battery Model and the key parameters of the model The remaining maximum
capacity of a used battery which represents the SOH of the battery is related in
the internal resistance under the depth of charge of 65 which is expressed by
the parameters of R00 and R10 These parameters can be identified by genetic
algorithms A result that quantifies the change of internal resistance in different
SOH values has been concluded based on the analysis of a series of experimental
tests
110
Chapter 7
Conclusions and Future
Research
This chapter summarizes the major achievements of the presented research work
in the field of battery modelling and state of health analysis Possible direction of
further research work is also described briefly in this chapter
71 Summary
Lead-acid batteries are used in various industrial sectors and are irreplaceable due
to their low price In areas where lead-acid batteries are employed as an energy
storage device the capacity loss caused by the repeated dischargecharge cycles is
very common This drop of capacity can neither be avoided nor be repaired by
using current technologies As a result it is essential to know whether the battery
is able to meet the demand and if it should be replaced on time
In this thesis a study on the capacity status of a battery and its relation to the
internal resistance had been conducted and this thesis established a novel model
based method to quantify the battery health An Equivalent Circuit Mathematical
model for the discharging progress of a lead-acid battery has been developed for
this purpose and is implemented under MatlabSIMULINK software environment
111
The model involves most of the important concepts of a battery to reflect the
dynamic response of terminal voltage when discharging
A series of experimental tests have been carried out during the project for the
model validation and the study of the state of health Six 12V-13Ah lead-acid
batteries with the same rated capacity are discharged and recharged from brand
new to obtain different values of state of health Genetic algorithm has been
employed to identify the unknown parameters of the battery model in each state of
health and the identified parameters are used as the factors that reflecting the state
of health and the internal resistance The internal resistances corresponding
different state of health have been collected and recorded A result was found in
the thesis that for the 12V-13Ah lead-acid battery which is used in the
experimental tests the value of internal resistance is increased by 25
approximately if the SOH of battery drops to 50
72 Limitations
The key limitation of the method introduced in this thesis is that it is based on the
parameter identifications of the model which means a test is still needed in order
to obtain the state of health The major reason is that the mathematical model does
not include the charging progress of battery which is also an important period of
the battery duty cycle Another limitation is that all the tests of the state of health
estimation are carried out at the same discharge rate because of the variation of
the internal resistance in different discharge rate as discussed in chapter 4 Finally
112
The lsquocoup de fouetrsquo behaviour that of took place at the beginning of discharge
when batteries are full is not able to be simulated in the current version of
mathematical model
73 Future Research Work
Following the limitations of the project some future research can be carried out in
three steps based on the model improvements and the practical applications of the
algorithm
First of all improvements of the discharging battery model can be carried out
which can mainly focus on the study of the battery internal resistance in different
discharge rates Equations of internal resistances that can withstand the change of
discharge rate will make the model capable for online applications Studies on the
relationship between the electromotive force and the state of charge can also lead
to a solution of the lsquocoup de fouetrsquo behaviour and a better simulation result
Another research work on the model modification is that the behaviour of battery
to the mathematical model when a battery is being charged can be involved by
which the monitoring system of battery can be implemented in the whole duty
cycles This part of work can be focused on the parasitic branch in the
mathematical model described in chapter 3
Further work should also reveal the variations of state of health in different duty
113
cycles and an algorithm based on this change should be designed to estimate the
remaining life-time of a lead-acid battery The value of current state of health and
the estimated raining life-time should also be considered as major outputs in this
period of work It is also possible to design an online management device of
battery to estimate the life-time and the state of health
114
References
Anon (2006) Global Wind Energy Council (GWEC) statistics [online] from
httpwwwgwecnetuploadsmedia07-
02_PR_Global_Statistics_2006pdf
Anon (2007) Battery Types Flooded versus AGM and Gel [online]
Retrieved February 13 2007 from
httpwwwvonwentzelnetBattery01Type
Anon (2007) BP Statistical Review of World Energy June 2007 [online] from
httpwwwbpcomliveassetsbp_internetglobalbpglobalbp_uk_englishr
eports_and_publicationsstatistical_energy_review_2007STAGINGlocal_
assetsdownloadsspreadsheetsstatistical_review_full_report_workbook_2
007xls
Anon (2007) International Energy Outlook 2007 [online] from
httpwwweiadoegovoiafieohighlightshtml
Ball R J Evans R and Stevens R (2002) Finite element (FE) modelling of
current density on the valve regulated leadacid battery positive grid
Journal of Power Sources 103(2) 213-222
Bernardes A M Espinosa D C R and Tenoacuterio J A S (2004) Recycling of
batteries a review of current processes and technologies Journal of
Power Sources 130(1-2) 291-298
Berndt D (1993) Maintenance-Free Batteries -- A Handbook of Battery
Technology Somerset Research Studies Press Ltd
Berndt D (2001) Valve-regulated lead-acid batteries Journal of Power
Sources 100(1-2) 29-46
115
Berndt D (2009) Electrochemical Energy Storage Battery Technology
Handbook CRC Press
Casacca M A and Salameh Z M (1992) Determination of lead-acid battery
capacity via mathematical modeling techniques Energy Conversion
IEEE Transaction on 7(3) 442-446
Ceraolo M (2000) New dynamical models of lead-acid batteries Ieee
Transactions on Power Systems 15(4) 1184-1190
Chan H L and Sutanto D (2000) A new battery model for use with Battery
Energy Storage Systems and Electric Vehicles Power Systems 2000 Ieee
Power Engineering Society Winter Meeting - Vols 1-4 Conference
Proceedings 470-475
Chen M and Rincacuteon-Mora G A (2006) Accurate electrical battery model
capable of predicting runtime and I-V performance IEEE
TRANSACTIONS ON ENERGY CONVERSION VOL 21( NO 2)
504-511
Chipperfield A J Fleming P J and Fonseca C M (1994A) Genetic algorithm
tools for control systems engineering Adaptive computing in
engineering design and control Plymouth UK
Chipperfield A J Fleming P J Pohlherim H and Fonseca C M (1994B)
Genetic algorithm toolbox for use with Matlab Department of automatic
control and systems engineering University of Sheffield
Crompton T R (2000) Battery Reference Book Third Edition Oxford
Elsevier Newnes
Cun J P Fiorina J N Fraisse M Mabboux H A and Mabboux H The
116
experience of a UPS company in advanced battery monitoring
Telecommunications Energy Conference 1996 INTELEC 96 18th
International 646 - 653
Durr M Cruden A Gair S and McDonald J R (2006) Dynamic model of a
lead acid battery for use in a domestic fuel cell system Journal of Power
Sources 161(2) 1400-1411
Esfahanian V Torabi F and Mosahebi (2008) An innovative computational
algorithm for simulation of lead-acid batteries Journal of Power
Sources 176(1) 373-380
Gillioli R and Cerolo P (1990) Charge and discharge fourth order dynamic
model of the lead battery 10th
intl Electric Vehicle Symposium Hong
Kong p1-9
Glendenning I (1981) Compressed air storage Physics in Technology 12(3)
103-10
GONG Q (2005) Modeling study of a vehicle traction battery model
CHINESE LABAT MAN 2005 Vol 42 Numb 2 issu 155 pages 76-79
Houck C Joines J and Kay M (1995) A Genetic Algorithm for Function
Optimization A Matlab Implementation NCSU-IE TR 95-09
Jacobi W (2009) Lithium Batteries Battery Technology Handbook CRC Press
Jayne M G and Morgan C (1986) a new mathematical model of lead acid
battery for electric vehicles Eighth Intl electric vehicle conference
Washington DC
Juvonen M (2003) Large-Scale Energy Storage Systems [online] from
httpwwwdocicacuk~mattiise2grpenergystorage_reportstoragehtml
117
Lee J H Lee K Y and Lee J Y (1996) Self-discharge behaviour of sealed
Ni-MH batteries using MmNi33+xCo07Al10-x anodes Journal of
Alloys and Compounds 232(1-2) 197-203
Liaw B Y Gu W B and Wang C Y (1997) Numerical simulation of coupled
electrochemical and transport processes in battery systems Proceedings
of the Intersociety Energy Conversion Engineering Conference
Honolulu HI USA IEEE
Lu S Meegahawatte D H Guo S Hillmansen S Roberts C and Goodman
C J (2008) Analysis of energy storage devices in hybrid railway vehicles
Railway Engineering - Challenges for Railway Transportation in
Information Age 2008 ICRE 2008 International Conference on
Mantell C L (1984) Batteries and energy systems Second Edition McGraw-
Hill Inc
MathWorks Inc (2004) Genetic Algorithm Direct Search Toolbox V102
MathWorksInc
MPowerSolutionsLtd (nd) Alternative Energy Storage Methods [online]
from httpwwwmpowerukcom
Okoshi T Yamada K Hirasawa T and Emori A (2006) Battery condition
monitoring (BCM) technologies about lead-acid batteries Journal of
Power Sources 158(2) 874-878
Perrin M Delaille A Huet F and Hernout L (2006) Study of the coup de
fouet of lead-acid cells as a function of their state-of-charge and state-of-
health Journal of Power Sources 158(2) 1019-28
Pham D T and Karaboga D (1998) Intelligent Optimisation Techniques
118
Genetic Algorithms Tabu Search Simulated Annealing and Neural
Networks New York Springer-Verlag New York Inc
RailPower Hybrid Technologies C (nd) Benifits of Hybrid Locomotives
[online] from httpwwwrailpowercomproducts_hl_benefitshtml
Rand D A J Moseley P T and Garche J (2004) Valve-Regulated Lead-Acid
Batteries Elsevier
Ruetschi P (2004) Aging mechanisms and service life of lead-acid batteries
Journal of Power Sources 127 (1-2) 33-44 Switzerland Elsevier
Salameh Z M Casacca M A and Lynch W A (1992) A mathematical model
for lead-acid batteries IEEE Trans on Energy conversion Vol7 No 1
Sato Y Takeuchi S and Kobayakawa K (2001) Cause of the memory effect
observed in alkaline secondary batteries using nickel electrode Journal
of Power Sources 93(1-2) 20-24
Sims R I Carnes J C Dzieciuch M A and Fenton J E (1990) Computer
modeling of Automotive lead acid batteries Ford Research Laboratories
Technical Report
Smil V (2007) Energy at the Crossroads Massachusetts Achorn Graphic
Services Inc
Ter-Gazarian A (1994) Energy storage for power systems London Peter
Peregrinus Ltd
TNI_Ltd (2007) Battery history [online] from
httpwwweuropulsecombattery_historybattery_historyhtm
Tuck C D S (1991) Modern Battery Technology Ellis Horwood Ltd
Wei J (2007) Development of Coal Mill and Aggregate Load Area Models in
119
Power Systems using Genetic Algorithms University of Liverpool PhD
Wikipedia (nd) Lead-Acid Battery [online] from
httpenwikipediaorgwikiLead-acid
Wikipedia (nd) Rechargeable Batteries [online] from
httpenwikipediaorgwikiRechargeable_battery
Wikipedia (nd) VRLA [online] from httpenwikipediaorgwikiVRLA
Zhang Y L Liu P H Zhang Q Y and Cheng W (2010) Separation of
cadmium(ii) from spent nickelcadmium battery by emulsion liquid
membrane Canadian Journal of Chemical Engineering 88(1) 95-100
120
Appendix I SIMULINK Diagrams of Battery Model
Figure A-1 SIMULINK Diagrams of ldquoMain Blockrdquo
121
Figure A-2 SIMULINK Diagrams of ldquoTerminal Voltage Calculationrdquo
122
Figure A-3 SIMULINK Diagrams of ldquoThermal Behaviourrdquo
123
Figure A-4 SIMULINK Diagrams of ldquoBattery Capacityrdquo
Figure A-5 SIMULINK Diagrams of ldquoBattery State of Chargerdquo
Figure A-6 SIMULINK Diagrams of ldquoBattery Depth of Chargerdquo
124
Figure A-7 SIMULINK Diagrams of ldquoBattery Electromotive Forcerdquo
(a)
(b)
Figure A-8 SIMULINK Diagrams of ldquoBattery Internal Resistancerdquo
125
Appendix II
List of Publications
S Hillmansen S Lu D H Meegahawatte S Guo C Roberts and C J
Goodman Analysis of Energy Storage Devices in Hybrid Railway Vehicles International Conference on Railway Engineering 2008 p68-73 Hong Kong China 25-28 March 2008
Y Yin X Luo S Guo Z Zhou J Wang A battery charging control strategy for
renewable energy generation systems The Proceedings of World Congress on Engineering 2008 Vol 1 pp356-361 London UK 2-4 July 2008
S Guo S Hillmansen Y Yin J Wang State of Health Monitoring of Lead-acid
Batteries Proceedings of the 14th International Conference on Automation amp Computing pp250-254 Brunel University West London UK 6 September 2008
Y Yin C Li Z Zhou Q Liu S Guo X Luo J Wang Design and Realization of a
PS2 Keyboard Interface in Embedded system Proceedings of the 14th International Conference on Automation amp Computing pp160-163 Brunel University West London UK 6 September 2008
Yin Y Wang J Luo X Guo S Development of a battery charging management
unit for renewable power generation a book chapter in Advances in
Electrical Engineering and Computational Science Edited by Sio-Long Ao and Len Gelman pp33-46 Springer 2009
Wang J Wei JL Guo S Condition monitoring of power plant milling process
using intelligent optimization and model based techniques accepted as a chapter in the book of Fault Detection in March 2009
S Guo S Hillmansen J Wang Model Based Analysis of Battery State of Health
using Genetic Algorithms accepted by the International Conference on Systems Engineering (ICSE) Coventry 8-10 September 2009

5
Contents
Chapter 1 Background and Objectives of the Project 1
11 Overview 1
12 Review of Energy Storage Systems 2
121 Applications of the Energy Storage Systems 2
122 Review of the Existing Energy Storage Devices 4
123 Review of Batteries 7
124 The Management of Batteries 11
13 Project Objectives 12
14 Outline of the thesis 13
Chapter 2 Introduction of Lead-acid Batteries 15
21 A General Overview of the Lead-acid Battery 15
22 Configuration of Lead-acid Batteries 18
221 Electrochemical Principles 18
222 Lead-Acid Battery Types and Technologies 20
223 Battery Designs for Different Applications 22
23 Mathematical Descriptions of Lead-acid Batteries 23
231 Capacity 23
232 Electromotive force 24
233 State of Charge and Depth of Charge 26
234 Internal Resistance and State of Health 27
235 Multi-Cell Lead-Acid Batteries 29
24 Summary 29
6
Chapter 3 Equivalent Circuit Modelling of Lead-acid Batteries 31
31 Requirements for the Battery Model 31
32 Overview of Battery Model Techniques 32
321 Electrochemical Model 32
322 Physical Models 33
323 Equivalent Circuit Model 34
324 Discussion of Different Battery Model Methods 35
33 Introduction of the Existing Equivalent Circuit Models 37
331 Simple Battery Model 37
332 Advanced Simple Battery Model 39
333 Thevenin Battery Model 40
334 Dynamic Battery Model 42
335 Fourth Order Dynamic Model 43
336 Improved Battery Model 44
34 Mathematical Model of the Lead-acid Batteries 44
341 Capacity 45
342 Electric Networks 48
343 State of Charge and Depth of Discharge 50
344 Electromotive Force of the Battery 50
345 Internal Resistance of a Battery 51
346 The Behaviour of Parasitic Branch 52
347 Main Branch Capacitance 53
348 Thermal Behaviour of a Battery 55
35 Mathematical Model of the Lead-acid Batteries 56
7
36 Summary and Discussion 57
Chapter 4 Experimental System Set up and Improved Battery Model Simulation
Implementation 59
41 The Experimental System 59
42 Improvements of the Battery Model 61
421 The Change of τ in Different Charge Status 63
422 Analysis in Variations of the Internal Resistance 64
423 Improved Lead-Acid Battery Mathematical Model 66
43 Simulation Study 68
44 Summary and Discussion 72
Chapter 5 Model Parameter Identification and Model Validation 73
51 Need for the Optimization Algorithms 73
52 Overview of the Optimization Algorithms 74
53 The Study of the Genetic Algorithms 77
531 Working Principle of GAs 77
532 Simulation Studies of Genetic Algorithms 81
54 Model Parameter Identification 87
541 Implementation of Genetic Algorithms and Experimental Data sets
87
542 Parameters of Battery Model 90
543 Battery Model Validation 92
55 Summary and Discussions 95
Chapter 6 The Analysis of State of Health (SOH) in association with the Internal
Resistance 97
8
61 Methodology 97
62 The identification of C0 R00 and R10 100
63 Summary and Discussions 108
Chapter 7 Conclusions and Future Research 110
71 Summary 110
72 Limitations 111
73 Future Research Works 112
9
List of Figures
Figure 1-1 Power density vs energy density plot 7
Figure 2-1 Working Principle of Lead-Acid Batteries (a) shows the battery when
discharging and (b) is when charging with a DC charger 18
Figure 3-1 Simple Battery Model 38
Figure 3-2 I-V chart of the Simple Battery Model 39
Figure 3-3 I-V Chart in different SOC 40
Figure 3-4 Sketch to show battery discharge behaviours in typical tests 41
Figure 3-5 Thevenin Battery Model 42
Figure 3-6 Fourth-order Battery Model43
Figure 3-7 Improved Battery Model 44
Figure 3-8 Battery Capacity vs Discharge Current 47
Figure 3-9 Lead-acid Battery Equivalent Network 48
Figure 3-10 The Equivalent Network with the Approximated mZ 49
Figure 3-11 R-C block 53
Figure 4-1 Equivalent Circuit of the Experimental Test Rig 60
Figure 4-2 Experimental Test Rig61
Figure 4-3 Test of constant-impedance load discharge 62
Figure 4-4 Test of two-load discharge 62
Figure 4-5 Structure of model for SIMULINK Implementation69
Figure 4-6 Terminal Voltage of Battery 71
Figure 5-1 Flowchart of a Simple Genetic Algorithm78
Figure 5-2 2-dimensional Rastrigins function83
Figure 5-3 Contour plot of Rastrigins function84
10
Figure 5-4 GA performance (Rastrigrinrsquos function) 85
Figure 5-5 2-dimensional Rosenbrock function 86
Figure 5-6 GA performance (Rosenbrock function) 87
Figure 5-7 Progress of Parameter Identification 88
Figure 5-8 Measured and Simulated Result after Parameter Identification 91
Figure 5-9 Mean and the Best Fitness Values in Each Generation 92
Figure 5-10 Measured and Simulated Terminal Voltage 93
Figure 5-11 Measured and Simulated Terminal Voltage 94
Figure 6-1 Experimental and Simulated Terminal Voltage of Test 1 (SOH = 100)
102
Figure 6-2 Experimental and Simulated Terminal Voltage of Test 2 (SOH=9314)
103
Figure 6-3 Experimental and Simulated Terminal Voltage of Test 3 (SOH=7889)
104
Figure 6-4 Experimental and Simulated Terminal Voltage of Test 4 (SOH=7019)
104
Figure 6-5 Experimental and Simulated Terminal Voltage of Test 5 (SOH=6354)
105
Figure 6-6 Experimental and Simulated Terminal Voltage of Test 6 (SOH=5306)
106
Figure 6-7 Change of Internal Resistance in Different State of Health (Battery 1)
107
Figure 6-8 Change of Internal Resistance in all 6 Batteries 108
1
Chapter 1
Background and Objectives of
the Project
11 Overview
Fossil fuels have been the main energy resource in recent human history although
their continuing use has been shown to have a detrimental effect on the
environment The principal problem for fossil fuels is that they cannot be
reproduced within a short period of time so it is a finite energy supply source If
current consumption rate continues they will be exhausted in a few generations
from now Fossil fuel has never been considered as a clean-resource because there
is an emission of noxious gasses including CO CO2 NOx SOx and HC into the
atmosphere With all the pressure from the problems associated with the fossil
fuel exploration of the usage of renewable energy is becoming an increasingly
important issue
Wind energy hydro energy and solar energy are three of the most important
renewable energy sources and they have been implemented on a large scale wind
energy has produced a annual global total of 65019 times 1012 Wmiddoth
(74223 MWtimes24htimes365 days) (Anon 2006) energy in the year 2006 and hydro
2
energy is about 304 times 1015 Wmiddoth (30404 times 1012 Wmiddoth) (Anon 2007) Solar energy
resources are estimated at about 10694times1015 Wmiddoth (3850times1021 J) (Smil 2007) To
compare with the worldwide energy consumption of 13097times1015 Wmiddoth in the year
2007 it is clear that renewable energies have a significant role to play (Anon
2007)
However the problem of the implementation of the renewable energy is that the
electricity generated is intermittent and the power systems are experiencing the
problem of rapidly changing power demand Therefore the management of the
energy is an important issue Devices of energy storage should solve these
problems in theory
12 Review of Energy Storage Systems
Not only giving a large scale energy solution energy storage devices are also
commonly used in a range of applications related to everybody Different energy
storage technologies are suited to different applications and consideration must be
made in order to select the correct solution for each application This section will
give an overview of the existing energy storage systems
121 Applications of the Energy Storage Systems
Large scale energy storage systems which are also called grid energy storage
refer to the methods used to large-scale store electricity within an electrical power
grid Off-peak energy is stored during times when production (from power plants)
3
exceeds consumption and the stores are utilized at times when consumption
exceeds production In this way electricity production need not be drastically
scaled up and down to meet momentary consumption ndash instead production is
maintained at a more constant level
Despite the applications in grid scale the energy storage systems are also popular
in a number of areas For example they are usually used to optimize the energy
generated from the engine in modern electrical hybrid vehicles One such
application is in a shunter locomotive A shunter is a small railroad locomotive
intended for assembling trains ready for a road locomotive to take over
disassembling a train that has been brought in and switching a train to another rail
at the rail terminals The duty cycle of a shunter is characterised by short duration
high power demands (accelerating a rake of vehicles) and the long periods of
idling while the train waits for other operations Comparing to traditional shunter
locomotive that use diesel engines only for the whole duty cycle hybrid shunter
locomotives with energy storage devices can have a 40-70 reduction in fuel use
(RailPower Hybrid Technologies nd) This saving is made by operating the prime
mover at its optimum
Another application of energy storage in the vehicle technologies is the
regenerative braking system which is used to save the braking energy of vehicle
The potential of this technology to save energy for a vehicle is depends on the
duty cycle (Lu Meegahawatte et al 2008) which is characterized by storing the
energy generated when the vehicle is decelerating and releasing when accelerating
4
Energy storage devices are also very popular in stationary applications also
known as the Uninterruptible Power Supply (UPS) systems This system is
designed to meet the power demand when problems like power failure happen and
it is important especially in the applications where power failures could have
serious consequences for example in hospitals and computer centres (Berndt
2009)
The energy storage devices in the UPS system are often used to achieve
ldquouninterruptiblerdquo in a short period before the secondary power supply started
When a power problem occurs the energy storage device starts to supply
electricity immediately and at the same time the generator begins to start When
the generator is ready to supply sufficient power the energy storage device stops
providing power When the grid power is recovered the energy storage device can
be recharged until full
122 Review of the Existing Energy Storage Devices
There are various kinds of energy storage systems including pumped hydro
compressed air flywheel supercapacitors electrochemical and also
superconducting magnetic Each technology is suited to different applications and
careful consideration must be made in order to select the correct solution for each
application
Pumped hydro is the oldest and the most effective kind of large scale energy
storage method which have been used for nearly a century since 1929 (Juvonen
5
2003) Two large reservoirs at different altitudes with a pump a turbine a motor
and a generator are employed to collect the off-peak energy The water is released
from the higher one through a turbine to generate electricity during peak load
period
Compressed air is a pneumatic energy storage method that refers to the air kept
under a certain pressure This system can be used in grid energy storage that the
air can be stored by compressors during periods with low power demand This
compressed air can be released to a generator to meet the high power demand
during peak time (Glendenning 1981 Ter-Gazarian 1994 Juvonen 2003) In some
applications the compressed air is released through a combustor mixed with
natural gas to obtain a higher overall efficiency
A capacitor is an electrical device that can store energy in an electric field
between a pair of conductors and is often used in circuits for short term energy
storage It blocks the circuit to hold DC voltage Supercapacitors are energy
storage devices with the same principle but with a higher energy density The
power density of the supercapacitor systems can be very high but the energy is
often released in a very short duration (Ter-Gazarian 1994) As a result the
supercapacitors are usually used in applications of an energy burst
Superconducting magnetic energy storage system stores energy in the magnetic
field generated by direct current in a coil Instead of traditional wires like copper
superconductors are employed to avoid the energy consumptions as heat because
of the resistance A problem is that the optimal operating temperature for
6
superconductors is 50-77K a refrigerator is therefore necessary in the system for
cooling down
Flywheels are considered as a method of storing mechanical kinetic energy by
accelerating a flywheel to a very high speed to store the energy and decelerating
to release the energy Flywheels are very efficient for short duration storage cycles
due to their fast response speed These energy storage devices are used mainly in
applications that demand kinetic energy storage and high numbers of deep
discharge cycles
Electrochemical energy storage stands for the device capable of converting
chemical and electrical energy to each other by chemical reactions Batteries are
the most common technology of electrochemical energy storage methods The
oxidation and reduction reactions in the two electrodes of battery lead to the
current through the external circuit when discharging to provide energy The
secondary battery can be recharged by applying electrical current which reverses
the chemical reactions that occur during the discharge
Fuel cell is another technology with very high energy density that converts the
chemical energy in a source fuel into an electrical current The fuel cells are
considered as the ldquoenvironmental friendlyrdquo as the only by-product is water The
working principle of fuel cells when discharging is the same as the batteries but
unlike the batteries the fuel cells do not need recharge as they only provide
electrical energy while the active chemicals are supplied to the electrodes (Mantell
1984 MPowerSolutionsLtd nd)
7
Figure 1-shows the Ragone chart of the energy and power density of some energy
storage systems
Figure 1-1 Power density vs energy density plot (MPowerSolutionsLtd nd)
123 Review of Batteries
The preceding discussion has identified that energy storage devices are becoming
increasingly important in both stationary and mobile applications Battery as the
most popular energy storage device is studied in this section
There are two different types of batteries applied in a large range of areas now
Primary batteries and Rechargeable batteries Primary batteries which are also
called disposable batteries often have higher energy densities than the
rechargeable ones and they have a lower self-discharge (Ter-Gazarian 1994)
8
However as the chemical reactions in these batteries are not reversible and the
active materials cannot be restored to their initial forms these batteries cannot be
reliably recharged The primary batteries are intended to be used once and then
discarded therefore they are not suitable for the energy storage systems
Rechargeable battery is the other type of the electrochemical batteries which is
also known as secondary battery because their electrochemical reactions are
electrically reversible There are many different rechargeable battery technologies
in which only four of them are leading the world market nickel-cadmium nickel-
hydride lead-acid and lithium-ion (Berndt 1993 Berndt 2009)
The Nickel-cadmium (NiCd) battery is a kind of rechargeable battery that uses
nickel oxide hydroxide and metallic cadmium as electrodes and an alkaline
electrolyte (often potassium hydroxide) (Mantell 1984) As designed to compete
the primary batteries the NiCd batteries are often manufactured in the same size
and they are used in the consumer market as primary batteries for example in
clocks toys radios and cordless tools However when the NiCds are substituted
for primary cells the lower terminal voltage and smaller ampere-hour capacity
may reduce performance as compared to primary cells The most attractive feature
of the nickel-cadmium batteries is that they are more difficult to damage
comparing with other batteries during deep discharge cycles They can also
sustain more cycles and the lower internal resistance can also help achieve a
higher maximum discharge rate A problem preventing the large scale application
of this battery technology is that the nickel-cadmium batteries suffers faster self
discharge rate than other rechargeable batteries and the cadmium used as the
9
active material in one of the electrodes is toxic and expensive (Zhang Liu et al
2010) Furthermore the capacity loss caused by the continuously discharge and
recharge to the same state of charge called ldquomemory effectrdquo is also a very
important issue of the nickel-cadmium batteries (Sato Takeuchi et al 2001)
The nickel-metal hydride (NiMH) battery is a type of secondary electrochemical
battery that designed to substitute for the nickel-cadmium cells They have a
similar size and a similar cell voltage but with more advantages By using
hydrogen-absorbing alloy as negative electrode instead of cadmium this
electrochemical technology is considered as ldquoenvironmental friendlyrdquo because of
the absence of toxic cadmium (Berndt 1993) The nickel-metal hydride batteries
also have low internal resistance and the high cycle durability as the NiCds and a
NiMH battery can have two to three times the capacity of an equivalent size
nickel-cadmium battery However the nickel-metal hydride batteries also have a
similar high self-discharge rate as the nickel-cadmium batteries (Lee Lee et al
1996) and it also cannot afford complete discharges Memory effect from
repeated partial discharge can occur in a NiMH battery but this is reversible
through charge cycling (Berndt 2009)
The lead-acid batteries are the oldest type of rechargeable battery with a history of
over 150 years but they are still the most popular battery chemistry for
applications such as engine starting or backup power systems as there is no
cheaper alternative when weight is not a factor This technology uses lead and
lead dioxide as electrodes and an acid electrolyte of sulphuric acid and the
advantage of this configuration is that the electrolyte takes part in reactions of
10
both electrodes and both electrodes turn into lead sulphate when discharging
(Berndt 1993 Berndt 2009) The lead-acid batteries can be designed for not only
deep discharge cycles but high discharge rate or compromise of the two cycles
They have a lower self-discharge rate compared with the nickel batteries and they
also do not suffer from the memory effect (Mantell 1984 Berndt 2009) However
as the energy density of lead-acid battery is not high it is seldom applied in the
portable electronics Another important problem is that the lead-acid batteries
must be recycled as the active material ldquoleadrdquo is toxic to both the environment and
the human bodies (Bernardes Espinosa et al 2004)
The lithium-ion (Li-ion) batteries are almost the perfect cell chemistry and are
currently used a wide range of consumer electronics products including cameras
cell phones laptops etc They have many attractive performance advantages
which make them also ideal for higher power applications such as automotive and
standby power First of all the lithium-ion batteries have the highest energy
density in all the rechargeable battery now which is about 4 times better than
lead-acid (Jacobi 2009) They are also capable for deep discharge and high
discharge rate with a relatively slow self discharge There is no liquid electrolyte
in the lithium-ion batteries which means they are immune from leaking However
just opposite to the lead-acid batteries the most serious problem that discourages
the lithium-ion batteries is the low economic efficiency comparing with the lead-
acid batteries Other factors like the stability of the chemicals and the recycling of
lithium should also be concerned because of the chemical activeness of lithium
Table 1-1 is gives some basic properties of the four major rechargeable batteries
11
introduced above There are also some less common battery chemistries used by
rechargeable batteries in addition to these technologies including nickel-zinc
(NiZn) nickel-iron (NiFe) etc but they have a small market share For the four
major battery chemistries lead-acid batteries with their low price and high
flexibility is adopted in a wide range of application areas
Table 1-1 properties of the rechargeable batteries (Wikipedia nd)
Type Voltage
(V)
Energy Density (Whkg)
Power Density (Wkg)
Self Discharge
rate
Cycle Durability
Nickel-Cadmium
12 40-60 150 20 1500
Nickel-Metal-Hydride
12 30-80 250-1000
20 1000
Lead-Acid 21 30-40 180 3-4 500-800
Lithium-ion 36 160 1800 5-10 1000-1200
124 The Management of Batteries
In the areas that batteries are employed as the energy storage device it is a critical
issue to consider that whether there is enough energy in the battery to meet the
demand However batteries do have the problem in limited cycle durability that
is when a battery is charged and discharged for a number of cycles its total
capacity decreases If the battery cannot offer sufficient powerenergy it should be
replaced at the right time But the problem is that it is difficult to quantify the
capacity loss and when the capacity of battery is no longer sufficient for a
particular application Due to the limitation of batteries it is essential to develop a
method to determine the capacity of battery that subjected to various duty cycles
in a number of applications
12
13 Project Objectives
The main objective of the project is to develop a method which can determine the
key parameters of batteries from the discharge tests The proposed methodology is
a model based approach that is to develop a mathematical model of the battery
which can represent the dynamic performance and battery status and
characteristics can be investigated through the analysis of the model
The first step of the project is to build a mathematical model of battery The
dynamic model is expected to reflect the relevant behaviours of battery when
being discharged including the characteristics of State of Charge Depth of Charge
Electromotive force Terminal Voltage The unknown parameters in the model are
identified by using Genetic Algorithms (GAs) with the laboratory experimental
data Afterwards some batteries are tested in experiments and the parameters in
different state of health are recorded to analyze the battery in different status of
battery
The focus of this work is to develop a suitable method for parameter identification
for common battery systems The lead-acid battery has been chosen because it has
relatively well defined properties and there is a wealth of literature describing the
performance of these types of batteries From an experimental view point they are
also readily available of low cost
13
14 Outline of the thesis
The thesis is organized into seven chapters and the first chapter presents the
background and motivation of the research project The remaining chapters are
briefly described as follows
Chapter 2 gives an overview of lead-acid batteries including the development
working principle and also some modern battery designs and technologies In the
second part of chapter 2 important concepts for a battery including electromotive
force capacity state of charge internal resistance and state of health are
introduced and some mathematical descriptions of these concepts are discussed
Chapter 3 starts from some requirements of the mathematical model designed for
this project and several different methods of battery model approaches are
discussed Afterwards some details of the dynamic mathematical model are
analyzed The initial battery model is described in the last part of this chapter that
summarized the equations of the battery
Chapter 4 is mainly focused on some improvement of the mathematical model
described in chapter 3 In the first section of chapter 4 the experimental test rig in
the project is introduced Some findings in the experimental tests is then listed and
studied and integrated into the improved model Finally the SIMULINK
implementation and a simulation study are given
Chapter 5 presents a method of model parameter identification The principle of
14
Genetic Algorithms is studied at first Then this algorithm is employed in the
model and the parameters of the model are identified with the help of
experimental tests This chapter also includes the validation of battery model
using two other groups of test results
Chapter 6 develops an algorithm that can reflect the state of health of a lead-acid
battery In this chapter the internal resistance parameters are measured under
different state of health through a group of continuous experimental tests The
change of internal resistance under a specific working condition is then related to
the battery state of health
Finally Chapter 7 gives a summary and the conclusions of the project Also the
future works that can be improved are proposed in this chapter
15
Chapter 2
Introduction of Lead-acid
Batteries
This chapter gives an overview of lead-acid batteries including background
knowledge working principles explanation of terminologies technologies and
applications encountered for this technology The chapter presents the
fundamental knowledge and prepares for the project work to be reported in the
following chapters
21 A General Overview of the
Lead-acid Battery
The lead-acid battery is the oldest type of rechargeable battery The first example
of a lead-acid battery can be attributed to the German physicist Sinsteden who
published the performance data of this battery system in 1854 (Berndt 1993)
Later in 1859 the French physicist Planteacute realized that a plate construction was
required to achieve a much larger effective surface area and he produced the first
rechargeable battery which was marketed for commercial use by alternately
charging and discharging lead sheets immersed in sulphuric acid This method
has remained unchanged and still in use today in stationary applications (Berndt
16
1993 Wikipedia nd) One of the first applications of lead-acid batteries was for
storing electrical energy for telegraphy systems The capacity required for these
applications was low and the battery at that time was not yet suited to high power
industrial applications (TNI_Ltd 2007)
In 1880 a French chemical engineer Faureacute significantly improved the design of
the lead-acid battery by producing the active materials separately His method was
to coat the lead plate with a paste of lead oxides sulphuric acid and water in a
warm humid atmosphere The paste then changed into a mixture of lead sulphates
which adhered to the lead plate as an electrochemically active material As a result
of this technology the Faureacute cells are able to achieve much higher capacity with
the first charge in comparison with the Planteacute ones (Berndt 1993 TNI_Ltd 2007)
The problem of these plates is that they are not very durable and become weak
only after a few dischargecharge cycles The lead grid alloyed with antimony or
calcium was developed to improve the mechanical characteristics The holes on
the grid are able to achieve improved bonding thus the batteries may have a longer
lifetime This advantage led to the industrial manufacturing of lead-acid batteries
In 1881 a lead electrode with a ribbed surface was designed in order to have a
large effective surface of the active material and this was the pioneer of the large
surface plates which are still common today (Berndt 1993 TNI_Ltd 2007
Wikipedia nd)
In the beginning lead-acid batteries were operated in open jars The advantage of
this feature was that the electrode can be cleaned and exchanged easily but faced
the problem of water evaporation Therefore the early batteries have to refill water
17
in order to continue normal use However this problem can be dramatically
reduced when the cells were fitted with covers to limit the evaporation (Berndt
1993) This kind of battery design is known as a lsquoflooded lead-acid batteryrsquo
In the 1950s a new type of battery which was aimed to become spill-proof was
designed and manufactured on a large scale This type of battery is characterized
by an immobilized electrolyte however this kind of spill-proof battery was only
manufactured in small sizes up to about 10 Ah (Berndt 2001) Later the
combination of a valve improved the characteristic features of the lead-acid
battery and this kind of battery is still common today and is known as the Gel
Lead-acid battery (Berndt 1993) In the 1970s micron diameter glass fibres
originally designed for air filters were used in glass mats which absorbed the
electrolyte and acted as separator Soon this kind of Absorbent Glass Mat (AGM)
battery appeared in market for stationary application
Currently Valve Regulated Lead Acid (VRLA) batteries based on both AGM and
Gel electrolytes are available in a large range of capacities for both stationary and
mobile power applications with a range of different designs for each type of
application Arguably the most important application of lead-acid batteries is for
vehicle engine starting The battery employed in this application which is called
Starting Lighting and Ignition (SLI) batteries are designed to deliver bursts of
energy usually in a discharge current as large as several hundred amperes in a
very short time A different type of battery construction can produce batteries
capable of deep cycling which are more suited to slow discharge cycles (Tuck
1991 Anon 2007)
18
22 Configuration of Lead-acid Batteries
This section gives a brief description of the working principles of lead-acid
batteries and how the battery can be configured to suit different applications
221 Electrochemical Principles
The lead-acid battery comprises two electrodes and the electrolyte The structure
of the lead-acid battery is shown in Figure 2-1 in which one electrode is Cathode
and the other is Anode The active matter in the positive plate is made of lead
dioxide (PbO2) and that in the negative plate is made of lead (Pb) and the
electrolyte is sulphuric acid One electrode can serve either as a Cathode or as an
Anode depending on which process the battery is experiencing - charging or
discharging With this structure a battery could convert electrical energy into
chemical energy and back again which is associated with the process of charging
and discharging
(a) (b)
Figure 2-1 Working Principle of Lead-Acid Batteries (a) shows the battery when
19
discharging and (b) is when charging with a DC charger
For the discharging process as shown in Figure 2-1 (a) the negative plate acts as
the anode and the positive plate is the cathode If a wire is connected between the
two the excess electrons from the anode will travel through the wire as a current
to the cathode where they are needed to complete the electron deficient reaction
there The chemical reactions in a lead-acid battery when discharging are
described as follow
Negative plate reaction (Anode)
+minusminus+rarrminus+ HPbSO2eHSOPb 44
Positive Plate reaction (Cathode)
O2HPbSO2e3HHSOPbO 2442 +rarr+++minus+minus
For the charging process an external power source is connected to the two
electrodes with the voltage as shown in Figure 2-1(b) In this way the flow of
electrons is forced backwards against the electropotential and the reactions are
driven backwards changing the lead sulphate back into lead and lead dioxide on
the negative and the positive plates and restoring the sulphuric acid to the liquid
electrolyte The anode when a battery is charging is the positive plate and the
cathode is the negative plate and the chemical reactions in a lead-acid battery
when charging are described as
Positive plate reaction (Anode)
+minusminus++rarrminus+ 3HHSOPbO2eO2HPbSO 4224
Negative plate reaction (Cathode)
minusminus++rarr++ 44 HSOPb2eHPbSO
20
The thermodynamic heat effects caused by the reactions are small in the lead-acid
battery because the difference between the enthalpy and the free enthalpy is very
small The rate of reversible heat effect in the reaction is 132 kJ per mol of the
cell reaction which corresponds to about 35 of the total energy converted when
the lead-acid battery is discharging or charged This amount of energy is relatively
small and is generated over a comparatively long period of time so it is usually
easily dissipated through radiation and convection (Berndt 1993)
222 Lead-Acid Battery Types and Technologies
The flooded battery is the simplest type of lead-acid battery in use Flooded
batteries are common for some traction applications despite the requirement in
high maintenance They are also very common for large capacity backup power
supplies for telecommunication computer centres grid energy storage and off-
grid household electric power systems Since the flooded batteries are not sealed
they must be kept upright to avoid acid spills and water must be periodically
added to top up the liquid electrolyte The most attractive feature of the flooded
battery is that they are able to withstand certain level of overcharging without
damage providing proper maintenance is carried out
The Valve Regulated Lead-Acid (VRLA) battery which is often colloquially
called the sealed lead-acid battery is becoming more and more popular in many
applications Because VRLA batteries are mostly sealed the electrolyte
evaporation will be reduced and spillage can be largely avoided when
overcharging which are very common in flooded batteries The electrolyte of the
21
VRLA battery is designed to be immobilized so the VRLA batteries will not leak
if inverted pierced or if the container is broken They can be mounted in any
orientation and position even immersed in water The immobilization of the
VRLA electrolyte can be achieved by using an absorbent mat separator as well as
gelling materials
In Absorbent Glass Mat (AGM) battery the electrolyte is absorbed into a mat of
fine glass fibres in order to immobilize the electrolyte In addition the pores in the
mats are fine enough to prevent the lead dendrites in the cathode from growing
through as a separator and only glass is wetted enough by sulphuric acid can soak
the separators The glass mats can therefore be used to insulate the electrodes
Gelling is another way to immobilize the electrolyte and this gelling technology at
present is only applied for lead-acid batteries The idea is to mix the sulphuric acid
with silica fume (SO2) which makes the electrolyte gel-like The mixture is stable
over a long term environmental safe and easy to work technically (Berndt 1993)
The sulphuric acid bound by the gel can also insulate electrodes as a separator
similarly with that in an AGM battery
VRLA batteries including both gel and AGM batteries are able to recombine and
reduce the emission of gases during overcharge so the requirement for the room
ventilation is reduced and there is no acid fume emission during normal discharge
(Berndt 1993 Anon 2007 Wikipedia nd) Although the generation of hydrogen
can be slowed down it cannot be avoided completely As a result a valve
regulation safety system is employed in VRLA batteries which vents the gases in
22
the battery only during over pressure faults (Tuck 1991 Berndt 1993)
However the VRLA batteries do have some drawbacks First of all the VRLA
batteries tend to have a lower specific energy density than flooded batteries and
they are also more expensive An accurate charging control is very important for a
VRLA battery especially when charging under high temperature environments
since it is not possible to cure the damage caused by overcharge
223 Battery Designs for Different Applications
Lead-acid batteries are deployed in a range of applications Different designs are
therefore required due to the different working environments and duty cycles SLI
batteries are designed for a burst of energy for cold-cranking an engine A SLI
battery is supposed to provide power only in the first few seconds when starting
an engine and will be recharged immediately once the engine is started In this
kind of lead-acid batteries a larger surface area of the electrode plates is used to
provide high electric current in a short period However repeated deep discharge
may shorten the battery lifetime
On the other hand deep cycle batteries are designed for applications where the
batteries are regularly discharged The plates of the deep cycle batteries are often
very thick in order to withstand the frequent and deep discharge cycles The plate
surface area of a deep cycle battery is not as large as a SLI battery and as a result
it is not possible to offer great power
23
Marine batteries are a compromise between a SLI battery and a deep cycle battery
Standby batteries can be classified as marine batteries which are used for backup
power supplies and providing the power in emergency situations They are
designed for a long lifetime and a large capacity but repeated discharges and high
current drain are not the intended application Traction batteries are designed for
higher current drain and repeated deep discharge cycles They are usually bigger
and heavier than other types of lead acid for the same voltage and capacity but
that is the cost of durability
23 Mathematical Descriptions of Lead-acid
Batteries
In order to investigate the relationship between the battery behaviour and
remaining lifetime for a lead-acid battery initial studies have been carried out and
are described in this chapter Concepts including Capacity State of Charge (SOC)
Depth of Charge (DOC) State of Health (SOH) and internal resistance are
introduced and quantitative descriptions of these concepts are listed
231 Capacity
The capacity of a lead-acid battery represents how much charged energy the
battery can offer which is usually described in Ampere-hours (Ah) The charge
capacity of a battery is decided by the construction factors of a battery cell This
includes the materials contained in the electrodes and the acid solution In
addition the capacity of a battery is not a fixed quantity but varies according to
24
how quickly it is discharged This is known as Peukertrsquos law (Ceraolo 2000
Dhameja 2001 Rand Moseley et al 2004)
tICk
p = (21)
where pC is the capacity on one-ampere discharge rate which is a constant
I is the discharge current (A)
t is the time of discharge (h)
k is the Peukert constant and for a lead-acid battery with the value
between 11 and 13 (varies for each individual battery)
It is common to refer to ldquoCnrdquo as the capacity of battery in Amp-Hours which
corresponds to complete discharge of the battery in n hours ldquonrdquo is a subscript that
represents the discharge rate In industry the capacity under ten-hour discharge
rate (C10) is always taken as the nominal capacity
232 Electromotive force
The electromotive force of a battery cell is the difference between the electric
potential of the two electrodes of each cell (Rand Moseley et al 2004) The
potential of each electrode which is called half cell potential is decided by the
chemical reaction and the relative activities of the solution and can be obtained
from Nernstrsquos equation (Crompton 2000)
25
Ox
Redln0
α
α
zF
RTEE minus= (22)
where E is the half-cell potential (V)
0E is the standard half-cell potential (V)
α is the relative activity of the oxidizer (α Ox) and reducer (α Red)
z is the number of electrons transferred in the cell reaction
R is the universal gas constant which is 8314472 JKminus1molminus1
T is the absolute temperature
F is the Faraday constant the number of coulombs per mole of electrons
and F = 964853399times104 Cmolminus1
At room temperature RTF is a constant of 25693mV for cells therefore
Ox
Redlog
z
V05910
Ox
Redln
z
mV69325
Ox
Redln 10
α
α
α
α
α
α==
nF
RT
The Nernstrsquos Equation therefore can be expressed by
Ox
Redlog
V0591010
0
α
α
zEE minus= (23)
The electromotive force could be calculated by the difference of the electric
potential
cathodeanode EEEMF minus= (24)
When a lead-battery is discharging the electromotive force can be written as
26
O)(H
)(SO)(Hlog
V05910
2
2
24
10
00
α
ααminus+
+minus=z
EEEMF cathodeanode (25)
The standard half-cell potential of the anode 0
anodeE is equal to 1685 (PbO2-
PbSO4SO42-) and that of cathode
0
cathodeE is -0356 (Pb-PbSO4SO42-) which are
constants for the same battery chemistry And the number of electrons transferred
( n ) is 2 for a lead-acid battery
Therefore the electromotive force of a lead-acid cell can be obtained by
O)(H
)(SO)(HlogV029600412
O)(H
)(SO)(HlogV02960)3560(6851
2
2
24
10
2
2
24
10
α
αα
α
αα
minus+
minus+
+=
+minusminus=EMF
(26)
This electromotive force of a battery cell is numerically equal to the open circuit
voltage which means that the terminal voltage of a single cell battery when it is
disconnected from the external load For a lead-acid cell the electrochemical
force at fully charged is between 210-213V per cell
233 State of Charge and Depth of Charge
State of charge (SOC) and depth of charge (DOC) are variables that can describe
the battery charge The main difference is that the SOC describes the percentage
of remaining charge relative to the nominal capacity while the DOC represents
that relative to the actual capacity under a specific discharge current These two
27
variables can be obtained by calculating the charge consumed and the battery
capacity
101 CQSOC eminus= (27)
Ie CQDOC 1minus= (28)
where Qe is the charge consumed by the load (Ah)
C is the nominal capacity (Ah)
CI is the actual capacity under the discharge current I (Ah)
234 Internal Resistance and State of Health
The internal resistance of a lead acid cell is the physical resistance of the cell The
value of the internal resistance is decided by many different factors But it could
be obtained by a simple equation
I
VVr tOC minus
= (29)
where Voc is the open circuit voltage (V)
Vt is the terminal voltage when discharging (V)
I is the discharge current (A)
However the factors in this equation are only a method of calculating the internal
resistance but not the determinants It is shown in applications that the internal
resistance of a lead-acid battery will increase when discharging as the SOC and
28
the DOC drops
It is common for batteries to suffer a capacity loss when discharged and charged
in a number of duty cycles even when idle Aged batteries are often weak and
sometimes not able to offer enough charges Therefore they should be replaced or
maintained State of health is a defined variable that is important for a weak
battery This variable is to show how weak the battery is and represents the
percentage of remaining capacity to the initial capacity when the battery is brand
new (Okoshi Yamada et al 2006) as shown in the equation
new
weak
C
CSOH = (210)
where Cweak is the remaining capacity of a weak battery (Ah)
Cnew is the capacity when the battery is brand new (Ah)
The reason for the capacity loss is complex but is usually due to the sulphation
Sulphation is a process when the amorphous lead sulphate which is easily
converted back to lead lead oxide and sulphuric acid converts to a stable
crystalline form coating the electrodes This form of lead sulphate cannot conduct
electricity and cannot be converted back to lead lead dioxide and lead sulphate
under normal charging conditions The internal resistance of a lead-acid battery
therefore increases and less charge can be provided when discharging Complete
or repeated deep discharges of a battery at low current densities that lead
excessive utilization of the active material are the most critical reason for
29
capacity loss for example a discharge of a traction battery that draws more than
80 of its nominal capacity (Berndt 1993)
235 Multi-Cell Lead-Acid Batteries
In most applications of batteries the voltage of an individual cell is not enough to
provide the sufficient voltage and power supply The solution is usually to series
connect a number of cells in a battery in order to achieve a higher battery voltage
The electromotive force of a series of lead-acid battery cells is directly related to
the cell numbers as well as the charge state of each cell For a six-cell lead-acid
battery which is a standard for most common usages the fully charged
electromotive force is about 128V The internal resistance of a multi cell battery
however is also equal to the sum of the internal resistances of each cell
Usually all the cells in a multi-cell battery should be constructed in the same
manner and in particular the capacity should be consistent because the capacity of
a multi-cell battery will be limited to the cell with the lowest capacity If one of
the cells fails it is not possible for the current to flow through the cell and the
battery is therefore disconnected from its internal cell loss Also if the SOC of one
particular cell drops faster than others in a battery the electromotive force of that
cell may affect the whole behaviour of the battery
24 Summary
The technology development of lead-acid batteries has been continuous over the
30
last 150 years From the earliest open cell batteries different advanced battery
configurations are now available which have been adopted in a wide range of
applications Meanwhile a number of solutions have been developed to address
the battery problems encountered in applications such as electrolyte evaporation
spillage and the electrolysis of electrolyte when charging However there are still
issues affecting the efficient and safe use of lead-acid batteries for example
determination of the SOH which if addressed in a robust manner would lead to
significant improved battery management system performance This chapter has
presented the essential fundamental knowledge technology terms and working
principles of lead-acid batteries which is served as a preparation for further study
reported in the following chapters of the thesis
In order to reveal the dynamic behaviour of a battery under different SOH and
identify the suitable strategy for SOH determination the mathematical modelling
study is carried out and an equivalent circuit model is derived in the next chapter
The key concepts of the battery model are explained and the fundamental analysis
is given for the concepts introduced
31
Chapter 3
Equivalent Circuit Modelling
of Lead-acid Batteries
In order to estimate the status of a battery a model based approach is adopted in
the project A mathematical model for lead-acid batteries should be developed
with a suitable level of abstraction This chapter describes the requirements to the
model to serve the project objectives and reviews the available model
technologies An improved mathematical model for lead-acid batteries is
introduced in the late part of this chapter
31 Requirements for the Battery Model
The main objective of the project is to develop an algorithm that can determine
the battery health by monitoring the battery status during discharge cycles This
algorithm is designed for implementation in a battery health monitoring system
with life-time prediction capabilities This prediction system is intended to work
on applications where the battery performance is of great importance for instance
hospital UPS systems and vehicle ignition systems To achieve the objective the
requirements to the mathematical model can be defined as
Requirement 1 The model should be able to calculate the evolution of key
battery parameters including terminal voltage cell temperature the state of health
32
and the internal resistance which describe the condition of the battery for
dynamical discharging It should also be able to adequately represent dynamic
processes while the battery is discharging
Requirement 2 The complexity of the model must be sufficient to satisfy the
requirement 1 but must also be executable in real-time for a model-based
condition monitoring system
Requirement 3 The output of the battery model should be understandable to the
battery operators and technicians as well as meaningful to those who do not have
any background in battery technologies
32 Overview of Battery Model Techniques
A number of different types of battery models have been used to serve as a tool in
solving a range of problems (GONG 2005) These include Electrochemical
Models Computational Fluid Dynamics Models Finite Element Models and
Equivalent Circuit Models This section gives an overview to the above named
four different types of battery models and the problems which are addressed by
each of them In Section 324 every battery model technology is assessed against
the overall requirements
321 Electrochemical Model
Electrochemistry is a branch of chemistry that studies chemical reactions which
33
take place in a solution at the interface of an electron conductor (a metal or a
semiconductor) and an ionic conductor (the electrolyte) The reactions involve
electrons transfering between the electrode and the electrolyte or species in
solution The application of electrochemistry research directly leads to the
development of the lead-acid batteries
Behaviour of a battery depends not only on how the battery is used but also on a
number of construction factors (Ruetschi 2004) These factors include but are not
limited to the thickness of the plates the active mass density of the active
material the concentration of the acid solution and the geometry of the electrodes
(Berndt 2001 Ruetschi 2004)
The electrochemical model is mainly focused on the oxidationreduction reactions
between the electrolytes and the electrodes By analyzing the consistency of each
matter in the solution and the electrochemical reaction caused by the connection
of electrodes to external circuit it is possible to represent the dynamic behaviour
of the battery (Crompton 2000)
322 Physical Models
The finite element method is a numerical analysis technique for finding
approximate solutions of partial differential equations as well as of integral
equations The basic principle of the Finite Element Model (FEM) is to divide the
problem into elements and each element is a smaller problem to be solved so that
they could be analyzed separately The lsquoelementsrsquo are then be assembled together
34
to restore the initial problem
Finite element is a very popular method of analysis in those areas with a complex
geometry and it is good at stress and thermal analysis For batteries the Finite
Element Models can help with a good understanding of the heat loss and that for
vibration problem in mobile applications There are also attempts to analyze the
current density on the positive grid bar in a lead-acid battery using FEM (Ball
Evans et al 2002)
Computational Fluid Dynamics (CFD) technology is a well-established tool for
physical analysis and optimization of fluid flow mass and heat transfer and
related phenomena (eg chemical reactions) that may simultaneously take place in
a complex system (Liaw Gu et al 1997) Computers are used to perform millions
of calculations required to simulate the interactions of fluids and gases with the
complex surfaces used in engineering
In a CFD Model of a battery the dynamic governing equations are solved with
respect to time space and all the physical time and space dependent properties
Acid concentration and potential distribution across the cell for instance can be
obtained Therefore such a modelling is able to give a very good understanding to
battery parameters and detailed characteristic of battery dynamics
323 Equivalent Circuit Model
An equivalent circuit refers to the simplest form of a circuit that retains all of the
35
electrical characteristics of the original (and more complex) circuit In its most
common form an equivalent circuit is made up of linear passive elements
However more complex equivalent circuits are used to approximate nonlinear
behaviours of the original circuit as well
In electrical engineering it is often useful to use an equivalent circuit model to
describe the non-ideal operation of a device For electrical engineers electrical
models are intuitive useful and easy to handle especially when they can be used
in circuit simulators and alongside application circuits
324 Discussion of Different Battery Model Methods
The electrochemical model focuses on the electrochemical reactions and the
activities in the battery which is very popular in the applications for the
constructional and design purpose However many electrochemical factors
contained in the electrochemical model are irrelevant to the external circuit and
some of the important parameters like the internal resistance are hard to describe
in an electrochemical model Therefore this model technology is not able to meet
the project Requirement 1 As the calculations in the electrochemical model are
not complicated Requirement 2 can be therefore satisfied by an electrochemical
model of battery Requirement 3 might be difficult to obtain for an
electrochemical model because the understanding of the outputs for an
electrochemical model usually need some background knowledge of the battery
chemistry As a result the electrochemical model is not chosen for the project
36
Physical models can give good understanding to the battery important parameters
so that Requirement 1 of the project can be satisfied The Requirement 3 can be
also met as the terminal voltage can be calculated as the output with the
knowledge of these parameters One significant disadvantage is that the physical
models involves huge amount of calculation in analysis which is quite time
consuming In finite element or CFD methods a large nonlinear system of
equations is solved iteratively and that could take excessive CPU time especially
for when the system is more than 2 dimensions As a result the physical
modelling methods cannot meet the Requirement 2 of fast response required by
the project (Esfahanian Torabi et al 2008)
In an equivalent circuit model most of the characteristic required by the project
can be reached in a reasonable level It is able to reflect the dynamic behaviour of
battery using simple circuit blocks such as voltage sources resistors and
capacitors (Chen and Rincacuteon-Mora 2006) That is to say the Requirement 1 of
the project can be satisfied by the equivalent circuit model And the model
simplicity causes its low computational time as Requirement 2 and therefore it
can be suited to the online implementation (Esfahanian Torabi et al 2008)
Additionally basic battery parameters like internal resistance terminal voltage
and SOC etc can be chosen as the main output of the model to meet the
Requirement 3
Table 3-1 summarized a comparison of all the three model methods on the
satisfaction of the requirements for the project
37
Table 3-1 Satisfaction of the Requirements in different Model Methods
Requirement 1 Requirement 2 Requirement 3
Electrochemical Model times radic times
Physical Model radic times radic
Equivalent Circuit Model radic radic radic
33 Introduction of the Existing Equivalent
Circuit Models
Section 32 introduced three different types of battery models to serve for different
research purposes each with different features and strengths It has been shown
that the equivalent circuit model that pays attention to the relationship between the
internal circuit and the external characteristics can adequately meet all the
requirements of the project Therefore further studies of battery models have been
carried out and six equivalent circuit battery models with different merits and
complexity are presented while the technique improvements are briefly described
in this section
331 Simple Battery Model
The Simple Battery Model is the simplest battery model As shown in Figure 3-1
this model consists of only ideal battery mE as the electromotive force of a battery
and a resistor r in series connection as the internal resistance bV in the figure is
the terminal voltage of the battery
38
Figure 3-1 Simple Battery Model
The Em in Figure 3-1 stands for the electromotive force of the battery while r
represents the internal resistance and Vb is the Terminal Voltage This model is
only applicable in some circuits where the state of charge is of little importance
because it does not consider the varying characteristic of the internal resistance in
different states of charge The model is often used in circuits where the battery
does not have major influences to the circuit analysis But without being able to
describe the battery behaviours in details this model is not suitable for the
research purpose In the Simple Battery Model the electromotive force mE can be
obtained by open circuit measurement and r can be calculated by measurement
with connecting a load to the battery after taking an open circuit measurement
For a battery with a terminal voltage of 13V and the internal resistance of 05Ω
the change of terminal voltage in a Simple Battery Model as the discharge current
increases can be given as Figure 3-2
39
Terminal
Voltage
Discharge
Current
0
10V
13V
Figure 3-2 I-V chart of the Simple Battery Model
332 Advanced Simple Battery Model
This model is developed based on the Simple Battery Model and has the same
block diagram as the Simple Battery Model The only difference is that this model
employs a variable resistor which depends on the state of charge (CUN
FIORINA et al Durr Cruden et al 2006) The relationship between the value of
the variable resistance and the state of charge is as follow
aSOC
Rr 0
= (31)
where 0R is the resistance of the battery when it is fully charged
a is the capacity coefficient
SOC is the state of charge of battery from 0 (completely discharged) to 1
(fully charged)
6A
40
The most important improvement of this model is that instead of a constant
internal resistor the value of the internal resistance is expressed as equation
function of SOC For the same battery described in section 331 the I-V chart in
different SOCs can be concluded as shown in Figure 3-3
Terminal
Voltage
Discharge
Current
0
10V
13V
SOC=1
SOC=60
Figure 3-3 I-V Chart in different SOC
333 Thevenin Battery Model
The previous models do not account for any transient behaviour of batteries
Figure 3-4 shows the gradual change in battery characteristics when external loads
are connected or disconnected to the battery
6A
41
011
14
125
Terminal
Voltage
t
Figure 3-4 Sketch to show battery discharge behaviours in typical tests
Thevenin Battery Model is one commonly used model which consists of an ideal
battery electromotive force ( mE ) internal resistance (0R ) overvoltage resistance
(1R ) and capacitance (
1C ) and the equivalent circuit is shown in Figure 3-5
(Casacca and Salameh 1992 Salameh Casacca et al 1992 Chan and Sutanto
2000) 1C represents the actual capacitance of battery and
1R represents the
resistance contributed by the contact resistance of the plate and the electrolyte
(Durr Cruden et al 2006) The capacitance in the Thevenin Battery Model can
overcome the trend of terminal voltage shown in Figure 3-4
No load No load Load
42
Figure 3-5 Thevenin Battery Model
The main disadvantage of this Thevenin Battery Model is that all the parameter
values are assumed to be constant but in fact they are strongly dependent on the
state of charge and discharge rate and some other discharge characteristics
334 Dynamic Battery Model
This model is developed based on the Thevenin Battery Model Similar to the
improvements made by the Advanced Simple Model comparing with the Simple
Battery Model the most important difference is that it takes into account the non-
linear characteristic of the open circuit voltage and internal resistance represented
by SOCK (Jayne and Morgan 1986 Sims 1990)
ISOC
KRVV bocb )( +minus= (32)
where bV is the terminal voltage of battery
ocV is the open circuit voltage
bR is the battery terminal resistor typically 01Ω
43
K is the polarization constant
I is the discharge current
335 Fourth Order Dynamic Model
This is a more accurate and sophisticated model The current pI flows through
pR (electrolyte reaction) dR (Ohmic effect) and its associated leakage
capacitance dC and wR (waste of energy) and its associated leakage
capacitance wC Current sI flowing through the resistor sR represents the
behaviour of self discharge (Gillioli and Cerolo 1990 Chan and Sutanto 2000)
The main drawback of this model just as its name indicates is that there are
fourth order equations due to consideration of the paralleled R-C blocks in the
circuit and therefore it takes more time for the computation Another drawback is
that a number of empirical parameters are contained in the model
Figure 3-6 Fourth-order Battery Model
44
336 Improved Battery Model
The most popular Equivalent Circuit Model used by researchers is the Improved
Battery Model (Casacca and Salameh 1992 Salameh Casacca et al 1992) This
model is simple but meets most requirements for a good battery model It contains
most non-linear characteristics and is linked to the state of charge Most elements
included in this model are the functions of the state of charge or the open circuit
voltage which is also related to the state of charge The improved model is
studied in this chapter and implemented in MatlabSIMULINK environment
Figure 3-7 Improved Battery Model
34 Mathematical Model of the Lead-acid
Batteries
As the Improved Battery Model is able to reflect the major dynamic behaviours of
a battery and does not take much computation time it meets the requirements for
45
the project Therefore the mathematical model developed in this project is based
on the Improved Battery Model by involving the components of variable voltage
sources as the electromotive force ( EMF equal to the open circuit voltage OCV )
variable resistors as internal resistance and overvoltage resistance and a capacitor
as the capacitance of battery The description and the detailed analysis of the
model are given in this section
341 Capacity
Based on the Peukertrsquos law introduced in Chapter 2 the relationship of capacity
with different discharge currents is obtained below
2121
2211
)( ttII
tItIC
k
kk
p
=
== (33)
And following the definition of battery capacity the capacity is
12
1
2111
1
21121121121222 )()())(()( I
kkkk
I CIItIIItIIIIItIIItICminusminus
=====
12
1
21 )( I
k
I CIICminus
=there4 (34)
where Cp is the one ampere capacity
CI2 CI1 is the capacity under the discharge current I2 I1
k is a constant that related to the battery
The equation of calculating the capacity by the discharging current can be
46
obtained through experiments (Ceraolo 2000 Barsali and Ceraolo 2002) An
experimental result is given as
m
c
c
IIK
CKIC
))(1(1)( 0
0minus+
= (35)
where )(00 ICC = which stands for the capacity when discharging at the rated
discharge rate usually the nominal capacity C10
cK is empirical coefficient and is 118 for lead-acid batteries
m is empirical coefficient of 120
This equation overcomes the inadequacies of the Peukertrsquos law The capacity
calculated by the Peukertrsquos law in a low discharge current is much larger than that
experimentally obtained (Ceraolo 2000)
With the parameters of 20118124420 ==== kKAIAhC c the simulation
study indicated that the capacities of low discharge rate (lt30A) in different
equations are quite similar as shown in Figure 3-8
47
0 5 10 15 20 25 30 35 40 45 500
10
20
30
40
50
60
70
80
Discharge Current (A)
Actu
al C
apacity (
Ah)
Based on Peukerts law
Based on the Equation 35
Based on the Equation 35
Based on thePeukerts Law
Figure 3-8 Battery Capacity vs Discharge Current
Variations of the cell temperature also affect the battery capacity The effect of
temperature on the battery capacity is described by the following equation
(Ceraolo 2000 Barsali and Ceraolo 2002)
ε
θ
θθ
minus+=
f
ICIC 1)()( 0 (36)
where fθ is the electrolyte freezing temperature and is equal to -40˚C
θ is the cell temperature
)(0 IC is the capacity of battery under the discharge current I at 0˚C
ε is a constant that equals to 129
48
Therefore
m
c
f
c
IIK
CK
IC))(1(1
1
)(
0
minus+
+
=
ε
θ
θ
θ (37)
342 Electric Networks
Figure 3-9 (Ceraolo 2000 Barsali and Ceraolo 2002) shows an adaptation of
electric network based on the improved battery model shown in Figure 3-7 The
major change of this equivalent circuit is that the self-discharge is not taken into
account because the self discharge is usually less than 10 per month in modern
technologies which can be ignored in normal applications
Figure 3-9 Lead-acid Battery Equivalent Network
In the figure mE in this the main branch represents the electromotive force of the
battery and Vb stands for the terminal voltage The mZ in the figure stands for the
internal impedance that can be approximated by two R-C blocks
49
Battery is an energy storage device but not all the energy that the battery gets
from the charger can be stored when a battery is charged Part of this energy is
lost for different reasons like water electrolysis A parasitic branch is therefore
added to the model to represent the energy loss This part is claimed to work only
when the battery is being charged (Ceraolo 2000 Barsali and Ceraolo 2002) In
this project the current of the parasitic branch pI in the figure can be described as
an equation of the voltage of the parasitic branch PNV instead of a simple resistor
pR because of the nonlinear character of the parasitic branch This issue will be
discussed in later sections
As a result of these factors an equivalent electric network of in Figure 3-9 is
designed as shown in Figure 3-10 in which 1C 1R and 0R are the elements of the
internal impedance mZ It is used in the whole project as the electric network of
mathematical model
Figure 3-10 The Equivalent Network with the Approximated mZ
50
343 State of Charge and Depth of Discharge
In Chapter 2 Equations 27 and 28 show the definitions of SOC and DOC of a
battery In the model the nominal capacity can be treated as C(0θ) while the
actual capacity is C(Iavg θ) therefore
)0(1 θCQSOC eminus= (38)
)(1 θavge ICQDOC minus= (39)
where σσ dItQt
e int=0
)()( is the charge already drained from the battery
)0( θC is the nominal capacity of battery
)( θavgIC stands for the actual capacity under the specific discharge
current
344 Electromotive Force of the Battery
The electromotive force of a battery which is Em in Figure 3-10 is the difference
between the electric potential of the two electrodes and can be calculated by the
Nernstrsquos equation (Eq 26)
)(
)()(log029600412
2
2
24
10OH
SOHEMF
α
ααminus+
+=
This equation gives a description of the electromotive force by the activity of
different matter in the sulphuric acid which is described as lsquoαrsquo When the battery
51
is being charged or discharged the electrolyte concentration changes and the
activity value of H+ SO42- and H2O in the Nernstrsquos equation changes which can
be found by the study of battery that is the EMF of battery will change as the
result of the change of state of charge The relationship between SOC and the
activity α is unknown but it is obviously that when the state of charge increases
the quotient of )(
)()(
2
2
24
OH
SOH
α
ααminus+
also increases This shows that the EMF rises
when the state of charge is increasing
From the literatures (Ceraolo 2000 Barsali and Ceraolo 2002) the electromotive
force is described simply as the following equation
)1)(273(0 SOCKEE Emm minusminusminusminus++++minusminusminusminus==== θ (310)
where 0mE and EK are constants for a battery
θ is the temperature of the cell
SOC is the state of charge of the battery
345 Internal Resistance of a Battery
The resistances of a battery as shown in Figure 3-10 can be calculated by the
equations (Ceraolo 2000 Barsali and Ceraolo 2002)
)]1(1[ 0000 SOCARR minus+= (311)
)ln(101 DOCRR minus= (312)
52
)exp(1 22
)]1([
202
21
IIA
eRR
m
SOCA
+=
minus
(313)
where 0A 21A and 22A are constants for a battery while 00R 10R 20R are
parameters related to the SOH which will be discussed in later chapters For the
model 020 asympR and can be omitted when a battery is discharging
Therefore the internal resistance of a cell when discharging is
)ln()]1(1[ 1000010 DOCRSOCARRRr minusminus+=+= (314)
346 The Behaviour of Parasitic Branch
When the battery is being charged there are some losses as represented by the
parasitic current This current depends on the electrolyte temperature and the
voltage at the parasitic branch (Ceraolo 2000)
Because the behaviour of parasitic branch is non-linear Tafel gassing-current
relationship is used instead of a simple resistance pR (Ceraolo 2000)
minus+= )1(exp
0
0
f
p
P
PNPPNp A
V
VGVI
θ
θ (315)
where pI is the current of the parasitic branch
PNV is the voltage of the parasitic branch
53
0PG is a constant in seconds
0PV is a constant in volt
pA is a constant
θ is the electrolyte temperature
fθ is the electrolyte freezing temperature and is equal to -40˚C
When the battery is being discharged 0asymppI the parasitic branch could be
omitted from the model in simulation if the charging behaviour is not necessary
to discuss
347 Main Branch Capacitance
In the electric network of the model there is an R-C circuit as shown in Figure
3-11
Figure 3-11 R-C block
where Im is the discharge current
IC1 is the current flow through the capacity branch
54
I1 is the current of R1
VR1 is the voltage over the R-C block
This branch can be solved by
))(
()( 11111111
dt
tdVCIRIIRIRV R
mCmR minusminusminusminus====minusminusminusminus====sdotsdotsdotsdot==== (316)
)()()(
111
11 tIRtVdt
tdVCR mR
R====++++ (317)
This is the differential equation that represents the main branch behaviour
Laplace transform is employed to solve this problem
)()( 1111 sIRsVSCR mR sdotsdotsdotsdot====sdotsdotsdotsdotsdotsdotsdotsdotsdotsdotsdotsdot (318)
1
)(
11
11
++++
sdotsdotsdotsdot====
SCR
sIRV m
R (319)
++++
====++++
========
SCR
C
SCR
R
I
VsG R
11
1
11
11
1
1
1)( (320)
where τ=11CR is the time constant that represents the double layer capacitance
When the current has a shape like a step and the initial voltage of the capacitor is
equal zero the solution in time becomes
m
t
R IeRtV )1()( 11τ
minus
minus= (321)
55
It is obviously that this equation is the typical form of the voltage with an R-C
circuit
348 Thermal Behaviour of a Battery
When the battery is charging or discharging there is a current flow through the
battery so that it produces heat due to the Joules law
0
2
1
2
12 RIRVIVVIP RPNps sdot++sdot+sdot= (322)
When discharging the parasitic branch and R2 are omitted the equation becomes
0
2
1
2
1 RIRVP Rs sdot+= (323)
The dynamic equation of cell temperature and the power is (Ceraolo 2000)
s
a PRdt
dC +
minus=
θ
θ
θθθ (324)
where θC is the thermal capacitance
θR is the thermal resistance between the battery and the environment
θ is the cell temperature and aθ is the environment temperature
56
35 Mathematical Model of the Lead-acid
Batteries
Considering the behaviour of capacity state of charge and depth of discharge
electromotive force and internal resistance an Improved Battery Model based on
the equivalent circuit shown in Figure 3-10 was introduced in previous sections
The battery model for the complete discharging progress can be derived as the
following equations
m
c
f
c
IIK
CK
IC))(1(1
)1(
)(
0
minus+
+
=
ε
θ
θ
θ (325)
σσ dItQt
e int=0
)()( (326)
)0(1 θCQSOC eminusminusminusminus==== (327)
)(1 θavge ICQDOC minusminusminusminus==== (328)
)1)(273(0 SOCKEE Emm minus+minus= θ (329)
)]1(1[ 0000 SOCARR minus+= (330)
)ln(101 DOCRR minus= (331)
1
1R
Cτ
= (332)
IeRtV
t
R sdotminussdot=minus
)1()( 11τ (333)
0
2
1
2
1 RIRVP Rs sdot+= (334)
57
sa P
Rdt
dC +
minus=
θ
θ
θθθ
(335)
)( θIC in the equations is the expression of capacity of battery when discharging
under the discharge current I and at a temperature of θ 0C stands for the
capacitance when discharging at the rated discharge current I while parameters
fθ and ε are constants in this model )(tQe represents the charge already
consumed while the equation of mE indicates the mathematical description of
electromotive force corresponding to the SOC and the cell temperature in which
0mE EK are constants for a battery 00R 10R are parameters related to the SOH
and the discharge current can also affect them τ in the equations are the time
constant of the R-C circuit which represents the time it takes the systems step
response to reach ( 6311 asympminus e ) of its asymptotic value The last two equations
represent the thermal dynamic of battery in which sP is the Joule heat generated
by the internal resistance θC is the thermal capacitance and θR is the thermal
resistance between the battery and the environment
36 Summary and Discussion
The Improved Battery Model based on the electric equivalent circuit is presented
in this chapter and it is proved that it can satisfy all the three requirements to serve
the project objectives This battery model consists of a variable voltage source
several R-C blocks and a parasitic branch as its electric network and the elements
are described as a variable related to the capacitance the charge consumption and
58
the cell temperature as well
However experimental tests show that the behaviour of the battery is much more
complicated can be represented by this equivalent circuit model For example the
internal resistance varies when discharging under different current and the time
constant of the R-C circuit at the beginning and end of discharge as well
Therefore the model has to be improved The next chapter overcomes these
problems found in the experimental tests and some improvements of the model
are described
59
Chapter 4
Experimental System Set up and
Improved Battery Model
Simulation Implementation
Experimental tests based on a 12V-13 Ah lead-acid battery are carried out and the
test system is introduced at the beginning of this chapter Some of the
characteristics of the battery can be found in the tests which has shown that the
battery model described previously is not accurate enough and improvements
have to be implemented into the model This chapter will focus on the analysis of
the battery characteristics and the description of the improvements implemented
In the last part of this chapter a finalised version of the battery model used in this
project is given and implemented in the MatlabSIMULINK environment for
simulation study
41 The Experimental System
In this experimental test system a variable resistor is used as the load of the
battery Three sensors are employed in the whole experiment process two current
sensors and one voltage sensor The equivalent circuit of the test rig designed for
the research purpose is shown in Figure 4-1
60
Figure 4-1 Equivalent Circuit of the Experimental Test Rig
In this figure the ideal voltage source EMF accompanying with the internal
resistance r acts as a lead-acid battery with 6 cells (12V) the terminals of the
battery are connected in parallel to a voltage sensor Switch Krsquo is employed to
control the voltage sensor connection so that the sensor can be disconnected from
the battery when the experiment is not being in progress to avoid an unnecessary
discharge The circuit break in Figure 4-1 can be used as a main controller which
decides whether the load is engaged to the battery to discharge or not Switch K
in the experiment is to vary the load of the system This experimental test system
is mainly designed for two different experimental tests of a battery in this study
constant-impedance load discharge and two-load discharge Figure 4-2 shows the
actual laboratory test rig used in the project
61
Figure 4-2 Experimental Test Rig
The data is collected and recorded every half second by a data acquisition card
PCI-6251 from National Instruments with the software environment of LabVIEW
and a 12V-13Ah lead-acid battery (marked in the red-dashed square in Figure 4-2)
is employed in the project as test batteries for the battery performance study
42 Improvements of the Battery Model
Figure 4-3 and Figure 4-4 show the typical data collected from the experimental
test rig Figure 4-3 is the result of a constant-impedance load discharge test with a
discharge current of 075A approximately and Figure 4-4 shows two-load
discharge with the discharge currents of 075A and 12A respectively
62
0 500 1000 1500 2000 2500 3000 3500 4000 4500 5000-02
0
02
04
06
08
1
12
Time (s)
Dis
charg
e C
urr
ent
(A)
0 500 1000 1500 2000 2500 3000 3500 4000 4500 5000105
11
115
12
125
13
Time (s)
Term
inal V
oltage (
V)
Figure 4-3 Test of constant-impedance load discharge top figure shows the discharge current of the experimental test and the bottom one shows the terminal
voltage 1τ is the time parameter of the R-C block at the beginning of the
discharge and 2τ is that when the discharge stopped
0 200 400 600 800 1000 1200 1400
0
05
1
15
Time (s)
Dis
charg
e C
urr
ent
(A)
0 200 400 600 800 1000 1200 1400118
12
122
124
126
128
Time (s)
Term
inal V
oltage (
V)
Figure 4-4 Test of two-load discharge top figure shows the discharge current of the experimental test and the bottom one shows the terminal voltage
I(t)RI1 and I(t)RI2 represent the voltage drop across the internal resistance value under different discharge current
1τ 2τ
I(t)RI1
I(t)RI2
I(t)RI1
63
421 The Change of τ in Different Charge Status
From analyzing these figures it is easy to find that it takes quite a long time for
the battery to have the steady terminal voltage when the discharge of battery stops
and it is longer than the time taken from the beginning of the discharge This
difference means that when the battery starts to discharge the time parameter
11CR=τ in the main branch equation (332) is not equal to that when the
discharge has just stopped In Figure 4-3 it is shown that when the discharge stops
the time parameterτ is longer than that when the discharge starts
As a result of this experimental feature a switch is employed to implement the
change of time parameter to match those described in the mathematical model of
the battery The switch is used to control the value of the time parameter τ in
different discharge currents When the battery is discharging the discharge current
is a positive value and the time parameter τ is equal to 1τ When the battery is
not discharging the discharge current is equal to 0 in theory and the time
parameter has a different value 2τ
Although the discharge current should be equal to 0 theoretically it is hard to
achieve this in the real experimental measurement because of the inaccuracy of
the current sensor reading due to the inaccuracy occurred in the power supply to
the sensor Therefore the trigger of the switch in the model is set to be 01 A that
is when the discharge current is greater than 01 A the time parameter is set to be
1τ as the battery is in its discharging segment By contrast the value of time
64
parameter is set to be 2τ and the discharge current is considered as the error
caused by the sensors when that current is less than 01 A
422 Analysis in Variations of the Internal Resistance
Another important issue found through analyzing the experimental test result is
that the internal resistance for a specific battery in a specific state of health (SOH)
is not a constant when the discharging current changes This difference is more
significant than the effect caused by the state of charge
For example in the two-load discharge results shown in Figure 4-4 when the
battery is not discharging the initial voltage is equal to the electromotive force
(EMF1) When the battery began to discharge at the discharge current I1 the
terminal voltage dropped to V1 After the discharge stopped for a while the value
of the terminal voltage is equal to the electromotive force (EMF2) at that state of
charge (SOC2) Then the discharge of the battery starts again at a current of I2 and
the terminal voltage dropped to V2 The discharge progress is then stopped for
certain of a time period to get the steady terminal voltage (EMF3) at that state of
charge (SOC3) After that the test of discharge at the I3 = I1 was repeated again
and get another terminal voltage of V3 The last discharge test is done to provide
the evidence for the fact that this change in the internal resistance is not caused by
the change of the state of charge (SOC)
The value of electromotive force in a discharging battery is equal to the sum of the
terminal voltage and the voltage that the internal resistance takes that is
65
nnnn IrVEMF sdot+=
Therefore the internal resistance can be calculated by
n
nnn
I
VEMFr
minus= (41)
From the data collected in the experiment the key parameter values for the graphs
shown in Figure 4-4 can be found as listed in Table 4-1
Table 4-1 Approximate Internal Resistance Calculating
n 1 2 3
Electromotive Force (EMFn) 1260V 1252V 1238V
Discharge Current (In) 078A 114A 076A
Terminal Voltage (Vn) 1219V 1203V 1197V
Substituting these values into Equation 41 the internal resistance can be
calculated Ω=Ω=Ω= 539043005260 321 rrr
This change of the internal resistance can cause quite a significant effect in the
discharge progress This problem can be possibly solved in a number of ways
One possible choice is to find a curve of the internal resistance change and the
discharge current for a specific battery after a certain numbers of experimental
tests But this method needs huge efforts in conducting experimental tests and the
result is not very meaningful for the project considering the time cost Another
possibility is to conduct the experimental tests with a constant load Therefore the
change of internal resistance caused by the change of discharge current could be
ignored As a result in the whole process of this project the same load is
66
employed either in the constant-impedance load discharge or in the two-load
discharge tests
In order to implement the different internal resistance value when discharging
under different load a switch that can control the parameters R00 and R10 is
employed This switch is controlled by the discharge current which is the main
input of the mathematical model In the two-load discharge tests when the switch
K in Figure 4-1 is switched off there is only one load is connected to the battery
terminals and the discharge current is lower the values of R00 and R10 are
switched to the first set of parameters R001 and R101 To the contrast when K is
switched on the discharge current is higher and the values are switched to the
second set R002 and R102
423 Improved Lead-Acid Battery Mathematical Model
From the model described in Chapter 3 and the improvements studied in this
chapter the mathematical model of lead-acid battery when discharging in different
discharge currents can be described as the following equations
m
c
f
c
IIK
CK
IC))(1(1
)1(
)(
0
minus+
+
=
ε
θ
θ
θ (42)
ττ dItQt
e int=0
)()( (43)
)0(1 θCQSOC eminusminusminusminus==== (44)
)(1 θavge ICQDOC minusminusminusminus==== (45)
67
)1)(273(0 SOCKEE Emm minusminusminusminus++++minusminusminusminus==== θ (46)
)]1(1[ 0000 SOCARR minusminusminusminus++++==== (47)
)ln(101 DOCRR minusminusminusminus==== (48)
11
RC
τ= (49)
IeRtV
t
R sdotminussdot=minus
)1()( 11τ (410)
RIRVP Rs sdot+=2
12
1 (411)
sa P
Rdt
dC +
minus=
θ
θ
θθθ
(412)
)(
)(
2
1
002
001
00Load
Load
R
RR
= (413)
)(
)(
2
1
102
101
10Load
Load
R
RR
= (414)
)10(
)10(
2
1
AI
AI
lt
gt
=τ
ττ (415)
001R 002R 101R 202R and 1τ 2τ in the equations stand for different parameter
values of 10R 20R and τ when the load and charge status changes in order to
reflect the improvements described in this chapter For a two-load discharge test
there are ten important unknown parameters in the equations of the mathematical
model which are unknown for a specific battery 0C 0mE EK 001R 002R 101R
102R 1τ 2τ and 0A As the internal resistance R00 and R10 vary only when the
load changes they can be treated as constants in the constant-impedance load
68
discharge tests the key parameters are therefore 21100000 ττRRKEC Em
and 0A In this project the study of state of health is based on constant-impedance
load discharge The identification of these unknown parameters will be discussed
in Chapter 5
43 Simulation Study
The processes described above have been implemented in SIMULINK as a
simulation model for computer based analysis The simulation program consists of
two main function blocks circuit block and thermal block The structure of the
SIMULINK implementation is described in Figure 4-5
69
Figure 4-5 Structure of model for SIMULINK Implementation
70
As shown in the figure there are mainly two inputs in the model the discharge
current and the discharge time The actual capacity of battery can be then
calculated with the knowledge of rated capacity and the discharge current The
actual capacity is also influenced by the cell temperature At the beginning of
discharge the cell temperature is the same as the surrounding temperature
Integrating the discharge current with respect to time is the capacity consumed in
the discharge progress and then the state of charge and the depth of charge can be
obtained It is shown that the electromotive force and the internal resistance vary
as a result of changing in the state of charge and the depth of charge and the
terminal voltage can be calculated
In the thermal block of the model the heat generated by the current and the
internal resistance are calculated by the Joules law Then this energy is
transferred to calculate the thermal temperature of the cell and the cell
temperature is given back to the circuit block to affect the actual capacity
71
0 1000 2000 3000 4000 5000 6000 7000
0
02
04
06
08
1
Time (s)
Dis
charg
e C
urr
ent
(A)
0 1000 2000 3000 4000 5000 6000 7000105
11
115
12
125
13
Time (s)
Term
inal V
oltage (
V)
Figure 4-6 Terminal Voltage of Battery (Constant Discharge Current SIMULINK)
The result in Figure 4-6 shows the terminal voltage of a battery which discharges
under the current of 08A in a simulation study Since the discharge begins the
voltage drops due to the internal resistance and the change of state of charge (SOC)
and it climbs up when the discharge stops However the voltage changes
gradually because of the time parameter τ This result shows a good qualitative
agreement with the experimental test results
72
44 Summary and Discussion
This chapter introduces the laboratory test system designed for the project and the
limitation of the mathematical model described in Chapter 3 Switches on the time
parameter τ and the internal resistance parameters R00 and R10 have been added to
the model so that the model is able to represent the change of these parameters
found in the experimental tests The implementation of the model under the
MatlabSIMULINK environment is described and the simulation study shows a
good qualitative agreement with the experimental test results
The next chapter will focus on the identification of those unknown parameters of
the battery model that are important for revealing the battery characteristics
including 20100000 τARRKEC Em and 1τ
73
Chapter 5
Model Parameter Identification
and Model Validation
The identification of the unknown parameters 20100000 τARRKEC Em and 1τ
in the mathematical model will be introduced in this chapter
51 Need for the Optimization Algorithms
In those equations of the battery model described previously some parameters are
unknown and some of them are difficult to derive from physics or engineering
principles or to be obtained through experimental tests Therefore the
identification of the model unknown parameters becomes an important part for the
project Parameter identification is an optimization process that adjusts the
parameters to enable the simulation results to show the best agreement with the
results acquired by the experimental tests There are many algorithms available
for optimization and the principle of the optimization process for the project is to
minimize the objective function The objective function is formed by the absolute
value of the difference between the simulated and experimental results at each
time point The set of parameters to achieve the least value of the objective
function is considered to be the fittest set
74
There are two basic requirements of the optimization in this project First of all as
the problem for the solutions trapped to the local minima is a very important and
challenging issue in many linear optimization solvers the optimization algorithm
used in this project must be able to find the global minimum Secondly the
optimization algorithm not only should find the minimum value of the objective
function but also can tell the values of the parameters that result in the best fitness
which is needed for the analysis purpose in this project Finally the time cost is
also an important factor in selection of a suitable optimization algorithm
It needs to point that the objective here is to identify the unknown parameters of a
model with an already known structure If the objective is to identify or
approximate unknown model structures the selection of optimisation methods
will be quite different In the case of latter Neural Network Genetic
Programming and Fuzzy Logical will be more suitable choices To concentrate on
the objective of the project the thesis will focus on optimisation algorithms for
parameter identification
52 Overview of the Optimization Algorithms
Brute-force search is the most basic direct search algorithm that is used to find the
minimum value In the brute-force search the initial guess is the minimum
possibility of parameters and increasesdecreases The parameter
increasesdecreases step by step in each iteration and the best solution can be
75
searched This algorithm is the simplest but its disadvantage is also obvious that
is it is the slowest optimization method especially when used in the identification
of more than two parameters and the results are largely dependent on the initial
guesses
Linear search is an optimization method to solve the linear optimization problem
the preference function of which is linear and the feasible domain is defined by a
linear constraint function The linear constraints define a convex polyhedron
geometrically which is called the feasible region The algorithm is to construct an
admission solution at a vertex of the polyhedron and then along edges of the
polyhedron to vertices with successively higher values of the objective function
until the optimum is reached
Besides the basic optimization methods evolution computation technology is
becoming increasingly popular A range of different evolution computation
technologies can solve the optimization problem in this project including genetic
algorithms (GAs) particle swarm optimization (PSO)
Genetic Algorithms are direct search algorithms inspired from the process of
evolution in nature the natural selection Based on the principle of survival of the
fittest the GAs can produce better and better approximations to the global optimal
solution in a number of generations In each generation a new group of solutions
is created by the fitness level in the problem of every individual in the last
generation The solutions are then bred together to lead to the evolution of
individuals
76
Particle swarm optimization is a stochastic population-based computer algorithm
modelled on swarm intelligence that searches for a solution to an optimization
problem in a search space Based on the social psychological principles each
individual called lsquoparticlersquo in PSO is able to provide information to others and
also learn the success from the local best and the global best The movement of
each particle through the search space are guided by these successes and the
solution can be found after a number of generations
It has been proved by Dr Jianlin in his PhD Thesis (Wei 2007) that both Genetic
Algorithm and Particle Swarm optimization are capable of the model parameter
identification But the Particle Swarm optimization is a new algorithm that first
described in 1995 and it is not as common as Genetic Algorithm in the research
areas
The purpose of this research work is to find a method for parameter estimation
Genetic algorithms are well proven solution for complicated optimisation
problems and have been applied successfully in a range of similar problems (Wei
2007 Wei Wang et al 2007) Genetic algorithms are also well suited to problems
with many local minima In the current work the exact form of the fitness
function is unknown and it is therefore important to select a robust technique
which can identify good overall solutions For these reasons GA was selected to
give the best possible chance of satisfying the overall project objectives within the
limited timeframe of the project
77
53 The Study of the Genetic Algorithms
The process of Genetic Algorithm is reviewed in this section to provide an insight
into how GAs work and simulation study of two bench mark functions are carried
out
531 Working Principle of GAs
There are many methods used to implement a GA process and usually a GA is at
least composed of three common genetic operators Selection Crossover and
Mutation (Pham and Karaboga 1998) The flowchart of a simple GA process is
given in Figure 5-1
As a preparation to start the optimization process a GA requires a group of initial
solutions as the first generation The first generation is usually a group of
randomly produced solutions created by a random number generator The
population which is the number of individuals in a generation should be big
enough so that there could be a reasonable amount of genetic diversity in the
population Also it should be small enough for each generation to be computed in
a reasonable period of time using the computer resources available Typically a
population includes individuals between 20 and 100 (Chipperfield Fleming et al
1994A)
78
Figure 5-1 Flowchart of a Simple Genetic Algorithm (Pham and Karaboga 1998)
The fitness function is evaluated to measure how close that the individuals fit the
desired result A fitness function could be either complex or simple depending on
the optimization problem addressed In a case of minimization problem the most
fitted individuals will have the lowest numerical value of the associated fitness
function
No
Yes
Selection
Crossover
Mutation
Find the Best Individual
Generate initial population
Results
Evaluate fitness values
Operators of generating new
generation
Gengt 100
Evaluation
Start
79
Individuals are selected according to a fitness-based process The operator of
selection is made up of ranking and selection progress by which more copies of
the individuals that fit the optimization problem better will be produced in the
next generation In GAs there are mainly two ways to select a new population
Roulette Wheel Selection (RWS) and Stochastic Universal Sampling (SUS)
The individuals will be recombined (crossover) after the selection This operation
is to produce two new individuals from two existing individuals selected by the
operator of selection by cutting them at one or more position and exchanging the
parts following the cut The new individuals therefore can inherit some parts of
both parentsrsquo genetic material There are usually four ways of doing this one-
point crossover two-point crossover cycle crossover and uniform crossover
(Pham and Karaboga 1998) Figure 5-2 (a) shows an example of the two-point
crossover progress
Mutation is another operator to produce new individuals The difference is that the
new individual is produced from a single old one In this operation the bit values
of each individual are randomly reversed according to a specified property A
mutation can also helps the GA to avoid local optimums and find the global best
solution Figure 5-2 (b) represents how the mutation operator works
80
Figure 5-2 (a) Crossover operation (b) Mutation operation
The group of individuals produced after the mutation is the second generation
Then the fitness value of each individual in the second generation is computed
again This cycle will not stop until the result is close enough or after a certain
generation
Three major Matlab toolboxes are applied in the current market for application
purpose they are Genetic Algorithms Toolbox V12 (Chipperfield Fleming et al
1994B) the Genetic Algorithms Optimization Toolbox V11 (Houck Joines et al
1995) Genetic Algorithm Direct Search Toolbox V102 (MathWorks Inc 2004)
In this project the official toolbox in Matlab form Mathworks Inc is employed
The property settings for the project based on Dr Weirsquos thesis (Wei 2007) are
shown in Table 5-1
Parent 1 1 1 0 0 1 0 1 1 0 1 0 1 1
Parent 2 0 1 1 0 1 1 0 0 1 0 1 0 0
Offspring 1 1 1 0 0 1 1 0 0 1 1 0 1 1
Offspring 2 0 1 1 0 1 0 1 1 0 0 1 0 0
(a)
Parent 1 1 0 0 1 1 0 0 1 1 0 1 1
Offspring 1 1 0 0 1 0 0 0 1 1 0 1 1
(b)
81
Table 5-1 The property settings for Genetic Algorithms
Name of the GA properties Value of the GA properties
Number of generations 100
Population size 20
Fitness assignment Rank-base fitness assignment
Selection Stochastic universal sampling
Crossover Scattered crossover
Crossover rate 07
Mutation function Uniform mutation
Mutation rate 01
Population size specifies how many individuals there are in each generation With
a large population size the genetic algorithm searches the solution space more
thoroughly and the gives more possibility to return the global minimum The
number of generations specifies the maximum number of iterations for the genetic
algorithm to perform If this number is too low the genetic algorithm is not able
convergence to the global solution However either a large population size or a
large number of generations can cause the algorithm to run more slowly The
crossover rate and the mutation rate are properties that control the crossover and
mutation operator High rate of these values means that the genetic algorithm has
a higher opportunity of producing new offspring but it can be easy to miss the
current best solution if these values are too big
Initial tests of genetic algorithms on different properties show that the values
shown in table 5-1 are able to find an adequate solution Similar results would be
82
obtained if the values of the generations and the population size are larger but
costing more CPU time The crossover rate and the mutation rate would not affect
the result significantly if only varies in a small range But it is impossible to prove
that these two values are the best choice due to the strong randomness
532 Simulation Studies of Genetic Algorithms
In order to test and demonstrate that Genetic Algorithms are able to meet the
requirements of the project simulation studies have been carried out Two
benchmark functions that are commonly used in evaluating evolutionary
computation algorithms are employed for the simulation studies They are
1) Rastrigin function
Rastrigin function is a typical example of non-linear multimodal function with
many local minima The problem of looking for the global minimum is quite
difficult due to its large search space and its large number of local minima The
function is shown as
))2cos(10(10)(1
2sum=
sdotsdotminus+sdot=
n
i
ii xxnXf πr
where n is the dimension of the problem and 1x ~ nx are the coefficients to be
identified Figure 5-2 shows a 2-dimensional Rastriginrsquos function while figure 5-3
is a contour plot of Rastrigins function shows the alternating maxima and minima
83
The global minimum of the Rastriginrsquos function is 0)( =Xfr
when
021 ==== nxxx L
Figure 5-2 2-dimensional Rastrigins function (MathWorks Inc 2004)
84
Figure 5-3 Contour plot of Rastrigins function (MathWorks Inc 2004)
In the simulation study a ten dimensional Rastriginrsquos function is adopted Figure
5-4 shows the best optimization performance of the Rastriginrsquos function in each
generation It is shown that after 700 generations a global optimal value is
obtained
85
0 100 200 300 400 500 600 700 800 900 10000
10
20
30
40
50
60
70
80Best 00099429
Generation
Fitness v
alu
e
Best f itness
Figure 5-4 GA performance (Rastrigrinrsquos function)
2) Rosenbrock function
Rosenbrock function is another mathematical function used as a test problem for
optimization algorithms The global minimum is inside a long narrow parabolic
shaped flat valley To find the valley is trivial but to converge to the global
minimum is difficult The Rosenbrock function is defined by
sum=
+ minus+minus=
n
i
iii xxxXf
1
2221 ))1()(100()(
r
where n is the dimension of the problem and 1x ~ nx are the coefficients to be
identified Figure 5-5 shows a 2-dimensional Rosenbrock function
86
The global minimum of the Rosenbrock function is 0)( =Xfr
when
121 ==== nxxx L The same as the Rastriginrsquos function a ten dimensional
Rosenbrock function is adopted for the simulation study Figure 5-6 is the GA
performance to the Rosenbrock function It can be found that the optimization
converges and get the global optimal value after 300 generations
Figure 5-5 2-dimensional Rosenbrock function (MathWorks Inc 2004)
87
0 100 200 300 400 500 600 700 800 900 10000
200
400
600
800
1000
1200Best 060113
Generation
Fitness v
alu
e
Best fitness
Figure 5-6 GA performance (Rosenbrock function)
54 Model Parameter Identification
541 Implementation of Genetic Algorithms and
Experimental Data sets
In this project the Genetic Algorithm Direct Search Toolbox V102 developed by
Mathworks Inc is employed to identify the parameters of the battery model The
process is shown in Figure 5-7
88
Figure 5-7 Progress of Parameter Identification
The fitness function is used in the project and the parameter identification is to
minimize the fitness function so that the model output can fit the experimental
result The fitness function is given as
sum
sum sumsum
minussdot=
minussdot++minussdot+minussdot=
minus
1
0
2
1 1
1
0
))()(()(
)()()(
exp
expexp2exp1
t
t
sim
t
t
t
t
simnsim
t
t
sim
tVtVabstW
VVabsWVVabsWVVabsWfitnessn
n
L
where Vexp is the experimental terminal voltage data
Vsim is the simulated terminal voltage
Wt is the weights of the difference in the simulated and experimental
results
This fitness function represents the sum of the error values at each time interval
Mathematical Model of a six-cell
Lead Acid Battery
Experimental Test
Results
Fitness
Function
Discharge Current
Simulation
Output
Terminal Voltage
Simulation
Input
lt fmin
Genetic Algorithms (Selection Crossover and Mutation
etc)
Parameter Update
Yes
No
Stop
89
considered ( ntt minus0 ) The weight coefficients Wt indicates how important the
weighted part is in the optimization and how much it contribute to the
optimisation process Periods with bigger tW values are more important because
the sum of errors will give big value contribution to the fitness function value and
the optimisation process will pay more attention to the higher weighted error parts
In the experiments and optimization process it is found that the results were more
important when the discharge of a battery at the stage of stopping Therefore the
weight in this period is greater than that of the others The weighting coefficient
values in this project are determined by the results of the first several attempts of
parameter identification The period of simulation data that fails to fit the test
result means that the weight value is not big enough until the overall performance
of simulation is reasonable
Following the objective fitness function unknown coefficients of the battery
model are identified using experimental data The mathematical model of a six-
cell lead-acid battery in the figure is described in Chapter 4 and the parameters are
to be identified by Genetic Algorithms are 210100000 ττARRKEC Em
Three sets of experimental tests have been carried out for the purpose of
parameter identification and the validation of the mathematical model These three
experimental results are based on a lead-acid battery with the ideal capacity of 13
Ampere-hours under the discharge current of 08A
90
542 Parameters of Battery Model
The parameters of the mathematical model of a lead-acid battery are identified
using Genetic Algorithms and the predicted battery responses using the identified
parameters are compared with the simulated results One set of typical values of
parameters identified are listed in Table 5-2
Table 5-2 Identified parameters identified by the Genetic
Algorithms in the model of 12V-13Ah lead-acid battery Parameter Value Parameter Value
0C 48198 (Amp-Sec) 0mE 21465 (V)
EK 0001109 (V) 0A 29895
00R 001038 (Ohm) 10R 012196 (Ohm)
1τ 21052 (s) 2τ 17565 (s)
Figure 5-8 shows the simulation results using the Improved Battery Model and the
change of weights defined for this set of result described in the fitness function
The top subplot of Figure 5-8 shows the weight value of the GA fitness function
described before while the middle figure is the discharge current of the
experimental test which is also the input of the mathematical model In the
following test results in this and next chapter the changes of weight value are
similar so they are not shown in the figures
The blue line marked as ldquoExperimental Terminal Voltagerdquo in the bottom figure
represents the measured outputs while the other one (Simulated Terminal Voltage)
represents the simulation results The simulation results are ldquonoisyrdquo because
experimental discharge current is used as the input of model in the simulation
91
progress It is obviously that Figure 5-8 shows a good overall agreement of the
results although some slope when discharging is not perfect
0 500 1000 1500 2000 2500 3000 3500
1
15
Time (s)
Weig
ht
0 500 1000 1500 2000 2500 3000 3500114
116
118
12
122
124
126
128
13
Time (s)
Term
inal V
oltage (
V)
Experimental Terminal Voltage
Simulated Terminal Voltage
0 500 1000 1500 2000 2500 3000 3500
0
05
1
Time (s)
Dis
charg
e C
urr
ent
Simulated Terminal Voltage
Experimental Terminal Voltage
Figure 5-8 Measured and Simulated Result after Parameter Identification
Figure 5-9 shows the mean fitness value and the best in each generation It can be
seen that the best fitness in each generation is decreasing The mean fitness is
unstable because of the mutation operator in the GA that can attempt to find better
solutions
92
0 10 20 30 40 50 60 70 80 90 100100
150
200
250
300
350
400
450
500
550
Generation
Fitness v
alu
e
Best 1075521 Mean 1312731
Best f itness
Mean fitness
Figure 5-9 Mean and the Best Fitness Values in Each Generation
543 Battery Model Validation
In order to validate the battery mathematical model two sets of experimental tests
have been adopted to compare with the simulation results
The inputs of the discharge current and the validation results using two
experimental tests are shown in Figure 5-10 and Figure 5-11
93
0 500 1000 1500 2000 2500 3000114
116
118
12
122
124
126
128
13
Time (s)
Term
inal V
oltage (
V)
Simulated Terminal Voltage
Experimental Terminal Voltage
Simulated Terminal Voltage
Experimental Terminal Voltage
Figure 5-10 Measured and Simulated Terminal Voltage (Validation data 1)
In the simulation that shows in Figure 5-10 the discharge of battery begins at the
time of 700s and the simulation result shows a reasonable agreement with the
experimental result despite the noise of signal caused by the error of the sensors
It is noticed that at the beginning of the discharge there is a difference between
the simulated and experimental terminal voltages for about 100 seconds This
difference is studied and so called lsquocoup de fouetrsquo which often takes place at the
beginning of a discharge test when the SOC of battery is high (Perrin Delaille et
al 2006) However this lsquocoup de fouetrsquo behaviour cannot be described in this
model The discharge period lasts for about 1200 seconds and then stops and after
that the simulation has the similar result with the experiment
94
0 1000 2000 3000 4000 5000 600011
112
114
116
118
12
122
124
126
128
13
Time (s)
Term
inal V
oltage (
V)
Simulated Terminal Voltage
Experimental Terminal Voltage
Simulated Terminal Voltage
Experiment Terminal Voltage
Figure 5-11 Measured and Simulated Terminal Voltage (Validation data 2)
Figure 5-11 shows another group of experimental test to validate the battery
model At the beginning of the experiment the terminal voltage from the
experiment is dropping without any discharge behaviour of battery and that is
because of the experiment was carried out when the terminal voltage of lead-acid
battery is not steady enough after being charged and that also causes the
deviations in the discharge at about 1000-2000 seconds In this period the lsquocoup
de fouetrsquo appears again After the first period the battery is disconnected from the
load until the terminal voltage become steady and the simulation result in this
period fits the experiment result well In the second discharge of this test it is
shown that the lsquocoup de fouetrsquo does not occur because the SOC is not high For
the similar reason in the first discharge in this group of the test results there are
95
also some deviations in this period Finally the simulation result in the last part of
figure fits the experimental result is highly satisfied
The average error of the simulated outputs of the simulation studies and the
measured results are studied Absolute Error and Relative Error is defined as the
following equations
sum
sum
=
=
minus=
minus=
N
i
sim
N
i
sim
iV
iViV
NRelError
iViVN
AbsError
1 exp
exp
1
exp
)(
)()(1
)()(1
The absolute error and relative error are summarised in Table 5-3
Table 5-3 AbsError and RelError of Model Validation
Absolute Error Relative Error discharging relaxing overall discharging relaxing overall
Experimental Test 1 (Identification)
00229V 00207V 00217V 01833 01724 01776
Experimental Test 2 (Validation data 1)
00536V 00484V 00492V 04453 03872 04024
Experimental Test 1 (Validation data 2)
00724V 00372V 00485V 06352 03013 05025
55 Summary and Discussions
Identification of the unknown model parameters is discussed in this chapter and a
range of possibly suitable methods are reviewed in brief In this project Genetic
Algorithm is adopted GAs working principle and its implementation has been
96
introduced in details in this chapter The simulation study of two benchmark
functions that are commonly used in evaluating evolutionary computation
algorithms are employed in order to show the capability of GAs The parameter
identification by tests of a brand new 13Ah lead-acid battery is carried out and is
validated by two sets of other experimental test results under the same working
condition of the same battery
97
Chapter 6
The Analysis of State of Health
(SOH) in association with the
Internal Resistance
61 Methodology
As the number of discharge cycles of battery increases in applications the
maximum charges that a battery can offer will decrease In other words the SOH
battery is deteriorating But this drop of capacity is not linear and it is also a long
progress At the beginning of the use of battery the change of capacity is very
slow and it is not obvious After a number of cycles of discharge and charge this
change will get faster and relatively significant
There are no reliable methods now to calculate the remaining charge capacity
which is the only one determinant of the state of health The normal method is
simply to measure the voltage on its terminals But this measurement is not
accurate on an aged battery A battery in poor state of health but sufficiently
charged can also offer sufficient voltage to appear normal The only way to
determine the capacity accurately is to integrate the discharge current of battery in
a full deep discharge but this method cannot be used too frequently because deep
98
discharge is harmful for the battery
In the project six lead-acid batteries were tested using the test system described in
Chapter 4 These batteries were repeatedly discharged and charged for their whole
life time so that the information related to different state of health can be revealed
as soon as possible Even though the batteries works frequently it still takes more
than 6 months to make the battery become weak The testing experiments were
carried out and the data was recorded every 2-3 weeks so that important value of
state of health is not missed However as the change of capacity is a long progress
and it is nonlinear not all the data collected can be used in this project
Referring the literature (Coleman Lee et al 2006 Lakhdari and Midoun 2007
Coleman Hurley et al 2008) an important factor that reflects the change of state
of health of a lead-acid battery is the internal resistance Not only the state of
health but also other factors (SOC DOC discharge current etc) can result in
variations in internal resistance a new alternative method that based on the
Improved Battery Model in Chapter 4 is adopted in the project
From the model study in Chapter 4 the internal resistance can be divided into two
parts expressed by )]1(1[ 0000 SOCARR minusminusminusminus++++==== (Eq 47) and )ln(101 DOCRR minusminusminusminus====
(Eq 48) These equations show that the internal resistance is affected by the state
of charge (SOC) and depth of charge (DOC) in a discharge cycle In real
applications batteries are seldom discharged to the full range because a deep
discharge could cause some damage to the battery They are also seldom to be
charged to full to prevent the possibility of overcharge that could also bring some
99
negative effects Although this issue is not very significant in a valve regulated
lead acid battery it is better to control the working range of depth of charge from
50 to 80 approximately In this project the internal resistance of battery in the
depth of charge of 65 is studied as a most important factor that related to the
state of health As a little inaccurate of SOC and DOC will induce a comparative
big difference in the internal resistance the method of measuring the internal
resistance accurately by an external circuit is discarded
In Equation 47 and Equation 48 the author found that there are two other factors
that influence the internal resistance besides the SOC and the DOC R00 and R10
Therefore in the project the values of R00 and R10 in a specific discharge current
are very important to study the internal resistance The values of these two factors
are used in Equation 47 and Equation 48 to calculate the internal resistance per
cell of the battery The depth of charge is assumed to be 65 for a normal
working battery as described previously In chapter 3 the SOC and the DOC are
defined as )0(1 θCQSOC eminus= (Eq 44) and )(1 θavge ICQDOC minus= (Eq
45) The Capacity is also defined as equation 42
k
c
fc
IIK
CK
IC))(1(1
)1(
)(
0
minusminusminusminus++++
++++
====
ε
θ
θ
θ (61)
in which Kc = 118 k = 120 and 6 II avg times= in this project The relationship
between the actual capacity under discharge current Iavg and the nominal capacity
is
100
62
1
))(1(1
1
)0)(1(1
1
))(1(1
1
)0(
)(asymp
minus+=
minus+
minus+=
k
avgck
c
k
avgcavg
IIK
IK
IIK
C
IC
θ
θ (62)
Therefore the SOC when the DOC is 65 is
586))0(62(1)0(1 asympsdotminus=minus= θθ CQCQSOC ee (63)
As described in chapter 5 30 asympA therefore the internal resistance of an
individual cell can be obtained by
10001000010 43041)ln()]1(1[ RRDOCRSOCARRRrcell sdot+sdotasympminusminus+=+= (64)
and for a six-cell lead-acid battery the internal resistance
1000 582486 RRrr cellbattery sdot+sdot=times= (65)
62 The identification of C0 R00 and R10
In the eight parameters identified previously in Chapter 5 there are only three
parameters can be affected by the change of battery conditions Therefore the
other five parameters ( 2100 ττAKE Em ) can be treated as a constant for a battery
The parameters that related to the battery condition 0010 RR and 0C are the key
problems which the project focused on 0C represents the state of health while
the 0010 RR stands for the internal resistance parameters Here again the Genetic
algorithm is adopted to identify these three parameters
In this project the battery have been discharged and charged in hundreds of cycles
to simulate the capacity loss in the normal applications which is described by the
101
state of health in this project In order to find out the different behaviour of
internal resistance in different state of health experimental tests have been carried
out in different state of health of the battery
The first test is carried out when the battery is brand new and the data is also used
to identify the other parameters of the battery model as described in the previous
chapter The second group of data is collected after 300 discharge cycles
approximately and the third test took place after 200 more cycles The number of
discharge cycles between the last four tests is only about 50 because the change of
State of Health is more significant The identified parameters of a battery in
different state of health are shown in table 6-1
Table 6-1 Battery Remaining Capacity and Internal Resistance
Remaining
Capacity C0 (Amps)
SOH R00 R10 RelError Internal
Resistance (Ohm)
Test 1 48198 100 00609 00220 01756 05683
Test 2 44861 9314 00654 00103 07428 05759
Test 3 38025 7889 00635 00191 02812 05827
Test 4 33830 7019 00573 00509 07265 06126
Test 5 30625 6354 00604 00582 04340 06575
Test 6 26072 5306 00703 00368 01342 06855
And the terminal voltages simulated and measured are shown as the following
figures The same as previous figures the blue lines represent the measured
outputs while the red lines represent the simulation results
The test shows in figure 6-1 the same as the test which is used to describe the
genetic algorithms and the battery parameter identification in chapter 5 Detailed
102
description and analysis are given in chapter 5
0 500 1000 1500 2000 2500 3000 350011
112
114
116
118
12
122
124
126
128
13
Time (s)
Term
inal voltage (
V)
Experimental Terminal Voltage
Simulated Terminal Voltage
Experimental Terminal Voltage
Simulated Terminal Voltage
Figure 6-1 Experimental and Simulated Terminal Voltage of Test 1 (SOH = 100)
103
0 1000 2000 3000 4000 5000 600011
112
114
116
118
12
122
124
126
128
13
Time (s)
Term
inal V
oltage (
V)
Simulated Terminal Voltage
Experimental Terminal Voltage
Simulated Terminal Voltage
Experimental Terminal Voltage
Figure 6-2 Experimental and Simulated Terminal Voltage of Test2 (SOH= 9314)
The experiment shown in figure 6-2 is tested several months after the first
experimental test In the period that the first discharge begins the experimental
result shows a different slope in terminal voltage The reason is probably that the
battery have just charged to full by a charger and itrsquos the capacitor had not fully
discharged After that when the discharge stopped there is a deviation in the
simulation voltage In the authorrsquos opinion that is because of the accuracy of R10
and R00 If the value of R10 is greater and that of R00 is smaller the simulation
result should fit the experimental result In the second discharge period of the
discharge test there is also a little difference in the experimental and simulation
result caused by the inaccuracy of battery parameters But it shows a good
agreement when the discharge stopped
104
0 500 1000 1500 2000 2500 3000 3500 400011
112
114
116
118
12
122
124
126
128
13
Time (s)
Term
inal V
oltage (
V)
Simulated Terminal Voltage
Experimental Terminal Voltage
Simulated Terminal Voltage
Experimental Terminal Voltage
Figure 6-3 Experimental and Simulated Terminal Voltage of Test3 (SOH= 7889)
0 500 1000 1500 2000 2500 3000 3500 4000 4500 500011
112
114
116
118
12
122
124
126
128
13
Time (s)
Term
inal V
oltage (
V)
Simulated Terminal Voltage
Experimental Terminal Voltage
Simulated Terminal Voltage
Experimental Terminal Voltage
Figure 6-4 Experimental and Simulated Terminal Voltage of Test4 (SOH= 7019)
105
0 1000 2000 3000 4000 5000 600011
112
114
116
118
12
122
124
126
128
13
Time (s)
Term
inal V
oltage (
V)
Experimental Terminal Voltage
Simulated Terminal Voltage
Simulated Terminal Voltage
Experimental Terminal Voltage
Figure 6-5 Experimental and Simulated Terminal Voltage of Test5 (SOH= 6354)
Figure 6-3 figure 6-4 and figure 6-5 show the test results of the battery when the
SOH drops to its 80 70 and 60 It is shown that the simulation result in
figure 6-3 fits the experimental result until the end of test when the discharge of
battery has just stopped The inaccuracy of the R10 and R00 is also the main cause
of the deviation The overall simulation result in figure 6-4 figure 6-5 are good to
express the battery behaviour
106
0 500 1000 1500 2000 2500 3000 3500 400011
112
114
116
118
12
122
124
126
128
13
Time (s)
Term
inal V
oltage (
V)
Experimental Terminal Voltage
Simulated Terminal Voltage
Experimental Terminal Voltage
Simulated Terminal Voltage
Figure 6-6 Experimental and Simulated Terminal Voltage of Test6 (SOH= 5306)
In the parameter identification of test shown in figure 6-6 the remaining capacity
is only about 12 of the initial capacity when the battery is brand new During the
discharge period the simulation and experimental result is not fitting very well
and the slopes of them are not the same This is probably also caused by
insufficient idle time after being charged and the capacitor had not fully
discharged
Figure 6-7 represents the internal resistance value in different state of health as
described in table 6-1
107
100 95 90 85 80 75 70 65 60 55 5004
045
05
055
06
065
07
075
08
State of Health
Inte
rnal R
esis
tance (
Ohm
)
r vs SOH
Approximation
Figure 6-7 Change of Internal Resistance in Different State of Health (Battery 1)
It is shown that the internal resistance is increasing when the state of health of a
lead-acid battery decreases This progress is at first very slow when the battery is
new But after a number of discharge cycles the remaining capacity of battery
drops to about 75 of the initial capacity when the battery is new and the
increase of internal resistance become faster When the state of health is brought
down to about 50 which means that the battery cannot offer enough energy as
new the value of internal resistance is increased by 30 approximately At
present there is not a published quantitative description of the internal resistance
when the capacity changes yet but it has been agreed that the internal resistance
increases while the battery health deteriorates
Similar tests have been carried out on 5 other batteries with the same nominal
108
capacity and the changes of their internal resistances are given as figure 6-8 It is
not possible to deduce a statistical approximation equation only based on the
existing data but it can be seen from the figure that the performance of internal
resistance under different state of health shows an agreement in a certain extent
100 95 90 85 80 75 70 65 60 55 5003
04
05
06
07
08
09
State of Health
Inte
rnal R
esis
tance (
Ohm
)
r vs SOH (Battery 1)
r vs SOH (Battery 2)
r vs SOH (Battery 3)
r vs SOH (Battery 4)
r vs SOH (Battery 5)
r vs SOH (Battery 6)
Figure 6-8 Change of Internal Resistance in all 6 Batteries
63 Summary and Discussions
The determination of battery remaining capacity accurately is becoming
increasingly important in modern battery managements This currently is mostly
obtained by integrating the discharge current of a full discharge but this progress
usually causes a negative effect on most of the batteries There is also a view that
109
the state of health which represents the percentage of remaining capacity of a
weak battery compared with the initial capacity when brand new can affect the
internal resistance therefore the battery state of health can be obtained by the
study of battery internal resistance However from the analysis based on the
mathematical model and the experimental results it can be concluded that other
parameters can also cause variations of the internal resistance which make the
estimation of the state of health more challenging
This chapter describes a new alternative method that based on the Improved
Battery Model and the key parameters of the model The remaining maximum
capacity of a used battery which represents the SOH of the battery is related in
the internal resistance under the depth of charge of 65 which is expressed by
the parameters of R00 and R10 These parameters can be identified by genetic
algorithms A result that quantifies the change of internal resistance in different
SOH values has been concluded based on the analysis of a series of experimental
tests
110
Chapter 7
Conclusions and Future
Research
This chapter summarizes the major achievements of the presented research work
in the field of battery modelling and state of health analysis Possible direction of
further research work is also described briefly in this chapter
71 Summary
Lead-acid batteries are used in various industrial sectors and are irreplaceable due
to their low price In areas where lead-acid batteries are employed as an energy
storage device the capacity loss caused by the repeated dischargecharge cycles is
very common This drop of capacity can neither be avoided nor be repaired by
using current technologies As a result it is essential to know whether the battery
is able to meet the demand and if it should be replaced on time
In this thesis a study on the capacity status of a battery and its relation to the
internal resistance had been conducted and this thesis established a novel model
based method to quantify the battery health An Equivalent Circuit Mathematical
model for the discharging progress of a lead-acid battery has been developed for
this purpose and is implemented under MatlabSIMULINK software environment
111
The model involves most of the important concepts of a battery to reflect the
dynamic response of terminal voltage when discharging
A series of experimental tests have been carried out during the project for the
model validation and the study of the state of health Six 12V-13Ah lead-acid
batteries with the same rated capacity are discharged and recharged from brand
new to obtain different values of state of health Genetic algorithm has been
employed to identify the unknown parameters of the battery model in each state of
health and the identified parameters are used as the factors that reflecting the state
of health and the internal resistance The internal resistances corresponding
different state of health have been collected and recorded A result was found in
the thesis that for the 12V-13Ah lead-acid battery which is used in the
experimental tests the value of internal resistance is increased by 25
approximately if the SOH of battery drops to 50
72 Limitations
The key limitation of the method introduced in this thesis is that it is based on the
parameter identifications of the model which means a test is still needed in order
to obtain the state of health The major reason is that the mathematical model does
not include the charging progress of battery which is also an important period of
the battery duty cycle Another limitation is that all the tests of the state of health
estimation are carried out at the same discharge rate because of the variation of
the internal resistance in different discharge rate as discussed in chapter 4 Finally
112
The lsquocoup de fouetrsquo behaviour that of took place at the beginning of discharge
when batteries are full is not able to be simulated in the current version of
mathematical model
73 Future Research Work
Following the limitations of the project some future research can be carried out in
three steps based on the model improvements and the practical applications of the
algorithm
First of all improvements of the discharging battery model can be carried out
which can mainly focus on the study of the battery internal resistance in different
discharge rates Equations of internal resistances that can withstand the change of
discharge rate will make the model capable for online applications Studies on the
relationship between the electromotive force and the state of charge can also lead
to a solution of the lsquocoup de fouetrsquo behaviour and a better simulation result
Another research work on the model modification is that the behaviour of battery
to the mathematical model when a battery is being charged can be involved by
which the monitoring system of battery can be implemented in the whole duty
cycles This part of work can be focused on the parasitic branch in the
mathematical model described in chapter 3
Further work should also reveal the variations of state of health in different duty
113
cycles and an algorithm based on this change should be designed to estimate the
remaining life-time of a lead-acid battery The value of current state of health and
the estimated raining life-time should also be considered as major outputs in this
period of work It is also possible to design an online management device of
battery to estimate the life-time and the state of health
114
References
Anon (2006) Global Wind Energy Council (GWEC) statistics [online] from
httpwwwgwecnetuploadsmedia07-
02_PR_Global_Statistics_2006pdf
Anon (2007) Battery Types Flooded versus AGM and Gel [online]
Retrieved February 13 2007 from
httpwwwvonwentzelnetBattery01Type
Anon (2007) BP Statistical Review of World Energy June 2007 [online] from
httpwwwbpcomliveassetsbp_internetglobalbpglobalbp_uk_englishr
eports_and_publicationsstatistical_energy_review_2007STAGINGlocal_
assetsdownloadsspreadsheetsstatistical_review_full_report_workbook_2
007xls
Anon (2007) International Energy Outlook 2007 [online] from
httpwwweiadoegovoiafieohighlightshtml
Ball R J Evans R and Stevens R (2002) Finite element (FE) modelling of
current density on the valve regulated leadacid battery positive grid
Journal of Power Sources 103(2) 213-222
Bernardes A M Espinosa D C R and Tenoacuterio J A S (2004) Recycling of
batteries a review of current processes and technologies Journal of
Power Sources 130(1-2) 291-298
Berndt D (1993) Maintenance-Free Batteries -- A Handbook of Battery
Technology Somerset Research Studies Press Ltd
Berndt D (2001) Valve-regulated lead-acid batteries Journal of Power
Sources 100(1-2) 29-46
115
Berndt D (2009) Electrochemical Energy Storage Battery Technology
Handbook CRC Press
Casacca M A and Salameh Z M (1992) Determination of lead-acid battery
capacity via mathematical modeling techniques Energy Conversion
IEEE Transaction on 7(3) 442-446
Ceraolo M (2000) New dynamical models of lead-acid batteries Ieee
Transactions on Power Systems 15(4) 1184-1190
Chan H L and Sutanto D (2000) A new battery model for use with Battery
Energy Storage Systems and Electric Vehicles Power Systems 2000 Ieee
Power Engineering Society Winter Meeting - Vols 1-4 Conference
Proceedings 470-475
Chen M and Rincacuteon-Mora G A (2006) Accurate electrical battery model
capable of predicting runtime and I-V performance IEEE
TRANSACTIONS ON ENERGY CONVERSION VOL 21( NO 2)
504-511
Chipperfield A J Fleming P J and Fonseca C M (1994A) Genetic algorithm
tools for control systems engineering Adaptive computing in
engineering design and control Plymouth UK
Chipperfield A J Fleming P J Pohlherim H and Fonseca C M (1994B)
Genetic algorithm toolbox for use with Matlab Department of automatic
control and systems engineering University of Sheffield
Crompton T R (2000) Battery Reference Book Third Edition Oxford
Elsevier Newnes
Cun J P Fiorina J N Fraisse M Mabboux H A and Mabboux H The
116
experience of a UPS company in advanced battery monitoring
Telecommunications Energy Conference 1996 INTELEC 96 18th
International 646 - 653
Durr M Cruden A Gair S and McDonald J R (2006) Dynamic model of a
lead acid battery for use in a domestic fuel cell system Journal of Power
Sources 161(2) 1400-1411
Esfahanian V Torabi F and Mosahebi (2008) An innovative computational
algorithm for simulation of lead-acid batteries Journal of Power
Sources 176(1) 373-380
Gillioli R and Cerolo P (1990) Charge and discharge fourth order dynamic
model of the lead battery 10th
intl Electric Vehicle Symposium Hong
Kong p1-9
Glendenning I (1981) Compressed air storage Physics in Technology 12(3)
103-10
GONG Q (2005) Modeling study of a vehicle traction battery model
CHINESE LABAT MAN 2005 Vol 42 Numb 2 issu 155 pages 76-79
Houck C Joines J and Kay M (1995) A Genetic Algorithm for Function
Optimization A Matlab Implementation NCSU-IE TR 95-09
Jacobi W (2009) Lithium Batteries Battery Technology Handbook CRC Press
Jayne M G and Morgan C (1986) a new mathematical model of lead acid
battery for electric vehicles Eighth Intl electric vehicle conference
Washington DC
Juvonen M (2003) Large-Scale Energy Storage Systems [online] from
httpwwwdocicacuk~mattiise2grpenergystorage_reportstoragehtml
117
Lee J H Lee K Y and Lee J Y (1996) Self-discharge behaviour of sealed
Ni-MH batteries using MmNi33+xCo07Al10-x anodes Journal of
Alloys and Compounds 232(1-2) 197-203
Liaw B Y Gu W B and Wang C Y (1997) Numerical simulation of coupled
electrochemical and transport processes in battery systems Proceedings
of the Intersociety Energy Conversion Engineering Conference
Honolulu HI USA IEEE
Lu S Meegahawatte D H Guo S Hillmansen S Roberts C and Goodman
C J (2008) Analysis of energy storage devices in hybrid railway vehicles
Railway Engineering - Challenges for Railway Transportation in
Information Age 2008 ICRE 2008 International Conference on
Mantell C L (1984) Batteries and energy systems Second Edition McGraw-
Hill Inc
MathWorks Inc (2004) Genetic Algorithm Direct Search Toolbox V102
MathWorksInc
MPowerSolutionsLtd (nd) Alternative Energy Storage Methods [online]
from httpwwwmpowerukcom
Okoshi T Yamada K Hirasawa T and Emori A (2006) Battery condition
monitoring (BCM) technologies about lead-acid batteries Journal of
Power Sources 158(2) 874-878
Perrin M Delaille A Huet F and Hernout L (2006) Study of the coup de
fouet of lead-acid cells as a function of their state-of-charge and state-of-
health Journal of Power Sources 158(2) 1019-28
Pham D T and Karaboga D (1998) Intelligent Optimisation Techniques
118
Genetic Algorithms Tabu Search Simulated Annealing and Neural
Networks New York Springer-Verlag New York Inc
RailPower Hybrid Technologies C (nd) Benifits of Hybrid Locomotives
[online] from httpwwwrailpowercomproducts_hl_benefitshtml
Rand D A J Moseley P T and Garche J (2004) Valve-Regulated Lead-Acid
Batteries Elsevier
Ruetschi P (2004) Aging mechanisms and service life of lead-acid batteries
Journal of Power Sources 127 (1-2) 33-44 Switzerland Elsevier
Salameh Z M Casacca M A and Lynch W A (1992) A mathematical model
for lead-acid batteries IEEE Trans on Energy conversion Vol7 No 1
Sato Y Takeuchi S and Kobayakawa K (2001) Cause of the memory effect
observed in alkaline secondary batteries using nickel electrode Journal
of Power Sources 93(1-2) 20-24
Sims R I Carnes J C Dzieciuch M A and Fenton J E (1990) Computer
modeling of Automotive lead acid batteries Ford Research Laboratories
Technical Report
Smil V (2007) Energy at the Crossroads Massachusetts Achorn Graphic
Services Inc
Ter-Gazarian A (1994) Energy storage for power systems London Peter
Peregrinus Ltd
TNI_Ltd (2007) Battery history [online] from
httpwwweuropulsecombattery_historybattery_historyhtm
Tuck C D S (1991) Modern Battery Technology Ellis Horwood Ltd
Wei J (2007) Development of Coal Mill and Aggregate Load Area Models in
119
Power Systems using Genetic Algorithms University of Liverpool PhD
Wikipedia (nd) Lead-Acid Battery [online] from
httpenwikipediaorgwikiLead-acid
Wikipedia (nd) Rechargeable Batteries [online] from
httpenwikipediaorgwikiRechargeable_battery
Wikipedia (nd) VRLA [online] from httpenwikipediaorgwikiVRLA
Zhang Y L Liu P H Zhang Q Y and Cheng W (2010) Separation of
cadmium(ii) from spent nickelcadmium battery by emulsion liquid
membrane Canadian Journal of Chemical Engineering 88(1) 95-100
120
Appendix I SIMULINK Diagrams of Battery Model
Figure A-1 SIMULINK Diagrams of ldquoMain Blockrdquo
121
Figure A-2 SIMULINK Diagrams of ldquoTerminal Voltage Calculationrdquo
122
Figure A-3 SIMULINK Diagrams of ldquoThermal Behaviourrdquo
123
Figure A-4 SIMULINK Diagrams of ldquoBattery Capacityrdquo
Figure A-5 SIMULINK Diagrams of ldquoBattery State of Chargerdquo
Figure A-6 SIMULINK Diagrams of ldquoBattery Depth of Chargerdquo
124
Figure A-7 SIMULINK Diagrams of ldquoBattery Electromotive Forcerdquo
(a)
(b)
Figure A-8 SIMULINK Diagrams of ldquoBattery Internal Resistancerdquo
125
Appendix II
List of Publications
S Hillmansen S Lu D H Meegahawatte S Guo C Roberts and C J
Goodman Analysis of Energy Storage Devices in Hybrid Railway Vehicles International Conference on Railway Engineering 2008 p68-73 Hong Kong China 25-28 March 2008
Y Yin X Luo S Guo Z Zhou J Wang A battery charging control strategy for
renewable energy generation systems The Proceedings of World Congress on Engineering 2008 Vol 1 pp356-361 London UK 2-4 July 2008
S Guo S Hillmansen Y Yin J Wang State of Health Monitoring of Lead-acid
Batteries Proceedings of the 14th International Conference on Automation amp Computing pp250-254 Brunel University West London UK 6 September 2008
Y Yin C Li Z Zhou Q Liu S Guo X Luo J Wang Design and Realization of a
PS2 Keyboard Interface in Embedded system Proceedings of the 14th International Conference on Automation amp Computing pp160-163 Brunel University West London UK 6 September 2008
Yin Y Wang J Luo X Guo S Development of a battery charging management
unit for renewable power generation a book chapter in Advances in
Electrical Engineering and Computational Science Edited by Sio-Long Ao and Len Gelman pp33-46 Springer 2009
Wang J Wei JL Guo S Condition monitoring of power plant milling process
using intelligent optimization and model based techniques accepted as a chapter in the book of Fault Detection in March 2009
S Guo S Hillmansen J Wang Model Based Analysis of Battery State of Health
using Genetic Algorithms accepted by the International Conference on Systems Engineering (ICSE) Coventry 8-10 September 2009

6
Chapter 3 Equivalent Circuit Modelling of Lead-acid Batteries 31
31 Requirements for the Battery Model 31
32 Overview of Battery Model Techniques 32
321 Electrochemical Model 32
322 Physical Models 33
323 Equivalent Circuit Model 34
324 Discussion of Different Battery Model Methods 35
33 Introduction of the Existing Equivalent Circuit Models 37
331 Simple Battery Model 37
332 Advanced Simple Battery Model 39
333 Thevenin Battery Model 40
334 Dynamic Battery Model 42
335 Fourth Order Dynamic Model 43
336 Improved Battery Model 44
34 Mathematical Model of the Lead-acid Batteries 44
341 Capacity 45
342 Electric Networks 48
343 State of Charge and Depth of Discharge 50
344 Electromotive Force of the Battery 50
345 Internal Resistance of a Battery 51
346 The Behaviour of Parasitic Branch 52
347 Main Branch Capacitance 53
348 Thermal Behaviour of a Battery 55
35 Mathematical Model of the Lead-acid Batteries 56
7
36 Summary and Discussion 57
Chapter 4 Experimental System Set up and Improved Battery Model Simulation
Implementation 59
41 The Experimental System 59
42 Improvements of the Battery Model 61
421 The Change of τ in Different Charge Status 63
422 Analysis in Variations of the Internal Resistance 64
423 Improved Lead-Acid Battery Mathematical Model 66
43 Simulation Study 68
44 Summary and Discussion 72
Chapter 5 Model Parameter Identification and Model Validation 73
51 Need for the Optimization Algorithms 73
52 Overview of the Optimization Algorithms 74
53 The Study of the Genetic Algorithms 77
531 Working Principle of GAs 77
532 Simulation Studies of Genetic Algorithms 81
54 Model Parameter Identification 87
541 Implementation of Genetic Algorithms and Experimental Data sets
87
542 Parameters of Battery Model 90
543 Battery Model Validation 92
55 Summary and Discussions 95
Chapter 6 The Analysis of State of Health (SOH) in association with the Internal
Resistance 97
8
61 Methodology 97
62 The identification of C0 R00 and R10 100
63 Summary and Discussions 108
Chapter 7 Conclusions and Future Research 110
71 Summary 110
72 Limitations 111
73 Future Research Works 112
9
List of Figures
Figure 1-1 Power density vs energy density plot 7
Figure 2-1 Working Principle of Lead-Acid Batteries (a) shows the battery when
discharging and (b) is when charging with a DC charger 18
Figure 3-1 Simple Battery Model 38
Figure 3-2 I-V chart of the Simple Battery Model 39
Figure 3-3 I-V Chart in different SOC 40
Figure 3-4 Sketch to show battery discharge behaviours in typical tests 41
Figure 3-5 Thevenin Battery Model 42
Figure 3-6 Fourth-order Battery Model43
Figure 3-7 Improved Battery Model 44
Figure 3-8 Battery Capacity vs Discharge Current 47
Figure 3-9 Lead-acid Battery Equivalent Network 48
Figure 3-10 The Equivalent Network with the Approximated mZ 49
Figure 3-11 R-C block 53
Figure 4-1 Equivalent Circuit of the Experimental Test Rig 60
Figure 4-2 Experimental Test Rig61
Figure 4-3 Test of constant-impedance load discharge 62
Figure 4-4 Test of two-load discharge 62
Figure 4-5 Structure of model for SIMULINK Implementation69
Figure 4-6 Terminal Voltage of Battery 71
Figure 5-1 Flowchart of a Simple Genetic Algorithm78
Figure 5-2 2-dimensional Rastrigins function83
Figure 5-3 Contour plot of Rastrigins function84
10
Figure 5-4 GA performance (Rastrigrinrsquos function) 85
Figure 5-5 2-dimensional Rosenbrock function 86
Figure 5-6 GA performance (Rosenbrock function) 87
Figure 5-7 Progress of Parameter Identification 88
Figure 5-8 Measured and Simulated Result after Parameter Identification 91
Figure 5-9 Mean and the Best Fitness Values in Each Generation 92
Figure 5-10 Measured and Simulated Terminal Voltage 93
Figure 5-11 Measured and Simulated Terminal Voltage 94
Figure 6-1 Experimental and Simulated Terminal Voltage of Test 1 (SOH = 100)
102
Figure 6-2 Experimental and Simulated Terminal Voltage of Test 2 (SOH=9314)
103
Figure 6-3 Experimental and Simulated Terminal Voltage of Test 3 (SOH=7889)
104
Figure 6-4 Experimental and Simulated Terminal Voltage of Test 4 (SOH=7019)
104
Figure 6-5 Experimental and Simulated Terminal Voltage of Test 5 (SOH=6354)
105
Figure 6-6 Experimental and Simulated Terminal Voltage of Test 6 (SOH=5306)
106
Figure 6-7 Change of Internal Resistance in Different State of Health (Battery 1)
107
Figure 6-8 Change of Internal Resistance in all 6 Batteries 108
1
Chapter 1
Background and Objectives of
the Project
11 Overview
Fossil fuels have been the main energy resource in recent human history although
their continuing use has been shown to have a detrimental effect on the
environment The principal problem for fossil fuels is that they cannot be
reproduced within a short period of time so it is a finite energy supply source If
current consumption rate continues they will be exhausted in a few generations
from now Fossil fuel has never been considered as a clean-resource because there
is an emission of noxious gasses including CO CO2 NOx SOx and HC into the
atmosphere With all the pressure from the problems associated with the fossil
fuel exploration of the usage of renewable energy is becoming an increasingly
important issue
Wind energy hydro energy and solar energy are three of the most important
renewable energy sources and they have been implemented on a large scale wind
energy has produced a annual global total of 65019 times 1012 Wmiddoth
(74223 MWtimes24htimes365 days) (Anon 2006) energy in the year 2006 and hydro
2
energy is about 304 times 1015 Wmiddoth (30404 times 1012 Wmiddoth) (Anon 2007) Solar energy
resources are estimated at about 10694times1015 Wmiddoth (3850times1021 J) (Smil 2007) To
compare with the worldwide energy consumption of 13097times1015 Wmiddoth in the year
2007 it is clear that renewable energies have a significant role to play (Anon
2007)
However the problem of the implementation of the renewable energy is that the
electricity generated is intermittent and the power systems are experiencing the
problem of rapidly changing power demand Therefore the management of the
energy is an important issue Devices of energy storage should solve these
problems in theory
12 Review of Energy Storage Systems
Not only giving a large scale energy solution energy storage devices are also
commonly used in a range of applications related to everybody Different energy
storage technologies are suited to different applications and consideration must be
made in order to select the correct solution for each application This section will
give an overview of the existing energy storage systems
121 Applications of the Energy Storage Systems
Large scale energy storage systems which are also called grid energy storage
refer to the methods used to large-scale store electricity within an electrical power
grid Off-peak energy is stored during times when production (from power plants)
3
exceeds consumption and the stores are utilized at times when consumption
exceeds production In this way electricity production need not be drastically
scaled up and down to meet momentary consumption ndash instead production is
maintained at a more constant level
Despite the applications in grid scale the energy storage systems are also popular
in a number of areas For example they are usually used to optimize the energy
generated from the engine in modern electrical hybrid vehicles One such
application is in a shunter locomotive A shunter is a small railroad locomotive
intended for assembling trains ready for a road locomotive to take over
disassembling a train that has been brought in and switching a train to another rail
at the rail terminals The duty cycle of a shunter is characterised by short duration
high power demands (accelerating a rake of vehicles) and the long periods of
idling while the train waits for other operations Comparing to traditional shunter
locomotive that use diesel engines only for the whole duty cycle hybrid shunter
locomotives with energy storage devices can have a 40-70 reduction in fuel use
(RailPower Hybrid Technologies nd) This saving is made by operating the prime
mover at its optimum
Another application of energy storage in the vehicle technologies is the
regenerative braking system which is used to save the braking energy of vehicle
The potential of this technology to save energy for a vehicle is depends on the
duty cycle (Lu Meegahawatte et al 2008) which is characterized by storing the
energy generated when the vehicle is decelerating and releasing when accelerating
4
Energy storage devices are also very popular in stationary applications also
known as the Uninterruptible Power Supply (UPS) systems This system is
designed to meet the power demand when problems like power failure happen and
it is important especially in the applications where power failures could have
serious consequences for example in hospitals and computer centres (Berndt
2009)
The energy storage devices in the UPS system are often used to achieve
ldquouninterruptiblerdquo in a short period before the secondary power supply started
When a power problem occurs the energy storage device starts to supply
electricity immediately and at the same time the generator begins to start When
the generator is ready to supply sufficient power the energy storage device stops
providing power When the grid power is recovered the energy storage device can
be recharged until full
122 Review of the Existing Energy Storage Devices
There are various kinds of energy storage systems including pumped hydro
compressed air flywheel supercapacitors electrochemical and also
superconducting magnetic Each technology is suited to different applications and
careful consideration must be made in order to select the correct solution for each
application
Pumped hydro is the oldest and the most effective kind of large scale energy
storage method which have been used for nearly a century since 1929 (Juvonen
5
2003) Two large reservoirs at different altitudes with a pump a turbine a motor
and a generator are employed to collect the off-peak energy The water is released
from the higher one through a turbine to generate electricity during peak load
period
Compressed air is a pneumatic energy storage method that refers to the air kept
under a certain pressure This system can be used in grid energy storage that the
air can be stored by compressors during periods with low power demand This
compressed air can be released to a generator to meet the high power demand
during peak time (Glendenning 1981 Ter-Gazarian 1994 Juvonen 2003) In some
applications the compressed air is released through a combustor mixed with
natural gas to obtain a higher overall efficiency
A capacitor is an electrical device that can store energy in an electric field
between a pair of conductors and is often used in circuits for short term energy
storage It blocks the circuit to hold DC voltage Supercapacitors are energy
storage devices with the same principle but with a higher energy density The
power density of the supercapacitor systems can be very high but the energy is
often released in a very short duration (Ter-Gazarian 1994) As a result the
supercapacitors are usually used in applications of an energy burst
Superconducting magnetic energy storage system stores energy in the magnetic
field generated by direct current in a coil Instead of traditional wires like copper
superconductors are employed to avoid the energy consumptions as heat because
of the resistance A problem is that the optimal operating temperature for
6
superconductors is 50-77K a refrigerator is therefore necessary in the system for
cooling down
Flywheels are considered as a method of storing mechanical kinetic energy by
accelerating a flywheel to a very high speed to store the energy and decelerating
to release the energy Flywheels are very efficient for short duration storage cycles
due to their fast response speed These energy storage devices are used mainly in
applications that demand kinetic energy storage and high numbers of deep
discharge cycles
Electrochemical energy storage stands for the device capable of converting
chemical and electrical energy to each other by chemical reactions Batteries are
the most common technology of electrochemical energy storage methods The
oxidation and reduction reactions in the two electrodes of battery lead to the
current through the external circuit when discharging to provide energy The
secondary battery can be recharged by applying electrical current which reverses
the chemical reactions that occur during the discharge
Fuel cell is another technology with very high energy density that converts the
chemical energy in a source fuel into an electrical current The fuel cells are
considered as the ldquoenvironmental friendlyrdquo as the only by-product is water The
working principle of fuel cells when discharging is the same as the batteries but
unlike the batteries the fuel cells do not need recharge as they only provide
electrical energy while the active chemicals are supplied to the electrodes (Mantell
1984 MPowerSolutionsLtd nd)
7
Figure 1-shows the Ragone chart of the energy and power density of some energy
storage systems
Figure 1-1 Power density vs energy density plot (MPowerSolutionsLtd nd)
123 Review of Batteries
The preceding discussion has identified that energy storage devices are becoming
increasingly important in both stationary and mobile applications Battery as the
most popular energy storage device is studied in this section
There are two different types of batteries applied in a large range of areas now
Primary batteries and Rechargeable batteries Primary batteries which are also
called disposable batteries often have higher energy densities than the
rechargeable ones and they have a lower self-discharge (Ter-Gazarian 1994)
8
However as the chemical reactions in these batteries are not reversible and the
active materials cannot be restored to their initial forms these batteries cannot be
reliably recharged The primary batteries are intended to be used once and then
discarded therefore they are not suitable for the energy storage systems
Rechargeable battery is the other type of the electrochemical batteries which is
also known as secondary battery because their electrochemical reactions are
electrically reversible There are many different rechargeable battery technologies
in which only four of them are leading the world market nickel-cadmium nickel-
hydride lead-acid and lithium-ion (Berndt 1993 Berndt 2009)
The Nickel-cadmium (NiCd) battery is a kind of rechargeable battery that uses
nickel oxide hydroxide and metallic cadmium as electrodes and an alkaline
electrolyte (often potassium hydroxide) (Mantell 1984) As designed to compete
the primary batteries the NiCd batteries are often manufactured in the same size
and they are used in the consumer market as primary batteries for example in
clocks toys radios and cordless tools However when the NiCds are substituted
for primary cells the lower terminal voltage and smaller ampere-hour capacity
may reduce performance as compared to primary cells The most attractive feature
of the nickel-cadmium batteries is that they are more difficult to damage
comparing with other batteries during deep discharge cycles They can also
sustain more cycles and the lower internal resistance can also help achieve a
higher maximum discharge rate A problem preventing the large scale application
of this battery technology is that the nickel-cadmium batteries suffers faster self
discharge rate than other rechargeable batteries and the cadmium used as the
9
active material in one of the electrodes is toxic and expensive (Zhang Liu et al
2010) Furthermore the capacity loss caused by the continuously discharge and
recharge to the same state of charge called ldquomemory effectrdquo is also a very
important issue of the nickel-cadmium batteries (Sato Takeuchi et al 2001)
The nickel-metal hydride (NiMH) battery is a type of secondary electrochemical
battery that designed to substitute for the nickel-cadmium cells They have a
similar size and a similar cell voltage but with more advantages By using
hydrogen-absorbing alloy as negative electrode instead of cadmium this
electrochemical technology is considered as ldquoenvironmental friendlyrdquo because of
the absence of toxic cadmium (Berndt 1993) The nickel-metal hydride batteries
also have low internal resistance and the high cycle durability as the NiCds and a
NiMH battery can have two to three times the capacity of an equivalent size
nickel-cadmium battery However the nickel-metal hydride batteries also have a
similar high self-discharge rate as the nickel-cadmium batteries (Lee Lee et al
1996) and it also cannot afford complete discharges Memory effect from
repeated partial discharge can occur in a NiMH battery but this is reversible
through charge cycling (Berndt 2009)
The lead-acid batteries are the oldest type of rechargeable battery with a history of
over 150 years but they are still the most popular battery chemistry for
applications such as engine starting or backup power systems as there is no
cheaper alternative when weight is not a factor This technology uses lead and
lead dioxide as electrodes and an acid electrolyte of sulphuric acid and the
advantage of this configuration is that the electrolyte takes part in reactions of
10
both electrodes and both electrodes turn into lead sulphate when discharging
(Berndt 1993 Berndt 2009) The lead-acid batteries can be designed for not only
deep discharge cycles but high discharge rate or compromise of the two cycles
They have a lower self-discharge rate compared with the nickel batteries and they
also do not suffer from the memory effect (Mantell 1984 Berndt 2009) However
as the energy density of lead-acid battery is not high it is seldom applied in the
portable electronics Another important problem is that the lead-acid batteries
must be recycled as the active material ldquoleadrdquo is toxic to both the environment and
the human bodies (Bernardes Espinosa et al 2004)
The lithium-ion (Li-ion) batteries are almost the perfect cell chemistry and are
currently used a wide range of consumer electronics products including cameras
cell phones laptops etc They have many attractive performance advantages
which make them also ideal for higher power applications such as automotive and
standby power First of all the lithium-ion batteries have the highest energy
density in all the rechargeable battery now which is about 4 times better than
lead-acid (Jacobi 2009) They are also capable for deep discharge and high
discharge rate with a relatively slow self discharge There is no liquid electrolyte
in the lithium-ion batteries which means they are immune from leaking However
just opposite to the lead-acid batteries the most serious problem that discourages
the lithium-ion batteries is the low economic efficiency comparing with the lead-
acid batteries Other factors like the stability of the chemicals and the recycling of
lithium should also be concerned because of the chemical activeness of lithium
Table 1-1 is gives some basic properties of the four major rechargeable batteries
11
introduced above There are also some less common battery chemistries used by
rechargeable batteries in addition to these technologies including nickel-zinc
(NiZn) nickel-iron (NiFe) etc but they have a small market share For the four
major battery chemistries lead-acid batteries with their low price and high
flexibility is adopted in a wide range of application areas
Table 1-1 properties of the rechargeable batteries (Wikipedia nd)
Type Voltage
(V)
Energy Density (Whkg)
Power Density (Wkg)
Self Discharge
rate
Cycle Durability
Nickel-Cadmium
12 40-60 150 20 1500
Nickel-Metal-Hydride
12 30-80 250-1000
20 1000
Lead-Acid 21 30-40 180 3-4 500-800
Lithium-ion 36 160 1800 5-10 1000-1200
124 The Management of Batteries
In the areas that batteries are employed as the energy storage device it is a critical
issue to consider that whether there is enough energy in the battery to meet the
demand However batteries do have the problem in limited cycle durability that
is when a battery is charged and discharged for a number of cycles its total
capacity decreases If the battery cannot offer sufficient powerenergy it should be
replaced at the right time But the problem is that it is difficult to quantify the
capacity loss and when the capacity of battery is no longer sufficient for a
particular application Due to the limitation of batteries it is essential to develop a
method to determine the capacity of battery that subjected to various duty cycles
in a number of applications
12
13 Project Objectives
The main objective of the project is to develop a method which can determine the
key parameters of batteries from the discharge tests The proposed methodology is
a model based approach that is to develop a mathematical model of the battery
which can represent the dynamic performance and battery status and
characteristics can be investigated through the analysis of the model
The first step of the project is to build a mathematical model of battery The
dynamic model is expected to reflect the relevant behaviours of battery when
being discharged including the characteristics of State of Charge Depth of Charge
Electromotive force Terminal Voltage The unknown parameters in the model are
identified by using Genetic Algorithms (GAs) with the laboratory experimental
data Afterwards some batteries are tested in experiments and the parameters in
different state of health are recorded to analyze the battery in different status of
battery
The focus of this work is to develop a suitable method for parameter identification
for common battery systems The lead-acid battery has been chosen because it has
relatively well defined properties and there is a wealth of literature describing the
performance of these types of batteries From an experimental view point they are
also readily available of low cost
13
14 Outline of the thesis
The thesis is organized into seven chapters and the first chapter presents the
background and motivation of the research project The remaining chapters are
briefly described as follows
Chapter 2 gives an overview of lead-acid batteries including the development
working principle and also some modern battery designs and technologies In the
second part of chapter 2 important concepts for a battery including electromotive
force capacity state of charge internal resistance and state of health are
introduced and some mathematical descriptions of these concepts are discussed
Chapter 3 starts from some requirements of the mathematical model designed for
this project and several different methods of battery model approaches are
discussed Afterwards some details of the dynamic mathematical model are
analyzed The initial battery model is described in the last part of this chapter that
summarized the equations of the battery
Chapter 4 is mainly focused on some improvement of the mathematical model
described in chapter 3 In the first section of chapter 4 the experimental test rig in
the project is introduced Some findings in the experimental tests is then listed and
studied and integrated into the improved model Finally the SIMULINK
implementation and a simulation study are given
Chapter 5 presents a method of model parameter identification The principle of
14
Genetic Algorithms is studied at first Then this algorithm is employed in the
model and the parameters of the model are identified with the help of
experimental tests This chapter also includes the validation of battery model
using two other groups of test results
Chapter 6 develops an algorithm that can reflect the state of health of a lead-acid
battery In this chapter the internal resistance parameters are measured under
different state of health through a group of continuous experimental tests The
change of internal resistance under a specific working condition is then related to
the battery state of health
Finally Chapter 7 gives a summary and the conclusions of the project Also the
future works that can be improved are proposed in this chapter
15
Chapter 2
Introduction of Lead-acid
Batteries
This chapter gives an overview of lead-acid batteries including background
knowledge working principles explanation of terminologies technologies and
applications encountered for this technology The chapter presents the
fundamental knowledge and prepares for the project work to be reported in the
following chapters
21 A General Overview of the
Lead-acid Battery
The lead-acid battery is the oldest type of rechargeable battery The first example
of a lead-acid battery can be attributed to the German physicist Sinsteden who
published the performance data of this battery system in 1854 (Berndt 1993)
Later in 1859 the French physicist Planteacute realized that a plate construction was
required to achieve a much larger effective surface area and he produced the first
rechargeable battery which was marketed for commercial use by alternately
charging and discharging lead sheets immersed in sulphuric acid This method
has remained unchanged and still in use today in stationary applications (Berndt
16
1993 Wikipedia nd) One of the first applications of lead-acid batteries was for
storing electrical energy for telegraphy systems The capacity required for these
applications was low and the battery at that time was not yet suited to high power
industrial applications (TNI_Ltd 2007)
In 1880 a French chemical engineer Faureacute significantly improved the design of
the lead-acid battery by producing the active materials separately His method was
to coat the lead plate with a paste of lead oxides sulphuric acid and water in a
warm humid atmosphere The paste then changed into a mixture of lead sulphates
which adhered to the lead plate as an electrochemically active material As a result
of this technology the Faureacute cells are able to achieve much higher capacity with
the first charge in comparison with the Planteacute ones (Berndt 1993 TNI_Ltd 2007)
The problem of these plates is that they are not very durable and become weak
only after a few dischargecharge cycles The lead grid alloyed with antimony or
calcium was developed to improve the mechanical characteristics The holes on
the grid are able to achieve improved bonding thus the batteries may have a longer
lifetime This advantage led to the industrial manufacturing of lead-acid batteries
In 1881 a lead electrode with a ribbed surface was designed in order to have a
large effective surface of the active material and this was the pioneer of the large
surface plates which are still common today (Berndt 1993 TNI_Ltd 2007
Wikipedia nd)
In the beginning lead-acid batteries were operated in open jars The advantage of
this feature was that the electrode can be cleaned and exchanged easily but faced
the problem of water evaporation Therefore the early batteries have to refill water
17
in order to continue normal use However this problem can be dramatically
reduced when the cells were fitted with covers to limit the evaporation (Berndt
1993) This kind of battery design is known as a lsquoflooded lead-acid batteryrsquo
In the 1950s a new type of battery which was aimed to become spill-proof was
designed and manufactured on a large scale This type of battery is characterized
by an immobilized electrolyte however this kind of spill-proof battery was only
manufactured in small sizes up to about 10 Ah (Berndt 2001) Later the
combination of a valve improved the characteristic features of the lead-acid
battery and this kind of battery is still common today and is known as the Gel
Lead-acid battery (Berndt 1993) In the 1970s micron diameter glass fibres
originally designed for air filters were used in glass mats which absorbed the
electrolyte and acted as separator Soon this kind of Absorbent Glass Mat (AGM)
battery appeared in market for stationary application
Currently Valve Regulated Lead Acid (VRLA) batteries based on both AGM and
Gel electrolytes are available in a large range of capacities for both stationary and
mobile power applications with a range of different designs for each type of
application Arguably the most important application of lead-acid batteries is for
vehicle engine starting The battery employed in this application which is called
Starting Lighting and Ignition (SLI) batteries are designed to deliver bursts of
energy usually in a discharge current as large as several hundred amperes in a
very short time A different type of battery construction can produce batteries
capable of deep cycling which are more suited to slow discharge cycles (Tuck
1991 Anon 2007)
18
22 Configuration of Lead-acid Batteries
This section gives a brief description of the working principles of lead-acid
batteries and how the battery can be configured to suit different applications
221 Electrochemical Principles
The lead-acid battery comprises two electrodes and the electrolyte The structure
of the lead-acid battery is shown in Figure 2-1 in which one electrode is Cathode
and the other is Anode The active matter in the positive plate is made of lead
dioxide (PbO2) and that in the negative plate is made of lead (Pb) and the
electrolyte is sulphuric acid One electrode can serve either as a Cathode or as an
Anode depending on which process the battery is experiencing - charging or
discharging With this structure a battery could convert electrical energy into
chemical energy and back again which is associated with the process of charging
and discharging
(a) (b)
Figure 2-1 Working Principle of Lead-Acid Batteries (a) shows the battery when
19
discharging and (b) is when charging with a DC charger
For the discharging process as shown in Figure 2-1 (a) the negative plate acts as
the anode and the positive plate is the cathode If a wire is connected between the
two the excess electrons from the anode will travel through the wire as a current
to the cathode where they are needed to complete the electron deficient reaction
there The chemical reactions in a lead-acid battery when discharging are
described as follow
Negative plate reaction (Anode)
+minusminus+rarrminus+ HPbSO2eHSOPb 44
Positive Plate reaction (Cathode)
O2HPbSO2e3HHSOPbO 2442 +rarr+++minus+minus
For the charging process an external power source is connected to the two
electrodes with the voltage as shown in Figure 2-1(b) In this way the flow of
electrons is forced backwards against the electropotential and the reactions are
driven backwards changing the lead sulphate back into lead and lead dioxide on
the negative and the positive plates and restoring the sulphuric acid to the liquid
electrolyte The anode when a battery is charging is the positive plate and the
cathode is the negative plate and the chemical reactions in a lead-acid battery
when charging are described as
Positive plate reaction (Anode)
+minusminus++rarrminus+ 3HHSOPbO2eO2HPbSO 4224
Negative plate reaction (Cathode)
minusminus++rarr++ 44 HSOPb2eHPbSO
20
The thermodynamic heat effects caused by the reactions are small in the lead-acid
battery because the difference between the enthalpy and the free enthalpy is very
small The rate of reversible heat effect in the reaction is 132 kJ per mol of the
cell reaction which corresponds to about 35 of the total energy converted when
the lead-acid battery is discharging or charged This amount of energy is relatively
small and is generated over a comparatively long period of time so it is usually
easily dissipated through radiation and convection (Berndt 1993)
222 Lead-Acid Battery Types and Technologies
The flooded battery is the simplest type of lead-acid battery in use Flooded
batteries are common for some traction applications despite the requirement in
high maintenance They are also very common for large capacity backup power
supplies for telecommunication computer centres grid energy storage and off-
grid household electric power systems Since the flooded batteries are not sealed
they must be kept upright to avoid acid spills and water must be periodically
added to top up the liquid electrolyte The most attractive feature of the flooded
battery is that they are able to withstand certain level of overcharging without
damage providing proper maintenance is carried out
The Valve Regulated Lead-Acid (VRLA) battery which is often colloquially
called the sealed lead-acid battery is becoming more and more popular in many
applications Because VRLA batteries are mostly sealed the electrolyte
evaporation will be reduced and spillage can be largely avoided when
overcharging which are very common in flooded batteries The electrolyte of the
21
VRLA battery is designed to be immobilized so the VRLA batteries will not leak
if inverted pierced or if the container is broken They can be mounted in any
orientation and position even immersed in water The immobilization of the
VRLA electrolyte can be achieved by using an absorbent mat separator as well as
gelling materials
In Absorbent Glass Mat (AGM) battery the electrolyte is absorbed into a mat of
fine glass fibres in order to immobilize the electrolyte In addition the pores in the
mats are fine enough to prevent the lead dendrites in the cathode from growing
through as a separator and only glass is wetted enough by sulphuric acid can soak
the separators The glass mats can therefore be used to insulate the electrodes
Gelling is another way to immobilize the electrolyte and this gelling technology at
present is only applied for lead-acid batteries The idea is to mix the sulphuric acid
with silica fume (SO2) which makes the electrolyte gel-like The mixture is stable
over a long term environmental safe and easy to work technically (Berndt 1993)
The sulphuric acid bound by the gel can also insulate electrodes as a separator
similarly with that in an AGM battery
VRLA batteries including both gel and AGM batteries are able to recombine and
reduce the emission of gases during overcharge so the requirement for the room
ventilation is reduced and there is no acid fume emission during normal discharge
(Berndt 1993 Anon 2007 Wikipedia nd) Although the generation of hydrogen
can be slowed down it cannot be avoided completely As a result a valve
regulation safety system is employed in VRLA batteries which vents the gases in
22
the battery only during over pressure faults (Tuck 1991 Berndt 1993)
However the VRLA batteries do have some drawbacks First of all the VRLA
batteries tend to have a lower specific energy density than flooded batteries and
they are also more expensive An accurate charging control is very important for a
VRLA battery especially when charging under high temperature environments
since it is not possible to cure the damage caused by overcharge
223 Battery Designs for Different Applications
Lead-acid batteries are deployed in a range of applications Different designs are
therefore required due to the different working environments and duty cycles SLI
batteries are designed for a burst of energy for cold-cranking an engine A SLI
battery is supposed to provide power only in the first few seconds when starting
an engine and will be recharged immediately once the engine is started In this
kind of lead-acid batteries a larger surface area of the electrode plates is used to
provide high electric current in a short period However repeated deep discharge
may shorten the battery lifetime
On the other hand deep cycle batteries are designed for applications where the
batteries are regularly discharged The plates of the deep cycle batteries are often
very thick in order to withstand the frequent and deep discharge cycles The plate
surface area of a deep cycle battery is not as large as a SLI battery and as a result
it is not possible to offer great power
23
Marine batteries are a compromise between a SLI battery and a deep cycle battery
Standby batteries can be classified as marine batteries which are used for backup
power supplies and providing the power in emergency situations They are
designed for a long lifetime and a large capacity but repeated discharges and high
current drain are not the intended application Traction batteries are designed for
higher current drain and repeated deep discharge cycles They are usually bigger
and heavier than other types of lead acid for the same voltage and capacity but
that is the cost of durability
23 Mathematical Descriptions of Lead-acid
Batteries
In order to investigate the relationship between the battery behaviour and
remaining lifetime for a lead-acid battery initial studies have been carried out and
are described in this chapter Concepts including Capacity State of Charge (SOC)
Depth of Charge (DOC) State of Health (SOH) and internal resistance are
introduced and quantitative descriptions of these concepts are listed
231 Capacity
The capacity of a lead-acid battery represents how much charged energy the
battery can offer which is usually described in Ampere-hours (Ah) The charge
capacity of a battery is decided by the construction factors of a battery cell This
includes the materials contained in the electrodes and the acid solution In
addition the capacity of a battery is not a fixed quantity but varies according to
24
how quickly it is discharged This is known as Peukertrsquos law (Ceraolo 2000
Dhameja 2001 Rand Moseley et al 2004)
tICk
p = (21)
where pC is the capacity on one-ampere discharge rate which is a constant
I is the discharge current (A)
t is the time of discharge (h)
k is the Peukert constant and for a lead-acid battery with the value
between 11 and 13 (varies for each individual battery)
It is common to refer to ldquoCnrdquo as the capacity of battery in Amp-Hours which
corresponds to complete discharge of the battery in n hours ldquonrdquo is a subscript that
represents the discharge rate In industry the capacity under ten-hour discharge
rate (C10) is always taken as the nominal capacity
232 Electromotive force
The electromotive force of a battery cell is the difference between the electric
potential of the two electrodes of each cell (Rand Moseley et al 2004) The
potential of each electrode which is called half cell potential is decided by the
chemical reaction and the relative activities of the solution and can be obtained
from Nernstrsquos equation (Crompton 2000)
25
Ox
Redln0
α
α
zF
RTEE minus= (22)
where E is the half-cell potential (V)
0E is the standard half-cell potential (V)
α is the relative activity of the oxidizer (α Ox) and reducer (α Red)
z is the number of electrons transferred in the cell reaction
R is the universal gas constant which is 8314472 JKminus1molminus1
T is the absolute temperature
F is the Faraday constant the number of coulombs per mole of electrons
and F = 964853399times104 Cmolminus1
At room temperature RTF is a constant of 25693mV for cells therefore
Ox
Redlog
z
V05910
Ox
Redln
z
mV69325
Ox
Redln 10
α
α
α
α
α
α==
nF
RT
The Nernstrsquos Equation therefore can be expressed by
Ox
Redlog
V0591010
0
α
α
zEE minus= (23)
The electromotive force could be calculated by the difference of the electric
potential
cathodeanode EEEMF minus= (24)
When a lead-battery is discharging the electromotive force can be written as
26
O)(H
)(SO)(Hlog
V05910
2
2
24
10
00
α
ααminus+
+minus=z
EEEMF cathodeanode (25)
The standard half-cell potential of the anode 0
anodeE is equal to 1685 (PbO2-
PbSO4SO42-) and that of cathode
0
cathodeE is -0356 (Pb-PbSO4SO42-) which are
constants for the same battery chemistry And the number of electrons transferred
( n ) is 2 for a lead-acid battery
Therefore the electromotive force of a lead-acid cell can be obtained by
O)(H
)(SO)(HlogV029600412
O)(H
)(SO)(HlogV02960)3560(6851
2
2
24
10
2
2
24
10
α
αα
α
αα
minus+
minus+
+=
+minusminus=EMF
(26)
This electromotive force of a battery cell is numerically equal to the open circuit
voltage which means that the terminal voltage of a single cell battery when it is
disconnected from the external load For a lead-acid cell the electrochemical
force at fully charged is between 210-213V per cell
233 State of Charge and Depth of Charge
State of charge (SOC) and depth of charge (DOC) are variables that can describe
the battery charge The main difference is that the SOC describes the percentage
of remaining charge relative to the nominal capacity while the DOC represents
that relative to the actual capacity under a specific discharge current These two
27
variables can be obtained by calculating the charge consumed and the battery
capacity
101 CQSOC eminus= (27)
Ie CQDOC 1minus= (28)
where Qe is the charge consumed by the load (Ah)
C is the nominal capacity (Ah)
CI is the actual capacity under the discharge current I (Ah)
234 Internal Resistance and State of Health
The internal resistance of a lead acid cell is the physical resistance of the cell The
value of the internal resistance is decided by many different factors But it could
be obtained by a simple equation
I
VVr tOC minus
= (29)
where Voc is the open circuit voltage (V)
Vt is the terminal voltage when discharging (V)
I is the discharge current (A)
However the factors in this equation are only a method of calculating the internal
resistance but not the determinants It is shown in applications that the internal
resistance of a lead-acid battery will increase when discharging as the SOC and
28
the DOC drops
It is common for batteries to suffer a capacity loss when discharged and charged
in a number of duty cycles even when idle Aged batteries are often weak and
sometimes not able to offer enough charges Therefore they should be replaced or
maintained State of health is a defined variable that is important for a weak
battery This variable is to show how weak the battery is and represents the
percentage of remaining capacity to the initial capacity when the battery is brand
new (Okoshi Yamada et al 2006) as shown in the equation
new
weak
C
CSOH = (210)
where Cweak is the remaining capacity of a weak battery (Ah)
Cnew is the capacity when the battery is brand new (Ah)
The reason for the capacity loss is complex but is usually due to the sulphation
Sulphation is a process when the amorphous lead sulphate which is easily
converted back to lead lead oxide and sulphuric acid converts to a stable
crystalline form coating the electrodes This form of lead sulphate cannot conduct
electricity and cannot be converted back to lead lead dioxide and lead sulphate
under normal charging conditions The internal resistance of a lead-acid battery
therefore increases and less charge can be provided when discharging Complete
or repeated deep discharges of a battery at low current densities that lead
excessive utilization of the active material are the most critical reason for
29
capacity loss for example a discharge of a traction battery that draws more than
80 of its nominal capacity (Berndt 1993)
235 Multi-Cell Lead-Acid Batteries
In most applications of batteries the voltage of an individual cell is not enough to
provide the sufficient voltage and power supply The solution is usually to series
connect a number of cells in a battery in order to achieve a higher battery voltage
The electromotive force of a series of lead-acid battery cells is directly related to
the cell numbers as well as the charge state of each cell For a six-cell lead-acid
battery which is a standard for most common usages the fully charged
electromotive force is about 128V The internal resistance of a multi cell battery
however is also equal to the sum of the internal resistances of each cell
Usually all the cells in a multi-cell battery should be constructed in the same
manner and in particular the capacity should be consistent because the capacity of
a multi-cell battery will be limited to the cell with the lowest capacity If one of
the cells fails it is not possible for the current to flow through the cell and the
battery is therefore disconnected from its internal cell loss Also if the SOC of one
particular cell drops faster than others in a battery the electromotive force of that
cell may affect the whole behaviour of the battery
24 Summary
The technology development of lead-acid batteries has been continuous over the
30
last 150 years From the earliest open cell batteries different advanced battery
configurations are now available which have been adopted in a wide range of
applications Meanwhile a number of solutions have been developed to address
the battery problems encountered in applications such as electrolyte evaporation
spillage and the electrolysis of electrolyte when charging However there are still
issues affecting the efficient and safe use of lead-acid batteries for example
determination of the SOH which if addressed in a robust manner would lead to
significant improved battery management system performance This chapter has
presented the essential fundamental knowledge technology terms and working
principles of lead-acid batteries which is served as a preparation for further study
reported in the following chapters of the thesis
In order to reveal the dynamic behaviour of a battery under different SOH and
identify the suitable strategy for SOH determination the mathematical modelling
study is carried out and an equivalent circuit model is derived in the next chapter
The key concepts of the battery model are explained and the fundamental analysis
is given for the concepts introduced
31
Chapter 3
Equivalent Circuit Modelling
of Lead-acid Batteries
In order to estimate the status of a battery a model based approach is adopted in
the project A mathematical model for lead-acid batteries should be developed
with a suitable level of abstraction This chapter describes the requirements to the
model to serve the project objectives and reviews the available model
technologies An improved mathematical model for lead-acid batteries is
introduced in the late part of this chapter
31 Requirements for the Battery Model
The main objective of the project is to develop an algorithm that can determine
the battery health by monitoring the battery status during discharge cycles This
algorithm is designed for implementation in a battery health monitoring system
with life-time prediction capabilities This prediction system is intended to work
on applications where the battery performance is of great importance for instance
hospital UPS systems and vehicle ignition systems To achieve the objective the
requirements to the mathematical model can be defined as
Requirement 1 The model should be able to calculate the evolution of key
battery parameters including terminal voltage cell temperature the state of health
32
and the internal resistance which describe the condition of the battery for
dynamical discharging It should also be able to adequately represent dynamic
processes while the battery is discharging
Requirement 2 The complexity of the model must be sufficient to satisfy the
requirement 1 but must also be executable in real-time for a model-based
condition monitoring system
Requirement 3 The output of the battery model should be understandable to the
battery operators and technicians as well as meaningful to those who do not have
any background in battery technologies
32 Overview of Battery Model Techniques
A number of different types of battery models have been used to serve as a tool in
solving a range of problems (GONG 2005) These include Electrochemical
Models Computational Fluid Dynamics Models Finite Element Models and
Equivalent Circuit Models This section gives an overview to the above named
four different types of battery models and the problems which are addressed by
each of them In Section 324 every battery model technology is assessed against
the overall requirements
321 Electrochemical Model
Electrochemistry is a branch of chemistry that studies chemical reactions which
33
take place in a solution at the interface of an electron conductor (a metal or a
semiconductor) and an ionic conductor (the electrolyte) The reactions involve
electrons transfering between the electrode and the electrolyte or species in
solution The application of electrochemistry research directly leads to the
development of the lead-acid batteries
Behaviour of a battery depends not only on how the battery is used but also on a
number of construction factors (Ruetschi 2004) These factors include but are not
limited to the thickness of the plates the active mass density of the active
material the concentration of the acid solution and the geometry of the electrodes
(Berndt 2001 Ruetschi 2004)
The electrochemical model is mainly focused on the oxidationreduction reactions
between the electrolytes and the electrodes By analyzing the consistency of each
matter in the solution and the electrochemical reaction caused by the connection
of electrodes to external circuit it is possible to represent the dynamic behaviour
of the battery (Crompton 2000)
322 Physical Models
The finite element method is a numerical analysis technique for finding
approximate solutions of partial differential equations as well as of integral
equations The basic principle of the Finite Element Model (FEM) is to divide the
problem into elements and each element is a smaller problem to be solved so that
they could be analyzed separately The lsquoelementsrsquo are then be assembled together
34
to restore the initial problem
Finite element is a very popular method of analysis in those areas with a complex
geometry and it is good at stress and thermal analysis For batteries the Finite
Element Models can help with a good understanding of the heat loss and that for
vibration problem in mobile applications There are also attempts to analyze the
current density on the positive grid bar in a lead-acid battery using FEM (Ball
Evans et al 2002)
Computational Fluid Dynamics (CFD) technology is a well-established tool for
physical analysis and optimization of fluid flow mass and heat transfer and
related phenomena (eg chemical reactions) that may simultaneously take place in
a complex system (Liaw Gu et al 1997) Computers are used to perform millions
of calculations required to simulate the interactions of fluids and gases with the
complex surfaces used in engineering
In a CFD Model of a battery the dynamic governing equations are solved with
respect to time space and all the physical time and space dependent properties
Acid concentration and potential distribution across the cell for instance can be
obtained Therefore such a modelling is able to give a very good understanding to
battery parameters and detailed characteristic of battery dynamics
323 Equivalent Circuit Model
An equivalent circuit refers to the simplest form of a circuit that retains all of the
35
electrical characteristics of the original (and more complex) circuit In its most
common form an equivalent circuit is made up of linear passive elements
However more complex equivalent circuits are used to approximate nonlinear
behaviours of the original circuit as well
In electrical engineering it is often useful to use an equivalent circuit model to
describe the non-ideal operation of a device For electrical engineers electrical
models are intuitive useful and easy to handle especially when they can be used
in circuit simulators and alongside application circuits
324 Discussion of Different Battery Model Methods
The electrochemical model focuses on the electrochemical reactions and the
activities in the battery which is very popular in the applications for the
constructional and design purpose However many electrochemical factors
contained in the electrochemical model are irrelevant to the external circuit and
some of the important parameters like the internal resistance are hard to describe
in an electrochemical model Therefore this model technology is not able to meet
the project Requirement 1 As the calculations in the electrochemical model are
not complicated Requirement 2 can be therefore satisfied by an electrochemical
model of battery Requirement 3 might be difficult to obtain for an
electrochemical model because the understanding of the outputs for an
electrochemical model usually need some background knowledge of the battery
chemistry As a result the electrochemical model is not chosen for the project
36
Physical models can give good understanding to the battery important parameters
so that Requirement 1 of the project can be satisfied The Requirement 3 can be
also met as the terminal voltage can be calculated as the output with the
knowledge of these parameters One significant disadvantage is that the physical
models involves huge amount of calculation in analysis which is quite time
consuming In finite element or CFD methods a large nonlinear system of
equations is solved iteratively and that could take excessive CPU time especially
for when the system is more than 2 dimensions As a result the physical
modelling methods cannot meet the Requirement 2 of fast response required by
the project (Esfahanian Torabi et al 2008)
In an equivalent circuit model most of the characteristic required by the project
can be reached in a reasonable level It is able to reflect the dynamic behaviour of
battery using simple circuit blocks such as voltage sources resistors and
capacitors (Chen and Rincacuteon-Mora 2006) That is to say the Requirement 1 of
the project can be satisfied by the equivalent circuit model And the model
simplicity causes its low computational time as Requirement 2 and therefore it
can be suited to the online implementation (Esfahanian Torabi et al 2008)
Additionally basic battery parameters like internal resistance terminal voltage
and SOC etc can be chosen as the main output of the model to meet the
Requirement 3
Table 3-1 summarized a comparison of all the three model methods on the
satisfaction of the requirements for the project
37
Table 3-1 Satisfaction of the Requirements in different Model Methods
Requirement 1 Requirement 2 Requirement 3
Electrochemical Model times radic times
Physical Model radic times radic
Equivalent Circuit Model radic radic radic
33 Introduction of the Existing Equivalent
Circuit Models
Section 32 introduced three different types of battery models to serve for different
research purposes each with different features and strengths It has been shown
that the equivalent circuit model that pays attention to the relationship between the
internal circuit and the external characteristics can adequately meet all the
requirements of the project Therefore further studies of battery models have been
carried out and six equivalent circuit battery models with different merits and
complexity are presented while the technique improvements are briefly described
in this section
331 Simple Battery Model
The Simple Battery Model is the simplest battery model As shown in Figure 3-1
this model consists of only ideal battery mE as the electromotive force of a battery
and a resistor r in series connection as the internal resistance bV in the figure is
the terminal voltage of the battery
38
Figure 3-1 Simple Battery Model
The Em in Figure 3-1 stands for the electromotive force of the battery while r
represents the internal resistance and Vb is the Terminal Voltage This model is
only applicable in some circuits where the state of charge is of little importance
because it does not consider the varying characteristic of the internal resistance in
different states of charge The model is often used in circuits where the battery
does not have major influences to the circuit analysis But without being able to
describe the battery behaviours in details this model is not suitable for the
research purpose In the Simple Battery Model the electromotive force mE can be
obtained by open circuit measurement and r can be calculated by measurement
with connecting a load to the battery after taking an open circuit measurement
For a battery with a terminal voltage of 13V and the internal resistance of 05Ω
the change of terminal voltage in a Simple Battery Model as the discharge current
increases can be given as Figure 3-2
39
Terminal
Voltage
Discharge
Current
0
10V
13V
Figure 3-2 I-V chart of the Simple Battery Model
332 Advanced Simple Battery Model
This model is developed based on the Simple Battery Model and has the same
block diagram as the Simple Battery Model The only difference is that this model
employs a variable resistor which depends on the state of charge (CUN
FIORINA et al Durr Cruden et al 2006) The relationship between the value of
the variable resistance and the state of charge is as follow
aSOC
Rr 0
= (31)
where 0R is the resistance of the battery when it is fully charged
a is the capacity coefficient
SOC is the state of charge of battery from 0 (completely discharged) to 1
(fully charged)
6A
40
The most important improvement of this model is that instead of a constant
internal resistor the value of the internal resistance is expressed as equation
function of SOC For the same battery described in section 331 the I-V chart in
different SOCs can be concluded as shown in Figure 3-3
Terminal
Voltage
Discharge
Current
0
10V
13V
SOC=1
SOC=60
Figure 3-3 I-V Chart in different SOC
333 Thevenin Battery Model
The previous models do not account for any transient behaviour of batteries
Figure 3-4 shows the gradual change in battery characteristics when external loads
are connected or disconnected to the battery
6A
41
011
14
125
Terminal
Voltage
t
Figure 3-4 Sketch to show battery discharge behaviours in typical tests
Thevenin Battery Model is one commonly used model which consists of an ideal
battery electromotive force ( mE ) internal resistance (0R ) overvoltage resistance
(1R ) and capacitance (
1C ) and the equivalent circuit is shown in Figure 3-5
(Casacca and Salameh 1992 Salameh Casacca et al 1992 Chan and Sutanto
2000) 1C represents the actual capacitance of battery and
1R represents the
resistance contributed by the contact resistance of the plate and the electrolyte
(Durr Cruden et al 2006) The capacitance in the Thevenin Battery Model can
overcome the trend of terminal voltage shown in Figure 3-4
No load No load Load
42
Figure 3-5 Thevenin Battery Model
The main disadvantage of this Thevenin Battery Model is that all the parameter
values are assumed to be constant but in fact they are strongly dependent on the
state of charge and discharge rate and some other discharge characteristics
334 Dynamic Battery Model
This model is developed based on the Thevenin Battery Model Similar to the
improvements made by the Advanced Simple Model comparing with the Simple
Battery Model the most important difference is that it takes into account the non-
linear characteristic of the open circuit voltage and internal resistance represented
by SOCK (Jayne and Morgan 1986 Sims 1990)
ISOC
KRVV bocb )( +minus= (32)
where bV is the terminal voltage of battery
ocV is the open circuit voltage
bR is the battery terminal resistor typically 01Ω
43
K is the polarization constant
I is the discharge current
335 Fourth Order Dynamic Model
This is a more accurate and sophisticated model The current pI flows through
pR (electrolyte reaction) dR (Ohmic effect) and its associated leakage
capacitance dC and wR (waste of energy) and its associated leakage
capacitance wC Current sI flowing through the resistor sR represents the
behaviour of self discharge (Gillioli and Cerolo 1990 Chan and Sutanto 2000)
The main drawback of this model just as its name indicates is that there are
fourth order equations due to consideration of the paralleled R-C blocks in the
circuit and therefore it takes more time for the computation Another drawback is
that a number of empirical parameters are contained in the model
Figure 3-6 Fourth-order Battery Model
44
336 Improved Battery Model
The most popular Equivalent Circuit Model used by researchers is the Improved
Battery Model (Casacca and Salameh 1992 Salameh Casacca et al 1992) This
model is simple but meets most requirements for a good battery model It contains
most non-linear characteristics and is linked to the state of charge Most elements
included in this model are the functions of the state of charge or the open circuit
voltage which is also related to the state of charge The improved model is
studied in this chapter and implemented in MatlabSIMULINK environment
Figure 3-7 Improved Battery Model
34 Mathematical Model of the Lead-acid
Batteries
As the Improved Battery Model is able to reflect the major dynamic behaviours of
a battery and does not take much computation time it meets the requirements for
45
the project Therefore the mathematical model developed in this project is based
on the Improved Battery Model by involving the components of variable voltage
sources as the electromotive force ( EMF equal to the open circuit voltage OCV )
variable resistors as internal resistance and overvoltage resistance and a capacitor
as the capacitance of battery The description and the detailed analysis of the
model are given in this section
341 Capacity
Based on the Peukertrsquos law introduced in Chapter 2 the relationship of capacity
with different discharge currents is obtained below
2121
2211
)( ttII
tItIC
k
kk
p
=
== (33)
And following the definition of battery capacity the capacity is
12
1
2111
1
21121121121222 )()())(()( I
kkkk
I CIItIIItIIIIItIIItICminusminus
=====
12
1
21 )( I
k
I CIICminus
=there4 (34)
where Cp is the one ampere capacity
CI2 CI1 is the capacity under the discharge current I2 I1
k is a constant that related to the battery
The equation of calculating the capacity by the discharging current can be
46
obtained through experiments (Ceraolo 2000 Barsali and Ceraolo 2002) An
experimental result is given as
m
c
c
IIK
CKIC
))(1(1)( 0
0minus+
= (35)
where )(00 ICC = which stands for the capacity when discharging at the rated
discharge rate usually the nominal capacity C10
cK is empirical coefficient and is 118 for lead-acid batteries
m is empirical coefficient of 120
This equation overcomes the inadequacies of the Peukertrsquos law The capacity
calculated by the Peukertrsquos law in a low discharge current is much larger than that
experimentally obtained (Ceraolo 2000)
With the parameters of 20118124420 ==== kKAIAhC c the simulation
study indicated that the capacities of low discharge rate (lt30A) in different
equations are quite similar as shown in Figure 3-8
47
0 5 10 15 20 25 30 35 40 45 500
10
20
30
40
50
60
70
80
Discharge Current (A)
Actu
al C
apacity (
Ah)
Based on Peukerts law
Based on the Equation 35
Based on the Equation 35
Based on thePeukerts Law
Figure 3-8 Battery Capacity vs Discharge Current
Variations of the cell temperature also affect the battery capacity The effect of
temperature on the battery capacity is described by the following equation
(Ceraolo 2000 Barsali and Ceraolo 2002)
ε
θ
θθ
minus+=
f
ICIC 1)()( 0 (36)
where fθ is the electrolyte freezing temperature and is equal to -40˚C
θ is the cell temperature
)(0 IC is the capacity of battery under the discharge current I at 0˚C
ε is a constant that equals to 129
48
Therefore
m
c
f
c
IIK
CK
IC))(1(1
1
)(
0
minus+
+
=
ε
θ
θ
θ (37)
342 Electric Networks
Figure 3-9 (Ceraolo 2000 Barsali and Ceraolo 2002) shows an adaptation of
electric network based on the improved battery model shown in Figure 3-7 The
major change of this equivalent circuit is that the self-discharge is not taken into
account because the self discharge is usually less than 10 per month in modern
technologies which can be ignored in normal applications
Figure 3-9 Lead-acid Battery Equivalent Network
In the figure mE in this the main branch represents the electromotive force of the
battery and Vb stands for the terminal voltage The mZ in the figure stands for the
internal impedance that can be approximated by two R-C blocks
49
Battery is an energy storage device but not all the energy that the battery gets
from the charger can be stored when a battery is charged Part of this energy is
lost for different reasons like water electrolysis A parasitic branch is therefore
added to the model to represent the energy loss This part is claimed to work only
when the battery is being charged (Ceraolo 2000 Barsali and Ceraolo 2002) In
this project the current of the parasitic branch pI in the figure can be described as
an equation of the voltage of the parasitic branch PNV instead of a simple resistor
pR because of the nonlinear character of the parasitic branch This issue will be
discussed in later sections
As a result of these factors an equivalent electric network of in Figure 3-9 is
designed as shown in Figure 3-10 in which 1C 1R and 0R are the elements of the
internal impedance mZ It is used in the whole project as the electric network of
mathematical model
Figure 3-10 The Equivalent Network with the Approximated mZ
50
343 State of Charge and Depth of Discharge
In Chapter 2 Equations 27 and 28 show the definitions of SOC and DOC of a
battery In the model the nominal capacity can be treated as C(0θ) while the
actual capacity is C(Iavg θ) therefore
)0(1 θCQSOC eminus= (38)
)(1 θavge ICQDOC minus= (39)
where σσ dItQt
e int=0
)()( is the charge already drained from the battery
)0( θC is the nominal capacity of battery
)( θavgIC stands for the actual capacity under the specific discharge
current
344 Electromotive Force of the Battery
The electromotive force of a battery which is Em in Figure 3-10 is the difference
between the electric potential of the two electrodes and can be calculated by the
Nernstrsquos equation (Eq 26)
)(
)()(log029600412
2
2
24
10OH
SOHEMF
α
ααminus+
+=
This equation gives a description of the electromotive force by the activity of
different matter in the sulphuric acid which is described as lsquoαrsquo When the battery
51
is being charged or discharged the electrolyte concentration changes and the
activity value of H+ SO42- and H2O in the Nernstrsquos equation changes which can
be found by the study of battery that is the EMF of battery will change as the
result of the change of state of charge The relationship between SOC and the
activity α is unknown but it is obviously that when the state of charge increases
the quotient of )(
)()(
2
2
24
OH
SOH
α
ααminus+
also increases This shows that the EMF rises
when the state of charge is increasing
From the literatures (Ceraolo 2000 Barsali and Ceraolo 2002) the electromotive
force is described simply as the following equation
)1)(273(0 SOCKEE Emm minusminusminusminus++++minusminusminusminus==== θ (310)
where 0mE and EK are constants for a battery
θ is the temperature of the cell
SOC is the state of charge of the battery
345 Internal Resistance of a Battery
The resistances of a battery as shown in Figure 3-10 can be calculated by the
equations (Ceraolo 2000 Barsali and Ceraolo 2002)
)]1(1[ 0000 SOCARR minus+= (311)
)ln(101 DOCRR minus= (312)
52
)exp(1 22
)]1([
202
21
IIA
eRR
m
SOCA
+=
minus
(313)
where 0A 21A and 22A are constants for a battery while 00R 10R 20R are
parameters related to the SOH which will be discussed in later chapters For the
model 020 asympR and can be omitted when a battery is discharging
Therefore the internal resistance of a cell when discharging is
)ln()]1(1[ 1000010 DOCRSOCARRRr minusminus+=+= (314)
346 The Behaviour of Parasitic Branch
When the battery is being charged there are some losses as represented by the
parasitic current This current depends on the electrolyte temperature and the
voltage at the parasitic branch (Ceraolo 2000)
Because the behaviour of parasitic branch is non-linear Tafel gassing-current
relationship is used instead of a simple resistance pR (Ceraolo 2000)
minus+= )1(exp
0
0
f
p
P
PNPPNp A
V
VGVI
θ
θ (315)
where pI is the current of the parasitic branch
PNV is the voltage of the parasitic branch
53
0PG is a constant in seconds
0PV is a constant in volt
pA is a constant
θ is the electrolyte temperature
fθ is the electrolyte freezing temperature and is equal to -40˚C
When the battery is being discharged 0asymppI the parasitic branch could be
omitted from the model in simulation if the charging behaviour is not necessary
to discuss
347 Main Branch Capacitance
In the electric network of the model there is an R-C circuit as shown in Figure
3-11
Figure 3-11 R-C block
where Im is the discharge current
IC1 is the current flow through the capacity branch
54
I1 is the current of R1
VR1 is the voltage over the R-C block
This branch can be solved by
))(
()( 11111111
dt
tdVCIRIIRIRV R
mCmR minusminusminusminus====minusminusminusminus====sdotsdotsdotsdot==== (316)
)()()(
111
11 tIRtVdt
tdVCR mR
R====++++ (317)
This is the differential equation that represents the main branch behaviour
Laplace transform is employed to solve this problem
)()( 1111 sIRsVSCR mR sdotsdotsdotsdot====sdotsdotsdotsdotsdotsdotsdotsdotsdotsdotsdotsdot (318)
1
)(
11
11
++++
sdotsdotsdotsdot====
SCR
sIRV m
R (319)
++++
====++++
========
SCR
C
SCR
R
I
VsG R
11
1
11
11
1
1
1)( (320)
where τ=11CR is the time constant that represents the double layer capacitance
When the current has a shape like a step and the initial voltage of the capacitor is
equal zero the solution in time becomes
m
t
R IeRtV )1()( 11τ
minus
minus= (321)
55
It is obviously that this equation is the typical form of the voltage with an R-C
circuit
348 Thermal Behaviour of a Battery
When the battery is charging or discharging there is a current flow through the
battery so that it produces heat due to the Joules law
0
2
1
2
12 RIRVIVVIP RPNps sdot++sdot+sdot= (322)
When discharging the parasitic branch and R2 are omitted the equation becomes
0
2
1
2
1 RIRVP Rs sdot+= (323)
The dynamic equation of cell temperature and the power is (Ceraolo 2000)
s
a PRdt
dC +
minus=
θ
θ
θθθ (324)
where θC is the thermal capacitance
θR is the thermal resistance between the battery and the environment
θ is the cell temperature and aθ is the environment temperature
56
35 Mathematical Model of the Lead-acid
Batteries
Considering the behaviour of capacity state of charge and depth of discharge
electromotive force and internal resistance an Improved Battery Model based on
the equivalent circuit shown in Figure 3-10 was introduced in previous sections
The battery model for the complete discharging progress can be derived as the
following equations
m
c
f
c
IIK
CK
IC))(1(1
)1(
)(
0
minus+
+
=
ε
θ
θ
θ (325)
σσ dItQt
e int=0
)()( (326)
)0(1 θCQSOC eminusminusminusminus==== (327)
)(1 θavge ICQDOC minusminusminusminus==== (328)
)1)(273(0 SOCKEE Emm minus+minus= θ (329)
)]1(1[ 0000 SOCARR minus+= (330)
)ln(101 DOCRR minus= (331)
1
1R
Cτ
= (332)
IeRtV
t
R sdotminussdot=minus
)1()( 11τ (333)
0
2
1
2
1 RIRVP Rs sdot+= (334)
57
sa P
Rdt
dC +
minus=
θ
θ
θθθ
(335)
)( θIC in the equations is the expression of capacity of battery when discharging
under the discharge current I and at a temperature of θ 0C stands for the
capacitance when discharging at the rated discharge current I while parameters
fθ and ε are constants in this model )(tQe represents the charge already
consumed while the equation of mE indicates the mathematical description of
electromotive force corresponding to the SOC and the cell temperature in which
0mE EK are constants for a battery 00R 10R are parameters related to the SOH
and the discharge current can also affect them τ in the equations are the time
constant of the R-C circuit which represents the time it takes the systems step
response to reach ( 6311 asympminus e ) of its asymptotic value The last two equations
represent the thermal dynamic of battery in which sP is the Joule heat generated
by the internal resistance θC is the thermal capacitance and θR is the thermal
resistance between the battery and the environment
36 Summary and Discussion
The Improved Battery Model based on the electric equivalent circuit is presented
in this chapter and it is proved that it can satisfy all the three requirements to serve
the project objectives This battery model consists of a variable voltage source
several R-C blocks and a parasitic branch as its electric network and the elements
are described as a variable related to the capacitance the charge consumption and
58
the cell temperature as well
However experimental tests show that the behaviour of the battery is much more
complicated can be represented by this equivalent circuit model For example the
internal resistance varies when discharging under different current and the time
constant of the R-C circuit at the beginning and end of discharge as well
Therefore the model has to be improved The next chapter overcomes these
problems found in the experimental tests and some improvements of the model
are described
59
Chapter 4
Experimental System Set up and
Improved Battery Model
Simulation Implementation
Experimental tests based on a 12V-13 Ah lead-acid battery are carried out and the
test system is introduced at the beginning of this chapter Some of the
characteristics of the battery can be found in the tests which has shown that the
battery model described previously is not accurate enough and improvements
have to be implemented into the model This chapter will focus on the analysis of
the battery characteristics and the description of the improvements implemented
In the last part of this chapter a finalised version of the battery model used in this
project is given and implemented in the MatlabSIMULINK environment for
simulation study
41 The Experimental System
In this experimental test system a variable resistor is used as the load of the
battery Three sensors are employed in the whole experiment process two current
sensors and one voltage sensor The equivalent circuit of the test rig designed for
the research purpose is shown in Figure 4-1
60
Figure 4-1 Equivalent Circuit of the Experimental Test Rig
In this figure the ideal voltage source EMF accompanying with the internal
resistance r acts as a lead-acid battery with 6 cells (12V) the terminals of the
battery are connected in parallel to a voltage sensor Switch Krsquo is employed to
control the voltage sensor connection so that the sensor can be disconnected from
the battery when the experiment is not being in progress to avoid an unnecessary
discharge The circuit break in Figure 4-1 can be used as a main controller which
decides whether the load is engaged to the battery to discharge or not Switch K
in the experiment is to vary the load of the system This experimental test system
is mainly designed for two different experimental tests of a battery in this study
constant-impedance load discharge and two-load discharge Figure 4-2 shows the
actual laboratory test rig used in the project
61
Figure 4-2 Experimental Test Rig
The data is collected and recorded every half second by a data acquisition card
PCI-6251 from National Instruments with the software environment of LabVIEW
and a 12V-13Ah lead-acid battery (marked in the red-dashed square in Figure 4-2)
is employed in the project as test batteries for the battery performance study
42 Improvements of the Battery Model
Figure 4-3 and Figure 4-4 show the typical data collected from the experimental
test rig Figure 4-3 is the result of a constant-impedance load discharge test with a
discharge current of 075A approximately and Figure 4-4 shows two-load
discharge with the discharge currents of 075A and 12A respectively
62
0 500 1000 1500 2000 2500 3000 3500 4000 4500 5000-02
0
02
04
06
08
1
12
Time (s)
Dis
charg
e C
urr
ent
(A)
0 500 1000 1500 2000 2500 3000 3500 4000 4500 5000105
11
115
12
125
13
Time (s)
Term
inal V
oltage (
V)
Figure 4-3 Test of constant-impedance load discharge top figure shows the discharge current of the experimental test and the bottom one shows the terminal
voltage 1τ is the time parameter of the R-C block at the beginning of the
discharge and 2τ is that when the discharge stopped
0 200 400 600 800 1000 1200 1400
0
05
1
15
Time (s)
Dis
charg
e C
urr
ent
(A)
0 200 400 600 800 1000 1200 1400118
12
122
124
126
128
Time (s)
Term
inal V
oltage (
V)
Figure 4-4 Test of two-load discharge top figure shows the discharge current of the experimental test and the bottom one shows the terminal voltage
I(t)RI1 and I(t)RI2 represent the voltage drop across the internal resistance value under different discharge current
1τ 2τ
I(t)RI1
I(t)RI2
I(t)RI1
63
421 The Change of τ in Different Charge Status
From analyzing these figures it is easy to find that it takes quite a long time for
the battery to have the steady terminal voltage when the discharge of battery stops
and it is longer than the time taken from the beginning of the discharge This
difference means that when the battery starts to discharge the time parameter
11CR=τ in the main branch equation (332) is not equal to that when the
discharge has just stopped In Figure 4-3 it is shown that when the discharge stops
the time parameterτ is longer than that when the discharge starts
As a result of this experimental feature a switch is employed to implement the
change of time parameter to match those described in the mathematical model of
the battery The switch is used to control the value of the time parameter τ in
different discharge currents When the battery is discharging the discharge current
is a positive value and the time parameter τ is equal to 1τ When the battery is
not discharging the discharge current is equal to 0 in theory and the time
parameter has a different value 2τ
Although the discharge current should be equal to 0 theoretically it is hard to
achieve this in the real experimental measurement because of the inaccuracy of
the current sensor reading due to the inaccuracy occurred in the power supply to
the sensor Therefore the trigger of the switch in the model is set to be 01 A that
is when the discharge current is greater than 01 A the time parameter is set to be
1τ as the battery is in its discharging segment By contrast the value of time
64
parameter is set to be 2τ and the discharge current is considered as the error
caused by the sensors when that current is less than 01 A
422 Analysis in Variations of the Internal Resistance
Another important issue found through analyzing the experimental test result is
that the internal resistance for a specific battery in a specific state of health (SOH)
is not a constant when the discharging current changes This difference is more
significant than the effect caused by the state of charge
For example in the two-load discharge results shown in Figure 4-4 when the
battery is not discharging the initial voltage is equal to the electromotive force
(EMF1) When the battery began to discharge at the discharge current I1 the
terminal voltage dropped to V1 After the discharge stopped for a while the value
of the terminal voltage is equal to the electromotive force (EMF2) at that state of
charge (SOC2) Then the discharge of the battery starts again at a current of I2 and
the terminal voltage dropped to V2 The discharge progress is then stopped for
certain of a time period to get the steady terminal voltage (EMF3) at that state of
charge (SOC3) After that the test of discharge at the I3 = I1 was repeated again
and get another terminal voltage of V3 The last discharge test is done to provide
the evidence for the fact that this change in the internal resistance is not caused by
the change of the state of charge (SOC)
The value of electromotive force in a discharging battery is equal to the sum of the
terminal voltage and the voltage that the internal resistance takes that is
65
nnnn IrVEMF sdot+=
Therefore the internal resistance can be calculated by
n
nnn
I
VEMFr
minus= (41)
From the data collected in the experiment the key parameter values for the graphs
shown in Figure 4-4 can be found as listed in Table 4-1
Table 4-1 Approximate Internal Resistance Calculating
n 1 2 3
Electromotive Force (EMFn) 1260V 1252V 1238V
Discharge Current (In) 078A 114A 076A
Terminal Voltage (Vn) 1219V 1203V 1197V
Substituting these values into Equation 41 the internal resistance can be
calculated Ω=Ω=Ω= 539043005260 321 rrr
This change of the internal resistance can cause quite a significant effect in the
discharge progress This problem can be possibly solved in a number of ways
One possible choice is to find a curve of the internal resistance change and the
discharge current for a specific battery after a certain numbers of experimental
tests But this method needs huge efforts in conducting experimental tests and the
result is not very meaningful for the project considering the time cost Another
possibility is to conduct the experimental tests with a constant load Therefore the
change of internal resistance caused by the change of discharge current could be
ignored As a result in the whole process of this project the same load is
66
employed either in the constant-impedance load discharge or in the two-load
discharge tests
In order to implement the different internal resistance value when discharging
under different load a switch that can control the parameters R00 and R10 is
employed This switch is controlled by the discharge current which is the main
input of the mathematical model In the two-load discharge tests when the switch
K in Figure 4-1 is switched off there is only one load is connected to the battery
terminals and the discharge current is lower the values of R00 and R10 are
switched to the first set of parameters R001 and R101 To the contrast when K is
switched on the discharge current is higher and the values are switched to the
second set R002 and R102
423 Improved Lead-Acid Battery Mathematical Model
From the model described in Chapter 3 and the improvements studied in this
chapter the mathematical model of lead-acid battery when discharging in different
discharge currents can be described as the following equations
m
c
f
c
IIK
CK
IC))(1(1
)1(
)(
0
minus+
+
=
ε
θ
θ
θ (42)
ττ dItQt
e int=0
)()( (43)
)0(1 θCQSOC eminusminusminusminus==== (44)
)(1 θavge ICQDOC minusminusminusminus==== (45)
67
)1)(273(0 SOCKEE Emm minusminusminusminus++++minusminusminusminus==== θ (46)
)]1(1[ 0000 SOCARR minusminusminusminus++++==== (47)
)ln(101 DOCRR minusminusminusminus==== (48)
11
RC
τ= (49)
IeRtV
t
R sdotminussdot=minus
)1()( 11τ (410)
RIRVP Rs sdot+=2
12
1 (411)
sa P
Rdt
dC +
minus=
θ
θ
θθθ
(412)
)(
)(
2
1
002
001
00Load
Load
R
RR
= (413)
)(
)(
2
1
102
101
10Load
Load
R
RR
= (414)
)10(
)10(
2
1
AI
AI
lt
gt
=τ
ττ (415)
001R 002R 101R 202R and 1τ 2τ in the equations stand for different parameter
values of 10R 20R and τ when the load and charge status changes in order to
reflect the improvements described in this chapter For a two-load discharge test
there are ten important unknown parameters in the equations of the mathematical
model which are unknown for a specific battery 0C 0mE EK 001R 002R 101R
102R 1τ 2τ and 0A As the internal resistance R00 and R10 vary only when the
load changes they can be treated as constants in the constant-impedance load
68
discharge tests the key parameters are therefore 21100000 ττRRKEC Em
and 0A In this project the study of state of health is based on constant-impedance
load discharge The identification of these unknown parameters will be discussed
in Chapter 5
43 Simulation Study
The processes described above have been implemented in SIMULINK as a
simulation model for computer based analysis The simulation program consists of
two main function blocks circuit block and thermal block The structure of the
SIMULINK implementation is described in Figure 4-5
69
Figure 4-5 Structure of model for SIMULINK Implementation
70
As shown in the figure there are mainly two inputs in the model the discharge
current and the discharge time The actual capacity of battery can be then
calculated with the knowledge of rated capacity and the discharge current The
actual capacity is also influenced by the cell temperature At the beginning of
discharge the cell temperature is the same as the surrounding temperature
Integrating the discharge current with respect to time is the capacity consumed in
the discharge progress and then the state of charge and the depth of charge can be
obtained It is shown that the electromotive force and the internal resistance vary
as a result of changing in the state of charge and the depth of charge and the
terminal voltage can be calculated
In the thermal block of the model the heat generated by the current and the
internal resistance are calculated by the Joules law Then this energy is
transferred to calculate the thermal temperature of the cell and the cell
temperature is given back to the circuit block to affect the actual capacity
71
0 1000 2000 3000 4000 5000 6000 7000
0
02
04
06
08
1
Time (s)
Dis
charg
e C
urr
ent
(A)
0 1000 2000 3000 4000 5000 6000 7000105
11
115
12
125
13
Time (s)
Term
inal V
oltage (
V)
Figure 4-6 Terminal Voltage of Battery (Constant Discharge Current SIMULINK)
The result in Figure 4-6 shows the terminal voltage of a battery which discharges
under the current of 08A in a simulation study Since the discharge begins the
voltage drops due to the internal resistance and the change of state of charge (SOC)
and it climbs up when the discharge stops However the voltage changes
gradually because of the time parameter τ This result shows a good qualitative
agreement with the experimental test results
72
44 Summary and Discussion
This chapter introduces the laboratory test system designed for the project and the
limitation of the mathematical model described in Chapter 3 Switches on the time
parameter τ and the internal resistance parameters R00 and R10 have been added to
the model so that the model is able to represent the change of these parameters
found in the experimental tests The implementation of the model under the
MatlabSIMULINK environment is described and the simulation study shows a
good qualitative agreement with the experimental test results
The next chapter will focus on the identification of those unknown parameters of
the battery model that are important for revealing the battery characteristics
including 20100000 τARRKEC Em and 1τ
73
Chapter 5
Model Parameter Identification
and Model Validation
The identification of the unknown parameters 20100000 τARRKEC Em and 1τ
in the mathematical model will be introduced in this chapter
51 Need for the Optimization Algorithms
In those equations of the battery model described previously some parameters are
unknown and some of them are difficult to derive from physics or engineering
principles or to be obtained through experimental tests Therefore the
identification of the model unknown parameters becomes an important part for the
project Parameter identification is an optimization process that adjusts the
parameters to enable the simulation results to show the best agreement with the
results acquired by the experimental tests There are many algorithms available
for optimization and the principle of the optimization process for the project is to
minimize the objective function The objective function is formed by the absolute
value of the difference between the simulated and experimental results at each
time point The set of parameters to achieve the least value of the objective
function is considered to be the fittest set
74
There are two basic requirements of the optimization in this project First of all as
the problem for the solutions trapped to the local minima is a very important and
challenging issue in many linear optimization solvers the optimization algorithm
used in this project must be able to find the global minimum Secondly the
optimization algorithm not only should find the minimum value of the objective
function but also can tell the values of the parameters that result in the best fitness
which is needed for the analysis purpose in this project Finally the time cost is
also an important factor in selection of a suitable optimization algorithm
It needs to point that the objective here is to identify the unknown parameters of a
model with an already known structure If the objective is to identify or
approximate unknown model structures the selection of optimisation methods
will be quite different In the case of latter Neural Network Genetic
Programming and Fuzzy Logical will be more suitable choices To concentrate on
the objective of the project the thesis will focus on optimisation algorithms for
parameter identification
52 Overview of the Optimization Algorithms
Brute-force search is the most basic direct search algorithm that is used to find the
minimum value In the brute-force search the initial guess is the minimum
possibility of parameters and increasesdecreases The parameter
increasesdecreases step by step in each iteration and the best solution can be
75
searched This algorithm is the simplest but its disadvantage is also obvious that
is it is the slowest optimization method especially when used in the identification
of more than two parameters and the results are largely dependent on the initial
guesses
Linear search is an optimization method to solve the linear optimization problem
the preference function of which is linear and the feasible domain is defined by a
linear constraint function The linear constraints define a convex polyhedron
geometrically which is called the feasible region The algorithm is to construct an
admission solution at a vertex of the polyhedron and then along edges of the
polyhedron to vertices with successively higher values of the objective function
until the optimum is reached
Besides the basic optimization methods evolution computation technology is
becoming increasingly popular A range of different evolution computation
technologies can solve the optimization problem in this project including genetic
algorithms (GAs) particle swarm optimization (PSO)
Genetic Algorithms are direct search algorithms inspired from the process of
evolution in nature the natural selection Based on the principle of survival of the
fittest the GAs can produce better and better approximations to the global optimal
solution in a number of generations In each generation a new group of solutions
is created by the fitness level in the problem of every individual in the last
generation The solutions are then bred together to lead to the evolution of
individuals
76
Particle swarm optimization is a stochastic population-based computer algorithm
modelled on swarm intelligence that searches for a solution to an optimization
problem in a search space Based on the social psychological principles each
individual called lsquoparticlersquo in PSO is able to provide information to others and
also learn the success from the local best and the global best The movement of
each particle through the search space are guided by these successes and the
solution can be found after a number of generations
It has been proved by Dr Jianlin in his PhD Thesis (Wei 2007) that both Genetic
Algorithm and Particle Swarm optimization are capable of the model parameter
identification But the Particle Swarm optimization is a new algorithm that first
described in 1995 and it is not as common as Genetic Algorithm in the research
areas
The purpose of this research work is to find a method for parameter estimation
Genetic algorithms are well proven solution for complicated optimisation
problems and have been applied successfully in a range of similar problems (Wei
2007 Wei Wang et al 2007) Genetic algorithms are also well suited to problems
with many local minima In the current work the exact form of the fitness
function is unknown and it is therefore important to select a robust technique
which can identify good overall solutions For these reasons GA was selected to
give the best possible chance of satisfying the overall project objectives within the
limited timeframe of the project
77
53 The Study of the Genetic Algorithms
The process of Genetic Algorithm is reviewed in this section to provide an insight
into how GAs work and simulation study of two bench mark functions are carried
out
531 Working Principle of GAs
There are many methods used to implement a GA process and usually a GA is at
least composed of three common genetic operators Selection Crossover and
Mutation (Pham and Karaboga 1998) The flowchart of a simple GA process is
given in Figure 5-1
As a preparation to start the optimization process a GA requires a group of initial
solutions as the first generation The first generation is usually a group of
randomly produced solutions created by a random number generator The
population which is the number of individuals in a generation should be big
enough so that there could be a reasonable amount of genetic diversity in the
population Also it should be small enough for each generation to be computed in
a reasonable period of time using the computer resources available Typically a
population includes individuals between 20 and 100 (Chipperfield Fleming et al
1994A)
78
Figure 5-1 Flowchart of a Simple Genetic Algorithm (Pham and Karaboga 1998)
The fitness function is evaluated to measure how close that the individuals fit the
desired result A fitness function could be either complex or simple depending on
the optimization problem addressed In a case of minimization problem the most
fitted individuals will have the lowest numerical value of the associated fitness
function
No
Yes
Selection
Crossover
Mutation
Find the Best Individual
Generate initial population
Results
Evaluate fitness values
Operators of generating new
generation
Gengt 100
Evaluation
Start
79
Individuals are selected according to a fitness-based process The operator of
selection is made up of ranking and selection progress by which more copies of
the individuals that fit the optimization problem better will be produced in the
next generation In GAs there are mainly two ways to select a new population
Roulette Wheel Selection (RWS) and Stochastic Universal Sampling (SUS)
The individuals will be recombined (crossover) after the selection This operation
is to produce two new individuals from two existing individuals selected by the
operator of selection by cutting them at one or more position and exchanging the
parts following the cut The new individuals therefore can inherit some parts of
both parentsrsquo genetic material There are usually four ways of doing this one-
point crossover two-point crossover cycle crossover and uniform crossover
(Pham and Karaboga 1998) Figure 5-2 (a) shows an example of the two-point
crossover progress
Mutation is another operator to produce new individuals The difference is that the
new individual is produced from a single old one In this operation the bit values
of each individual are randomly reversed according to a specified property A
mutation can also helps the GA to avoid local optimums and find the global best
solution Figure 5-2 (b) represents how the mutation operator works
80
Figure 5-2 (a) Crossover operation (b) Mutation operation
The group of individuals produced after the mutation is the second generation
Then the fitness value of each individual in the second generation is computed
again This cycle will not stop until the result is close enough or after a certain
generation
Three major Matlab toolboxes are applied in the current market for application
purpose they are Genetic Algorithms Toolbox V12 (Chipperfield Fleming et al
1994B) the Genetic Algorithms Optimization Toolbox V11 (Houck Joines et al
1995) Genetic Algorithm Direct Search Toolbox V102 (MathWorks Inc 2004)
In this project the official toolbox in Matlab form Mathworks Inc is employed
The property settings for the project based on Dr Weirsquos thesis (Wei 2007) are
shown in Table 5-1
Parent 1 1 1 0 0 1 0 1 1 0 1 0 1 1
Parent 2 0 1 1 0 1 1 0 0 1 0 1 0 0
Offspring 1 1 1 0 0 1 1 0 0 1 1 0 1 1
Offspring 2 0 1 1 0 1 0 1 1 0 0 1 0 0
(a)
Parent 1 1 0 0 1 1 0 0 1 1 0 1 1
Offspring 1 1 0 0 1 0 0 0 1 1 0 1 1
(b)
81
Table 5-1 The property settings for Genetic Algorithms
Name of the GA properties Value of the GA properties
Number of generations 100
Population size 20
Fitness assignment Rank-base fitness assignment
Selection Stochastic universal sampling
Crossover Scattered crossover
Crossover rate 07
Mutation function Uniform mutation
Mutation rate 01
Population size specifies how many individuals there are in each generation With
a large population size the genetic algorithm searches the solution space more
thoroughly and the gives more possibility to return the global minimum The
number of generations specifies the maximum number of iterations for the genetic
algorithm to perform If this number is too low the genetic algorithm is not able
convergence to the global solution However either a large population size or a
large number of generations can cause the algorithm to run more slowly The
crossover rate and the mutation rate are properties that control the crossover and
mutation operator High rate of these values means that the genetic algorithm has
a higher opportunity of producing new offspring but it can be easy to miss the
current best solution if these values are too big
Initial tests of genetic algorithms on different properties show that the values
shown in table 5-1 are able to find an adequate solution Similar results would be
82
obtained if the values of the generations and the population size are larger but
costing more CPU time The crossover rate and the mutation rate would not affect
the result significantly if only varies in a small range But it is impossible to prove
that these two values are the best choice due to the strong randomness
532 Simulation Studies of Genetic Algorithms
In order to test and demonstrate that Genetic Algorithms are able to meet the
requirements of the project simulation studies have been carried out Two
benchmark functions that are commonly used in evaluating evolutionary
computation algorithms are employed for the simulation studies They are
1) Rastrigin function
Rastrigin function is a typical example of non-linear multimodal function with
many local minima The problem of looking for the global minimum is quite
difficult due to its large search space and its large number of local minima The
function is shown as
))2cos(10(10)(1
2sum=
sdotsdotminus+sdot=
n
i
ii xxnXf πr
where n is the dimension of the problem and 1x ~ nx are the coefficients to be
identified Figure 5-2 shows a 2-dimensional Rastriginrsquos function while figure 5-3
is a contour plot of Rastrigins function shows the alternating maxima and minima
83
The global minimum of the Rastriginrsquos function is 0)( =Xfr
when
021 ==== nxxx L
Figure 5-2 2-dimensional Rastrigins function (MathWorks Inc 2004)
84
Figure 5-3 Contour plot of Rastrigins function (MathWorks Inc 2004)
In the simulation study a ten dimensional Rastriginrsquos function is adopted Figure
5-4 shows the best optimization performance of the Rastriginrsquos function in each
generation It is shown that after 700 generations a global optimal value is
obtained
85
0 100 200 300 400 500 600 700 800 900 10000
10
20
30
40
50
60
70
80Best 00099429
Generation
Fitness v
alu
e
Best f itness
Figure 5-4 GA performance (Rastrigrinrsquos function)
2) Rosenbrock function
Rosenbrock function is another mathematical function used as a test problem for
optimization algorithms The global minimum is inside a long narrow parabolic
shaped flat valley To find the valley is trivial but to converge to the global
minimum is difficult The Rosenbrock function is defined by
sum=
+ minus+minus=
n
i
iii xxxXf
1
2221 ))1()(100()(
r
where n is the dimension of the problem and 1x ~ nx are the coefficients to be
identified Figure 5-5 shows a 2-dimensional Rosenbrock function
86
The global minimum of the Rosenbrock function is 0)( =Xfr
when
121 ==== nxxx L The same as the Rastriginrsquos function a ten dimensional
Rosenbrock function is adopted for the simulation study Figure 5-6 is the GA
performance to the Rosenbrock function It can be found that the optimization
converges and get the global optimal value after 300 generations
Figure 5-5 2-dimensional Rosenbrock function (MathWorks Inc 2004)
87
0 100 200 300 400 500 600 700 800 900 10000
200
400
600
800
1000
1200Best 060113
Generation
Fitness v
alu
e
Best fitness
Figure 5-6 GA performance (Rosenbrock function)
54 Model Parameter Identification
541 Implementation of Genetic Algorithms and
Experimental Data sets
In this project the Genetic Algorithm Direct Search Toolbox V102 developed by
Mathworks Inc is employed to identify the parameters of the battery model The
process is shown in Figure 5-7
88
Figure 5-7 Progress of Parameter Identification
The fitness function is used in the project and the parameter identification is to
minimize the fitness function so that the model output can fit the experimental
result The fitness function is given as
sum
sum sumsum
minussdot=
minussdot++minussdot+minussdot=
minus
1
0
2
1 1
1
0
))()(()(
)()()(
exp
expexp2exp1
t
t
sim
t
t
t
t
simnsim
t
t
sim
tVtVabstW
VVabsWVVabsWVVabsWfitnessn
n
L
where Vexp is the experimental terminal voltage data
Vsim is the simulated terminal voltage
Wt is the weights of the difference in the simulated and experimental
results
This fitness function represents the sum of the error values at each time interval
Mathematical Model of a six-cell
Lead Acid Battery
Experimental Test
Results
Fitness
Function
Discharge Current
Simulation
Output
Terminal Voltage
Simulation
Input
lt fmin
Genetic Algorithms (Selection Crossover and Mutation
etc)
Parameter Update
Yes
No
Stop
89
considered ( ntt minus0 ) The weight coefficients Wt indicates how important the
weighted part is in the optimization and how much it contribute to the
optimisation process Periods with bigger tW values are more important because
the sum of errors will give big value contribution to the fitness function value and
the optimisation process will pay more attention to the higher weighted error parts
In the experiments and optimization process it is found that the results were more
important when the discharge of a battery at the stage of stopping Therefore the
weight in this period is greater than that of the others The weighting coefficient
values in this project are determined by the results of the first several attempts of
parameter identification The period of simulation data that fails to fit the test
result means that the weight value is not big enough until the overall performance
of simulation is reasonable
Following the objective fitness function unknown coefficients of the battery
model are identified using experimental data The mathematical model of a six-
cell lead-acid battery in the figure is described in Chapter 4 and the parameters are
to be identified by Genetic Algorithms are 210100000 ττARRKEC Em
Three sets of experimental tests have been carried out for the purpose of
parameter identification and the validation of the mathematical model These three
experimental results are based on a lead-acid battery with the ideal capacity of 13
Ampere-hours under the discharge current of 08A
90
542 Parameters of Battery Model
The parameters of the mathematical model of a lead-acid battery are identified
using Genetic Algorithms and the predicted battery responses using the identified
parameters are compared with the simulated results One set of typical values of
parameters identified are listed in Table 5-2
Table 5-2 Identified parameters identified by the Genetic
Algorithms in the model of 12V-13Ah lead-acid battery Parameter Value Parameter Value
0C 48198 (Amp-Sec) 0mE 21465 (V)
EK 0001109 (V) 0A 29895
00R 001038 (Ohm) 10R 012196 (Ohm)
1τ 21052 (s) 2τ 17565 (s)
Figure 5-8 shows the simulation results using the Improved Battery Model and the
change of weights defined for this set of result described in the fitness function
The top subplot of Figure 5-8 shows the weight value of the GA fitness function
described before while the middle figure is the discharge current of the
experimental test which is also the input of the mathematical model In the
following test results in this and next chapter the changes of weight value are
similar so they are not shown in the figures
The blue line marked as ldquoExperimental Terminal Voltagerdquo in the bottom figure
represents the measured outputs while the other one (Simulated Terminal Voltage)
represents the simulation results The simulation results are ldquonoisyrdquo because
experimental discharge current is used as the input of model in the simulation
91
progress It is obviously that Figure 5-8 shows a good overall agreement of the
results although some slope when discharging is not perfect
0 500 1000 1500 2000 2500 3000 3500
1
15
Time (s)
Weig
ht
0 500 1000 1500 2000 2500 3000 3500114
116
118
12
122
124
126
128
13
Time (s)
Term
inal V
oltage (
V)
Experimental Terminal Voltage
Simulated Terminal Voltage
0 500 1000 1500 2000 2500 3000 3500
0
05
1
Time (s)
Dis
charg
e C
urr
ent
Simulated Terminal Voltage
Experimental Terminal Voltage
Figure 5-8 Measured and Simulated Result after Parameter Identification
Figure 5-9 shows the mean fitness value and the best in each generation It can be
seen that the best fitness in each generation is decreasing The mean fitness is
unstable because of the mutation operator in the GA that can attempt to find better
solutions
92
0 10 20 30 40 50 60 70 80 90 100100
150
200
250
300
350
400
450
500
550
Generation
Fitness v
alu
e
Best 1075521 Mean 1312731
Best f itness
Mean fitness
Figure 5-9 Mean and the Best Fitness Values in Each Generation
543 Battery Model Validation
In order to validate the battery mathematical model two sets of experimental tests
have been adopted to compare with the simulation results
The inputs of the discharge current and the validation results using two
experimental tests are shown in Figure 5-10 and Figure 5-11
93
0 500 1000 1500 2000 2500 3000114
116
118
12
122
124
126
128
13
Time (s)
Term
inal V
oltage (
V)
Simulated Terminal Voltage
Experimental Terminal Voltage
Simulated Terminal Voltage
Experimental Terminal Voltage
Figure 5-10 Measured and Simulated Terminal Voltage (Validation data 1)
In the simulation that shows in Figure 5-10 the discharge of battery begins at the
time of 700s and the simulation result shows a reasonable agreement with the
experimental result despite the noise of signal caused by the error of the sensors
It is noticed that at the beginning of the discharge there is a difference between
the simulated and experimental terminal voltages for about 100 seconds This
difference is studied and so called lsquocoup de fouetrsquo which often takes place at the
beginning of a discharge test when the SOC of battery is high (Perrin Delaille et
al 2006) However this lsquocoup de fouetrsquo behaviour cannot be described in this
model The discharge period lasts for about 1200 seconds and then stops and after
that the simulation has the similar result with the experiment
94
0 1000 2000 3000 4000 5000 600011
112
114
116
118
12
122
124
126
128
13
Time (s)
Term
inal V
oltage (
V)
Simulated Terminal Voltage
Experimental Terminal Voltage
Simulated Terminal Voltage
Experiment Terminal Voltage
Figure 5-11 Measured and Simulated Terminal Voltage (Validation data 2)
Figure 5-11 shows another group of experimental test to validate the battery
model At the beginning of the experiment the terminal voltage from the
experiment is dropping without any discharge behaviour of battery and that is
because of the experiment was carried out when the terminal voltage of lead-acid
battery is not steady enough after being charged and that also causes the
deviations in the discharge at about 1000-2000 seconds In this period the lsquocoup
de fouetrsquo appears again After the first period the battery is disconnected from the
load until the terminal voltage become steady and the simulation result in this
period fits the experiment result well In the second discharge of this test it is
shown that the lsquocoup de fouetrsquo does not occur because the SOC is not high For
the similar reason in the first discharge in this group of the test results there are
95
also some deviations in this period Finally the simulation result in the last part of
figure fits the experimental result is highly satisfied
The average error of the simulated outputs of the simulation studies and the
measured results are studied Absolute Error and Relative Error is defined as the
following equations
sum
sum
=
=
minus=
minus=
N
i
sim
N
i
sim
iV
iViV
NRelError
iViVN
AbsError
1 exp
exp
1
exp
)(
)()(1
)()(1
The absolute error and relative error are summarised in Table 5-3
Table 5-3 AbsError and RelError of Model Validation
Absolute Error Relative Error discharging relaxing overall discharging relaxing overall
Experimental Test 1 (Identification)
00229V 00207V 00217V 01833 01724 01776
Experimental Test 2 (Validation data 1)
00536V 00484V 00492V 04453 03872 04024
Experimental Test 1 (Validation data 2)
00724V 00372V 00485V 06352 03013 05025
55 Summary and Discussions
Identification of the unknown model parameters is discussed in this chapter and a
range of possibly suitable methods are reviewed in brief In this project Genetic
Algorithm is adopted GAs working principle and its implementation has been
96
introduced in details in this chapter The simulation study of two benchmark
functions that are commonly used in evaluating evolutionary computation
algorithms are employed in order to show the capability of GAs The parameter
identification by tests of a brand new 13Ah lead-acid battery is carried out and is
validated by two sets of other experimental test results under the same working
condition of the same battery
97
Chapter 6
The Analysis of State of Health
(SOH) in association with the
Internal Resistance
61 Methodology
As the number of discharge cycles of battery increases in applications the
maximum charges that a battery can offer will decrease In other words the SOH
battery is deteriorating But this drop of capacity is not linear and it is also a long
progress At the beginning of the use of battery the change of capacity is very
slow and it is not obvious After a number of cycles of discharge and charge this
change will get faster and relatively significant
There are no reliable methods now to calculate the remaining charge capacity
which is the only one determinant of the state of health The normal method is
simply to measure the voltage on its terminals But this measurement is not
accurate on an aged battery A battery in poor state of health but sufficiently
charged can also offer sufficient voltage to appear normal The only way to
determine the capacity accurately is to integrate the discharge current of battery in
a full deep discharge but this method cannot be used too frequently because deep
98
discharge is harmful for the battery
In the project six lead-acid batteries were tested using the test system described in
Chapter 4 These batteries were repeatedly discharged and charged for their whole
life time so that the information related to different state of health can be revealed
as soon as possible Even though the batteries works frequently it still takes more
than 6 months to make the battery become weak The testing experiments were
carried out and the data was recorded every 2-3 weeks so that important value of
state of health is not missed However as the change of capacity is a long progress
and it is nonlinear not all the data collected can be used in this project
Referring the literature (Coleman Lee et al 2006 Lakhdari and Midoun 2007
Coleman Hurley et al 2008) an important factor that reflects the change of state
of health of a lead-acid battery is the internal resistance Not only the state of
health but also other factors (SOC DOC discharge current etc) can result in
variations in internal resistance a new alternative method that based on the
Improved Battery Model in Chapter 4 is adopted in the project
From the model study in Chapter 4 the internal resistance can be divided into two
parts expressed by )]1(1[ 0000 SOCARR minusminusminusminus++++==== (Eq 47) and )ln(101 DOCRR minusminusminusminus====
(Eq 48) These equations show that the internal resistance is affected by the state
of charge (SOC) and depth of charge (DOC) in a discharge cycle In real
applications batteries are seldom discharged to the full range because a deep
discharge could cause some damage to the battery They are also seldom to be
charged to full to prevent the possibility of overcharge that could also bring some
99
negative effects Although this issue is not very significant in a valve regulated
lead acid battery it is better to control the working range of depth of charge from
50 to 80 approximately In this project the internal resistance of battery in the
depth of charge of 65 is studied as a most important factor that related to the
state of health As a little inaccurate of SOC and DOC will induce a comparative
big difference in the internal resistance the method of measuring the internal
resistance accurately by an external circuit is discarded
In Equation 47 and Equation 48 the author found that there are two other factors
that influence the internal resistance besides the SOC and the DOC R00 and R10
Therefore in the project the values of R00 and R10 in a specific discharge current
are very important to study the internal resistance The values of these two factors
are used in Equation 47 and Equation 48 to calculate the internal resistance per
cell of the battery The depth of charge is assumed to be 65 for a normal
working battery as described previously In chapter 3 the SOC and the DOC are
defined as )0(1 θCQSOC eminus= (Eq 44) and )(1 θavge ICQDOC minus= (Eq
45) The Capacity is also defined as equation 42
k
c
fc
IIK
CK
IC))(1(1
)1(
)(
0
minusminusminusminus++++
++++
====
ε
θ
θ
θ (61)
in which Kc = 118 k = 120 and 6 II avg times= in this project The relationship
between the actual capacity under discharge current Iavg and the nominal capacity
is
100
62
1
))(1(1
1
)0)(1(1
1
))(1(1
1
)0(
)(asymp
minus+=
minus+
minus+=
k
avgck
c
k
avgcavg
IIK
IK
IIK
C
IC
θ
θ (62)
Therefore the SOC when the DOC is 65 is
586))0(62(1)0(1 asympsdotminus=minus= θθ CQCQSOC ee (63)
As described in chapter 5 30 asympA therefore the internal resistance of an
individual cell can be obtained by
10001000010 43041)ln()]1(1[ RRDOCRSOCARRRrcell sdot+sdotasympminusminus+=+= (64)
and for a six-cell lead-acid battery the internal resistance
1000 582486 RRrr cellbattery sdot+sdot=times= (65)
62 The identification of C0 R00 and R10
In the eight parameters identified previously in Chapter 5 there are only three
parameters can be affected by the change of battery conditions Therefore the
other five parameters ( 2100 ττAKE Em ) can be treated as a constant for a battery
The parameters that related to the battery condition 0010 RR and 0C are the key
problems which the project focused on 0C represents the state of health while
the 0010 RR stands for the internal resistance parameters Here again the Genetic
algorithm is adopted to identify these three parameters
In this project the battery have been discharged and charged in hundreds of cycles
to simulate the capacity loss in the normal applications which is described by the
101
state of health in this project In order to find out the different behaviour of
internal resistance in different state of health experimental tests have been carried
out in different state of health of the battery
The first test is carried out when the battery is brand new and the data is also used
to identify the other parameters of the battery model as described in the previous
chapter The second group of data is collected after 300 discharge cycles
approximately and the third test took place after 200 more cycles The number of
discharge cycles between the last four tests is only about 50 because the change of
State of Health is more significant The identified parameters of a battery in
different state of health are shown in table 6-1
Table 6-1 Battery Remaining Capacity and Internal Resistance
Remaining
Capacity C0 (Amps)
SOH R00 R10 RelError Internal
Resistance (Ohm)
Test 1 48198 100 00609 00220 01756 05683
Test 2 44861 9314 00654 00103 07428 05759
Test 3 38025 7889 00635 00191 02812 05827
Test 4 33830 7019 00573 00509 07265 06126
Test 5 30625 6354 00604 00582 04340 06575
Test 6 26072 5306 00703 00368 01342 06855
And the terminal voltages simulated and measured are shown as the following
figures The same as previous figures the blue lines represent the measured
outputs while the red lines represent the simulation results
The test shows in figure 6-1 the same as the test which is used to describe the
genetic algorithms and the battery parameter identification in chapter 5 Detailed
102
description and analysis are given in chapter 5
0 500 1000 1500 2000 2500 3000 350011
112
114
116
118
12
122
124
126
128
13
Time (s)
Term
inal voltage (
V)
Experimental Terminal Voltage
Simulated Terminal Voltage
Experimental Terminal Voltage
Simulated Terminal Voltage
Figure 6-1 Experimental and Simulated Terminal Voltage of Test 1 (SOH = 100)
103
0 1000 2000 3000 4000 5000 600011
112
114
116
118
12
122
124
126
128
13
Time (s)
Term
inal V
oltage (
V)
Simulated Terminal Voltage
Experimental Terminal Voltage
Simulated Terminal Voltage
Experimental Terminal Voltage
Figure 6-2 Experimental and Simulated Terminal Voltage of Test2 (SOH= 9314)
The experiment shown in figure 6-2 is tested several months after the first
experimental test In the period that the first discharge begins the experimental
result shows a different slope in terminal voltage The reason is probably that the
battery have just charged to full by a charger and itrsquos the capacitor had not fully
discharged After that when the discharge stopped there is a deviation in the
simulation voltage In the authorrsquos opinion that is because of the accuracy of R10
and R00 If the value of R10 is greater and that of R00 is smaller the simulation
result should fit the experimental result In the second discharge period of the
discharge test there is also a little difference in the experimental and simulation
result caused by the inaccuracy of battery parameters But it shows a good
agreement when the discharge stopped
104
0 500 1000 1500 2000 2500 3000 3500 400011
112
114
116
118
12
122
124
126
128
13
Time (s)
Term
inal V
oltage (
V)
Simulated Terminal Voltage
Experimental Terminal Voltage
Simulated Terminal Voltage
Experimental Terminal Voltage
Figure 6-3 Experimental and Simulated Terminal Voltage of Test3 (SOH= 7889)
0 500 1000 1500 2000 2500 3000 3500 4000 4500 500011
112
114
116
118
12
122
124
126
128
13
Time (s)
Term
inal V
oltage (
V)
Simulated Terminal Voltage
Experimental Terminal Voltage
Simulated Terminal Voltage
Experimental Terminal Voltage
Figure 6-4 Experimental and Simulated Terminal Voltage of Test4 (SOH= 7019)
105
0 1000 2000 3000 4000 5000 600011
112
114
116
118
12
122
124
126
128
13
Time (s)
Term
inal V
oltage (
V)
Experimental Terminal Voltage
Simulated Terminal Voltage
Simulated Terminal Voltage
Experimental Terminal Voltage
Figure 6-5 Experimental and Simulated Terminal Voltage of Test5 (SOH= 6354)
Figure 6-3 figure 6-4 and figure 6-5 show the test results of the battery when the
SOH drops to its 80 70 and 60 It is shown that the simulation result in
figure 6-3 fits the experimental result until the end of test when the discharge of
battery has just stopped The inaccuracy of the R10 and R00 is also the main cause
of the deviation The overall simulation result in figure 6-4 figure 6-5 are good to
express the battery behaviour
106
0 500 1000 1500 2000 2500 3000 3500 400011
112
114
116
118
12
122
124
126
128
13
Time (s)
Term
inal V
oltage (
V)
Experimental Terminal Voltage
Simulated Terminal Voltage
Experimental Terminal Voltage
Simulated Terminal Voltage
Figure 6-6 Experimental and Simulated Terminal Voltage of Test6 (SOH= 5306)
In the parameter identification of test shown in figure 6-6 the remaining capacity
is only about 12 of the initial capacity when the battery is brand new During the
discharge period the simulation and experimental result is not fitting very well
and the slopes of them are not the same This is probably also caused by
insufficient idle time after being charged and the capacitor had not fully
discharged
Figure 6-7 represents the internal resistance value in different state of health as
described in table 6-1
107
100 95 90 85 80 75 70 65 60 55 5004
045
05
055
06
065
07
075
08
State of Health
Inte
rnal R
esis
tance (
Ohm
)
r vs SOH
Approximation
Figure 6-7 Change of Internal Resistance in Different State of Health (Battery 1)
It is shown that the internal resistance is increasing when the state of health of a
lead-acid battery decreases This progress is at first very slow when the battery is
new But after a number of discharge cycles the remaining capacity of battery
drops to about 75 of the initial capacity when the battery is new and the
increase of internal resistance become faster When the state of health is brought
down to about 50 which means that the battery cannot offer enough energy as
new the value of internal resistance is increased by 30 approximately At
present there is not a published quantitative description of the internal resistance
when the capacity changes yet but it has been agreed that the internal resistance
increases while the battery health deteriorates
Similar tests have been carried out on 5 other batteries with the same nominal
108
capacity and the changes of their internal resistances are given as figure 6-8 It is
not possible to deduce a statistical approximation equation only based on the
existing data but it can be seen from the figure that the performance of internal
resistance under different state of health shows an agreement in a certain extent
100 95 90 85 80 75 70 65 60 55 5003
04
05
06
07
08
09
State of Health
Inte
rnal R
esis
tance (
Ohm
)
r vs SOH (Battery 1)
r vs SOH (Battery 2)
r vs SOH (Battery 3)
r vs SOH (Battery 4)
r vs SOH (Battery 5)
r vs SOH (Battery 6)
Figure 6-8 Change of Internal Resistance in all 6 Batteries
63 Summary and Discussions
The determination of battery remaining capacity accurately is becoming
increasingly important in modern battery managements This currently is mostly
obtained by integrating the discharge current of a full discharge but this progress
usually causes a negative effect on most of the batteries There is also a view that
109
the state of health which represents the percentage of remaining capacity of a
weak battery compared with the initial capacity when brand new can affect the
internal resistance therefore the battery state of health can be obtained by the
study of battery internal resistance However from the analysis based on the
mathematical model and the experimental results it can be concluded that other
parameters can also cause variations of the internal resistance which make the
estimation of the state of health more challenging
This chapter describes a new alternative method that based on the Improved
Battery Model and the key parameters of the model The remaining maximum
capacity of a used battery which represents the SOH of the battery is related in
the internal resistance under the depth of charge of 65 which is expressed by
the parameters of R00 and R10 These parameters can be identified by genetic
algorithms A result that quantifies the change of internal resistance in different
SOH values has been concluded based on the analysis of a series of experimental
tests
110
Chapter 7
Conclusions and Future
Research
This chapter summarizes the major achievements of the presented research work
in the field of battery modelling and state of health analysis Possible direction of
further research work is also described briefly in this chapter
71 Summary
Lead-acid batteries are used in various industrial sectors and are irreplaceable due
to their low price In areas where lead-acid batteries are employed as an energy
storage device the capacity loss caused by the repeated dischargecharge cycles is
very common This drop of capacity can neither be avoided nor be repaired by
using current technologies As a result it is essential to know whether the battery
is able to meet the demand and if it should be replaced on time
In this thesis a study on the capacity status of a battery and its relation to the
internal resistance had been conducted and this thesis established a novel model
based method to quantify the battery health An Equivalent Circuit Mathematical
model for the discharging progress of a lead-acid battery has been developed for
this purpose and is implemented under MatlabSIMULINK software environment
111
The model involves most of the important concepts of a battery to reflect the
dynamic response of terminal voltage when discharging
A series of experimental tests have been carried out during the project for the
model validation and the study of the state of health Six 12V-13Ah lead-acid
batteries with the same rated capacity are discharged and recharged from brand
new to obtain different values of state of health Genetic algorithm has been
employed to identify the unknown parameters of the battery model in each state of
health and the identified parameters are used as the factors that reflecting the state
of health and the internal resistance The internal resistances corresponding
different state of health have been collected and recorded A result was found in
the thesis that for the 12V-13Ah lead-acid battery which is used in the
experimental tests the value of internal resistance is increased by 25
approximately if the SOH of battery drops to 50
72 Limitations
The key limitation of the method introduced in this thesis is that it is based on the
parameter identifications of the model which means a test is still needed in order
to obtain the state of health The major reason is that the mathematical model does
not include the charging progress of battery which is also an important period of
the battery duty cycle Another limitation is that all the tests of the state of health
estimation are carried out at the same discharge rate because of the variation of
the internal resistance in different discharge rate as discussed in chapter 4 Finally
112
The lsquocoup de fouetrsquo behaviour that of took place at the beginning of discharge
when batteries are full is not able to be simulated in the current version of
mathematical model
73 Future Research Work
Following the limitations of the project some future research can be carried out in
three steps based on the model improvements and the practical applications of the
algorithm
First of all improvements of the discharging battery model can be carried out
which can mainly focus on the study of the battery internal resistance in different
discharge rates Equations of internal resistances that can withstand the change of
discharge rate will make the model capable for online applications Studies on the
relationship between the electromotive force and the state of charge can also lead
to a solution of the lsquocoup de fouetrsquo behaviour and a better simulation result
Another research work on the model modification is that the behaviour of battery
to the mathematical model when a battery is being charged can be involved by
which the monitoring system of battery can be implemented in the whole duty
cycles This part of work can be focused on the parasitic branch in the
mathematical model described in chapter 3
Further work should also reveal the variations of state of health in different duty
113
cycles and an algorithm based on this change should be designed to estimate the
remaining life-time of a lead-acid battery The value of current state of health and
the estimated raining life-time should also be considered as major outputs in this
period of work It is also possible to design an online management device of
battery to estimate the life-time and the state of health
114
References
Anon (2006) Global Wind Energy Council (GWEC) statistics [online] from
httpwwwgwecnetuploadsmedia07-
02_PR_Global_Statistics_2006pdf
Anon (2007) Battery Types Flooded versus AGM and Gel [online]
Retrieved February 13 2007 from
httpwwwvonwentzelnetBattery01Type
Anon (2007) BP Statistical Review of World Energy June 2007 [online] from
httpwwwbpcomliveassetsbp_internetglobalbpglobalbp_uk_englishr
eports_and_publicationsstatistical_energy_review_2007STAGINGlocal_
assetsdownloadsspreadsheetsstatistical_review_full_report_workbook_2
007xls
Anon (2007) International Energy Outlook 2007 [online] from
httpwwweiadoegovoiafieohighlightshtml
Ball R J Evans R and Stevens R (2002) Finite element (FE) modelling of
current density on the valve regulated leadacid battery positive grid
Journal of Power Sources 103(2) 213-222
Bernardes A M Espinosa D C R and Tenoacuterio J A S (2004) Recycling of
batteries a review of current processes and technologies Journal of
Power Sources 130(1-2) 291-298
Berndt D (1993) Maintenance-Free Batteries -- A Handbook of Battery
Technology Somerset Research Studies Press Ltd
Berndt D (2001) Valve-regulated lead-acid batteries Journal of Power
Sources 100(1-2) 29-46
115
Berndt D (2009) Electrochemical Energy Storage Battery Technology
Handbook CRC Press
Casacca M A and Salameh Z M (1992) Determination of lead-acid battery
capacity via mathematical modeling techniques Energy Conversion
IEEE Transaction on 7(3) 442-446
Ceraolo M (2000) New dynamical models of lead-acid batteries Ieee
Transactions on Power Systems 15(4) 1184-1190
Chan H L and Sutanto D (2000) A new battery model for use with Battery
Energy Storage Systems and Electric Vehicles Power Systems 2000 Ieee
Power Engineering Society Winter Meeting - Vols 1-4 Conference
Proceedings 470-475
Chen M and Rincacuteon-Mora G A (2006) Accurate electrical battery model
capable of predicting runtime and I-V performance IEEE
TRANSACTIONS ON ENERGY CONVERSION VOL 21( NO 2)
504-511
Chipperfield A J Fleming P J and Fonseca C M (1994A) Genetic algorithm
tools for control systems engineering Adaptive computing in
engineering design and control Plymouth UK
Chipperfield A J Fleming P J Pohlherim H and Fonseca C M (1994B)
Genetic algorithm toolbox for use with Matlab Department of automatic
control and systems engineering University of Sheffield
Crompton T R (2000) Battery Reference Book Third Edition Oxford
Elsevier Newnes
Cun J P Fiorina J N Fraisse M Mabboux H A and Mabboux H The
116
experience of a UPS company in advanced battery monitoring
Telecommunications Energy Conference 1996 INTELEC 96 18th
International 646 - 653
Durr M Cruden A Gair S and McDonald J R (2006) Dynamic model of a
lead acid battery for use in a domestic fuel cell system Journal of Power
Sources 161(2) 1400-1411
Esfahanian V Torabi F and Mosahebi (2008) An innovative computational
algorithm for simulation of lead-acid batteries Journal of Power
Sources 176(1) 373-380
Gillioli R and Cerolo P (1990) Charge and discharge fourth order dynamic
model of the lead battery 10th
intl Electric Vehicle Symposium Hong
Kong p1-9
Glendenning I (1981) Compressed air storage Physics in Technology 12(3)
103-10
GONG Q (2005) Modeling study of a vehicle traction battery model
CHINESE LABAT MAN 2005 Vol 42 Numb 2 issu 155 pages 76-79
Houck C Joines J and Kay M (1995) A Genetic Algorithm for Function
Optimization A Matlab Implementation NCSU-IE TR 95-09
Jacobi W (2009) Lithium Batteries Battery Technology Handbook CRC Press
Jayne M G and Morgan C (1986) a new mathematical model of lead acid
battery for electric vehicles Eighth Intl electric vehicle conference
Washington DC
Juvonen M (2003) Large-Scale Energy Storage Systems [online] from
httpwwwdocicacuk~mattiise2grpenergystorage_reportstoragehtml
117
Lee J H Lee K Y and Lee J Y (1996) Self-discharge behaviour of sealed
Ni-MH batteries using MmNi33+xCo07Al10-x anodes Journal of
Alloys and Compounds 232(1-2) 197-203
Liaw B Y Gu W B and Wang C Y (1997) Numerical simulation of coupled
electrochemical and transport processes in battery systems Proceedings
of the Intersociety Energy Conversion Engineering Conference
Honolulu HI USA IEEE
Lu S Meegahawatte D H Guo S Hillmansen S Roberts C and Goodman
C J (2008) Analysis of energy storage devices in hybrid railway vehicles
Railway Engineering - Challenges for Railway Transportation in
Information Age 2008 ICRE 2008 International Conference on
Mantell C L (1984) Batteries and energy systems Second Edition McGraw-
Hill Inc
MathWorks Inc (2004) Genetic Algorithm Direct Search Toolbox V102
MathWorksInc
MPowerSolutionsLtd (nd) Alternative Energy Storage Methods [online]
from httpwwwmpowerukcom
Okoshi T Yamada K Hirasawa T and Emori A (2006) Battery condition
monitoring (BCM) technologies about lead-acid batteries Journal of
Power Sources 158(2) 874-878
Perrin M Delaille A Huet F and Hernout L (2006) Study of the coup de
fouet of lead-acid cells as a function of their state-of-charge and state-of-
health Journal of Power Sources 158(2) 1019-28
Pham D T and Karaboga D (1998) Intelligent Optimisation Techniques
118
Genetic Algorithms Tabu Search Simulated Annealing and Neural
Networks New York Springer-Verlag New York Inc
RailPower Hybrid Technologies C (nd) Benifits of Hybrid Locomotives
[online] from httpwwwrailpowercomproducts_hl_benefitshtml
Rand D A J Moseley P T and Garche J (2004) Valve-Regulated Lead-Acid
Batteries Elsevier
Ruetschi P (2004) Aging mechanisms and service life of lead-acid batteries
Journal of Power Sources 127 (1-2) 33-44 Switzerland Elsevier
Salameh Z M Casacca M A and Lynch W A (1992) A mathematical model
for lead-acid batteries IEEE Trans on Energy conversion Vol7 No 1
Sato Y Takeuchi S and Kobayakawa K (2001) Cause of the memory effect
observed in alkaline secondary batteries using nickel electrode Journal
of Power Sources 93(1-2) 20-24
Sims R I Carnes J C Dzieciuch M A and Fenton J E (1990) Computer
modeling of Automotive lead acid batteries Ford Research Laboratories
Technical Report
Smil V (2007) Energy at the Crossroads Massachusetts Achorn Graphic
Services Inc
Ter-Gazarian A (1994) Energy storage for power systems London Peter
Peregrinus Ltd
TNI_Ltd (2007) Battery history [online] from
httpwwweuropulsecombattery_historybattery_historyhtm
Tuck C D S (1991) Modern Battery Technology Ellis Horwood Ltd
Wei J (2007) Development of Coal Mill and Aggregate Load Area Models in
119
Power Systems using Genetic Algorithms University of Liverpool PhD
Wikipedia (nd) Lead-Acid Battery [online] from
httpenwikipediaorgwikiLead-acid
Wikipedia (nd) Rechargeable Batteries [online] from
httpenwikipediaorgwikiRechargeable_battery
Wikipedia (nd) VRLA [online] from httpenwikipediaorgwikiVRLA
Zhang Y L Liu P H Zhang Q Y and Cheng W (2010) Separation of
cadmium(ii) from spent nickelcadmium battery by emulsion liquid
membrane Canadian Journal of Chemical Engineering 88(1) 95-100
120
Appendix I SIMULINK Diagrams of Battery Model
Figure A-1 SIMULINK Diagrams of ldquoMain Blockrdquo
121
Figure A-2 SIMULINK Diagrams of ldquoTerminal Voltage Calculationrdquo
122
Figure A-3 SIMULINK Diagrams of ldquoThermal Behaviourrdquo
123
Figure A-4 SIMULINK Diagrams of ldquoBattery Capacityrdquo
Figure A-5 SIMULINK Diagrams of ldquoBattery State of Chargerdquo
Figure A-6 SIMULINK Diagrams of ldquoBattery Depth of Chargerdquo
124
Figure A-7 SIMULINK Diagrams of ldquoBattery Electromotive Forcerdquo
(a)
(b)
Figure A-8 SIMULINK Diagrams of ldquoBattery Internal Resistancerdquo
125
Appendix II
List of Publications
S Hillmansen S Lu D H Meegahawatte S Guo C Roberts and C J
Goodman Analysis of Energy Storage Devices in Hybrid Railway Vehicles International Conference on Railway Engineering 2008 p68-73 Hong Kong China 25-28 March 2008
Y Yin X Luo S Guo Z Zhou J Wang A battery charging control strategy for
renewable energy generation systems The Proceedings of World Congress on Engineering 2008 Vol 1 pp356-361 London UK 2-4 July 2008
S Guo S Hillmansen Y Yin J Wang State of Health Monitoring of Lead-acid
Batteries Proceedings of the 14th International Conference on Automation amp Computing pp250-254 Brunel University West London UK 6 September 2008
Y Yin C Li Z Zhou Q Liu S Guo X Luo J Wang Design and Realization of a
PS2 Keyboard Interface in Embedded system Proceedings of the 14th International Conference on Automation amp Computing pp160-163 Brunel University West London UK 6 September 2008
Yin Y Wang J Luo X Guo S Development of a battery charging management
unit for renewable power generation a book chapter in Advances in
Electrical Engineering and Computational Science Edited by Sio-Long Ao and Len Gelman pp33-46 Springer 2009
Wang J Wei JL Guo S Condition monitoring of power plant milling process
using intelligent optimization and model based techniques accepted as a chapter in the book of Fault Detection in March 2009
S Guo S Hillmansen J Wang Model Based Analysis of Battery State of Health
using Genetic Algorithms accepted by the International Conference on Systems Engineering (ICSE) Coventry 8-10 September 2009

7
36 Summary and Discussion 57
Chapter 4 Experimental System Set up and Improved Battery Model Simulation
Implementation 59
41 The Experimental System 59
42 Improvements of the Battery Model 61
421 The Change of τ in Different Charge Status 63
422 Analysis in Variations of the Internal Resistance 64
423 Improved Lead-Acid Battery Mathematical Model 66
43 Simulation Study 68
44 Summary and Discussion 72
Chapter 5 Model Parameter Identification and Model Validation 73
51 Need for the Optimization Algorithms 73
52 Overview of the Optimization Algorithms 74
53 The Study of the Genetic Algorithms 77
531 Working Principle of GAs 77
532 Simulation Studies of Genetic Algorithms 81
54 Model Parameter Identification 87
541 Implementation of Genetic Algorithms and Experimental Data sets
87
542 Parameters of Battery Model 90
543 Battery Model Validation 92
55 Summary and Discussions 95
Chapter 6 The Analysis of State of Health (SOH) in association with the Internal
Resistance 97
8
61 Methodology 97
62 The identification of C0 R00 and R10 100
63 Summary and Discussions 108
Chapter 7 Conclusions and Future Research 110
71 Summary 110
72 Limitations 111
73 Future Research Works 112
9
List of Figures
Figure 1-1 Power density vs energy density plot 7
Figure 2-1 Working Principle of Lead-Acid Batteries (a) shows the battery when
discharging and (b) is when charging with a DC charger 18
Figure 3-1 Simple Battery Model 38
Figure 3-2 I-V chart of the Simple Battery Model 39
Figure 3-3 I-V Chart in different SOC 40
Figure 3-4 Sketch to show battery discharge behaviours in typical tests 41
Figure 3-5 Thevenin Battery Model 42
Figure 3-6 Fourth-order Battery Model43
Figure 3-7 Improved Battery Model 44
Figure 3-8 Battery Capacity vs Discharge Current 47
Figure 3-9 Lead-acid Battery Equivalent Network 48
Figure 3-10 The Equivalent Network with the Approximated mZ 49
Figure 3-11 R-C block 53
Figure 4-1 Equivalent Circuit of the Experimental Test Rig 60
Figure 4-2 Experimental Test Rig61
Figure 4-3 Test of constant-impedance load discharge 62
Figure 4-4 Test of two-load discharge 62
Figure 4-5 Structure of model for SIMULINK Implementation69
Figure 4-6 Terminal Voltage of Battery 71
Figure 5-1 Flowchart of a Simple Genetic Algorithm78
Figure 5-2 2-dimensional Rastrigins function83
Figure 5-3 Contour plot of Rastrigins function84
10
Figure 5-4 GA performance (Rastrigrinrsquos function) 85
Figure 5-5 2-dimensional Rosenbrock function 86
Figure 5-6 GA performance (Rosenbrock function) 87
Figure 5-7 Progress of Parameter Identification 88
Figure 5-8 Measured and Simulated Result after Parameter Identification 91
Figure 5-9 Mean and the Best Fitness Values in Each Generation 92
Figure 5-10 Measured and Simulated Terminal Voltage 93
Figure 5-11 Measured and Simulated Terminal Voltage 94
Figure 6-1 Experimental and Simulated Terminal Voltage of Test 1 (SOH = 100)
102
Figure 6-2 Experimental and Simulated Terminal Voltage of Test 2 (SOH=9314)
103
Figure 6-3 Experimental and Simulated Terminal Voltage of Test 3 (SOH=7889)
104
Figure 6-4 Experimental and Simulated Terminal Voltage of Test 4 (SOH=7019)
104
Figure 6-5 Experimental and Simulated Terminal Voltage of Test 5 (SOH=6354)
105
Figure 6-6 Experimental and Simulated Terminal Voltage of Test 6 (SOH=5306)
106
Figure 6-7 Change of Internal Resistance in Different State of Health (Battery 1)
107
Figure 6-8 Change of Internal Resistance in all 6 Batteries 108
1
Chapter 1
Background and Objectives of
the Project
11 Overview
Fossil fuels have been the main energy resource in recent human history although
their continuing use has been shown to have a detrimental effect on the
environment The principal problem for fossil fuels is that they cannot be
reproduced within a short period of time so it is a finite energy supply source If
current consumption rate continues they will be exhausted in a few generations
from now Fossil fuel has never been considered as a clean-resource because there
is an emission of noxious gasses including CO CO2 NOx SOx and HC into the
atmosphere With all the pressure from the problems associated with the fossil
fuel exploration of the usage of renewable energy is becoming an increasingly
important issue
Wind energy hydro energy and solar energy are three of the most important
renewable energy sources and they have been implemented on a large scale wind
energy has produced a annual global total of 65019 times 1012 Wmiddoth
(74223 MWtimes24htimes365 days) (Anon 2006) energy in the year 2006 and hydro
2
energy is about 304 times 1015 Wmiddoth (30404 times 1012 Wmiddoth) (Anon 2007) Solar energy
resources are estimated at about 10694times1015 Wmiddoth (3850times1021 J) (Smil 2007) To
compare with the worldwide energy consumption of 13097times1015 Wmiddoth in the year
2007 it is clear that renewable energies have a significant role to play (Anon
2007)
However the problem of the implementation of the renewable energy is that the
electricity generated is intermittent and the power systems are experiencing the
problem of rapidly changing power demand Therefore the management of the
energy is an important issue Devices of energy storage should solve these
problems in theory
12 Review of Energy Storage Systems
Not only giving a large scale energy solution energy storage devices are also
commonly used in a range of applications related to everybody Different energy
storage technologies are suited to different applications and consideration must be
made in order to select the correct solution for each application This section will
give an overview of the existing energy storage systems
121 Applications of the Energy Storage Systems
Large scale energy storage systems which are also called grid energy storage
refer to the methods used to large-scale store electricity within an electrical power
grid Off-peak energy is stored during times when production (from power plants)
3
exceeds consumption and the stores are utilized at times when consumption
exceeds production In this way electricity production need not be drastically
scaled up and down to meet momentary consumption ndash instead production is
maintained at a more constant level
Despite the applications in grid scale the energy storage systems are also popular
in a number of areas For example they are usually used to optimize the energy
generated from the engine in modern electrical hybrid vehicles One such
application is in a shunter locomotive A shunter is a small railroad locomotive
intended for assembling trains ready for a road locomotive to take over
disassembling a train that has been brought in and switching a train to another rail
at the rail terminals The duty cycle of a shunter is characterised by short duration
high power demands (accelerating a rake of vehicles) and the long periods of
idling while the train waits for other operations Comparing to traditional shunter
locomotive that use diesel engines only for the whole duty cycle hybrid shunter
locomotives with energy storage devices can have a 40-70 reduction in fuel use
(RailPower Hybrid Technologies nd) This saving is made by operating the prime
mover at its optimum
Another application of energy storage in the vehicle technologies is the
regenerative braking system which is used to save the braking energy of vehicle
The potential of this technology to save energy for a vehicle is depends on the
duty cycle (Lu Meegahawatte et al 2008) which is characterized by storing the
energy generated when the vehicle is decelerating and releasing when accelerating
4
Energy storage devices are also very popular in stationary applications also
known as the Uninterruptible Power Supply (UPS) systems This system is
designed to meet the power demand when problems like power failure happen and
it is important especially in the applications where power failures could have
serious consequences for example in hospitals and computer centres (Berndt
2009)
The energy storage devices in the UPS system are often used to achieve
ldquouninterruptiblerdquo in a short period before the secondary power supply started
When a power problem occurs the energy storage device starts to supply
electricity immediately and at the same time the generator begins to start When
the generator is ready to supply sufficient power the energy storage device stops
providing power When the grid power is recovered the energy storage device can
be recharged until full
122 Review of the Existing Energy Storage Devices
There are various kinds of energy storage systems including pumped hydro
compressed air flywheel supercapacitors electrochemical and also
superconducting magnetic Each technology is suited to different applications and
careful consideration must be made in order to select the correct solution for each
application
Pumped hydro is the oldest and the most effective kind of large scale energy
storage method which have been used for nearly a century since 1929 (Juvonen
5
2003) Two large reservoirs at different altitudes with a pump a turbine a motor
and a generator are employed to collect the off-peak energy The water is released
from the higher one through a turbine to generate electricity during peak load
period
Compressed air is a pneumatic energy storage method that refers to the air kept
under a certain pressure This system can be used in grid energy storage that the
air can be stored by compressors during periods with low power demand This
compressed air can be released to a generator to meet the high power demand
during peak time (Glendenning 1981 Ter-Gazarian 1994 Juvonen 2003) In some
applications the compressed air is released through a combustor mixed with
natural gas to obtain a higher overall efficiency
A capacitor is an electrical device that can store energy in an electric field
between a pair of conductors and is often used in circuits for short term energy
storage It blocks the circuit to hold DC voltage Supercapacitors are energy
storage devices with the same principle but with a higher energy density The
power density of the supercapacitor systems can be very high but the energy is
often released in a very short duration (Ter-Gazarian 1994) As a result the
supercapacitors are usually used in applications of an energy burst
Superconducting magnetic energy storage system stores energy in the magnetic
field generated by direct current in a coil Instead of traditional wires like copper
superconductors are employed to avoid the energy consumptions as heat because
of the resistance A problem is that the optimal operating temperature for
6
superconductors is 50-77K a refrigerator is therefore necessary in the system for
cooling down
Flywheels are considered as a method of storing mechanical kinetic energy by
accelerating a flywheel to a very high speed to store the energy and decelerating
to release the energy Flywheels are very efficient for short duration storage cycles
due to their fast response speed These energy storage devices are used mainly in
applications that demand kinetic energy storage and high numbers of deep
discharge cycles
Electrochemical energy storage stands for the device capable of converting
chemical and electrical energy to each other by chemical reactions Batteries are
the most common technology of electrochemical energy storage methods The
oxidation and reduction reactions in the two electrodes of battery lead to the
current through the external circuit when discharging to provide energy The
secondary battery can be recharged by applying electrical current which reverses
the chemical reactions that occur during the discharge
Fuel cell is another technology with very high energy density that converts the
chemical energy in a source fuel into an electrical current The fuel cells are
considered as the ldquoenvironmental friendlyrdquo as the only by-product is water The
working principle of fuel cells when discharging is the same as the batteries but
unlike the batteries the fuel cells do not need recharge as they only provide
electrical energy while the active chemicals are supplied to the electrodes (Mantell
1984 MPowerSolutionsLtd nd)
7
Figure 1-shows the Ragone chart of the energy and power density of some energy
storage systems
Figure 1-1 Power density vs energy density plot (MPowerSolutionsLtd nd)
123 Review of Batteries
The preceding discussion has identified that energy storage devices are becoming
increasingly important in both stationary and mobile applications Battery as the
most popular energy storage device is studied in this section
There are two different types of batteries applied in a large range of areas now
Primary batteries and Rechargeable batteries Primary batteries which are also
called disposable batteries often have higher energy densities than the
rechargeable ones and they have a lower self-discharge (Ter-Gazarian 1994)
8
However as the chemical reactions in these batteries are not reversible and the
active materials cannot be restored to their initial forms these batteries cannot be
reliably recharged The primary batteries are intended to be used once and then
discarded therefore they are not suitable for the energy storage systems
Rechargeable battery is the other type of the electrochemical batteries which is
also known as secondary battery because their electrochemical reactions are
electrically reversible There are many different rechargeable battery technologies
in which only four of them are leading the world market nickel-cadmium nickel-
hydride lead-acid and lithium-ion (Berndt 1993 Berndt 2009)
The Nickel-cadmium (NiCd) battery is a kind of rechargeable battery that uses
nickel oxide hydroxide and metallic cadmium as electrodes and an alkaline
electrolyte (often potassium hydroxide) (Mantell 1984) As designed to compete
the primary batteries the NiCd batteries are often manufactured in the same size
and they are used in the consumer market as primary batteries for example in
clocks toys radios and cordless tools However when the NiCds are substituted
for primary cells the lower terminal voltage and smaller ampere-hour capacity
may reduce performance as compared to primary cells The most attractive feature
of the nickel-cadmium batteries is that they are more difficult to damage
comparing with other batteries during deep discharge cycles They can also
sustain more cycles and the lower internal resistance can also help achieve a
higher maximum discharge rate A problem preventing the large scale application
of this battery technology is that the nickel-cadmium batteries suffers faster self
discharge rate than other rechargeable batteries and the cadmium used as the
9
active material in one of the electrodes is toxic and expensive (Zhang Liu et al
2010) Furthermore the capacity loss caused by the continuously discharge and
recharge to the same state of charge called ldquomemory effectrdquo is also a very
important issue of the nickel-cadmium batteries (Sato Takeuchi et al 2001)
The nickel-metal hydride (NiMH) battery is a type of secondary electrochemical
battery that designed to substitute for the nickel-cadmium cells They have a
similar size and a similar cell voltage but with more advantages By using
hydrogen-absorbing alloy as negative electrode instead of cadmium this
electrochemical technology is considered as ldquoenvironmental friendlyrdquo because of
the absence of toxic cadmium (Berndt 1993) The nickel-metal hydride batteries
also have low internal resistance and the high cycle durability as the NiCds and a
NiMH battery can have two to three times the capacity of an equivalent size
nickel-cadmium battery However the nickel-metal hydride batteries also have a
similar high self-discharge rate as the nickel-cadmium batteries (Lee Lee et al
1996) and it also cannot afford complete discharges Memory effect from
repeated partial discharge can occur in a NiMH battery but this is reversible
through charge cycling (Berndt 2009)
The lead-acid batteries are the oldest type of rechargeable battery with a history of
over 150 years but they are still the most popular battery chemistry for
applications such as engine starting or backup power systems as there is no
cheaper alternative when weight is not a factor This technology uses lead and
lead dioxide as electrodes and an acid electrolyte of sulphuric acid and the
advantage of this configuration is that the electrolyte takes part in reactions of
10
both electrodes and both electrodes turn into lead sulphate when discharging
(Berndt 1993 Berndt 2009) The lead-acid batteries can be designed for not only
deep discharge cycles but high discharge rate or compromise of the two cycles
They have a lower self-discharge rate compared with the nickel batteries and they
also do not suffer from the memory effect (Mantell 1984 Berndt 2009) However
as the energy density of lead-acid battery is not high it is seldom applied in the
portable electronics Another important problem is that the lead-acid batteries
must be recycled as the active material ldquoleadrdquo is toxic to both the environment and
the human bodies (Bernardes Espinosa et al 2004)
The lithium-ion (Li-ion) batteries are almost the perfect cell chemistry and are
currently used a wide range of consumer electronics products including cameras
cell phones laptops etc They have many attractive performance advantages
which make them also ideal for higher power applications such as automotive and
standby power First of all the lithium-ion batteries have the highest energy
density in all the rechargeable battery now which is about 4 times better than
lead-acid (Jacobi 2009) They are also capable for deep discharge and high
discharge rate with a relatively slow self discharge There is no liquid electrolyte
in the lithium-ion batteries which means they are immune from leaking However
just opposite to the lead-acid batteries the most serious problem that discourages
the lithium-ion batteries is the low economic efficiency comparing with the lead-
acid batteries Other factors like the stability of the chemicals and the recycling of
lithium should also be concerned because of the chemical activeness of lithium
Table 1-1 is gives some basic properties of the four major rechargeable batteries
11
introduced above There are also some less common battery chemistries used by
rechargeable batteries in addition to these technologies including nickel-zinc
(NiZn) nickel-iron (NiFe) etc but they have a small market share For the four
major battery chemistries lead-acid batteries with their low price and high
flexibility is adopted in a wide range of application areas
Table 1-1 properties of the rechargeable batteries (Wikipedia nd)
Type Voltage
(V)
Energy Density (Whkg)
Power Density (Wkg)
Self Discharge
rate
Cycle Durability
Nickel-Cadmium
12 40-60 150 20 1500
Nickel-Metal-Hydride
12 30-80 250-1000
20 1000
Lead-Acid 21 30-40 180 3-4 500-800
Lithium-ion 36 160 1800 5-10 1000-1200
124 The Management of Batteries
In the areas that batteries are employed as the energy storage device it is a critical
issue to consider that whether there is enough energy in the battery to meet the
demand However batteries do have the problem in limited cycle durability that
is when a battery is charged and discharged for a number of cycles its total
capacity decreases If the battery cannot offer sufficient powerenergy it should be
replaced at the right time But the problem is that it is difficult to quantify the
capacity loss and when the capacity of battery is no longer sufficient for a
particular application Due to the limitation of batteries it is essential to develop a
method to determine the capacity of battery that subjected to various duty cycles
in a number of applications
12
13 Project Objectives
The main objective of the project is to develop a method which can determine the
key parameters of batteries from the discharge tests The proposed methodology is
a model based approach that is to develop a mathematical model of the battery
which can represent the dynamic performance and battery status and
characteristics can be investigated through the analysis of the model
The first step of the project is to build a mathematical model of battery The
dynamic model is expected to reflect the relevant behaviours of battery when
being discharged including the characteristics of State of Charge Depth of Charge
Electromotive force Terminal Voltage The unknown parameters in the model are
identified by using Genetic Algorithms (GAs) with the laboratory experimental
data Afterwards some batteries are tested in experiments and the parameters in
different state of health are recorded to analyze the battery in different status of
battery
The focus of this work is to develop a suitable method for parameter identification
for common battery systems The lead-acid battery has been chosen because it has
relatively well defined properties and there is a wealth of literature describing the
performance of these types of batteries From an experimental view point they are
also readily available of low cost
13
14 Outline of the thesis
The thesis is organized into seven chapters and the first chapter presents the
background and motivation of the research project The remaining chapters are
briefly described as follows
Chapter 2 gives an overview of lead-acid batteries including the development
working principle and also some modern battery designs and technologies In the
second part of chapter 2 important concepts for a battery including electromotive
force capacity state of charge internal resistance and state of health are
introduced and some mathematical descriptions of these concepts are discussed
Chapter 3 starts from some requirements of the mathematical model designed for
this project and several different methods of battery model approaches are
discussed Afterwards some details of the dynamic mathematical model are
analyzed The initial battery model is described in the last part of this chapter that
summarized the equations of the battery
Chapter 4 is mainly focused on some improvement of the mathematical model
described in chapter 3 In the first section of chapter 4 the experimental test rig in
the project is introduced Some findings in the experimental tests is then listed and
studied and integrated into the improved model Finally the SIMULINK
implementation and a simulation study are given
Chapter 5 presents a method of model parameter identification The principle of
14
Genetic Algorithms is studied at first Then this algorithm is employed in the
model and the parameters of the model are identified with the help of
experimental tests This chapter also includes the validation of battery model
using two other groups of test results
Chapter 6 develops an algorithm that can reflect the state of health of a lead-acid
battery In this chapter the internal resistance parameters are measured under
different state of health through a group of continuous experimental tests The
change of internal resistance under a specific working condition is then related to
the battery state of health
Finally Chapter 7 gives a summary and the conclusions of the project Also the
future works that can be improved are proposed in this chapter
15
Chapter 2
Introduction of Lead-acid
Batteries
This chapter gives an overview of lead-acid batteries including background
knowledge working principles explanation of terminologies technologies and
applications encountered for this technology The chapter presents the
fundamental knowledge and prepares for the project work to be reported in the
following chapters
21 A General Overview of the
Lead-acid Battery
The lead-acid battery is the oldest type of rechargeable battery The first example
of a lead-acid battery can be attributed to the German physicist Sinsteden who
published the performance data of this battery system in 1854 (Berndt 1993)
Later in 1859 the French physicist Planteacute realized that a plate construction was
required to achieve a much larger effective surface area and he produced the first
rechargeable battery which was marketed for commercial use by alternately
charging and discharging lead sheets immersed in sulphuric acid This method
has remained unchanged and still in use today in stationary applications (Berndt
16
1993 Wikipedia nd) One of the first applications of lead-acid batteries was for
storing electrical energy for telegraphy systems The capacity required for these
applications was low and the battery at that time was not yet suited to high power
industrial applications (TNI_Ltd 2007)
In 1880 a French chemical engineer Faureacute significantly improved the design of
the lead-acid battery by producing the active materials separately His method was
to coat the lead plate with a paste of lead oxides sulphuric acid and water in a
warm humid atmosphere The paste then changed into a mixture of lead sulphates
which adhered to the lead plate as an electrochemically active material As a result
of this technology the Faureacute cells are able to achieve much higher capacity with
the first charge in comparison with the Planteacute ones (Berndt 1993 TNI_Ltd 2007)
The problem of these plates is that they are not very durable and become weak
only after a few dischargecharge cycles The lead grid alloyed with antimony or
calcium was developed to improve the mechanical characteristics The holes on
the grid are able to achieve improved bonding thus the batteries may have a longer
lifetime This advantage led to the industrial manufacturing of lead-acid batteries
In 1881 a lead electrode with a ribbed surface was designed in order to have a
large effective surface of the active material and this was the pioneer of the large
surface plates which are still common today (Berndt 1993 TNI_Ltd 2007
Wikipedia nd)
In the beginning lead-acid batteries were operated in open jars The advantage of
this feature was that the electrode can be cleaned and exchanged easily but faced
the problem of water evaporation Therefore the early batteries have to refill water
17
in order to continue normal use However this problem can be dramatically
reduced when the cells were fitted with covers to limit the evaporation (Berndt
1993) This kind of battery design is known as a lsquoflooded lead-acid batteryrsquo
In the 1950s a new type of battery which was aimed to become spill-proof was
designed and manufactured on a large scale This type of battery is characterized
by an immobilized electrolyte however this kind of spill-proof battery was only
manufactured in small sizes up to about 10 Ah (Berndt 2001) Later the
combination of a valve improved the characteristic features of the lead-acid
battery and this kind of battery is still common today and is known as the Gel
Lead-acid battery (Berndt 1993) In the 1970s micron diameter glass fibres
originally designed for air filters were used in glass mats which absorbed the
electrolyte and acted as separator Soon this kind of Absorbent Glass Mat (AGM)
battery appeared in market for stationary application
Currently Valve Regulated Lead Acid (VRLA) batteries based on both AGM and
Gel electrolytes are available in a large range of capacities for both stationary and
mobile power applications with a range of different designs for each type of
application Arguably the most important application of lead-acid batteries is for
vehicle engine starting The battery employed in this application which is called
Starting Lighting and Ignition (SLI) batteries are designed to deliver bursts of
energy usually in a discharge current as large as several hundred amperes in a
very short time A different type of battery construction can produce batteries
capable of deep cycling which are more suited to slow discharge cycles (Tuck
1991 Anon 2007)
18
22 Configuration of Lead-acid Batteries
This section gives a brief description of the working principles of lead-acid
batteries and how the battery can be configured to suit different applications
221 Electrochemical Principles
The lead-acid battery comprises two electrodes and the electrolyte The structure
of the lead-acid battery is shown in Figure 2-1 in which one electrode is Cathode
and the other is Anode The active matter in the positive plate is made of lead
dioxide (PbO2) and that in the negative plate is made of lead (Pb) and the
electrolyte is sulphuric acid One electrode can serve either as a Cathode or as an
Anode depending on which process the battery is experiencing - charging or
discharging With this structure a battery could convert electrical energy into
chemical energy and back again which is associated with the process of charging
and discharging
(a) (b)
Figure 2-1 Working Principle of Lead-Acid Batteries (a) shows the battery when
19
discharging and (b) is when charging with a DC charger
For the discharging process as shown in Figure 2-1 (a) the negative plate acts as
the anode and the positive plate is the cathode If a wire is connected between the
two the excess electrons from the anode will travel through the wire as a current
to the cathode where they are needed to complete the electron deficient reaction
there The chemical reactions in a lead-acid battery when discharging are
described as follow
Negative plate reaction (Anode)
+minusminus+rarrminus+ HPbSO2eHSOPb 44
Positive Plate reaction (Cathode)
O2HPbSO2e3HHSOPbO 2442 +rarr+++minus+minus
For the charging process an external power source is connected to the two
electrodes with the voltage as shown in Figure 2-1(b) In this way the flow of
electrons is forced backwards against the electropotential and the reactions are
driven backwards changing the lead sulphate back into lead and lead dioxide on
the negative and the positive plates and restoring the sulphuric acid to the liquid
electrolyte The anode when a battery is charging is the positive plate and the
cathode is the negative plate and the chemical reactions in a lead-acid battery
when charging are described as
Positive plate reaction (Anode)
+minusminus++rarrminus+ 3HHSOPbO2eO2HPbSO 4224
Negative plate reaction (Cathode)
minusminus++rarr++ 44 HSOPb2eHPbSO
20
The thermodynamic heat effects caused by the reactions are small in the lead-acid
battery because the difference between the enthalpy and the free enthalpy is very
small The rate of reversible heat effect in the reaction is 132 kJ per mol of the
cell reaction which corresponds to about 35 of the total energy converted when
the lead-acid battery is discharging or charged This amount of energy is relatively
small and is generated over a comparatively long period of time so it is usually
easily dissipated through radiation and convection (Berndt 1993)
222 Lead-Acid Battery Types and Technologies
The flooded battery is the simplest type of lead-acid battery in use Flooded
batteries are common for some traction applications despite the requirement in
high maintenance They are also very common for large capacity backup power
supplies for telecommunication computer centres grid energy storage and off-
grid household electric power systems Since the flooded batteries are not sealed
they must be kept upright to avoid acid spills and water must be periodically
added to top up the liquid electrolyte The most attractive feature of the flooded
battery is that they are able to withstand certain level of overcharging without
damage providing proper maintenance is carried out
The Valve Regulated Lead-Acid (VRLA) battery which is often colloquially
called the sealed lead-acid battery is becoming more and more popular in many
applications Because VRLA batteries are mostly sealed the electrolyte
evaporation will be reduced and spillage can be largely avoided when
overcharging which are very common in flooded batteries The electrolyte of the
21
VRLA battery is designed to be immobilized so the VRLA batteries will not leak
if inverted pierced or if the container is broken They can be mounted in any
orientation and position even immersed in water The immobilization of the
VRLA electrolyte can be achieved by using an absorbent mat separator as well as
gelling materials
In Absorbent Glass Mat (AGM) battery the electrolyte is absorbed into a mat of
fine glass fibres in order to immobilize the electrolyte In addition the pores in the
mats are fine enough to prevent the lead dendrites in the cathode from growing
through as a separator and only glass is wetted enough by sulphuric acid can soak
the separators The glass mats can therefore be used to insulate the electrodes
Gelling is another way to immobilize the electrolyte and this gelling technology at
present is only applied for lead-acid batteries The idea is to mix the sulphuric acid
with silica fume (SO2) which makes the electrolyte gel-like The mixture is stable
over a long term environmental safe and easy to work technically (Berndt 1993)
The sulphuric acid bound by the gel can also insulate electrodes as a separator
similarly with that in an AGM battery
VRLA batteries including both gel and AGM batteries are able to recombine and
reduce the emission of gases during overcharge so the requirement for the room
ventilation is reduced and there is no acid fume emission during normal discharge
(Berndt 1993 Anon 2007 Wikipedia nd) Although the generation of hydrogen
can be slowed down it cannot be avoided completely As a result a valve
regulation safety system is employed in VRLA batteries which vents the gases in
22
the battery only during over pressure faults (Tuck 1991 Berndt 1993)
However the VRLA batteries do have some drawbacks First of all the VRLA
batteries tend to have a lower specific energy density than flooded batteries and
they are also more expensive An accurate charging control is very important for a
VRLA battery especially when charging under high temperature environments
since it is not possible to cure the damage caused by overcharge
223 Battery Designs for Different Applications
Lead-acid batteries are deployed in a range of applications Different designs are
therefore required due to the different working environments and duty cycles SLI
batteries are designed for a burst of energy for cold-cranking an engine A SLI
battery is supposed to provide power only in the first few seconds when starting
an engine and will be recharged immediately once the engine is started In this
kind of lead-acid batteries a larger surface area of the electrode plates is used to
provide high electric current in a short period However repeated deep discharge
may shorten the battery lifetime
On the other hand deep cycle batteries are designed for applications where the
batteries are regularly discharged The plates of the deep cycle batteries are often
very thick in order to withstand the frequent and deep discharge cycles The plate
surface area of a deep cycle battery is not as large as a SLI battery and as a result
it is not possible to offer great power
23
Marine batteries are a compromise between a SLI battery and a deep cycle battery
Standby batteries can be classified as marine batteries which are used for backup
power supplies and providing the power in emergency situations They are
designed for a long lifetime and a large capacity but repeated discharges and high
current drain are not the intended application Traction batteries are designed for
higher current drain and repeated deep discharge cycles They are usually bigger
and heavier than other types of lead acid for the same voltage and capacity but
that is the cost of durability
23 Mathematical Descriptions of Lead-acid
Batteries
In order to investigate the relationship between the battery behaviour and
remaining lifetime for a lead-acid battery initial studies have been carried out and
are described in this chapter Concepts including Capacity State of Charge (SOC)
Depth of Charge (DOC) State of Health (SOH) and internal resistance are
introduced and quantitative descriptions of these concepts are listed
231 Capacity
The capacity of a lead-acid battery represents how much charged energy the
battery can offer which is usually described in Ampere-hours (Ah) The charge
capacity of a battery is decided by the construction factors of a battery cell This
includes the materials contained in the electrodes and the acid solution In
addition the capacity of a battery is not a fixed quantity but varies according to
24
how quickly it is discharged This is known as Peukertrsquos law (Ceraolo 2000
Dhameja 2001 Rand Moseley et al 2004)
tICk
p = (21)
where pC is the capacity on one-ampere discharge rate which is a constant
I is the discharge current (A)
t is the time of discharge (h)
k is the Peukert constant and for a lead-acid battery with the value
between 11 and 13 (varies for each individual battery)
It is common to refer to ldquoCnrdquo as the capacity of battery in Amp-Hours which
corresponds to complete discharge of the battery in n hours ldquonrdquo is a subscript that
represents the discharge rate In industry the capacity under ten-hour discharge
rate (C10) is always taken as the nominal capacity
232 Electromotive force
The electromotive force of a battery cell is the difference between the electric
potential of the two electrodes of each cell (Rand Moseley et al 2004) The
potential of each electrode which is called half cell potential is decided by the
chemical reaction and the relative activities of the solution and can be obtained
from Nernstrsquos equation (Crompton 2000)
25
Ox
Redln0
α
α
zF
RTEE minus= (22)
where E is the half-cell potential (V)
0E is the standard half-cell potential (V)
α is the relative activity of the oxidizer (α Ox) and reducer (α Red)
z is the number of electrons transferred in the cell reaction
R is the universal gas constant which is 8314472 JKminus1molminus1
T is the absolute temperature
F is the Faraday constant the number of coulombs per mole of electrons
and F = 964853399times104 Cmolminus1
At room temperature RTF is a constant of 25693mV for cells therefore
Ox
Redlog
z
V05910
Ox
Redln
z
mV69325
Ox
Redln 10
α
α
α
α
α
α==
nF
RT
The Nernstrsquos Equation therefore can be expressed by
Ox
Redlog
V0591010
0
α
α
zEE minus= (23)
The electromotive force could be calculated by the difference of the electric
potential
cathodeanode EEEMF minus= (24)
When a lead-battery is discharging the electromotive force can be written as
26
O)(H
)(SO)(Hlog
V05910
2
2
24
10
00
α
ααminus+
+minus=z
EEEMF cathodeanode (25)
The standard half-cell potential of the anode 0
anodeE is equal to 1685 (PbO2-
PbSO4SO42-) and that of cathode
0
cathodeE is -0356 (Pb-PbSO4SO42-) which are
constants for the same battery chemistry And the number of electrons transferred
( n ) is 2 for a lead-acid battery
Therefore the electromotive force of a lead-acid cell can be obtained by
O)(H
)(SO)(HlogV029600412
O)(H
)(SO)(HlogV02960)3560(6851
2
2
24
10
2
2
24
10
α
αα
α
αα
minus+
minus+
+=
+minusminus=EMF
(26)
This electromotive force of a battery cell is numerically equal to the open circuit
voltage which means that the terminal voltage of a single cell battery when it is
disconnected from the external load For a lead-acid cell the electrochemical
force at fully charged is between 210-213V per cell
233 State of Charge and Depth of Charge
State of charge (SOC) and depth of charge (DOC) are variables that can describe
the battery charge The main difference is that the SOC describes the percentage
of remaining charge relative to the nominal capacity while the DOC represents
that relative to the actual capacity under a specific discharge current These two
27
variables can be obtained by calculating the charge consumed and the battery
capacity
101 CQSOC eminus= (27)
Ie CQDOC 1minus= (28)
where Qe is the charge consumed by the load (Ah)
C is the nominal capacity (Ah)
CI is the actual capacity under the discharge current I (Ah)
234 Internal Resistance and State of Health
The internal resistance of a lead acid cell is the physical resistance of the cell The
value of the internal resistance is decided by many different factors But it could
be obtained by a simple equation
I
VVr tOC minus
= (29)
where Voc is the open circuit voltage (V)
Vt is the terminal voltage when discharging (V)
I is the discharge current (A)
However the factors in this equation are only a method of calculating the internal
resistance but not the determinants It is shown in applications that the internal
resistance of a lead-acid battery will increase when discharging as the SOC and
28
the DOC drops
It is common for batteries to suffer a capacity loss when discharged and charged
in a number of duty cycles even when idle Aged batteries are often weak and
sometimes not able to offer enough charges Therefore they should be replaced or
maintained State of health is a defined variable that is important for a weak
battery This variable is to show how weak the battery is and represents the
percentage of remaining capacity to the initial capacity when the battery is brand
new (Okoshi Yamada et al 2006) as shown in the equation
new
weak
C
CSOH = (210)
where Cweak is the remaining capacity of a weak battery (Ah)
Cnew is the capacity when the battery is brand new (Ah)
The reason for the capacity loss is complex but is usually due to the sulphation
Sulphation is a process when the amorphous lead sulphate which is easily
converted back to lead lead oxide and sulphuric acid converts to a stable
crystalline form coating the electrodes This form of lead sulphate cannot conduct
electricity and cannot be converted back to lead lead dioxide and lead sulphate
under normal charging conditions The internal resistance of a lead-acid battery
therefore increases and less charge can be provided when discharging Complete
or repeated deep discharges of a battery at low current densities that lead
excessive utilization of the active material are the most critical reason for
29
capacity loss for example a discharge of a traction battery that draws more than
80 of its nominal capacity (Berndt 1993)
235 Multi-Cell Lead-Acid Batteries
In most applications of batteries the voltage of an individual cell is not enough to
provide the sufficient voltage and power supply The solution is usually to series
connect a number of cells in a battery in order to achieve a higher battery voltage
The electromotive force of a series of lead-acid battery cells is directly related to
the cell numbers as well as the charge state of each cell For a six-cell lead-acid
battery which is a standard for most common usages the fully charged
electromotive force is about 128V The internal resistance of a multi cell battery
however is also equal to the sum of the internal resistances of each cell
Usually all the cells in a multi-cell battery should be constructed in the same
manner and in particular the capacity should be consistent because the capacity of
a multi-cell battery will be limited to the cell with the lowest capacity If one of
the cells fails it is not possible for the current to flow through the cell and the
battery is therefore disconnected from its internal cell loss Also if the SOC of one
particular cell drops faster than others in a battery the electromotive force of that
cell may affect the whole behaviour of the battery
24 Summary
The technology development of lead-acid batteries has been continuous over the
30
last 150 years From the earliest open cell batteries different advanced battery
configurations are now available which have been adopted in a wide range of
applications Meanwhile a number of solutions have been developed to address
the battery problems encountered in applications such as electrolyte evaporation
spillage and the electrolysis of electrolyte when charging However there are still
issues affecting the efficient and safe use of lead-acid batteries for example
determination of the SOH which if addressed in a robust manner would lead to
significant improved battery management system performance This chapter has
presented the essential fundamental knowledge technology terms and working
principles of lead-acid batteries which is served as a preparation for further study
reported in the following chapters of the thesis
In order to reveal the dynamic behaviour of a battery under different SOH and
identify the suitable strategy for SOH determination the mathematical modelling
study is carried out and an equivalent circuit model is derived in the next chapter
The key concepts of the battery model are explained and the fundamental analysis
is given for the concepts introduced
31
Chapter 3
Equivalent Circuit Modelling
of Lead-acid Batteries
In order to estimate the status of a battery a model based approach is adopted in
the project A mathematical model for lead-acid batteries should be developed
with a suitable level of abstraction This chapter describes the requirements to the
model to serve the project objectives and reviews the available model
technologies An improved mathematical model for lead-acid batteries is
introduced in the late part of this chapter
31 Requirements for the Battery Model
The main objective of the project is to develop an algorithm that can determine
the battery health by monitoring the battery status during discharge cycles This
algorithm is designed for implementation in a battery health monitoring system
with life-time prediction capabilities This prediction system is intended to work
on applications where the battery performance is of great importance for instance
hospital UPS systems and vehicle ignition systems To achieve the objective the
requirements to the mathematical model can be defined as
Requirement 1 The model should be able to calculate the evolution of key
battery parameters including terminal voltage cell temperature the state of health
32
and the internal resistance which describe the condition of the battery for
dynamical discharging It should also be able to adequately represent dynamic
processes while the battery is discharging
Requirement 2 The complexity of the model must be sufficient to satisfy the
requirement 1 but must also be executable in real-time for a model-based
condition monitoring system
Requirement 3 The output of the battery model should be understandable to the
battery operators and technicians as well as meaningful to those who do not have
any background in battery technologies
32 Overview of Battery Model Techniques
A number of different types of battery models have been used to serve as a tool in
solving a range of problems (GONG 2005) These include Electrochemical
Models Computational Fluid Dynamics Models Finite Element Models and
Equivalent Circuit Models This section gives an overview to the above named
four different types of battery models and the problems which are addressed by
each of them In Section 324 every battery model technology is assessed against
the overall requirements
321 Electrochemical Model
Electrochemistry is a branch of chemistry that studies chemical reactions which
33
take place in a solution at the interface of an electron conductor (a metal or a
semiconductor) and an ionic conductor (the electrolyte) The reactions involve
electrons transfering between the electrode and the electrolyte or species in
solution The application of electrochemistry research directly leads to the
development of the lead-acid batteries
Behaviour of a battery depends not only on how the battery is used but also on a
number of construction factors (Ruetschi 2004) These factors include but are not
limited to the thickness of the plates the active mass density of the active
material the concentration of the acid solution and the geometry of the electrodes
(Berndt 2001 Ruetschi 2004)
The electrochemical model is mainly focused on the oxidationreduction reactions
between the electrolytes and the electrodes By analyzing the consistency of each
matter in the solution and the electrochemical reaction caused by the connection
of electrodes to external circuit it is possible to represent the dynamic behaviour
of the battery (Crompton 2000)
322 Physical Models
The finite element method is a numerical analysis technique for finding
approximate solutions of partial differential equations as well as of integral
equations The basic principle of the Finite Element Model (FEM) is to divide the
problem into elements and each element is a smaller problem to be solved so that
they could be analyzed separately The lsquoelementsrsquo are then be assembled together
34
to restore the initial problem
Finite element is a very popular method of analysis in those areas with a complex
geometry and it is good at stress and thermal analysis For batteries the Finite
Element Models can help with a good understanding of the heat loss and that for
vibration problem in mobile applications There are also attempts to analyze the
current density on the positive grid bar in a lead-acid battery using FEM (Ball
Evans et al 2002)
Computational Fluid Dynamics (CFD) technology is a well-established tool for
physical analysis and optimization of fluid flow mass and heat transfer and
related phenomena (eg chemical reactions) that may simultaneously take place in
a complex system (Liaw Gu et al 1997) Computers are used to perform millions
of calculations required to simulate the interactions of fluids and gases with the
complex surfaces used in engineering
In a CFD Model of a battery the dynamic governing equations are solved with
respect to time space and all the physical time and space dependent properties
Acid concentration and potential distribution across the cell for instance can be
obtained Therefore such a modelling is able to give a very good understanding to
battery parameters and detailed characteristic of battery dynamics
323 Equivalent Circuit Model
An equivalent circuit refers to the simplest form of a circuit that retains all of the
35
electrical characteristics of the original (and more complex) circuit In its most
common form an equivalent circuit is made up of linear passive elements
However more complex equivalent circuits are used to approximate nonlinear
behaviours of the original circuit as well
In electrical engineering it is often useful to use an equivalent circuit model to
describe the non-ideal operation of a device For electrical engineers electrical
models are intuitive useful and easy to handle especially when they can be used
in circuit simulators and alongside application circuits
324 Discussion of Different Battery Model Methods
The electrochemical model focuses on the electrochemical reactions and the
activities in the battery which is very popular in the applications for the
constructional and design purpose However many electrochemical factors
contained in the electrochemical model are irrelevant to the external circuit and
some of the important parameters like the internal resistance are hard to describe
in an electrochemical model Therefore this model technology is not able to meet
the project Requirement 1 As the calculations in the electrochemical model are
not complicated Requirement 2 can be therefore satisfied by an electrochemical
model of battery Requirement 3 might be difficult to obtain for an
electrochemical model because the understanding of the outputs for an
electrochemical model usually need some background knowledge of the battery
chemistry As a result the electrochemical model is not chosen for the project
36
Physical models can give good understanding to the battery important parameters
so that Requirement 1 of the project can be satisfied The Requirement 3 can be
also met as the terminal voltage can be calculated as the output with the
knowledge of these parameters One significant disadvantage is that the physical
models involves huge amount of calculation in analysis which is quite time
consuming In finite element or CFD methods a large nonlinear system of
equations is solved iteratively and that could take excessive CPU time especially
for when the system is more than 2 dimensions As a result the physical
modelling methods cannot meet the Requirement 2 of fast response required by
the project (Esfahanian Torabi et al 2008)
In an equivalent circuit model most of the characteristic required by the project
can be reached in a reasonable level It is able to reflect the dynamic behaviour of
battery using simple circuit blocks such as voltage sources resistors and
capacitors (Chen and Rincacuteon-Mora 2006) That is to say the Requirement 1 of
the project can be satisfied by the equivalent circuit model And the model
simplicity causes its low computational time as Requirement 2 and therefore it
can be suited to the online implementation (Esfahanian Torabi et al 2008)
Additionally basic battery parameters like internal resistance terminal voltage
and SOC etc can be chosen as the main output of the model to meet the
Requirement 3
Table 3-1 summarized a comparison of all the three model methods on the
satisfaction of the requirements for the project
37
Table 3-1 Satisfaction of the Requirements in different Model Methods
Requirement 1 Requirement 2 Requirement 3
Electrochemical Model times radic times
Physical Model radic times radic
Equivalent Circuit Model radic radic radic
33 Introduction of the Existing Equivalent
Circuit Models
Section 32 introduced three different types of battery models to serve for different
research purposes each with different features and strengths It has been shown
that the equivalent circuit model that pays attention to the relationship between the
internal circuit and the external characteristics can adequately meet all the
requirements of the project Therefore further studies of battery models have been
carried out and six equivalent circuit battery models with different merits and
complexity are presented while the technique improvements are briefly described
in this section
331 Simple Battery Model
The Simple Battery Model is the simplest battery model As shown in Figure 3-1
this model consists of only ideal battery mE as the electromotive force of a battery
and a resistor r in series connection as the internal resistance bV in the figure is
the terminal voltage of the battery
38
Figure 3-1 Simple Battery Model
The Em in Figure 3-1 stands for the electromotive force of the battery while r
represents the internal resistance and Vb is the Terminal Voltage This model is
only applicable in some circuits where the state of charge is of little importance
because it does not consider the varying characteristic of the internal resistance in
different states of charge The model is often used in circuits where the battery
does not have major influences to the circuit analysis But without being able to
describe the battery behaviours in details this model is not suitable for the
research purpose In the Simple Battery Model the electromotive force mE can be
obtained by open circuit measurement and r can be calculated by measurement
with connecting a load to the battery after taking an open circuit measurement
For a battery with a terminal voltage of 13V and the internal resistance of 05Ω
the change of terminal voltage in a Simple Battery Model as the discharge current
increases can be given as Figure 3-2
39
Terminal
Voltage
Discharge
Current
0
10V
13V
Figure 3-2 I-V chart of the Simple Battery Model
332 Advanced Simple Battery Model
This model is developed based on the Simple Battery Model and has the same
block diagram as the Simple Battery Model The only difference is that this model
employs a variable resistor which depends on the state of charge (CUN
FIORINA et al Durr Cruden et al 2006) The relationship between the value of
the variable resistance and the state of charge is as follow
aSOC
Rr 0
= (31)
where 0R is the resistance of the battery when it is fully charged
a is the capacity coefficient
SOC is the state of charge of battery from 0 (completely discharged) to 1
(fully charged)
6A
40
The most important improvement of this model is that instead of a constant
internal resistor the value of the internal resistance is expressed as equation
function of SOC For the same battery described in section 331 the I-V chart in
different SOCs can be concluded as shown in Figure 3-3
Terminal
Voltage
Discharge
Current
0
10V
13V
SOC=1
SOC=60
Figure 3-3 I-V Chart in different SOC
333 Thevenin Battery Model
The previous models do not account for any transient behaviour of batteries
Figure 3-4 shows the gradual change in battery characteristics when external loads
are connected or disconnected to the battery
6A
41
011
14
125
Terminal
Voltage
t
Figure 3-4 Sketch to show battery discharge behaviours in typical tests
Thevenin Battery Model is one commonly used model which consists of an ideal
battery electromotive force ( mE ) internal resistance (0R ) overvoltage resistance
(1R ) and capacitance (
1C ) and the equivalent circuit is shown in Figure 3-5
(Casacca and Salameh 1992 Salameh Casacca et al 1992 Chan and Sutanto
2000) 1C represents the actual capacitance of battery and
1R represents the
resistance contributed by the contact resistance of the plate and the electrolyte
(Durr Cruden et al 2006) The capacitance in the Thevenin Battery Model can
overcome the trend of terminal voltage shown in Figure 3-4
No load No load Load
42
Figure 3-5 Thevenin Battery Model
The main disadvantage of this Thevenin Battery Model is that all the parameter
values are assumed to be constant but in fact they are strongly dependent on the
state of charge and discharge rate and some other discharge characteristics
334 Dynamic Battery Model
This model is developed based on the Thevenin Battery Model Similar to the
improvements made by the Advanced Simple Model comparing with the Simple
Battery Model the most important difference is that it takes into account the non-
linear characteristic of the open circuit voltage and internal resistance represented
by SOCK (Jayne and Morgan 1986 Sims 1990)
ISOC
KRVV bocb )( +minus= (32)
where bV is the terminal voltage of battery
ocV is the open circuit voltage
bR is the battery terminal resistor typically 01Ω
43
K is the polarization constant
I is the discharge current
335 Fourth Order Dynamic Model
This is a more accurate and sophisticated model The current pI flows through
pR (electrolyte reaction) dR (Ohmic effect) and its associated leakage
capacitance dC and wR (waste of energy) and its associated leakage
capacitance wC Current sI flowing through the resistor sR represents the
behaviour of self discharge (Gillioli and Cerolo 1990 Chan and Sutanto 2000)
The main drawback of this model just as its name indicates is that there are
fourth order equations due to consideration of the paralleled R-C blocks in the
circuit and therefore it takes more time for the computation Another drawback is
that a number of empirical parameters are contained in the model
Figure 3-6 Fourth-order Battery Model
44
336 Improved Battery Model
The most popular Equivalent Circuit Model used by researchers is the Improved
Battery Model (Casacca and Salameh 1992 Salameh Casacca et al 1992) This
model is simple but meets most requirements for a good battery model It contains
most non-linear characteristics and is linked to the state of charge Most elements
included in this model are the functions of the state of charge or the open circuit
voltage which is also related to the state of charge The improved model is
studied in this chapter and implemented in MatlabSIMULINK environment
Figure 3-7 Improved Battery Model
34 Mathematical Model of the Lead-acid
Batteries
As the Improved Battery Model is able to reflect the major dynamic behaviours of
a battery and does not take much computation time it meets the requirements for
45
the project Therefore the mathematical model developed in this project is based
on the Improved Battery Model by involving the components of variable voltage
sources as the electromotive force ( EMF equal to the open circuit voltage OCV )
variable resistors as internal resistance and overvoltage resistance and a capacitor
as the capacitance of battery The description and the detailed analysis of the
model are given in this section
341 Capacity
Based on the Peukertrsquos law introduced in Chapter 2 the relationship of capacity
with different discharge currents is obtained below
2121
2211
)( ttII
tItIC
k
kk
p
=
== (33)
And following the definition of battery capacity the capacity is
12
1
2111
1
21121121121222 )()())(()( I
kkkk
I CIItIIItIIIIItIIItICminusminus
=====
12
1
21 )( I
k
I CIICminus
=there4 (34)
where Cp is the one ampere capacity
CI2 CI1 is the capacity under the discharge current I2 I1
k is a constant that related to the battery
The equation of calculating the capacity by the discharging current can be
46
obtained through experiments (Ceraolo 2000 Barsali and Ceraolo 2002) An
experimental result is given as
m
c
c
IIK
CKIC
))(1(1)( 0
0minus+
= (35)
where )(00 ICC = which stands for the capacity when discharging at the rated
discharge rate usually the nominal capacity C10
cK is empirical coefficient and is 118 for lead-acid batteries
m is empirical coefficient of 120
This equation overcomes the inadequacies of the Peukertrsquos law The capacity
calculated by the Peukertrsquos law in a low discharge current is much larger than that
experimentally obtained (Ceraolo 2000)
With the parameters of 20118124420 ==== kKAIAhC c the simulation
study indicated that the capacities of low discharge rate (lt30A) in different
equations are quite similar as shown in Figure 3-8
47
0 5 10 15 20 25 30 35 40 45 500
10
20
30
40
50
60
70
80
Discharge Current (A)
Actu
al C
apacity (
Ah)
Based on Peukerts law
Based on the Equation 35
Based on the Equation 35
Based on thePeukerts Law
Figure 3-8 Battery Capacity vs Discharge Current
Variations of the cell temperature also affect the battery capacity The effect of
temperature on the battery capacity is described by the following equation
(Ceraolo 2000 Barsali and Ceraolo 2002)
ε
θ
θθ
minus+=
f
ICIC 1)()( 0 (36)
where fθ is the electrolyte freezing temperature and is equal to -40˚C
θ is the cell temperature
)(0 IC is the capacity of battery under the discharge current I at 0˚C
ε is a constant that equals to 129
48
Therefore
m
c
f
c
IIK
CK
IC))(1(1
1
)(
0
minus+
+
=
ε
θ
θ
θ (37)
342 Electric Networks
Figure 3-9 (Ceraolo 2000 Barsali and Ceraolo 2002) shows an adaptation of
electric network based on the improved battery model shown in Figure 3-7 The
major change of this equivalent circuit is that the self-discharge is not taken into
account because the self discharge is usually less than 10 per month in modern
technologies which can be ignored in normal applications
Figure 3-9 Lead-acid Battery Equivalent Network
In the figure mE in this the main branch represents the electromotive force of the
battery and Vb stands for the terminal voltage The mZ in the figure stands for the
internal impedance that can be approximated by two R-C blocks
49
Battery is an energy storage device but not all the energy that the battery gets
from the charger can be stored when a battery is charged Part of this energy is
lost for different reasons like water electrolysis A parasitic branch is therefore
added to the model to represent the energy loss This part is claimed to work only
when the battery is being charged (Ceraolo 2000 Barsali and Ceraolo 2002) In
this project the current of the parasitic branch pI in the figure can be described as
an equation of the voltage of the parasitic branch PNV instead of a simple resistor
pR because of the nonlinear character of the parasitic branch This issue will be
discussed in later sections
As a result of these factors an equivalent electric network of in Figure 3-9 is
designed as shown in Figure 3-10 in which 1C 1R and 0R are the elements of the
internal impedance mZ It is used in the whole project as the electric network of
mathematical model
Figure 3-10 The Equivalent Network with the Approximated mZ
50
343 State of Charge and Depth of Discharge
In Chapter 2 Equations 27 and 28 show the definitions of SOC and DOC of a
battery In the model the nominal capacity can be treated as C(0θ) while the
actual capacity is C(Iavg θ) therefore
)0(1 θCQSOC eminus= (38)
)(1 θavge ICQDOC minus= (39)
where σσ dItQt
e int=0
)()( is the charge already drained from the battery
)0( θC is the nominal capacity of battery
)( θavgIC stands for the actual capacity under the specific discharge
current
344 Electromotive Force of the Battery
The electromotive force of a battery which is Em in Figure 3-10 is the difference
between the electric potential of the two electrodes and can be calculated by the
Nernstrsquos equation (Eq 26)
)(
)()(log029600412
2
2
24
10OH
SOHEMF
α
ααminus+
+=
This equation gives a description of the electromotive force by the activity of
different matter in the sulphuric acid which is described as lsquoαrsquo When the battery
51
is being charged or discharged the electrolyte concentration changes and the
activity value of H+ SO42- and H2O in the Nernstrsquos equation changes which can
be found by the study of battery that is the EMF of battery will change as the
result of the change of state of charge The relationship between SOC and the
activity α is unknown but it is obviously that when the state of charge increases
the quotient of )(
)()(
2
2
24
OH
SOH
α
ααminus+
also increases This shows that the EMF rises
when the state of charge is increasing
From the literatures (Ceraolo 2000 Barsali and Ceraolo 2002) the electromotive
force is described simply as the following equation
)1)(273(0 SOCKEE Emm minusminusminusminus++++minusminusminusminus==== θ (310)
where 0mE and EK are constants for a battery
θ is the temperature of the cell
SOC is the state of charge of the battery
345 Internal Resistance of a Battery
The resistances of a battery as shown in Figure 3-10 can be calculated by the
equations (Ceraolo 2000 Barsali and Ceraolo 2002)
)]1(1[ 0000 SOCARR minus+= (311)
)ln(101 DOCRR minus= (312)
52
)exp(1 22
)]1([
202
21
IIA
eRR
m
SOCA
+=
minus
(313)
where 0A 21A and 22A are constants for a battery while 00R 10R 20R are
parameters related to the SOH which will be discussed in later chapters For the
model 020 asympR and can be omitted when a battery is discharging
Therefore the internal resistance of a cell when discharging is
)ln()]1(1[ 1000010 DOCRSOCARRRr minusminus+=+= (314)
346 The Behaviour of Parasitic Branch
When the battery is being charged there are some losses as represented by the
parasitic current This current depends on the electrolyte temperature and the
voltage at the parasitic branch (Ceraolo 2000)
Because the behaviour of parasitic branch is non-linear Tafel gassing-current
relationship is used instead of a simple resistance pR (Ceraolo 2000)
minus+= )1(exp
0
0
f
p
P
PNPPNp A
V
VGVI
θ
θ (315)
where pI is the current of the parasitic branch
PNV is the voltage of the parasitic branch
53
0PG is a constant in seconds
0PV is a constant in volt
pA is a constant
θ is the electrolyte temperature
fθ is the electrolyte freezing temperature and is equal to -40˚C
When the battery is being discharged 0asymppI the parasitic branch could be
omitted from the model in simulation if the charging behaviour is not necessary
to discuss
347 Main Branch Capacitance
In the electric network of the model there is an R-C circuit as shown in Figure
3-11
Figure 3-11 R-C block
where Im is the discharge current
IC1 is the current flow through the capacity branch
54
I1 is the current of R1
VR1 is the voltage over the R-C block
This branch can be solved by
))(
()( 11111111
dt
tdVCIRIIRIRV R
mCmR minusminusminusminus====minusminusminusminus====sdotsdotsdotsdot==== (316)
)()()(
111
11 tIRtVdt
tdVCR mR
R====++++ (317)
This is the differential equation that represents the main branch behaviour
Laplace transform is employed to solve this problem
)()( 1111 sIRsVSCR mR sdotsdotsdotsdot====sdotsdotsdotsdotsdotsdotsdotsdotsdotsdotsdotsdot (318)
1
)(
11
11
++++
sdotsdotsdotsdot====
SCR
sIRV m
R (319)
++++
====++++
========
SCR
C
SCR
R
I
VsG R
11
1
11
11
1
1
1)( (320)
where τ=11CR is the time constant that represents the double layer capacitance
When the current has a shape like a step and the initial voltage of the capacitor is
equal zero the solution in time becomes
m
t
R IeRtV )1()( 11τ
minus
minus= (321)
55
It is obviously that this equation is the typical form of the voltage with an R-C
circuit
348 Thermal Behaviour of a Battery
When the battery is charging or discharging there is a current flow through the
battery so that it produces heat due to the Joules law
0
2
1
2
12 RIRVIVVIP RPNps sdot++sdot+sdot= (322)
When discharging the parasitic branch and R2 are omitted the equation becomes
0
2
1
2
1 RIRVP Rs sdot+= (323)
The dynamic equation of cell temperature and the power is (Ceraolo 2000)
s
a PRdt
dC +
minus=
θ
θ
θθθ (324)
where θC is the thermal capacitance
θR is the thermal resistance between the battery and the environment
θ is the cell temperature and aθ is the environment temperature
56
35 Mathematical Model of the Lead-acid
Batteries
Considering the behaviour of capacity state of charge and depth of discharge
electromotive force and internal resistance an Improved Battery Model based on
the equivalent circuit shown in Figure 3-10 was introduced in previous sections
The battery model for the complete discharging progress can be derived as the
following equations
m
c
f
c
IIK
CK
IC))(1(1
)1(
)(
0
minus+
+
=
ε
θ
θ
θ (325)
σσ dItQt
e int=0
)()( (326)
)0(1 θCQSOC eminusminusminusminus==== (327)
)(1 θavge ICQDOC minusminusminusminus==== (328)
)1)(273(0 SOCKEE Emm minus+minus= θ (329)
)]1(1[ 0000 SOCARR minus+= (330)
)ln(101 DOCRR minus= (331)
1
1R
Cτ
= (332)
IeRtV
t
R sdotminussdot=minus
)1()( 11τ (333)
0
2
1
2
1 RIRVP Rs sdot+= (334)
57
sa P
Rdt
dC +
minus=
θ
θ
θθθ
(335)
)( θIC in the equations is the expression of capacity of battery when discharging
under the discharge current I and at a temperature of θ 0C stands for the
capacitance when discharging at the rated discharge current I while parameters
fθ and ε are constants in this model )(tQe represents the charge already
consumed while the equation of mE indicates the mathematical description of
electromotive force corresponding to the SOC and the cell temperature in which
0mE EK are constants for a battery 00R 10R are parameters related to the SOH
and the discharge current can also affect them τ in the equations are the time
constant of the R-C circuit which represents the time it takes the systems step
response to reach ( 6311 asympminus e ) of its asymptotic value The last two equations
represent the thermal dynamic of battery in which sP is the Joule heat generated
by the internal resistance θC is the thermal capacitance and θR is the thermal
resistance between the battery and the environment
36 Summary and Discussion
The Improved Battery Model based on the electric equivalent circuit is presented
in this chapter and it is proved that it can satisfy all the three requirements to serve
the project objectives This battery model consists of a variable voltage source
several R-C blocks and a parasitic branch as its electric network and the elements
are described as a variable related to the capacitance the charge consumption and
58
the cell temperature as well
However experimental tests show that the behaviour of the battery is much more
complicated can be represented by this equivalent circuit model For example the
internal resistance varies when discharging under different current and the time
constant of the R-C circuit at the beginning and end of discharge as well
Therefore the model has to be improved The next chapter overcomes these
problems found in the experimental tests and some improvements of the model
are described
59
Chapter 4
Experimental System Set up and
Improved Battery Model
Simulation Implementation
Experimental tests based on a 12V-13 Ah lead-acid battery are carried out and the
test system is introduced at the beginning of this chapter Some of the
characteristics of the battery can be found in the tests which has shown that the
battery model described previously is not accurate enough and improvements
have to be implemented into the model This chapter will focus on the analysis of
the battery characteristics and the description of the improvements implemented
In the last part of this chapter a finalised version of the battery model used in this
project is given and implemented in the MatlabSIMULINK environment for
simulation study
41 The Experimental System
In this experimental test system a variable resistor is used as the load of the
battery Three sensors are employed in the whole experiment process two current
sensors and one voltage sensor The equivalent circuit of the test rig designed for
the research purpose is shown in Figure 4-1
60
Figure 4-1 Equivalent Circuit of the Experimental Test Rig
In this figure the ideal voltage source EMF accompanying with the internal
resistance r acts as a lead-acid battery with 6 cells (12V) the terminals of the
battery are connected in parallel to a voltage sensor Switch Krsquo is employed to
control the voltage sensor connection so that the sensor can be disconnected from
the battery when the experiment is not being in progress to avoid an unnecessary
discharge The circuit break in Figure 4-1 can be used as a main controller which
decides whether the load is engaged to the battery to discharge or not Switch K
in the experiment is to vary the load of the system This experimental test system
is mainly designed for two different experimental tests of a battery in this study
constant-impedance load discharge and two-load discharge Figure 4-2 shows the
actual laboratory test rig used in the project
61
Figure 4-2 Experimental Test Rig
The data is collected and recorded every half second by a data acquisition card
PCI-6251 from National Instruments with the software environment of LabVIEW
and a 12V-13Ah lead-acid battery (marked in the red-dashed square in Figure 4-2)
is employed in the project as test batteries for the battery performance study
42 Improvements of the Battery Model
Figure 4-3 and Figure 4-4 show the typical data collected from the experimental
test rig Figure 4-3 is the result of a constant-impedance load discharge test with a
discharge current of 075A approximately and Figure 4-4 shows two-load
discharge with the discharge currents of 075A and 12A respectively
62
0 500 1000 1500 2000 2500 3000 3500 4000 4500 5000-02
0
02
04
06
08
1
12
Time (s)
Dis
charg
e C
urr
ent
(A)
0 500 1000 1500 2000 2500 3000 3500 4000 4500 5000105
11
115
12
125
13
Time (s)
Term
inal V
oltage (
V)
Figure 4-3 Test of constant-impedance load discharge top figure shows the discharge current of the experimental test and the bottom one shows the terminal
voltage 1τ is the time parameter of the R-C block at the beginning of the
discharge and 2τ is that when the discharge stopped
0 200 400 600 800 1000 1200 1400
0
05
1
15
Time (s)
Dis
charg
e C
urr
ent
(A)
0 200 400 600 800 1000 1200 1400118
12
122
124
126
128
Time (s)
Term
inal V
oltage (
V)
Figure 4-4 Test of two-load discharge top figure shows the discharge current of the experimental test and the bottom one shows the terminal voltage
I(t)RI1 and I(t)RI2 represent the voltage drop across the internal resistance value under different discharge current
1τ 2τ
I(t)RI1
I(t)RI2
I(t)RI1
63
421 The Change of τ in Different Charge Status
From analyzing these figures it is easy to find that it takes quite a long time for
the battery to have the steady terminal voltage when the discharge of battery stops
and it is longer than the time taken from the beginning of the discharge This
difference means that when the battery starts to discharge the time parameter
11CR=τ in the main branch equation (332) is not equal to that when the
discharge has just stopped In Figure 4-3 it is shown that when the discharge stops
the time parameterτ is longer than that when the discharge starts
As a result of this experimental feature a switch is employed to implement the
change of time parameter to match those described in the mathematical model of
the battery The switch is used to control the value of the time parameter τ in
different discharge currents When the battery is discharging the discharge current
is a positive value and the time parameter τ is equal to 1τ When the battery is
not discharging the discharge current is equal to 0 in theory and the time
parameter has a different value 2τ
Although the discharge current should be equal to 0 theoretically it is hard to
achieve this in the real experimental measurement because of the inaccuracy of
the current sensor reading due to the inaccuracy occurred in the power supply to
the sensor Therefore the trigger of the switch in the model is set to be 01 A that
is when the discharge current is greater than 01 A the time parameter is set to be
1τ as the battery is in its discharging segment By contrast the value of time
64
parameter is set to be 2τ and the discharge current is considered as the error
caused by the sensors when that current is less than 01 A
422 Analysis in Variations of the Internal Resistance
Another important issue found through analyzing the experimental test result is
that the internal resistance for a specific battery in a specific state of health (SOH)
is not a constant when the discharging current changes This difference is more
significant than the effect caused by the state of charge
For example in the two-load discharge results shown in Figure 4-4 when the
battery is not discharging the initial voltage is equal to the electromotive force
(EMF1) When the battery began to discharge at the discharge current I1 the
terminal voltage dropped to V1 After the discharge stopped for a while the value
of the terminal voltage is equal to the electromotive force (EMF2) at that state of
charge (SOC2) Then the discharge of the battery starts again at a current of I2 and
the terminal voltage dropped to V2 The discharge progress is then stopped for
certain of a time period to get the steady terminal voltage (EMF3) at that state of
charge (SOC3) After that the test of discharge at the I3 = I1 was repeated again
and get another terminal voltage of V3 The last discharge test is done to provide
the evidence for the fact that this change in the internal resistance is not caused by
the change of the state of charge (SOC)
The value of electromotive force in a discharging battery is equal to the sum of the
terminal voltage and the voltage that the internal resistance takes that is
65
nnnn IrVEMF sdot+=
Therefore the internal resistance can be calculated by
n
nnn
I
VEMFr
minus= (41)
From the data collected in the experiment the key parameter values for the graphs
shown in Figure 4-4 can be found as listed in Table 4-1
Table 4-1 Approximate Internal Resistance Calculating
n 1 2 3
Electromotive Force (EMFn) 1260V 1252V 1238V
Discharge Current (In) 078A 114A 076A
Terminal Voltage (Vn) 1219V 1203V 1197V
Substituting these values into Equation 41 the internal resistance can be
calculated Ω=Ω=Ω= 539043005260 321 rrr
This change of the internal resistance can cause quite a significant effect in the
discharge progress This problem can be possibly solved in a number of ways
One possible choice is to find a curve of the internal resistance change and the
discharge current for a specific battery after a certain numbers of experimental
tests But this method needs huge efforts in conducting experimental tests and the
result is not very meaningful for the project considering the time cost Another
possibility is to conduct the experimental tests with a constant load Therefore the
change of internal resistance caused by the change of discharge current could be
ignored As a result in the whole process of this project the same load is
66
employed either in the constant-impedance load discharge or in the two-load
discharge tests
In order to implement the different internal resistance value when discharging
under different load a switch that can control the parameters R00 and R10 is
employed This switch is controlled by the discharge current which is the main
input of the mathematical model In the two-load discharge tests when the switch
K in Figure 4-1 is switched off there is only one load is connected to the battery
terminals and the discharge current is lower the values of R00 and R10 are
switched to the first set of parameters R001 and R101 To the contrast when K is
switched on the discharge current is higher and the values are switched to the
second set R002 and R102
423 Improved Lead-Acid Battery Mathematical Model
From the model described in Chapter 3 and the improvements studied in this
chapter the mathematical model of lead-acid battery when discharging in different
discharge currents can be described as the following equations
m
c
f
c
IIK
CK
IC))(1(1
)1(
)(
0
minus+
+
=
ε
θ
θ
θ (42)
ττ dItQt
e int=0
)()( (43)
)0(1 θCQSOC eminusminusminusminus==== (44)
)(1 θavge ICQDOC minusminusminusminus==== (45)
67
)1)(273(0 SOCKEE Emm minusminusminusminus++++minusminusminusminus==== θ (46)
)]1(1[ 0000 SOCARR minusminusminusminus++++==== (47)
)ln(101 DOCRR minusminusminusminus==== (48)
11
RC
τ= (49)
IeRtV
t
R sdotminussdot=minus
)1()( 11τ (410)
RIRVP Rs sdot+=2
12
1 (411)
sa P
Rdt
dC +
minus=
θ
θ
θθθ
(412)
)(
)(
2
1
002
001
00Load
Load
R
RR
= (413)
)(
)(
2
1
102
101
10Load
Load
R
RR
= (414)
)10(
)10(
2
1
AI
AI
lt
gt
=τ
ττ (415)
001R 002R 101R 202R and 1τ 2τ in the equations stand for different parameter
values of 10R 20R and τ when the load and charge status changes in order to
reflect the improvements described in this chapter For a two-load discharge test
there are ten important unknown parameters in the equations of the mathematical
model which are unknown for a specific battery 0C 0mE EK 001R 002R 101R
102R 1τ 2τ and 0A As the internal resistance R00 and R10 vary only when the
load changes they can be treated as constants in the constant-impedance load
68
discharge tests the key parameters are therefore 21100000 ττRRKEC Em
and 0A In this project the study of state of health is based on constant-impedance
load discharge The identification of these unknown parameters will be discussed
in Chapter 5
43 Simulation Study
The processes described above have been implemented in SIMULINK as a
simulation model for computer based analysis The simulation program consists of
two main function blocks circuit block and thermal block The structure of the
SIMULINK implementation is described in Figure 4-5
69
Figure 4-5 Structure of model for SIMULINK Implementation
70
As shown in the figure there are mainly two inputs in the model the discharge
current and the discharge time The actual capacity of battery can be then
calculated with the knowledge of rated capacity and the discharge current The
actual capacity is also influenced by the cell temperature At the beginning of
discharge the cell temperature is the same as the surrounding temperature
Integrating the discharge current with respect to time is the capacity consumed in
the discharge progress and then the state of charge and the depth of charge can be
obtained It is shown that the electromotive force and the internal resistance vary
as a result of changing in the state of charge and the depth of charge and the
terminal voltage can be calculated
In the thermal block of the model the heat generated by the current and the
internal resistance are calculated by the Joules law Then this energy is
transferred to calculate the thermal temperature of the cell and the cell
temperature is given back to the circuit block to affect the actual capacity
71
0 1000 2000 3000 4000 5000 6000 7000
0
02
04
06
08
1
Time (s)
Dis
charg
e C
urr
ent
(A)
0 1000 2000 3000 4000 5000 6000 7000105
11
115
12
125
13
Time (s)
Term
inal V
oltage (
V)
Figure 4-6 Terminal Voltage of Battery (Constant Discharge Current SIMULINK)
The result in Figure 4-6 shows the terminal voltage of a battery which discharges
under the current of 08A in a simulation study Since the discharge begins the
voltage drops due to the internal resistance and the change of state of charge (SOC)
and it climbs up when the discharge stops However the voltage changes
gradually because of the time parameter τ This result shows a good qualitative
agreement with the experimental test results
72
44 Summary and Discussion
This chapter introduces the laboratory test system designed for the project and the
limitation of the mathematical model described in Chapter 3 Switches on the time
parameter τ and the internal resistance parameters R00 and R10 have been added to
the model so that the model is able to represent the change of these parameters
found in the experimental tests The implementation of the model under the
MatlabSIMULINK environment is described and the simulation study shows a
good qualitative agreement with the experimental test results
The next chapter will focus on the identification of those unknown parameters of
the battery model that are important for revealing the battery characteristics
including 20100000 τARRKEC Em and 1τ
73
Chapter 5
Model Parameter Identification
and Model Validation
The identification of the unknown parameters 20100000 τARRKEC Em and 1τ
in the mathematical model will be introduced in this chapter
51 Need for the Optimization Algorithms
In those equations of the battery model described previously some parameters are
unknown and some of them are difficult to derive from physics or engineering
principles or to be obtained through experimental tests Therefore the
identification of the model unknown parameters becomes an important part for the
project Parameter identification is an optimization process that adjusts the
parameters to enable the simulation results to show the best agreement with the
results acquired by the experimental tests There are many algorithms available
for optimization and the principle of the optimization process for the project is to
minimize the objective function The objective function is formed by the absolute
value of the difference between the simulated and experimental results at each
time point The set of parameters to achieve the least value of the objective
function is considered to be the fittest set
74
There are two basic requirements of the optimization in this project First of all as
the problem for the solutions trapped to the local minima is a very important and
challenging issue in many linear optimization solvers the optimization algorithm
used in this project must be able to find the global minimum Secondly the
optimization algorithm not only should find the minimum value of the objective
function but also can tell the values of the parameters that result in the best fitness
which is needed for the analysis purpose in this project Finally the time cost is
also an important factor in selection of a suitable optimization algorithm
It needs to point that the objective here is to identify the unknown parameters of a
model with an already known structure If the objective is to identify or
approximate unknown model structures the selection of optimisation methods
will be quite different In the case of latter Neural Network Genetic
Programming and Fuzzy Logical will be more suitable choices To concentrate on
the objective of the project the thesis will focus on optimisation algorithms for
parameter identification
52 Overview of the Optimization Algorithms
Brute-force search is the most basic direct search algorithm that is used to find the
minimum value In the brute-force search the initial guess is the minimum
possibility of parameters and increasesdecreases The parameter
increasesdecreases step by step in each iteration and the best solution can be
75
searched This algorithm is the simplest but its disadvantage is also obvious that
is it is the slowest optimization method especially when used in the identification
of more than two parameters and the results are largely dependent on the initial
guesses
Linear search is an optimization method to solve the linear optimization problem
the preference function of which is linear and the feasible domain is defined by a
linear constraint function The linear constraints define a convex polyhedron
geometrically which is called the feasible region The algorithm is to construct an
admission solution at a vertex of the polyhedron and then along edges of the
polyhedron to vertices with successively higher values of the objective function
until the optimum is reached
Besides the basic optimization methods evolution computation technology is
becoming increasingly popular A range of different evolution computation
technologies can solve the optimization problem in this project including genetic
algorithms (GAs) particle swarm optimization (PSO)
Genetic Algorithms are direct search algorithms inspired from the process of
evolution in nature the natural selection Based on the principle of survival of the
fittest the GAs can produce better and better approximations to the global optimal
solution in a number of generations In each generation a new group of solutions
is created by the fitness level in the problem of every individual in the last
generation The solutions are then bred together to lead to the evolution of
individuals
76
Particle swarm optimization is a stochastic population-based computer algorithm
modelled on swarm intelligence that searches for a solution to an optimization
problem in a search space Based on the social psychological principles each
individual called lsquoparticlersquo in PSO is able to provide information to others and
also learn the success from the local best and the global best The movement of
each particle through the search space are guided by these successes and the
solution can be found after a number of generations
It has been proved by Dr Jianlin in his PhD Thesis (Wei 2007) that both Genetic
Algorithm and Particle Swarm optimization are capable of the model parameter
identification But the Particle Swarm optimization is a new algorithm that first
described in 1995 and it is not as common as Genetic Algorithm in the research
areas
The purpose of this research work is to find a method for parameter estimation
Genetic algorithms are well proven solution for complicated optimisation
problems and have been applied successfully in a range of similar problems (Wei
2007 Wei Wang et al 2007) Genetic algorithms are also well suited to problems
with many local minima In the current work the exact form of the fitness
function is unknown and it is therefore important to select a robust technique
which can identify good overall solutions For these reasons GA was selected to
give the best possible chance of satisfying the overall project objectives within the
limited timeframe of the project
77
53 The Study of the Genetic Algorithms
The process of Genetic Algorithm is reviewed in this section to provide an insight
into how GAs work and simulation study of two bench mark functions are carried
out
531 Working Principle of GAs
There are many methods used to implement a GA process and usually a GA is at
least composed of three common genetic operators Selection Crossover and
Mutation (Pham and Karaboga 1998) The flowchart of a simple GA process is
given in Figure 5-1
As a preparation to start the optimization process a GA requires a group of initial
solutions as the first generation The first generation is usually a group of
randomly produced solutions created by a random number generator The
population which is the number of individuals in a generation should be big
enough so that there could be a reasonable amount of genetic diversity in the
population Also it should be small enough for each generation to be computed in
a reasonable period of time using the computer resources available Typically a
population includes individuals between 20 and 100 (Chipperfield Fleming et al
1994A)
78
Figure 5-1 Flowchart of a Simple Genetic Algorithm (Pham and Karaboga 1998)
The fitness function is evaluated to measure how close that the individuals fit the
desired result A fitness function could be either complex or simple depending on
the optimization problem addressed In a case of minimization problem the most
fitted individuals will have the lowest numerical value of the associated fitness
function
No
Yes
Selection
Crossover
Mutation
Find the Best Individual
Generate initial population
Results
Evaluate fitness values
Operators of generating new
generation
Gengt 100
Evaluation
Start
79
Individuals are selected according to a fitness-based process The operator of
selection is made up of ranking and selection progress by which more copies of
the individuals that fit the optimization problem better will be produced in the
next generation In GAs there are mainly two ways to select a new population
Roulette Wheel Selection (RWS) and Stochastic Universal Sampling (SUS)
The individuals will be recombined (crossover) after the selection This operation
is to produce two new individuals from two existing individuals selected by the
operator of selection by cutting them at one or more position and exchanging the
parts following the cut The new individuals therefore can inherit some parts of
both parentsrsquo genetic material There are usually four ways of doing this one-
point crossover two-point crossover cycle crossover and uniform crossover
(Pham and Karaboga 1998) Figure 5-2 (a) shows an example of the two-point
crossover progress
Mutation is another operator to produce new individuals The difference is that the
new individual is produced from a single old one In this operation the bit values
of each individual are randomly reversed according to a specified property A
mutation can also helps the GA to avoid local optimums and find the global best
solution Figure 5-2 (b) represents how the mutation operator works
80
Figure 5-2 (a) Crossover operation (b) Mutation operation
The group of individuals produced after the mutation is the second generation
Then the fitness value of each individual in the second generation is computed
again This cycle will not stop until the result is close enough or after a certain
generation
Three major Matlab toolboxes are applied in the current market for application
purpose they are Genetic Algorithms Toolbox V12 (Chipperfield Fleming et al
1994B) the Genetic Algorithms Optimization Toolbox V11 (Houck Joines et al
1995) Genetic Algorithm Direct Search Toolbox V102 (MathWorks Inc 2004)
In this project the official toolbox in Matlab form Mathworks Inc is employed
The property settings for the project based on Dr Weirsquos thesis (Wei 2007) are
shown in Table 5-1
Parent 1 1 1 0 0 1 0 1 1 0 1 0 1 1
Parent 2 0 1 1 0 1 1 0 0 1 0 1 0 0
Offspring 1 1 1 0 0 1 1 0 0 1 1 0 1 1
Offspring 2 0 1 1 0 1 0 1 1 0 0 1 0 0
(a)
Parent 1 1 0 0 1 1 0 0 1 1 0 1 1
Offspring 1 1 0 0 1 0 0 0 1 1 0 1 1
(b)
81
Table 5-1 The property settings for Genetic Algorithms
Name of the GA properties Value of the GA properties
Number of generations 100
Population size 20
Fitness assignment Rank-base fitness assignment
Selection Stochastic universal sampling
Crossover Scattered crossover
Crossover rate 07
Mutation function Uniform mutation
Mutation rate 01
Population size specifies how many individuals there are in each generation With
a large population size the genetic algorithm searches the solution space more
thoroughly and the gives more possibility to return the global minimum The
number of generations specifies the maximum number of iterations for the genetic
algorithm to perform If this number is too low the genetic algorithm is not able
convergence to the global solution However either a large population size or a
large number of generations can cause the algorithm to run more slowly The
crossover rate and the mutation rate are properties that control the crossover and
mutation operator High rate of these values means that the genetic algorithm has
a higher opportunity of producing new offspring but it can be easy to miss the
current best solution if these values are too big
Initial tests of genetic algorithms on different properties show that the values
shown in table 5-1 are able to find an adequate solution Similar results would be
82
obtained if the values of the generations and the population size are larger but
costing more CPU time The crossover rate and the mutation rate would not affect
the result significantly if only varies in a small range But it is impossible to prove
that these two values are the best choice due to the strong randomness
532 Simulation Studies of Genetic Algorithms
In order to test and demonstrate that Genetic Algorithms are able to meet the
requirements of the project simulation studies have been carried out Two
benchmark functions that are commonly used in evaluating evolutionary
computation algorithms are employed for the simulation studies They are
1) Rastrigin function
Rastrigin function is a typical example of non-linear multimodal function with
many local minima The problem of looking for the global minimum is quite
difficult due to its large search space and its large number of local minima The
function is shown as
))2cos(10(10)(1
2sum=
sdotsdotminus+sdot=
n
i
ii xxnXf πr
where n is the dimension of the problem and 1x ~ nx are the coefficients to be
identified Figure 5-2 shows a 2-dimensional Rastriginrsquos function while figure 5-3
is a contour plot of Rastrigins function shows the alternating maxima and minima
83
The global minimum of the Rastriginrsquos function is 0)( =Xfr
when
021 ==== nxxx L
Figure 5-2 2-dimensional Rastrigins function (MathWorks Inc 2004)
84
Figure 5-3 Contour plot of Rastrigins function (MathWorks Inc 2004)
In the simulation study a ten dimensional Rastriginrsquos function is adopted Figure
5-4 shows the best optimization performance of the Rastriginrsquos function in each
generation It is shown that after 700 generations a global optimal value is
obtained
85
0 100 200 300 400 500 600 700 800 900 10000
10
20
30
40
50
60
70
80Best 00099429
Generation
Fitness v
alu
e
Best f itness
Figure 5-4 GA performance (Rastrigrinrsquos function)
2) Rosenbrock function
Rosenbrock function is another mathematical function used as a test problem for
optimization algorithms The global minimum is inside a long narrow parabolic
shaped flat valley To find the valley is trivial but to converge to the global
minimum is difficult The Rosenbrock function is defined by
sum=
+ minus+minus=
n
i
iii xxxXf
1
2221 ))1()(100()(
r
where n is the dimension of the problem and 1x ~ nx are the coefficients to be
identified Figure 5-5 shows a 2-dimensional Rosenbrock function
86
The global minimum of the Rosenbrock function is 0)( =Xfr
when
121 ==== nxxx L The same as the Rastriginrsquos function a ten dimensional
Rosenbrock function is adopted for the simulation study Figure 5-6 is the GA
performance to the Rosenbrock function It can be found that the optimization
converges and get the global optimal value after 300 generations
Figure 5-5 2-dimensional Rosenbrock function (MathWorks Inc 2004)
87
0 100 200 300 400 500 600 700 800 900 10000
200
400
600
800
1000
1200Best 060113
Generation
Fitness v
alu
e
Best fitness
Figure 5-6 GA performance (Rosenbrock function)
54 Model Parameter Identification
541 Implementation of Genetic Algorithms and
Experimental Data sets
In this project the Genetic Algorithm Direct Search Toolbox V102 developed by
Mathworks Inc is employed to identify the parameters of the battery model The
process is shown in Figure 5-7
88
Figure 5-7 Progress of Parameter Identification
The fitness function is used in the project and the parameter identification is to
minimize the fitness function so that the model output can fit the experimental
result The fitness function is given as
sum
sum sumsum
minussdot=
minussdot++minussdot+minussdot=
minus
1
0
2
1 1
1
0
))()(()(
)()()(
exp
expexp2exp1
t
t
sim
t
t
t
t
simnsim
t
t
sim
tVtVabstW
VVabsWVVabsWVVabsWfitnessn
n
L
where Vexp is the experimental terminal voltage data
Vsim is the simulated terminal voltage
Wt is the weights of the difference in the simulated and experimental
results
This fitness function represents the sum of the error values at each time interval
Mathematical Model of a six-cell
Lead Acid Battery
Experimental Test
Results
Fitness
Function
Discharge Current
Simulation
Output
Terminal Voltage
Simulation
Input
lt fmin
Genetic Algorithms (Selection Crossover and Mutation
etc)
Parameter Update
Yes
No
Stop
89
considered ( ntt minus0 ) The weight coefficients Wt indicates how important the
weighted part is in the optimization and how much it contribute to the
optimisation process Periods with bigger tW values are more important because
the sum of errors will give big value contribution to the fitness function value and
the optimisation process will pay more attention to the higher weighted error parts
In the experiments and optimization process it is found that the results were more
important when the discharge of a battery at the stage of stopping Therefore the
weight in this period is greater than that of the others The weighting coefficient
values in this project are determined by the results of the first several attempts of
parameter identification The period of simulation data that fails to fit the test
result means that the weight value is not big enough until the overall performance
of simulation is reasonable
Following the objective fitness function unknown coefficients of the battery
model are identified using experimental data The mathematical model of a six-
cell lead-acid battery in the figure is described in Chapter 4 and the parameters are
to be identified by Genetic Algorithms are 210100000 ττARRKEC Em
Three sets of experimental tests have been carried out for the purpose of
parameter identification and the validation of the mathematical model These three
experimental results are based on a lead-acid battery with the ideal capacity of 13
Ampere-hours under the discharge current of 08A
90
542 Parameters of Battery Model
The parameters of the mathematical model of a lead-acid battery are identified
using Genetic Algorithms and the predicted battery responses using the identified
parameters are compared with the simulated results One set of typical values of
parameters identified are listed in Table 5-2
Table 5-2 Identified parameters identified by the Genetic
Algorithms in the model of 12V-13Ah lead-acid battery Parameter Value Parameter Value
0C 48198 (Amp-Sec) 0mE 21465 (V)
EK 0001109 (V) 0A 29895
00R 001038 (Ohm) 10R 012196 (Ohm)
1τ 21052 (s) 2τ 17565 (s)
Figure 5-8 shows the simulation results using the Improved Battery Model and the
change of weights defined for this set of result described in the fitness function
The top subplot of Figure 5-8 shows the weight value of the GA fitness function
described before while the middle figure is the discharge current of the
experimental test which is also the input of the mathematical model In the
following test results in this and next chapter the changes of weight value are
similar so they are not shown in the figures
The blue line marked as ldquoExperimental Terminal Voltagerdquo in the bottom figure
represents the measured outputs while the other one (Simulated Terminal Voltage)
represents the simulation results The simulation results are ldquonoisyrdquo because
experimental discharge current is used as the input of model in the simulation
91
progress It is obviously that Figure 5-8 shows a good overall agreement of the
results although some slope when discharging is not perfect
0 500 1000 1500 2000 2500 3000 3500
1
15
Time (s)
Weig
ht
0 500 1000 1500 2000 2500 3000 3500114
116
118
12
122
124
126
128
13
Time (s)
Term
inal V
oltage (
V)
Experimental Terminal Voltage
Simulated Terminal Voltage
0 500 1000 1500 2000 2500 3000 3500
0
05
1
Time (s)
Dis
charg
e C
urr
ent
Simulated Terminal Voltage
Experimental Terminal Voltage
Figure 5-8 Measured and Simulated Result after Parameter Identification
Figure 5-9 shows the mean fitness value and the best in each generation It can be
seen that the best fitness in each generation is decreasing The mean fitness is
unstable because of the mutation operator in the GA that can attempt to find better
solutions
92
0 10 20 30 40 50 60 70 80 90 100100
150
200
250
300
350
400
450
500
550
Generation
Fitness v
alu
e
Best 1075521 Mean 1312731
Best f itness
Mean fitness
Figure 5-9 Mean and the Best Fitness Values in Each Generation
543 Battery Model Validation
In order to validate the battery mathematical model two sets of experimental tests
have been adopted to compare with the simulation results
The inputs of the discharge current and the validation results using two
experimental tests are shown in Figure 5-10 and Figure 5-11
93
0 500 1000 1500 2000 2500 3000114
116
118
12
122
124
126
128
13
Time (s)
Term
inal V
oltage (
V)
Simulated Terminal Voltage
Experimental Terminal Voltage
Simulated Terminal Voltage
Experimental Terminal Voltage
Figure 5-10 Measured and Simulated Terminal Voltage (Validation data 1)
In the simulation that shows in Figure 5-10 the discharge of battery begins at the
time of 700s and the simulation result shows a reasonable agreement with the
experimental result despite the noise of signal caused by the error of the sensors
It is noticed that at the beginning of the discharge there is a difference between
the simulated and experimental terminal voltages for about 100 seconds This
difference is studied and so called lsquocoup de fouetrsquo which often takes place at the
beginning of a discharge test when the SOC of battery is high (Perrin Delaille et
al 2006) However this lsquocoup de fouetrsquo behaviour cannot be described in this
model The discharge period lasts for about 1200 seconds and then stops and after
that the simulation has the similar result with the experiment
94
0 1000 2000 3000 4000 5000 600011
112
114
116
118
12
122
124
126
128
13
Time (s)
Term
inal V
oltage (
V)
Simulated Terminal Voltage
Experimental Terminal Voltage
Simulated Terminal Voltage
Experiment Terminal Voltage
Figure 5-11 Measured and Simulated Terminal Voltage (Validation data 2)
Figure 5-11 shows another group of experimental test to validate the battery
model At the beginning of the experiment the terminal voltage from the
experiment is dropping without any discharge behaviour of battery and that is
because of the experiment was carried out when the terminal voltage of lead-acid
battery is not steady enough after being charged and that also causes the
deviations in the discharge at about 1000-2000 seconds In this period the lsquocoup
de fouetrsquo appears again After the first period the battery is disconnected from the
load until the terminal voltage become steady and the simulation result in this
period fits the experiment result well In the second discharge of this test it is
shown that the lsquocoup de fouetrsquo does not occur because the SOC is not high For
the similar reason in the first discharge in this group of the test results there are
95
also some deviations in this period Finally the simulation result in the last part of
figure fits the experimental result is highly satisfied
The average error of the simulated outputs of the simulation studies and the
measured results are studied Absolute Error and Relative Error is defined as the
following equations
sum
sum
=
=
minus=
minus=
N
i
sim
N
i
sim
iV
iViV
NRelError
iViVN
AbsError
1 exp
exp
1
exp
)(
)()(1
)()(1
The absolute error and relative error are summarised in Table 5-3
Table 5-3 AbsError and RelError of Model Validation
Absolute Error Relative Error discharging relaxing overall discharging relaxing overall
Experimental Test 1 (Identification)
00229V 00207V 00217V 01833 01724 01776
Experimental Test 2 (Validation data 1)
00536V 00484V 00492V 04453 03872 04024
Experimental Test 1 (Validation data 2)
00724V 00372V 00485V 06352 03013 05025
55 Summary and Discussions
Identification of the unknown model parameters is discussed in this chapter and a
range of possibly suitable methods are reviewed in brief In this project Genetic
Algorithm is adopted GAs working principle and its implementation has been
96
introduced in details in this chapter The simulation study of two benchmark
functions that are commonly used in evaluating evolutionary computation
algorithms are employed in order to show the capability of GAs The parameter
identification by tests of a brand new 13Ah lead-acid battery is carried out and is
validated by two sets of other experimental test results under the same working
condition of the same battery
97
Chapter 6
The Analysis of State of Health
(SOH) in association with the
Internal Resistance
61 Methodology
As the number of discharge cycles of battery increases in applications the
maximum charges that a battery can offer will decrease In other words the SOH
battery is deteriorating But this drop of capacity is not linear and it is also a long
progress At the beginning of the use of battery the change of capacity is very
slow and it is not obvious After a number of cycles of discharge and charge this
change will get faster and relatively significant
There are no reliable methods now to calculate the remaining charge capacity
which is the only one determinant of the state of health The normal method is
simply to measure the voltage on its terminals But this measurement is not
accurate on an aged battery A battery in poor state of health but sufficiently
charged can also offer sufficient voltage to appear normal The only way to
determine the capacity accurately is to integrate the discharge current of battery in
a full deep discharge but this method cannot be used too frequently because deep
98
discharge is harmful for the battery
In the project six lead-acid batteries were tested using the test system described in
Chapter 4 These batteries were repeatedly discharged and charged for their whole
life time so that the information related to different state of health can be revealed
as soon as possible Even though the batteries works frequently it still takes more
than 6 months to make the battery become weak The testing experiments were
carried out and the data was recorded every 2-3 weeks so that important value of
state of health is not missed However as the change of capacity is a long progress
and it is nonlinear not all the data collected can be used in this project
Referring the literature (Coleman Lee et al 2006 Lakhdari and Midoun 2007
Coleman Hurley et al 2008) an important factor that reflects the change of state
of health of a lead-acid battery is the internal resistance Not only the state of
health but also other factors (SOC DOC discharge current etc) can result in
variations in internal resistance a new alternative method that based on the
Improved Battery Model in Chapter 4 is adopted in the project
From the model study in Chapter 4 the internal resistance can be divided into two
parts expressed by )]1(1[ 0000 SOCARR minusminusminusminus++++==== (Eq 47) and )ln(101 DOCRR minusminusminusminus====
(Eq 48) These equations show that the internal resistance is affected by the state
of charge (SOC) and depth of charge (DOC) in a discharge cycle In real
applications batteries are seldom discharged to the full range because a deep
discharge could cause some damage to the battery They are also seldom to be
charged to full to prevent the possibility of overcharge that could also bring some
99
negative effects Although this issue is not very significant in a valve regulated
lead acid battery it is better to control the working range of depth of charge from
50 to 80 approximately In this project the internal resistance of battery in the
depth of charge of 65 is studied as a most important factor that related to the
state of health As a little inaccurate of SOC and DOC will induce a comparative
big difference in the internal resistance the method of measuring the internal
resistance accurately by an external circuit is discarded
In Equation 47 and Equation 48 the author found that there are two other factors
that influence the internal resistance besides the SOC and the DOC R00 and R10
Therefore in the project the values of R00 and R10 in a specific discharge current
are very important to study the internal resistance The values of these two factors
are used in Equation 47 and Equation 48 to calculate the internal resistance per
cell of the battery The depth of charge is assumed to be 65 for a normal
working battery as described previously In chapter 3 the SOC and the DOC are
defined as )0(1 θCQSOC eminus= (Eq 44) and )(1 θavge ICQDOC minus= (Eq
45) The Capacity is also defined as equation 42
k
c
fc
IIK
CK
IC))(1(1
)1(
)(
0
minusminusminusminus++++
++++
====
ε
θ
θ
θ (61)
in which Kc = 118 k = 120 and 6 II avg times= in this project The relationship
between the actual capacity under discharge current Iavg and the nominal capacity
is
100
62
1
))(1(1
1
)0)(1(1
1
))(1(1
1
)0(
)(asymp
minus+=
minus+
minus+=
k
avgck
c
k
avgcavg
IIK
IK
IIK
C
IC
θ
θ (62)
Therefore the SOC when the DOC is 65 is
586))0(62(1)0(1 asympsdotminus=minus= θθ CQCQSOC ee (63)
As described in chapter 5 30 asympA therefore the internal resistance of an
individual cell can be obtained by
10001000010 43041)ln()]1(1[ RRDOCRSOCARRRrcell sdot+sdotasympminusminus+=+= (64)
and for a six-cell lead-acid battery the internal resistance
1000 582486 RRrr cellbattery sdot+sdot=times= (65)
62 The identification of C0 R00 and R10
In the eight parameters identified previously in Chapter 5 there are only three
parameters can be affected by the change of battery conditions Therefore the
other five parameters ( 2100 ττAKE Em ) can be treated as a constant for a battery
The parameters that related to the battery condition 0010 RR and 0C are the key
problems which the project focused on 0C represents the state of health while
the 0010 RR stands for the internal resistance parameters Here again the Genetic
algorithm is adopted to identify these three parameters
In this project the battery have been discharged and charged in hundreds of cycles
to simulate the capacity loss in the normal applications which is described by the
101
state of health in this project In order to find out the different behaviour of
internal resistance in different state of health experimental tests have been carried
out in different state of health of the battery
The first test is carried out when the battery is brand new and the data is also used
to identify the other parameters of the battery model as described in the previous
chapter The second group of data is collected after 300 discharge cycles
approximately and the third test took place after 200 more cycles The number of
discharge cycles between the last four tests is only about 50 because the change of
State of Health is more significant The identified parameters of a battery in
different state of health are shown in table 6-1
Table 6-1 Battery Remaining Capacity and Internal Resistance
Remaining
Capacity C0 (Amps)
SOH R00 R10 RelError Internal
Resistance (Ohm)
Test 1 48198 100 00609 00220 01756 05683
Test 2 44861 9314 00654 00103 07428 05759
Test 3 38025 7889 00635 00191 02812 05827
Test 4 33830 7019 00573 00509 07265 06126
Test 5 30625 6354 00604 00582 04340 06575
Test 6 26072 5306 00703 00368 01342 06855
And the terminal voltages simulated and measured are shown as the following
figures The same as previous figures the blue lines represent the measured
outputs while the red lines represent the simulation results
The test shows in figure 6-1 the same as the test which is used to describe the
genetic algorithms and the battery parameter identification in chapter 5 Detailed
102
description and analysis are given in chapter 5
0 500 1000 1500 2000 2500 3000 350011
112
114
116
118
12
122
124
126
128
13
Time (s)
Term
inal voltage (
V)
Experimental Terminal Voltage
Simulated Terminal Voltage
Experimental Terminal Voltage
Simulated Terminal Voltage
Figure 6-1 Experimental and Simulated Terminal Voltage of Test 1 (SOH = 100)
103
0 1000 2000 3000 4000 5000 600011
112
114
116
118
12
122
124
126
128
13
Time (s)
Term
inal V
oltage (
V)
Simulated Terminal Voltage
Experimental Terminal Voltage
Simulated Terminal Voltage
Experimental Terminal Voltage
Figure 6-2 Experimental and Simulated Terminal Voltage of Test2 (SOH= 9314)
The experiment shown in figure 6-2 is tested several months after the first
experimental test In the period that the first discharge begins the experimental
result shows a different slope in terminal voltage The reason is probably that the
battery have just charged to full by a charger and itrsquos the capacitor had not fully
discharged After that when the discharge stopped there is a deviation in the
simulation voltage In the authorrsquos opinion that is because of the accuracy of R10
and R00 If the value of R10 is greater and that of R00 is smaller the simulation
result should fit the experimental result In the second discharge period of the
discharge test there is also a little difference in the experimental and simulation
result caused by the inaccuracy of battery parameters But it shows a good
agreement when the discharge stopped
104
0 500 1000 1500 2000 2500 3000 3500 400011
112
114
116
118
12
122
124
126
128
13
Time (s)
Term
inal V
oltage (
V)
Simulated Terminal Voltage
Experimental Terminal Voltage
Simulated Terminal Voltage
Experimental Terminal Voltage
Figure 6-3 Experimental and Simulated Terminal Voltage of Test3 (SOH= 7889)
0 500 1000 1500 2000 2500 3000 3500 4000 4500 500011
112
114
116
118
12
122
124
126
128
13
Time (s)
Term
inal V
oltage (
V)
Simulated Terminal Voltage
Experimental Terminal Voltage
Simulated Terminal Voltage
Experimental Terminal Voltage
Figure 6-4 Experimental and Simulated Terminal Voltage of Test4 (SOH= 7019)
105
0 1000 2000 3000 4000 5000 600011
112
114
116
118
12
122
124
126
128
13
Time (s)
Term
inal V
oltage (
V)
Experimental Terminal Voltage
Simulated Terminal Voltage
Simulated Terminal Voltage
Experimental Terminal Voltage
Figure 6-5 Experimental and Simulated Terminal Voltage of Test5 (SOH= 6354)
Figure 6-3 figure 6-4 and figure 6-5 show the test results of the battery when the
SOH drops to its 80 70 and 60 It is shown that the simulation result in
figure 6-3 fits the experimental result until the end of test when the discharge of
battery has just stopped The inaccuracy of the R10 and R00 is also the main cause
of the deviation The overall simulation result in figure 6-4 figure 6-5 are good to
express the battery behaviour
106
0 500 1000 1500 2000 2500 3000 3500 400011
112
114
116
118
12
122
124
126
128
13
Time (s)
Term
inal V
oltage (
V)
Experimental Terminal Voltage
Simulated Terminal Voltage
Experimental Terminal Voltage
Simulated Terminal Voltage
Figure 6-6 Experimental and Simulated Terminal Voltage of Test6 (SOH= 5306)
In the parameter identification of test shown in figure 6-6 the remaining capacity
is only about 12 of the initial capacity when the battery is brand new During the
discharge period the simulation and experimental result is not fitting very well
and the slopes of them are not the same This is probably also caused by
insufficient idle time after being charged and the capacitor had not fully
discharged
Figure 6-7 represents the internal resistance value in different state of health as
described in table 6-1
107
100 95 90 85 80 75 70 65 60 55 5004
045
05
055
06
065
07
075
08
State of Health
Inte
rnal R
esis
tance (
Ohm
)
r vs SOH
Approximation
Figure 6-7 Change of Internal Resistance in Different State of Health (Battery 1)
It is shown that the internal resistance is increasing when the state of health of a
lead-acid battery decreases This progress is at first very slow when the battery is
new But after a number of discharge cycles the remaining capacity of battery
drops to about 75 of the initial capacity when the battery is new and the
increase of internal resistance become faster When the state of health is brought
down to about 50 which means that the battery cannot offer enough energy as
new the value of internal resistance is increased by 30 approximately At
present there is not a published quantitative description of the internal resistance
when the capacity changes yet but it has been agreed that the internal resistance
increases while the battery health deteriorates
Similar tests have been carried out on 5 other batteries with the same nominal
108
capacity and the changes of their internal resistances are given as figure 6-8 It is
not possible to deduce a statistical approximation equation only based on the
existing data but it can be seen from the figure that the performance of internal
resistance under different state of health shows an agreement in a certain extent
100 95 90 85 80 75 70 65 60 55 5003
04
05
06
07
08
09
State of Health
Inte
rnal R
esis
tance (
Ohm
)
r vs SOH (Battery 1)
r vs SOH (Battery 2)
r vs SOH (Battery 3)
r vs SOH (Battery 4)
r vs SOH (Battery 5)
r vs SOH (Battery 6)
Figure 6-8 Change of Internal Resistance in all 6 Batteries
63 Summary and Discussions
The determination of battery remaining capacity accurately is becoming
increasingly important in modern battery managements This currently is mostly
obtained by integrating the discharge current of a full discharge but this progress
usually causes a negative effect on most of the batteries There is also a view that
109
the state of health which represents the percentage of remaining capacity of a
weak battery compared with the initial capacity when brand new can affect the
internal resistance therefore the battery state of health can be obtained by the
study of battery internal resistance However from the analysis based on the
mathematical model and the experimental results it can be concluded that other
parameters can also cause variations of the internal resistance which make the
estimation of the state of health more challenging
This chapter describes a new alternative method that based on the Improved
Battery Model and the key parameters of the model The remaining maximum
capacity of a used battery which represents the SOH of the battery is related in
the internal resistance under the depth of charge of 65 which is expressed by
the parameters of R00 and R10 These parameters can be identified by genetic
algorithms A result that quantifies the change of internal resistance in different
SOH values has been concluded based on the analysis of a series of experimental
tests
110
Chapter 7
Conclusions and Future
Research
This chapter summarizes the major achievements of the presented research work
in the field of battery modelling and state of health analysis Possible direction of
further research work is also described briefly in this chapter
71 Summary
Lead-acid batteries are used in various industrial sectors and are irreplaceable due
to their low price In areas where lead-acid batteries are employed as an energy
storage device the capacity loss caused by the repeated dischargecharge cycles is
very common This drop of capacity can neither be avoided nor be repaired by
using current technologies As a result it is essential to know whether the battery
is able to meet the demand and if it should be replaced on time
In this thesis a study on the capacity status of a battery and its relation to the
internal resistance had been conducted and this thesis established a novel model
based method to quantify the battery health An Equivalent Circuit Mathematical
model for the discharging progress of a lead-acid battery has been developed for
this purpose and is implemented under MatlabSIMULINK software environment
111
The model involves most of the important concepts of a battery to reflect the
dynamic response of terminal voltage when discharging
A series of experimental tests have been carried out during the project for the
model validation and the study of the state of health Six 12V-13Ah lead-acid
batteries with the same rated capacity are discharged and recharged from brand
new to obtain different values of state of health Genetic algorithm has been
employed to identify the unknown parameters of the battery model in each state of
health and the identified parameters are used as the factors that reflecting the state
of health and the internal resistance The internal resistances corresponding
different state of health have been collected and recorded A result was found in
the thesis that for the 12V-13Ah lead-acid battery which is used in the
experimental tests the value of internal resistance is increased by 25
approximately if the SOH of battery drops to 50
72 Limitations
The key limitation of the method introduced in this thesis is that it is based on the
parameter identifications of the model which means a test is still needed in order
to obtain the state of health The major reason is that the mathematical model does
not include the charging progress of battery which is also an important period of
the battery duty cycle Another limitation is that all the tests of the state of health
estimation are carried out at the same discharge rate because of the variation of
the internal resistance in different discharge rate as discussed in chapter 4 Finally
112
The lsquocoup de fouetrsquo behaviour that of took place at the beginning of discharge
when batteries are full is not able to be simulated in the current version of
mathematical model
73 Future Research Work
Following the limitations of the project some future research can be carried out in
three steps based on the model improvements and the practical applications of the
algorithm
First of all improvements of the discharging battery model can be carried out
which can mainly focus on the study of the battery internal resistance in different
discharge rates Equations of internal resistances that can withstand the change of
discharge rate will make the model capable for online applications Studies on the
relationship between the electromotive force and the state of charge can also lead
to a solution of the lsquocoup de fouetrsquo behaviour and a better simulation result
Another research work on the model modification is that the behaviour of battery
to the mathematical model when a battery is being charged can be involved by
which the monitoring system of battery can be implemented in the whole duty
cycles This part of work can be focused on the parasitic branch in the
mathematical model described in chapter 3
Further work should also reveal the variations of state of health in different duty
113
cycles and an algorithm based on this change should be designed to estimate the
remaining life-time of a lead-acid battery The value of current state of health and
the estimated raining life-time should also be considered as major outputs in this
period of work It is also possible to design an online management device of
battery to estimate the life-time and the state of health
114
References
Anon (2006) Global Wind Energy Council (GWEC) statistics [online] from
httpwwwgwecnetuploadsmedia07-
02_PR_Global_Statistics_2006pdf
Anon (2007) Battery Types Flooded versus AGM and Gel [online]
Retrieved February 13 2007 from
httpwwwvonwentzelnetBattery01Type
Anon (2007) BP Statistical Review of World Energy June 2007 [online] from
httpwwwbpcomliveassetsbp_internetglobalbpglobalbp_uk_englishr
eports_and_publicationsstatistical_energy_review_2007STAGINGlocal_
assetsdownloadsspreadsheetsstatistical_review_full_report_workbook_2
007xls
Anon (2007) International Energy Outlook 2007 [online] from
httpwwweiadoegovoiafieohighlightshtml
Ball R J Evans R and Stevens R (2002) Finite element (FE) modelling of
current density on the valve regulated leadacid battery positive grid
Journal of Power Sources 103(2) 213-222
Bernardes A M Espinosa D C R and Tenoacuterio J A S (2004) Recycling of
batteries a review of current processes and technologies Journal of
Power Sources 130(1-2) 291-298
Berndt D (1993) Maintenance-Free Batteries -- A Handbook of Battery
Technology Somerset Research Studies Press Ltd
Berndt D (2001) Valve-regulated lead-acid batteries Journal of Power
Sources 100(1-2) 29-46
115
Berndt D (2009) Electrochemical Energy Storage Battery Technology
Handbook CRC Press
Casacca M A and Salameh Z M (1992) Determination of lead-acid battery
capacity via mathematical modeling techniques Energy Conversion
IEEE Transaction on 7(3) 442-446
Ceraolo M (2000) New dynamical models of lead-acid batteries Ieee
Transactions on Power Systems 15(4) 1184-1190
Chan H L and Sutanto D (2000) A new battery model for use with Battery
Energy Storage Systems and Electric Vehicles Power Systems 2000 Ieee
Power Engineering Society Winter Meeting - Vols 1-4 Conference
Proceedings 470-475
Chen M and Rincacuteon-Mora G A (2006) Accurate electrical battery model
capable of predicting runtime and I-V performance IEEE
TRANSACTIONS ON ENERGY CONVERSION VOL 21( NO 2)
504-511
Chipperfield A J Fleming P J and Fonseca C M (1994A) Genetic algorithm
tools for control systems engineering Adaptive computing in
engineering design and control Plymouth UK
Chipperfield A J Fleming P J Pohlherim H and Fonseca C M (1994B)
Genetic algorithm toolbox for use with Matlab Department of automatic
control and systems engineering University of Sheffield
Crompton T R (2000) Battery Reference Book Third Edition Oxford
Elsevier Newnes
Cun J P Fiorina J N Fraisse M Mabboux H A and Mabboux H The
116
experience of a UPS company in advanced battery monitoring
Telecommunications Energy Conference 1996 INTELEC 96 18th
International 646 - 653
Durr M Cruden A Gair S and McDonald J R (2006) Dynamic model of a
lead acid battery for use in a domestic fuel cell system Journal of Power
Sources 161(2) 1400-1411
Esfahanian V Torabi F and Mosahebi (2008) An innovative computational
algorithm for simulation of lead-acid batteries Journal of Power
Sources 176(1) 373-380
Gillioli R and Cerolo P (1990) Charge and discharge fourth order dynamic
model of the lead battery 10th
intl Electric Vehicle Symposium Hong
Kong p1-9
Glendenning I (1981) Compressed air storage Physics in Technology 12(3)
103-10
GONG Q (2005) Modeling study of a vehicle traction battery model
CHINESE LABAT MAN 2005 Vol 42 Numb 2 issu 155 pages 76-79
Houck C Joines J and Kay M (1995) A Genetic Algorithm for Function
Optimization A Matlab Implementation NCSU-IE TR 95-09
Jacobi W (2009) Lithium Batteries Battery Technology Handbook CRC Press
Jayne M G and Morgan C (1986) a new mathematical model of lead acid
battery for electric vehicles Eighth Intl electric vehicle conference
Washington DC
Juvonen M (2003) Large-Scale Energy Storage Systems [online] from
httpwwwdocicacuk~mattiise2grpenergystorage_reportstoragehtml
117
Lee J H Lee K Y and Lee J Y (1996) Self-discharge behaviour of sealed
Ni-MH batteries using MmNi33+xCo07Al10-x anodes Journal of
Alloys and Compounds 232(1-2) 197-203
Liaw B Y Gu W B and Wang C Y (1997) Numerical simulation of coupled
electrochemical and transport processes in battery systems Proceedings
of the Intersociety Energy Conversion Engineering Conference
Honolulu HI USA IEEE
Lu S Meegahawatte D H Guo S Hillmansen S Roberts C and Goodman
C J (2008) Analysis of energy storage devices in hybrid railway vehicles
Railway Engineering - Challenges for Railway Transportation in
Information Age 2008 ICRE 2008 International Conference on
Mantell C L (1984) Batteries and energy systems Second Edition McGraw-
Hill Inc
MathWorks Inc (2004) Genetic Algorithm Direct Search Toolbox V102
MathWorksInc
MPowerSolutionsLtd (nd) Alternative Energy Storage Methods [online]
from httpwwwmpowerukcom
Okoshi T Yamada K Hirasawa T and Emori A (2006) Battery condition
monitoring (BCM) technologies about lead-acid batteries Journal of
Power Sources 158(2) 874-878
Perrin M Delaille A Huet F and Hernout L (2006) Study of the coup de
fouet of lead-acid cells as a function of their state-of-charge and state-of-
health Journal of Power Sources 158(2) 1019-28
Pham D T and Karaboga D (1998) Intelligent Optimisation Techniques
118
Genetic Algorithms Tabu Search Simulated Annealing and Neural
Networks New York Springer-Verlag New York Inc
RailPower Hybrid Technologies C (nd) Benifits of Hybrid Locomotives
[online] from httpwwwrailpowercomproducts_hl_benefitshtml
Rand D A J Moseley P T and Garche J (2004) Valve-Regulated Lead-Acid
Batteries Elsevier
Ruetschi P (2004) Aging mechanisms and service life of lead-acid batteries
Journal of Power Sources 127 (1-2) 33-44 Switzerland Elsevier
Salameh Z M Casacca M A and Lynch W A (1992) A mathematical model
for lead-acid batteries IEEE Trans on Energy conversion Vol7 No 1
Sato Y Takeuchi S and Kobayakawa K (2001) Cause of the memory effect
observed in alkaline secondary batteries using nickel electrode Journal
of Power Sources 93(1-2) 20-24
Sims R I Carnes J C Dzieciuch M A and Fenton J E (1990) Computer
modeling of Automotive lead acid batteries Ford Research Laboratories
Technical Report
Smil V (2007) Energy at the Crossroads Massachusetts Achorn Graphic
Services Inc
Ter-Gazarian A (1994) Energy storage for power systems London Peter
Peregrinus Ltd
TNI_Ltd (2007) Battery history [online] from
httpwwweuropulsecombattery_historybattery_historyhtm
Tuck C D S (1991) Modern Battery Technology Ellis Horwood Ltd
Wei J (2007) Development of Coal Mill and Aggregate Load Area Models in
119
Power Systems using Genetic Algorithms University of Liverpool PhD
Wikipedia (nd) Lead-Acid Battery [online] from
httpenwikipediaorgwikiLead-acid
Wikipedia (nd) Rechargeable Batteries [online] from
httpenwikipediaorgwikiRechargeable_battery
Wikipedia (nd) VRLA [online] from httpenwikipediaorgwikiVRLA
Zhang Y L Liu P H Zhang Q Y and Cheng W (2010) Separation of
cadmium(ii) from spent nickelcadmium battery by emulsion liquid
membrane Canadian Journal of Chemical Engineering 88(1) 95-100
120
Appendix I SIMULINK Diagrams of Battery Model
Figure A-1 SIMULINK Diagrams of ldquoMain Blockrdquo
121
Figure A-2 SIMULINK Diagrams of ldquoTerminal Voltage Calculationrdquo
122
Figure A-3 SIMULINK Diagrams of ldquoThermal Behaviourrdquo
123
Figure A-4 SIMULINK Diagrams of ldquoBattery Capacityrdquo
Figure A-5 SIMULINK Diagrams of ldquoBattery State of Chargerdquo
Figure A-6 SIMULINK Diagrams of ldquoBattery Depth of Chargerdquo
124
Figure A-7 SIMULINK Diagrams of ldquoBattery Electromotive Forcerdquo
(a)
(b)
Figure A-8 SIMULINK Diagrams of ldquoBattery Internal Resistancerdquo
125
Appendix II
List of Publications
S Hillmansen S Lu D H Meegahawatte S Guo C Roberts and C J
Goodman Analysis of Energy Storage Devices in Hybrid Railway Vehicles International Conference on Railway Engineering 2008 p68-73 Hong Kong China 25-28 March 2008
Y Yin X Luo S Guo Z Zhou J Wang A battery charging control strategy for
renewable energy generation systems The Proceedings of World Congress on Engineering 2008 Vol 1 pp356-361 London UK 2-4 July 2008
S Guo S Hillmansen Y Yin J Wang State of Health Monitoring of Lead-acid
Batteries Proceedings of the 14th International Conference on Automation amp Computing pp250-254 Brunel University West London UK 6 September 2008
Y Yin C Li Z Zhou Q Liu S Guo X Luo J Wang Design and Realization of a
PS2 Keyboard Interface in Embedded system Proceedings of the 14th International Conference on Automation amp Computing pp160-163 Brunel University West London UK 6 September 2008
Yin Y Wang J Luo X Guo S Development of a battery charging management
unit for renewable power generation a book chapter in Advances in
Electrical Engineering and Computational Science Edited by Sio-Long Ao and Len Gelman pp33-46 Springer 2009
Wang J Wei JL Guo S Condition monitoring of power plant milling process
using intelligent optimization and model based techniques accepted as a chapter in the book of Fault Detection in March 2009
S Guo S Hillmansen J Wang Model Based Analysis of Battery State of Health
using Genetic Algorithms accepted by the International Conference on Systems Engineering (ICSE) Coventry 8-10 September 2009

8
61 Methodology 97
62 The identification of C0 R00 and R10 100
63 Summary and Discussions 108
Chapter 7 Conclusions and Future Research 110
71 Summary 110
72 Limitations 111
73 Future Research Works 112
9
List of Figures
Figure 1-1 Power density vs energy density plot 7
Figure 2-1 Working Principle of Lead-Acid Batteries (a) shows the battery when
discharging and (b) is when charging with a DC charger 18
Figure 3-1 Simple Battery Model 38
Figure 3-2 I-V chart of the Simple Battery Model 39
Figure 3-3 I-V Chart in different SOC 40
Figure 3-4 Sketch to show battery discharge behaviours in typical tests 41
Figure 3-5 Thevenin Battery Model 42
Figure 3-6 Fourth-order Battery Model43
Figure 3-7 Improved Battery Model 44
Figure 3-8 Battery Capacity vs Discharge Current 47
Figure 3-9 Lead-acid Battery Equivalent Network 48
Figure 3-10 The Equivalent Network with the Approximated mZ 49
Figure 3-11 R-C block 53
Figure 4-1 Equivalent Circuit of the Experimental Test Rig 60
Figure 4-2 Experimental Test Rig61
Figure 4-3 Test of constant-impedance load discharge 62
Figure 4-4 Test of two-load discharge 62
Figure 4-5 Structure of model for SIMULINK Implementation69
Figure 4-6 Terminal Voltage of Battery 71
Figure 5-1 Flowchart of a Simple Genetic Algorithm78
Figure 5-2 2-dimensional Rastrigins function83
Figure 5-3 Contour plot of Rastrigins function84
10
Figure 5-4 GA performance (Rastrigrinrsquos function) 85
Figure 5-5 2-dimensional Rosenbrock function 86
Figure 5-6 GA performance (Rosenbrock function) 87
Figure 5-7 Progress of Parameter Identification 88
Figure 5-8 Measured and Simulated Result after Parameter Identification 91
Figure 5-9 Mean and the Best Fitness Values in Each Generation 92
Figure 5-10 Measured and Simulated Terminal Voltage 93
Figure 5-11 Measured and Simulated Terminal Voltage 94
Figure 6-1 Experimental and Simulated Terminal Voltage of Test 1 (SOH = 100)
102
Figure 6-2 Experimental and Simulated Terminal Voltage of Test 2 (SOH=9314)
103
Figure 6-3 Experimental and Simulated Terminal Voltage of Test 3 (SOH=7889)
104
Figure 6-4 Experimental and Simulated Terminal Voltage of Test 4 (SOH=7019)
104
Figure 6-5 Experimental and Simulated Terminal Voltage of Test 5 (SOH=6354)
105
Figure 6-6 Experimental and Simulated Terminal Voltage of Test 6 (SOH=5306)
106
Figure 6-7 Change of Internal Resistance in Different State of Health (Battery 1)
107
Figure 6-8 Change of Internal Resistance in all 6 Batteries 108
1
Chapter 1
Background and Objectives of
the Project
11 Overview
Fossil fuels have been the main energy resource in recent human history although
their continuing use has been shown to have a detrimental effect on the
environment The principal problem for fossil fuels is that they cannot be
reproduced within a short period of time so it is a finite energy supply source If
current consumption rate continues they will be exhausted in a few generations
from now Fossil fuel has never been considered as a clean-resource because there
is an emission of noxious gasses including CO CO2 NOx SOx and HC into the
atmosphere With all the pressure from the problems associated with the fossil
fuel exploration of the usage of renewable energy is becoming an increasingly
important issue
Wind energy hydro energy and solar energy are three of the most important
renewable energy sources and they have been implemented on a large scale wind
energy has produced a annual global total of 65019 times 1012 Wmiddoth
(74223 MWtimes24htimes365 days) (Anon 2006) energy in the year 2006 and hydro
2
energy is about 304 times 1015 Wmiddoth (30404 times 1012 Wmiddoth) (Anon 2007) Solar energy
resources are estimated at about 10694times1015 Wmiddoth (3850times1021 J) (Smil 2007) To
compare with the worldwide energy consumption of 13097times1015 Wmiddoth in the year
2007 it is clear that renewable energies have a significant role to play (Anon
2007)
However the problem of the implementation of the renewable energy is that the
electricity generated is intermittent and the power systems are experiencing the
problem of rapidly changing power demand Therefore the management of the
energy is an important issue Devices of energy storage should solve these
problems in theory
12 Review of Energy Storage Systems
Not only giving a large scale energy solution energy storage devices are also
commonly used in a range of applications related to everybody Different energy
storage technologies are suited to different applications and consideration must be
made in order to select the correct solution for each application This section will
give an overview of the existing energy storage systems
121 Applications of the Energy Storage Systems
Large scale energy storage systems which are also called grid energy storage
refer to the methods used to large-scale store electricity within an electrical power
grid Off-peak energy is stored during times when production (from power plants)
3
exceeds consumption and the stores are utilized at times when consumption
exceeds production In this way electricity production need not be drastically
scaled up and down to meet momentary consumption ndash instead production is
maintained at a more constant level
Despite the applications in grid scale the energy storage systems are also popular
in a number of areas For example they are usually used to optimize the energy
generated from the engine in modern electrical hybrid vehicles One such
application is in a shunter locomotive A shunter is a small railroad locomotive
intended for assembling trains ready for a road locomotive to take over
disassembling a train that has been brought in and switching a train to another rail
at the rail terminals The duty cycle of a shunter is characterised by short duration
high power demands (accelerating a rake of vehicles) and the long periods of
idling while the train waits for other operations Comparing to traditional shunter
locomotive that use diesel engines only for the whole duty cycle hybrid shunter
locomotives with energy storage devices can have a 40-70 reduction in fuel use
(RailPower Hybrid Technologies nd) This saving is made by operating the prime
mover at its optimum
Another application of energy storage in the vehicle technologies is the
regenerative braking system which is used to save the braking energy of vehicle
The potential of this technology to save energy for a vehicle is depends on the
duty cycle (Lu Meegahawatte et al 2008) which is characterized by storing the
energy generated when the vehicle is decelerating and releasing when accelerating
4
Energy storage devices are also very popular in stationary applications also
known as the Uninterruptible Power Supply (UPS) systems This system is
designed to meet the power demand when problems like power failure happen and
it is important especially in the applications where power failures could have
serious consequences for example in hospitals and computer centres (Berndt
2009)
The energy storage devices in the UPS system are often used to achieve
ldquouninterruptiblerdquo in a short period before the secondary power supply started
When a power problem occurs the energy storage device starts to supply
electricity immediately and at the same time the generator begins to start When
the generator is ready to supply sufficient power the energy storage device stops
providing power When the grid power is recovered the energy storage device can
be recharged until full
122 Review of the Existing Energy Storage Devices
There are various kinds of energy storage systems including pumped hydro
compressed air flywheel supercapacitors electrochemical and also
superconducting magnetic Each technology is suited to different applications and
careful consideration must be made in order to select the correct solution for each
application
Pumped hydro is the oldest and the most effective kind of large scale energy
storage method which have been used for nearly a century since 1929 (Juvonen
5
2003) Two large reservoirs at different altitudes with a pump a turbine a motor
and a generator are employed to collect the off-peak energy The water is released
from the higher one through a turbine to generate electricity during peak load
period
Compressed air is a pneumatic energy storage method that refers to the air kept
under a certain pressure This system can be used in grid energy storage that the
air can be stored by compressors during periods with low power demand This
compressed air can be released to a generator to meet the high power demand
during peak time (Glendenning 1981 Ter-Gazarian 1994 Juvonen 2003) In some
applications the compressed air is released through a combustor mixed with
natural gas to obtain a higher overall efficiency
A capacitor is an electrical device that can store energy in an electric field
between a pair of conductors and is often used in circuits for short term energy
storage It blocks the circuit to hold DC voltage Supercapacitors are energy
storage devices with the same principle but with a higher energy density The
power density of the supercapacitor systems can be very high but the energy is
often released in a very short duration (Ter-Gazarian 1994) As a result the
supercapacitors are usually used in applications of an energy burst
Superconducting magnetic energy storage system stores energy in the magnetic
field generated by direct current in a coil Instead of traditional wires like copper
superconductors are employed to avoid the energy consumptions as heat because
of the resistance A problem is that the optimal operating temperature for
6
superconductors is 50-77K a refrigerator is therefore necessary in the system for
cooling down
Flywheels are considered as a method of storing mechanical kinetic energy by
accelerating a flywheel to a very high speed to store the energy and decelerating
to release the energy Flywheels are very efficient for short duration storage cycles
due to their fast response speed These energy storage devices are used mainly in
applications that demand kinetic energy storage and high numbers of deep
discharge cycles
Electrochemical energy storage stands for the device capable of converting
chemical and electrical energy to each other by chemical reactions Batteries are
the most common technology of electrochemical energy storage methods The
oxidation and reduction reactions in the two electrodes of battery lead to the
current through the external circuit when discharging to provide energy The
secondary battery can be recharged by applying electrical current which reverses
the chemical reactions that occur during the discharge
Fuel cell is another technology with very high energy density that converts the
chemical energy in a source fuel into an electrical current The fuel cells are
considered as the ldquoenvironmental friendlyrdquo as the only by-product is water The
working principle of fuel cells when discharging is the same as the batteries but
unlike the batteries the fuel cells do not need recharge as they only provide
electrical energy while the active chemicals are supplied to the electrodes (Mantell
1984 MPowerSolutionsLtd nd)
7
Figure 1-shows the Ragone chart of the energy and power density of some energy
storage systems
Figure 1-1 Power density vs energy density plot (MPowerSolutionsLtd nd)
123 Review of Batteries
The preceding discussion has identified that energy storage devices are becoming
increasingly important in both stationary and mobile applications Battery as the
most popular energy storage device is studied in this section
There are two different types of batteries applied in a large range of areas now
Primary batteries and Rechargeable batteries Primary batteries which are also
called disposable batteries often have higher energy densities than the
rechargeable ones and they have a lower self-discharge (Ter-Gazarian 1994)
8
However as the chemical reactions in these batteries are not reversible and the
active materials cannot be restored to their initial forms these batteries cannot be
reliably recharged The primary batteries are intended to be used once and then
discarded therefore they are not suitable for the energy storage systems
Rechargeable battery is the other type of the electrochemical batteries which is
also known as secondary battery because their electrochemical reactions are
electrically reversible There are many different rechargeable battery technologies
in which only four of them are leading the world market nickel-cadmium nickel-
hydride lead-acid and lithium-ion (Berndt 1993 Berndt 2009)
The Nickel-cadmium (NiCd) battery is a kind of rechargeable battery that uses
nickel oxide hydroxide and metallic cadmium as electrodes and an alkaline
electrolyte (often potassium hydroxide) (Mantell 1984) As designed to compete
the primary batteries the NiCd batteries are often manufactured in the same size
and they are used in the consumer market as primary batteries for example in
clocks toys radios and cordless tools However when the NiCds are substituted
for primary cells the lower terminal voltage and smaller ampere-hour capacity
may reduce performance as compared to primary cells The most attractive feature
of the nickel-cadmium batteries is that they are more difficult to damage
comparing with other batteries during deep discharge cycles They can also
sustain more cycles and the lower internal resistance can also help achieve a
higher maximum discharge rate A problem preventing the large scale application
of this battery technology is that the nickel-cadmium batteries suffers faster self
discharge rate than other rechargeable batteries and the cadmium used as the
9
active material in one of the electrodes is toxic and expensive (Zhang Liu et al
2010) Furthermore the capacity loss caused by the continuously discharge and
recharge to the same state of charge called ldquomemory effectrdquo is also a very
important issue of the nickel-cadmium batteries (Sato Takeuchi et al 2001)
The nickel-metal hydride (NiMH) battery is a type of secondary electrochemical
battery that designed to substitute for the nickel-cadmium cells They have a
similar size and a similar cell voltage but with more advantages By using
hydrogen-absorbing alloy as negative electrode instead of cadmium this
electrochemical technology is considered as ldquoenvironmental friendlyrdquo because of
the absence of toxic cadmium (Berndt 1993) The nickel-metal hydride batteries
also have low internal resistance and the high cycle durability as the NiCds and a
NiMH battery can have two to three times the capacity of an equivalent size
nickel-cadmium battery However the nickel-metal hydride batteries also have a
similar high self-discharge rate as the nickel-cadmium batteries (Lee Lee et al
1996) and it also cannot afford complete discharges Memory effect from
repeated partial discharge can occur in a NiMH battery but this is reversible
through charge cycling (Berndt 2009)
The lead-acid batteries are the oldest type of rechargeable battery with a history of
over 150 years but they are still the most popular battery chemistry for
applications such as engine starting or backup power systems as there is no
cheaper alternative when weight is not a factor This technology uses lead and
lead dioxide as electrodes and an acid electrolyte of sulphuric acid and the
advantage of this configuration is that the electrolyte takes part in reactions of
10
both electrodes and both electrodes turn into lead sulphate when discharging
(Berndt 1993 Berndt 2009) The lead-acid batteries can be designed for not only
deep discharge cycles but high discharge rate or compromise of the two cycles
They have a lower self-discharge rate compared with the nickel batteries and they
also do not suffer from the memory effect (Mantell 1984 Berndt 2009) However
as the energy density of lead-acid battery is not high it is seldom applied in the
portable electronics Another important problem is that the lead-acid batteries
must be recycled as the active material ldquoleadrdquo is toxic to both the environment and
the human bodies (Bernardes Espinosa et al 2004)
The lithium-ion (Li-ion) batteries are almost the perfect cell chemistry and are
currently used a wide range of consumer electronics products including cameras
cell phones laptops etc They have many attractive performance advantages
which make them also ideal for higher power applications such as automotive and
standby power First of all the lithium-ion batteries have the highest energy
density in all the rechargeable battery now which is about 4 times better than
lead-acid (Jacobi 2009) They are also capable for deep discharge and high
discharge rate with a relatively slow self discharge There is no liquid electrolyte
in the lithium-ion batteries which means they are immune from leaking However
just opposite to the lead-acid batteries the most serious problem that discourages
the lithium-ion batteries is the low economic efficiency comparing with the lead-
acid batteries Other factors like the stability of the chemicals and the recycling of
lithium should also be concerned because of the chemical activeness of lithium
Table 1-1 is gives some basic properties of the four major rechargeable batteries
11
introduced above There are also some less common battery chemistries used by
rechargeable batteries in addition to these technologies including nickel-zinc
(NiZn) nickel-iron (NiFe) etc but they have a small market share For the four
major battery chemistries lead-acid batteries with their low price and high
flexibility is adopted in a wide range of application areas
Table 1-1 properties of the rechargeable batteries (Wikipedia nd)
Type Voltage
(V)
Energy Density (Whkg)
Power Density (Wkg)
Self Discharge
rate
Cycle Durability
Nickel-Cadmium
12 40-60 150 20 1500
Nickel-Metal-Hydride
12 30-80 250-1000
20 1000
Lead-Acid 21 30-40 180 3-4 500-800
Lithium-ion 36 160 1800 5-10 1000-1200
124 The Management of Batteries
In the areas that batteries are employed as the energy storage device it is a critical
issue to consider that whether there is enough energy in the battery to meet the
demand However batteries do have the problem in limited cycle durability that
is when a battery is charged and discharged for a number of cycles its total
capacity decreases If the battery cannot offer sufficient powerenergy it should be
replaced at the right time But the problem is that it is difficult to quantify the
capacity loss and when the capacity of battery is no longer sufficient for a
particular application Due to the limitation of batteries it is essential to develop a
method to determine the capacity of battery that subjected to various duty cycles
in a number of applications
12
13 Project Objectives
The main objective of the project is to develop a method which can determine the
key parameters of batteries from the discharge tests The proposed methodology is
a model based approach that is to develop a mathematical model of the battery
which can represent the dynamic performance and battery status and
characteristics can be investigated through the analysis of the model
The first step of the project is to build a mathematical model of battery The
dynamic model is expected to reflect the relevant behaviours of battery when
being discharged including the characteristics of State of Charge Depth of Charge
Electromotive force Terminal Voltage The unknown parameters in the model are
identified by using Genetic Algorithms (GAs) with the laboratory experimental
data Afterwards some batteries are tested in experiments and the parameters in
different state of health are recorded to analyze the battery in different status of
battery
The focus of this work is to develop a suitable method for parameter identification
for common battery systems The lead-acid battery has been chosen because it has
relatively well defined properties and there is a wealth of literature describing the
performance of these types of batteries From an experimental view point they are
also readily available of low cost
13
14 Outline of the thesis
The thesis is organized into seven chapters and the first chapter presents the
background and motivation of the research project The remaining chapters are
briefly described as follows
Chapter 2 gives an overview of lead-acid batteries including the development
working principle and also some modern battery designs and technologies In the
second part of chapter 2 important concepts for a battery including electromotive
force capacity state of charge internal resistance and state of health are
introduced and some mathematical descriptions of these concepts are discussed
Chapter 3 starts from some requirements of the mathematical model designed for
this project and several different methods of battery model approaches are
discussed Afterwards some details of the dynamic mathematical model are
analyzed The initial battery model is described in the last part of this chapter that
summarized the equations of the battery
Chapter 4 is mainly focused on some improvement of the mathematical model
described in chapter 3 In the first section of chapter 4 the experimental test rig in
the project is introduced Some findings in the experimental tests is then listed and
studied and integrated into the improved model Finally the SIMULINK
implementation and a simulation study are given
Chapter 5 presents a method of model parameter identification The principle of
14
Genetic Algorithms is studied at first Then this algorithm is employed in the
model and the parameters of the model are identified with the help of
experimental tests This chapter also includes the validation of battery model
using two other groups of test results
Chapter 6 develops an algorithm that can reflect the state of health of a lead-acid
battery In this chapter the internal resistance parameters are measured under
different state of health through a group of continuous experimental tests The
change of internal resistance under a specific working condition is then related to
the battery state of health
Finally Chapter 7 gives a summary and the conclusions of the project Also the
future works that can be improved are proposed in this chapter
15
Chapter 2
Introduction of Lead-acid
Batteries
This chapter gives an overview of lead-acid batteries including background
knowledge working principles explanation of terminologies technologies and
applications encountered for this technology The chapter presents the
fundamental knowledge and prepares for the project work to be reported in the
following chapters
21 A General Overview of the
Lead-acid Battery
The lead-acid battery is the oldest type of rechargeable battery The first example
of a lead-acid battery can be attributed to the German physicist Sinsteden who
published the performance data of this battery system in 1854 (Berndt 1993)
Later in 1859 the French physicist Planteacute realized that a plate construction was
required to achieve a much larger effective surface area and he produced the first
rechargeable battery which was marketed for commercial use by alternately
charging and discharging lead sheets immersed in sulphuric acid This method
has remained unchanged and still in use today in stationary applications (Berndt
16
1993 Wikipedia nd) One of the first applications of lead-acid batteries was for
storing electrical energy for telegraphy systems The capacity required for these
applications was low and the battery at that time was not yet suited to high power
industrial applications (TNI_Ltd 2007)
In 1880 a French chemical engineer Faureacute significantly improved the design of
the lead-acid battery by producing the active materials separately His method was
to coat the lead plate with a paste of lead oxides sulphuric acid and water in a
warm humid atmosphere The paste then changed into a mixture of lead sulphates
which adhered to the lead plate as an electrochemically active material As a result
of this technology the Faureacute cells are able to achieve much higher capacity with
the first charge in comparison with the Planteacute ones (Berndt 1993 TNI_Ltd 2007)
The problem of these plates is that they are not very durable and become weak
only after a few dischargecharge cycles The lead grid alloyed with antimony or
calcium was developed to improve the mechanical characteristics The holes on
the grid are able to achieve improved bonding thus the batteries may have a longer
lifetime This advantage led to the industrial manufacturing of lead-acid batteries
In 1881 a lead electrode with a ribbed surface was designed in order to have a
large effective surface of the active material and this was the pioneer of the large
surface plates which are still common today (Berndt 1993 TNI_Ltd 2007
Wikipedia nd)
In the beginning lead-acid batteries were operated in open jars The advantage of
this feature was that the electrode can be cleaned and exchanged easily but faced
the problem of water evaporation Therefore the early batteries have to refill water
17
in order to continue normal use However this problem can be dramatically
reduced when the cells were fitted with covers to limit the evaporation (Berndt
1993) This kind of battery design is known as a lsquoflooded lead-acid batteryrsquo
In the 1950s a new type of battery which was aimed to become spill-proof was
designed and manufactured on a large scale This type of battery is characterized
by an immobilized electrolyte however this kind of spill-proof battery was only
manufactured in small sizes up to about 10 Ah (Berndt 2001) Later the
combination of a valve improved the characteristic features of the lead-acid
battery and this kind of battery is still common today and is known as the Gel
Lead-acid battery (Berndt 1993) In the 1970s micron diameter glass fibres
originally designed for air filters were used in glass mats which absorbed the
electrolyte and acted as separator Soon this kind of Absorbent Glass Mat (AGM)
battery appeared in market for stationary application
Currently Valve Regulated Lead Acid (VRLA) batteries based on both AGM and
Gel electrolytes are available in a large range of capacities for both stationary and
mobile power applications with a range of different designs for each type of
application Arguably the most important application of lead-acid batteries is for
vehicle engine starting The battery employed in this application which is called
Starting Lighting and Ignition (SLI) batteries are designed to deliver bursts of
energy usually in a discharge current as large as several hundred amperes in a
very short time A different type of battery construction can produce batteries
capable of deep cycling which are more suited to slow discharge cycles (Tuck
1991 Anon 2007)
18
22 Configuration of Lead-acid Batteries
This section gives a brief description of the working principles of lead-acid
batteries and how the battery can be configured to suit different applications
221 Electrochemical Principles
The lead-acid battery comprises two electrodes and the electrolyte The structure
of the lead-acid battery is shown in Figure 2-1 in which one electrode is Cathode
and the other is Anode The active matter in the positive plate is made of lead
dioxide (PbO2) and that in the negative plate is made of lead (Pb) and the
electrolyte is sulphuric acid One electrode can serve either as a Cathode or as an
Anode depending on which process the battery is experiencing - charging or
discharging With this structure a battery could convert electrical energy into
chemical energy and back again which is associated with the process of charging
and discharging
(a) (b)
Figure 2-1 Working Principle of Lead-Acid Batteries (a) shows the battery when
19
discharging and (b) is when charging with a DC charger
For the discharging process as shown in Figure 2-1 (a) the negative plate acts as
the anode and the positive plate is the cathode If a wire is connected between the
two the excess electrons from the anode will travel through the wire as a current
to the cathode where they are needed to complete the electron deficient reaction
there The chemical reactions in a lead-acid battery when discharging are
described as follow
Negative plate reaction (Anode)
+minusminus+rarrminus+ HPbSO2eHSOPb 44
Positive Plate reaction (Cathode)
O2HPbSO2e3HHSOPbO 2442 +rarr+++minus+minus
For the charging process an external power source is connected to the two
electrodes with the voltage as shown in Figure 2-1(b) In this way the flow of
electrons is forced backwards against the electropotential and the reactions are
driven backwards changing the lead sulphate back into lead and lead dioxide on
the negative and the positive plates and restoring the sulphuric acid to the liquid
electrolyte The anode when a battery is charging is the positive plate and the
cathode is the negative plate and the chemical reactions in a lead-acid battery
when charging are described as
Positive plate reaction (Anode)
+minusminus++rarrminus+ 3HHSOPbO2eO2HPbSO 4224
Negative plate reaction (Cathode)
minusminus++rarr++ 44 HSOPb2eHPbSO
20
The thermodynamic heat effects caused by the reactions are small in the lead-acid
battery because the difference between the enthalpy and the free enthalpy is very
small The rate of reversible heat effect in the reaction is 132 kJ per mol of the
cell reaction which corresponds to about 35 of the total energy converted when
the lead-acid battery is discharging or charged This amount of energy is relatively
small and is generated over a comparatively long period of time so it is usually
easily dissipated through radiation and convection (Berndt 1993)
222 Lead-Acid Battery Types and Technologies
The flooded battery is the simplest type of lead-acid battery in use Flooded
batteries are common for some traction applications despite the requirement in
high maintenance They are also very common for large capacity backup power
supplies for telecommunication computer centres grid energy storage and off-
grid household electric power systems Since the flooded batteries are not sealed
they must be kept upright to avoid acid spills and water must be periodically
added to top up the liquid electrolyte The most attractive feature of the flooded
battery is that they are able to withstand certain level of overcharging without
damage providing proper maintenance is carried out
The Valve Regulated Lead-Acid (VRLA) battery which is often colloquially
called the sealed lead-acid battery is becoming more and more popular in many
applications Because VRLA batteries are mostly sealed the electrolyte
evaporation will be reduced and spillage can be largely avoided when
overcharging which are very common in flooded batteries The electrolyte of the
21
VRLA battery is designed to be immobilized so the VRLA batteries will not leak
if inverted pierced or if the container is broken They can be mounted in any
orientation and position even immersed in water The immobilization of the
VRLA electrolyte can be achieved by using an absorbent mat separator as well as
gelling materials
In Absorbent Glass Mat (AGM) battery the electrolyte is absorbed into a mat of
fine glass fibres in order to immobilize the electrolyte In addition the pores in the
mats are fine enough to prevent the lead dendrites in the cathode from growing
through as a separator and only glass is wetted enough by sulphuric acid can soak
the separators The glass mats can therefore be used to insulate the electrodes
Gelling is another way to immobilize the electrolyte and this gelling technology at
present is only applied for lead-acid batteries The idea is to mix the sulphuric acid
with silica fume (SO2) which makes the electrolyte gel-like The mixture is stable
over a long term environmental safe and easy to work technically (Berndt 1993)
The sulphuric acid bound by the gel can also insulate electrodes as a separator
similarly with that in an AGM battery
VRLA batteries including both gel and AGM batteries are able to recombine and
reduce the emission of gases during overcharge so the requirement for the room
ventilation is reduced and there is no acid fume emission during normal discharge
(Berndt 1993 Anon 2007 Wikipedia nd) Although the generation of hydrogen
can be slowed down it cannot be avoided completely As a result a valve
regulation safety system is employed in VRLA batteries which vents the gases in
22
the battery only during over pressure faults (Tuck 1991 Berndt 1993)
However the VRLA batteries do have some drawbacks First of all the VRLA
batteries tend to have a lower specific energy density than flooded batteries and
they are also more expensive An accurate charging control is very important for a
VRLA battery especially when charging under high temperature environments
since it is not possible to cure the damage caused by overcharge
223 Battery Designs for Different Applications
Lead-acid batteries are deployed in a range of applications Different designs are
therefore required due to the different working environments and duty cycles SLI
batteries are designed for a burst of energy for cold-cranking an engine A SLI
battery is supposed to provide power only in the first few seconds when starting
an engine and will be recharged immediately once the engine is started In this
kind of lead-acid batteries a larger surface area of the electrode plates is used to
provide high electric current in a short period However repeated deep discharge
may shorten the battery lifetime
On the other hand deep cycle batteries are designed for applications where the
batteries are regularly discharged The plates of the deep cycle batteries are often
very thick in order to withstand the frequent and deep discharge cycles The plate
surface area of a deep cycle battery is not as large as a SLI battery and as a result
it is not possible to offer great power
23
Marine batteries are a compromise between a SLI battery and a deep cycle battery
Standby batteries can be classified as marine batteries which are used for backup
power supplies and providing the power in emergency situations They are
designed for a long lifetime and a large capacity but repeated discharges and high
current drain are not the intended application Traction batteries are designed for
higher current drain and repeated deep discharge cycles They are usually bigger
and heavier than other types of lead acid for the same voltage and capacity but
that is the cost of durability
23 Mathematical Descriptions of Lead-acid
Batteries
In order to investigate the relationship between the battery behaviour and
remaining lifetime for a lead-acid battery initial studies have been carried out and
are described in this chapter Concepts including Capacity State of Charge (SOC)
Depth of Charge (DOC) State of Health (SOH) and internal resistance are
introduced and quantitative descriptions of these concepts are listed
231 Capacity
The capacity of a lead-acid battery represents how much charged energy the
battery can offer which is usually described in Ampere-hours (Ah) The charge
capacity of a battery is decided by the construction factors of a battery cell This
includes the materials contained in the electrodes and the acid solution In
addition the capacity of a battery is not a fixed quantity but varies according to
24
how quickly it is discharged This is known as Peukertrsquos law (Ceraolo 2000
Dhameja 2001 Rand Moseley et al 2004)
tICk
p = (21)
where pC is the capacity on one-ampere discharge rate which is a constant
I is the discharge current (A)
t is the time of discharge (h)
k is the Peukert constant and for a lead-acid battery with the value
between 11 and 13 (varies for each individual battery)
It is common to refer to ldquoCnrdquo as the capacity of battery in Amp-Hours which
corresponds to complete discharge of the battery in n hours ldquonrdquo is a subscript that
represents the discharge rate In industry the capacity under ten-hour discharge
rate (C10) is always taken as the nominal capacity
232 Electromotive force
The electromotive force of a battery cell is the difference between the electric
potential of the two electrodes of each cell (Rand Moseley et al 2004) The
potential of each electrode which is called half cell potential is decided by the
chemical reaction and the relative activities of the solution and can be obtained
from Nernstrsquos equation (Crompton 2000)
25
Ox
Redln0
α
α
zF
RTEE minus= (22)
where E is the half-cell potential (V)
0E is the standard half-cell potential (V)
α is the relative activity of the oxidizer (α Ox) and reducer (α Red)
z is the number of electrons transferred in the cell reaction
R is the universal gas constant which is 8314472 JKminus1molminus1
T is the absolute temperature
F is the Faraday constant the number of coulombs per mole of electrons
and F = 964853399times104 Cmolminus1
At room temperature RTF is a constant of 25693mV for cells therefore
Ox
Redlog
z
V05910
Ox
Redln
z
mV69325
Ox
Redln 10
α
α
α
α
α
α==
nF
RT
The Nernstrsquos Equation therefore can be expressed by
Ox
Redlog
V0591010
0
α
α
zEE minus= (23)
The electromotive force could be calculated by the difference of the electric
potential
cathodeanode EEEMF minus= (24)
When a lead-battery is discharging the electromotive force can be written as
26
O)(H
)(SO)(Hlog
V05910
2
2
24
10
00
α
ααminus+
+minus=z
EEEMF cathodeanode (25)
The standard half-cell potential of the anode 0
anodeE is equal to 1685 (PbO2-
PbSO4SO42-) and that of cathode
0
cathodeE is -0356 (Pb-PbSO4SO42-) which are
constants for the same battery chemistry And the number of electrons transferred
( n ) is 2 for a lead-acid battery
Therefore the electromotive force of a lead-acid cell can be obtained by
O)(H
)(SO)(HlogV029600412
O)(H
)(SO)(HlogV02960)3560(6851
2
2
24
10
2
2
24
10
α
αα
α
αα
minus+
minus+
+=
+minusminus=EMF
(26)
This electromotive force of a battery cell is numerically equal to the open circuit
voltage which means that the terminal voltage of a single cell battery when it is
disconnected from the external load For a lead-acid cell the electrochemical
force at fully charged is between 210-213V per cell
233 State of Charge and Depth of Charge
State of charge (SOC) and depth of charge (DOC) are variables that can describe
the battery charge The main difference is that the SOC describes the percentage
of remaining charge relative to the nominal capacity while the DOC represents
that relative to the actual capacity under a specific discharge current These two
27
variables can be obtained by calculating the charge consumed and the battery
capacity
101 CQSOC eminus= (27)
Ie CQDOC 1minus= (28)
where Qe is the charge consumed by the load (Ah)
C is the nominal capacity (Ah)
CI is the actual capacity under the discharge current I (Ah)
234 Internal Resistance and State of Health
The internal resistance of a lead acid cell is the physical resistance of the cell The
value of the internal resistance is decided by many different factors But it could
be obtained by a simple equation
I
VVr tOC minus
= (29)
where Voc is the open circuit voltage (V)
Vt is the terminal voltage when discharging (V)
I is the discharge current (A)
However the factors in this equation are only a method of calculating the internal
resistance but not the determinants It is shown in applications that the internal
resistance of a lead-acid battery will increase when discharging as the SOC and
28
the DOC drops
It is common for batteries to suffer a capacity loss when discharged and charged
in a number of duty cycles even when idle Aged batteries are often weak and
sometimes not able to offer enough charges Therefore they should be replaced or
maintained State of health is a defined variable that is important for a weak
battery This variable is to show how weak the battery is and represents the
percentage of remaining capacity to the initial capacity when the battery is brand
new (Okoshi Yamada et al 2006) as shown in the equation
new
weak
C
CSOH = (210)
where Cweak is the remaining capacity of a weak battery (Ah)
Cnew is the capacity when the battery is brand new (Ah)
The reason for the capacity loss is complex but is usually due to the sulphation
Sulphation is a process when the amorphous lead sulphate which is easily
converted back to lead lead oxide and sulphuric acid converts to a stable
crystalline form coating the electrodes This form of lead sulphate cannot conduct
electricity and cannot be converted back to lead lead dioxide and lead sulphate
under normal charging conditions The internal resistance of a lead-acid battery
therefore increases and less charge can be provided when discharging Complete
or repeated deep discharges of a battery at low current densities that lead
excessive utilization of the active material are the most critical reason for
29
capacity loss for example a discharge of a traction battery that draws more than
80 of its nominal capacity (Berndt 1993)
235 Multi-Cell Lead-Acid Batteries
In most applications of batteries the voltage of an individual cell is not enough to
provide the sufficient voltage and power supply The solution is usually to series
connect a number of cells in a battery in order to achieve a higher battery voltage
The electromotive force of a series of lead-acid battery cells is directly related to
the cell numbers as well as the charge state of each cell For a six-cell lead-acid
battery which is a standard for most common usages the fully charged
electromotive force is about 128V The internal resistance of a multi cell battery
however is also equal to the sum of the internal resistances of each cell
Usually all the cells in a multi-cell battery should be constructed in the same
manner and in particular the capacity should be consistent because the capacity of
a multi-cell battery will be limited to the cell with the lowest capacity If one of
the cells fails it is not possible for the current to flow through the cell and the
battery is therefore disconnected from its internal cell loss Also if the SOC of one
particular cell drops faster than others in a battery the electromotive force of that
cell may affect the whole behaviour of the battery
24 Summary
The technology development of lead-acid batteries has been continuous over the
30
last 150 years From the earliest open cell batteries different advanced battery
configurations are now available which have been adopted in a wide range of
applications Meanwhile a number of solutions have been developed to address
the battery problems encountered in applications such as electrolyte evaporation
spillage and the electrolysis of electrolyte when charging However there are still
issues affecting the efficient and safe use of lead-acid batteries for example
determination of the SOH which if addressed in a robust manner would lead to
significant improved battery management system performance This chapter has
presented the essential fundamental knowledge technology terms and working
principles of lead-acid batteries which is served as a preparation for further study
reported in the following chapters of the thesis
In order to reveal the dynamic behaviour of a battery under different SOH and
identify the suitable strategy for SOH determination the mathematical modelling
study is carried out and an equivalent circuit model is derived in the next chapter
The key concepts of the battery model are explained and the fundamental analysis
is given for the concepts introduced
31
Chapter 3
Equivalent Circuit Modelling
of Lead-acid Batteries
In order to estimate the status of a battery a model based approach is adopted in
the project A mathematical model for lead-acid batteries should be developed
with a suitable level of abstraction This chapter describes the requirements to the
model to serve the project objectives and reviews the available model
technologies An improved mathematical model for lead-acid batteries is
introduced in the late part of this chapter
31 Requirements for the Battery Model
The main objective of the project is to develop an algorithm that can determine
the battery health by monitoring the battery status during discharge cycles This
algorithm is designed for implementation in a battery health monitoring system
with life-time prediction capabilities This prediction system is intended to work
on applications where the battery performance is of great importance for instance
hospital UPS systems and vehicle ignition systems To achieve the objective the
requirements to the mathematical model can be defined as
Requirement 1 The model should be able to calculate the evolution of key
battery parameters including terminal voltage cell temperature the state of health
32
and the internal resistance which describe the condition of the battery for
dynamical discharging It should also be able to adequately represent dynamic
processes while the battery is discharging
Requirement 2 The complexity of the model must be sufficient to satisfy the
requirement 1 but must also be executable in real-time for a model-based
condition monitoring system
Requirement 3 The output of the battery model should be understandable to the
battery operators and technicians as well as meaningful to those who do not have
any background in battery technologies
32 Overview of Battery Model Techniques
A number of different types of battery models have been used to serve as a tool in
solving a range of problems (GONG 2005) These include Electrochemical
Models Computational Fluid Dynamics Models Finite Element Models and
Equivalent Circuit Models This section gives an overview to the above named
four different types of battery models and the problems which are addressed by
each of them In Section 324 every battery model technology is assessed against
the overall requirements
321 Electrochemical Model
Electrochemistry is a branch of chemistry that studies chemical reactions which
33
take place in a solution at the interface of an electron conductor (a metal or a
semiconductor) and an ionic conductor (the electrolyte) The reactions involve
electrons transfering between the electrode and the electrolyte or species in
solution The application of electrochemistry research directly leads to the
development of the lead-acid batteries
Behaviour of a battery depends not only on how the battery is used but also on a
number of construction factors (Ruetschi 2004) These factors include but are not
limited to the thickness of the plates the active mass density of the active
material the concentration of the acid solution and the geometry of the electrodes
(Berndt 2001 Ruetschi 2004)
The electrochemical model is mainly focused on the oxidationreduction reactions
between the electrolytes and the electrodes By analyzing the consistency of each
matter in the solution and the electrochemical reaction caused by the connection
of electrodes to external circuit it is possible to represent the dynamic behaviour
of the battery (Crompton 2000)
322 Physical Models
The finite element method is a numerical analysis technique for finding
approximate solutions of partial differential equations as well as of integral
equations The basic principle of the Finite Element Model (FEM) is to divide the
problem into elements and each element is a smaller problem to be solved so that
they could be analyzed separately The lsquoelementsrsquo are then be assembled together
34
to restore the initial problem
Finite element is a very popular method of analysis in those areas with a complex
geometry and it is good at stress and thermal analysis For batteries the Finite
Element Models can help with a good understanding of the heat loss and that for
vibration problem in mobile applications There are also attempts to analyze the
current density on the positive grid bar in a lead-acid battery using FEM (Ball
Evans et al 2002)
Computational Fluid Dynamics (CFD) technology is a well-established tool for
physical analysis and optimization of fluid flow mass and heat transfer and
related phenomena (eg chemical reactions) that may simultaneously take place in
a complex system (Liaw Gu et al 1997) Computers are used to perform millions
of calculations required to simulate the interactions of fluids and gases with the
complex surfaces used in engineering
In a CFD Model of a battery the dynamic governing equations are solved with
respect to time space and all the physical time and space dependent properties
Acid concentration and potential distribution across the cell for instance can be
obtained Therefore such a modelling is able to give a very good understanding to
battery parameters and detailed characteristic of battery dynamics
323 Equivalent Circuit Model
An equivalent circuit refers to the simplest form of a circuit that retains all of the
35
electrical characteristics of the original (and more complex) circuit In its most
common form an equivalent circuit is made up of linear passive elements
However more complex equivalent circuits are used to approximate nonlinear
behaviours of the original circuit as well
In electrical engineering it is often useful to use an equivalent circuit model to
describe the non-ideal operation of a device For electrical engineers electrical
models are intuitive useful and easy to handle especially when they can be used
in circuit simulators and alongside application circuits
324 Discussion of Different Battery Model Methods
The electrochemical model focuses on the electrochemical reactions and the
activities in the battery which is very popular in the applications for the
constructional and design purpose However many electrochemical factors
contained in the electrochemical model are irrelevant to the external circuit and
some of the important parameters like the internal resistance are hard to describe
in an electrochemical model Therefore this model technology is not able to meet
the project Requirement 1 As the calculations in the electrochemical model are
not complicated Requirement 2 can be therefore satisfied by an electrochemical
model of battery Requirement 3 might be difficult to obtain for an
electrochemical model because the understanding of the outputs for an
electrochemical model usually need some background knowledge of the battery
chemistry As a result the electrochemical model is not chosen for the project
36
Physical models can give good understanding to the battery important parameters
so that Requirement 1 of the project can be satisfied The Requirement 3 can be
also met as the terminal voltage can be calculated as the output with the
knowledge of these parameters One significant disadvantage is that the physical
models involves huge amount of calculation in analysis which is quite time
consuming In finite element or CFD methods a large nonlinear system of
equations is solved iteratively and that could take excessive CPU time especially
for when the system is more than 2 dimensions As a result the physical
modelling methods cannot meet the Requirement 2 of fast response required by
the project (Esfahanian Torabi et al 2008)
In an equivalent circuit model most of the characteristic required by the project
can be reached in a reasonable level It is able to reflect the dynamic behaviour of
battery using simple circuit blocks such as voltage sources resistors and
capacitors (Chen and Rincacuteon-Mora 2006) That is to say the Requirement 1 of
the project can be satisfied by the equivalent circuit model And the model
simplicity causes its low computational time as Requirement 2 and therefore it
can be suited to the online implementation (Esfahanian Torabi et al 2008)
Additionally basic battery parameters like internal resistance terminal voltage
and SOC etc can be chosen as the main output of the model to meet the
Requirement 3
Table 3-1 summarized a comparison of all the three model methods on the
satisfaction of the requirements for the project
37
Table 3-1 Satisfaction of the Requirements in different Model Methods
Requirement 1 Requirement 2 Requirement 3
Electrochemical Model times radic times
Physical Model radic times radic
Equivalent Circuit Model radic radic radic
33 Introduction of the Existing Equivalent
Circuit Models
Section 32 introduced three different types of battery models to serve for different
research purposes each with different features and strengths It has been shown
that the equivalent circuit model that pays attention to the relationship between the
internal circuit and the external characteristics can adequately meet all the
requirements of the project Therefore further studies of battery models have been
carried out and six equivalent circuit battery models with different merits and
complexity are presented while the technique improvements are briefly described
in this section
331 Simple Battery Model
The Simple Battery Model is the simplest battery model As shown in Figure 3-1
this model consists of only ideal battery mE as the electromotive force of a battery
and a resistor r in series connection as the internal resistance bV in the figure is
the terminal voltage of the battery
38
Figure 3-1 Simple Battery Model
The Em in Figure 3-1 stands for the electromotive force of the battery while r
represents the internal resistance and Vb is the Terminal Voltage This model is
only applicable in some circuits where the state of charge is of little importance
because it does not consider the varying characteristic of the internal resistance in
different states of charge The model is often used in circuits where the battery
does not have major influences to the circuit analysis But without being able to
describe the battery behaviours in details this model is not suitable for the
research purpose In the Simple Battery Model the electromotive force mE can be
obtained by open circuit measurement and r can be calculated by measurement
with connecting a load to the battery after taking an open circuit measurement
For a battery with a terminal voltage of 13V and the internal resistance of 05Ω
the change of terminal voltage in a Simple Battery Model as the discharge current
increases can be given as Figure 3-2
39
Terminal
Voltage
Discharge
Current
0
10V
13V
Figure 3-2 I-V chart of the Simple Battery Model
332 Advanced Simple Battery Model
This model is developed based on the Simple Battery Model and has the same
block diagram as the Simple Battery Model The only difference is that this model
employs a variable resistor which depends on the state of charge (CUN
FIORINA et al Durr Cruden et al 2006) The relationship between the value of
the variable resistance and the state of charge is as follow
aSOC
Rr 0
= (31)
where 0R is the resistance of the battery when it is fully charged
a is the capacity coefficient
SOC is the state of charge of battery from 0 (completely discharged) to 1
(fully charged)
6A
40
The most important improvement of this model is that instead of a constant
internal resistor the value of the internal resistance is expressed as equation
function of SOC For the same battery described in section 331 the I-V chart in
different SOCs can be concluded as shown in Figure 3-3
Terminal
Voltage
Discharge
Current
0
10V
13V
SOC=1
SOC=60
Figure 3-3 I-V Chart in different SOC
333 Thevenin Battery Model
The previous models do not account for any transient behaviour of batteries
Figure 3-4 shows the gradual change in battery characteristics when external loads
are connected or disconnected to the battery
6A
41
011
14
125
Terminal
Voltage
t
Figure 3-4 Sketch to show battery discharge behaviours in typical tests
Thevenin Battery Model is one commonly used model which consists of an ideal
battery electromotive force ( mE ) internal resistance (0R ) overvoltage resistance
(1R ) and capacitance (
1C ) and the equivalent circuit is shown in Figure 3-5
(Casacca and Salameh 1992 Salameh Casacca et al 1992 Chan and Sutanto
2000) 1C represents the actual capacitance of battery and
1R represents the
resistance contributed by the contact resistance of the plate and the electrolyte
(Durr Cruden et al 2006) The capacitance in the Thevenin Battery Model can
overcome the trend of terminal voltage shown in Figure 3-4
No load No load Load
42
Figure 3-5 Thevenin Battery Model
The main disadvantage of this Thevenin Battery Model is that all the parameter
values are assumed to be constant but in fact they are strongly dependent on the
state of charge and discharge rate and some other discharge characteristics
334 Dynamic Battery Model
This model is developed based on the Thevenin Battery Model Similar to the
improvements made by the Advanced Simple Model comparing with the Simple
Battery Model the most important difference is that it takes into account the non-
linear characteristic of the open circuit voltage and internal resistance represented
by SOCK (Jayne and Morgan 1986 Sims 1990)
ISOC
KRVV bocb )( +minus= (32)
where bV is the terminal voltage of battery
ocV is the open circuit voltage
bR is the battery terminal resistor typically 01Ω
43
K is the polarization constant
I is the discharge current
335 Fourth Order Dynamic Model
This is a more accurate and sophisticated model The current pI flows through
pR (electrolyte reaction) dR (Ohmic effect) and its associated leakage
capacitance dC and wR (waste of energy) and its associated leakage
capacitance wC Current sI flowing through the resistor sR represents the
behaviour of self discharge (Gillioli and Cerolo 1990 Chan and Sutanto 2000)
The main drawback of this model just as its name indicates is that there are
fourth order equations due to consideration of the paralleled R-C blocks in the
circuit and therefore it takes more time for the computation Another drawback is
that a number of empirical parameters are contained in the model
Figure 3-6 Fourth-order Battery Model
44
336 Improved Battery Model
The most popular Equivalent Circuit Model used by researchers is the Improved
Battery Model (Casacca and Salameh 1992 Salameh Casacca et al 1992) This
model is simple but meets most requirements for a good battery model It contains
most non-linear characteristics and is linked to the state of charge Most elements
included in this model are the functions of the state of charge or the open circuit
voltage which is also related to the state of charge The improved model is
studied in this chapter and implemented in MatlabSIMULINK environment
Figure 3-7 Improved Battery Model
34 Mathematical Model of the Lead-acid
Batteries
As the Improved Battery Model is able to reflect the major dynamic behaviours of
a battery and does not take much computation time it meets the requirements for
45
the project Therefore the mathematical model developed in this project is based
on the Improved Battery Model by involving the components of variable voltage
sources as the electromotive force ( EMF equal to the open circuit voltage OCV )
variable resistors as internal resistance and overvoltage resistance and a capacitor
as the capacitance of battery The description and the detailed analysis of the
model are given in this section
341 Capacity
Based on the Peukertrsquos law introduced in Chapter 2 the relationship of capacity
with different discharge currents is obtained below
2121
2211
)( ttII
tItIC
k
kk
p
=
== (33)
And following the definition of battery capacity the capacity is
12
1
2111
1
21121121121222 )()())(()( I
kkkk
I CIItIIItIIIIItIIItICminusminus
=====
12
1
21 )( I
k
I CIICminus
=there4 (34)
where Cp is the one ampere capacity
CI2 CI1 is the capacity under the discharge current I2 I1
k is a constant that related to the battery
The equation of calculating the capacity by the discharging current can be
46
obtained through experiments (Ceraolo 2000 Barsali and Ceraolo 2002) An
experimental result is given as
m
c
c
IIK
CKIC
))(1(1)( 0
0minus+
= (35)
where )(00 ICC = which stands for the capacity when discharging at the rated
discharge rate usually the nominal capacity C10
cK is empirical coefficient and is 118 for lead-acid batteries
m is empirical coefficient of 120
This equation overcomes the inadequacies of the Peukertrsquos law The capacity
calculated by the Peukertrsquos law in a low discharge current is much larger than that
experimentally obtained (Ceraolo 2000)
With the parameters of 20118124420 ==== kKAIAhC c the simulation
study indicated that the capacities of low discharge rate (lt30A) in different
equations are quite similar as shown in Figure 3-8
47
0 5 10 15 20 25 30 35 40 45 500
10
20
30
40
50
60
70
80
Discharge Current (A)
Actu
al C
apacity (
Ah)
Based on Peukerts law
Based on the Equation 35
Based on the Equation 35
Based on thePeukerts Law
Figure 3-8 Battery Capacity vs Discharge Current
Variations of the cell temperature also affect the battery capacity The effect of
temperature on the battery capacity is described by the following equation
(Ceraolo 2000 Barsali and Ceraolo 2002)
ε
θ
θθ
minus+=
f
ICIC 1)()( 0 (36)
where fθ is the electrolyte freezing temperature and is equal to -40˚C
θ is the cell temperature
)(0 IC is the capacity of battery under the discharge current I at 0˚C
ε is a constant that equals to 129
48
Therefore
m
c
f
c
IIK
CK
IC))(1(1
1
)(
0
minus+
+
=
ε
θ
θ
θ (37)
342 Electric Networks
Figure 3-9 (Ceraolo 2000 Barsali and Ceraolo 2002) shows an adaptation of
electric network based on the improved battery model shown in Figure 3-7 The
major change of this equivalent circuit is that the self-discharge is not taken into
account because the self discharge is usually less than 10 per month in modern
technologies which can be ignored in normal applications
Figure 3-9 Lead-acid Battery Equivalent Network
In the figure mE in this the main branch represents the electromotive force of the
battery and Vb stands for the terminal voltage The mZ in the figure stands for the
internal impedance that can be approximated by two R-C blocks
49
Battery is an energy storage device but not all the energy that the battery gets
from the charger can be stored when a battery is charged Part of this energy is
lost for different reasons like water electrolysis A parasitic branch is therefore
added to the model to represent the energy loss This part is claimed to work only
when the battery is being charged (Ceraolo 2000 Barsali and Ceraolo 2002) In
this project the current of the parasitic branch pI in the figure can be described as
an equation of the voltage of the parasitic branch PNV instead of a simple resistor
pR because of the nonlinear character of the parasitic branch This issue will be
discussed in later sections
As a result of these factors an equivalent electric network of in Figure 3-9 is
designed as shown in Figure 3-10 in which 1C 1R and 0R are the elements of the
internal impedance mZ It is used in the whole project as the electric network of
mathematical model
Figure 3-10 The Equivalent Network with the Approximated mZ
50
343 State of Charge and Depth of Discharge
In Chapter 2 Equations 27 and 28 show the definitions of SOC and DOC of a
battery In the model the nominal capacity can be treated as C(0θ) while the
actual capacity is C(Iavg θ) therefore
)0(1 θCQSOC eminus= (38)
)(1 θavge ICQDOC minus= (39)
where σσ dItQt
e int=0
)()( is the charge already drained from the battery
)0( θC is the nominal capacity of battery
)( θavgIC stands for the actual capacity under the specific discharge
current
344 Electromotive Force of the Battery
The electromotive force of a battery which is Em in Figure 3-10 is the difference
between the electric potential of the two electrodes and can be calculated by the
Nernstrsquos equation (Eq 26)
)(
)()(log029600412
2
2
24
10OH
SOHEMF
α
ααminus+
+=
This equation gives a description of the electromotive force by the activity of
different matter in the sulphuric acid which is described as lsquoαrsquo When the battery
51
is being charged or discharged the electrolyte concentration changes and the
activity value of H+ SO42- and H2O in the Nernstrsquos equation changes which can
be found by the study of battery that is the EMF of battery will change as the
result of the change of state of charge The relationship between SOC and the
activity α is unknown but it is obviously that when the state of charge increases
the quotient of )(
)()(
2
2
24
OH
SOH
α
ααminus+
also increases This shows that the EMF rises
when the state of charge is increasing
From the literatures (Ceraolo 2000 Barsali and Ceraolo 2002) the electromotive
force is described simply as the following equation
)1)(273(0 SOCKEE Emm minusminusminusminus++++minusminusminusminus==== θ (310)
where 0mE and EK are constants for a battery
θ is the temperature of the cell
SOC is the state of charge of the battery
345 Internal Resistance of a Battery
The resistances of a battery as shown in Figure 3-10 can be calculated by the
equations (Ceraolo 2000 Barsali and Ceraolo 2002)
)]1(1[ 0000 SOCARR minus+= (311)
)ln(101 DOCRR minus= (312)
52
)exp(1 22
)]1([
202
21
IIA
eRR
m
SOCA
+=
minus
(313)
where 0A 21A and 22A are constants for a battery while 00R 10R 20R are
parameters related to the SOH which will be discussed in later chapters For the
model 020 asympR and can be omitted when a battery is discharging
Therefore the internal resistance of a cell when discharging is
)ln()]1(1[ 1000010 DOCRSOCARRRr minusminus+=+= (314)
346 The Behaviour of Parasitic Branch
When the battery is being charged there are some losses as represented by the
parasitic current This current depends on the electrolyte temperature and the
voltage at the parasitic branch (Ceraolo 2000)
Because the behaviour of parasitic branch is non-linear Tafel gassing-current
relationship is used instead of a simple resistance pR (Ceraolo 2000)
minus+= )1(exp
0
0
f
p
P
PNPPNp A
V
VGVI
θ
θ (315)
where pI is the current of the parasitic branch
PNV is the voltage of the parasitic branch
53
0PG is a constant in seconds
0PV is a constant in volt
pA is a constant
θ is the electrolyte temperature
fθ is the electrolyte freezing temperature and is equal to -40˚C
When the battery is being discharged 0asymppI the parasitic branch could be
omitted from the model in simulation if the charging behaviour is not necessary
to discuss
347 Main Branch Capacitance
In the electric network of the model there is an R-C circuit as shown in Figure
3-11
Figure 3-11 R-C block
where Im is the discharge current
IC1 is the current flow through the capacity branch
54
I1 is the current of R1
VR1 is the voltage over the R-C block
This branch can be solved by
))(
()( 11111111
dt
tdVCIRIIRIRV R
mCmR minusminusminusminus====minusminusminusminus====sdotsdotsdotsdot==== (316)
)()()(
111
11 tIRtVdt
tdVCR mR
R====++++ (317)
This is the differential equation that represents the main branch behaviour
Laplace transform is employed to solve this problem
)()( 1111 sIRsVSCR mR sdotsdotsdotsdot====sdotsdotsdotsdotsdotsdotsdotsdotsdotsdotsdotsdot (318)
1
)(
11
11
++++
sdotsdotsdotsdot====
SCR
sIRV m
R (319)
++++
====++++
========
SCR
C
SCR
R
I
VsG R
11
1
11
11
1
1
1)( (320)
where τ=11CR is the time constant that represents the double layer capacitance
When the current has a shape like a step and the initial voltage of the capacitor is
equal zero the solution in time becomes
m
t
R IeRtV )1()( 11τ
minus
minus= (321)
55
It is obviously that this equation is the typical form of the voltage with an R-C
circuit
348 Thermal Behaviour of a Battery
When the battery is charging or discharging there is a current flow through the
battery so that it produces heat due to the Joules law
0
2
1
2
12 RIRVIVVIP RPNps sdot++sdot+sdot= (322)
When discharging the parasitic branch and R2 are omitted the equation becomes
0
2
1
2
1 RIRVP Rs sdot+= (323)
The dynamic equation of cell temperature and the power is (Ceraolo 2000)
s
a PRdt
dC +
minus=
θ
θ
θθθ (324)
where θC is the thermal capacitance
θR is the thermal resistance between the battery and the environment
θ is the cell temperature and aθ is the environment temperature
56
35 Mathematical Model of the Lead-acid
Batteries
Considering the behaviour of capacity state of charge and depth of discharge
electromotive force and internal resistance an Improved Battery Model based on
the equivalent circuit shown in Figure 3-10 was introduced in previous sections
The battery model for the complete discharging progress can be derived as the
following equations
m
c
f
c
IIK
CK
IC))(1(1
)1(
)(
0
minus+
+
=
ε
θ
θ
θ (325)
σσ dItQt
e int=0
)()( (326)
)0(1 θCQSOC eminusminusminusminus==== (327)
)(1 θavge ICQDOC minusminusminusminus==== (328)
)1)(273(0 SOCKEE Emm minus+minus= θ (329)
)]1(1[ 0000 SOCARR minus+= (330)
)ln(101 DOCRR minus= (331)
1
1R
Cτ
= (332)
IeRtV
t
R sdotminussdot=minus
)1()( 11τ (333)
0
2
1
2
1 RIRVP Rs sdot+= (334)
57
sa P
Rdt
dC +
minus=
θ
θ
θθθ
(335)
)( θIC in the equations is the expression of capacity of battery when discharging
under the discharge current I and at a temperature of θ 0C stands for the
capacitance when discharging at the rated discharge current I while parameters
fθ and ε are constants in this model )(tQe represents the charge already
consumed while the equation of mE indicates the mathematical description of
electromotive force corresponding to the SOC and the cell temperature in which
0mE EK are constants for a battery 00R 10R are parameters related to the SOH
and the discharge current can also affect them τ in the equations are the time
constant of the R-C circuit which represents the time it takes the systems step
response to reach ( 6311 asympminus e ) of its asymptotic value The last two equations
represent the thermal dynamic of battery in which sP is the Joule heat generated
by the internal resistance θC is the thermal capacitance and θR is the thermal
resistance between the battery and the environment
36 Summary and Discussion
The Improved Battery Model based on the electric equivalent circuit is presented
in this chapter and it is proved that it can satisfy all the three requirements to serve
the project objectives This battery model consists of a variable voltage source
several R-C blocks and a parasitic branch as its electric network and the elements
are described as a variable related to the capacitance the charge consumption and
58
the cell temperature as well
However experimental tests show that the behaviour of the battery is much more
complicated can be represented by this equivalent circuit model For example the
internal resistance varies when discharging under different current and the time
constant of the R-C circuit at the beginning and end of discharge as well
Therefore the model has to be improved The next chapter overcomes these
problems found in the experimental tests and some improvements of the model
are described
59
Chapter 4
Experimental System Set up and
Improved Battery Model
Simulation Implementation
Experimental tests based on a 12V-13 Ah lead-acid battery are carried out and the
test system is introduced at the beginning of this chapter Some of the
characteristics of the battery can be found in the tests which has shown that the
battery model described previously is not accurate enough and improvements
have to be implemented into the model This chapter will focus on the analysis of
the battery characteristics and the description of the improvements implemented
In the last part of this chapter a finalised version of the battery model used in this
project is given and implemented in the MatlabSIMULINK environment for
simulation study
41 The Experimental System
In this experimental test system a variable resistor is used as the load of the
battery Three sensors are employed in the whole experiment process two current
sensors and one voltage sensor The equivalent circuit of the test rig designed for
the research purpose is shown in Figure 4-1
60
Figure 4-1 Equivalent Circuit of the Experimental Test Rig
In this figure the ideal voltage source EMF accompanying with the internal
resistance r acts as a lead-acid battery with 6 cells (12V) the terminals of the
battery are connected in parallel to a voltage sensor Switch Krsquo is employed to
control the voltage sensor connection so that the sensor can be disconnected from
the battery when the experiment is not being in progress to avoid an unnecessary
discharge The circuit break in Figure 4-1 can be used as a main controller which
decides whether the load is engaged to the battery to discharge or not Switch K
in the experiment is to vary the load of the system This experimental test system
is mainly designed for two different experimental tests of a battery in this study
constant-impedance load discharge and two-load discharge Figure 4-2 shows the
actual laboratory test rig used in the project
61
Figure 4-2 Experimental Test Rig
The data is collected and recorded every half second by a data acquisition card
PCI-6251 from National Instruments with the software environment of LabVIEW
and a 12V-13Ah lead-acid battery (marked in the red-dashed square in Figure 4-2)
is employed in the project as test batteries for the battery performance study
42 Improvements of the Battery Model
Figure 4-3 and Figure 4-4 show the typical data collected from the experimental
test rig Figure 4-3 is the result of a constant-impedance load discharge test with a
discharge current of 075A approximately and Figure 4-4 shows two-load
discharge with the discharge currents of 075A and 12A respectively
62
0 500 1000 1500 2000 2500 3000 3500 4000 4500 5000-02
0
02
04
06
08
1
12
Time (s)
Dis
charg
e C
urr
ent
(A)
0 500 1000 1500 2000 2500 3000 3500 4000 4500 5000105
11
115
12
125
13
Time (s)
Term
inal V
oltage (
V)
Figure 4-3 Test of constant-impedance load discharge top figure shows the discharge current of the experimental test and the bottom one shows the terminal
voltage 1τ is the time parameter of the R-C block at the beginning of the
discharge and 2τ is that when the discharge stopped
0 200 400 600 800 1000 1200 1400
0
05
1
15
Time (s)
Dis
charg
e C
urr
ent
(A)
0 200 400 600 800 1000 1200 1400118
12
122
124
126
128
Time (s)
Term
inal V
oltage (
V)
Figure 4-4 Test of two-load discharge top figure shows the discharge current of the experimental test and the bottom one shows the terminal voltage
I(t)RI1 and I(t)RI2 represent the voltage drop across the internal resistance value under different discharge current
1τ 2τ
I(t)RI1
I(t)RI2
I(t)RI1
63
421 The Change of τ in Different Charge Status
From analyzing these figures it is easy to find that it takes quite a long time for
the battery to have the steady terminal voltage when the discharge of battery stops
and it is longer than the time taken from the beginning of the discharge This
difference means that when the battery starts to discharge the time parameter
11CR=τ in the main branch equation (332) is not equal to that when the
discharge has just stopped In Figure 4-3 it is shown that when the discharge stops
the time parameterτ is longer than that when the discharge starts
As a result of this experimental feature a switch is employed to implement the
change of time parameter to match those described in the mathematical model of
the battery The switch is used to control the value of the time parameter τ in
different discharge currents When the battery is discharging the discharge current
is a positive value and the time parameter τ is equal to 1τ When the battery is
not discharging the discharge current is equal to 0 in theory and the time
parameter has a different value 2τ
Although the discharge current should be equal to 0 theoretically it is hard to
achieve this in the real experimental measurement because of the inaccuracy of
the current sensor reading due to the inaccuracy occurred in the power supply to
the sensor Therefore the trigger of the switch in the model is set to be 01 A that
is when the discharge current is greater than 01 A the time parameter is set to be
1τ as the battery is in its discharging segment By contrast the value of time
64
parameter is set to be 2τ and the discharge current is considered as the error
caused by the sensors when that current is less than 01 A
422 Analysis in Variations of the Internal Resistance
Another important issue found through analyzing the experimental test result is
that the internal resistance for a specific battery in a specific state of health (SOH)
is not a constant when the discharging current changes This difference is more
significant than the effect caused by the state of charge
For example in the two-load discharge results shown in Figure 4-4 when the
battery is not discharging the initial voltage is equal to the electromotive force
(EMF1) When the battery began to discharge at the discharge current I1 the
terminal voltage dropped to V1 After the discharge stopped for a while the value
of the terminal voltage is equal to the electromotive force (EMF2) at that state of
charge (SOC2) Then the discharge of the battery starts again at a current of I2 and
the terminal voltage dropped to V2 The discharge progress is then stopped for
certain of a time period to get the steady terminal voltage (EMF3) at that state of
charge (SOC3) After that the test of discharge at the I3 = I1 was repeated again
and get another terminal voltage of V3 The last discharge test is done to provide
the evidence for the fact that this change in the internal resistance is not caused by
the change of the state of charge (SOC)
The value of electromotive force in a discharging battery is equal to the sum of the
terminal voltage and the voltage that the internal resistance takes that is
65
nnnn IrVEMF sdot+=
Therefore the internal resistance can be calculated by
n
nnn
I
VEMFr
minus= (41)
From the data collected in the experiment the key parameter values for the graphs
shown in Figure 4-4 can be found as listed in Table 4-1
Table 4-1 Approximate Internal Resistance Calculating
n 1 2 3
Electromotive Force (EMFn) 1260V 1252V 1238V
Discharge Current (In) 078A 114A 076A
Terminal Voltage (Vn) 1219V 1203V 1197V
Substituting these values into Equation 41 the internal resistance can be
calculated Ω=Ω=Ω= 539043005260 321 rrr
This change of the internal resistance can cause quite a significant effect in the
discharge progress This problem can be possibly solved in a number of ways
One possible choice is to find a curve of the internal resistance change and the
discharge current for a specific battery after a certain numbers of experimental
tests But this method needs huge efforts in conducting experimental tests and the
result is not very meaningful for the project considering the time cost Another
possibility is to conduct the experimental tests with a constant load Therefore the
change of internal resistance caused by the change of discharge current could be
ignored As a result in the whole process of this project the same load is
66
employed either in the constant-impedance load discharge or in the two-load
discharge tests
In order to implement the different internal resistance value when discharging
under different load a switch that can control the parameters R00 and R10 is
employed This switch is controlled by the discharge current which is the main
input of the mathematical model In the two-load discharge tests when the switch
K in Figure 4-1 is switched off there is only one load is connected to the battery
terminals and the discharge current is lower the values of R00 and R10 are
switched to the first set of parameters R001 and R101 To the contrast when K is
switched on the discharge current is higher and the values are switched to the
second set R002 and R102
423 Improved Lead-Acid Battery Mathematical Model
From the model described in Chapter 3 and the improvements studied in this
chapter the mathematical model of lead-acid battery when discharging in different
discharge currents can be described as the following equations
m
c
f
c
IIK
CK
IC))(1(1
)1(
)(
0
minus+
+
=
ε
θ
θ
θ (42)
ττ dItQt
e int=0
)()( (43)
)0(1 θCQSOC eminusminusminusminus==== (44)
)(1 θavge ICQDOC minusminusminusminus==== (45)
67
)1)(273(0 SOCKEE Emm minusminusminusminus++++minusminusminusminus==== θ (46)
)]1(1[ 0000 SOCARR minusminusminusminus++++==== (47)
)ln(101 DOCRR minusminusminusminus==== (48)
11
RC
τ= (49)
IeRtV
t
R sdotminussdot=minus
)1()( 11τ (410)
RIRVP Rs sdot+=2
12
1 (411)
sa P
Rdt
dC +
minus=
θ
θ
θθθ
(412)
)(
)(
2
1
002
001
00Load
Load
R
RR
= (413)
)(
)(
2
1
102
101
10Load
Load
R
RR
= (414)
)10(
)10(
2
1
AI
AI
lt
gt
=τ
ττ (415)
001R 002R 101R 202R and 1τ 2τ in the equations stand for different parameter
values of 10R 20R and τ when the load and charge status changes in order to
reflect the improvements described in this chapter For a two-load discharge test
there are ten important unknown parameters in the equations of the mathematical
model which are unknown for a specific battery 0C 0mE EK 001R 002R 101R
102R 1τ 2τ and 0A As the internal resistance R00 and R10 vary only when the
load changes they can be treated as constants in the constant-impedance load
68
discharge tests the key parameters are therefore 21100000 ττRRKEC Em
and 0A In this project the study of state of health is based on constant-impedance
load discharge The identification of these unknown parameters will be discussed
in Chapter 5
43 Simulation Study
The processes described above have been implemented in SIMULINK as a
simulation model for computer based analysis The simulation program consists of
two main function blocks circuit block and thermal block The structure of the
SIMULINK implementation is described in Figure 4-5
69
Figure 4-5 Structure of model for SIMULINK Implementation
70
As shown in the figure there are mainly two inputs in the model the discharge
current and the discharge time The actual capacity of battery can be then
calculated with the knowledge of rated capacity and the discharge current The
actual capacity is also influenced by the cell temperature At the beginning of
discharge the cell temperature is the same as the surrounding temperature
Integrating the discharge current with respect to time is the capacity consumed in
the discharge progress and then the state of charge and the depth of charge can be
obtained It is shown that the electromotive force and the internal resistance vary
as a result of changing in the state of charge and the depth of charge and the
terminal voltage can be calculated
In the thermal block of the model the heat generated by the current and the
internal resistance are calculated by the Joules law Then this energy is
transferred to calculate the thermal temperature of the cell and the cell
temperature is given back to the circuit block to affect the actual capacity
71
0 1000 2000 3000 4000 5000 6000 7000
0
02
04
06
08
1
Time (s)
Dis
charg
e C
urr
ent
(A)
0 1000 2000 3000 4000 5000 6000 7000105
11
115
12
125
13
Time (s)
Term
inal V
oltage (
V)
Figure 4-6 Terminal Voltage of Battery (Constant Discharge Current SIMULINK)
The result in Figure 4-6 shows the terminal voltage of a battery which discharges
under the current of 08A in a simulation study Since the discharge begins the
voltage drops due to the internal resistance and the change of state of charge (SOC)
and it climbs up when the discharge stops However the voltage changes
gradually because of the time parameter τ This result shows a good qualitative
agreement with the experimental test results
72
44 Summary and Discussion
This chapter introduces the laboratory test system designed for the project and the
limitation of the mathematical model described in Chapter 3 Switches on the time
parameter τ and the internal resistance parameters R00 and R10 have been added to
the model so that the model is able to represent the change of these parameters
found in the experimental tests The implementation of the model under the
MatlabSIMULINK environment is described and the simulation study shows a
good qualitative agreement with the experimental test results
The next chapter will focus on the identification of those unknown parameters of
the battery model that are important for revealing the battery characteristics
including 20100000 τARRKEC Em and 1τ
73
Chapter 5
Model Parameter Identification
and Model Validation
The identification of the unknown parameters 20100000 τARRKEC Em and 1τ
in the mathematical model will be introduced in this chapter
51 Need for the Optimization Algorithms
In those equations of the battery model described previously some parameters are
unknown and some of them are difficult to derive from physics or engineering
principles or to be obtained through experimental tests Therefore the
identification of the model unknown parameters becomes an important part for the
project Parameter identification is an optimization process that adjusts the
parameters to enable the simulation results to show the best agreement with the
results acquired by the experimental tests There are many algorithms available
for optimization and the principle of the optimization process for the project is to
minimize the objective function The objective function is formed by the absolute
value of the difference between the simulated and experimental results at each
time point The set of parameters to achieve the least value of the objective
function is considered to be the fittest set
74
There are two basic requirements of the optimization in this project First of all as
the problem for the solutions trapped to the local minima is a very important and
challenging issue in many linear optimization solvers the optimization algorithm
used in this project must be able to find the global minimum Secondly the
optimization algorithm not only should find the minimum value of the objective
function but also can tell the values of the parameters that result in the best fitness
which is needed for the analysis purpose in this project Finally the time cost is
also an important factor in selection of a suitable optimization algorithm
It needs to point that the objective here is to identify the unknown parameters of a
model with an already known structure If the objective is to identify or
approximate unknown model structures the selection of optimisation methods
will be quite different In the case of latter Neural Network Genetic
Programming and Fuzzy Logical will be more suitable choices To concentrate on
the objective of the project the thesis will focus on optimisation algorithms for
parameter identification
52 Overview of the Optimization Algorithms
Brute-force search is the most basic direct search algorithm that is used to find the
minimum value In the brute-force search the initial guess is the minimum
possibility of parameters and increasesdecreases The parameter
increasesdecreases step by step in each iteration and the best solution can be
75
searched This algorithm is the simplest but its disadvantage is also obvious that
is it is the slowest optimization method especially when used in the identification
of more than two parameters and the results are largely dependent on the initial
guesses
Linear search is an optimization method to solve the linear optimization problem
the preference function of which is linear and the feasible domain is defined by a
linear constraint function The linear constraints define a convex polyhedron
geometrically which is called the feasible region The algorithm is to construct an
admission solution at a vertex of the polyhedron and then along edges of the
polyhedron to vertices with successively higher values of the objective function
until the optimum is reached
Besides the basic optimization methods evolution computation technology is
becoming increasingly popular A range of different evolution computation
technologies can solve the optimization problem in this project including genetic
algorithms (GAs) particle swarm optimization (PSO)
Genetic Algorithms are direct search algorithms inspired from the process of
evolution in nature the natural selection Based on the principle of survival of the
fittest the GAs can produce better and better approximations to the global optimal
solution in a number of generations In each generation a new group of solutions
is created by the fitness level in the problem of every individual in the last
generation The solutions are then bred together to lead to the evolution of
individuals
76
Particle swarm optimization is a stochastic population-based computer algorithm
modelled on swarm intelligence that searches for a solution to an optimization
problem in a search space Based on the social psychological principles each
individual called lsquoparticlersquo in PSO is able to provide information to others and
also learn the success from the local best and the global best The movement of
each particle through the search space are guided by these successes and the
solution can be found after a number of generations
It has been proved by Dr Jianlin in his PhD Thesis (Wei 2007) that both Genetic
Algorithm and Particle Swarm optimization are capable of the model parameter
identification But the Particle Swarm optimization is a new algorithm that first
described in 1995 and it is not as common as Genetic Algorithm in the research
areas
The purpose of this research work is to find a method for parameter estimation
Genetic algorithms are well proven solution for complicated optimisation
problems and have been applied successfully in a range of similar problems (Wei
2007 Wei Wang et al 2007) Genetic algorithms are also well suited to problems
with many local minima In the current work the exact form of the fitness
function is unknown and it is therefore important to select a robust technique
which can identify good overall solutions For these reasons GA was selected to
give the best possible chance of satisfying the overall project objectives within the
limited timeframe of the project
77
53 The Study of the Genetic Algorithms
The process of Genetic Algorithm is reviewed in this section to provide an insight
into how GAs work and simulation study of two bench mark functions are carried
out
531 Working Principle of GAs
There are many methods used to implement a GA process and usually a GA is at
least composed of three common genetic operators Selection Crossover and
Mutation (Pham and Karaboga 1998) The flowchart of a simple GA process is
given in Figure 5-1
As a preparation to start the optimization process a GA requires a group of initial
solutions as the first generation The first generation is usually a group of
randomly produced solutions created by a random number generator The
population which is the number of individuals in a generation should be big
enough so that there could be a reasonable amount of genetic diversity in the
population Also it should be small enough for each generation to be computed in
a reasonable period of time using the computer resources available Typically a
population includes individuals between 20 and 100 (Chipperfield Fleming et al
1994A)
78
Figure 5-1 Flowchart of a Simple Genetic Algorithm (Pham and Karaboga 1998)
The fitness function is evaluated to measure how close that the individuals fit the
desired result A fitness function could be either complex or simple depending on
the optimization problem addressed In a case of minimization problem the most
fitted individuals will have the lowest numerical value of the associated fitness
function
No
Yes
Selection
Crossover
Mutation
Find the Best Individual
Generate initial population
Results
Evaluate fitness values
Operators of generating new
generation
Gengt 100
Evaluation
Start
79
Individuals are selected according to a fitness-based process The operator of
selection is made up of ranking and selection progress by which more copies of
the individuals that fit the optimization problem better will be produced in the
next generation In GAs there are mainly two ways to select a new population
Roulette Wheel Selection (RWS) and Stochastic Universal Sampling (SUS)
The individuals will be recombined (crossover) after the selection This operation
is to produce two new individuals from two existing individuals selected by the
operator of selection by cutting them at one or more position and exchanging the
parts following the cut The new individuals therefore can inherit some parts of
both parentsrsquo genetic material There are usually four ways of doing this one-
point crossover two-point crossover cycle crossover and uniform crossover
(Pham and Karaboga 1998) Figure 5-2 (a) shows an example of the two-point
crossover progress
Mutation is another operator to produce new individuals The difference is that the
new individual is produced from a single old one In this operation the bit values
of each individual are randomly reversed according to a specified property A
mutation can also helps the GA to avoid local optimums and find the global best
solution Figure 5-2 (b) represents how the mutation operator works
80
Figure 5-2 (a) Crossover operation (b) Mutation operation
The group of individuals produced after the mutation is the second generation
Then the fitness value of each individual in the second generation is computed
again This cycle will not stop until the result is close enough or after a certain
generation
Three major Matlab toolboxes are applied in the current market for application
purpose they are Genetic Algorithms Toolbox V12 (Chipperfield Fleming et al
1994B) the Genetic Algorithms Optimization Toolbox V11 (Houck Joines et al
1995) Genetic Algorithm Direct Search Toolbox V102 (MathWorks Inc 2004)
In this project the official toolbox in Matlab form Mathworks Inc is employed
The property settings for the project based on Dr Weirsquos thesis (Wei 2007) are
shown in Table 5-1
Parent 1 1 1 0 0 1 0 1 1 0 1 0 1 1
Parent 2 0 1 1 0 1 1 0 0 1 0 1 0 0
Offspring 1 1 1 0 0 1 1 0 0 1 1 0 1 1
Offspring 2 0 1 1 0 1 0 1 1 0 0 1 0 0
(a)
Parent 1 1 0 0 1 1 0 0 1 1 0 1 1
Offspring 1 1 0 0 1 0 0 0 1 1 0 1 1
(b)
81
Table 5-1 The property settings for Genetic Algorithms
Name of the GA properties Value of the GA properties
Number of generations 100
Population size 20
Fitness assignment Rank-base fitness assignment
Selection Stochastic universal sampling
Crossover Scattered crossover
Crossover rate 07
Mutation function Uniform mutation
Mutation rate 01
Population size specifies how many individuals there are in each generation With
a large population size the genetic algorithm searches the solution space more
thoroughly and the gives more possibility to return the global minimum The
number of generations specifies the maximum number of iterations for the genetic
algorithm to perform If this number is too low the genetic algorithm is not able
convergence to the global solution However either a large population size or a
large number of generations can cause the algorithm to run more slowly The
crossover rate and the mutation rate are properties that control the crossover and
mutation operator High rate of these values means that the genetic algorithm has
a higher opportunity of producing new offspring but it can be easy to miss the
current best solution if these values are too big
Initial tests of genetic algorithms on different properties show that the values
shown in table 5-1 are able to find an adequate solution Similar results would be
82
obtained if the values of the generations and the population size are larger but
costing more CPU time The crossover rate and the mutation rate would not affect
the result significantly if only varies in a small range But it is impossible to prove
that these two values are the best choice due to the strong randomness
532 Simulation Studies of Genetic Algorithms
In order to test and demonstrate that Genetic Algorithms are able to meet the
requirements of the project simulation studies have been carried out Two
benchmark functions that are commonly used in evaluating evolutionary
computation algorithms are employed for the simulation studies They are
1) Rastrigin function
Rastrigin function is a typical example of non-linear multimodal function with
many local minima The problem of looking for the global minimum is quite
difficult due to its large search space and its large number of local minima The
function is shown as
))2cos(10(10)(1
2sum=
sdotsdotminus+sdot=
n
i
ii xxnXf πr
where n is the dimension of the problem and 1x ~ nx are the coefficients to be
identified Figure 5-2 shows a 2-dimensional Rastriginrsquos function while figure 5-3
is a contour plot of Rastrigins function shows the alternating maxima and minima
83
The global minimum of the Rastriginrsquos function is 0)( =Xfr
when
021 ==== nxxx L
Figure 5-2 2-dimensional Rastrigins function (MathWorks Inc 2004)
84
Figure 5-3 Contour plot of Rastrigins function (MathWorks Inc 2004)
In the simulation study a ten dimensional Rastriginrsquos function is adopted Figure
5-4 shows the best optimization performance of the Rastriginrsquos function in each
generation It is shown that after 700 generations a global optimal value is
obtained
85
0 100 200 300 400 500 600 700 800 900 10000
10
20
30
40
50
60
70
80Best 00099429
Generation
Fitness v
alu
e
Best f itness
Figure 5-4 GA performance (Rastrigrinrsquos function)
2) Rosenbrock function
Rosenbrock function is another mathematical function used as a test problem for
optimization algorithms The global minimum is inside a long narrow parabolic
shaped flat valley To find the valley is trivial but to converge to the global
minimum is difficult The Rosenbrock function is defined by
sum=
+ minus+minus=
n
i
iii xxxXf
1
2221 ))1()(100()(
r
where n is the dimension of the problem and 1x ~ nx are the coefficients to be
identified Figure 5-5 shows a 2-dimensional Rosenbrock function
86
The global minimum of the Rosenbrock function is 0)( =Xfr
when
121 ==== nxxx L The same as the Rastriginrsquos function a ten dimensional
Rosenbrock function is adopted for the simulation study Figure 5-6 is the GA
performance to the Rosenbrock function It can be found that the optimization
converges and get the global optimal value after 300 generations
Figure 5-5 2-dimensional Rosenbrock function (MathWorks Inc 2004)
87
0 100 200 300 400 500 600 700 800 900 10000
200
400
600
800
1000
1200Best 060113
Generation
Fitness v
alu
e
Best fitness
Figure 5-6 GA performance (Rosenbrock function)
54 Model Parameter Identification
541 Implementation of Genetic Algorithms and
Experimental Data sets
In this project the Genetic Algorithm Direct Search Toolbox V102 developed by
Mathworks Inc is employed to identify the parameters of the battery model The
process is shown in Figure 5-7
88
Figure 5-7 Progress of Parameter Identification
The fitness function is used in the project and the parameter identification is to
minimize the fitness function so that the model output can fit the experimental
result The fitness function is given as
sum
sum sumsum
minussdot=
minussdot++minussdot+minussdot=
minus
1
0
2
1 1
1
0
))()(()(
)()()(
exp
expexp2exp1
t
t
sim
t
t
t
t
simnsim
t
t
sim
tVtVabstW
VVabsWVVabsWVVabsWfitnessn
n
L
where Vexp is the experimental terminal voltage data
Vsim is the simulated terminal voltage
Wt is the weights of the difference in the simulated and experimental
results
This fitness function represents the sum of the error values at each time interval
Mathematical Model of a six-cell
Lead Acid Battery
Experimental Test
Results
Fitness
Function
Discharge Current
Simulation
Output
Terminal Voltage
Simulation
Input
lt fmin
Genetic Algorithms (Selection Crossover and Mutation
etc)
Parameter Update
Yes
No
Stop
89
considered ( ntt minus0 ) The weight coefficients Wt indicates how important the
weighted part is in the optimization and how much it contribute to the
optimisation process Periods with bigger tW values are more important because
the sum of errors will give big value contribution to the fitness function value and
the optimisation process will pay more attention to the higher weighted error parts
In the experiments and optimization process it is found that the results were more
important when the discharge of a battery at the stage of stopping Therefore the
weight in this period is greater than that of the others The weighting coefficient
values in this project are determined by the results of the first several attempts of
parameter identification The period of simulation data that fails to fit the test
result means that the weight value is not big enough until the overall performance
of simulation is reasonable
Following the objective fitness function unknown coefficients of the battery
model are identified using experimental data The mathematical model of a six-
cell lead-acid battery in the figure is described in Chapter 4 and the parameters are
to be identified by Genetic Algorithms are 210100000 ττARRKEC Em
Three sets of experimental tests have been carried out for the purpose of
parameter identification and the validation of the mathematical model These three
experimental results are based on a lead-acid battery with the ideal capacity of 13
Ampere-hours under the discharge current of 08A
90
542 Parameters of Battery Model
The parameters of the mathematical model of a lead-acid battery are identified
using Genetic Algorithms and the predicted battery responses using the identified
parameters are compared with the simulated results One set of typical values of
parameters identified are listed in Table 5-2
Table 5-2 Identified parameters identified by the Genetic
Algorithms in the model of 12V-13Ah lead-acid battery Parameter Value Parameter Value
0C 48198 (Amp-Sec) 0mE 21465 (V)
EK 0001109 (V) 0A 29895
00R 001038 (Ohm) 10R 012196 (Ohm)
1τ 21052 (s) 2τ 17565 (s)
Figure 5-8 shows the simulation results using the Improved Battery Model and the
change of weights defined for this set of result described in the fitness function
The top subplot of Figure 5-8 shows the weight value of the GA fitness function
described before while the middle figure is the discharge current of the
experimental test which is also the input of the mathematical model In the
following test results in this and next chapter the changes of weight value are
similar so they are not shown in the figures
The blue line marked as ldquoExperimental Terminal Voltagerdquo in the bottom figure
represents the measured outputs while the other one (Simulated Terminal Voltage)
represents the simulation results The simulation results are ldquonoisyrdquo because
experimental discharge current is used as the input of model in the simulation
91
progress It is obviously that Figure 5-8 shows a good overall agreement of the
results although some slope when discharging is not perfect
0 500 1000 1500 2000 2500 3000 3500
1
15
Time (s)
Weig
ht
0 500 1000 1500 2000 2500 3000 3500114
116
118
12
122
124
126
128
13
Time (s)
Term
inal V
oltage (
V)
Experimental Terminal Voltage
Simulated Terminal Voltage
0 500 1000 1500 2000 2500 3000 3500
0
05
1
Time (s)
Dis
charg
e C
urr
ent
Simulated Terminal Voltage
Experimental Terminal Voltage
Figure 5-8 Measured and Simulated Result after Parameter Identification
Figure 5-9 shows the mean fitness value and the best in each generation It can be
seen that the best fitness in each generation is decreasing The mean fitness is
unstable because of the mutation operator in the GA that can attempt to find better
solutions
92
0 10 20 30 40 50 60 70 80 90 100100
150
200
250
300
350
400
450
500
550
Generation
Fitness v
alu
e
Best 1075521 Mean 1312731
Best f itness
Mean fitness
Figure 5-9 Mean and the Best Fitness Values in Each Generation
543 Battery Model Validation
In order to validate the battery mathematical model two sets of experimental tests
have been adopted to compare with the simulation results
The inputs of the discharge current and the validation results using two
experimental tests are shown in Figure 5-10 and Figure 5-11
93
0 500 1000 1500 2000 2500 3000114
116
118
12
122
124
126
128
13
Time (s)
Term
inal V
oltage (
V)
Simulated Terminal Voltage
Experimental Terminal Voltage
Simulated Terminal Voltage
Experimental Terminal Voltage
Figure 5-10 Measured and Simulated Terminal Voltage (Validation data 1)
In the simulation that shows in Figure 5-10 the discharge of battery begins at the
time of 700s and the simulation result shows a reasonable agreement with the
experimental result despite the noise of signal caused by the error of the sensors
It is noticed that at the beginning of the discharge there is a difference between
the simulated and experimental terminal voltages for about 100 seconds This
difference is studied and so called lsquocoup de fouetrsquo which often takes place at the
beginning of a discharge test when the SOC of battery is high (Perrin Delaille et
al 2006) However this lsquocoup de fouetrsquo behaviour cannot be described in this
model The discharge period lasts for about 1200 seconds and then stops and after
that the simulation has the similar result with the experiment
94
0 1000 2000 3000 4000 5000 600011
112
114
116
118
12
122
124
126
128
13
Time (s)
Term
inal V
oltage (
V)
Simulated Terminal Voltage
Experimental Terminal Voltage
Simulated Terminal Voltage
Experiment Terminal Voltage
Figure 5-11 Measured and Simulated Terminal Voltage (Validation data 2)
Figure 5-11 shows another group of experimental test to validate the battery
model At the beginning of the experiment the terminal voltage from the
experiment is dropping without any discharge behaviour of battery and that is
because of the experiment was carried out when the terminal voltage of lead-acid
battery is not steady enough after being charged and that also causes the
deviations in the discharge at about 1000-2000 seconds In this period the lsquocoup
de fouetrsquo appears again After the first period the battery is disconnected from the
load until the terminal voltage become steady and the simulation result in this
period fits the experiment result well In the second discharge of this test it is
shown that the lsquocoup de fouetrsquo does not occur because the SOC is not high For
the similar reason in the first discharge in this group of the test results there are
95
also some deviations in this period Finally the simulation result in the last part of
figure fits the experimental result is highly satisfied
The average error of the simulated outputs of the simulation studies and the
measured results are studied Absolute Error and Relative Error is defined as the
following equations
sum
sum
=
=
minus=
minus=
N
i
sim
N
i
sim
iV
iViV
NRelError
iViVN
AbsError
1 exp
exp
1
exp
)(
)()(1
)()(1
The absolute error and relative error are summarised in Table 5-3
Table 5-3 AbsError and RelError of Model Validation
Absolute Error Relative Error discharging relaxing overall discharging relaxing overall
Experimental Test 1 (Identification)
00229V 00207V 00217V 01833 01724 01776
Experimental Test 2 (Validation data 1)
00536V 00484V 00492V 04453 03872 04024
Experimental Test 1 (Validation data 2)
00724V 00372V 00485V 06352 03013 05025
55 Summary and Discussions
Identification of the unknown model parameters is discussed in this chapter and a
range of possibly suitable methods are reviewed in brief In this project Genetic
Algorithm is adopted GAs working principle and its implementation has been
96
introduced in details in this chapter The simulation study of two benchmark
functions that are commonly used in evaluating evolutionary computation
algorithms are employed in order to show the capability of GAs The parameter
identification by tests of a brand new 13Ah lead-acid battery is carried out and is
validated by two sets of other experimental test results under the same working
condition of the same battery
97
Chapter 6
The Analysis of State of Health
(SOH) in association with the
Internal Resistance
61 Methodology
As the number of discharge cycles of battery increases in applications the
maximum charges that a battery can offer will decrease In other words the SOH
battery is deteriorating But this drop of capacity is not linear and it is also a long
progress At the beginning of the use of battery the change of capacity is very
slow and it is not obvious After a number of cycles of discharge and charge this
change will get faster and relatively significant
There are no reliable methods now to calculate the remaining charge capacity
which is the only one determinant of the state of health The normal method is
simply to measure the voltage on its terminals But this measurement is not
accurate on an aged battery A battery in poor state of health but sufficiently
charged can also offer sufficient voltage to appear normal The only way to
determine the capacity accurately is to integrate the discharge current of battery in
a full deep discharge but this method cannot be used too frequently because deep
98
discharge is harmful for the battery
In the project six lead-acid batteries were tested using the test system described in
Chapter 4 These batteries were repeatedly discharged and charged for their whole
life time so that the information related to different state of health can be revealed
as soon as possible Even though the batteries works frequently it still takes more
than 6 months to make the battery become weak The testing experiments were
carried out and the data was recorded every 2-3 weeks so that important value of
state of health is not missed However as the change of capacity is a long progress
and it is nonlinear not all the data collected can be used in this project
Referring the literature (Coleman Lee et al 2006 Lakhdari and Midoun 2007
Coleman Hurley et al 2008) an important factor that reflects the change of state
of health of a lead-acid battery is the internal resistance Not only the state of
health but also other factors (SOC DOC discharge current etc) can result in
variations in internal resistance a new alternative method that based on the
Improved Battery Model in Chapter 4 is adopted in the project
From the model study in Chapter 4 the internal resistance can be divided into two
parts expressed by )]1(1[ 0000 SOCARR minusminusminusminus++++==== (Eq 47) and )ln(101 DOCRR minusminusminusminus====
(Eq 48) These equations show that the internal resistance is affected by the state
of charge (SOC) and depth of charge (DOC) in a discharge cycle In real
applications batteries are seldom discharged to the full range because a deep
discharge could cause some damage to the battery They are also seldom to be
charged to full to prevent the possibility of overcharge that could also bring some
99
negative effects Although this issue is not very significant in a valve regulated
lead acid battery it is better to control the working range of depth of charge from
50 to 80 approximately In this project the internal resistance of battery in the
depth of charge of 65 is studied as a most important factor that related to the
state of health As a little inaccurate of SOC and DOC will induce a comparative
big difference in the internal resistance the method of measuring the internal
resistance accurately by an external circuit is discarded
In Equation 47 and Equation 48 the author found that there are two other factors
that influence the internal resistance besides the SOC and the DOC R00 and R10
Therefore in the project the values of R00 and R10 in a specific discharge current
are very important to study the internal resistance The values of these two factors
are used in Equation 47 and Equation 48 to calculate the internal resistance per
cell of the battery The depth of charge is assumed to be 65 for a normal
working battery as described previously In chapter 3 the SOC and the DOC are
defined as )0(1 θCQSOC eminus= (Eq 44) and )(1 θavge ICQDOC minus= (Eq
45) The Capacity is also defined as equation 42
k
c
fc
IIK
CK
IC))(1(1
)1(
)(
0
minusminusminusminus++++
++++
====
ε
θ
θ
θ (61)
in which Kc = 118 k = 120 and 6 II avg times= in this project The relationship
between the actual capacity under discharge current Iavg and the nominal capacity
is
100
62
1
))(1(1
1
)0)(1(1
1
))(1(1
1
)0(
)(asymp
minus+=
minus+
minus+=
k
avgck
c
k
avgcavg
IIK
IK
IIK
C
IC
θ
θ (62)
Therefore the SOC when the DOC is 65 is
586))0(62(1)0(1 asympsdotminus=minus= θθ CQCQSOC ee (63)
As described in chapter 5 30 asympA therefore the internal resistance of an
individual cell can be obtained by
10001000010 43041)ln()]1(1[ RRDOCRSOCARRRrcell sdot+sdotasympminusminus+=+= (64)
and for a six-cell lead-acid battery the internal resistance
1000 582486 RRrr cellbattery sdot+sdot=times= (65)
62 The identification of C0 R00 and R10
In the eight parameters identified previously in Chapter 5 there are only three
parameters can be affected by the change of battery conditions Therefore the
other five parameters ( 2100 ττAKE Em ) can be treated as a constant for a battery
The parameters that related to the battery condition 0010 RR and 0C are the key
problems which the project focused on 0C represents the state of health while
the 0010 RR stands for the internal resistance parameters Here again the Genetic
algorithm is adopted to identify these three parameters
In this project the battery have been discharged and charged in hundreds of cycles
to simulate the capacity loss in the normal applications which is described by the
101
state of health in this project In order to find out the different behaviour of
internal resistance in different state of health experimental tests have been carried
out in different state of health of the battery
The first test is carried out when the battery is brand new and the data is also used
to identify the other parameters of the battery model as described in the previous
chapter The second group of data is collected after 300 discharge cycles
approximately and the third test took place after 200 more cycles The number of
discharge cycles between the last four tests is only about 50 because the change of
State of Health is more significant The identified parameters of a battery in
different state of health are shown in table 6-1
Table 6-1 Battery Remaining Capacity and Internal Resistance
Remaining
Capacity C0 (Amps)
SOH R00 R10 RelError Internal
Resistance (Ohm)
Test 1 48198 100 00609 00220 01756 05683
Test 2 44861 9314 00654 00103 07428 05759
Test 3 38025 7889 00635 00191 02812 05827
Test 4 33830 7019 00573 00509 07265 06126
Test 5 30625 6354 00604 00582 04340 06575
Test 6 26072 5306 00703 00368 01342 06855
And the terminal voltages simulated and measured are shown as the following
figures The same as previous figures the blue lines represent the measured
outputs while the red lines represent the simulation results
The test shows in figure 6-1 the same as the test which is used to describe the
genetic algorithms and the battery parameter identification in chapter 5 Detailed
102
description and analysis are given in chapter 5
0 500 1000 1500 2000 2500 3000 350011
112
114
116
118
12
122
124
126
128
13
Time (s)
Term
inal voltage (
V)
Experimental Terminal Voltage
Simulated Terminal Voltage
Experimental Terminal Voltage
Simulated Terminal Voltage
Figure 6-1 Experimental and Simulated Terminal Voltage of Test 1 (SOH = 100)
103
0 1000 2000 3000 4000 5000 600011
112
114
116
118
12
122
124
126
128
13
Time (s)
Term
inal V
oltage (
V)
Simulated Terminal Voltage
Experimental Terminal Voltage
Simulated Terminal Voltage
Experimental Terminal Voltage
Figure 6-2 Experimental and Simulated Terminal Voltage of Test2 (SOH= 9314)
The experiment shown in figure 6-2 is tested several months after the first
experimental test In the period that the first discharge begins the experimental
result shows a different slope in terminal voltage The reason is probably that the
battery have just charged to full by a charger and itrsquos the capacitor had not fully
discharged After that when the discharge stopped there is a deviation in the
simulation voltage In the authorrsquos opinion that is because of the accuracy of R10
and R00 If the value of R10 is greater and that of R00 is smaller the simulation
result should fit the experimental result In the second discharge period of the
discharge test there is also a little difference in the experimental and simulation
result caused by the inaccuracy of battery parameters But it shows a good
agreement when the discharge stopped
104
0 500 1000 1500 2000 2500 3000 3500 400011
112
114
116
118
12
122
124
126
128
13
Time (s)
Term
inal V
oltage (
V)
Simulated Terminal Voltage
Experimental Terminal Voltage
Simulated Terminal Voltage
Experimental Terminal Voltage
Figure 6-3 Experimental and Simulated Terminal Voltage of Test3 (SOH= 7889)
0 500 1000 1500 2000 2500 3000 3500 4000 4500 500011
112
114
116
118
12
122
124
126
128
13
Time (s)
Term
inal V
oltage (
V)
Simulated Terminal Voltage
Experimental Terminal Voltage
Simulated Terminal Voltage
Experimental Terminal Voltage
Figure 6-4 Experimental and Simulated Terminal Voltage of Test4 (SOH= 7019)
105
0 1000 2000 3000 4000 5000 600011
112
114
116
118
12
122
124
126
128
13
Time (s)
Term
inal V
oltage (
V)
Experimental Terminal Voltage
Simulated Terminal Voltage
Simulated Terminal Voltage
Experimental Terminal Voltage
Figure 6-5 Experimental and Simulated Terminal Voltage of Test5 (SOH= 6354)
Figure 6-3 figure 6-4 and figure 6-5 show the test results of the battery when the
SOH drops to its 80 70 and 60 It is shown that the simulation result in
figure 6-3 fits the experimental result until the end of test when the discharge of
battery has just stopped The inaccuracy of the R10 and R00 is also the main cause
of the deviation The overall simulation result in figure 6-4 figure 6-5 are good to
express the battery behaviour
106
0 500 1000 1500 2000 2500 3000 3500 400011
112
114
116
118
12
122
124
126
128
13
Time (s)
Term
inal V
oltage (
V)
Experimental Terminal Voltage
Simulated Terminal Voltage
Experimental Terminal Voltage
Simulated Terminal Voltage
Figure 6-6 Experimental and Simulated Terminal Voltage of Test6 (SOH= 5306)
In the parameter identification of test shown in figure 6-6 the remaining capacity
is only about 12 of the initial capacity when the battery is brand new During the
discharge period the simulation and experimental result is not fitting very well
and the slopes of them are not the same This is probably also caused by
insufficient idle time after being charged and the capacitor had not fully
discharged
Figure 6-7 represents the internal resistance value in different state of health as
described in table 6-1
107
100 95 90 85 80 75 70 65 60 55 5004
045
05
055
06
065
07
075
08
State of Health
Inte
rnal R
esis
tance (
Ohm
)
r vs SOH
Approximation
Figure 6-7 Change of Internal Resistance in Different State of Health (Battery 1)
It is shown that the internal resistance is increasing when the state of health of a
lead-acid battery decreases This progress is at first very slow when the battery is
new But after a number of discharge cycles the remaining capacity of battery
drops to about 75 of the initial capacity when the battery is new and the
increase of internal resistance become faster When the state of health is brought
down to about 50 which means that the battery cannot offer enough energy as
new the value of internal resistance is increased by 30 approximately At
present there is not a published quantitative description of the internal resistance
when the capacity changes yet but it has been agreed that the internal resistance
increases while the battery health deteriorates
Similar tests have been carried out on 5 other batteries with the same nominal
108
capacity and the changes of their internal resistances are given as figure 6-8 It is
not possible to deduce a statistical approximation equation only based on the
existing data but it can be seen from the figure that the performance of internal
resistance under different state of health shows an agreement in a certain extent
100 95 90 85 80 75 70 65 60 55 5003
04
05
06
07
08
09
State of Health
Inte
rnal R
esis
tance (
Ohm
)
r vs SOH (Battery 1)
r vs SOH (Battery 2)
r vs SOH (Battery 3)
r vs SOH (Battery 4)
r vs SOH (Battery 5)
r vs SOH (Battery 6)
Figure 6-8 Change of Internal Resistance in all 6 Batteries
63 Summary and Discussions
The determination of battery remaining capacity accurately is becoming
increasingly important in modern battery managements This currently is mostly
obtained by integrating the discharge current of a full discharge but this progress
usually causes a negative effect on most of the batteries There is also a view that
109
the state of health which represents the percentage of remaining capacity of a
weak battery compared with the initial capacity when brand new can affect the
internal resistance therefore the battery state of health can be obtained by the
study of battery internal resistance However from the analysis based on the
mathematical model and the experimental results it can be concluded that other
parameters can also cause variations of the internal resistance which make the
estimation of the state of health more challenging
This chapter describes a new alternative method that based on the Improved
Battery Model and the key parameters of the model The remaining maximum
capacity of a used battery which represents the SOH of the battery is related in
the internal resistance under the depth of charge of 65 which is expressed by
the parameters of R00 and R10 These parameters can be identified by genetic
algorithms A result that quantifies the change of internal resistance in different
SOH values has been concluded based on the analysis of a series of experimental
tests
110
Chapter 7
Conclusions and Future
Research
This chapter summarizes the major achievements of the presented research work
in the field of battery modelling and state of health analysis Possible direction of
further research work is also described briefly in this chapter
71 Summary
Lead-acid batteries are used in various industrial sectors and are irreplaceable due
to their low price In areas where lead-acid batteries are employed as an energy
storage device the capacity loss caused by the repeated dischargecharge cycles is
very common This drop of capacity can neither be avoided nor be repaired by
using current technologies As a result it is essential to know whether the battery
is able to meet the demand and if it should be replaced on time
In this thesis a study on the capacity status of a battery and its relation to the
internal resistance had been conducted and this thesis established a novel model
based method to quantify the battery health An Equivalent Circuit Mathematical
model for the discharging progress of a lead-acid battery has been developed for
this purpose and is implemented under MatlabSIMULINK software environment
111
The model involves most of the important concepts of a battery to reflect the
dynamic response of terminal voltage when discharging
A series of experimental tests have been carried out during the project for the
model validation and the study of the state of health Six 12V-13Ah lead-acid
batteries with the same rated capacity are discharged and recharged from brand
new to obtain different values of state of health Genetic algorithm has been
employed to identify the unknown parameters of the battery model in each state of
health and the identified parameters are used as the factors that reflecting the state
of health and the internal resistance The internal resistances corresponding
different state of health have been collected and recorded A result was found in
the thesis that for the 12V-13Ah lead-acid battery which is used in the
experimental tests the value of internal resistance is increased by 25
approximately if the SOH of battery drops to 50
72 Limitations
The key limitation of the method introduced in this thesis is that it is based on the
parameter identifications of the model which means a test is still needed in order
to obtain the state of health The major reason is that the mathematical model does
not include the charging progress of battery which is also an important period of
the battery duty cycle Another limitation is that all the tests of the state of health
estimation are carried out at the same discharge rate because of the variation of
the internal resistance in different discharge rate as discussed in chapter 4 Finally
112
The lsquocoup de fouetrsquo behaviour that of took place at the beginning of discharge
when batteries are full is not able to be simulated in the current version of
mathematical model
73 Future Research Work
Following the limitations of the project some future research can be carried out in
three steps based on the model improvements and the practical applications of the
algorithm
First of all improvements of the discharging battery model can be carried out
which can mainly focus on the study of the battery internal resistance in different
discharge rates Equations of internal resistances that can withstand the change of
discharge rate will make the model capable for online applications Studies on the
relationship between the electromotive force and the state of charge can also lead
to a solution of the lsquocoup de fouetrsquo behaviour and a better simulation result
Another research work on the model modification is that the behaviour of battery
to the mathematical model when a battery is being charged can be involved by
which the monitoring system of battery can be implemented in the whole duty
cycles This part of work can be focused on the parasitic branch in the
mathematical model described in chapter 3
Further work should also reveal the variations of state of health in different duty
113
cycles and an algorithm based on this change should be designed to estimate the
remaining life-time of a lead-acid battery The value of current state of health and
the estimated raining life-time should also be considered as major outputs in this
period of work It is also possible to design an online management device of
battery to estimate the life-time and the state of health
114
References
Anon (2006) Global Wind Energy Council (GWEC) statistics [online] from
httpwwwgwecnetuploadsmedia07-
02_PR_Global_Statistics_2006pdf
Anon (2007) Battery Types Flooded versus AGM and Gel [online]
Retrieved February 13 2007 from
httpwwwvonwentzelnetBattery01Type
Anon (2007) BP Statistical Review of World Energy June 2007 [online] from
httpwwwbpcomliveassetsbp_internetglobalbpglobalbp_uk_englishr
eports_and_publicationsstatistical_energy_review_2007STAGINGlocal_
assetsdownloadsspreadsheetsstatistical_review_full_report_workbook_2
007xls
Anon (2007) International Energy Outlook 2007 [online] from
httpwwweiadoegovoiafieohighlightshtml
Ball R J Evans R and Stevens R (2002) Finite element (FE) modelling of
current density on the valve regulated leadacid battery positive grid
Journal of Power Sources 103(2) 213-222
Bernardes A M Espinosa D C R and Tenoacuterio J A S (2004) Recycling of
batteries a review of current processes and technologies Journal of
Power Sources 130(1-2) 291-298
Berndt D (1993) Maintenance-Free Batteries -- A Handbook of Battery
Technology Somerset Research Studies Press Ltd
Berndt D (2001) Valve-regulated lead-acid batteries Journal of Power
Sources 100(1-2) 29-46
115
Berndt D (2009) Electrochemical Energy Storage Battery Technology
Handbook CRC Press
Casacca M A and Salameh Z M (1992) Determination of lead-acid battery
capacity via mathematical modeling techniques Energy Conversion
IEEE Transaction on 7(3) 442-446
Ceraolo M (2000) New dynamical models of lead-acid batteries Ieee
Transactions on Power Systems 15(4) 1184-1190
Chan H L and Sutanto D (2000) A new battery model for use with Battery
Energy Storage Systems and Electric Vehicles Power Systems 2000 Ieee
Power Engineering Society Winter Meeting - Vols 1-4 Conference
Proceedings 470-475
Chen M and Rincacuteon-Mora G A (2006) Accurate electrical battery model
capable of predicting runtime and I-V performance IEEE
TRANSACTIONS ON ENERGY CONVERSION VOL 21( NO 2)
504-511
Chipperfield A J Fleming P J and Fonseca C M (1994A) Genetic algorithm
tools for control systems engineering Adaptive computing in
engineering design and control Plymouth UK
Chipperfield A J Fleming P J Pohlherim H and Fonseca C M (1994B)
Genetic algorithm toolbox for use with Matlab Department of automatic
control and systems engineering University of Sheffield
Crompton T R (2000) Battery Reference Book Third Edition Oxford
Elsevier Newnes
Cun J P Fiorina J N Fraisse M Mabboux H A and Mabboux H The
116
experience of a UPS company in advanced battery monitoring
Telecommunications Energy Conference 1996 INTELEC 96 18th
International 646 - 653
Durr M Cruden A Gair S and McDonald J R (2006) Dynamic model of a
lead acid battery for use in a domestic fuel cell system Journal of Power
Sources 161(2) 1400-1411
Esfahanian V Torabi F and Mosahebi (2008) An innovative computational
algorithm for simulation of lead-acid batteries Journal of Power
Sources 176(1) 373-380
Gillioli R and Cerolo P (1990) Charge and discharge fourth order dynamic
model of the lead battery 10th
intl Electric Vehicle Symposium Hong
Kong p1-9
Glendenning I (1981) Compressed air storage Physics in Technology 12(3)
103-10
GONG Q (2005) Modeling study of a vehicle traction battery model
CHINESE LABAT MAN 2005 Vol 42 Numb 2 issu 155 pages 76-79
Houck C Joines J and Kay M (1995) A Genetic Algorithm for Function
Optimization A Matlab Implementation NCSU-IE TR 95-09
Jacobi W (2009) Lithium Batteries Battery Technology Handbook CRC Press
Jayne M G and Morgan C (1986) a new mathematical model of lead acid
battery for electric vehicles Eighth Intl electric vehicle conference
Washington DC
Juvonen M (2003) Large-Scale Energy Storage Systems [online] from
httpwwwdocicacuk~mattiise2grpenergystorage_reportstoragehtml
117
Lee J H Lee K Y and Lee J Y (1996) Self-discharge behaviour of sealed
Ni-MH batteries using MmNi33+xCo07Al10-x anodes Journal of
Alloys and Compounds 232(1-2) 197-203
Liaw B Y Gu W B and Wang C Y (1997) Numerical simulation of coupled
electrochemical and transport processes in battery systems Proceedings
of the Intersociety Energy Conversion Engineering Conference
Honolulu HI USA IEEE
Lu S Meegahawatte D H Guo S Hillmansen S Roberts C and Goodman
C J (2008) Analysis of energy storage devices in hybrid railway vehicles
Railway Engineering - Challenges for Railway Transportation in
Information Age 2008 ICRE 2008 International Conference on
Mantell C L (1984) Batteries and energy systems Second Edition McGraw-
Hill Inc
MathWorks Inc (2004) Genetic Algorithm Direct Search Toolbox V102
MathWorksInc
MPowerSolutionsLtd (nd) Alternative Energy Storage Methods [online]
from httpwwwmpowerukcom
Okoshi T Yamada K Hirasawa T and Emori A (2006) Battery condition
monitoring (BCM) technologies about lead-acid batteries Journal of
Power Sources 158(2) 874-878
Perrin M Delaille A Huet F and Hernout L (2006) Study of the coup de
fouet of lead-acid cells as a function of their state-of-charge and state-of-
health Journal of Power Sources 158(2) 1019-28
Pham D T and Karaboga D (1998) Intelligent Optimisation Techniques
118
Genetic Algorithms Tabu Search Simulated Annealing and Neural
Networks New York Springer-Verlag New York Inc
RailPower Hybrid Technologies C (nd) Benifits of Hybrid Locomotives
[online] from httpwwwrailpowercomproducts_hl_benefitshtml
Rand D A J Moseley P T and Garche J (2004) Valve-Regulated Lead-Acid
Batteries Elsevier
Ruetschi P (2004) Aging mechanisms and service life of lead-acid batteries
Journal of Power Sources 127 (1-2) 33-44 Switzerland Elsevier
Salameh Z M Casacca M A and Lynch W A (1992) A mathematical model
for lead-acid batteries IEEE Trans on Energy conversion Vol7 No 1
Sato Y Takeuchi S and Kobayakawa K (2001) Cause of the memory effect
observed in alkaline secondary batteries using nickel electrode Journal
of Power Sources 93(1-2) 20-24
Sims R I Carnes J C Dzieciuch M A and Fenton J E (1990) Computer
modeling of Automotive lead acid batteries Ford Research Laboratories
Technical Report
Smil V (2007) Energy at the Crossroads Massachusetts Achorn Graphic
Services Inc
Ter-Gazarian A (1994) Energy storage for power systems London Peter
Peregrinus Ltd
TNI_Ltd (2007) Battery history [online] from
httpwwweuropulsecombattery_historybattery_historyhtm
Tuck C D S (1991) Modern Battery Technology Ellis Horwood Ltd
Wei J (2007) Development of Coal Mill and Aggregate Load Area Models in
119
Power Systems using Genetic Algorithms University of Liverpool PhD
Wikipedia (nd) Lead-Acid Battery [online] from
httpenwikipediaorgwikiLead-acid
Wikipedia (nd) Rechargeable Batteries [online] from
httpenwikipediaorgwikiRechargeable_battery
Wikipedia (nd) VRLA [online] from httpenwikipediaorgwikiVRLA
Zhang Y L Liu P H Zhang Q Y and Cheng W (2010) Separation of
cadmium(ii) from spent nickelcadmium battery by emulsion liquid
membrane Canadian Journal of Chemical Engineering 88(1) 95-100
120
Appendix I SIMULINK Diagrams of Battery Model
Figure A-1 SIMULINK Diagrams of ldquoMain Blockrdquo
121
Figure A-2 SIMULINK Diagrams of ldquoTerminal Voltage Calculationrdquo
122
Figure A-3 SIMULINK Diagrams of ldquoThermal Behaviourrdquo
123
Figure A-4 SIMULINK Diagrams of ldquoBattery Capacityrdquo
Figure A-5 SIMULINK Diagrams of ldquoBattery State of Chargerdquo
Figure A-6 SIMULINK Diagrams of ldquoBattery Depth of Chargerdquo
124
Figure A-7 SIMULINK Diagrams of ldquoBattery Electromotive Forcerdquo
(a)
(b)
Figure A-8 SIMULINK Diagrams of ldquoBattery Internal Resistancerdquo
125
Appendix II
List of Publications
S Hillmansen S Lu D H Meegahawatte S Guo C Roberts and C J
Goodman Analysis of Energy Storage Devices in Hybrid Railway Vehicles International Conference on Railway Engineering 2008 p68-73 Hong Kong China 25-28 March 2008
Y Yin X Luo S Guo Z Zhou J Wang A battery charging control strategy for
renewable energy generation systems The Proceedings of World Congress on Engineering 2008 Vol 1 pp356-361 London UK 2-4 July 2008
S Guo S Hillmansen Y Yin J Wang State of Health Monitoring of Lead-acid
Batteries Proceedings of the 14th International Conference on Automation amp Computing pp250-254 Brunel University West London UK 6 September 2008
Y Yin C Li Z Zhou Q Liu S Guo X Luo J Wang Design and Realization of a
PS2 Keyboard Interface in Embedded system Proceedings of the 14th International Conference on Automation amp Computing pp160-163 Brunel University West London UK 6 September 2008
Yin Y Wang J Luo X Guo S Development of a battery charging management
unit for renewable power generation a book chapter in Advances in
Electrical Engineering and Computational Science Edited by Sio-Long Ao and Len Gelman pp33-46 Springer 2009
Wang J Wei JL Guo S Condition monitoring of power plant milling process
using intelligent optimization and model based techniques accepted as a chapter in the book of Fault Detection in March 2009
S Guo S Hillmansen J Wang Model Based Analysis of Battery State of Health
using Genetic Algorithms accepted by the International Conference on Systems Engineering (ICSE) Coventry 8-10 September 2009
9
List of Figures
Figure 1-1 Power density vs energy density plot 7
Figure 2-1 Working Principle of Lead-Acid Batteries (a) shows the battery when
discharging and (b) is when charging with a DC charger 18
Figure 3-1 Simple Battery Model 38
Figure 3-2 I-V chart of the Simple Battery Model 39
Figure 3-3 I-V Chart in different SOC 40
Figure 3-4 Sketch to show battery discharge behaviours in typical tests 41
Figure 3-5 Thevenin Battery Model 42
Figure 3-6 Fourth-order Battery Model43
Figure 3-7 Improved Battery Model 44
Figure 3-8 Battery Capacity vs Discharge Current 47
Figure 3-9 Lead-acid Battery Equivalent Network 48
Figure 3-10 The Equivalent Network with the Approximated mZ 49
Figure 3-11 R-C block 53
Figure 4-1 Equivalent Circuit of the Experimental Test Rig 60
Figure 4-2 Experimental Test Rig61
Figure 4-3 Test of constant-impedance load discharge 62
Figure 4-4 Test of two-load discharge 62
Figure 4-5 Structure of model for SIMULINK Implementation69
Figure 4-6 Terminal Voltage of Battery 71
Figure 5-1 Flowchart of a Simple Genetic Algorithm78
Figure 5-2 2-dimensional Rastrigins function83
Figure 5-3 Contour plot of Rastrigins function84
10
Figure 5-4 GA performance (Rastrigrinrsquos function) 85
Figure 5-5 2-dimensional Rosenbrock function 86
Figure 5-6 GA performance (Rosenbrock function) 87
Figure 5-7 Progress of Parameter Identification 88
Figure 5-8 Measured and Simulated Result after Parameter Identification 91
Figure 5-9 Mean and the Best Fitness Values in Each Generation 92
Figure 5-10 Measured and Simulated Terminal Voltage 93
Figure 5-11 Measured and Simulated Terminal Voltage 94
Figure 6-1 Experimental and Simulated Terminal Voltage of Test 1 (SOH = 100)
102
Figure 6-2 Experimental and Simulated Terminal Voltage of Test 2 (SOH=9314)
103
Figure 6-3 Experimental and Simulated Terminal Voltage of Test 3 (SOH=7889)
104
Figure 6-4 Experimental and Simulated Terminal Voltage of Test 4 (SOH=7019)
104
Figure 6-5 Experimental and Simulated Terminal Voltage of Test 5 (SOH=6354)
105
Figure 6-6 Experimental and Simulated Terminal Voltage of Test 6 (SOH=5306)
106
Figure 6-7 Change of Internal Resistance in Different State of Health (Battery 1)
107
Figure 6-8 Change of Internal Resistance in all 6 Batteries 108
1
Chapter 1
Background and Objectives of
the Project
11 Overview
Fossil fuels have been the main energy resource in recent human history although
their continuing use has been shown to have a detrimental effect on the
environment The principal problem for fossil fuels is that they cannot be
reproduced within a short period of time so it is a finite energy supply source If
current consumption rate continues they will be exhausted in a few generations
from now Fossil fuel has never been considered as a clean-resource because there
is an emission of noxious gasses including CO CO2 NOx SOx and HC into the
atmosphere With all the pressure from the problems associated with the fossil
fuel exploration of the usage of renewable energy is becoming an increasingly
important issue
Wind energy hydro energy and solar energy are three of the most important
renewable energy sources and they have been implemented on a large scale wind
energy has produced a annual global total of 65019 times 1012 Wmiddoth
(74223 MWtimes24htimes365 days) (Anon 2006) energy in the year 2006 and hydro
2
energy is about 304 times 1015 Wmiddoth (30404 times 1012 Wmiddoth) (Anon 2007) Solar energy
resources are estimated at about 10694times1015 Wmiddoth (3850times1021 J) (Smil 2007) To
compare with the worldwide energy consumption of 13097times1015 Wmiddoth in the year
2007 it is clear that renewable energies have a significant role to play (Anon
2007)
However the problem of the implementation of the renewable energy is that the
electricity generated is intermittent and the power systems are experiencing the
problem of rapidly changing power demand Therefore the management of the
energy is an important issue Devices of energy storage should solve these
problems in theory
12 Review of Energy Storage Systems
Not only giving a large scale energy solution energy storage devices are also
commonly used in a range of applications related to everybody Different energy
storage technologies are suited to different applications and consideration must be
made in order to select the correct solution for each application This section will
give an overview of the existing energy storage systems
121 Applications of the Energy Storage Systems
Large scale energy storage systems which are also called grid energy storage
refer to the methods used to large-scale store electricity within an electrical power
grid Off-peak energy is stored during times when production (from power plants)
3
exceeds consumption and the stores are utilized at times when consumption
exceeds production In this way electricity production need not be drastically
scaled up and down to meet momentary consumption ndash instead production is
maintained at a more constant level
Despite the applications in grid scale the energy storage systems are also popular
in a number of areas For example they are usually used to optimize the energy
generated from the engine in modern electrical hybrid vehicles One such
application is in a shunter locomotive A shunter is a small railroad locomotive
intended for assembling trains ready for a road locomotive to take over
disassembling a train that has been brought in and switching a train to another rail
at the rail terminals The duty cycle of a shunter is characterised by short duration
high power demands (accelerating a rake of vehicles) and the long periods of
idling while the train waits for other operations Comparing to traditional shunter
locomotive that use diesel engines only for the whole duty cycle hybrid shunter
locomotives with energy storage devices can have a 40-70 reduction in fuel use
(RailPower Hybrid Technologies nd) This saving is made by operating the prime
mover at its optimum
Another application of energy storage in the vehicle technologies is the
regenerative braking system which is used to save the braking energy of vehicle
The potential of this technology to save energy for a vehicle is depends on the
duty cycle (Lu Meegahawatte et al 2008) which is characterized by storing the
energy generated when the vehicle is decelerating and releasing when accelerating
4
Energy storage devices are also very popular in stationary applications also
known as the Uninterruptible Power Supply (UPS) systems This system is
designed to meet the power demand when problems like power failure happen and
it is important especially in the applications where power failures could have
serious consequences for example in hospitals and computer centres (Berndt
2009)
The energy storage devices in the UPS system are often used to achieve
ldquouninterruptiblerdquo in a short period before the secondary power supply started
When a power problem occurs the energy storage device starts to supply
electricity immediately and at the same time the generator begins to start When
the generator is ready to supply sufficient power the energy storage device stops
providing power When the grid power is recovered the energy storage device can
be recharged until full
122 Review of the Existing Energy Storage Devices
There are various kinds of energy storage systems including pumped hydro
compressed air flywheel supercapacitors electrochemical and also
superconducting magnetic Each technology is suited to different applications and
careful consideration must be made in order to select the correct solution for each
application
Pumped hydro is the oldest and the most effective kind of large scale energy
storage method which have been used for nearly a century since 1929 (Juvonen
5
2003) Two large reservoirs at different altitudes with a pump a turbine a motor
and a generator are employed to collect the off-peak energy The water is released
from the higher one through a turbine to generate electricity during peak load
period
Compressed air is a pneumatic energy storage method that refers to the air kept
under a certain pressure This system can be used in grid energy storage that the
air can be stored by compressors during periods with low power demand This
compressed air can be released to a generator to meet the high power demand
during peak time (Glendenning 1981 Ter-Gazarian 1994 Juvonen 2003) In some
applications the compressed air is released through a combustor mixed with
natural gas to obtain a higher overall efficiency
A capacitor is an electrical device that can store energy in an electric field
between a pair of conductors and is often used in circuits for short term energy
storage It blocks the circuit to hold DC voltage Supercapacitors are energy
storage devices with the same principle but with a higher energy density The
power density of the supercapacitor systems can be very high but the energy is
often released in a very short duration (Ter-Gazarian 1994) As a result the
supercapacitors are usually used in applications of an energy burst
Superconducting magnetic energy storage system stores energy in the magnetic
field generated by direct current in a coil Instead of traditional wires like copper
superconductors are employed to avoid the energy consumptions as heat because
of the resistance A problem is that the optimal operating temperature for
6
superconductors is 50-77K a refrigerator is therefore necessary in the system for
cooling down
Flywheels are considered as a method of storing mechanical kinetic energy by
accelerating a flywheel to a very high speed to store the energy and decelerating
to release the energy Flywheels are very efficient for short duration storage cycles
due to their fast response speed These energy storage devices are used mainly in
applications that demand kinetic energy storage and high numbers of deep
discharge cycles
Electrochemical energy storage stands for the device capable of converting
chemical and electrical energy to each other by chemical reactions Batteries are
the most common technology of electrochemical energy storage methods The
oxidation and reduction reactions in the two electrodes of battery lead to the
current through the external circuit when discharging to provide energy The
secondary battery can be recharged by applying electrical current which reverses
the chemical reactions that occur during the discharge
Fuel cell is another technology with very high energy density that converts the
chemical energy in a source fuel into an electrical current The fuel cells are
considered as the ldquoenvironmental friendlyrdquo as the only by-product is water The
working principle of fuel cells when discharging is the same as the batteries but
unlike the batteries the fuel cells do not need recharge as they only provide
electrical energy while the active chemicals are supplied to the electrodes (Mantell
1984 MPowerSolutionsLtd nd)
7
Figure 1-shows the Ragone chart of the energy and power density of some energy
storage systems
Figure 1-1 Power density vs energy density plot (MPowerSolutionsLtd nd)
123 Review of Batteries
The preceding discussion has identified that energy storage devices are becoming
increasingly important in both stationary and mobile applications Battery as the
most popular energy storage device is studied in this section
There are two different types of batteries applied in a large range of areas now
Primary batteries and Rechargeable batteries Primary batteries which are also
called disposable batteries often have higher energy densities than the
rechargeable ones and they have a lower self-discharge (Ter-Gazarian 1994)
8
However as the chemical reactions in these batteries are not reversible and the
active materials cannot be restored to their initial forms these batteries cannot be
reliably recharged The primary batteries are intended to be used once and then
discarded therefore they are not suitable for the energy storage systems
Rechargeable battery is the other type of the electrochemical batteries which is
also known as secondary battery because their electrochemical reactions are
electrically reversible There are many different rechargeable battery technologies
in which only four of them are leading the world market nickel-cadmium nickel-
hydride lead-acid and lithium-ion (Berndt 1993 Berndt 2009)
The Nickel-cadmium (NiCd) battery is a kind of rechargeable battery that uses
nickel oxide hydroxide and metallic cadmium as electrodes and an alkaline
electrolyte (often potassium hydroxide) (Mantell 1984) As designed to compete
the primary batteries the NiCd batteries are often manufactured in the same size
and they are used in the consumer market as primary batteries for example in
clocks toys radios and cordless tools However when the NiCds are substituted
for primary cells the lower terminal voltage and smaller ampere-hour capacity
may reduce performance as compared to primary cells The most attractive feature
of the nickel-cadmium batteries is that they are more difficult to damage
comparing with other batteries during deep discharge cycles They can also
sustain more cycles and the lower internal resistance can also help achieve a
higher maximum discharge rate A problem preventing the large scale application
of this battery technology is that the nickel-cadmium batteries suffers faster self
discharge rate than other rechargeable batteries and the cadmium used as the
9
active material in one of the electrodes is toxic and expensive (Zhang Liu et al
2010) Furthermore the capacity loss caused by the continuously discharge and
recharge to the same state of charge called ldquomemory effectrdquo is also a very
important issue of the nickel-cadmium batteries (Sato Takeuchi et al 2001)
The nickel-metal hydride (NiMH) battery is a type of secondary electrochemical
battery that designed to substitute for the nickel-cadmium cells They have a
similar size and a similar cell voltage but with more advantages By using
hydrogen-absorbing alloy as negative electrode instead of cadmium this
electrochemical technology is considered as ldquoenvironmental friendlyrdquo because of
the absence of toxic cadmium (Berndt 1993) The nickel-metal hydride batteries
also have low internal resistance and the high cycle durability as the NiCds and a
NiMH battery can have two to three times the capacity of an equivalent size
nickel-cadmium battery However the nickel-metal hydride batteries also have a
similar high self-discharge rate as the nickel-cadmium batteries (Lee Lee et al
1996) and it also cannot afford complete discharges Memory effect from
repeated partial discharge can occur in a NiMH battery but this is reversible
through charge cycling (Berndt 2009)
The lead-acid batteries are the oldest type of rechargeable battery with a history of
over 150 years but they are still the most popular battery chemistry for
applications such as engine starting or backup power systems as there is no
cheaper alternative when weight is not a factor This technology uses lead and
lead dioxide as electrodes and an acid electrolyte of sulphuric acid and the
advantage of this configuration is that the electrolyte takes part in reactions of
10
both electrodes and both electrodes turn into lead sulphate when discharging
(Berndt 1993 Berndt 2009) The lead-acid batteries can be designed for not only
deep discharge cycles but high discharge rate or compromise of the two cycles
They have a lower self-discharge rate compared with the nickel batteries and they
also do not suffer from the memory effect (Mantell 1984 Berndt 2009) However
as the energy density of lead-acid battery is not high it is seldom applied in the
portable electronics Another important problem is that the lead-acid batteries
must be recycled as the active material ldquoleadrdquo is toxic to both the environment and
the human bodies (Bernardes Espinosa et al 2004)
The lithium-ion (Li-ion) batteries are almost the perfect cell chemistry and are
currently used a wide range of consumer electronics products including cameras
cell phones laptops etc They have many attractive performance advantages
which make them also ideal for higher power applications such as automotive and
standby power First of all the lithium-ion batteries have the highest energy
density in all the rechargeable battery now which is about 4 times better than
lead-acid (Jacobi 2009) They are also capable for deep discharge and high
discharge rate with a relatively slow self discharge There is no liquid electrolyte
in the lithium-ion batteries which means they are immune from leaking However
just opposite to the lead-acid batteries the most serious problem that discourages
the lithium-ion batteries is the low economic efficiency comparing with the lead-
acid batteries Other factors like the stability of the chemicals and the recycling of
lithium should also be concerned because of the chemical activeness of lithium
Table 1-1 is gives some basic properties of the four major rechargeable batteries
11
introduced above There are also some less common battery chemistries used by
rechargeable batteries in addition to these technologies including nickel-zinc
(NiZn) nickel-iron (NiFe) etc but they have a small market share For the four
major battery chemistries lead-acid batteries with their low price and high
flexibility is adopted in a wide range of application areas
Table 1-1 properties of the rechargeable batteries (Wikipedia nd)
Type Voltage
(V)
Energy Density (Whkg)
Power Density (Wkg)
Self Discharge
rate
Cycle Durability
Nickel-Cadmium
12 40-60 150 20 1500
Nickel-Metal-Hydride
12 30-80 250-1000
20 1000
Lead-Acid 21 30-40 180 3-4 500-800
Lithium-ion 36 160 1800 5-10 1000-1200
124 The Management of Batteries
In the areas that batteries are employed as the energy storage device it is a critical
issue to consider that whether there is enough energy in the battery to meet the
demand However batteries do have the problem in limited cycle durability that
is when a battery is charged and discharged for a number of cycles its total
capacity decreases If the battery cannot offer sufficient powerenergy it should be
replaced at the right time But the problem is that it is difficult to quantify the
capacity loss and when the capacity of battery is no longer sufficient for a
particular application Due to the limitation of batteries it is essential to develop a
method to determine the capacity of battery that subjected to various duty cycles
in a number of applications
12
13 Project Objectives
The main objective of the project is to develop a method which can determine the
key parameters of batteries from the discharge tests The proposed methodology is
a model based approach that is to develop a mathematical model of the battery
which can represent the dynamic performance and battery status and
characteristics can be investigated through the analysis of the model
The first step of the project is to build a mathematical model of battery The
dynamic model is expected to reflect the relevant behaviours of battery when
being discharged including the characteristics of State of Charge Depth of Charge
Electromotive force Terminal Voltage The unknown parameters in the model are
identified by using Genetic Algorithms (GAs) with the laboratory experimental
data Afterwards some batteries are tested in experiments and the parameters in
different state of health are recorded to analyze the battery in different status of
battery
The focus of this work is to develop a suitable method for parameter identification
for common battery systems The lead-acid battery has been chosen because it has
relatively well defined properties and there is a wealth of literature describing the
performance of these types of batteries From an experimental view point they are
also readily available of low cost
13
14 Outline of the thesis
The thesis is organized into seven chapters and the first chapter presents the
background and motivation of the research project The remaining chapters are
briefly described as follows
Chapter 2 gives an overview of lead-acid batteries including the development
working principle and also some modern battery designs and technologies In the
second part of chapter 2 important concepts for a battery including electromotive
force capacity state of charge internal resistance and state of health are
introduced and some mathematical descriptions of these concepts are discussed
Chapter 3 starts from some requirements of the mathematical model designed for
this project and several different methods of battery model approaches are
discussed Afterwards some details of the dynamic mathematical model are
analyzed The initial battery model is described in the last part of this chapter that
summarized the equations of the battery
Chapter 4 is mainly focused on some improvement of the mathematical model
described in chapter 3 In the first section of chapter 4 the experimental test rig in
the project is introduced Some findings in the experimental tests is then listed and
studied and integrated into the improved model Finally the SIMULINK
implementation and a simulation study are given
Chapter 5 presents a method of model parameter identification The principle of
14
Genetic Algorithms is studied at first Then this algorithm is employed in the
model and the parameters of the model are identified with the help of
experimental tests This chapter also includes the validation of battery model
using two other groups of test results
Chapter 6 develops an algorithm that can reflect the state of health of a lead-acid
battery In this chapter the internal resistance parameters are measured under
different state of health through a group of continuous experimental tests The
change of internal resistance under a specific working condition is then related to
the battery state of health
Finally Chapter 7 gives a summary and the conclusions of the project Also the
future works that can be improved are proposed in this chapter
15
Chapter 2
Introduction of Lead-acid
Batteries
This chapter gives an overview of lead-acid batteries including background
knowledge working principles explanation of terminologies technologies and
applications encountered for this technology The chapter presents the
fundamental knowledge and prepares for the project work to be reported in the
following chapters
21 A General Overview of the
Lead-acid Battery
The lead-acid battery is the oldest type of rechargeable battery The first example
of a lead-acid battery can be attributed to the German physicist Sinsteden who
published the performance data of this battery system in 1854 (Berndt 1993)
Later in 1859 the French physicist Planteacute realized that a plate construction was
required to achieve a much larger effective surface area and he produced the first
rechargeable battery which was marketed for commercial use by alternately
charging and discharging lead sheets immersed in sulphuric acid This method
has remained unchanged and still in use today in stationary applications (Berndt
16
1993 Wikipedia nd) One of the first applications of lead-acid batteries was for
storing electrical energy for telegraphy systems The capacity required for these
applications was low and the battery at that time was not yet suited to high power
industrial applications (TNI_Ltd 2007)
In 1880 a French chemical engineer Faureacute significantly improved the design of
the lead-acid battery by producing the active materials separately His method was
to coat the lead plate with a paste of lead oxides sulphuric acid and water in a
warm humid atmosphere The paste then changed into a mixture of lead sulphates
which adhered to the lead plate as an electrochemically active material As a result
of this technology the Faureacute cells are able to achieve much higher capacity with
the first charge in comparison with the Planteacute ones (Berndt 1993 TNI_Ltd 2007)
The problem of these plates is that they are not very durable and become weak
only after a few dischargecharge cycles The lead grid alloyed with antimony or
calcium was developed to improve the mechanical characteristics The holes on
the grid are able to achieve improved bonding thus the batteries may have a longer
lifetime This advantage led to the industrial manufacturing of lead-acid batteries
In 1881 a lead electrode with a ribbed surface was designed in order to have a
large effective surface of the active material and this was the pioneer of the large
surface plates which are still common today (Berndt 1993 TNI_Ltd 2007
Wikipedia nd)
In the beginning lead-acid batteries were operated in open jars The advantage of
this feature was that the electrode can be cleaned and exchanged easily but faced
the problem of water evaporation Therefore the early batteries have to refill water
17
in order to continue normal use However this problem can be dramatically
reduced when the cells were fitted with covers to limit the evaporation (Berndt
1993) This kind of battery design is known as a lsquoflooded lead-acid batteryrsquo
In the 1950s a new type of battery which was aimed to become spill-proof was
designed and manufactured on a large scale This type of battery is characterized
by an immobilized electrolyte however this kind of spill-proof battery was only
manufactured in small sizes up to about 10 Ah (Berndt 2001) Later the
combination of a valve improved the characteristic features of the lead-acid
battery and this kind of battery is still common today and is known as the Gel
Lead-acid battery (Berndt 1993) In the 1970s micron diameter glass fibres
originally designed for air filters were used in glass mats which absorbed the
electrolyte and acted as separator Soon this kind of Absorbent Glass Mat (AGM)
battery appeared in market for stationary application
Currently Valve Regulated Lead Acid (VRLA) batteries based on both AGM and
Gel electrolytes are available in a large range of capacities for both stationary and
mobile power applications with a range of different designs for each type of
application Arguably the most important application of lead-acid batteries is for
vehicle engine starting The battery employed in this application which is called
Starting Lighting and Ignition (SLI) batteries are designed to deliver bursts of
energy usually in a discharge current as large as several hundred amperes in a
very short time A different type of battery construction can produce batteries
capable of deep cycling which are more suited to slow discharge cycles (Tuck
1991 Anon 2007)
18
22 Configuration of Lead-acid Batteries
This section gives a brief description of the working principles of lead-acid
batteries and how the battery can be configured to suit different applications
221 Electrochemical Principles
The lead-acid battery comprises two electrodes and the electrolyte The structure
of the lead-acid battery is shown in Figure 2-1 in which one electrode is Cathode
and the other is Anode The active matter in the positive plate is made of lead
dioxide (PbO2) and that in the negative plate is made of lead (Pb) and the
electrolyte is sulphuric acid One electrode can serve either as a Cathode or as an
Anode depending on which process the battery is experiencing - charging or
discharging With this structure a battery could convert electrical energy into
chemical energy and back again which is associated with the process of charging
and discharging
(a) (b)
Figure 2-1 Working Principle of Lead-Acid Batteries (a) shows the battery when
19
discharging and (b) is when charging with a DC charger
For the discharging process as shown in Figure 2-1 (a) the negative plate acts as
the anode and the positive plate is the cathode If a wire is connected between the
two the excess electrons from the anode will travel through the wire as a current
to the cathode where they are needed to complete the electron deficient reaction
there The chemical reactions in a lead-acid battery when discharging are
described as follow
Negative plate reaction (Anode)
+minusminus+rarrminus+ HPbSO2eHSOPb 44
Positive Plate reaction (Cathode)
O2HPbSO2e3HHSOPbO 2442 +rarr+++minus+minus
For the charging process an external power source is connected to the two
electrodes with the voltage as shown in Figure 2-1(b) In this way the flow of
electrons is forced backwards against the electropotential and the reactions are
driven backwards changing the lead sulphate back into lead and lead dioxide on
the negative and the positive plates and restoring the sulphuric acid to the liquid
electrolyte The anode when a battery is charging is the positive plate and the
cathode is the negative plate and the chemical reactions in a lead-acid battery
when charging are described as
Positive plate reaction (Anode)
+minusminus++rarrminus+ 3HHSOPbO2eO2HPbSO 4224
Negative plate reaction (Cathode)
minusminus++rarr++ 44 HSOPb2eHPbSO
20
The thermodynamic heat effects caused by the reactions are small in the lead-acid
battery because the difference between the enthalpy and the free enthalpy is very
small The rate of reversible heat effect in the reaction is 132 kJ per mol of the
cell reaction which corresponds to about 35 of the total energy converted when
the lead-acid battery is discharging or charged This amount of energy is relatively
small and is generated over a comparatively long period of time so it is usually
easily dissipated through radiation and convection (Berndt 1993)
222 Lead-Acid Battery Types and Technologies
The flooded battery is the simplest type of lead-acid battery in use Flooded
batteries are common for some traction applications despite the requirement in
high maintenance They are also very common for large capacity backup power
supplies for telecommunication computer centres grid energy storage and off-
grid household electric power systems Since the flooded batteries are not sealed
they must be kept upright to avoid acid spills and water must be periodically
added to top up the liquid electrolyte The most attractive feature of the flooded
battery is that they are able to withstand certain level of overcharging without
damage providing proper maintenance is carried out
The Valve Regulated Lead-Acid (VRLA) battery which is often colloquially
called the sealed lead-acid battery is becoming more and more popular in many
applications Because VRLA batteries are mostly sealed the electrolyte
evaporation will be reduced and spillage can be largely avoided when
overcharging which are very common in flooded batteries The electrolyte of the
21
VRLA battery is designed to be immobilized so the VRLA batteries will not leak
if inverted pierced or if the container is broken They can be mounted in any
orientation and position even immersed in water The immobilization of the
VRLA electrolyte can be achieved by using an absorbent mat separator as well as
gelling materials
In Absorbent Glass Mat (AGM) battery the electrolyte is absorbed into a mat of
fine glass fibres in order to immobilize the electrolyte In addition the pores in the
mats are fine enough to prevent the lead dendrites in the cathode from growing
through as a separator and only glass is wetted enough by sulphuric acid can soak
the separators The glass mats can therefore be used to insulate the electrodes
Gelling is another way to immobilize the electrolyte and this gelling technology at
present is only applied for lead-acid batteries The idea is to mix the sulphuric acid
with silica fume (SO2) which makes the electrolyte gel-like The mixture is stable
over a long term environmental safe and easy to work technically (Berndt 1993)
The sulphuric acid bound by the gel can also insulate electrodes as a separator
similarly with that in an AGM battery
VRLA batteries including both gel and AGM batteries are able to recombine and
reduce the emission of gases during overcharge so the requirement for the room
ventilation is reduced and there is no acid fume emission during normal discharge
(Berndt 1993 Anon 2007 Wikipedia nd) Although the generation of hydrogen
can be slowed down it cannot be avoided completely As a result a valve
regulation safety system is employed in VRLA batteries which vents the gases in
22
the battery only during over pressure faults (Tuck 1991 Berndt 1993)
However the VRLA batteries do have some drawbacks First of all the VRLA
batteries tend to have a lower specific energy density than flooded batteries and
they are also more expensive An accurate charging control is very important for a
VRLA battery especially when charging under high temperature environments
since it is not possible to cure the damage caused by overcharge
223 Battery Designs for Different Applications
Lead-acid batteries are deployed in a range of applications Different designs are
therefore required due to the different working environments and duty cycles SLI
batteries are designed for a burst of energy for cold-cranking an engine A SLI
battery is supposed to provide power only in the first few seconds when starting
an engine and will be recharged immediately once the engine is started In this
kind of lead-acid batteries a larger surface area of the electrode plates is used to
provide high electric current in a short period However repeated deep discharge
may shorten the battery lifetime
On the other hand deep cycle batteries are designed for applications where the
batteries are regularly discharged The plates of the deep cycle batteries are often
very thick in order to withstand the frequent and deep discharge cycles The plate
surface area of a deep cycle battery is not as large as a SLI battery and as a result
it is not possible to offer great power
23
Marine batteries are a compromise between a SLI battery and a deep cycle battery
Standby batteries can be classified as marine batteries which are used for backup
power supplies and providing the power in emergency situations They are
designed for a long lifetime and a large capacity but repeated discharges and high
current drain are not the intended application Traction batteries are designed for
higher current drain and repeated deep discharge cycles They are usually bigger
and heavier than other types of lead acid for the same voltage and capacity but
that is the cost of durability
23 Mathematical Descriptions of Lead-acid
Batteries
In order to investigate the relationship between the battery behaviour and
remaining lifetime for a lead-acid battery initial studies have been carried out and
are described in this chapter Concepts including Capacity State of Charge (SOC)
Depth of Charge (DOC) State of Health (SOH) and internal resistance are
introduced and quantitative descriptions of these concepts are listed
231 Capacity
The capacity of a lead-acid battery represents how much charged energy the
battery can offer which is usually described in Ampere-hours (Ah) The charge
capacity of a battery is decided by the construction factors of a battery cell This
includes the materials contained in the electrodes and the acid solution In
addition the capacity of a battery is not a fixed quantity but varies according to
24
how quickly it is discharged This is known as Peukertrsquos law (Ceraolo 2000
Dhameja 2001 Rand Moseley et al 2004)
tICk
p = (21)
where pC is the capacity on one-ampere discharge rate which is a constant
I is the discharge current (A)
t is the time of discharge (h)
k is the Peukert constant and for a lead-acid battery with the value
between 11 and 13 (varies for each individual battery)
It is common to refer to ldquoCnrdquo as the capacity of battery in Amp-Hours which
corresponds to complete discharge of the battery in n hours ldquonrdquo is a subscript that
represents the discharge rate In industry the capacity under ten-hour discharge
rate (C10) is always taken as the nominal capacity
232 Electromotive force
The electromotive force of a battery cell is the difference between the electric
potential of the two electrodes of each cell (Rand Moseley et al 2004) The
potential of each electrode which is called half cell potential is decided by the
chemical reaction and the relative activities of the solution and can be obtained
from Nernstrsquos equation (Crompton 2000)
25
Ox
Redln0
α
α
zF
RTEE minus= (22)
where E is the half-cell potential (V)
0E is the standard half-cell potential (V)
α is the relative activity of the oxidizer (α Ox) and reducer (α Red)
z is the number of electrons transferred in the cell reaction
R is the universal gas constant which is 8314472 JKminus1molminus1
T is the absolute temperature
F is the Faraday constant the number of coulombs per mole of electrons
and F = 964853399times104 Cmolminus1
At room temperature RTF is a constant of 25693mV for cells therefore
Ox
Redlog
z
V05910
Ox
Redln
z
mV69325
Ox
Redln 10
α
α
α
α
α
α==
nF
RT
The Nernstrsquos Equation therefore can be expressed by
Ox
Redlog
V0591010
0
α
α
zEE minus= (23)
The electromotive force could be calculated by the difference of the electric
potential
cathodeanode EEEMF minus= (24)
When a lead-battery is discharging the electromotive force can be written as
26
O)(H
)(SO)(Hlog
V05910
2
2
24
10
00
α
ααminus+
+minus=z
EEEMF cathodeanode (25)
The standard half-cell potential of the anode 0
anodeE is equal to 1685 (PbO2-
PbSO4SO42-) and that of cathode
0
cathodeE is -0356 (Pb-PbSO4SO42-) which are
constants for the same battery chemistry And the number of electrons transferred
( n ) is 2 for a lead-acid battery
Therefore the electromotive force of a lead-acid cell can be obtained by
O)(H
)(SO)(HlogV029600412
O)(H
)(SO)(HlogV02960)3560(6851
2
2
24
10
2
2
24
10
α
αα
α
αα
minus+
minus+
+=
+minusminus=EMF
(26)
This electromotive force of a battery cell is numerically equal to the open circuit
voltage which means that the terminal voltage of a single cell battery when it is
disconnected from the external load For a lead-acid cell the electrochemical
force at fully charged is between 210-213V per cell
233 State of Charge and Depth of Charge
State of charge (SOC) and depth of charge (DOC) are variables that can describe
the battery charge The main difference is that the SOC describes the percentage
of remaining charge relative to the nominal capacity while the DOC represents
that relative to the actual capacity under a specific discharge current These two
27
variables can be obtained by calculating the charge consumed and the battery
capacity
101 CQSOC eminus= (27)
Ie CQDOC 1minus= (28)
where Qe is the charge consumed by the load (Ah)
C is the nominal capacity (Ah)
CI is the actual capacity under the discharge current I (Ah)
234 Internal Resistance and State of Health
The internal resistance of a lead acid cell is the physical resistance of the cell The
value of the internal resistance is decided by many different factors But it could
be obtained by a simple equation
I
VVr tOC minus
= (29)
where Voc is the open circuit voltage (V)
Vt is the terminal voltage when discharging (V)
I is the discharge current (A)
However the factors in this equation are only a method of calculating the internal
resistance but not the determinants It is shown in applications that the internal
resistance of a lead-acid battery will increase when discharging as the SOC and
28
the DOC drops
It is common for batteries to suffer a capacity loss when discharged and charged
in a number of duty cycles even when idle Aged batteries are often weak and
sometimes not able to offer enough charges Therefore they should be replaced or
maintained State of health is a defined variable that is important for a weak
battery This variable is to show how weak the battery is and represents the
percentage of remaining capacity to the initial capacity when the battery is brand
new (Okoshi Yamada et al 2006) as shown in the equation
new
weak
C
CSOH = (210)
where Cweak is the remaining capacity of a weak battery (Ah)
Cnew is the capacity when the battery is brand new (Ah)
The reason for the capacity loss is complex but is usually due to the sulphation
Sulphation is a process when the amorphous lead sulphate which is easily
converted back to lead lead oxide and sulphuric acid converts to a stable
crystalline form coating the electrodes This form of lead sulphate cannot conduct
electricity and cannot be converted back to lead lead dioxide and lead sulphate
under normal charging conditions The internal resistance of a lead-acid battery
therefore increases and less charge can be provided when discharging Complete
or repeated deep discharges of a battery at low current densities that lead
excessive utilization of the active material are the most critical reason for
29
capacity loss for example a discharge of a traction battery that draws more than
80 of its nominal capacity (Berndt 1993)
235 Multi-Cell Lead-Acid Batteries
In most applications of batteries the voltage of an individual cell is not enough to
provide the sufficient voltage and power supply The solution is usually to series
connect a number of cells in a battery in order to achieve a higher battery voltage
The electromotive force of a series of lead-acid battery cells is directly related to
the cell numbers as well as the charge state of each cell For a six-cell lead-acid
battery which is a standard for most common usages the fully charged
electromotive force is about 128V The internal resistance of a multi cell battery
however is also equal to the sum of the internal resistances of each cell
Usually all the cells in a multi-cell battery should be constructed in the same
manner and in particular the capacity should be consistent because the capacity of
a multi-cell battery will be limited to the cell with the lowest capacity If one of
the cells fails it is not possible for the current to flow through the cell and the
battery is therefore disconnected from its internal cell loss Also if the SOC of one
particular cell drops faster than others in a battery the electromotive force of that
cell may affect the whole behaviour of the battery
24 Summary
The technology development of lead-acid batteries has been continuous over the
30
last 150 years From the earliest open cell batteries different advanced battery
configurations are now available which have been adopted in a wide range of
applications Meanwhile a number of solutions have been developed to address
the battery problems encountered in applications such as electrolyte evaporation
spillage and the electrolysis of electrolyte when charging However there are still
issues affecting the efficient and safe use of lead-acid batteries for example
determination of the SOH which if addressed in a robust manner would lead to
significant improved battery management system performance This chapter has
presented the essential fundamental knowledge technology terms and working
principles of lead-acid batteries which is served as a preparation for further study
reported in the following chapters of the thesis
In order to reveal the dynamic behaviour of a battery under different SOH and
identify the suitable strategy for SOH determination the mathematical modelling
study is carried out and an equivalent circuit model is derived in the next chapter
The key concepts of the battery model are explained and the fundamental analysis
is given for the concepts introduced
31
Chapter 3
Equivalent Circuit Modelling
of Lead-acid Batteries
In order to estimate the status of a battery a model based approach is adopted in
the project A mathematical model for lead-acid batteries should be developed
with a suitable level of abstraction This chapter describes the requirements to the
model to serve the project objectives and reviews the available model
technologies An improved mathematical model for lead-acid batteries is
introduced in the late part of this chapter
31 Requirements for the Battery Model
The main objective of the project is to develop an algorithm that can determine
the battery health by monitoring the battery status during discharge cycles This
algorithm is designed for implementation in a battery health monitoring system
with life-time prediction capabilities This prediction system is intended to work
on applications where the battery performance is of great importance for instance
hospital UPS systems and vehicle ignition systems To achieve the objective the
requirements to the mathematical model can be defined as
Requirement 1 The model should be able to calculate the evolution of key
battery parameters including terminal voltage cell temperature the state of health
32
and the internal resistance which describe the condition of the battery for
dynamical discharging It should also be able to adequately represent dynamic
processes while the battery is discharging
Requirement 2 The complexity of the model must be sufficient to satisfy the
requirement 1 but must also be executable in real-time for a model-based
condition monitoring system
Requirement 3 The output of the battery model should be understandable to the
battery operators and technicians as well as meaningful to those who do not have
any background in battery technologies
32 Overview of Battery Model Techniques
A number of different types of battery models have been used to serve as a tool in
solving a range of problems (GONG 2005) These include Electrochemical
Models Computational Fluid Dynamics Models Finite Element Models and
Equivalent Circuit Models This section gives an overview to the above named
four different types of battery models and the problems which are addressed by
each of them In Section 324 every battery model technology is assessed against
the overall requirements
321 Electrochemical Model
Electrochemistry is a branch of chemistry that studies chemical reactions which
33
take place in a solution at the interface of an electron conductor (a metal or a
semiconductor) and an ionic conductor (the electrolyte) The reactions involve
electrons transfering between the electrode and the electrolyte or species in
solution The application of electrochemistry research directly leads to the
development of the lead-acid batteries
Behaviour of a battery depends not only on how the battery is used but also on a
number of construction factors (Ruetschi 2004) These factors include but are not
limited to the thickness of the plates the active mass density of the active
material the concentration of the acid solution and the geometry of the electrodes
(Berndt 2001 Ruetschi 2004)
The electrochemical model is mainly focused on the oxidationreduction reactions
between the electrolytes and the electrodes By analyzing the consistency of each
matter in the solution and the electrochemical reaction caused by the connection
of electrodes to external circuit it is possible to represent the dynamic behaviour
of the battery (Crompton 2000)
322 Physical Models
The finite element method is a numerical analysis technique for finding
approximate solutions of partial differential equations as well as of integral
equations The basic principle of the Finite Element Model (FEM) is to divide the
problem into elements and each element is a smaller problem to be solved so that
they could be analyzed separately The lsquoelementsrsquo are then be assembled together
34
to restore the initial problem
Finite element is a very popular method of analysis in those areas with a complex
geometry and it is good at stress and thermal analysis For batteries the Finite
Element Models can help with a good understanding of the heat loss and that for
vibration problem in mobile applications There are also attempts to analyze the
current density on the positive grid bar in a lead-acid battery using FEM (Ball
Evans et al 2002)
Computational Fluid Dynamics (CFD) technology is a well-established tool for
physical analysis and optimization of fluid flow mass and heat transfer and
related phenomena (eg chemical reactions) that may simultaneously take place in
a complex system (Liaw Gu et al 1997) Computers are used to perform millions
of calculations required to simulate the interactions of fluids and gases with the
complex surfaces used in engineering
In a CFD Model of a battery the dynamic governing equations are solved with
respect to time space and all the physical time and space dependent properties
Acid concentration and potential distribution across the cell for instance can be
obtained Therefore such a modelling is able to give a very good understanding to
battery parameters and detailed characteristic of battery dynamics
323 Equivalent Circuit Model
An equivalent circuit refers to the simplest form of a circuit that retains all of the
35
electrical characteristics of the original (and more complex) circuit In its most
common form an equivalent circuit is made up of linear passive elements
However more complex equivalent circuits are used to approximate nonlinear
behaviours of the original circuit as well
In electrical engineering it is often useful to use an equivalent circuit model to
describe the non-ideal operation of a device For electrical engineers electrical
models are intuitive useful and easy to handle especially when they can be used
in circuit simulators and alongside application circuits
324 Discussion of Different Battery Model Methods
The electrochemical model focuses on the electrochemical reactions and the
activities in the battery which is very popular in the applications for the
constructional and design purpose However many electrochemical factors
contained in the electrochemical model are irrelevant to the external circuit and
some of the important parameters like the internal resistance are hard to describe
in an electrochemical model Therefore this model technology is not able to meet
the project Requirement 1 As the calculations in the electrochemical model are
not complicated Requirement 2 can be therefore satisfied by an electrochemical
model of battery Requirement 3 might be difficult to obtain for an
electrochemical model because the understanding of the outputs for an
electrochemical model usually need some background knowledge of the battery
chemistry As a result the electrochemical model is not chosen for the project
36
Physical models can give good understanding to the battery important parameters
so that Requirement 1 of the project can be satisfied The Requirement 3 can be
also met as the terminal voltage can be calculated as the output with the
knowledge of these parameters One significant disadvantage is that the physical
models involves huge amount of calculation in analysis which is quite time
consuming In finite element or CFD methods a large nonlinear system of
equations is solved iteratively and that could take excessive CPU time especially
for when the system is more than 2 dimensions As a result the physical
modelling methods cannot meet the Requirement 2 of fast response required by
the project (Esfahanian Torabi et al 2008)
In an equivalent circuit model most of the characteristic required by the project
can be reached in a reasonable level It is able to reflect the dynamic behaviour of
battery using simple circuit blocks such as voltage sources resistors and
capacitors (Chen and Rincacuteon-Mora 2006) That is to say the Requirement 1 of
the project can be satisfied by the equivalent circuit model And the model
simplicity causes its low computational time as Requirement 2 and therefore it
can be suited to the online implementation (Esfahanian Torabi et al 2008)
Additionally basic battery parameters like internal resistance terminal voltage
and SOC etc can be chosen as the main output of the model to meet the
Requirement 3
Table 3-1 summarized a comparison of all the three model methods on the
satisfaction of the requirements for the project
37
Table 3-1 Satisfaction of the Requirements in different Model Methods
Requirement 1 Requirement 2 Requirement 3
Electrochemical Model times radic times
Physical Model radic times radic
Equivalent Circuit Model radic radic radic
33 Introduction of the Existing Equivalent
Circuit Models
Section 32 introduced three different types of battery models to serve for different
research purposes each with different features and strengths It has been shown
that the equivalent circuit model that pays attention to the relationship between the
internal circuit and the external characteristics can adequately meet all the
requirements of the project Therefore further studies of battery models have been
carried out and six equivalent circuit battery models with different merits and
complexity are presented while the technique improvements are briefly described
in this section
331 Simple Battery Model
The Simple Battery Model is the simplest battery model As shown in Figure 3-1
this model consists of only ideal battery mE as the electromotive force of a battery
and a resistor r in series connection as the internal resistance bV in the figure is
the terminal voltage of the battery
38
Figure 3-1 Simple Battery Model
The Em in Figure 3-1 stands for the electromotive force of the battery while r
represents the internal resistance and Vb is the Terminal Voltage This model is
only applicable in some circuits where the state of charge is of little importance
because it does not consider the varying characteristic of the internal resistance in
different states of charge The model is often used in circuits where the battery
does not have major influences to the circuit analysis But without being able to
describe the battery behaviours in details this model is not suitable for the
research purpose In the Simple Battery Model the electromotive force mE can be
obtained by open circuit measurement and r can be calculated by measurement
with connecting a load to the battery after taking an open circuit measurement
For a battery with a terminal voltage of 13V and the internal resistance of 05Ω
the change of terminal voltage in a Simple Battery Model as the discharge current
increases can be given as Figure 3-2
39
Terminal
Voltage
Discharge
Current
0
10V
13V
Figure 3-2 I-V chart of the Simple Battery Model
332 Advanced Simple Battery Model
This model is developed based on the Simple Battery Model and has the same
block diagram as the Simple Battery Model The only difference is that this model
employs a variable resistor which depends on the state of charge (CUN
FIORINA et al Durr Cruden et al 2006) The relationship between the value of
the variable resistance and the state of charge is as follow
aSOC
Rr 0
= (31)
where 0R is the resistance of the battery when it is fully charged
a is the capacity coefficient
SOC is the state of charge of battery from 0 (completely discharged) to 1
(fully charged)
6A
40
The most important improvement of this model is that instead of a constant
internal resistor the value of the internal resistance is expressed as equation
function of SOC For the same battery described in section 331 the I-V chart in
different SOCs can be concluded as shown in Figure 3-3
Terminal
Voltage
Discharge
Current
0
10V
13V
SOC=1
SOC=60
Figure 3-3 I-V Chart in different SOC
333 Thevenin Battery Model
The previous models do not account for any transient behaviour of batteries
Figure 3-4 shows the gradual change in battery characteristics when external loads
are connected or disconnected to the battery
6A
41
011
14
125
Terminal
Voltage
t
Figure 3-4 Sketch to show battery discharge behaviours in typical tests
Thevenin Battery Model is one commonly used model which consists of an ideal
battery electromotive force ( mE ) internal resistance (0R ) overvoltage resistance
(1R ) and capacitance (
1C ) and the equivalent circuit is shown in Figure 3-5
(Casacca and Salameh 1992 Salameh Casacca et al 1992 Chan and Sutanto
2000) 1C represents the actual capacitance of battery and
1R represents the
resistance contributed by the contact resistance of the plate and the electrolyte
(Durr Cruden et al 2006) The capacitance in the Thevenin Battery Model can
overcome the trend of terminal voltage shown in Figure 3-4
No load No load Load
42
Figure 3-5 Thevenin Battery Model
The main disadvantage of this Thevenin Battery Model is that all the parameter
values are assumed to be constant but in fact they are strongly dependent on the
state of charge and discharge rate and some other discharge characteristics
334 Dynamic Battery Model
This model is developed based on the Thevenin Battery Model Similar to the
improvements made by the Advanced Simple Model comparing with the Simple
Battery Model the most important difference is that it takes into account the non-
linear characteristic of the open circuit voltage and internal resistance represented
by SOCK (Jayne and Morgan 1986 Sims 1990)
ISOC
KRVV bocb )( +minus= (32)
where bV is the terminal voltage of battery
ocV is the open circuit voltage
bR is the battery terminal resistor typically 01Ω
43
K is the polarization constant
I is the discharge current
335 Fourth Order Dynamic Model
This is a more accurate and sophisticated model The current pI flows through
pR (electrolyte reaction) dR (Ohmic effect) and its associated leakage
capacitance dC and wR (waste of energy) and its associated leakage
capacitance wC Current sI flowing through the resistor sR represents the
behaviour of self discharge (Gillioli and Cerolo 1990 Chan and Sutanto 2000)
The main drawback of this model just as its name indicates is that there are
fourth order equations due to consideration of the paralleled R-C blocks in the
circuit and therefore it takes more time for the computation Another drawback is
that a number of empirical parameters are contained in the model
Figure 3-6 Fourth-order Battery Model
44
336 Improved Battery Model
The most popular Equivalent Circuit Model used by researchers is the Improved
Battery Model (Casacca and Salameh 1992 Salameh Casacca et al 1992) This
model is simple but meets most requirements for a good battery model It contains
most non-linear characteristics and is linked to the state of charge Most elements
included in this model are the functions of the state of charge or the open circuit
voltage which is also related to the state of charge The improved model is
studied in this chapter and implemented in MatlabSIMULINK environment
Figure 3-7 Improved Battery Model
34 Mathematical Model of the Lead-acid
Batteries
As the Improved Battery Model is able to reflect the major dynamic behaviours of
a battery and does not take much computation time it meets the requirements for
45
the project Therefore the mathematical model developed in this project is based
on the Improved Battery Model by involving the components of variable voltage
sources as the electromotive force ( EMF equal to the open circuit voltage OCV )
variable resistors as internal resistance and overvoltage resistance and a capacitor
as the capacitance of battery The description and the detailed analysis of the
model are given in this section
341 Capacity
Based on the Peukertrsquos law introduced in Chapter 2 the relationship of capacity
with different discharge currents is obtained below
2121
2211
)( ttII
tItIC
k
kk
p
=
== (33)
And following the definition of battery capacity the capacity is
12
1
2111
1
21121121121222 )()())(()( I
kkkk
I CIItIIItIIIIItIIItICminusminus
=====
12
1
21 )( I
k
I CIICminus
=there4 (34)
where Cp is the one ampere capacity
CI2 CI1 is the capacity under the discharge current I2 I1
k is a constant that related to the battery
The equation of calculating the capacity by the discharging current can be
46
obtained through experiments (Ceraolo 2000 Barsali and Ceraolo 2002) An
experimental result is given as
m
c
c
IIK
CKIC
))(1(1)( 0
0minus+
= (35)
where )(00 ICC = which stands for the capacity when discharging at the rated
discharge rate usually the nominal capacity C10
cK is empirical coefficient and is 118 for lead-acid batteries
m is empirical coefficient of 120
This equation overcomes the inadequacies of the Peukertrsquos law The capacity
calculated by the Peukertrsquos law in a low discharge current is much larger than that
experimentally obtained (Ceraolo 2000)
With the parameters of 20118124420 ==== kKAIAhC c the simulation
study indicated that the capacities of low discharge rate (lt30A) in different
equations are quite similar as shown in Figure 3-8
47
0 5 10 15 20 25 30 35 40 45 500
10
20
30
40
50
60
70
80
Discharge Current (A)
Actu
al C
apacity (
Ah)
Based on Peukerts law
Based on the Equation 35
Based on the Equation 35
Based on thePeukerts Law
Figure 3-8 Battery Capacity vs Discharge Current
Variations of the cell temperature also affect the battery capacity The effect of
temperature on the battery capacity is described by the following equation
(Ceraolo 2000 Barsali and Ceraolo 2002)
ε
θ
θθ
minus+=
f
ICIC 1)()( 0 (36)
where fθ is the electrolyte freezing temperature and is equal to -40˚C
θ is the cell temperature
)(0 IC is the capacity of battery under the discharge current I at 0˚C
ε is a constant that equals to 129
48
Therefore
m
c
f
c
IIK
CK
IC))(1(1
1
)(
0
minus+
+
=
ε
θ
θ
θ (37)
342 Electric Networks
Figure 3-9 (Ceraolo 2000 Barsali and Ceraolo 2002) shows an adaptation of
electric network based on the improved battery model shown in Figure 3-7 The
major change of this equivalent circuit is that the self-discharge is not taken into
account because the self discharge is usually less than 10 per month in modern
technologies which can be ignored in normal applications
Figure 3-9 Lead-acid Battery Equivalent Network
In the figure mE in this the main branch represents the electromotive force of the
battery and Vb stands for the terminal voltage The mZ in the figure stands for the
internal impedance that can be approximated by two R-C blocks
49
Battery is an energy storage device but not all the energy that the battery gets
from the charger can be stored when a battery is charged Part of this energy is
lost for different reasons like water electrolysis A parasitic branch is therefore
added to the model to represent the energy loss This part is claimed to work only
when the battery is being charged (Ceraolo 2000 Barsali and Ceraolo 2002) In
this project the current of the parasitic branch pI in the figure can be described as
an equation of the voltage of the parasitic branch PNV instead of a simple resistor
pR because of the nonlinear character of the parasitic branch This issue will be
discussed in later sections
As a result of these factors an equivalent electric network of in Figure 3-9 is
designed as shown in Figure 3-10 in which 1C 1R and 0R are the elements of the
internal impedance mZ It is used in the whole project as the electric network of
mathematical model
Figure 3-10 The Equivalent Network with the Approximated mZ
50
343 State of Charge and Depth of Discharge
In Chapter 2 Equations 27 and 28 show the definitions of SOC and DOC of a
battery In the model the nominal capacity can be treated as C(0θ) while the
actual capacity is C(Iavg θ) therefore
)0(1 θCQSOC eminus= (38)
)(1 θavge ICQDOC minus= (39)
where σσ dItQt
e int=0
)()( is the charge already drained from the battery
)0( θC is the nominal capacity of battery
)( θavgIC stands for the actual capacity under the specific discharge
current
344 Electromotive Force of the Battery
The electromotive force of a battery which is Em in Figure 3-10 is the difference
between the electric potential of the two electrodes and can be calculated by the
Nernstrsquos equation (Eq 26)
)(
)()(log029600412
2
2
24
10OH
SOHEMF
α
ααminus+
+=
This equation gives a description of the electromotive force by the activity of
different matter in the sulphuric acid which is described as lsquoαrsquo When the battery
51
is being charged or discharged the electrolyte concentration changes and the
activity value of H+ SO42- and H2O in the Nernstrsquos equation changes which can
be found by the study of battery that is the EMF of battery will change as the
result of the change of state of charge The relationship between SOC and the
activity α is unknown but it is obviously that when the state of charge increases
the quotient of )(
)()(
2
2
24
OH
SOH
α
ααminus+
also increases This shows that the EMF rises
when the state of charge is increasing
From the literatures (Ceraolo 2000 Barsali and Ceraolo 2002) the electromotive
force is described simply as the following equation
)1)(273(0 SOCKEE Emm minusminusminusminus++++minusminusminusminus==== θ (310)
where 0mE and EK are constants for a battery
θ is the temperature of the cell
SOC is the state of charge of the battery
345 Internal Resistance of a Battery
The resistances of a battery as shown in Figure 3-10 can be calculated by the
equations (Ceraolo 2000 Barsali and Ceraolo 2002)
)]1(1[ 0000 SOCARR minus+= (311)
)ln(101 DOCRR minus= (312)
52
)exp(1 22
)]1([
202
21
IIA
eRR
m
SOCA
+=
minus
(313)
where 0A 21A and 22A are constants for a battery while 00R 10R 20R are
parameters related to the SOH which will be discussed in later chapters For the
model 020 asympR and can be omitted when a battery is discharging
Therefore the internal resistance of a cell when discharging is
)ln()]1(1[ 1000010 DOCRSOCARRRr minusminus+=+= (314)
346 The Behaviour of Parasitic Branch
When the battery is being charged there are some losses as represented by the
parasitic current This current depends on the electrolyte temperature and the
voltage at the parasitic branch (Ceraolo 2000)
Because the behaviour of parasitic branch is non-linear Tafel gassing-current
relationship is used instead of a simple resistance pR (Ceraolo 2000)
minus+= )1(exp
0
0
f
p
P
PNPPNp A
V
VGVI
θ
θ (315)
where pI is the current of the parasitic branch
PNV is the voltage of the parasitic branch
53
0PG is a constant in seconds
0PV is a constant in volt
pA is a constant
θ is the electrolyte temperature
fθ is the electrolyte freezing temperature and is equal to -40˚C
When the battery is being discharged 0asymppI the parasitic branch could be
omitted from the model in simulation if the charging behaviour is not necessary
to discuss
347 Main Branch Capacitance
In the electric network of the model there is an R-C circuit as shown in Figure
3-11
Figure 3-11 R-C block
where Im is the discharge current
IC1 is the current flow through the capacity branch
54
I1 is the current of R1
VR1 is the voltage over the R-C block
This branch can be solved by
))(
()( 11111111
dt
tdVCIRIIRIRV R
mCmR minusminusminusminus====minusminusminusminus====sdotsdotsdotsdot==== (316)
)()()(
111
11 tIRtVdt
tdVCR mR
R====++++ (317)
This is the differential equation that represents the main branch behaviour
Laplace transform is employed to solve this problem
)()( 1111 sIRsVSCR mR sdotsdotsdotsdot====sdotsdotsdotsdotsdotsdotsdotsdotsdotsdotsdotsdot (318)
1
)(
11
11
++++
sdotsdotsdotsdot====
SCR
sIRV m
R (319)
++++
====++++
========
SCR
C
SCR
R
I
VsG R
11
1
11
11
1
1
1)( (320)
where τ=11CR is the time constant that represents the double layer capacitance
When the current has a shape like a step and the initial voltage of the capacitor is
equal zero the solution in time becomes
m
t
R IeRtV )1()( 11τ
minus
minus= (321)
55
It is obviously that this equation is the typical form of the voltage with an R-C
circuit
348 Thermal Behaviour of a Battery
When the battery is charging or discharging there is a current flow through the
battery so that it produces heat due to the Joules law
0
2
1
2
12 RIRVIVVIP RPNps sdot++sdot+sdot= (322)
When discharging the parasitic branch and R2 are omitted the equation becomes
0
2
1
2
1 RIRVP Rs sdot+= (323)
The dynamic equation of cell temperature and the power is (Ceraolo 2000)
s
a PRdt
dC +
minus=
θ
θ
θθθ (324)
where θC is the thermal capacitance
θR is the thermal resistance between the battery and the environment
θ is the cell temperature and aθ is the environment temperature
56
35 Mathematical Model of the Lead-acid
Batteries
Considering the behaviour of capacity state of charge and depth of discharge
electromotive force and internal resistance an Improved Battery Model based on
the equivalent circuit shown in Figure 3-10 was introduced in previous sections
The battery model for the complete discharging progress can be derived as the
following equations
m
c
f
c
IIK
CK
IC))(1(1
)1(
)(
0
minus+
+
=
ε
θ
θ
θ (325)
σσ dItQt
e int=0
)()( (326)
)0(1 θCQSOC eminusminusminusminus==== (327)
)(1 θavge ICQDOC minusminusminusminus==== (328)
)1)(273(0 SOCKEE Emm minus+minus= θ (329)
)]1(1[ 0000 SOCARR minus+= (330)
)ln(101 DOCRR minus= (331)
1
1R
Cτ
= (332)
IeRtV
t
R sdotminussdot=minus
)1()( 11τ (333)
0
2
1
2
1 RIRVP Rs sdot+= (334)
57
sa P
Rdt
dC +
minus=
θ
θ
θθθ
(335)
)( θIC in the equations is the expression of capacity of battery when discharging
under the discharge current I and at a temperature of θ 0C stands for the
capacitance when discharging at the rated discharge current I while parameters
fθ and ε are constants in this model )(tQe represents the charge already
consumed while the equation of mE indicates the mathematical description of
electromotive force corresponding to the SOC and the cell temperature in which
0mE EK are constants for a battery 00R 10R are parameters related to the SOH
and the discharge current can also affect them τ in the equations are the time
constant of the R-C circuit which represents the time it takes the systems step
response to reach ( 6311 asympminus e ) of its asymptotic value The last two equations
represent the thermal dynamic of battery in which sP is the Joule heat generated
by the internal resistance θC is the thermal capacitance and θR is the thermal
resistance between the battery and the environment
36 Summary and Discussion
The Improved Battery Model based on the electric equivalent circuit is presented
in this chapter and it is proved that it can satisfy all the three requirements to serve
the project objectives This battery model consists of a variable voltage source
several R-C blocks and a parasitic branch as its electric network and the elements
are described as a variable related to the capacitance the charge consumption and
58
the cell temperature as well
However experimental tests show that the behaviour of the battery is much more
complicated can be represented by this equivalent circuit model For example the
internal resistance varies when discharging under different current and the time
constant of the R-C circuit at the beginning and end of discharge as well
Therefore the model has to be improved The next chapter overcomes these
problems found in the experimental tests and some improvements of the model
are described
59
Chapter 4
Experimental System Set up and
Improved Battery Model
Simulation Implementation
Experimental tests based on a 12V-13 Ah lead-acid battery are carried out and the
test system is introduced at the beginning of this chapter Some of the
characteristics of the battery can be found in the tests which has shown that the
battery model described previously is not accurate enough and improvements
have to be implemented into the model This chapter will focus on the analysis of
the battery characteristics and the description of the improvements implemented
In the last part of this chapter a finalised version of the battery model used in this
project is given and implemented in the MatlabSIMULINK environment for
simulation study
41 The Experimental System
In this experimental test system a variable resistor is used as the load of the
battery Three sensors are employed in the whole experiment process two current
sensors and one voltage sensor The equivalent circuit of the test rig designed for
the research purpose is shown in Figure 4-1
60
Figure 4-1 Equivalent Circuit of the Experimental Test Rig
In this figure the ideal voltage source EMF accompanying with the internal
resistance r acts as a lead-acid battery with 6 cells (12V) the terminals of the
battery are connected in parallel to a voltage sensor Switch Krsquo is employed to
control the voltage sensor connection so that the sensor can be disconnected from
the battery when the experiment is not being in progress to avoid an unnecessary
discharge The circuit break in Figure 4-1 can be used as a main controller which
decides whether the load is engaged to the battery to discharge or not Switch K
in the experiment is to vary the load of the system This experimental test system
is mainly designed for two different experimental tests of a battery in this study
constant-impedance load discharge and two-load discharge Figure 4-2 shows the
actual laboratory test rig used in the project
61
Figure 4-2 Experimental Test Rig
The data is collected and recorded every half second by a data acquisition card
PCI-6251 from National Instruments with the software environment of LabVIEW
and a 12V-13Ah lead-acid battery (marked in the red-dashed square in Figure 4-2)
is employed in the project as test batteries for the battery performance study
42 Improvements of the Battery Model
Figure 4-3 and Figure 4-4 show the typical data collected from the experimental
test rig Figure 4-3 is the result of a constant-impedance load discharge test with a
discharge current of 075A approximately and Figure 4-4 shows two-load
discharge with the discharge currents of 075A and 12A respectively
62
0 500 1000 1500 2000 2500 3000 3500 4000 4500 5000-02
0
02
04
06
08
1
12
Time (s)
Dis
charg
e C
urr
ent
(A)
0 500 1000 1500 2000 2500 3000 3500 4000 4500 5000105
11
115
12
125
13
Time (s)
Term
inal V
oltage (
V)
Figure 4-3 Test of constant-impedance load discharge top figure shows the discharge current of the experimental test and the bottom one shows the terminal
voltage 1τ is the time parameter of the R-C block at the beginning of the
discharge and 2τ is that when the discharge stopped
0 200 400 600 800 1000 1200 1400
0
05
1
15
Time (s)
Dis
charg
e C
urr
ent
(A)
0 200 400 600 800 1000 1200 1400118
12
122
124
126
128
Time (s)
Term
inal V
oltage (
V)
Figure 4-4 Test of two-load discharge top figure shows the discharge current of the experimental test and the bottom one shows the terminal voltage
I(t)RI1 and I(t)RI2 represent the voltage drop across the internal resistance value under different discharge current
1τ 2τ
I(t)RI1
I(t)RI2
I(t)RI1
63
421 The Change of τ in Different Charge Status
From analyzing these figures it is easy to find that it takes quite a long time for
the battery to have the steady terminal voltage when the discharge of battery stops
and it is longer than the time taken from the beginning of the discharge This
difference means that when the battery starts to discharge the time parameter
11CR=τ in the main branch equation (332) is not equal to that when the
discharge has just stopped In Figure 4-3 it is shown that when the discharge stops
the time parameterτ is longer than that when the discharge starts
As a result of this experimental feature a switch is employed to implement the
change of time parameter to match those described in the mathematical model of
the battery The switch is used to control the value of the time parameter τ in
different discharge currents When the battery is discharging the discharge current
is a positive value and the time parameter τ is equal to 1τ When the battery is
not discharging the discharge current is equal to 0 in theory and the time
parameter has a different value 2τ
Although the discharge current should be equal to 0 theoretically it is hard to
achieve this in the real experimental measurement because of the inaccuracy of
the current sensor reading due to the inaccuracy occurred in the power supply to
the sensor Therefore the trigger of the switch in the model is set to be 01 A that
is when the discharge current is greater than 01 A the time parameter is set to be
1τ as the battery is in its discharging segment By contrast the value of time
64
parameter is set to be 2τ and the discharge current is considered as the error
caused by the sensors when that current is less than 01 A
422 Analysis in Variations of the Internal Resistance
Another important issue found through analyzing the experimental test result is
that the internal resistance for a specific battery in a specific state of health (SOH)
is not a constant when the discharging current changes This difference is more
significant than the effect caused by the state of charge
For example in the two-load discharge results shown in Figure 4-4 when the
battery is not discharging the initial voltage is equal to the electromotive force
(EMF1) When the battery began to discharge at the discharge current I1 the
terminal voltage dropped to V1 After the discharge stopped for a while the value
of the terminal voltage is equal to the electromotive force (EMF2) at that state of
charge (SOC2) Then the discharge of the battery starts again at a current of I2 and
the terminal voltage dropped to V2 The discharge progress is then stopped for
certain of a time period to get the steady terminal voltage (EMF3) at that state of
charge (SOC3) After that the test of discharge at the I3 = I1 was repeated again
and get another terminal voltage of V3 The last discharge test is done to provide
the evidence for the fact that this change in the internal resistance is not caused by
the change of the state of charge (SOC)
The value of electromotive force in a discharging battery is equal to the sum of the
terminal voltage and the voltage that the internal resistance takes that is
65
nnnn IrVEMF sdot+=
Therefore the internal resistance can be calculated by
n
nnn
I
VEMFr
minus= (41)
From the data collected in the experiment the key parameter values for the graphs
shown in Figure 4-4 can be found as listed in Table 4-1
Table 4-1 Approximate Internal Resistance Calculating
n 1 2 3
Electromotive Force (EMFn) 1260V 1252V 1238V
Discharge Current (In) 078A 114A 076A
Terminal Voltage (Vn) 1219V 1203V 1197V
Substituting these values into Equation 41 the internal resistance can be
calculated Ω=Ω=Ω= 539043005260 321 rrr
This change of the internal resistance can cause quite a significant effect in the
discharge progress This problem can be possibly solved in a number of ways
One possible choice is to find a curve of the internal resistance change and the
discharge current for a specific battery after a certain numbers of experimental
tests But this method needs huge efforts in conducting experimental tests and the
result is not very meaningful for the project considering the time cost Another
possibility is to conduct the experimental tests with a constant load Therefore the
change of internal resistance caused by the change of discharge current could be
ignored As a result in the whole process of this project the same load is
66
employed either in the constant-impedance load discharge or in the two-load
discharge tests
In order to implement the different internal resistance value when discharging
under different load a switch that can control the parameters R00 and R10 is
employed This switch is controlled by the discharge current which is the main
input of the mathematical model In the two-load discharge tests when the switch
K in Figure 4-1 is switched off there is only one load is connected to the battery
terminals and the discharge current is lower the values of R00 and R10 are
switched to the first set of parameters R001 and R101 To the contrast when K is
switched on the discharge current is higher and the values are switched to the
second set R002 and R102
423 Improved Lead-Acid Battery Mathematical Model
From the model described in Chapter 3 and the improvements studied in this
chapter the mathematical model of lead-acid battery when discharging in different
discharge currents can be described as the following equations
m
c
f
c
IIK
CK
IC))(1(1
)1(
)(
0
minus+
+
=
ε
θ
θ
θ (42)
ττ dItQt
e int=0
)()( (43)
)0(1 θCQSOC eminusminusminusminus==== (44)
)(1 θavge ICQDOC minusminusminusminus==== (45)
67
)1)(273(0 SOCKEE Emm minusminusminusminus++++minusminusminusminus==== θ (46)
)]1(1[ 0000 SOCARR minusminusminusminus++++==== (47)
)ln(101 DOCRR minusminusminusminus==== (48)
11
RC
τ= (49)
IeRtV
t
R sdotminussdot=minus
)1()( 11τ (410)
RIRVP Rs sdot+=2
12
1 (411)
sa P
Rdt
dC +
minus=
θ
θ
θθθ
(412)
)(
)(
2
1
002
001
00Load
Load
R
RR
= (413)
)(
)(
2
1
102
101
10Load
Load
R
RR
= (414)
)10(
)10(
2
1
AI
AI
lt
gt
=τ
ττ (415)
001R 002R 101R 202R and 1τ 2τ in the equations stand for different parameter
values of 10R 20R and τ when the load and charge status changes in order to
reflect the improvements described in this chapter For a two-load discharge test
there are ten important unknown parameters in the equations of the mathematical
model which are unknown for a specific battery 0C 0mE EK 001R 002R 101R
102R 1τ 2τ and 0A As the internal resistance R00 and R10 vary only when the
load changes they can be treated as constants in the constant-impedance load
68
discharge tests the key parameters are therefore 21100000 ττRRKEC Em
and 0A In this project the study of state of health is based on constant-impedance
load discharge The identification of these unknown parameters will be discussed
in Chapter 5
43 Simulation Study
The processes described above have been implemented in SIMULINK as a
simulation model for computer based analysis The simulation program consists of
two main function blocks circuit block and thermal block The structure of the
SIMULINK implementation is described in Figure 4-5
69
Figure 4-5 Structure of model for SIMULINK Implementation
70
As shown in the figure there are mainly two inputs in the model the discharge
current and the discharge time The actual capacity of battery can be then
calculated with the knowledge of rated capacity and the discharge current The
actual capacity is also influenced by the cell temperature At the beginning of
discharge the cell temperature is the same as the surrounding temperature
Integrating the discharge current with respect to time is the capacity consumed in
the discharge progress and then the state of charge and the depth of charge can be
obtained It is shown that the electromotive force and the internal resistance vary
as a result of changing in the state of charge and the depth of charge and the
terminal voltage can be calculated
In the thermal block of the model the heat generated by the current and the
internal resistance are calculated by the Joules law Then this energy is
transferred to calculate the thermal temperature of the cell and the cell
temperature is given back to the circuit block to affect the actual capacity
71
0 1000 2000 3000 4000 5000 6000 7000
0
02
04
06
08
1
Time (s)
Dis
charg
e C
urr
ent
(A)
0 1000 2000 3000 4000 5000 6000 7000105
11
115
12
125
13
Time (s)
Term
inal V
oltage (
V)
Figure 4-6 Terminal Voltage of Battery (Constant Discharge Current SIMULINK)
The result in Figure 4-6 shows the terminal voltage of a battery which discharges
under the current of 08A in a simulation study Since the discharge begins the
voltage drops due to the internal resistance and the change of state of charge (SOC)
and it climbs up when the discharge stops However the voltage changes
gradually because of the time parameter τ This result shows a good qualitative
agreement with the experimental test results
72
44 Summary and Discussion
This chapter introduces the laboratory test system designed for the project and the
limitation of the mathematical model described in Chapter 3 Switches on the time
parameter τ and the internal resistance parameters R00 and R10 have been added to
the model so that the model is able to represent the change of these parameters
found in the experimental tests The implementation of the model under the
MatlabSIMULINK environment is described and the simulation study shows a
good qualitative agreement with the experimental test results
The next chapter will focus on the identification of those unknown parameters of
the battery model that are important for revealing the battery characteristics
including 20100000 τARRKEC Em and 1τ
73
Chapter 5
Model Parameter Identification
and Model Validation
The identification of the unknown parameters 20100000 τARRKEC Em and 1τ
in the mathematical model will be introduced in this chapter
51 Need for the Optimization Algorithms
In those equations of the battery model described previously some parameters are
unknown and some of them are difficult to derive from physics or engineering
principles or to be obtained through experimental tests Therefore the
identification of the model unknown parameters becomes an important part for the
project Parameter identification is an optimization process that adjusts the
parameters to enable the simulation results to show the best agreement with the
results acquired by the experimental tests There are many algorithms available
for optimization and the principle of the optimization process for the project is to
minimize the objective function The objective function is formed by the absolute
value of the difference between the simulated and experimental results at each
time point The set of parameters to achieve the least value of the objective
function is considered to be the fittest set
74
There are two basic requirements of the optimization in this project First of all as
the problem for the solutions trapped to the local minima is a very important and
challenging issue in many linear optimization solvers the optimization algorithm
used in this project must be able to find the global minimum Secondly the
optimization algorithm not only should find the minimum value of the objective
function but also can tell the values of the parameters that result in the best fitness
which is needed for the analysis purpose in this project Finally the time cost is
also an important factor in selection of a suitable optimization algorithm
It needs to point that the objective here is to identify the unknown parameters of a
model with an already known structure If the objective is to identify or
approximate unknown model structures the selection of optimisation methods
will be quite different In the case of latter Neural Network Genetic
Programming and Fuzzy Logical will be more suitable choices To concentrate on
the objective of the project the thesis will focus on optimisation algorithms for
parameter identification
52 Overview of the Optimization Algorithms
Brute-force search is the most basic direct search algorithm that is used to find the
minimum value In the brute-force search the initial guess is the minimum
possibility of parameters and increasesdecreases The parameter
increasesdecreases step by step in each iteration and the best solution can be
75
searched This algorithm is the simplest but its disadvantage is also obvious that
is it is the slowest optimization method especially when used in the identification
of more than two parameters and the results are largely dependent on the initial
guesses
Linear search is an optimization method to solve the linear optimization problem
the preference function of which is linear and the feasible domain is defined by a
linear constraint function The linear constraints define a convex polyhedron
geometrically which is called the feasible region The algorithm is to construct an
admission solution at a vertex of the polyhedron and then along edges of the
polyhedron to vertices with successively higher values of the objective function
until the optimum is reached
Besides the basic optimization methods evolution computation technology is
becoming increasingly popular A range of different evolution computation
technologies can solve the optimization problem in this project including genetic
algorithms (GAs) particle swarm optimization (PSO)
Genetic Algorithms are direct search algorithms inspired from the process of
evolution in nature the natural selection Based on the principle of survival of the
fittest the GAs can produce better and better approximations to the global optimal
solution in a number of generations In each generation a new group of solutions
is created by the fitness level in the problem of every individual in the last
generation The solutions are then bred together to lead to the evolution of
individuals
76
Particle swarm optimization is a stochastic population-based computer algorithm
modelled on swarm intelligence that searches for a solution to an optimization
problem in a search space Based on the social psychological principles each
individual called lsquoparticlersquo in PSO is able to provide information to others and
also learn the success from the local best and the global best The movement of
each particle through the search space are guided by these successes and the
solution can be found after a number of generations
It has been proved by Dr Jianlin in his PhD Thesis (Wei 2007) that both Genetic
Algorithm and Particle Swarm optimization are capable of the model parameter
identification But the Particle Swarm optimization is a new algorithm that first
described in 1995 and it is not as common as Genetic Algorithm in the research
areas
The purpose of this research work is to find a method for parameter estimation
Genetic algorithms are well proven solution for complicated optimisation
problems and have been applied successfully in a range of similar problems (Wei
2007 Wei Wang et al 2007) Genetic algorithms are also well suited to problems
with many local minima In the current work the exact form of the fitness
function is unknown and it is therefore important to select a robust technique
which can identify good overall solutions For these reasons GA was selected to
give the best possible chance of satisfying the overall project objectives within the
limited timeframe of the project
77
53 The Study of the Genetic Algorithms
The process of Genetic Algorithm is reviewed in this section to provide an insight
into how GAs work and simulation study of two bench mark functions are carried
out
531 Working Principle of GAs
There are many methods used to implement a GA process and usually a GA is at
least composed of three common genetic operators Selection Crossover and
Mutation (Pham and Karaboga 1998) The flowchart of a simple GA process is
given in Figure 5-1
As a preparation to start the optimization process a GA requires a group of initial
solutions as the first generation The first generation is usually a group of
randomly produced solutions created by a random number generator The
population which is the number of individuals in a generation should be big
enough so that there could be a reasonable amount of genetic diversity in the
population Also it should be small enough for each generation to be computed in
a reasonable period of time using the computer resources available Typically a
population includes individuals between 20 and 100 (Chipperfield Fleming et al
1994A)
78
Figure 5-1 Flowchart of a Simple Genetic Algorithm (Pham and Karaboga 1998)
The fitness function is evaluated to measure how close that the individuals fit the
desired result A fitness function could be either complex or simple depending on
the optimization problem addressed In a case of minimization problem the most
fitted individuals will have the lowest numerical value of the associated fitness
function
No
Yes
Selection
Crossover
Mutation
Find the Best Individual
Generate initial population
Results
Evaluate fitness values
Operators of generating new
generation
Gengt 100
Evaluation
Start
79
Individuals are selected according to a fitness-based process The operator of
selection is made up of ranking and selection progress by which more copies of
the individuals that fit the optimization problem better will be produced in the
next generation In GAs there are mainly two ways to select a new population
Roulette Wheel Selection (RWS) and Stochastic Universal Sampling (SUS)
The individuals will be recombined (crossover) after the selection This operation
is to produce two new individuals from two existing individuals selected by the
operator of selection by cutting them at one or more position and exchanging the
parts following the cut The new individuals therefore can inherit some parts of
both parentsrsquo genetic material There are usually four ways of doing this one-
point crossover two-point crossover cycle crossover and uniform crossover
(Pham and Karaboga 1998) Figure 5-2 (a) shows an example of the two-point
crossover progress
Mutation is another operator to produce new individuals The difference is that the
new individual is produced from a single old one In this operation the bit values
of each individual are randomly reversed according to a specified property A
mutation can also helps the GA to avoid local optimums and find the global best
solution Figure 5-2 (b) represents how the mutation operator works
80
Figure 5-2 (a) Crossover operation (b) Mutation operation
The group of individuals produced after the mutation is the second generation
Then the fitness value of each individual in the second generation is computed
again This cycle will not stop until the result is close enough or after a certain
generation
Three major Matlab toolboxes are applied in the current market for application
purpose they are Genetic Algorithms Toolbox V12 (Chipperfield Fleming et al
1994B) the Genetic Algorithms Optimization Toolbox V11 (Houck Joines et al
1995) Genetic Algorithm Direct Search Toolbox V102 (MathWorks Inc 2004)
In this project the official toolbox in Matlab form Mathworks Inc is employed
The property settings for the project based on Dr Weirsquos thesis (Wei 2007) are
shown in Table 5-1
Parent 1 1 1 0 0 1 0 1 1 0 1 0 1 1
Parent 2 0 1 1 0 1 1 0 0 1 0 1 0 0
Offspring 1 1 1 0 0 1 1 0 0 1 1 0 1 1
Offspring 2 0 1 1 0 1 0 1 1 0 0 1 0 0
(a)
Parent 1 1 0 0 1 1 0 0 1 1 0 1 1
Offspring 1 1 0 0 1 0 0 0 1 1 0 1 1
(b)
81
Table 5-1 The property settings for Genetic Algorithms
Name of the GA properties Value of the GA properties
Number of generations 100
Population size 20
Fitness assignment Rank-base fitness assignment
Selection Stochastic universal sampling
Crossover Scattered crossover
Crossover rate 07
Mutation function Uniform mutation
Mutation rate 01
Population size specifies how many individuals there are in each generation With
a large population size the genetic algorithm searches the solution space more
thoroughly and the gives more possibility to return the global minimum The
number of generations specifies the maximum number of iterations for the genetic
algorithm to perform If this number is too low the genetic algorithm is not able
convergence to the global solution However either a large population size or a
large number of generations can cause the algorithm to run more slowly The
crossover rate and the mutation rate are properties that control the crossover and
mutation operator High rate of these values means that the genetic algorithm has
a higher opportunity of producing new offspring but it can be easy to miss the
current best solution if these values are too big
Initial tests of genetic algorithms on different properties show that the values
shown in table 5-1 are able to find an adequate solution Similar results would be
82
obtained if the values of the generations and the population size are larger but
costing more CPU time The crossover rate and the mutation rate would not affect
the result significantly if only varies in a small range But it is impossible to prove
that these two values are the best choice due to the strong randomness
532 Simulation Studies of Genetic Algorithms
In order to test and demonstrate that Genetic Algorithms are able to meet the
requirements of the project simulation studies have been carried out Two
benchmark functions that are commonly used in evaluating evolutionary
computation algorithms are employed for the simulation studies They are
1) Rastrigin function
Rastrigin function is a typical example of non-linear multimodal function with
many local minima The problem of looking for the global minimum is quite
difficult due to its large search space and its large number of local minima The
function is shown as
))2cos(10(10)(1
2sum=
sdotsdotminus+sdot=
n
i
ii xxnXf πr
where n is the dimension of the problem and 1x ~ nx are the coefficients to be
identified Figure 5-2 shows a 2-dimensional Rastriginrsquos function while figure 5-3
is a contour plot of Rastrigins function shows the alternating maxima and minima
83
The global minimum of the Rastriginrsquos function is 0)( =Xfr
when
021 ==== nxxx L
Figure 5-2 2-dimensional Rastrigins function (MathWorks Inc 2004)
84
Figure 5-3 Contour plot of Rastrigins function (MathWorks Inc 2004)
In the simulation study a ten dimensional Rastriginrsquos function is adopted Figure
5-4 shows the best optimization performance of the Rastriginrsquos function in each
generation It is shown that after 700 generations a global optimal value is
obtained
85
0 100 200 300 400 500 600 700 800 900 10000
10
20
30
40
50
60
70
80Best 00099429
Generation
Fitness v
alu
e
Best f itness
Figure 5-4 GA performance (Rastrigrinrsquos function)
2) Rosenbrock function
Rosenbrock function is another mathematical function used as a test problem for
optimization algorithms The global minimum is inside a long narrow parabolic
shaped flat valley To find the valley is trivial but to converge to the global
minimum is difficult The Rosenbrock function is defined by
sum=
+ minus+minus=
n
i
iii xxxXf
1
2221 ))1()(100()(
r
where n is the dimension of the problem and 1x ~ nx are the coefficients to be
identified Figure 5-5 shows a 2-dimensional Rosenbrock function
86
The global minimum of the Rosenbrock function is 0)( =Xfr
when
121 ==== nxxx L The same as the Rastriginrsquos function a ten dimensional
Rosenbrock function is adopted for the simulation study Figure 5-6 is the GA
performance to the Rosenbrock function It can be found that the optimization
converges and get the global optimal value after 300 generations
Figure 5-5 2-dimensional Rosenbrock function (MathWorks Inc 2004)
87
0 100 200 300 400 500 600 700 800 900 10000
200
400
600
800
1000
1200Best 060113
Generation
Fitness v
alu
e
Best fitness
Figure 5-6 GA performance (Rosenbrock function)
54 Model Parameter Identification
541 Implementation of Genetic Algorithms and
Experimental Data sets
In this project the Genetic Algorithm Direct Search Toolbox V102 developed by
Mathworks Inc is employed to identify the parameters of the battery model The
process is shown in Figure 5-7
88
Figure 5-7 Progress of Parameter Identification
The fitness function is used in the project and the parameter identification is to
minimize the fitness function so that the model output can fit the experimental
result The fitness function is given as
sum
sum sumsum
minussdot=
minussdot++minussdot+minussdot=
minus
1
0
2
1 1
1
0
))()(()(
)()()(
exp
expexp2exp1
t
t
sim
t
t
t
t
simnsim
t
t
sim
tVtVabstW
VVabsWVVabsWVVabsWfitnessn
n
L
where Vexp is the experimental terminal voltage data
Vsim is the simulated terminal voltage
Wt is the weights of the difference in the simulated and experimental
results
This fitness function represents the sum of the error values at each time interval
Mathematical Model of a six-cell
Lead Acid Battery
Experimental Test
Results
Fitness
Function
Discharge Current
Simulation
Output
Terminal Voltage
Simulation
Input
lt fmin
Genetic Algorithms (Selection Crossover and Mutation
etc)
Parameter Update
Yes
No
Stop
89
considered ( ntt minus0 ) The weight coefficients Wt indicates how important the
weighted part is in the optimization and how much it contribute to the
optimisation process Periods with bigger tW values are more important because
the sum of errors will give big value contribution to the fitness function value and
the optimisation process will pay more attention to the higher weighted error parts
In the experiments and optimization process it is found that the results were more
important when the discharge of a battery at the stage of stopping Therefore the
weight in this period is greater than that of the others The weighting coefficient
values in this project are determined by the results of the first several attempts of
parameter identification The period of simulation data that fails to fit the test
result means that the weight value is not big enough until the overall performance
of simulation is reasonable
Following the objective fitness function unknown coefficients of the battery
model are identified using experimental data The mathematical model of a six-
cell lead-acid battery in the figure is described in Chapter 4 and the parameters are
to be identified by Genetic Algorithms are 210100000 ττARRKEC Em
Three sets of experimental tests have been carried out for the purpose of
parameter identification and the validation of the mathematical model These three
experimental results are based on a lead-acid battery with the ideal capacity of 13
Ampere-hours under the discharge current of 08A
90
542 Parameters of Battery Model
The parameters of the mathematical model of a lead-acid battery are identified
using Genetic Algorithms and the predicted battery responses using the identified
parameters are compared with the simulated results One set of typical values of
parameters identified are listed in Table 5-2
Table 5-2 Identified parameters identified by the Genetic
Algorithms in the model of 12V-13Ah lead-acid battery Parameter Value Parameter Value
0C 48198 (Amp-Sec) 0mE 21465 (V)
EK 0001109 (V) 0A 29895
00R 001038 (Ohm) 10R 012196 (Ohm)
1τ 21052 (s) 2τ 17565 (s)
Figure 5-8 shows the simulation results using the Improved Battery Model and the
change of weights defined for this set of result described in the fitness function
The top subplot of Figure 5-8 shows the weight value of the GA fitness function
described before while the middle figure is the discharge current of the
experimental test which is also the input of the mathematical model In the
following test results in this and next chapter the changes of weight value are
similar so they are not shown in the figures
The blue line marked as ldquoExperimental Terminal Voltagerdquo in the bottom figure
represents the measured outputs while the other one (Simulated Terminal Voltage)
represents the simulation results The simulation results are ldquonoisyrdquo because
experimental discharge current is used as the input of model in the simulation
91
progress It is obviously that Figure 5-8 shows a good overall agreement of the
results although some slope when discharging is not perfect
0 500 1000 1500 2000 2500 3000 3500
1
15
Time (s)
Weig
ht
0 500 1000 1500 2000 2500 3000 3500114
116
118
12
122
124
126
128
13
Time (s)
Term
inal V
oltage (
V)
Experimental Terminal Voltage
Simulated Terminal Voltage
0 500 1000 1500 2000 2500 3000 3500
0
05
1
Time (s)
Dis
charg
e C
urr
ent
Simulated Terminal Voltage
Experimental Terminal Voltage
Figure 5-8 Measured and Simulated Result after Parameter Identification
Figure 5-9 shows the mean fitness value and the best in each generation It can be
seen that the best fitness in each generation is decreasing The mean fitness is
unstable because of the mutation operator in the GA that can attempt to find better
solutions
92
0 10 20 30 40 50 60 70 80 90 100100
150
200
250
300
350
400
450
500
550
Generation
Fitness v
alu
e
Best 1075521 Mean 1312731
Best f itness
Mean fitness
Figure 5-9 Mean and the Best Fitness Values in Each Generation
543 Battery Model Validation
In order to validate the battery mathematical model two sets of experimental tests
have been adopted to compare with the simulation results
The inputs of the discharge current and the validation results using two
experimental tests are shown in Figure 5-10 and Figure 5-11
93
0 500 1000 1500 2000 2500 3000114
116
118
12
122
124
126
128
13
Time (s)
Term
inal V
oltage (
V)
Simulated Terminal Voltage
Experimental Terminal Voltage
Simulated Terminal Voltage
Experimental Terminal Voltage
Figure 5-10 Measured and Simulated Terminal Voltage (Validation data 1)
In the simulation that shows in Figure 5-10 the discharge of battery begins at the
time of 700s and the simulation result shows a reasonable agreement with the
experimental result despite the noise of signal caused by the error of the sensors
It is noticed that at the beginning of the discharge there is a difference between
the simulated and experimental terminal voltages for about 100 seconds This
difference is studied and so called lsquocoup de fouetrsquo which often takes place at the
beginning of a discharge test when the SOC of battery is high (Perrin Delaille et
al 2006) However this lsquocoup de fouetrsquo behaviour cannot be described in this
model The discharge period lasts for about 1200 seconds and then stops and after
that the simulation has the similar result with the experiment
94
0 1000 2000 3000 4000 5000 600011
112
114
116
118
12
122
124
126
128
13
Time (s)
Term
inal V
oltage (
V)
Simulated Terminal Voltage
Experimental Terminal Voltage
Simulated Terminal Voltage
Experiment Terminal Voltage
Figure 5-11 Measured and Simulated Terminal Voltage (Validation data 2)
Figure 5-11 shows another group of experimental test to validate the battery
model At the beginning of the experiment the terminal voltage from the
experiment is dropping without any discharge behaviour of battery and that is
because of the experiment was carried out when the terminal voltage of lead-acid
battery is not steady enough after being charged and that also causes the
deviations in the discharge at about 1000-2000 seconds In this period the lsquocoup
de fouetrsquo appears again After the first period the battery is disconnected from the
load until the terminal voltage become steady and the simulation result in this
period fits the experiment result well In the second discharge of this test it is
shown that the lsquocoup de fouetrsquo does not occur because the SOC is not high For
the similar reason in the first discharge in this group of the test results there are
95
also some deviations in this period Finally the simulation result in the last part of
figure fits the experimental result is highly satisfied
The average error of the simulated outputs of the simulation studies and the
measured results are studied Absolute Error and Relative Error is defined as the
following equations
sum
sum
=
=
minus=
minus=
N
i
sim
N
i
sim
iV
iViV
NRelError
iViVN
AbsError
1 exp
exp
1
exp
)(
)()(1
)()(1
The absolute error and relative error are summarised in Table 5-3
Table 5-3 AbsError and RelError of Model Validation
Absolute Error Relative Error discharging relaxing overall discharging relaxing overall
Experimental Test 1 (Identification)
00229V 00207V 00217V 01833 01724 01776
Experimental Test 2 (Validation data 1)
00536V 00484V 00492V 04453 03872 04024
Experimental Test 1 (Validation data 2)
00724V 00372V 00485V 06352 03013 05025
55 Summary and Discussions
Identification of the unknown model parameters is discussed in this chapter and a
range of possibly suitable methods are reviewed in brief In this project Genetic
Algorithm is adopted GAs working principle and its implementation has been
96
introduced in details in this chapter The simulation study of two benchmark
functions that are commonly used in evaluating evolutionary computation
algorithms are employed in order to show the capability of GAs The parameter
identification by tests of a brand new 13Ah lead-acid battery is carried out and is
validated by two sets of other experimental test results under the same working
condition of the same battery
97
Chapter 6
The Analysis of State of Health
(SOH) in association with the
Internal Resistance
61 Methodology
As the number of discharge cycles of battery increases in applications the
maximum charges that a battery can offer will decrease In other words the SOH
battery is deteriorating But this drop of capacity is not linear and it is also a long
progress At the beginning of the use of battery the change of capacity is very
slow and it is not obvious After a number of cycles of discharge and charge this
change will get faster and relatively significant
There are no reliable methods now to calculate the remaining charge capacity
which is the only one determinant of the state of health The normal method is
simply to measure the voltage on its terminals But this measurement is not
accurate on an aged battery A battery in poor state of health but sufficiently
charged can also offer sufficient voltage to appear normal The only way to
determine the capacity accurately is to integrate the discharge current of battery in
a full deep discharge but this method cannot be used too frequently because deep
98
discharge is harmful for the battery
In the project six lead-acid batteries were tested using the test system described in
Chapter 4 These batteries were repeatedly discharged and charged for their whole
life time so that the information related to different state of health can be revealed
as soon as possible Even though the batteries works frequently it still takes more
than 6 months to make the battery become weak The testing experiments were
carried out and the data was recorded every 2-3 weeks so that important value of
state of health is not missed However as the change of capacity is a long progress
and it is nonlinear not all the data collected can be used in this project
Referring the literature (Coleman Lee et al 2006 Lakhdari and Midoun 2007
Coleman Hurley et al 2008) an important factor that reflects the change of state
of health of a lead-acid battery is the internal resistance Not only the state of
health but also other factors (SOC DOC discharge current etc) can result in
variations in internal resistance a new alternative method that based on the
Improved Battery Model in Chapter 4 is adopted in the project
From the model study in Chapter 4 the internal resistance can be divided into two
parts expressed by )]1(1[ 0000 SOCARR minusminusminusminus++++==== (Eq 47) and )ln(101 DOCRR minusminusminusminus====
(Eq 48) These equations show that the internal resistance is affected by the state
of charge (SOC) and depth of charge (DOC) in a discharge cycle In real
applications batteries are seldom discharged to the full range because a deep
discharge could cause some damage to the battery They are also seldom to be
charged to full to prevent the possibility of overcharge that could also bring some
99
negative effects Although this issue is not very significant in a valve regulated
lead acid battery it is better to control the working range of depth of charge from
50 to 80 approximately In this project the internal resistance of battery in the
depth of charge of 65 is studied as a most important factor that related to the
state of health As a little inaccurate of SOC and DOC will induce a comparative
big difference in the internal resistance the method of measuring the internal
resistance accurately by an external circuit is discarded
In Equation 47 and Equation 48 the author found that there are two other factors
that influence the internal resistance besides the SOC and the DOC R00 and R10
Therefore in the project the values of R00 and R10 in a specific discharge current
are very important to study the internal resistance The values of these two factors
are used in Equation 47 and Equation 48 to calculate the internal resistance per
cell of the battery The depth of charge is assumed to be 65 for a normal
working battery as described previously In chapter 3 the SOC and the DOC are
defined as )0(1 θCQSOC eminus= (Eq 44) and )(1 θavge ICQDOC minus= (Eq
45) The Capacity is also defined as equation 42
k
c
fc
IIK
CK
IC))(1(1
)1(
)(
0
minusminusminusminus++++
++++
====
ε
θ
θ
θ (61)
in which Kc = 118 k = 120 and 6 II avg times= in this project The relationship
between the actual capacity under discharge current Iavg and the nominal capacity
is
100
62
1
))(1(1
1
)0)(1(1
1
))(1(1
1
)0(
)(asymp
minus+=
minus+
minus+=
k
avgck
c
k
avgcavg
IIK
IK
IIK
C
IC
θ
θ (62)
Therefore the SOC when the DOC is 65 is
586))0(62(1)0(1 asympsdotminus=minus= θθ CQCQSOC ee (63)
As described in chapter 5 30 asympA therefore the internal resistance of an
individual cell can be obtained by
10001000010 43041)ln()]1(1[ RRDOCRSOCARRRrcell sdot+sdotasympminusminus+=+= (64)
and for a six-cell lead-acid battery the internal resistance
1000 582486 RRrr cellbattery sdot+sdot=times= (65)
62 The identification of C0 R00 and R10
In the eight parameters identified previously in Chapter 5 there are only three
parameters can be affected by the change of battery conditions Therefore the
other five parameters ( 2100 ττAKE Em ) can be treated as a constant for a battery
The parameters that related to the battery condition 0010 RR and 0C are the key
problems which the project focused on 0C represents the state of health while
the 0010 RR stands for the internal resistance parameters Here again the Genetic
algorithm is adopted to identify these three parameters
In this project the battery have been discharged and charged in hundreds of cycles
to simulate the capacity loss in the normal applications which is described by the
101
state of health in this project In order to find out the different behaviour of
internal resistance in different state of health experimental tests have been carried
out in different state of health of the battery
The first test is carried out when the battery is brand new and the data is also used
to identify the other parameters of the battery model as described in the previous
chapter The second group of data is collected after 300 discharge cycles
approximately and the third test took place after 200 more cycles The number of
discharge cycles between the last four tests is only about 50 because the change of
State of Health is more significant The identified parameters of a battery in
different state of health are shown in table 6-1
Table 6-1 Battery Remaining Capacity and Internal Resistance
Remaining
Capacity C0 (Amps)
SOH R00 R10 RelError Internal
Resistance (Ohm)
Test 1 48198 100 00609 00220 01756 05683
Test 2 44861 9314 00654 00103 07428 05759
Test 3 38025 7889 00635 00191 02812 05827
Test 4 33830 7019 00573 00509 07265 06126
Test 5 30625 6354 00604 00582 04340 06575
Test 6 26072 5306 00703 00368 01342 06855
And the terminal voltages simulated and measured are shown as the following
figures The same as previous figures the blue lines represent the measured
outputs while the red lines represent the simulation results
The test shows in figure 6-1 the same as the test which is used to describe the
genetic algorithms and the battery parameter identification in chapter 5 Detailed
102
description and analysis are given in chapter 5
0 500 1000 1500 2000 2500 3000 350011
112
114
116
118
12
122
124
126
128
13
Time (s)
Term
inal voltage (
V)
Experimental Terminal Voltage
Simulated Terminal Voltage
Experimental Terminal Voltage
Simulated Terminal Voltage
Figure 6-1 Experimental and Simulated Terminal Voltage of Test 1 (SOH = 100)
103
0 1000 2000 3000 4000 5000 600011
112
114
116
118
12
122
124
126
128
13
Time (s)
Term
inal V
oltage (
V)
Simulated Terminal Voltage
Experimental Terminal Voltage
Simulated Terminal Voltage
Experimental Terminal Voltage
Figure 6-2 Experimental and Simulated Terminal Voltage of Test2 (SOH= 9314)
The experiment shown in figure 6-2 is tested several months after the first
experimental test In the period that the first discharge begins the experimental
result shows a different slope in terminal voltage The reason is probably that the
battery have just charged to full by a charger and itrsquos the capacitor had not fully
discharged After that when the discharge stopped there is a deviation in the
simulation voltage In the authorrsquos opinion that is because of the accuracy of R10
and R00 If the value of R10 is greater and that of R00 is smaller the simulation
result should fit the experimental result In the second discharge period of the
discharge test there is also a little difference in the experimental and simulation
result caused by the inaccuracy of battery parameters But it shows a good
agreement when the discharge stopped
104
0 500 1000 1500 2000 2500 3000 3500 400011
112
114
116
118
12
122
124
126
128
13
Time (s)
Term
inal V
oltage (
V)
Simulated Terminal Voltage
Experimental Terminal Voltage
Simulated Terminal Voltage
Experimental Terminal Voltage
Figure 6-3 Experimental and Simulated Terminal Voltage of Test3 (SOH= 7889)
0 500 1000 1500 2000 2500 3000 3500 4000 4500 500011
112
114
116
118
12
122
124
126
128
13
Time (s)
Term
inal V
oltage (
V)
Simulated Terminal Voltage
Experimental Terminal Voltage
Simulated Terminal Voltage
Experimental Terminal Voltage
Figure 6-4 Experimental and Simulated Terminal Voltage of Test4 (SOH= 7019)
105
0 1000 2000 3000 4000 5000 600011
112
114
116
118
12
122
124
126
128
13
Time (s)
Term
inal V
oltage (
V)
Experimental Terminal Voltage
Simulated Terminal Voltage
Simulated Terminal Voltage
Experimental Terminal Voltage
Figure 6-5 Experimental and Simulated Terminal Voltage of Test5 (SOH= 6354)
Figure 6-3 figure 6-4 and figure 6-5 show the test results of the battery when the
SOH drops to its 80 70 and 60 It is shown that the simulation result in
figure 6-3 fits the experimental result until the end of test when the discharge of
battery has just stopped The inaccuracy of the R10 and R00 is also the main cause
of the deviation The overall simulation result in figure 6-4 figure 6-5 are good to
express the battery behaviour
106
0 500 1000 1500 2000 2500 3000 3500 400011
112
114
116
118
12
122
124
126
128
13
Time (s)
Term
inal V
oltage (
V)
Experimental Terminal Voltage
Simulated Terminal Voltage
Experimental Terminal Voltage
Simulated Terminal Voltage
Figure 6-6 Experimental and Simulated Terminal Voltage of Test6 (SOH= 5306)
In the parameter identification of test shown in figure 6-6 the remaining capacity
is only about 12 of the initial capacity when the battery is brand new During the
discharge period the simulation and experimental result is not fitting very well
and the slopes of them are not the same This is probably also caused by
insufficient idle time after being charged and the capacitor had not fully
discharged
Figure 6-7 represents the internal resistance value in different state of health as
described in table 6-1
107
100 95 90 85 80 75 70 65 60 55 5004
045
05
055
06
065
07
075
08
State of Health
Inte
rnal R
esis
tance (
Ohm
)
r vs SOH
Approximation
Figure 6-7 Change of Internal Resistance in Different State of Health (Battery 1)
It is shown that the internal resistance is increasing when the state of health of a
lead-acid battery decreases This progress is at first very slow when the battery is
new But after a number of discharge cycles the remaining capacity of battery
drops to about 75 of the initial capacity when the battery is new and the
increase of internal resistance become faster When the state of health is brought
down to about 50 which means that the battery cannot offer enough energy as
new the value of internal resistance is increased by 30 approximately At
present there is not a published quantitative description of the internal resistance
when the capacity changes yet but it has been agreed that the internal resistance
increases while the battery health deteriorates
Similar tests have been carried out on 5 other batteries with the same nominal
108
capacity and the changes of their internal resistances are given as figure 6-8 It is
not possible to deduce a statistical approximation equation only based on the
existing data but it can be seen from the figure that the performance of internal
resistance under different state of health shows an agreement in a certain extent
100 95 90 85 80 75 70 65 60 55 5003
04
05
06
07
08
09
State of Health
Inte
rnal R
esis
tance (
Ohm
)
r vs SOH (Battery 1)
r vs SOH (Battery 2)
r vs SOH (Battery 3)
r vs SOH (Battery 4)
r vs SOH (Battery 5)
r vs SOH (Battery 6)
Figure 6-8 Change of Internal Resistance in all 6 Batteries
63 Summary and Discussions
The determination of battery remaining capacity accurately is becoming
increasingly important in modern battery managements This currently is mostly
obtained by integrating the discharge current of a full discharge but this progress
usually causes a negative effect on most of the batteries There is also a view that
109
the state of health which represents the percentage of remaining capacity of a
weak battery compared with the initial capacity when brand new can affect the
internal resistance therefore the battery state of health can be obtained by the
study of battery internal resistance However from the analysis based on the
mathematical model and the experimental results it can be concluded that other
parameters can also cause variations of the internal resistance which make the
estimation of the state of health more challenging
This chapter describes a new alternative method that based on the Improved
Battery Model and the key parameters of the model The remaining maximum
capacity of a used battery which represents the SOH of the battery is related in
the internal resistance under the depth of charge of 65 which is expressed by
the parameters of R00 and R10 These parameters can be identified by genetic
algorithms A result that quantifies the change of internal resistance in different
SOH values has been concluded based on the analysis of a series of experimental
tests
110
Chapter 7
Conclusions and Future
Research
This chapter summarizes the major achievements of the presented research work
in the field of battery modelling and state of health analysis Possible direction of
further research work is also described briefly in this chapter
71 Summary
Lead-acid batteries are used in various industrial sectors and are irreplaceable due
to their low price In areas where lead-acid batteries are employed as an energy
storage device the capacity loss caused by the repeated dischargecharge cycles is
very common This drop of capacity can neither be avoided nor be repaired by
using current technologies As a result it is essential to know whether the battery
is able to meet the demand and if it should be replaced on time
In this thesis a study on the capacity status of a battery and its relation to the
internal resistance had been conducted and this thesis established a novel model
based method to quantify the battery health An Equivalent Circuit Mathematical
model for the discharging progress of a lead-acid battery has been developed for
this purpose and is implemented under MatlabSIMULINK software environment
111
The model involves most of the important concepts of a battery to reflect the
dynamic response of terminal voltage when discharging
A series of experimental tests have been carried out during the project for the
model validation and the study of the state of health Six 12V-13Ah lead-acid
batteries with the same rated capacity are discharged and recharged from brand
new to obtain different values of state of health Genetic algorithm has been
employed to identify the unknown parameters of the battery model in each state of
health and the identified parameters are used as the factors that reflecting the state
of health and the internal resistance The internal resistances corresponding
different state of health have been collected and recorded A result was found in
the thesis that for the 12V-13Ah lead-acid battery which is used in the
experimental tests the value of internal resistance is increased by 25
approximately if the SOH of battery drops to 50
72 Limitations
The key limitation of the method introduced in this thesis is that it is based on the
parameter identifications of the model which means a test is still needed in order
to obtain the state of health The major reason is that the mathematical model does
not include the charging progress of battery which is also an important period of
the battery duty cycle Another limitation is that all the tests of the state of health
estimation are carried out at the same discharge rate because of the variation of
the internal resistance in different discharge rate as discussed in chapter 4 Finally
112
The lsquocoup de fouetrsquo behaviour that of took place at the beginning of discharge
when batteries are full is not able to be simulated in the current version of
mathematical model
73 Future Research Work
Following the limitations of the project some future research can be carried out in
three steps based on the model improvements and the practical applications of the
algorithm
First of all improvements of the discharging battery model can be carried out
which can mainly focus on the study of the battery internal resistance in different
discharge rates Equations of internal resistances that can withstand the change of
discharge rate will make the model capable for online applications Studies on the
relationship between the electromotive force and the state of charge can also lead
to a solution of the lsquocoup de fouetrsquo behaviour and a better simulation result
Another research work on the model modification is that the behaviour of battery
to the mathematical model when a battery is being charged can be involved by
which the monitoring system of battery can be implemented in the whole duty
cycles This part of work can be focused on the parasitic branch in the
mathematical model described in chapter 3
Further work should also reveal the variations of state of health in different duty
113
cycles and an algorithm based on this change should be designed to estimate the
remaining life-time of a lead-acid battery The value of current state of health and
the estimated raining life-time should also be considered as major outputs in this
period of work It is also possible to design an online management device of
battery to estimate the life-time and the state of health
114
References
Anon (2006) Global Wind Energy Council (GWEC) statistics [online] from
httpwwwgwecnetuploadsmedia07-
02_PR_Global_Statistics_2006pdf
Anon (2007) Battery Types Flooded versus AGM and Gel [online]
Retrieved February 13 2007 from
httpwwwvonwentzelnetBattery01Type
Anon (2007) BP Statistical Review of World Energy June 2007 [online] from
httpwwwbpcomliveassetsbp_internetglobalbpglobalbp_uk_englishr
eports_and_publicationsstatistical_energy_review_2007STAGINGlocal_
assetsdownloadsspreadsheetsstatistical_review_full_report_workbook_2
007xls
Anon (2007) International Energy Outlook 2007 [online] from
httpwwweiadoegovoiafieohighlightshtml
Ball R J Evans R and Stevens R (2002) Finite element (FE) modelling of
current density on the valve regulated leadacid battery positive grid
Journal of Power Sources 103(2) 213-222
Bernardes A M Espinosa D C R and Tenoacuterio J A S (2004) Recycling of
batteries a review of current processes and technologies Journal of
Power Sources 130(1-2) 291-298
Berndt D (1993) Maintenance-Free Batteries -- A Handbook of Battery
Technology Somerset Research Studies Press Ltd
Berndt D (2001) Valve-regulated lead-acid batteries Journal of Power
Sources 100(1-2) 29-46
115
Berndt D (2009) Electrochemical Energy Storage Battery Technology
Handbook CRC Press
Casacca M A and Salameh Z M (1992) Determination of lead-acid battery
capacity via mathematical modeling techniques Energy Conversion
IEEE Transaction on 7(3) 442-446
Ceraolo M (2000) New dynamical models of lead-acid batteries Ieee
Transactions on Power Systems 15(4) 1184-1190
Chan H L and Sutanto D (2000) A new battery model for use with Battery
Energy Storage Systems and Electric Vehicles Power Systems 2000 Ieee
Power Engineering Society Winter Meeting - Vols 1-4 Conference
Proceedings 470-475
Chen M and Rincacuteon-Mora G A (2006) Accurate electrical battery model
capable of predicting runtime and I-V performance IEEE
TRANSACTIONS ON ENERGY CONVERSION VOL 21( NO 2)
504-511
Chipperfield A J Fleming P J and Fonseca C M (1994A) Genetic algorithm
tools for control systems engineering Adaptive computing in
engineering design and control Plymouth UK
Chipperfield A J Fleming P J Pohlherim H and Fonseca C M (1994B)
Genetic algorithm toolbox for use with Matlab Department of automatic
control and systems engineering University of Sheffield
Crompton T R (2000) Battery Reference Book Third Edition Oxford
Elsevier Newnes
Cun J P Fiorina J N Fraisse M Mabboux H A and Mabboux H The
116
experience of a UPS company in advanced battery monitoring
Telecommunications Energy Conference 1996 INTELEC 96 18th
International 646 - 653
Durr M Cruden A Gair S and McDonald J R (2006) Dynamic model of a
lead acid battery for use in a domestic fuel cell system Journal of Power
Sources 161(2) 1400-1411
Esfahanian V Torabi F and Mosahebi (2008) An innovative computational
algorithm for simulation of lead-acid batteries Journal of Power
Sources 176(1) 373-380
Gillioli R and Cerolo P (1990) Charge and discharge fourth order dynamic
model of the lead battery 10th
intl Electric Vehicle Symposium Hong
Kong p1-9
Glendenning I (1981) Compressed air storage Physics in Technology 12(3)
103-10
GONG Q (2005) Modeling study of a vehicle traction battery model
CHINESE LABAT MAN 2005 Vol 42 Numb 2 issu 155 pages 76-79
Houck C Joines J and Kay M (1995) A Genetic Algorithm for Function
Optimization A Matlab Implementation NCSU-IE TR 95-09
Jacobi W (2009) Lithium Batteries Battery Technology Handbook CRC Press
Jayne M G and Morgan C (1986) a new mathematical model of lead acid
battery for electric vehicles Eighth Intl electric vehicle conference
Washington DC
Juvonen M (2003) Large-Scale Energy Storage Systems [online] from
httpwwwdocicacuk~mattiise2grpenergystorage_reportstoragehtml
117
Lee J H Lee K Y and Lee J Y (1996) Self-discharge behaviour of sealed
Ni-MH batteries using MmNi33+xCo07Al10-x anodes Journal of
Alloys and Compounds 232(1-2) 197-203
Liaw B Y Gu W B and Wang C Y (1997) Numerical simulation of coupled
electrochemical and transport processes in battery systems Proceedings
of the Intersociety Energy Conversion Engineering Conference
Honolulu HI USA IEEE
Lu S Meegahawatte D H Guo S Hillmansen S Roberts C and Goodman
C J (2008) Analysis of energy storage devices in hybrid railway vehicles
Railway Engineering - Challenges for Railway Transportation in
Information Age 2008 ICRE 2008 International Conference on
Mantell C L (1984) Batteries and energy systems Second Edition McGraw-
Hill Inc
MathWorks Inc (2004) Genetic Algorithm Direct Search Toolbox V102
MathWorksInc
MPowerSolutionsLtd (nd) Alternative Energy Storage Methods [online]
from httpwwwmpowerukcom
Okoshi T Yamada K Hirasawa T and Emori A (2006) Battery condition
monitoring (BCM) technologies about lead-acid batteries Journal of
Power Sources 158(2) 874-878
Perrin M Delaille A Huet F and Hernout L (2006) Study of the coup de
fouet of lead-acid cells as a function of their state-of-charge and state-of-
health Journal of Power Sources 158(2) 1019-28
Pham D T and Karaboga D (1998) Intelligent Optimisation Techniques
118
Genetic Algorithms Tabu Search Simulated Annealing and Neural
Networks New York Springer-Verlag New York Inc
RailPower Hybrid Technologies C (nd) Benifits of Hybrid Locomotives
[online] from httpwwwrailpowercomproducts_hl_benefitshtml
Rand D A J Moseley P T and Garche J (2004) Valve-Regulated Lead-Acid
Batteries Elsevier
Ruetschi P (2004) Aging mechanisms and service life of lead-acid batteries
Journal of Power Sources 127 (1-2) 33-44 Switzerland Elsevier
Salameh Z M Casacca M A and Lynch W A (1992) A mathematical model
for lead-acid batteries IEEE Trans on Energy conversion Vol7 No 1
Sato Y Takeuchi S and Kobayakawa K (2001) Cause of the memory effect
observed in alkaline secondary batteries using nickel electrode Journal
of Power Sources 93(1-2) 20-24
Sims R I Carnes J C Dzieciuch M A and Fenton J E (1990) Computer
modeling of Automotive lead acid batteries Ford Research Laboratories
Technical Report
Smil V (2007) Energy at the Crossroads Massachusetts Achorn Graphic
Services Inc
Ter-Gazarian A (1994) Energy storage for power systems London Peter
Peregrinus Ltd
TNI_Ltd (2007) Battery history [online] from
httpwwweuropulsecombattery_historybattery_historyhtm
Tuck C D S (1991) Modern Battery Technology Ellis Horwood Ltd
Wei J (2007) Development of Coal Mill and Aggregate Load Area Models in
119
Power Systems using Genetic Algorithms University of Liverpool PhD
Wikipedia (nd) Lead-Acid Battery [online] from
httpenwikipediaorgwikiLead-acid
Wikipedia (nd) Rechargeable Batteries [online] from
httpenwikipediaorgwikiRechargeable_battery
Wikipedia (nd) VRLA [online] from httpenwikipediaorgwikiVRLA
Zhang Y L Liu P H Zhang Q Y and Cheng W (2010) Separation of
cadmium(ii) from spent nickelcadmium battery by emulsion liquid
membrane Canadian Journal of Chemical Engineering 88(1) 95-100
120
Appendix I SIMULINK Diagrams of Battery Model
Figure A-1 SIMULINK Diagrams of ldquoMain Blockrdquo
121
Figure A-2 SIMULINK Diagrams of ldquoTerminal Voltage Calculationrdquo
122
Figure A-3 SIMULINK Diagrams of ldquoThermal Behaviourrdquo
123
Figure A-4 SIMULINK Diagrams of ldquoBattery Capacityrdquo
Figure A-5 SIMULINK Diagrams of ldquoBattery State of Chargerdquo
Figure A-6 SIMULINK Diagrams of ldquoBattery Depth of Chargerdquo
124
Figure A-7 SIMULINK Diagrams of ldquoBattery Electromotive Forcerdquo
(a)
(b)
Figure A-8 SIMULINK Diagrams of ldquoBattery Internal Resistancerdquo
125
Appendix II
List of Publications
S Hillmansen S Lu D H Meegahawatte S Guo C Roberts and C J
Goodman Analysis of Energy Storage Devices in Hybrid Railway Vehicles International Conference on Railway Engineering 2008 p68-73 Hong Kong China 25-28 March 2008
Y Yin X Luo S Guo Z Zhou J Wang A battery charging control strategy for
renewable energy generation systems The Proceedings of World Congress on Engineering 2008 Vol 1 pp356-361 London UK 2-4 July 2008
S Guo S Hillmansen Y Yin J Wang State of Health Monitoring of Lead-acid
Batteries Proceedings of the 14th International Conference on Automation amp Computing pp250-254 Brunel University West London UK 6 September 2008
Y Yin C Li Z Zhou Q Liu S Guo X Luo J Wang Design and Realization of a
PS2 Keyboard Interface in Embedded system Proceedings of the 14th International Conference on Automation amp Computing pp160-163 Brunel University West London UK 6 September 2008
Yin Y Wang J Luo X Guo S Development of a battery charging management
unit for renewable power generation a book chapter in Advances in
Electrical Engineering and Computational Science Edited by Sio-Long Ao and Len Gelman pp33-46 Springer 2009
Wang J Wei JL Guo S Condition monitoring of power plant milling process
using intelligent optimization and model based techniques accepted as a chapter in the book of Fault Detection in March 2009
S Guo S Hillmansen J Wang Model Based Analysis of Battery State of Health
using Genetic Algorithms accepted by the International Conference on Systems Engineering (ICSE) Coventry 8-10 September 2009
10
Figure 5-4 GA performance (Rastrigrinrsquos function) 85
Figure 5-5 2-dimensional Rosenbrock function 86
Figure 5-6 GA performance (Rosenbrock function) 87
Figure 5-7 Progress of Parameter Identification 88
Figure 5-8 Measured and Simulated Result after Parameter Identification 91
Figure 5-9 Mean and the Best Fitness Values in Each Generation 92
Figure 5-10 Measured and Simulated Terminal Voltage 93
Figure 5-11 Measured and Simulated Terminal Voltage 94
Figure 6-1 Experimental and Simulated Terminal Voltage of Test 1 (SOH = 100)
102
Figure 6-2 Experimental and Simulated Terminal Voltage of Test 2 (SOH=9314)
103
Figure 6-3 Experimental and Simulated Terminal Voltage of Test 3 (SOH=7889)
104
Figure 6-4 Experimental and Simulated Terminal Voltage of Test 4 (SOH=7019)
104
Figure 6-5 Experimental and Simulated Terminal Voltage of Test 5 (SOH=6354)
105
Figure 6-6 Experimental and Simulated Terminal Voltage of Test 6 (SOH=5306)
106
Figure 6-7 Change of Internal Resistance in Different State of Health (Battery 1)
107
Figure 6-8 Change of Internal Resistance in all 6 Batteries 108
1
Chapter 1
Background and Objectives of
the Project
11 Overview
Fossil fuels have been the main energy resource in recent human history although
their continuing use has been shown to have a detrimental effect on the
environment The principal problem for fossil fuels is that they cannot be
reproduced within a short period of time so it is a finite energy supply source If
current consumption rate continues they will be exhausted in a few generations
from now Fossil fuel has never been considered as a clean-resource because there
is an emission of noxious gasses including CO CO2 NOx SOx and HC into the
atmosphere With all the pressure from the problems associated with the fossil
fuel exploration of the usage of renewable energy is becoming an increasingly
important issue
Wind energy hydro energy and solar energy are three of the most important
renewable energy sources and they have been implemented on a large scale wind
energy has produced a annual global total of 65019 times 1012 Wmiddoth
(74223 MWtimes24htimes365 days) (Anon 2006) energy in the year 2006 and hydro
2
energy is about 304 times 1015 Wmiddoth (30404 times 1012 Wmiddoth) (Anon 2007) Solar energy
resources are estimated at about 10694times1015 Wmiddoth (3850times1021 J) (Smil 2007) To
compare with the worldwide energy consumption of 13097times1015 Wmiddoth in the year
2007 it is clear that renewable energies have a significant role to play (Anon
2007)
However the problem of the implementation of the renewable energy is that the
electricity generated is intermittent and the power systems are experiencing the
problem of rapidly changing power demand Therefore the management of the
energy is an important issue Devices of energy storage should solve these
problems in theory
12 Review of Energy Storage Systems
Not only giving a large scale energy solution energy storage devices are also
commonly used in a range of applications related to everybody Different energy
storage technologies are suited to different applications and consideration must be
made in order to select the correct solution for each application This section will
give an overview of the existing energy storage systems
121 Applications of the Energy Storage Systems
Large scale energy storage systems which are also called grid energy storage
refer to the methods used to large-scale store electricity within an electrical power
grid Off-peak energy is stored during times when production (from power plants)
3
exceeds consumption and the stores are utilized at times when consumption
exceeds production In this way electricity production need not be drastically
scaled up and down to meet momentary consumption ndash instead production is
maintained at a more constant level
Despite the applications in grid scale the energy storage systems are also popular
in a number of areas For example they are usually used to optimize the energy
generated from the engine in modern electrical hybrid vehicles One such
application is in a shunter locomotive A shunter is a small railroad locomotive
intended for assembling trains ready for a road locomotive to take over
disassembling a train that has been brought in and switching a train to another rail
at the rail terminals The duty cycle of a shunter is characterised by short duration
high power demands (accelerating a rake of vehicles) and the long periods of
idling while the train waits for other operations Comparing to traditional shunter
locomotive that use diesel engines only for the whole duty cycle hybrid shunter
locomotives with energy storage devices can have a 40-70 reduction in fuel use
(RailPower Hybrid Technologies nd) This saving is made by operating the prime
mover at its optimum
Another application of energy storage in the vehicle technologies is the
regenerative braking system which is used to save the braking energy of vehicle
The potential of this technology to save energy for a vehicle is depends on the
duty cycle (Lu Meegahawatte et al 2008) which is characterized by storing the
energy generated when the vehicle is decelerating and releasing when accelerating
4
Energy storage devices are also very popular in stationary applications also
known as the Uninterruptible Power Supply (UPS) systems This system is
designed to meet the power demand when problems like power failure happen and
it is important especially in the applications where power failures could have
serious consequences for example in hospitals and computer centres (Berndt
2009)
The energy storage devices in the UPS system are often used to achieve
ldquouninterruptiblerdquo in a short period before the secondary power supply started
When a power problem occurs the energy storage device starts to supply
electricity immediately and at the same time the generator begins to start When
the generator is ready to supply sufficient power the energy storage device stops
providing power When the grid power is recovered the energy storage device can
be recharged until full
122 Review of the Existing Energy Storage Devices
There are various kinds of energy storage systems including pumped hydro
compressed air flywheel supercapacitors electrochemical and also
superconducting magnetic Each technology is suited to different applications and
careful consideration must be made in order to select the correct solution for each
application
Pumped hydro is the oldest and the most effective kind of large scale energy
storage method which have been used for nearly a century since 1929 (Juvonen
5
2003) Two large reservoirs at different altitudes with a pump a turbine a motor
and a generator are employed to collect the off-peak energy The water is released
from the higher one through a turbine to generate electricity during peak load
period
Compressed air is a pneumatic energy storage method that refers to the air kept
under a certain pressure This system can be used in grid energy storage that the
air can be stored by compressors during periods with low power demand This
compressed air can be released to a generator to meet the high power demand
during peak time (Glendenning 1981 Ter-Gazarian 1994 Juvonen 2003) In some
applications the compressed air is released through a combustor mixed with
natural gas to obtain a higher overall efficiency
A capacitor is an electrical device that can store energy in an electric field
between a pair of conductors and is often used in circuits for short term energy
storage It blocks the circuit to hold DC voltage Supercapacitors are energy
storage devices with the same principle but with a higher energy density The
power density of the supercapacitor systems can be very high but the energy is
often released in a very short duration (Ter-Gazarian 1994) As a result the
supercapacitors are usually used in applications of an energy burst
Superconducting magnetic energy storage system stores energy in the magnetic
field generated by direct current in a coil Instead of traditional wires like copper
superconductors are employed to avoid the energy consumptions as heat because
of the resistance A problem is that the optimal operating temperature for
6
superconductors is 50-77K a refrigerator is therefore necessary in the system for
cooling down
Flywheels are considered as a method of storing mechanical kinetic energy by
accelerating a flywheel to a very high speed to store the energy and decelerating
to release the energy Flywheels are very efficient for short duration storage cycles
due to their fast response speed These energy storage devices are used mainly in
applications that demand kinetic energy storage and high numbers of deep
discharge cycles
Electrochemical energy storage stands for the device capable of converting
chemical and electrical energy to each other by chemical reactions Batteries are
the most common technology of electrochemical energy storage methods The
oxidation and reduction reactions in the two electrodes of battery lead to the
current through the external circuit when discharging to provide energy The
secondary battery can be recharged by applying electrical current which reverses
the chemical reactions that occur during the discharge
Fuel cell is another technology with very high energy density that converts the
chemical energy in a source fuel into an electrical current The fuel cells are
considered as the ldquoenvironmental friendlyrdquo as the only by-product is water The
working principle of fuel cells when discharging is the same as the batteries but
unlike the batteries the fuel cells do not need recharge as they only provide
electrical energy while the active chemicals are supplied to the electrodes (Mantell
1984 MPowerSolutionsLtd nd)
7
Figure 1-shows the Ragone chart of the energy and power density of some energy
storage systems
Figure 1-1 Power density vs energy density plot (MPowerSolutionsLtd nd)
123 Review of Batteries
The preceding discussion has identified that energy storage devices are becoming
increasingly important in both stationary and mobile applications Battery as the
most popular energy storage device is studied in this section
There are two different types of batteries applied in a large range of areas now
Primary batteries and Rechargeable batteries Primary batteries which are also
called disposable batteries often have higher energy densities than the
rechargeable ones and they have a lower self-discharge (Ter-Gazarian 1994)
8
However as the chemical reactions in these batteries are not reversible and the
active materials cannot be restored to their initial forms these batteries cannot be
reliably recharged The primary batteries are intended to be used once and then
discarded therefore they are not suitable for the energy storage systems
Rechargeable battery is the other type of the electrochemical batteries which is
also known as secondary battery because their electrochemical reactions are
electrically reversible There are many different rechargeable battery technologies
in which only four of them are leading the world market nickel-cadmium nickel-
hydride lead-acid and lithium-ion (Berndt 1993 Berndt 2009)
The Nickel-cadmium (NiCd) battery is a kind of rechargeable battery that uses
nickel oxide hydroxide and metallic cadmium as electrodes and an alkaline
electrolyte (often potassium hydroxide) (Mantell 1984) As designed to compete
the primary batteries the NiCd batteries are often manufactured in the same size
and they are used in the consumer market as primary batteries for example in
clocks toys radios and cordless tools However when the NiCds are substituted
for primary cells the lower terminal voltage and smaller ampere-hour capacity
may reduce performance as compared to primary cells The most attractive feature
of the nickel-cadmium batteries is that they are more difficult to damage
comparing with other batteries during deep discharge cycles They can also
sustain more cycles and the lower internal resistance can also help achieve a
higher maximum discharge rate A problem preventing the large scale application
of this battery technology is that the nickel-cadmium batteries suffers faster self
discharge rate than other rechargeable batteries and the cadmium used as the
9
active material in one of the electrodes is toxic and expensive (Zhang Liu et al
2010) Furthermore the capacity loss caused by the continuously discharge and
recharge to the same state of charge called ldquomemory effectrdquo is also a very
important issue of the nickel-cadmium batteries (Sato Takeuchi et al 2001)
The nickel-metal hydride (NiMH) battery is a type of secondary electrochemical
battery that designed to substitute for the nickel-cadmium cells They have a
similar size and a similar cell voltage but with more advantages By using
hydrogen-absorbing alloy as negative electrode instead of cadmium this
electrochemical technology is considered as ldquoenvironmental friendlyrdquo because of
the absence of toxic cadmium (Berndt 1993) The nickel-metal hydride batteries
also have low internal resistance and the high cycle durability as the NiCds and a
NiMH battery can have two to three times the capacity of an equivalent size
nickel-cadmium battery However the nickel-metal hydride batteries also have a
similar high self-discharge rate as the nickel-cadmium batteries (Lee Lee et al
1996) and it also cannot afford complete discharges Memory effect from
repeated partial discharge can occur in a NiMH battery but this is reversible
through charge cycling (Berndt 2009)
The lead-acid batteries are the oldest type of rechargeable battery with a history of
over 150 years but they are still the most popular battery chemistry for
applications such as engine starting or backup power systems as there is no
cheaper alternative when weight is not a factor This technology uses lead and
lead dioxide as electrodes and an acid electrolyte of sulphuric acid and the
advantage of this configuration is that the electrolyte takes part in reactions of
10
both electrodes and both electrodes turn into lead sulphate when discharging
(Berndt 1993 Berndt 2009) The lead-acid batteries can be designed for not only
deep discharge cycles but high discharge rate or compromise of the two cycles
They have a lower self-discharge rate compared with the nickel batteries and they
also do not suffer from the memory effect (Mantell 1984 Berndt 2009) However
as the energy density of lead-acid battery is not high it is seldom applied in the
portable electronics Another important problem is that the lead-acid batteries
must be recycled as the active material ldquoleadrdquo is toxic to both the environment and
the human bodies (Bernardes Espinosa et al 2004)
The lithium-ion (Li-ion) batteries are almost the perfect cell chemistry and are
currently used a wide range of consumer electronics products including cameras
cell phones laptops etc They have many attractive performance advantages
which make them also ideal for higher power applications such as automotive and
standby power First of all the lithium-ion batteries have the highest energy
density in all the rechargeable battery now which is about 4 times better than
lead-acid (Jacobi 2009) They are also capable for deep discharge and high
discharge rate with a relatively slow self discharge There is no liquid electrolyte
in the lithium-ion batteries which means they are immune from leaking However
just opposite to the lead-acid batteries the most serious problem that discourages
the lithium-ion batteries is the low economic efficiency comparing with the lead-
acid batteries Other factors like the stability of the chemicals and the recycling of
lithium should also be concerned because of the chemical activeness of lithium
Table 1-1 is gives some basic properties of the four major rechargeable batteries
11
introduced above There are also some less common battery chemistries used by
rechargeable batteries in addition to these technologies including nickel-zinc
(NiZn) nickel-iron (NiFe) etc but they have a small market share For the four
major battery chemistries lead-acid batteries with their low price and high
flexibility is adopted in a wide range of application areas
Table 1-1 properties of the rechargeable batteries (Wikipedia nd)
Type Voltage
(V)
Energy Density (Whkg)
Power Density (Wkg)
Self Discharge
rate
Cycle Durability
Nickel-Cadmium
12 40-60 150 20 1500
Nickel-Metal-Hydride
12 30-80 250-1000
20 1000
Lead-Acid 21 30-40 180 3-4 500-800
Lithium-ion 36 160 1800 5-10 1000-1200
124 The Management of Batteries
In the areas that batteries are employed as the energy storage device it is a critical
issue to consider that whether there is enough energy in the battery to meet the
demand However batteries do have the problem in limited cycle durability that
is when a battery is charged and discharged for a number of cycles its total
capacity decreases If the battery cannot offer sufficient powerenergy it should be
replaced at the right time But the problem is that it is difficult to quantify the
capacity loss and when the capacity of battery is no longer sufficient for a
particular application Due to the limitation of batteries it is essential to develop a
method to determine the capacity of battery that subjected to various duty cycles
in a number of applications
12
13 Project Objectives
The main objective of the project is to develop a method which can determine the
key parameters of batteries from the discharge tests The proposed methodology is
a model based approach that is to develop a mathematical model of the battery
which can represent the dynamic performance and battery status and
characteristics can be investigated through the analysis of the model
The first step of the project is to build a mathematical model of battery The
dynamic model is expected to reflect the relevant behaviours of battery when
being discharged including the characteristics of State of Charge Depth of Charge
Electromotive force Terminal Voltage The unknown parameters in the model are
identified by using Genetic Algorithms (GAs) with the laboratory experimental
data Afterwards some batteries are tested in experiments and the parameters in
different state of health are recorded to analyze the battery in different status of
battery
The focus of this work is to develop a suitable method for parameter identification
for common battery systems The lead-acid battery has been chosen because it has
relatively well defined properties and there is a wealth of literature describing the
performance of these types of batteries From an experimental view point they are
also readily available of low cost
13
14 Outline of the thesis
The thesis is organized into seven chapters and the first chapter presents the
background and motivation of the research project The remaining chapters are
briefly described as follows
Chapter 2 gives an overview of lead-acid batteries including the development
working principle and also some modern battery designs and technologies In the
second part of chapter 2 important concepts for a battery including electromotive
force capacity state of charge internal resistance and state of health are
introduced and some mathematical descriptions of these concepts are discussed
Chapter 3 starts from some requirements of the mathematical model designed for
this project and several different methods of battery model approaches are
discussed Afterwards some details of the dynamic mathematical model are
analyzed The initial battery model is described in the last part of this chapter that
summarized the equations of the battery
Chapter 4 is mainly focused on some improvement of the mathematical model
described in chapter 3 In the first section of chapter 4 the experimental test rig in
the project is introduced Some findings in the experimental tests is then listed and
studied and integrated into the improved model Finally the SIMULINK
implementation and a simulation study are given
Chapter 5 presents a method of model parameter identification The principle of
14
Genetic Algorithms is studied at first Then this algorithm is employed in the
model and the parameters of the model are identified with the help of
experimental tests This chapter also includes the validation of battery model
using two other groups of test results
Chapter 6 develops an algorithm that can reflect the state of health of a lead-acid
battery In this chapter the internal resistance parameters are measured under
different state of health through a group of continuous experimental tests The
change of internal resistance under a specific working condition is then related to
the battery state of health
Finally Chapter 7 gives a summary and the conclusions of the project Also the
future works that can be improved are proposed in this chapter
15
Chapter 2
Introduction of Lead-acid
Batteries
This chapter gives an overview of lead-acid batteries including background
knowledge working principles explanation of terminologies technologies and
applications encountered for this technology The chapter presents the
fundamental knowledge and prepares for the project work to be reported in the
following chapters
21 A General Overview of the
Lead-acid Battery
The lead-acid battery is the oldest type of rechargeable battery The first example
of a lead-acid battery can be attributed to the German physicist Sinsteden who
published the performance data of this battery system in 1854 (Berndt 1993)
Later in 1859 the French physicist Planteacute realized that a plate construction was
required to achieve a much larger effective surface area and he produced the first
rechargeable battery which was marketed for commercial use by alternately
charging and discharging lead sheets immersed in sulphuric acid This method
has remained unchanged and still in use today in stationary applications (Berndt
16
1993 Wikipedia nd) One of the first applications of lead-acid batteries was for
storing electrical energy for telegraphy systems The capacity required for these
applications was low and the battery at that time was not yet suited to high power
industrial applications (TNI_Ltd 2007)
In 1880 a French chemical engineer Faureacute significantly improved the design of
the lead-acid battery by producing the active materials separately His method was
to coat the lead plate with a paste of lead oxides sulphuric acid and water in a
warm humid atmosphere The paste then changed into a mixture of lead sulphates
which adhered to the lead plate as an electrochemically active material As a result
of this technology the Faureacute cells are able to achieve much higher capacity with
the first charge in comparison with the Planteacute ones (Berndt 1993 TNI_Ltd 2007)
The problem of these plates is that they are not very durable and become weak
only after a few dischargecharge cycles The lead grid alloyed with antimony or
calcium was developed to improve the mechanical characteristics The holes on
the grid are able to achieve improved bonding thus the batteries may have a longer
lifetime This advantage led to the industrial manufacturing of lead-acid batteries
In 1881 a lead electrode with a ribbed surface was designed in order to have a
large effective surface of the active material and this was the pioneer of the large
surface plates which are still common today (Berndt 1993 TNI_Ltd 2007
Wikipedia nd)
In the beginning lead-acid batteries were operated in open jars The advantage of
this feature was that the electrode can be cleaned and exchanged easily but faced
the problem of water evaporation Therefore the early batteries have to refill water
17
in order to continue normal use However this problem can be dramatically
reduced when the cells were fitted with covers to limit the evaporation (Berndt
1993) This kind of battery design is known as a lsquoflooded lead-acid batteryrsquo
In the 1950s a new type of battery which was aimed to become spill-proof was
designed and manufactured on a large scale This type of battery is characterized
by an immobilized electrolyte however this kind of spill-proof battery was only
manufactured in small sizes up to about 10 Ah (Berndt 2001) Later the
combination of a valve improved the characteristic features of the lead-acid
battery and this kind of battery is still common today and is known as the Gel
Lead-acid battery (Berndt 1993) In the 1970s micron diameter glass fibres
originally designed for air filters were used in glass mats which absorbed the
electrolyte and acted as separator Soon this kind of Absorbent Glass Mat (AGM)
battery appeared in market for stationary application
Currently Valve Regulated Lead Acid (VRLA) batteries based on both AGM and
Gel electrolytes are available in a large range of capacities for both stationary and
mobile power applications with a range of different designs for each type of
application Arguably the most important application of lead-acid batteries is for
vehicle engine starting The battery employed in this application which is called
Starting Lighting and Ignition (SLI) batteries are designed to deliver bursts of
energy usually in a discharge current as large as several hundred amperes in a
very short time A different type of battery construction can produce batteries
capable of deep cycling which are more suited to slow discharge cycles (Tuck
1991 Anon 2007)
18
22 Configuration of Lead-acid Batteries
This section gives a brief description of the working principles of lead-acid
batteries and how the battery can be configured to suit different applications
221 Electrochemical Principles
The lead-acid battery comprises two electrodes and the electrolyte The structure
of the lead-acid battery is shown in Figure 2-1 in which one electrode is Cathode
and the other is Anode The active matter in the positive plate is made of lead
dioxide (PbO2) and that in the negative plate is made of lead (Pb) and the
electrolyte is sulphuric acid One electrode can serve either as a Cathode or as an
Anode depending on which process the battery is experiencing - charging or
discharging With this structure a battery could convert electrical energy into
chemical energy and back again which is associated with the process of charging
and discharging
(a) (b)
Figure 2-1 Working Principle of Lead-Acid Batteries (a) shows the battery when
19
discharging and (b) is when charging with a DC charger
For the discharging process as shown in Figure 2-1 (a) the negative plate acts as
the anode and the positive plate is the cathode If a wire is connected between the
two the excess electrons from the anode will travel through the wire as a current
to the cathode where they are needed to complete the electron deficient reaction
there The chemical reactions in a lead-acid battery when discharging are
described as follow
Negative plate reaction (Anode)
+minusminus+rarrminus+ HPbSO2eHSOPb 44
Positive Plate reaction (Cathode)
O2HPbSO2e3HHSOPbO 2442 +rarr+++minus+minus
For the charging process an external power source is connected to the two
electrodes with the voltage as shown in Figure 2-1(b) In this way the flow of
electrons is forced backwards against the electropotential and the reactions are
driven backwards changing the lead sulphate back into lead and lead dioxide on
the negative and the positive plates and restoring the sulphuric acid to the liquid
electrolyte The anode when a battery is charging is the positive plate and the
cathode is the negative plate and the chemical reactions in a lead-acid battery
when charging are described as
Positive plate reaction (Anode)
+minusminus++rarrminus+ 3HHSOPbO2eO2HPbSO 4224
Negative plate reaction (Cathode)
minusminus++rarr++ 44 HSOPb2eHPbSO
20
The thermodynamic heat effects caused by the reactions are small in the lead-acid
battery because the difference between the enthalpy and the free enthalpy is very
small The rate of reversible heat effect in the reaction is 132 kJ per mol of the
cell reaction which corresponds to about 35 of the total energy converted when
the lead-acid battery is discharging or charged This amount of energy is relatively
small and is generated over a comparatively long period of time so it is usually
easily dissipated through radiation and convection (Berndt 1993)
222 Lead-Acid Battery Types and Technologies
The flooded battery is the simplest type of lead-acid battery in use Flooded
batteries are common for some traction applications despite the requirement in
high maintenance They are also very common for large capacity backup power
supplies for telecommunication computer centres grid energy storage and off-
grid household electric power systems Since the flooded batteries are not sealed
they must be kept upright to avoid acid spills and water must be periodically
added to top up the liquid electrolyte The most attractive feature of the flooded
battery is that they are able to withstand certain level of overcharging without
damage providing proper maintenance is carried out
The Valve Regulated Lead-Acid (VRLA) battery which is often colloquially
called the sealed lead-acid battery is becoming more and more popular in many
applications Because VRLA batteries are mostly sealed the electrolyte
evaporation will be reduced and spillage can be largely avoided when
overcharging which are very common in flooded batteries The electrolyte of the
21
VRLA battery is designed to be immobilized so the VRLA batteries will not leak
if inverted pierced or if the container is broken They can be mounted in any
orientation and position even immersed in water The immobilization of the
VRLA electrolyte can be achieved by using an absorbent mat separator as well as
gelling materials
In Absorbent Glass Mat (AGM) battery the electrolyte is absorbed into a mat of
fine glass fibres in order to immobilize the electrolyte In addition the pores in the
mats are fine enough to prevent the lead dendrites in the cathode from growing
through as a separator and only glass is wetted enough by sulphuric acid can soak
the separators The glass mats can therefore be used to insulate the electrodes
Gelling is another way to immobilize the electrolyte and this gelling technology at
present is only applied for lead-acid batteries The idea is to mix the sulphuric acid
with silica fume (SO2) which makes the electrolyte gel-like The mixture is stable
over a long term environmental safe and easy to work technically (Berndt 1993)
The sulphuric acid bound by the gel can also insulate electrodes as a separator
similarly with that in an AGM battery
VRLA batteries including both gel and AGM batteries are able to recombine and
reduce the emission of gases during overcharge so the requirement for the room
ventilation is reduced and there is no acid fume emission during normal discharge
(Berndt 1993 Anon 2007 Wikipedia nd) Although the generation of hydrogen
can be slowed down it cannot be avoided completely As a result a valve
regulation safety system is employed in VRLA batteries which vents the gases in
22
the battery only during over pressure faults (Tuck 1991 Berndt 1993)
However the VRLA batteries do have some drawbacks First of all the VRLA
batteries tend to have a lower specific energy density than flooded batteries and
they are also more expensive An accurate charging control is very important for a
VRLA battery especially when charging under high temperature environments
since it is not possible to cure the damage caused by overcharge
223 Battery Designs for Different Applications
Lead-acid batteries are deployed in a range of applications Different designs are
therefore required due to the different working environments and duty cycles SLI
batteries are designed for a burst of energy for cold-cranking an engine A SLI
battery is supposed to provide power only in the first few seconds when starting
an engine and will be recharged immediately once the engine is started In this
kind of lead-acid batteries a larger surface area of the electrode plates is used to
provide high electric current in a short period However repeated deep discharge
may shorten the battery lifetime
On the other hand deep cycle batteries are designed for applications where the
batteries are regularly discharged The plates of the deep cycle batteries are often
very thick in order to withstand the frequent and deep discharge cycles The plate
surface area of a deep cycle battery is not as large as a SLI battery and as a result
it is not possible to offer great power
23
Marine batteries are a compromise between a SLI battery and a deep cycle battery
Standby batteries can be classified as marine batteries which are used for backup
power supplies and providing the power in emergency situations They are
designed for a long lifetime and a large capacity but repeated discharges and high
current drain are not the intended application Traction batteries are designed for
higher current drain and repeated deep discharge cycles They are usually bigger
and heavier than other types of lead acid for the same voltage and capacity but
that is the cost of durability
23 Mathematical Descriptions of Lead-acid
Batteries
In order to investigate the relationship between the battery behaviour and
remaining lifetime for a lead-acid battery initial studies have been carried out and
are described in this chapter Concepts including Capacity State of Charge (SOC)
Depth of Charge (DOC) State of Health (SOH) and internal resistance are
introduced and quantitative descriptions of these concepts are listed
231 Capacity
The capacity of a lead-acid battery represents how much charged energy the
battery can offer which is usually described in Ampere-hours (Ah) The charge
capacity of a battery is decided by the construction factors of a battery cell This
includes the materials contained in the electrodes and the acid solution In
addition the capacity of a battery is not a fixed quantity but varies according to
24
how quickly it is discharged This is known as Peukertrsquos law (Ceraolo 2000
Dhameja 2001 Rand Moseley et al 2004)
tICk
p = (21)
where pC is the capacity on one-ampere discharge rate which is a constant
I is the discharge current (A)
t is the time of discharge (h)
k is the Peukert constant and for a lead-acid battery with the value
between 11 and 13 (varies for each individual battery)
It is common to refer to ldquoCnrdquo as the capacity of battery in Amp-Hours which
corresponds to complete discharge of the battery in n hours ldquonrdquo is a subscript that
represents the discharge rate In industry the capacity under ten-hour discharge
rate (C10) is always taken as the nominal capacity
232 Electromotive force
The electromotive force of a battery cell is the difference between the electric
potential of the two electrodes of each cell (Rand Moseley et al 2004) The
potential of each electrode which is called half cell potential is decided by the
chemical reaction and the relative activities of the solution and can be obtained
from Nernstrsquos equation (Crompton 2000)
25
Ox
Redln0
α
α
zF
RTEE minus= (22)
where E is the half-cell potential (V)
0E is the standard half-cell potential (V)
α is the relative activity of the oxidizer (α Ox) and reducer (α Red)
z is the number of electrons transferred in the cell reaction
R is the universal gas constant which is 8314472 JKminus1molminus1
T is the absolute temperature
F is the Faraday constant the number of coulombs per mole of electrons
and F = 964853399times104 Cmolminus1
At room temperature RTF is a constant of 25693mV for cells therefore
Ox
Redlog
z
V05910
Ox
Redln
z
mV69325
Ox
Redln 10
α
α
α
α
α
α==
nF
RT
The Nernstrsquos Equation therefore can be expressed by
Ox
Redlog
V0591010
0
α
α
zEE minus= (23)
The electromotive force could be calculated by the difference of the electric
potential
cathodeanode EEEMF minus= (24)
When a lead-battery is discharging the electromotive force can be written as
26
O)(H
)(SO)(Hlog
V05910
2
2
24
10
00
α
ααminus+
+minus=z
EEEMF cathodeanode (25)
The standard half-cell potential of the anode 0
anodeE is equal to 1685 (PbO2-
PbSO4SO42-) and that of cathode
0
cathodeE is -0356 (Pb-PbSO4SO42-) which are
constants for the same battery chemistry And the number of electrons transferred
( n ) is 2 for a lead-acid battery
Therefore the electromotive force of a lead-acid cell can be obtained by
O)(H
)(SO)(HlogV029600412
O)(H
)(SO)(HlogV02960)3560(6851
2
2
24
10
2
2
24
10
α
αα
α
αα
minus+
minus+
+=
+minusminus=EMF
(26)
This electromotive force of a battery cell is numerically equal to the open circuit
voltage which means that the terminal voltage of a single cell battery when it is
disconnected from the external load For a lead-acid cell the electrochemical
force at fully charged is between 210-213V per cell
233 State of Charge and Depth of Charge
State of charge (SOC) and depth of charge (DOC) are variables that can describe
the battery charge The main difference is that the SOC describes the percentage
of remaining charge relative to the nominal capacity while the DOC represents
that relative to the actual capacity under a specific discharge current These two
27
variables can be obtained by calculating the charge consumed and the battery
capacity
101 CQSOC eminus= (27)
Ie CQDOC 1minus= (28)
where Qe is the charge consumed by the load (Ah)
C is the nominal capacity (Ah)
CI is the actual capacity under the discharge current I (Ah)
234 Internal Resistance and State of Health
The internal resistance of a lead acid cell is the physical resistance of the cell The
value of the internal resistance is decided by many different factors But it could
be obtained by a simple equation
I
VVr tOC minus
= (29)
where Voc is the open circuit voltage (V)
Vt is the terminal voltage when discharging (V)
I is the discharge current (A)
However the factors in this equation are only a method of calculating the internal
resistance but not the determinants It is shown in applications that the internal
resistance of a lead-acid battery will increase when discharging as the SOC and
28
the DOC drops
It is common for batteries to suffer a capacity loss when discharged and charged
in a number of duty cycles even when idle Aged batteries are often weak and
sometimes not able to offer enough charges Therefore they should be replaced or
maintained State of health is a defined variable that is important for a weak
battery This variable is to show how weak the battery is and represents the
percentage of remaining capacity to the initial capacity when the battery is brand
new (Okoshi Yamada et al 2006) as shown in the equation
new
weak
C
CSOH = (210)
where Cweak is the remaining capacity of a weak battery (Ah)
Cnew is the capacity when the battery is brand new (Ah)
The reason for the capacity loss is complex but is usually due to the sulphation
Sulphation is a process when the amorphous lead sulphate which is easily
converted back to lead lead oxide and sulphuric acid converts to a stable
crystalline form coating the electrodes This form of lead sulphate cannot conduct
electricity and cannot be converted back to lead lead dioxide and lead sulphate
under normal charging conditions The internal resistance of a lead-acid battery
therefore increases and less charge can be provided when discharging Complete
or repeated deep discharges of a battery at low current densities that lead
excessive utilization of the active material are the most critical reason for
29
capacity loss for example a discharge of a traction battery that draws more than
80 of its nominal capacity (Berndt 1993)
235 Multi-Cell Lead-Acid Batteries
In most applications of batteries the voltage of an individual cell is not enough to
provide the sufficient voltage and power supply The solution is usually to series
connect a number of cells in a battery in order to achieve a higher battery voltage
The electromotive force of a series of lead-acid battery cells is directly related to
the cell numbers as well as the charge state of each cell For a six-cell lead-acid
battery which is a standard for most common usages the fully charged
electromotive force is about 128V The internal resistance of a multi cell battery
however is also equal to the sum of the internal resistances of each cell
Usually all the cells in a multi-cell battery should be constructed in the same
manner and in particular the capacity should be consistent because the capacity of
a multi-cell battery will be limited to the cell with the lowest capacity If one of
the cells fails it is not possible for the current to flow through the cell and the
battery is therefore disconnected from its internal cell loss Also if the SOC of one
particular cell drops faster than others in a battery the electromotive force of that
cell may affect the whole behaviour of the battery
24 Summary
The technology development of lead-acid batteries has been continuous over the
30
last 150 years From the earliest open cell batteries different advanced battery
configurations are now available which have been adopted in a wide range of
applications Meanwhile a number of solutions have been developed to address
the battery problems encountered in applications such as electrolyte evaporation
spillage and the electrolysis of electrolyte when charging However there are still
issues affecting the efficient and safe use of lead-acid batteries for example
determination of the SOH which if addressed in a robust manner would lead to
significant improved battery management system performance This chapter has
presented the essential fundamental knowledge technology terms and working
principles of lead-acid batteries which is served as a preparation for further study
reported in the following chapters of the thesis
In order to reveal the dynamic behaviour of a battery under different SOH and
identify the suitable strategy for SOH determination the mathematical modelling
study is carried out and an equivalent circuit model is derived in the next chapter
The key concepts of the battery model are explained and the fundamental analysis
is given for the concepts introduced
31
Chapter 3
Equivalent Circuit Modelling
of Lead-acid Batteries
In order to estimate the status of a battery a model based approach is adopted in
the project A mathematical model for lead-acid batteries should be developed
with a suitable level of abstraction This chapter describes the requirements to the
model to serve the project objectives and reviews the available model
technologies An improved mathematical model for lead-acid batteries is
introduced in the late part of this chapter
31 Requirements for the Battery Model
The main objective of the project is to develop an algorithm that can determine
the battery health by monitoring the battery status during discharge cycles This
algorithm is designed for implementation in a battery health monitoring system
with life-time prediction capabilities This prediction system is intended to work
on applications where the battery performance is of great importance for instance
hospital UPS systems and vehicle ignition systems To achieve the objective the
requirements to the mathematical model can be defined as
Requirement 1 The model should be able to calculate the evolution of key
battery parameters including terminal voltage cell temperature the state of health
32
and the internal resistance which describe the condition of the battery for
dynamical discharging It should also be able to adequately represent dynamic
processes while the battery is discharging
Requirement 2 The complexity of the model must be sufficient to satisfy the
requirement 1 but must also be executable in real-time for a model-based
condition monitoring system
Requirement 3 The output of the battery model should be understandable to the
battery operators and technicians as well as meaningful to those who do not have
any background in battery technologies
32 Overview of Battery Model Techniques
A number of different types of battery models have been used to serve as a tool in
solving a range of problems (GONG 2005) These include Electrochemical
Models Computational Fluid Dynamics Models Finite Element Models and
Equivalent Circuit Models This section gives an overview to the above named
four different types of battery models and the problems which are addressed by
each of them In Section 324 every battery model technology is assessed against
the overall requirements
321 Electrochemical Model
Electrochemistry is a branch of chemistry that studies chemical reactions which
33
take place in a solution at the interface of an electron conductor (a metal or a
semiconductor) and an ionic conductor (the electrolyte) The reactions involve
electrons transfering between the electrode and the electrolyte or species in
solution The application of electrochemistry research directly leads to the
development of the lead-acid batteries
Behaviour of a battery depends not only on how the battery is used but also on a
number of construction factors (Ruetschi 2004) These factors include but are not
limited to the thickness of the plates the active mass density of the active
material the concentration of the acid solution and the geometry of the electrodes
(Berndt 2001 Ruetschi 2004)
The electrochemical model is mainly focused on the oxidationreduction reactions
between the electrolytes and the electrodes By analyzing the consistency of each
matter in the solution and the electrochemical reaction caused by the connection
of electrodes to external circuit it is possible to represent the dynamic behaviour
of the battery (Crompton 2000)
322 Physical Models
The finite element method is a numerical analysis technique for finding
approximate solutions of partial differential equations as well as of integral
equations The basic principle of the Finite Element Model (FEM) is to divide the
problem into elements and each element is a smaller problem to be solved so that
they could be analyzed separately The lsquoelementsrsquo are then be assembled together
34
to restore the initial problem
Finite element is a very popular method of analysis in those areas with a complex
geometry and it is good at stress and thermal analysis For batteries the Finite
Element Models can help with a good understanding of the heat loss and that for
vibration problem in mobile applications There are also attempts to analyze the
current density on the positive grid bar in a lead-acid battery using FEM (Ball
Evans et al 2002)
Computational Fluid Dynamics (CFD) technology is a well-established tool for
physical analysis and optimization of fluid flow mass and heat transfer and
related phenomena (eg chemical reactions) that may simultaneously take place in
a complex system (Liaw Gu et al 1997) Computers are used to perform millions
of calculations required to simulate the interactions of fluids and gases with the
complex surfaces used in engineering
In a CFD Model of a battery the dynamic governing equations are solved with
respect to time space and all the physical time and space dependent properties
Acid concentration and potential distribution across the cell for instance can be
obtained Therefore such a modelling is able to give a very good understanding to
battery parameters and detailed characteristic of battery dynamics
323 Equivalent Circuit Model
An equivalent circuit refers to the simplest form of a circuit that retains all of the
35
electrical characteristics of the original (and more complex) circuit In its most
common form an equivalent circuit is made up of linear passive elements
However more complex equivalent circuits are used to approximate nonlinear
behaviours of the original circuit as well
In electrical engineering it is often useful to use an equivalent circuit model to
describe the non-ideal operation of a device For electrical engineers electrical
models are intuitive useful and easy to handle especially when they can be used
in circuit simulators and alongside application circuits
324 Discussion of Different Battery Model Methods
The electrochemical model focuses on the electrochemical reactions and the
activities in the battery which is very popular in the applications for the
constructional and design purpose However many electrochemical factors
contained in the electrochemical model are irrelevant to the external circuit and
some of the important parameters like the internal resistance are hard to describe
in an electrochemical model Therefore this model technology is not able to meet
the project Requirement 1 As the calculations in the electrochemical model are
not complicated Requirement 2 can be therefore satisfied by an electrochemical
model of battery Requirement 3 might be difficult to obtain for an
electrochemical model because the understanding of the outputs for an
electrochemical model usually need some background knowledge of the battery
chemistry As a result the electrochemical model is not chosen for the project
36
Physical models can give good understanding to the battery important parameters
so that Requirement 1 of the project can be satisfied The Requirement 3 can be
also met as the terminal voltage can be calculated as the output with the
knowledge of these parameters One significant disadvantage is that the physical
models involves huge amount of calculation in analysis which is quite time
consuming In finite element or CFD methods a large nonlinear system of
equations is solved iteratively and that could take excessive CPU time especially
for when the system is more than 2 dimensions As a result the physical
modelling methods cannot meet the Requirement 2 of fast response required by
the project (Esfahanian Torabi et al 2008)
In an equivalent circuit model most of the characteristic required by the project
can be reached in a reasonable level It is able to reflect the dynamic behaviour of
battery using simple circuit blocks such as voltage sources resistors and
capacitors (Chen and Rincacuteon-Mora 2006) That is to say the Requirement 1 of
the project can be satisfied by the equivalent circuit model And the model
simplicity causes its low computational time as Requirement 2 and therefore it
can be suited to the online implementation (Esfahanian Torabi et al 2008)
Additionally basic battery parameters like internal resistance terminal voltage
and SOC etc can be chosen as the main output of the model to meet the
Requirement 3
Table 3-1 summarized a comparison of all the three model methods on the
satisfaction of the requirements for the project
37
Table 3-1 Satisfaction of the Requirements in different Model Methods
Requirement 1 Requirement 2 Requirement 3
Electrochemical Model times radic times
Physical Model radic times radic
Equivalent Circuit Model radic radic radic
33 Introduction of the Existing Equivalent
Circuit Models
Section 32 introduced three different types of battery models to serve for different
research purposes each with different features and strengths It has been shown
that the equivalent circuit model that pays attention to the relationship between the
internal circuit and the external characteristics can adequately meet all the
requirements of the project Therefore further studies of battery models have been
carried out and six equivalent circuit battery models with different merits and
complexity are presented while the technique improvements are briefly described
in this section
331 Simple Battery Model
The Simple Battery Model is the simplest battery model As shown in Figure 3-1
this model consists of only ideal battery mE as the electromotive force of a battery
and a resistor r in series connection as the internal resistance bV in the figure is
the terminal voltage of the battery
38
Figure 3-1 Simple Battery Model
The Em in Figure 3-1 stands for the electromotive force of the battery while r
represents the internal resistance and Vb is the Terminal Voltage This model is
only applicable in some circuits where the state of charge is of little importance
because it does not consider the varying characteristic of the internal resistance in
different states of charge The model is often used in circuits where the battery
does not have major influences to the circuit analysis But without being able to
describe the battery behaviours in details this model is not suitable for the
research purpose In the Simple Battery Model the electromotive force mE can be
obtained by open circuit measurement and r can be calculated by measurement
with connecting a load to the battery after taking an open circuit measurement
For a battery with a terminal voltage of 13V and the internal resistance of 05Ω
the change of terminal voltage in a Simple Battery Model as the discharge current
increases can be given as Figure 3-2
39
Terminal
Voltage
Discharge
Current
0
10V
13V
Figure 3-2 I-V chart of the Simple Battery Model
332 Advanced Simple Battery Model
This model is developed based on the Simple Battery Model and has the same
block diagram as the Simple Battery Model The only difference is that this model
employs a variable resistor which depends on the state of charge (CUN
FIORINA et al Durr Cruden et al 2006) The relationship between the value of
the variable resistance and the state of charge is as follow
aSOC
Rr 0
= (31)
where 0R is the resistance of the battery when it is fully charged
a is the capacity coefficient
SOC is the state of charge of battery from 0 (completely discharged) to 1
(fully charged)
6A
40
The most important improvement of this model is that instead of a constant
internal resistor the value of the internal resistance is expressed as equation
function of SOC For the same battery described in section 331 the I-V chart in
different SOCs can be concluded as shown in Figure 3-3
Terminal
Voltage
Discharge
Current
0
10V
13V
SOC=1
SOC=60
Figure 3-3 I-V Chart in different SOC
333 Thevenin Battery Model
The previous models do not account for any transient behaviour of batteries
Figure 3-4 shows the gradual change in battery characteristics when external loads
are connected or disconnected to the battery
6A
41
011
14
125
Terminal
Voltage
t
Figure 3-4 Sketch to show battery discharge behaviours in typical tests
Thevenin Battery Model is one commonly used model which consists of an ideal
battery electromotive force ( mE ) internal resistance (0R ) overvoltage resistance
(1R ) and capacitance (
1C ) and the equivalent circuit is shown in Figure 3-5
(Casacca and Salameh 1992 Salameh Casacca et al 1992 Chan and Sutanto
2000) 1C represents the actual capacitance of battery and
1R represents the
resistance contributed by the contact resistance of the plate and the electrolyte
(Durr Cruden et al 2006) The capacitance in the Thevenin Battery Model can
overcome the trend of terminal voltage shown in Figure 3-4
No load No load Load
42
Figure 3-5 Thevenin Battery Model
The main disadvantage of this Thevenin Battery Model is that all the parameter
values are assumed to be constant but in fact they are strongly dependent on the
state of charge and discharge rate and some other discharge characteristics
334 Dynamic Battery Model
This model is developed based on the Thevenin Battery Model Similar to the
improvements made by the Advanced Simple Model comparing with the Simple
Battery Model the most important difference is that it takes into account the non-
linear characteristic of the open circuit voltage and internal resistance represented
by SOCK (Jayne and Morgan 1986 Sims 1990)
ISOC
KRVV bocb )( +minus= (32)
where bV is the terminal voltage of battery
ocV is the open circuit voltage
bR is the battery terminal resistor typically 01Ω
43
K is the polarization constant
I is the discharge current
335 Fourth Order Dynamic Model
This is a more accurate and sophisticated model The current pI flows through
pR (electrolyte reaction) dR (Ohmic effect) and its associated leakage
capacitance dC and wR (waste of energy) and its associated leakage
capacitance wC Current sI flowing through the resistor sR represents the
behaviour of self discharge (Gillioli and Cerolo 1990 Chan and Sutanto 2000)
The main drawback of this model just as its name indicates is that there are
fourth order equations due to consideration of the paralleled R-C blocks in the
circuit and therefore it takes more time for the computation Another drawback is
that a number of empirical parameters are contained in the model
Figure 3-6 Fourth-order Battery Model
44
336 Improved Battery Model
The most popular Equivalent Circuit Model used by researchers is the Improved
Battery Model (Casacca and Salameh 1992 Salameh Casacca et al 1992) This
model is simple but meets most requirements for a good battery model It contains
most non-linear characteristics and is linked to the state of charge Most elements
included in this model are the functions of the state of charge or the open circuit
voltage which is also related to the state of charge The improved model is
studied in this chapter and implemented in MatlabSIMULINK environment
Figure 3-7 Improved Battery Model
34 Mathematical Model of the Lead-acid
Batteries
As the Improved Battery Model is able to reflect the major dynamic behaviours of
a battery and does not take much computation time it meets the requirements for
45
the project Therefore the mathematical model developed in this project is based
on the Improved Battery Model by involving the components of variable voltage
sources as the electromotive force ( EMF equal to the open circuit voltage OCV )
variable resistors as internal resistance and overvoltage resistance and a capacitor
as the capacitance of battery The description and the detailed analysis of the
model are given in this section
341 Capacity
Based on the Peukertrsquos law introduced in Chapter 2 the relationship of capacity
with different discharge currents is obtained below
2121
2211
)( ttII
tItIC
k
kk
p
=
== (33)
And following the definition of battery capacity the capacity is
12
1
2111
1
21121121121222 )()())(()( I
kkkk
I CIItIIItIIIIItIIItICminusminus
=====
12
1
21 )( I
k
I CIICminus
=there4 (34)
where Cp is the one ampere capacity
CI2 CI1 is the capacity under the discharge current I2 I1
k is a constant that related to the battery
The equation of calculating the capacity by the discharging current can be
46
obtained through experiments (Ceraolo 2000 Barsali and Ceraolo 2002) An
experimental result is given as
m
c
c
IIK
CKIC
))(1(1)( 0
0minus+
= (35)
where )(00 ICC = which stands for the capacity when discharging at the rated
discharge rate usually the nominal capacity C10
cK is empirical coefficient and is 118 for lead-acid batteries
m is empirical coefficient of 120
This equation overcomes the inadequacies of the Peukertrsquos law The capacity
calculated by the Peukertrsquos law in a low discharge current is much larger than that
experimentally obtained (Ceraolo 2000)
With the parameters of 20118124420 ==== kKAIAhC c the simulation
study indicated that the capacities of low discharge rate (lt30A) in different
equations are quite similar as shown in Figure 3-8
47
0 5 10 15 20 25 30 35 40 45 500
10
20
30
40
50
60
70
80
Discharge Current (A)
Actu
al C
apacity (
Ah)
Based on Peukerts law
Based on the Equation 35
Based on the Equation 35
Based on thePeukerts Law
Figure 3-8 Battery Capacity vs Discharge Current
Variations of the cell temperature also affect the battery capacity The effect of
temperature on the battery capacity is described by the following equation
(Ceraolo 2000 Barsali and Ceraolo 2002)
ε
θ
θθ
minus+=
f
ICIC 1)()( 0 (36)
where fθ is the electrolyte freezing temperature and is equal to -40˚C
θ is the cell temperature
)(0 IC is the capacity of battery under the discharge current I at 0˚C
ε is a constant that equals to 129
48
Therefore
m
c
f
c
IIK
CK
IC))(1(1
1
)(
0
minus+
+
=
ε
θ
θ
θ (37)
342 Electric Networks
Figure 3-9 (Ceraolo 2000 Barsali and Ceraolo 2002) shows an adaptation of
electric network based on the improved battery model shown in Figure 3-7 The
major change of this equivalent circuit is that the self-discharge is not taken into
account because the self discharge is usually less than 10 per month in modern
technologies which can be ignored in normal applications
Figure 3-9 Lead-acid Battery Equivalent Network
In the figure mE in this the main branch represents the electromotive force of the
battery and Vb stands for the terminal voltage The mZ in the figure stands for the
internal impedance that can be approximated by two R-C blocks
49
Battery is an energy storage device but not all the energy that the battery gets
from the charger can be stored when a battery is charged Part of this energy is
lost for different reasons like water electrolysis A parasitic branch is therefore
added to the model to represent the energy loss This part is claimed to work only
when the battery is being charged (Ceraolo 2000 Barsali and Ceraolo 2002) In
this project the current of the parasitic branch pI in the figure can be described as
an equation of the voltage of the parasitic branch PNV instead of a simple resistor
pR because of the nonlinear character of the parasitic branch This issue will be
discussed in later sections
As a result of these factors an equivalent electric network of in Figure 3-9 is
designed as shown in Figure 3-10 in which 1C 1R and 0R are the elements of the
internal impedance mZ It is used in the whole project as the electric network of
mathematical model
Figure 3-10 The Equivalent Network with the Approximated mZ
50
343 State of Charge and Depth of Discharge
In Chapter 2 Equations 27 and 28 show the definitions of SOC and DOC of a
battery In the model the nominal capacity can be treated as C(0θ) while the
actual capacity is C(Iavg θ) therefore
)0(1 θCQSOC eminus= (38)
)(1 θavge ICQDOC minus= (39)
where σσ dItQt
e int=0
)()( is the charge already drained from the battery
)0( θC is the nominal capacity of battery
)( θavgIC stands for the actual capacity under the specific discharge
current
344 Electromotive Force of the Battery
The electromotive force of a battery which is Em in Figure 3-10 is the difference
between the electric potential of the two electrodes and can be calculated by the
Nernstrsquos equation (Eq 26)
)(
)()(log029600412
2
2
24
10OH
SOHEMF
α
ααminus+
+=
This equation gives a description of the electromotive force by the activity of
different matter in the sulphuric acid which is described as lsquoαrsquo When the battery
51
is being charged or discharged the electrolyte concentration changes and the
activity value of H+ SO42- and H2O in the Nernstrsquos equation changes which can
be found by the study of battery that is the EMF of battery will change as the
result of the change of state of charge The relationship between SOC and the
activity α is unknown but it is obviously that when the state of charge increases
the quotient of )(
)()(
2
2
24
OH
SOH
α
ααminus+
also increases This shows that the EMF rises
when the state of charge is increasing
From the literatures (Ceraolo 2000 Barsali and Ceraolo 2002) the electromotive
force is described simply as the following equation
)1)(273(0 SOCKEE Emm minusminusminusminus++++minusminusminusminus==== θ (310)
where 0mE and EK are constants for a battery
θ is the temperature of the cell
SOC is the state of charge of the battery
345 Internal Resistance of a Battery
The resistances of a battery as shown in Figure 3-10 can be calculated by the
equations (Ceraolo 2000 Barsali and Ceraolo 2002)
)]1(1[ 0000 SOCARR minus+= (311)
)ln(101 DOCRR minus= (312)
52
)exp(1 22
)]1([
202
21
IIA
eRR
m
SOCA
+=
minus
(313)
where 0A 21A and 22A are constants for a battery while 00R 10R 20R are
parameters related to the SOH which will be discussed in later chapters For the
model 020 asympR and can be omitted when a battery is discharging
Therefore the internal resistance of a cell when discharging is
)ln()]1(1[ 1000010 DOCRSOCARRRr minusminus+=+= (314)
346 The Behaviour of Parasitic Branch
When the battery is being charged there are some losses as represented by the
parasitic current This current depends on the electrolyte temperature and the
voltage at the parasitic branch (Ceraolo 2000)
Because the behaviour of parasitic branch is non-linear Tafel gassing-current
relationship is used instead of a simple resistance pR (Ceraolo 2000)
minus+= )1(exp
0
0
f
p
P
PNPPNp A
V
VGVI
θ
θ (315)
where pI is the current of the parasitic branch
PNV is the voltage of the parasitic branch
53
0PG is a constant in seconds
0PV is a constant in volt
pA is a constant
θ is the electrolyte temperature
fθ is the electrolyte freezing temperature and is equal to -40˚C
When the battery is being discharged 0asymppI the parasitic branch could be
omitted from the model in simulation if the charging behaviour is not necessary
to discuss
347 Main Branch Capacitance
In the electric network of the model there is an R-C circuit as shown in Figure
3-11
Figure 3-11 R-C block
where Im is the discharge current
IC1 is the current flow through the capacity branch
54
I1 is the current of R1
VR1 is the voltage over the R-C block
This branch can be solved by
))(
()( 11111111
dt
tdVCIRIIRIRV R
mCmR minusminusminusminus====minusminusminusminus====sdotsdotsdotsdot==== (316)
)()()(
111
11 tIRtVdt
tdVCR mR
R====++++ (317)
This is the differential equation that represents the main branch behaviour
Laplace transform is employed to solve this problem
)()( 1111 sIRsVSCR mR sdotsdotsdotsdot====sdotsdotsdotsdotsdotsdotsdotsdotsdotsdotsdotsdot (318)
1
)(
11
11
++++
sdotsdotsdotsdot====
SCR
sIRV m
R (319)
++++
====++++
========
SCR
C
SCR
R
I
VsG R
11
1
11
11
1
1
1)( (320)
where τ=11CR is the time constant that represents the double layer capacitance
When the current has a shape like a step and the initial voltage of the capacitor is
equal zero the solution in time becomes
m
t
R IeRtV )1()( 11τ
minus
minus= (321)
55
It is obviously that this equation is the typical form of the voltage with an R-C
circuit
348 Thermal Behaviour of a Battery
When the battery is charging or discharging there is a current flow through the
battery so that it produces heat due to the Joules law
0
2
1
2
12 RIRVIVVIP RPNps sdot++sdot+sdot= (322)
When discharging the parasitic branch and R2 are omitted the equation becomes
0
2
1
2
1 RIRVP Rs sdot+= (323)
The dynamic equation of cell temperature and the power is (Ceraolo 2000)
s
a PRdt
dC +
minus=
θ
θ
θθθ (324)
where θC is the thermal capacitance
θR is the thermal resistance between the battery and the environment
θ is the cell temperature and aθ is the environment temperature
56
35 Mathematical Model of the Lead-acid
Batteries
Considering the behaviour of capacity state of charge and depth of discharge
electromotive force and internal resistance an Improved Battery Model based on
the equivalent circuit shown in Figure 3-10 was introduced in previous sections
The battery model for the complete discharging progress can be derived as the
following equations
m
c
f
c
IIK
CK
IC))(1(1
)1(
)(
0
minus+
+
=
ε
θ
θ
θ (325)
σσ dItQt
e int=0
)()( (326)
)0(1 θCQSOC eminusminusminusminus==== (327)
)(1 θavge ICQDOC minusminusminusminus==== (328)
)1)(273(0 SOCKEE Emm minus+minus= θ (329)
)]1(1[ 0000 SOCARR minus+= (330)
)ln(101 DOCRR minus= (331)
1
1R
Cτ
= (332)
IeRtV
t
R sdotminussdot=minus
)1()( 11τ (333)
0
2
1
2
1 RIRVP Rs sdot+= (334)
57
sa P
Rdt
dC +
minus=
θ
θ
θθθ
(335)
)( θIC in the equations is the expression of capacity of battery when discharging
under the discharge current I and at a temperature of θ 0C stands for the
capacitance when discharging at the rated discharge current I while parameters
fθ and ε are constants in this model )(tQe represents the charge already
consumed while the equation of mE indicates the mathematical description of
electromotive force corresponding to the SOC and the cell temperature in which
0mE EK are constants for a battery 00R 10R are parameters related to the SOH
and the discharge current can also affect them τ in the equations are the time
constant of the R-C circuit which represents the time it takes the systems step
response to reach ( 6311 asympminus e ) of its asymptotic value The last two equations
represent the thermal dynamic of battery in which sP is the Joule heat generated
by the internal resistance θC is the thermal capacitance and θR is the thermal
resistance between the battery and the environment
36 Summary and Discussion
The Improved Battery Model based on the electric equivalent circuit is presented
in this chapter and it is proved that it can satisfy all the three requirements to serve
the project objectives This battery model consists of a variable voltage source
several R-C blocks and a parasitic branch as its electric network and the elements
are described as a variable related to the capacitance the charge consumption and
58
the cell temperature as well
However experimental tests show that the behaviour of the battery is much more
complicated can be represented by this equivalent circuit model For example the
internal resistance varies when discharging under different current and the time
constant of the R-C circuit at the beginning and end of discharge as well
Therefore the model has to be improved The next chapter overcomes these
problems found in the experimental tests and some improvements of the model
are described
59
Chapter 4
Experimental System Set up and
Improved Battery Model
Simulation Implementation
Experimental tests based on a 12V-13 Ah lead-acid battery are carried out and the
test system is introduced at the beginning of this chapter Some of the
characteristics of the battery can be found in the tests which has shown that the
battery model described previously is not accurate enough and improvements
have to be implemented into the model This chapter will focus on the analysis of
the battery characteristics and the description of the improvements implemented
In the last part of this chapter a finalised version of the battery model used in this
project is given and implemented in the MatlabSIMULINK environment for
simulation study
41 The Experimental System
In this experimental test system a variable resistor is used as the load of the
battery Three sensors are employed in the whole experiment process two current
sensors and one voltage sensor The equivalent circuit of the test rig designed for
the research purpose is shown in Figure 4-1
60
Figure 4-1 Equivalent Circuit of the Experimental Test Rig
In this figure the ideal voltage source EMF accompanying with the internal
resistance r acts as a lead-acid battery with 6 cells (12V) the terminals of the
battery are connected in parallel to a voltage sensor Switch Krsquo is employed to
control the voltage sensor connection so that the sensor can be disconnected from
the battery when the experiment is not being in progress to avoid an unnecessary
discharge The circuit break in Figure 4-1 can be used as a main controller which
decides whether the load is engaged to the battery to discharge or not Switch K
in the experiment is to vary the load of the system This experimental test system
is mainly designed for two different experimental tests of a battery in this study
constant-impedance load discharge and two-load discharge Figure 4-2 shows the
actual laboratory test rig used in the project
61
Figure 4-2 Experimental Test Rig
The data is collected and recorded every half second by a data acquisition card
PCI-6251 from National Instruments with the software environment of LabVIEW
and a 12V-13Ah lead-acid battery (marked in the red-dashed square in Figure 4-2)
is employed in the project as test batteries for the battery performance study
42 Improvements of the Battery Model
Figure 4-3 and Figure 4-4 show the typical data collected from the experimental
test rig Figure 4-3 is the result of a constant-impedance load discharge test with a
discharge current of 075A approximately and Figure 4-4 shows two-load
discharge with the discharge currents of 075A and 12A respectively
62
0 500 1000 1500 2000 2500 3000 3500 4000 4500 5000-02
0
02
04
06
08
1
12
Time (s)
Dis
charg
e C
urr
ent
(A)
0 500 1000 1500 2000 2500 3000 3500 4000 4500 5000105
11
115
12
125
13
Time (s)
Term
inal V
oltage (
V)
Figure 4-3 Test of constant-impedance load discharge top figure shows the discharge current of the experimental test and the bottom one shows the terminal
voltage 1τ is the time parameter of the R-C block at the beginning of the
discharge and 2τ is that when the discharge stopped
0 200 400 600 800 1000 1200 1400
0
05
1
15
Time (s)
Dis
charg
e C
urr
ent
(A)
0 200 400 600 800 1000 1200 1400118
12
122
124
126
128
Time (s)
Term
inal V
oltage (
V)
Figure 4-4 Test of two-load discharge top figure shows the discharge current of the experimental test and the bottom one shows the terminal voltage
I(t)RI1 and I(t)RI2 represent the voltage drop across the internal resistance value under different discharge current
1τ 2τ
I(t)RI1
I(t)RI2
I(t)RI1
63
421 The Change of τ in Different Charge Status
From analyzing these figures it is easy to find that it takes quite a long time for
the battery to have the steady terminal voltage when the discharge of battery stops
and it is longer than the time taken from the beginning of the discharge This
difference means that when the battery starts to discharge the time parameter
11CR=τ in the main branch equation (332) is not equal to that when the
discharge has just stopped In Figure 4-3 it is shown that when the discharge stops
the time parameterτ is longer than that when the discharge starts
As a result of this experimental feature a switch is employed to implement the
change of time parameter to match those described in the mathematical model of
the battery The switch is used to control the value of the time parameter τ in
different discharge currents When the battery is discharging the discharge current
is a positive value and the time parameter τ is equal to 1τ When the battery is
not discharging the discharge current is equal to 0 in theory and the time
parameter has a different value 2τ
Although the discharge current should be equal to 0 theoretically it is hard to
achieve this in the real experimental measurement because of the inaccuracy of
the current sensor reading due to the inaccuracy occurred in the power supply to
the sensor Therefore the trigger of the switch in the model is set to be 01 A that
is when the discharge current is greater than 01 A the time parameter is set to be
1τ as the battery is in its discharging segment By contrast the value of time
64
parameter is set to be 2τ and the discharge current is considered as the error
caused by the sensors when that current is less than 01 A
422 Analysis in Variations of the Internal Resistance
Another important issue found through analyzing the experimental test result is
that the internal resistance for a specific battery in a specific state of health (SOH)
is not a constant when the discharging current changes This difference is more
significant than the effect caused by the state of charge
For example in the two-load discharge results shown in Figure 4-4 when the
battery is not discharging the initial voltage is equal to the electromotive force
(EMF1) When the battery began to discharge at the discharge current I1 the
terminal voltage dropped to V1 After the discharge stopped for a while the value
of the terminal voltage is equal to the electromotive force (EMF2) at that state of
charge (SOC2) Then the discharge of the battery starts again at a current of I2 and
the terminal voltage dropped to V2 The discharge progress is then stopped for
certain of a time period to get the steady terminal voltage (EMF3) at that state of
charge (SOC3) After that the test of discharge at the I3 = I1 was repeated again
and get another terminal voltage of V3 The last discharge test is done to provide
the evidence for the fact that this change in the internal resistance is not caused by
the change of the state of charge (SOC)
The value of electromotive force in a discharging battery is equal to the sum of the
terminal voltage and the voltage that the internal resistance takes that is
65
nnnn IrVEMF sdot+=
Therefore the internal resistance can be calculated by
n
nnn
I
VEMFr
minus= (41)
From the data collected in the experiment the key parameter values for the graphs
shown in Figure 4-4 can be found as listed in Table 4-1
Table 4-1 Approximate Internal Resistance Calculating
n 1 2 3
Electromotive Force (EMFn) 1260V 1252V 1238V
Discharge Current (In) 078A 114A 076A
Terminal Voltage (Vn) 1219V 1203V 1197V
Substituting these values into Equation 41 the internal resistance can be
calculated Ω=Ω=Ω= 539043005260 321 rrr
This change of the internal resistance can cause quite a significant effect in the
discharge progress This problem can be possibly solved in a number of ways
One possible choice is to find a curve of the internal resistance change and the
discharge current for a specific battery after a certain numbers of experimental
tests But this method needs huge efforts in conducting experimental tests and the
result is not very meaningful for the project considering the time cost Another
possibility is to conduct the experimental tests with a constant load Therefore the
change of internal resistance caused by the change of discharge current could be
ignored As a result in the whole process of this project the same load is
66
employed either in the constant-impedance load discharge or in the two-load
discharge tests
In order to implement the different internal resistance value when discharging
under different load a switch that can control the parameters R00 and R10 is
employed This switch is controlled by the discharge current which is the main
input of the mathematical model In the two-load discharge tests when the switch
K in Figure 4-1 is switched off there is only one load is connected to the battery
terminals and the discharge current is lower the values of R00 and R10 are
switched to the first set of parameters R001 and R101 To the contrast when K is
switched on the discharge current is higher and the values are switched to the
second set R002 and R102
423 Improved Lead-Acid Battery Mathematical Model
From the model described in Chapter 3 and the improvements studied in this
chapter the mathematical model of lead-acid battery when discharging in different
discharge currents can be described as the following equations
m
c
f
c
IIK
CK
IC))(1(1
)1(
)(
0
minus+
+
=
ε
θ
θ
θ (42)
ττ dItQt
e int=0
)()( (43)
)0(1 θCQSOC eminusminusminusminus==== (44)
)(1 θavge ICQDOC minusminusminusminus==== (45)
67
)1)(273(0 SOCKEE Emm minusminusminusminus++++minusminusminusminus==== θ (46)
)]1(1[ 0000 SOCARR minusminusminusminus++++==== (47)
)ln(101 DOCRR minusminusminusminus==== (48)
11
RC
τ= (49)
IeRtV
t
R sdotminussdot=minus
)1()( 11τ (410)
RIRVP Rs sdot+=2
12
1 (411)
sa P
Rdt
dC +
minus=
θ
θ
θθθ
(412)
)(
)(
2
1
002
001
00Load
Load
R
RR
= (413)
)(
)(
2
1
102
101
10Load
Load
R
RR
= (414)
)10(
)10(
2
1
AI
AI
lt
gt
=τ
ττ (415)
001R 002R 101R 202R and 1τ 2τ in the equations stand for different parameter
values of 10R 20R and τ when the load and charge status changes in order to
reflect the improvements described in this chapter For a two-load discharge test
there are ten important unknown parameters in the equations of the mathematical
model which are unknown for a specific battery 0C 0mE EK 001R 002R 101R
102R 1τ 2τ and 0A As the internal resistance R00 and R10 vary only when the
load changes they can be treated as constants in the constant-impedance load
68
discharge tests the key parameters are therefore 21100000 ττRRKEC Em
and 0A In this project the study of state of health is based on constant-impedance
load discharge The identification of these unknown parameters will be discussed
in Chapter 5
43 Simulation Study
The processes described above have been implemented in SIMULINK as a
simulation model for computer based analysis The simulation program consists of
two main function blocks circuit block and thermal block The structure of the
SIMULINK implementation is described in Figure 4-5
69
Figure 4-5 Structure of model for SIMULINK Implementation
70
As shown in the figure there are mainly two inputs in the model the discharge
current and the discharge time The actual capacity of battery can be then
calculated with the knowledge of rated capacity and the discharge current The
actual capacity is also influenced by the cell temperature At the beginning of
discharge the cell temperature is the same as the surrounding temperature
Integrating the discharge current with respect to time is the capacity consumed in
the discharge progress and then the state of charge and the depth of charge can be
obtained It is shown that the electromotive force and the internal resistance vary
as a result of changing in the state of charge and the depth of charge and the
terminal voltage can be calculated
In the thermal block of the model the heat generated by the current and the
internal resistance are calculated by the Joules law Then this energy is
transferred to calculate the thermal temperature of the cell and the cell
temperature is given back to the circuit block to affect the actual capacity
71
0 1000 2000 3000 4000 5000 6000 7000
0
02
04
06
08
1
Time (s)
Dis
charg
e C
urr
ent
(A)
0 1000 2000 3000 4000 5000 6000 7000105
11
115
12
125
13
Time (s)
Term
inal V
oltage (
V)
Figure 4-6 Terminal Voltage of Battery (Constant Discharge Current SIMULINK)
The result in Figure 4-6 shows the terminal voltage of a battery which discharges
under the current of 08A in a simulation study Since the discharge begins the
voltage drops due to the internal resistance and the change of state of charge (SOC)
and it climbs up when the discharge stops However the voltage changes
gradually because of the time parameter τ This result shows a good qualitative
agreement with the experimental test results
72
44 Summary and Discussion
This chapter introduces the laboratory test system designed for the project and the
limitation of the mathematical model described in Chapter 3 Switches on the time
parameter τ and the internal resistance parameters R00 and R10 have been added to
the model so that the model is able to represent the change of these parameters
found in the experimental tests The implementation of the model under the
MatlabSIMULINK environment is described and the simulation study shows a
good qualitative agreement with the experimental test results
The next chapter will focus on the identification of those unknown parameters of
the battery model that are important for revealing the battery characteristics
including 20100000 τARRKEC Em and 1τ
73
Chapter 5
Model Parameter Identification
and Model Validation
The identification of the unknown parameters 20100000 τARRKEC Em and 1τ
in the mathematical model will be introduced in this chapter
51 Need for the Optimization Algorithms
In those equations of the battery model described previously some parameters are
unknown and some of them are difficult to derive from physics or engineering
principles or to be obtained through experimental tests Therefore the
identification of the model unknown parameters becomes an important part for the
project Parameter identification is an optimization process that adjusts the
parameters to enable the simulation results to show the best agreement with the
results acquired by the experimental tests There are many algorithms available
for optimization and the principle of the optimization process for the project is to
minimize the objective function The objective function is formed by the absolute
value of the difference between the simulated and experimental results at each
time point The set of parameters to achieve the least value of the objective
function is considered to be the fittest set
74
There are two basic requirements of the optimization in this project First of all as
the problem for the solutions trapped to the local minima is a very important and
challenging issue in many linear optimization solvers the optimization algorithm
used in this project must be able to find the global minimum Secondly the
optimization algorithm not only should find the minimum value of the objective
function but also can tell the values of the parameters that result in the best fitness
which is needed for the analysis purpose in this project Finally the time cost is
also an important factor in selection of a suitable optimization algorithm
It needs to point that the objective here is to identify the unknown parameters of a
model with an already known structure If the objective is to identify or
approximate unknown model structures the selection of optimisation methods
will be quite different In the case of latter Neural Network Genetic
Programming and Fuzzy Logical will be more suitable choices To concentrate on
the objective of the project the thesis will focus on optimisation algorithms for
parameter identification
52 Overview of the Optimization Algorithms
Brute-force search is the most basic direct search algorithm that is used to find the
minimum value In the brute-force search the initial guess is the minimum
possibility of parameters and increasesdecreases The parameter
increasesdecreases step by step in each iteration and the best solution can be
75
searched This algorithm is the simplest but its disadvantage is also obvious that
is it is the slowest optimization method especially when used in the identification
of more than two parameters and the results are largely dependent on the initial
guesses
Linear search is an optimization method to solve the linear optimization problem
the preference function of which is linear and the feasible domain is defined by a
linear constraint function The linear constraints define a convex polyhedron
geometrically which is called the feasible region The algorithm is to construct an
admission solution at a vertex of the polyhedron and then along edges of the
polyhedron to vertices with successively higher values of the objective function
until the optimum is reached
Besides the basic optimization methods evolution computation technology is
becoming increasingly popular A range of different evolution computation
technologies can solve the optimization problem in this project including genetic
algorithms (GAs) particle swarm optimization (PSO)
Genetic Algorithms are direct search algorithms inspired from the process of
evolution in nature the natural selection Based on the principle of survival of the
fittest the GAs can produce better and better approximations to the global optimal
solution in a number of generations In each generation a new group of solutions
is created by the fitness level in the problem of every individual in the last
generation The solutions are then bred together to lead to the evolution of
individuals
76
Particle swarm optimization is a stochastic population-based computer algorithm
modelled on swarm intelligence that searches for a solution to an optimization
problem in a search space Based on the social psychological principles each
individual called lsquoparticlersquo in PSO is able to provide information to others and
also learn the success from the local best and the global best The movement of
each particle through the search space are guided by these successes and the
solution can be found after a number of generations
It has been proved by Dr Jianlin in his PhD Thesis (Wei 2007) that both Genetic
Algorithm and Particle Swarm optimization are capable of the model parameter
identification But the Particle Swarm optimization is a new algorithm that first
described in 1995 and it is not as common as Genetic Algorithm in the research
areas
The purpose of this research work is to find a method for parameter estimation
Genetic algorithms are well proven solution for complicated optimisation
problems and have been applied successfully in a range of similar problems (Wei
2007 Wei Wang et al 2007) Genetic algorithms are also well suited to problems
with many local minima In the current work the exact form of the fitness
function is unknown and it is therefore important to select a robust technique
which can identify good overall solutions For these reasons GA was selected to
give the best possible chance of satisfying the overall project objectives within the
limited timeframe of the project
77
53 The Study of the Genetic Algorithms
The process of Genetic Algorithm is reviewed in this section to provide an insight
into how GAs work and simulation study of two bench mark functions are carried
out
531 Working Principle of GAs
There are many methods used to implement a GA process and usually a GA is at
least composed of three common genetic operators Selection Crossover and
Mutation (Pham and Karaboga 1998) The flowchart of a simple GA process is
given in Figure 5-1
As a preparation to start the optimization process a GA requires a group of initial
solutions as the first generation The first generation is usually a group of
randomly produced solutions created by a random number generator The
population which is the number of individuals in a generation should be big
enough so that there could be a reasonable amount of genetic diversity in the
population Also it should be small enough for each generation to be computed in
a reasonable period of time using the computer resources available Typically a
population includes individuals between 20 and 100 (Chipperfield Fleming et al
1994A)
78
Figure 5-1 Flowchart of a Simple Genetic Algorithm (Pham and Karaboga 1998)
The fitness function is evaluated to measure how close that the individuals fit the
desired result A fitness function could be either complex or simple depending on
the optimization problem addressed In a case of minimization problem the most
fitted individuals will have the lowest numerical value of the associated fitness
function
No
Yes
Selection
Crossover
Mutation
Find the Best Individual
Generate initial population
Results
Evaluate fitness values
Operators of generating new
generation
Gengt 100
Evaluation
Start
79
Individuals are selected according to a fitness-based process The operator of
selection is made up of ranking and selection progress by which more copies of
the individuals that fit the optimization problem better will be produced in the
next generation In GAs there are mainly two ways to select a new population
Roulette Wheel Selection (RWS) and Stochastic Universal Sampling (SUS)
The individuals will be recombined (crossover) after the selection This operation
is to produce two new individuals from two existing individuals selected by the
operator of selection by cutting them at one or more position and exchanging the
parts following the cut The new individuals therefore can inherit some parts of
both parentsrsquo genetic material There are usually four ways of doing this one-
point crossover two-point crossover cycle crossover and uniform crossover
(Pham and Karaboga 1998) Figure 5-2 (a) shows an example of the two-point
crossover progress
Mutation is another operator to produce new individuals The difference is that the
new individual is produced from a single old one In this operation the bit values
of each individual are randomly reversed according to a specified property A
mutation can also helps the GA to avoid local optimums and find the global best
solution Figure 5-2 (b) represents how the mutation operator works
80
Figure 5-2 (a) Crossover operation (b) Mutation operation
The group of individuals produced after the mutation is the second generation
Then the fitness value of each individual in the second generation is computed
again This cycle will not stop until the result is close enough or after a certain
generation
Three major Matlab toolboxes are applied in the current market for application
purpose they are Genetic Algorithms Toolbox V12 (Chipperfield Fleming et al
1994B) the Genetic Algorithms Optimization Toolbox V11 (Houck Joines et al
1995) Genetic Algorithm Direct Search Toolbox V102 (MathWorks Inc 2004)
In this project the official toolbox in Matlab form Mathworks Inc is employed
The property settings for the project based on Dr Weirsquos thesis (Wei 2007) are
shown in Table 5-1
Parent 1 1 1 0 0 1 0 1 1 0 1 0 1 1
Parent 2 0 1 1 0 1 1 0 0 1 0 1 0 0
Offspring 1 1 1 0 0 1 1 0 0 1 1 0 1 1
Offspring 2 0 1 1 0 1 0 1 1 0 0 1 0 0
(a)
Parent 1 1 0 0 1 1 0 0 1 1 0 1 1
Offspring 1 1 0 0 1 0 0 0 1 1 0 1 1
(b)
81
Table 5-1 The property settings for Genetic Algorithms
Name of the GA properties Value of the GA properties
Number of generations 100
Population size 20
Fitness assignment Rank-base fitness assignment
Selection Stochastic universal sampling
Crossover Scattered crossover
Crossover rate 07
Mutation function Uniform mutation
Mutation rate 01
Population size specifies how many individuals there are in each generation With
a large population size the genetic algorithm searches the solution space more
thoroughly and the gives more possibility to return the global minimum The
number of generations specifies the maximum number of iterations for the genetic
algorithm to perform If this number is too low the genetic algorithm is not able
convergence to the global solution However either a large population size or a
large number of generations can cause the algorithm to run more slowly The
crossover rate and the mutation rate are properties that control the crossover and
mutation operator High rate of these values means that the genetic algorithm has
a higher opportunity of producing new offspring but it can be easy to miss the
current best solution if these values are too big
Initial tests of genetic algorithms on different properties show that the values
shown in table 5-1 are able to find an adequate solution Similar results would be
82
obtained if the values of the generations and the population size are larger but
costing more CPU time The crossover rate and the mutation rate would not affect
the result significantly if only varies in a small range But it is impossible to prove
that these two values are the best choice due to the strong randomness
532 Simulation Studies of Genetic Algorithms
In order to test and demonstrate that Genetic Algorithms are able to meet the
requirements of the project simulation studies have been carried out Two
benchmark functions that are commonly used in evaluating evolutionary
computation algorithms are employed for the simulation studies They are
1) Rastrigin function
Rastrigin function is a typical example of non-linear multimodal function with
many local minima The problem of looking for the global minimum is quite
difficult due to its large search space and its large number of local minima The
function is shown as
))2cos(10(10)(1
2sum=
sdotsdotminus+sdot=
n
i
ii xxnXf πr
where n is the dimension of the problem and 1x ~ nx are the coefficients to be
identified Figure 5-2 shows a 2-dimensional Rastriginrsquos function while figure 5-3
is a contour plot of Rastrigins function shows the alternating maxima and minima
83
The global minimum of the Rastriginrsquos function is 0)( =Xfr
when
021 ==== nxxx L
Figure 5-2 2-dimensional Rastrigins function (MathWorks Inc 2004)
84
Figure 5-3 Contour plot of Rastrigins function (MathWorks Inc 2004)
In the simulation study a ten dimensional Rastriginrsquos function is adopted Figure
5-4 shows the best optimization performance of the Rastriginrsquos function in each
generation It is shown that after 700 generations a global optimal value is
obtained
85
0 100 200 300 400 500 600 700 800 900 10000
10
20
30
40
50
60
70
80Best 00099429
Generation
Fitness v
alu
e
Best f itness
Figure 5-4 GA performance (Rastrigrinrsquos function)
2) Rosenbrock function
Rosenbrock function is another mathematical function used as a test problem for
optimization algorithms The global minimum is inside a long narrow parabolic
shaped flat valley To find the valley is trivial but to converge to the global
minimum is difficult The Rosenbrock function is defined by
sum=
+ minus+minus=
n
i
iii xxxXf
1
2221 ))1()(100()(
r
where n is the dimension of the problem and 1x ~ nx are the coefficients to be
identified Figure 5-5 shows a 2-dimensional Rosenbrock function
86
The global minimum of the Rosenbrock function is 0)( =Xfr
when
121 ==== nxxx L The same as the Rastriginrsquos function a ten dimensional
Rosenbrock function is adopted for the simulation study Figure 5-6 is the GA
performance to the Rosenbrock function It can be found that the optimization
converges and get the global optimal value after 300 generations
Figure 5-5 2-dimensional Rosenbrock function (MathWorks Inc 2004)
87
0 100 200 300 400 500 600 700 800 900 10000
200
400
600
800
1000
1200Best 060113
Generation
Fitness v
alu
e
Best fitness
Figure 5-6 GA performance (Rosenbrock function)
54 Model Parameter Identification
541 Implementation of Genetic Algorithms and
Experimental Data sets
In this project the Genetic Algorithm Direct Search Toolbox V102 developed by
Mathworks Inc is employed to identify the parameters of the battery model The
process is shown in Figure 5-7
88
Figure 5-7 Progress of Parameter Identification
The fitness function is used in the project and the parameter identification is to
minimize the fitness function so that the model output can fit the experimental
result The fitness function is given as
sum
sum sumsum
minussdot=
minussdot++minussdot+minussdot=
minus
1
0
2
1 1
1
0
))()(()(
)()()(
exp
expexp2exp1
t
t
sim
t
t
t
t
simnsim
t
t
sim
tVtVabstW
VVabsWVVabsWVVabsWfitnessn
n
L
where Vexp is the experimental terminal voltage data
Vsim is the simulated terminal voltage
Wt is the weights of the difference in the simulated and experimental
results
This fitness function represents the sum of the error values at each time interval
Mathematical Model of a six-cell
Lead Acid Battery
Experimental Test
Results
Fitness
Function
Discharge Current
Simulation
Output
Terminal Voltage
Simulation
Input
lt fmin
Genetic Algorithms (Selection Crossover and Mutation
etc)
Parameter Update
Yes
No
Stop
89
considered ( ntt minus0 ) The weight coefficients Wt indicates how important the
weighted part is in the optimization and how much it contribute to the
optimisation process Periods with bigger tW values are more important because
the sum of errors will give big value contribution to the fitness function value and
the optimisation process will pay more attention to the higher weighted error parts
In the experiments and optimization process it is found that the results were more
important when the discharge of a battery at the stage of stopping Therefore the
weight in this period is greater than that of the others The weighting coefficient
values in this project are determined by the results of the first several attempts of
parameter identification The period of simulation data that fails to fit the test
result means that the weight value is not big enough until the overall performance
of simulation is reasonable
Following the objective fitness function unknown coefficients of the battery
model are identified using experimental data The mathematical model of a six-
cell lead-acid battery in the figure is described in Chapter 4 and the parameters are
to be identified by Genetic Algorithms are 210100000 ττARRKEC Em
Three sets of experimental tests have been carried out for the purpose of
parameter identification and the validation of the mathematical model These three
experimental results are based on a lead-acid battery with the ideal capacity of 13
Ampere-hours under the discharge current of 08A
90
542 Parameters of Battery Model
The parameters of the mathematical model of a lead-acid battery are identified
using Genetic Algorithms and the predicted battery responses using the identified
parameters are compared with the simulated results One set of typical values of
parameters identified are listed in Table 5-2
Table 5-2 Identified parameters identified by the Genetic
Algorithms in the model of 12V-13Ah lead-acid battery Parameter Value Parameter Value
0C 48198 (Amp-Sec) 0mE 21465 (V)
EK 0001109 (V) 0A 29895
00R 001038 (Ohm) 10R 012196 (Ohm)
1τ 21052 (s) 2τ 17565 (s)
Figure 5-8 shows the simulation results using the Improved Battery Model and the
change of weights defined for this set of result described in the fitness function
The top subplot of Figure 5-8 shows the weight value of the GA fitness function
described before while the middle figure is the discharge current of the
experimental test which is also the input of the mathematical model In the
following test results in this and next chapter the changes of weight value are
similar so they are not shown in the figures
The blue line marked as ldquoExperimental Terminal Voltagerdquo in the bottom figure
represents the measured outputs while the other one (Simulated Terminal Voltage)
represents the simulation results The simulation results are ldquonoisyrdquo because
experimental discharge current is used as the input of model in the simulation
91
progress It is obviously that Figure 5-8 shows a good overall agreement of the
results although some slope when discharging is not perfect
0 500 1000 1500 2000 2500 3000 3500
1
15
Time (s)
Weig
ht
0 500 1000 1500 2000 2500 3000 3500114
116
118
12
122
124
126
128
13
Time (s)
Term
inal V
oltage (
V)
Experimental Terminal Voltage
Simulated Terminal Voltage
0 500 1000 1500 2000 2500 3000 3500
0
05
1
Time (s)
Dis
charg
e C
urr
ent
Simulated Terminal Voltage
Experimental Terminal Voltage
Figure 5-8 Measured and Simulated Result after Parameter Identification
Figure 5-9 shows the mean fitness value and the best in each generation It can be
seen that the best fitness in each generation is decreasing The mean fitness is
unstable because of the mutation operator in the GA that can attempt to find better
solutions
92
0 10 20 30 40 50 60 70 80 90 100100
150
200
250
300
350
400
450
500
550
Generation
Fitness v
alu
e
Best 1075521 Mean 1312731
Best f itness
Mean fitness
Figure 5-9 Mean and the Best Fitness Values in Each Generation
543 Battery Model Validation
In order to validate the battery mathematical model two sets of experimental tests
have been adopted to compare with the simulation results
The inputs of the discharge current and the validation results using two
experimental tests are shown in Figure 5-10 and Figure 5-11
93
0 500 1000 1500 2000 2500 3000114
116
118
12
122
124
126
128
13
Time (s)
Term
inal V
oltage (
V)
Simulated Terminal Voltage
Experimental Terminal Voltage
Simulated Terminal Voltage
Experimental Terminal Voltage
Figure 5-10 Measured and Simulated Terminal Voltage (Validation data 1)
In the simulation that shows in Figure 5-10 the discharge of battery begins at the
time of 700s and the simulation result shows a reasonable agreement with the
experimental result despite the noise of signal caused by the error of the sensors
It is noticed that at the beginning of the discharge there is a difference between
the simulated and experimental terminal voltages for about 100 seconds This
difference is studied and so called lsquocoup de fouetrsquo which often takes place at the
beginning of a discharge test when the SOC of battery is high (Perrin Delaille et
al 2006) However this lsquocoup de fouetrsquo behaviour cannot be described in this
model The discharge period lasts for about 1200 seconds and then stops and after
that the simulation has the similar result with the experiment
94
0 1000 2000 3000 4000 5000 600011
112
114
116
118
12
122
124
126
128
13
Time (s)
Term
inal V
oltage (
V)
Simulated Terminal Voltage
Experimental Terminal Voltage
Simulated Terminal Voltage
Experiment Terminal Voltage
Figure 5-11 Measured and Simulated Terminal Voltage (Validation data 2)
Figure 5-11 shows another group of experimental test to validate the battery
model At the beginning of the experiment the terminal voltage from the
experiment is dropping without any discharge behaviour of battery and that is
because of the experiment was carried out when the terminal voltage of lead-acid
battery is not steady enough after being charged and that also causes the
deviations in the discharge at about 1000-2000 seconds In this period the lsquocoup
de fouetrsquo appears again After the first period the battery is disconnected from the
load until the terminal voltage become steady and the simulation result in this
period fits the experiment result well In the second discharge of this test it is
shown that the lsquocoup de fouetrsquo does not occur because the SOC is not high For
the similar reason in the first discharge in this group of the test results there are
95
also some deviations in this period Finally the simulation result in the last part of
figure fits the experimental result is highly satisfied
The average error of the simulated outputs of the simulation studies and the
measured results are studied Absolute Error and Relative Error is defined as the
following equations
sum
sum
=
=
minus=
minus=
N
i
sim
N
i
sim
iV
iViV
NRelError
iViVN
AbsError
1 exp
exp
1
exp
)(
)()(1
)()(1
The absolute error and relative error are summarised in Table 5-3
Table 5-3 AbsError and RelError of Model Validation
Absolute Error Relative Error discharging relaxing overall discharging relaxing overall
Experimental Test 1 (Identification)
00229V 00207V 00217V 01833 01724 01776
Experimental Test 2 (Validation data 1)
00536V 00484V 00492V 04453 03872 04024
Experimental Test 1 (Validation data 2)
00724V 00372V 00485V 06352 03013 05025
55 Summary and Discussions
Identification of the unknown model parameters is discussed in this chapter and a
range of possibly suitable methods are reviewed in brief In this project Genetic
Algorithm is adopted GAs working principle and its implementation has been
96
introduced in details in this chapter The simulation study of two benchmark
functions that are commonly used in evaluating evolutionary computation
algorithms are employed in order to show the capability of GAs The parameter
identification by tests of a brand new 13Ah lead-acid battery is carried out and is
validated by two sets of other experimental test results under the same working
condition of the same battery
97
Chapter 6
The Analysis of State of Health
(SOH) in association with the
Internal Resistance
61 Methodology
As the number of discharge cycles of battery increases in applications the
maximum charges that a battery can offer will decrease In other words the SOH
battery is deteriorating But this drop of capacity is not linear and it is also a long
progress At the beginning of the use of battery the change of capacity is very
slow and it is not obvious After a number of cycles of discharge and charge this
change will get faster and relatively significant
There are no reliable methods now to calculate the remaining charge capacity
which is the only one determinant of the state of health The normal method is
simply to measure the voltage on its terminals But this measurement is not
accurate on an aged battery A battery in poor state of health but sufficiently
charged can also offer sufficient voltage to appear normal The only way to
determine the capacity accurately is to integrate the discharge current of battery in
a full deep discharge but this method cannot be used too frequently because deep
98
discharge is harmful for the battery
In the project six lead-acid batteries were tested using the test system described in
Chapter 4 These batteries were repeatedly discharged and charged for their whole
life time so that the information related to different state of health can be revealed
as soon as possible Even though the batteries works frequently it still takes more
than 6 months to make the battery become weak The testing experiments were
carried out and the data was recorded every 2-3 weeks so that important value of
state of health is not missed However as the change of capacity is a long progress
and it is nonlinear not all the data collected can be used in this project
Referring the literature (Coleman Lee et al 2006 Lakhdari and Midoun 2007
Coleman Hurley et al 2008) an important factor that reflects the change of state
of health of a lead-acid battery is the internal resistance Not only the state of
health but also other factors (SOC DOC discharge current etc) can result in
variations in internal resistance a new alternative method that based on the
Improved Battery Model in Chapter 4 is adopted in the project
From the model study in Chapter 4 the internal resistance can be divided into two
parts expressed by )]1(1[ 0000 SOCARR minusminusminusminus++++==== (Eq 47) and )ln(101 DOCRR minusminusminusminus====
(Eq 48) These equations show that the internal resistance is affected by the state
of charge (SOC) and depth of charge (DOC) in a discharge cycle In real
applications batteries are seldom discharged to the full range because a deep
discharge could cause some damage to the battery They are also seldom to be
charged to full to prevent the possibility of overcharge that could also bring some
99
negative effects Although this issue is not very significant in a valve regulated
lead acid battery it is better to control the working range of depth of charge from
50 to 80 approximately In this project the internal resistance of battery in the
depth of charge of 65 is studied as a most important factor that related to the
state of health As a little inaccurate of SOC and DOC will induce a comparative
big difference in the internal resistance the method of measuring the internal
resistance accurately by an external circuit is discarded
In Equation 47 and Equation 48 the author found that there are two other factors
that influence the internal resistance besides the SOC and the DOC R00 and R10
Therefore in the project the values of R00 and R10 in a specific discharge current
are very important to study the internal resistance The values of these two factors
are used in Equation 47 and Equation 48 to calculate the internal resistance per
cell of the battery The depth of charge is assumed to be 65 for a normal
working battery as described previously In chapter 3 the SOC and the DOC are
defined as )0(1 θCQSOC eminus= (Eq 44) and )(1 θavge ICQDOC minus= (Eq
45) The Capacity is also defined as equation 42
k
c
fc
IIK
CK
IC))(1(1
)1(
)(
0
minusminusminusminus++++
++++
====
ε
θ
θ
θ (61)
in which Kc = 118 k = 120 and 6 II avg times= in this project The relationship
between the actual capacity under discharge current Iavg and the nominal capacity
is
100
62
1
))(1(1
1
)0)(1(1
1
))(1(1
1
)0(
)(asymp
minus+=
minus+
minus+=
k
avgck
c
k
avgcavg
IIK
IK
IIK
C
IC
θ
θ (62)
Therefore the SOC when the DOC is 65 is
586))0(62(1)0(1 asympsdotminus=minus= θθ CQCQSOC ee (63)
As described in chapter 5 30 asympA therefore the internal resistance of an
individual cell can be obtained by
10001000010 43041)ln()]1(1[ RRDOCRSOCARRRrcell sdot+sdotasympminusminus+=+= (64)
and for a six-cell lead-acid battery the internal resistance
1000 582486 RRrr cellbattery sdot+sdot=times= (65)
62 The identification of C0 R00 and R10
In the eight parameters identified previously in Chapter 5 there are only three
parameters can be affected by the change of battery conditions Therefore the
other five parameters ( 2100 ττAKE Em ) can be treated as a constant for a battery
The parameters that related to the battery condition 0010 RR and 0C are the key
problems which the project focused on 0C represents the state of health while
the 0010 RR stands for the internal resistance parameters Here again the Genetic
algorithm is adopted to identify these three parameters
In this project the battery have been discharged and charged in hundreds of cycles
to simulate the capacity loss in the normal applications which is described by the
101
state of health in this project In order to find out the different behaviour of
internal resistance in different state of health experimental tests have been carried
out in different state of health of the battery
The first test is carried out when the battery is brand new and the data is also used
to identify the other parameters of the battery model as described in the previous
chapter The second group of data is collected after 300 discharge cycles
approximately and the third test took place after 200 more cycles The number of
discharge cycles between the last four tests is only about 50 because the change of
State of Health is more significant The identified parameters of a battery in
different state of health are shown in table 6-1
Table 6-1 Battery Remaining Capacity and Internal Resistance
Remaining
Capacity C0 (Amps)
SOH R00 R10 RelError Internal
Resistance (Ohm)
Test 1 48198 100 00609 00220 01756 05683
Test 2 44861 9314 00654 00103 07428 05759
Test 3 38025 7889 00635 00191 02812 05827
Test 4 33830 7019 00573 00509 07265 06126
Test 5 30625 6354 00604 00582 04340 06575
Test 6 26072 5306 00703 00368 01342 06855
And the terminal voltages simulated and measured are shown as the following
figures The same as previous figures the blue lines represent the measured
outputs while the red lines represent the simulation results
The test shows in figure 6-1 the same as the test which is used to describe the
genetic algorithms and the battery parameter identification in chapter 5 Detailed
102
description and analysis are given in chapter 5
0 500 1000 1500 2000 2500 3000 350011
112
114
116
118
12
122
124
126
128
13
Time (s)
Term
inal voltage (
V)
Experimental Terminal Voltage
Simulated Terminal Voltage
Experimental Terminal Voltage
Simulated Terminal Voltage
Figure 6-1 Experimental and Simulated Terminal Voltage of Test 1 (SOH = 100)
103
0 1000 2000 3000 4000 5000 600011
112
114
116
118
12
122
124
126
128
13
Time (s)
Term
inal V
oltage (
V)
Simulated Terminal Voltage
Experimental Terminal Voltage
Simulated Terminal Voltage
Experimental Terminal Voltage
Figure 6-2 Experimental and Simulated Terminal Voltage of Test2 (SOH= 9314)
The experiment shown in figure 6-2 is tested several months after the first
experimental test In the period that the first discharge begins the experimental
result shows a different slope in terminal voltage The reason is probably that the
battery have just charged to full by a charger and itrsquos the capacitor had not fully
discharged After that when the discharge stopped there is a deviation in the
simulation voltage In the authorrsquos opinion that is because of the accuracy of R10
and R00 If the value of R10 is greater and that of R00 is smaller the simulation
result should fit the experimental result In the second discharge period of the
discharge test there is also a little difference in the experimental and simulation
result caused by the inaccuracy of battery parameters But it shows a good
agreement when the discharge stopped
104
0 500 1000 1500 2000 2500 3000 3500 400011
112
114
116
118
12
122
124
126
128
13
Time (s)
Term
inal V
oltage (
V)
Simulated Terminal Voltage
Experimental Terminal Voltage
Simulated Terminal Voltage
Experimental Terminal Voltage
Figure 6-3 Experimental and Simulated Terminal Voltage of Test3 (SOH= 7889)
0 500 1000 1500 2000 2500 3000 3500 4000 4500 500011
112
114
116
118
12
122
124
126
128
13
Time (s)
Term
inal V
oltage (
V)
Simulated Terminal Voltage
Experimental Terminal Voltage
Simulated Terminal Voltage
Experimental Terminal Voltage
Figure 6-4 Experimental and Simulated Terminal Voltage of Test4 (SOH= 7019)
105
0 1000 2000 3000 4000 5000 600011
112
114
116
118
12
122
124
126
128
13
Time (s)
Term
inal V
oltage (
V)
Experimental Terminal Voltage
Simulated Terminal Voltage
Simulated Terminal Voltage
Experimental Terminal Voltage
Figure 6-5 Experimental and Simulated Terminal Voltage of Test5 (SOH= 6354)
Figure 6-3 figure 6-4 and figure 6-5 show the test results of the battery when the
SOH drops to its 80 70 and 60 It is shown that the simulation result in
figure 6-3 fits the experimental result until the end of test when the discharge of
battery has just stopped The inaccuracy of the R10 and R00 is also the main cause
of the deviation The overall simulation result in figure 6-4 figure 6-5 are good to
express the battery behaviour
106
0 500 1000 1500 2000 2500 3000 3500 400011
112
114
116
118
12
122
124
126
128
13
Time (s)
Term
inal V
oltage (
V)
Experimental Terminal Voltage
Simulated Terminal Voltage
Experimental Terminal Voltage
Simulated Terminal Voltage
Figure 6-6 Experimental and Simulated Terminal Voltage of Test6 (SOH= 5306)
In the parameter identification of test shown in figure 6-6 the remaining capacity
is only about 12 of the initial capacity when the battery is brand new During the
discharge period the simulation and experimental result is not fitting very well
and the slopes of them are not the same This is probably also caused by
insufficient idle time after being charged and the capacitor had not fully
discharged
Figure 6-7 represents the internal resistance value in different state of health as
described in table 6-1
107
100 95 90 85 80 75 70 65 60 55 5004
045
05
055
06
065
07
075
08
State of Health
Inte
rnal R
esis
tance (
Ohm
)
r vs SOH
Approximation
Figure 6-7 Change of Internal Resistance in Different State of Health (Battery 1)
It is shown that the internal resistance is increasing when the state of health of a
lead-acid battery decreases This progress is at first very slow when the battery is
new But after a number of discharge cycles the remaining capacity of battery
drops to about 75 of the initial capacity when the battery is new and the
increase of internal resistance become faster When the state of health is brought
down to about 50 which means that the battery cannot offer enough energy as
new the value of internal resistance is increased by 30 approximately At
present there is not a published quantitative description of the internal resistance
when the capacity changes yet but it has been agreed that the internal resistance
increases while the battery health deteriorates
Similar tests have been carried out on 5 other batteries with the same nominal
108
capacity and the changes of their internal resistances are given as figure 6-8 It is
not possible to deduce a statistical approximation equation only based on the
existing data but it can be seen from the figure that the performance of internal
resistance under different state of health shows an agreement in a certain extent
100 95 90 85 80 75 70 65 60 55 5003
04
05
06
07
08
09
State of Health
Inte
rnal R
esis
tance (
Ohm
)
r vs SOH (Battery 1)
r vs SOH (Battery 2)
r vs SOH (Battery 3)
r vs SOH (Battery 4)
r vs SOH (Battery 5)
r vs SOH (Battery 6)
Figure 6-8 Change of Internal Resistance in all 6 Batteries
63 Summary and Discussions
The determination of battery remaining capacity accurately is becoming
increasingly important in modern battery managements This currently is mostly
obtained by integrating the discharge current of a full discharge but this progress
usually causes a negative effect on most of the batteries There is also a view that
109
the state of health which represents the percentage of remaining capacity of a
weak battery compared with the initial capacity when brand new can affect the
internal resistance therefore the battery state of health can be obtained by the
study of battery internal resistance However from the analysis based on the
mathematical model and the experimental results it can be concluded that other
parameters can also cause variations of the internal resistance which make the
estimation of the state of health more challenging
This chapter describes a new alternative method that based on the Improved
Battery Model and the key parameters of the model The remaining maximum
capacity of a used battery which represents the SOH of the battery is related in
the internal resistance under the depth of charge of 65 which is expressed by
the parameters of R00 and R10 These parameters can be identified by genetic
algorithms A result that quantifies the change of internal resistance in different
SOH values has been concluded based on the analysis of a series of experimental
tests
110
Chapter 7
Conclusions and Future
Research
This chapter summarizes the major achievements of the presented research work
in the field of battery modelling and state of health analysis Possible direction of
further research work is also described briefly in this chapter
71 Summary
Lead-acid batteries are used in various industrial sectors and are irreplaceable due
to their low price In areas where lead-acid batteries are employed as an energy
storage device the capacity loss caused by the repeated dischargecharge cycles is
very common This drop of capacity can neither be avoided nor be repaired by
using current technologies As a result it is essential to know whether the battery
is able to meet the demand and if it should be replaced on time
In this thesis a study on the capacity status of a battery and its relation to the
internal resistance had been conducted and this thesis established a novel model
based method to quantify the battery health An Equivalent Circuit Mathematical
model for the discharging progress of a lead-acid battery has been developed for
this purpose and is implemented under MatlabSIMULINK software environment
111
The model involves most of the important concepts of a battery to reflect the
dynamic response of terminal voltage when discharging
A series of experimental tests have been carried out during the project for the
model validation and the study of the state of health Six 12V-13Ah lead-acid
batteries with the same rated capacity are discharged and recharged from brand
new to obtain different values of state of health Genetic algorithm has been
employed to identify the unknown parameters of the battery model in each state of
health and the identified parameters are used as the factors that reflecting the state
of health and the internal resistance The internal resistances corresponding
different state of health have been collected and recorded A result was found in
the thesis that for the 12V-13Ah lead-acid battery which is used in the
experimental tests the value of internal resistance is increased by 25
approximately if the SOH of battery drops to 50
72 Limitations
The key limitation of the method introduced in this thesis is that it is based on the
parameter identifications of the model which means a test is still needed in order
to obtain the state of health The major reason is that the mathematical model does
not include the charging progress of battery which is also an important period of
the battery duty cycle Another limitation is that all the tests of the state of health
estimation are carried out at the same discharge rate because of the variation of
the internal resistance in different discharge rate as discussed in chapter 4 Finally
112
The lsquocoup de fouetrsquo behaviour that of took place at the beginning of discharge
when batteries are full is not able to be simulated in the current version of
mathematical model
73 Future Research Work
Following the limitations of the project some future research can be carried out in
three steps based on the model improvements and the practical applications of the
algorithm
First of all improvements of the discharging battery model can be carried out
which can mainly focus on the study of the battery internal resistance in different
discharge rates Equations of internal resistances that can withstand the change of
discharge rate will make the model capable for online applications Studies on the
relationship between the electromotive force and the state of charge can also lead
to a solution of the lsquocoup de fouetrsquo behaviour and a better simulation result
Another research work on the model modification is that the behaviour of battery
to the mathematical model when a battery is being charged can be involved by
which the monitoring system of battery can be implemented in the whole duty
cycles This part of work can be focused on the parasitic branch in the
mathematical model described in chapter 3
Further work should also reveal the variations of state of health in different duty
113
cycles and an algorithm based on this change should be designed to estimate the
remaining life-time of a lead-acid battery The value of current state of health and
the estimated raining life-time should also be considered as major outputs in this
period of work It is also possible to design an online management device of
battery to estimate the life-time and the state of health
114
References
Anon (2006) Global Wind Energy Council (GWEC) statistics [online] from
httpwwwgwecnetuploadsmedia07-
02_PR_Global_Statistics_2006pdf
Anon (2007) Battery Types Flooded versus AGM and Gel [online]
Retrieved February 13 2007 from
httpwwwvonwentzelnetBattery01Type
Anon (2007) BP Statistical Review of World Energy June 2007 [online] from
httpwwwbpcomliveassetsbp_internetglobalbpglobalbp_uk_englishr
eports_and_publicationsstatistical_energy_review_2007STAGINGlocal_
assetsdownloadsspreadsheetsstatistical_review_full_report_workbook_2
007xls
Anon (2007) International Energy Outlook 2007 [online] from
httpwwweiadoegovoiafieohighlightshtml
Ball R J Evans R and Stevens R (2002) Finite element (FE) modelling of
current density on the valve regulated leadacid battery positive grid
Journal of Power Sources 103(2) 213-222
Bernardes A M Espinosa D C R and Tenoacuterio J A S (2004) Recycling of
batteries a review of current processes and technologies Journal of
Power Sources 130(1-2) 291-298
Berndt D (1993) Maintenance-Free Batteries -- A Handbook of Battery
Technology Somerset Research Studies Press Ltd
Berndt D (2001) Valve-regulated lead-acid batteries Journal of Power
Sources 100(1-2) 29-46
115
Berndt D (2009) Electrochemical Energy Storage Battery Technology
Handbook CRC Press
Casacca M A and Salameh Z M (1992) Determination of lead-acid battery
capacity via mathematical modeling techniques Energy Conversion
IEEE Transaction on 7(3) 442-446
Ceraolo M (2000) New dynamical models of lead-acid batteries Ieee
Transactions on Power Systems 15(4) 1184-1190
Chan H L and Sutanto D (2000) A new battery model for use with Battery
Energy Storage Systems and Electric Vehicles Power Systems 2000 Ieee
Power Engineering Society Winter Meeting - Vols 1-4 Conference
Proceedings 470-475
Chen M and Rincacuteon-Mora G A (2006) Accurate electrical battery model
capable of predicting runtime and I-V performance IEEE
TRANSACTIONS ON ENERGY CONVERSION VOL 21( NO 2)
504-511
Chipperfield A J Fleming P J and Fonseca C M (1994A) Genetic algorithm
tools for control systems engineering Adaptive computing in
engineering design and control Plymouth UK
Chipperfield A J Fleming P J Pohlherim H and Fonseca C M (1994B)
Genetic algorithm toolbox for use with Matlab Department of automatic
control and systems engineering University of Sheffield
Crompton T R (2000) Battery Reference Book Third Edition Oxford
Elsevier Newnes
Cun J P Fiorina J N Fraisse M Mabboux H A and Mabboux H The
116
experience of a UPS company in advanced battery monitoring
Telecommunications Energy Conference 1996 INTELEC 96 18th
International 646 - 653
Durr M Cruden A Gair S and McDonald J R (2006) Dynamic model of a
lead acid battery for use in a domestic fuel cell system Journal of Power
Sources 161(2) 1400-1411
Esfahanian V Torabi F and Mosahebi (2008) An innovative computational
algorithm for simulation of lead-acid batteries Journal of Power
Sources 176(1) 373-380
Gillioli R and Cerolo P (1990) Charge and discharge fourth order dynamic
model of the lead battery 10th
intl Electric Vehicle Symposium Hong
Kong p1-9
Glendenning I (1981) Compressed air storage Physics in Technology 12(3)
103-10
GONG Q (2005) Modeling study of a vehicle traction battery model
CHINESE LABAT MAN 2005 Vol 42 Numb 2 issu 155 pages 76-79
Houck C Joines J and Kay M (1995) A Genetic Algorithm for Function
Optimization A Matlab Implementation NCSU-IE TR 95-09
Jacobi W (2009) Lithium Batteries Battery Technology Handbook CRC Press
Jayne M G and Morgan C (1986) a new mathematical model of lead acid
battery for electric vehicles Eighth Intl electric vehicle conference
Washington DC
Juvonen M (2003) Large-Scale Energy Storage Systems [online] from
httpwwwdocicacuk~mattiise2grpenergystorage_reportstoragehtml
117
Lee J H Lee K Y and Lee J Y (1996) Self-discharge behaviour of sealed
Ni-MH batteries using MmNi33+xCo07Al10-x anodes Journal of
Alloys and Compounds 232(1-2) 197-203
Liaw B Y Gu W B and Wang C Y (1997) Numerical simulation of coupled
electrochemical and transport processes in battery systems Proceedings
of the Intersociety Energy Conversion Engineering Conference
Honolulu HI USA IEEE
Lu S Meegahawatte D H Guo S Hillmansen S Roberts C and Goodman
C J (2008) Analysis of energy storage devices in hybrid railway vehicles
Railway Engineering - Challenges for Railway Transportation in
Information Age 2008 ICRE 2008 International Conference on
Mantell C L (1984) Batteries and energy systems Second Edition McGraw-
Hill Inc
MathWorks Inc (2004) Genetic Algorithm Direct Search Toolbox V102
MathWorksInc
MPowerSolutionsLtd (nd) Alternative Energy Storage Methods [online]
from httpwwwmpowerukcom
Okoshi T Yamada K Hirasawa T and Emori A (2006) Battery condition
monitoring (BCM) technologies about lead-acid batteries Journal of
Power Sources 158(2) 874-878
Perrin M Delaille A Huet F and Hernout L (2006) Study of the coup de
fouet of lead-acid cells as a function of their state-of-charge and state-of-
health Journal of Power Sources 158(2) 1019-28
Pham D T and Karaboga D (1998) Intelligent Optimisation Techniques
118
Genetic Algorithms Tabu Search Simulated Annealing and Neural
Networks New York Springer-Verlag New York Inc
RailPower Hybrid Technologies C (nd) Benifits of Hybrid Locomotives
[online] from httpwwwrailpowercomproducts_hl_benefitshtml
Rand D A J Moseley P T and Garche J (2004) Valve-Regulated Lead-Acid
Batteries Elsevier
Ruetschi P (2004) Aging mechanisms and service life of lead-acid batteries
Journal of Power Sources 127 (1-2) 33-44 Switzerland Elsevier
Salameh Z M Casacca M A and Lynch W A (1992) A mathematical model
for lead-acid batteries IEEE Trans on Energy conversion Vol7 No 1
Sato Y Takeuchi S and Kobayakawa K (2001) Cause of the memory effect
observed in alkaline secondary batteries using nickel electrode Journal
of Power Sources 93(1-2) 20-24
Sims R I Carnes J C Dzieciuch M A and Fenton J E (1990) Computer
modeling of Automotive lead acid batteries Ford Research Laboratories
Technical Report
Smil V (2007) Energy at the Crossroads Massachusetts Achorn Graphic
Services Inc
Ter-Gazarian A (1994) Energy storage for power systems London Peter
Peregrinus Ltd
TNI_Ltd (2007) Battery history [online] from
httpwwweuropulsecombattery_historybattery_historyhtm
Tuck C D S (1991) Modern Battery Technology Ellis Horwood Ltd
Wei J (2007) Development of Coal Mill and Aggregate Load Area Models in
119
Power Systems using Genetic Algorithms University of Liverpool PhD
Wikipedia (nd) Lead-Acid Battery [online] from
httpenwikipediaorgwikiLead-acid
Wikipedia (nd) Rechargeable Batteries [online] from
httpenwikipediaorgwikiRechargeable_battery
Wikipedia (nd) VRLA [online] from httpenwikipediaorgwikiVRLA
Zhang Y L Liu P H Zhang Q Y and Cheng W (2010) Separation of
cadmium(ii) from spent nickelcadmium battery by emulsion liquid
membrane Canadian Journal of Chemical Engineering 88(1) 95-100
120
Appendix I SIMULINK Diagrams of Battery Model
Figure A-1 SIMULINK Diagrams of ldquoMain Blockrdquo
121
Figure A-2 SIMULINK Diagrams of ldquoTerminal Voltage Calculationrdquo
122
Figure A-3 SIMULINK Diagrams of ldquoThermal Behaviourrdquo
123
Figure A-4 SIMULINK Diagrams of ldquoBattery Capacityrdquo
Figure A-5 SIMULINK Diagrams of ldquoBattery State of Chargerdquo
Figure A-6 SIMULINK Diagrams of ldquoBattery Depth of Chargerdquo
124
Figure A-7 SIMULINK Diagrams of ldquoBattery Electromotive Forcerdquo
(a)
(b)
Figure A-8 SIMULINK Diagrams of ldquoBattery Internal Resistancerdquo
125
Appendix II
List of Publications
S Hillmansen S Lu D H Meegahawatte S Guo C Roberts and C J
Goodman Analysis of Energy Storage Devices in Hybrid Railway Vehicles International Conference on Railway Engineering 2008 p68-73 Hong Kong China 25-28 March 2008
Y Yin X Luo S Guo Z Zhou J Wang A battery charging control strategy for
renewable energy generation systems The Proceedings of World Congress on Engineering 2008 Vol 1 pp356-361 London UK 2-4 July 2008
S Guo S Hillmansen Y Yin J Wang State of Health Monitoring of Lead-acid
Batteries Proceedings of the 14th International Conference on Automation amp Computing pp250-254 Brunel University West London UK 6 September 2008
Y Yin C Li Z Zhou Q Liu S Guo X Luo J Wang Design and Realization of a
PS2 Keyboard Interface in Embedded system Proceedings of the 14th International Conference on Automation amp Computing pp160-163 Brunel University West London UK 6 September 2008
Yin Y Wang J Luo X Guo S Development of a battery charging management
unit for renewable power generation a book chapter in Advances in
Electrical Engineering and Computational Science Edited by Sio-Long Ao and Len Gelman pp33-46 Springer 2009
Wang J Wei JL Guo S Condition monitoring of power plant milling process
using intelligent optimization and model based techniques accepted as a chapter in the book of Fault Detection in March 2009
S Guo S Hillmansen J Wang Model Based Analysis of Battery State of Health
using Genetic Algorithms accepted by the International Conference on Systems Engineering (ICSE) Coventry 8-10 September 2009
1
Chapter 1
Background and Objectives of
the Project
11 Overview
Fossil fuels have been the main energy resource in recent human history although
their continuing use has been shown to have a detrimental effect on the
environment The principal problem for fossil fuels is that they cannot be
reproduced within a short period of time so it is a finite energy supply source If
current consumption rate continues they will be exhausted in a few generations
from now Fossil fuel has never been considered as a clean-resource because there
is an emission of noxious gasses including CO CO2 NOx SOx and HC into the
atmosphere With all the pressure from the problems associated with the fossil
fuel exploration of the usage of renewable energy is becoming an increasingly
important issue
Wind energy hydro energy and solar energy are three of the most important
renewable energy sources and they have been implemented on a large scale wind
energy has produced a annual global total of 65019 times 1012 Wmiddoth
(74223 MWtimes24htimes365 days) (Anon 2006) energy in the year 2006 and hydro
2
energy is about 304 times 1015 Wmiddoth (30404 times 1012 Wmiddoth) (Anon 2007) Solar energy
resources are estimated at about 10694times1015 Wmiddoth (3850times1021 J) (Smil 2007) To
compare with the worldwide energy consumption of 13097times1015 Wmiddoth in the year
2007 it is clear that renewable energies have a significant role to play (Anon
2007)
However the problem of the implementation of the renewable energy is that the
electricity generated is intermittent and the power systems are experiencing the
problem of rapidly changing power demand Therefore the management of the
energy is an important issue Devices of energy storage should solve these
problems in theory
12 Review of Energy Storage Systems
Not only giving a large scale energy solution energy storage devices are also
commonly used in a range of applications related to everybody Different energy
storage technologies are suited to different applications and consideration must be
made in order to select the correct solution for each application This section will
give an overview of the existing energy storage systems
121 Applications of the Energy Storage Systems
Large scale energy storage systems which are also called grid energy storage
refer to the methods used to large-scale store electricity within an electrical power
grid Off-peak energy is stored during times when production (from power plants)
3
exceeds consumption and the stores are utilized at times when consumption
exceeds production In this way electricity production need not be drastically
scaled up and down to meet momentary consumption ndash instead production is
maintained at a more constant level
Despite the applications in grid scale the energy storage systems are also popular
in a number of areas For example they are usually used to optimize the energy
generated from the engine in modern electrical hybrid vehicles One such
application is in a shunter locomotive A shunter is a small railroad locomotive
intended for assembling trains ready for a road locomotive to take over
disassembling a train that has been brought in and switching a train to another rail
at the rail terminals The duty cycle of a shunter is characterised by short duration
high power demands (accelerating a rake of vehicles) and the long periods of
idling while the train waits for other operations Comparing to traditional shunter
locomotive that use diesel engines only for the whole duty cycle hybrid shunter
locomotives with energy storage devices can have a 40-70 reduction in fuel use
(RailPower Hybrid Technologies nd) This saving is made by operating the prime
mover at its optimum
Another application of energy storage in the vehicle technologies is the
regenerative braking system which is used to save the braking energy of vehicle
The potential of this technology to save energy for a vehicle is depends on the
duty cycle (Lu Meegahawatte et al 2008) which is characterized by storing the
energy generated when the vehicle is decelerating and releasing when accelerating
4
Energy storage devices are also very popular in stationary applications also
known as the Uninterruptible Power Supply (UPS) systems This system is
designed to meet the power demand when problems like power failure happen and
it is important especially in the applications where power failures could have
serious consequences for example in hospitals and computer centres (Berndt
2009)
The energy storage devices in the UPS system are often used to achieve
ldquouninterruptiblerdquo in a short period before the secondary power supply started
When a power problem occurs the energy storage device starts to supply
electricity immediately and at the same time the generator begins to start When
the generator is ready to supply sufficient power the energy storage device stops
providing power When the grid power is recovered the energy storage device can
be recharged until full
122 Review of the Existing Energy Storage Devices
There are various kinds of energy storage systems including pumped hydro
compressed air flywheel supercapacitors electrochemical and also
superconducting magnetic Each technology is suited to different applications and
careful consideration must be made in order to select the correct solution for each
application
Pumped hydro is the oldest and the most effective kind of large scale energy
storage method which have been used for nearly a century since 1929 (Juvonen
5
2003) Two large reservoirs at different altitudes with a pump a turbine a motor
and a generator are employed to collect the off-peak energy The water is released
from the higher one through a turbine to generate electricity during peak load
period
Compressed air is a pneumatic energy storage method that refers to the air kept
under a certain pressure This system can be used in grid energy storage that the
air can be stored by compressors during periods with low power demand This
compressed air can be released to a generator to meet the high power demand
during peak time (Glendenning 1981 Ter-Gazarian 1994 Juvonen 2003) In some
applications the compressed air is released through a combustor mixed with
natural gas to obtain a higher overall efficiency
A capacitor is an electrical device that can store energy in an electric field
between a pair of conductors and is often used in circuits for short term energy
storage It blocks the circuit to hold DC voltage Supercapacitors are energy
storage devices with the same principle but with a higher energy density The
power density of the supercapacitor systems can be very high but the energy is
often released in a very short duration (Ter-Gazarian 1994) As a result the
supercapacitors are usually used in applications of an energy burst
Superconducting magnetic energy storage system stores energy in the magnetic
field generated by direct current in a coil Instead of traditional wires like copper
superconductors are employed to avoid the energy consumptions as heat because
of the resistance A problem is that the optimal operating temperature for
6
superconductors is 50-77K a refrigerator is therefore necessary in the system for
cooling down
Flywheels are considered as a method of storing mechanical kinetic energy by
accelerating a flywheel to a very high speed to store the energy and decelerating
to release the energy Flywheels are very efficient for short duration storage cycles
due to their fast response speed These energy storage devices are used mainly in
applications that demand kinetic energy storage and high numbers of deep
discharge cycles
Electrochemical energy storage stands for the device capable of converting
chemical and electrical energy to each other by chemical reactions Batteries are
the most common technology of electrochemical energy storage methods The
oxidation and reduction reactions in the two electrodes of battery lead to the
current through the external circuit when discharging to provide energy The
secondary battery can be recharged by applying electrical current which reverses
the chemical reactions that occur during the discharge
Fuel cell is another technology with very high energy density that converts the
chemical energy in a source fuel into an electrical current The fuel cells are
considered as the ldquoenvironmental friendlyrdquo as the only by-product is water The
working principle of fuel cells when discharging is the same as the batteries but
unlike the batteries the fuel cells do not need recharge as they only provide
electrical energy while the active chemicals are supplied to the electrodes (Mantell
1984 MPowerSolutionsLtd nd)
7
Figure 1-shows the Ragone chart of the energy and power density of some energy
storage systems
Figure 1-1 Power density vs energy density plot (MPowerSolutionsLtd nd)
123 Review of Batteries
The preceding discussion has identified that energy storage devices are becoming
increasingly important in both stationary and mobile applications Battery as the
most popular energy storage device is studied in this section
There are two different types of batteries applied in a large range of areas now
Primary batteries and Rechargeable batteries Primary batteries which are also
called disposable batteries often have higher energy densities than the
rechargeable ones and they have a lower self-discharge (Ter-Gazarian 1994)
8
However as the chemical reactions in these batteries are not reversible and the
active materials cannot be restored to their initial forms these batteries cannot be
reliably recharged The primary batteries are intended to be used once and then
discarded therefore they are not suitable for the energy storage systems
Rechargeable battery is the other type of the electrochemical batteries which is
also known as secondary battery because their electrochemical reactions are
electrically reversible There are many different rechargeable battery technologies
in which only four of them are leading the world market nickel-cadmium nickel-
hydride lead-acid and lithium-ion (Berndt 1993 Berndt 2009)
The Nickel-cadmium (NiCd) battery is a kind of rechargeable battery that uses
nickel oxide hydroxide and metallic cadmium as electrodes and an alkaline
electrolyte (often potassium hydroxide) (Mantell 1984) As designed to compete
the primary batteries the NiCd batteries are often manufactured in the same size
and they are used in the consumer market as primary batteries for example in
clocks toys radios and cordless tools However when the NiCds are substituted
for primary cells the lower terminal voltage and smaller ampere-hour capacity
may reduce performance as compared to primary cells The most attractive feature
of the nickel-cadmium batteries is that they are more difficult to damage
comparing with other batteries during deep discharge cycles They can also
sustain more cycles and the lower internal resistance can also help achieve a
higher maximum discharge rate A problem preventing the large scale application
of this battery technology is that the nickel-cadmium batteries suffers faster self
discharge rate than other rechargeable batteries and the cadmium used as the
9
active material in one of the electrodes is toxic and expensive (Zhang Liu et al
2010) Furthermore the capacity loss caused by the continuously discharge and
recharge to the same state of charge called ldquomemory effectrdquo is also a very
important issue of the nickel-cadmium batteries (Sato Takeuchi et al 2001)
The nickel-metal hydride (NiMH) battery is a type of secondary electrochemical
battery that designed to substitute for the nickel-cadmium cells They have a
similar size and a similar cell voltage but with more advantages By using
hydrogen-absorbing alloy as negative electrode instead of cadmium this
electrochemical technology is considered as ldquoenvironmental friendlyrdquo because of
the absence of toxic cadmium (Berndt 1993) The nickel-metal hydride batteries
also have low internal resistance and the high cycle durability as the NiCds and a
NiMH battery can have two to three times the capacity of an equivalent size
nickel-cadmium battery However the nickel-metal hydride batteries also have a
similar high self-discharge rate as the nickel-cadmium batteries (Lee Lee et al
1996) and it also cannot afford complete discharges Memory effect from
repeated partial discharge can occur in a NiMH battery but this is reversible
through charge cycling (Berndt 2009)
The lead-acid batteries are the oldest type of rechargeable battery with a history of
over 150 years but they are still the most popular battery chemistry for
applications such as engine starting or backup power systems as there is no
cheaper alternative when weight is not a factor This technology uses lead and
lead dioxide as electrodes and an acid electrolyte of sulphuric acid and the
advantage of this configuration is that the electrolyte takes part in reactions of
10
both electrodes and both electrodes turn into lead sulphate when discharging
(Berndt 1993 Berndt 2009) The lead-acid batteries can be designed for not only
deep discharge cycles but high discharge rate or compromise of the two cycles
They have a lower self-discharge rate compared with the nickel batteries and they
also do not suffer from the memory effect (Mantell 1984 Berndt 2009) However
as the energy density of lead-acid battery is not high it is seldom applied in the
portable electronics Another important problem is that the lead-acid batteries
must be recycled as the active material ldquoleadrdquo is toxic to both the environment and
the human bodies (Bernardes Espinosa et al 2004)
The lithium-ion (Li-ion) batteries are almost the perfect cell chemistry and are
currently used a wide range of consumer electronics products including cameras
cell phones laptops etc They have many attractive performance advantages
which make them also ideal for higher power applications such as automotive and
standby power First of all the lithium-ion batteries have the highest energy
density in all the rechargeable battery now which is about 4 times better than
lead-acid (Jacobi 2009) They are also capable for deep discharge and high
discharge rate with a relatively slow self discharge There is no liquid electrolyte
in the lithium-ion batteries which means they are immune from leaking However
just opposite to the lead-acid batteries the most serious problem that discourages
the lithium-ion batteries is the low economic efficiency comparing with the lead-
acid batteries Other factors like the stability of the chemicals and the recycling of
lithium should also be concerned because of the chemical activeness of lithium
Table 1-1 is gives some basic properties of the four major rechargeable batteries
11
introduced above There are also some less common battery chemistries used by
rechargeable batteries in addition to these technologies including nickel-zinc
(NiZn) nickel-iron (NiFe) etc but they have a small market share For the four
major battery chemistries lead-acid batteries with their low price and high
flexibility is adopted in a wide range of application areas
Table 1-1 properties of the rechargeable batteries (Wikipedia nd)
Type Voltage
(V)
Energy Density (Whkg)
Power Density (Wkg)
Self Discharge
rate
Cycle Durability
Nickel-Cadmium
12 40-60 150 20 1500
Nickel-Metal-Hydride
12 30-80 250-1000
20 1000
Lead-Acid 21 30-40 180 3-4 500-800
Lithium-ion 36 160 1800 5-10 1000-1200
124 The Management of Batteries
In the areas that batteries are employed as the energy storage device it is a critical
issue to consider that whether there is enough energy in the battery to meet the
demand However batteries do have the problem in limited cycle durability that
is when a battery is charged and discharged for a number of cycles its total
capacity decreases If the battery cannot offer sufficient powerenergy it should be
replaced at the right time But the problem is that it is difficult to quantify the
capacity loss and when the capacity of battery is no longer sufficient for a
particular application Due to the limitation of batteries it is essential to develop a
method to determine the capacity of battery that subjected to various duty cycles
in a number of applications
12
13 Project Objectives
The main objective of the project is to develop a method which can determine the
key parameters of batteries from the discharge tests The proposed methodology is
a model based approach that is to develop a mathematical model of the battery
which can represent the dynamic performance and battery status and
characteristics can be investigated through the analysis of the model
The first step of the project is to build a mathematical model of battery The
dynamic model is expected to reflect the relevant behaviours of battery when
being discharged including the characteristics of State of Charge Depth of Charge
Electromotive force Terminal Voltage The unknown parameters in the model are
identified by using Genetic Algorithms (GAs) with the laboratory experimental
data Afterwards some batteries are tested in experiments and the parameters in
different state of health are recorded to analyze the battery in different status of
battery
The focus of this work is to develop a suitable method for parameter identification
for common battery systems The lead-acid battery has been chosen because it has
relatively well defined properties and there is a wealth of literature describing the
performance of these types of batteries From an experimental view point they are
also readily available of low cost
13
14 Outline of the thesis
The thesis is organized into seven chapters and the first chapter presents the
background and motivation of the research project The remaining chapters are
briefly described as follows
Chapter 2 gives an overview of lead-acid batteries including the development
working principle and also some modern battery designs and technologies In the
second part of chapter 2 important concepts for a battery including electromotive
force capacity state of charge internal resistance and state of health are
introduced and some mathematical descriptions of these concepts are discussed
Chapter 3 starts from some requirements of the mathematical model designed for
this project and several different methods of battery model approaches are
discussed Afterwards some details of the dynamic mathematical model are
analyzed The initial battery model is described in the last part of this chapter that
summarized the equations of the battery
Chapter 4 is mainly focused on some improvement of the mathematical model
described in chapter 3 In the first section of chapter 4 the experimental test rig in
the project is introduced Some findings in the experimental tests is then listed and
studied and integrated into the improved model Finally the SIMULINK
implementation and a simulation study are given
Chapter 5 presents a method of model parameter identification The principle of
14
Genetic Algorithms is studied at first Then this algorithm is employed in the
model and the parameters of the model are identified with the help of
experimental tests This chapter also includes the validation of battery model
using two other groups of test results
Chapter 6 develops an algorithm that can reflect the state of health of a lead-acid
battery In this chapter the internal resistance parameters are measured under
different state of health through a group of continuous experimental tests The
change of internal resistance under a specific working condition is then related to
the battery state of health
Finally Chapter 7 gives a summary and the conclusions of the project Also the
future works that can be improved are proposed in this chapter
15
Chapter 2
Introduction of Lead-acid
Batteries
This chapter gives an overview of lead-acid batteries including background
knowledge working principles explanation of terminologies technologies and
applications encountered for this technology The chapter presents the
fundamental knowledge and prepares for the project work to be reported in the
following chapters
21 A General Overview of the
Lead-acid Battery
The lead-acid battery is the oldest type of rechargeable battery The first example
of a lead-acid battery can be attributed to the German physicist Sinsteden who
published the performance data of this battery system in 1854 (Berndt 1993)
Later in 1859 the French physicist Planteacute realized that a plate construction was
required to achieve a much larger effective surface area and he produced the first
rechargeable battery which was marketed for commercial use by alternately
charging and discharging lead sheets immersed in sulphuric acid This method
has remained unchanged and still in use today in stationary applications (Berndt
16
1993 Wikipedia nd) One of the first applications of lead-acid batteries was for
storing electrical energy for telegraphy systems The capacity required for these
applications was low and the battery at that time was not yet suited to high power
industrial applications (TNI_Ltd 2007)
In 1880 a French chemical engineer Faureacute significantly improved the design of
the lead-acid battery by producing the active materials separately His method was
to coat the lead plate with a paste of lead oxides sulphuric acid and water in a
warm humid atmosphere The paste then changed into a mixture of lead sulphates
which adhered to the lead plate as an electrochemically active material As a result
of this technology the Faureacute cells are able to achieve much higher capacity with
the first charge in comparison with the Planteacute ones (Berndt 1993 TNI_Ltd 2007)
The problem of these plates is that they are not very durable and become weak
only after a few dischargecharge cycles The lead grid alloyed with antimony or
calcium was developed to improve the mechanical characteristics The holes on
the grid are able to achieve improved bonding thus the batteries may have a longer
lifetime This advantage led to the industrial manufacturing of lead-acid batteries
In 1881 a lead electrode with a ribbed surface was designed in order to have a
large effective surface of the active material and this was the pioneer of the large
surface plates which are still common today (Berndt 1993 TNI_Ltd 2007
Wikipedia nd)
In the beginning lead-acid batteries were operated in open jars The advantage of
this feature was that the electrode can be cleaned and exchanged easily but faced
the problem of water evaporation Therefore the early batteries have to refill water
17
in order to continue normal use However this problem can be dramatically
reduced when the cells were fitted with covers to limit the evaporation (Berndt
1993) This kind of battery design is known as a lsquoflooded lead-acid batteryrsquo
In the 1950s a new type of battery which was aimed to become spill-proof was
designed and manufactured on a large scale This type of battery is characterized
by an immobilized electrolyte however this kind of spill-proof battery was only
manufactured in small sizes up to about 10 Ah (Berndt 2001) Later the
combination of a valve improved the characteristic features of the lead-acid
battery and this kind of battery is still common today and is known as the Gel
Lead-acid battery (Berndt 1993) In the 1970s micron diameter glass fibres
originally designed for air filters were used in glass mats which absorbed the
electrolyte and acted as separator Soon this kind of Absorbent Glass Mat (AGM)
battery appeared in market for stationary application
Currently Valve Regulated Lead Acid (VRLA) batteries based on both AGM and
Gel electrolytes are available in a large range of capacities for both stationary and
mobile power applications with a range of different designs for each type of
application Arguably the most important application of lead-acid batteries is for
vehicle engine starting The battery employed in this application which is called
Starting Lighting and Ignition (SLI) batteries are designed to deliver bursts of
energy usually in a discharge current as large as several hundred amperes in a
very short time A different type of battery construction can produce batteries
capable of deep cycling which are more suited to slow discharge cycles (Tuck
1991 Anon 2007)
18
22 Configuration of Lead-acid Batteries
This section gives a brief description of the working principles of lead-acid
batteries and how the battery can be configured to suit different applications
221 Electrochemical Principles
The lead-acid battery comprises two electrodes and the electrolyte The structure
of the lead-acid battery is shown in Figure 2-1 in which one electrode is Cathode
and the other is Anode The active matter in the positive plate is made of lead
dioxide (PbO2) and that in the negative plate is made of lead (Pb) and the
electrolyte is sulphuric acid One electrode can serve either as a Cathode or as an
Anode depending on which process the battery is experiencing - charging or
discharging With this structure a battery could convert electrical energy into
chemical energy and back again which is associated with the process of charging
and discharging
(a) (b)
Figure 2-1 Working Principle of Lead-Acid Batteries (a) shows the battery when
19
discharging and (b) is when charging with a DC charger
For the discharging process as shown in Figure 2-1 (a) the negative plate acts as
the anode and the positive plate is the cathode If a wire is connected between the
two the excess electrons from the anode will travel through the wire as a current
to the cathode where they are needed to complete the electron deficient reaction
there The chemical reactions in a lead-acid battery when discharging are
described as follow
Negative plate reaction (Anode)
+minusminus+rarrminus+ HPbSO2eHSOPb 44
Positive Plate reaction (Cathode)
O2HPbSO2e3HHSOPbO 2442 +rarr+++minus+minus
For the charging process an external power source is connected to the two
electrodes with the voltage as shown in Figure 2-1(b) In this way the flow of
electrons is forced backwards against the electropotential and the reactions are
driven backwards changing the lead sulphate back into lead and lead dioxide on
the negative and the positive plates and restoring the sulphuric acid to the liquid
electrolyte The anode when a battery is charging is the positive plate and the
cathode is the negative plate and the chemical reactions in a lead-acid battery
when charging are described as
Positive plate reaction (Anode)
+minusminus++rarrminus+ 3HHSOPbO2eO2HPbSO 4224
Negative plate reaction (Cathode)
minusminus++rarr++ 44 HSOPb2eHPbSO
20
The thermodynamic heat effects caused by the reactions are small in the lead-acid
battery because the difference between the enthalpy and the free enthalpy is very
small The rate of reversible heat effect in the reaction is 132 kJ per mol of the
cell reaction which corresponds to about 35 of the total energy converted when
the lead-acid battery is discharging or charged This amount of energy is relatively
small and is generated over a comparatively long period of time so it is usually
easily dissipated through radiation and convection (Berndt 1993)
222 Lead-Acid Battery Types and Technologies
The flooded battery is the simplest type of lead-acid battery in use Flooded
batteries are common for some traction applications despite the requirement in
high maintenance They are also very common for large capacity backup power
supplies for telecommunication computer centres grid energy storage and off-
grid household electric power systems Since the flooded batteries are not sealed
they must be kept upright to avoid acid spills and water must be periodically
added to top up the liquid electrolyte The most attractive feature of the flooded
battery is that they are able to withstand certain level of overcharging without
damage providing proper maintenance is carried out
The Valve Regulated Lead-Acid (VRLA) battery which is often colloquially
called the sealed lead-acid battery is becoming more and more popular in many
applications Because VRLA batteries are mostly sealed the electrolyte
evaporation will be reduced and spillage can be largely avoided when
overcharging which are very common in flooded batteries The electrolyte of the
21
VRLA battery is designed to be immobilized so the VRLA batteries will not leak
if inverted pierced or if the container is broken They can be mounted in any
orientation and position even immersed in water The immobilization of the
VRLA electrolyte can be achieved by using an absorbent mat separator as well as
gelling materials
In Absorbent Glass Mat (AGM) battery the electrolyte is absorbed into a mat of
fine glass fibres in order to immobilize the electrolyte In addition the pores in the
mats are fine enough to prevent the lead dendrites in the cathode from growing
through as a separator and only glass is wetted enough by sulphuric acid can soak
the separators The glass mats can therefore be used to insulate the electrodes
Gelling is another way to immobilize the electrolyte and this gelling technology at
present is only applied for lead-acid batteries The idea is to mix the sulphuric acid
with silica fume (SO2) which makes the electrolyte gel-like The mixture is stable
over a long term environmental safe and easy to work technically (Berndt 1993)
The sulphuric acid bound by the gel can also insulate electrodes as a separator
similarly with that in an AGM battery
VRLA batteries including both gel and AGM batteries are able to recombine and
reduce the emission of gases during overcharge so the requirement for the room
ventilation is reduced and there is no acid fume emission during normal discharge
(Berndt 1993 Anon 2007 Wikipedia nd) Although the generation of hydrogen
can be slowed down it cannot be avoided completely As a result a valve
regulation safety system is employed in VRLA batteries which vents the gases in
22
the battery only during over pressure faults (Tuck 1991 Berndt 1993)
However the VRLA batteries do have some drawbacks First of all the VRLA
batteries tend to have a lower specific energy density than flooded batteries and
they are also more expensive An accurate charging control is very important for a
VRLA battery especially when charging under high temperature environments
since it is not possible to cure the damage caused by overcharge
223 Battery Designs for Different Applications
Lead-acid batteries are deployed in a range of applications Different designs are
therefore required due to the different working environments and duty cycles SLI
batteries are designed for a burst of energy for cold-cranking an engine A SLI
battery is supposed to provide power only in the first few seconds when starting
an engine and will be recharged immediately once the engine is started In this
kind of lead-acid batteries a larger surface area of the electrode plates is used to
provide high electric current in a short period However repeated deep discharge
may shorten the battery lifetime
On the other hand deep cycle batteries are designed for applications where the
batteries are regularly discharged The plates of the deep cycle batteries are often
very thick in order to withstand the frequent and deep discharge cycles The plate
surface area of a deep cycle battery is not as large as a SLI battery and as a result
it is not possible to offer great power
23
Marine batteries are a compromise between a SLI battery and a deep cycle battery
Standby batteries can be classified as marine batteries which are used for backup
power supplies and providing the power in emergency situations They are
designed for a long lifetime and a large capacity but repeated discharges and high
current drain are not the intended application Traction batteries are designed for
higher current drain and repeated deep discharge cycles They are usually bigger
and heavier than other types of lead acid for the same voltage and capacity but
that is the cost of durability
23 Mathematical Descriptions of Lead-acid
Batteries
In order to investigate the relationship between the battery behaviour and
remaining lifetime for a lead-acid battery initial studies have been carried out and
are described in this chapter Concepts including Capacity State of Charge (SOC)
Depth of Charge (DOC) State of Health (SOH) and internal resistance are
introduced and quantitative descriptions of these concepts are listed
231 Capacity
The capacity of a lead-acid battery represents how much charged energy the
battery can offer which is usually described in Ampere-hours (Ah) The charge
capacity of a battery is decided by the construction factors of a battery cell This
includes the materials contained in the electrodes and the acid solution In
addition the capacity of a battery is not a fixed quantity but varies according to
24
how quickly it is discharged This is known as Peukertrsquos law (Ceraolo 2000
Dhameja 2001 Rand Moseley et al 2004)
tICk
p = (21)
where pC is the capacity on one-ampere discharge rate which is a constant
I is the discharge current (A)
t is the time of discharge (h)
k is the Peukert constant and for a lead-acid battery with the value
between 11 and 13 (varies for each individual battery)
It is common to refer to ldquoCnrdquo as the capacity of battery in Amp-Hours which
corresponds to complete discharge of the battery in n hours ldquonrdquo is a subscript that
represents the discharge rate In industry the capacity under ten-hour discharge
rate (C10) is always taken as the nominal capacity
232 Electromotive force
The electromotive force of a battery cell is the difference between the electric
potential of the two electrodes of each cell (Rand Moseley et al 2004) The
potential of each electrode which is called half cell potential is decided by the
chemical reaction and the relative activities of the solution and can be obtained
from Nernstrsquos equation (Crompton 2000)
25
Ox
Redln0
α
α
zF
RTEE minus= (22)
where E is the half-cell potential (V)
0E is the standard half-cell potential (V)
α is the relative activity of the oxidizer (α Ox) and reducer (α Red)
z is the number of electrons transferred in the cell reaction
R is the universal gas constant which is 8314472 JKminus1molminus1
T is the absolute temperature
F is the Faraday constant the number of coulombs per mole of electrons
and F = 964853399times104 Cmolminus1
At room temperature RTF is a constant of 25693mV for cells therefore
Ox
Redlog
z
V05910
Ox
Redln
z
mV69325
Ox
Redln 10
α
α
α
α
α
α==
nF
RT
The Nernstrsquos Equation therefore can be expressed by
Ox
Redlog
V0591010
0
α
α
zEE minus= (23)
The electromotive force could be calculated by the difference of the electric
potential
cathodeanode EEEMF minus= (24)
When a lead-battery is discharging the electromotive force can be written as
26
O)(H
)(SO)(Hlog
V05910
2
2
24
10
00
α
ααminus+
+minus=z
EEEMF cathodeanode (25)
The standard half-cell potential of the anode 0
anodeE is equal to 1685 (PbO2-
PbSO4SO42-) and that of cathode
0
cathodeE is -0356 (Pb-PbSO4SO42-) which are
constants for the same battery chemistry And the number of electrons transferred
( n ) is 2 for a lead-acid battery
Therefore the electromotive force of a lead-acid cell can be obtained by
O)(H
)(SO)(HlogV029600412
O)(H
)(SO)(HlogV02960)3560(6851
2
2
24
10
2
2
24
10
α
αα
α
αα
minus+
minus+
+=
+minusminus=EMF
(26)
This electromotive force of a battery cell is numerically equal to the open circuit
voltage which means that the terminal voltage of a single cell battery when it is
disconnected from the external load For a lead-acid cell the electrochemical
force at fully charged is between 210-213V per cell
233 State of Charge and Depth of Charge
State of charge (SOC) and depth of charge (DOC) are variables that can describe
the battery charge The main difference is that the SOC describes the percentage
of remaining charge relative to the nominal capacity while the DOC represents
that relative to the actual capacity under a specific discharge current These two
27
variables can be obtained by calculating the charge consumed and the battery
capacity
101 CQSOC eminus= (27)
Ie CQDOC 1minus= (28)
where Qe is the charge consumed by the load (Ah)
C is the nominal capacity (Ah)
CI is the actual capacity under the discharge current I (Ah)
234 Internal Resistance and State of Health
The internal resistance of a lead acid cell is the physical resistance of the cell The
value of the internal resistance is decided by many different factors But it could
be obtained by a simple equation
I
VVr tOC minus
= (29)
where Voc is the open circuit voltage (V)
Vt is the terminal voltage when discharging (V)
I is the discharge current (A)
However the factors in this equation are only a method of calculating the internal
resistance but not the determinants It is shown in applications that the internal
resistance of a lead-acid battery will increase when discharging as the SOC and
28
the DOC drops
It is common for batteries to suffer a capacity loss when discharged and charged
in a number of duty cycles even when idle Aged batteries are often weak and
sometimes not able to offer enough charges Therefore they should be replaced or
maintained State of health is a defined variable that is important for a weak
battery This variable is to show how weak the battery is and represents the
percentage of remaining capacity to the initial capacity when the battery is brand
new (Okoshi Yamada et al 2006) as shown in the equation
new
weak
C
CSOH = (210)
where Cweak is the remaining capacity of a weak battery (Ah)
Cnew is the capacity when the battery is brand new (Ah)
The reason for the capacity loss is complex but is usually due to the sulphation
Sulphation is a process when the amorphous lead sulphate which is easily
converted back to lead lead oxide and sulphuric acid converts to a stable
crystalline form coating the electrodes This form of lead sulphate cannot conduct
electricity and cannot be converted back to lead lead dioxide and lead sulphate
under normal charging conditions The internal resistance of a lead-acid battery
therefore increases and less charge can be provided when discharging Complete
or repeated deep discharges of a battery at low current densities that lead
excessive utilization of the active material are the most critical reason for
29
capacity loss for example a discharge of a traction battery that draws more than
80 of its nominal capacity (Berndt 1993)
235 Multi-Cell Lead-Acid Batteries
In most applications of batteries the voltage of an individual cell is not enough to
provide the sufficient voltage and power supply The solution is usually to series
connect a number of cells in a battery in order to achieve a higher battery voltage
The electromotive force of a series of lead-acid battery cells is directly related to
the cell numbers as well as the charge state of each cell For a six-cell lead-acid
battery which is a standard for most common usages the fully charged
electromotive force is about 128V The internal resistance of a multi cell battery
however is also equal to the sum of the internal resistances of each cell
Usually all the cells in a multi-cell battery should be constructed in the same
manner and in particular the capacity should be consistent because the capacity of
a multi-cell battery will be limited to the cell with the lowest capacity If one of
the cells fails it is not possible for the current to flow through the cell and the
battery is therefore disconnected from its internal cell loss Also if the SOC of one
particular cell drops faster than others in a battery the electromotive force of that
cell may affect the whole behaviour of the battery
24 Summary
The technology development of lead-acid batteries has been continuous over the
30
last 150 years From the earliest open cell batteries different advanced battery
configurations are now available which have been adopted in a wide range of
applications Meanwhile a number of solutions have been developed to address
the battery problems encountered in applications such as electrolyte evaporation
spillage and the electrolysis of electrolyte when charging However there are still
issues affecting the efficient and safe use of lead-acid batteries for example
determination of the SOH which if addressed in a robust manner would lead to
significant improved battery management system performance This chapter has
presented the essential fundamental knowledge technology terms and working
principles of lead-acid batteries which is served as a preparation for further study
reported in the following chapters of the thesis
In order to reveal the dynamic behaviour of a battery under different SOH and
identify the suitable strategy for SOH determination the mathematical modelling
study is carried out and an equivalent circuit model is derived in the next chapter
The key concepts of the battery model are explained and the fundamental analysis
is given for the concepts introduced
31
Chapter 3
Equivalent Circuit Modelling
of Lead-acid Batteries
In order to estimate the status of a battery a model based approach is adopted in
the project A mathematical model for lead-acid batteries should be developed
with a suitable level of abstraction This chapter describes the requirements to the
model to serve the project objectives and reviews the available model
technologies An improved mathematical model for lead-acid batteries is
introduced in the late part of this chapter
31 Requirements for the Battery Model
The main objective of the project is to develop an algorithm that can determine
the battery health by monitoring the battery status during discharge cycles This
algorithm is designed for implementation in a battery health monitoring system
with life-time prediction capabilities This prediction system is intended to work
on applications where the battery performance is of great importance for instance
hospital UPS systems and vehicle ignition systems To achieve the objective the
requirements to the mathematical model can be defined as
Requirement 1 The model should be able to calculate the evolution of key
battery parameters including terminal voltage cell temperature the state of health
32
and the internal resistance which describe the condition of the battery for
dynamical discharging It should also be able to adequately represent dynamic
processes while the battery is discharging
Requirement 2 The complexity of the model must be sufficient to satisfy the
requirement 1 but must also be executable in real-time for a model-based
condition monitoring system
Requirement 3 The output of the battery model should be understandable to the
battery operators and technicians as well as meaningful to those who do not have
any background in battery technologies
32 Overview of Battery Model Techniques
A number of different types of battery models have been used to serve as a tool in
solving a range of problems (GONG 2005) These include Electrochemical
Models Computational Fluid Dynamics Models Finite Element Models and
Equivalent Circuit Models This section gives an overview to the above named
four different types of battery models and the problems which are addressed by
each of them In Section 324 every battery model technology is assessed against
the overall requirements
321 Electrochemical Model
Electrochemistry is a branch of chemistry that studies chemical reactions which
33
take place in a solution at the interface of an electron conductor (a metal or a
semiconductor) and an ionic conductor (the electrolyte) The reactions involve
electrons transfering between the electrode and the electrolyte or species in
solution The application of electrochemistry research directly leads to the
development of the lead-acid batteries
Behaviour of a battery depends not only on how the battery is used but also on a
number of construction factors (Ruetschi 2004) These factors include but are not
limited to the thickness of the plates the active mass density of the active
material the concentration of the acid solution and the geometry of the electrodes
(Berndt 2001 Ruetschi 2004)
The electrochemical model is mainly focused on the oxidationreduction reactions
between the electrolytes and the electrodes By analyzing the consistency of each
matter in the solution and the electrochemical reaction caused by the connection
of electrodes to external circuit it is possible to represent the dynamic behaviour
of the battery (Crompton 2000)
322 Physical Models
The finite element method is a numerical analysis technique for finding
approximate solutions of partial differential equations as well as of integral
equations The basic principle of the Finite Element Model (FEM) is to divide the
problem into elements and each element is a smaller problem to be solved so that
they could be analyzed separately The lsquoelementsrsquo are then be assembled together
34
to restore the initial problem
Finite element is a very popular method of analysis in those areas with a complex
geometry and it is good at stress and thermal analysis For batteries the Finite
Element Models can help with a good understanding of the heat loss and that for
vibration problem in mobile applications There are also attempts to analyze the
current density on the positive grid bar in a lead-acid battery using FEM (Ball
Evans et al 2002)
Computational Fluid Dynamics (CFD) technology is a well-established tool for
physical analysis and optimization of fluid flow mass and heat transfer and
related phenomena (eg chemical reactions) that may simultaneously take place in
a complex system (Liaw Gu et al 1997) Computers are used to perform millions
of calculations required to simulate the interactions of fluids and gases with the
complex surfaces used in engineering
In a CFD Model of a battery the dynamic governing equations are solved with
respect to time space and all the physical time and space dependent properties
Acid concentration and potential distribution across the cell for instance can be
obtained Therefore such a modelling is able to give a very good understanding to
battery parameters and detailed characteristic of battery dynamics
323 Equivalent Circuit Model
An equivalent circuit refers to the simplest form of a circuit that retains all of the
35
electrical characteristics of the original (and more complex) circuit In its most
common form an equivalent circuit is made up of linear passive elements
However more complex equivalent circuits are used to approximate nonlinear
behaviours of the original circuit as well
In electrical engineering it is often useful to use an equivalent circuit model to
describe the non-ideal operation of a device For electrical engineers electrical
models are intuitive useful and easy to handle especially when they can be used
in circuit simulators and alongside application circuits
324 Discussion of Different Battery Model Methods
The electrochemical model focuses on the electrochemical reactions and the
activities in the battery which is very popular in the applications for the
constructional and design purpose However many electrochemical factors
contained in the electrochemical model are irrelevant to the external circuit and
some of the important parameters like the internal resistance are hard to describe
in an electrochemical model Therefore this model technology is not able to meet
the project Requirement 1 As the calculations in the electrochemical model are
not complicated Requirement 2 can be therefore satisfied by an electrochemical
model of battery Requirement 3 might be difficult to obtain for an
electrochemical model because the understanding of the outputs for an
electrochemical model usually need some background knowledge of the battery
chemistry As a result the electrochemical model is not chosen for the project
36
Physical models can give good understanding to the battery important parameters
so that Requirement 1 of the project can be satisfied The Requirement 3 can be
also met as the terminal voltage can be calculated as the output with the
knowledge of these parameters One significant disadvantage is that the physical
models involves huge amount of calculation in analysis which is quite time
consuming In finite element or CFD methods a large nonlinear system of
equations is solved iteratively and that could take excessive CPU time especially
for when the system is more than 2 dimensions As a result the physical
modelling methods cannot meet the Requirement 2 of fast response required by
the project (Esfahanian Torabi et al 2008)
In an equivalent circuit model most of the characteristic required by the project
can be reached in a reasonable level It is able to reflect the dynamic behaviour of
battery using simple circuit blocks such as voltage sources resistors and
capacitors (Chen and Rincacuteon-Mora 2006) That is to say the Requirement 1 of
the project can be satisfied by the equivalent circuit model And the model
simplicity causes its low computational time as Requirement 2 and therefore it
can be suited to the online implementation (Esfahanian Torabi et al 2008)
Additionally basic battery parameters like internal resistance terminal voltage
and SOC etc can be chosen as the main output of the model to meet the
Requirement 3
Table 3-1 summarized a comparison of all the three model methods on the
satisfaction of the requirements for the project
37
Table 3-1 Satisfaction of the Requirements in different Model Methods
Requirement 1 Requirement 2 Requirement 3
Electrochemical Model times radic times
Physical Model radic times radic
Equivalent Circuit Model radic radic radic
33 Introduction of the Existing Equivalent
Circuit Models
Section 32 introduced three different types of battery models to serve for different
research purposes each with different features and strengths It has been shown
that the equivalent circuit model that pays attention to the relationship between the
internal circuit and the external characteristics can adequately meet all the
requirements of the project Therefore further studies of battery models have been
carried out and six equivalent circuit battery models with different merits and
complexity are presented while the technique improvements are briefly described
in this section
331 Simple Battery Model
The Simple Battery Model is the simplest battery model As shown in Figure 3-1
this model consists of only ideal battery mE as the electromotive force of a battery
and a resistor r in series connection as the internal resistance bV in the figure is
the terminal voltage of the battery
38
Figure 3-1 Simple Battery Model
The Em in Figure 3-1 stands for the electromotive force of the battery while r
represents the internal resistance and Vb is the Terminal Voltage This model is
only applicable in some circuits where the state of charge is of little importance
because it does not consider the varying characteristic of the internal resistance in
different states of charge The model is often used in circuits where the battery
does not have major influences to the circuit analysis But without being able to
describe the battery behaviours in details this model is not suitable for the
research purpose In the Simple Battery Model the electromotive force mE can be
obtained by open circuit measurement and r can be calculated by measurement
with connecting a load to the battery after taking an open circuit measurement
For a battery with a terminal voltage of 13V and the internal resistance of 05Ω
the change of terminal voltage in a Simple Battery Model as the discharge current
increases can be given as Figure 3-2
39
Terminal
Voltage
Discharge
Current
0
10V
13V
Figure 3-2 I-V chart of the Simple Battery Model
332 Advanced Simple Battery Model
This model is developed based on the Simple Battery Model and has the same
block diagram as the Simple Battery Model The only difference is that this model
employs a variable resistor which depends on the state of charge (CUN
FIORINA et al Durr Cruden et al 2006) The relationship between the value of
the variable resistance and the state of charge is as follow
aSOC
Rr 0
= (31)
where 0R is the resistance of the battery when it is fully charged
a is the capacity coefficient
SOC is the state of charge of battery from 0 (completely discharged) to 1
(fully charged)
6A
40
The most important improvement of this model is that instead of a constant
internal resistor the value of the internal resistance is expressed as equation
function of SOC For the same battery described in section 331 the I-V chart in
different SOCs can be concluded as shown in Figure 3-3
Terminal
Voltage
Discharge
Current
0
10V
13V
SOC=1
SOC=60
Figure 3-3 I-V Chart in different SOC
333 Thevenin Battery Model
The previous models do not account for any transient behaviour of batteries
Figure 3-4 shows the gradual change in battery characteristics when external loads
are connected or disconnected to the battery
6A
41
011
14
125
Terminal
Voltage
t
Figure 3-4 Sketch to show battery discharge behaviours in typical tests
Thevenin Battery Model is one commonly used model which consists of an ideal
battery electromotive force ( mE ) internal resistance (0R ) overvoltage resistance
(1R ) and capacitance (
1C ) and the equivalent circuit is shown in Figure 3-5
(Casacca and Salameh 1992 Salameh Casacca et al 1992 Chan and Sutanto
2000) 1C represents the actual capacitance of battery and
1R represents the
resistance contributed by the contact resistance of the plate and the electrolyte
(Durr Cruden et al 2006) The capacitance in the Thevenin Battery Model can
overcome the trend of terminal voltage shown in Figure 3-4
No load No load Load
42
Figure 3-5 Thevenin Battery Model
The main disadvantage of this Thevenin Battery Model is that all the parameter
values are assumed to be constant but in fact they are strongly dependent on the
state of charge and discharge rate and some other discharge characteristics
334 Dynamic Battery Model
This model is developed based on the Thevenin Battery Model Similar to the
improvements made by the Advanced Simple Model comparing with the Simple
Battery Model the most important difference is that it takes into account the non-
linear characteristic of the open circuit voltage and internal resistance represented
by SOCK (Jayne and Morgan 1986 Sims 1990)
ISOC
KRVV bocb )( +minus= (32)
where bV is the terminal voltage of battery
ocV is the open circuit voltage
bR is the battery terminal resistor typically 01Ω
43
K is the polarization constant
I is the discharge current
335 Fourth Order Dynamic Model
This is a more accurate and sophisticated model The current pI flows through
pR (electrolyte reaction) dR (Ohmic effect) and its associated leakage
capacitance dC and wR (waste of energy) and its associated leakage
capacitance wC Current sI flowing through the resistor sR represents the
behaviour of self discharge (Gillioli and Cerolo 1990 Chan and Sutanto 2000)
The main drawback of this model just as its name indicates is that there are
fourth order equations due to consideration of the paralleled R-C blocks in the
circuit and therefore it takes more time for the computation Another drawback is
that a number of empirical parameters are contained in the model
Figure 3-6 Fourth-order Battery Model
44
336 Improved Battery Model
The most popular Equivalent Circuit Model used by researchers is the Improved
Battery Model (Casacca and Salameh 1992 Salameh Casacca et al 1992) This
model is simple but meets most requirements for a good battery model It contains
most non-linear characteristics and is linked to the state of charge Most elements
included in this model are the functions of the state of charge or the open circuit
voltage which is also related to the state of charge The improved model is
studied in this chapter and implemented in MatlabSIMULINK environment
Figure 3-7 Improved Battery Model
34 Mathematical Model of the Lead-acid
Batteries
As the Improved Battery Model is able to reflect the major dynamic behaviours of
a battery and does not take much computation time it meets the requirements for
45
the project Therefore the mathematical model developed in this project is based
on the Improved Battery Model by involving the components of variable voltage
sources as the electromotive force ( EMF equal to the open circuit voltage OCV )
variable resistors as internal resistance and overvoltage resistance and a capacitor
as the capacitance of battery The description and the detailed analysis of the
model are given in this section
341 Capacity
Based on the Peukertrsquos law introduced in Chapter 2 the relationship of capacity
with different discharge currents is obtained below
2121
2211
)( ttII
tItIC
k
kk
p
=
== (33)
And following the definition of battery capacity the capacity is
12
1
2111
1
21121121121222 )()())(()( I
kkkk
I CIItIIItIIIIItIIItICminusminus
=====
12
1
21 )( I
k
I CIICminus
=there4 (34)
where Cp is the one ampere capacity
CI2 CI1 is the capacity under the discharge current I2 I1
k is a constant that related to the battery
The equation of calculating the capacity by the discharging current can be
46
obtained through experiments (Ceraolo 2000 Barsali and Ceraolo 2002) An
experimental result is given as
m
c
c
IIK
CKIC
))(1(1)( 0
0minus+
= (35)
where )(00 ICC = which stands for the capacity when discharging at the rated
discharge rate usually the nominal capacity C10
cK is empirical coefficient and is 118 for lead-acid batteries
m is empirical coefficient of 120
This equation overcomes the inadequacies of the Peukertrsquos law The capacity
calculated by the Peukertrsquos law in a low discharge current is much larger than that
experimentally obtained (Ceraolo 2000)
With the parameters of 20118124420 ==== kKAIAhC c the simulation
study indicated that the capacities of low discharge rate (lt30A) in different
equations are quite similar as shown in Figure 3-8
47
0 5 10 15 20 25 30 35 40 45 500
10
20
30
40
50
60
70
80
Discharge Current (A)
Actu
al C
apacity (
Ah)
Based on Peukerts law
Based on the Equation 35
Based on the Equation 35
Based on thePeukerts Law
Figure 3-8 Battery Capacity vs Discharge Current
Variations of the cell temperature also affect the battery capacity The effect of
temperature on the battery capacity is described by the following equation
(Ceraolo 2000 Barsali and Ceraolo 2002)
ε
θ
θθ
minus+=
f
ICIC 1)()( 0 (36)
where fθ is the electrolyte freezing temperature and is equal to -40˚C
θ is the cell temperature
)(0 IC is the capacity of battery under the discharge current I at 0˚C
ε is a constant that equals to 129
48
Therefore
m
c
f
c
IIK
CK
IC))(1(1
1
)(
0
minus+
+
=
ε
θ
θ
θ (37)
342 Electric Networks
Figure 3-9 (Ceraolo 2000 Barsali and Ceraolo 2002) shows an adaptation of
electric network based on the improved battery model shown in Figure 3-7 The
major change of this equivalent circuit is that the self-discharge is not taken into
account because the self discharge is usually less than 10 per month in modern
technologies which can be ignored in normal applications
Figure 3-9 Lead-acid Battery Equivalent Network
In the figure mE in this the main branch represents the electromotive force of the
battery and Vb stands for the terminal voltage The mZ in the figure stands for the
internal impedance that can be approximated by two R-C blocks
49
Battery is an energy storage device but not all the energy that the battery gets
from the charger can be stored when a battery is charged Part of this energy is
lost for different reasons like water electrolysis A parasitic branch is therefore
added to the model to represent the energy loss This part is claimed to work only
when the battery is being charged (Ceraolo 2000 Barsali and Ceraolo 2002) In
this project the current of the parasitic branch pI in the figure can be described as
an equation of the voltage of the parasitic branch PNV instead of a simple resistor
pR because of the nonlinear character of the parasitic branch This issue will be
discussed in later sections
As a result of these factors an equivalent electric network of in Figure 3-9 is
designed as shown in Figure 3-10 in which 1C 1R and 0R are the elements of the
internal impedance mZ It is used in the whole project as the electric network of
mathematical model
Figure 3-10 The Equivalent Network with the Approximated mZ
50
343 State of Charge and Depth of Discharge
In Chapter 2 Equations 27 and 28 show the definitions of SOC and DOC of a
battery In the model the nominal capacity can be treated as C(0θ) while the
actual capacity is C(Iavg θ) therefore
)0(1 θCQSOC eminus= (38)
)(1 θavge ICQDOC minus= (39)
where σσ dItQt
e int=0
)()( is the charge already drained from the battery
)0( θC is the nominal capacity of battery
)( θavgIC stands for the actual capacity under the specific discharge
current
344 Electromotive Force of the Battery
The electromotive force of a battery which is Em in Figure 3-10 is the difference
between the electric potential of the two electrodes and can be calculated by the
Nernstrsquos equation (Eq 26)
)(
)()(log029600412
2
2
24
10OH
SOHEMF
α
ααminus+
+=
This equation gives a description of the electromotive force by the activity of
different matter in the sulphuric acid which is described as lsquoαrsquo When the battery
51
is being charged or discharged the electrolyte concentration changes and the
activity value of H+ SO42- and H2O in the Nernstrsquos equation changes which can
be found by the study of battery that is the EMF of battery will change as the
result of the change of state of charge The relationship between SOC and the
activity α is unknown but it is obviously that when the state of charge increases
the quotient of )(
)()(
2
2
24
OH
SOH
α
ααminus+
also increases This shows that the EMF rises
when the state of charge is increasing
From the literatures (Ceraolo 2000 Barsali and Ceraolo 2002) the electromotive
force is described simply as the following equation
)1)(273(0 SOCKEE Emm minusminusminusminus++++minusminusminusminus==== θ (310)
where 0mE and EK are constants for a battery
θ is the temperature of the cell
SOC is the state of charge of the battery
345 Internal Resistance of a Battery
The resistances of a battery as shown in Figure 3-10 can be calculated by the
equations (Ceraolo 2000 Barsali and Ceraolo 2002)
)]1(1[ 0000 SOCARR minus+= (311)
)ln(101 DOCRR minus= (312)
52
)exp(1 22
)]1([
202
21
IIA
eRR
m
SOCA
+=
minus
(313)
where 0A 21A and 22A are constants for a battery while 00R 10R 20R are
parameters related to the SOH which will be discussed in later chapters For the
model 020 asympR and can be omitted when a battery is discharging
Therefore the internal resistance of a cell when discharging is
)ln()]1(1[ 1000010 DOCRSOCARRRr minusminus+=+= (314)
346 The Behaviour of Parasitic Branch
When the battery is being charged there are some losses as represented by the
parasitic current This current depends on the electrolyte temperature and the
voltage at the parasitic branch (Ceraolo 2000)
Because the behaviour of parasitic branch is non-linear Tafel gassing-current
relationship is used instead of a simple resistance pR (Ceraolo 2000)
minus+= )1(exp
0
0
f
p
P
PNPPNp A
V
VGVI
θ
θ (315)
where pI is the current of the parasitic branch
PNV is the voltage of the parasitic branch
53
0PG is a constant in seconds
0PV is a constant in volt
pA is a constant
θ is the electrolyte temperature
fθ is the electrolyte freezing temperature and is equal to -40˚C
When the battery is being discharged 0asymppI the parasitic branch could be
omitted from the model in simulation if the charging behaviour is not necessary
to discuss
347 Main Branch Capacitance
In the electric network of the model there is an R-C circuit as shown in Figure
3-11
Figure 3-11 R-C block
where Im is the discharge current
IC1 is the current flow through the capacity branch
54
I1 is the current of R1
VR1 is the voltage over the R-C block
This branch can be solved by
))(
()( 11111111
dt
tdVCIRIIRIRV R
mCmR minusminusminusminus====minusminusminusminus====sdotsdotsdotsdot==== (316)
)()()(
111
11 tIRtVdt
tdVCR mR
R====++++ (317)
This is the differential equation that represents the main branch behaviour
Laplace transform is employed to solve this problem
)()( 1111 sIRsVSCR mR sdotsdotsdotsdot====sdotsdotsdotsdotsdotsdotsdotsdotsdotsdotsdotsdot (318)
1
)(
11
11
++++
sdotsdotsdotsdot====
SCR
sIRV m
R (319)
++++
====++++
========
SCR
C
SCR
R
I
VsG R
11
1
11
11
1
1
1)( (320)
where τ=11CR is the time constant that represents the double layer capacitance
When the current has a shape like a step and the initial voltage of the capacitor is
equal zero the solution in time becomes
m
t
R IeRtV )1()( 11τ
minus
minus= (321)
55
It is obviously that this equation is the typical form of the voltage with an R-C
circuit
348 Thermal Behaviour of a Battery
When the battery is charging or discharging there is a current flow through the
battery so that it produces heat due to the Joules law
0
2
1
2
12 RIRVIVVIP RPNps sdot++sdot+sdot= (322)
When discharging the parasitic branch and R2 are omitted the equation becomes
0
2
1
2
1 RIRVP Rs sdot+= (323)
The dynamic equation of cell temperature and the power is (Ceraolo 2000)
s
a PRdt
dC +
minus=
θ
θ
θθθ (324)
where θC is the thermal capacitance
θR is the thermal resistance between the battery and the environment
θ is the cell temperature and aθ is the environment temperature
56
35 Mathematical Model of the Lead-acid
Batteries
Considering the behaviour of capacity state of charge and depth of discharge
electromotive force and internal resistance an Improved Battery Model based on
the equivalent circuit shown in Figure 3-10 was introduced in previous sections
The battery model for the complete discharging progress can be derived as the
following equations
m
c
f
c
IIK
CK
IC))(1(1
)1(
)(
0
minus+
+
=
ε
θ
θ
θ (325)
σσ dItQt
e int=0
)()( (326)
)0(1 θCQSOC eminusminusminusminus==== (327)
)(1 θavge ICQDOC minusminusminusminus==== (328)
)1)(273(0 SOCKEE Emm minus+minus= θ (329)
)]1(1[ 0000 SOCARR minus+= (330)
)ln(101 DOCRR minus= (331)
1
1R
Cτ
= (332)
IeRtV
t
R sdotminussdot=minus
)1()( 11τ (333)
0
2
1
2
1 RIRVP Rs sdot+= (334)
57
sa P
Rdt
dC +
minus=
θ
θ
θθθ
(335)
)( θIC in the equations is the expression of capacity of battery when discharging
under the discharge current I and at a temperature of θ 0C stands for the
capacitance when discharging at the rated discharge current I while parameters
fθ and ε are constants in this model )(tQe represents the charge already
consumed while the equation of mE indicates the mathematical description of
electromotive force corresponding to the SOC and the cell temperature in which
0mE EK are constants for a battery 00R 10R are parameters related to the SOH
and the discharge current can also affect them τ in the equations are the time
constant of the R-C circuit which represents the time it takes the systems step
response to reach ( 6311 asympminus e ) of its asymptotic value The last two equations
represent the thermal dynamic of battery in which sP is the Joule heat generated
by the internal resistance θC is the thermal capacitance and θR is the thermal
resistance between the battery and the environment
36 Summary and Discussion
The Improved Battery Model based on the electric equivalent circuit is presented
in this chapter and it is proved that it can satisfy all the three requirements to serve
the project objectives This battery model consists of a variable voltage source
several R-C blocks and a parasitic branch as its electric network and the elements
are described as a variable related to the capacitance the charge consumption and
58
the cell temperature as well
However experimental tests show that the behaviour of the battery is much more
complicated can be represented by this equivalent circuit model For example the
internal resistance varies when discharging under different current and the time
constant of the R-C circuit at the beginning and end of discharge as well
Therefore the model has to be improved The next chapter overcomes these
problems found in the experimental tests and some improvements of the model
are described
59
Chapter 4
Experimental System Set up and
Improved Battery Model
Simulation Implementation
Experimental tests based on a 12V-13 Ah lead-acid battery are carried out and the
test system is introduced at the beginning of this chapter Some of the
characteristics of the battery can be found in the tests which has shown that the
battery model described previously is not accurate enough and improvements
have to be implemented into the model This chapter will focus on the analysis of
the battery characteristics and the description of the improvements implemented
In the last part of this chapter a finalised version of the battery model used in this
project is given and implemented in the MatlabSIMULINK environment for
simulation study
41 The Experimental System
In this experimental test system a variable resistor is used as the load of the
battery Three sensors are employed in the whole experiment process two current
sensors and one voltage sensor The equivalent circuit of the test rig designed for
the research purpose is shown in Figure 4-1
60
Figure 4-1 Equivalent Circuit of the Experimental Test Rig
In this figure the ideal voltage source EMF accompanying with the internal
resistance r acts as a lead-acid battery with 6 cells (12V) the terminals of the
battery are connected in parallel to a voltage sensor Switch Krsquo is employed to
control the voltage sensor connection so that the sensor can be disconnected from
the battery when the experiment is not being in progress to avoid an unnecessary
discharge The circuit break in Figure 4-1 can be used as a main controller which
decides whether the load is engaged to the battery to discharge or not Switch K
in the experiment is to vary the load of the system This experimental test system
is mainly designed for two different experimental tests of a battery in this study
constant-impedance load discharge and two-load discharge Figure 4-2 shows the
actual laboratory test rig used in the project
61
Figure 4-2 Experimental Test Rig
The data is collected and recorded every half second by a data acquisition card
PCI-6251 from National Instruments with the software environment of LabVIEW
and a 12V-13Ah lead-acid battery (marked in the red-dashed square in Figure 4-2)
is employed in the project as test batteries for the battery performance study
42 Improvements of the Battery Model
Figure 4-3 and Figure 4-4 show the typical data collected from the experimental
test rig Figure 4-3 is the result of a constant-impedance load discharge test with a
discharge current of 075A approximately and Figure 4-4 shows two-load
discharge with the discharge currents of 075A and 12A respectively
62
0 500 1000 1500 2000 2500 3000 3500 4000 4500 5000-02
0
02
04
06
08
1
12
Time (s)
Dis
charg
e C
urr
ent
(A)
0 500 1000 1500 2000 2500 3000 3500 4000 4500 5000105
11
115
12
125
13
Time (s)
Term
inal V
oltage (
V)
Figure 4-3 Test of constant-impedance load discharge top figure shows the discharge current of the experimental test and the bottom one shows the terminal
voltage 1τ is the time parameter of the R-C block at the beginning of the
discharge and 2τ is that when the discharge stopped
0 200 400 600 800 1000 1200 1400
0
05
1
15
Time (s)
Dis
charg
e C
urr
ent
(A)
0 200 400 600 800 1000 1200 1400118
12
122
124
126
128
Time (s)
Term
inal V
oltage (
V)
Figure 4-4 Test of two-load discharge top figure shows the discharge current of the experimental test and the bottom one shows the terminal voltage
I(t)RI1 and I(t)RI2 represent the voltage drop across the internal resistance value under different discharge current
1τ 2τ
I(t)RI1
I(t)RI2
I(t)RI1
63
421 The Change of τ in Different Charge Status
From analyzing these figures it is easy to find that it takes quite a long time for
the battery to have the steady terminal voltage when the discharge of battery stops
and it is longer than the time taken from the beginning of the discharge This
difference means that when the battery starts to discharge the time parameter
11CR=τ in the main branch equation (332) is not equal to that when the
discharge has just stopped In Figure 4-3 it is shown that when the discharge stops
the time parameterτ is longer than that when the discharge starts
As a result of this experimental feature a switch is employed to implement the
change of time parameter to match those described in the mathematical model of
the battery The switch is used to control the value of the time parameter τ in
different discharge currents When the battery is discharging the discharge current
is a positive value and the time parameter τ is equal to 1τ When the battery is
not discharging the discharge current is equal to 0 in theory and the time
parameter has a different value 2τ
Although the discharge current should be equal to 0 theoretically it is hard to
achieve this in the real experimental measurement because of the inaccuracy of
the current sensor reading due to the inaccuracy occurred in the power supply to
the sensor Therefore the trigger of the switch in the model is set to be 01 A that
is when the discharge current is greater than 01 A the time parameter is set to be
1τ as the battery is in its discharging segment By contrast the value of time
64
parameter is set to be 2τ and the discharge current is considered as the error
caused by the sensors when that current is less than 01 A
422 Analysis in Variations of the Internal Resistance
Another important issue found through analyzing the experimental test result is
that the internal resistance for a specific battery in a specific state of health (SOH)
is not a constant when the discharging current changes This difference is more
significant than the effect caused by the state of charge
For example in the two-load discharge results shown in Figure 4-4 when the
battery is not discharging the initial voltage is equal to the electromotive force
(EMF1) When the battery began to discharge at the discharge current I1 the
terminal voltage dropped to V1 After the discharge stopped for a while the value
of the terminal voltage is equal to the electromotive force (EMF2) at that state of
charge (SOC2) Then the discharge of the battery starts again at a current of I2 and
the terminal voltage dropped to V2 The discharge progress is then stopped for
certain of a time period to get the steady terminal voltage (EMF3) at that state of
charge (SOC3) After that the test of discharge at the I3 = I1 was repeated again
and get another terminal voltage of V3 The last discharge test is done to provide
the evidence for the fact that this change in the internal resistance is not caused by
the change of the state of charge (SOC)
The value of electromotive force in a discharging battery is equal to the sum of the
terminal voltage and the voltage that the internal resistance takes that is
65
nnnn IrVEMF sdot+=
Therefore the internal resistance can be calculated by
n
nnn
I
VEMFr
minus= (41)
From the data collected in the experiment the key parameter values for the graphs
shown in Figure 4-4 can be found as listed in Table 4-1
Table 4-1 Approximate Internal Resistance Calculating
n 1 2 3
Electromotive Force (EMFn) 1260V 1252V 1238V
Discharge Current (In) 078A 114A 076A
Terminal Voltage (Vn) 1219V 1203V 1197V
Substituting these values into Equation 41 the internal resistance can be
calculated Ω=Ω=Ω= 539043005260 321 rrr
This change of the internal resistance can cause quite a significant effect in the
discharge progress This problem can be possibly solved in a number of ways
One possible choice is to find a curve of the internal resistance change and the
discharge current for a specific battery after a certain numbers of experimental
tests But this method needs huge efforts in conducting experimental tests and the
result is not very meaningful for the project considering the time cost Another
possibility is to conduct the experimental tests with a constant load Therefore the
change of internal resistance caused by the change of discharge current could be
ignored As a result in the whole process of this project the same load is
66
employed either in the constant-impedance load discharge or in the two-load
discharge tests
In order to implement the different internal resistance value when discharging
under different load a switch that can control the parameters R00 and R10 is
employed This switch is controlled by the discharge current which is the main
input of the mathematical model In the two-load discharge tests when the switch
K in Figure 4-1 is switched off there is only one load is connected to the battery
terminals and the discharge current is lower the values of R00 and R10 are
switched to the first set of parameters R001 and R101 To the contrast when K is
switched on the discharge current is higher and the values are switched to the
second set R002 and R102
423 Improved Lead-Acid Battery Mathematical Model
From the model described in Chapter 3 and the improvements studied in this
chapter the mathematical model of lead-acid battery when discharging in different
discharge currents can be described as the following equations
m
c
f
c
IIK
CK
IC))(1(1
)1(
)(
0
minus+
+
=
ε
θ
θ
θ (42)
ττ dItQt
e int=0
)()( (43)
)0(1 θCQSOC eminusminusminusminus==== (44)
)(1 θavge ICQDOC minusminusminusminus==== (45)
67
)1)(273(0 SOCKEE Emm minusminusminusminus++++minusminusminusminus==== θ (46)
)]1(1[ 0000 SOCARR minusminusminusminus++++==== (47)
)ln(101 DOCRR minusminusminusminus==== (48)
11
RC
τ= (49)
IeRtV
t
R sdotminussdot=minus
)1()( 11τ (410)
RIRVP Rs sdot+=2
12
1 (411)
sa P
Rdt
dC +
minus=
θ
θ
θθθ
(412)
)(
)(
2
1
002
001
00Load
Load
R
RR
= (413)
)(
)(
2
1
102
101
10Load
Load
R
RR
= (414)
)10(
)10(
2
1
AI
AI
lt
gt
=τ
ττ (415)
001R 002R 101R 202R and 1τ 2τ in the equations stand for different parameter
values of 10R 20R and τ when the load and charge status changes in order to
reflect the improvements described in this chapter For a two-load discharge test
there are ten important unknown parameters in the equations of the mathematical
model which are unknown for a specific battery 0C 0mE EK 001R 002R 101R
102R 1τ 2τ and 0A As the internal resistance R00 and R10 vary only when the
load changes they can be treated as constants in the constant-impedance load
68
discharge tests the key parameters are therefore 21100000 ττRRKEC Em
and 0A In this project the study of state of health is based on constant-impedance
load discharge The identification of these unknown parameters will be discussed
in Chapter 5
43 Simulation Study
The processes described above have been implemented in SIMULINK as a
simulation model for computer based analysis The simulation program consists of
two main function blocks circuit block and thermal block The structure of the
SIMULINK implementation is described in Figure 4-5
69
Figure 4-5 Structure of model for SIMULINK Implementation
70
As shown in the figure there are mainly two inputs in the model the discharge
current and the discharge time The actual capacity of battery can be then
calculated with the knowledge of rated capacity and the discharge current The
actual capacity is also influenced by the cell temperature At the beginning of
discharge the cell temperature is the same as the surrounding temperature
Integrating the discharge current with respect to time is the capacity consumed in
the discharge progress and then the state of charge and the depth of charge can be
obtained It is shown that the electromotive force and the internal resistance vary
as a result of changing in the state of charge and the depth of charge and the
terminal voltage can be calculated
In the thermal block of the model the heat generated by the current and the
internal resistance are calculated by the Joules law Then this energy is
transferred to calculate the thermal temperature of the cell and the cell
temperature is given back to the circuit block to affect the actual capacity
71
0 1000 2000 3000 4000 5000 6000 7000
0
02
04
06
08
1
Time (s)
Dis
charg
e C
urr
ent
(A)
0 1000 2000 3000 4000 5000 6000 7000105
11
115
12
125
13
Time (s)
Term
inal V
oltage (
V)
Figure 4-6 Terminal Voltage of Battery (Constant Discharge Current SIMULINK)
The result in Figure 4-6 shows the terminal voltage of a battery which discharges
under the current of 08A in a simulation study Since the discharge begins the
voltage drops due to the internal resistance and the change of state of charge (SOC)
and it climbs up when the discharge stops However the voltage changes
gradually because of the time parameter τ This result shows a good qualitative
agreement with the experimental test results
72
44 Summary and Discussion
This chapter introduces the laboratory test system designed for the project and the
limitation of the mathematical model described in Chapter 3 Switches on the time
parameter τ and the internal resistance parameters R00 and R10 have been added to
the model so that the model is able to represent the change of these parameters
found in the experimental tests The implementation of the model under the
MatlabSIMULINK environment is described and the simulation study shows a
good qualitative agreement with the experimental test results
The next chapter will focus on the identification of those unknown parameters of
the battery model that are important for revealing the battery characteristics
including 20100000 τARRKEC Em and 1τ
73
Chapter 5
Model Parameter Identification
and Model Validation
The identification of the unknown parameters 20100000 τARRKEC Em and 1τ
in the mathematical model will be introduced in this chapter
51 Need for the Optimization Algorithms
In those equations of the battery model described previously some parameters are
unknown and some of them are difficult to derive from physics or engineering
principles or to be obtained through experimental tests Therefore the
identification of the model unknown parameters becomes an important part for the
project Parameter identification is an optimization process that adjusts the
parameters to enable the simulation results to show the best agreement with the
results acquired by the experimental tests There are many algorithms available
for optimization and the principle of the optimization process for the project is to
minimize the objective function The objective function is formed by the absolute
value of the difference between the simulated and experimental results at each
time point The set of parameters to achieve the least value of the objective
function is considered to be the fittest set
74
There are two basic requirements of the optimization in this project First of all as
the problem for the solutions trapped to the local minima is a very important and
challenging issue in many linear optimization solvers the optimization algorithm
used in this project must be able to find the global minimum Secondly the
optimization algorithm not only should find the minimum value of the objective
function but also can tell the values of the parameters that result in the best fitness
which is needed for the analysis purpose in this project Finally the time cost is
also an important factor in selection of a suitable optimization algorithm
It needs to point that the objective here is to identify the unknown parameters of a
model with an already known structure If the objective is to identify or
approximate unknown model structures the selection of optimisation methods
will be quite different In the case of latter Neural Network Genetic
Programming and Fuzzy Logical will be more suitable choices To concentrate on
the objective of the project the thesis will focus on optimisation algorithms for
parameter identification
52 Overview of the Optimization Algorithms
Brute-force search is the most basic direct search algorithm that is used to find the
minimum value In the brute-force search the initial guess is the minimum
possibility of parameters and increasesdecreases The parameter
increasesdecreases step by step in each iteration and the best solution can be
75
searched This algorithm is the simplest but its disadvantage is also obvious that
is it is the slowest optimization method especially when used in the identification
of more than two parameters and the results are largely dependent on the initial
guesses
Linear search is an optimization method to solve the linear optimization problem
the preference function of which is linear and the feasible domain is defined by a
linear constraint function The linear constraints define a convex polyhedron
geometrically which is called the feasible region The algorithm is to construct an
admission solution at a vertex of the polyhedron and then along edges of the
polyhedron to vertices with successively higher values of the objective function
until the optimum is reached
Besides the basic optimization methods evolution computation technology is
becoming increasingly popular A range of different evolution computation
technologies can solve the optimization problem in this project including genetic
algorithms (GAs) particle swarm optimization (PSO)
Genetic Algorithms are direct search algorithms inspired from the process of
evolution in nature the natural selection Based on the principle of survival of the
fittest the GAs can produce better and better approximations to the global optimal
solution in a number of generations In each generation a new group of solutions
is created by the fitness level in the problem of every individual in the last
generation The solutions are then bred together to lead to the evolution of
individuals
76
Particle swarm optimization is a stochastic population-based computer algorithm
modelled on swarm intelligence that searches for a solution to an optimization
problem in a search space Based on the social psychological principles each
individual called lsquoparticlersquo in PSO is able to provide information to others and
also learn the success from the local best and the global best The movement of
each particle through the search space are guided by these successes and the
solution can be found after a number of generations
It has been proved by Dr Jianlin in his PhD Thesis (Wei 2007) that both Genetic
Algorithm and Particle Swarm optimization are capable of the model parameter
identification But the Particle Swarm optimization is a new algorithm that first
described in 1995 and it is not as common as Genetic Algorithm in the research
areas
The purpose of this research work is to find a method for parameter estimation
Genetic algorithms are well proven solution for complicated optimisation
problems and have been applied successfully in a range of similar problems (Wei
2007 Wei Wang et al 2007) Genetic algorithms are also well suited to problems
with many local minima In the current work the exact form of the fitness
function is unknown and it is therefore important to select a robust technique
which can identify good overall solutions For these reasons GA was selected to
give the best possible chance of satisfying the overall project objectives within the
limited timeframe of the project
77
53 The Study of the Genetic Algorithms
The process of Genetic Algorithm is reviewed in this section to provide an insight
into how GAs work and simulation study of two bench mark functions are carried
out
531 Working Principle of GAs
There are many methods used to implement a GA process and usually a GA is at
least composed of three common genetic operators Selection Crossover and
Mutation (Pham and Karaboga 1998) The flowchart of a simple GA process is
given in Figure 5-1
As a preparation to start the optimization process a GA requires a group of initial
solutions as the first generation The first generation is usually a group of
randomly produced solutions created by a random number generator The
population which is the number of individuals in a generation should be big
enough so that there could be a reasonable amount of genetic diversity in the
population Also it should be small enough for each generation to be computed in
a reasonable period of time using the computer resources available Typically a
population includes individuals between 20 and 100 (Chipperfield Fleming et al
1994A)
78
Figure 5-1 Flowchart of a Simple Genetic Algorithm (Pham and Karaboga 1998)
The fitness function is evaluated to measure how close that the individuals fit the
desired result A fitness function could be either complex or simple depending on
the optimization problem addressed In a case of minimization problem the most
fitted individuals will have the lowest numerical value of the associated fitness
function
No
Yes
Selection
Crossover
Mutation
Find the Best Individual
Generate initial population
Results
Evaluate fitness values
Operators of generating new
generation
Gengt 100
Evaluation
Start
79
Individuals are selected according to a fitness-based process The operator of
selection is made up of ranking and selection progress by which more copies of
the individuals that fit the optimization problem better will be produced in the
next generation In GAs there are mainly two ways to select a new population
Roulette Wheel Selection (RWS) and Stochastic Universal Sampling (SUS)
The individuals will be recombined (crossover) after the selection This operation
is to produce two new individuals from two existing individuals selected by the
operator of selection by cutting them at one or more position and exchanging the
parts following the cut The new individuals therefore can inherit some parts of
both parentsrsquo genetic material There are usually four ways of doing this one-
point crossover two-point crossover cycle crossover and uniform crossover
(Pham and Karaboga 1998) Figure 5-2 (a) shows an example of the two-point
crossover progress
Mutation is another operator to produce new individuals The difference is that the
new individual is produced from a single old one In this operation the bit values
of each individual are randomly reversed according to a specified property A
mutation can also helps the GA to avoid local optimums and find the global best
solution Figure 5-2 (b) represents how the mutation operator works
80
Figure 5-2 (a) Crossover operation (b) Mutation operation
The group of individuals produced after the mutation is the second generation
Then the fitness value of each individual in the second generation is computed
again This cycle will not stop until the result is close enough or after a certain
generation
Three major Matlab toolboxes are applied in the current market for application
purpose they are Genetic Algorithms Toolbox V12 (Chipperfield Fleming et al
1994B) the Genetic Algorithms Optimization Toolbox V11 (Houck Joines et al
1995) Genetic Algorithm Direct Search Toolbox V102 (MathWorks Inc 2004)
In this project the official toolbox in Matlab form Mathworks Inc is employed
The property settings for the project based on Dr Weirsquos thesis (Wei 2007) are
shown in Table 5-1
Parent 1 1 1 0 0 1 0 1 1 0 1 0 1 1
Parent 2 0 1 1 0 1 1 0 0 1 0 1 0 0
Offspring 1 1 1 0 0 1 1 0 0 1 1 0 1 1
Offspring 2 0 1 1 0 1 0 1 1 0 0 1 0 0
(a)
Parent 1 1 0 0 1 1 0 0 1 1 0 1 1
Offspring 1 1 0 0 1 0 0 0 1 1 0 1 1
(b)
81
Table 5-1 The property settings for Genetic Algorithms
Name of the GA properties Value of the GA properties
Number of generations 100
Population size 20
Fitness assignment Rank-base fitness assignment
Selection Stochastic universal sampling
Crossover Scattered crossover
Crossover rate 07
Mutation function Uniform mutation
Mutation rate 01
Population size specifies how many individuals there are in each generation With
a large population size the genetic algorithm searches the solution space more
thoroughly and the gives more possibility to return the global minimum The
number of generations specifies the maximum number of iterations for the genetic
algorithm to perform If this number is too low the genetic algorithm is not able
convergence to the global solution However either a large population size or a
large number of generations can cause the algorithm to run more slowly The
crossover rate and the mutation rate are properties that control the crossover and
mutation operator High rate of these values means that the genetic algorithm has
a higher opportunity of producing new offspring but it can be easy to miss the
current best solution if these values are too big
Initial tests of genetic algorithms on different properties show that the values
shown in table 5-1 are able to find an adequate solution Similar results would be
82
obtained if the values of the generations and the population size are larger but
costing more CPU time The crossover rate and the mutation rate would not affect
the result significantly if only varies in a small range But it is impossible to prove
that these two values are the best choice due to the strong randomness
532 Simulation Studies of Genetic Algorithms
In order to test and demonstrate that Genetic Algorithms are able to meet the
requirements of the project simulation studies have been carried out Two
benchmark functions that are commonly used in evaluating evolutionary
computation algorithms are employed for the simulation studies They are
1) Rastrigin function
Rastrigin function is a typical example of non-linear multimodal function with
many local minima The problem of looking for the global minimum is quite
difficult due to its large search space and its large number of local minima The
function is shown as
))2cos(10(10)(1
2sum=
sdotsdotminus+sdot=
n
i
ii xxnXf πr
where n is the dimension of the problem and 1x ~ nx are the coefficients to be
identified Figure 5-2 shows a 2-dimensional Rastriginrsquos function while figure 5-3
is a contour plot of Rastrigins function shows the alternating maxima and minima
83
The global minimum of the Rastriginrsquos function is 0)( =Xfr
when
021 ==== nxxx L
Figure 5-2 2-dimensional Rastrigins function (MathWorks Inc 2004)
84
Figure 5-3 Contour plot of Rastrigins function (MathWorks Inc 2004)
In the simulation study a ten dimensional Rastriginrsquos function is adopted Figure
5-4 shows the best optimization performance of the Rastriginrsquos function in each
generation It is shown that after 700 generations a global optimal value is
obtained
85
0 100 200 300 400 500 600 700 800 900 10000
10
20
30
40
50
60
70
80Best 00099429
Generation
Fitness v
alu
e
Best f itness
Figure 5-4 GA performance (Rastrigrinrsquos function)
2) Rosenbrock function
Rosenbrock function is another mathematical function used as a test problem for
optimization algorithms The global minimum is inside a long narrow parabolic
shaped flat valley To find the valley is trivial but to converge to the global
minimum is difficult The Rosenbrock function is defined by
sum=
+ minus+minus=
n
i
iii xxxXf
1
2221 ))1()(100()(
r
where n is the dimension of the problem and 1x ~ nx are the coefficients to be
identified Figure 5-5 shows a 2-dimensional Rosenbrock function
86
The global minimum of the Rosenbrock function is 0)( =Xfr
when
121 ==== nxxx L The same as the Rastriginrsquos function a ten dimensional
Rosenbrock function is adopted for the simulation study Figure 5-6 is the GA
performance to the Rosenbrock function It can be found that the optimization
converges and get the global optimal value after 300 generations
Figure 5-5 2-dimensional Rosenbrock function (MathWorks Inc 2004)
87
0 100 200 300 400 500 600 700 800 900 10000
200
400
600
800
1000
1200Best 060113
Generation
Fitness v
alu
e
Best fitness
Figure 5-6 GA performance (Rosenbrock function)
54 Model Parameter Identification
541 Implementation of Genetic Algorithms and
Experimental Data sets
In this project the Genetic Algorithm Direct Search Toolbox V102 developed by
Mathworks Inc is employed to identify the parameters of the battery model The
process is shown in Figure 5-7
88
Figure 5-7 Progress of Parameter Identification
The fitness function is used in the project and the parameter identification is to
minimize the fitness function so that the model output can fit the experimental
result The fitness function is given as
sum
sum sumsum
minussdot=
minussdot++minussdot+minussdot=
minus
1
0
2
1 1
1
0
))()(()(
)()()(
exp
expexp2exp1
t
t
sim
t
t
t
t
simnsim
t
t
sim
tVtVabstW
VVabsWVVabsWVVabsWfitnessn
n
L
where Vexp is the experimental terminal voltage data
Vsim is the simulated terminal voltage
Wt is the weights of the difference in the simulated and experimental
results
This fitness function represents the sum of the error values at each time interval
Mathematical Model of a six-cell
Lead Acid Battery
Experimental Test
Results
Fitness
Function
Discharge Current
Simulation
Output
Terminal Voltage
Simulation
Input
lt fmin
Genetic Algorithms (Selection Crossover and Mutation
etc)
Parameter Update
Yes
No
Stop
89
considered ( ntt minus0 ) The weight coefficients Wt indicates how important the
weighted part is in the optimization and how much it contribute to the
optimisation process Periods with bigger tW values are more important because
the sum of errors will give big value contribution to the fitness function value and
the optimisation process will pay more attention to the higher weighted error parts
In the experiments and optimization process it is found that the results were more
important when the discharge of a battery at the stage of stopping Therefore the
weight in this period is greater than that of the others The weighting coefficient
values in this project are determined by the results of the first several attempts of
parameter identification The period of simulation data that fails to fit the test
result means that the weight value is not big enough until the overall performance
of simulation is reasonable
Following the objective fitness function unknown coefficients of the battery
model are identified using experimental data The mathematical model of a six-
cell lead-acid battery in the figure is described in Chapter 4 and the parameters are
to be identified by Genetic Algorithms are 210100000 ττARRKEC Em
Three sets of experimental tests have been carried out for the purpose of
parameter identification and the validation of the mathematical model These three
experimental results are based on a lead-acid battery with the ideal capacity of 13
Ampere-hours under the discharge current of 08A
90
542 Parameters of Battery Model
The parameters of the mathematical model of a lead-acid battery are identified
using Genetic Algorithms and the predicted battery responses using the identified
parameters are compared with the simulated results One set of typical values of
parameters identified are listed in Table 5-2
Table 5-2 Identified parameters identified by the Genetic
Algorithms in the model of 12V-13Ah lead-acid battery Parameter Value Parameter Value
0C 48198 (Amp-Sec) 0mE 21465 (V)
EK 0001109 (V) 0A 29895
00R 001038 (Ohm) 10R 012196 (Ohm)
1τ 21052 (s) 2τ 17565 (s)
Figure 5-8 shows the simulation results using the Improved Battery Model and the
change of weights defined for this set of result described in the fitness function
The top subplot of Figure 5-8 shows the weight value of the GA fitness function
described before while the middle figure is the discharge current of the
experimental test which is also the input of the mathematical model In the
following test results in this and next chapter the changes of weight value are
similar so they are not shown in the figures
The blue line marked as ldquoExperimental Terminal Voltagerdquo in the bottom figure
represents the measured outputs while the other one (Simulated Terminal Voltage)
represents the simulation results The simulation results are ldquonoisyrdquo because
experimental discharge current is used as the input of model in the simulation
91
progress It is obviously that Figure 5-8 shows a good overall agreement of the
results although some slope when discharging is not perfect
0 500 1000 1500 2000 2500 3000 3500
1
15
Time (s)
Weig
ht
0 500 1000 1500 2000 2500 3000 3500114
116
118
12
122
124
126
128
13
Time (s)
Term
inal V
oltage (
V)
Experimental Terminal Voltage
Simulated Terminal Voltage
0 500 1000 1500 2000 2500 3000 3500
0
05
1
Time (s)
Dis
charg
e C
urr
ent
Simulated Terminal Voltage
Experimental Terminal Voltage
Figure 5-8 Measured and Simulated Result after Parameter Identification
Figure 5-9 shows the mean fitness value and the best in each generation It can be
seen that the best fitness in each generation is decreasing The mean fitness is
unstable because of the mutation operator in the GA that can attempt to find better
solutions
92
0 10 20 30 40 50 60 70 80 90 100100
150
200
250
300
350
400
450
500
550
Generation
Fitness v
alu
e
Best 1075521 Mean 1312731
Best f itness
Mean fitness
Figure 5-9 Mean and the Best Fitness Values in Each Generation
543 Battery Model Validation
In order to validate the battery mathematical model two sets of experimental tests
have been adopted to compare with the simulation results
The inputs of the discharge current and the validation results using two
experimental tests are shown in Figure 5-10 and Figure 5-11
93
0 500 1000 1500 2000 2500 3000114
116
118
12
122
124
126
128
13
Time (s)
Term
inal V
oltage (
V)
Simulated Terminal Voltage
Experimental Terminal Voltage
Simulated Terminal Voltage
Experimental Terminal Voltage
Figure 5-10 Measured and Simulated Terminal Voltage (Validation data 1)
In the simulation that shows in Figure 5-10 the discharge of battery begins at the
time of 700s and the simulation result shows a reasonable agreement with the
experimental result despite the noise of signal caused by the error of the sensors
It is noticed that at the beginning of the discharge there is a difference between
the simulated and experimental terminal voltages for about 100 seconds This
difference is studied and so called lsquocoup de fouetrsquo which often takes place at the
beginning of a discharge test when the SOC of battery is high (Perrin Delaille et
al 2006) However this lsquocoup de fouetrsquo behaviour cannot be described in this
model The discharge period lasts for about 1200 seconds and then stops and after
that the simulation has the similar result with the experiment
94
0 1000 2000 3000 4000 5000 600011
112
114
116
118
12
122
124
126
128
13
Time (s)
Term
inal V
oltage (
V)
Simulated Terminal Voltage
Experimental Terminal Voltage
Simulated Terminal Voltage
Experiment Terminal Voltage
Figure 5-11 Measured and Simulated Terminal Voltage (Validation data 2)
Figure 5-11 shows another group of experimental test to validate the battery
model At the beginning of the experiment the terminal voltage from the
experiment is dropping without any discharge behaviour of battery and that is
because of the experiment was carried out when the terminal voltage of lead-acid
battery is not steady enough after being charged and that also causes the
deviations in the discharge at about 1000-2000 seconds In this period the lsquocoup
de fouetrsquo appears again After the first period the battery is disconnected from the
load until the terminal voltage become steady and the simulation result in this
period fits the experiment result well In the second discharge of this test it is
shown that the lsquocoup de fouetrsquo does not occur because the SOC is not high For
the similar reason in the first discharge in this group of the test results there are
95
also some deviations in this period Finally the simulation result in the last part of
figure fits the experimental result is highly satisfied
The average error of the simulated outputs of the simulation studies and the
measured results are studied Absolute Error and Relative Error is defined as the
following equations
sum
sum
=
=
minus=
minus=
N
i
sim
N
i
sim
iV
iViV
NRelError
iViVN
AbsError
1 exp
exp
1
exp
)(
)()(1
)()(1
The absolute error and relative error are summarised in Table 5-3
Table 5-3 AbsError and RelError of Model Validation
Absolute Error Relative Error discharging relaxing overall discharging relaxing overall
Experimental Test 1 (Identification)
00229V 00207V 00217V 01833 01724 01776
Experimental Test 2 (Validation data 1)
00536V 00484V 00492V 04453 03872 04024
Experimental Test 1 (Validation data 2)
00724V 00372V 00485V 06352 03013 05025
55 Summary and Discussions
Identification of the unknown model parameters is discussed in this chapter and a
range of possibly suitable methods are reviewed in brief In this project Genetic
Algorithm is adopted GAs working principle and its implementation has been
96
introduced in details in this chapter The simulation study of two benchmark
functions that are commonly used in evaluating evolutionary computation
algorithms are employed in order to show the capability of GAs The parameter
identification by tests of a brand new 13Ah lead-acid battery is carried out and is
validated by two sets of other experimental test results under the same working
condition of the same battery
97
Chapter 6
The Analysis of State of Health
(SOH) in association with the
Internal Resistance
61 Methodology
As the number of discharge cycles of battery increases in applications the
maximum charges that a battery can offer will decrease In other words the SOH
battery is deteriorating But this drop of capacity is not linear and it is also a long
progress At the beginning of the use of battery the change of capacity is very
slow and it is not obvious After a number of cycles of discharge and charge this
change will get faster and relatively significant
There are no reliable methods now to calculate the remaining charge capacity
which is the only one determinant of the state of health The normal method is
simply to measure the voltage on its terminals But this measurement is not
accurate on an aged battery A battery in poor state of health but sufficiently
charged can also offer sufficient voltage to appear normal The only way to
determine the capacity accurately is to integrate the discharge current of battery in
a full deep discharge but this method cannot be used too frequently because deep
98
discharge is harmful for the battery
In the project six lead-acid batteries were tested using the test system described in
Chapter 4 These batteries were repeatedly discharged and charged for their whole
life time so that the information related to different state of health can be revealed
as soon as possible Even though the batteries works frequently it still takes more
than 6 months to make the battery become weak The testing experiments were
carried out and the data was recorded every 2-3 weeks so that important value of
state of health is not missed However as the change of capacity is a long progress
and it is nonlinear not all the data collected can be used in this project
Referring the literature (Coleman Lee et al 2006 Lakhdari and Midoun 2007
Coleman Hurley et al 2008) an important factor that reflects the change of state
of health of a lead-acid battery is the internal resistance Not only the state of
health but also other factors (SOC DOC discharge current etc) can result in
variations in internal resistance a new alternative method that based on the
Improved Battery Model in Chapter 4 is adopted in the project
From the model study in Chapter 4 the internal resistance can be divided into two
parts expressed by )]1(1[ 0000 SOCARR minusminusminusminus++++==== (Eq 47) and )ln(101 DOCRR minusminusminusminus====
(Eq 48) These equations show that the internal resistance is affected by the state
of charge (SOC) and depth of charge (DOC) in a discharge cycle In real
applications batteries are seldom discharged to the full range because a deep
discharge could cause some damage to the battery They are also seldom to be
charged to full to prevent the possibility of overcharge that could also bring some
99
negative effects Although this issue is not very significant in a valve regulated
lead acid battery it is better to control the working range of depth of charge from
50 to 80 approximately In this project the internal resistance of battery in the
depth of charge of 65 is studied as a most important factor that related to the
state of health As a little inaccurate of SOC and DOC will induce a comparative
big difference in the internal resistance the method of measuring the internal
resistance accurately by an external circuit is discarded
In Equation 47 and Equation 48 the author found that there are two other factors
that influence the internal resistance besides the SOC and the DOC R00 and R10
Therefore in the project the values of R00 and R10 in a specific discharge current
are very important to study the internal resistance The values of these two factors
are used in Equation 47 and Equation 48 to calculate the internal resistance per
cell of the battery The depth of charge is assumed to be 65 for a normal
working battery as described previously In chapter 3 the SOC and the DOC are
defined as )0(1 θCQSOC eminus= (Eq 44) and )(1 θavge ICQDOC minus= (Eq
45) The Capacity is also defined as equation 42
k
c
fc
IIK
CK
IC))(1(1
)1(
)(
0
minusminusminusminus++++
++++
====
ε
θ
θ
θ (61)
in which Kc = 118 k = 120 and 6 II avg times= in this project The relationship
between the actual capacity under discharge current Iavg and the nominal capacity
is
100
62
1
))(1(1
1
)0)(1(1
1
))(1(1
1
)0(
)(asymp
minus+=
minus+
minus+=
k
avgck
c
k
avgcavg
IIK
IK
IIK
C
IC
θ
θ (62)
Therefore the SOC when the DOC is 65 is
586))0(62(1)0(1 asympsdotminus=minus= θθ CQCQSOC ee (63)
As described in chapter 5 30 asympA therefore the internal resistance of an
individual cell can be obtained by
10001000010 43041)ln()]1(1[ RRDOCRSOCARRRrcell sdot+sdotasympminusminus+=+= (64)
and for a six-cell lead-acid battery the internal resistance
1000 582486 RRrr cellbattery sdot+sdot=times= (65)
62 The identification of C0 R00 and R10
In the eight parameters identified previously in Chapter 5 there are only three
parameters can be affected by the change of battery conditions Therefore the
other five parameters ( 2100 ττAKE Em ) can be treated as a constant for a battery
The parameters that related to the battery condition 0010 RR and 0C are the key
problems which the project focused on 0C represents the state of health while
the 0010 RR stands for the internal resistance parameters Here again the Genetic
algorithm is adopted to identify these three parameters
In this project the battery have been discharged and charged in hundreds of cycles
to simulate the capacity loss in the normal applications which is described by the
101
state of health in this project In order to find out the different behaviour of
internal resistance in different state of health experimental tests have been carried
out in different state of health of the battery
The first test is carried out when the battery is brand new and the data is also used
to identify the other parameters of the battery model as described in the previous
chapter The second group of data is collected after 300 discharge cycles
approximately and the third test took place after 200 more cycles The number of
discharge cycles between the last four tests is only about 50 because the change of
State of Health is more significant The identified parameters of a battery in
different state of health are shown in table 6-1
Table 6-1 Battery Remaining Capacity and Internal Resistance
Remaining
Capacity C0 (Amps)
SOH R00 R10 RelError Internal
Resistance (Ohm)
Test 1 48198 100 00609 00220 01756 05683
Test 2 44861 9314 00654 00103 07428 05759
Test 3 38025 7889 00635 00191 02812 05827
Test 4 33830 7019 00573 00509 07265 06126
Test 5 30625 6354 00604 00582 04340 06575
Test 6 26072 5306 00703 00368 01342 06855
And the terminal voltages simulated and measured are shown as the following
figures The same as previous figures the blue lines represent the measured
outputs while the red lines represent the simulation results
The test shows in figure 6-1 the same as the test which is used to describe the
genetic algorithms and the battery parameter identification in chapter 5 Detailed
102
description and analysis are given in chapter 5
0 500 1000 1500 2000 2500 3000 350011
112
114
116
118
12
122
124
126
128
13
Time (s)
Term
inal voltage (
V)
Experimental Terminal Voltage
Simulated Terminal Voltage
Experimental Terminal Voltage
Simulated Terminal Voltage
Figure 6-1 Experimental and Simulated Terminal Voltage of Test 1 (SOH = 100)
103
0 1000 2000 3000 4000 5000 600011
112
114
116
118
12
122
124
126
128
13
Time (s)
Term
inal V
oltage (
V)
Simulated Terminal Voltage
Experimental Terminal Voltage
Simulated Terminal Voltage
Experimental Terminal Voltage
Figure 6-2 Experimental and Simulated Terminal Voltage of Test2 (SOH= 9314)
The experiment shown in figure 6-2 is tested several months after the first
experimental test In the period that the first discharge begins the experimental
result shows a different slope in terminal voltage The reason is probably that the
battery have just charged to full by a charger and itrsquos the capacitor had not fully
discharged After that when the discharge stopped there is a deviation in the
simulation voltage In the authorrsquos opinion that is because of the accuracy of R10
and R00 If the value of R10 is greater and that of R00 is smaller the simulation
result should fit the experimental result In the second discharge period of the
discharge test there is also a little difference in the experimental and simulation
result caused by the inaccuracy of battery parameters But it shows a good
agreement when the discharge stopped
104
0 500 1000 1500 2000 2500 3000 3500 400011
112
114
116
118
12
122
124
126
128
13
Time (s)
Term
inal V
oltage (
V)
Simulated Terminal Voltage
Experimental Terminal Voltage
Simulated Terminal Voltage
Experimental Terminal Voltage
Figure 6-3 Experimental and Simulated Terminal Voltage of Test3 (SOH= 7889)
0 500 1000 1500 2000 2500 3000 3500 4000 4500 500011
112
114
116
118
12
122
124
126
128
13
Time (s)
Term
inal V
oltage (
V)
Simulated Terminal Voltage
Experimental Terminal Voltage
Simulated Terminal Voltage
Experimental Terminal Voltage
Figure 6-4 Experimental and Simulated Terminal Voltage of Test4 (SOH= 7019)
105
0 1000 2000 3000 4000 5000 600011
112
114
116
118
12
122
124
126
128
13
Time (s)
Term
inal V
oltage (
V)
Experimental Terminal Voltage
Simulated Terminal Voltage
Simulated Terminal Voltage
Experimental Terminal Voltage
Figure 6-5 Experimental and Simulated Terminal Voltage of Test5 (SOH= 6354)
Figure 6-3 figure 6-4 and figure 6-5 show the test results of the battery when the
SOH drops to its 80 70 and 60 It is shown that the simulation result in
figure 6-3 fits the experimental result until the end of test when the discharge of
battery has just stopped The inaccuracy of the R10 and R00 is also the main cause
of the deviation The overall simulation result in figure 6-4 figure 6-5 are good to
express the battery behaviour
106
0 500 1000 1500 2000 2500 3000 3500 400011
112
114
116
118
12
122
124
126
128
13
Time (s)
Term
inal V
oltage (
V)
Experimental Terminal Voltage
Simulated Terminal Voltage
Experimental Terminal Voltage
Simulated Terminal Voltage
Figure 6-6 Experimental and Simulated Terminal Voltage of Test6 (SOH= 5306)
In the parameter identification of test shown in figure 6-6 the remaining capacity
is only about 12 of the initial capacity when the battery is brand new During the
discharge period the simulation and experimental result is not fitting very well
and the slopes of them are not the same This is probably also caused by
insufficient idle time after being charged and the capacitor had not fully
discharged
Figure 6-7 represents the internal resistance value in different state of health as
described in table 6-1
107
100 95 90 85 80 75 70 65 60 55 5004
045
05
055
06
065
07
075
08
State of Health
Inte
rnal R
esis
tance (
Ohm
)
r vs SOH
Approximation
Figure 6-7 Change of Internal Resistance in Different State of Health (Battery 1)
It is shown that the internal resistance is increasing when the state of health of a
lead-acid battery decreases This progress is at first very slow when the battery is
new But after a number of discharge cycles the remaining capacity of battery
drops to about 75 of the initial capacity when the battery is new and the
increase of internal resistance become faster When the state of health is brought
down to about 50 which means that the battery cannot offer enough energy as
new the value of internal resistance is increased by 30 approximately At
present there is not a published quantitative description of the internal resistance
when the capacity changes yet but it has been agreed that the internal resistance
increases while the battery health deteriorates
Similar tests have been carried out on 5 other batteries with the same nominal
108
capacity and the changes of their internal resistances are given as figure 6-8 It is
not possible to deduce a statistical approximation equation only based on the
existing data but it can be seen from the figure that the performance of internal
resistance under different state of health shows an agreement in a certain extent
100 95 90 85 80 75 70 65 60 55 5003
04
05
06
07
08
09
State of Health
Inte
rnal R
esis
tance (
Ohm
)
r vs SOH (Battery 1)
r vs SOH (Battery 2)
r vs SOH (Battery 3)
r vs SOH (Battery 4)
r vs SOH (Battery 5)
r vs SOH (Battery 6)
Figure 6-8 Change of Internal Resistance in all 6 Batteries
63 Summary and Discussions
The determination of battery remaining capacity accurately is becoming
increasingly important in modern battery managements This currently is mostly
obtained by integrating the discharge current of a full discharge but this progress
usually causes a negative effect on most of the batteries There is also a view that
109
the state of health which represents the percentage of remaining capacity of a
weak battery compared with the initial capacity when brand new can affect the
internal resistance therefore the battery state of health can be obtained by the
study of battery internal resistance However from the analysis based on the
mathematical model and the experimental results it can be concluded that other
parameters can also cause variations of the internal resistance which make the
estimation of the state of health more challenging
This chapter describes a new alternative method that based on the Improved
Battery Model and the key parameters of the model The remaining maximum
capacity of a used battery which represents the SOH of the battery is related in
the internal resistance under the depth of charge of 65 which is expressed by
the parameters of R00 and R10 These parameters can be identified by genetic
algorithms A result that quantifies the change of internal resistance in different
SOH values has been concluded based on the analysis of a series of experimental
tests
110
Chapter 7
Conclusions and Future
Research
This chapter summarizes the major achievements of the presented research work
in the field of battery modelling and state of health analysis Possible direction of
further research work is also described briefly in this chapter
71 Summary
Lead-acid batteries are used in various industrial sectors and are irreplaceable due
to their low price In areas where lead-acid batteries are employed as an energy
storage device the capacity loss caused by the repeated dischargecharge cycles is
very common This drop of capacity can neither be avoided nor be repaired by
using current technologies As a result it is essential to know whether the battery
is able to meet the demand and if it should be replaced on time
In this thesis a study on the capacity status of a battery and its relation to the
internal resistance had been conducted and this thesis established a novel model
based method to quantify the battery health An Equivalent Circuit Mathematical
model for the discharging progress of a lead-acid battery has been developed for
this purpose and is implemented under MatlabSIMULINK software environment
111
The model involves most of the important concepts of a battery to reflect the
dynamic response of terminal voltage when discharging
A series of experimental tests have been carried out during the project for the
model validation and the study of the state of health Six 12V-13Ah lead-acid
batteries with the same rated capacity are discharged and recharged from brand
new to obtain different values of state of health Genetic algorithm has been
employed to identify the unknown parameters of the battery model in each state of
health and the identified parameters are used as the factors that reflecting the state
of health and the internal resistance The internal resistances corresponding
different state of health have been collected and recorded A result was found in
the thesis that for the 12V-13Ah lead-acid battery which is used in the
experimental tests the value of internal resistance is increased by 25
approximately if the SOH of battery drops to 50
72 Limitations
The key limitation of the method introduced in this thesis is that it is based on the
parameter identifications of the model which means a test is still needed in order
to obtain the state of health The major reason is that the mathematical model does
not include the charging progress of battery which is also an important period of
the battery duty cycle Another limitation is that all the tests of the state of health
estimation are carried out at the same discharge rate because of the variation of
the internal resistance in different discharge rate as discussed in chapter 4 Finally
112
The lsquocoup de fouetrsquo behaviour that of took place at the beginning of discharge
when batteries are full is not able to be simulated in the current version of
mathematical model
73 Future Research Work
Following the limitations of the project some future research can be carried out in
three steps based on the model improvements and the practical applications of the
algorithm
First of all improvements of the discharging battery model can be carried out
which can mainly focus on the study of the battery internal resistance in different
discharge rates Equations of internal resistances that can withstand the change of
discharge rate will make the model capable for online applications Studies on the
relationship between the electromotive force and the state of charge can also lead
to a solution of the lsquocoup de fouetrsquo behaviour and a better simulation result
Another research work on the model modification is that the behaviour of battery
to the mathematical model when a battery is being charged can be involved by
which the monitoring system of battery can be implemented in the whole duty
cycles This part of work can be focused on the parasitic branch in the
mathematical model described in chapter 3
Further work should also reveal the variations of state of health in different duty
113
cycles and an algorithm based on this change should be designed to estimate the
remaining life-time of a lead-acid battery The value of current state of health and
the estimated raining life-time should also be considered as major outputs in this
period of work It is also possible to design an online management device of
battery to estimate the life-time and the state of health
114
References
Anon (2006) Global Wind Energy Council (GWEC) statistics [online] from
httpwwwgwecnetuploadsmedia07-
02_PR_Global_Statistics_2006pdf
Anon (2007) Battery Types Flooded versus AGM and Gel [online]
Retrieved February 13 2007 from
httpwwwvonwentzelnetBattery01Type
Anon (2007) BP Statistical Review of World Energy June 2007 [online] from
httpwwwbpcomliveassetsbp_internetglobalbpglobalbp_uk_englishr
eports_and_publicationsstatistical_energy_review_2007STAGINGlocal_
assetsdownloadsspreadsheetsstatistical_review_full_report_workbook_2
007xls
Anon (2007) International Energy Outlook 2007 [online] from
httpwwweiadoegovoiafieohighlightshtml
Ball R J Evans R and Stevens R (2002) Finite element (FE) modelling of
current density on the valve regulated leadacid battery positive grid
Journal of Power Sources 103(2) 213-222
Bernardes A M Espinosa D C R and Tenoacuterio J A S (2004) Recycling of
batteries a review of current processes and technologies Journal of
Power Sources 130(1-2) 291-298
Berndt D (1993) Maintenance-Free Batteries -- A Handbook of Battery
Technology Somerset Research Studies Press Ltd
Berndt D (2001) Valve-regulated lead-acid batteries Journal of Power
Sources 100(1-2) 29-46
115
Berndt D (2009) Electrochemical Energy Storage Battery Technology
Handbook CRC Press
Casacca M A and Salameh Z M (1992) Determination of lead-acid battery
capacity via mathematical modeling techniques Energy Conversion
IEEE Transaction on 7(3) 442-446
Ceraolo M (2000) New dynamical models of lead-acid batteries Ieee
Transactions on Power Systems 15(4) 1184-1190
Chan H L and Sutanto D (2000) A new battery model for use with Battery
Energy Storage Systems and Electric Vehicles Power Systems 2000 Ieee
Power Engineering Society Winter Meeting - Vols 1-4 Conference
Proceedings 470-475
Chen M and Rincacuteon-Mora G A (2006) Accurate electrical battery model
capable of predicting runtime and I-V performance IEEE
TRANSACTIONS ON ENERGY CONVERSION VOL 21( NO 2)
504-511
Chipperfield A J Fleming P J and Fonseca C M (1994A) Genetic algorithm
tools for control systems engineering Adaptive computing in
engineering design and control Plymouth UK
Chipperfield A J Fleming P J Pohlherim H and Fonseca C M (1994B)
Genetic algorithm toolbox for use with Matlab Department of automatic
control and systems engineering University of Sheffield
Crompton T R (2000) Battery Reference Book Third Edition Oxford
Elsevier Newnes
Cun J P Fiorina J N Fraisse M Mabboux H A and Mabboux H The
116
experience of a UPS company in advanced battery monitoring
Telecommunications Energy Conference 1996 INTELEC 96 18th
International 646 - 653
Durr M Cruden A Gair S and McDonald J R (2006) Dynamic model of a
lead acid battery for use in a domestic fuel cell system Journal of Power
Sources 161(2) 1400-1411
Esfahanian V Torabi F and Mosahebi (2008) An innovative computational
algorithm for simulation of lead-acid batteries Journal of Power
Sources 176(1) 373-380
Gillioli R and Cerolo P (1990) Charge and discharge fourth order dynamic
model of the lead battery 10th
intl Electric Vehicle Symposium Hong
Kong p1-9
Glendenning I (1981) Compressed air storage Physics in Technology 12(3)
103-10
GONG Q (2005) Modeling study of a vehicle traction battery model
CHINESE LABAT MAN 2005 Vol 42 Numb 2 issu 155 pages 76-79
Houck C Joines J and Kay M (1995) A Genetic Algorithm for Function
Optimization A Matlab Implementation NCSU-IE TR 95-09
Jacobi W (2009) Lithium Batteries Battery Technology Handbook CRC Press
Jayne M G and Morgan C (1986) a new mathematical model of lead acid
battery for electric vehicles Eighth Intl electric vehicle conference
Washington DC
Juvonen M (2003) Large-Scale Energy Storage Systems [online] from
httpwwwdocicacuk~mattiise2grpenergystorage_reportstoragehtml
117
Lee J H Lee K Y and Lee J Y (1996) Self-discharge behaviour of sealed
Ni-MH batteries using MmNi33+xCo07Al10-x anodes Journal of
Alloys and Compounds 232(1-2) 197-203
Liaw B Y Gu W B and Wang C Y (1997) Numerical simulation of coupled
electrochemical and transport processes in battery systems Proceedings
of the Intersociety Energy Conversion Engineering Conference
Honolulu HI USA IEEE
Lu S Meegahawatte D H Guo S Hillmansen S Roberts C and Goodman
C J (2008) Analysis of energy storage devices in hybrid railway vehicles
Railway Engineering - Challenges for Railway Transportation in
Information Age 2008 ICRE 2008 International Conference on
Mantell C L (1984) Batteries and energy systems Second Edition McGraw-
Hill Inc
MathWorks Inc (2004) Genetic Algorithm Direct Search Toolbox V102
MathWorksInc
MPowerSolutionsLtd (nd) Alternative Energy Storage Methods [online]
from httpwwwmpowerukcom
Okoshi T Yamada K Hirasawa T and Emori A (2006) Battery condition
monitoring (BCM) technologies about lead-acid batteries Journal of
Power Sources 158(2) 874-878
Perrin M Delaille A Huet F and Hernout L (2006) Study of the coup de
fouet of lead-acid cells as a function of their state-of-charge and state-of-
health Journal of Power Sources 158(2) 1019-28
Pham D T and Karaboga D (1998) Intelligent Optimisation Techniques
118
Genetic Algorithms Tabu Search Simulated Annealing and Neural
Networks New York Springer-Verlag New York Inc
RailPower Hybrid Technologies C (nd) Benifits of Hybrid Locomotives
[online] from httpwwwrailpowercomproducts_hl_benefitshtml
Rand D A J Moseley P T and Garche J (2004) Valve-Regulated Lead-Acid
Batteries Elsevier
Ruetschi P (2004) Aging mechanisms and service life of lead-acid batteries
Journal of Power Sources 127 (1-2) 33-44 Switzerland Elsevier
Salameh Z M Casacca M A and Lynch W A (1992) A mathematical model
for lead-acid batteries IEEE Trans on Energy conversion Vol7 No 1
Sato Y Takeuchi S and Kobayakawa K (2001) Cause of the memory effect
observed in alkaline secondary batteries using nickel electrode Journal
of Power Sources 93(1-2) 20-24
Sims R I Carnes J C Dzieciuch M A and Fenton J E (1990) Computer
modeling of Automotive lead acid batteries Ford Research Laboratories
Technical Report
Smil V (2007) Energy at the Crossroads Massachusetts Achorn Graphic
Services Inc
Ter-Gazarian A (1994) Energy storage for power systems London Peter
Peregrinus Ltd
TNI_Ltd (2007) Battery history [online] from
httpwwweuropulsecombattery_historybattery_historyhtm
Tuck C D S (1991) Modern Battery Technology Ellis Horwood Ltd
Wei J (2007) Development of Coal Mill and Aggregate Load Area Models in
119
Power Systems using Genetic Algorithms University of Liverpool PhD
Wikipedia (nd) Lead-Acid Battery [online] from
httpenwikipediaorgwikiLead-acid
Wikipedia (nd) Rechargeable Batteries [online] from
httpenwikipediaorgwikiRechargeable_battery
Wikipedia (nd) VRLA [online] from httpenwikipediaorgwikiVRLA
Zhang Y L Liu P H Zhang Q Y and Cheng W (2010) Separation of
cadmium(ii) from spent nickelcadmium battery by emulsion liquid
membrane Canadian Journal of Chemical Engineering 88(1) 95-100
120
Appendix I SIMULINK Diagrams of Battery Model
Figure A-1 SIMULINK Diagrams of ldquoMain Blockrdquo
121
Figure A-2 SIMULINK Diagrams of ldquoTerminal Voltage Calculationrdquo
122
Figure A-3 SIMULINK Diagrams of ldquoThermal Behaviourrdquo
123
Figure A-4 SIMULINK Diagrams of ldquoBattery Capacityrdquo
Figure A-5 SIMULINK Diagrams of ldquoBattery State of Chargerdquo
Figure A-6 SIMULINK Diagrams of ldquoBattery Depth of Chargerdquo
124
Figure A-7 SIMULINK Diagrams of ldquoBattery Electromotive Forcerdquo
(a)
(b)
Figure A-8 SIMULINK Diagrams of ldquoBattery Internal Resistancerdquo
125
Appendix II
List of Publications
S Hillmansen S Lu D H Meegahawatte S Guo C Roberts and C J
Goodman Analysis of Energy Storage Devices in Hybrid Railway Vehicles International Conference on Railway Engineering 2008 p68-73 Hong Kong China 25-28 March 2008
Y Yin X Luo S Guo Z Zhou J Wang A battery charging control strategy for
renewable energy generation systems The Proceedings of World Congress on Engineering 2008 Vol 1 pp356-361 London UK 2-4 July 2008
S Guo S Hillmansen Y Yin J Wang State of Health Monitoring of Lead-acid
Batteries Proceedings of the 14th International Conference on Automation amp Computing pp250-254 Brunel University West London UK 6 September 2008
Y Yin C Li Z Zhou Q Liu S Guo X Luo J Wang Design and Realization of a
PS2 Keyboard Interface in Embedded system Proceedings of the 14th International Conference on Automation amp Computing pp160-163 Brunel University West London UK 6 September 2008
Yin Y Wang J Luo X Guo S Development of a battery charging management
unit for renewable power generation a book chapter in Advances in
Electrical Engineering and Computational Science Edited by Sio-Long Ao and Len Gelman pp33-46 Springer 2009
Wang J Wei JL Guo S Condition monitoring of power plant milling process
using intelligent optimization and model based techniques accepted as a chapter in the book of Fault Detection in March 2009
S Guo S Hillmansen J Wang Model Based Analysis of Battery State of Health
using Genetic Algorithms accepted by the International Conference on Systems Engineering (ICSE) Coventry 8-10 September 2009


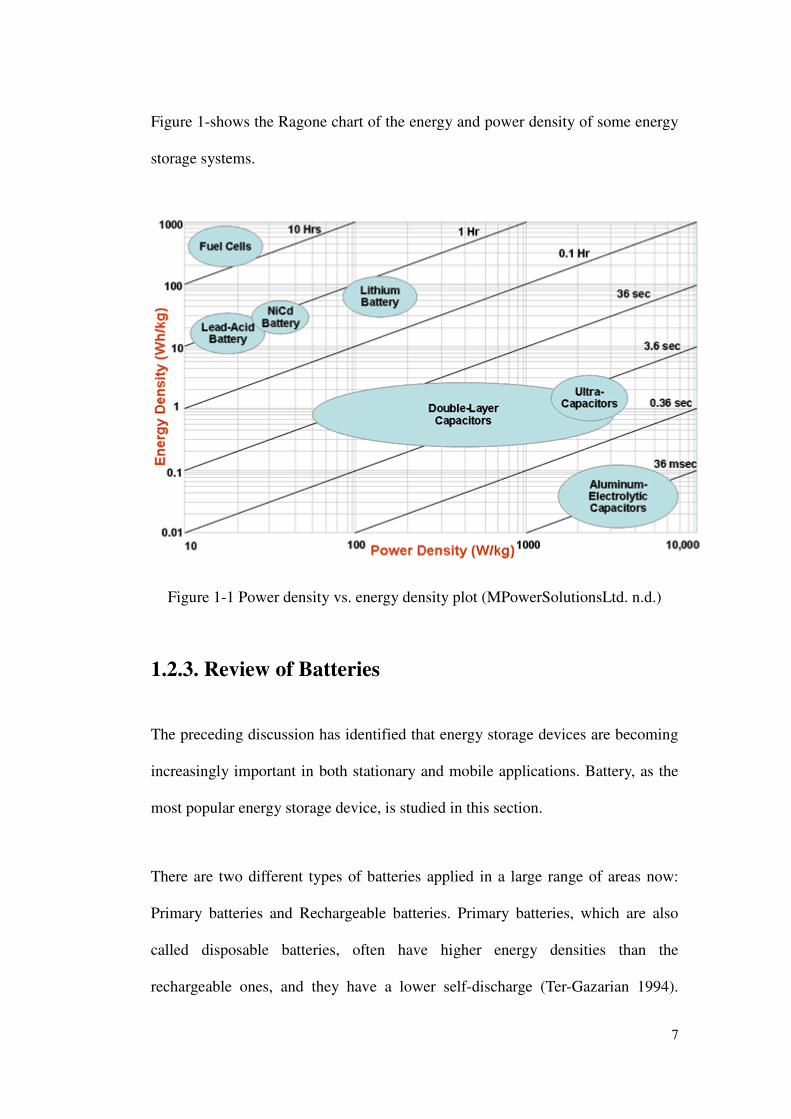

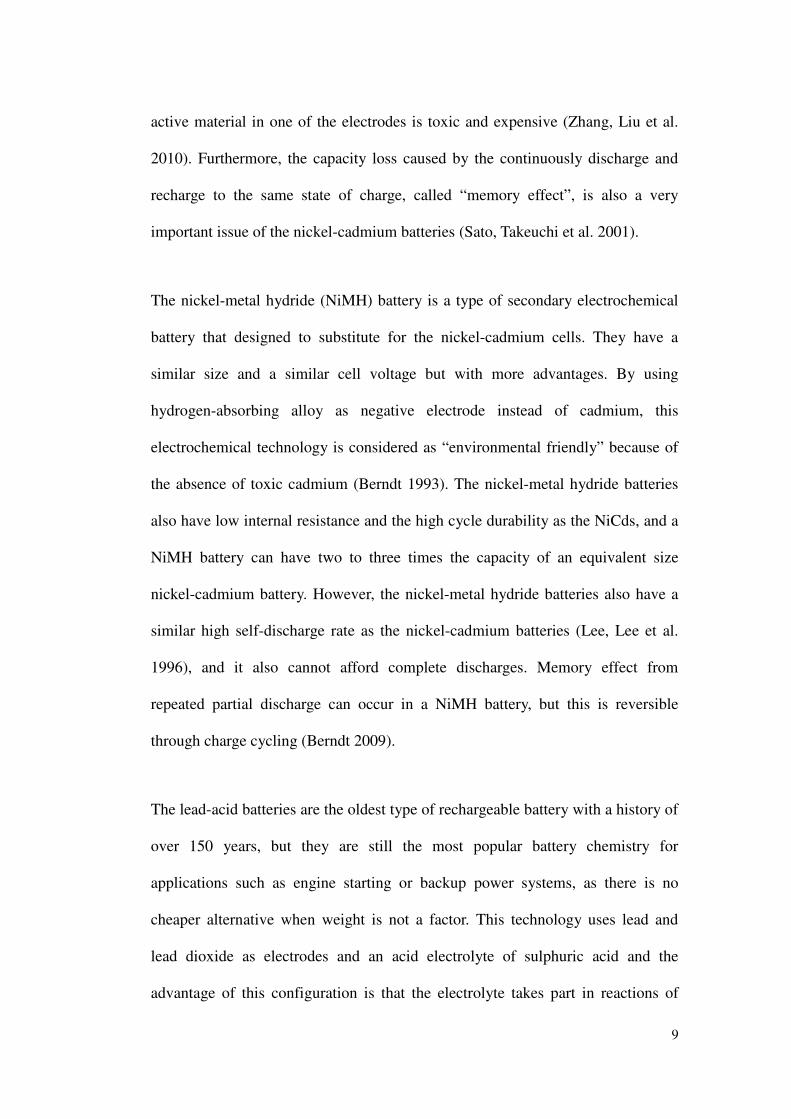

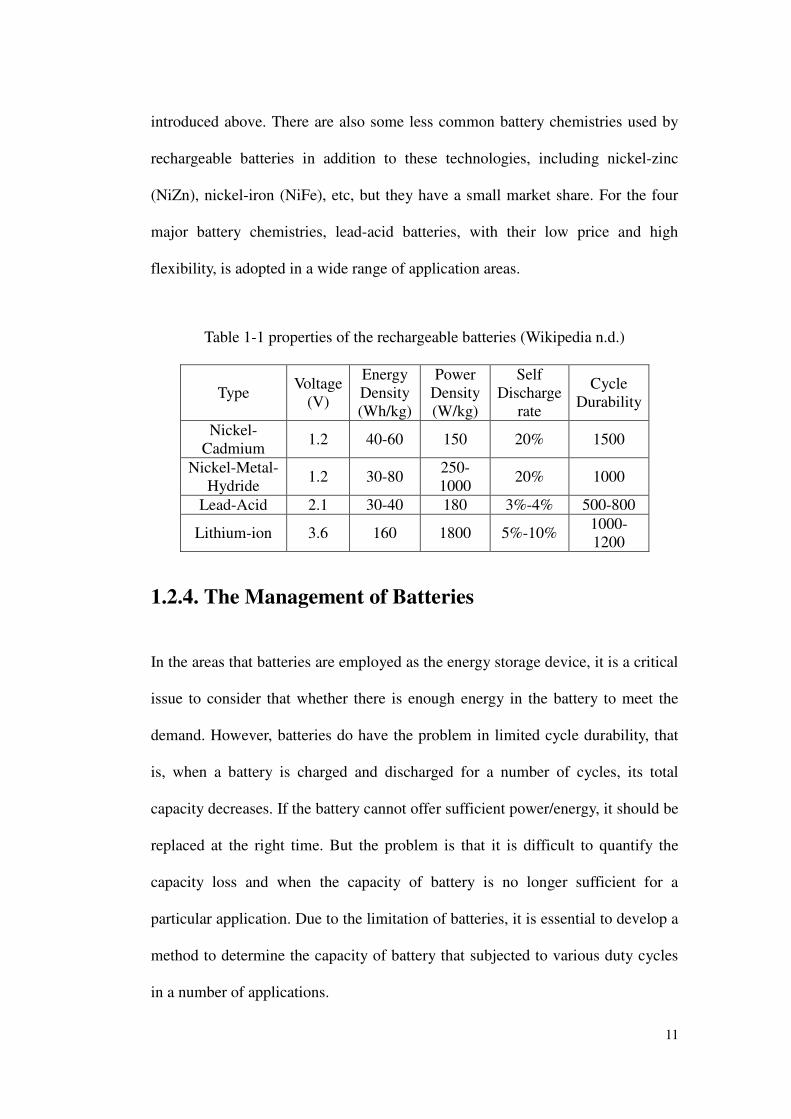


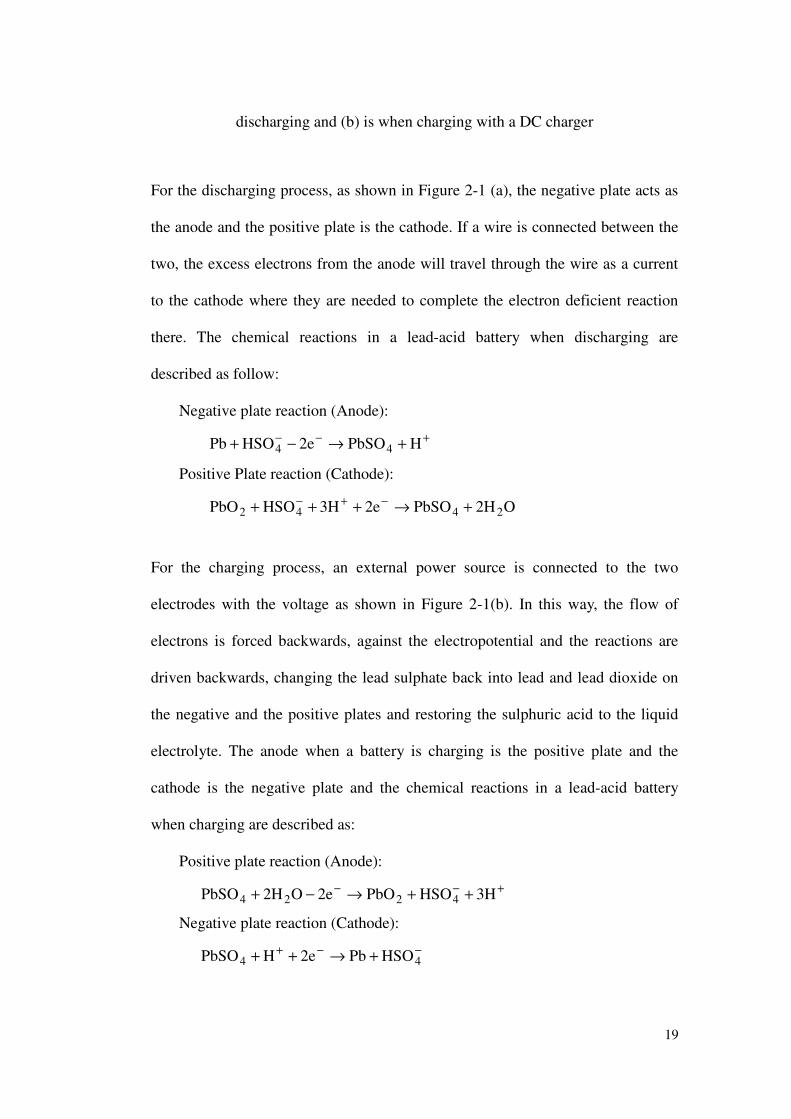


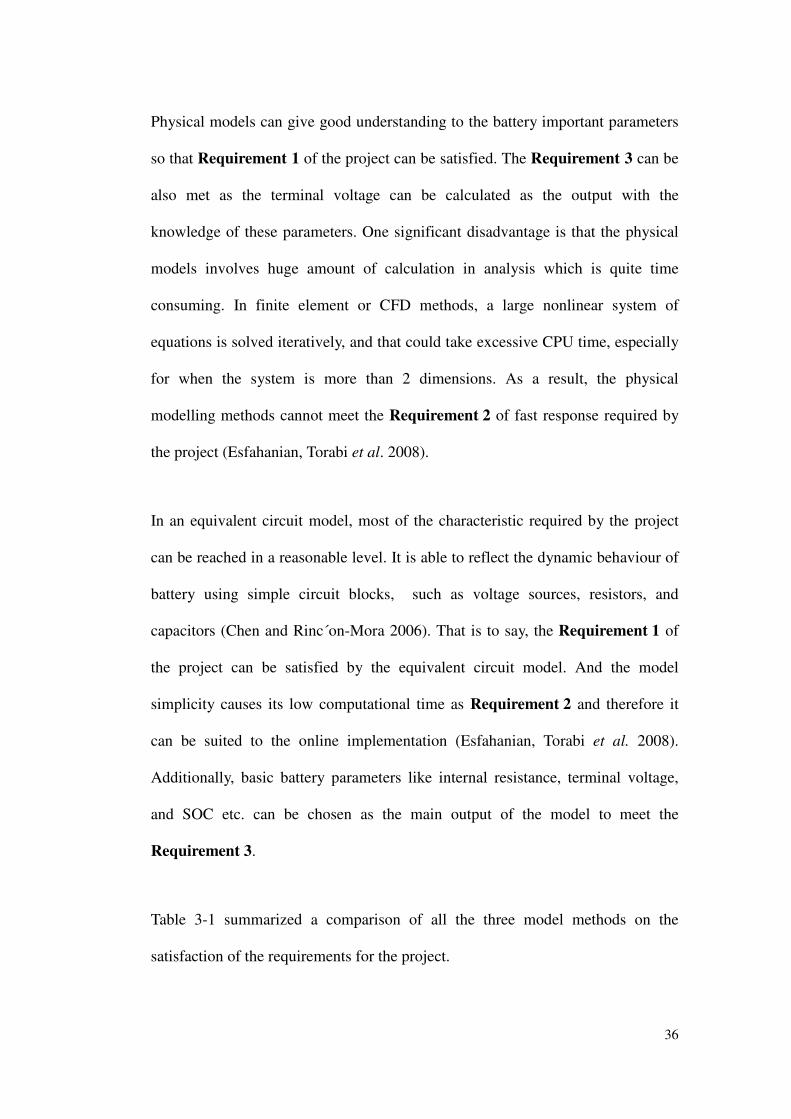
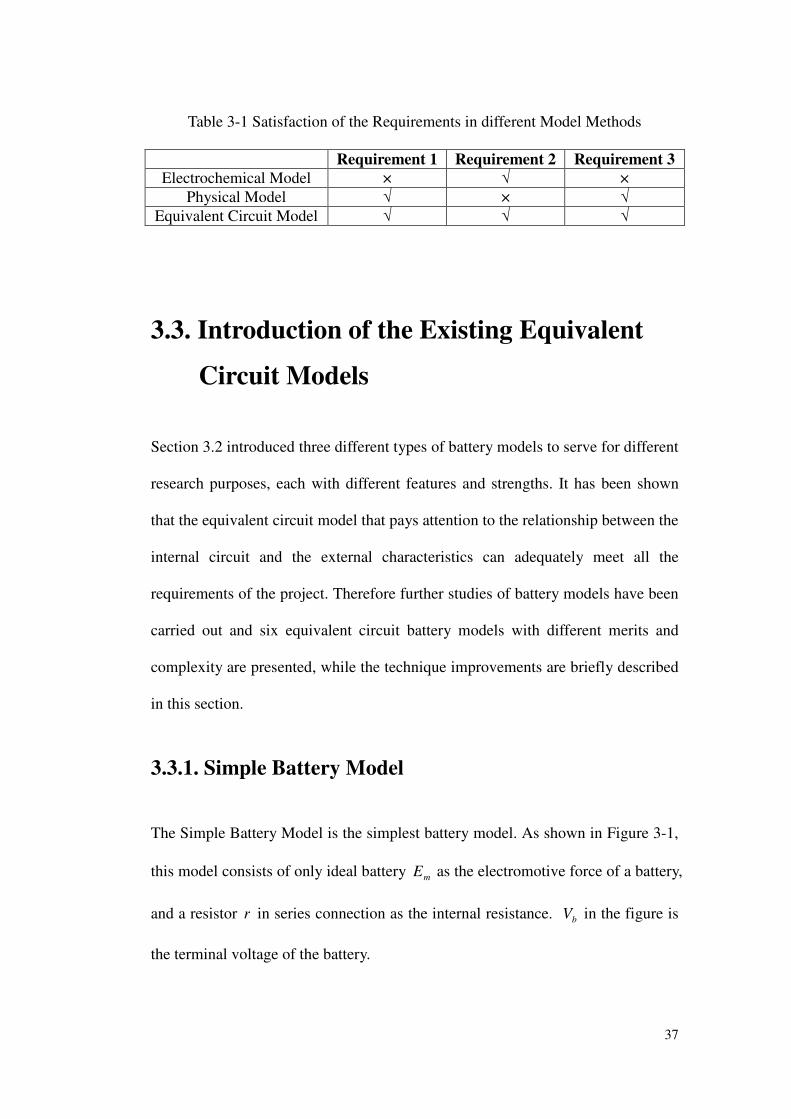
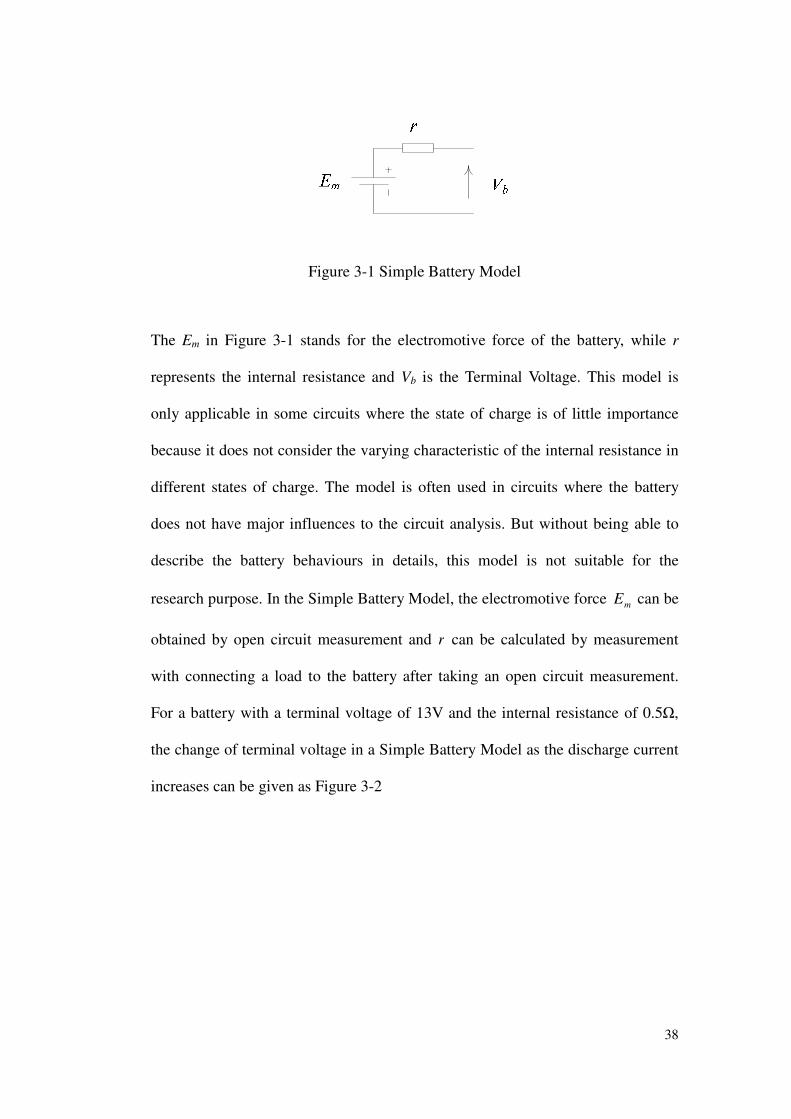
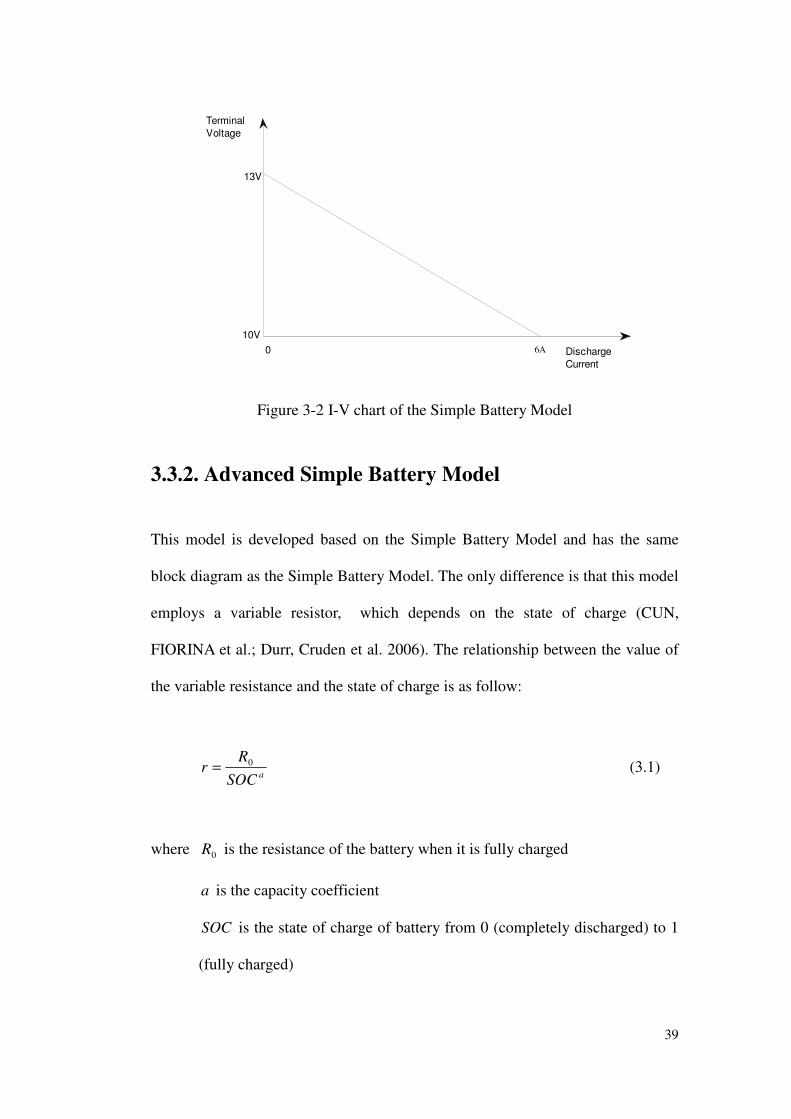
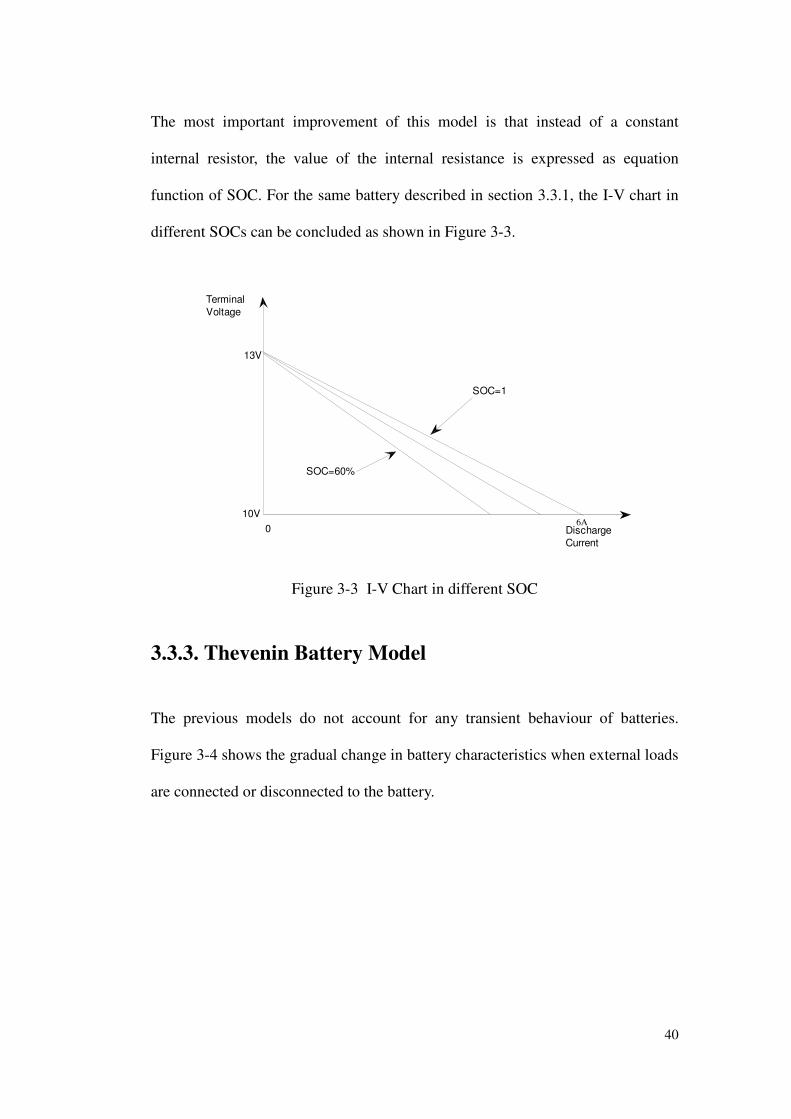
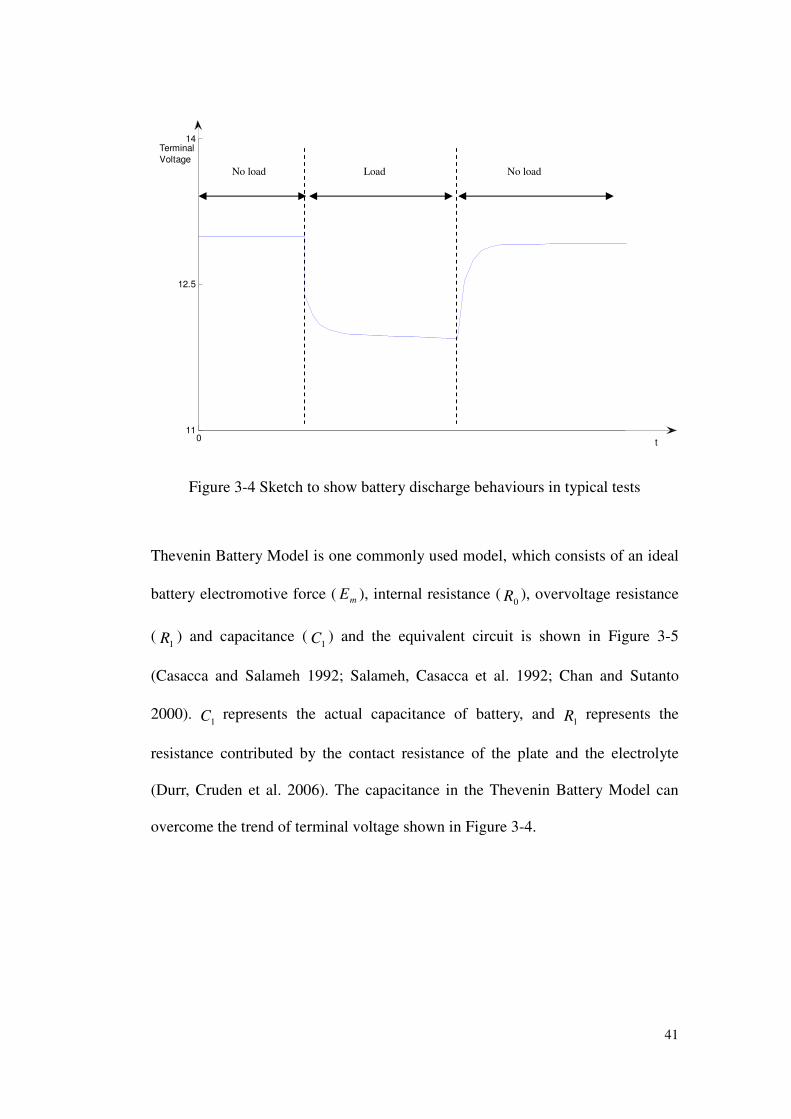
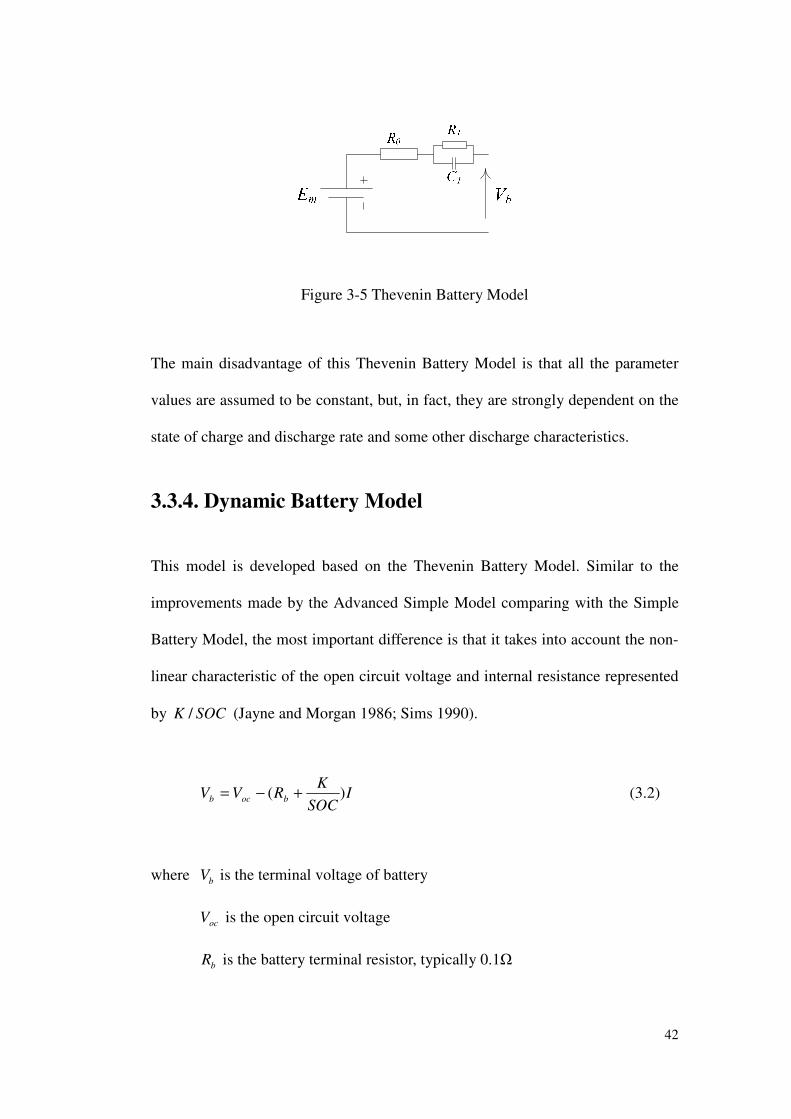
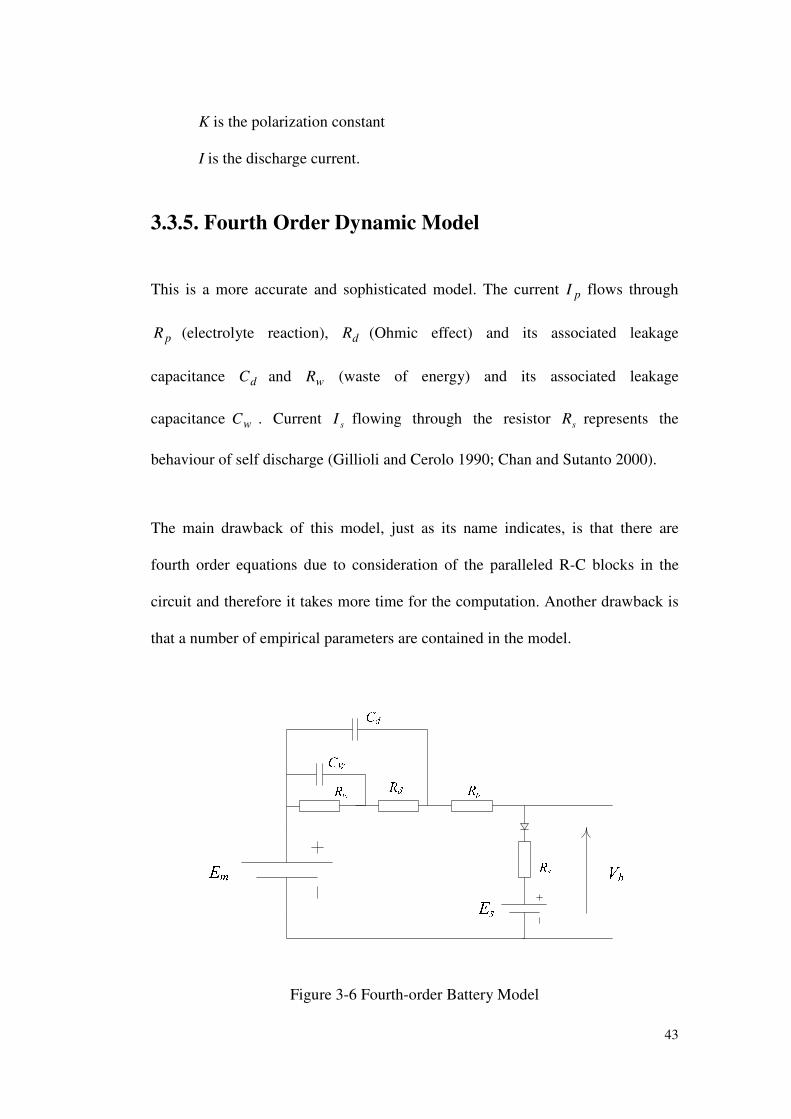

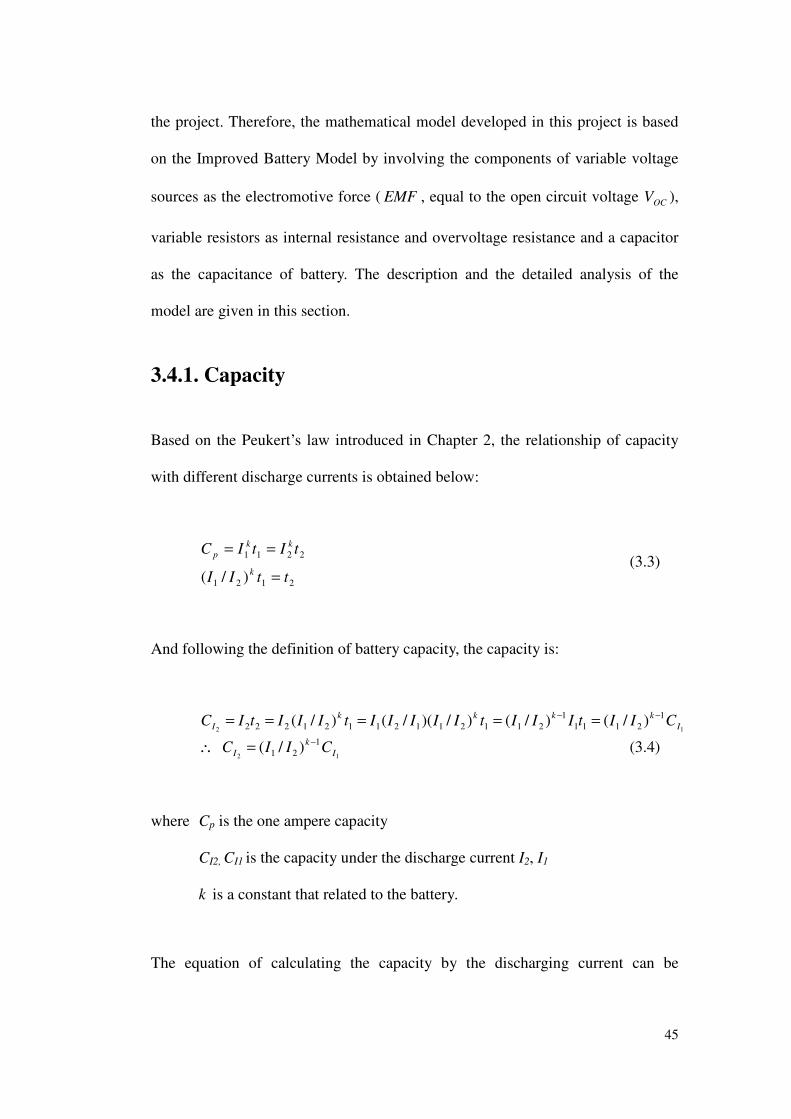
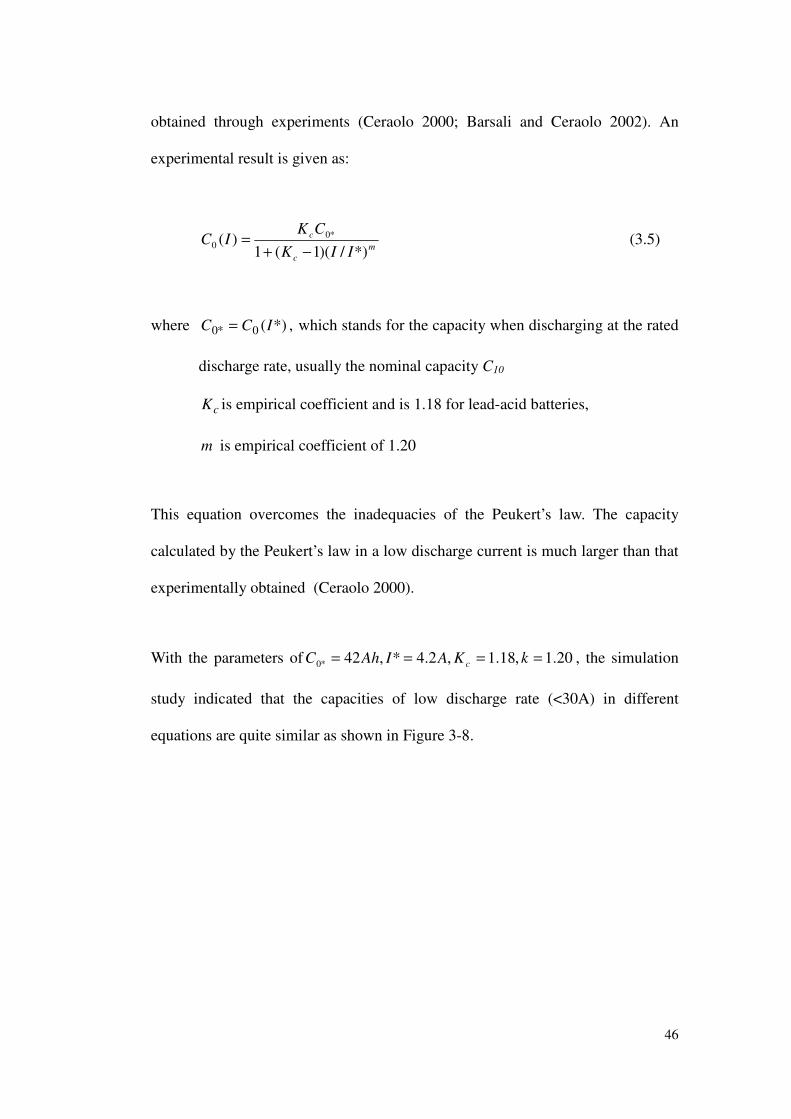
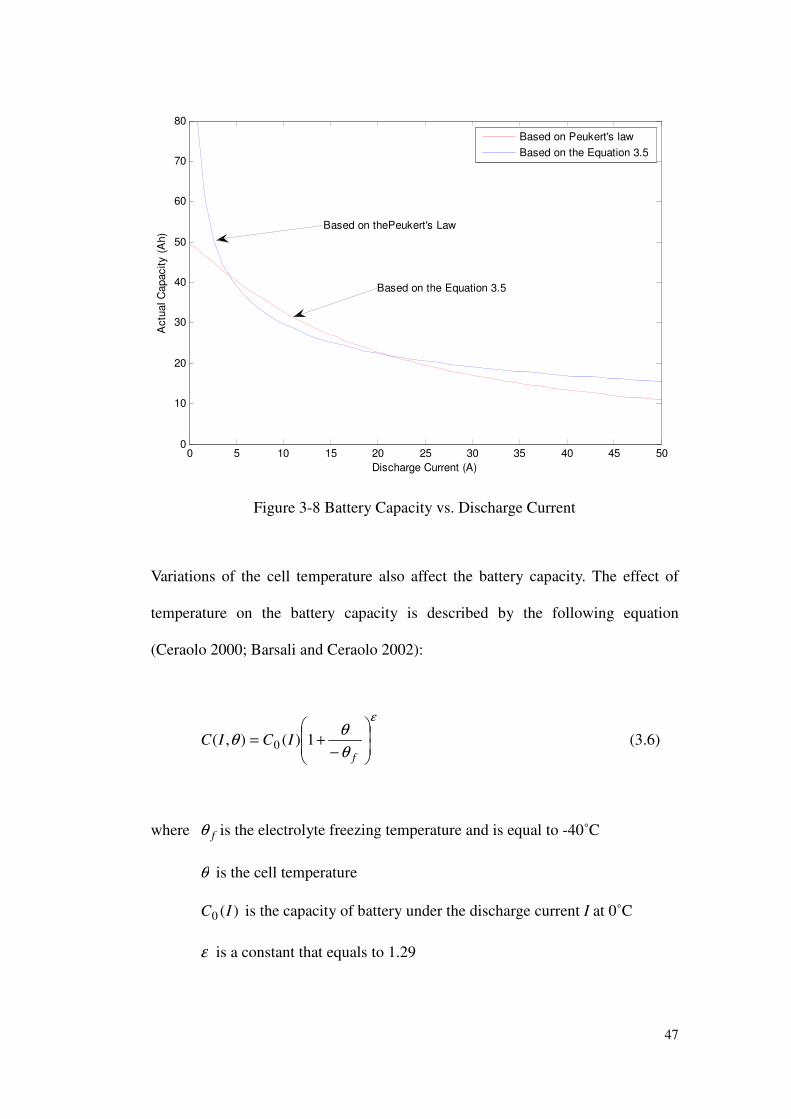

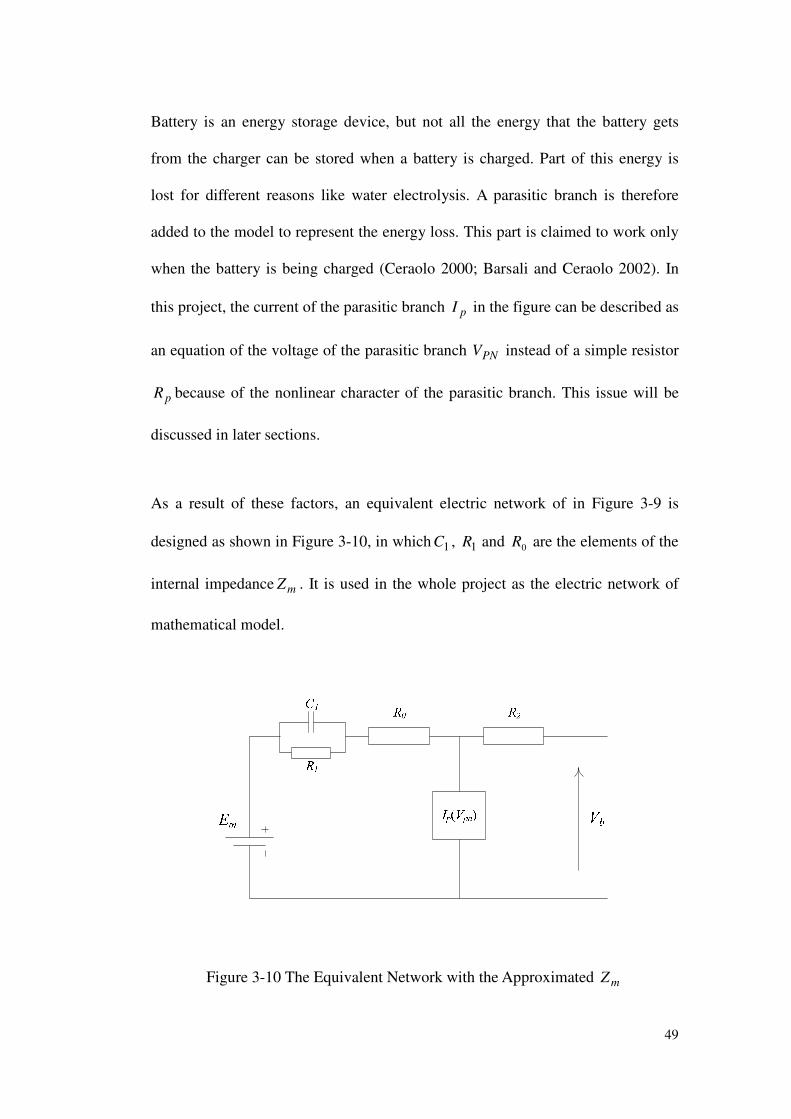

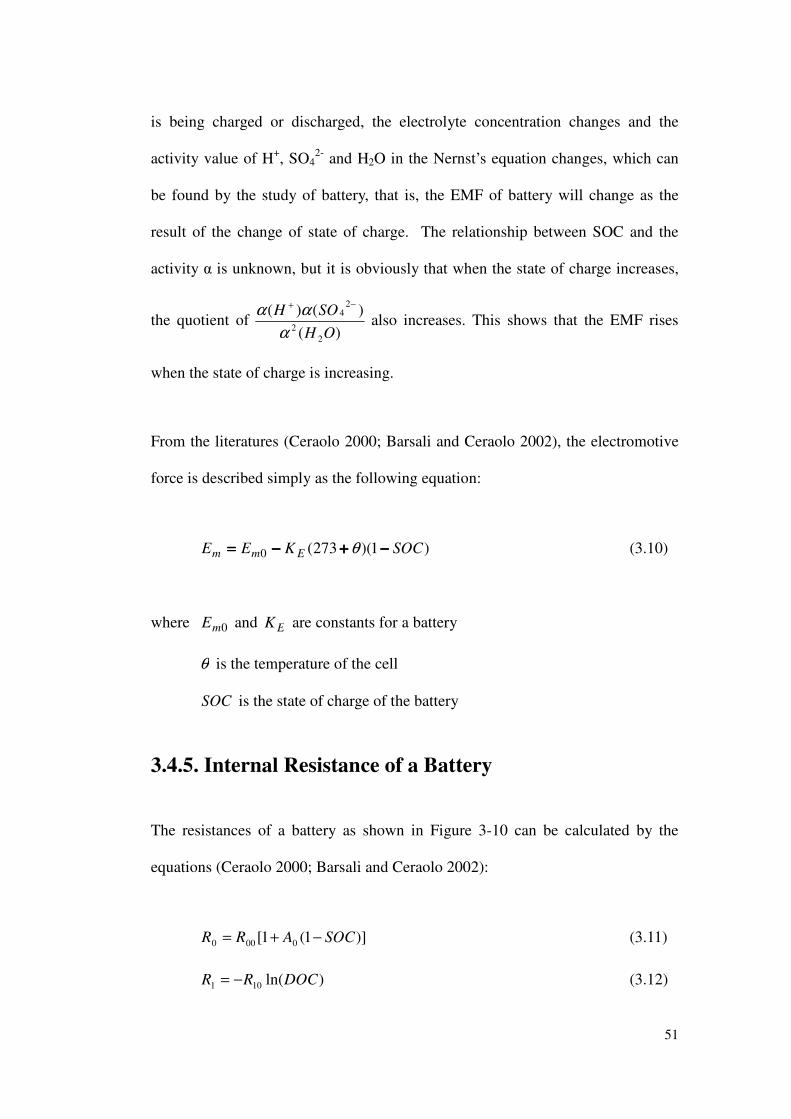

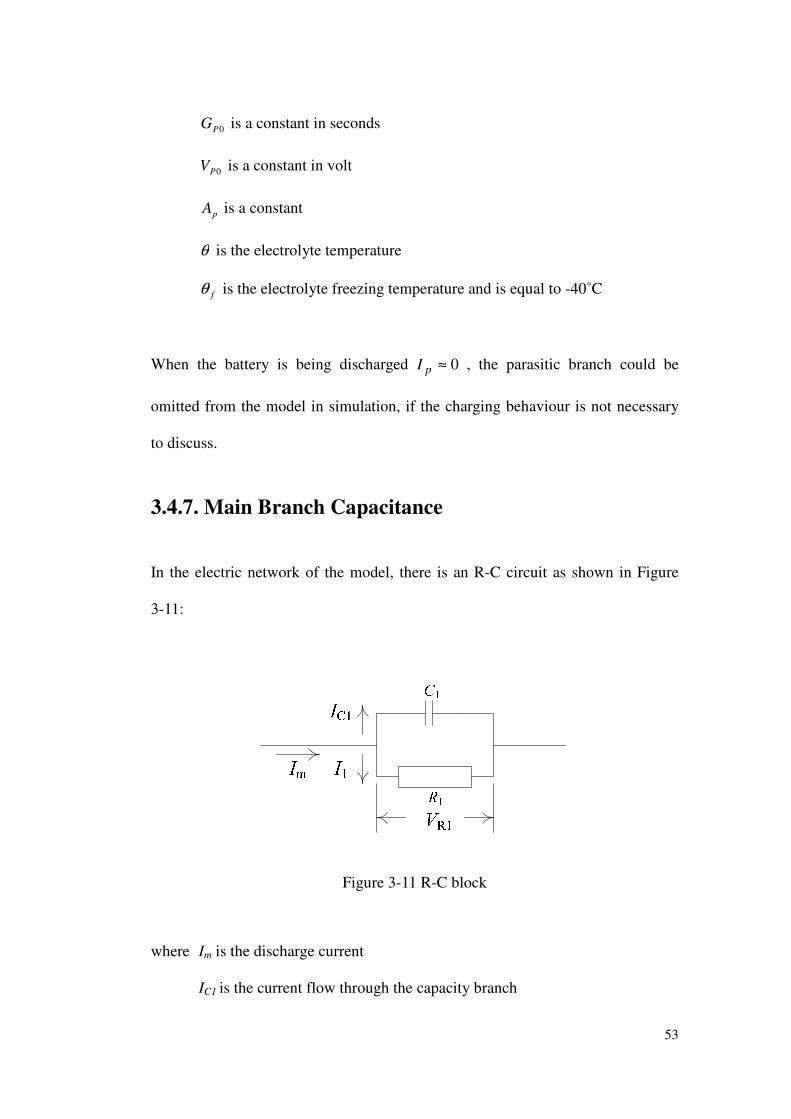

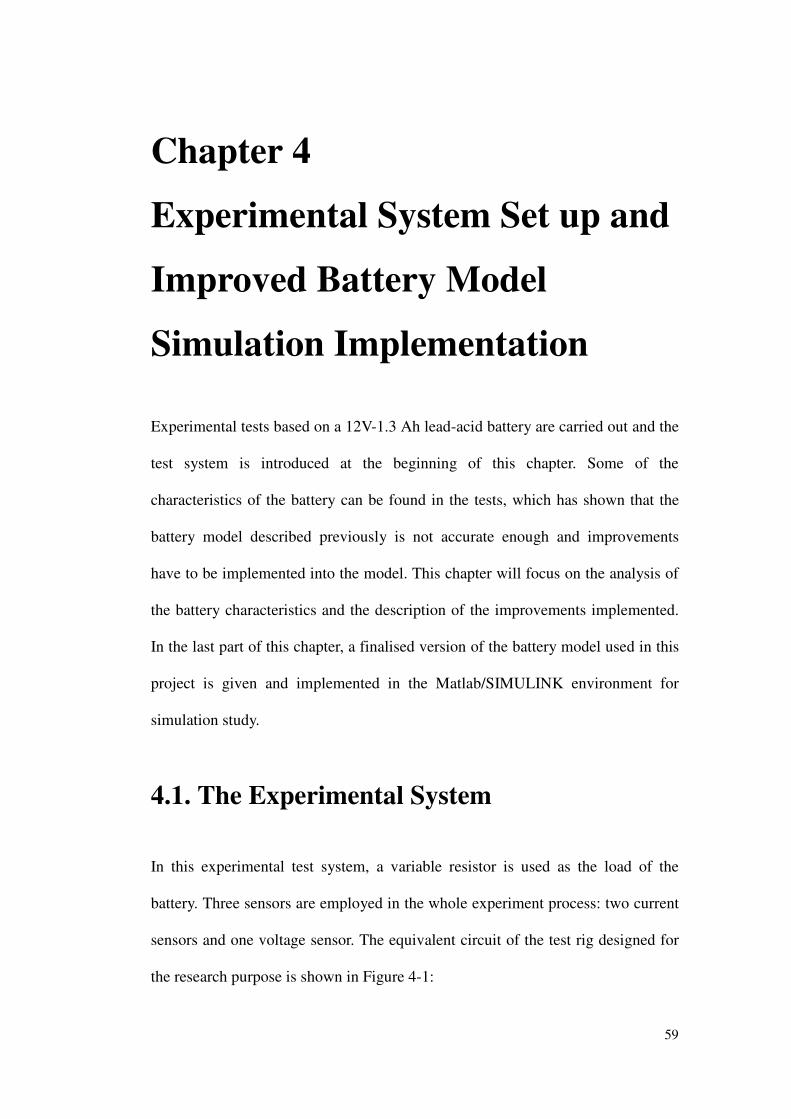
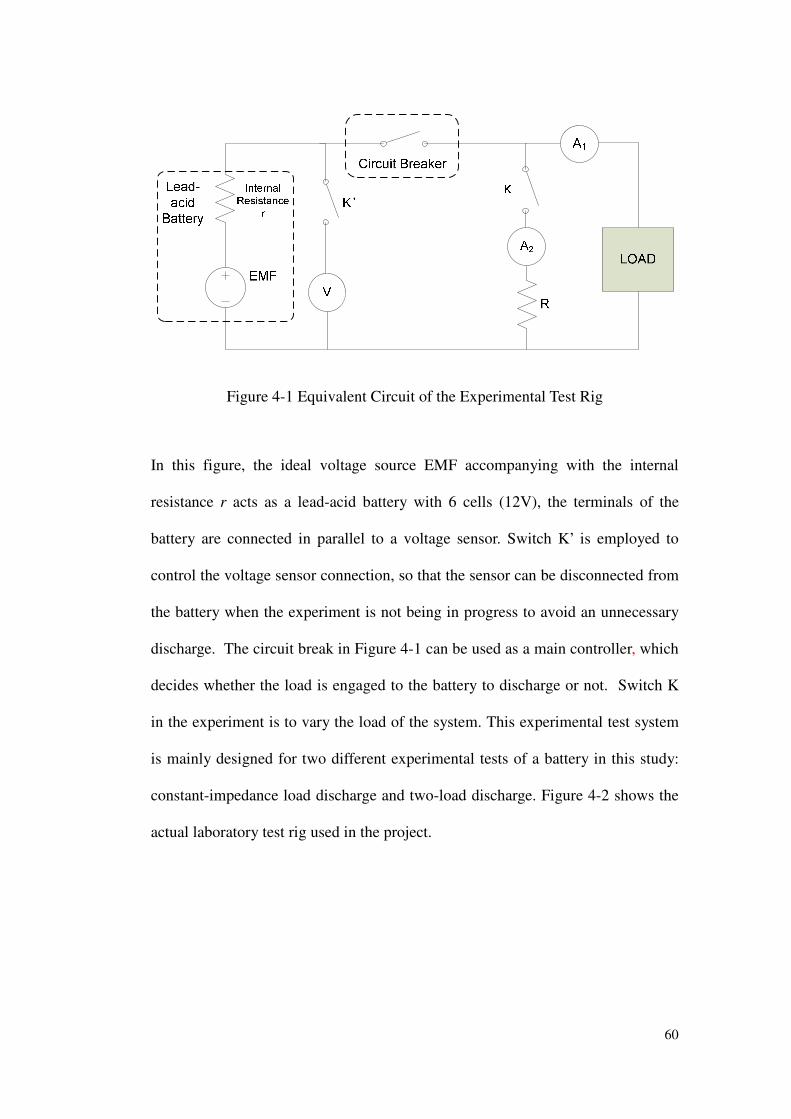
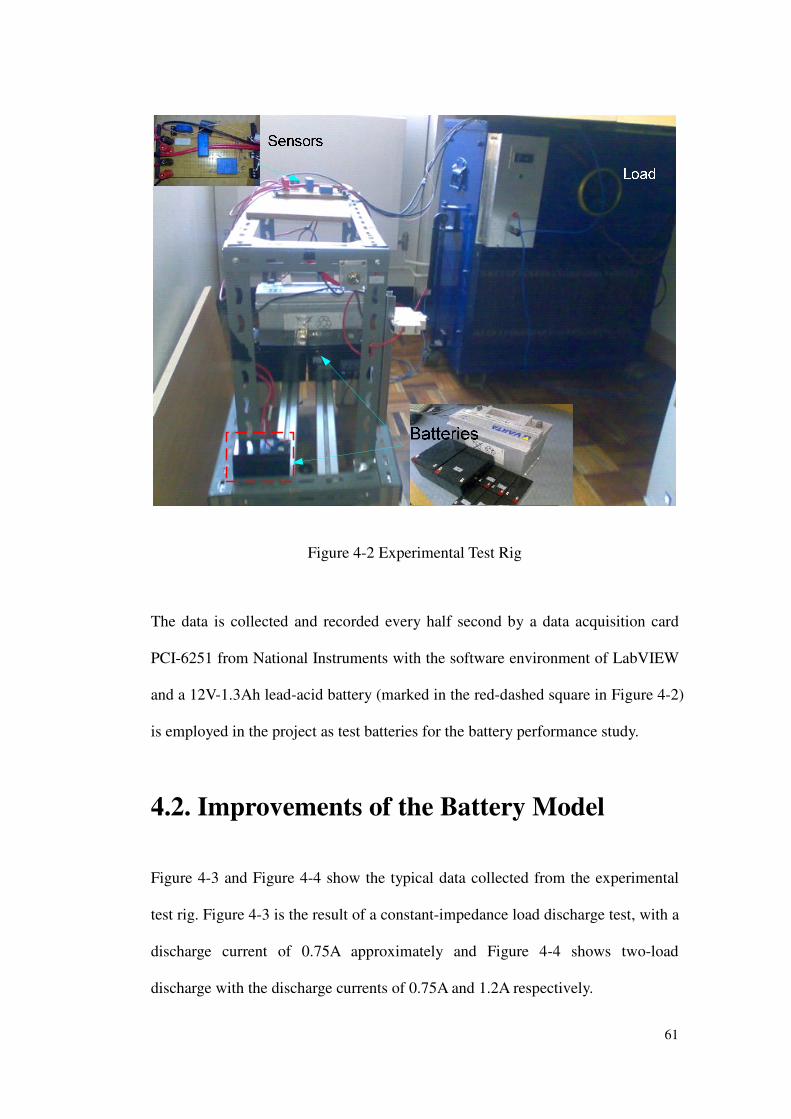
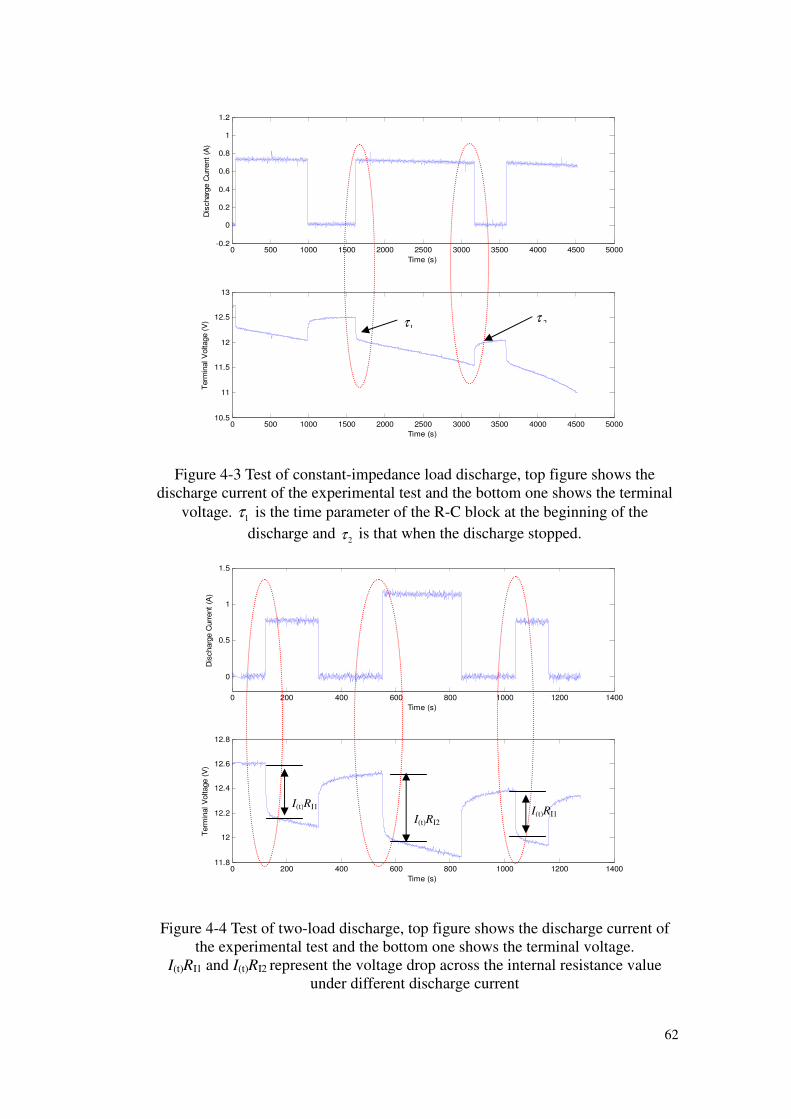

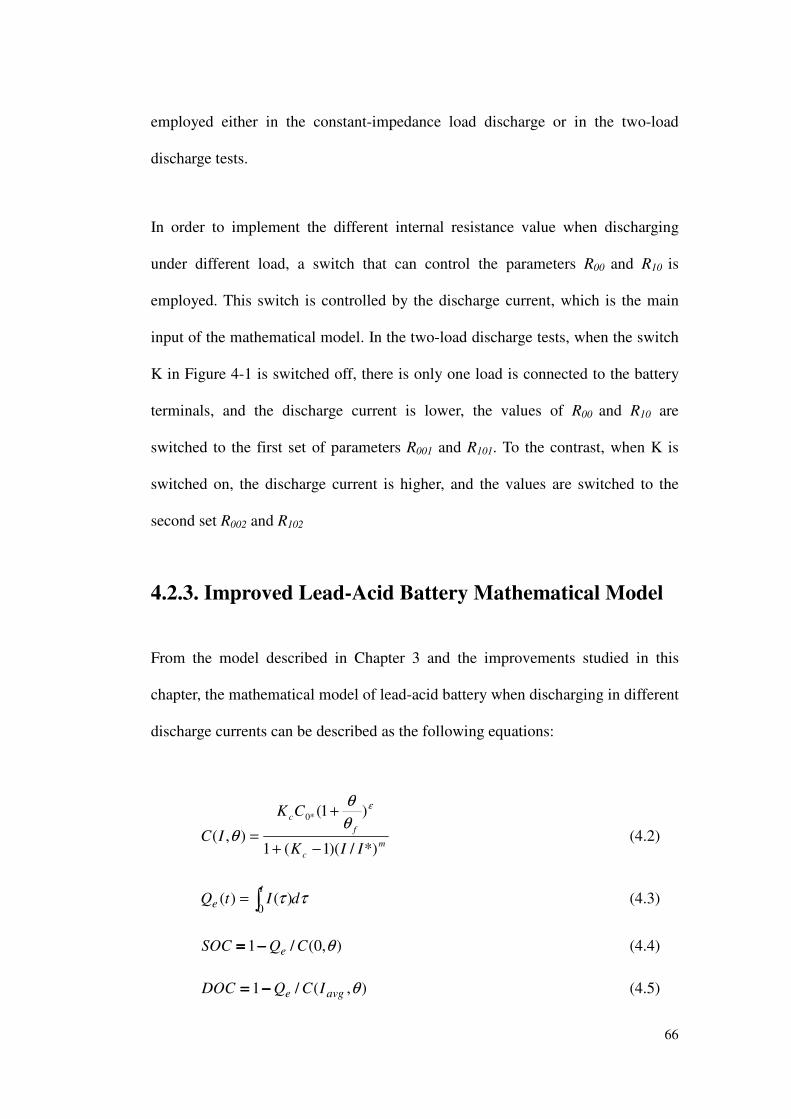
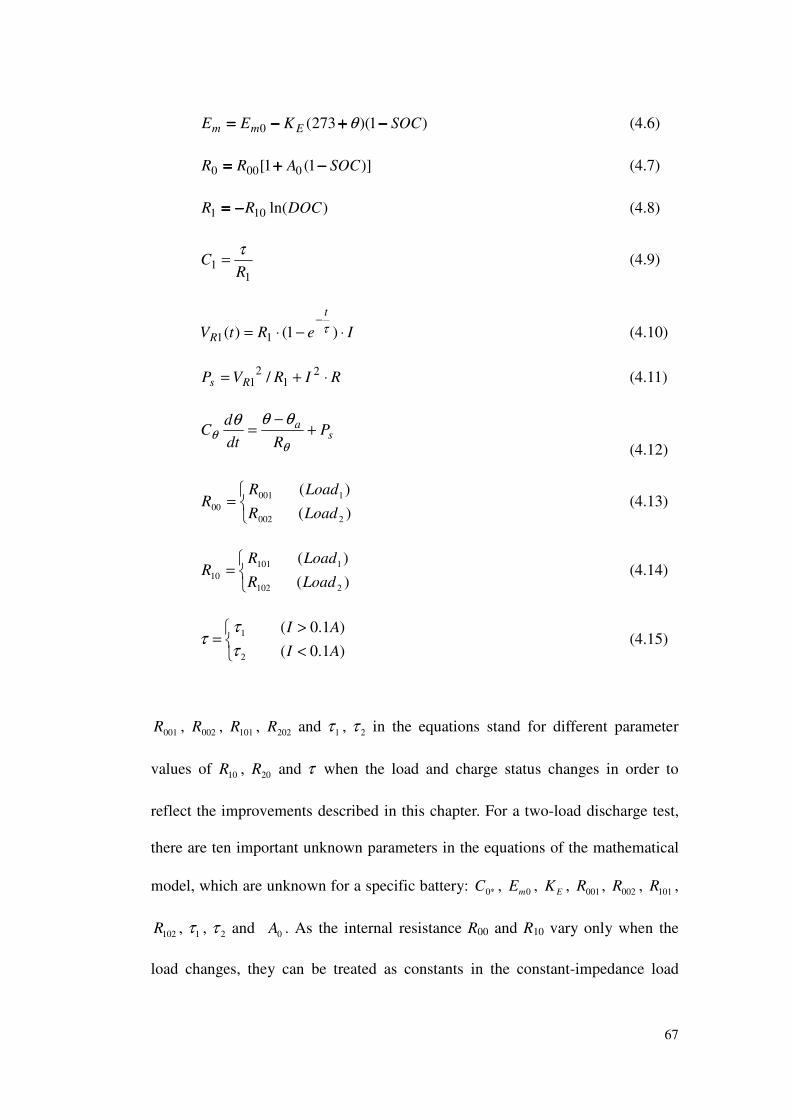

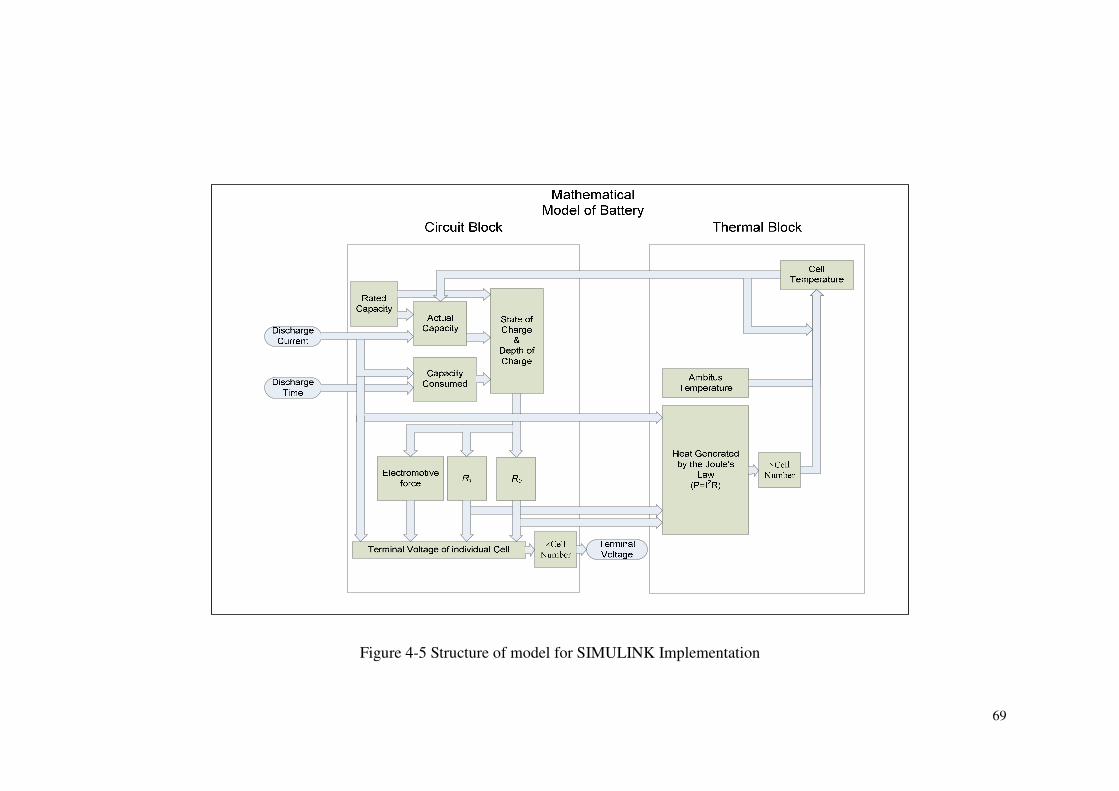

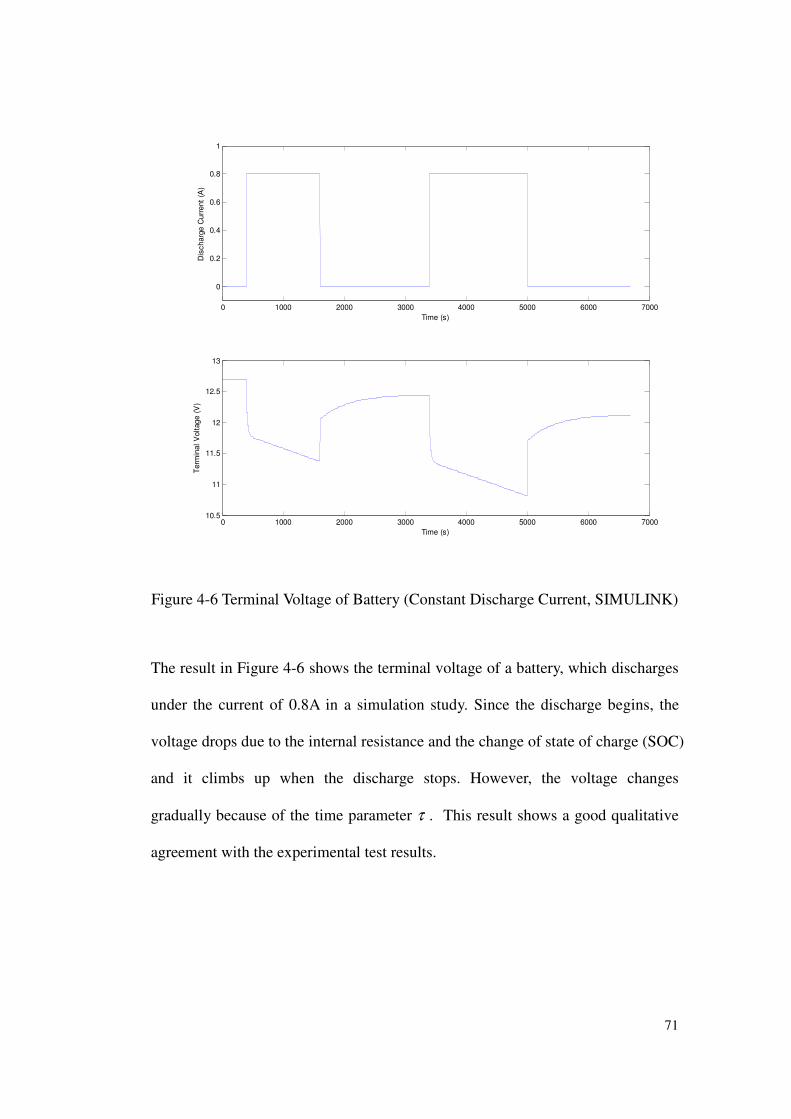


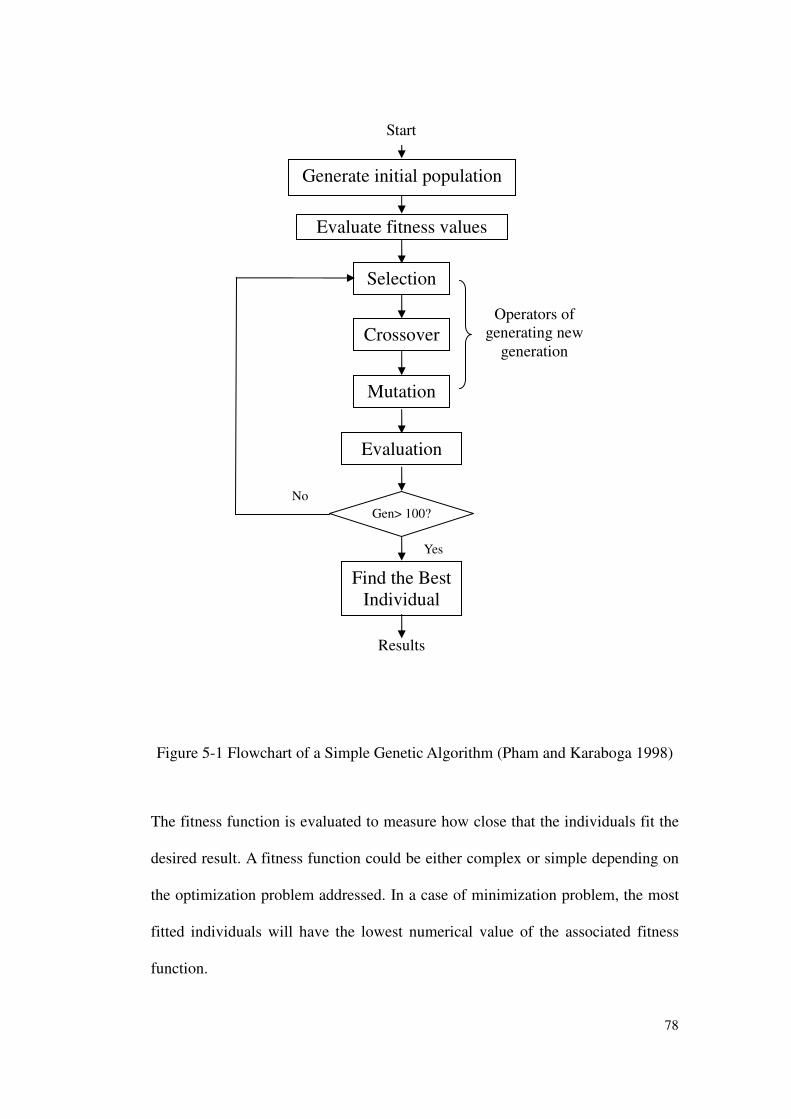


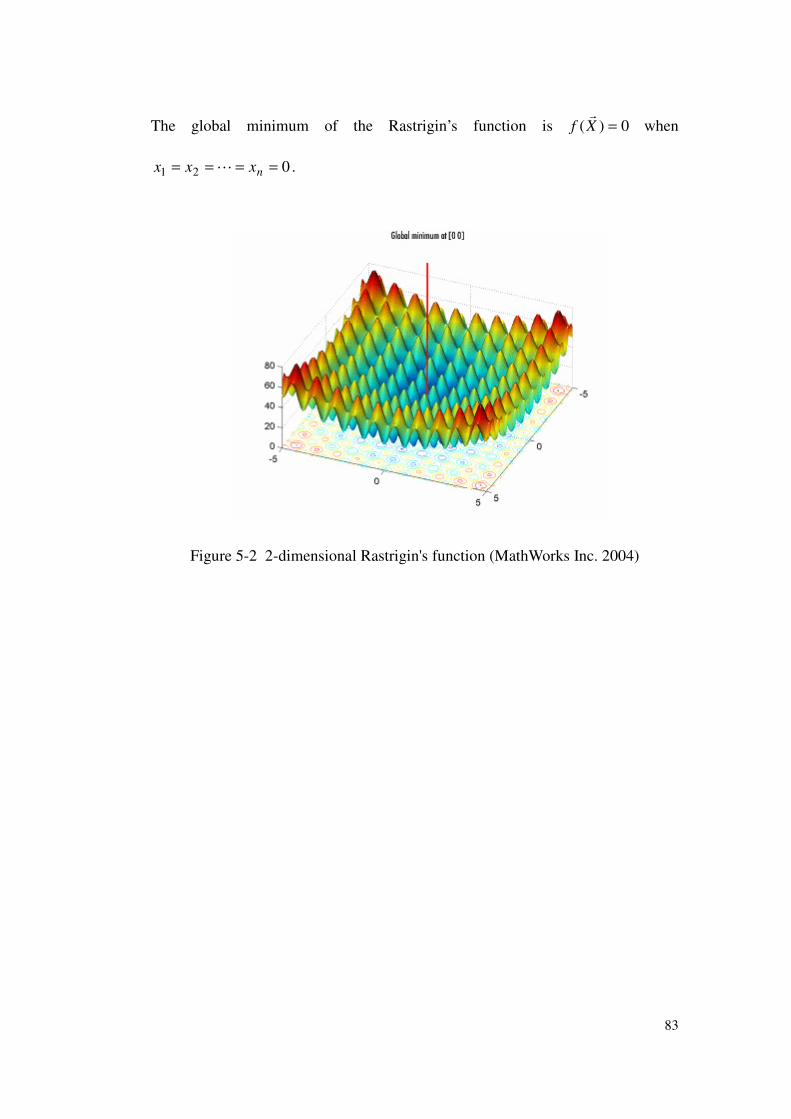


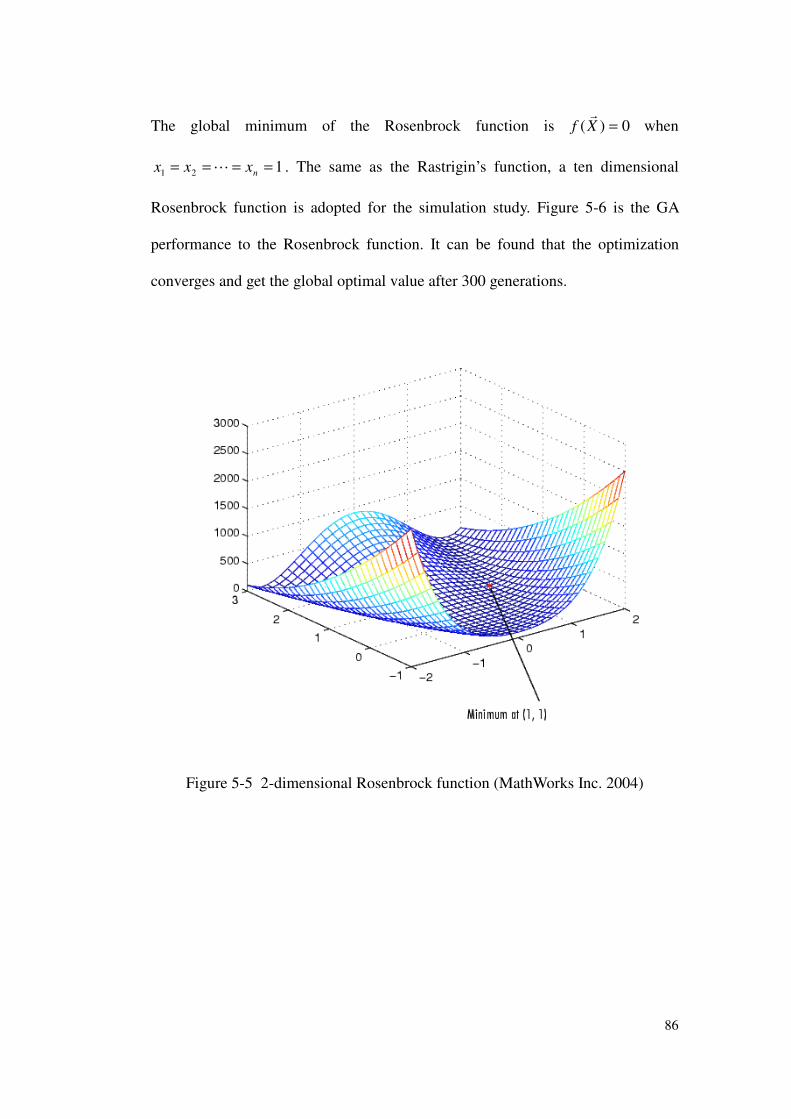

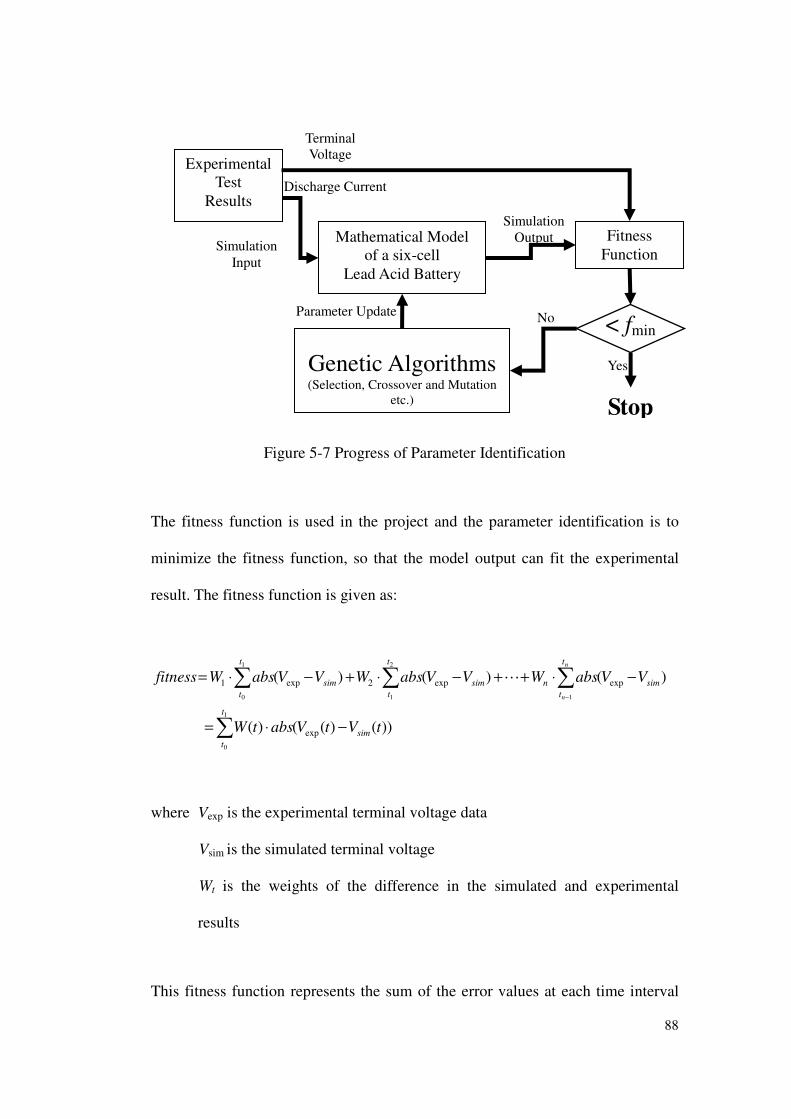
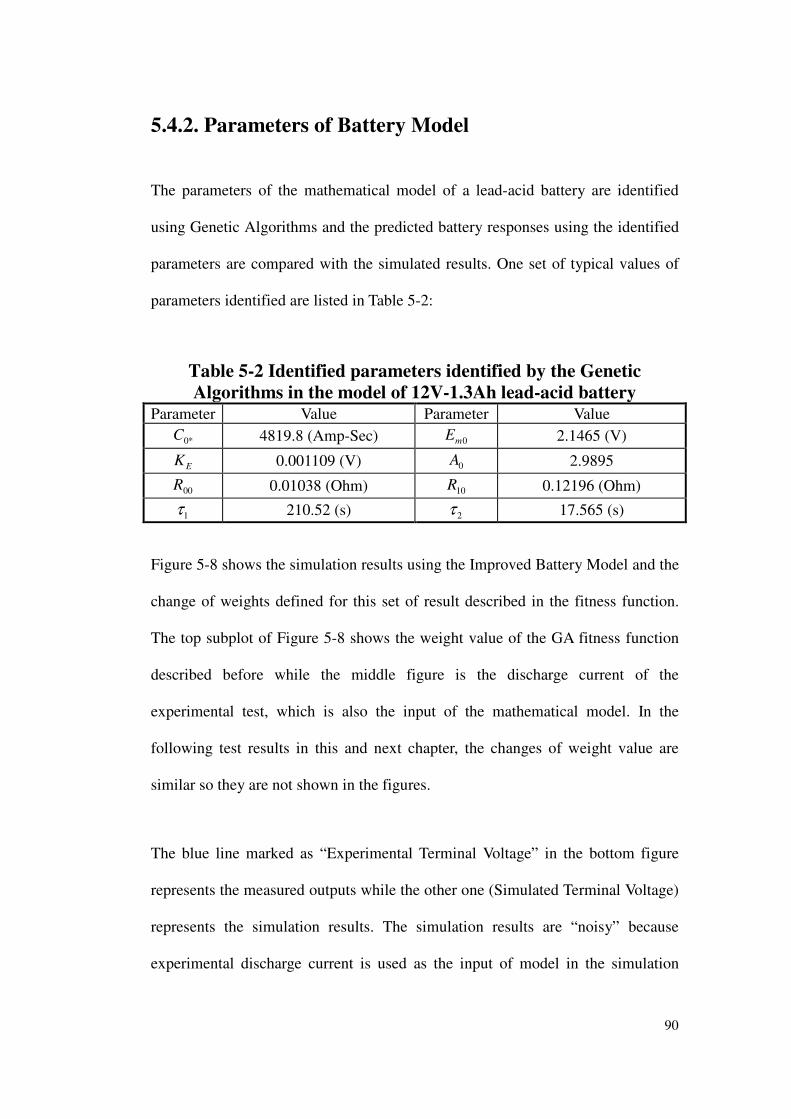

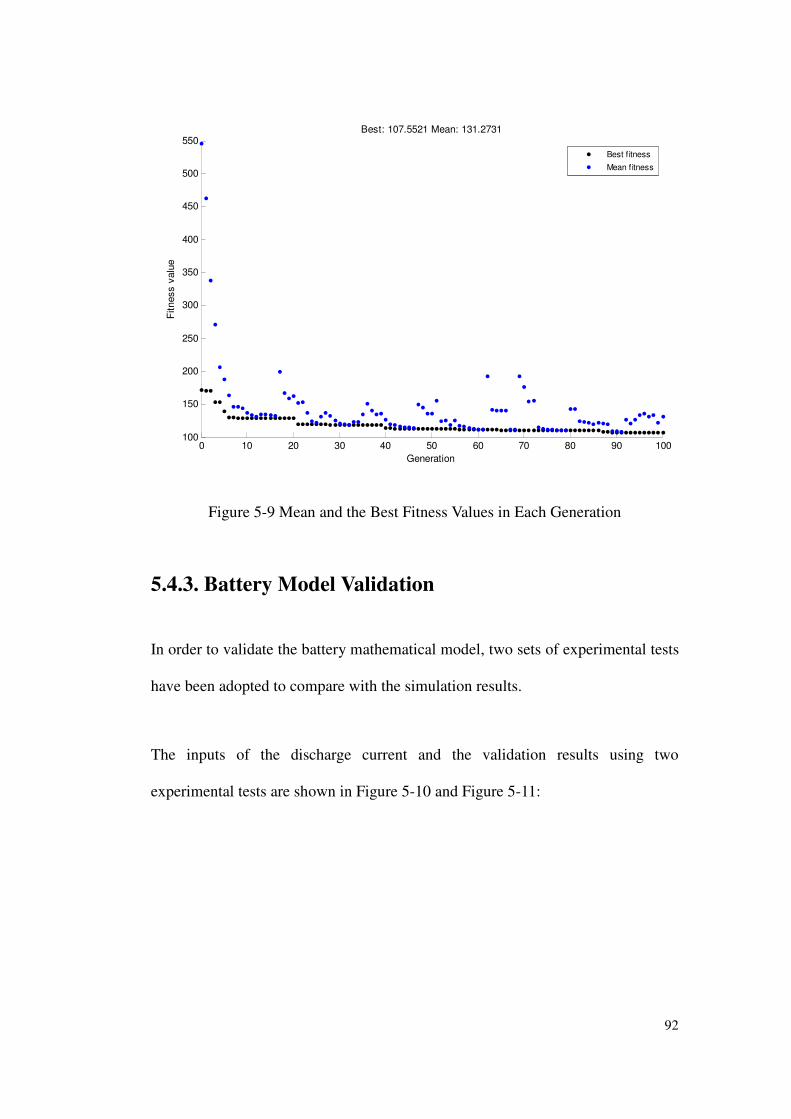
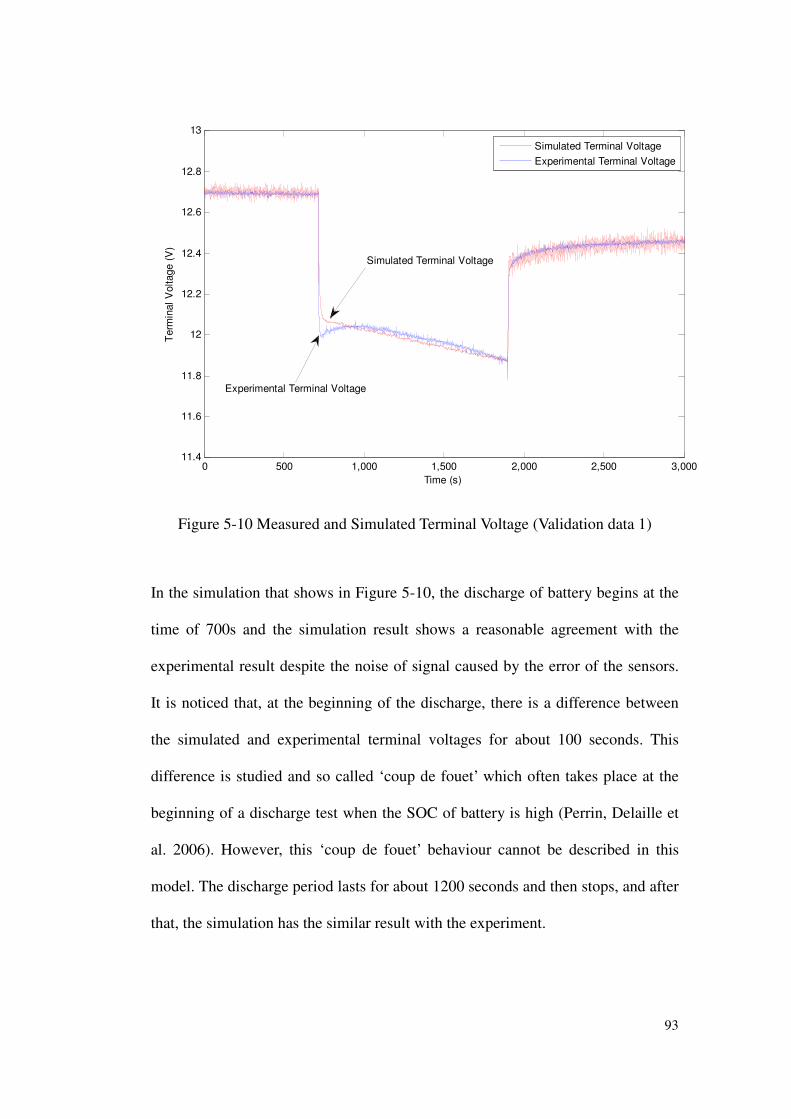
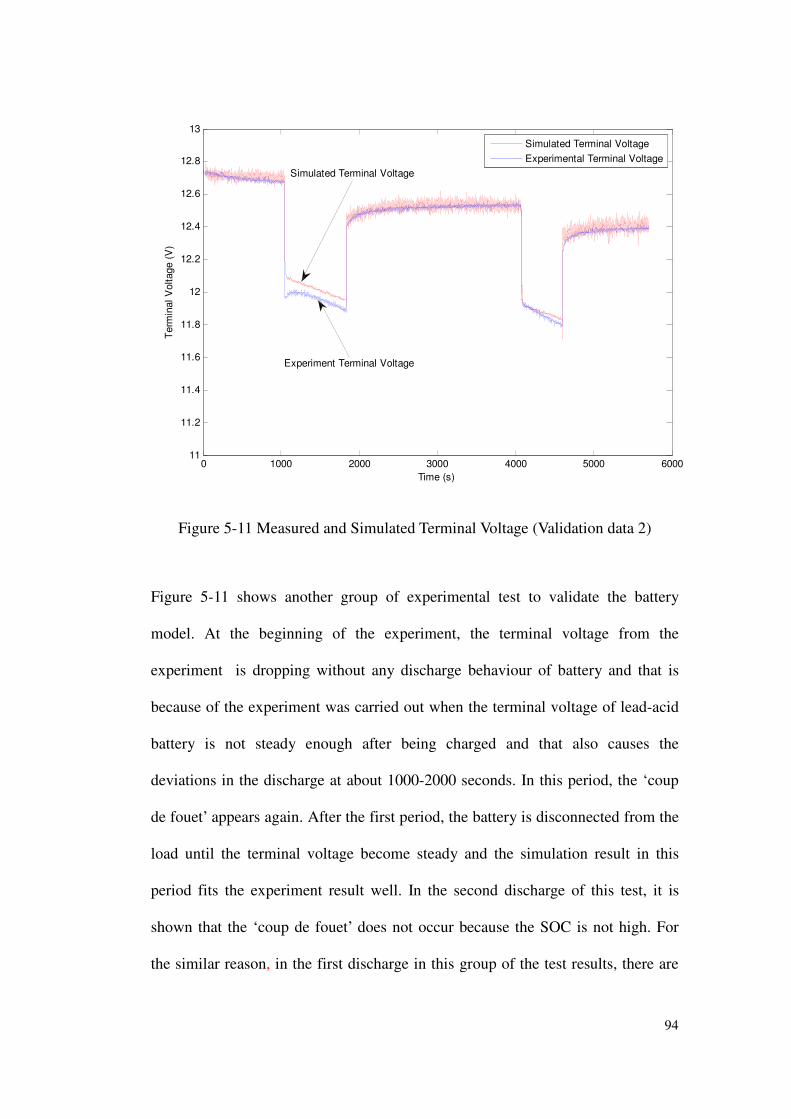
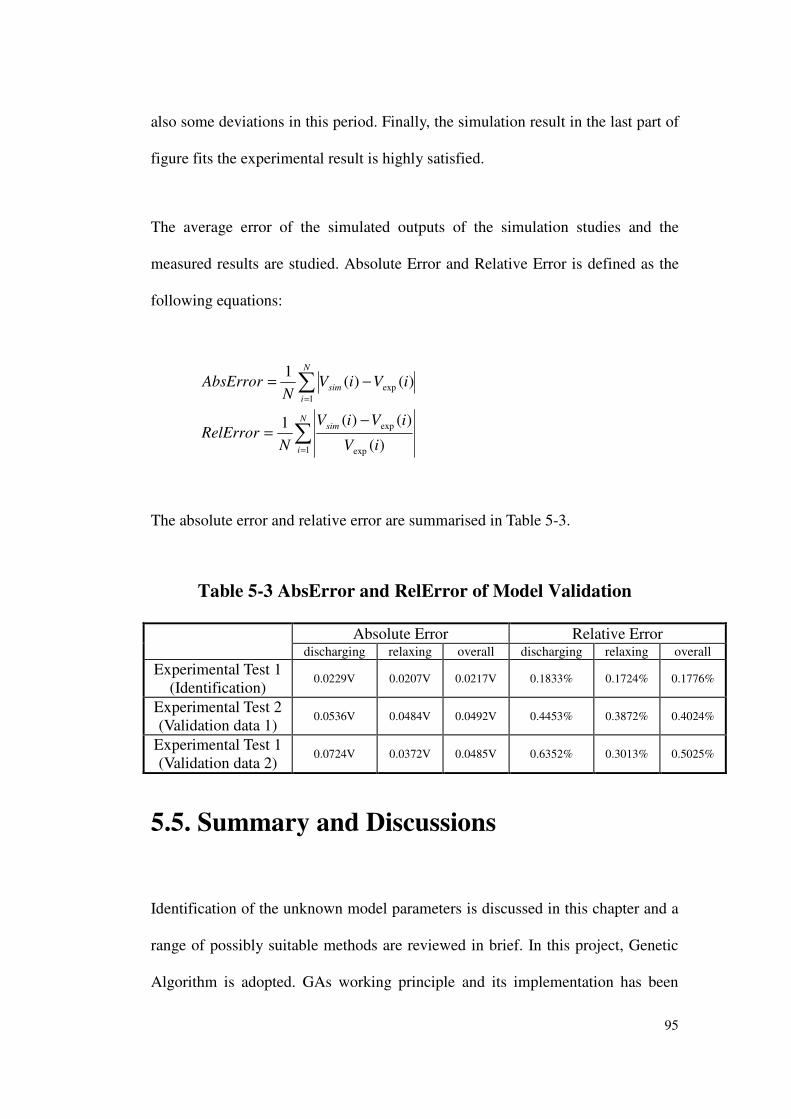


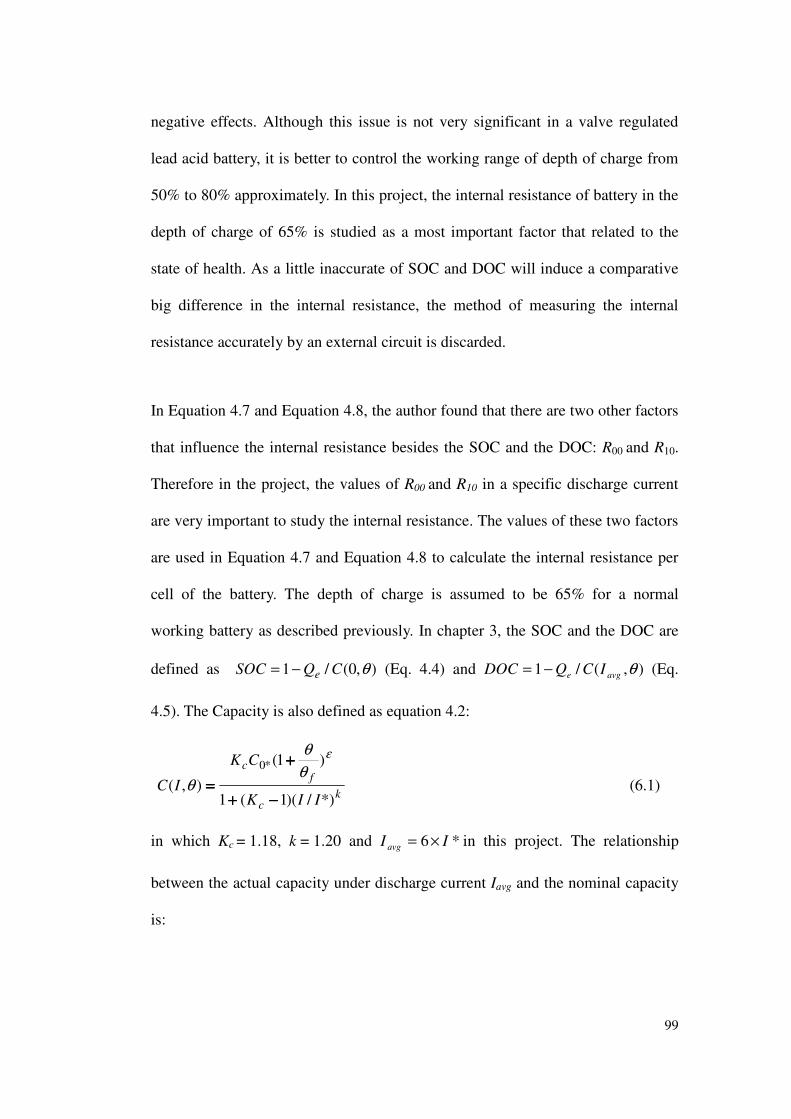
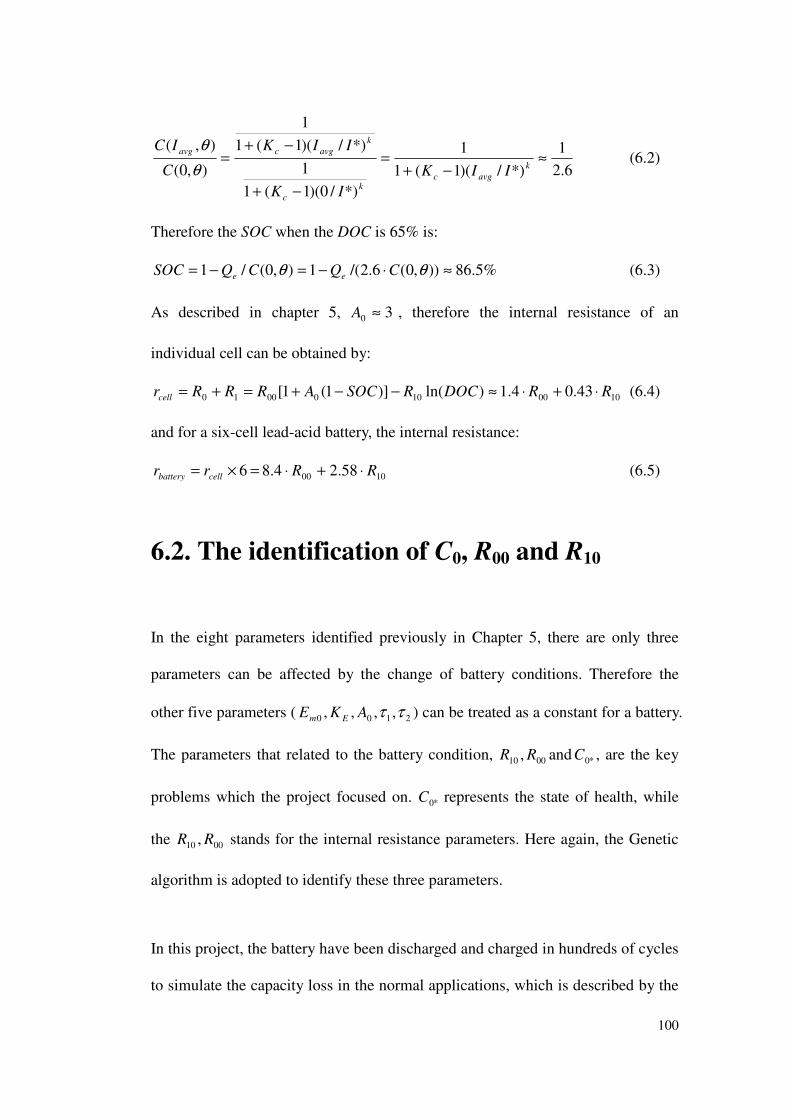

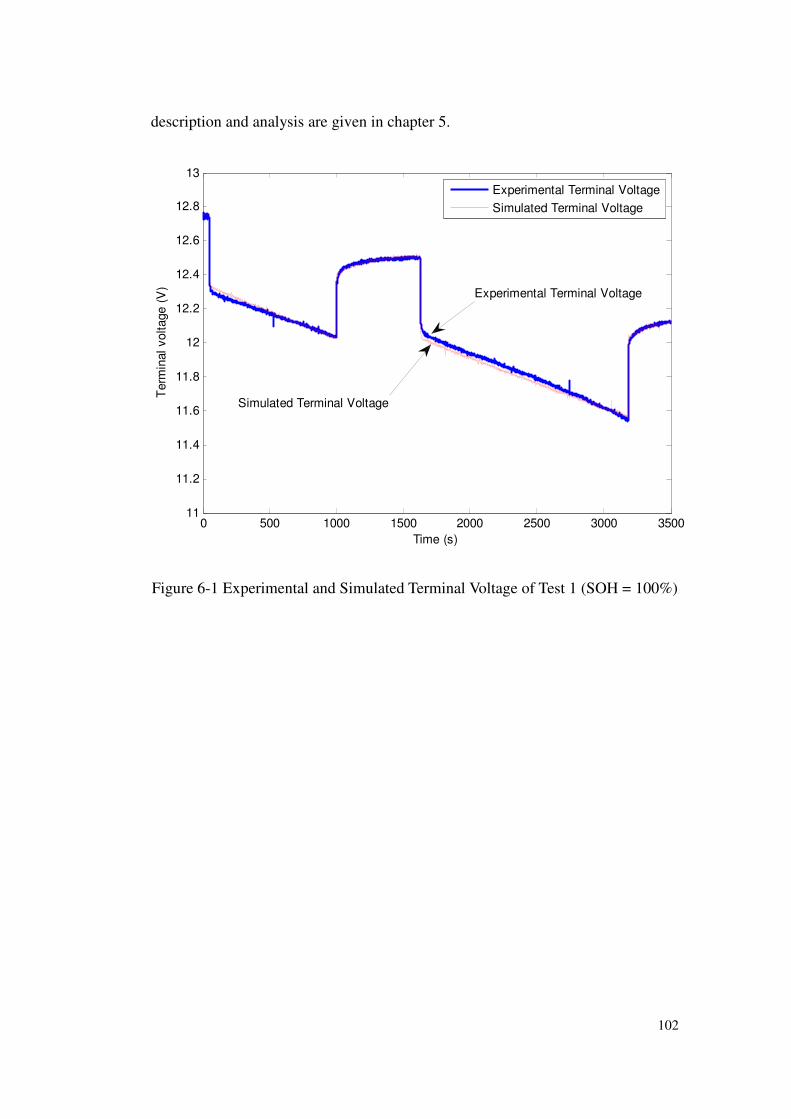


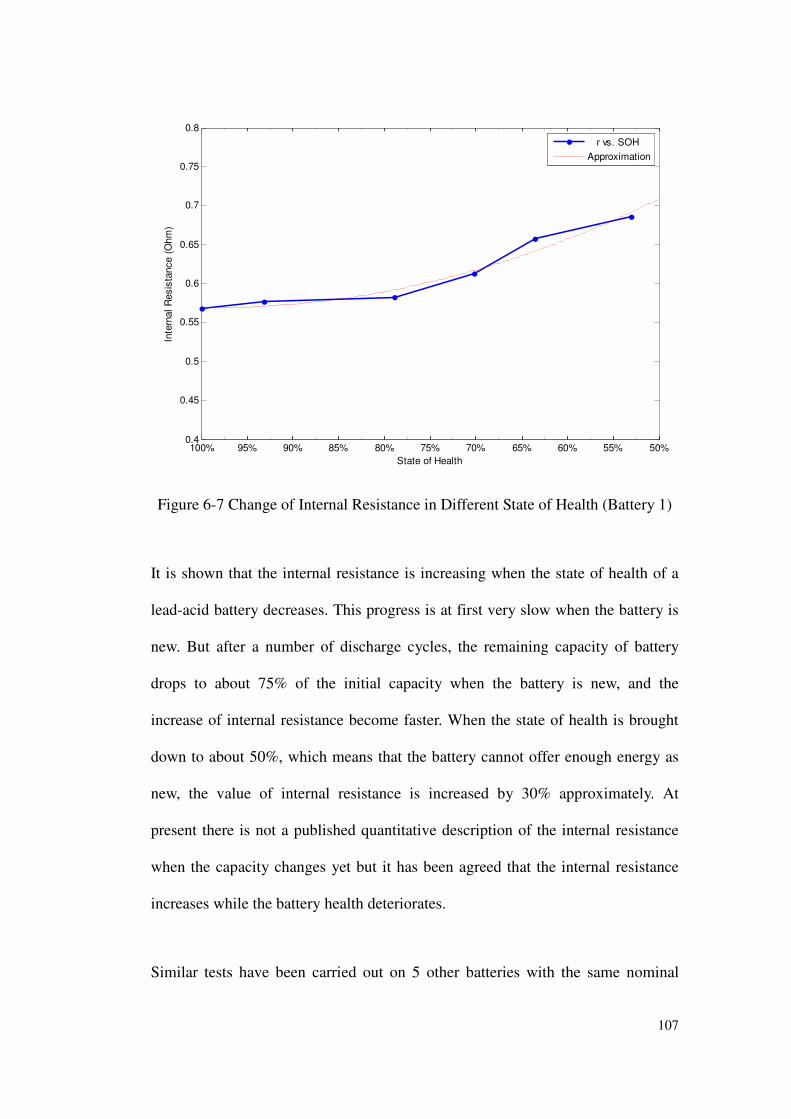
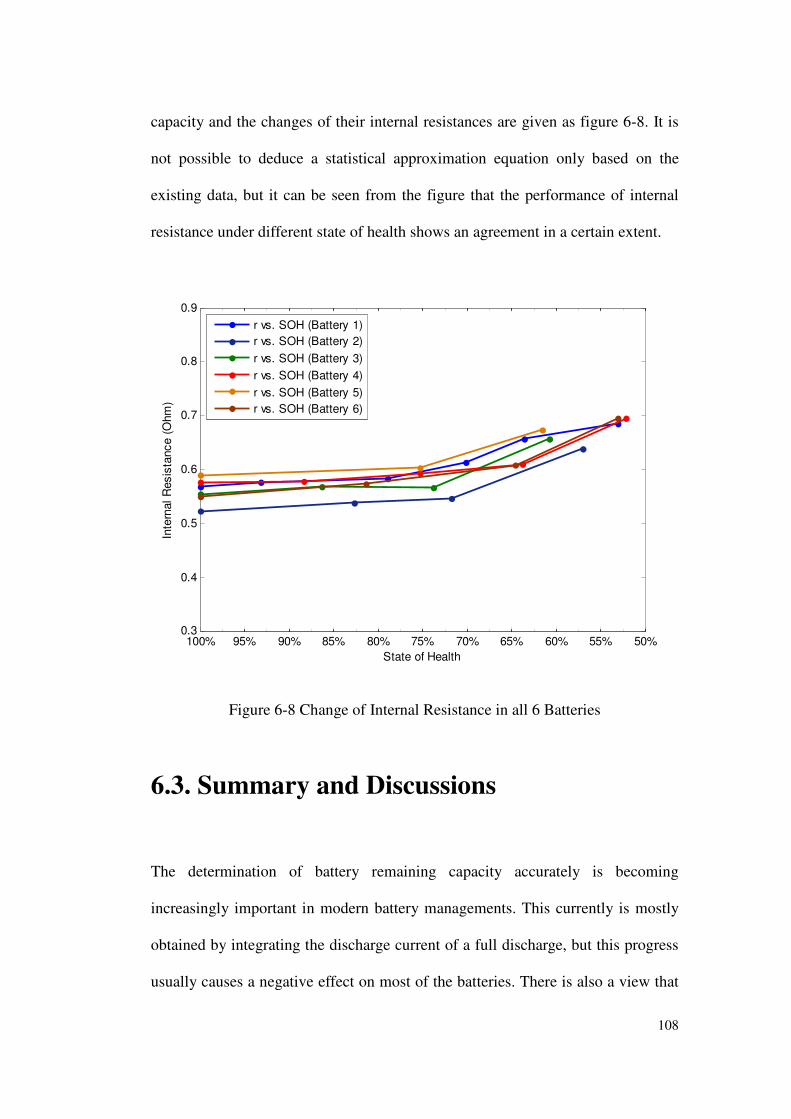


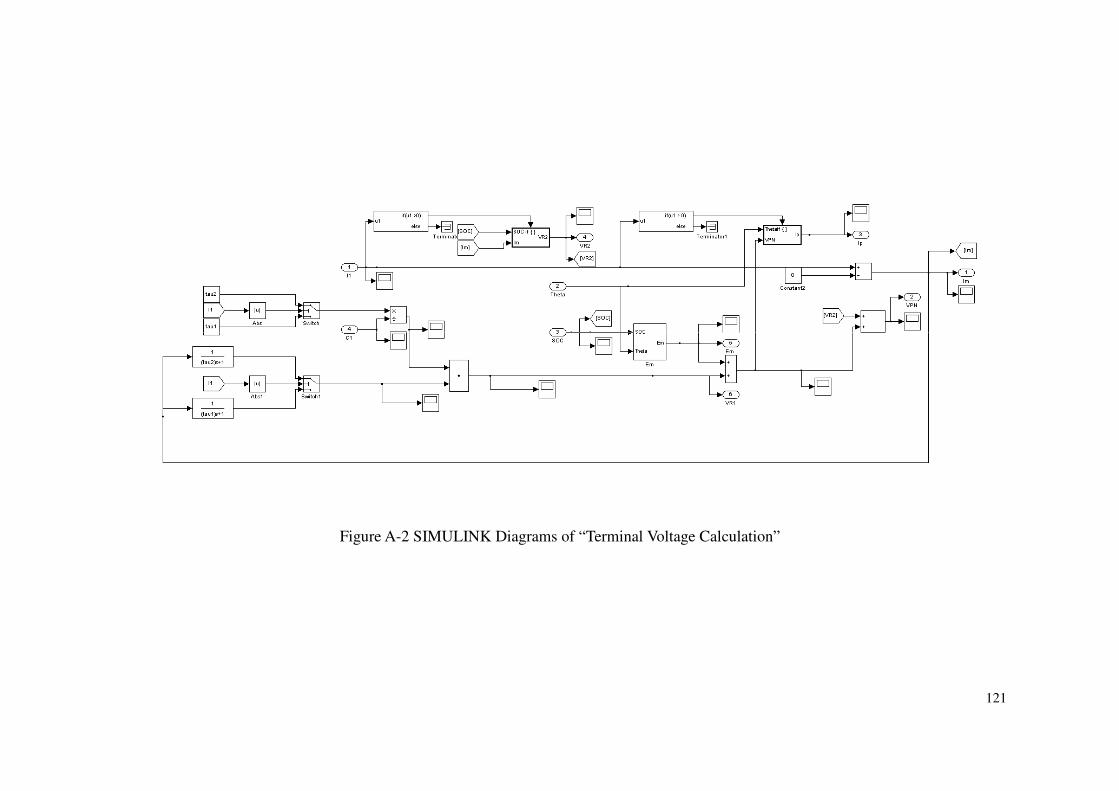
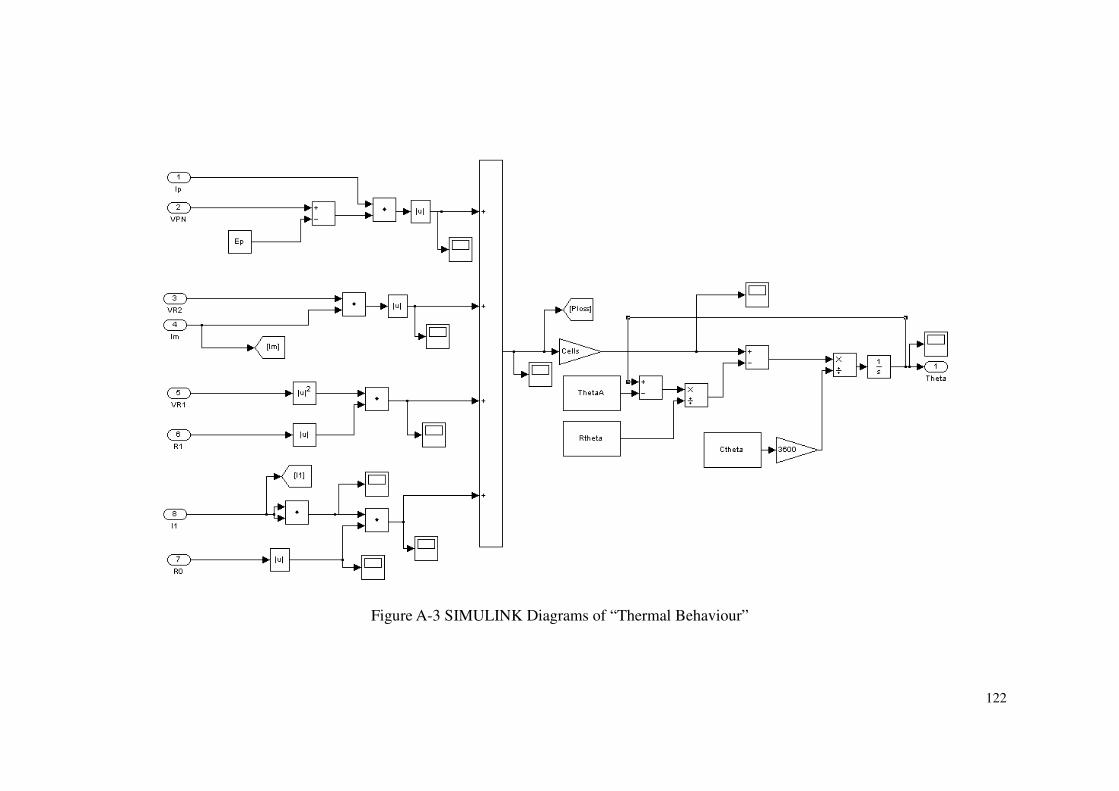
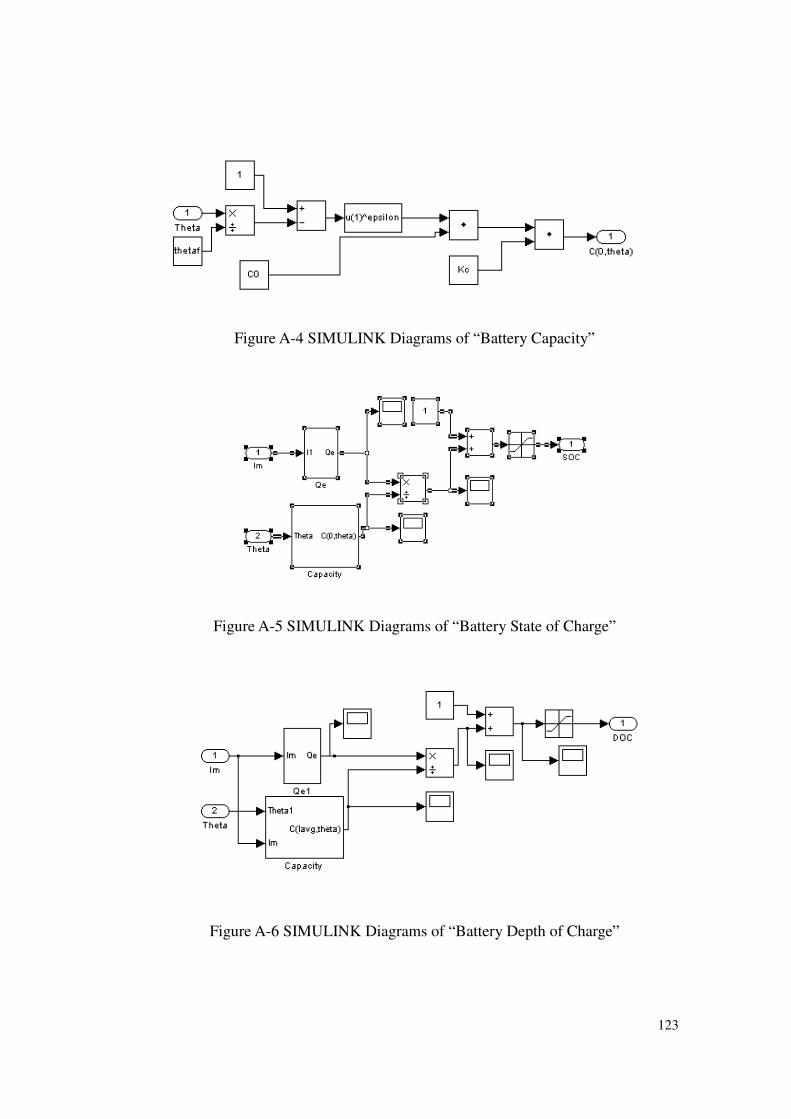
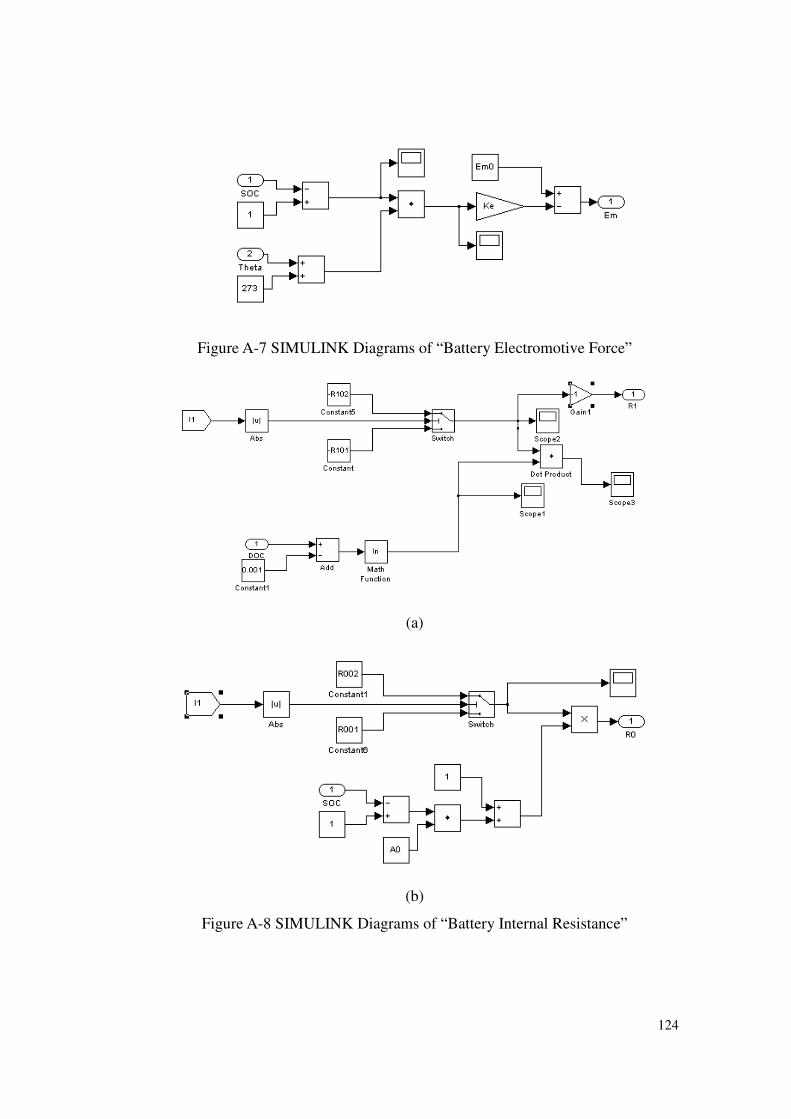

Recommended