1
The Agroecological Zone using Fuzzy Logic for Land
Suitability and Regional Sustainable Food Insecurity in
Boyolali, Central of Java Indonesia
Sri Yulianto Joko Prasetyo1 , Bistok Hasiholan S.2 and Kristoko Dwi Hartomo3
1Faculty of Information Technology, Satya Wacana Christian University,
Salatiga, Central of Java, Indonesia
2Faculty of Agriculture and Business Satya Wacana Christian University,
Salatiga, Central of Java, Indonesia
31Faculty of Information Technology, Satya Wacana Christian University,
Salatiga, Central of Java, Indonesia
Abstract
This study is aimed to develop agroecological zone model (AEZ) integrated with the evaluation of land suitability in
order to attain the food tenacity in Boyolali County, Central
Java, Indonesia. This model is established through five steps. First, it is stocktaking and identifying biophysical
land characteristic. The second step is compiling map of
suitability of land commodities. The third is compiling the
indicator of food vulnerability. The fourth step is
classifying variable with fuzzy logic and the last is
generating map based on the selected variable. Fuzzy
method was chosen because most research data contain
uncertainty value. Fuzzy Inference Systems (FIS) concept enables to stipulate the suitability of land to be used by a
particular type of plant, inhibiting factor and managerial
advice that can be applied to overcome the presence of
inhibiting factor, and also the appropriate location for a particular plant species.
The findings of this study show some benefits that can be
used for 1) compiling the indicator and detail map
(1:50.000) of agroecological zone integrated with the suitability of commodities and the character of land (soil
and climate) for agricultural cultivation, 2) compiling the
appropriate sustainable land management, 3) compiling the
indicator and detail map (1:50.000) of food vulnerability at the district level by a certain periodicity.
Keywords: Agroecological Zone, Land Suitability, Fuzzy Logic, Land Management, Food Insecurity
1. Backgrounds
In Indonesia, agricultural development to improve
food tenacity of an area has not been integrated
among AEZ, classification of land suitability and
capability, regional agricultural commodity and
planning for sustainable land management. Due to
this reason, a research was conducted to build the
integrated system of AEZ, land suitability evaluation,
regional commodity, determination of indicators and
food vulnerability map in a sustainable manner for
the strong agricultural development.
Food tenacity is the attempt to attain food availability
for all households which is adequate, good in quality
and nutrition, safe to eat, equitable and affordable for
every individual. One of the main pillars of regional
food tenacity is the variety of food, where the
development of food variety will be determined by
the biophysical condition of land, land management,
and ideal agricultural system used.
The food vulnerability in one area will happen when
regional food resource depends only on one type of
food commodity. The area which is lack of food
commodity, food distribution, and affordable price
will tend to have a risk of food vulnerability. The
regional food availability constitutes the function of
food production and distribution capability. Food
production capability itself is determined by various
factors comprising climate, soil attributes, rainfall,
irrigation, agricultural production component used,
IJCSI International Journal of Computer Science Issues, Vol. 9, Issue 6, No 3, November 2012 ISSN (Online): 1694-0814 www.IJCSI.org 191
Copyright (c) 2012 International Journal of Computer Science Issues. All Rights Reserved.

2
and even incentives for the farmers in order to
produce food grain. The food commodity
development in one area has not been conducted
integratedly among AEZ, classification of land
suitability and capability, regional food commodity
and planning for sustainable land management. In
line with this situation, integrated AEZ development
and suitability of spatio-temporal based land was
conducted. AEZ system used Fuzzy method to
classify region based on the similar biophysical
characteristic of land (slope, depth, and elevation),
climate (rainfall, humidity, and temperature),
growing plants requirements, so that plants can grow
and produce optimally. The aim of the classification
process is to define areas of crops and potential
commodities, which are economic scaled and well-
conceived in order to attain the sustainable farming
system.
2. Theoretical Backgrounds The Land constitutes a significant means of
production in farming system because it provides
nutrient, water resource, and air circulation. The land
is also the site of a broad range of farm management
activities. Moreover, the land is the part of a
landscape, encompassing physical environment of
climate, topography, soil, hydrology, and natural
vegetation, affecting the use of land [1][2]. By its
role, it is multi functions (the function of production,
biotic environment, climate regulatory, hydrology,
raw material and mineral resources, waste and
pollution control, living space, and spatial link).
Functioning as the site of farming production, there
were six groups of the most important land resources
for farming. They were (i) climate, (ii) geological
relief and formation, (iii) soil, (iv) water, (v)
vegetation, and (vi) artificial elements. At some
points, those six factors affect the land potential and
capability for agricultural uses[3].
The development of agricultural commodities should
be in line with supporting capacity of land in order to
be optimal according to its capability and to be able
to be sustainable used. The problem appears in an
inefficiency of land use, caused by lack of
information about suitability of land use and
management actions needed for every land area.
Information about the suitability of land use will
consider various factors, both physical and
socioeconomic environment. Related to the physical
factor, land evaluation is necessary in giving various
suitable alternative use of land.
One of the approaches used in land evaluation is
conducting AEZ determination based on the method
of the evaluation of land suitability for agricultural
uses. The concept of regional agriculture or AEZ
mapping is the simplification and grouping of diverse
agroecosystems into a more applicable form of
classification. Conducting the evaluation of land use
for farming through AEZ determination, according to
Amien (1994), has the integrated approach from
various factors, where determinants of agricultural
production (soil, hydrology, and climate) get a
balanced consideration[4].
In addition, AEZ constitutes one way in managing
the use of land through the zone classification based
on the similar nature and condition of the area [5][6].
The classification itself was aimed to determine
cropping area and potential commodities, which are
economic-scaled, well-orchestrated in order to attain
the sustainable farming system. In AEZ, lands were
sorted out based on its nature of land and climate
conditions in order to determine the alternative land
use. Each of land has different particular nature and
farming system. Consequently, it calls for vary
management and technology. Regarding this concept,
by applying AEZ in each use of land for farming, the
firm and sustainable farming system can be attained.
In Indonesia, AEZ determination was only conducted
on the scale of 1:230.000 and the classification of
land suitability produced can only be used for
planning on the level of province and county.
Meanwhile, for the regional farming plan, the
existing AEZ has not been able to be used to the
applicable scale in fields. Hence, to support specific
development programs in the area and in order to
construct regional food tenacity model,
characterization of the potential of land resources to
the level of semi detail (scale of 1:50.000) for the
entire villages was conducted.
Moreover, AEZ can be used for optimizing the
utilization of land resources targetedly and efficiently
through 1) compiling the alternative land use or
appropriate farming system, 2) determining the
planting area and developing commodities (eminent)
according to its environmental supporting capacity,
which is economic-scaled and well-orchestrated. The
development of crops in accordance with AEZ will
deliver a sustainable farming venture and finally, the
increase of communities’ revenue will occur.
The food vulnerability in one area is related to the
farming system development, whether it is suitable or
not with AEZ. In their research in Semarang,
Simanjuntak and Marina (2009) asserted that the
sequence of the top five indicators that potentially
provoke the food vulnerability are (1) the percentage
of the number of unemployed inhabitants; (2)
potentially natural disaster area (drought, poor
IJCSI International Journal of Computer Science Issues, Vol. 9, Issue 6, No 3, November 2012 ISSN (Online): 1694-0814 www.IJCSI.org 192
Copyright (c) 2012 International Journal of Computer Science Issues. All Rights Reserved.

3
drainage – stagnated water, avalanche – erosion );( 3)
the ratio of inhabitants per number of inhabitants in
the scale of the health care; 4) the percentage of the
number of inhabitants that do not have access to
clean water; and 5) the normative consumption per
capita. Based on that research, land factor constitutes
the significant factor leading to food vulnerability of
a region. Accordingly, the right land use system will
be able to contribute in the increase of regional food
tenacity[7][8].
This paper is organized as follows. Section 2
describes some related AEZ researches used as the
reference and theoretical concept for model
development. The section 3 is the research methods,
the concept of fuzzy inference system method. The
section 4 is the finding research, describes
architectural model proposed in this research. The
section 5 is conclusion and future work.
3. Methods Stages of the research conducted are shown in Fig. 1.
Inventory of primary and secondary data was
conducted on the biophysical land variables such as
the existing air temperature, rainfall, soil texture,
slope, solum depth, drainage, and local knowledge.
The existing pranatamangsa pattern conducted by the
society, agricultural production, and farming system
were the examples[9]. The analysis and generation of
food vulnerability map and agro-ecological zone map
in one area, in detail, used the preparation of regional
food tenacity model based on the results analysis and
the generation of map of AEZ, food vulnerability and
the evaluation of land suitability.
National Food Tenacity Policy
The Land Biophysical
Characteristic
The Food
Vulnerability
Indicator
The Agroecological
Map
The Food
Vulnerability
Indicator Map
The Suitability
Commodity Map
The Development of
Ideal and Sustainable
Farming Map
FUZZY LOGIC - OVERLAY
The Main
Indicator of
Food
Vulnerability
Analysis
Recommendation of
Sustainable Regional
Food Tenacity Model
INPUT
PROCESS
OUTPUT
Sustainable Land Development
FUZZY LOGIC - OVERLAY
The Regional Food
Vulnerability Based
On The Land
Biophysical Map
Fig.1. The Stages of the Research Procedure
Fuzzy logic concept constitutes the classification
based on the variable revealed in the form of the
membership function. It is a curve that shows the
mapping of points of data input into the value of
membership. Representation of Linear and Triangle
curve in membership function preparation as in
Equation (1) and Equation (2) was used in this
research[10][11].
(1)
(2)
Defuzzification method used the composition of
Mamdani bisector rule. It is taking value of the fuzzy
domain that has membership value (half of the total
numbers of membership on the fuzzy area). The
equation of bisector method is shown on the equation
(3)
(3)
That concept representation was conducted by
applying in the form of application using
programming language (PHP), MySQL database,
MapServer framework for maps, and XTJS for
graphics. The classification process in the system was
done by Fuzzy Engine and Fuzzy Rule Base. The
system architecture is shown in Fig. 2.
Data Processing and Analysis
Data acces
User
GUI
GUI Non Spatial
Ext JS Framework
GUI Spatial
MapServer Framework
Acces Autozae Update Model
Fuzzy Engine
Database
Fuzzy Rule
Base
Data
Source
Fig. 2. The Architecture of conceptual system
IJCSI International Journal of Computer Science Issues, Vol. 9, Issue 6, No 3, November 2012 ISSN (Online): 1694-0814 www.IJCSI.org 193
Copyright (c) 2012 International Journal of Computer Science Issues. All Rights Reserved.

4
4. Findings
Fuzzy logic was used for determining agroecological
zone from one village area in one county. Indicators
used are the slope, elevation, and rainfall. The
magnitude of the slope of the land was used to
determine the type of physiography of a region[12].
The physiography are:
Zone I : The slope < 8%, with flat to slightly
flat physiography.
Zone II : The slope is 8-15%, with choppy
physiography and slightly steep slope .
Zone III : The slope is 15-40%, with
rolling/hilly physiography and steep slope.
Zone IV : The slope > 40%, with mountainous
physiography and very steep slope
The regional altitude/elevation value was used for
determining the air temperature in one area. Those air
temperatures are:
Hot (A) the height of 500 msl or the average of
yearly air temperature > 26°C.
Cool (B) the height of 500 – 1000 msl or the
average of yearly air temperature is 26°C –
23°C.
Cold (C) the height of >1000 msl or the average
of yearly air temperature < 23°C.
The regional rainfall value was used for determining
the humidity in one area. The humidities are:
Dry (X), when the dry month > 7 months in a
year or yearly rainfall <1500 mm.
Humid (Y) when the dry month is between 4 - 7
months in a year or the yearly rainfall is
between 3000 – 1500 mm.
Wet (Z) when the dry month < 3 months in a
year or the yearly rainfall >3000 mm.
The Land Physiography Value:
Flat physiography (<8%)
Slightly Steep Physiography (8% -
15%)
Steep Physiography (15% - 40%)
Very Steep Physiography (>40%)
The Value of Altitude/elevation:
Fuzzy Set Domain:
Hot Temperature (<500 msl)
Cool Temperature (500 msl – 1000
msl)
Cold Temperature (> 1000 msl)
The Humidity Value
Dry (< 1500 mm)
Humid (1500 mm – 3000 mm)
Wet (> 3000 mm)
Basic map information in the system is displaying the
studied area data (Boyolali County, Central Java,
Indonesia). The map was displayed up to the limit of
the scope of the sub district. On the next stage, data
analysis and the representation of information will be
detailed up to the level of village. Boyolali County
can administratively be seen as shown in Fig. 3.
Fig. 3. The Information of Administrative Area of Boyolali
County
The commodity suitability classification presents the
distribution of agricultural commodities in the 5 year
period produced by Boyolali County. On the earlier
research, there were rice, corn, tobacco, sengon
woods and in a small percentage of wheat
commodities. The type of commodities information
was presented in the form of polygon colour
difference so that the production expansion and
capacity of each subdistrict area was unknown. The
improvement of this model is to make the village unit
become the smallest unit and show the amount of
production capacity with data rates in the last 5 years
as map AEZ (Fig.4.), AEZ information in Fig.5.,
recommendation local agriculture system (Fig.6.),
and information of food insecurity in Fig.7.
Fig. 4. Representation information in the form of map AEZ
area of Boyolali County
IJCSI International Journal of Computer Science Issues, Vol. 9, Issue 6, No 3, November 2012 ISSN (Online): 1694-0814 www.IJCSI.org 194
Copyright (c) 2012 International Journal of Computer Science Issues. All Rights Reserved.
5
Fig. 5. Detail zones information in map AEZ local area of
Boyolali County
Fig.6. Recommendation local agriculture system area of Boyolali County
The rainfall variable is the significant indicator in
agricultural cultivation because it will affect the type
of commodities and cropping practices to be appied
in one area. The rainfall map was orchestrated based
on the data obtained from daily data for 10 years
from the station of National Indonesian Air Force
(TNI-AU) Indonesia Surakarta. The rainfall
information was presented in the form of map
(Fig.8.). The presentation of the rainfall information
will be refined based on the pattern of rain
distribution using isohyets map instead of the
administrative area.
Fig.7. Information of food insecurity area of Boyolali
County
Figure 8. The Information of rainfall according to the sub
district in the form isohyets map to Boyolali County Administratives
The division of interval in the rainfall comprises: “
kering” as dry, “lembab” as humid and “basah” as
wed.
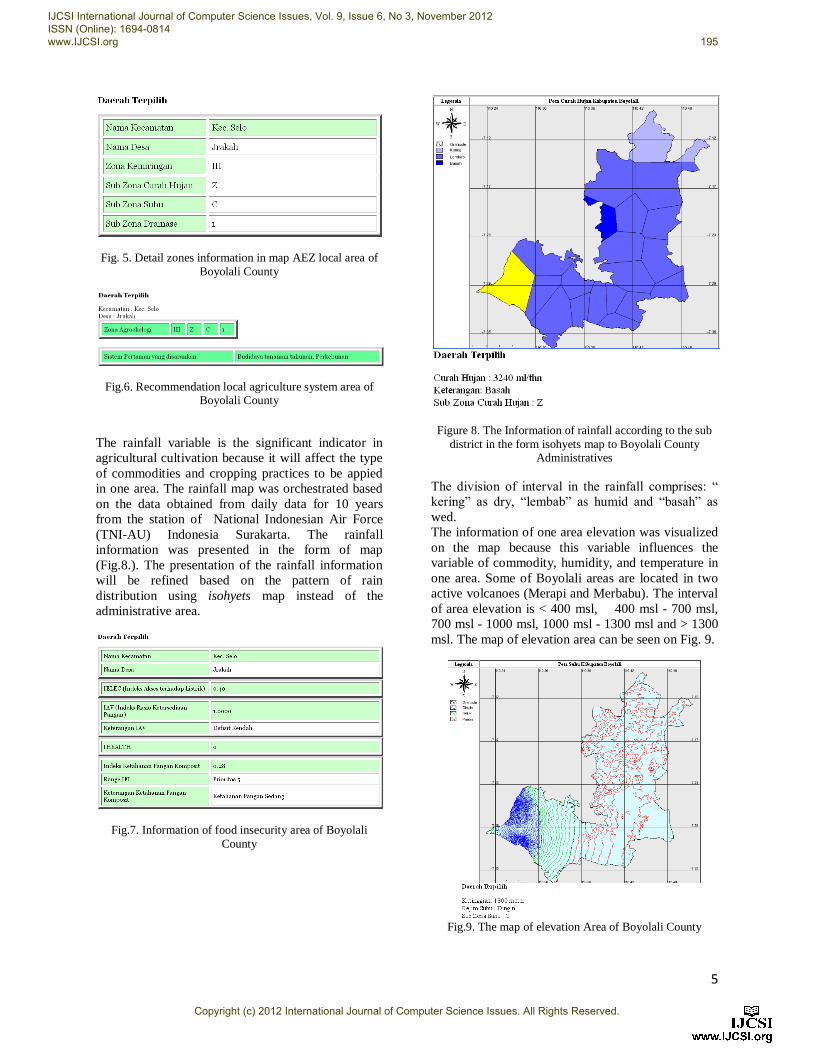
The information of one area elevation was visualized
on the map because this variable influences the
variable of commodity, humidity, and temperature in
one area. Some of Boyolali areas are located in two
active volcanoes (Merapi and Merbabu). The interval
of area elevation is < 400 msl, 400 msl - 700 msl,
700 msl - 1000 msl, 1000 msl - 1300 msl and > 1300
msl. The map of elevation area can be seen on Fig. 9.
Fig.9. The map of elevation Area of Boyolali County
IJCSI International Journal of Computer Science Issues, Vol. 9, Issue 6, No 3, November 2012 ISSN (Online): 1694-0814 www.IJCSI.org 195
Copyright (c) 2012 International Journal of Computer Science Issues. All Rights Reserved.

6
The other visualized information is the map of soil
type. It becomes the important indicator in
agricultural commodities determination. The sorts of
soil in Boyolali are Litosol, Regosol, Andosol,
Mediterranean and Grumosol. The map of soil type
can be seen on Fig.8.
Fig. 8. The Map of Soil Type in Boyolali County
Fuzzy logic conducted the classification of the entire
data on the variable for creating commodity
suitability. It can be seen in Fig.9. The Suitability
category comprises S1 (extremely suitable), S2 (quite
suitable) and S3 (marginal suitable).
Fig. 9. Visualization of Commodity Suitability
5. Conclusion Fuzzy Logic method can be applied for classifying
data according to its attribute and providing the
information of the proper land use suitability. The
fuzzy logic method precisely worked by the merger
between physiographic characteristic of land (slope,
drainage, altitude) and climate (rainfall and
temperature). The characteristic of physiograpic land
data was acquired from the processing of contour
map, elevation map, and the rainfall data becoming
the digital map of slope, humidity, temperature
regime, and drainage.
6. REFERENCES [1] Terme V.D., 1996, Agroecological Zoning
Guidelines, Food and Agriculture Organization of the United Nations, Rome.
[2] Quiroz et al., 2000, Toward A Dynamic Definition of
Agroecological Zones Using Modern Information
Technology Tools, Centro de Investigaciones en Recursos Naturales y Medio Ambiente, Puno, Peru.
[3] Fischer G., Nachtergaele F.O, Prieler S, Teixeira E.,
Tóth G., Velthuizen H., Verelst L., Wiberg D.,
Global Agro‐Ecological Zones (GAEZ v3.0), Food
and Agriculture Organization of the United Nations
[4] Amien Istiqlal, 2000, Agroecological Analysis for
Agricultural Development in Indonesia, Center for
Soil and Agroclimate Research Jalan Juanda 98 Bogor 16123, Indonesia.
[5] Syafrudin, 2004, Penataan Sistem Pertanian dan
Penetapan Komoditas Unggulan Berdasarkan Zona Agroekologi di Sulawesi Tengah, Litbang Deptan,
RI.
[6] Bistok H.S dan Marina MH, 2009, Penyusunan
Indikator dan Pemetaan Rawan Pangan Kabupaten Semarang Tahun 2009, Semarang: Bappeda Kab.
Semarang(In Indonesia Language).
[7] Bhan S.K., Saha, L.M., Pande dan J.Prasad, 1996,
Use of Remote Sensing and GIS Technology in Sustainable Agricultural Management and
Development, Indian Institute of Remote Sensing,
NRSA DEHRADUN-248001, India.
[8] Patel N.R.,2002, Remote Sensing and GIS Application in Agro-ecological Zoning, Agriculture
and Soils Division Indian Institute of Remote
Sensing, Dehra Dun.
[9] Bistok H.S., Yulianto J.P.,, Hartomo K.D.,, 2010, Improving Food Resilience with Effective Cropping
Pattern Planning using Spatial Temporal-Based
Updated Pranata Mangsa, International Conference
on Soft Computing, Intelligent System and Information Technology Petra Surabaya.
[10] Kusumadewi, S., 2002, Analisis dan Desain Sistem
Fuzzy Menggunakan Tool Box Matlab, Graha Ilmu,
Yogyakarta(In Indonesia Language). [11] Kusumadewi, S.,Hartati S., Harjoko A., dkk., 2006,
Fuzzy Multi-Attribute Decission Making (Fuzzy
MADM), Graha Ilmu, Yogyakarta.
IJCSI International Journal of Computer Science Issues, Vol. 9, Issue 6, No 3, November 2012 ISSN (Online): 1694-0814 www.IJCSI.org 196
Copyright (c) 2012 International Journal of Computer Science Issues. All Rights Reserved.

7
[12] Balitbang Pertanian, 1999, Panduan Metodologi
Analisis Zone Agro Ekologi, Dep.Pertanian RI(In Indonesia Language).
Sri Yulianto J.P., Received is B.Sc at Biology from the Duta
Wacana Christian University Yogyakarta Indonesia in 1995.
Received is Master degree at Computer Science at Faculty
of Mathematics and Natural Sciences from the Gadjah Mada
University Yogyakarta Indonesia in 2002. He is student
Doctoral Program Computer Science at Faculty of
Mathematics and Natural Sciences from the Gadjah Mada
University Yogyakarta Indonesia. He is currently a lecturer in
the Informatic Engineering Department, Faculty of
Information Technology, Satya Wacana Christian University
Salatiga Indonesia. His current research interests include
spatial statistic, GIS, simulation and modeling, data mining
and their applications.
Bistok Hasiholan Simanjuntak, Received the M.Sc. degree in
Departemen Soil and Land Resources Science from Bogor
Agricultural University Indonesia. He received his Ph.D.
degree in Soil and Land Resources from the University of
Brawijaya. He is currently a lecturer in the Faculty of
Agricultural and Business Satya Wacana Christian
University, Salatiga, Indonesia. His current research
interests include Agroclimate, Agroecological, Soil and Land
Resources.
Kristoko Dwi Hartomo., Received is B.Sc at Informatic
Engineering from the Duta Wacana Christian University
Yogyakarta Indonesia. Received is Master degree at
Computer Science at Faculty of Mathematics and Natural
Sciences from the Gadjah Mada University Yogyakarta
Indonesia. He is student Doctoral Program Computer
Science at Faculty of Mathematics and Natural Sciences
from the Gadjah Mada University Yogyakarta Indonesia. He
is currently a lecturer in the Informatic Engineering
Department, Faculty of Information Technology, Satya
Wacana Christian University Salatiga Indonesia. His current
research interests include spatial Modeling, GIS, database,
data mining and their applications.
IJCSI International Journal of Computer Science Issues, Vol. 9, Issue 6, No 3, November 2012 ISSN (Online): 1694-0814 www.IJCSI.org 197
Copyright (c) 2012 International Journal of Computer Science Issues. All Rights Reserved.
Recommended