The Absorption of Illicit Financial Flows from Developing Countries: 2002–2006
Prepared by Dev Kar, Devon Cartwright-Smith and Ann Hollingshead

The Absorption of Illicit Financial Flows from Developing Countries: 2002-2006
Prepared by
Dev Kar, Devon Cartwright-Smith, and Ann Hollingshead 1
Global Financial Integrity Wishes to Thank The Ford Foundation for Supporting this Project
1 Dev Kar, formerly a Senior Economist at the International Monetary Fund, is Lead Economist at Global Financial Integrity (GFI), Center for International Policy. Devon Cartwright-Smith and Ann Hollingshead are, respectively, Economist and Junior Economist at GFI. The authors would like to thank, without attribution, Raymond Baker and other staff of GFI and one anonymous reviewer at the IMF for helpful comments. Thanks are also due to Swapan Pradhan of the Bank for International Settlements for his expert assistance in providing the necessary international banking data. Remaining errors are the authors’ responsibility. The views expressed are those of the authors and do not necessarily reflect those of GFI, the Task Force on Financial Integrity and Economic Development, or GFI’s Advisory Board.

iThe Absorption of Illicit Financial Flows from Developing Countries: 2002-2006
Contents
Letter From the Director. . . . . . . . . . . . . . . . . . . . . . . . . . . . . . . . . . . . . . . . . . . . . . . . . . . . . . . . . . . . iii
Abstract . . . . . . . . . . . . . . . . . . . . . . . . . . . . . . . . . . . . . . . . . . . . . . . . . . . . . . . . . . . . . . . . . . . . . . . . v
Executive Summary . . . . . . . . . . . . . . . . . . . . . . . . . . . . . . . . . . . . . . . . . . . . . . . . . . . . . . . . . . . . . . vii
I. Introduction . . . . . . . . . . . . . . . . . . . . . . . . . . . . . . . . . . . . . . . . . . . . . . . . . . . . . . . . . . . . . . . . . . . . 1
II. Data Sources and Related Issues . . . . . . . . . . . . . . . . . . . . . . . . . . . . . . . . . . . . . . . . . . . . . . . . . . 5
III. Points of Absorption (POAs) . . . . . . . . . . . . . . . . . . . . . . . . . . . . . . . . . . . . . . . . . . . . . . . . . . . . . 11
IV. A Model of Absorption . . . . . . . . . . . . . . . . . . . . . . . . . . . . . . . . . . . . . . . . . . . . . . . . . . . . . . . . . 13
V. Licit-Illicit Analysis . . . . . . . . . . . . . . . . . . . . . . . . . . . . . . . . . . . . . . . . . . . . . . . . . . . . . . . . . . . . . 25
VI. Conclusions . . . . . . . . . . . . . . . . . . . . . . . . . . . . . . . . . . . . . . . . . . . . . . . . . . . . . . . . . . . . . . . . . 29
References . . . . . . . . . . . . . . . . . . . . . . . . . . . . . . . . . . . . . . . . . . . . . . . . . . . . . . . . . . . . . . . . . . . . . 31
Appendix . . . . . . . . . . . . . . . . . . . . . . . . . . . . . . . . . . . . . . . . . . . . . . . . . . . . . . . . . . . . . . . . . . . . . . 33

ii Global Financial Integrity
iiiThe Absorption of Illicit Financial Flows from Developing Countries: 2002-2006
We are pleased to present our report, “The Absorption of Illicit Financial Flows from Developing Countries:
2002-2006”
In December 2008 Global Financial Integrity produced its analysis entitled “Illicit Financial Flows from
Developing Countries: 2002-2006.” We found that some $850 billion to $1 trillion a year was disappearing from
poorer countries as proceeds of bribery and theft, criminal activity, and commercial tax evasion. This analysis
utilized established economic models, namely the World Bank Residual Method and IMF Direction of Trade
Statistics. And the estimate is considered to be quite conservative, as it does not include illicit flows generated
through smuggling and some forms of trade mispricing.
The question then arises: Where are these financial flows absorbed? There are no established economic
models providing analytical tools to answer this question. It is in fact easier to analyze outflows from
developing countries with weak statistical capacities than it is to analyze inflows into developed countries
with much stronger statistical capacities. The greater part of illicit flows departing one country and arriving in
another country are transferred as cash through the shadow financial system, resulting in deposits in accounts
outside countries of origin. But such money does not remain as cash on deposit; instead much of it gets
withdrawn and put into securities, real estate, consumption, or other uses. Withdrawal data are not reported.
End-of-period deposit data are reported. Thus it is possible to examine the change of annual end-of-period
deposits and compare this to outflow data. For each country, the Bank for International Settlements (BIS)
compiles data on the total of private deposits outside countries of origin. Normally, such external deposit data
is provided globally, not broken down by country of deposit. At our request, the BIS kindly made available
regional breakdowns of such deposit data. Growth of external deposits by region compared to estimated
illicit outflows provides a basis for analyzing where such global illicit outflows ultimately arrive. With additional
analytical techniques it is possible to estimate how much is deposited in offshore financial centers versus
developed country banks.
Our work demonstrates that developed countries are the largest absorbers of cash coming out of developing
countries. Developed country banks absorb between 56 percent and 76 percent of such flows, considerably
more than offshore financial centers. Thus, the problem of absorption of illicit financial flows is one that rests
primarily with Europe and North America, rather more so than with tax havens and secrecy jurisdictions. The
policy implication is clear. While developing countries need to implement policies to curtail illicit financial flows,
efforts to alleviate poverty and contribute to sustainable growth will be thwarted as long as developed countries
permit their banks and cooperating offshore financial centers to facilitate the absorption of illicit funds.
Our work further demonstrates the need for considerably improved data on cross-border deposits. This should
be a major focus of current efforts toward global financial reform.
GFI thanks Dev Kar, Devon Cartwright-Smith, and Ann Hollingshead for their excellent work in producing this
difficult and very important analysis.
Raymond W. BakerDirector

iv Global Financial Integrity
vThe Absorption of Illicit Financial Flows from Developing Countries: 2002-2006
Abstract
A recent study by Kar and Cartwright-Smith (2008) found that over the period 2002 to 2006, illicit
financial flows from developing countries increased from US$372 to US$859 billion. The purpose of
this paper is to link these outflows with major points of absorption consisting of offshore financial
centers and developed country banks. While offshore centers have recently attracted media
attention regarding their lack of transparency, the paper finds that large data gaps exist for banks
as well. These gaps make it difficult to analyze the absorption of illicit funds, defined as the change
in private sector deposits of developing countries in banks and offshore centers. The paper argues
that both need to greatly improve the transparency of their operations. Regular reporting of detailed
deposit data by sector, maturity, and country of residence of deposit holder would close many
of the data gaps identified in this paper and allow for a more robust analysis of the absorption of
illicit flows from developing countries. Given data limitations, certain assumptions had to be made
regarding the behavior of illicit flows and investments. These assumptions were formulated as
control variables for a simple model of absorption. Several simulations of illicit outflows against
absorption (defined as the non-bank private sector deposits of developing countries) were carried
out using different settings of the control variables. The paper finds that while offshore centers
have been absorbing an increasing share of illicit flows from developing countries over the five-year
period of this study, international banks have played a pivotal role in facilitating that absorption.
Depending upon whether one uses the narrower Bank for International Settlements or broader
International Monetary Fund definition (a control variable), offshore centers hold an estimated
24 or 44 percent of total absorption respectively, while banks hold the balance. As total absorption
consists of both licit and illicit funds, the paper presents a simple algebraic analysis to estimate the
portion of such deposits in banks and offshore centers. Furthermore, the analysis shows that the
polar extreme (all illicit or all licit) in such holdings by either group is not tenable given the overall
volume of illicit flows and absorption.

vi Global Financial Integrity
viiThe Absorption of Illicit Financial Flows from Developing Countries: 2002-2006
Executive Summary
According to a recent study at Global Financial Integrity, illicit financial flows from developing
countries increased at a compound annual rate of 18.2 percent per annum since 2002 to nearly
a trillion dollars in 2006. Massive as these flows are, economists have not studied the issue of
absorption—where are illicit funds deposited after they leave the developing countries?
The objective of this paper is to shed light on the absorption of illicit funds by developed country
banks (henceforth, banks) and offshore financial centers (henceforth, offshore centers or OFCs).
Banks are defined as those in four developed countries (Australia, Japan, United Kingdom,
and United States) and the European reporting centers (see Appendix Table 4). As there is no
universally agreed definition of offshore centers, this paper uses both the International Monetary
Fund (IMF) and the BIS versions. Specifically, the IMF classifies Ireland and Switzerland as offshore
centers whereas the BIS does not. Also, the paper makes no distinction between offshore centers
and tax havens because the two lists are identical except for Liberia, which is a pure tax haven.
The paper presents a framework for estimating the extent to which banks and offshore centers
facilitate the absorption of flight capital. The policy implication of this paper is that economic and
governance policies in developing countries could curtail illicit flows if they are complemented by
developed country policies that make the absorption of these funds much more difficult.
We point out that extensive data gaps and lack of transparency in the financial transactions of
banks and offshore centers introduce significant errors in any attempt to “map” illicit outflows to
initial points of absorption. These data gaps are highlighted in order to elicit discussion on the next
steps involved in strengthening the database on international banking. However, quite apart from
statistical issues, the fact remains that economic models are basically unable to capture the totality
of illicit flows. While data on absorption are not complete either, simulations carried out in the paper
show that illicit flows are significantly lower than total absorption.
An important reason is that financial institutions absorb both licit as well as illicit funds from
developing countries. Hence, the data on absorption compiled by the Bank for International
Settlements (BIS) includes a licit component, involving funds that conform to a developing country’s
tax laws and its exchange control regime. Thus, legitimate profits of companies on which domestic
taxes were paid and are legally repatriated or the transfer of foreign currency by individuals who
obtained prior approval for such transfers would be examples of licit funds from developing
countries absorbed in traditional banks and offshore centers. Illicit financial flows on the other
hand comprise funds that are illegally earned, transferred, or utilized—if it breaks laws in its origin,
movement, or use it merits the label. In terms of economic models used in this paper, illicit funds
are either unrecorded leakages from a country’s balance of payments (captured by the World Bank
Residual model) or are generated through trade mispricing (estimated using the Trade Misinvoicing
model). Thus one would expect absorption to exceed total illicit flows by a significant margin,
viii Global Financial Integrity
notwithstanding the fact that the deposit data reported to the BIS are likely to be understated as
well (mainly due to the fact that not all points of absorption report deposit data to the BIS).
The methodology underlying the simulation model starts with the recognition that absorption of
illicit funds refers only to cash deposits in banks and offshore centers. No international institution
or country statistical agency has any information on the portion of illicit funds invested in tangible
assets like precious metals and stones, real estate, and collectables such as art objects. Therefore
the models presented in the paper seek to compare cash illicit outflows with cash absorption or
deposits. Illicit outflows from developing countries in cash are based on estimates of cash deposit
shares in investor portfolios by country obtained from two private companies, CapGemini and Oliver
Wyman. The implicit assumption is that investors invest the same proportion of their total portfolio
in cash whether making illicit investments abroad or licit investments in general.
Data on bank and offshore center deposits from developing countries are based on BIS locational
banking statistics, which, unfortunately, are not broken down by private non-bank and public
sectors. Hence, the private/public split in the BIS consolidated banking statistics had to be used in
order to derive the private sector deposits of developing countries on a locational basis.
As expected, cash absorption exceeded illicit outflows in cash by a significant margin. Apart
from this general observation, model simulations using the BIS definition of OFCs indicate that,
on average, banks account for about 76 percent of total cash absorption while offshore centers
absorb the rest (24 percent). According to our estimates, offshore centers have increased their
share of holdings of illicit deposits from 21.8 percent in 2003 to 34.2 percent in 2006, reflecting
a corresponding decline of the share held by banks during that period from 78.2 percent to 65.8
percent. In fact, private sector deposits in offshore centers nearly double to 44 percent of total
absorption if the wider IMF definition, which includes Ireland and Switzerland as offshore centers,
is used. The paper also notes that the higher 44 percent of total absorption is also likely to include
a higher licit portion in offshore centers given that financial institutions in Ireland and Switzerland
also act as traditional banks. The increasing role of offshore centers in the world’s shadow financial
system helps explain the recent media focus as well as the ongoing efforts by the G-20 to improve
their transparency and accountability.
On average, we find that offshore centers have absorbed more illicit flows from Asia (43.9 percent)
than any other region during 2002 to 2006. They played a smaller role in the absorption of illicit
flows from MENA (36.0 percent), Africa (26.8 percent), Europe (15.8 percent) and the Western
ixThe Absorption of Illicit Financial Flows from Developing Countries: 2002-2006
Hemisphere (10.4 percent). This suggests that developing countries in the Western Hemisphere and
Europe deposit most of their illicit funds in developed country banks rather than offshore centers.
When Ireland and Switzerland are classified as offshore centers, the corresponding regional shares
increase significantly (Asia 53.1 percent, MENA 49.3 percent, Africa 45.5 percent, Europe 37.6
percent, and Western Hemisphere 42.1 percent).
Another interesting finding of the paper is that regardless of which definition of OFCs is chosen,
developed country banks hold, on average, a significant portion of illicit funds ranging possibly from
46 to 67 percent of total deposits. In fact, though the data used to determine the licit/illicit splits
are admittedly imperfect, it appears that even at its widest range, the proportion of illicit funds in
developed country banks was significant between 2003 and 2006 (anywhere from 20 to 72 percent).

x Global Financial Integrity
1The Absorption of Illicit Financial Flows from Developing Countries: 2002-2006
I. Introduction
This paper is the second part of a project financed by the Ford Foundation. The first part,
which began in early 2008, culminated in the publication of the report Illicit Financial Flows from
Developing Countries, 2002-2006 by Global Financial Integrity (GFI). The 2008 GFI study showed
that, even at its most conservative estimate, illicit financial flows (IFFs) from developing countries
increased from US$372 billion to at least US$859 billion over the period 2002 to 2006 or at a
compound annual rate of 18.2 percent. As massive as these flows are, economists have not studied
where illicit funds are deposited after they leave the developing countries. The objective of this
paper is to shed light on the absorption of these funds by developed country banks (henceforth,
banks) and offshore financial centers (referred to as offshore centers or OFCs). Absorption is
defined as the change in the private sector deposits of developing countries in banks and
offshore centers.
It should be clear at the outset that absorption in banks and offshore centers involve cash deposits
(see Section II on Data Sources). Absorption of illicit funds exclusively involves cash deposits
or liquid financial assets. No international organization, national statistical agency, or research
institution has any information on investments of illicit funds in tangible assets like precious
metals, real estate, and collectibles. Hence, we need to estimate the proportion of illicit funds from
developing countries that were invested in cash.
We obtained estimates of cash deposit shares in investor portfolios by country from two private
companies, CapGemini and Oliver Wyman. The implicit assumption is that investors invest the
same proportion of their total portfolio in cash whether making illicit investments abroad or licit
investments in general. Hence, the rest of the paper is devoted to the analysis of cash outflows
of illicit funds from developing countries and their subsequent absorption in banks and offshore
centers as cash deposits.
Note that the analysis of absorption presented here cannot be used to ascertain the total stock of
illicit funds from any particular country that is deposited in these points of absorption abroad. This
is because deposit data are stocks at end-December and there is no information on concurrent
withdrawals throughout the year. Hence, the change in deposits from one year to the next cannot be
cumulated and compared to cumulative cash outflows.
An important question is why do we need to know where illicit flows are initially absorbed? Should
we care that these flows are intermediated through offshore financial centers or non-offshore
country banks? The main reason is that illicit financial flows have deprived developing countries of
scarce financial resources for development and poverty alleviation and have seriously undermined
the effectiveness of foreign aid. Attempts by developing countries to curtail illicit outflows have not
worked because there are many institutions which are not only willing, but actively seeking, to absorb
2 Global Financial Integrity
these illicit flows. Economic and governance policies in developing countries must be complemented
by efforts in developed countries to make the absorption of illicit funds more difficult. If, as we find in
this study, both offshore centers and banks have been complicit in the absorption of illicit funds, then
regulatory measures and oversight to bring about greater transparency and accountability must be
applied even-handedly in order to penalize and discourage such transactions. As Kapur and Webb
(2000) write:
Banking secrecy has made it difficult to monitor and regulate private banking
activities, even in jurisdictions where there are stringent laws on domestic money-
laundering. Even in high-profile cases (such as that of Mobutu or of Marcos)
countries have been unable to recover their looted wealth. The role of private
banking in abetting capital flight gained prominence in 1999, when the Bank of
New York helped shift at least US$7 billion in ill-gotten gains out of the Russian
Federation into private bank accounts in the West. But the scandal in this case
was because the lost funds were perceived to have come out of the pockets—via
contributions to IMF—of US tax-payers (in itself a fallacy, but that’s a separate
issue). Far more grievous scandals in developing countries go unnoticed. During
the 1980s debt crisis, even as US banks were pressing floundering Latin America
countries to service their debt, their private banking operations provided easy
avenues for capital flight, thereby exacerbating the problem of debt-services
(Lissakers, 1991). Some of the largest and most venerable banking institutions have
been implicated in recent years. The Mexican crisis and the travails of Indonesia and
the Russian Federation have been sharply exacerbated by massive capital flight. In
all these cases the benefits of borrowings are privatized and the costs socialized in
that capital flight reduces the foreign exchange available to governments to pay off
their debts, and they cannot capture private foreign assets to offset private and/or
public liabilities. 2
More recently in 2009, there was widespread media coverage of UBS helping U.S. citizens
evade taxes by facilitating the illicit transfer and absorption of taxable income. Greater regulatory
oversight and transparency related to banking operations could perhaps have discouraged UBS
from breaking the law. However, in the absence of a balanced approach between outflow-reducing
and absorption-restricting policy measures, GFI’s study shows that illicit financial flows have been
increasing at around 18 percent per annum over the period 2002 to 2006. Hence, efforts to curtail
illicit flows must examine the role of banks and offshore centers in the absorption of these funds,
which is the objective of this paper. The policy implication is clear: regulatory agencies need to
formulate policies requiring stricter oversight and greater transparency, in order to make absorption
more difficult and complement efforts by developing countries to improve the effectiveness of and
reduce their dependence on foreign aid.
2 Devesh Kapur and Richard Webb, Governance-related Conditionalities of the International Financial Institutions, No. 6, August 2000, page 13, last paragraph.
3The Absorption of Illicit Financial Flows from Developing Countries: 2002-2006
The paucity of any systematic study of absorption arises from the fact that estimating the volume of
illicit flows absorbed by banks and offshore centers is very difficult. There are significant problems
of estimation regarding both sides of the illicit outflows-to-absorption equation. As explained in
GFI’s study, even the best economic models cannot capture all the conduits for sending money out
of a country because they must rely on officially recorded statistics. Hence, smuggling, “hawala”-
style currency swap arrangements, and same-invoice faking that are arranged by word of mouth
between colluding traders all generate illicit flows that cannot be captured by economic models.
Regarding the absorption side of the equation, researchers can easily see that there is a lack of
deposit data at an appropriate level of detail. This lack of data is directly related to the deliberate
opacity with which banks and offshore centers operate. For example, because OFCs typically do
not disseminate data on their transactions, it is difficult to obtain even aggregate deposit data, let
alone deposit data on non-resident non-bank private sector of developing countries. In that regard,
the newly-assembled dataset developed by Lane and Milesi-Ferretti (2010) based on external
assets and liabilities of small international financial centers, is not in itself suitable for studying the
issue of the absorption of illicit funds from developing countries. For one, data on the liabilities
of these investment centers do not relate to developing countries specifically but include those
related to developed countries as well. For another, their sample of small international financial
centers excludes the larger offshore centers (e.g., Ireland, Malaysia, Singapore, and Switzerland)
by definition. Moreover, the aggregate external liabilities are not at an appropriate level of sectoral
detail (such as non-bank, private sector) necessary to permit the illicit flows-to-absorption
simulations we carry out. Given these data limitations, we had to make a number of assumptions
regarding the behavior of illicit flows and absorption in order to simulate the model.
The paper is organized as follows. Section II discusses the data sources and issues underlying
the absorption model. Thereby, we bring out the data required to better map illicit flows against
absorption in banks and offshore centers. Section III presents a brief overview of the BIS and IMF
classifications of offshore centers and why tax havens are not explicitly considered in this paper. The
absorption model is estimated using both the BIS and the IMF definition of offshore centers. Section
IV presents a simple model of absorption which allows one to vary the underlying core assumptions
through control variables. Section V provides an analysis of the licit and illicit shares possible in
offshore centers and banks. The main conclusions of the paper are presented in Section VI.

4 Global Financial Integrity
5The Absorption of Illicit Financial Flows from Developing Countries: 2002-2006
II. Data: Sources and Related Issues
GFI’s study of illicit flows discussed data limitations underlying the estimation of illicit flows from
developing countries. This section reviews the main sources of absorption data used to estimate
the distribution of illicit funds in banks and offshore centers and discusses their limitations. We
first discuss the sources and methods for estimating illicit flows, followed by the estimation of the
cash component of illicit funds invested abroad. The remainder of the section is devoted to a brief
overview of the various sources of data on absorption and their limitations.
(i) Illicit Financial FlowsEstimates of total illicit outflows are obtained from GFI’s 2008 study (see Appendix Table 5). The
trade mispricing component was derived using the Gross Excluding Reversals (GER) method while
illicit flows from the balance of payments were captured using the World Bank Residual model
(Change in External Debt or CED). In that paper, we sought to minimize the data issues related to
informal intra China-Hong Kong trade by excluding Hong Kong’s trade data from the world. This
was consistent with the approach used by Zhu, Li, and Epstein (2005). In this study, however,
Hong Kong could not be excluded from the mispricing estimates because the absorption figures
we obtained from the BIS include that Special Administrative Region of China as a major offshore
center in Asia.
(ii) Estimating Illicit Outflows in Cash: Merrill Lynch-CapGemini and Oliver Wyman
Illicit funds from developing countries are invested in a variety of assets, such as equity (stocks
and bonds); certificates of deposits, annuities, and other fixed investment assets; precious metals,
art objects, and other tangible assets; and investments in real estate. Because absorption of illicit
financial flows from developing countries into banks and offshore centers exclusively involve cash
deposits, total illicit flows must be scaled down by the portion of funds that is invested as cash
deposits that can be traced from banking statistics.
Merrill Lynch-CapGemini (MLC) is a private consulting company that provides estimates of the
proportion of cash held by high net-worth individuals (HNWIs) in their investment portfolios.
In contrast, the corresponding estimates of cash investments provided by Oliver Wyman (OW)
refer to the general investing public, not just HNWIs. Furthermore, OW cash deposit shares cover
only a select number of developing countries, which means regional averages must be assumed
from this handful of countries. In contrast, MLC’s estimates of cash investment ratios refer to
regional averages.
6 Global Financial Integrity
Both MLC and OW derive estimates of cash investments that are related to licit funds based on
officially recorded national accounts, savings propensities, and income distributions. We use these
cash investment shares to estimate the cash component of illicit flows out of developing countries.
As illicit investment decisions cannot be directly observed nor information on them collected
through surveys, we have to assume that illicit investors in developing countries hold the same
proportion of their illicit assets in cash as do licit investors estimated by the MLC and OW wealth
models. However, because illicit investments are relatively riskier, there is an incentive to hold a
higher proportion in cash rather than in a more illiquid form, so that the cash deposit shares based
on the MLC and OW models are likely to understate illicit deposits. This could explain some of the
gap between illicit outflows and absorption.
The cash deposit shares used in our study are based on regional estimates of cash investments
provided by MLC and OW. Ideally, illicit financial flows from each developing country should be
scaled down by the cash investment factor relating to illicit investors in that country. However, as
neither MLC nor OW provides estimates of licit investments in cash for each developing country,
we scaled down regional illicit flows by the corresponding regional cash deposit shares. Of course,
this method introduces estimation errors to the extent that the investors in each country hold
proportions of cash investments that are different from the regional cash holdings preferences.
It should also be noted that we use MLC over OW data for almost every region because we assume
that only high net-worth individuals send illicit capital abroad and not the general population.
Participation in trade mispricing, for example, first requires that an individual has the capital and
the opportunity to engage in international trade. The general population is unlikely to engage
in international trade transactions. Because the OW cash deposit shares relate to the general
population, rather than HNWIs, the OW estimates are consistently much greater than those from
MLC. A reasonable explanation for this could be that HNWIs have more sophisticated investment
strategies, relative to the general population, and therefore they would favor lower cash deposits in
order to maximize the return on their portfolio. As such, we primarily use the cash-deposit shares
estimated by MLC, rather than estimates developed by Oliver Wyman. However, as MLC provides
no estimates for Africa, we used the OW deposit shares for South Africa, which was the only African
country for which the estimate was available.
The MLC model provides estimates of total wealth held by high net-worth individuals in 71
countries, accounting for more than 98 percent of world gross national income. It then distributes
national wealth across the adult population of the country. The model is updated on an annual basis
to calculate the value of high net worth individuals’ financial wealth at a macro level. Total wealth
by country is estimated using the national account statistics database of the IMF and the World
Bank. Annual national savings are then summed over time to arrive at a book value of accumulated
national wealth. National wealth at book value is adjusted using world stock price indexes to reflect
7The Absorption of Illicit Financial Flows from Developing Countries: 2002-2006
the market value of the equity portion of HNWI wealth. This stock of wealth is then distributed
according to the relationship between income and wealth, using the World Bank’s data on income
distribution and Lorenz curve specifics for each country. The distribution of wealth among the adult
population of each country yields estimates of HNWIs across countries, regions, and the world.
The MLC wealth model includes values of private equity holdings at book value as well as all forms
of publicly quoted equities, bonds, funds, and cash deposits. It does not include collectibles,
consumables, consumer durables, and real estate used for primary residence.
The OW wealth model analyzes 48 countries grouped into seven major regions, covering some
95 percent of total world GDP. Wealth, defined as gross financial assets, consists of (i) cash and
deposits, (ii) equities and bonds, (iii) mutual funds, (iv) alternative investments, and (v) individual
pension assets. Residential real estate, occupational pension assets and household debt are not
considered. Official records of household balance sheets provided by national central banks and
the OECD are used to estimate asset data. If official data are not available, as is the case for many
Latin American, Asian, or Eastern European countries, the OW model looks at the relationships
between the state of economic development, GDP, and financial assets to determine the total asset
pool for a specific base year.
(iii) Absorption: International Monetary FundBeja (2005) proposed a method to capture the absorption of illicit outflows using data on the
change in currency deposits of domestic residents in foreign banks, after adjusting for changes
in exchange valuations. He claimed that these mirror statistics, which can be used to obtain an
estimate of private foreign assets, could be obtained from the IMF’s International Financial Statistics
(IFS). Upon closer scrutiny, however, it is clear that IFS monetary statistics cannot be used to derive
estimates of the absorption of illicit flows into OFCs and developed country banks. In fact, the IFS
“Banking Survey” section does not include a line called “currency deposits of domestic residents in
foreign banks.” Such data are not available even to country officials. This means that the IMF, which
publishes official banking statistics from developing countries, does not have this information. It is
therefore unlikely that most developing countries currently compile such data.
(iv) Absorption: DatamonitorDatamonitor, a private sector company, has developed a limited database on OFCs, which is
available for a fee. Their exclusive database was developed from a study of secondary information
from each of the governing bodies of eleven offshore financial centers: The Bahamas, Bermuda,
Cayman Islands, Hong Kong, Guernsey, Jersey, Isle of Man, Dublin, Luxembourg, Singapore, and
Switzerland. As the company points out, the quantification of information on deposits, mutual funds,
and insurance contracts written in each OFC is based on data provided by the governing bodies
within each offshore location. Where specific data on deposits or other financial instruments are not
provided, Datamonitor makes estimates using proxy data obtained from the regulators.
8 Global Financial Integrity
The lack of sectoral and geographical detail necessary to obtain data on the private sector non-
resident deposits of developing countries limits the use of these data to analyze the absorption
of illicit flows. Nevertheless, the company does collect limited data on private sector non-resident
deposits, so that a further breakdown into developed and developing country holders is just one
level short. Another drawback to the Datamonitor database is that it covers only eleven centers. We
could find no other data source that provides this level of detail. On balance however, the coverage
and level of detail on offshore financial center deposits provided by Datamonitor fell well short of
our expectations given the hefty charges involved.
(v) Absorption: Bank for International SettlementsThe Bank for International Settlements (BIS) publishes the most comprehensive dataset on cross-
border international banking statistics currently available. It does not, however, provide breakdowns
of the data at the country level, which would have been ideal for this study. The BIS collects and
disseminates two different sets of international banking data, based on information provided by
member country banks. The first set of data, locational statistics, collects quarterly data on the
gross international financial claims and liabilities of banks residents from a given country. The
second set, known as the consolidated statistics, report banks’ on-balance sheet financial claims
vis-à-vis the rest of the world and provides a measure of the risk exposures of lenders’ national
banking systems. That is to say, consolidated statistics show reporting countries’ claims on the rest
of the world. Once differences in reporting regimes are taken into account, the two sets of data may
be used to complement one another in economic analysis.
The main purpose of locational statistics is to provide information on the role of banks and financial
centers in the intermediation of international capital flows. The key organizational criteria are the
country of residence of the reporting banks and their counterparties, as well as the recording of all
positions on a gross basis. Locational statistics can be used to present the combined cross-border
positions of reporting banks in all the BIS reporting countries vis-à-vis individual countries listed on
the locational tables. There are currently 42 countries providing these statistics (Appendix Table 1).
Some of the locational banking statistics are restricted for use by reporting countries. The BIS
needs specific approval from each reporting country for release of individual country data to third
parties. Since we were not able to obtain country-level data from the BIS without permission
from those individual countries, we requested and received aggregated regional-level data. This
dataset, which does not show cross-border bank positions on a bilateral basis, could not be
used to determine one or more reporting country’s deposits vis-à-vis one or a sub aggregate of
counterparties.

9The Absorption of Illicit Financial Flows from Developing Countries: 2002-2006
If bilateral deposit data were available, researchers would be able to track the pattern of deposit
holdings by residents of any developing country into any individual bank or offshore center.
Ideally, the distribution of such holdings would account for the totality of all foreign assets held
by the private sector of a particular developing country in those points of absorption. Even at the
most detailed level, however, locational data refer only to the external deposits of the 42 reporting
banks vis-à-vis the non-bank sector. These data are not further broken down by private and public
sectors. The consolidated statistics, however, do provide a split between public and private sector
deposits. Although consolidated statistics report these banks’ claims on the rest of the world, we
assume each country’s claims on the world have the same public/private split as other country’s
claims on them. In this way, we use this split in conjunction with the consolidated statistics in order
to derive a proxy for private sector holdings of developing countries.
The BIS provided data on the deposits of developing countries in four major destination groups:
Asian financial centers, offshore financial centers, European financial centers, and banks in four
other developed countries (U.S., U.K., Australia and Japan). There are several countries that are
classified as offshore financial centers by the IMF for which we did not receive deposit information
from the BIS. For these countries, which we have classified as “other financial centers,” we obtained
deposit information primarily from the BIS and supplemented their data with data from the IMF and
central bank websites. These latter two sources did not provide a breakdown of their data by region
of origin. We therefore had to assume their splits were consistent with those of other offshore
financial centers.

10 Global Financial Integrity
11The Absorption of Illicit Financial Flows from Developing Countries: 2002-2006
III. Points of Absorption (PoAs)
Financial institutions absorb both licit as well as illicit financial flows from developing countries.
Licit funds involve those that conform to a developing country’s tax laws and its exchange
control regime. Legitimate profits of companies on which domestic taxes are paid and are legally
repatriated or the transfer of foreign currency by individuals who obtain prior approval for such
transfers would be examples of licit funds from developing countries absorbed in the two main
points of absorption: offshore financial centers and non-offshore developed country banks. Illicit
financial flows on the other hand comprise funds that violate the tax or capital controls in effect in
developing countries. By definition, illicit funds are unrecorded leakages from a country’s balance of
payments or are generated through trade mispricing.
A range of criteria have been put forward to define an offshore financial center, including (i)
orientation of business primarily toward nonresidents (ii) favorable regulatory environment (iii)
low or zero tax rate and (iv) offshore banking as an entrepôt business.3 There is, however, a
lack of consensus on the definition of an OFC, since many centers display only some of these
characteristics while other centers that practice banking secrecy, such as Delaware in the United
States, are not generally considered as offshore centers.
One alternative to seeking a universal definition of offshore centers that is gaining support is to
consider them as part of a broader group of the world’s secrecy jurisdictions, which also includes
developed countries.4 Secrecy jurisdictions are defined by the Tax Justice Network as places
that “intentionally create regulation for the primary benefit and use of those not resident in their
geographical domain and are designed to undermine the regulation of another jurisdiction”
(Appendix Table 2). To encourage depositors, secrecy jurisdictions also create a deliberate, legally
backed veil of secrecy that ensures their clients cannot be identified. Globalization, the attendant
myriad range of cross-border transactions, intermediation in many countries, and efforts by a
number of countries to build or promote their offshore industries have blurred distinctions between
different kinds of secrecy jurisdictions.
In this paper, we use the IMF definition of an offshore center, which is “a jurisdiction in which
international investment position assets, including as resident all entities that have legal domicile
in that jurisdiction, are close to or more than 50 percent of GDP and in absolute terms more than
$1 billion.” The IMF considers 46 countries and jurisdictions as offshore financial centers, of which
only 26 are IMF members (Appendix Table 3).
3 Zoromé (2007) proposed an alternative data-based indicator, namely the ratio of net financial services exports to GDP. This approach is complicated by the fact that many jurisdictions do not prepare sufficiently detailed balance of payments data, and in some cases the data for net financial services has to be inferred from other sources, such as the IMF’s Coordinated Portfolio Investment Survey or data on International Investment Positions.
4 Reference, Identifying Tax Havens and Offshore Finance Centers, Tax Justice Network, 2007, Washington, DC.
12 Global Financial Integrity
Like offshore centers, tax havens are another type of secrecy jurisdiction. We do not make a
distinction between them because according to the IMF criteria, all tax havens, with the exception
of Liberia, are also classified as offshore centers. Nevertheless, it is useful to consider the
characteristics of jurisdictions popularly known as tax havens. According to the Organization for
Economic Co-operation and Development (OECD), tax havens have four key characteristics. First,
the jurisdiction imposes no or only nominal taxes. Second, the jurisdiction lacks transparency in
terms of the information it provides regarding its transactions and operations. Third, its laws or
administrative practices prevent the effective exchange of information with other governments.
Finally, there is no requirement that such activities be substantial. As of March 2009, the OECD
listed 35 jurisdictions that meet the criteria of a tax haven (Appendix Table 3).
In this study, developed country banks are traditional banks in non-OFC developed countries,
specifically those in four developed countries (Australia, Japan, United Kingdom, and United States)
and the European reporting centers (see Appendix Table 4).
13The Absorption of Illicit Financial Flows from Developing Countries: 2002-2006
IV. A Model of Absorption
The following simple model attempts to map the cash portion of regional illicit outflows with the
private sector deposits in the absorption centers. One would expect absorption to be larger than the
illicit outflows because, as noted earlier, absorption includes a licit component while illicit outflows
captured by economic models are likely to be understated.
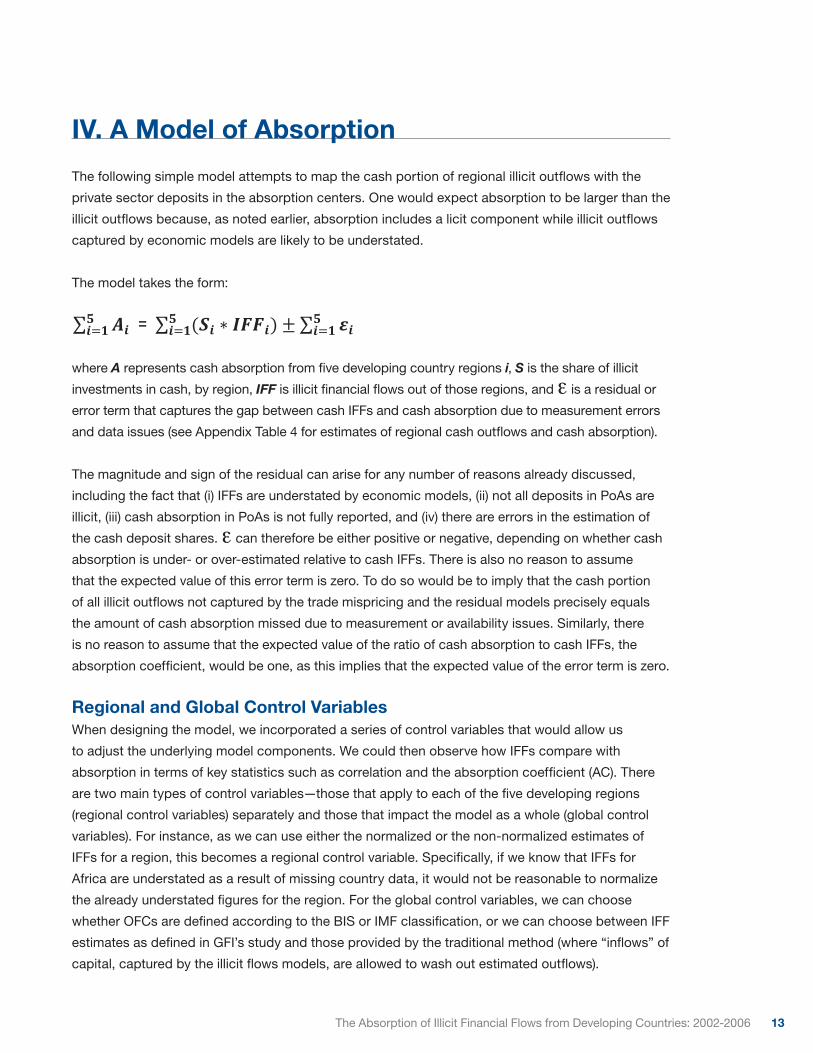
The model takes the form:
where A represents cash absorption from five developing country regions i, S is the share of illicit
investments in cash, by region, IFF is illicit financial flows out of those regions, and e is a residual or
error term that captures the gap between cash IFFs and cash absorption due to measurement errors
and data issues (see Appendix Table 4 for estimates of regional cash outflows and cash absorption).
The magnitude and sign of the residual can arise for any number of reasons already discussed,
including the fact that (i) IFFs are understated by economic models, (ii) not all deposits in PoAs are
illicit, (iii) cash absorption in PoAs is not fully reported, and (iv) there are errors in the estimation of
the cash deposit shares. e can therefore be either positive or negative, depending on whether cash
absorption is under- or over-estimated relative to cash IFFs. There is also no reason to assume
that the expected value of this error term is zero. To do so would be to imply that the cash portion
of all illicit outflows not captured by the trade mispricing and the residual models precisely equals
the amount of cash absorption missed due to measurement or availability issues. Similarly, there
is no reason to assume that the expected value of the ratio of cash absorption to cash IFFs, the
absorption coefficient, would be one, as this implies that the expected value of the error term is zero.
Regional and Global Control Variables When designing the model, we incorporated a series of control variables that would allow us
to adjust the underlying model components. We could then observe how IFFs compare with
absorption in terms of key statistics such as correlation and the absorption coefficient (AC). There
are two main types of control variables—those that apply to each of the five developing regions
(regional control variables) separately and those that impact the model as a whole (global control
variables). For instance, as we can use either the normalized or the non-normalized estimates of
IFFs for a region, this becomes a regional control variable. Specifically, if we know that IFFs for
Africa are understated as a result of missing country data, it would not be reasonable to normalize
the already understated figures for the region. For the global control variables, we can choose
whether OFCs are defined according to the BIS or IMF classification, or we can choose between IFF
estimates as defined in GFI’s study and those provided by the traditional method (where “inflows” of
capital, captured by the illicit flows models, are allowed to wash out estimated outflows).
- 12 -
The following simple model attempts to map the cash portion of regional illicit outflows with the private sector deposits in the absorption centers. One would expect absorption to be larger than the illicit outflows because, as noted earlier, absorption includes a licit component while illicit outflows captured by economic models are likely to be understated. The model takes the form: 𝑨𝑨𝒊𝒊𝟓𝟓
𝒊𝒊=𝟏𝟏 = (𝑺𝑺𝒊𝒊 ∗ 𝑰𝑰𝑰𝑰𝑰𝑰𝒊𝒊)𝟓𝟓𝒊𝒊=𝟏𝟏 ± 𝜺𝜺𝒊𝒊𝟓𝟓
𝒊𝒊=𝟏𝟏 where A represents cash absorption from five developing country regions i, S is the share of illicit investments in cash, by region, IFF is illicit financial flows out of those regions, and ε is a residual or error term that captures the gap between cash IFFs and cash absorption due to measurement errors and data issues (see Appendix Table 4 for estimates of regional cash outflows and cash absorption).
The magnitude and sign of the residual can arise for any number of reasons already discussed, including the fact that (i) IFFs are understated by economic models, (ii) not all deposits in PoAs are illicit, (iii) cash absorption in PoAs is not fully reported, and (iv) there are errors in the estimation of the cash deposit shares. ε can therefore be either positive or negative, depending on whether cash absorption is under- or over-estimated relative to cash IFFs. There is also no reason to assume that the expected value of this error term is zero. To do so would be to imply that the cash portion of all illicit outflows not captured by the trade mispricing and the residual models precisely equals the amount of cash absorption missed due to measurement or availability issues. Similarly, there is no reason to assume that the expected value of the ratio of cash absorption to cash IFFs, the absorption coefficient, would be one, as this implies that the expected value of the error term is zero.
Regional and Global Control Variables When designing the model, we incorporated a series of control variables that would allow us to adjust the underlying model components. We could then observe how IFFs compare with absorption in terms of key statistics such as correlation and the absorption coefficient (AC). There are two main types of control variables—those that apply to each of the five developing regions (regional control variables) separately and those that impact the model as a whole (global control variables). For instance, as we can use either the normalized or the non-normalized estimates of IFFs for a region, this becomes a regional control variable. Specifically, if we know that IFFs for Africa are understated as a result of missing country data, it would not be reasonable to normalize the already understated figures for the region. For the global control variables, we can choose whether OFCs are defined according to the BIS or IMF classification, or we can choose between IFF estimates as defined in GFI’s study and those provided by the traditional method (where ―inflows‖ of capital, captured by the illicit flows models, are allowed to wash out estimated outflows).
Simulations
14 Global Financial Integrity
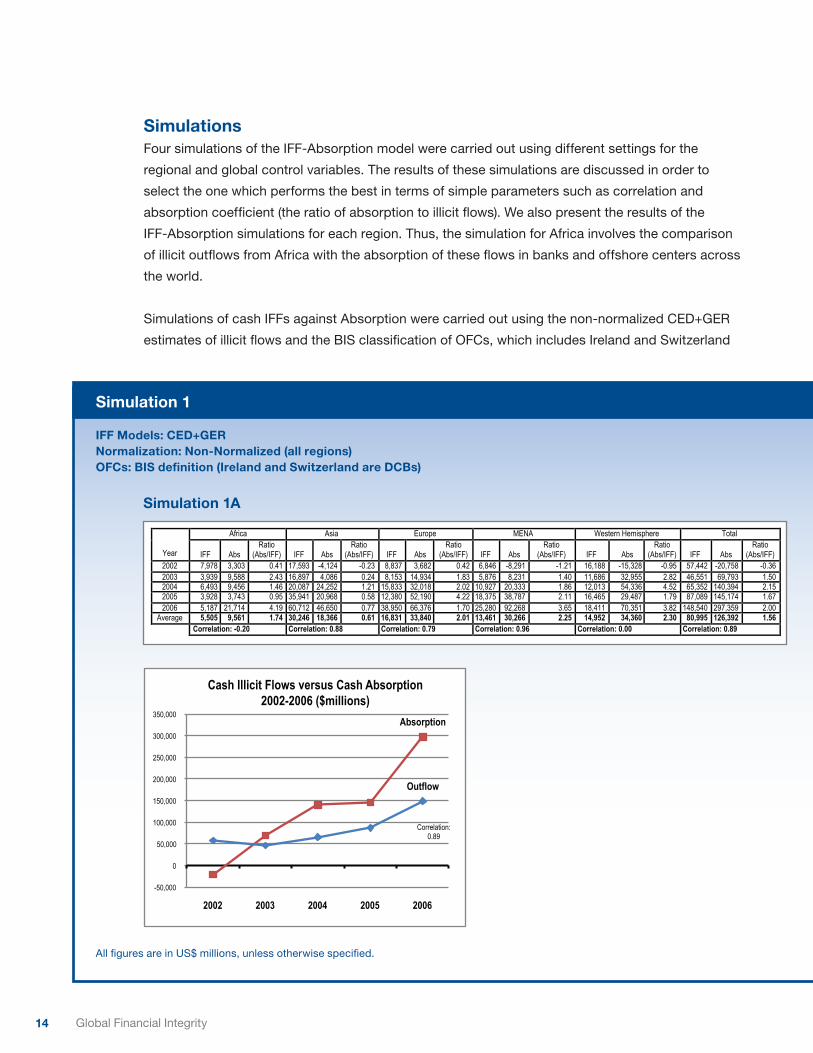
Simulations Four simulations of the IFF-Absorption model were carried out using different settings for the
regional and global control variables. The results of these simulations are discussed in order to
select the one which performs the best in terms of simple parameters such as correlation and
absorption coefficient (the ratio of absorption to illicit flows). We also present the results of the
IFF-Absorption simulations for each region. Thus, the simulation for Africa involves the comparison
of illicit outflows from Africa with the absorption of these flows in banks and offshore centers across
the world.
Simulations of cash IFFs against Absorption were carried out using the non-normalized CED+GER
estimates of illicit flows and the BIS classification of OFCs, which includes Ireland and Switzerland
Absorption
Outflow
-50,000
0
50,000
100,000
150,000
200,000
250,000
300,000
350,000
2002 2003 2004 2005 2006
Cash Illicit Flows versus Cash Absorption 2002-2006 ($millions)
Correlation: 0.89
All figures are in US$ millions, unless otherwise specified.
Simulation 1
IFF Models: CED+GERNormalization: Non-Normalized (all regions)OFCs: BIS definition (Ireland and Switzerland are DCBs)
Simulation 1A
Africa Asia Europe MENA Western Hemisphere Total
Year IFF Abs Ratio
(Abs/IFF) IFF Abs Ratio
(Abs/IFF) IFF Abs Ratio
(Abs/IFF) IFF Abs Ratio
(Abs/IFF) IFF Abs Ratio
(Abs/IFF) IFF Abs Ratio
(Abs/IFF) 2002 7,978 3,303 0.41 17,593 -4,124 -0.23 8,837 3,682 0.42 6,846 -8,291 -1.21 16,188 -15,328 -0.95 57,442 -20,758 -0.36 2003 3,939 9,588 2.43 16,897 4,086 0.24 8,153 14,934 1.83 5,876 8,231 1.40 11,686 32,955 2.82 46,551 69,793 1.50 2004 6,493 9,456 1.46 20,087 24,252 1.21 15,833 32,018 2.02 10,927 20,333 1.86 12,013 54,336 4.52 65,352 140,394 2.15 2005 3,928 3,743 0.95 35,941 20,968 0.58 12,380 52,190 4.22 18,375 38,787 2.11 16,465 29,487 1.79 87,089 145,174 1.67 2006 5,187 21,714 4.19 60,712 46,650 0.77 38,950 66,376 1.70 25,280 92,268 3.65 18,411 70,351 3.82 148,540 297,359 2.00
Average 5,505 9,561 1.74 30,246 18,366 0.61 16,831 33,840 2.01 13,461 30,266 2.25 14,952 34,360 2.30 80,995 126,392 1.56 Correlation: -0.20 Correlation: 0.88 Correlation: 0.79 Correlation: 0.96 Correlation: 0.00 Correlation: 0.89
15The Absorption of Illicit Financial Flows from Developing Countries: 2002-2006
in European reporting countries (part of banks), rather than offshore reporting centers (part of
OFCs). This benchmark simulation provided the best fit between cash IFFs and cash absorption
in PoAs, reflected in an absorption coefficient of 1.56 (section A, last column). Overall correlation
between IFFs and absorption was an impressive 0.89 (section A), suggesting that despite
formidable data issues, the simulation was successful.
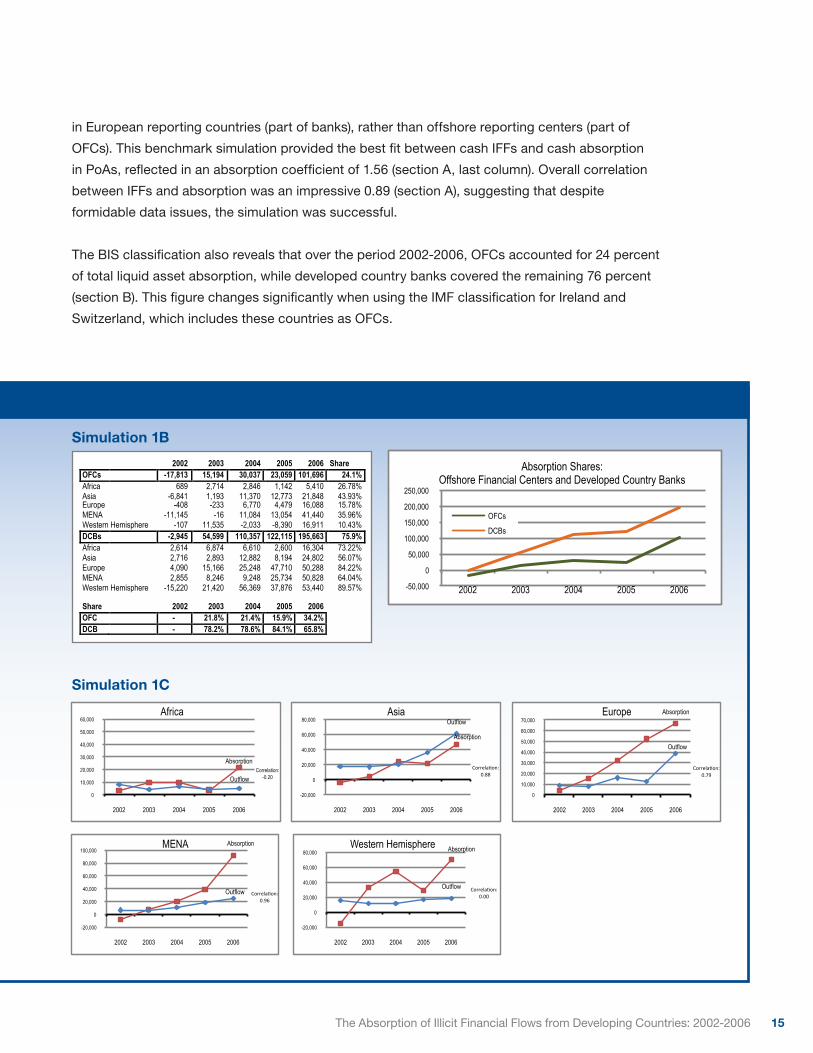
The BIS classification also reveals that over the period 2002-2006, OFCs accounted for 24 percent
of total liquid asset absorption, while developed country banks covered the remaining 76 percent
(section B). This figure changes significantly when using the IMF classification for Ireland and
Switzerland, which includes these countries as OFCs.
Simulation 1C
-50,000
0
50,000
100,000
150,000
200,000
250,000
2002 2003 2004 2005 2006
Absorption Shares: Offshore Financial Centers and Developed Country Banks
OFCs
DCBs
Simulation 1B
Absorption
Outflow
0
10,000
20,000
30,000
40,000
50,000
60,000
2002 2003 2004 2005 2006
Africa
Correlation: -0.20
Absorption
Outflow
-20,000
0
20,000
40,000
60,000
80,000
2002 2003 2004 2005 2006
Asia
Correla'on: 0.88
Absorption
Outflow
0
10,000
20,000
30,000
40,000
50,000
60,000
70,000
2002 2003 2004 2005 2006
Europe
Correla'on: 0.79
Absorption
Outflow
-20,000
0
20,000
40,000
60,000
80,000
100,000
2002 2003 2004 2005 2006
MENA
Correla'on: 0.96
Absorption
Outflow
-20,000
0
20,000
40,000
60,000
80,000
2002 2003 2004 2005 2006
Western Hemisphere
Correla'on: 0.00
2002 2003 2004 2005 2006 Share OFCs -17,813 15,194 30,037 23,059 101,696 24.1% Africa 689 2,714 2,846 1,142 5,410 26.78% Asia -6,841 1,193 11,370 12,773 21,848 43.93% Europe -408 -233 6,770 4,479 16,088 15.78% MENA -11,145 -16 11,084 13,054 41,440 35.96% Western Hemisphere -107 11,535 -2,033 -8,390 16,911 10.43% DCBs -2,945 54,599 110,357 122,115 195,663 75.9% Africa 2,614 6,874 6,610 2,600 16,304 73.22% Asia 2,716 2,893 12,882 8,194 24,802 56.07% Europe 4,090 15,166 25,248 47,710 50,288 84.22% MENA 2,855 8,246 9,248 25,734 50,828 64.04% Western Hemisphere -15,220 21,420 56,369 37,876 53,440 89.57% Share 2002 2003 2004 2005 2006 OFC - 21.8% 21.4% 15.9% 34.2% DCB - 78.2% 78.6% 84.1% 65.8%
16 Global Financial Integrity
Simulation 2
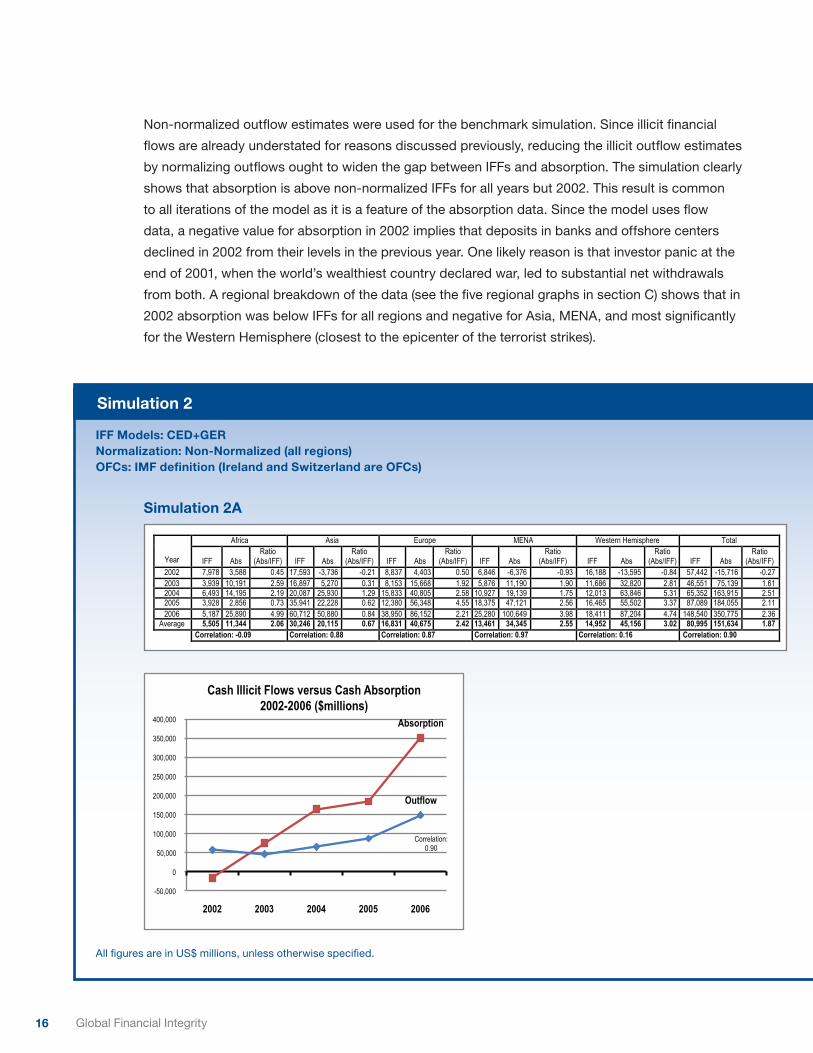
Non-normalized outflow estimates were used for the benchmark simulation. Since illicit financial
flows are already understated for reasons discussed previously, reducing the illicit outflow estimates
by normalizing outflows ought to widen the gap between IFFs and absorption. The simulation clearly
shows that absorption is above non-normalized IFFs for all years but 2002. This result is common
to all iterations of the model as it is a feature of the absorption data. Since the model uses flow
data, a negative value for absorption in 2002 implies that deposits in banks and offshore centers
declined in 2002 from their levels in the previous year. One likely reason is that investor panic at the
end of 2001, when the world’s wealthiest country declared war, led to substantial net withdrawals
from both. A regional breakdown of the data (see the five regional graphs in section C) shows that in
2002 absorption was below IFFs for all regions and negative for Asia, MENA, and most significantly
for the Western Hemisphere (closest to the epicenter of the terrorist strikes).
IFF Models: CED+GERNormalization: Non-Normalized (all regions)OFCs: IMF definition (Ireland and Switzerland are OFCs)
Absorption
Outflow
-50,000
0
50,000
100,000
150,000
200,000
250,000
300,000
350,000
400,000
2002 2003 2004 2005 2006
Cash Illicit Flows versus Cash Absorption 2002-2006 ($millions)
Correlation: 0.90
All figures are in US$ millions, unless otherwise specified.
Simulation 2A
Africa Asia Europe MENA Western Hemisphere Total
Year IFF Abs Ratio
(Abs/IFF) IFF Abs Ratio
(Abs/IFF) IFF Abs Ratio
(Abs/IFF) IFF Abs Ratio
(Abs/IFF) IFF Abs Ratio
(Abs/IFF) IFF Abs Ratio
(Abs/IFF) 2002 7,978 3,588 0.45 17,593 -3,736 -0.21 8,837 4,403 0.50 6,846 -6,376 -0.93 16,188 -13,595 -0.84 57,442 -15,716 -0.27 2003 3,939 10,191 2.59 16,897 5,270 0.31 8,153 15,668 1.92 5,876 11,190 1.90 11,686 32,820 2.81 46,551 75,139 1.61 2004 6,493 14,195 2.19 20,087 25,930 1.29 15,833 40,805 2.58 10,927 19,139 1.75 12,013 63,846 5.31 65,352 163,915 2.51 2005 3,928 2,856 0.73 35,941 22,228 0.62 12,380 56,348 4.55 18,375 47,121 2.56 16,465 55,502 3.37 87,089 184,055 2.11 2006 5,187 25,890 4.99 60,712 50,880 0.84 38,950 86,152 2.21 25,280 100,649 3.98 18,411 87,204 4.74 148,540 350,775 2.36
Average 5,505 11,344 2.06 30,246 20,115 0.67 16,831 40,675 2.42 13,461 34,345 2.55 14,952 45,156 3.02 80,995 151,634 1.87 Correlation: -0.09 Correlation: 0.88 Correlation: 0.87 Correlation: 0.97 Correlation: 0.16 Correlation: 0.90
17The Absorption of Illicit Financial Flows from Developing Countries: 2002-2006
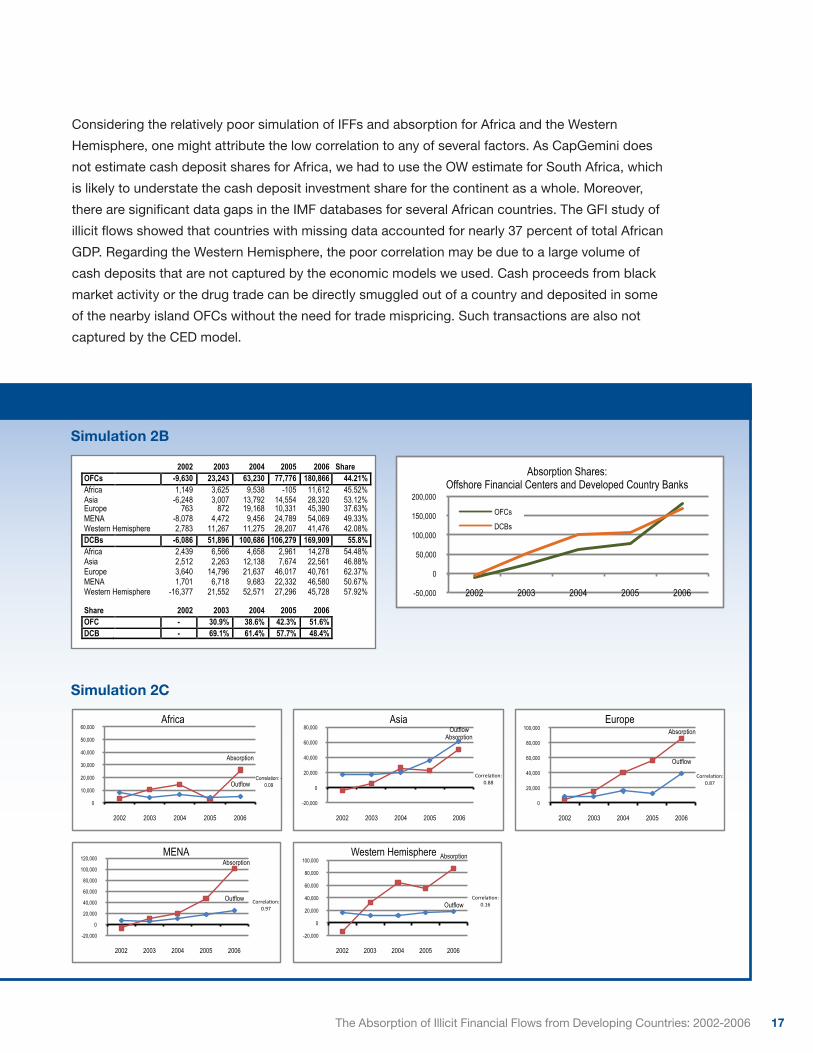
Considering the relatively poor simulation of IFFs and absorption for Africa and the Western
Hemisphere, one might attribute the low correlation to any of several factors. As CapGemini does
not estimate cash deposit shares for Africa, we had to use the OW estimate for South Africa, which
is likely to understate the cash deposit investment share for the continent as a whole. Moreover,
there are significant data gaps in the IMF databases for several African countries. The GFI study of
illicit flows showed that countries with missing data accounted for nearly 37 percent of total African
GDP. Regarding the Western Hemisphere, the poor correlation may be due to a large volume of
cash deposits that are not captured by the economic models we used. Cash proceeds from black
market activity or the drug trade can be directly smuggled out of a country and deposited in some
of the nearby island OFCs without the need for trade mispricing. Such transactions are also not
captured by the CED model.
Simulation 2C
Simulation 2B
-50,000
0
50,000
100,000
150,000
200,000
2002 2003 2004 2005 2006
Absorption Shares: Offshore Financial Centers and Developed Country Banks
OFCs
DCBs
Absorption
Outflow
0
10,000
20,000
30,000
40,000
50,000
60,000
2002 2003 2004 2005 2006
Africa
Correlation: - 0.09
Absorption
Outflow
0
20,000
40,000
60,000
80,000
100,000
2002 2003 2004 2005 2006
Europe
Correla'on: 0.87
Absorption
Outflow
-20,000
0
20,000
40,000
60,000
80,000
100,000
120,000
2002 2003 2004 2005 2006
MENA
Correla'on: 0.97
Absorption
Outflow
-20,000
0
20,000
40,000
60,000
80,000
100,000
2002 2003 2004 2005 2006
Western Hemisphere
Correla'on: 0.16
Absorption Outflow
-20,000
0
20,000
40,000
60,000
80,000
2002 2003 2004 2005 2006
Asia
Correla'on: 0.88
2002 2003 2004 2005 2006 Share OFCs -9,630 23,243 63,230 77,776 180,866 44.21% Africa 1,149 3,625 9,538 -105 11,612 45.52% Asia -6,248 3,007 13,792 14,554 28,320 53.12% Europe 763 872 19,168 10,331 45,390 37.63% MENA -8,078 4,472 9,456 24,789 54,069 49.33% Western Hemisphere 2,783 11,267 11,275 28,207 41,476 42.08% DCBs -6,086 51,896 100,686 106,279 169,909 55.8% Africa 2,439 6,566 4,658 2,961 14,278 54.48% Asia 2,512 2,263 12,138 7,674 22,561 46.88% Europe 3,640 14,796 21,637 46,017 40,761 62.37% MENA 1,701 6,718 9,683 22,332 46,580 50.67% Western Hemisphere -16,377 21,552 52,571 27,296 45,728 57.92% Share 2002 2003 2004 2005 2006 OFC - 30.9% 38.6% 42.3% 51.6% DCB - 69.1% 61.4% 57.7% 48.4%
18 Global Financial Integrity
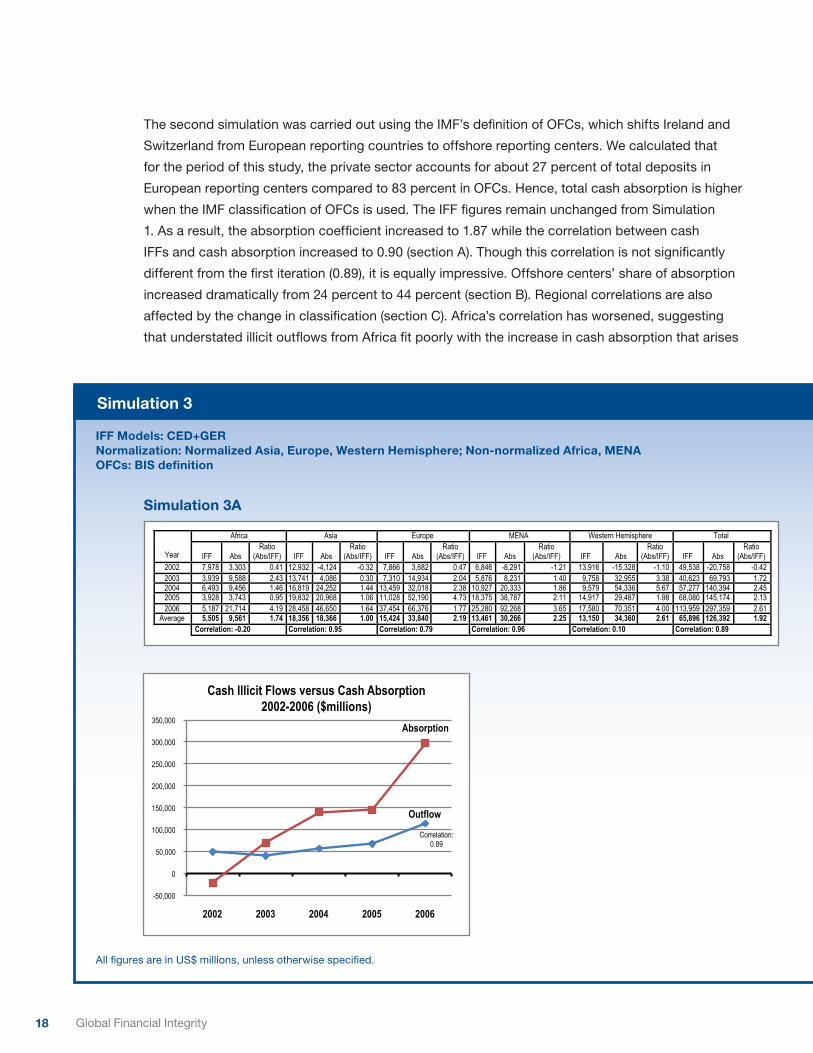
Simulation 3
The second simulation was carried out using the IMF’s definition of OFCs, which shifts Ireland and
Switzerland from European reporting countries to offshore reporting centers. We calculated that
for the period of this study, the private sector accounts for about 27 percent of total deposits in
European reporting centers compared to 83 percent in OFCs. Hence, total cash absorption is higher
when the IMF classification of OFCs is used. The IFF figures remain unchanged from Simulation
1. As a result, the absorption coefficient increased to 1.87 while the correlation between cash
IFFs and cash absorption increased to 0.90 (section A). Though this correlation is not significantly
different from the first iteration (0.89), it is equally impressive. Offshore centers’ share of absorption
increased dramatically from 24 percent to 44 percent (section B). Regional correlations are also
affected by the change in classification (section C). Africa’s correlation has worsened, suggesting
that understated illicit outflows from Africa fit poorly with the increase in cash absorption that arises
Simulation 3A
IFF Models: CED+GERNormalization: Normalized Asia, Europe, Western Hemisphere; Non-normalized Africa, MENA OFCs: BIS definition
Absorption
Outflow
-50,000
0
50,000
100,000
150,000
200,000
250,000
300,000
350,000
2002 2003 2004 2005 2006
Cash Illicit Flows versus Cash Absorption 2002-2006 ($millions)
Correlation: 0.89
All figures are in US$ millions, unless otherwise specified.
Africa Asia Europe MENA Western Hemisphere Total
Year IFF Abs Ratio
(Abs/IFF) IFF Abs Ratio
(Abs/IFF) IFF Abs Ratio
(Abs/IFF) IFF Abs Ratio
(Abs/IFF) IFF Abs Ratio
(Abs/IFF) IFF Abs Ratio
(Abs/IFF) 2002 7,978 3,303 0.41 12,932 -4,124 -0.32 7,866 3,682 0.47 6,846 -8,291 -1.21 13,916 -15,328 -1.10 49,538 -20,758 -0.42 2003 3,939 9,588 2.43 13,741 4,086 0.30 7,310 14,934 2.04 5,876 8,231 1.40 9,758 32,955 3.38 40,623 69,793 1.72 2004 6,493 9,456 1.46 16,819 24,252 1.44 13,459 32,018 2.38 10,927 20,333 1.86 9,579 54,336 5.67 57,277 140,394 2.45 2005 3,928 3,743 0.95 19,832 20,968 1.06 11,028 52,190 4.73 18,375 38,787 2.11 14,917 29,487 1.98 68,080 145,174 2.13 2006 5,187 21,714 4.19 28,458 46,650 1.64 37,454 66,376 1.77 25,280 92,268 3.65 17,580 70,351 4.00 113,959 297,359 2.61
Average 5,505 9,561 1.74 18,356 18,366 1.00 15,424 33,840 2.19 13,461 30,266 2.25 13,150 34,360 2.61 65,896 126,392 1.92 Correlation: -0.20 Correlation: 0.95 Correlation: 0.79 Correlation: 0.96 Correlation: 0.10 Correlation: 0.89
19The Absorption of Illicit Financial Flows from Developing Countries: 2002-2006
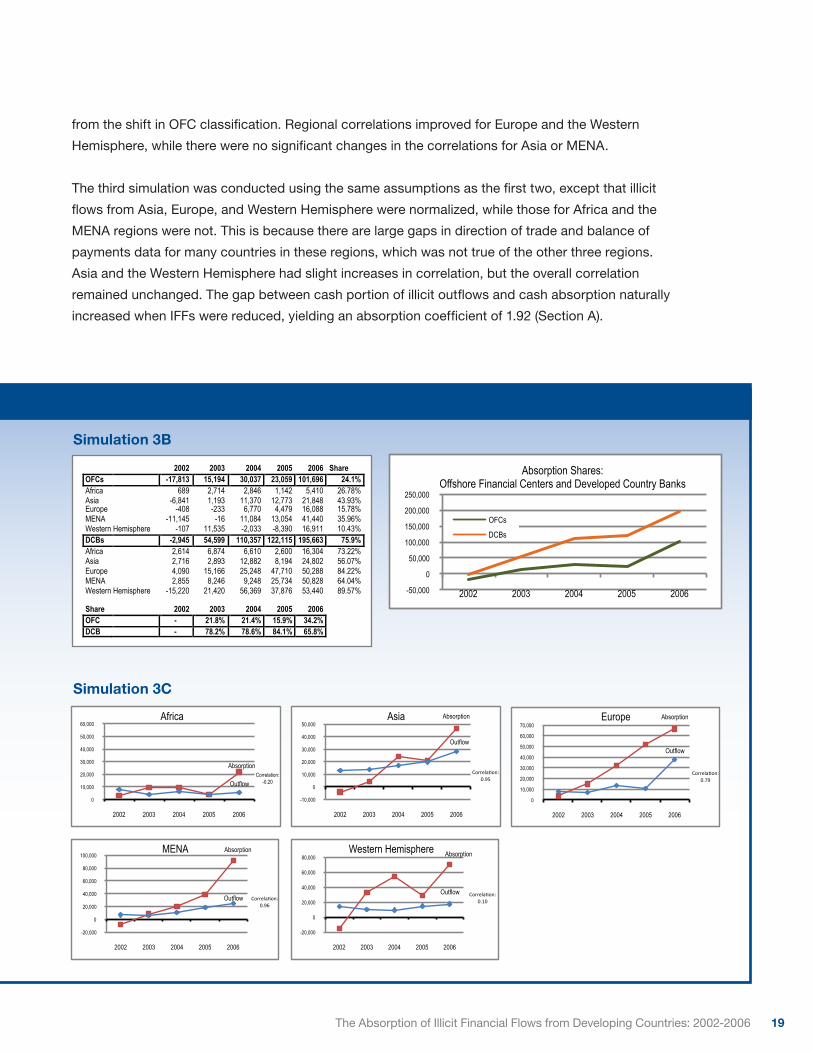
from the shift in OFC classification. Regional correlations improved for Europe and the Western
Hemisphere, while there were no significant changes in the correlations for Asia or MENA.
The third simulation was conducted using the same assumptions as the first two, except that illicit
flows from Asia, Europe, and Western Hemisphere were normalized, while those for Africa and the
MENA regions were not. This is because there are large gaps in direction of trade and balance of
payments data for many countries in these regions, which was not true of the other three regions.
Asia and the Western Hemisphere had slight increases in correlation, but the overall correlation
remained unchanged. The gap between cash portion of illicit outflows and cash absorption naturally
increased when IFFs were reduced, yielding an absorption coefficient of 1.92 (Section A).
Simulation 3C
Simulation 3B
-50,000
0
50,000
100,000
150,000
200,000
250,000
2002 2003 2004 2005 2006
Absorption Shares: Offshore Financial Centers and Developed Country Banks
OFCs
DCBs
Absorption
Outflow
-10,000
0
10,000
20,000
30,000
40,000
50,000
2002 2003 2004 2005 2006
Asia
Correla'on: 0.95
Absorption
Outflow
0
10,000
20,000
30,000
40,000
50,000
60,000
70,000
2002 2003 2004 2005 2006
Europe
Correla'on: 0.79
Absorption
Outflow
-20,000
0
20,000
40,000
60,000
80,000
100,000
2002 2003 2004 2005 2006
MENA
Correla'on: 0.96
Absorption
Outflow
-20,000
0
20,000
40,000
60,000
80,000
2002 2003 2004 2005 2006
Western Hemisphere
Correla'on: 0.10
Absorption
Outflow
0
10,000
20,000
30,000
40,000
50,000
60,000
2002 2003 2004 2005 2006
Africa
Correlation: -0.20
2002 2003 2004 2005 2006 Share OFCs -17,813 15,194 30,037 23,059 101,696 24.1% Africa 689 2,714 2,846 1,142 5,410 26.78% Asia -6,841 1,193 11,370 12,773 21,848 43.93% Europe -408 -233 6,770 4,479 16,088 15.78% MENA -11,145 -16 11,084 13,054 41,440 35.96% Western Hemisphere -107 11,535 -2,033 -8,390 16,911 10.43% DCBs -2,945 54,599 110,357 122,115 195,663 75.9% Africa 2,614 6,874 6,610 2,600 16,304 73.22% Asia 2,716 2,893 12,882 8,194 24,802 56.07% Europe 4,090 15,166 25,248 47,710 50,288 84.22% MENA 2,855 8,246 9,248 25,734 50,828 64.04% Western Hemisphere -15,220 21,420 56,369 37,876 53,440 89.57% Share 2002 2003 2004 2005 2006 OFC - 21.8% 21.4% 15.9% 34.2% DCB - 78.2% 78.6% 84.1% 65.8%
20 Global Financial Integrity
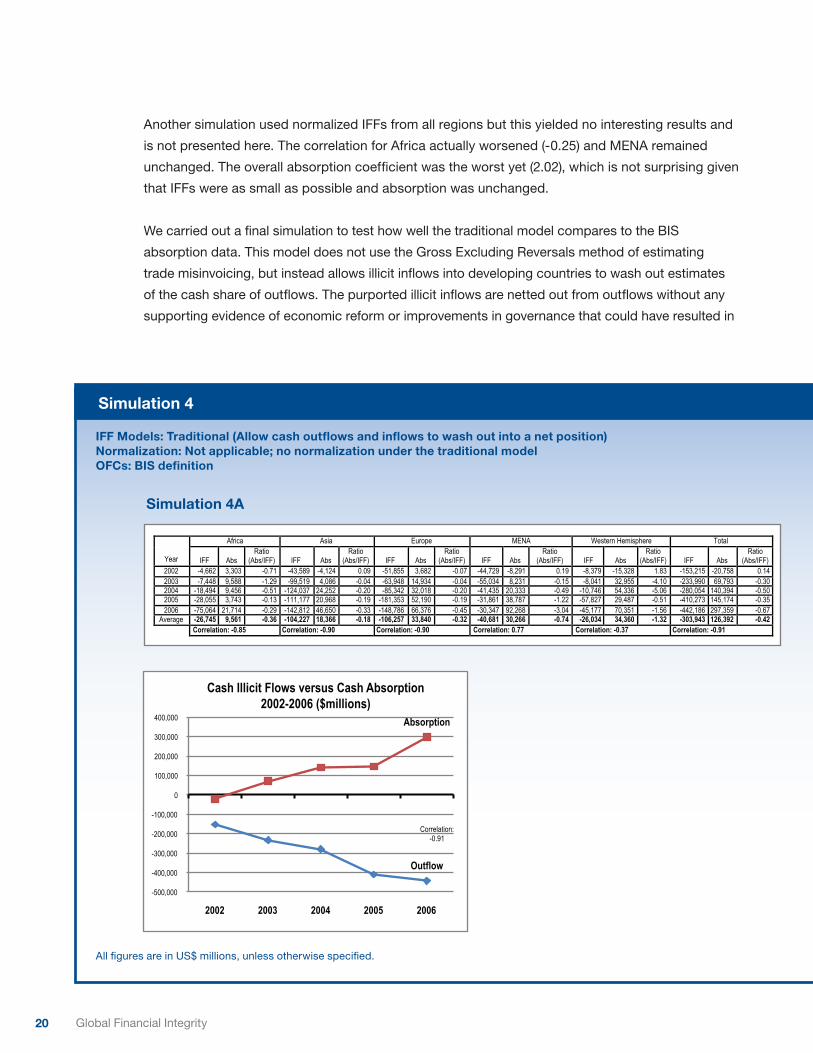
Simulation 4
All figures are in US$ millions, unless otherwise specified.
Another simulation used normalized IFFs from all regions but this yielded no interesting results and
is not presented here. The correlation for Africa actually worsened (-0.25) and MENA remained
unchanged. The overall absorption coefficient was the worst yet (2.02), which is not surprising given
that IFFs were as small as possible and absorption was unchanged.
We carried out a final simulation to test how well the traditional model compares to the BIS
absorption data. This model does not use the Gross Excluding Reversals method of estimating
trade misinvoicing, but instead allows illicit inflows into developing countries to wash out estimates
of the cash share of outflows. The purported illicit inflows are netted out from outflows without any
supporting evidence of economic reform or improvements in governance that could have resulted in
Simulation 4A
IFF Models: Traditional (Allow cash outflows and inflows to wash out into a net position)Normalization: Not applicable; no normalization under the traditional model OFCs: BIS definition
Absorption
Outflow
-500,000
-400,000
-300,000
-200,000
-100,000
0
100,000
200,000
300,000
400,000
2002 2003 2004 2005 2006
Cash Illicit Flows versus Cash Absorption 2002-2006 ($millions)
Correlation: -0.91
Africa Asia Europe MENA Western Hemisphere Total
Year IFF Abs Ratio
(Abs/IFF) IFF Abs Ratio
(Abs/IFF) IFF Abs Ratio
(Abs/IFF) IFF Abs Ratio
(Abs/IFF) IFF Abs Ratio
(Abs/IFF) IFF Abs Ratio
(Abs/IFF) 2002 -4,662 3,303 -0.71 -43,589 -4,124 0.09 -51,855 3,682 -0.07 -44,729 -8,291 0.19 -8,379 -15,328 1.83 -153,215 -20,758 0.14 2003 -7,448 9,588 -1.29 -99,519 4,086 -0.04 -63,948 14,934 -0.04 -55,034 8,231 -0.15 -8,041 32,955 -4.10 -233,990 69,793 -0.30 2004 -18,494 9,456 -0.51 -124,037 24,252 -0.20 -85,342 32,018 -0.20 -41,435 20,333 -0.49 -10,746 54,336 -5.06 -280,054 140,394 -0.50 2005 -28,055 3,743 -0.13 -111,177 20,968 -0.19 -181,353 52,190 -0.19 -31,861 38,787 -1.22 -57,827 29,487 -0.51 -410,273 145,174 -0.35 2006 -75,064 21,714 -0.29 -142,812 46,650 -0.33 -148,786 66,376 -0.45 -30,347 92,268 -3.04 -45,177 70,351 -1.56 -442,186 297,359 -0.67
Average -26,745 9,561 -0.36 -104,227 18,366 -0.18 -106,257 33,840 -0.32 -40,681 30,266 -0.74 -26,034 34,360 -1.32 -303,943 126,392 -0.42 Correlation: -0.85 Correlation: -0.90 Correlation: -0.90 Correlation: 0.77 Correlation: -0.37 Correlation: -0.91
21The Absorption of Illicit Financial Flows from Developing Countries: 2002-2006
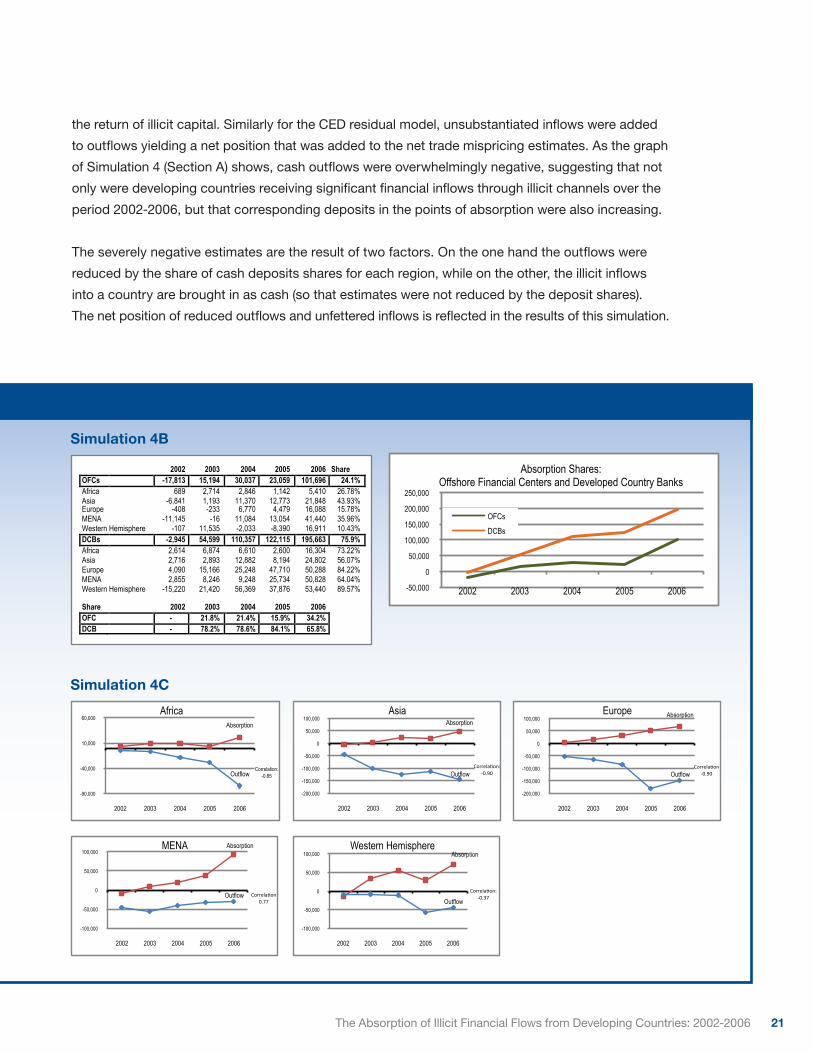
the return of illicit capital. Similarly for the CED residual model, unsubstantiated inflows were added
to outflows yielding a net position that was added to the net trade mispricing estimates. As the graph
of Simulation 4 (Section A) shows, cash outflows were overwhelmingly negative, suggesting that not
only were developing countries receiving significant financial inflows through illicit channels over the
period 2002-2006, but that corresponding deposits in the points of absorption were also increasing.
The severely negative estimates are the result of two factors. On the one hand the outflows were
reduced by the share of cash deposits shares for each region, while on the other, the illicit inflows
into a country are brought in as cash (so that estimates were not reduced by the deposit shares).
The net position of reduced outflows and unfettered inflows is reflected in the results of this simulation.
Simulation 4C
Simulation 4B
-50,000
0
50,000
100,000
150,000
200,000
250,000
2002 2003 2004 2005 2006
Absorption Shares: Offshore Financial Centers and Developed Country Banks
OFCs
DCBs
Absorption
Outflow
-90,000
-40,000
10,000
60,000
2002 2003 2004 2005 2006
Africa
Correlation: -0.85
Absorption
Outflow
-200,000
-150,000
-100,000
-50,000
0
50,000
100,000
2002 2003 2004 2005 2006
Europe
Correla'on -‐0.90
Absorption
Outflow
-100,000
-50,000
0
50,000
100,000
2002 2003 2004 2005 2006
MENA
Correla'on 0.77
Absorption
Outflow
-100,000
-50,000
0
50,000
100,000
2002 2003 2004 2005 2006
Western Hemisphere
Correla'on: -‐0.37
Absorption
Outflow
-200,000
-150,000
-100,000
-50,000
0
50,000
100,000
2002 2003 2004 2005 2006
Asia
Correla'on: -‐0.90
2002 2003 2004 2005 2006 Share OFCs -17,813 15,194 30,037 23,059 101,696 24.1% Africa 689 2,714 2,846 1,142 5,410 26.78% Asia -6,841 1,193 11,370 12,773 21,848 43.93% Europe -408 -233 6,770 4,479 16,088 15.78% MENA -11,145 -16 11,084 13,054 41,440 35.96% Western Hemisphere -107 11,535 -2,033 -8,390 16,911 10.43% DCBs -2,945 54,599 110,357 122,115 195,663 75.9% Africa 2,614 6,874 6,610 2,600 16,304 73.22% Asia 2,716 2,893 12,882 8,194 24,802 56.07% Europe 4,090 15,166 25,248 47,710 50,288 84.22% MENA 2,855 8,246 9,248 25,734 50,828 64.04% Western Hemisphere -15,220 21,420 56,369 37,876 53,440 89.57% Share 2002 2003 2004 2005 2006 OFC - 21.8% 21.4% 15.9% 34.2% DCB - 78.2% 78.6% 84.1% 65.8%
22 Global Financial Integrity
Summary of SimulationsThe following conclusions can be drawn from the simulation results subject to the assumptions
previously outlined.
1. As expected, we found absorption, defined as the change in private sector deposits in banks
and offshore centers to exceed illicit cash outflows by a significant margin (some 60-100%). This
is because illicit flows are most likely understated due to the reasons already discussed while
absorption also includes licit cash deposits.
2. Following the terrorist attacks on the United States in 2001, there was a much larger withdrawal
from the OFCs than there was from banks (US$18 billion versus less than US$3 billion, see
Simulation 1, section B, 2002 figures). Cash absorption of IFFs in that year was also below cash
IFFs. This suggests that net cash withdrawals from PoAs were diverted into noncash investments
or brought into countries as illicit capital. The net withdrawal of funds from PoAs in 2002 should
be viewed as a one-off shock effect of the attacks in the United States that affected investor
behavior related to the world’s shadow financial system.
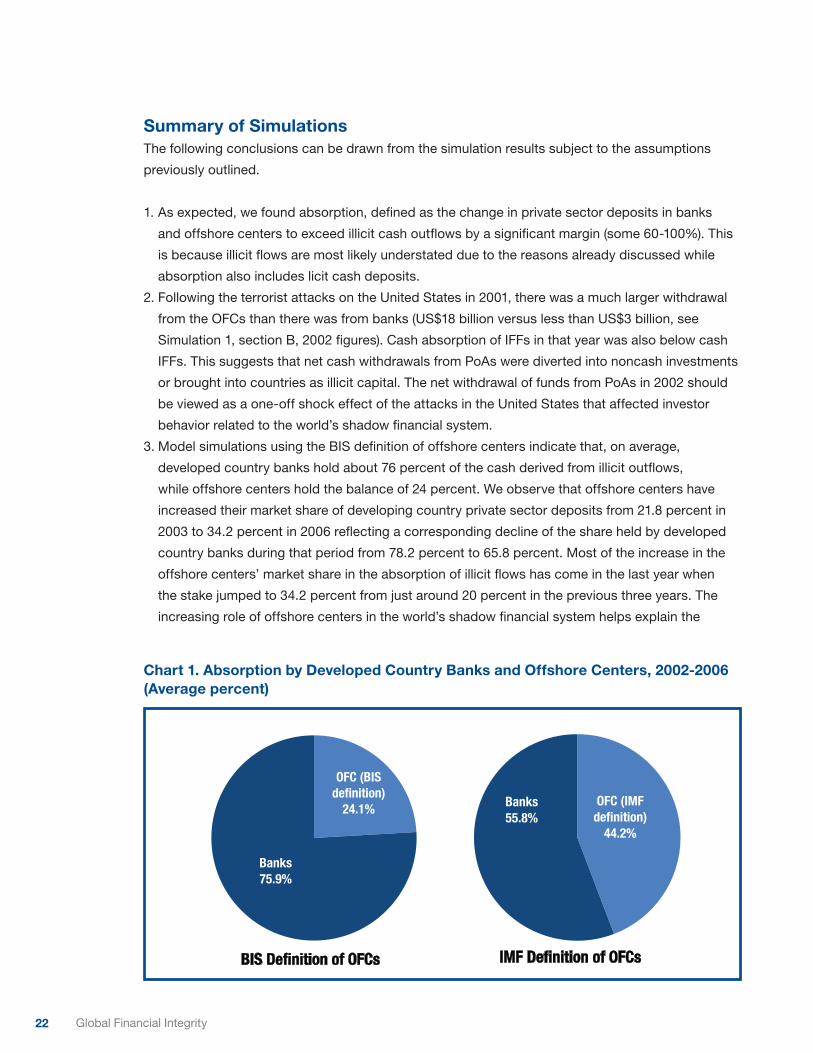
3. Model simulations using the BIS definition of offshore centers indicate that, on average,
developed country banks hold about 76 percent of the cash derived from illicit outflows,
while offshore centers hold the balance of 24 percent. We observe that offshore centers have
increased their market share of developing country private sector deposits from 21.8 percent in
2003 to 34.2 percent in 2006 reflecting a corresponding decline of the share held by developed
country banks during that period from 78.2 percent to 65.8 percent. Most of the increase in the
offshore centers’ market share in the absorption of illicit flows has come in the last year when
the stake jumped to 34.2 percent from just around 20 percent in the previous three years. The
increasing role of offshore centers in the world’s shadow financial system helps explain the
Chart 1. Absorption by Developed Country Banks and Offshore Centers, 2002-2006(Average percent)
OFC (BIS definition)
24.1%
Banks 75.9%
BIS Definition of OFCs
OFC (IMF definition)
44.2%
Banks 55.8%
IMF Definition of OFCs
23The Absorption of Illicit Financial Flows from Developing Countries: 2002-2006
recent media focus as well as the ongoing efforts by the G-20 to improve their transparency and
accountability. If we were to use the IMF definition of offshore centers, then their holdings of
private sector deposits from developing countries almost doubles from 24 percent to 44 percent
of the total. Note that this 44 percent share is also likely to include a higher licit portion given
that points of absorption in Ireland and Switzerland act as offshore centers as well as traditional
banks. The relative proportion of absorption in banks and offshore centers (as defined by the BIS
and the IMF) are shown in Chart 1.
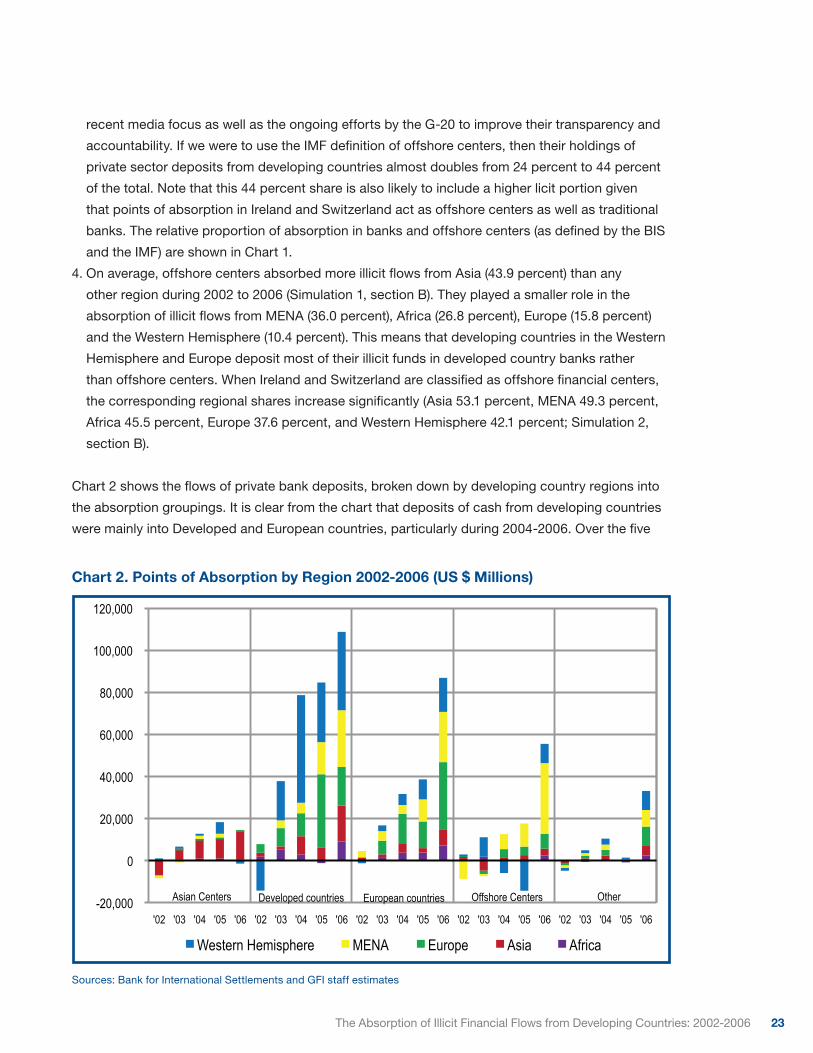
4. On average, offshore centers absorbed more illicit flows from Asia (43.9 percent) than any
other region during 2002 to 2006 (Simulation 1, section B). They played a smaller role in the
absorption of illicit flows from MENA (36.0 percent), Africa (26.8 percent), Europe (15.8 percent)
and the Western Hemisphere (10.4 percent). This means that developing countries in the Western
Hemisphere and Europe deposit most of their illicit funds in developed country banks rather
than offshore centers. When Ireland and Switzerland are classified as offshore financial centers,
the corresponding regional shares increase significantly (Asia 53.1 percent, MENA 49.3 percent,
Africa 45.5 percent, Europe 37.6 percent, and Western Hemisphere 42.1 percent; Simulation 2,
section B).
Chart 2 shows the flows of private bank deposits, broken down by developing country regions into
the absorption groupings. It is clear from the chart that deposits of cash from developing countries
were mainly into Developed and European countries, particularly during 2004-2006. Over the five
Chart 2. Points of Absorption by Region 2002-2006 (US $ Millions)
Asian Centers Developed countries European countries Offshore Centers Other -20,000
0
20,000
40,000
60,000
80,000
100,000
120,000
'02 '03 '04 '05 '06 '02 '03 '04 '05 '06 '02 '03 '04 '05 '06 '02 '03 '04 '05 '06 '02 '03 '04 '05 '06
Chart 2. Points of Absorption by Region 2002-2006 (US$millions)
Western Hemisphere MENA Europe Asia Africa Sources: Bank for International Settlements and GFI staff estimates
Sources: Bank for International Settlements and GFI staff estimates
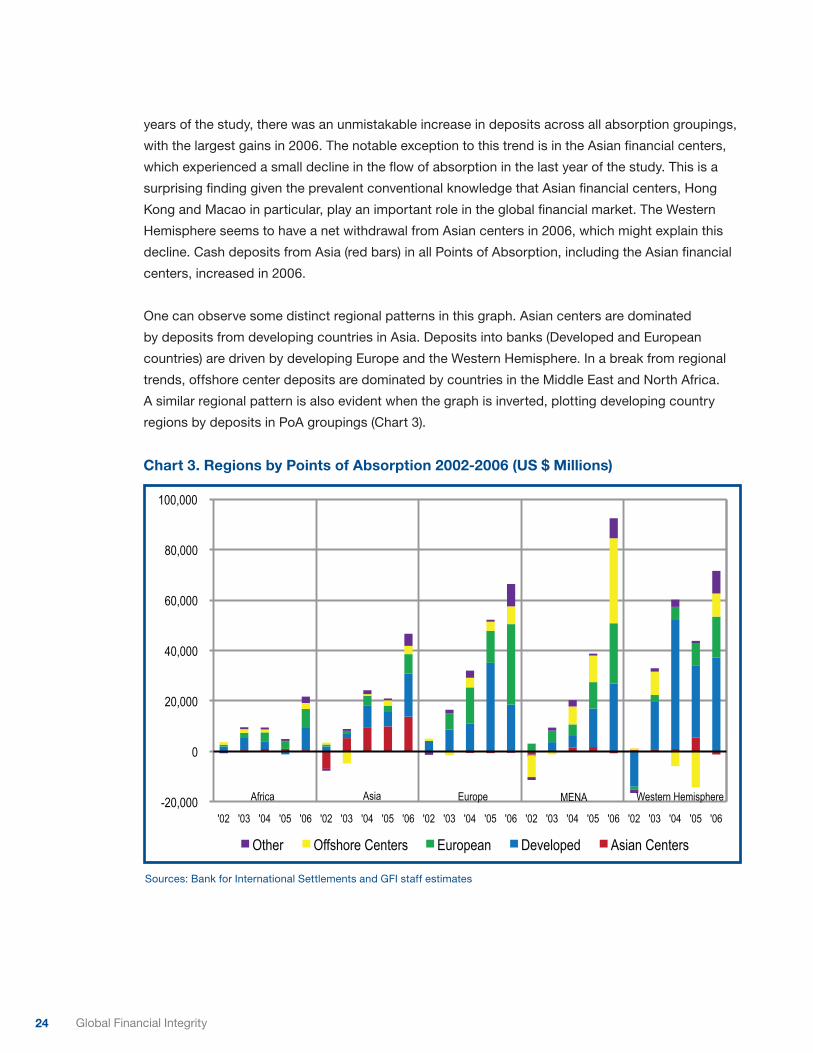
24 Global Financial Integrity
years of the study, there was an unmistakable increase in deposits across all absorption groupings,
with the largest gains in 2006. The notable exception to this trend is in the Asian financial centers,
which experienced a small decline in the flow of absorption in the last year of the study. This is a
surprising finding given the prevalent conventional knowledge that Asian financial centers, Hong
Kong and Macao in particular, play an important role in the global financial market. The Western
Hemisphere seems to have a net withdrawal from Asian centers in 2006, which might explain this
decline. Cash deposits from Asia (red bars) in all Points of Absorption, including the Asian financial
centers, increased in 2006.
One can observe some distinct regional patterns in this graph. Asian centers are dominated
by deposits from developing countries in Asia. Deposits into banks (Developed and European
countries) are driven by developing Europe and the Western Hemisphere. In a break from regional
trends, offshore center deposits are dominated by countries in the Middle East and North Africa.
A similar regional pattern is also evident when the graph is inverted, plotting developing country
regions by deposits in PoA groupings (Chart 3).
Chart 3. Regions by Points of Absorption 2002-2006 (US $ Millions)
Africa Asia Europe MENA Western Hemisphere -20,000
0
20,000
40,000
60,000
80,000
100,000
'02 '03 '04 '05 '06 '02 '03 '04 '05 '06 '02 '03 '04 '05 '06 '02 '03 '04 '05 '06 '02 '03 '04 '05 '06
Chart 3. Regions by Points of Absorption 2002-2006 (US$millions)
Other Offshore Centers European Developed Asian Centers Sources: Bank for International Settlements and GFI staff estimates Sources: Bank for International Settlements and GFI staff estimates
25The Absorption of Illicit Financial Flows from Developing Countries: 2002-2006
V. Licit-Illicit Analysis
The following analysis allows us to derive rough estimates of the split between licit and illicit funds in
developed country banks (DCBs or banks) and, by default, in OFCs. We start by providing a simple
explanation of the algebraic formulations and manipulations.
Absorption takes place in either banks or offshore centers but in each there is some portion of
funds that is licit, some that is illicit (Equation 1). Now, we assume the total illicit is given by the
amount of cash illicit outflows. Therefore, the difference between total cash absorption and cash
illicit outflows ought to be the amount of licit flows. These licit flows are presumably absorbed
by both banks and offshore centers. Equation 2 states exactly this: the sum of the licit amount in
banks and the licit amount in offshore centers equals the total licit flows (the difference between
total absorption and illicit flows). The only unknowns now are exactly what percentage of deposits
in banks and offshore centers are licit. Equation 3 rewrites this idea so that we can identify one of
these unknowns in terms of the other, much like the familiar equation for a line, y = mx + b. Here, y
is the licit percentage of bank deposits and x is the licit percentage of offshore center deposits.
At this point, we can either graph x and y or we can just plug in a range of values for x and see
what results we get for y. The goal would be to see if the range of y is acceptable for any values
of x or if only a few values of x are acceptable. We can also plug in values for y and determine the
acceptable range for x. Specifically, we seek to find out if it is alright to say that banks have only
licit or no illicit deposits (i.e., y is 100 percent). Are banks as clean as they claim to be? We can
also see if it is reasonable to assume that offshore centers, which are at the heart of the world’s
shadow financial system, only have illicit deposits. We find that neither extreme is reasonable in that
extremes yield corresponding shares that violate boundary conditions (such as the share of licit and
illicit deposits in banks and offshore centers must equal one).
Let:
δ1 = Licit fraction in OFCs 0≤ δ1≤1
δ2 = Licit fraction in DCBs 0≤ δ2≤1
δ3 = Illicit fraction in OFCs 0≤ δ3≤1
δ4 = Illicit fraction in DCBs 0≤ δ4≤1
OFC and DCB represent total deposits in OFCs and DCBs, such that:
δ1+ δ3 = 1 and δ2+ δ4 = 1
26 Global Financial Integrity
Total absorption consists of the sum of licit and illicit funds in both points of absorption OFCs
and DCBs:
A = δ1OFC + δ3OFC + δ2DCB + δ4DCB
The assumption underlying this paper is that the cash share of illicit outflows is absorbed in
both OFCs and DCBs because the PoAs neither have the operational means nor the incentive to
effectively exclude illicit funds. Hence:
(1) IFF = δ3OFC + δ4DCB
or, δ4DCB = IFF - δ3OFC
∴ A = δ1OFC + δ3OFC + δ2DCB + IFF - δ3OFC
(2) A = δ1OFC + δ2DCB + IFF
or, δ2DCB = A - δ1OFC - IFF
This gives:
(3) δ2 = [A- δ1OFC – IFF]/DCB
or, δ2 = [A- IFF] /DCB - δ1[OFC/DCB]
Equation 3 provides the general relationship between the proportion of licit funds in OFCs and
DCBs. This is as far as one can get without making assumptions about δ1 or δ2. For example, one
can assume that the OFCs only absorb illicit funds (δ1 = 0). Then the licit fraction in DCBs would be:
δ2 = [A – IFF]/DCB
The assumption that there are no licit funds from developing countries deposited in OFCs, however,
is a restrictive one, particularly if one includes Ireland and Switzerland as OFCs. These countries
also act like DCBs, suggesting they attract some licit funds from developing countries. Equation 3
can be rearranged to show the relationship between illicit funds in OFCs and DCBs as well:
(4) δ4 = 1-[A- (1-δ3)OFC – IFF]/DCB
Or, equivalently,
(5) δ3 = 1-[A- (1-δ4)DCB – IFF]/OFC
27The Absorption of Illicit Financial Flows from Developing Countries: 2002-2006
Equation 4 specifies the illicit fraction of funds in DCBs in terms of the corresponding illicit fraction
of funds in OFCs. Equation 5 determines the illicit fraction in OFCs for varying assumptions of the
illicit fraction in DBCs. The following tables show the proportion of licit and illicit funds in OFCs and
DCBs based on these formulas. The first table uses the BIS definition of OFCs while the second
uses the IMF definition. As absorption was negative for 2002, this year was excluded from the
calculations.
Table 2. IMF Definition
Proportion of Illicit Funds in DCBs, δ4, 2003-2006 Proportion of Illicit Funds in OFCs, δ3, 2003-20060%, δ3=0
30%, δ3=0.3
70%, δ3=0.7
100%, δ3=1
Average 0%, δ4=0
30%, δ4=0.3
70%, δ4=0.7
100%, δ4=1
Average
2003 85% 72% 54% 41% 63% 190% 123% 34% -33% 79%
2004 69% 50% 25% 6% 38% 110% 62% -1% -49% 30%
2005 82% 60% 31% 9% 46% 113% 72% 17% -24% 44%
2006 83% 51% 9% -23% 30% 78% 50% 13% -16% 31%
These estimates are subject to all of the data issues and assumptions described in this paper.
However, there are some points worth noting.
(i) If one were to include Ireland and Switzerland as OFCs as under the IMF definition, the
estimates show that it is unrealistic to assume that OFCs hold only illicit funds, at least for 2006.
This finding is based on the fact that when δ3 = 1, δ4 is negative. This contradicts the range of
possible values for δ4. Therefore, for this year, and for this definition, OFCs absorbed at least
some licit deposits from developing countries.
(ii) Similarly, it is unrealistic to assume that DCBs hold only illicit funds (δ4 = 1) because then δ3
would be negative, which violates the boundary conditions on δ3. This reasonable conclusion is
supported by both definitions for all years.
(iii) Conversely, if we assume that DCBs absorb only licit funds (δ4 = 0), the corresponding value for
δ3 is larger than 100 percent for nearly all years of either definition. The sole exception is the
aforementioned 2006, IMF definition. This means that by and large, developed country banks
absorb both licit and illicit funds from developing countries.
Table 1. BIS Definition
Proportion of Illicit Funds in DCBs, δ4, 2003-2006 Proportion of Illicit Funds in OFCs, δ3, 2003-20060%, δ3=0
30%, δ3=0.3
70%, δ3=0.7
100%, δ3=1
Average 0%, δ4=0
30%, δ4=0.3
70%, δ4=0.7
100%, δ4=1
Average
2003 81% 73% 62% 53% 67% 291% 184% 40% -68% 112%
2004 63% 55% 44% 36% 49% 232% 121% -25% -136% 48%
2005 72% 66% 58% 53% 62% 380% 221% 9% -150% 115%
2006 72% 57% 36% 20% 46% 139% 82% 5% -53% 43%
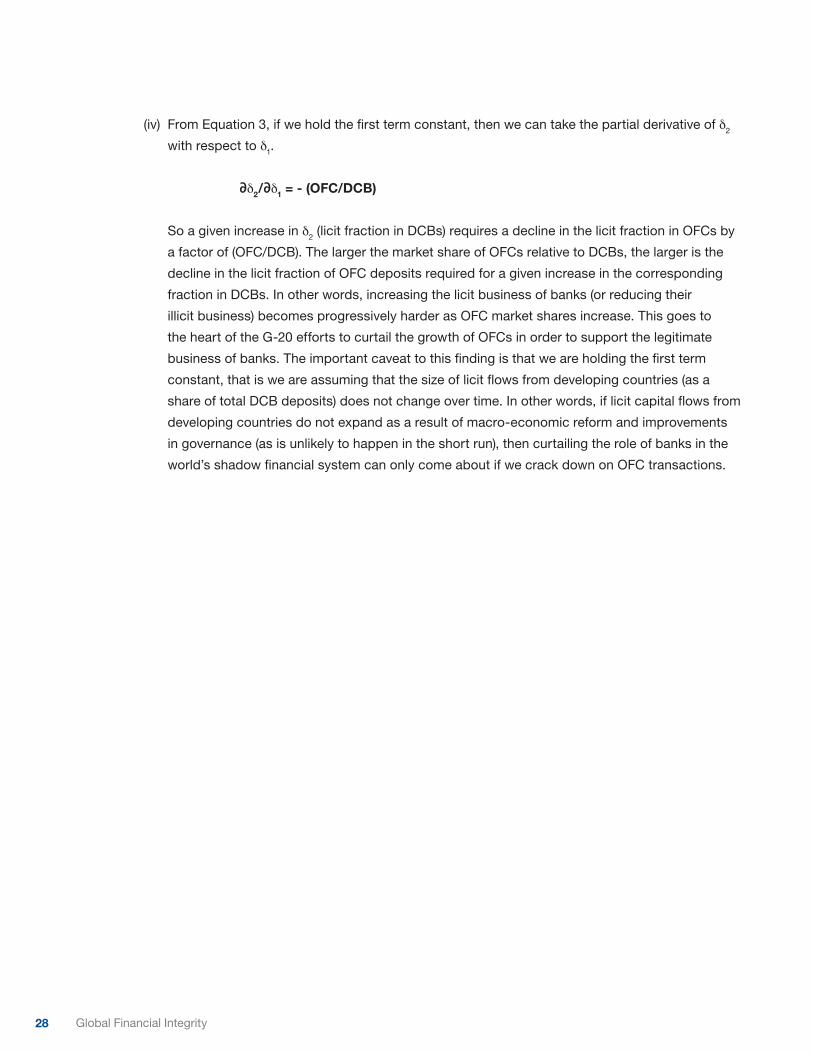
28 Global Financial Integrity
(iv) From Equation 3, if we hold the first term constant, then we can take the partial derivative of δ2
with respect to δ1.
∂δ2/∂δ1 = - (OFC/DCB)
So a given increase in δ2 (licit fraction in DCBs) requires a decline in the licit fraction in OFCs by
a factor of (OFC/DCB). The larger the market share of OFCs relative to DCBs, the larger is the
decline in the licit fraction of OFC deposits required for a given increase in the corresponding
fraction in DCBs. In other words, increasing the licit business of banks (or reducing their
illicit business) becomes progressively harder as OFC market shares increase. This goes to
the heart of the G-20 efforts to curtail the growth of OFCs in order to support the legitimate
business of banks. The important caveat to this finding is that we are holding the first term
constant, that is we are assuming that the size of licit flows from developing countries (as a
share of total DCB deposits) does not change over time. In other words, if licit capital flows from
developing countries do not expand as a result of macro-economic reform and improvements
in governance (as is unlikely to happen in the short run), then curtailing the role of banks in the
world’s shadow financial system can only come about if we crack down on OFC transactions.
29The Absorption of Illicit Financial Flows from Developing Countries: 2002-2006
VI. Conclusions
This paper makes several important, rather seminal, contributions to the study of the absorption
of illicit flows from developing countries. After several unsuccessful attempts to get data at the
necessary level of detail from the IMF, the central banks of the PoAs, and private corporations like
Datamonitor and CapGemini, we finally managed to obtain high quality data from the BIS. Even
better, the BIS was able to provide a regional breakdown of absorption, so that we were able to
compare illicit outflows and absorption on a regional level.
The model of absorption presented in this paper explicitly incorporates the two types of PoAs:
offshore financial centers and developed country banks, as defined in Section III. Since there is no
international consensus on the definition of an OFC, we used both the narrower BIS and the wider
IMF definitions of OFCs in our model. Classifying Ireland and Switzerland as offshore reporting
centers instead of European reporting countries resulted in an increase in overall absorption due
to the larger role of private sector deposits in offshore centers, suggested by the BIS consolidated
banking statistics.
In order to compensate for a lack of data at a sufficient level of detail, some assumptions had to be
made. We used CapGemini’s estimates of the cash share of deposits in the investment portfolios of
HNWIs and assumed that the deposit shares remained unchanged between licit and illicit portfolios.
For Africa, where CapGemini’s estimates were lacking, we supplemented with the estimates provided
by Oliver Wyman. We then assumed that the regional cash deposit shares represent the deposit
shares of all countries in that region. On the absorption side, we combined information about the
public/private split from the consolidated statistics with the data provided in the locational statistics.
We were further able to vary the model by incorporating a series of control variables that allowed us
to change certain parameters, according to different assumptions about the behavior of IFFs.
A number of simulations were run. The regional simulations attempt to compare regional illicit
outflows with the absorption of these funds in banks and offshore centers worldwide. The
performance of each was measured in terms of the resulting correlation between IFF and
absorption and the absorption coefficient. If perfect data were available, both the correlation and
AC would be close to 1, but given data limitations on illicit outflows and absorption, we did not
expect such results. The first simulation defined a base case, pairing non-normalized illicit outflows
with absorption, according to the BIS classification for offshore centers. The next simulation
looked at the results from classifying Ireland and Switzerland as OFCs according to the IMF
definition. A third simulation examined the effects of normalizing the IFFs from certain regions. The
final simulation used the traditional model of IFFs, which allowed illicit inflows of capital to offset
outflows. We found net illicit cash flows to be negative for all years for all regions. This model
therefore failed spectacularly in explaining official data on absorption.
30 Global Financial Integrity
We finally use a simple algebraic technique to derive the share of licit and illicit funds deposited in
OFCs and DCBs. Our calculations demonstrate that it is unrealistic for developed country banks
to only hold illicit deposits. By the same measure, when Ireland and Switzerland are classified as
OFCs, we found that OFCs must hold some licit funds in their total portfolio.
Our most interesting finding, however, was that developed country banks hold a significant portion
of the total of illicit funds, ranging possibly from 46 to 67 percent on average no matter how we
define OFCs (if we exclude 2006’s outlier). In fact, though the data used to determine the licit/illicit
splits are admittedly imperfect, it appears that even at its widest range, the proportion of total illicit
funds that find their way into developed country banks was anywhere from 20 percent to 72 percent
between 2003 and 2006.
The findings and conclusions in this paper are dependent upon the data we were able to obtain and
assumptions we were forced to make to compensate for the lack of higher quality data. This paper
provides a framework for relating illicit flows from developing countries to the absorption of these
flows in offshore financial centers and developed country banks. In order for economists to improve
upon the present analysis, the following data requirements need to be met.
Private consulting firms that estimate deposit shares would need to provide time series data
on each country’s cash deposit shares and would need to improve the coverage for important
countries in Africa. The BIS would need to expand the coverage of locational banking statistics
from the forty-one countries listed in Table 1. Estimates of absorption are understated to the
extent that private sector deposits of developing countries are also held in countries that do
not report locational banking data to the BIS. Furthermore, the locational deposit data that are
reported do not relate to the private sector deposits of developing countries. For instance, because
locational deposits are not split between private and public sectors, the private-public split from
the consolidated banking data had to be applied to the locational data. We urge member reporting
countries to cooperate with the BIS so that the latter can collect and disseminate the private-public
breakdown of locational banking statistics.
The IMF also has an important role to play in improving the range and breakdown of international
banking data. In this age of electronic banking and large-scale data processing, there is no reason
for countries not to compile a detailed breakdown of non-resident private sector deposits and to
make such data publicly available. It is inconceivable that such monetary statistics would violate
any country’s bank secrecy laws. The call for greater transparency and accountability from the
world’s financial system will ring hollow if it is not backed up by concrete action by international
organizations and member countries to make a wider range of detailed monetary statistics
available.
31The Absorption of Illicit Financial Flows from Developing Countries: 2002-2006
ReferencesBaer, K, 2002, Improving large taxpayer compliance: a review of country experience, Occasional Paper No. 215,
International Monetary Fund, Washington, DC.
Baker, Raymond, 2005, Capitalism’s Achilles Heel: Dirty Money and How to Renew the Free Market System, John Wiley & Sons: Hoboken, NJ.
Bank for International Settlements, Statistics, Available Online: http://www.bis.org/statistics.
Beja, Edsel L., 2005, Capital Flight: Meanings and Measures, in Capital Flight and Capital Controls in Developing Countries, Edited by Gerald A. Epstein, pp. 58-82, Edward Elgar, Cheltenham, United Kingdom.
Cheung, Yin-Wong and Xing Wang Qian, 2009, Capital Flight: China’s Experience, Department of Economics, University of California, Santa Cruz and State University of New York, Buffalo, October.
Christian Aid, 2008, Death and taxes. The true toll of tax dodging, Report from Christian Aid (May).
Colchester, Nicholas, 1986, A heavyweight sheds pounds, Financial Times, April 8, 1986.
Desai, Mihir, C. Fritz Foley, and James Hines, 2005, The Demand for Tax Haven Operations, Journal of Public Economics 90 (2006): 513-531.
Dharmapala, D. and James Hines, 2006, Which countries become tax havens? NBER Working Paper 12802.
The Economist, 2009, Haven hypocrisy, March 26th 2009.
Edison, Hali J. and Francis E.A. Warnock, 2001, A Simple Measure of the Intensity of Capital Controls, IMF Working Paper No. 01/180, International Monetary Fund, Washington, DC.
Errico, Luca and Alberto Musalem, Offshore Banking: An Analysis of Macro-and Micro Prudential Issues, IMF Working Paper No. 99/5, International Monetary Fund, Washington, DC.
Financial Stability Forum, 2000, Report of the Working Group on Offshore Financial Centers, Basel.
House of Commons, Treasury Committee, 2008, Offshore Financial Centers—Written Evidence, Washington, DC.
International Monetary Fund, 2008, Monetary and Financial Statistics: Compilation Guide, Washington, DC.
International Monetary Fund, 2008, Offshore Financial Centers. Report on the Assessment Program and Proposal for Integration with the Financial Sector Assessment Program, Supplementary Information, Washington, DC.
International Monetary Fund, 2000, Offshore Financial Centers—IMF Background Paper, Washington, DC.
Kapur, Devesh and Richard Webb, 2000, Governance-related Conditionalities of the International Financial Institutions, G-24 Discussion Paper Series, No. 6, August 2000.
Kar, Dev and Devon Cartwright-Smith, 2008, Illicit Financial Flows from Developing Countries: 2002-2006, Global Financial Integrity, Washington, DC.
Kar, Dev and Devon Cartwright-Smith, 2010, Illicit Financial Flows from Africa: Hidden Resource for Development, Global Financial Integrity, Washington, DC.
Kar, Dev, 1986, Currency Invoicing and Exchange Conversion in International Trade, Papers in International Financial Statistics, PIFS/86/1, International Monetary Fund, February 14, 1986, Washington, DC.
Lane, Philip R. and Gian Maria Milesi-Ferretti, 2010, Cross-Border Investment in Small International Financial Centers, IMF Working Paper, WP/10/38, International Monetary Fund, February, Washington, DC.
Lissakers, Karen (1991), Banks, Borrowers and the Establishment: A Revisionist Account of the International Debt Crisis, New York, Basic Books.
Merrill Lynch/Cap Gemini Ernst & Young, 2006, Asia-Pacific Wealth Report 2006, New York, NY.
Merrill Lynch/Cap Gemini Ernst & Young, 2007, Asia-Pacific Wealth Report 2007, New York, NY.
Merrill Lynch/Cap Gemini Ernst & Young, 2003, World Wealth Report 2003, New York, NY.
32 Global Financial Integrity
Merrill Lynch/Cap Gemini Ernst & Young, 2004, World Wealth Report 2004, New York, NY.
Merrill Lynch/Cap Gemini Ernst & Young, 2005, World Wealth Report 2005, New York, NY.
Merrill Lynch/Cap Gemini Ernst & Young, 2006, World Wealth Report 2006, New York, NY.
Merrill Lynch/Cap Gemini Ernst & Young, 2007, World Wealth Report 2007, New York, NY.
Tax Justice Network, 2007, Identifying Tax Havens and Offshore Finance Centers, Washington, DC.
Tax Justice Network, 2005, Briefing Paper: The Price of Offshore, March 2005, Washington, DC.
OECD, 2009, A Progress Report on the Jurisdictions Surveyed by the OECD Global Forum in Implementing the Internationally Agreed Tax Standard, September 28th 2009, Paris.
Oliver Wyman, 2008, The Future of Private Banking: A Wealth of Opportunity?
Official Norwegian Reports, 2009, Tax havens and development: Status, analyses, and measures, 2009: 19, Norwegian Ministry of Foreign Affairs, Oslo.
Rose, Andrew K., and Mark M. Spiegel, 2006, Offshore Financial Centers: Parasites or Symbionts? NBER Working Paper 12044, National Bureau of Economic Research, February, Cambridge, Massachusetts.
World Economic Forum, 2008, The Financial Development Report 2008.
Zhu, Andong, Chunxiang Li and Gerald Epstein, 2005, Capital Flight from China, 1982-2001, in Capital Flight and Capital Controls in Developing Countries, Edited by Gerald A. Epstein, pp. 262-285, Edward Elgar, Cheltenham, United Kingdom.
Zoromé, Ahmed, 2007, Concept of Offshore Financial Centers: In Search of an Operational Definition, IMF Working Paper No. 07/87, International Monetary Fund, April, Washington, DC.
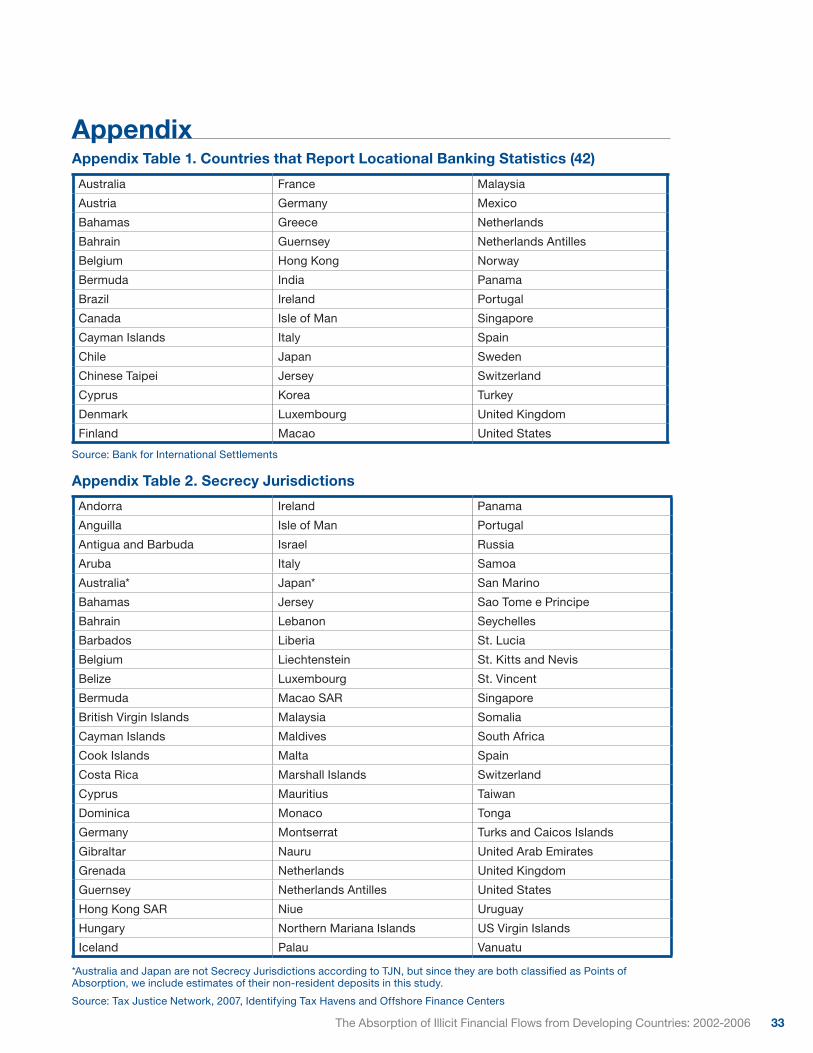
33The Absorption of Illicit Financial Flows from Developing Countries: 2002-2006
AppendixAppendix Table 1. Countries that Report Locational Banking Statistics (42)
Australia France Malaysia
Austria Germany Mexico
Bahamas Greece Netherlands
Bahrain Guernsey Netherlands Antilles
Belgium Hong Kong Norway
Bermuda India Panama
Brazil Ireland Portugal
Canada Isle of Man Singapore
Cayman Islands Italy Spain
Chile Japan Sweden
Chinese Taipei Jersey Switzerland
Cyprus Korea Turkey
Denmark Luxembourg United Kingdom
Finland Macao United States
Source: Bank for International Settlements
Andorra Ireland Panama
Anguilla Isle of Man Portugal
Antigua and Barbuda Israel Russia
Aruba Italy Samoa
Australia* Japan* San Marino
Bahamas Jersey Sao Tome e Principe
Bahrain Lebanon Seychelles
Barbados Liberia St. Lucia
Belgium Liechtenstein St. Kitts and Nevis
Belize Luxembourg St. Vincent
Bermuda Macao SAR Singapore
British Virgin Islands Malaysia Somalia
Cayman Islands Maldives South Africa
Cook Islands Malta Spain
Costa Rica Marshall Islands Switzerland
Cyprus Mauritius Taiwan
Dominica Monaco Tonga
Germany Montserrat Turks and Caicos Islands
Gibraltar Nauru United Arab Emirates
Grenada Netherlands United Kingdom
Guernsey Netherlands Antilles United States
Hong Kong SAR Niue Uruguay
Hungary Northern Mariana Islands US Virgin Islands
Iceland Palau Vanuatu
Appendix Table 2. Secrecy Jurisdictions
*Australia and Japan are not Secrecy Jurisdictions according to TJN, but since they are both classified as Points of Absorption, we include estimates of their non-resident deposits in this study.
Source: Tax Justice Network, 2007, Identifying Tax Havens and Offshore Finance Centers
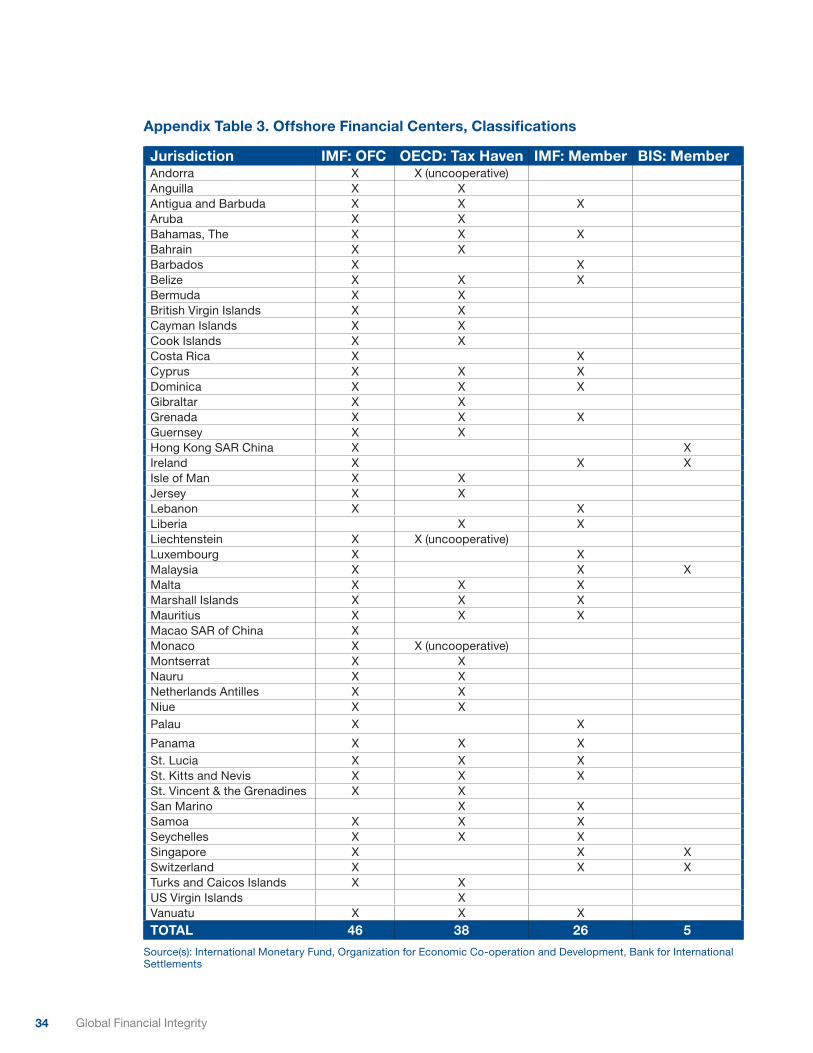
34 Global Financial Integrity
Jurisdiction IMF: OFC OECD: Tax Haven IMF: Member BIS: MemberAndorra X X (uncooperative) Anguilla X X Antigua and Barbuda X X X Aruba X X Bahamas, The X X X Bahrain X X Barbados X X Belize X X X Bermuda X X British Virgin Islands X X Cayman Islands X X Cook Islands X X Costa Rica X X Cyprus X X X Dominica X X X Gibraltar X X Grenada X X X Guernsey X X Hong Kong SAR China X XIreland X X XIsle of Man X X Jersey X X Lebanon X X Liberia X X Liechtenstein X X (uncooperative) Luxembourg X X Malaysia X X XMalta X X X Marshall Islands X X X Mauritius X X X Macao SAR of China X Monaco X X (uncooperative) Montserrat X X Nauru X X Netherlands Antilles X X Niue X X Palau X X
Panama X X X St. Lucia X X X St. Kitts and Nevis X X X St. Vincent & the Grenadines X X San Marino X X Samoa X X X Seychelles X X X Singapore X X XSwitzerland X X XTurks and Caicos Islands X X US Virgin Islands X Vanuatu X X X
TOTAL 46 38 26 5
Source(s): International Monetary Fund, Organization for Economic Co-operation and Development, Bank for International Settlements
Appendix Table 3. Offshore Financial Centers, Classifications
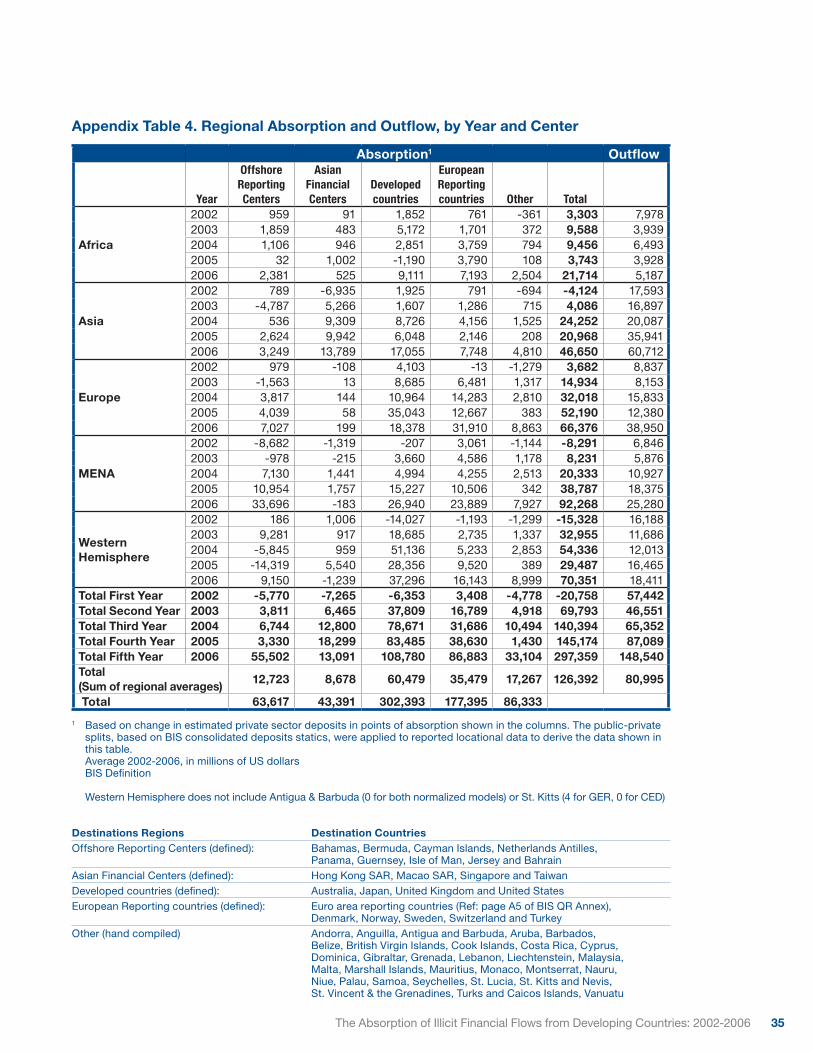
35The Absorption of Illicit Financial Flows from Developing Countries: 2002-2006
Appendix Table 4. Regional Absorption and Outflow, by Year and Center
1 Based on change in estimated private sector deposits in points of absorption shown in the columns. The public-private splits, based on BIS consolidated deposits statics, were applied to reported locational data to derive the data shown in this table. Average 2002-2006, in millions of US dollars BIS Definition Western Hemisphere does not include Antigua & Barbuda (0 for both normalized models) or St. Kitts (4 for GER, 0 for CED)
Destinations Regions Destination CountriesOffshore Reporting Centers (defined): Bahamas, Bermuda, Cayman Islands, Netherlands Antilles, Panama, Guernsey, Isle of Man, Jersey and BahrainAsian Financial Centers (defined): Hong Kong SAR, Macao SAR, Singapore and TaiwanDeveloped countries (defined): Australia, Japan, United Kingdom and United StatesEuropean Reporting countries (defined): Euro area reporting countries (Ref: page A5 of BIS QR Annex), Denmark, Norway, Sweden, Switzerland and TurkeyOther (hand compiled) Andorra, Anguilla, Antigua and Barbuda, Aruba, Barbados, Belize, British Virgin Islands, Cook Islands, Costa Rica, Cyprus, Dominica, Gibraltar, Grenada, Lebanon, Liechtenstein, Malaysia, Malta, Marshall Islands, Mauritius, Monaco, Montserrat, Nauru, Niue, Palau, Samoa, Seychelles, St. Lucia, St. Kitts and Nevis, St. Vincent & the Grenadines, Turks and Caicos Islands, Vanuatu
Absorption1 Outflow
Year
Offshore Reporting Centers
Asian Financial Centers
Developed countries
European Reporting countries Other Total
Africa
2002 959 91 1,852 761 -361 3,303 7,9782003 1,859 483 5,172 1,701 372 9,588 3,9392004 1,106 946 2,851 3,759 794 9,456 6,4932005 32 1,002 -1,190 3,790 108 3,743 3,9282006 2,381 525 9,111 7,193 2,504 21,714 5,187
Asia
2002 789 -6,935 1,925 791 -694 -4,124 17,5932003 -4,787 5,266 1,607 1,286 715 4,086 16,8972004 536 9,309 8,726 4,156 1,525 24,252 20,0872005 2,624 9,942 6,048 2,146 208 20,968 35,9412006 3,249 13,789 17,055 7,748 4,810 46,650 60,712
Europe
2002 979 -108 4,103 -13 -1,279 3,682 8,8372003 -1,563 13 8,685 6,481 1,317 14,934 8,1532004 3,817 144 10,964 14,283 2,810 32,018 15,8332005 4,039 58 35,043 12,667 383 52,190 12,3802006 7,027 199 18,378 31,910 8,863 66,376 38,950
MENA
2002 -8,682 -1,319 -207 3,061 -1,144 -8,291 6,8462003 -978 -215 3,660 4,586 1,178 8,231 5,8762004 7,130 1,441 4,994 4,255 2,513 20,333 10,9272005 10,954 1,757 15,227 10,506 342 38,787 18,3752006 33,696 -183 26,940 23,889 7,927 92,268 25,280
Western Hemisphere
2002 186 1,006 -14,027 -1,193 -1,299 -15,328 16,1882003 9,281 917 18,685 2,735 1,337 32,955 11,6862004 -5,845 959 51,136 5,233 2,853 54,336 12,0132005 -14,319 5,540 28,356 9,520 389 29,487 16,4652006 9,150 -1,239 37,296 16,143 8,999 70,351 18,411
Total First Year 2002 -5,770 -7,265 -6,353 3,408 -4,778 -20,758 57,442Total Second Year 2003 3,811 6,465 37,809 16,789 4,918 69,793 46,551Total Third Year 2004 6,744 12,800 78,671 31,686 10,494 140,394 65,352Total Fourth Year 2005 3,330 18,299 83,485 38,630 1,430 145,174 87,089Total Fifth Year 2006 55,502 13,091 108,780 86,883 33,104 297,359 148,540Total (Sum of regional averages)
12,723 8,678 60,479 35,479 17,267 126,392 80,995
Total 63,617 43,391 302,393 177,395 86,333
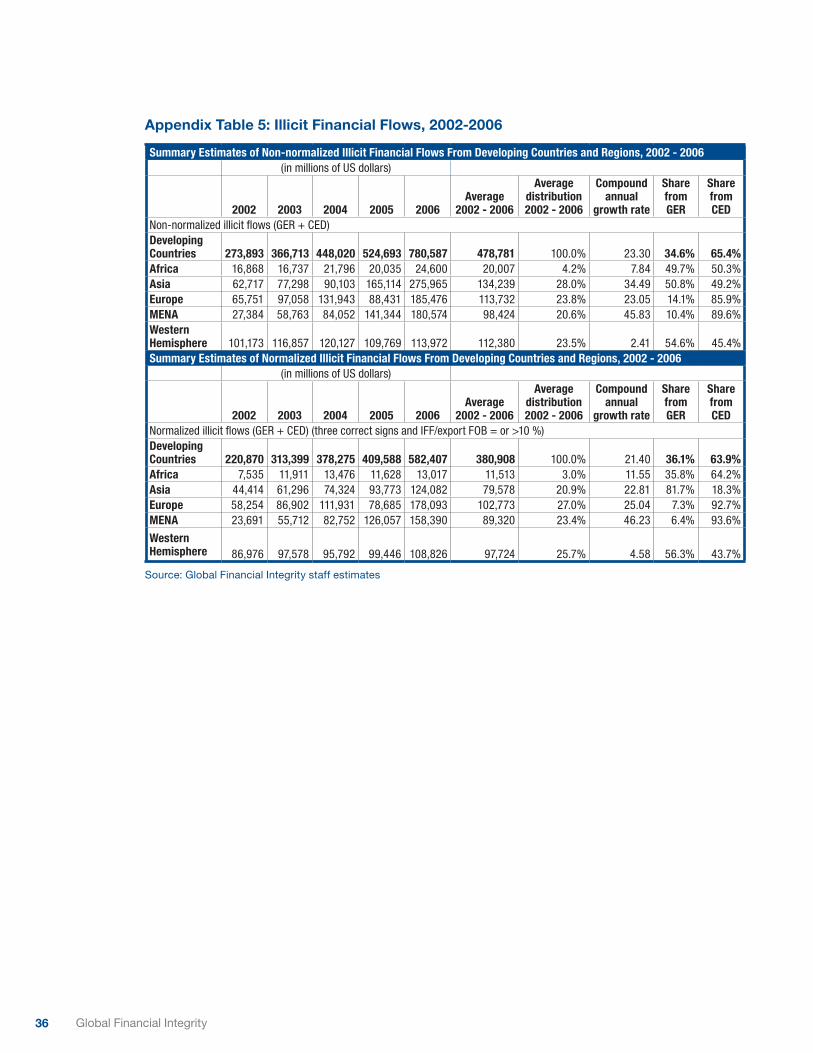
36 Global Financial Integrity
Appendix Table 5: Illicit Financial Flows, 2002-2006
Summary Estimates of Non-normalized Illicit Financial Flows From Developing Countries and Regions, 2002 - 2006 (in millions of US dollars)
2002 2003 2004 2005 2006Average
2002 - 2006
Average distribution 2002 - 2006
Compound annual
growth rate
Share from GER
Share from CED
Non-normalized illicit flows (GER + CED)Developing Countries 273,893 366,713 448,020 524,693 780,587 478,781 100.0% 23.30 34.6% 65.4%Africa 16,868 16,737 21,796 20,035 24,600 20,007 4.2% 7.84 49.7% 50.3%Asia 62,717 77,298 90,103 165,114 275,965 134,239 28.0% 34.49 50.8% 49.2%Europe 65,751 97,058 131,943 88,431 185,476 113,732 23.8% 23.05 14.1% 85.9%MENA 27,384 58,763 84,052 141,344 180,574 98,424 20.6% 45.83 10.4% 89.6%Western Hemisphere 101,173 116,857 120,127 109,769 113,972 112,380 23.5% 2.41 54.6% 45.4%Summary Estimates of Normalized Illicit Financial Flows From Developing Countries and Regions, 2002 - 2006 (in millions of US dollars)
2002 2003 2004 2005 2006Average
2002 - 2006
Average distribution 2002 - 2006
Compound annual
growth rate
Share from GER
Share from CED
Normalized illicit flows (GER + CED) (three correct signs and IFF/export FOB = or >10 %)Developing Countries 220,870 313,399 378,275 409,588 582,407 380,908 100.0% 21.40 36.1% 63.9%Africa 7,535 11,911 13,476 11,628 13,017 11,513 3.0% 11.55 35.8% 64.2%Asia 44,414 61,296 74,324 93,773 124,082 79,578 20.9% 22.81 81.7% 18.3%Europe 58,254 86,902 111,931 78,685 178,093 102,773 27.0% 25.04 7.3% 92.7%MENA 23,691 55,712 82,752 126,057 158,390 89,320 23.4% 46.23 6.4% 93.6%
Western Hemisphere 86,976 97,578 95,792 99,446 108,826 97,724 25.7% 4.58 56.3% 43.7%
Source: Global Financial Integrity staff estimates

A Program of the Center for International Policy
1319 18th Street, NW, Suite 200 | Washington, DC | 20036Tel. +1 (202) 293-0740 | Fax. +1 (202) 293-1720 | www.gfip.org
Director: Raymond Baker, Managing Director: Tom CardamoneAdvisory Board: Charles Davidson (Chair), Jack Blum, Lord Daniel Brennan, Francis Fukuyama,
John Heimann, Ken Jensen, Eva Joly, David Landes, Krishen Mehta, Robert Morganthau, Moisés Naím, Ngozi Okonjo-Iweala, Thomas Pogge, John Whitehead
Recommended


![ENERGY&RETROFIT&SCENARIOS:& MATERIAL&FLOWS… · ∑&Total&Flows&(in/out)& 40t & 30km& 50km& Volume [m³] Weight [t] Scenarios X Z X Z ∑Outflows 9 143 1,880 247,338 ∑Inflows 50](https://img.pdfslide.us/doc/110x75/607fd31081f11b5d5c7b88d5/energyretrofitscenarios-materialflows-atotalflowsinout.jpg)