THE 5 BIGGEST EA CHALLENGES SOLVED WITH REAL-TIME METRICS
Dominik Rose, LeanIX
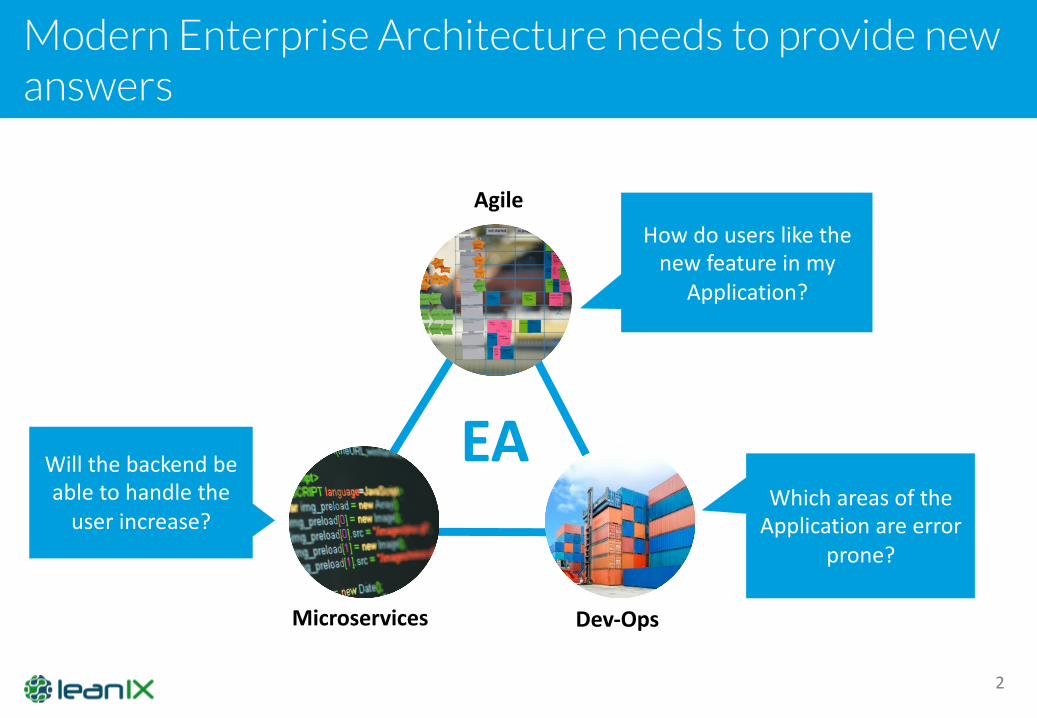
Modern Enterprise Architecture needs to provide new answers
2
Agile
Microservices Dev-‐Ops
EA
How do users like the new feature in my
Application?
Will the backend be able to handle the user increase?
Which areas of the Application are error
prone?
3
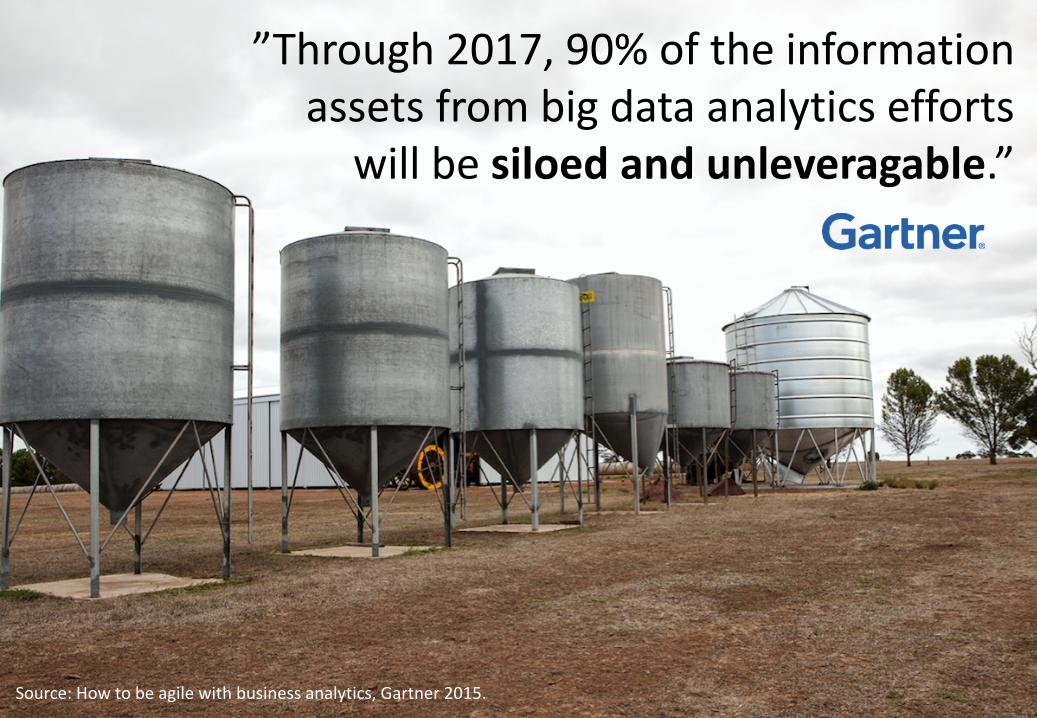
”Through 2017, 90% of the information assets from big data analytics efforts will be siloed and unleveragable.”
Source: How to be agile with business analytics, Gartner 2015.
4
LeanIX Metrics takes Enterprise Architecture to thenext level
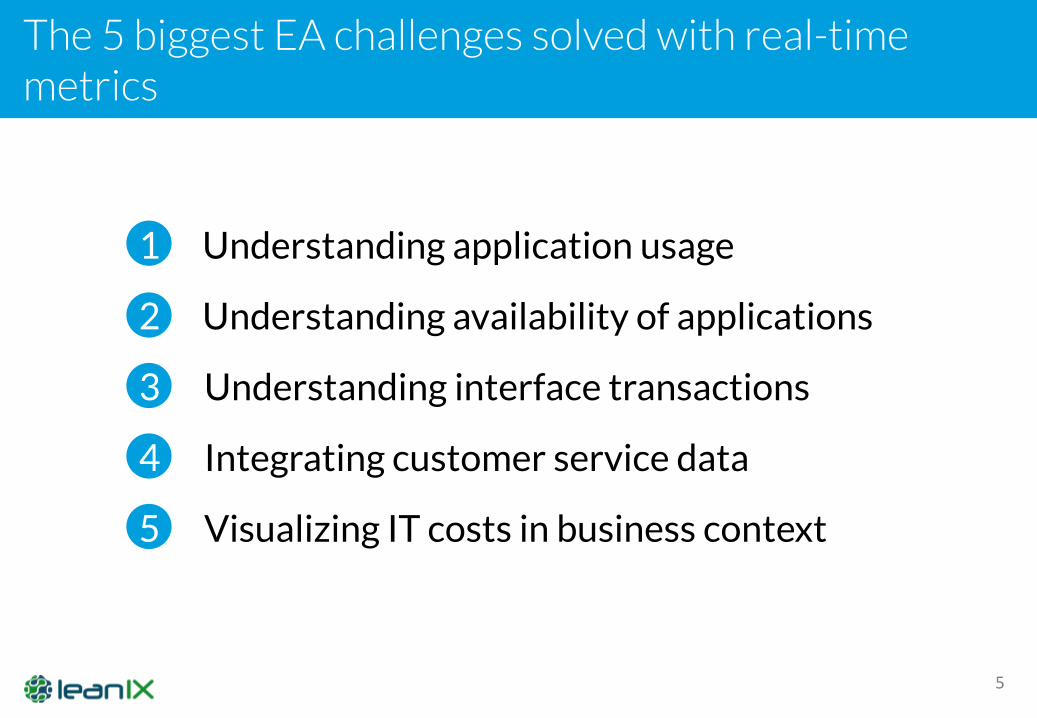
The 5 biggest EA challenges solved with real-time metrics
5
Understanding availability of applications
1
2
3
4
5
Understanding interface transactions
Understanding application usage
Integrating customer service data
Visualizing IT costs in business context

6
Understanding application usage
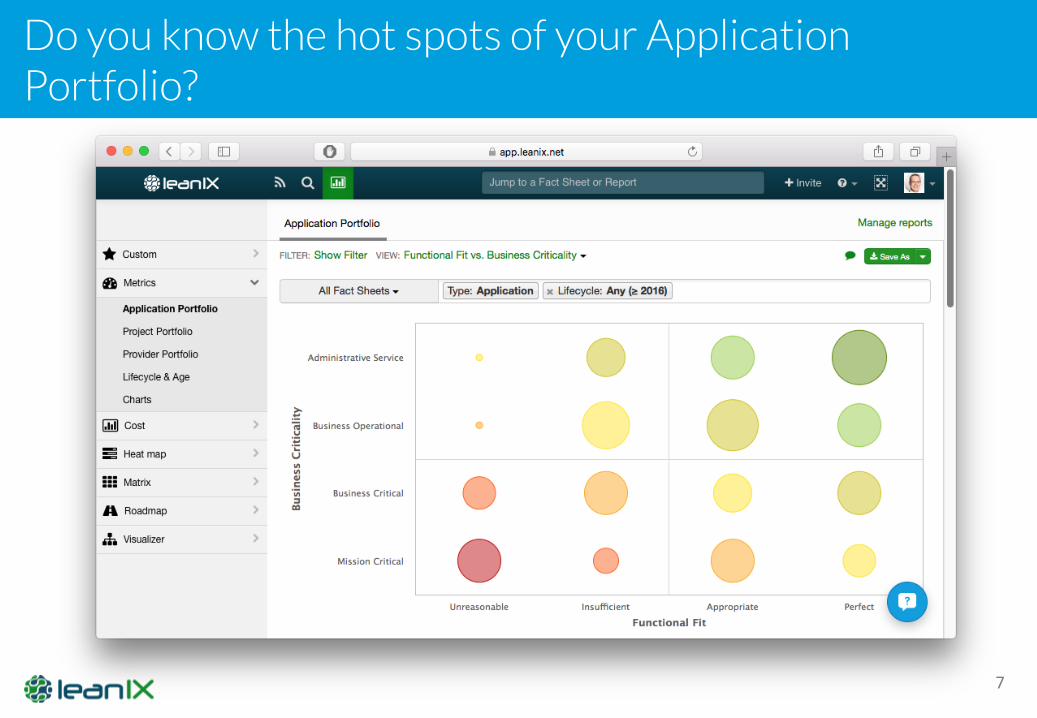
Do you know the hot spots of your Application Portfolio?
7
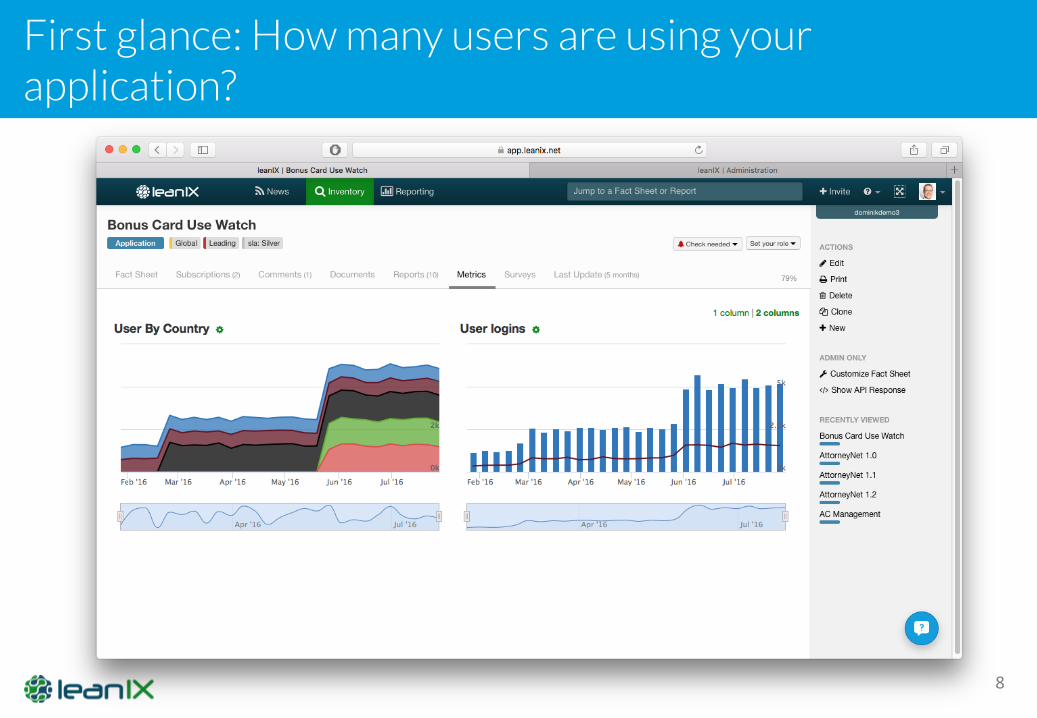
First glance: How many users are using your application?
8
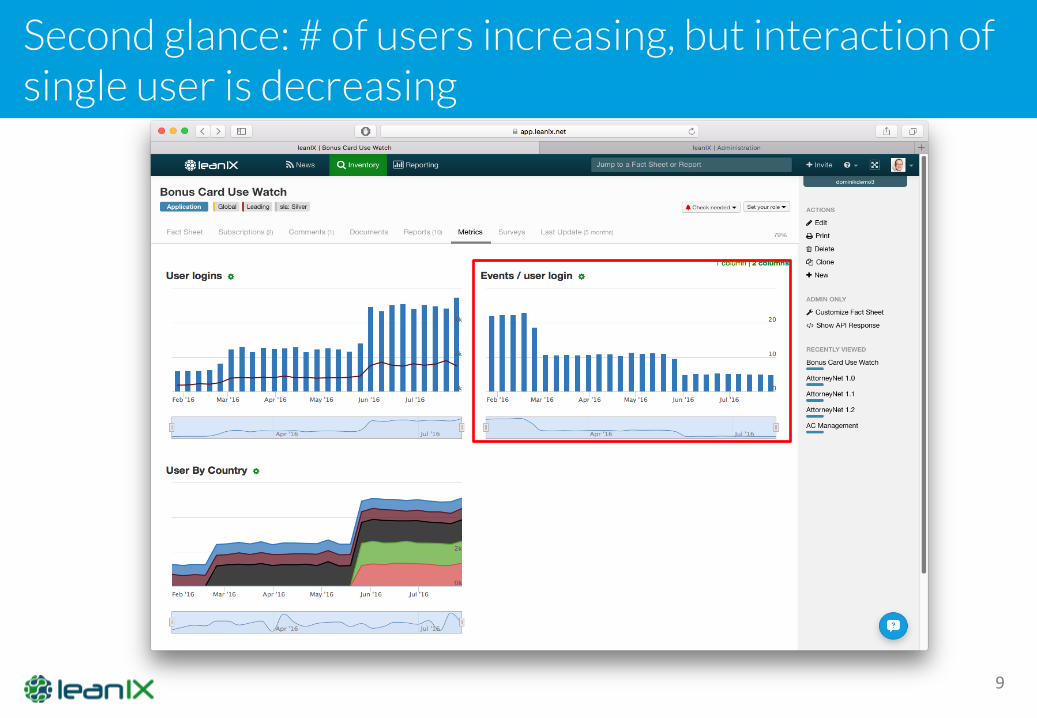
Second glance: # of users increasing, but interaction of single user is decreasing
9
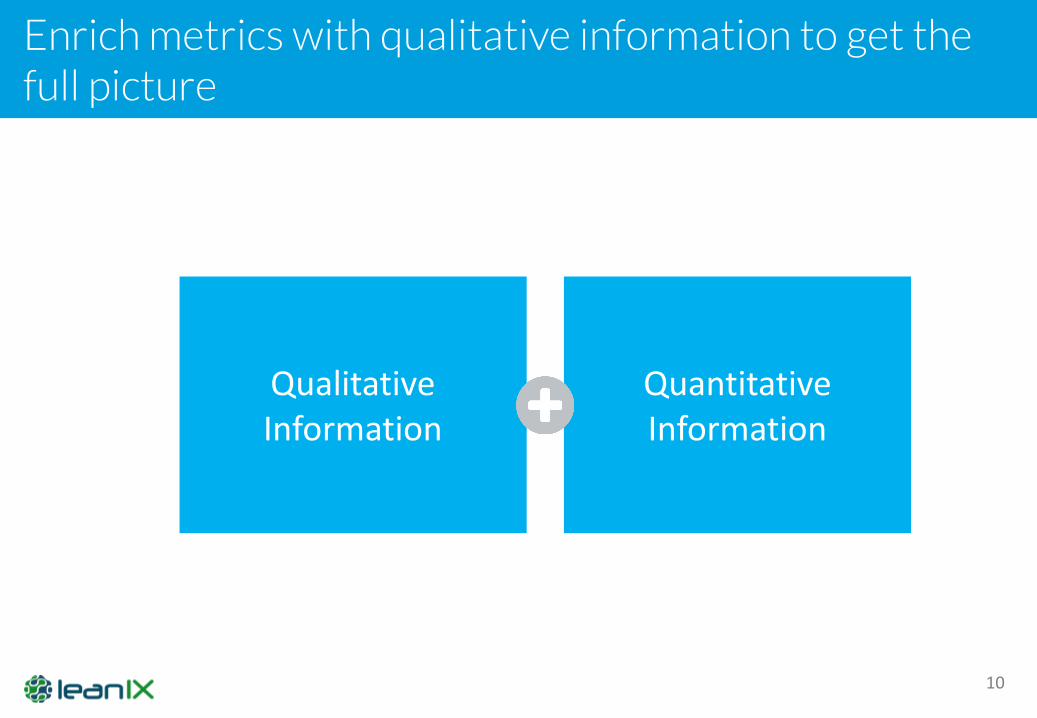
QualitativeInformation
QuantitativeInformation
Enrich metrics with qualitative information to get the full picture
10
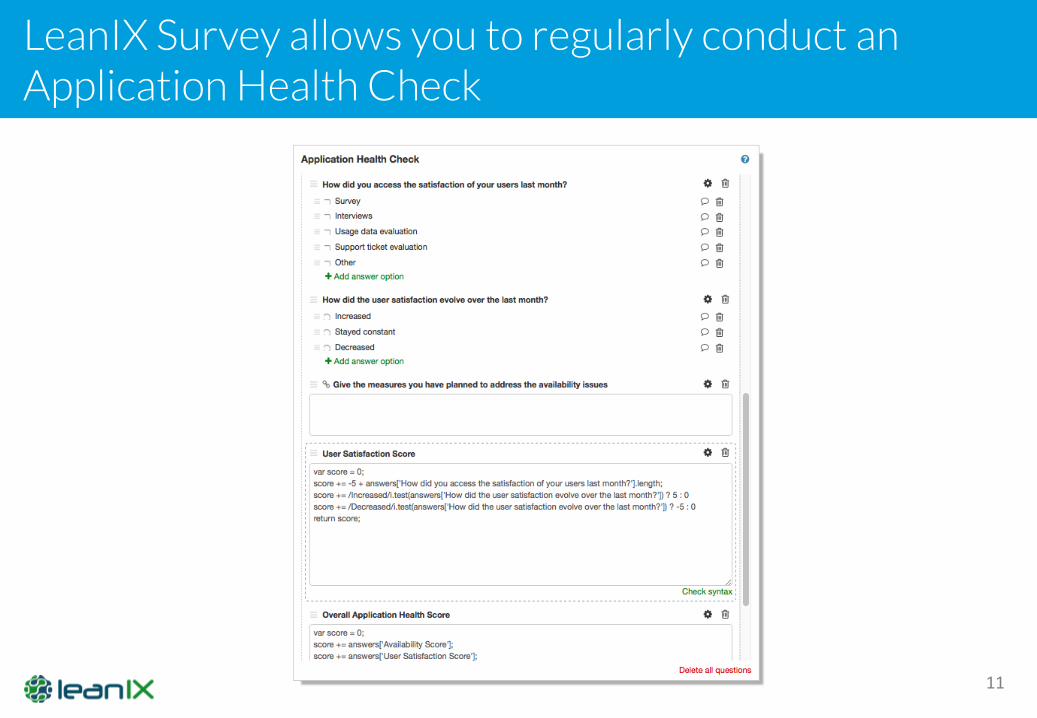
LeanIX Survey allows you to regularly conduct an Application Health Check
11
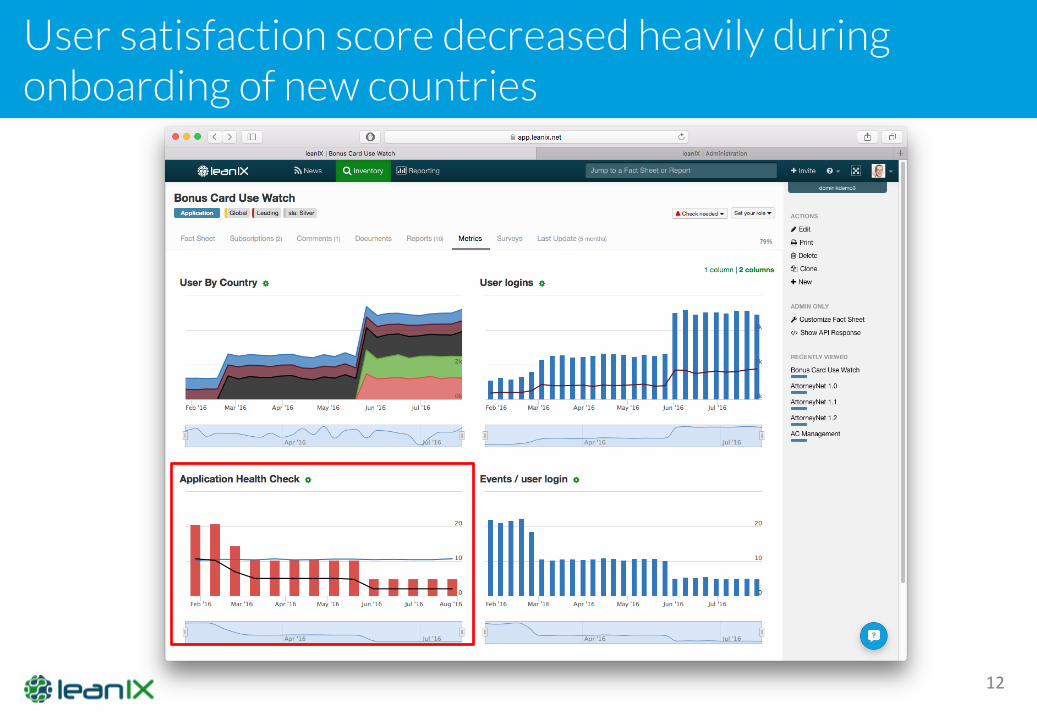
User satisfaction score decreased heavily during onboarding of new countries
12
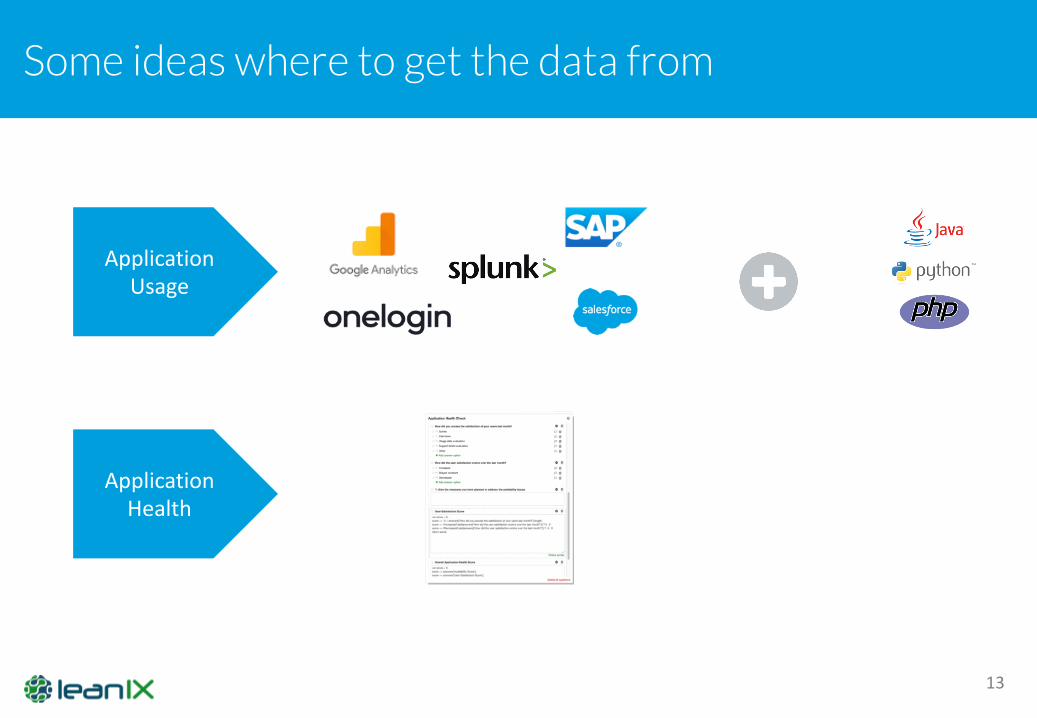
Some ideas where to get the data from
13
Application Usage
Application Health

14
Understanding availability of applications
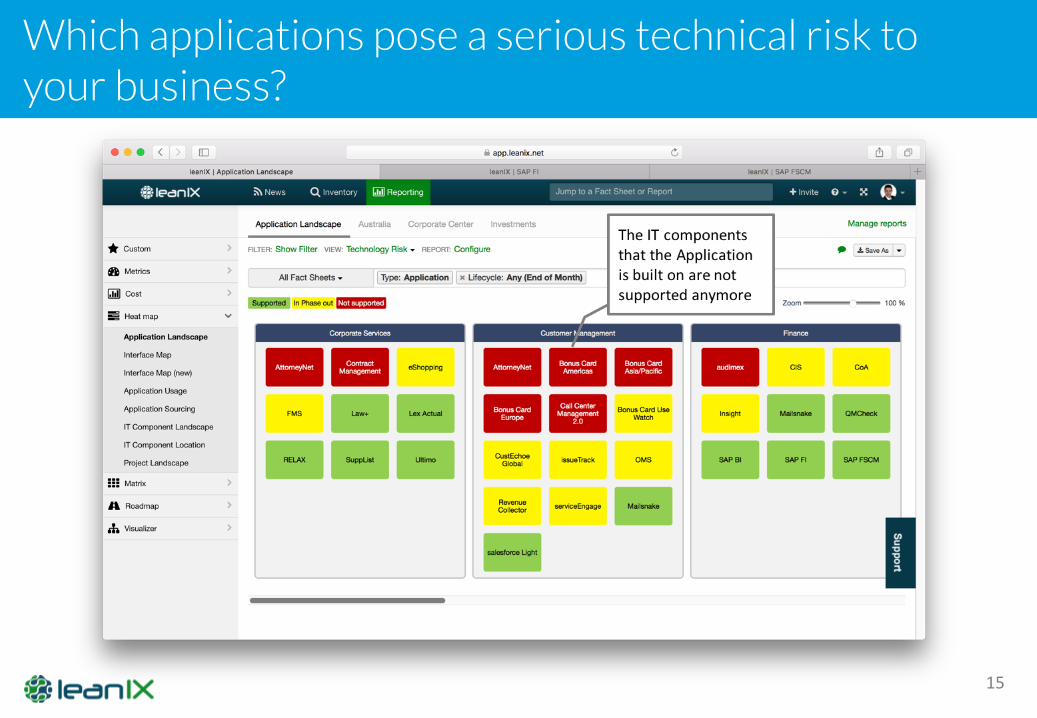
Which applications pose a serious technical risk to your business?
15
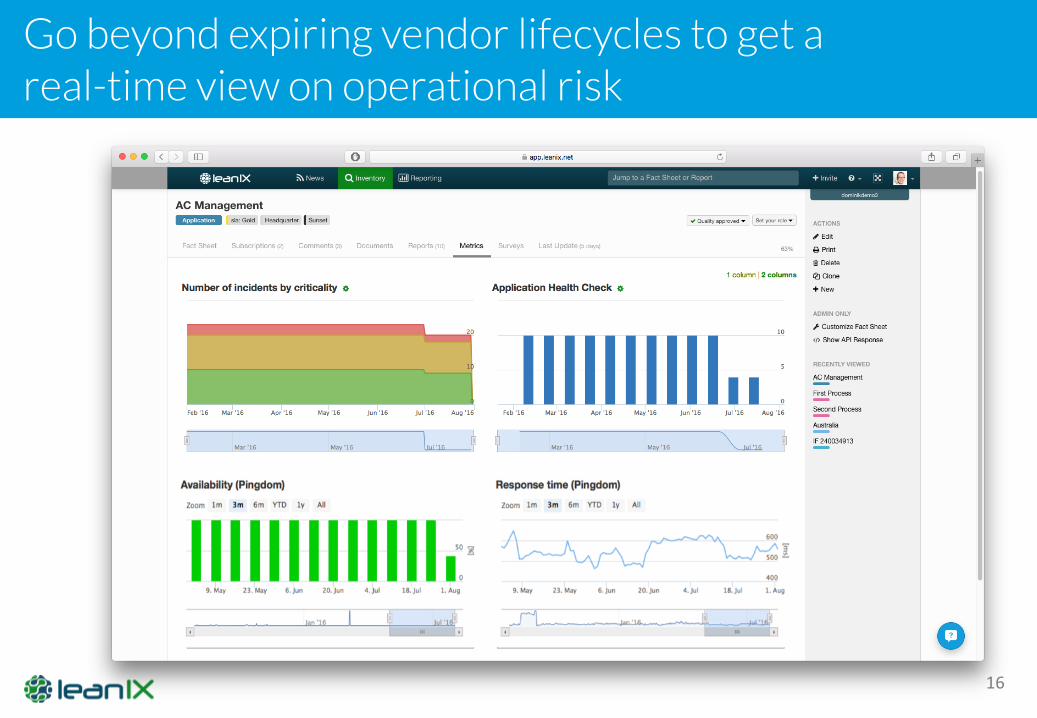
Go beyond expiring vendor lifecycles to get a real-time view on operational risk
16
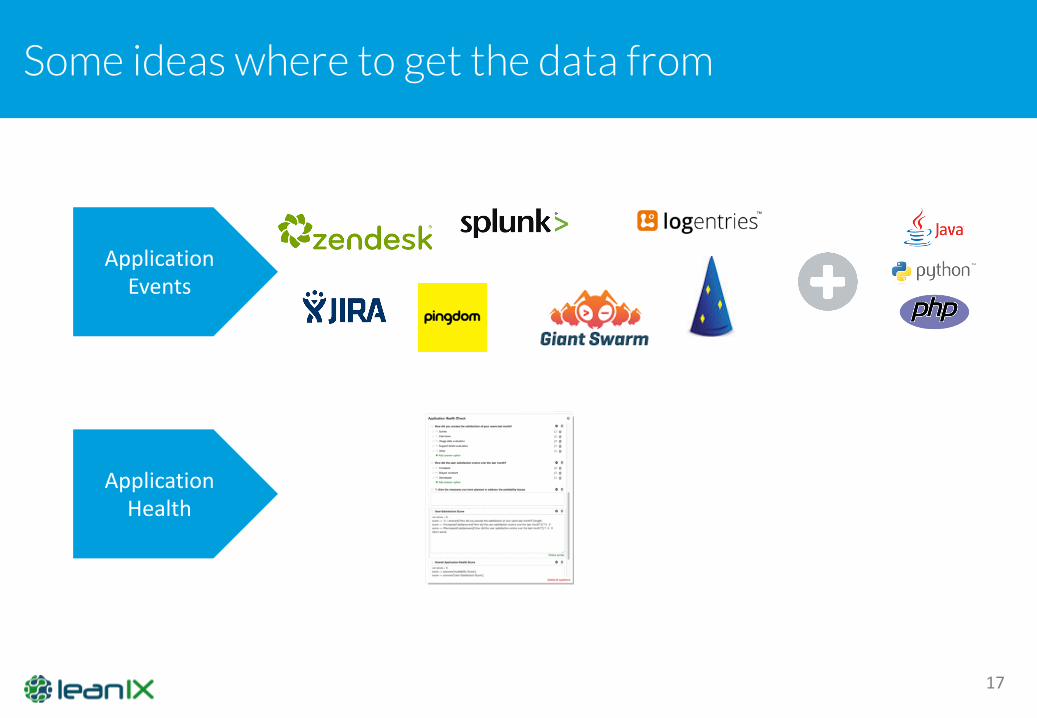
Some ideas where to get the data from
17
Application Events
Application Health

18
Understanding interface transactions
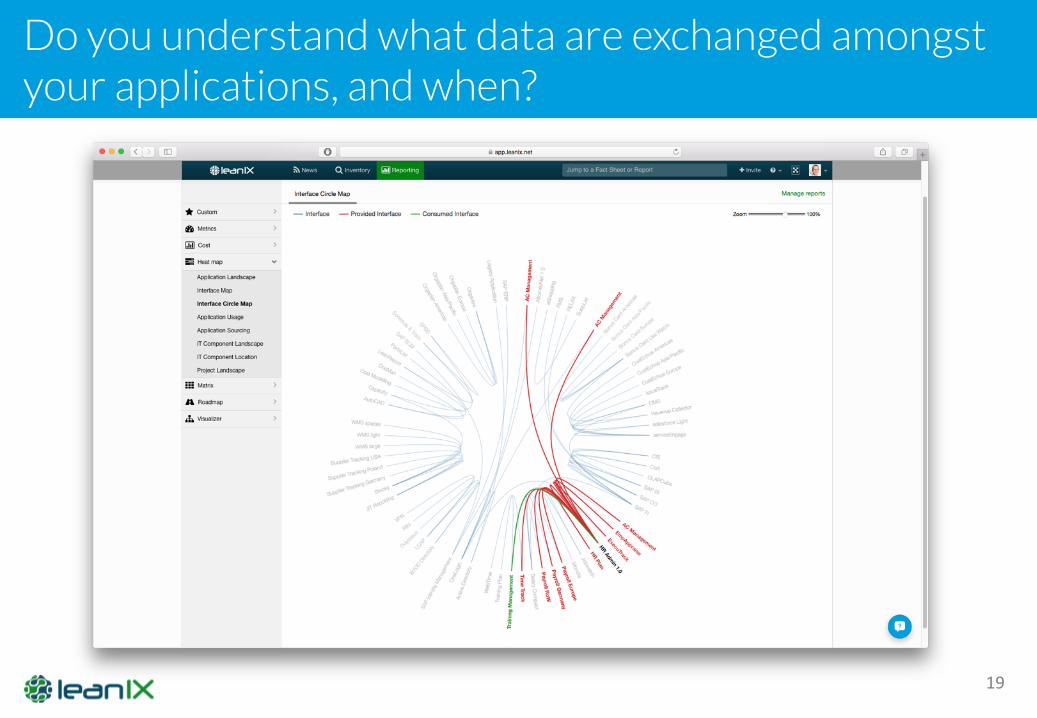
Do you understand what data are exchanged amongst your applications, and when?
19
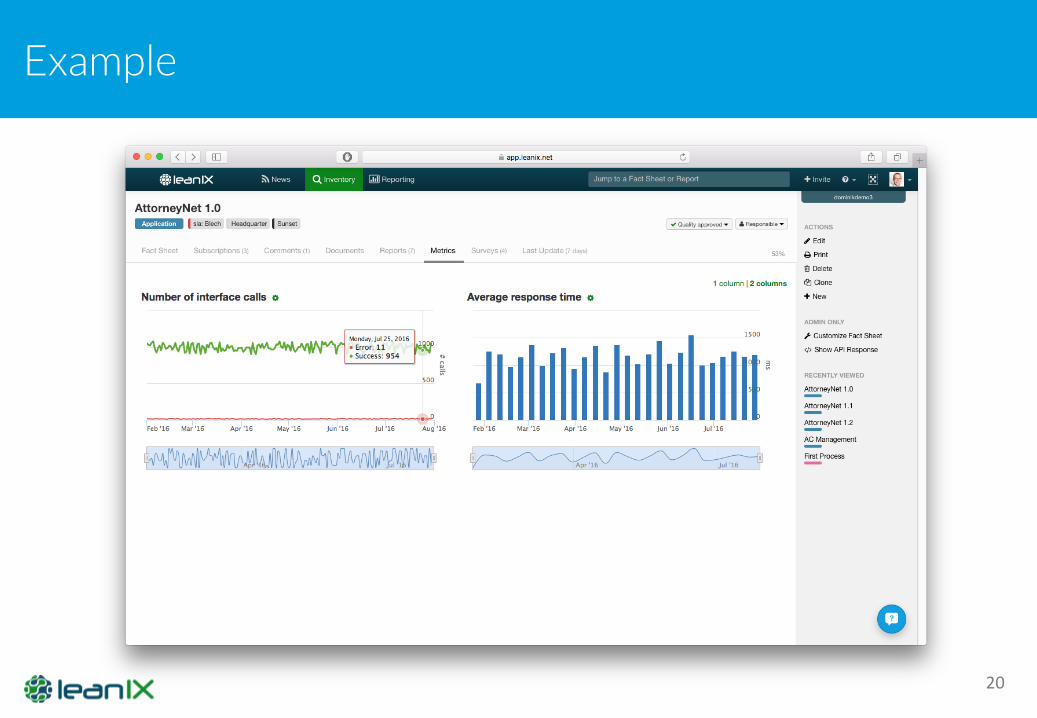
Example
20
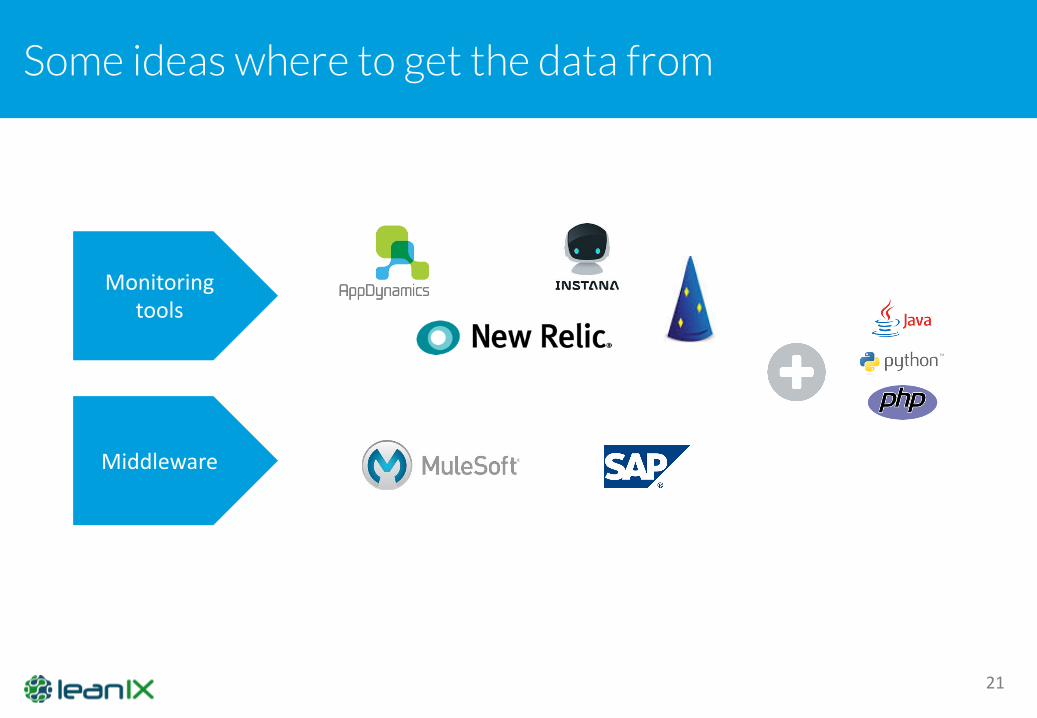
Some ideas where to get the data from
21
Monitoring tools
Middleware
22
Integrating customer service data
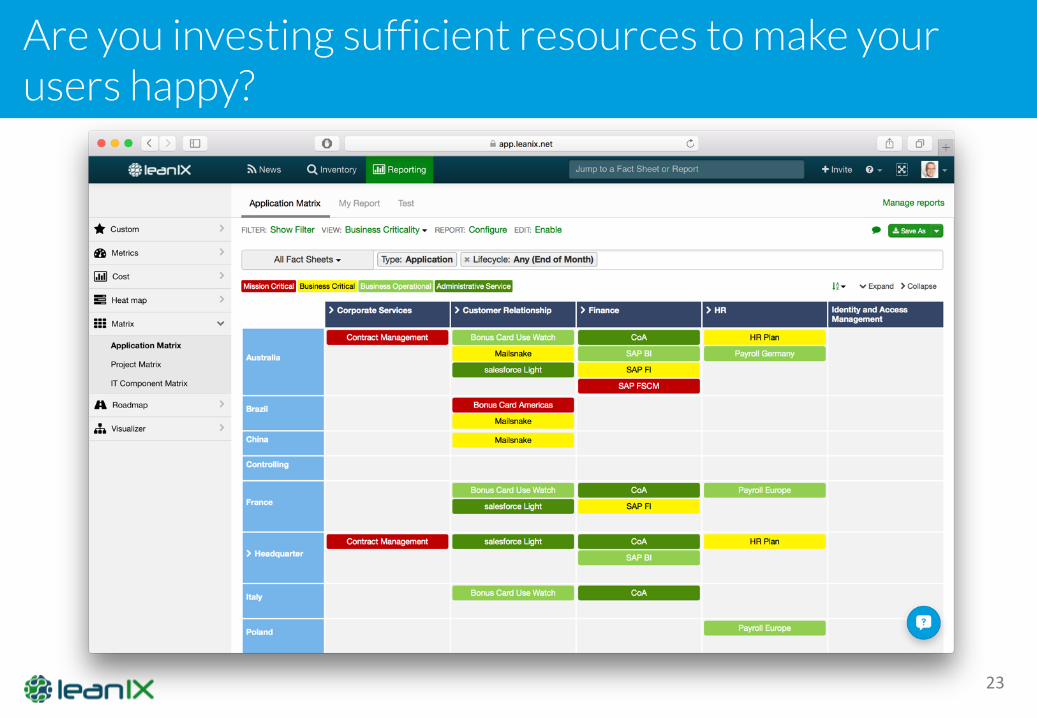
Are you investing sufficient resources to make your users happy?
23
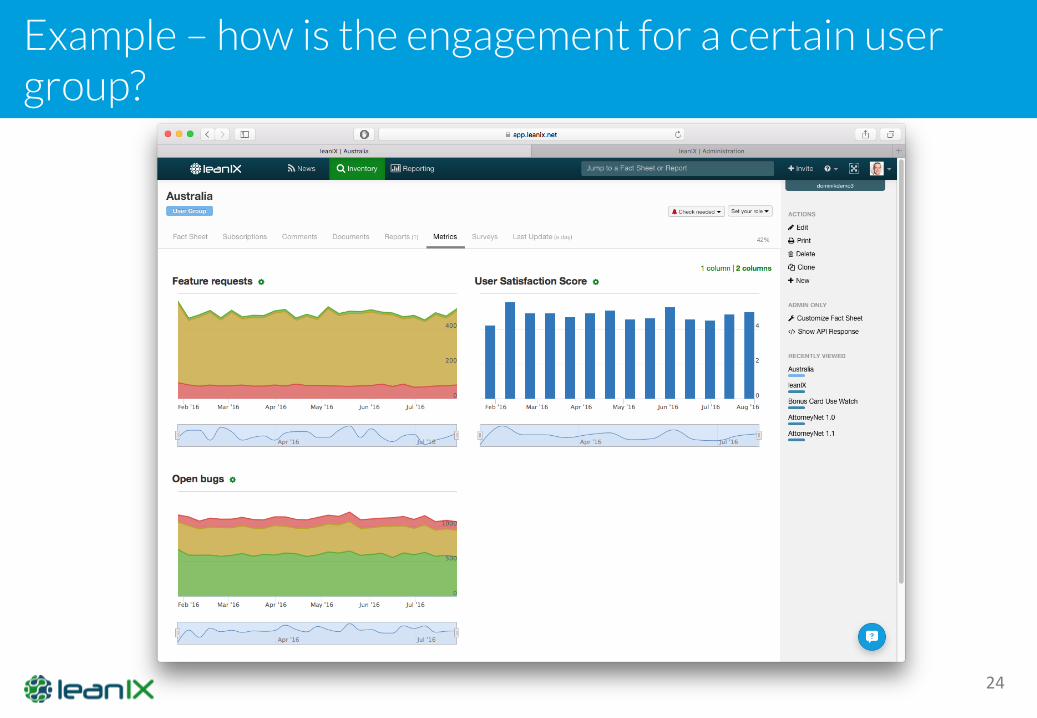
Example – how is the engagement for a certain user group?
24
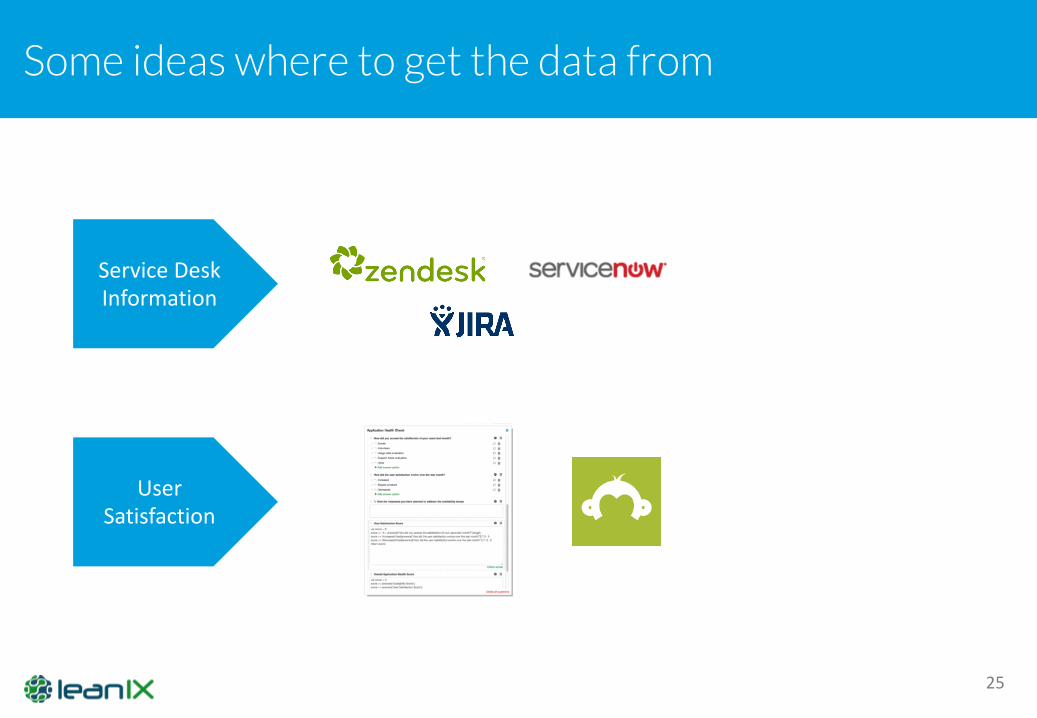
Some ideas where to get the data from
25
Service Desk Information
User Satisfaction

26
Vizualizing IT costs in business context
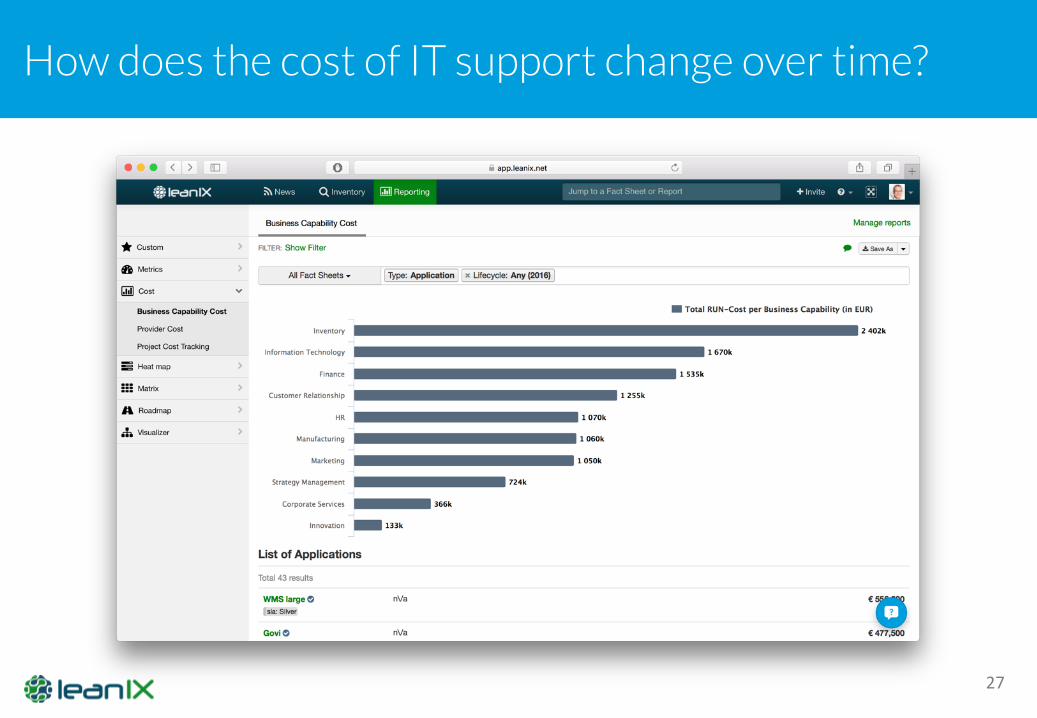
How does the cost of IT support change over time?
27
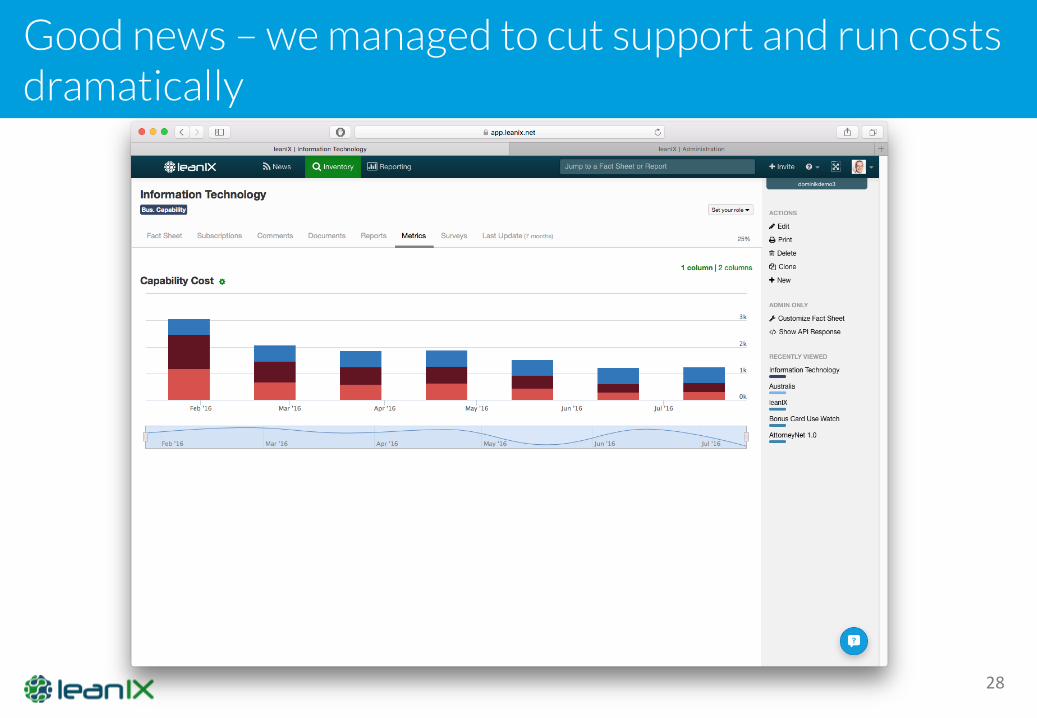
Good news – we managed to cut support and run costs dramatically
28
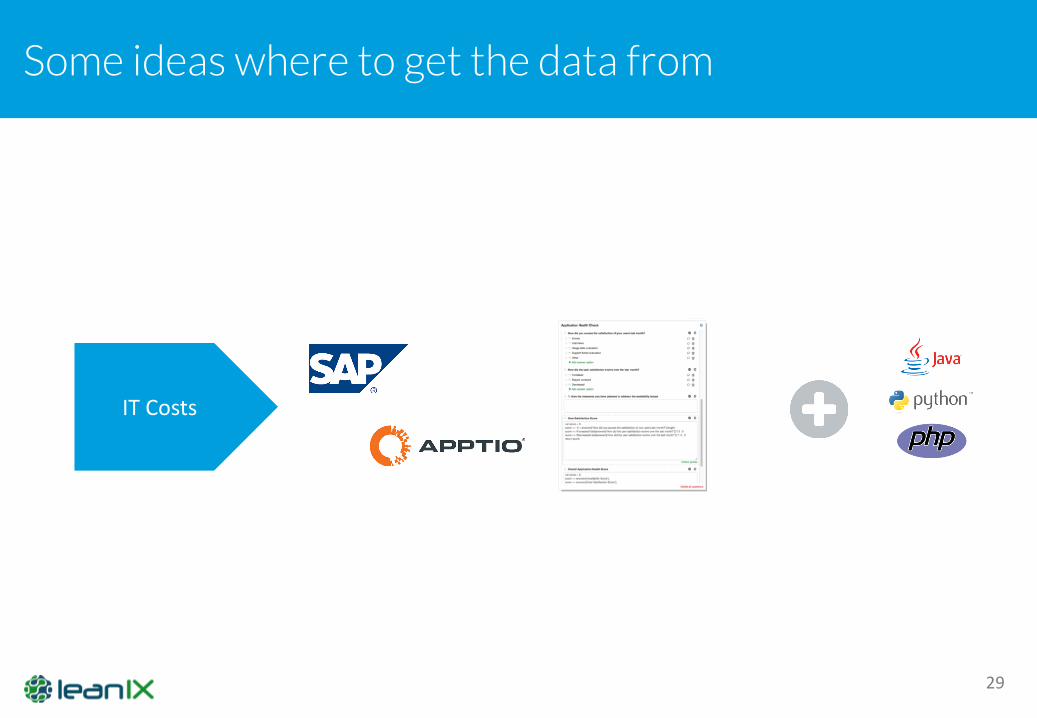
Some ideas where to get the data from
29
IT Costs

30
The four steps how to create your metric
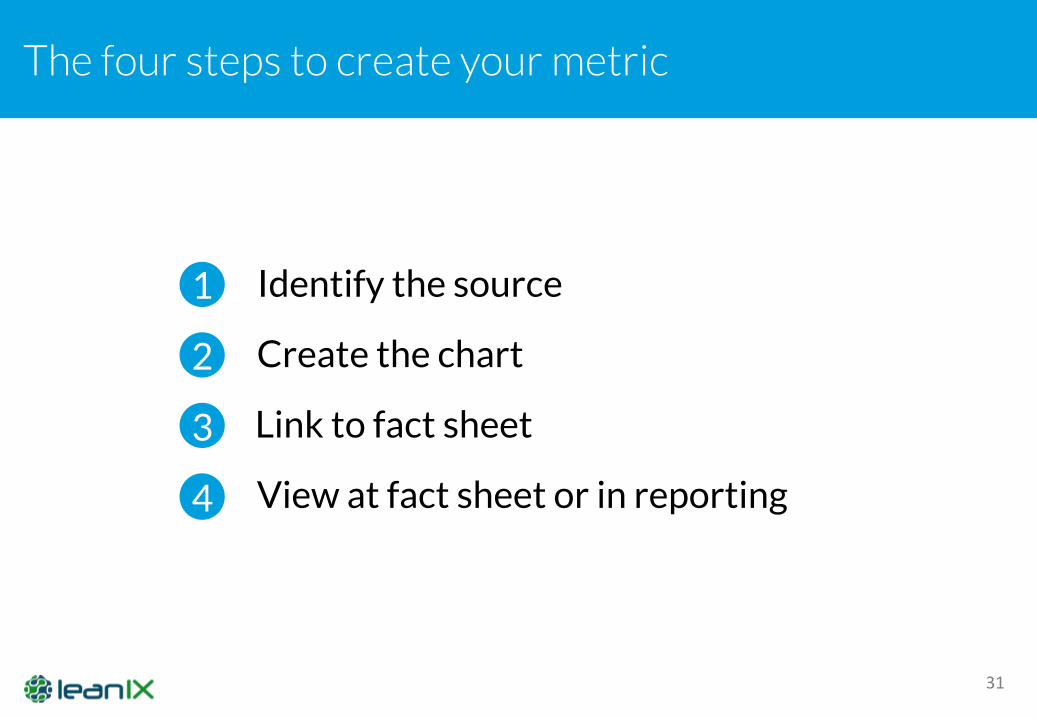
The four steps to create your metric
31
Link to fact sheet
1
2
3
4
Create the chart
Identify the source
View at fact sheet or in reporting
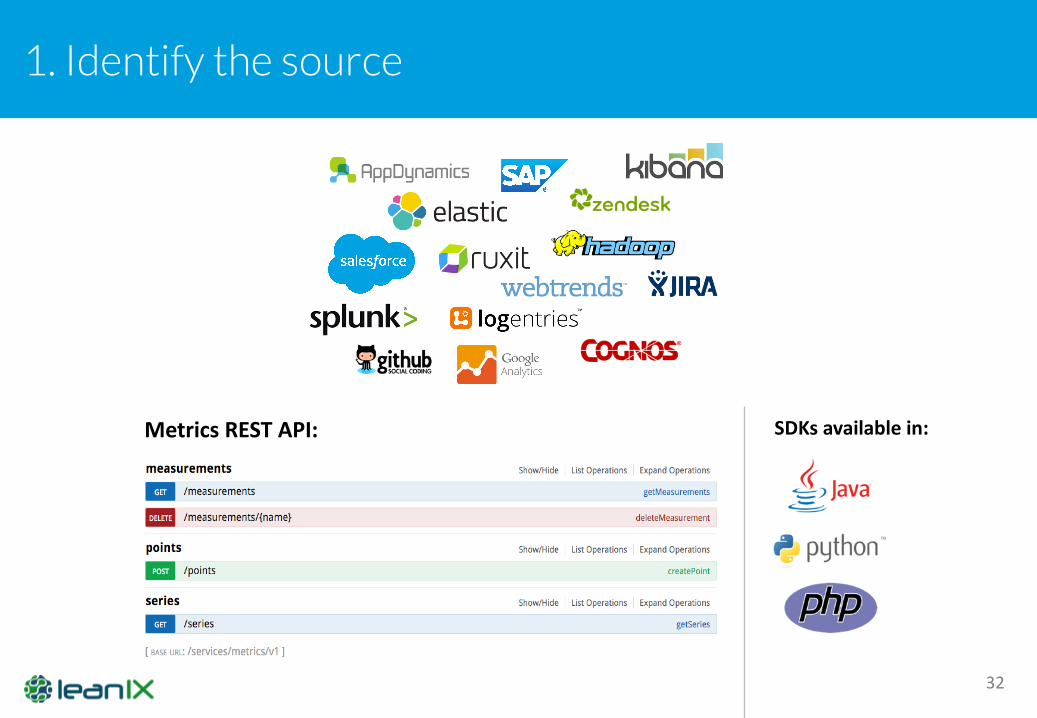
1. Identify the source
32
Metrics REST API: SDKs available in:
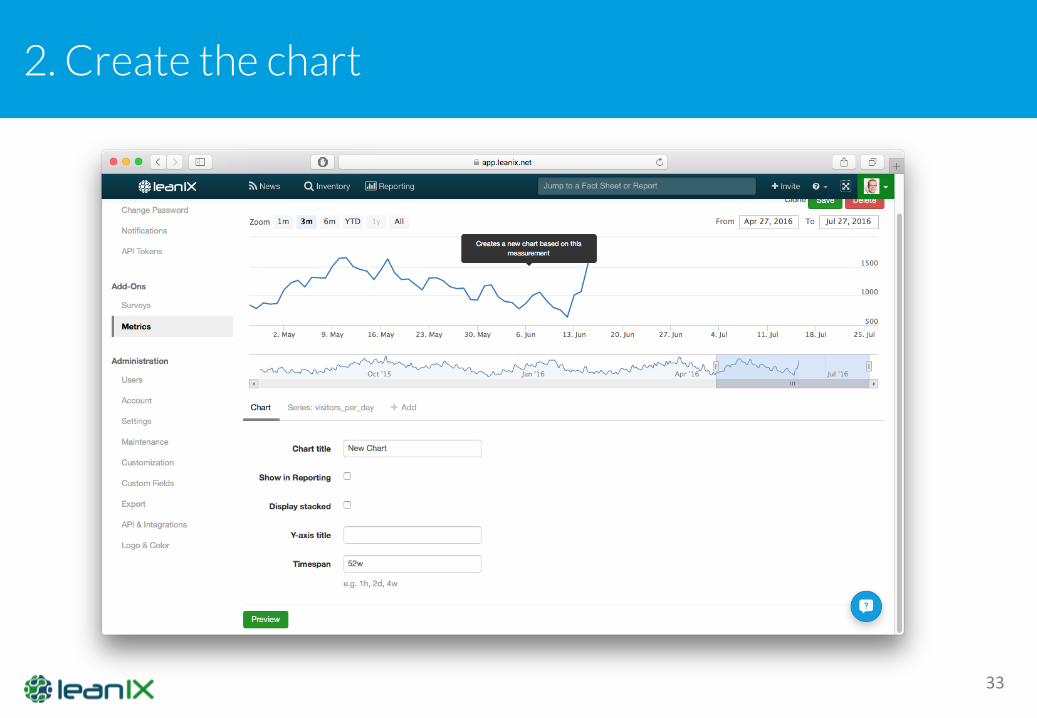
2. Create the chart
33
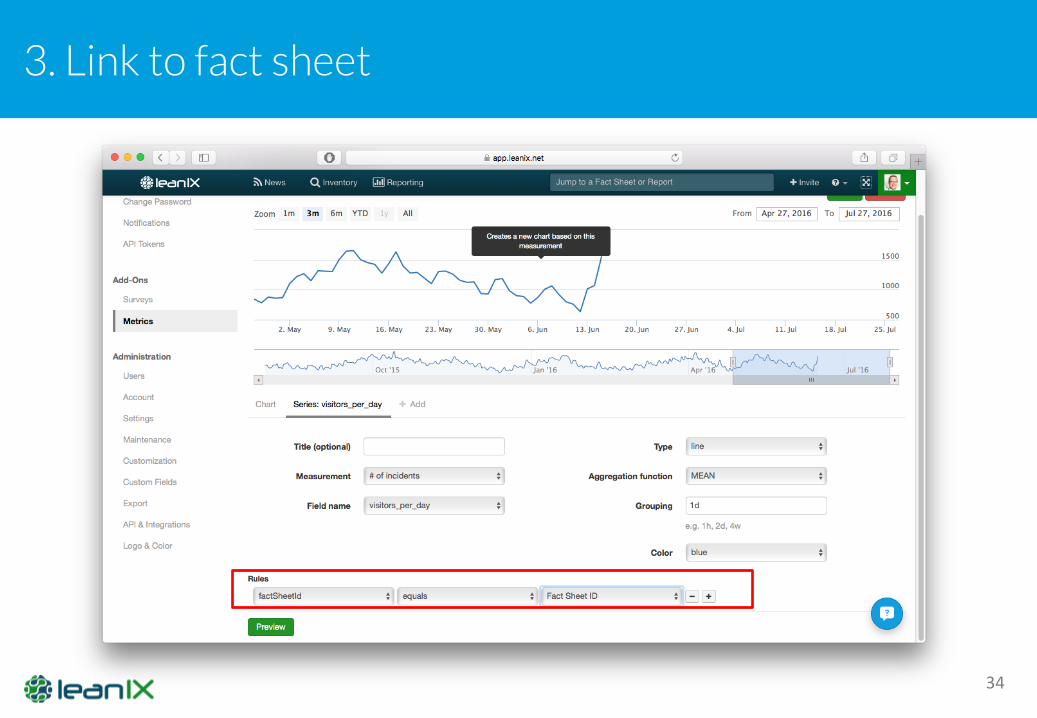
3. Link to fact sheet
34
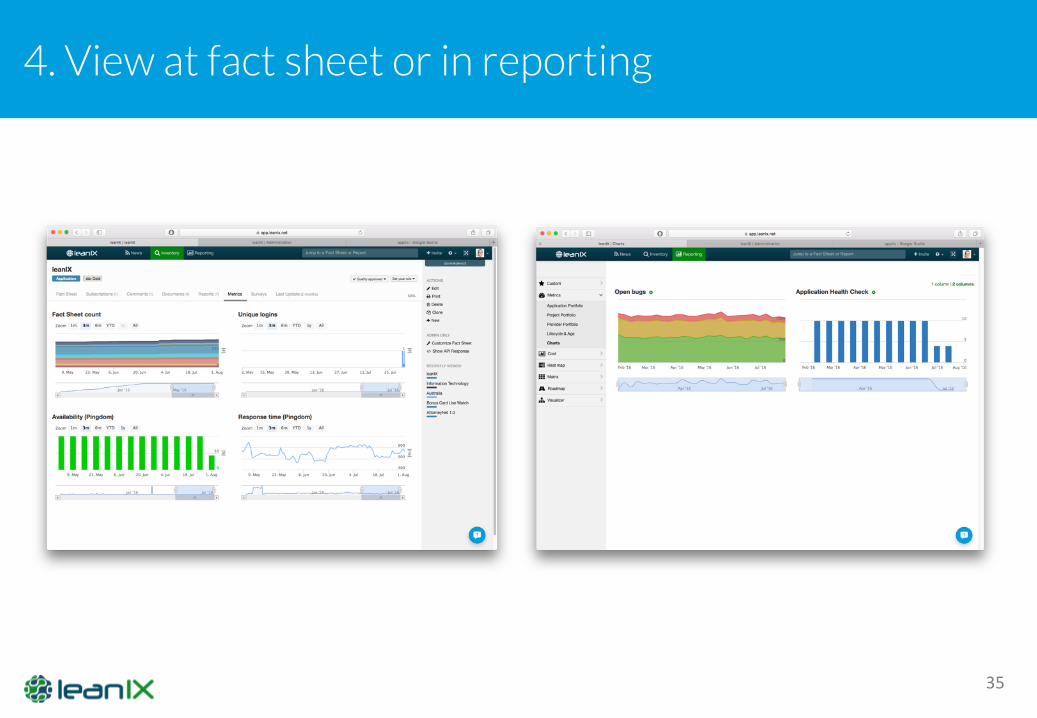
4. View at fact sheet or in reporting
35
FAQ
36
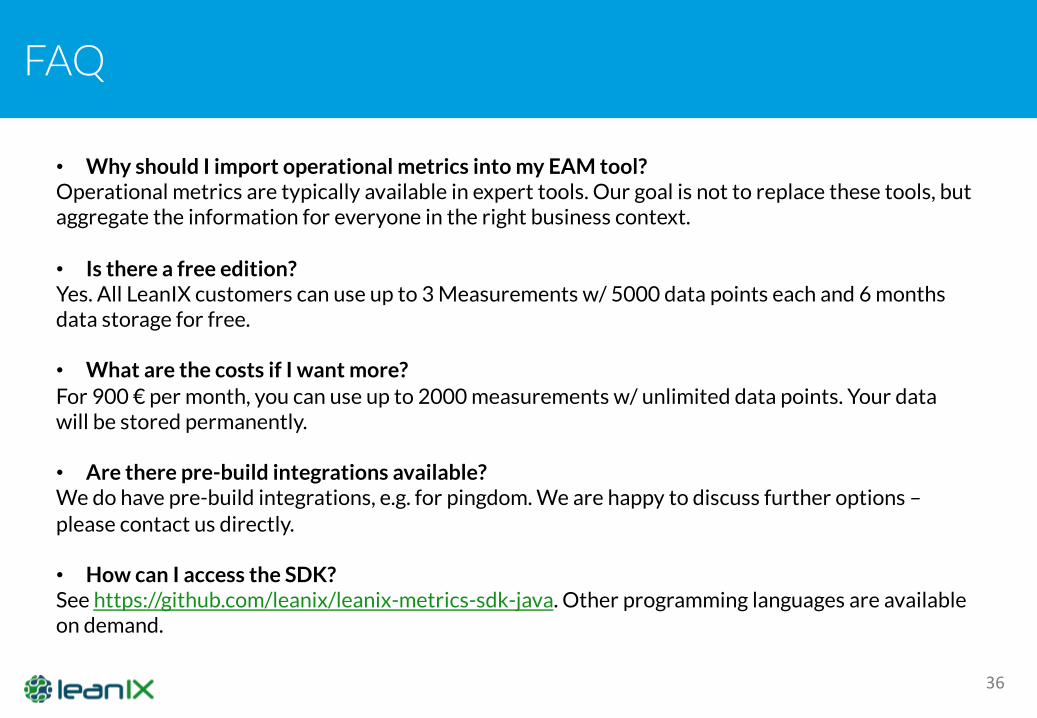
• Why should I import operational metrics into my EAM tool?Operational metrics are typically available in expert tools. Our goal is not to replace these tools, but aggregate the information for everyone in the right business context.
• Is there a free edition?Yes. All LeanIX customers can use up to 3 Measurements w/ 5000 data points each and 6 months data storage for free.
• What are the costs if I want more?For 900 € per month, you can use up to 2000 measurements w/ unlimited data points. Your data will be stored permanently.
• Are there pre-build integrations available?We do have pre-build integrations, e.g. for pingdom. We are happy to discuss further options –please contact us directly.
• How can I access the SDK?See https://github.com/leanix/leanix-metrics-sdk-java. Other programming languages are available on demand.
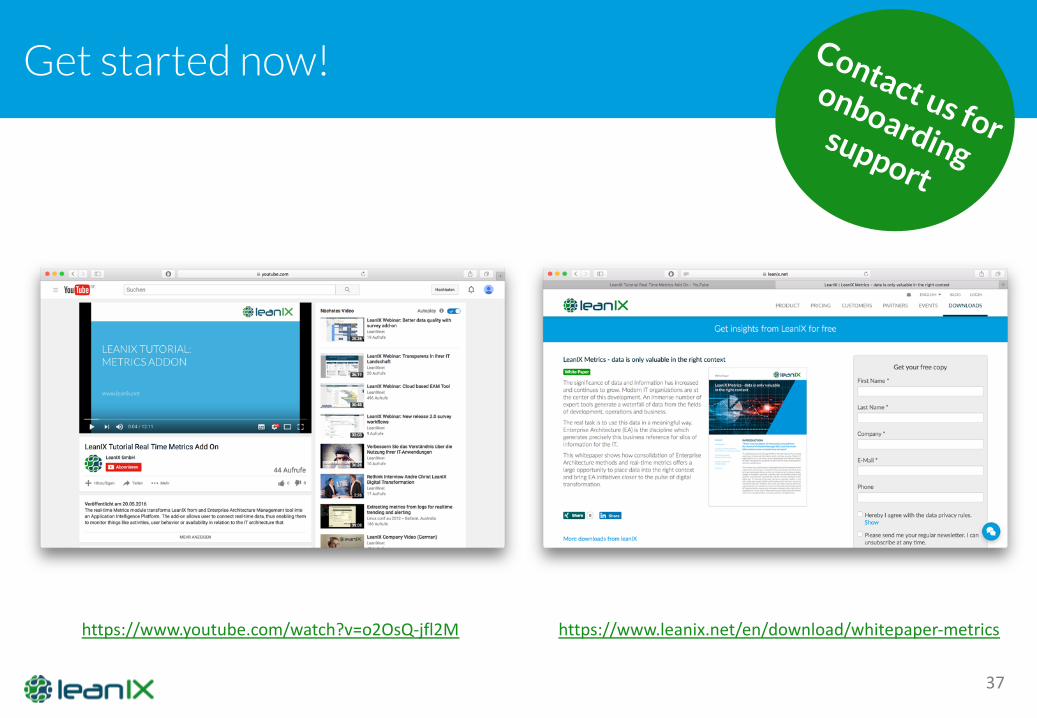
Get started now!
37
https://www.leanix.net/en/download/whitepaper-‐metricshttps://www.youtube.com/watch?v=o2OsQ-‐jfl2M

38
with speakers from …
3. LeanIX EA Connect Day
à http://berlin2016.leanix.net
6th Oct 2016 - Zalando Innovation Lab, Mollstrasse 1, Berlin
Recommended