Congressional Budget Office
The 2016 Budget Outlook
Presentation at thePeter G. Peterson Foundation’s
2016 Fiscal SummitWashington, D.C.
May 11, 2016
Keith HallDirector
This presentation draws on Updated Budget Projections: 2016 to 2026 (March 2016), www.cbo.gov/publication/51384, Budgetary and Economic Outcomes Under Paths for Federal Revenues and Noninterest Spending Specified by Chairman Price, March 2016 (March 2016), www.cbo.gov/publication/51260, and The Budget and Economic Outlook: 2016 to 2026 (January 2016), www.cbo.gov/publication/51129.
1CO N G R ES S I O N A L B U D G E T O F F I C E
CBO’s Budget Projections Through 2026 as of March 2016
2CO N G R ES S I O N A L B U D G E T O F F I C E
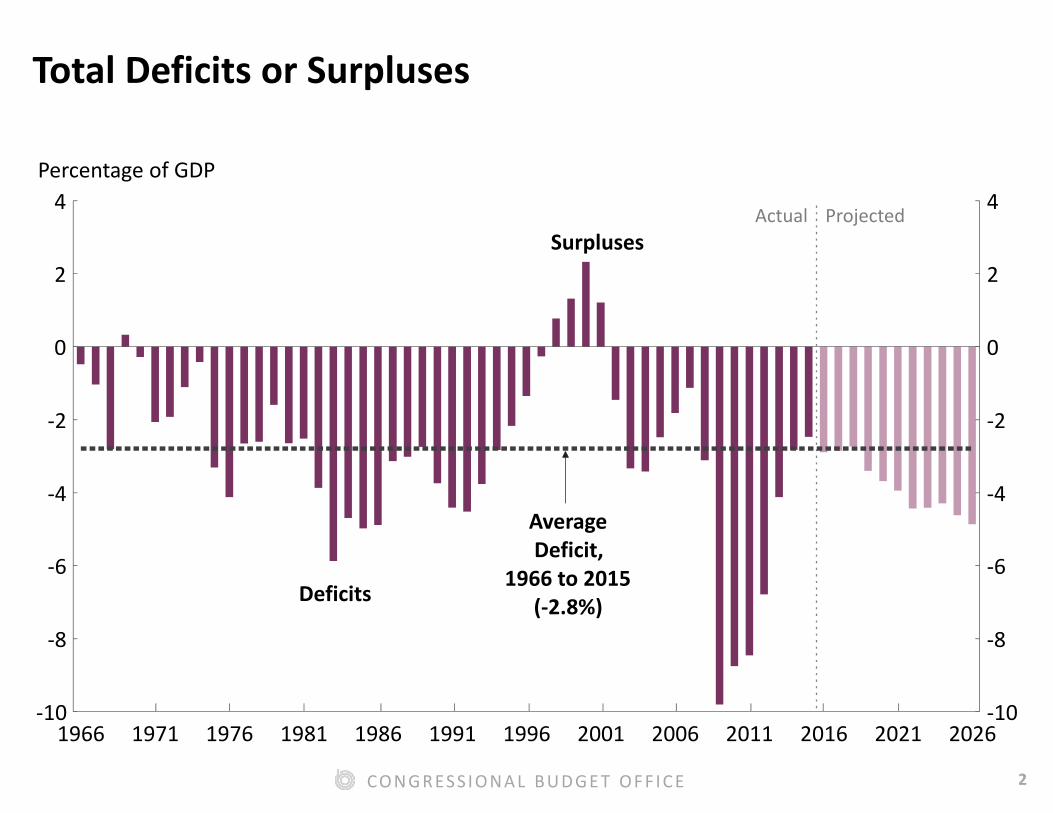
Total Deficits or Surpluses
Percentage of GDP
Actual Projected
Deficits
Surpluses
AverageDeficit,
1966 to 2015(-2.8%)
1966 1971 1976 1981 1986 1991 1996 2001 2006 2011 2016 2021 2026-10
-8
-6
-4
-2
0
2
4
-10
-8
-6
-4
-2
0
2
4
3CO N G R ES S I O N A L B U D G E T O F F I C E
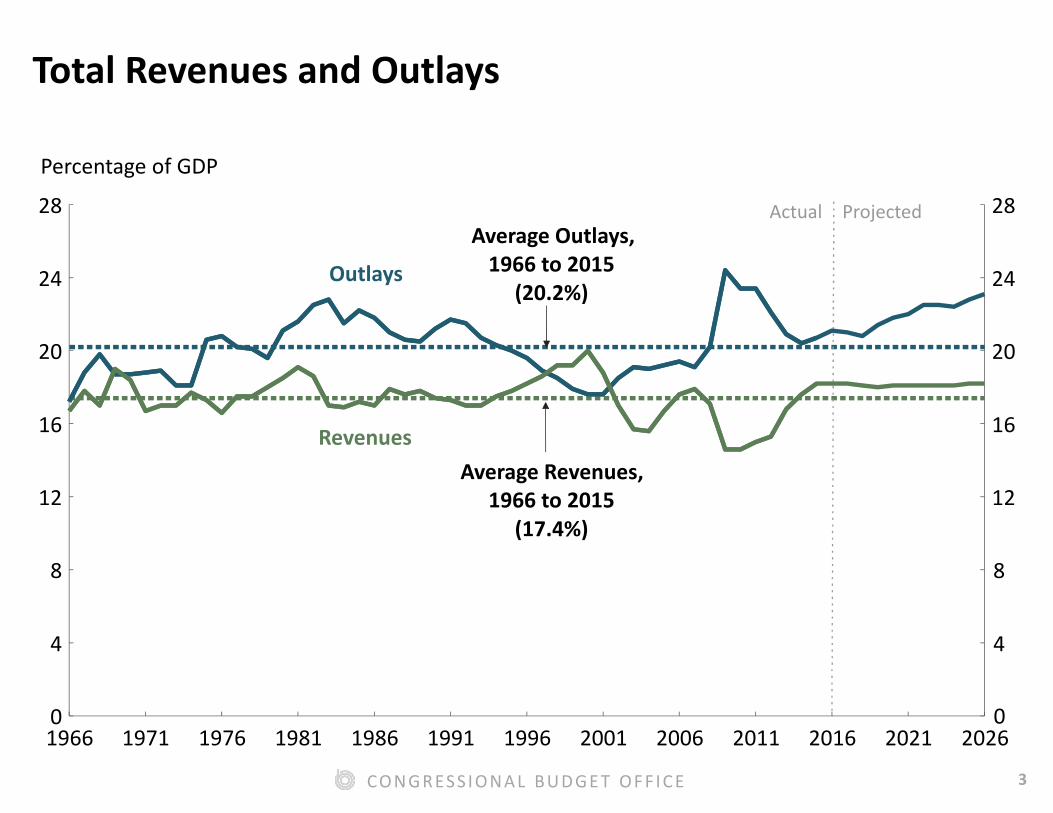
Total Revenues and Outlays
Percentage of GDP
1966 1971 1976 1981 1986 1991 1996 2001 2006 2011 2016 2021 20260
4
8
12
16
20
24
28
0
4
8
12
16
20
24
28
Outlays
Revenues
Average Outlays,1966 to 2015
(20.2%)
Average Revenues,1966 to 2015
(17.4%)
Actual Projected
4CO N G R ES S I O N A L B U D G E T O F F I C E
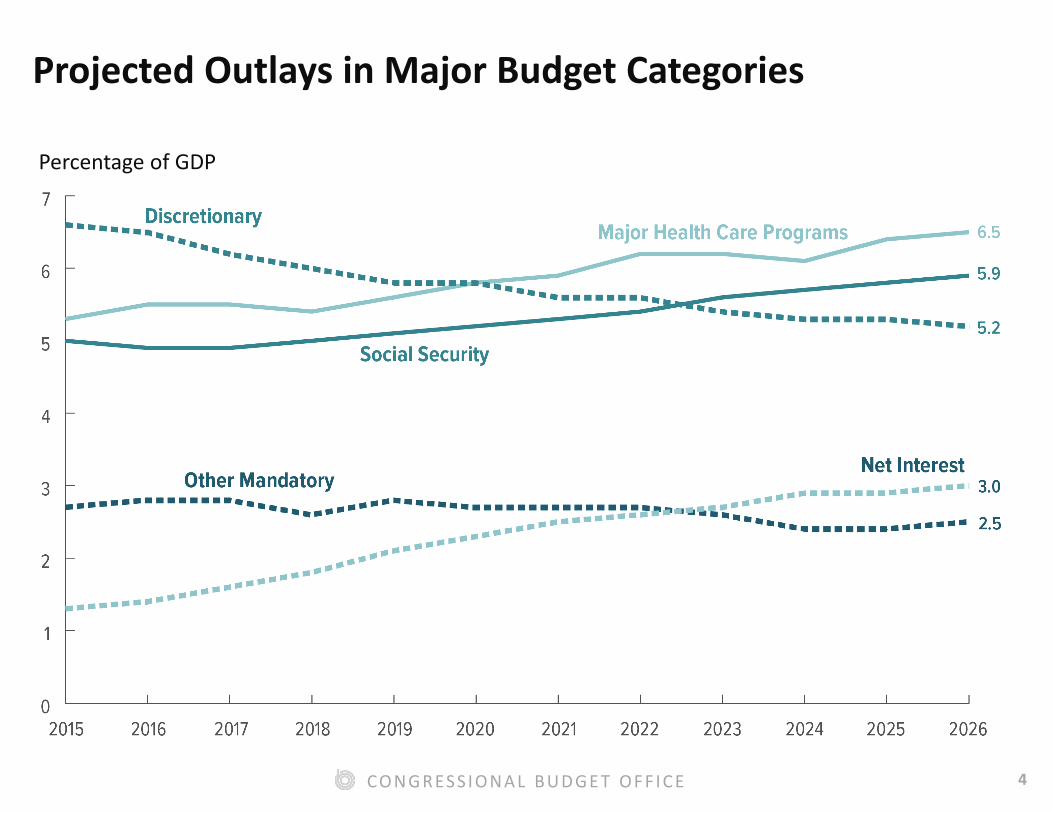
Projected Outlays in Major Budget Categories
Percentage of GDP
5CO N G R ES S I O N A L B U D G E T O F F I C E
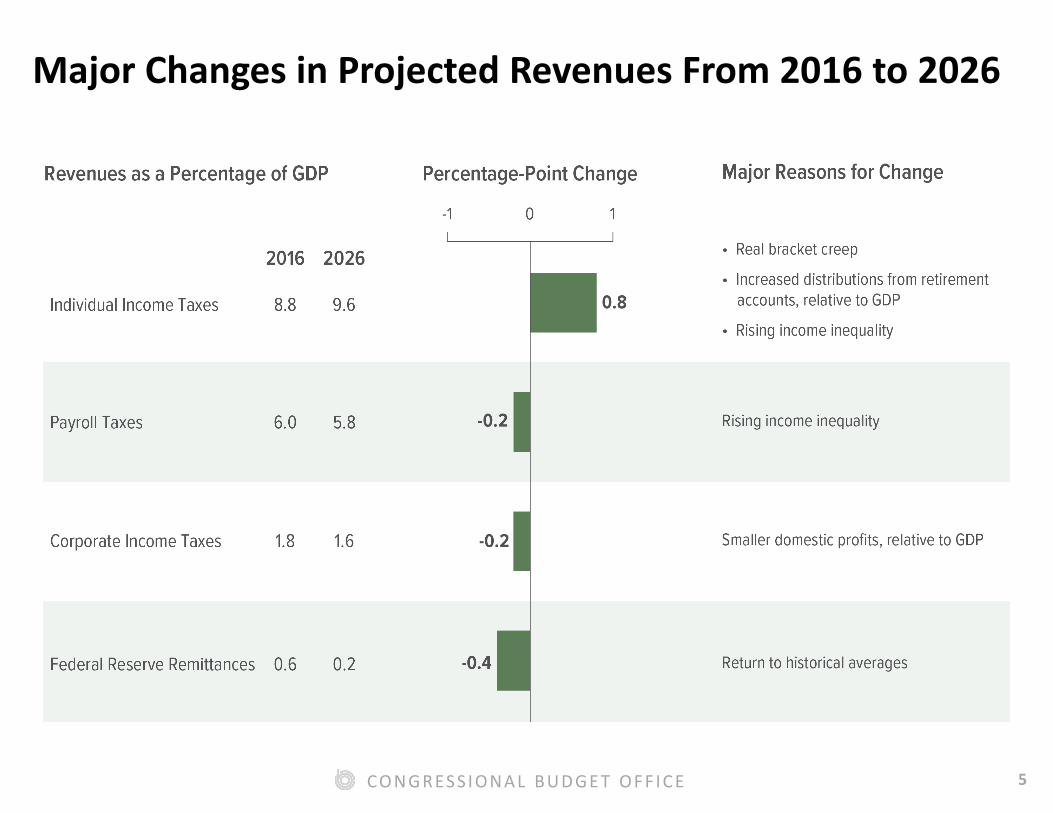
Major Changes in Projected Revenues From 2016 to 2026
6CO N G R ES S I O N A L B U D G E T O F F I C E
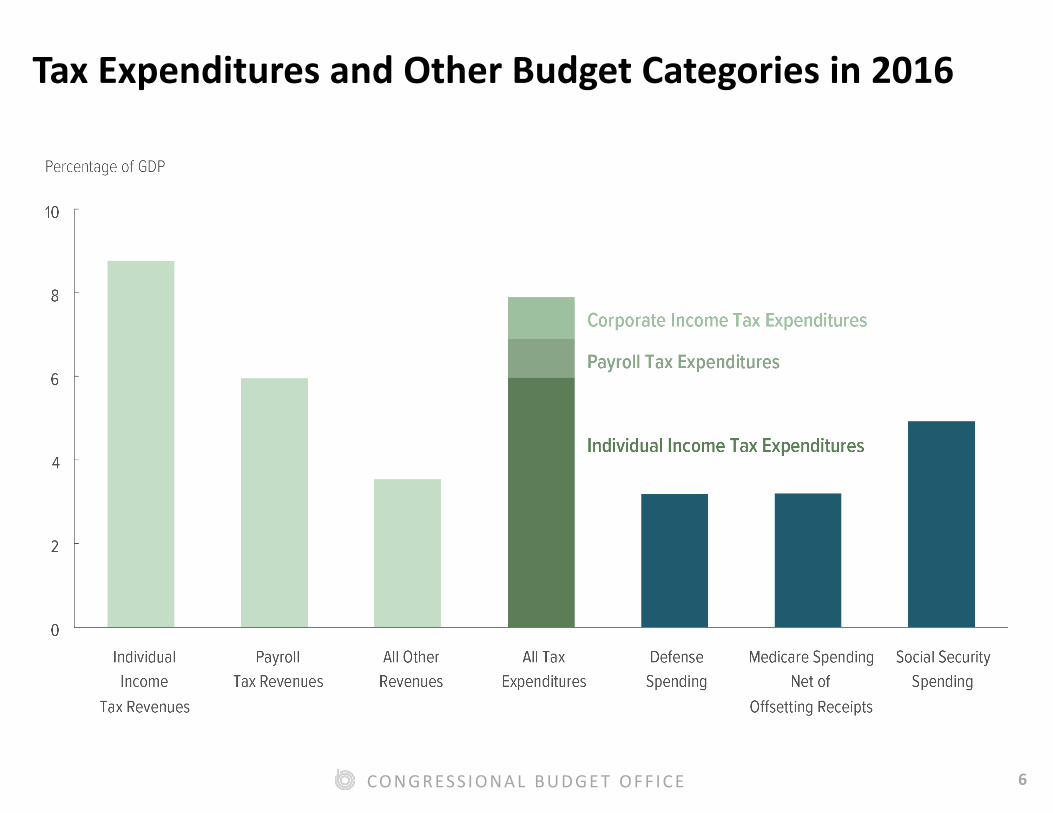
Tax Expenditures and Other Budget Categories in 2016
7CO N G R ES S I O N A L B U D G E T O F F I C E
CBO’s Budget Projections Through 2040 as of January 2016
8CO N G R ES S I O N A L B U D G E T O F F I C E
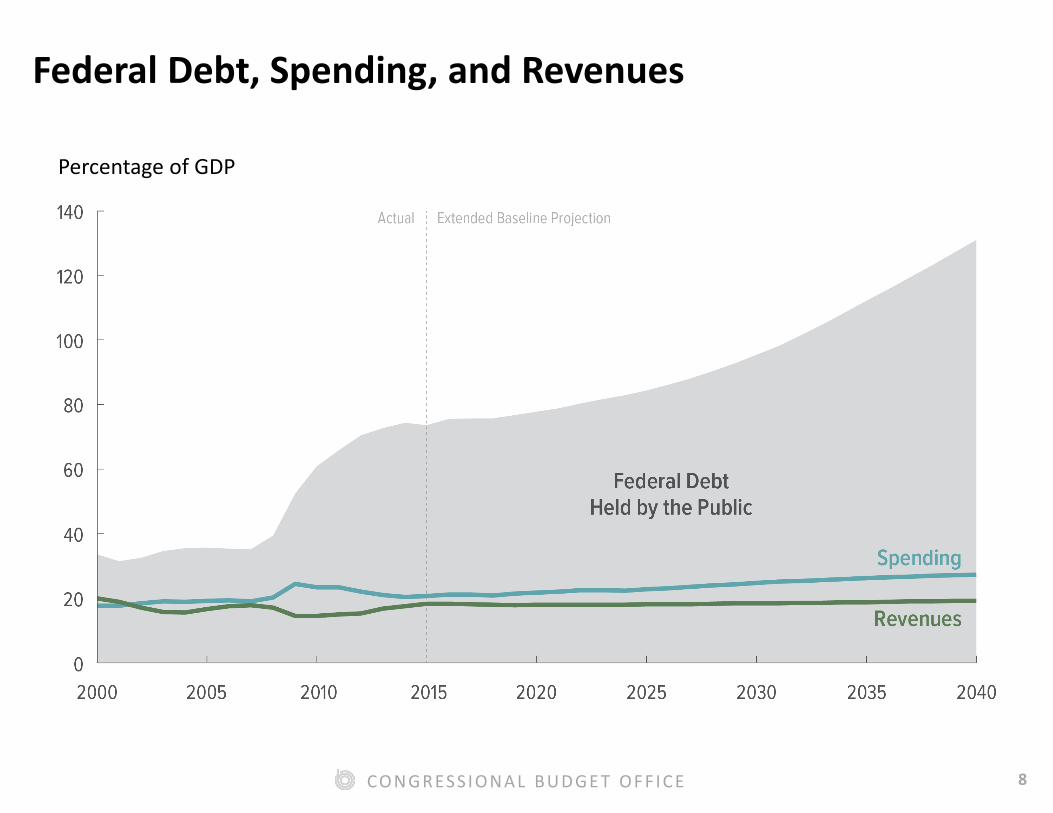
Federal Debt, Spending, and Revenues
Percentage of GDP
9CO N G R ES S I O N A L B U D G E T O F F I C E
Uncertainty About Projections of Debt
■ Even if future tax and spending policies match the policies specified in current law, budgetary outcomes will undoubtedly differ from CBO’s projections.
■ Unexpected changes in the economy, demographics, and other key factors will occur.
10CO N G R ES S I O N A L B U D G E T O F F I C E
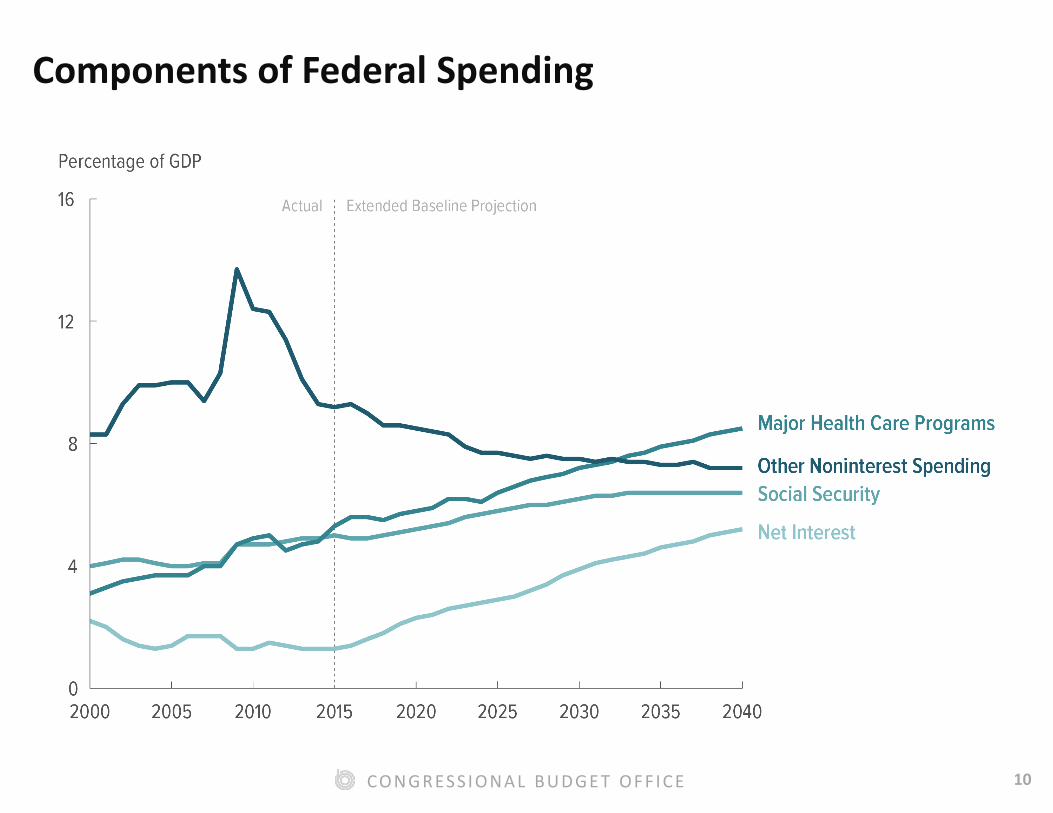
Components of Federal Spending
11CO N G R ES S I O N A L B U D G E T O F F I C E
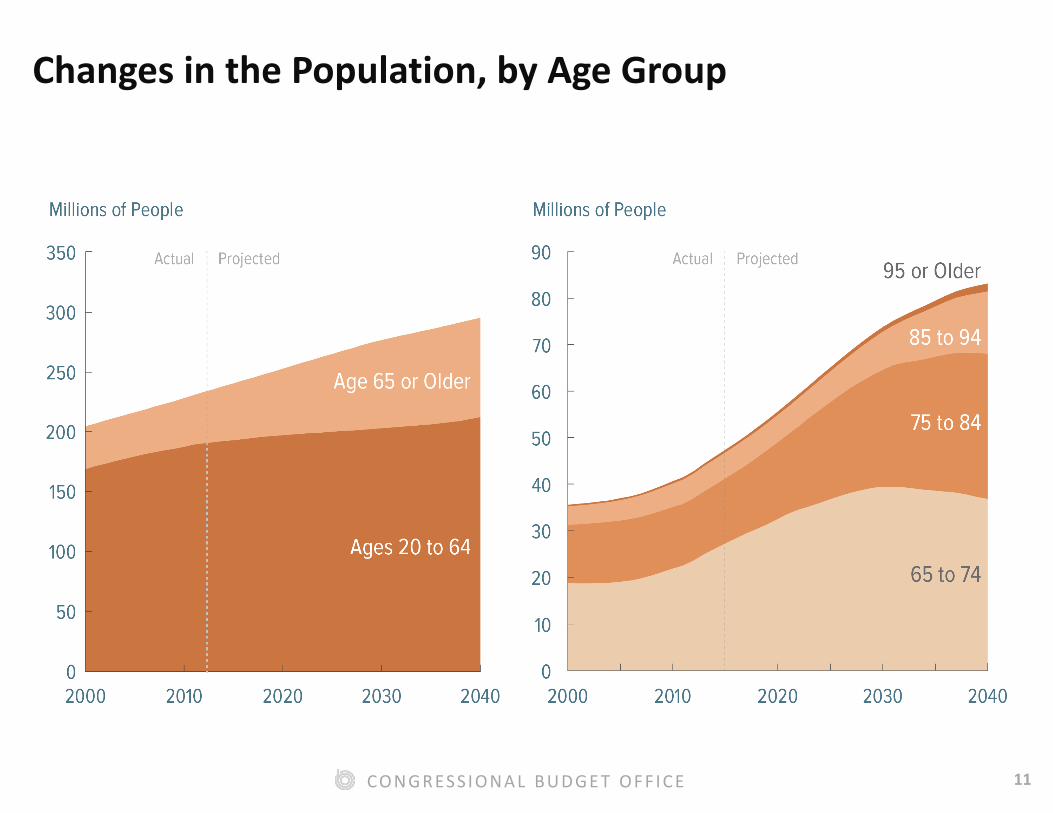
Changes in the Population, by Age Group
12CO N G R ES S I O N A L B U D G E T O F F I C E
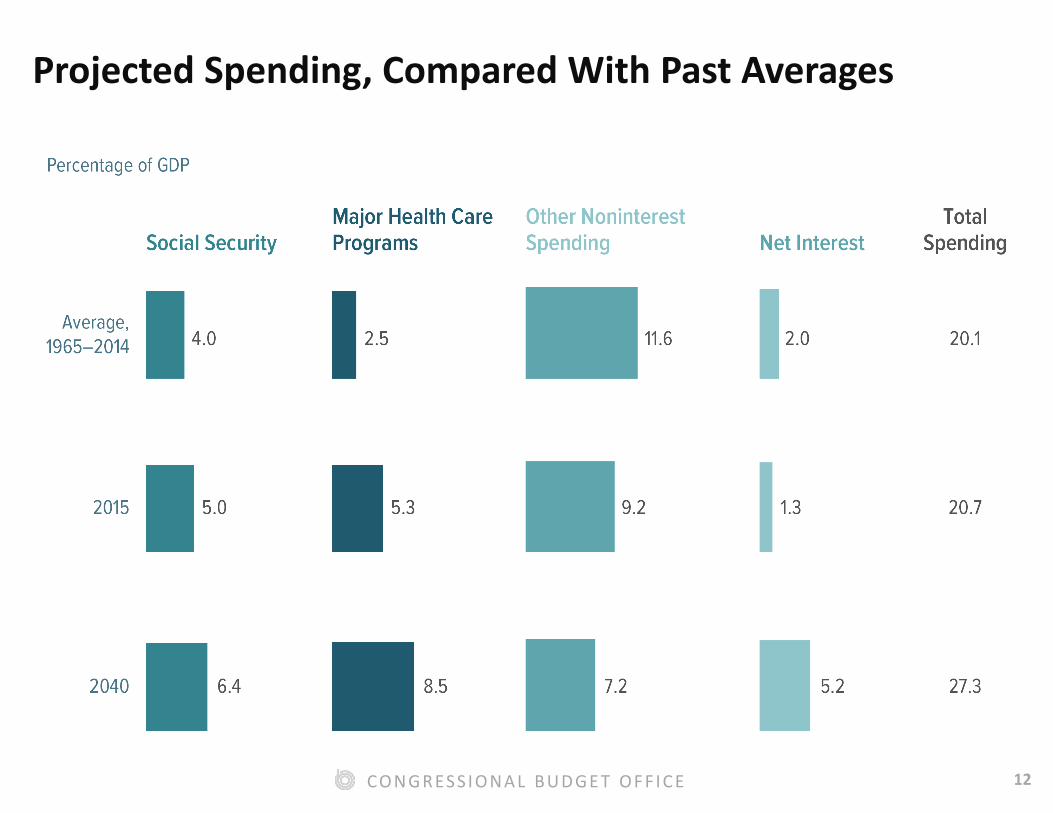
Projected Spending, Compared With Past Averages
13CO N G R ES S I O N A L B U D G E T O F F I C E
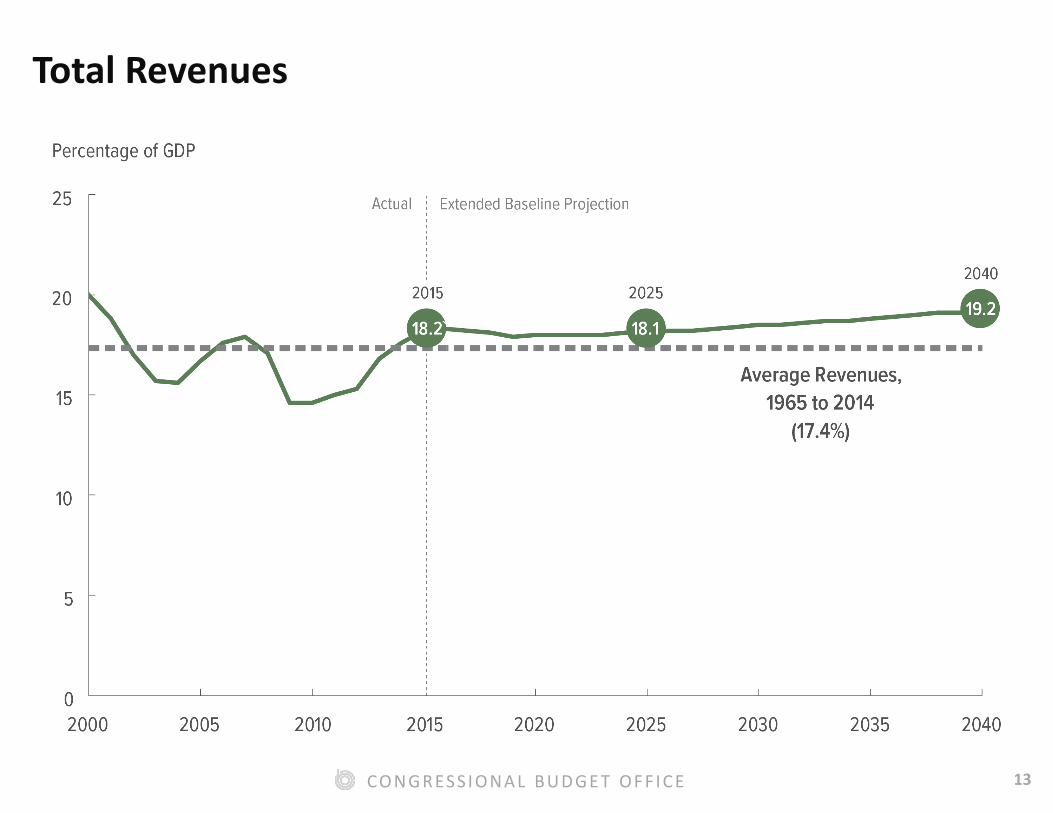
Total Revenues
14CO N G R ES S I O N A L B U D G E T O F F I C E
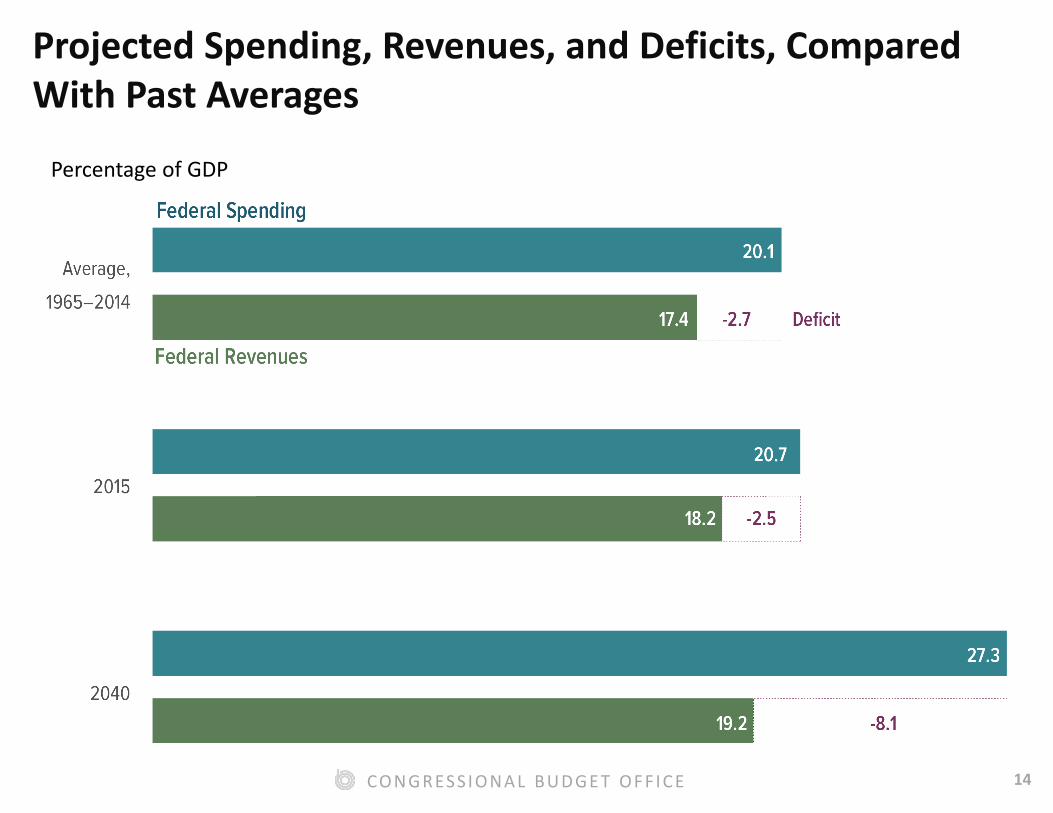
Projected Spending, Revenues, and Deficits, Compared With Past Averages
Percentage of GDP
15CO N G R ES S I O N A L B U D G E T O F F I C E
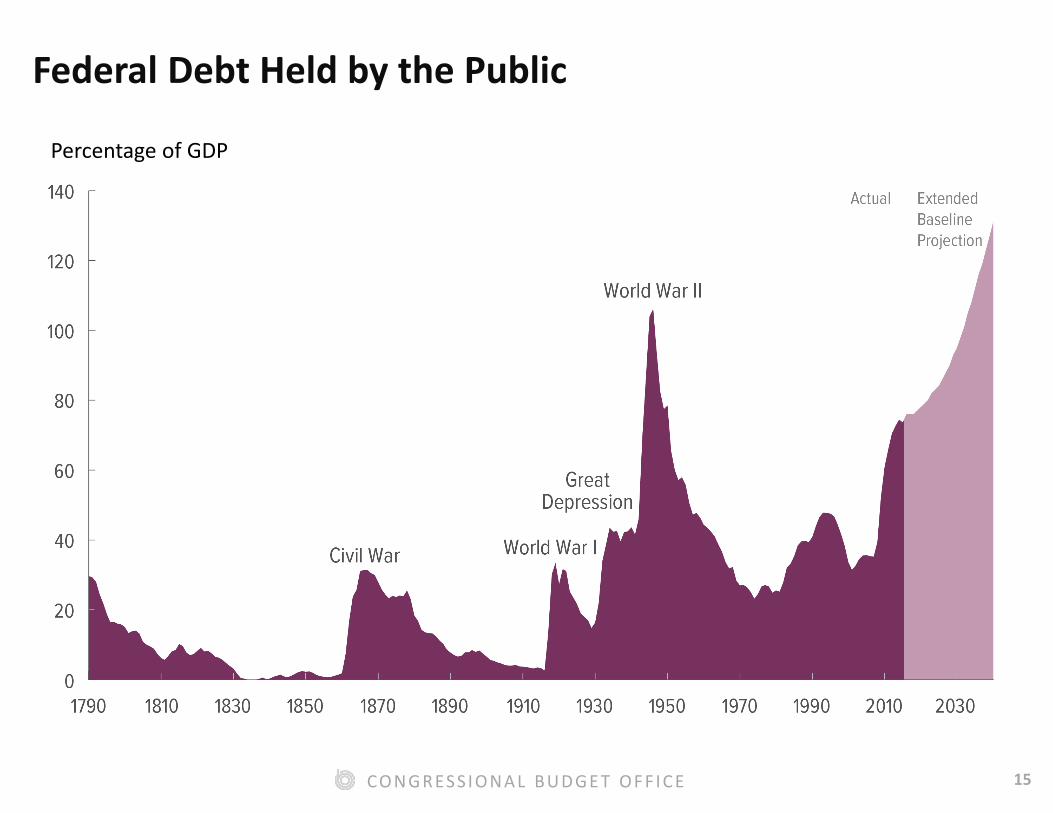
Federal Debt Held by the Public
Percentage of GDP
16CO N G R ES S I O N A L B U D G E T O F F I C E
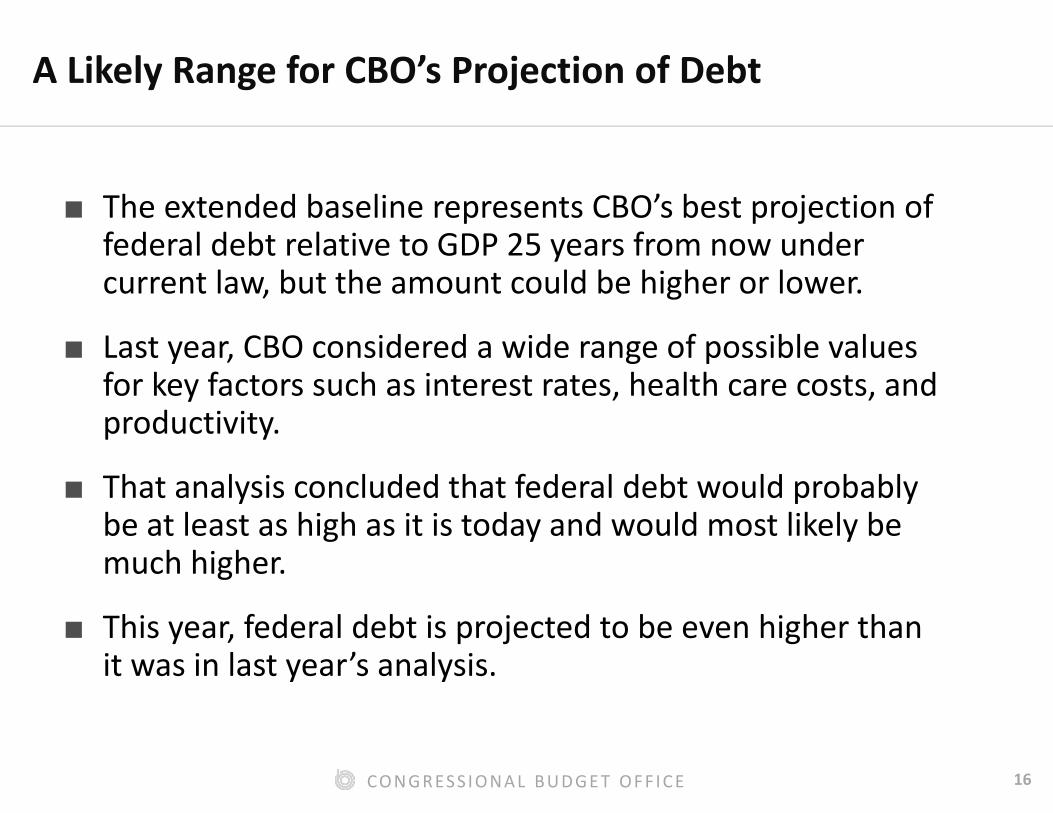
A Likely Range for CBO’s Projection of Debt
■ The extended baseline represents CBO’s best projection of federal debt relative to GDP 25 years from now under current law, but the amount could be higher or lower.
■ Last year, CBO considered a wide range of possible values for key factors such as interest rates, health care costs, and productivity.
■ That analysis concluded that federal debt would probably be at least as high as it is today and would most likely be much higher.
■ This year, federal debt is projected to be even higher than it was in last year’s analysis.
17CO N G R ES S I O N A L B U D G E T O F F I C E
A Sustainable Path for the Long Term
■ Lawmakers would have to make major changes to tax policies, spending policies, or both.
■ The size of such changes would depend upon the amount of federal debt that lawmakers considered appropriate.
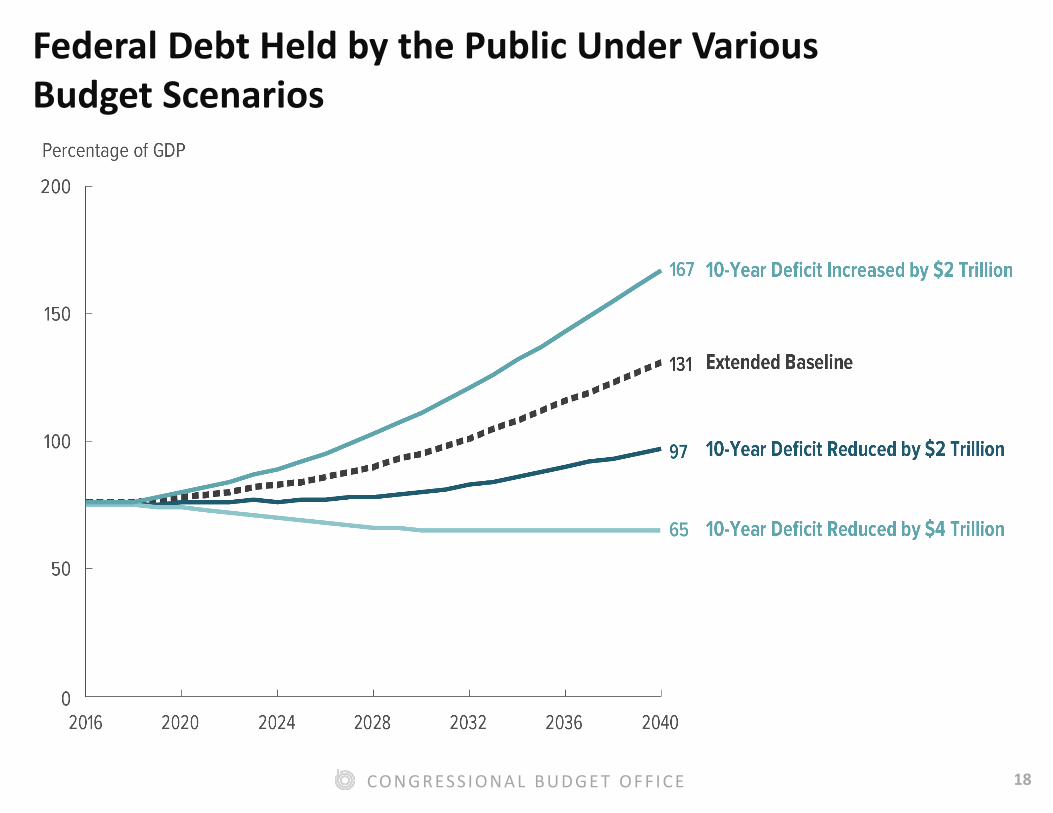
18CO N G R ES S I O N A L B U D G E T O F F I C E
Federal Debt Held by the Public Under Various Budget Scenarios
Recommended