1
TEST PERFORMANCE STUDY
Molecular detection of Xylella fastidiosa through quantitative real time assays
Implementation of the Proficiency test EU-XF- PT-2017-02
November 2017 – January 2018

2
CONTENT 1. General information ..................................................................................................................................... 3
1.1 Objective ........................................................................................................................................... 3
1.2 Performance Criteria ........................................................................................................................ 3
1.3 Organization ..................................................................................................................................... 4
1.4 Laboratories ...................................................................................................................................... 4
2. DNA TEMPLATES ........................................................................................................................................... 5
3. PROTOCOLS ................................................................................................................................................... 6
4. ANALYSIS OF THE RESULTS ........................................................................................................................... 9
5. RESULTS ....................................................................................................................................................... 11
5.1 Qualitative results ............................................................................................................................. 11
5.2 Quantitative results ................................................................................................................ 14
6. CONCLUSIONS .................................................................................................................................. 20
7. REFERENCES ................................................................................................................................................ 22
This report was prepared based on the analyses of the results received by all 14 participant laboratories: https://www.ponteproject.eu/wp-content-uploads-2017-07-eu-xf-pt-2017-02-results-zip/
Authors:
Maria Saponari, IPSP-CNR
Giuliana Loconsole, DiSSPA-UNIBA

3
1. General information
1.1 Objective This interlaboratory validation followed the proficiency test (PT) EU-XF- PT-2017-02 carried out in early 2017,
and aimed to assess the performance and the accuracy of different qPCR assays to detect Xylella fastidiosa
in host plants. In the framework of this test performance study (TPS), five different qPCR assays were
compared using a common panel of DNA templates. DNA extracts were those previously recovered in the
framework of the PT EU-XF- PT-2017-02, from olive tissues spiked with bacterial suspension of X. fastidiosa
subsp. pauca strain De Donno, at known concentrations (CFU/ml). More specifically, the DNA extracts used
in this TPS were recovered from artificially contaminated olive sap, processed using either the DNeasy®
mericon™ Food kit (Qiagen) or the CTAB-based extraction protocol.
1.2 Performance Criteria
The following performance criteria were evaluated (definition: OEPP/EPPO PM 7/76 (2), 2010; OEPP/EPPO
PM 7/122 (1), 2014):
Performance criteria Dataset used in this TPS
Diagnostic sensitivity:
Proportion of infected/infested samples testing
positive compared to results from an alternative
test (or combination of tests). Sensitivity = true
positives/(true positives + false negatives)
Results obtained for the 9 Xf-contaminated
samples tested with each protocol
Specificity:
Proportion of uninfected/uninfested samples (true
negatives) testing negative compared to results
from an alternative test (or combination of tests).
Specificity = true negative results/(true negatives +
false positives)
Results obtained for the 3 Xf-free samples tested
with each protocol
Repeatability: Level of agreement between
replicates of a sample tested under the same
conditions
Results obtained in the same laboratory on the 3
replicates for each set of Xf-contaminated and Xf-
free samples
Accuracy: closeness of agreement between
a test result and the accepted reference value
Determined based on the results of 3
aforementioned performance criteria
Reproducibility: Ability of a test to provide
consistent results when applied to aliquots of the
same sample tested under different conditions
(time, persons, equipment, laboratory, etc)
Identities among the results yielded for the 3
replicates of each set of Xf-contaminated/Xf-free
samples, in the different laboratories (i.e. under
different conditions).

4
1.3 Organization
This TPS was promoted by the Institute for Sustainable Plant Protection, CNR, Bari (Italy) and Department of
Soil, Plant and Food Science of the University of Bari (Italy), as an implementation of the PT EU-XF- PT-2017-
02, and in the framework of the following ongoing European projects:
- EUPHRESCO project (2015-F-146) “Harmonized protocol for monitoring and detection of Xylella
fastidiosa in its host plants and its vectors”
- H2020 “POnTE – Pest Organisms Threatening Europe (635646)”
- H2020 “XF-ACTORS - Xylella fastidiosa Active Containment Through a multidisciplinary-Oriented
Research Strategy (727987)”.
1.4 Laboratories
The laboratories participating in the TPS are listed in Table 1, each laboratory was identified with the same
anonymous alphanumeric code assigned for the PT EU-XF-PT-2017-02.
Table 1. List of the participating laboratories
INSTITUTION COUNTRY INSTITUTION COUNTRY
AGES - Austrian Agency for Health and Food Safety
AUSTRIA CSIC - Institute for Sustainable Agriculture
SPAIN
JKI - Julius Kuehn Institute GERMANY LOSVIB - Laboratorio Oficial de Sanidad Vegetal de las Islas Baleares
SPAIN
LOEWE - Loewe Biochemica GmbH GERMANY Fera UK
SASA - Science and Advice for Scottish Agriculture
UK Di3A - Dipartimento di Agricoltura, Alimentazione e Ambiente, Università degli Studi di Catania
ITALY
CREA-PAV - Consiglio per la ricerca e la sperimentazione in agricoltura, Centro di ricerca per la Patologia Vegetale
ITALY SELGE- Institute for Sustainable Plant Protection, CNR and Department of Soil, Plant and Food Science, University of Bari
ITALY
HCPHS - Croatian Centre for Agriculture, Food and Rural Affairs
CROATIA CRSFA- Centro di ricerca, Sperimentazione e Formazione “Basile Caramia”
ITALY
L27 RIH - Research Institute of Horticulture
POLAND Unisalento - Dipartimento di Scienze e Tecnologie
ITALY

5
2. DNA TEMPLATES
This TPS was carried out using the DNA extracts recovered by the same participating laboratories during the
PT EU-XF-PT-2017-02, and stored at -20°C. More specifically, the panel of DNA extracts used in this TPS
included the extracts recovered either using the DNeasy® mericon™ Food kit (Qiagen) or the CTAB-based
extraction protocol. Table 2 reports the list of the experimental samples tested.
Table 2. List of samples used to assess the performance of the different qPCR assays
For each protocol, qPCR reactions were set up by running two replicates per sample. All the raw data, both
qualitative and quantitative results, received from the different participating laboratories were collected in
separate excel files with the corresponding decrypted sample codes.
Samples Assigned Value Used to calculate the performance
criteria
3 replicates of DNA extracts from non-infected olives negative X
3 replicates of DNA extracts (from olive) containing 10^6 cells/ml positive X
3 replicates of DNA extracts (from olive) containing 10^5 cells/ml positive X
3 replicates of DNA extracts (from olive) containing 10^4 cells/ml positive X
1 lure sample Positive/negative randomly chosen
1 tube of Positive Amplification Control (PAC) for qPCR and PCR assays consisting in purified bacterial DNA.
positive

6
3. PROTOCOLS
The protocols with the specific indications on the reagents (brand and catalog number) and on the amplification conditions used in this TPS were
provided by the Organizers (Annex I). Reagents were supplied by each laboratory and reactions were performed on different thermocyclers according to the
equipment own by each laboratory. The thermocycler, the DNA templates and the protocols selected by each participant laboratories are reported in table
3. Each protocol was identified with a code as indicated in red and in parenthesis in table 3.
Table 3. Protocols, thermocyclers and DNA extracts used in this TPS by the participating laboratories
qPCR
protocol
Lab
Thermocycler
DNA PURIFIED USING CTAB PROTOCOL DNeasy® mericon™ Food kit (Qiagen)
Harper et al., 2010 (HP)
Li et al., 2013, using
standard TaqMan
probe (Li-SP)
Li et al., 2013, using
MGB-TaqMan
probe (Li-MGB)
Francis et al., 2006 (FR-SP)
Francis et al., 2006,
modified using Sybr
green (FR-SG)
Harper et al., 2010 (HP)
Li et al., 2013, using standard TaqMan probe
(Li-SP)
Li et al., 2013, using
MGB-TaqMan
probe (Li-MGB)
Francis et al., 2006
(FR-SP)
Francis et al., 2006,
modified using Sybr green
(FR-SG)
L01 Eppendorf Realplex 4 Mastercycler S
X X X X* X* X X X
X*
X*
L09 BioRad CFX96
X X X X X X X X
L10 BioRad CFX96
X X X X X X X X X X
L11 ROCHE LightCycler 480 I
X X X X X X X X X X
L12 IQ Cycler Biorad
X X X X X X X X X X

7
qPCR
protocol
Lab
Thermocycler
DNA PURIFIED USING CTAB PROTOCOL DNeasy® mericon™ Food kit (Qiagen)
Harper et al., 2010 (HP)
Li et al., 2013, using
standard TaqMan
probe (Li-SP)
Li et al., 2013, using
MGB-TaqMan
probe (Li-MGB)
Francis et al., 2006 (FR-SP)
Francis et al., 2006,
modified using Sybr
green (FR-SG)
Harper et al., 2010 (HP)
Li et al., 2013, using standard TaqMan probe
(Li-SP)
Li et al., 2013, using
MGB-TaqMan
probe (Li-MGB)
Francis et al., 2006
(FR-SP)
Francis et al., 2006,
modified using Sybr green
(FR-SG)
L13 Applied biosystems 7900HT
X X X X X X X X
L16 Stratagene Mx3005P
X X X X
L20 StepOnePlus Applied Biosystems
X X X X X X
L21 Quant Studio 3
X X X X X X X X X X
L22 BioRad CFX96
X X X X X
L27 BioRad CFX96
X X X X X
L29 Applied Biosystems 7900
X X X X X X X X
L30 BioRad CFX96
X X X X X X X X X X
L33 Applied Biosystems 7900
X X X X X

8
qPCR
protocol
Lab
Thermocycler
DNA PURIFIED USING CTAB PROTOCOL DNeasy® mericon™ Food kit (Qiagen)
Harper et al., 2010 (HP)
Li et al., 2013, using
standard TaqMan
probe (Li-SP)
Li et al., 2013, using
MGB-TaqMan
probe (Li-MGB)
Francis et al., 2006 (FR-SP)
Francis et al., 2006,
modified using Sybr
green (FR-SG)
Harper et al., 2010 (HP)
Li et al., 2013, using standard TaqMan probe
(Li-SP)
Li et al., 2013, using
MGB-TaqMan
probe (Li-MGB)
Francis et al., 2006
(FR-SP)
Francis et al., 2006,
modified using Sybr green
(FR-SG)
HT Fast Real-time PCR System
TOTAL LABORATORIES
12 13 13 10 8 11 11 11 9 7
*= the results from these tests were not included in the analysis due to technical problems which invalidate the results
9
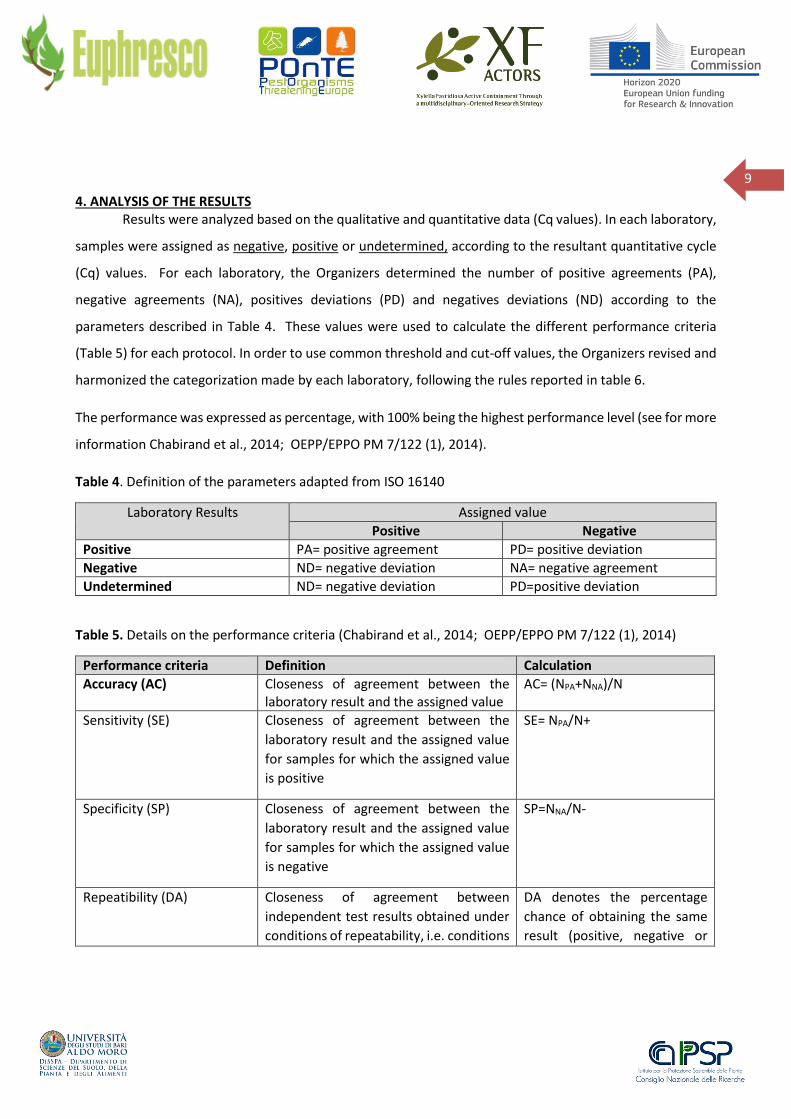
4. ANALYSIS OF THE RESULTS Results were analyzed based on the qualitative and quantitative data (Cq values). In each laboratory,
samples were assigned as negative, positive or undetermined, according to the resultant quantitative cycle
(Cq) values. For each laboratory, the Organizers determined the number of positive agreements (PA),
negative agreements (NA), positives deviations (PD) and negatives deviations (ND) according to the
parameters described in Table 4. These values were used to calculate the different performance criteria
(Table 5) for each protocol. In order to use common threshold and cut-off values, the Organizers revised and
harmonized the categorization made by each laboratory, following the rules reported in table 6.
The performance was expressed as percentage, with 100% being the highest performance level (see for more
information Chabirand et al., 2014; OEPP/EPPO PM 7/122 (1), 2014).
Table 4. Definition of the parameters adapted from ISO 16140
Laboratory Results Assigned value
Positive Negative
Positive PA= positive agreement PD= positive deviation
Negative ND= negative deviation NA= negative agreement
Undetermined ND= negative deviation PD=positive deviation
Table 5. Details on the performance criteria (Chabirand et al., 2014; OEPP/EPPO PM 7/122 (1), 2014)
Performance criteria Definition Calculation
Accuracy (AC) Closeness of agreement between the laboratory result and the assigned value
AC= (NPA+NNA)/N
Sensitivity (SE) Closeness of agreement between the
laboratory result and the assigned value
for samples for which the assigned value
is positive
SE= NPA/N+
Specificity (SP) Closeness of agreement between the
laboratory result and the assigned value
for samples for which the assigned value
is negative
SP=NNA/N-
Repeatibility (DA) Closeness of agreement between
independent test results obtained under
conditions of repeatability, i.e. conditions
DA denotes the percentage
chance of obtaining the same
result (positive, negative or

10
Performance criteria Definition Calculation
under which independent test results are
obtained by the same method, on
identical test samples in the same
laboratory, by the same operator, using
the same equipment, within a short
period of time
indeterminate) from two
identical samples analyzed in
the same laboratory
Reproducibility as the ability of a test to provide consistent results when applied to aliquots of the same sample tested under different conditions (time, persons, equipment, location, etc)
based on the number of interlaboratory pairs of same results/total number of interlaboratory pairs
Table 6. Rules adopted for the harmonization of the interpretation of the results
Result replicate 1 Result replicate 2 Final assessment
Positive (Cq ≤ 35) Positive (Cq ≤ 35) Sample assigned as positive
Positive Undetermined (35≤Cq<40) Sample assigned as negative
Undetermined (35≤Cq<40) Undetermined (35≤Cq <40) Sample assigned as undetermined
Negative (N/A) Undetermined (35≤Cq <40) Sample assigned as negative
Negative (Cq= N/A) Negative (Cq= N/A) Sample assigned as negative

11
5. RESULTS
The results recovered in each laboratory are available at the following link https://www.ponteproject.eu/wp-content/uploads/2017/07/EU-XF-PT-2017-02-results.zip
5.1 Qualitative results
Tables 7 and 8 report the values of the performance criteria yielded for each qPCR protocol performed on
the DNA templates prepared using the DNeasy® mericon™ Food kit (Qiagen) or the CTAB-based extraction
protocol, respectively.
As shown in the tables, the highest values (for all performance criteria) were obtained when qPCR reactions
were performed on the DNA templates recovered using the DNeasy® mericon™ Food kit (Qiagen). In this
case, values of 100% were consistently yielded for the qPCR protocols HP, FR-SP and FR-SG. Whereas, as
shown in table 7, the qPCR Li-SP and Li-MGB, yielded values slightly lower than those obtained with the other
qPCR protocols. More specifically, this was the determined by the results gained in one laboratory where one
expected negative sample was categorized as “undertermined” (i.e. positive deviation), yielding Cq values of
36.66 (Li-SP) and 37.80 (Li-MGB).
When DNA templates recovered using CTAB-based extraction protocol were subjected to qPCR,
consistent values of 100% where obtained using the qPCR HP and FR-SG; whereas, the remaining protocols
generated values lower than 100% for the sensitivity, accuracy, repeatability and reproducibility. These lower
values were determined by 7 and 13 presumptive negative samples which, instead, yielded undetermined
results (positive deviations), i.e. Cq values close to or >35.00, with Li-SP and Li-MGB, respectively. These
positive deviations affected the accuracy (96%), the reproducibility (92%) and the repeatability (97%).
Furthermore, the protocol FR-SP produced, in one laboratory, three negative deviations corresponding to
three undetermined results (average Cq values of 36.49, 35.81 and 37.09) for 3 replicates contaminated with
the lowest bacterial concentration (10^4 cells/ml) which determined values of sensitivity of 97%, accuracy
98% and reproducibility 98%.
Besides the occurrence of samples producing undetermined results, none of the qPCR assays produced false
positive or false negative results.

12
Table 7. Values recovered for the different performance criteria using five different qPCR protocols on the
DNA purified using the DNeasy mericon Food Kit (QIAGEN).
DATA qPCR PROTOCOLS
HP Li-SP Li-MGB FR-SP FR-SG
N. lab 11 11 11 9 7
N+ 99 99 99 81 63
PA 99 99 99 81 63
ND - Undetermined
(suspicious) of N+
0 0 0 0 0
0 0 0 0 0
N- 33 33 33 33 21
NA 33 32 32 33 21
PD - Undetermined
(suspicious) of N-
0 1 1 0 0
0 1 1 0 0
% Accuracy 100 99 99 100 100
% Sensitivity 100 100 100 100 100
% Specificity 100 97 97 100 100
% Repeatability 100 99 99 100 100
% Reproducibility 100 99 99 100 100
PA positive agreements; NA negative agreements; PD positive deviations; ND negative deviations; N+
number of samples with positive assigned value (Σ PA+ Σ ND); N- number of samples with negative assigned
value (Σ NA+ Σ PD); N total number of samples (N+ + N-).

13
Table 8. Values recovered for the different performance criteria using five different qPCR protocols on DNA
purified using CTAB-based extraction protocol.
DATA qPCR PROTOCOLS
HP Li-SP Li-MGB FR-SP FR-SG
N. of laboratories 12 13 13 10 8
N. of results obtained 144 156 156 120 96
N+ 108 117 117 90 72
PA 108 117 117 87 72
ND - Undetermined
(suspicious) of N+
0 0 0 3 0
0 0 0 3 0
N- 36 39 39 30 24
NA 36 32 26 30 24
PD - Undetermined
(suspicious) of N-
0 7 13 0 0
0 7 13 0 0
% Accuracy 100 96 92 98 100
% Sensitivity 100 100 100 97 100
% Specificity 100 82 67 100 100
% Repeatability 100 97 97 100 100
% Reproducibility 100 96 92 98 100
PA positive agreements; NA negative agreements; PD positive deviations; ND negative deviations; N+
number of samples with positive assigned value (Σ PA+ Σ ND); N- number of samples with negative assigned
value (Σ NA+ Σ PD); N total number of samples (N+ + N-).

14
5.2 Quantitative results
This section includes comparative analyses of the values of the quantitation cycles (Cq) recovered for
the different qPCR assays. The Cq values obtained from each qPCR protocols for each series of samples
processed either using the DNeasy® mericon™ Food kit (Qiagen) or the CTAB-based protocol are graphically
shown with boxplots in figure 1.
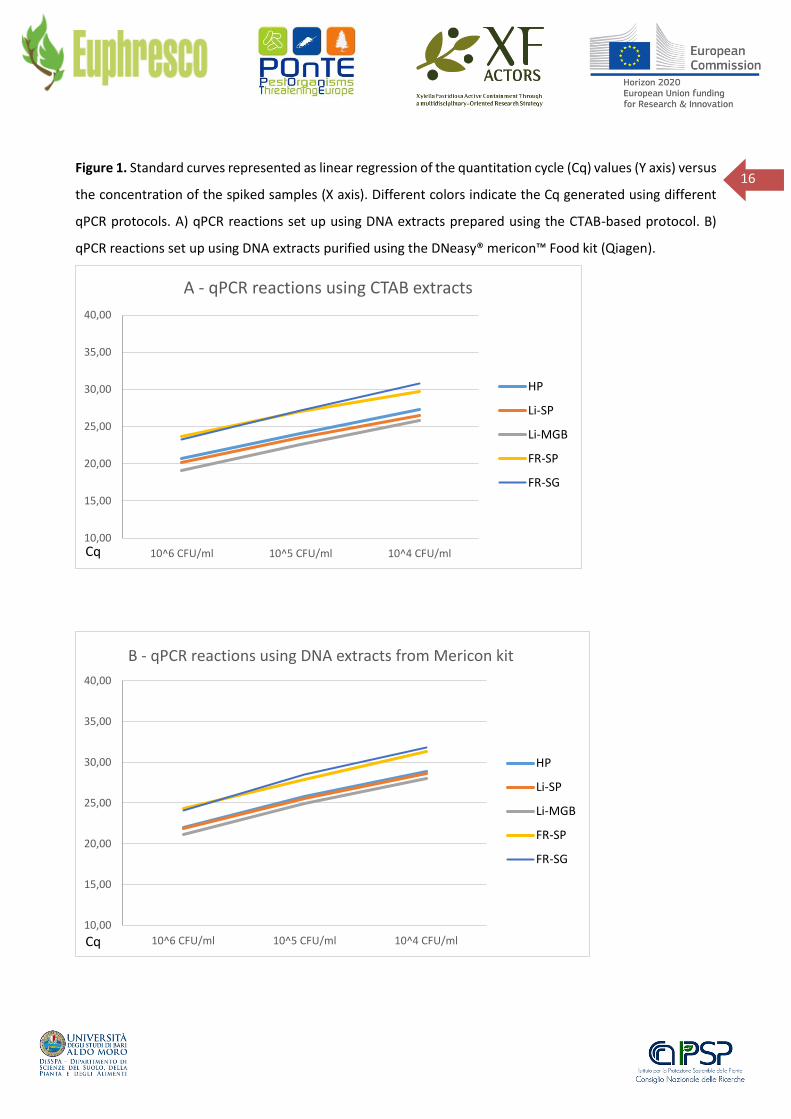
The qPCR efficiencies for the five tested qPCR protocols was determined using the average Cq
recovered for the three series of Xf-contaminated samples (10-fold dilutions). The slopes of the linear
regression, that measure the assay’s efficiency, were between 3.065 and 3.91, corresponding to the optimal
qPCR efficiency values, ranging from 90% to 110% (Table 9, Figure 1). Similarly, the R2 values that measure
the performance of the assay were greater than 0.99, regardless the procedures used to prepare the DNA
templates.
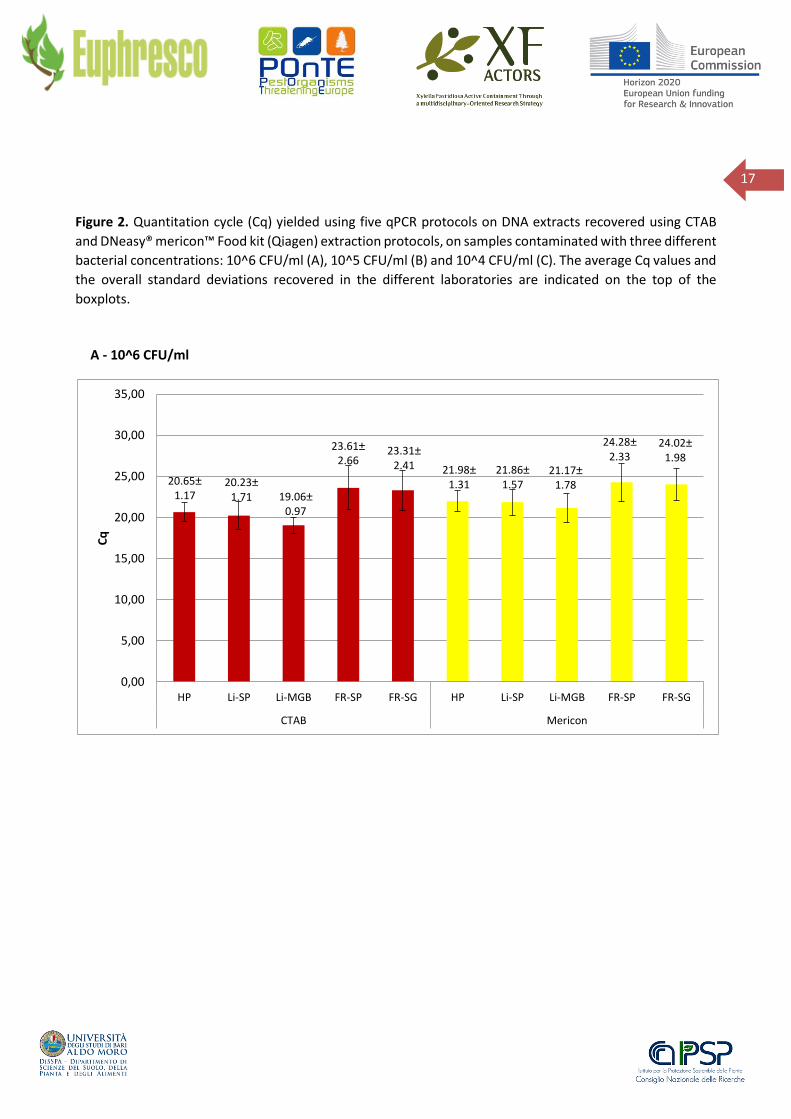
For a given sample, the Cq values varied according to the method used for the purification of the DNA and in
relation to the qPCR protocol used for the amplification (Fig. 2 A-C).
In general, higher values (∆Cq= ~ 1) were obtained, regardless the qPCR protocol used, when the DNA purified
using the DNeasy® mericon™ Food kit (Qiagen) was used.
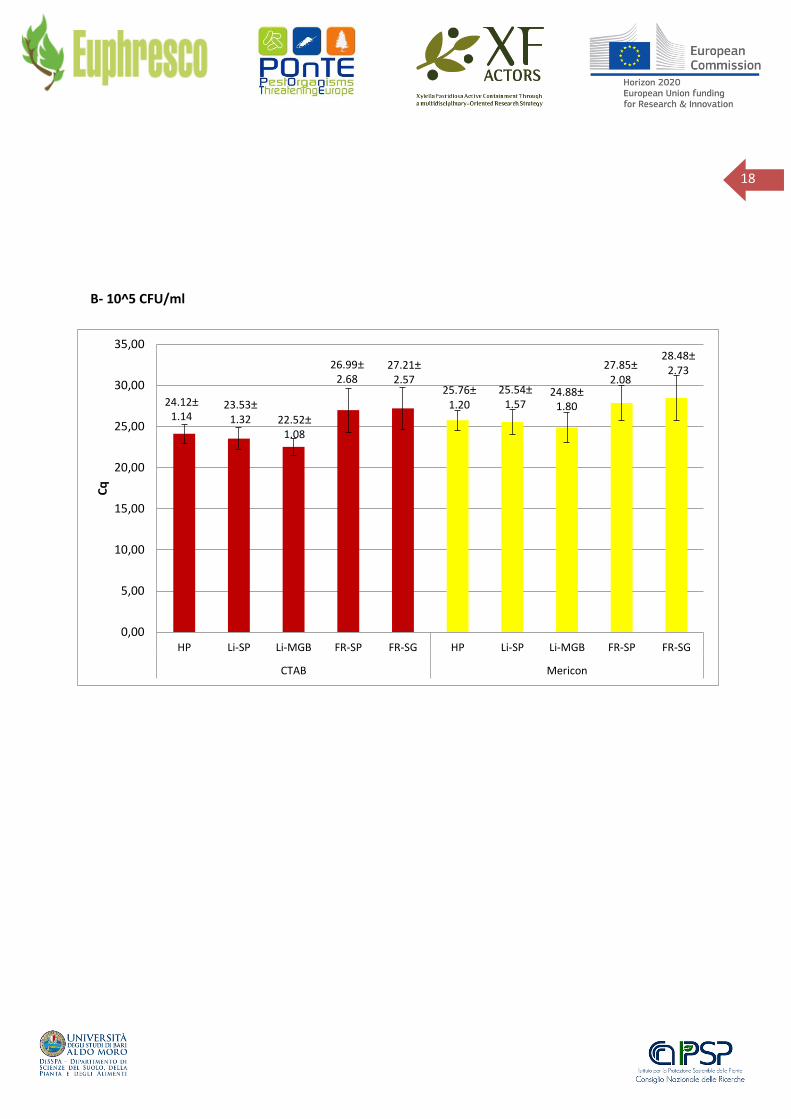
Whereas with regard to the qPCR protocols, the assays based on Li et al (2013) consistently produced the
lowest Cq values for all sets of samples. For both qPCR protocols Li-SP and Li-MGB, the standard deviation
(SD) values were in the range of +1.07-1.71 and +0.97-1.13 when using CTAB-extracts, and in the range of
+1.28-1.57 and +1.78-1.93 when using DNA recovered with the DNeasy® mericon™ Food kit (Qiagen),
respectively. On the other hand, as reported in the previous paragraph, Li-SP and Li-MGB protocols
generated the highest number of “undetermined” results, which impacted the specificity and the accuracy
of the assays.
The values of Cq generated using the HP protocol were slightly higher (∆Cq ~ 1) than those recovered Li-SP
and Li-MGB, with SD values comprised in the range of +1.14-1.17 and +1.20-1.31 for CTAB and DNeasy®
mericon™ Food kit (Qiagen) extracts, respectively.
The values of Cq generated using the protocols FR-SP and FR-SG were the highest among the tested protocols,
i.e. ∆Cq= ~ 3-4. Similarly, the SD of the Cq values recovered from these two protocols were higher than those
recovered with the other protocols, being comprised in the range of +2.27-2.68 and +1.98-2.73 for CTAB and
DNeasy® mericon™ Food kit (Qiagen) extracts, respectively.

15
Although, using the panel of samples prepared for this TPS, the values of sensitivity recovered from the
protocols FR-SP and FR-SG were 100%, the analysis of the Cq values put in evidence that this assay has lower
sensitivity, as confirmed by the highest Cq values, which would have been more evident testing samples
containing bacterial concentrations lower than 10^4 CFU/ml (as used in this TPS) and closer to the detection
limit of the qPCR assays.
Table 9. Results of the linear regression analysis
DNA extracts recovered using CTAB-based protocol
qPCR protocols Linear regression and R2 values
HP y = 3,335x + 17,36 R² = 0,9995
Li-SP y = 3,16x + 17,117 R² = 0,9993
Li-MGB y = 3,365x + 15,727 R² = 0,9997
FR-SP y = 3,065x + 20,65 R² = 0,9965
FR-SG y = 3,75x + 19,61 R² = 0,9995
DNA extracts recovered using DNeasy® mericon™ Food kit (Qiagen)
qPCR protocols Linear regression and R2 values
HP y = 3,465x + 18,62 R² = 0,9973
Li-SP y = 3,365x + 18,6 R² = 0,9971
Li-MGB y = 3,445x + 17,813 R² = 0,998
FR-SP y = 3,525x + 20,77 R² = 0,9999
FR-SG y = 3,91x + 20,93 R² = 0,9934
16
Figure 1. Standard curves represented as linear regression of the quantitation cycle (Cq) values (Y axis) versus
the concentration of the spiked samples (X axis). Different colors indicate the Cq generated using different
qPCR protocols. A) qPCR reactions set up using DNA extracts prepared using the CTAB-based protocol. B)
qPCR reactions set up using DNA extracts purified using the DNeasy® mericon™ Food kit (Qiagen).
10,00
15,00
20,00
25,00
30,00
35,00
40,00
10^6 CFU/ml 10^5 CFU/ml 10^4 CFU/ml
A - qPCR reactions using CTAB extracts
HP
Li-SP
Li-MGB
FR-SP
FR-SG
10,00
15,00
20,00
25,00
30,00
35,00
40,00
10^6 CFU/ml 10^5 CFU/ml 10^4 CFU/ml
B - qPCR reactions using DNA extracts from Mericon kit
HP
Li-SP
Li-MGB
FR-SP
FR-SG
Cq
Cq
17
Figure 2. Quantitation cycle (Cq) yielded using five qPCR protocols on DNA extracts recovered using CTAB
and DNeasy® mericon™ Food kit (Qiagen) extraction protocols, on samples contaminated with three different
bacterial concentrations: 10^6 CFU/ml (A), 10^5 CFU/ml (B) and 10^4 CFU/ml (C). The average Cq values and
the overall standard deviations recovered in the different laboratories are indicated on the top of the
boxplots.
0,00
5,00
10,00
15,00
20,00
25,00
30,00
35,00
HP Li-SP Li-MGB FR-SP FR-SG HP Li-SP Li-MGB FR-SP FR-SG
CTAB Mericon
Cq
A - 10^6 CFU/ml
20.65±
1.17 20.23±
1.71 19.06±
0.97
23.61±
2.66 23.31±
2.41 21.98±
1.31 21.86±
1.57 21.17±
1.78
24.28±
2.33 24.02±
1.98
18
0,00
5,00
10,00
15,00
20,00
25,00
30,00
35,00
HP Li-SP Li-MGB FR-SP FR-SG HP Li-SP Li-MGB FR-SP FR-SG
CTAB Mericon
Cq
B- 10^5 CFU/ml
24.12±
1.14 23.53±
1.32 22.52±
1.08
26.99±
2.68 27.21±
2.57 25.76±
1.20
25.54±
1.57 24.88±
1.80
27.85±
2.08
28.48±
2.73

19
0,00
5,00
10,00
15,00
20,00
25,00
30,00
35,00
HP Li-SP Li-MGB FR-SP FR-SG HP Li-SP Li-MGB FR-SP FR-SG
CTAB Mericon
Cq
C - 10^4 CFU/ml
27.32±
1.16 26.55±
1.07 25.79±
1.13
29.74±
2.27
30.81±
2.59 28.91±
1.24 28.59±
1.28
28.06±
1.93
31.33±
2.16
31.84±
2.17

20
6. CONCLUSIONS
The accuracy, repeatability and reproducibility of the qPCR protocols tested in this TPS were in the range of
92-100%, thus the molecular diagnostic tests (including both the plant DNA extraction procedures and the
qPCR protocols) showed robustness (PM 7/76) and proved to be suitable for the diagnosis of X. fastidiosa in
plant materials.
The data summarized in table 10 show that:
The qPCR protocols HP, FR-SP and FR-SG produced the best performance values, regardless the
method used for the extraction of the DNA, reaching values of 98-100% for the different performance
criteria analyzed.
The qPCR protocols Li-SP and Li-MGB, produced the lowest Cq values, but although showed general
good performances (values >92%) these were the lowest among the five protocols compared, and
determined by the occurrence of PD, higher in the case DNA templates were obtained using the
CTAB-based protocol.
Modifying the TaqMan probe designed by Li et al. (2013) by including the MGB reporter, did not
improve any of the performance parameters.
HP protocol generated Cq values consistently lower than those obtained using both qPCR protocols
based on the assay designed by Francis et al (2006). This is in the nature of the assays, the primers of
Harper et al (2010) amplify a multi-copy gene, whereas the primers of Francis et al (2006) are
designed to amplify a single-copy gene.

21
Table 10. Summary of the values of the performance criteria obtained for the five different qPCR protocols
using extracts recovered using for CTAB-based and DNeasy® mericon™ Food kit (Qiagen) protocols.
Percentage below 100% are shaded.
qPCR protocol
DNA extracts
Accuracy %
Sensitivity %
Specificity %
Repeatability %
Reproducibility %
HP CTAB 100 100 100 100 100 Mericon 100 100 100 100 100
Li-SP CTAB 96 100 92 97 96
Mericon 99 100 97 99 99
Li-MGB CTAB 92 100 67 97 92 Mericon 99 100 97 99 99
FR-SP CTAB 98 97 100 100 98
Mericon 100 100 100 100 100 FR-SG CTAB 100 100 100 100 100
Mericon 100 100 100 100 100

22
7. REFERENCES
- Chabirand A, Anthoine G, Pierson O, Hostachy B, 2014. The organization of proficiency testing in plant pathology (qualitative methods of analysis) according to the ISO/IEC 17043: example of the French national reference laboratory. Accred Qual Assur (2014) 19: 111–125 DOI 10.1007/s00769-014-1034-y. - International Organization for Standardization (2010). Conformity assessment—general requirements for proficiency testing. ISO/IEC 17043:2010. ISO, Geneva - Francis M, Lin H, Cabrera-La Rosa J, Doddapaneni H & Civerolo EL, (2006). Genome-based PCR primers for specific and sensitive detection and quantification of Xylella fastidiosa. European Journal of Plant Pathology 115, 203–213. - Harper SJ, Ward LI, Clover GRG, 2010. Development of LAMP and real-time PCR methods for the rapid detection of Xylella fastidiosa for quarantine and field applications. Phytopathology 100, 1282–1288. - Li W, Teixeira DC, Hartung JS, Huang Q, Duan Y, Zhou L et al., (2013). Development and systematic validation of qPCR assays for rapid and reliable differentiation of Xylella fastidiosa strains causing citrus variegated chlorosis. Journal of Microbiological Methods 92, 79–89. -PM 7/122 (1), Guidelines for the organization of interlaboratory comparison by plant pest diagnostic laboratories. EPPO Bull, 44 (3), 390-399. - PM 7/24 (2) (2016), Xylella fastidiosa. EPPO Bull, 46: 463–500. doi:10.1111/epp.12327. - PM 7/76 (4) (2017) Use of EPPO diagnostic protocols. EPPO Bull, 47: 1365-2338. 10. doi:1111/epp.12365
Recommended