Technical Report Documentation Page
•
•
1. Report No.
FAA-RD-76-23
2. Government Accession No. 3. Recipient's Catalog No.
4. Title and Subtitle
A Concept and Plan for the Development of a Weather Support Subsystem for Air Traffic Control
5. Report Date
16 April 1976
6. Performing Organi zation Code
7. Author! s)
Steven 1. Krich and Steven M. Sussman
8. Performing Organi zation Report No.
ATC-64
9. Performing Organi zotion Name and Address
Massachusetts Institute of Technology Lincoln Laboratory P.O. Box 73 Lexington, Massachusetts 02173
12. Sponsoring Agency Nome and Address
Department of Transportation Federal Aviation Administration Systems Research and Development Service Washington, D. C. 20591
I--:--,------------------------------
10. Work Unit No. (TRAIS)
DOT-FA74WAI-485 11. Contract or Grant No.
Project Report
13. Type of Report and Period Covered -~
14. Sponsoring Agency Code
15. Supp lementary Notes
The work reported in this document was performed at Lincoln Laboratory, a center for research operated by the Massachusetts Institute of Technology under Air Force Contract FI9628-76-C-0002.
1 f,. Abstract
This report summarizes the results of a study to: (1) investigate the primary needs of air traffic controllers, flow controllers, and central flow controllers for weather information, (2) define a cost effective system concept to meet these needs, and (3) layout a plan for the development of the proposed weather subsystem to support Air Traffic Control.
The recommended system will provide rapid generation and dissemination of reliable user oriented observations and very short range severe weather forecasts (up to 30 min.) to facilitate controller planning. This new capability will: 1) reduce weather induced controller work load peaks, 2) permit controllers to coordinate and preplan aircraft rerouting for weather avoidance, 3) achieve an improved balance between the inefficiency of overreaction and the essentials of safety, 4) facilitate controller response to pilot requests for weather data on a work load permitting basis, and 5) enable the issuance of accurate weather advisories. The system will also provide rapid generation and dissemination of reliable short range forecasts (up to 4 hours) to permit early introduction of necessary flow control procedures. This new capability will: 1) decrease problems for controllers, 2) increase acceptance of flow control, and 3) increase traffic flow efficiency without decreasing safety .
17. Key Words
Air Traffic Control Meteorology Radar Meteorology
lB. Distribution Statement
Document is available to the public through the National Technical Information Service, Springfield, Virginia 22151.
19. Security Clo55if. (of this report)
Unclassified
20. Security Classif. (of this poge)
Unclassified
21. No. of Pages
124
Form DOT F 1700.7 (8-72) Reproduction of completed page authorized
TABLE OF CONTENTS
Section
1.0 INTRODUCTION 1
1.1 Executive Summary 1
1,2 The Recommended System Concept 6
1. 2.1 The Supporting Communication Network 7
1. 2. 2 The ARTCC WEather Processor (AWEP) 9
1. 2. 3 The TRACON WEather Processor (TWEP) 12
1. 2.4 The SCC WEather Processor (SWEP) 14
1.2.5 Evolutionary Issues 16
2.0 NEEDS AND BENEFITS 17
2.1 Principal Limitations with Today's System 17
2.2 User Needs - Long Term Goals 21
2.3 User Needs - Satisfiable in Near Term 28
2.4 Delay Costs and Accidents 33
2.4.1 Delays 33
2 . 4 • 2 Safety 35
3.0 USER FEATURES 39
3.1 PVD Display of Radar Weather Data - En Route and Terminal 41
3.1.1 Utility of Storm Cell Heights 49
3.2 En Route Controller Alphanumeric/Graphical Display 51
3.2.1 Alphanumeric Pages 51 •
3.2.2 Selectable Alphanumerics S2
3 .2.3 Graphics 54
iii
Section
3.3 Terminal Controller Alphanumeric Display
3.4 Flow Control/Supervision Console
3.5 TRACON Supervisor's Console
3.6 SCC Meteorologist
4.0 RECOMMENDED SYSTEM ARCHITECTURE
4.1 Overview
4.2 ARTCC WEather Processor (AWEP)
4.2.1 AWEP Processing
4.2.1.1 Radar netting
4.2.1.2 Radar performance monitoring
4.2.1.3 Very short range cell forecast
4.2.2 Data Storage and Management
4.2.2.1 Radar weather data
4.2.2.2 Local terminal observations from the TWEPs
4.2.2.3 Selected NDC products
4.2.2.4 Service A and C
4.2.2.5 PIREPs
4.2.2,6 Alert messages
4.2.3 Display Formatting and Automated Alerting
4.2.4 Data Communication
4.2.4.1 Data collection
4.2.4.2 Data distribution
4.3 TRACON WEather Processor (TWEP)
4.3.1 ASR Radar Data
4.3.2 WRAP at Airport
iv
Page
55
57 • 58
59
61
61
64
64
64
67
67
67
68
68
69
70
70
70
70
71
71
71
72
72
74
Section
4.3.3 Wind Shear and Wake Vortex 74
of
4.3.4 Automated Surface Observations - AV-AWOS, Semi 74 Automated LAWRS, AMOS, RAMOS~ etc.
4.3.4.1 Coordination with TWEP 74
4.3.4.2 TWEP management of surface observations 77
4.3.5 Other Functions 77
4.4 SCC WEather Processor (SWEP) 78
4.5 Communication Structure 81
4.5.1 Dial-Up Links - Communication Economy 85
5.0 THE ENGINEERING AND DEVELOPMENT PLAN 87
5.1 AWEP, TWEP, and SWEP Development 87
5.1.1 Processor Design and Interfacing 87
5.1.2 Coordination and Integration of Underway Sensor Developments - AV-AWOS, Semi-Automated LAWRS, Wind Shear/Wake Vortex, AMOS, RAMOS 89
5.1.3 Field Demonstration Testing and Upgrading 89
5.1.4 Improved PIREP Procedures 90
5.2 ASR Modification for Weather 91
5.2.1 Validation of the Severe Weather Hypothesis and Prototype Development 91
5.2.2 NAFEC Testing and Flight Tests 91
5.3 Joint Use Weather Radar (FAA, NWS, AWS) 92
5.3.1 Joint Use Feasibility ~tudy 92
5.3.2 Prototype Development 92
5.3.3 Field Demonstration 92
5.3.4 Interagency Planning 93
v
Section Page
APPENDICES
AI. Data Rates 94
Al.1 WRAP to AWEP 94
AI. 2 TWEP-AWEP 96
A1,2.1 TWEP to AWEP 97
AI. 2.2 AWEP to TWEP 98
Al. 3 SWEP-AWEP 98
A2. NWS Weather Communications 100
A3. Route Oriented PIREPs 104
A3.1 Overview 104
A3.2 Background 104
A3.3 Data Collection Method 105
A3.4 Manpower 106
ACKNOWLEDGEMENT 107
REFERENCES 108
•
vi
•
Figure
1. 2.1
1. 2.2
1. 2. 3
1. 2.4
1. 2. 5
2.1.1
2.2.1
2.2.2
3.0.1
3.1.1
3.1. 2
3.1. 3
3.1.4
3.1. 5
3.1.6
3.1. 7
3.2.1
3.3.1
4.1. 1
4.2.1
LIST OF ILLUSTRATIONS
Supporting communication network. 8
ARTCC weather processing and dissemination. 10
Candidate weather situation displays. 11
TRACON weather processing and dissemination. 13
Weather subsystem for ATC. 15
The ATC weather system today. 18
Chicago daily arrivals. 23
New York (Kennedy, LaGuardia, Newark) daily arrivals. 24
Weather subsystem for ATC user features. 40
Candidate weather situation display - current conditions. 42
Candidate weather situation display - 10 minute very short range forecast. 43
Candidate ARTS III weather situation DISPLAY no cell tops. 44
Candidate ARTS III weather situation DISPLAY no cell tops. 45
Candidate low reflectivity. fixed threshold weather contour. 46
Candidate high reflectivity fixed threshold weather contour. 47
Narrow band weather subsystem. 48
CRD display from MAPS demonstration. 53
Illustrative terminal controller CRD display, 56
Weather subsystem for ATC structure. 62
The ARTCC weather processor (AWEP). 65
vii
LIST OF ILLUSTRATIONS (Cont.)
Figure
4.2.2
4.3.1
4.3.2
4.4.1
4.5.1
4.5.2
5.0.1
A2.1
A2.2
Page
Radar netting. 66
TRACON WEather processor (TWEP). 73
Common terminal weather data base. 76
Recommended CFCF control room layout. 80
Overall INACS connectivity. 83
Weather data network. 84
The development plan. 88
NDC and SDC. 101
WSFO type configuration. 102
viii
AFOS
AMOS
• ARTCC
ARSR
ARTS
ASR
ATC
ATCRBS
AV-AWOS
AWANS
AWEP
AWS
BRITE
C
CAT
CFeF
CONUS
CRD
CRT
DABS
FAA
FSS
INACS
LAWRS
MAPS
MrI
NAFAX
NAFEC
NAS
NBWS
NDC
NMC
NWS
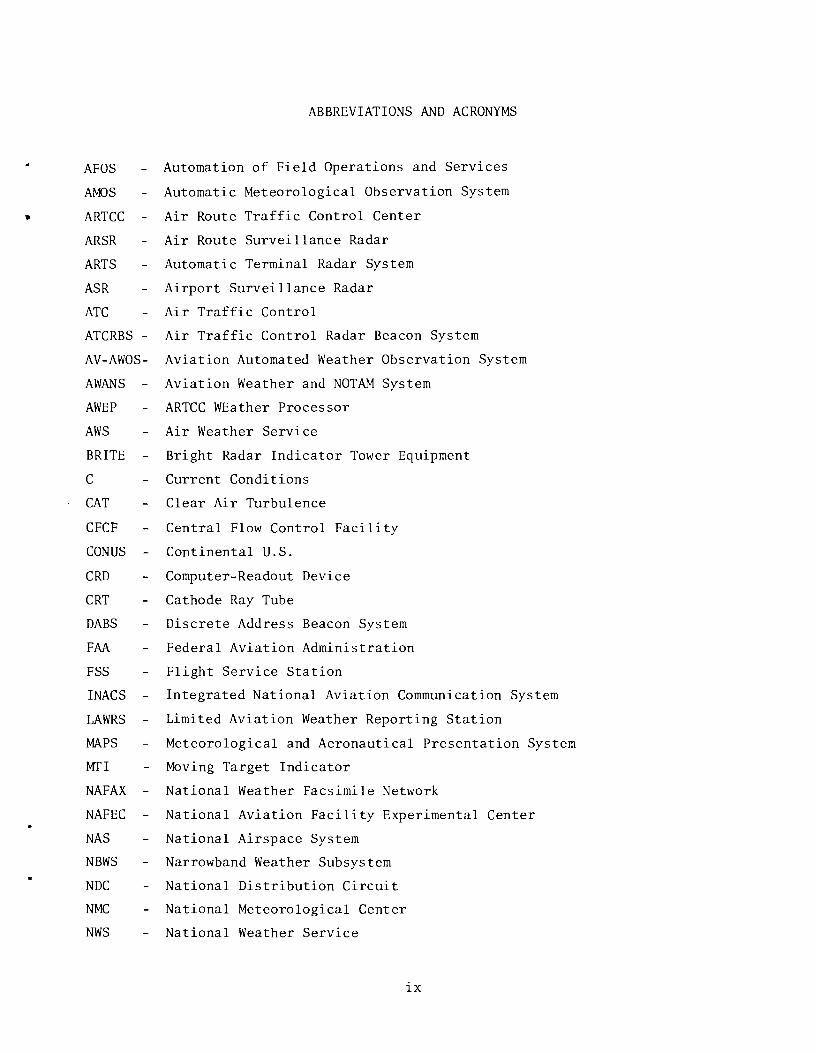
ABBREVIATIONS AND ACRONYMS
Automation of Field Operations and Services
Automatic Meteorological Observation System
Air Route Traffic Control Center
Air Route Surveillance Radar
Automatic Terminal Radar System
Airport Surveillance Radar
Air Traffic Control
Air Traffic Control Radar Beacon System
Aviation Automated Weather Observation System
Aviation Weather and NOTAM System
ARTCC WEather Processor
Air Weather Service
Bright Radar Indicator Tower Equipment
Current Conditions
Clear Air Turbulence
Central Flow Control Facility
Continental U.S.
Computer-Readout Device
Cathode Ray Tube
Discrete Address Beacon System
Federal Aviation Administration
Flight Service Station
Integrated National Aviation Communication System
Limited Aviation Weather Reporting Station
Meteorological and Aeronautical Presentation System
Moving Target Indicator
National Weather Facsimile Network
National Aviation Facility Experimental Center
National Airspace System
Narrowband Weather Subsystem
National Distribution Circuit
National Meteorological Center
National Weather Service
ix
Abbreviations (Cont.)
PIREP Pilot Report
PVD Plan View Display
RAMOS Remote Automatic Meteorological Observation System
R&D Research and Development
RVR Runway Visual Range
S Short Term (0-4 hr) Forecast
SCC System Command Center
SDC State Distribution Circuit
SSF System Support Facility
STC Sensitivity Time Control
SVR Slant Visual Range
SWAP Severe Weather Avoidance Plan
SWEP SCC WEather Processor
TCA Terminal Control Area
TIPS Terminal Information Processing System
TRACON Terminal Radar Control
TWEP TRACON WEather Processor
WBRR Weather Bureau Radar Remote
WMSC Weather Message Switching Center
WRAP Weather Radar for ATC Planning
WSA Weather Subsystem for ATC
WSFO Weather Service Forecast Office
Service A data:
SA Surface Observation
SW Supplementary Weather
SP Special Weather
FT Terminal Forecasts
FA Area Forecasts
WW Severe Weather Forecasts
WH Hurricane Advisories
NOSUMS - Notice to Airmen Summaries
x
Abbreviations (Cont.)
• FO Winds and Temperatures Aloft
WS SIGMENTS
WA AIRMETS
SO Radar Weather Reports
UA Pilot Reports
NOTAMS Notices to Airmen
AS Surface Analysis
FS Surface Forecast
xi
1.0 INTRODUCTION
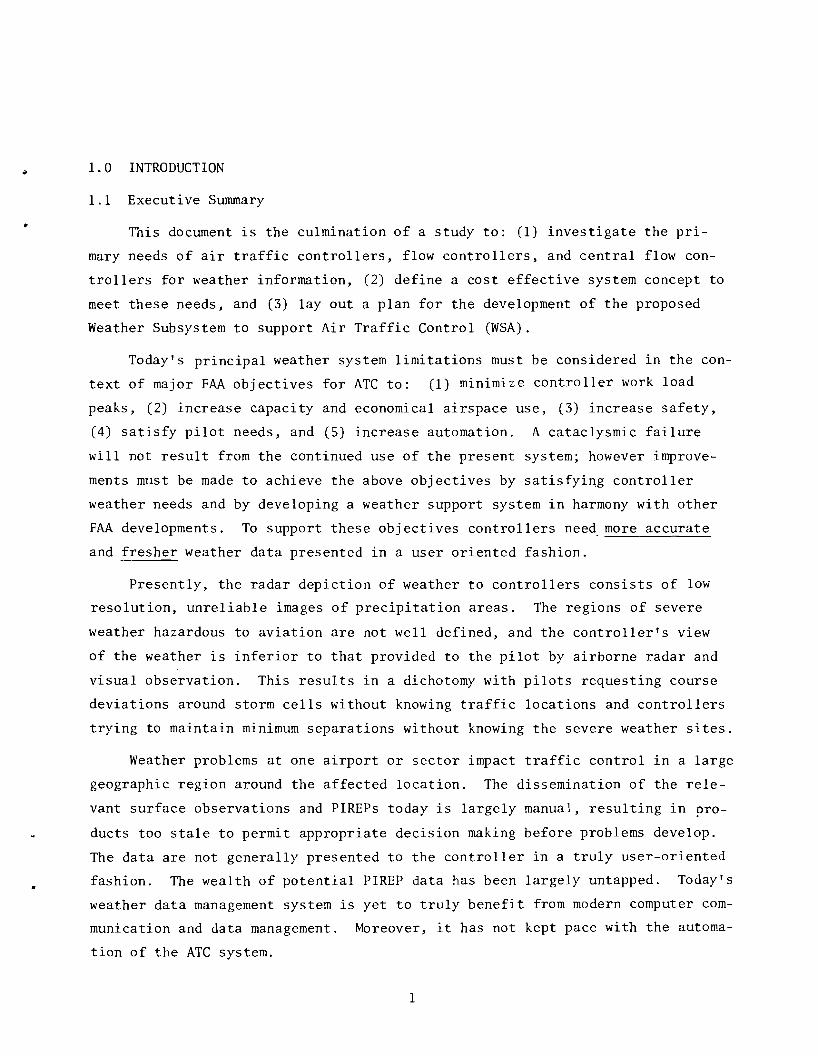
1.1 Executive Summary
This document is the culmination of a study to: (1) investigate the pri
mary needs of air traffic controllers, flow controllers, and central flow con
trollers for weather information, (2) define a cost effective system concept to
meet these needs, and (3) layout a plan for the development of the proposed
Weather Subsystem to support Air Traffic Control (WSA).
Today's principal weather system limitations must be considered in the con
text of major FAA obj ectives for ATC to: (1) minimize controller work load
peaks, (2) increase capacity and economical airspace use, (3) increase safety,
(4) satisfy pilot needs, and (5) increase automation. A cataclysmic failure
will not result from the continued use of the present system; however improve
ments must be made to achieve the above objectives by satisfying controller
weather needs and by developing a weather support system in harmony with other
FAA developments. To support these objectives controllers need. more accurate
and fresher weather data presented in a user oriented fashion.
Presently, the radar depiction of weather to controllers consists of low
resolution, unreliable images of precipitation areas. The regions of severe
weather hazardous to aviation are not well defined, and the controller's view
of the weather is inferior to that provided to the pilot by airborne radar and
visual observation. This results in a dichotomy with pilots requesting course
deviations around storm cells without knowing traffic locations and controllers
trying to maintain minimum separations without knowing the severe weather sites.
Weather problems at one airport or sector impact traffic control in a large
geographic region around the affected location. The dissemination of the rele
vant surface observations and PIREPs today is largely manual, resulting in pro
ducts too stale to permit appropriate decision making before problems develop.
The data are not generally presented to the controller in a truly user-oriented
fashion. The wealth of potential PIREP data has been largely untapped. Today's
weather data management system is yet to truly benefit from modern computer com
munication and data management. Moreover, it has not kept pace with the automa
tion of the ATC system.
1
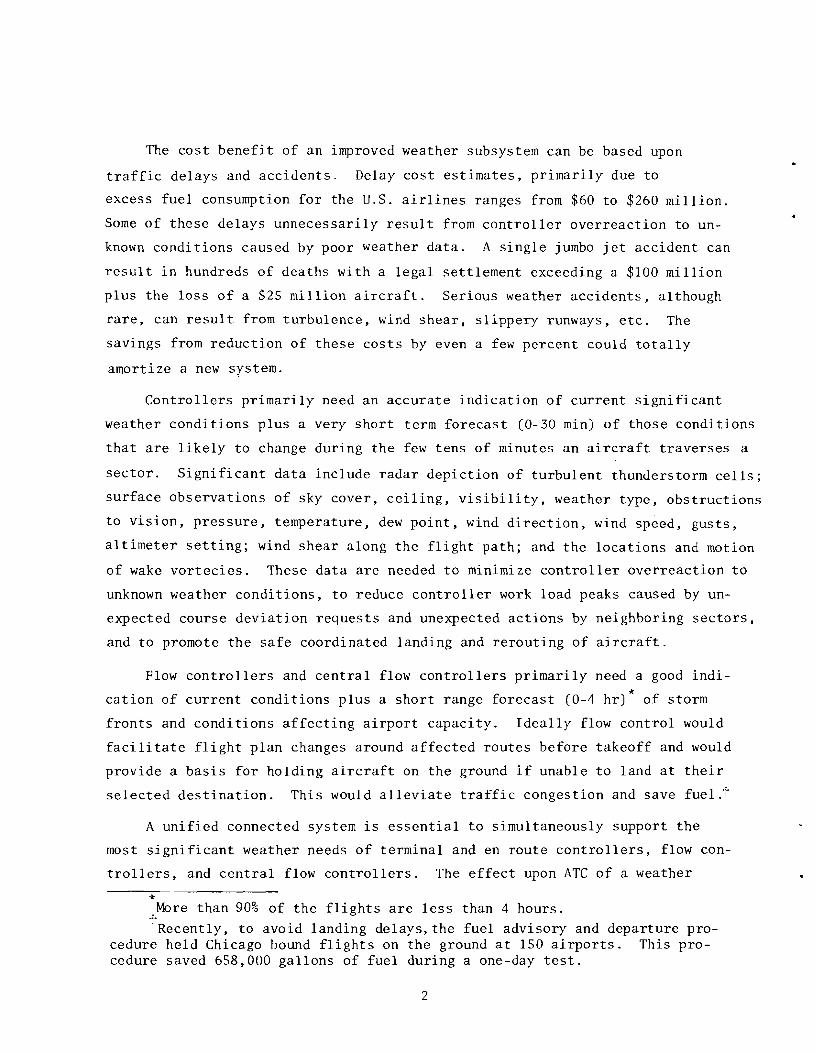
The cost benefit of an improved weather subsystem can be based upon
traffic delays and accidents_ Delay cost estimates, primarily due to
excess fuel consumption for the U.S. airlines ranges from $60 to $260 million.
Some of these delays unnecessarily result from controller overreaction to un
known conditions caused by poor weather data. A single jumbo jet accident can
result in hundreds of deaths with a legal settlement exceeding a $100 million
plus the loss of a $25 million aircraft. Serious weather accidents, although
rare, can result from turbulence, wind shear, slippery runways, etc. The
savings from reduction of these costs by even a few percent could totally
amortize a new system.
Controllers primarily need an accurate indication of current significant
weather conditions plus a very short term forecast (0-30 min) of those conditions
that are likely to change during the few tens of minutes an aircraft traverses a
sector. Significant data include radar depiction of turbulent thunderstorm cells;
surface observations of sky cover, ceiling, visibility, weather type, obstructions
to vision, pressure, temperature, dew point, wind direction, wind speed, gusts,
altimeter setting; wind shear along the flight path; and the locations and motion
of wake vortecies. These data are needed to minimize controller overreaction to
unknown weather conditions, to reduce controller work load peaks caused by un
expected course deviation requests and unexpected actions by neighboring sectors,
and to promote the safe coordinated landing and rerouting of aircraft.
Flow controllers and central flow controllers primarily need a good indi
cation of current conditions plus a short range forecast (0-4 hr) * of storm
fronts and conditions affecting airport capacity. Ideally flow control would
facilitate flight plan changes around affected routes before takeoff and would
provide a basis for holding aircraft on the ground if unable to land at their
selected destination. This would alleviate traffic congestion and save fuel. t
A unified connected system is essential to simultaneously support the
most significant weather needs of terminal and en route controllers, flow con
trollers, and central flow controllers. The effect upon ATC of a weather
* More than 90% of the flights are less than 4 hours. tRecently, to avoid landing delays, the fuel advisory and departure pro
cedure held Chicago bound flights on the ground at 150 airports. This procedure saved 658,000 gallons of fuel during a one-day test.
2
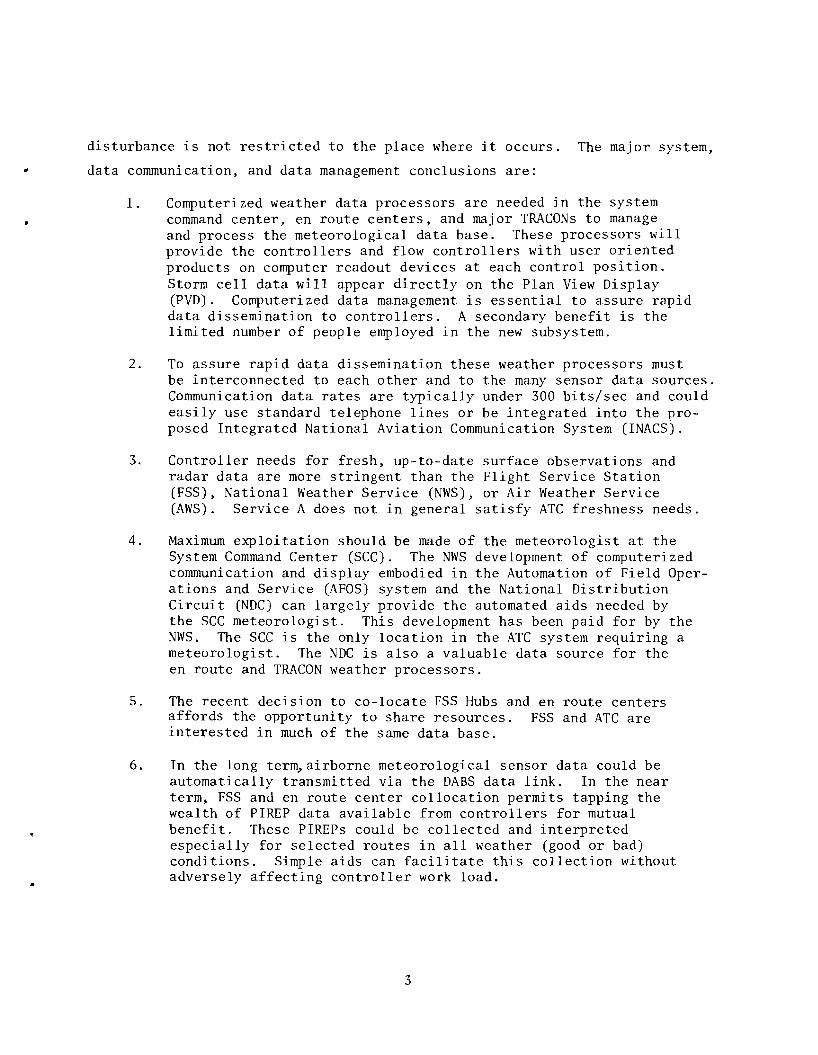
disturbance is not restricted to the place where it occurs. The major system,
data communication, and data management conclusions are:
1. Computerized weather data processors are needed in the system command center, en route centers, and major TRACONs to manage• and process the meteorological data base. These processors will provide the controllers and flow controllers with user oriented products on computer readout devices at each control position. Storm cell data will ap~ear directly on the Plan View Display (PVD). Computerized data management is essential to assure rapid data dissemination to controllers. A secondary benefit is the limited number of people employed in the new subsystem.
2. To assure rapid data dissemination these weather processors must be interconnected to each other and to the many sensor data sources. Communication data rates are typically under 300 bits/sec and could easily use standard telephone lines or be integrated into the proposed Integrated National Aviation Communication System (INACS).
3. Controller needs for fresh, up-to-date surface observations and radar data are more stringent than the Flight Service Station (FSS), National Weather Service (NWS), or Air Weather Service (AWS). Service A does not in general satisfy ATC freshness needs.
4. Maximum exploitation should be made of the meteorologist at the System Command Center (SCC). The NWS development of computerized communication and display embodied in the Automation of Field Operations and Service (AFOS) system and the National Distribution Circuit (NDC) can largely provide the automated aids needed by the SCC meteorologist. This development has been paid for by the NWS. The SCC is the only location in the ATC system requiring a meteorologist. The NDC is also a valuable data source for the en route and TRACON weather processors.
5. The recent decision to co-locate FSS Hubs and en route centers affords the opportunity to share resources. FSS and ATC are interested in much of the same data base.
6. In the long term~airborne meteorological sensor data could be automatically transmitted via the DABS data link. In the near term, FSS and en route center collocation permits tapping the wealth of PIREP data available from controllers for mutual benefit. These PIREPs could be collected and interpreted especially for selected routes in all weather (good or bad) conditions. Simple aids can facilitate this collection without adversely affecting controller work load.
3
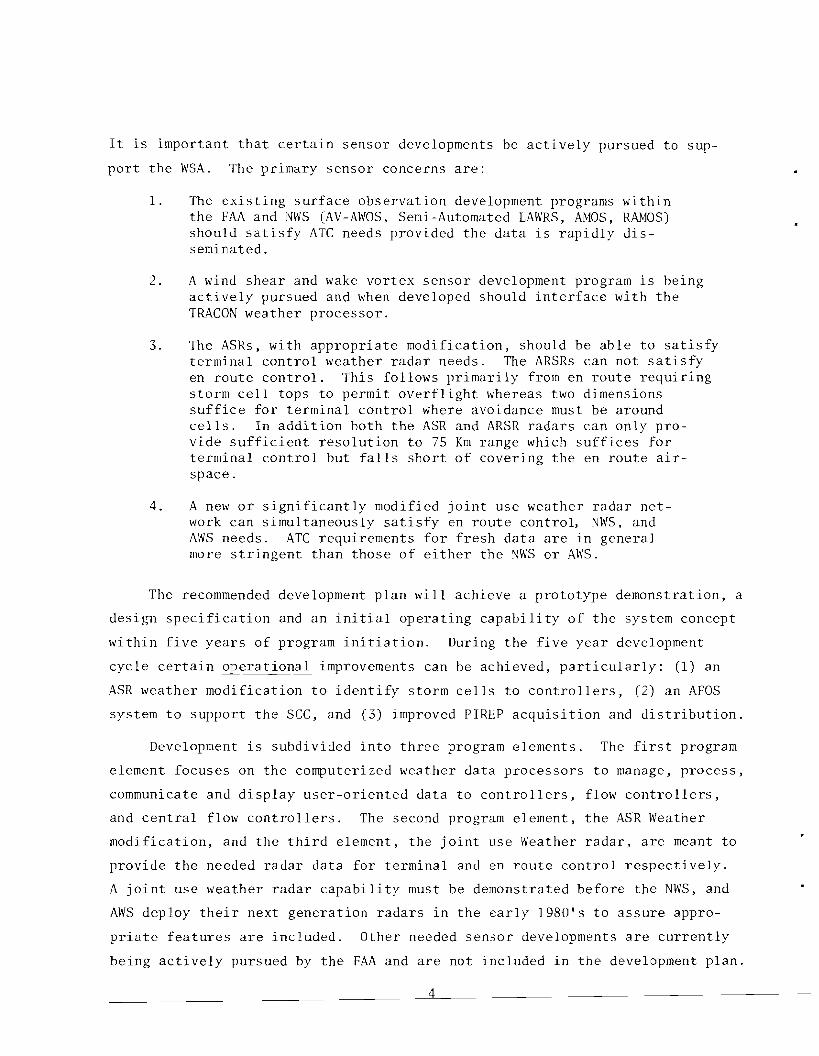
It is important that certain sensor developments be actively pursued to sup
port the WSA. The primary sensor concerns are:
1. The existing surface observation development programs within the FAA and NWS (AV-AWOS, Semi-Automated LAWRS, AMOS, RAMOS) should satisfy ATC needs provided the data is rapidly disseminated.
2. A wind shear and wake vortex sensor development program is being actively pursued and when developed should interface with the TRACON weather processor.
3. The ASRs. with appropriate modification, should be able to satisfy terminal control weather radar needs. The ARSRs can not satisfy en route control. This follows primarily from en route requiring storm cell tops to permit overflight whereas two dimensions suffice for terminal control where avoidance must be around cells. In addition both the ASR and ARSR radars can only provide sufficient resolution to 7S Km range which suffices for terminal control but falls short of covering the en route air space.
4. A new or significantly modified joint use weather radar network can simultaneously satisfy en route control, NWS, and AWS needs. ATC requirements for fresh data are in general more stringent than those of either the NWS or AWS.
The recommended development plan will achieve a prototype demonstration, a
design specification and an initial operating capability of the system concept
within five years of program initiation. During the five year development
cycle certain operational improvements can be achieved, particularly: (1) an
ASR weather modification to identify storm cells to controllers, (2) an AFOS
system to support the SCC, and (3) improved PIREP acquisition and distribution.
Development is subdivided into three program elements. The first program
element focuses on the computerized weather data processors to manage, process,
communicate and display user-oriented data to controllers, flow controllers,
and central flow controllers. The second program element, the ASR Weather
modification, and the third element, the joint use Weather radar, are meant to
provide the needed radar data for terminal and en route control respectively.
A joint use weather radar capability must be demonstrated before the NWS, and
AWS deploy their next generation radars in the early 1980's to assure appro
priate features are included. Other needed sensor developments are currently
being actively pursued by the FAA and are not included in the development plan.
4
Subsection 1.2 provides an overview of the major elements and features
in the recommended system. Those readers, without the need for details, may
skip to the development plan in Section 5. The body of the report is meant • for the most interested reader and is divided into four sections with sup
porting appendices. Section 2 considers the principle limitations of today's
system, the long-term needs and those needs that can be satisfied by the early
1980's. Section 3 describes the recommended system from a user's viewpoint
focussing attention on the meteorological products and displays. Section 4
considers the system architecture to interconnect the data sources, process
the data to satisfy the needs,and supply the products described in Sections 2
and 3. Section 5 considers a plan for the development of the proposed subsystem .
•
5
1.2 The Recommended System Concept
The proposed system concept has been developed to eliminate the major prob
lems with today's system. The recommended system will provide rapid generation
and dissemination of reliable user oriented observations and very short range
severe weather forecasts (up to 30 min) to facilitate controller planning. This
new capability will: 1) reduce weather induced controller work load peaks, 2) per
mit controllers to coordinate and preplan aircraft rerouting for weather avoid
ance, 3) achieve an improved balance between the inefficiency of overreaction
and the essentials of safety, 4) facilitate controller response to pilot requests
for weather data on a work load permitting basis and 5) enable the issuance of
accurate ATC weather advisories. The system will also provide rapid generation
and dissemination of reliable short range forecasts (up to 4 hours) to permit
early introduction of necessary flow control procedures. This new capability
will: 1) decrease problems for controllers, 2) increase acceptance of flow
control, and 3) increase traffic flow efficiency without decreasing safety.
The system will employ small computer processors at each en route center
and major terminal area for weather data management, automated alerting, weather
radar netting, and automated generation of very short range severe weather fore
casts. The terminal ASR radars are to be modified and the en route ARSR network
is to be augmented by joint use (NWS, FAA. AWS) Weather Radars to provide accu
rate, fresh, high resolution data for storm cell depiction and automatic genera
tion of very short range severe weather forecasts for controllers. The colloca
tion of automated Flight Service Station Hubs with ARTCCs will facilitate rapid
dissemination and interpretation of PIREPs. Display of weather data to control
lers is to be provided by an upgraded version of the Meteorological and Aeronau
tic Presentation System (MAPS) at the ARTCCs and the Terminal Information
Presentation System (TIPS) at the major terminals; radar weather data is to be
available on the Plan View Display (PVD). Separate weather display consoles
are provided for central flow control, flow control and terminal supervisor
use. A telephone line computer communication network will interconnect existing
and future sensors for rapid dissemination of weather information. The full
data base available in real time to the System Command Center meteorologist
6

through the computer managed system will facilitate analysis of impending weather
problems before they produce ATC problems. The short range forecasts of severe
weather, generated automatically, will be monitored by the SCC meteorologist and
will be available for flow control applications. These data are to provide a
nationwide capability similar to that provided to the New York Center by the
resident meteorologist as a part of the Severe Weather Avoidance Plan (SWAP).
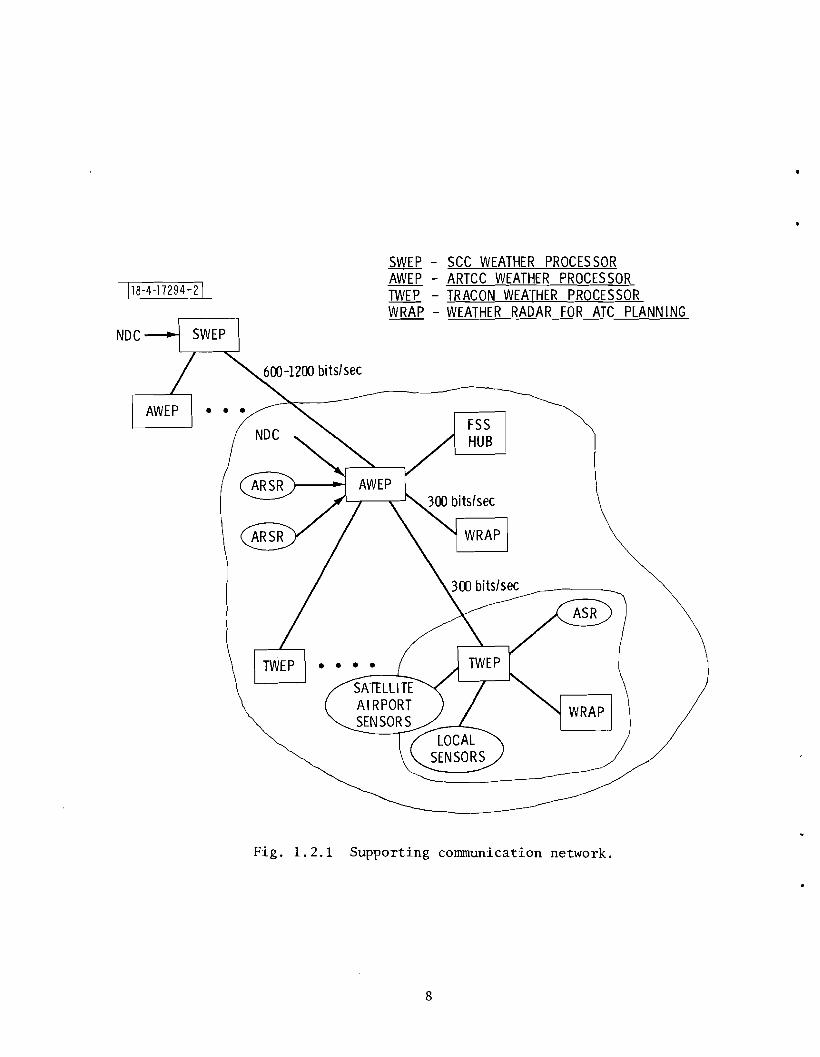
1.2.1 The Supporting Communication Network
The communication network required to support the system can easily
be provided by low data rate telephone links; see Fig. 1.2.1. The three new
components comprising the ATC weather subsystem include: 1) the ~CC WEather
frocessor (SWEP), 2) the ARTCC WEather Processor (AWEP), and 3) the IRACON
WEather frocessor (TWEP), A new joint use (NWS, AWS, FAA) Weather Radar for
ATC flanning (WRAP), network, provides storm cell data.
Data flow requirements demand connectivity between SWEP and each of the
20 AWEPs (within the Continental United States) and between each AWEP and its
associated TWEPs. The low required data rates permit use of standard telephone
lines or a network such as the proposed Integrated National Airspace Communica
tions System (INACS). The particular communication structure is not critical
providing data delays are very small. Moreover, where geographically advantageous,
single links can service several AWEPs, although redundant routing is planned
for system reliability. The interchange of data with the FSS Hubs is facilitated
by collocation with the ARTCCs. Digitized low rate weather radar data is pro
vided to the en route centers by the WRAPs. A single link can serve several
WRAPs where geographically advantageous. Some weather radar data will be
provided through the narrow band links with the associated ATC surveillance
radars.
The system generates its own weather data, but also depends on available
standard weather products as currently distributed over Services A and C from the
Weather Message Switching Center (WMSC). Preferably, in the future, these
products will be provided by the National Weather Service through connection
FAA WJH Technical Center
7 I"IIII"IIIIIIIIUIII~IIIIUII~IIIIIIIIIIIIIIII 00090271
SWEP - SCC WEATHER PROCESSOR AWEP - ARTCC WEATHER PROCESSOR
l18-4-17294-2 L TWEP - TRACON WEATHER PROCESSOR WRAP - WEATHER RADAR FOR ATC PLANNING
FSS HUB
Fig. 1.2.1 Supporting communication network.
8
with the National Distribution Circuit (NDC). Observation data collected by
the ATC facilities will be input through this same network.
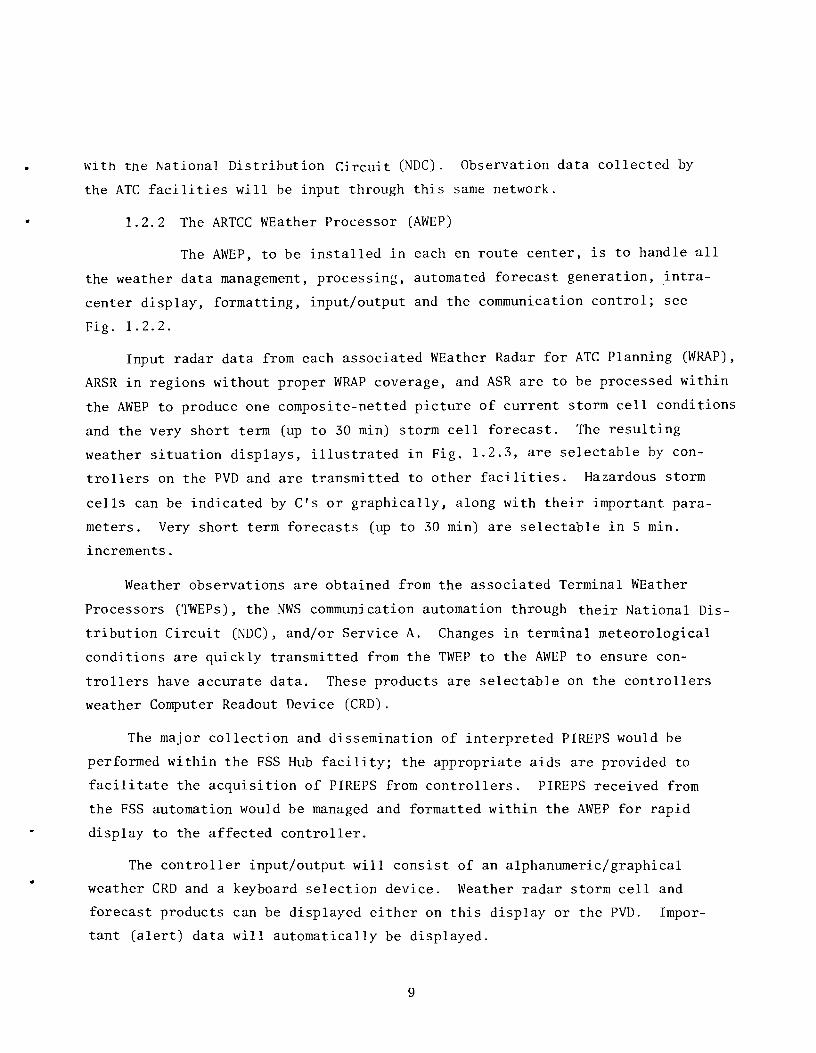
• 1.2.2 The ARTCC WEather Processor (AWEP)
The AWEP, to be installed in each en route center, is to handle all
the weather data management, processing, automated forecast generation, intra
center display, formatting, input/output and the communication control; see
Fig. 1.2.2.
Input radar data from each associated WEather Radar for ATC Planning (WRAP),
ARSR in regions without proper WRAP coverage, and ASR are to be processed within
the AWEP to produce one composite-netted picture of current storm cell conditions
and the very short term (up to 30 min) storm cell forecast. The resulting
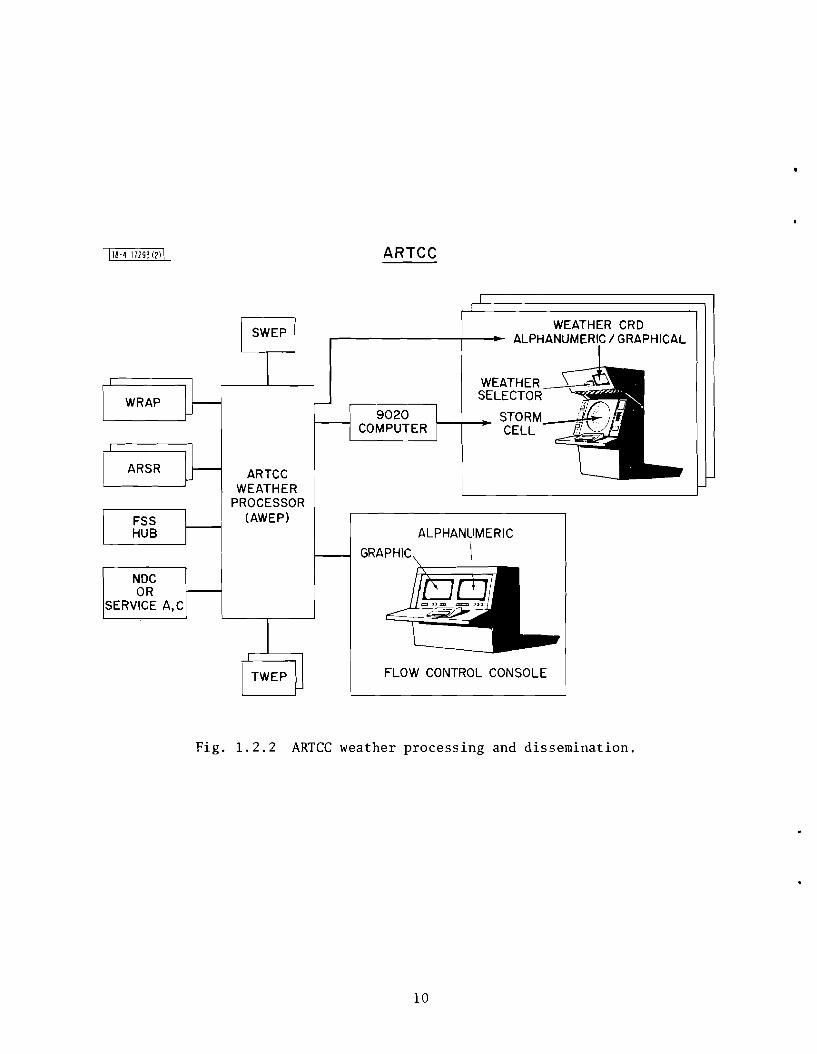
weather situation displays, illustrated in Fig. 1.2.3, are selectable by con
trollers on the PVD and are transmitted to other facilities. Hazardous storm
cells can be indicated by C's or graphically, along with their important para
meters. Very short term forecasts (up to 30 min) are selectable in 5 min.
increments.
Weather observations are obtained from the associated Terminal WEather
Processors (TWEPs), the NWS communication automation through their National Dis
tribution Circuit (NDC), and/or Service A. Changes in terminal meteorological
conditions are quickly transmitted from the TWEP to the AWEP to ensure con
trollers have accurate data. These products are selectable on the controllers
weather Computer Readout Device (CRD).
The major collection and dissemination of interpreted PIREPS would be
performed within the FSS Hub facility; the appropriate aids are provided to
facilitate the acquisition of PIREPS from controllers. PIREPS received from
the FSS automation would be managed and formatted within the AWEP for rapid
display to the affected controller.
The controller input/output will consist of an alphanumeric/graphical
weather CRD and a keyboard selection device. Weather radar storm cell and
forecast products can be displayed either on this display or the PVD. Impor
tant (alert) data will automatically be displayed.
9
118-4-17293 (2l! ARTCC
WEATHER~':l SELECTOR
9020 f---+---- STORM._~ COMPUTER CELL
WEATHER CRD,....--------1---- ALPHANUMERIC I GRAPHICAL
WRAP
ARSR ARTCC WEATHER
PROCESSOR
U (AWEP)FSS ALPHANUMERIC,--_H_U_B__I I
GRAPHIC
NDC OR
SERVICE A,C
FLOW CONTROL CONSOLE
Fig. 1.2.2 ARTCC weather processing and dissemination.
10
EN ROUTE1-4-176361 CURRENT CELLS 10 MINUTE PREDICTION
•
ARTs-m
LEGEND
C - HAZARDOU S STORM CELL
TAG PARAMETERS:
S- SEVERE }H- HEAVY M _ MODERATE FIRST LEDER
L-L1GHT G - GROWING}D- DECAYING SECOND LEDER
DIAMETER IN MILES - FIRST NUMBER
HEIGHT IN THOUSANDS OF FEET - SECOND NUMBER (en route only)
Fig. 1.2.3 Candidate weather situation displays .
•
11
The flow controller input/output will consist of a graphical and textual
display with keyboard data recall and entry. All controller weather products
plus a short range forecast (up to 4 hours) of storm front activity, provided
by the System Command Center WEather Processor (SWEP),will be selectable by the
flow controller. Where necessary the SCC meteorologist will interpret the data
for the flow controller via a voice phone link.
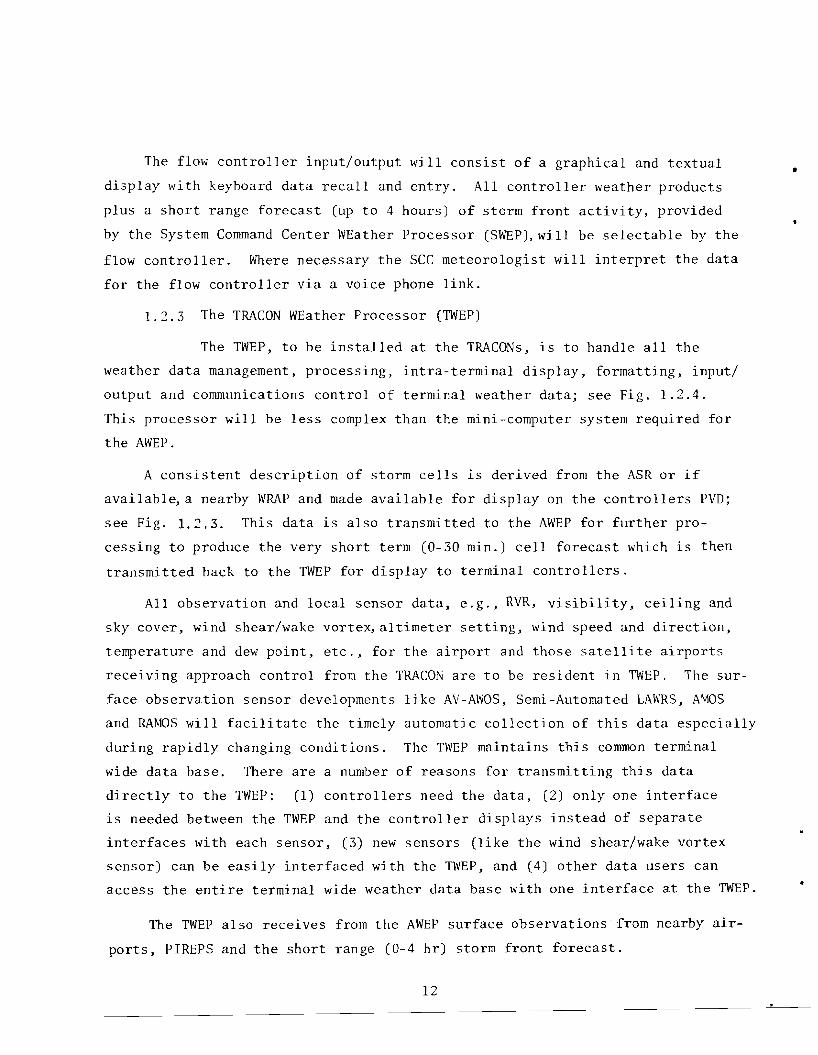
1.2.3 The TRACON WEather Processor (TWEP)
The TWEP, to be installed at the TRACONs, is to handle all the
weather data management, processing, intra-terminal display, formatting, input/
output and communications control of terminal weather data; see Fig. 1.2.4.
This processor will be less complex than the mini-computer system required for
the AWEP.
A consistent description of storm cells is derived from the ASR or if
available, a nearby WRAP and made available for display on the controllers PVD;
see Fig. 1.2.3. This data is also transmitted to the AWEP for further pro
cessing to produce the very short term (0-30 min.) cell forecast which is then
transmitted back to the TWEP for display to terminal controllers.
All observation and local sensor data, e.g., RVR, visibility, ceiling and
sky cover, wind shear/wake vortex, altimeter setting, wind speed and direction,
temperature and dew point, etc., for the airport and those satellite airports
receiving approach control from the TRACON are to be resident in TWEP. The sur
face observation sensor developments like AV-AWOS, Semi-Automated LAWRS, AMOS
and RAMOS will facilitate the timely automatic collection of this data especially
during rapidly changing conditions. The TWEP maintains this common terminal
wide data base. There are a number of reasons for transmitting this data
directly to the TWEP: (1) controllers need the data, (2) only one interface
is needed between the TWEP and the controller displays instead of separate
interfaces with each sensor, (3) new sensors (like the wind shear/wake vortex
sensor) can be easily interfaced with the TWEP, and (4) other data users can
access the entire terminal wide weather data base with one interface at the TWEP.
The TWEP also receives from the AWEP surface observations from nearby air
ports, PIREPS and the short range (0-4 hr) storm front forecast.
12
• 118-4-11292121 I TRACON
•
WRAP
LOCAL OBSERVATIONS
SATELLITE AIRPORT
OBSERVATIONS
ASR
WEATHER CRD ....-------+.- ALPHANUMERIC
~4--~STORM CELL
WEATHER SELECTOR ~~~
TRACON WEATHER
PROCESSOR (TWEP)
SUPERVISOR'S CONSOLE
Fig. 1.2.4 TRACON weather processing and dissemination.
13
The controller input/output will consist of a textual CRD display, a •graphic display on the PVD, and a keyboard selection device. Important (alert)
data will automatically be displayed. The user input/output will facilitate
rapid data retrieval. The same data will also be provided to the tower.
The supervisors input/output will consist of a single graphical/textual
display with keyboard data recall and entry. All controller products plus a
short range (up to 4 hour) storm front forecast will be selectable. Where
necessary the SCC meteorologist will interpret the data via a voice phone link.
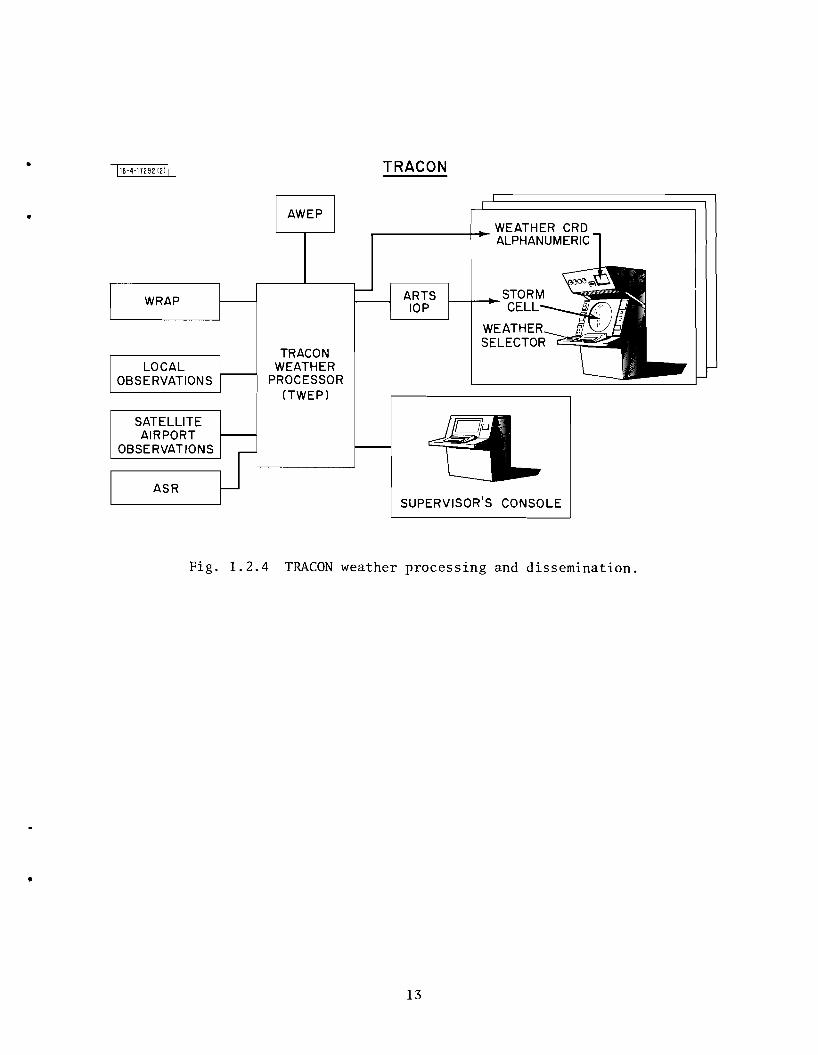
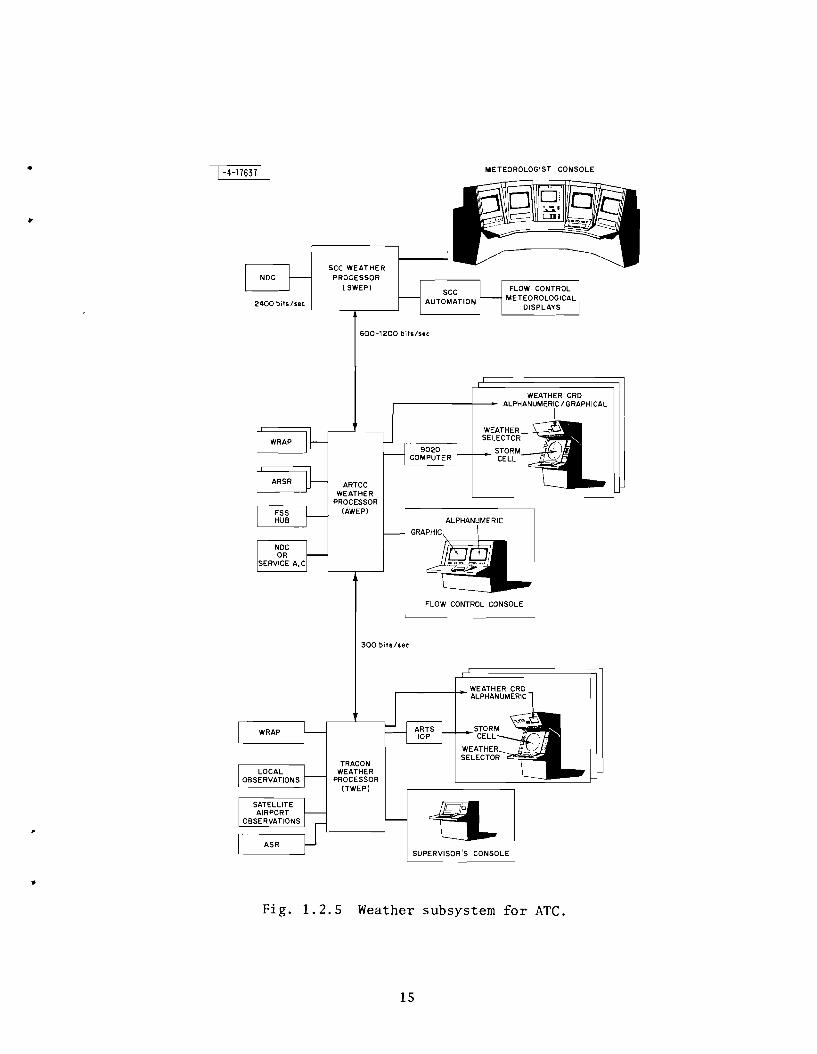
1.2.4 The SCC WEather Processor (SWEP)
The SWEP, to be installed at the System Command Center, is to
handle all of the weather data management, processing, automated forecasting,
display formatting, input/output, communications control and interface with
the SCC automation system. See Fig. 1.2.5 for its relationship to the rest of
the system.
The SCC has the only full time meteorologist (an NWS employee) in the ATC
system. To effectively serve flow control, his data base must be as good or bet
ter than that available in the en route centers and terminals; this is not always
the case today. An AFOS terminal (the NWS's computerized communication, pro
cessing and display terminal) is recommended to form the nucleus of the SWEP.
It is well matched to the meteorologists needs: (1) minimizing his clerical
tasks, (2) providing good access to the NWS data base, (3) it has been developed
for NWS meteorologists, (4) it will be a low cost solution having been developed
by the NWS, and (5) it should be upgradable for the special aviation weather
tasks.
Input radar data from the AWEP is to be processed within the SWEP to pro
vide a national netting of current storm activity plus the short range (0 to
4 hr) forecast. This data will be presented to the meteorologist who will re
view and monitor system operation, and provide special interpretation to the
central flow and flow controllers. The meteorologist will have the authoriza
tion, responsibility and support equipment to change incorrect weather products
based upon his assessment of new data. Short range forecast data and associated
meteorologist's inputs will be formatted for transmission to the Al\~Ps. noutine
14
METEOROLOGIST CONSOLE1-4-176371
•
SCC WEATHER PROCESSOR
( SWEP)
2400blts/sec L .-__--'
FLOW CONTROL METEOROLOGICAL
DISPLAYS
600-1200 blts/sec
ARTCC WEATHER
PROCESSOR (AWEP)
WEATHER __~~~
SELECTOR
STORM CELL
WEATHER CRO ALPHANUMERIC / GRAPHICAL
FLOW CONTROL CONSOLE
300 bits/sec
:EEL~~~~~>-'''''''''='C'",L, TRACON
WEATHER PROCESSOR
(TWEPI
STORM CELL
SUPERVISOR'S CONSOLE
•
Fig. 1.2.5 Weather subsystem for ATC.
15
weather observations and forecasts will be obtained from the NDC; changing ter
minal conditions and PIREPs will be obtained from the AWEPs. Built-in auto
mated alert features will provide the meteorologist with early data on emerging ~
problems. Graphic and alphanumeric products prepared by the meteorologists
will be formatted for presentation to the SCC flow controller and transmission
to the AWEPs. The meteorologist's input/output will consist of several graphic/
textual displays, and operator entry devices. Communications with TWEPs will
take place through the associated AWEPs. Phone voice links will permit special
interpretations when necessary to flow controllers and terminal supervisors.
1,2.5 Evolutionary Issues
In developing this concept for a weather subsystem it was recognized
that nothing should impinge upon the controller's primary responsibility of keeping
aircraft separated. The fresh and accurate weather data will provide controllers
a capability to stay on top of the weather picture and thereby reduce the number
and impact of unexpected pilot requests for deviations. The controller has com
plete freedom to select or not select displays he deems necessary. No demand is
made upon the controller to act as a link between the weather information system
and the pilot; however the mechanisms are provided to enhance a common under
standing of the weather situation for mutual benefit.
This system concept provides the air traffic controller with the same types
of weather information he receives today, i.e., radar weather data, surface
observations, and PIREPs. The major departure from the present system is that
this data will be fresh and accurate. This is accomplished with modern computer
processing, data management and communication. No totally new sensors are
recommended for the FAA. A modification is recommended for the ASRs and the
next generation of NWS and AWS radars should be designed for compatibility
with FAA needs in the en route centers. Full utility is taken of NWS communi
cations, automation, and the present and planned surface observation network.
This is not a totally new subsystem, but rather one that takes full advantage
of the NWS present and planned capabilities as well as using state-of-the
~rt technology to augment and upgrade today's extensive ATC weather subsystem.
16
• 2.0 NEEDS AND BENEFITS
• 2.1 Principal Limitations with Today's System
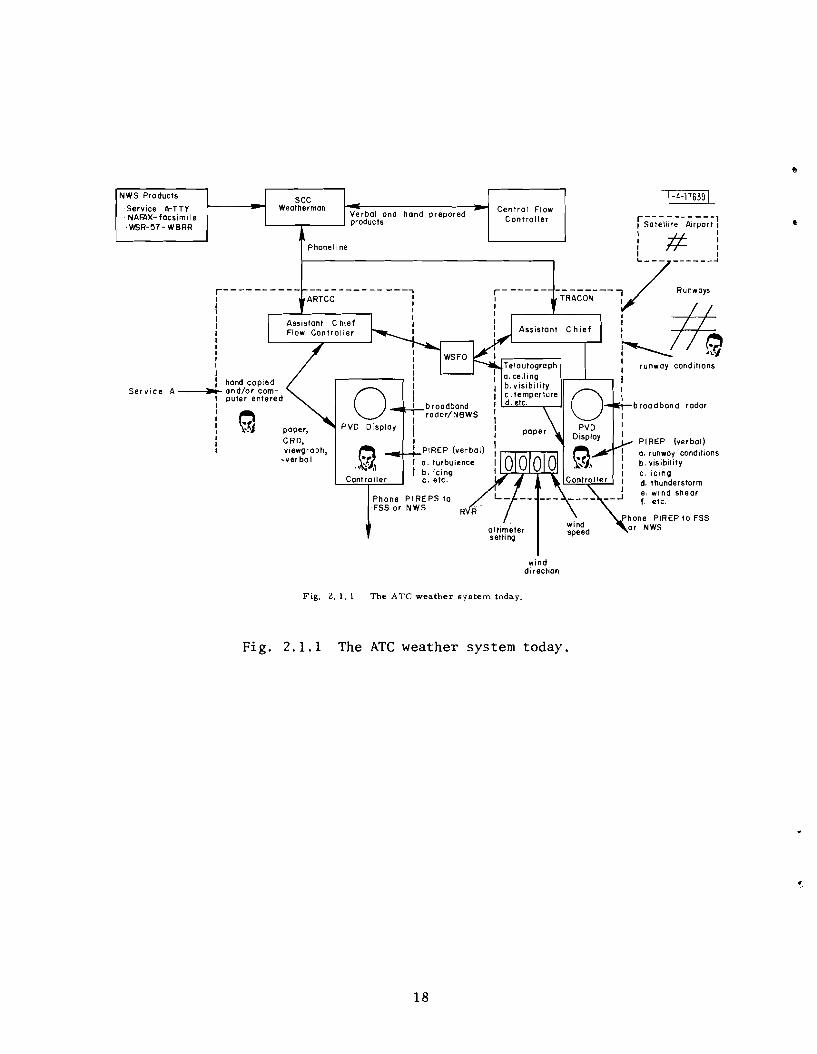
The current weather support system has evolved differently in each control
facility depending upon local conditions (Fig. 2.1.1). For instance, en route
controllers receive Service A data in a variety of ways - paper, Computer Read
out Device (CRD) , viewgraph, or verbal. TRACON controllers receive observations
from satellite airports by phone and in some instances the flight data printer.
Some data is informally passed along from controller to controller along the
handoff lines. Between facilities verbal information is transmitted by phone
lines. Within facilities much data is hand copied or verbally transmitted.
Controllers are individualsl ; some make use of only essential weather data
while others actively use and seek additional information for their own traffic
planning and to advise pilots. This variability exists even for controllers
occupying the same sector. It was thus concluded that any weather system must
allow for flexibility in controller use and should not be inflicted upon him
arbitrarily.
The differences in methods of acquiring, displaying and using weather
information is not necessarily a limitation of the present system. The limita
tion must be considered in the context of: (1) controller workload, (2) capacity,
(3) safety, (4) pilot needs, and (5) the ability to support automation. A few
illustrative problems reflect upon these limitations:
Controllers become visibly uneasy during adverse weather conditions. Primarily this results from a breakdown in the well ordered traffic flow, forcing reroutings. This increases his work load and to compensate controllers will increase the separation distance between aircraft thereby frequeptly unnecessarily decreasing capacity.
Severe weather, particularly that due to convective thunderstorms, causes significant disruptions to the safe, orderly flow of aircraft and an increase in controller work load .• Presently, the radar depiction of weather to controllers consists of low resolution, unreliable images of precipitation
17
PI REP Iverbal) o. runway conditions b, visibility c, icing d. thunderstorm e, WInd shear f, etc.
b roo d bon d radar
I I I
a.ceiling b. visibility c. temper1ure d. etc. broadband
radar/NBWS
PIREP (verbal)
o. turbulence
-------------, ARTCC :
I I I I
poper, CRD, viewgroph ,
-ver bo I
put6' entered
NWS Pro ducts 1-4-176391SCC Weatherman'Service A-TTY Central FlowVe rbol and hand prepared. NAFAX- focslm i Ie r-- - -------1
·'M)R-57- WBRR Controllerproducts I Satellite Airport I
I I#I I Phonel i ne I I
r--------- -i,",,,----7-:"::.~J Assistant Chief f..--#~
ITelautograph runwo~ conditionsI
hand copied Service A --4"~ and/or com
I I I I I I I I I
.~ b. icing
Controller c. etc.
Phone PI REPS to FSS or NWS
wind di rection
Fig. 2. 1. 1 The ATe weather system today.
Fig. 2.1.1 The ATe weather system today.
18
areas. The regions of severe weather hazardous to aviation are not well defined2 which limits the ability of controllers to assist pilots without airborne radar. In addition the controllers image of the weather is inferior to that provided
• to the pilot by airborne radar and visual observations. This results in a dichotomy with pilots requesting course deviation around storm cells without knowing traffic locations and controllers trying to maintain minimum separations without knowing the severe weather sites. One aircraft may deviate around a storm cell to the right and the very next aircraft may request a deviation to the left. Even the request for a deviation from the first aircraft may surprise the controller. This disadvantage hampers coordinated rerouting and the efficient exercise of air traffic control procedures today3 and may impact the computerized automation plans associated with conflict resolution, Intermittent Positive Control (IPC), and Metering and Spacing (M&S).
Weather problems at one airport or sector impact traffic control in a large geographical region around the affected location. Thunderstorms, fog, rain, changing winds, etc., can reduce the acceptance rate, change the approach fixes, close a runway, or change the active runway. Such events may force the rerouting of aircraft through a number of sectors which aggravates the controllers peak work load when he is caught by surprise. This is especially severe when it involves a line of closely spaced aircraft and the next sector suddenly refuses to accept additional aircraft. The largely manual handling of surface observations and PIREPs, and the delays associated with Service A result in data frequently being too stale to permit appropriate decision making before problems develop. PIREPS, a valuable source for adverse conditions, are frequently lost or delayed because the work required for distribution conflicts with higher priority tasks. The slow dissemination and the fragmented uninterpreted form makes them almost valueless for traffic control and of marginal use for preflight planning. The orderly collection of the wealth of PIREP data from controllers and pilots, and the rapid dissemination of interpreted reports to affected controllers and the FSSs would significantly enhance the utility of this data source. In the near term, a PIREP specialist could collect, interpret, and disseminate the data. In the long term, to relieve the pilot, the air to ground digital data link could automatically acquire data from airborne sensors.
The above are a few of the most illustrative limitations. Two conclusions
can be drawn; for weather information to be useful it must be accurate and fresh.
• The following sections consider the specific meteorological weather needs and
the benefits to be derived.
19
First the specific en route, terminal and flow control needs for weather
data are considered, ignoring the ability of present technology to economically
or physically meet these needs. These should be viewed as long term goals and,
where possible, the WSA architecture should permit the incorporation of these
features as the technology advances. The second part discusses the needs which
can be met with current technology and implemented between now and the early
1980's. They are incorporated into the system concept described in Sections 3
and 4. The reader is encouraged to carefully read Section 2.2, since there are
a number of concepts and definitions presented which are necessary for a full
understanding of the system description. Finally the costs related to delays
and accidents are considered.
20
2.2 User Needs - Long Term Goals•
In this section, the weather information needed within the ATC system to
meet the objective of improved safety, efficiency, and economy are discussed .• Attention is restricted to only the most important needs of en route controllers,
terminal controllers, and flow controllers. For convenience, the en route and
terminal controllers will sometimes be referred to simply as controllers. Flow
controllers at each ARTCC and the central flow controllers at the SCC are both
referred to here as flow controllers.
Although the needs of the three types of terminal controilerJ3 (approach,
departure and tower) are different, it is premature to precisely specify the
individual differences. At this stage ln the WSA development, it is necessary
to determine what meteorological information is needed by at least one terminal
controller. If a meteorological product is available in the terminal the dis
semination to all users desiring the product is easy and can be left to the
final design. This is consistent with the Terminal Information Processing
System (TIPS) studyl which concluded that, "Meteorological and Status Informa
tion were determined to be required by all primary and secondary control posi
tions. Its display should be adaptable to individual control positions." They
also observed that the personal preferences of individual controllers occupying
the same position varied. With computer generated display of weather products,
each controller could select the desired products as he occupied a position by
keying the number of a personal computer file listing the desired data.
ATC automation has reached the point whereby traffic flows in an orderly
pattern and control uncertainties have been largely removed, except under adverse
weather conditions. The unpredictable or unexpected deviation request around a
thunderstorm, the unexpected refusal of an adjacent sector to accept any more
aircraft, the unexpected aborted landing, and many others, have a severe impact
upon the controller work load peaks and severely impedes orderly traffic flow.
Alerting the controller to conditions which will affect the aircraft in his sec
• tor permits the appropriate preplanning, smooths out the work load peaks and
facilitates the flow of traffic without overreaction. In general, controllers
need good weather information:
21
to reduce work load peaks
to facilitate coordinated routing and rerouting
for hazard avoidance
to balance overreaction and safety
to respond to pilot needs
Controllers need a detailed description of current conditions and a forecast of
those conditions that are likely to change during the few tens of minutes an
aircraft traverses a sector.
Flow controllers, on the other hand, are more concerned with how many air
craft an air route or terminal can accommodate and are not particularly interested
* in specific aircraft. A subsynoptic description of conditions within an en
route center's control area thus satisfies the flow controller's needs. This
should include forecasts of meteorological conditions that will exist along a
route or at a terminal when an aircraft is scheduled to arrive. Ideally, flight
plan changes would be made before an aircraft takes off, or an aircraft would
be held on the ground if unable to land at its destination, thus avoiding the
excess fuel consumption and airborne congestion in the terminal area. A reli
able short range forecast for a period less than 4 hours would take care of the
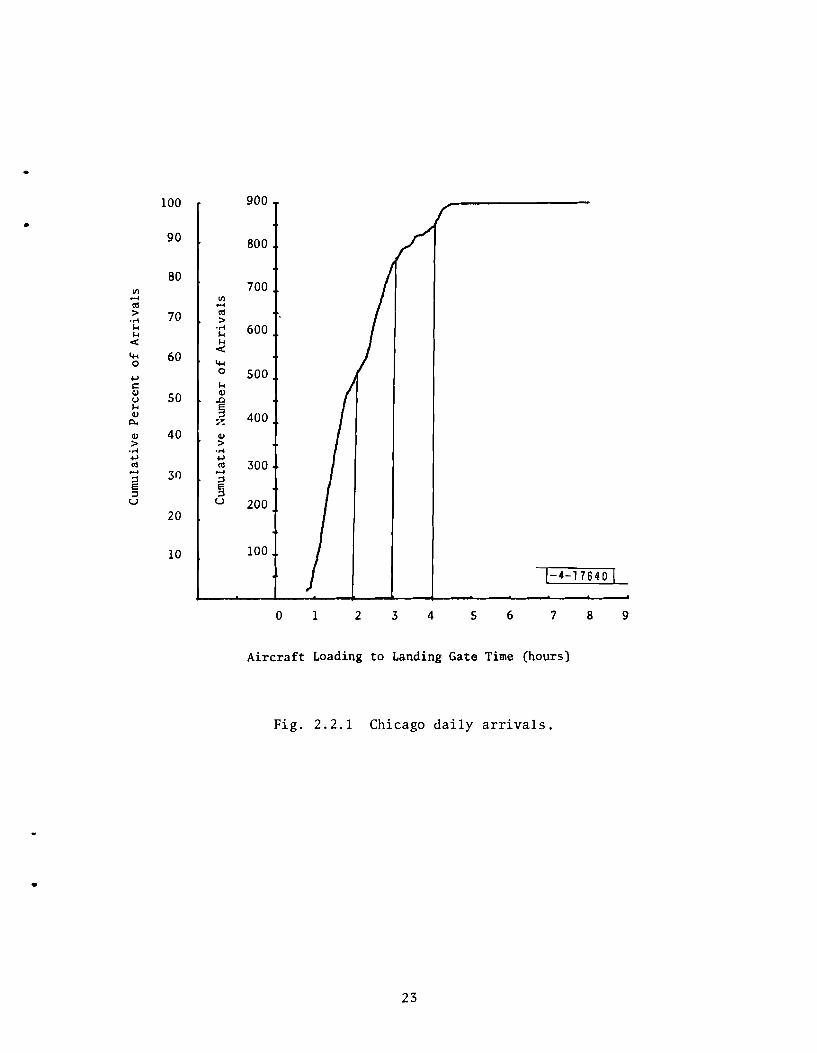
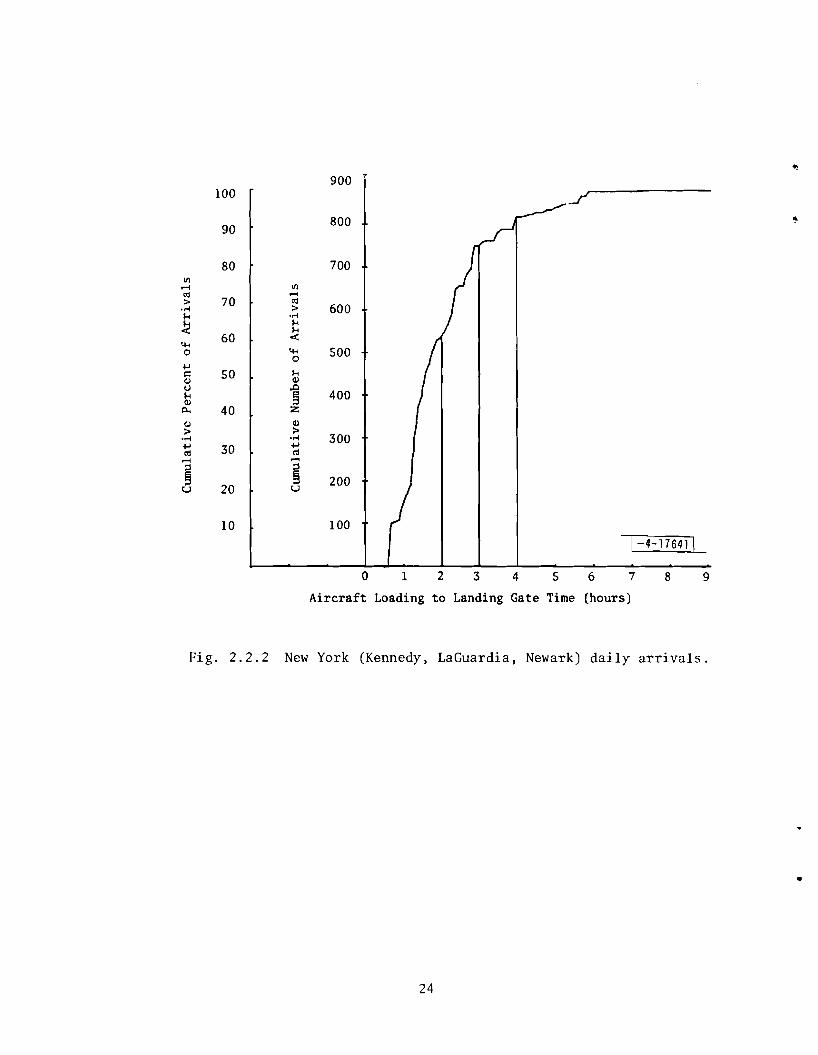
majority of aircraft being handled by the ATC system. For ~xampleJ the number
of arrivals at Chicago and New York vs. Aircraft Loading to Landing Gate Time
are plotted in Fig. 2.2.1 and 2.2.2. A 4 hour forecast would affect 93% of the
aircraft before takeoff for either of these destination airports.
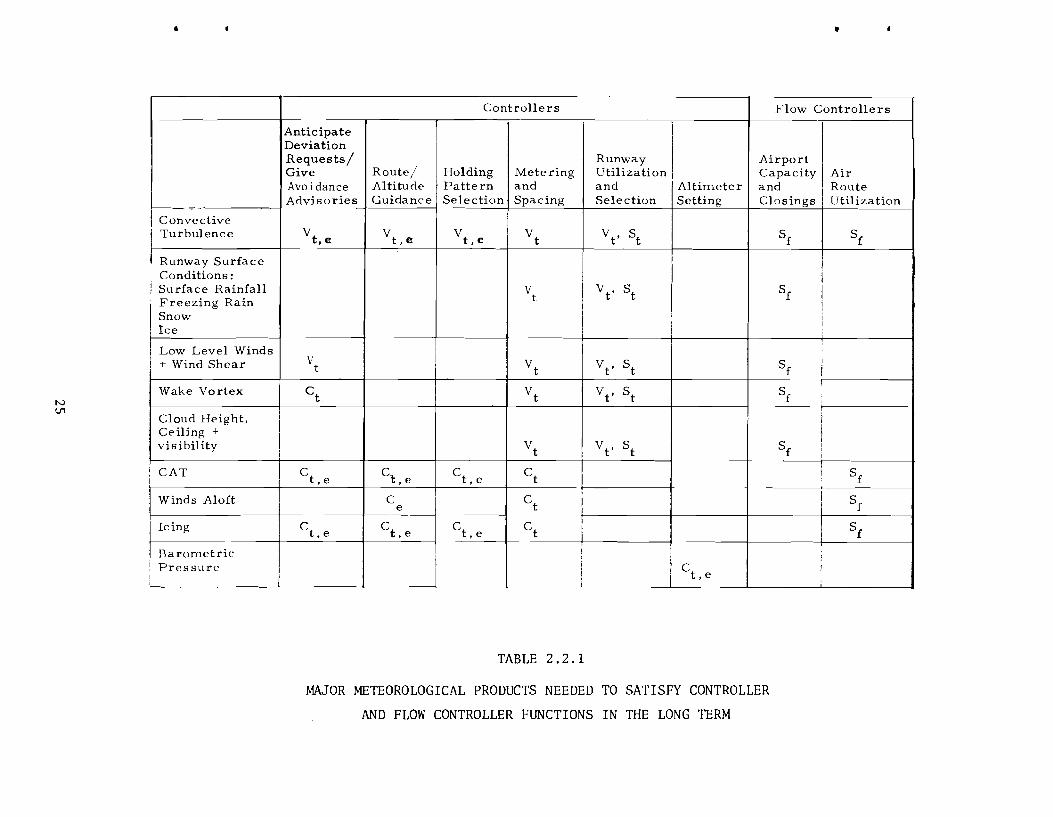
In Table 2.2.1, the most important weather product needs of controllers
and flow controllers are tabulated. Relevant weather phenomena are listed along
the left side and various ATC activities are listed along the top. The ATC
activities are divided into the two user classes, controllers and flow controllers.
The letters C, V and S stand for the time frame needed to describe the meteoro
logical phenomena where:
C stands for the best available description of "current conditions." ..It may be based upon the last available measurements or Pilot Reports (PIREPs) .
* Subsynoptic refers to spatial scales between 100 and 1000 km.
22
100 900
• 90 800
III .... cO
80
III.... 700
> 'M H H
70 cO >
'M H 600
"'" H
.... 0
60 "'".... +-' ~
0
H 500
CIl 0 SO CIl
.0 H CIl
Cl. 9 7 400
CIl 40 CIl >
'M > 'M
+-' cO .... ;:l 3(}
+-' cO.... ;:l
300
e ;:l 3 u u 200
20
10 100
0 1 2 3 4
-[-4-17640 L
5 6 7 8
Aircraft Loading to Landing Gate Time (hours)
Fig. 2.2.1 Chicago daily arrivals .
•
23
9
100
90
80 til .... cd > 70 .~
H H c:(
60'H 0
+.l I=: 50CI) () H CI)
p.. 40 CI)
> .~
+-' 30cd .... :l § u 20
10
~
900 _/
..800
700
til .... cd > 600 .~
H H
c:(
'H 5000
H CI)
..c 9 400 z CI)
> .~ 300+-' cd .... § 200 u
100
l-4-17641 L 0 1 2 3 4 5 6 7 8 9
Aircraft Loading to Landing Gate Time (hours)
Fig. 2.2.2 New York (Kennedy, LaGuardia, Newark) daily arrivals.
•
24
• •
Anticipate Deviation Requests/ Give Avoidance
. Advisories
Vt,e
j Runway Surface Conditions:
I Surface Rainfall Freezing Rain Snow Ice
Low Level Winds + Wind Shear V
t
Vt,e
N (J'I
Wake Vortex
Cloud Height, Ceiling + visibility
C t
CAT C t , e Ct,e
Controllers Flow Controllers
Vt, e Vt Vt , St Sf Sf
V t
Vt , St Sf
Vt
Vt
Vt ' St
Ve St
Sf
Sf I I
Ct,e
Vt
C t
Vt ' St
I I I Sf
I
'Sf
Winds Aloft
1 Icing
Barometric I Pressure J
I I j
Ct,e
Co
r--ct,eI I I C,
I Ct,e CtL I __~
I I
I
C t , eI
I
I
t-I ----"
Sf
Sf
I
TABLE 2.2.1
MAJOR METEOROLOGICAL PRODUCTS NEEDED TO SATISFY CONTROLLER
AND FLOW CONTROLLER FUNCTIONS IN THE LONG TERM
V stands for "very short range forecast." It includes a meso-scale * description of current conditions plus a prediction of conditions in a few tens of minutes (i.e .• a time frame matched to the dwell time of an aircraft in a sector). It may be based upon current measurements and PIREPs.
5 stands for a "short range forecast" for a period up to 4 hours. It includes a subsynoptic description of current conditions plus a series of forecasts from 1/2 to 4 hours. It may be based upon last available measurements, PIREPs and NW5 forecast products.
The subscripts "t". "e". or "f" in the table indicate that the product is
needed by terminal, en route, or flow controllers, respectively. Generally, C
and V products are for use by controllers. Meteorological phenomena indicated
with a C do not change quickly enough. or the effect of meteorological changes
are not relevant enough to require a very short range forecast. Items indicated
with a V, as for example convective turbulence, do change significantly in the
few tens of minutes an aircraft traverses a sector. Most short range forecasts,
5, are to assist flow controller planning. The terminal is also interested in a
short range forecast to plan for the runway configuration which will maximize its
capacity. The absence of an entry in the table means that the impact of the
meteorological phenomena, although perhaps of interest, is not considered signi
ficant enough to call for a forecast product.
The primary user of the forecast product is indicated in the table; however,
there may be secondary users. For example, en route controllers also have a
use for terminal weather. but their needs are secondary to those of the terminal
controller. In other words. the en route controller's needs for terminal weather
are not sufficient to justify developing a terminal forecast just for him; how
ever. if one exists, then this information should be made available. Knowledge
of weather conditions outside the controller's sector, primarily in adjacent
sectors and nearby terminals, enables the controller to preplan for the effect
of control actions in neighboring sectors. It also permits the controller, time
permitting, to assist the pilot.
* Mesoscale refers to spatial scales between 1 and 100 km.
26
It is important to note that a C, V, or S product for different users may
not be the same. For example, a very short range forecast of convective turbulence
• intended to assist a terminal controller in runway selection must have finer
spatial resolution than that needed by an en route controller, i,e., the spatial
resolution must be matched to the flexibility the controller has in using the
airspace .
•
27
2.3 User Needs - Satisfiable ln Near Term •
Many of the weather data entries shown in Table 2.2.1 cannot effectively
be provided with today's state of the art. The objective between now and the
early 1980's should be to satisfy a selected subset of the product needs. Fea
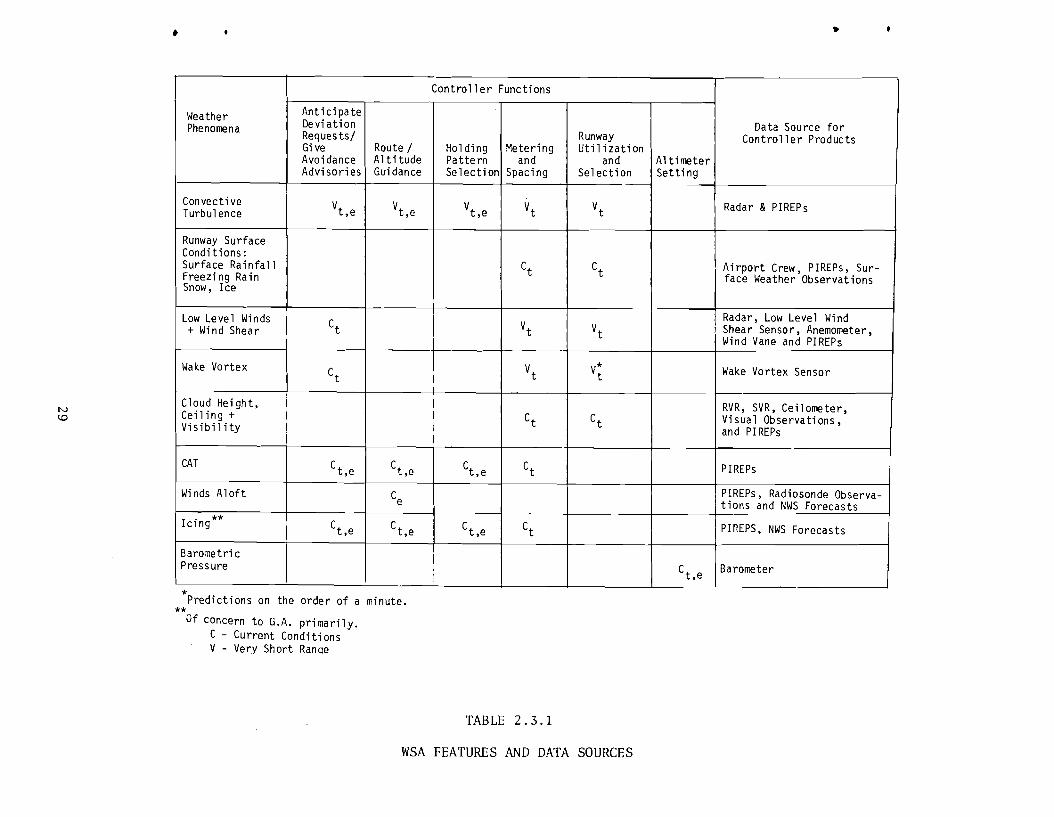
tures which should be included in this next step are tabulated in Table 2.3.1
along with the data sources. The motivation behind this table was to extract
the weather products from Table 2.2.1 for which there are promising solutions
from both technical and economy viewpoints. The most important aspect of this
next step is in the hazardous weather area with thunderstorms, low-level wind
shear and wake vortices having special attention.
With modern digital radar processing~ preferably using a pencil beam radar,
thunderstorm cell locations, severity, height and diameter, plus a very short
range forecast (V) of these parameters would be available for graphical display
upon controller PVDs (this is described further in Section 3.1). The very short
range cell prediction would be based on the recent movement of current cells and
the expected growth of new cells. These products are for use by controllers ln
determining where the hazardous conditions are now and where they will most
likely be up to a few tens of minutes from now. They are designed to help the
controller coordinate rerouting and respond to requests for help in avoiding
hazardous conditions. The time span of the prediction is designed to match the
transition time of an aircraft in his sector. The spatial resolution is designed
to span features that cannot be avoided such as runways, approach and departure
routes, and holding areas. For these forecasts, the severe weather conditions
are defined by small local reflectivity increases (cells) on radar observations
of the weather. Ground clutter and anomalous propagation (a serious problem with
the Narrowband Weather Subsystem) are largely eliminated. Objective forecast
techniques (computer forecasts) are required to process the available data in a
timely manner so the controller is aware of the hazardous conditions before they
occur, not after. This improved capability is not intended to remove the respon
sibility for thunderstorm avoidance from the cockpit. However, if the controller
can preplan for, instead of react to, deviation requests his work load and job
tension are decreased and the capacity, especially in the terminal area should
increase.
28
• •
N \D
Weather Phenomena
Controller Functions
Data Source for Controller Products
Anticipate Devi ation Requests/Gi ve Avoidance Advi sori es
Route /Altitude Gui dance
Holding Patte rn Selection
Meteri ng and
Spacing
Runway Util ization
and Selection
Altimeter Setting
Convect; ve Turbul ence
Vt,e Vt,e Vt,e Vt Vt Radar & PIREPs
Runway Surface Conditions: Surface Rainfall Freezing Rain Snow, Ice
Ct Ct Airport Crew, PIREPs, Surface Weather Observations
Low Level Winds + Wind Shear Ct Vt Vt
Radar, Low Level Wind Shear Sensor, Anemometer, Wind Vane and PIREPs
Wake Vortex Ct Vt v*t Wake Vortex Sensor
Cloud Hei ght, Ceiling + Visibil ity
Ct Ct RVR, SVR, Ceilometer, Visual Observations, and PIREPs
CAT Ct,e Ct,e Ct,e Ct PIREPs
Winds Aloft Ce PIREPs, Radiosonde Observations and NWS Forecasts
Icing ** Ct,e Ct,e Ct,e Ct PIREPS, NWS Forecasts
Barometric Press ure
Ct,e Barometer
*Predictions on the order of a minute. ** Of concern to G.A. primarily.
C - Current Conditions V - Very Short Ranoe
TABLE 2.3.1
WSA FEATURES AND DATA SOURCES
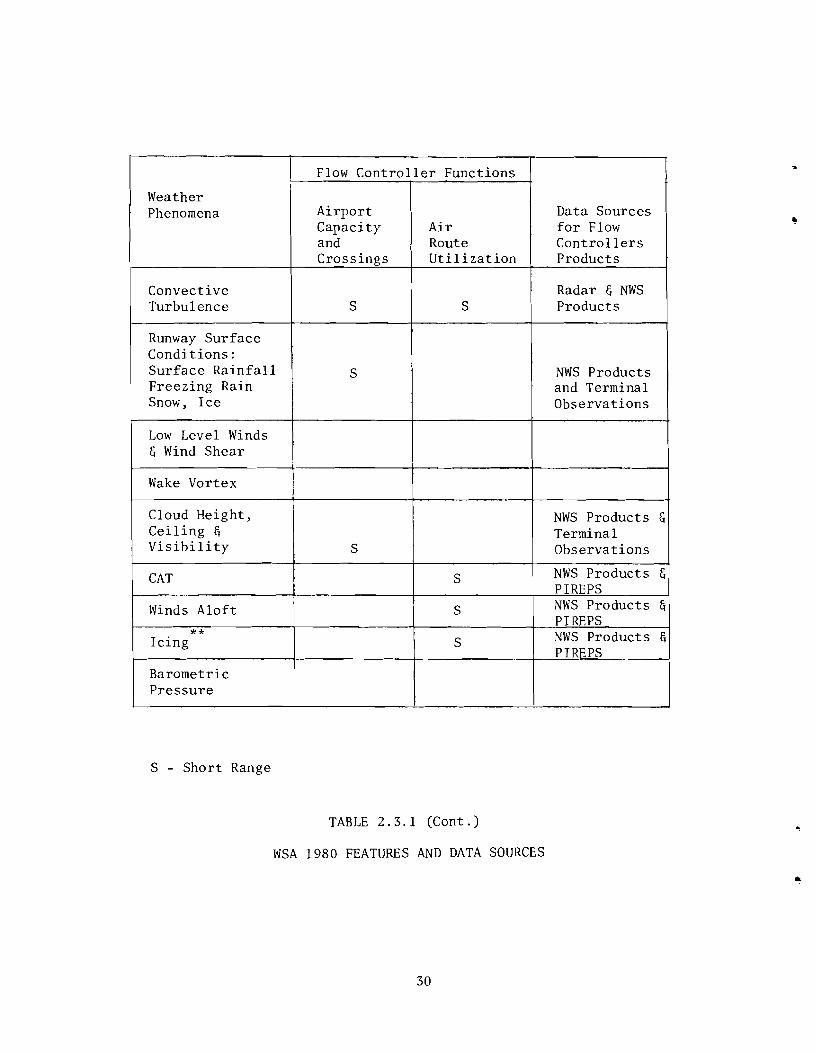
Weather Phenomena
Flow Controller Functions
Airport Capacity and Crossings
Air Route Utilization
Convective Turbulence S S
Runway Surface Conditions: Surface Rainfall Freezing Rain Snow, Ice
S
S
S
S
Low Level Winds & Wind Shear
Wake Vortex
Cloud Height, Ceiling & Visibili ty S
CAT
Winds Aloft
**Icing
Barometric Pressure
Data Sources for Flow Controllers Products
Radar & NWS Products
NWS Products and Terminal Observations
NWS Products & Terminal Observations
NWS Products & PIREPS NWS Products & PlREPS NWS Products & PIREPS
S - Short Range
TABLE 2.3.1 (Cont.)
WSA 1980 FEATURES AND DATA SOURCES
•
30
A second, longer time span, short range forecast (up to 4 hour) is needed
to anticipate larger areas or sectors where thunderstorms will occur. This fore
cast is based upon radar data, surface observations and NWS products. The purpose • of this forecast is for use in planning air route changes to keep traffic away
from areas where deviations and resulting traffic delays will occur. The time
span of interest is governed by the time required to effectively reroute the
traffic and by the time the severe weather system will affect particular routes.
The spatial resolution is governed by the size of severe weather systems such as
squall lines or rain bands responsible for closing a route or terminal. These
short range forecast techniques must detect disturbances that will develop into
hazardous conditions before they are evident on radar and must predict the develop
development, motion, and decay of the hazardous convective activity. Computer
generated objective forecasts are needed to interpret the large amounts of data
available for forecast preparation in a timely manner.
The two other weather related phenomena, low-level wind shear and wake
vortices are particular hazards to landing aircraft. With accurate measure
ments of wake vortex locations and prediction of their movement, landing separa
tions could be minimized with the associated increase in terminal capacity.
The development of sensors for both phenomena is being actively pursued under
FAA sponsorship.
Notice that many of the data sources in Table 2.3.1 are quite similar to
those used today. The WSA will provide better acquisition, distribution and
display of these data. These data sources may not completely satisfy controller
needs as, for example, PIREPs for CAT, winds aloft, and icing. With PIREPs,
the controller can only obtain data from the airspace where there are aircraft,
and the controller must rely upon pilot cooperation. The transmission of PIREPs
via radio is very cumbersome and much data is either lost, misreported, or
never obtained. A digital data link is needed to automatically obtain airborne
meteorological measurements for automatic processing without pilot or controller
involvement. It is unlikely that a digital data link will be sufficiently•
deployed for this purpose during this next WSA development step (1980).
Thus, PIREPs will have to be treated in a largely manual manner as they are
today with hopefully more orderly collection and dissemination procedures.
31
The above discussion focuses upon ATe needs; the system to implement the
results in Table 2.3.1 are described in Sections 3 and 4. This architecture
stresses a netted system which avoids duplication and integrates the many sep
arate sensor developments into a unified system, thereby minimizing processor
and communication costs. The design is flexible to accommodate the evolutionary
changes which will certainly come about.
32
2.4 Delay Costs and Accidents
Delays and accidents are very costly to aviation and even a few percent
decrease in their costs justify a significant expenditure in developing
the WSA. It is impossible to quantify the actual delay and accident reduction
resulting from the recommended system. Nor is it possible to quantify the cost
benefit from reducing controller tension and work load peaks. However, it is
shown below that delays, especially in flight, annually cost the airlines tens
to hundreds of millions of dollars. Similarly, each accident of a jet aircraft
can exceed a hundred million dollars.
2.4.1 Delays
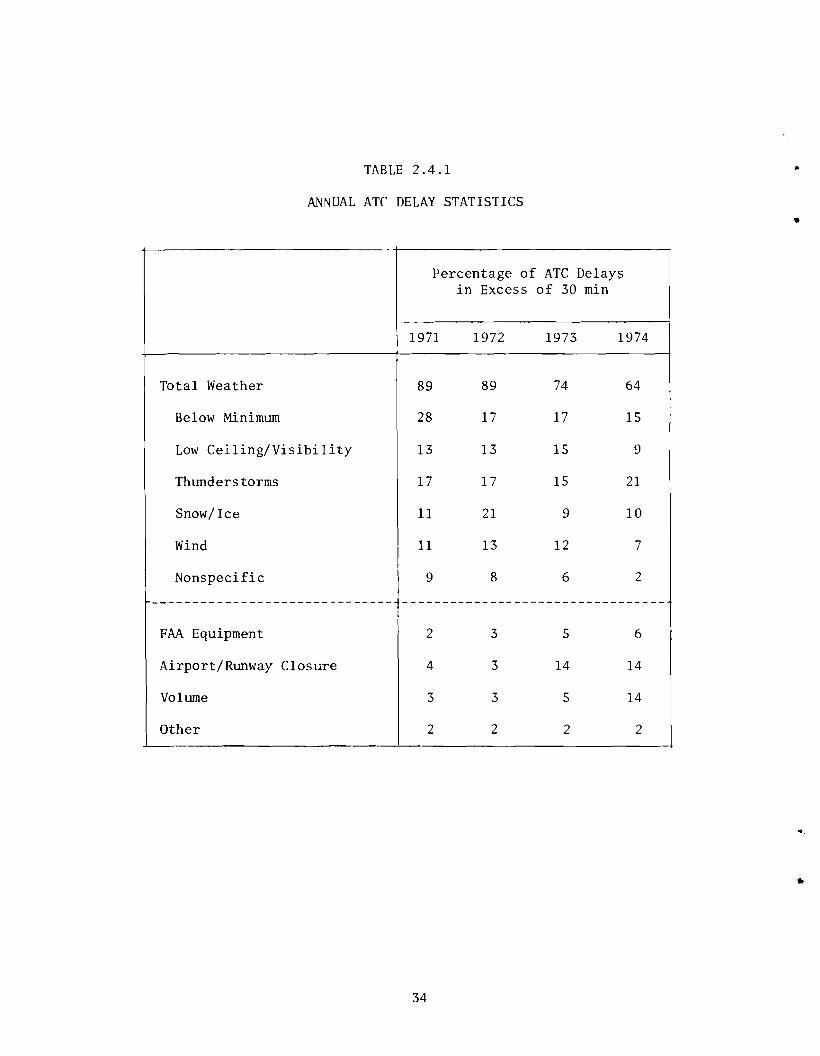
. f d· f 3· 6,7ATC delay statistlcs or elays ln excess 0 0 mlnutes are pre
sented by category in Table 2.4.1. It is evident from these data that weather is
is the major factor affecting delays and most delays are caused by terminal area
conditions especially those affecting runway usage. Typically, arrival delays
outnumber departure delays by a factor of two with only a few percent being en
route delays. An improved aviation weather subsystem with an accurate forecast
of terminal conditions and severe en route conditions would permit users to
balance the relative costs of cancelling before takeoff, holding. or diverting
to another terminal. Furthermore, it would permit flow controllers to anticipate
route and terminal capacity. A recent FAA test of the fuel advisory and depar
ture procedure. designed to be used when weather or other factors cause aircraft
landing delays. indicates the magnitude of the possible saving. "The procedure
saved 658,446 gal. of fuel during a one-day test when Chicago-bound flights were
held on the ground at 150 airports until they could be accepted at Chicago's
O'Hare International Airport with a minimum of airborne delay.,,72
Many different delay cost estimates have been made; for example:
The air transport association8 estimates the annual cost of scheduled airline delays to be around $90 million.
The cost of jet fuel to U.S. Air Carriers for domestic ... flights in 1974 was roughly $2.1 billion (8.2 billion
gallons9 at $0.25 a gal). If even the small percentage of 3% of this fuel consumption were attributable to air borne delays, an annual fuel delay cost of $63 million is incurred.
33
------------------------------ ---------------------------------
TABLE 2.4.1
ANNUAL ATC
-
Total Weather
Below Minimum
Low Ceiling/Visibility
Thunderstorms
Snow/Ice
Wind
Nonspecific
FAA Equipment
Airport/Runway Closure
Volume
Other
DELAY STATISTICS •
Percentage of ATC Delays in Excess of 30 min
1971 1972 1973 1974
89 89 74 64
28 17 17 15
13 13 15 9
17 17 15 21
11 21 9 10
11 13 12 7, I
9 8 6 2
2 3 5 6
4 3 14 14
3 3 5 14
2 2 2 2
•
34
I
The cost per airborne minute of jet fuel to the U.S. carriers for domestic flight in 1974 was roughly $5.3/min (8.2 billion gallons consumed in 6.5 million hours9 at $0.25/gal).* Assurnihg an average delay of 5 minutes per operation and 10 million operations per year results in an annual fuel delay cost of $260 million.
The data in Table 2.4.1 shows that a large percentage of these delays are
weather related. Since no weather modification is planned, except for possible
advances in fog modification, a high percentage of delays will continue to be
attributable to weather. However, better weather information systematically
used will promote an efficient ATC system and will hold delays, especially air
borne delays, to a minimum. An improved aviation weather subsystem reducing
these delays by only a few percent, no matter which delay cost estimate is taken,
would reasonably justify an annual expenditure of several million dollars, on
purely economic grounds.
2.4.2 Safety
Safety provides the other cornerstone for the development of an
improved aviation weather subsystem. The law suits resulting from the death
of a couple hundred people on a jumbo jet can easily exceed a hundred million
dollars not including the 25 million dollar cost of a jumbo jet. Of the
meteorological conditions affecting safety, turbulence plus factors affecting
safe landings and takeoffs are the most important.
From a review of accident reports and statistics it is evident that severe
turbulence is the meteorological phenomenon most affecting safety throughout
all portions of flight. Brunstein2 has summarized the damage and loss of life
attributed to turbulence involving U.S. air carriers for the period 1964 through
1969. His results are summarized in Table 2.4.2 which shows that turbulence
was involved in 22% of all accidents, with convective turbulence (turbulence
associated with severe weather, thunderstorms, squalls, etc.) and CAT (tur
bulence associated with clear air conditions) both being significant. In
addition there was little change in the accident incidence over the six year
period. These accidents resulted in 228 fatalities, 127 serious injuries,S
* The average cost per airborne minute of jet fuel for a Boeing 727 experienced by the major airlines during the third quarter of 1974 was also $5.3!min. lO
35
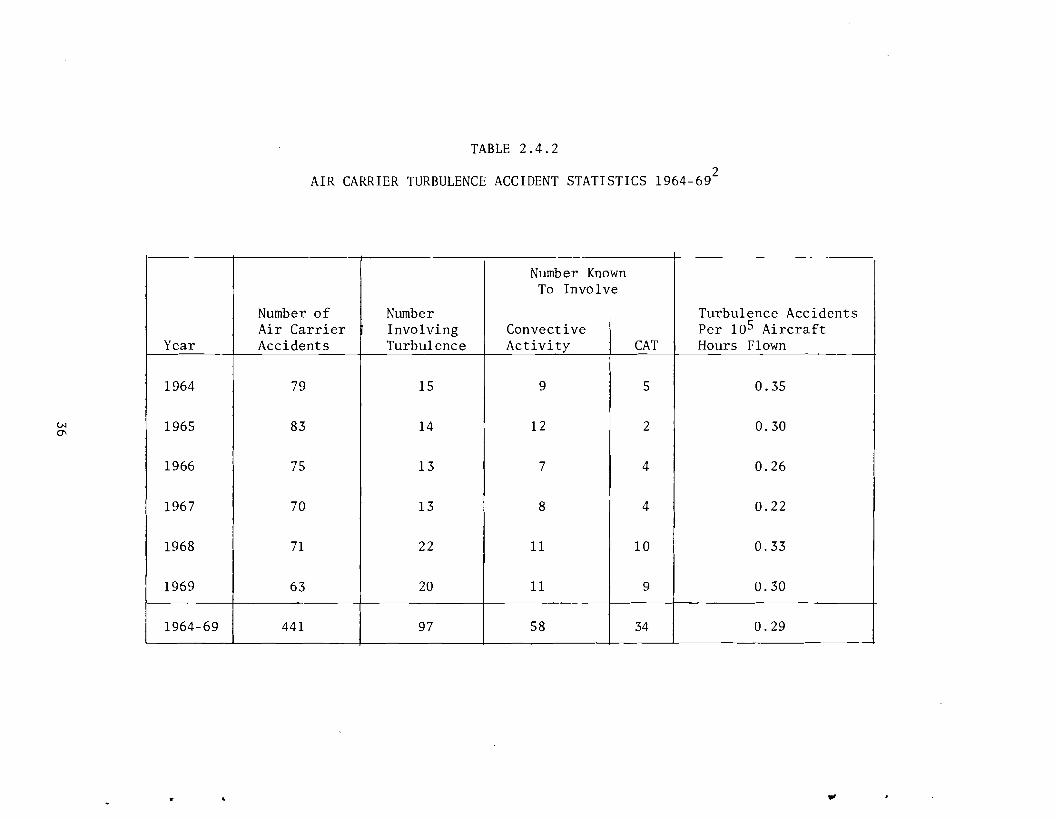
TABLE 2.4.2
2AIR CARRIER TURBULENCE ACCIDENT STATISTICS 1964-69
Vl 0'1
Year
Number of Air Carrier Accidents
Number Involving Turbulence
Number Known To Involve
Convective Activity CAT
Turbulence Accidents Per 105 Aircraft Hours Flown
1964 79 15 9 5 0.35
1965 83 14 12 2 0.30
1966 75 13 7 4 0.26
1967 70 13 8 4 0.22
1968 71 22 11 10 0.33
1969 63 20 11 9 0.30
1964-69 441 97 58 34 0.29
...
aircraft destroyed, and 4 substantially damaged. It is important to note that,
of these 97 turbulence-involved air carrier accidents, 11% occurred during ascent
22% during descent, and 65% during normal cruise. Thus turbulence is an impor
tant safety factor in all phase of flight. However, the most severe accidents
have occured during descent.
Although not separately categorized in these accident statistics, low
level wind shear is a hazardous phenomenon that falls within the scope of the
WSA. Wind shear is at times a consequence of nearby thunderstorm activity.
Avoiding the vicinity of active storm cells will therefore reduce the incidence
of low-level wind shear as well as convective-turbulence-induced accidents.
The crash of an Eastern Airlines aircraft in New York on June 24, 1975,
apparently involved wind shear associated with thunderstorm activity. The 11Ozark Airline flight that crashed in St. Louis on July 25, 1973 is another
example of an accident related to thunderstorm activity near the approach path.
Brunstein points out that there were many cases where the flight crew was
aware of the turbulence possibility but the controller was unable to authorize
a deviation because of a traffic conflict or other control problem. With good
data the controller would be able to preplan for such deviation requests with12out ordering the pilot to take any action. As the traffic density increases ,13
the control of aircraft becomes more sensitive to weather. This was especially
true in the New York area where separation minimums were violated by aircraft 3
deviating without controller permission to avoid storm cells. One of the
reasons for implementing the Severe Weather Avoidance Plan (SWAP) during the
summer thunderstorm season was to enable planning for, instead of reacting to
thunderstorm activity.
"d 2There are even 1nC1 ents of aircraft flying into convective turbulence
which was not detected by airborne weather radar. At the same time the con
troller did not observe weather on the surveillance radar display and thus was
unable to respond to the pilot request for aid. Surveillance radars are opti
mized to see aircraft, not weather. Photographs of NWS weather radar scopes
taken during such incidents have indicated severe thunderstorms and thus
weather radar data should be provided to controllers or the weather detection
capability of the surveillance radars should be improved.
37
It is evident from reviewing accident reports that poor visibility while
on final approach is a significant contributor to accidents. Contrary to flight
regulations, many pilots have descended below the minimum decision altitude 14,15,16,17
before seeing the runway and crashed.
Runway surface condition is clearly critical to the safety of landing and
takeoff. For instance, freezing rain, snow and excessive rainfall can cause
the runway to be very slippery. Hydroplanning18 ,19 has caused aircraft to slide
off the end of the runway. Cross wind is another important phenomenon affecting
runway safety, since each aircraft has a maximum cTosswind component with which
it can safely land and taxi. Thus good measurements of final approach visibility,
runway surface conditions, and surface winds are important to improve safety.
Terminal controllers have additional interest in these conditions to enable the
selection of runways for maximum efficiency.
Finally, the wake vortex problem has become important with the introduction 20of wide body aircraft. The crash of a OC-9 at Fort Worth in 1972 showed that
even large aircraft are affected. Measurements of the wake vortices produced
. f 21 f' d h . f h bby large alrcra t con lrme t e severlty 0 t e pro lem.
38
3.0 USER FEATURES
The intent of this section is to show: (1) the weather products and dis
plays provided to en route and terminal controllers, the team supervisors,
the flow controller and the system command center, and (2) how the users
will benefit from these features. The system architecture indicating where
data come from how they are processed and the rather modest communication re
quirement is left for Section 4.
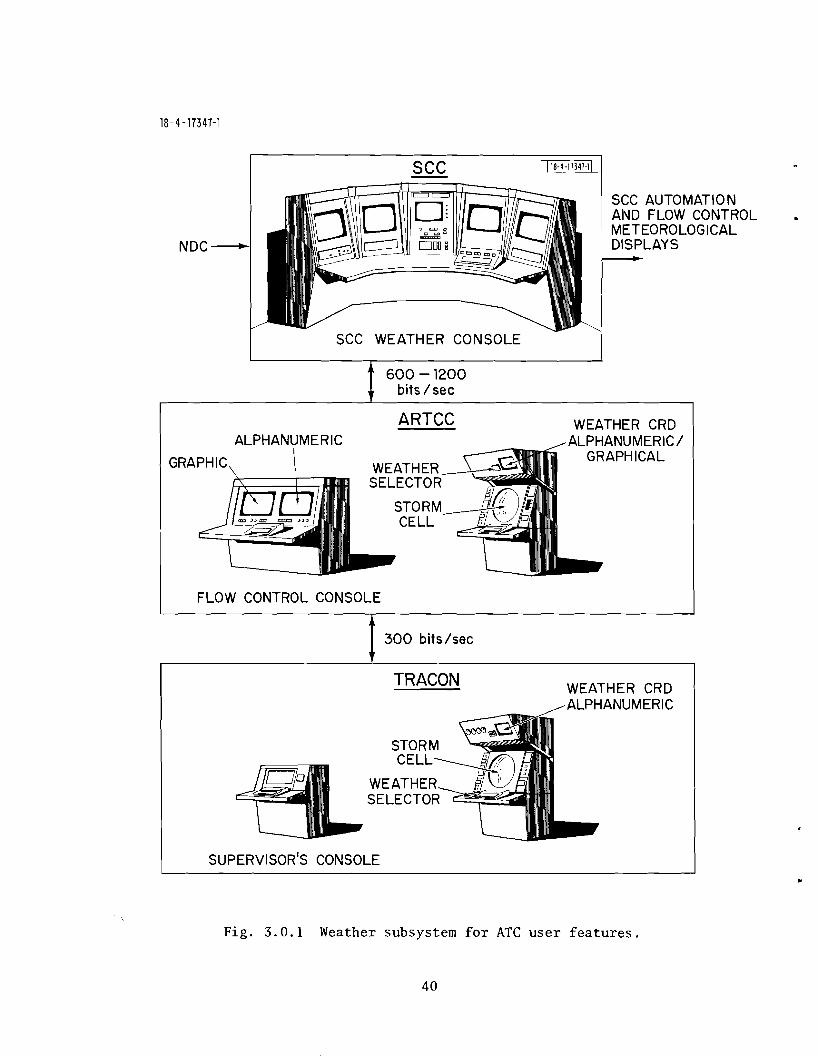
Figure 3.0.1 illustrates the major user features. The controllers PVD and
the separate weather CRD (possibly MAPS and TIPS) are primarily used to display
storm cells and textual data, respectively. The CRD could also display some non
weather data. The supervisors or flow control console provides access to all
weather products used by controllers and specially designed forecasts for one to
four hour planning. The SCC weather console is primarily used by the SCC meteoro
logists to serve the central flow controllers. Data is exchanged between the SCC,
ARTCCs, and TRACONs at a very modest data rate. In the following subsections the
displays illustrated in Fig. 3.0.1 will be described in more detail. These
display depictions are helpful in describing the overall WSA concepts and it
should not be misconstrued as a recommendation for these precise displays .
•
39
18-4-1T34T-l
SCC 118+11347-11
NDC-~
SCC AUTOMATION AND FLOW CONTROL METEOROLOGICAL DISPLAYS
SCC WEATHER CONSOLE
600 -1200 bits /sec
ARTCC ALPHANUMERIC
GRAPHIC
FLOW CONTROL CONSOLE
300 bits/sec
TRACON
WEATHER CRD ALPHANUMERIC/
GRAPHICAL
WEATHER CRD ALPHANUMERIC
SUPERVISOR'S CONSOLE
Fig. 3.0.1 Weather subsystem for ATe user features.
40
3.1 PVD Display of Radar Weather Data - En Route and Terminal
Both terminal and en route controllers should be provided with a good reli
able graphical depiction of the hazardous storm cells without cluttering the
PVD. Recent experimental S results indicate that the hazardous storm cells are
relatively small physical entities (roughly 1-4 miles in diameter) which can
be identified with appropriate processing of pencil beam weather radar data.
By sacrificing the ability to measure cell tops, a similar capability is possi
ble with appropriate processing of ASR or ARSR radar data, but only to a 45 mile 5 range - quite adequate for terminal areas but not en route.
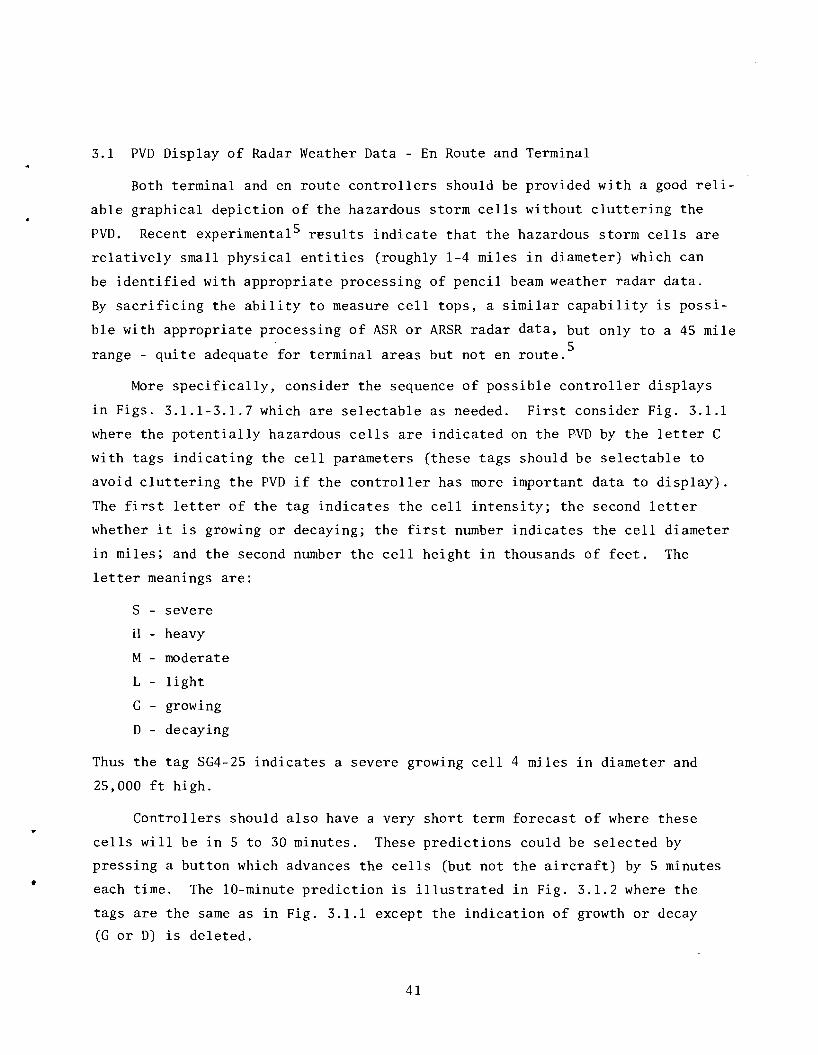
More specifically, consider the sequence of possible controller displays
in Figs. 3.1.1-3.1.7 which are selectable as needed. First consider Fig. 3.1.1
where the potentially hazardous cells are indicated on the PVD by the letter C
with tags indicating the cell parameters (these tags should be selectable to
avoid cluttering the PVD if the controller has more important data to display).
The first letter of the tag indicates the cell intensity; the second letter
whether it is growing or decaying; the first number indicates the cell diameter
in miles; and the second number the cell height in thousands of feet. The
letter meanings are:
S - severe
H - heavy
M - moderate
L - light
G - growing
D - decaying
Thus the tag SG4-25 indicates a severe growing cell 4 miles in diameter and
25,000 ft high.
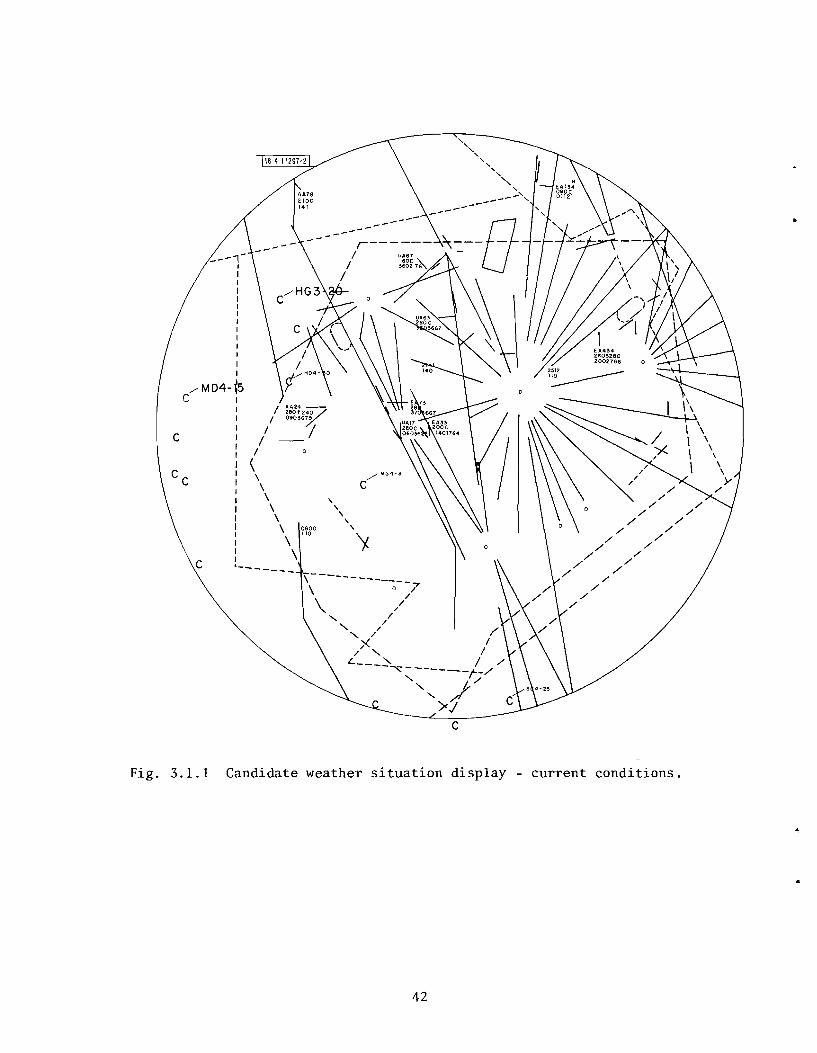
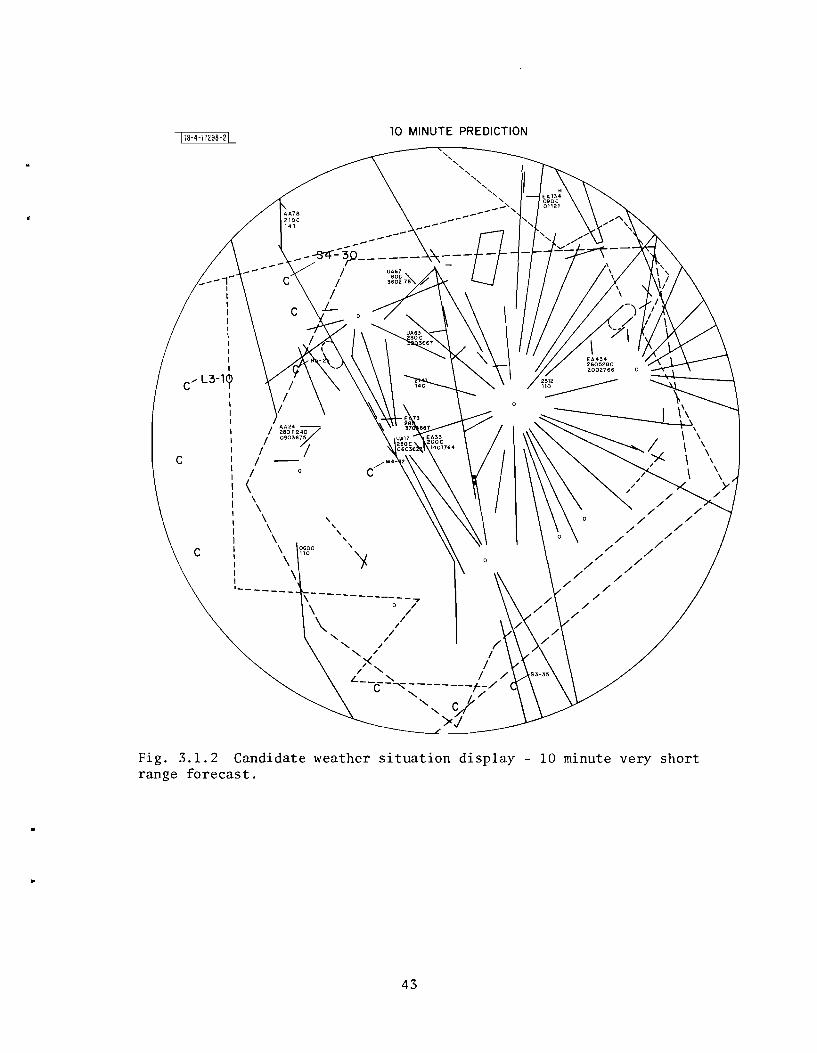
Controllers should also have a very short term forecast of where these
cells will be in 5 to 30 minutes. These predictions could be selected by
pressing a button which advances the cells (but not the aircraft) by 5 minutes
each time. The 10-minute prediction is illustrated in Fig. 3,1.2 where the
tags are the same as in Fig. 3.1.1 except the indication of growth or decay
(G or D) is deleted.
41
././
./ ./
././
./ ./
./ ./
./ ./
./
"-:.--8
, ''-,,,
" '" , -------',
----
r-----/
/ /
,,,,, 'y.
-----------
\ ------------\ 0 7 \ /// , /" //" /i<
/ " L __ " / ./ --~ - -------t-./
"" t./
'>1
0600 110
/ I
I /
/
~ \ \ \ \ \ \ \ \
1 -c
c
c
Fig. 3.1.1 Candidate weather situation display - current conditions.
42
10 MINUTE PREDICTION
...., ".... .... .... .... ....
...., ....---_............----
--~~--e ------
,,,,, Y
\ -------------"7 \ /\ /
, /1, /, /
)< / / , / / L_-C-~ - ------_j-_/, /
" ~! )<j
/ AA24 -280t2~P /
/ 090:56/-j
/ //
/
\, \ \ \ \ \ ?~go
\ \
C
_--1I I I I I 1, I I 1 I
C/ L3-1~ I I I I I
C
Fig. 3.1.2 Candidate weather situation display - 10 minute very short range forecast.
43
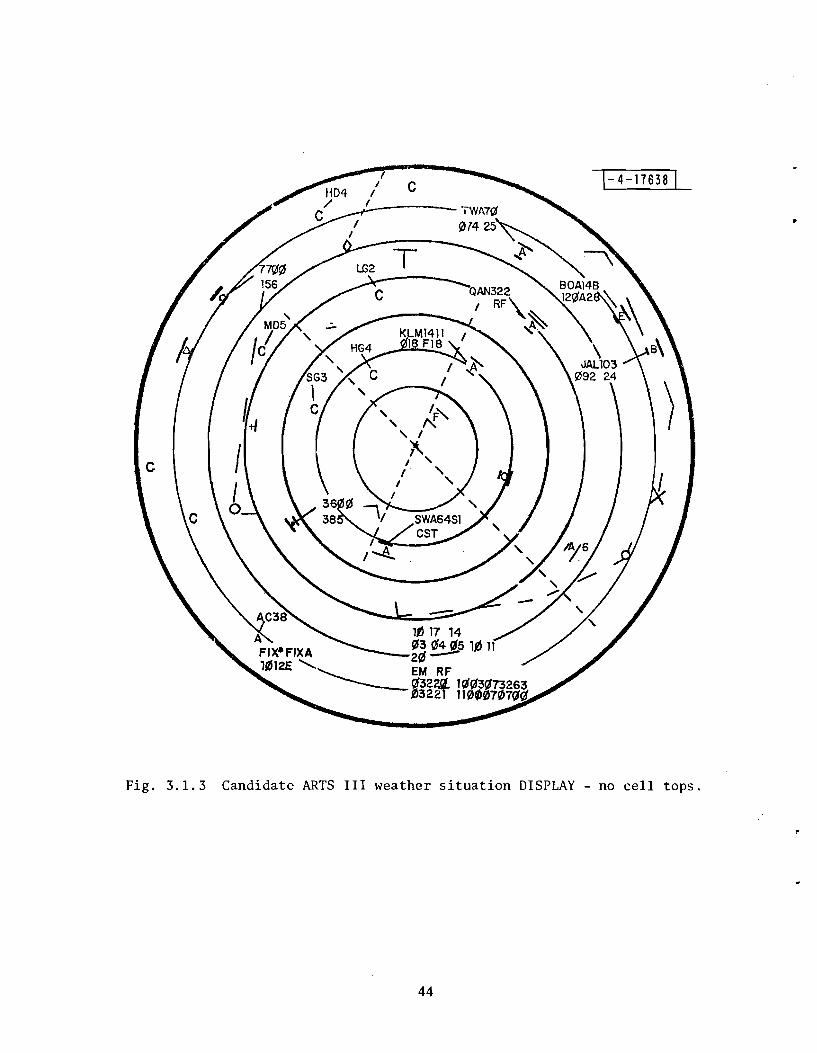
c
l- 4-17638 L
Fig. 3.1.3 Candidate ARTS III weather situation DISPLAY - no cell tops.
44
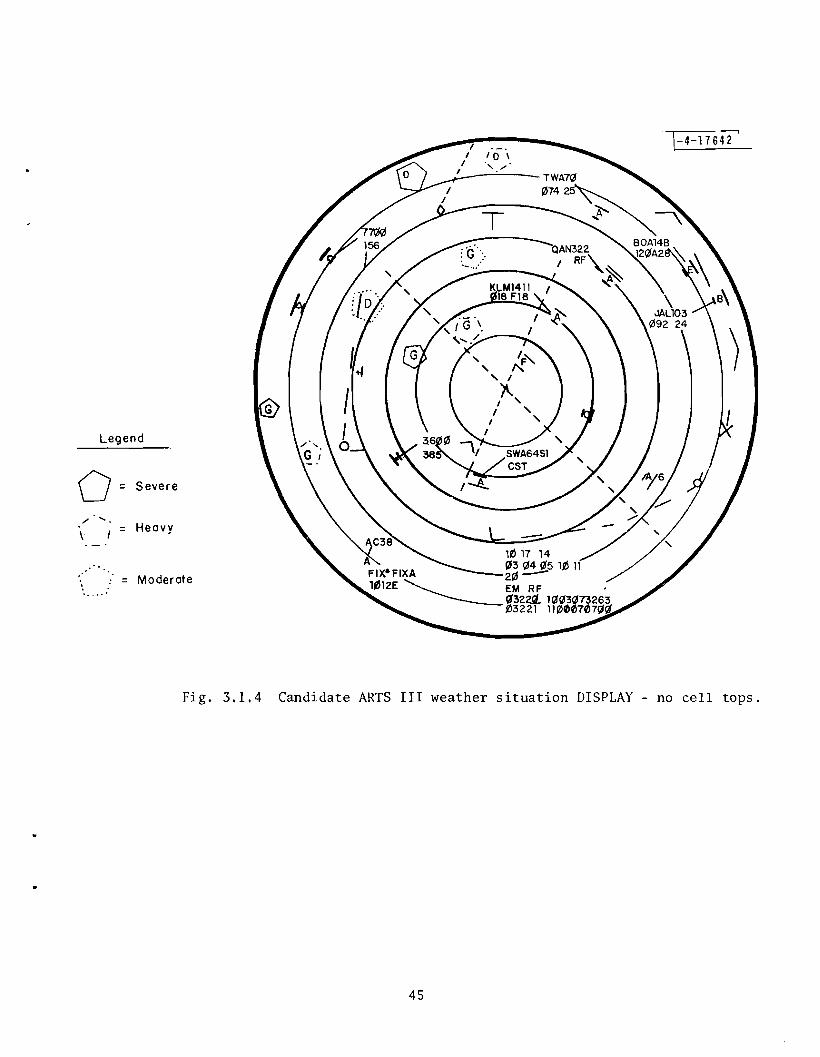
Legend
0 = Severe
/ .... = Heavy
\
= Moderote ......
l-4-17642 L
Fig. 3.1.4 Candidate ARTS III weather situation DISPLAY - no cell tops.
45
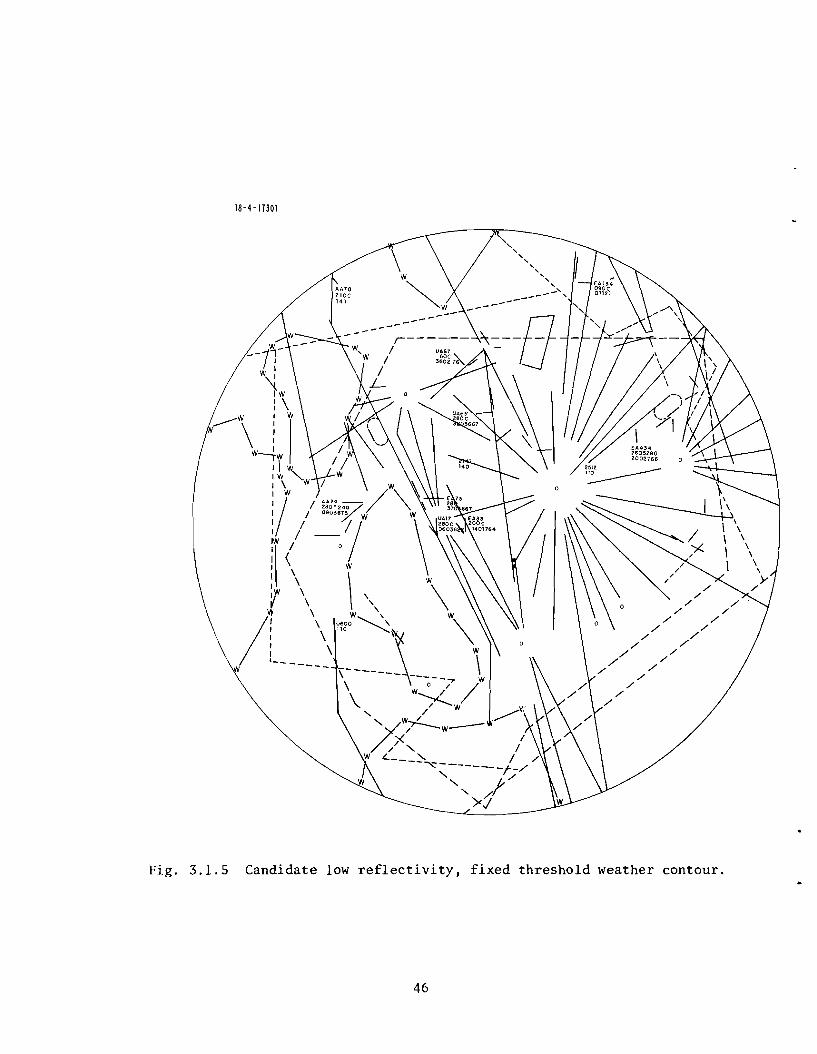
18-4-17301
/ /
//
//
//
/ /
/ /
/
Fig. 3.1.5 Candidate low reflectivity. fixed threshold weather contour.
46
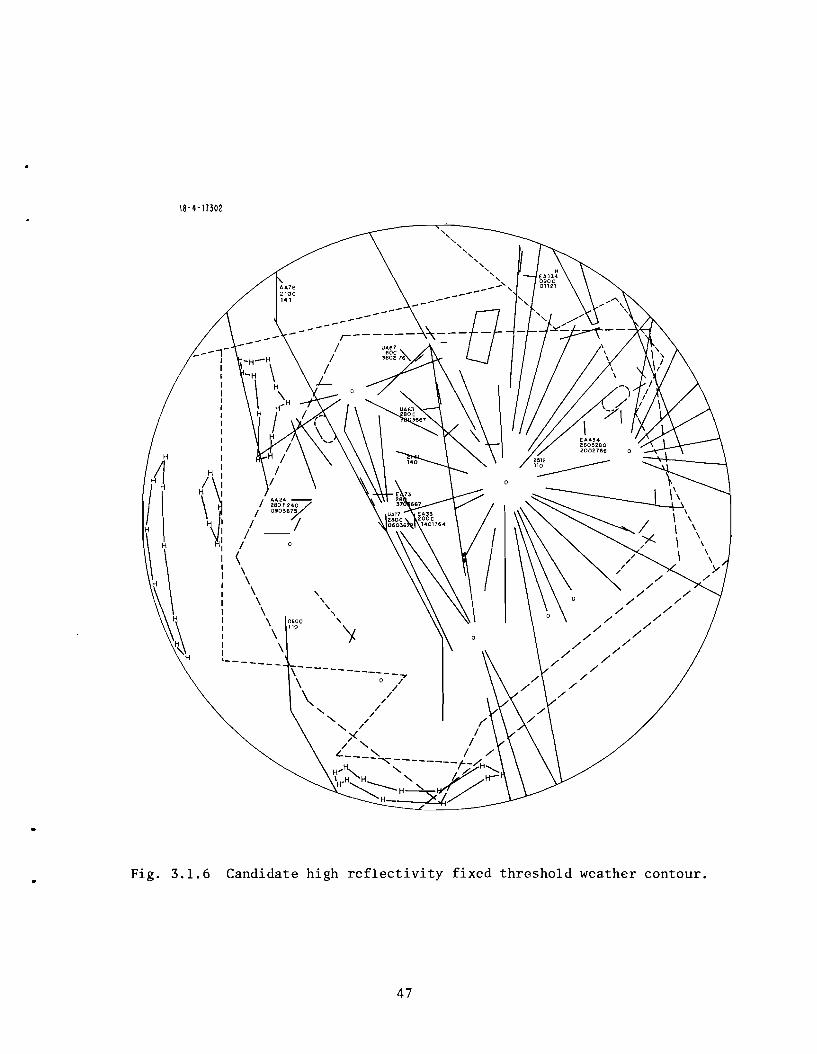
18- 4-17302
'" "" ",,,
" ",-'---- " ------------
I AA24 -280t2~£> /
/ Oi036/,;
/ _/ I 0
( \ \ \ \ \ \ ?~go
\ \
1 -
H
\\ ~:
Fig. 3.1.6 Candidate high reflectivity fixed threshold weather contour .•
47
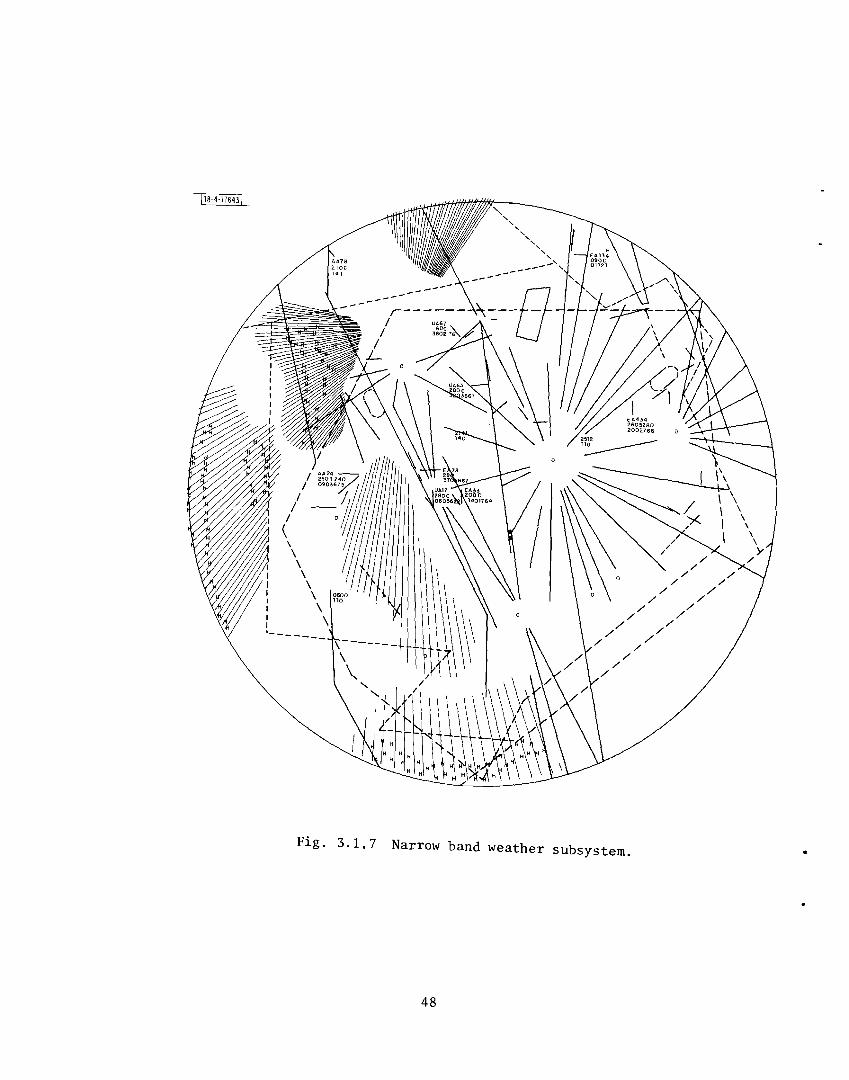
118-4-116431
" " ,
" ,,, ,--',-----
/" /
//
//
//
/ /
/ /
/
Fig. 3.1.7 Narrow band weather subsystem.
48
The following scenario indicates how this is useful. Consider the air
craft AA78 at 21,000 ft in the upper left corner of Fig. 3.1.1 which will
intersect cell HG3-20 (heavy, growing, 3 miles in diameter with a 20,000 ft top)
in 10 minutes. The controller, noting that this cell is still growing, can
advance the cell 10 minutes and observe as shown in Fig. 3.1.2 that this heavy
cell is predicted to be S4-30 (severe, 4 miles in diameter with a 30,000 ft
top). The controller is thus alerted to warn the pilot or expect a deviation
request from the pilot. With this type of good presentation, the controller
can plan for and coordinate the rerouting around the hazardous cells.
Since most TRACONs would be served by an ASR which is unable to supply
height data, candidate ARTS-III weather situation displays are depicted in Fig.
3.1.3 and 3.1.4.
It is expected that controllers will eventually only use the cell data and
forecasts. However, during the early implementation stages, controllers should
have access to 2 threshold contours as is available with the narrowband weather
subsystem (NBWS). These could be selectable by the controller as illustrated
in Figs. 3.1.5 and 3.1.6. The fixed threshold contours indicated with Ws and
Hs are for widespread rain (low reflectivity) and heavy rain (high reflectivity).
These low and high rain contours do not indicate aviation hazards and thus the
PVD display need only approximate the actual contours to within a few miles.
This flexibility simplifies the contour display algorithms. Note that the
potentially hazardous cells indicated in Fig. 3.1.1 must be accurately located
on the PVD. For comparison, the presentation of the NBWS is shown in Fig. 3.1.7.
The precise form for the PVD display of current conditions and very short
term forecasts will require a human factors study. The above are simply illus
trative examples.
3.1.1 Utility of Storm Cell Heights
In the en route airspace, storm top information is very useful since
many aircraft can fly over the cells. In the terminal area where aircraft must
fly around or through a cell, the height information is not as important, except
as an indicator of turbulence. Although height information would also be useful
in the terminal area, it is not as valuable as in the en route airspace. Thus
49
a fan beam ASR is more suited to satisfy a terminal controller's weather data
needs than an ARSR is for en route controllers. In addition, due to partial
beam filling, fan beam surveillance radar data can not be used to produce reli
able weather situation displays as illustrated in Figs. 3.1.1-3.1.4 beyond 45
miles. S This is well suited for terminal control but not en route.
so
3.2 En Route Controller Alphanumeric/Graphical Display
Each control position should have a separate CRD display for presentation
of alphanumeric and possibly graphical weather data. This same CRD may also be
used for non-weather data. The presentation of several pages of data tailored
to each control sector is well suited for this job. Data requests other than
page selection should be kept to a minimum and should rarely be needed if the
pages are designed properly for each sector. Special requests on a rare occa
sion can be handled as they are today by phone links or by means to be deter
mined during system development.
3.2.1 Alphanumeric Pages
The system should be capable of presenting most of the data pre
sently available on Service A, although in the future this same data will be
more conveniently received from the NDC, FSS Hub Automation or directly from
the airport terminal. The message types include:
Surface observation (SA)
Terminal forecasts (FT)
Notices to airmen (NOTAMS)
Pilot reports (UA)
Supplementary weather (SW)
Area forecasts (FA)
Severe weather forecasts (WW)
Hurricane advisories (WH)
Notice to airmen summaries (NOSUMS)
Forecast winds and temperatures aloft (FD)
SIGMETS (WS)
AIRMETS (WA)
Radar Weather reports (SD)
Surface forecast (FS)
51
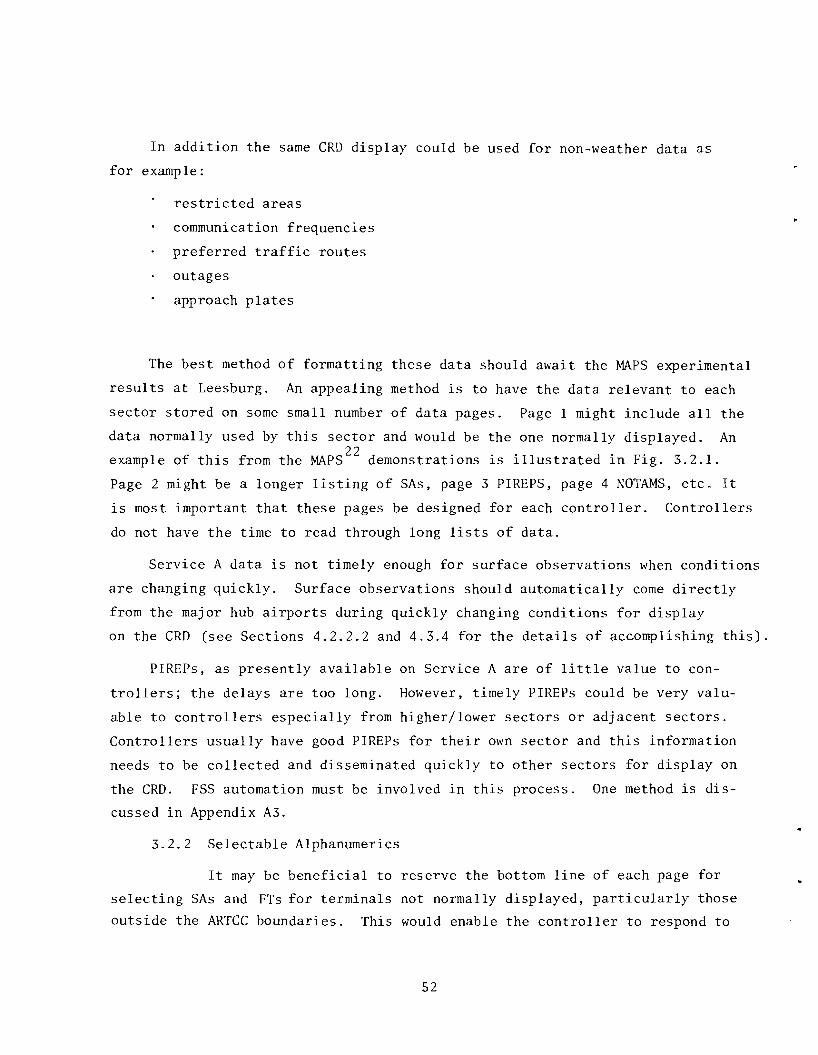
In addition the same CRD display could be used for non-weather data as
for example:
restricted areas
communication frequencies
preferred traffic routes
outages
approach plates
The best method of formatting these data should await the MAPS experimental
results at Leesburg. An appealing method is to have the data relevant to each
sector stored on some small number of data pages. Page 1 might include all the
data normally used by this sector and would be the one normally displayed. An 22
example of this from the MAPS demonstrations is illustrated in Fig. 3.2.1.
Page 2 might be a longer listing of SAs, page 3 PIREPS, page 4 NOTAMS, etc. It
is most important that these pages be designed for each controller. Controllers
do not have the time to read through long lists of data.
Service A data is not timely enough for surface observations when conditions
are changing quickly. Surface observations should automatically come directly
from the major hub airports during quickly changing conditions for display
on the CRD (see Sections 4.2.2.2 and 4.3.4 for the details of accomplishing this).
PIREPs, as presently available on Service A are of little value to con
trollers; the delays are too long. However, timely PIREPs could be very valu
able to controllers especially from higher/lower sectors or adjacent sectors.
Controllers usually have good PIREPs for their own sector and this information
needs to be collected and disseminated quickly to other sectors for display on
the CRD. FSS automation must be involved in this process. One method is dis
cussed in Appendix A3.
3.2.2 Selectable Alphanumerics
It may be beneficial to reserve the bottom line of each page for
selecting SAs and FTs for terminals not normally displayed, particularly those
outside the ARTCC boundaries. This would enable the controller to respond to
52
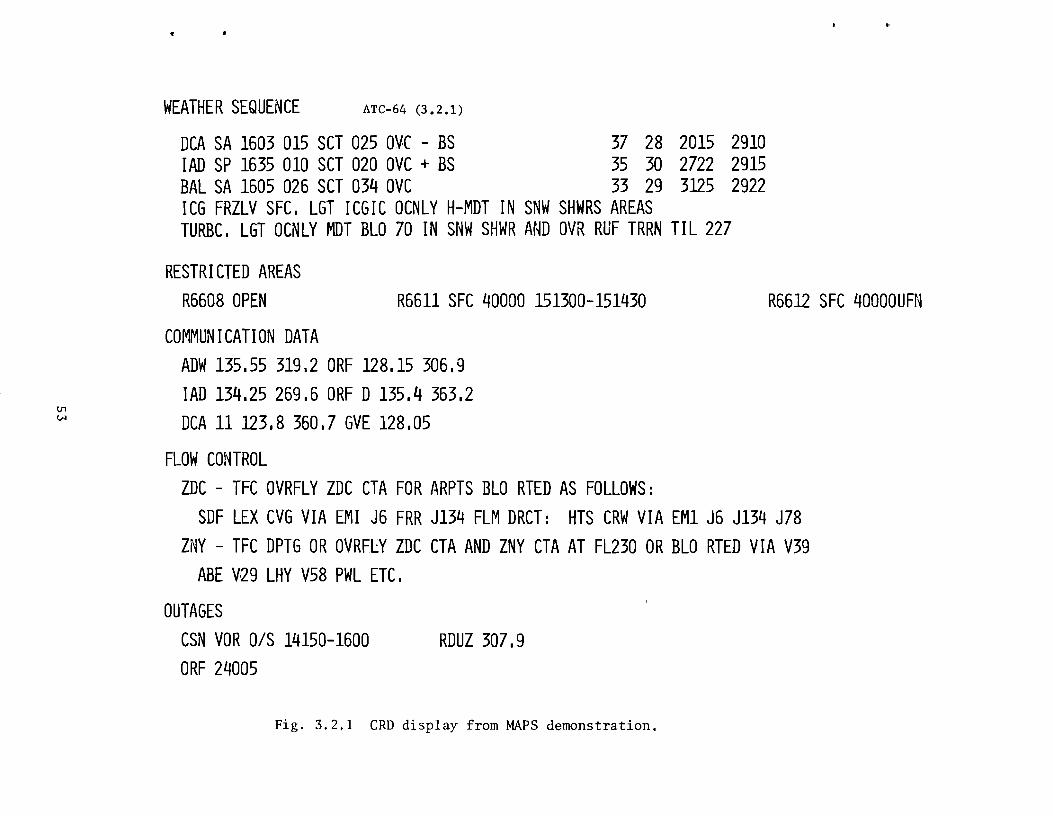
•
WEATHER SEQUENCE ATC-64 (3.2.1)
DCA SA 1603 015 SCT 025 ove - BS 37 28 2015 2910 lAD SP 1635 010 SCT 020 OVC + BS 35 30 2722 2915 BAL SA 1605 026 SCT 034 OVC 33 29 3125 2922 ICG FRZLV SFC. LGT ICGIC OCNlY H-MDT IN SNW SHWRS AREAS TURBC. LGT OCNLY MDT BLO 70 IN SNW SHWR AND OVR RUF TRRN TIL 227
RESTRICTED AREAS R6608 OPEN R6611 SFC 40000 151300-151430 R6612 SFC 40000UFN
COMMUNICATION DATA ADW 135.55 319.2 ORF 128.15 306.9 lAD 134.25 269.6 ORF D135.4 363.2
V1 C".I DCA 11 123.8 360.7 GVE 128.05
FLOW CONTROL ZDC - TFC OVRFlY ZDC CTA FOR ARPTS BLO RTED AS FOLLOWS:
SDF LEX CVG VIA EMI J6 FRR J134 FlM DRCT: HTS CRW VIA EM1 J6 J134 J78 ZNY - TFC DPTG OR OVRFlY ZDC CTA AND ZNY CTA AT Fl230 OR BlO RTED VIA V39
ABE ¥29 LHY V58 PWL ETC,
OUTAGES CSN VOR DIS 14150-1600 RDUZ 307.9 ORF 24005
Fig. 3.2.1 eRD display from MAPS demonstration.
pilot requests for destination airport conditions. Naturally, this would have
to be on a controller time permitted basis. Whether or not this extra feature
is cost effective or even desirable must be determined.
3.2.3 Graphics
There are a number of potential graphical applications for both
weather and non-weather users. Only the weather uses are discussed here. Con
sidering that a graphics capability will significantly increase the cost of
these CRD displays, careful consideration should be given to its effectiveness.
Potential applications for weather graphics include:
The radar weather display of current conditions for a region larger than the control sector. This would enable the controller to anticipate storm movements into his sector and to alert pilots concerning storms in neighboring sectors. The controller could also avoid cluttering the PVD with the weather display except when he is alerted to a problem on the separate CRD. This is not a substitute for selecting the weather graphics on the PVD.
PIREPs tagged to their geographic location; i.e., instead of a tabular listing, PIREPs could appear on a map indicating the reporting location.
54
3.3 Terminal Controller Alphanumeric Display
Each approach, departure, and tower control position should have an alpha
numeric CRD display for weathe~ data. Graphics, although potentially useful,
cannot be justified here. Surface observations for the airport or satellite
airports for which the controller is providing approach, departure or local con
trol are the most important data to present. This includes sky cover, ceiling,
prevailing visibility, weather type, obstruction to vision, sea-level pressure,
temperature, dewpoint, wind direction, wind speed, gusts, altimeter setting,
runway visibility - RVV or RVR, wind shear and wake vortex. Where possible
these should be continuously updated from automatic sensors and controllers
should be alerted when a meteorological parameter has changed significantly.
This could be handled by flashing the parameter on the CRD until an acknowledge
button is pressed and possibly also flashing a light on or near the PVD to alert
the controller to look at the CRD. A nice feature of a CRD is that when new
sensors are deployed, as for example, the wind shear/wake vortex sensor, the
display can be adapted to accommodate the new information with no additional
hardware.
In addition surface observations, NOTAMS, and holding delays for a few
nearby airports should be displayed with updates at least once an hour. The
update interval should be automatically adaptable to the rate conditions are
changing. This would enable the terminal controller to advise the pilot, con
cerning an alternate destination, when landing conditions are marginal, below
minimum or in an emergency.
Other important data includes PIREPs, automatic alert messages, and mes
sages generated by the terminal supervisor. In addition some non-weather data
could be displayed as for example restricted areas, communication frequencies,
and facility outages.
A representative CRD display appears in Fig. 3.3.1; this is a modified
version of the MAPS display illustrated in Fig. 3.2.1.
55
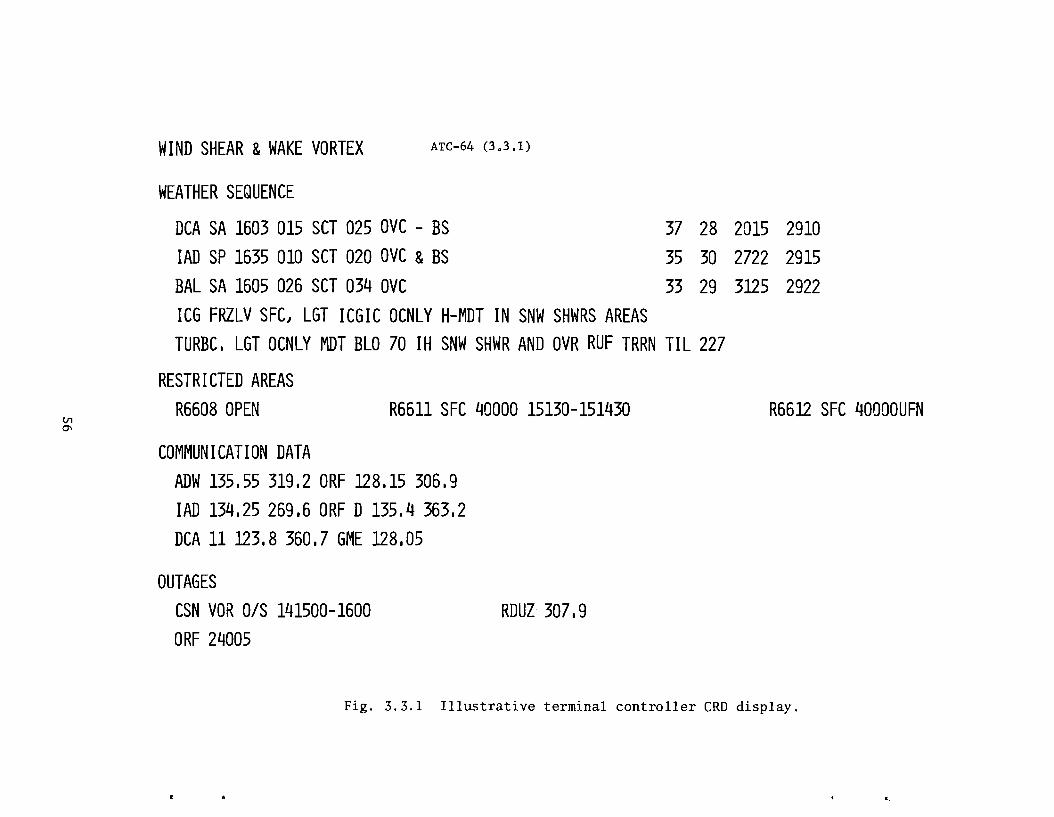
WIND SHEAR &WAKE VORTEX ATC-64 (3.3.1)
WEATHER SEQUENCE
DCA SA 1603 015 SCT 025 OVC - BS lAD SP 1635 010 SCT 020 OVC &BS BAL SA 1605 026 SCT 034 OVC
37 35 33
28 30 29
2015 2722 3125
2910 2915 2922
ICG FRZLV SFC J LGT ICGIC OCNLY H-MDT IN SNW SHWRS AREAS TURBC, LGT OCNLY MDT BLO 70 IH SNW SHWR AND OVR RUF TRRN TIL 227
RESTRICTED AREAS
CJ'1 G\
R6608 OPEN
COMMUNICATION DATA
R6611 SFC 40000 15130-151430 R6612 SFC 40000UFN
ADW 135,55 319.2 ORF 128.15 306,9 lAD 134,25 269.6 ORF D135.4 363.2 DCA 11 123.8 360.7 GME 128.05
OUTAGES CSN VOR O/S 141500-1600 ORF 24005
ROUt 307.9
Fig. 3.3.1 Illustrative terminal controller eRD display.
.~
3.4 Flow Control/Supervision Console
The flow controller, with his weather console, should have access to:
all the weather data, graphical and alphanumeric, available to controllers
graphical short range forecasts (0-4 hr) of squall lines and fronts (possibly 1/2, 1, 2, and 4 hour predictions updated every 20 minutes).
selected weather graphics from the NDC or FSS Hub Automation
special graphical messages generated by the SCC meteorologist
special alphanumeric messages generated by the SCC meteorologist, or TRACON supervisor
A console with two CRD displays, one graphical and one alphanumeric, plus a key
board entry and selection device should satisfy these display needs. However,
the design should be modular to allow for additional CRDs in en route centers
with particuarly severe conditions.
The keyboard entry and selection device in addition to selecting data is
to be used for:
sending alert messages to individual controllers, TRACONs, and the SCC meteorologist
entering PIREPs
The easy access of the weather data available to controllers provides the
flow controller with a good indication of current weather conditions. The short
range forecast (0-4 hrs) is automatically computer generated at the SCC and
transmitted to this CRD display. This will enable the flow controller to plan
the traffic flow for changing conditions.
An important feature is the ability to display the same graphics on both
the SCC weather console and the flow control console at the ARTCC. This would,
for example, permit the SCC meteorologist to provide real time interpretative
aid based on graphical products during telephone requests.
57
3.5 TRACON Supervisor's Console
The supervisor's console should be able to display:
all the alphanumeric data available to controllers,
the current and very short term storm cell data for a region larger than the terminal area,
graphical short range forecast (0-4 hr) of squall lines and fronts (possibly 1/2, 1,2 and 4 hour predictions updated every 20 minutes).
special alphanumeric messages generated by the SCC meteorologist or the ARTCC flow controller.
A console with one graphical/alphanumeric CRO plus a keyboard entry and selection
device should satisfy these display needs. However, the design should be modular
to allow for additional CROs to be added.
The keyboard entry and selection device is also used to:
send alert messages to individual controllers, towers, the flow controller and the SCC meteorologist,
entering PIREPs,
entering terminal observations which cannot be obtained from automated sensors.
Since most TRACONs are relatively small, supervisors can obtain most of the
important data from looking over a controllers shoulder. Thus the display fea
tures of this console can be limited.
The short range forecast permits the TRACON to coordinate the traffic flow
with the ARTCC flow controller for changing conditions.
The same graphics should be displayable on this console, the flow control
-console, and the SCC weather console to permit a three-way discussion and meteoro
logist interpretation of conditions.
58
3.6 SCC Meteorologist
Once the SCC meteorologist has a timely aviation weather data base that is
at least as good as is available in the en route centers and terminals he may
well have difficulty keeping up with the requests for his service unless some
automated aids are provided. This data includes:
(1) the NWS data base from the NDC. He is the only person in the ATC system trained to interpret their products
(2) the storm cells and very short range forecasts (0-30 min) transmitted from the en route centers and terminals
(3) timely reports on changing surface observations
(4) computer generated short-range forecasts (0-4 hr) based upon radar data. surface observations. and NWS products
Presently he has the data in item (1) through the high speed Service A teletype
drop and NAFAX. These are printed on paper and require extensive clerical
efforts to put in a usable form. The Service A could be computer interfaced
but NAFAX can not. He has storm data through the direct dial up of the NWS
radars; however this data is frequently stale, inaccessible and is not pro
cessed to depict aviation hazards. The quality of the facsimile printout is
poor. He frequently does not receive reports on changing terminal conditions
until after a problem has developed. Finally the forecasts generated by the
NWS are for a lo~ger time frame than the 0-4 hours most needed for ATC flow
control.
With a good data base the meteorologist's functions will include:
(1) interpreting available graphical and textual products to the central flow controllers, flow controllers and terminal supervisors,
(2) anticipating aviation weather problems before they happen and alerting the affected facility, and
(3) monitoring and correcting if necessary the automatic computer generated forecasts (short range and very short range).
59
Item (1) is an expansion of his present duties, item (2) he tries to do now but
is rarely able to with the available data base, and item (3) is a completely new
task. To accomplish these tasks the meteorologist will find great value in a
computer driven display terminal with good user-oriented alerting and recall aids.
He should be able to display, alter and add to the products available on the
terminal area supervisors console, and the en route centers flow control con
sole. An interface is also needed with see automation to permit the meteoro
logist to work up the appropriate graphical and textual displays which are
appropriate to the central flow controllers. The recommended architecture
to achieve this is discussed in Section 4.4.
60
4.0 RECOMMENDED SYSTEM ARCHITECTURE
4.1 Overview
The WSA satisfies most of the controller and flow controller needs for
timely, user-oriented weather products. The selected architecture connects and
unifies the many weather sensor developments and integrates the WSA into NWS
automation, FSS automation, and FAA communication plans. Careful consideration
has been given to avoid duplication of NWS services and particular attention
has been given to minimizing communication costs.
The system architecture employs three types of weather processors referred
to as the ARTCC WEather Processor (AWEP), the TRACON WEather Processor (TWEP),
and the System Command Center WEather Processor (SWEP). These are small computers
which are linked together in a tree-like communication structure as illustrated
in Fig. 4.1.1. The main function of these processors is to satisfy the needs
expressed in Sections 2 and 3 of controllers for both graphical (primarily radar)
and alphanumeric data. Each processor has four major functions which will be
described in detail in the following sections:
data storage and management,
data processing,
data communication, and
display formatting.
Each computer maintains the data base and provides the automated data handling
which is relevant to the controllers, flow controllers or supervisors it serves.
The data processing digests the weather data for suitable presentation to the
meteorologically untrained controllers. Appropriate processing also permits
use of very low data rate links between the various system nodes. For example,
as illustrated in Fig. 4.1.1, 300 bits/sec between the AWEP and TWEP, and be
tween the WRAP and AWEP provides all the ATC meteorological data requirements for
radar and local observation data .. The data rates on the links between the SWEP
and each AWEP cannot be specified at this time, but are in the 600-1200 bit/sec
peak data rate range. It makes little difference whether the particular com
munication support system is a dedicated link or integrated with other data flow,
61
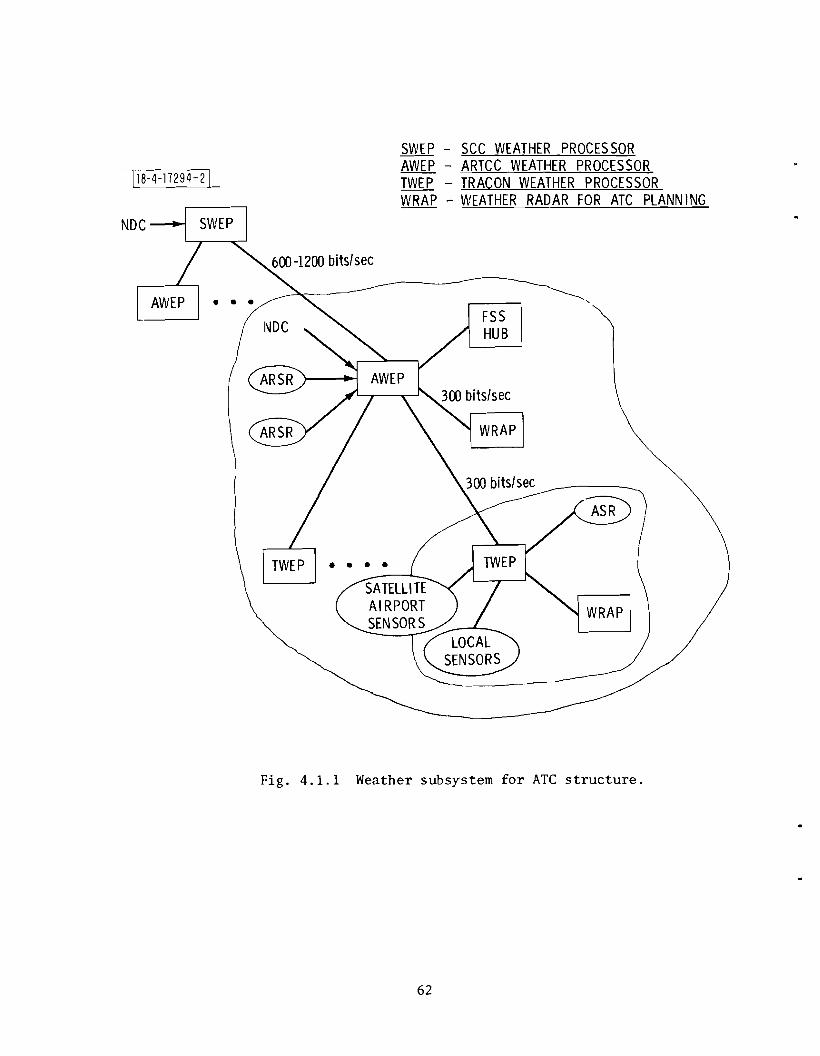
SWEP - SCC WEATHER PROCESSOR AWEP - ARTCC WEATHER PROCESSOR
l18-4-17294-2 L TWEP - TRACON WEATHER PROCESSOR
• • •
WRAP - WEATHER RADAR FOR ATC PLANNING
FSS HUB
Fig. 4.1.1 Weather subsystem for ATe structure.
62
provided sufficient capacity is provided and queing delays are small. Integra
tion of the communication into the proposed Integrated National Aviation Commun
ications System (INACS)23 is a very sensible approach. Section 4.5 discusses
the communication structures in more detail.
63
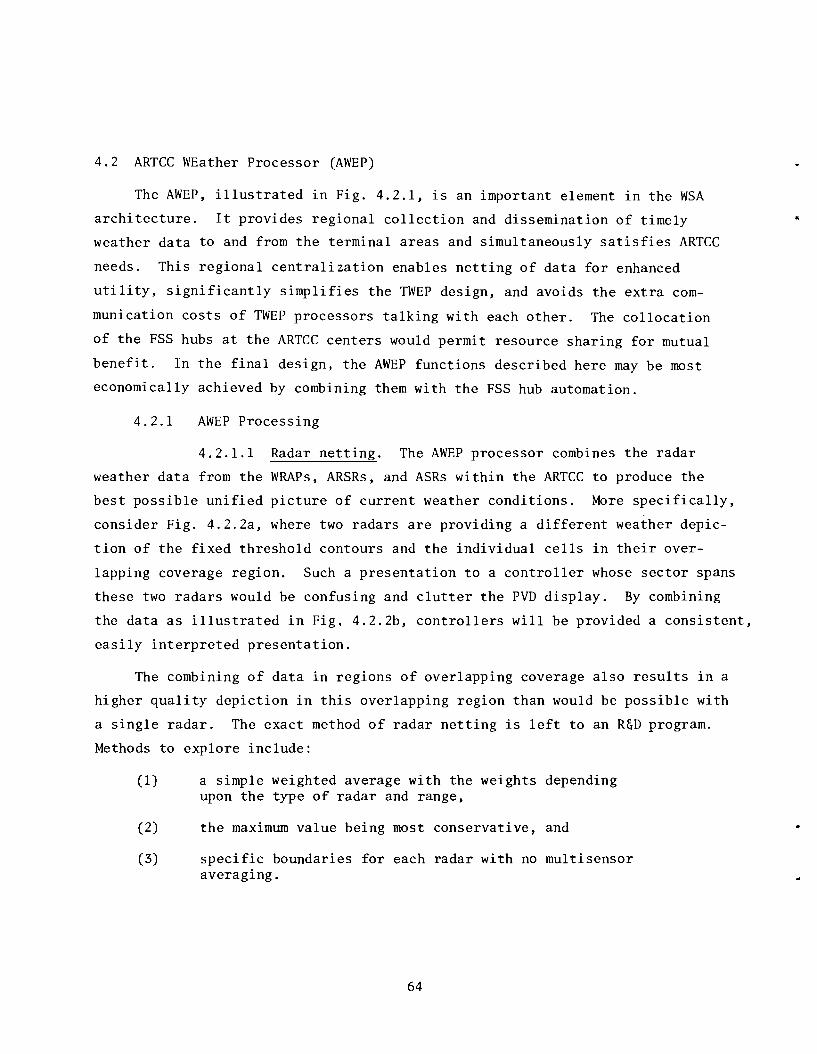
4.2 ARTCC WEather Processor (AWEP)
The AWEP, illustrated in Fig. 4.2.1, is an important element in the WSA
architecture. It provides regional collection and dissemination of timely
weather data to and from the terminal areas and simultaneously satisfies ARTCC
needs. This regional centralization enables netting of data for enhanced
utility, significantly simplifies the TWEP design, and avoids the extra com
munication costs of TWEP processors talking with each other. The collocation
of the FSS hubs at the ARTCC centers would permit resource sharing for mutual
benefit. In the final design, the AWEP functions described here may be most
economically achieved by combining them with the FSS hub automation.
4.2.1 AWEP Processing
4.2.1.1 Radar netting. The AWEP processor combines the radar
weather data from the WRAPs, ARSRs, and ASRs within the ARTCC to produce the
best possible unified picture of current weather conditions. More specifically,
consider Fig. 4.2.2a, where two radars are providing a different weather depic
tion of the fixed threshold contours and the individual cells in their over
lapping coverage region. Such a presentation to a controller whose sector spans
these two radars would be confusing and clutter the PVD display. By combining
the data as illustrated in Fig. 4.2.2b, controllers will be provided a consistent,
easily interpreted presentation.
The combining of data in regions of overlapping coverage also results in a
higher quality depiction in this overlapping region than would be possible with
a single radar. The exact method of radar netting is left to an R&D program.
Methods to explore include:
(1) a simple weighted average with the weights depending upon the type of radar and range.
(2) the maximum value being most conservative, and
(3) specific boundaries averaging.
for each radar with no multisensor
64
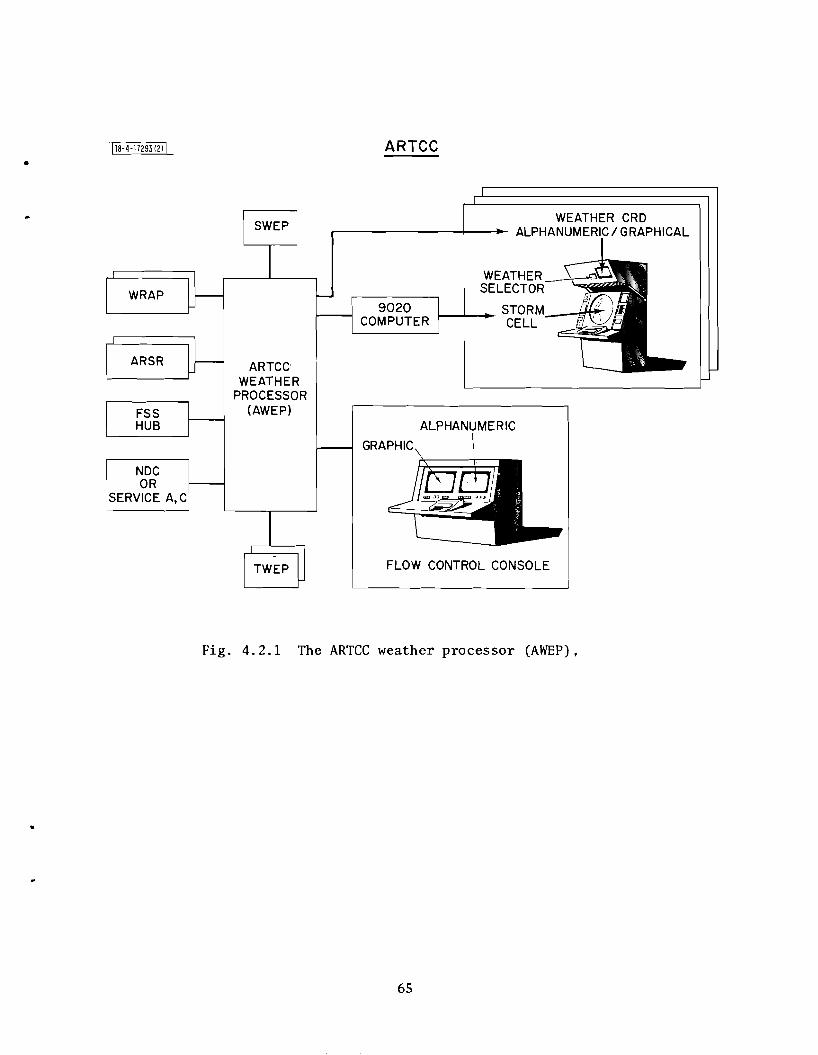
WEATHER~~
ARTCC •
WEATHER CRD .--------+---1~ ALPHANUMERIC / GRAPHICAL
SELECTORWRAP 9020 f--+-- STO RM_---:!'Ti
COMPUTER CELL
ARSR ARTCC WEATHER
PROCESSOR (AWEP)FSS
HUB ALPHANUMERIC
GRAPHIC \
NDC OR
SERVICE A,C
FLOW CONTROL CONSOLE
Fig. 4.2.1 The ARTCC weather processor (AWEP) ,
65
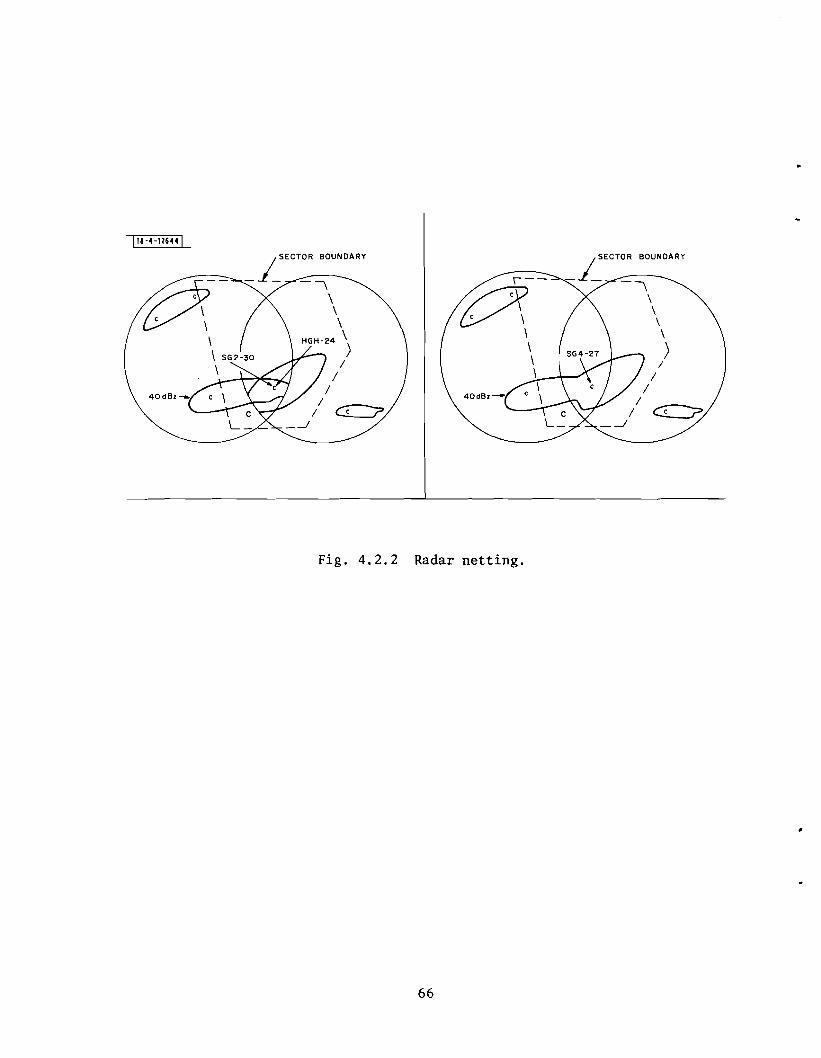
118-4-176441
_j SECTOR BOUNDARY
- -,~--
\
V' \ \
\ HGH-24
\ \ /
/ /
/ _J
\ )
/
..
_j ~ECTOR BOUNOARY
\
r--- -, ~
\
\ \ \ \ )\ \ /
/
/
//~ _J
Fig. 4.2.2 Radar netting.
66
4.2.1.2 Radar performance monitoring. An important useful by
product of rada: netting is performance and calibration monitoring of the
radars. Consistent large differences in the cell parameter estimates or the
threshold contours is a good indication that the radar is out of calibration.
The AWEP will keep running statistics and send an alert to the supervisor's
console when radar calibration maintenance is needed. This is not a substitute
for periodic on-site calibration.
4.2.1.3 Very short range cell forecast. The very short range
cast of cell positions and parameters (0-30 min.) is best done within the AWEP,
instead of at the radar site or at the TWEP, for four reasons:
to do a good job, especially near the radar boundaries, the cell forecasts should be based upon the netted radar data,
the extra complexity in having the AWEP processor perform the very short term forecast is more than offest by simplifying the more numerous TWEP and WRAP processors,
the very short range forecast will use wind field data which is readily available in the AWEP from its connection with the NDC or Service C.
the very short range forecast will be needed by the en route controllers anyway.
The very short range forecast will be based upon cell tracking and wind
fields. The exact algorithm will have to be determined ln an R&D program. For
more details, the reader is referred to Reference 5.
4.2.2 Data Storage and Management
Data request delays cannot be tolerated by controllers and it is
thus important that all weather products for ARTCC controllers be stored in the
AWEP in a form suitable for immediate retrieval .. Having to request data from
other WSA processors or the NWS on a routine basis with the immediate retrieval
requirement would complicate the communication requirements. Thus, relevant
meteorological data should be routinely transmitted to the AWEP from the radars,
the NWS, and any TWEP equipped terminals.
67
The flow controllers similarly need quick data retrieval; however, occa
sional delays of a few minutes are tolerable. For instance, special requests •
from the SWEP processor or meteorologist for conditions in other centers need
not be answered immediately.
More specifics on the data to be stored in the AWEP follows.
4.2.2.1 Radar weather data. After the processing discussed above,
the netted radar of current ARTCC conditions and the very short range cell fore
casts are stored in the AWEP for display to controllers. The short range fore
cast (0-4 hr) of squall lines and frontal movement which is computer generated
at the SWEP is also stored in the AWEP for use by flow controllers.
4.2.2.2 Local terminal observations from the TWEPs. Terminal
observations, especially from any TWEP-equipped TRACONs, should be transmitted
to the AWEP periodically from all automated sensors. The update interval should
be adaptable to the rate of change of the measured parameters (see Section 4.3.4
for details). This will enable: (1) flow controllers to quickly spot deterio
rating terminal conditions, (2) controllers to give pilots up-to-date data, and
(3) partially alleviate the uncertainty controllers have in feeding aircraft into
the terminal area. More specifically, the terminal observation data, which
should be transmitted to the AWEP if available in digital form from automated
sensors, includes: sky cover, ceiling, visibility, prevailing visibility,
weather type, obstruction to vision, sea-level pressure, temperature, dewpoint,
wind direction, wind speed, gusts, altimeter setting, runway visibility - RVV
or RVR, wind shear and wake vortex This data represents only 300-400 bits
from each airport (1 bit/sec for updates every 20 minutes). would be available
from the TWEP data base, and can thus be readily obtained with a negligible
impact upon the AWEP-TWEP data link. In addition, these surface observations
may be useful in the short range forecasts (0-4 hr) at the Sl'!EP.
68
24 27• 4.2,2.3 Selected NDC products. Th~ Nnr. - is a source for:
terminal observations from locations not connected to a TWEP,
terminal forecasts useful to both controllers and flow controllers,
PIREPS
wind and temperatures aloft on a synoptic scale (useful in the preparation of very short term cell forecasts).
graphical weather maps - these cannot be specified now since the computerized replacement of facsimile is still in developmental stages. However, some of these products should be useful for flow control planning.
Most of the above NDC data will also be needed by the FSS automation. The
graphical weather products which are presently available on NAFAX are more
applicable to FSS but possibly useful to ATC. A partial list of these include:
200, 300, 500, 700, 850 Mb analysis
36 hr heights/isotachs forecast - 300 Mb
Radar summary
12 hr upper wind and temperature prog. - 9,000, 18,000, 30,000 and 39,000 ft
Low level winds aloft - second standard level above surface, 5,000, 8,000 and 10,000 ft
Intermediate level winds aloft - 14,000, 25,000, 30,000 and 35,000 ft
Surface prog. - 12 and 24 hour
Significant weather prog. - 12 and 24 hour
NMC surface analysis
NMC weather depiction
Considering the overlap of interest in the NDC data base, combining the FSS
automation processor with the AWEP is a good approach to investigate. A
69
communication system to support FSS automation may be a source for this data
instead of the NDC.
4.2.2.4 Service A and C. Should the NDC not be available, the
terminal observations, forecasts, wind and temperature aloft data is available
on these two services.
4.2.2.5 PIREPs. Stale PIREPs, an hour or more old, are of little
utility for controlling traffic and thus the present Service A is not suited for
ATC. With colocation of the FSSs in the ARTCCs, the PIREPs relevant to the
ARTCC would readily and quickly be available. Improved procedures to obtain
PIREPs on a routine and structured basis from controllers could be instituted.
For a further discussion, see Appendix A3.
4.2.2.6 Alert messages, The flow controller, assistant chief,
the FSS personnel, and the SCC meteorologist should be able to send special alert
messages to any location in the WSA. These should be in a free format. The
AWEP stores and routes the messages to the designated user, Although it is en
visioned that the number of alert messages will be small, this is an important
feature.
4.2.3 Display Formatting and Automated Alerting
Display formatting involves presenting the data in an appro
priate form for display on the controller's PVD, weather CRD and the flow con
troller's two CRDs. These displays and what goes on them have been discussed
in Sections 3.1, 3.2 and 3.4.
The controller's weather display and the flow control console are relatively
straightforward design tasks since it does not involve an interface with existing
ATC equipment. A human factors study is needed to determine the appropriate
formats.
The storm cell data on the PVD is complicated by the necessary interface
with the NAS 9020 computer. This interface will involve a design tradeoff be
tween what is desirable from a human factors viewpoint and what is possible with
the 9020. Displays like those in Figs. 3.1.1-3.1.6 are possible; however,
human factor studies may end up preferring different display formats.
70
4.2.4 Data Communication
The AWEP is the regional collection and distribution point for
weather data. This regional centralization should minimize processor and com
munication costs.
4.2.4.1 Data collection. The AWEP receives digital weather data
from:
WRAP radars,at 300 bits/sec, only when there is measurable precipitation. The data includes cell positions, reflectivity, height, and diameter, plus one or two fixed threshold contours.
ARSRs for regions not covered by WRAP radars
TWEPs - ASR or WRAP radar data, surface observations, PlREPs
SWEP - short range forecasts, special messages
NDC, Service A and C, or FSS automation weather data.
4.2.4.2 Data distribution. The AWEP transmits digital weather
data to:
SWEP - netted radar data, terminal surface observations, PIREPs, and special messages
TWEP - netted radar data, very short range forecast, terminal observations from other terminals, PlREPs, the short range forecast originating at the SWEP, and special messages.
71
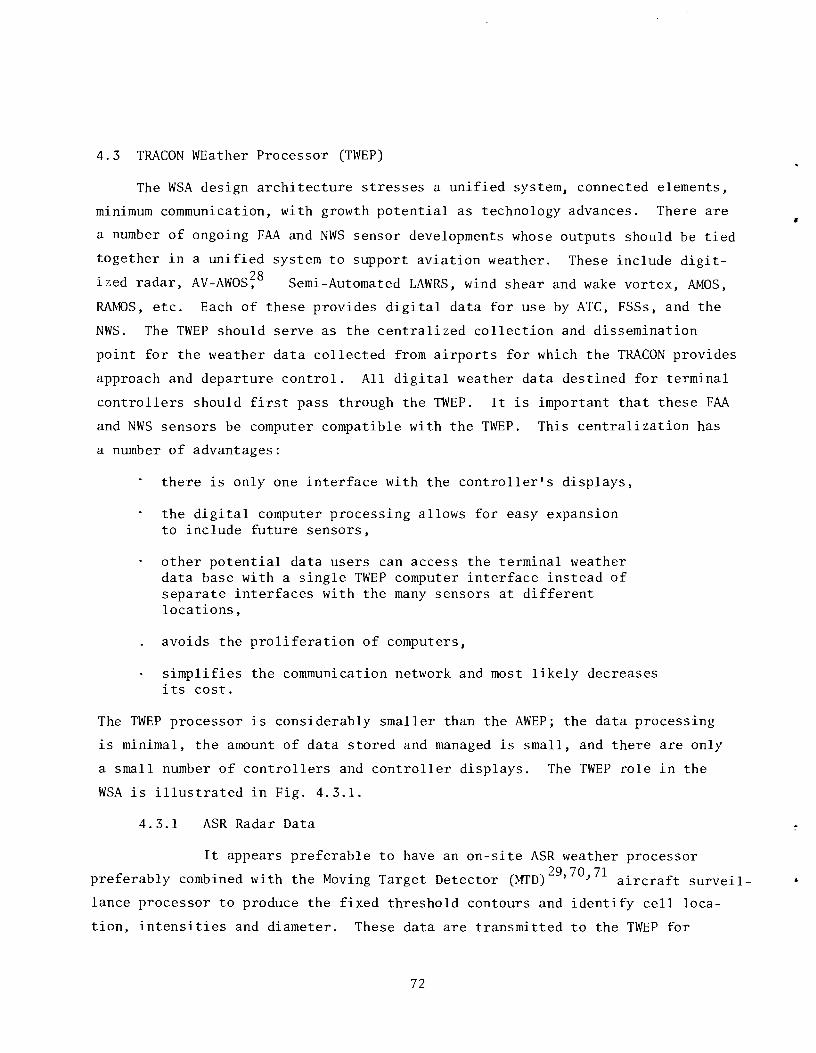
4.3 TRACON WEather Processor (TWEP)
The WSA design architecture stresses a unified system, connected elements,
minimum communication, with growth potential as technology advances. There are •
a number of ongoing FAA and NWS sensor developments whose outputs should be tied
together ln a unified system to support aviation weather. These include digit
ized radar, AV-AWOS~8 Semi-Automated LAWRS, wind shear and wake vortex, AMOS,
RAMOS, etc. Each of these provides digital data for use by ATC, FSSs, and the
NWS. The TWEP should serve as the centralized collection and dissemination
point for the weather data collected from airports for which the TRACON provides
approach and departure control. All digital weather data destined for terminal
controllers should first pass through the TWEP. It is important that these FAA
and NWS sensors be computer compatible with the TWEP. This centralization has
a number of advantages:
there is only one interface with the controller's displays,
the digital computer processing allows for easy expansion to include future sensors,
other potential data users can access the terminal weather data base with a single TWEP computer interface instead of separate interfaces with the many sensors at different locations,
avoids the proliferation of computers,
simplifies the communication network and most likely decreases its cost.
The TWEP processor is considerably smaller than the AWEP; the data processing
is minimal, the amount of data stored and managed is small, and there are only
a small number of controllers and controller displays. The TWEP role in the
WSA is illustrated in Fig. 4.3.1.
4.3.1 ASR Radar Data
It appears preferable to have an on-site ASR weather processor
preferably combined with the Moving Target Detector (MTD)29,70}71 aircraft surveil
lance processor to produce the fixed threshold contours and identify cell loca
tion, intensities and diameter. These data are transmitted to the TWEP for
72
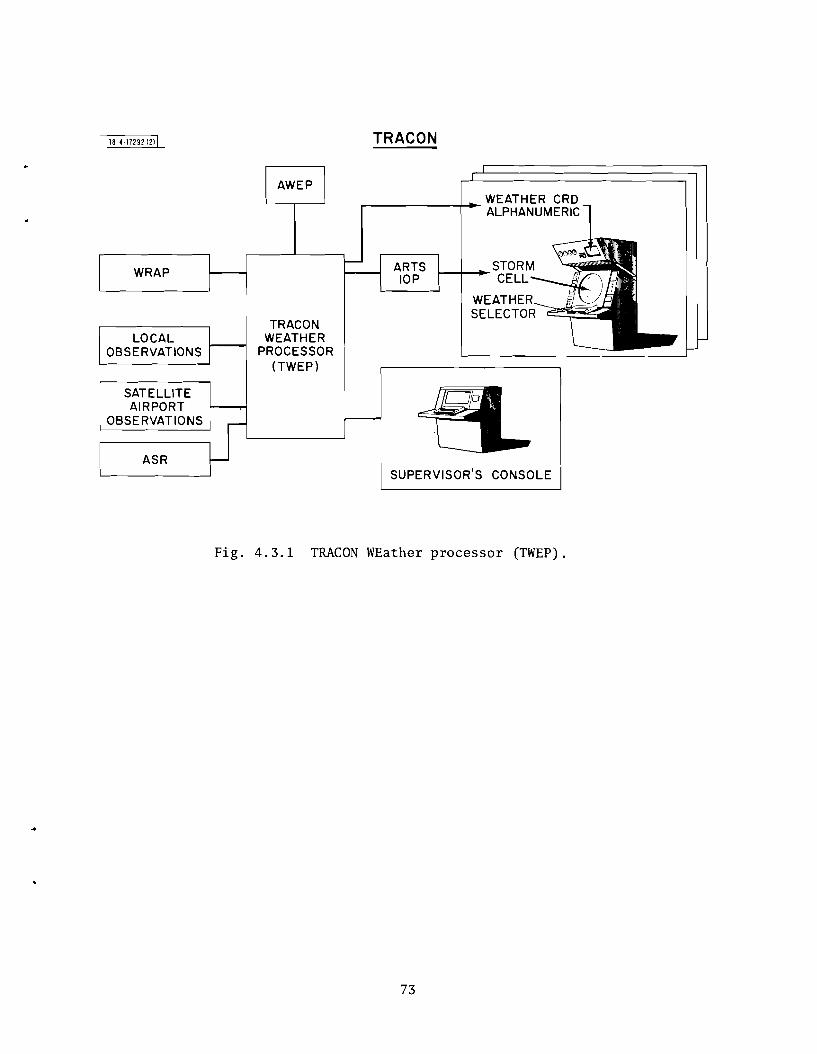
TRACON118-4-1119111l1
WEATHER CRD r------~~ ALPHANUMERIC
f---+-_STORMWRAP CELL
WEATHER
TRACON LOCAL WEATHER
OBSERVATIONS PROCESSOR (TWEP)
SELECTOR-e~~i
SATELLITE AIRPORT
OBSERVATIONS
ASR SUPERVISOR'S CONSOLE
Fig. 4.3.1 TRACON WEather processor (TWEP).
73
display on the terminal controller's radar scope. The TWEP also transmits this
data to the AWEP for radar netting and receives in return the very short range
forecast (5-30 min) and an updated depiction of current conditions based upon
netted radar data. Whether the controller's display of current conditions is
just from the ASR or the netted radar from the AWEP will depend upon the distance
to the nearest radar in the net. Even if the netted radar is preferred, the ASR
data should be available for display in case of a communication failure with the
AWEP.
Since the ASR is usually on the airport, communication costs between the
ASR and TWEP are not a prime consideration. It may thus be preferable for the
TWEP to assume part of this ASR weather processing. This decision will have
to wait for the ASR modification program results.
4.3.2 WRAP at the Airport
If there is a WRAP providing terminal area coverage then it will
be used instead of the ASR with the addition of storm cell top information.
4.3.3 Wind Shear and Wake Vortex
It is too early in this sensor development to determine the precise
role of the nVEP; however, the TWEP should be involved in alerting the controllers
of hazardous conditions. Whether this is in the form of the hazard location on
the PVD, and alert message on the PVD or weather CRD, or simply a red and green
light remains to be determined.
When wind shear or wake vortex conditions exceed some threshold, periodic
updates should be sent to the AWEP to alert en route controllers and flow con
trollers of changing terminal area acceptance rates. Once every 20 minutes
should normally be sufficient; however the update rate should be adaptive to
the fluctuation rate of the wind shear and wake vortex parameters.
4.3.4 Automated Surface Observations - AV-AWOS, Semi-Automated LAWRS,
AMOS, RAMOS, etc.
4.3.4.1 Coordination with TWEP. These automated sensor develop
ments should be carefully coordinated with the TWEP; the digital observations
should be accessible. The parameters include as many of the following as can
be automatically measured:
74
cloud height
sky cover
present weather - precipitation [yes/no], freezing precipitation
pressure
temperature
dew point
wind pirection
wind speed
gusts
altimeter setting
prevailing visibility
runway visibility (RVV)
RVR
Those that cannot be automatically measured should be observed at least once an
hour and manually entered. More frequent observations should be made and entered
when conditions change significantly. The above parameters represent at most
300-400 bits, wh~ch is a very small quantity of data.
One scenario for integrating these sensors into the TWEP is illustrated
in Fig. 4.3.2. The automated sensors at the airports for which the TRACON pro
vides approach control are accessible to the TWEP with automatic dial up using
standard voice grade phone lines; dedicated lines are not needed. The time in
terval between transmissions should be automatically adaptable and initiated by
the sensor. Once an hour should normally be sufficient; however~ during quickly
changing conditions, every 5 minutes might be necessary. Forming a loop with
dedicated lines or integrating this data with other ATC communication data may
be more advantagious in some places. The only important requirement is that
data, especially when conditions are changing, be rapidly transmitted to the
TWEP.
For the larger airports usually collocated with the TRACON, the controllers
(approach, departure, and tower) need a frequent update of the local conditions.
Presently, they receive a continuously updated meter reading of altimeter setting,
75
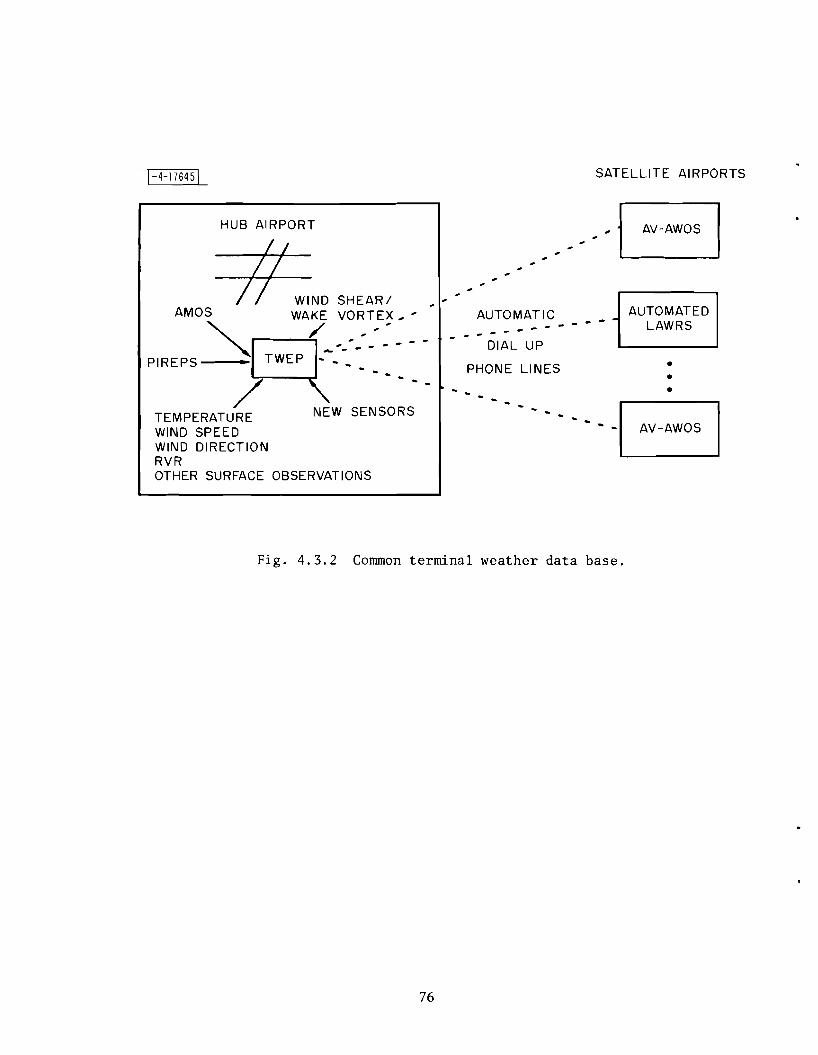
SATELLITE AIRPORTSl-4-17645L
HUB AIRPORT ______ j AV-AWOS I
#ND SHEAR/ AUTOMATIC AUTOMATED
_ - - LAWRSAMO~8WA/~~~~,E:~ ~ _ - - DIAL UP
PIREPS • TWEP .-. -. -. •PHONE LINES. ••
TEMPERATL NEW SENSO:S' •
WIND SPEED ··········1 IW-AWOS WIND DIRECTION RVR OTHER SURFACE OBSERVATIONS
Fig. 4.3.2 Common terminal weather data base.
.
76
wind direction, wind speed, and when conditions warrant, RVR. This service
should be continued except possibly the present meters at each control position
should be eliminated and the data presented on the controller's weather CRD via
the TWEP. Some meter readout in the TRACON may be advisable for backup.
4.3.4.2 TWEP management of surface observations. The TWEP pro
vides the approach, departure and the collocated tower with the most recent up
dates of local terminal observations. In addition, periodic summaries are sent
to the AWEP. The update interval should be adaptable but will rarely be more
frequent than every 20 minutes. These summaries include the most recent reading
plus peaks and averages over the reporting interval. With digital computer
processing, the nature of these peak and average reports can be specified and
changed once AWEP needs are more clearly understood.
4.3.5 Other Functions
The TWEP receives surface observations from the AWEP for nearby
airports (not controlled from this TRACON). This data should be accessible by
controllers on the weather CRD to assist pilots.
The supervisor should be able to enter PIREPs and other messages into the
TWEP for display to controllers and transmission to the AWEP.
Improved procedures should be developed for obtaining runway surface con
ditions. This is especially important during slippery conditions such as
snow, ice, and surface water. Whether this should be from automated sensors
or from the runway crews should be looked into.
77
4.4 SCC WEather Processor (SWEP)
24-27 .The NWS is undergoing an automation program of Weather Servlce Fore
cast Offices (WSFO) and Weather Service Offices (WSO). This involves a mini
computer based display terminal at each WSFO called Automation of Field Opera
tion and Services (AFOS). This automation system stresses computers talking
with computers which are interconnected via the digital National Distribution
Circuit (NDC). Virtually all the products presently carried on the many tele
type circuits (A,C,O, etc.) plus the facsimile products will be digitally cir
culated nationwide on the NDC for display on the AFOS terminals.
The AFOS terminal is recommended to form the nucleus of the SWEP for the
following reasons:
The NDC products and the AFOS display flexibility are well matched to the SCC needs for quick, timely, automated access to the NWS data base,
The clerical tasks presently performed by the SCC meteorologist are minimized,
AFOS has been developed for NWS personnel and thus any meteorologist provided by the NWS for SCC duties will be trained to use it,
Life cycle costs are minimized since the NWS is developing AFOS and there will be maintenance economics associated with the large number that will be in the field,
It should be upgradable to interface with the AWEPs and TWEPs for access to the changing surface observations, storm cell data, the very short term cell forecasts and PIREPs,
It should be reprogramable to generate the special aviation weather products like the short range (0-4 hr) squall line and frontal movement forecast. This will be based upon the storm cell data, surface observation, and rawinsonde data, This may require additional mini-computer computation power but the same AFOS displays should suffice.
A means is needed for displaying to the central flow controllers the picture
worked up by the meteorologist on the AFOS terminal. A decision should be
coordinated with the SCC automation plans. Should the AFOS terminal be in
stalled before SCC automation is realized, then there are
78
a number of temporary options ranging from the present rear screen viewgraph *projections to a large screen video projection directly interfaced to the AFOS
terminal. The latter type of equipment is rapidly evolving with a number of
systems on the market or being developed.
25The recommended installation of AFOS equipment for the Central Flow Con
trol Facility (CFCF) room of the SCC is depicted in Fig. 4.4.1. Note that some
AFOS equipment is positioned nearby the flow controllers.
*For example, Video Beam Television produced by Advent Corp. Cambridge, Massachusetts.
79
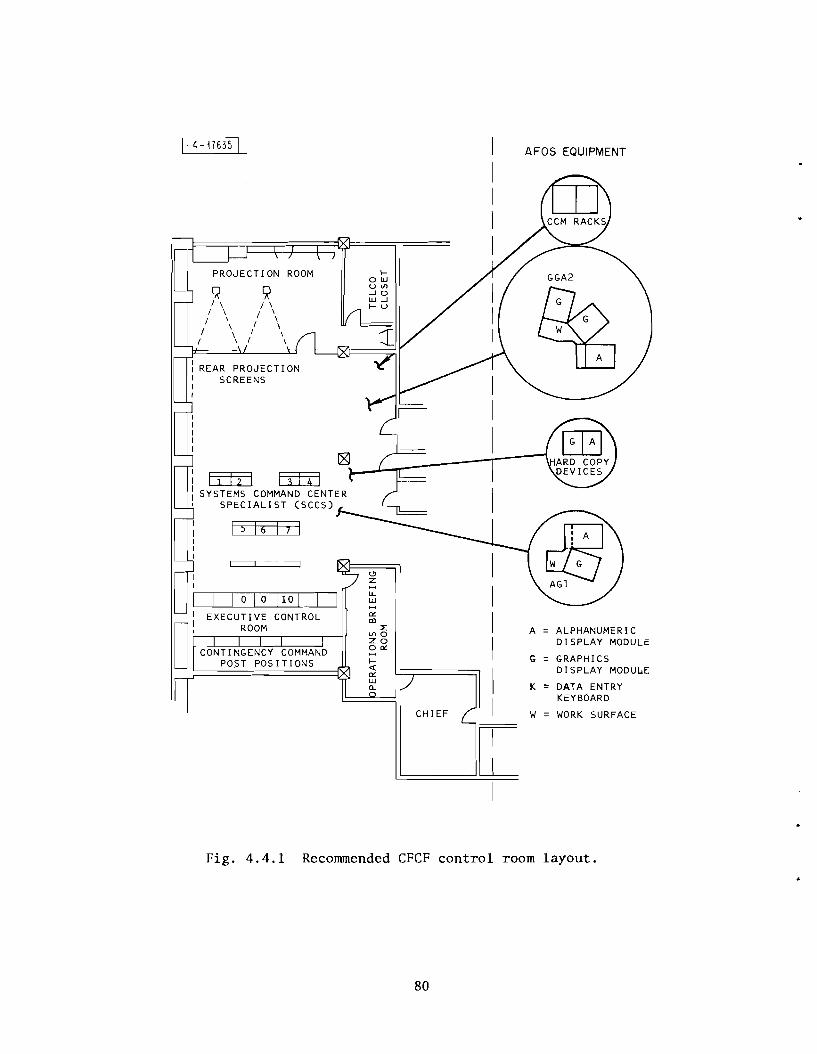
l-4-17635 L AFOS EQUIPMENT
A = ALPHANUMERIC DISPLAY MODULE
G = GRAPHICS DISPLAY MODUuE
K = DATA ENTRY KEYBOARD
W = WORK SURFACE
I
I I I
I I
[ CHIEF
:I: VlO ZO O~
f<{ ~ UJ a.
o z ~
lL UJ
9 / \
/ \ I \
I \ \
I \
9 I \
I \ I \
/ \ I \
PROJECTION
o I 0 110 I
: REAR PROJECTION I SCREENS I I
: 111z1 E1JSBi S YS TEMS COMMAND CENTE R , SPECIALIST (SCCS)
5 16 7
I EXECUTIVE CONTROL
O I ROOM
, CONTINGENCY COMMAND POST POS ITIONS
Fig. 4.4.1 Recommended CFCF control room layout.
80
4.5 Communication Structure
Data communications for collection and dissemination of weather data plays - -f·· 30,31 d -11 .a slgnl lcant role In today's system· an WI 3s~ume even greater Impor
tance in future, more automated sy~tem~.
An analysis of the data flow on the various links connecting ATC facilities
and NWS facilities has led to the estimates of peak data rate requirements ill
Table 4.5.1. Efficient coding in terms of storm cells and contours permits the
weather radar graphic data to be transmitted at the low datil rate of 300 bits!
sec (see Appendix AI). Between ShU) and AI\TP there is some uncertainty in data
rate since the peak demand depends on the type of real-time interactive graphic
communication that is carried on between the SCC: meteoroloQist and en route flow
controllers.
The demand for communications capacity to support weather data flO\oJ between
ATC facilities is small and can readily be accommodated by the proposed Integrated
National Aviation Communications System (INACS) or most any reliable data com23
munication network. The overall connectivity of INACS is shown in Fig. 4.5.1;
notice that a weather radar connection is provided.
In addition to the FAA links, weather data will be carried by the NWS on
the NDC and State Distribution Circuit (SOC). A brief description of these two
circuits and the nodal point processors is given in Appendix A2. For more
details, see References 24-27.
The role of the links in supporting the aviation weather needs is illustrated
in Fig. 4.5.2. Arrowheads indicate the direction of oneway data flow; lines
without arrows imply bi-directional flow. The NDC loop connects WSFO's and the
National MeteorOlogical Center (NMC). A branch NWS - State Distribution Circuit
(SOC) to a WSO indicates one method of collecting weather data from automatic
meteorological observation stations (AMOS).
The left side of Fig. 4.5.2 represents the eventual configuration of an
AWEP linked to a WSFO. This connection can serve for both collection and dis
semination of weather data. The observation stations associated with the TWEP
equipped TRACONs could pass their data via TWEP and AWEF to the NDC network.
81
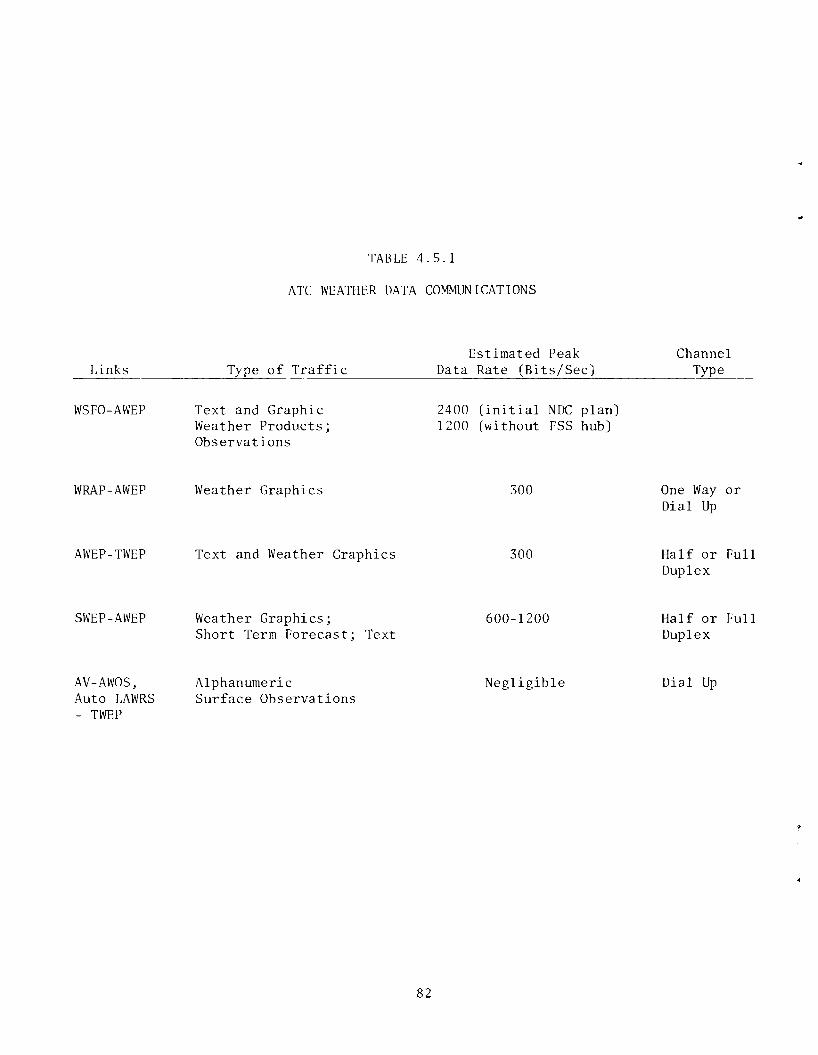
ATC
TABLE 4.5.1
WEATHER DATA COMMUNICATIONS
Links Type of Traffic Estimated Peak
Data Rate (Bits/Sec) Channel
Type
WSFO-AWEP
WRAP-AWEP
AWEP-TWEP
SWEP-AWEP
AV-AWOS, Auto LAWRS - TWEP
Text and Graphic Weather Products; Observations
2400 1200
(initial NDC plan) (without FSS hub)
Weather Graphics 300 One Way Dial Up
or
Text and Weather Graphics 300 Half or Duplex
Full
Weather Graphics; Short Term Forecast; Text
600-1200 Half or Duplex
Full
Alphanumeric Surface Observations
Negligible Dial Up
82
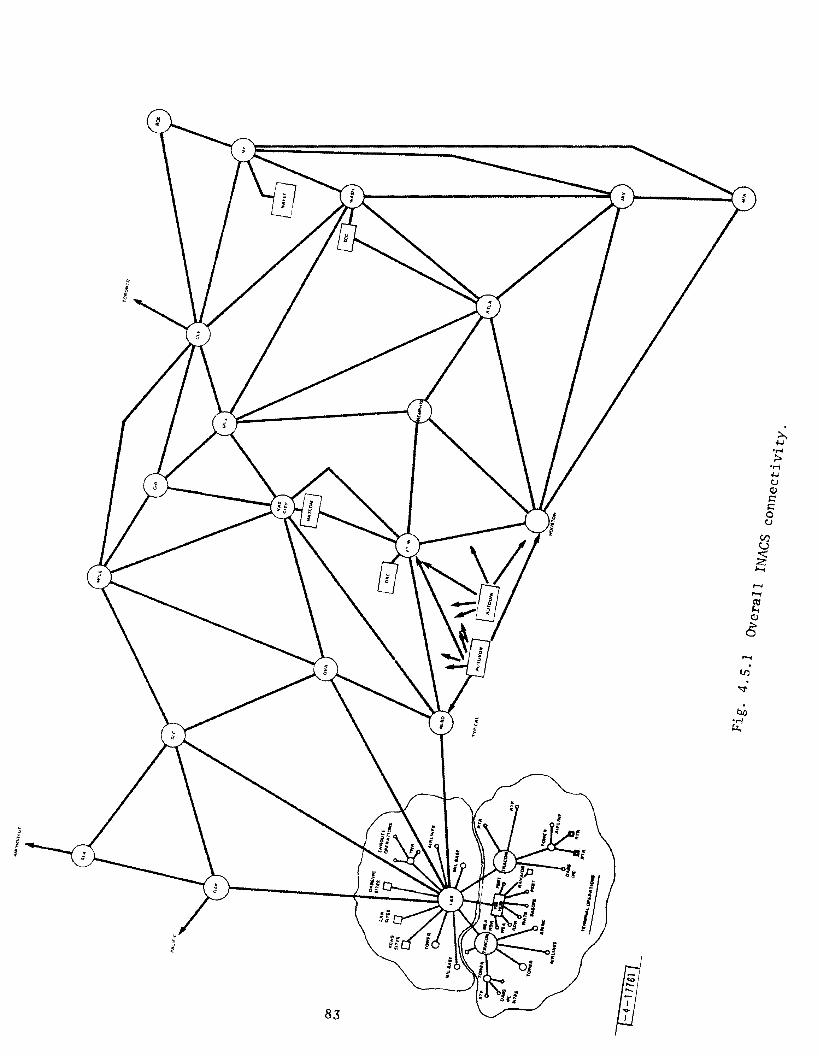
J
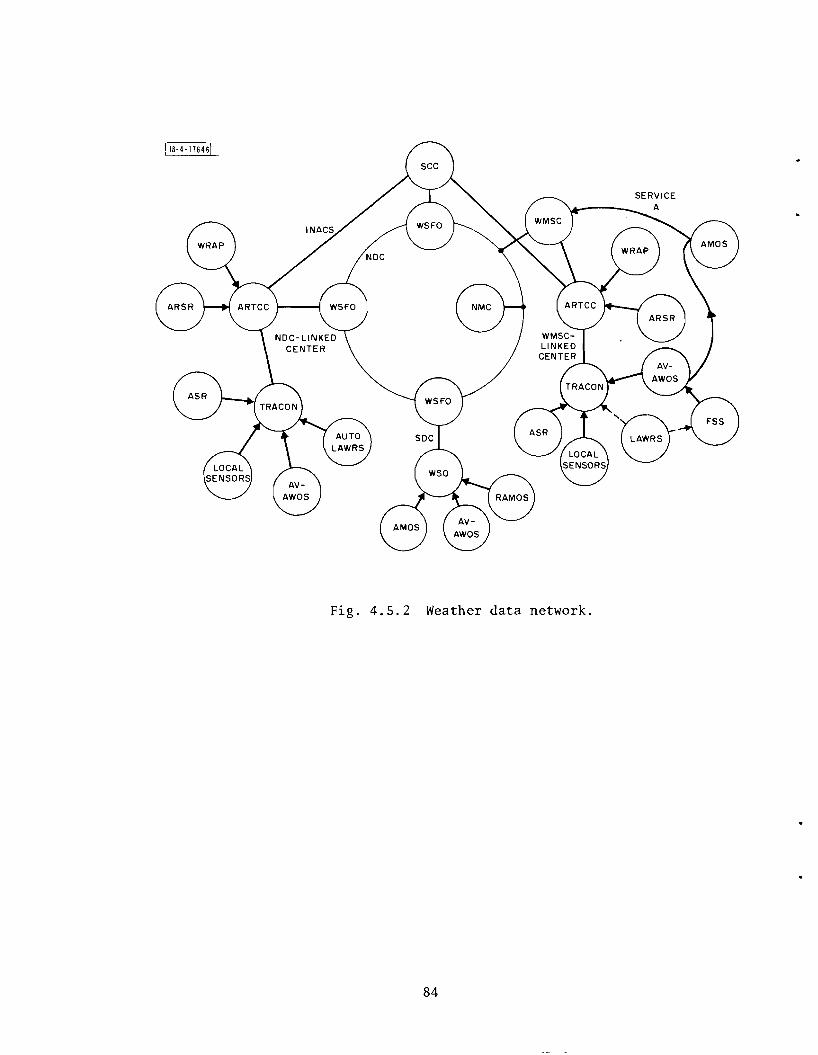
118-4-116461
Fig. 4.5.2 Weather d ata network.
84
INACS can support the link between AWEP and SWEP via a routine that may
involve several intervening ARTCC nodes.
An earlier stage in the evolution of the weather system is shown on the
right of Fig. 4.3.2. Surface observations from the stations in the ARTCC area
are acquired by the Weather Message Switching Center (WMSC) via Service A as
in the present system. Collection of observations involves manual handling of
data as indicated by the dotted lines from LAWRS to the TRACON and FSS. The
AWEP obtains weather data directly from the WMSC.
Note that the two types of ARTCC modes are entirely compatible and can co
exist during an indefinite transition period. The only requirement is a tie
point between NDC and WMSC to permit exchange of data. Such an interchange 24
capability is planned for NDC according to the AFOS development plan.
The broad outline of a weather data network presented here demonstrates
the need for close coordination between the FAA and NWS to assure mutual satis
faction of requirements, to avoid duplication of effort, and to clearly define
interface specifications.
4.5.1 Dial-Up Links - Communication Economy
Eventually, as a network of WRAPs are deployed, the communication
from these radars to the AWEP could be the major factor in communication costs.
However, most of the time, in most regions of the country, there is no measurable
precipitation. Automated dial-up using standard voice grade phone lines could
provide the data when needed. More specifically, the WRAP processor could auto
matically initiate the phone link when certain thresholds are exceeded. Con
sidering that the peak data rate is only JOO bits/sec, normal voice lines could
satisfy the requirements.
The storm cell data also dominates the link between the AWEP and TWEP. A
variable capacity link using dial-up may also be preferred here with only the
surface observations being carried routinely.
85
Finally, for the AWEP-SWEP link, a dedicated 300 bits/sec line could carry *
the surface observations to the SCC. When conditions warrant, a dial-up link
could transmit the storm cell data to the SWEP and the short range forecasts
plus special graphics to the AWEP.
Dial-up links should be used instead of dedicated lines providing the duty
cycle is low enough. This decision must be made depending upon the weather
conditions around each facility and the availability of other data links to
multiplex data with. It is important to emphasize that the particular communica
tion structure is not important and can vary from region to region. Rapid dis
semination is the only requirement.
* The hourly and special surface observations come from the NDC. This link provides more frequent updates when conditions are changing quickly.
86
5.0 THE ENGINEERING AND DEVELOPMENT PLAN
The development plan (Fig. 5.0.1), will achieve a prototype demonstration,
a design specification and an initial operating capability of the system con
cept within five years of program initiation. During the five year development
cycle certain operational improvements can be achieved, particularly: (1) an
ASR weather modification to identify storm cells to controllers, (2) an AFOS
system to support the SCC and (3) improved PIREP acquisition and distribution.
Development is subdivided into three program elements. The first program
element focuses on the AWEP, TWEP and SWEP to manage, process, communicate and
display user-oriented data to controllers, flow controllers, and central flow
controllers. The second program element, the ASR modification to enhance
identification and the third element, the joint use Weather radar, are meant to
provide the needed radar data for terminal and en route control respectively.
Other needed sensor developments are currently being actively pursued by the FAA
and are not included in this development plan.
5.1 AWEP, TWEP, and SWEP Development
The goal of this development is to design a connected system to satisfy
the needs expressed in Section 2 with the features in Section 3. The system
architecture in Section 4 provides the structure on which to base the design.
This development is broken down into three efforts.
5.1.1 Processor Design and Interfacing
The goal is to develop the processor, display and communication
equipment necessary to demonstrate the concept in operational control facilities
The major tasks are:
Design and implementation of prototype equipment.
Computer processor slzlng and software development to process, manage, communicate, and display the data.
Designing the supporting communication structure which takes maximum advantage of FSS Hub and NWS communication automation plans.
87
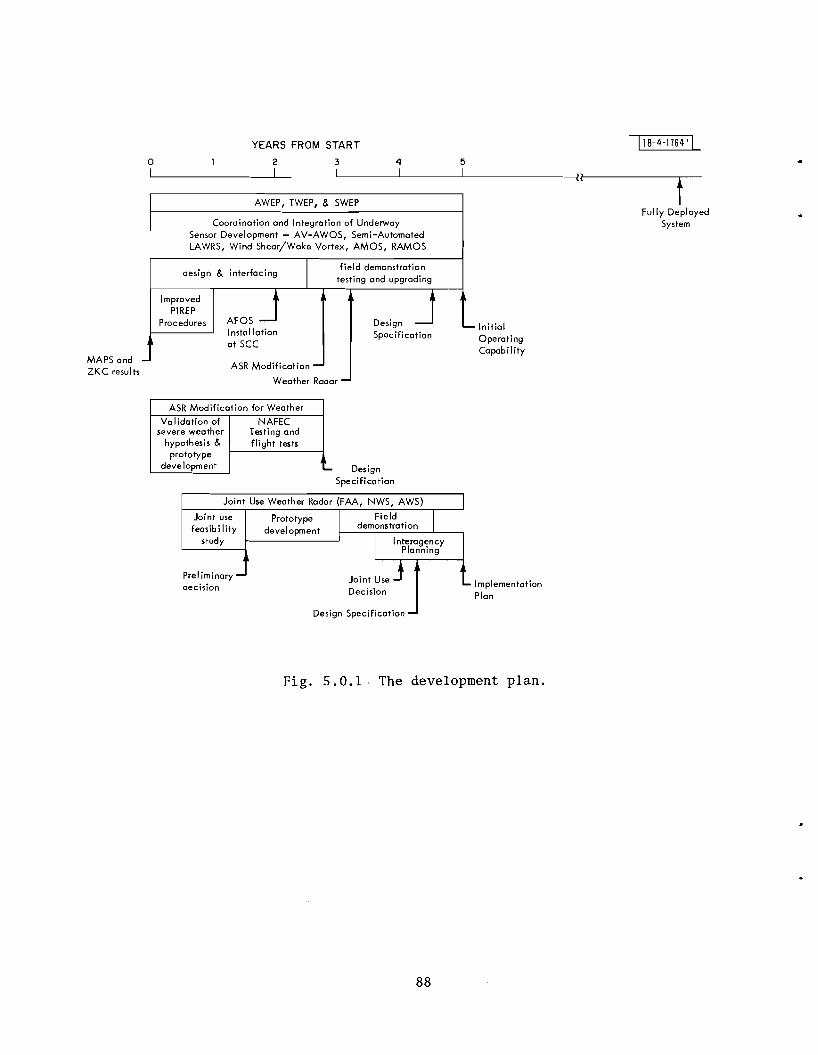
YEARS FROM START l18-4-17641 L o 2 3 4 5 I I I I I
AWEP, TWEP, & SWEP
Coordination and Integration of Underway Sensor Development - AV-AWOS, Semi-Automated LAWRS, Wind Shear/Woke Vortex, AMOS, RAMOS
design & interfacing I
field demonstration testing and upgrading
Improved
AFOS J JPIREP Procedures Design
Installation Specification at SCC
ASR Modification -
-
t-Fully Deployed
System
..... Initial Operating Capability
MAPS and ZKC results
Weather Radar
ASR Modification for Weather
Validation of NAFEC severe weather Testing and
hypothesis & prototype
flight tests
development .... Design Specification
Joint Use Weather Radar (FAA, NWS, AWS)
Joint use feasibi lity
study
Preliminary decision
Field I demonstration IPrototype
development Interogency
PlanningI
Joint Use J - ImplementationDecision Plan
.. ,
Fig. 5.0.1 The development plan.
88
FSS Hub coordination to promote shared resources and avoid • processor duplication especially in the en route centers.
NWS coordination to encourage the generation of weather products, primarily forecast, in a form most applicable to ATC.
AFOS installation and assessment at the SCC
5.1.2 Coordination and Integration of Underway Sensor Developments - AVAWOS, Semi-Automated LAWRS, Wind Shear/Wake Vortex, AMOS, RAMOS.
The goal is the common terminal wide weather data base which is
necessary to support the TRACON. These sensors, as currently being developed,
should adequately satisfy ATC in the eighties. The major tasks are:
Monitoring the sensors digital output design to ensure compatibility with the TWEP design.
Establishing the timely communications necessary to support terminal control.
5.1.3 Field Demonstration Testing and Upgrading
The goal is the system concept validation in operational control
facilities. These tests will include the processing and management of the sur
face observations, forecasts, ASR radar, and weather radar data to produce the
displays discussed in Section 3. The major tasks are:
To assess the benefits/cost on the TRACON, En Route, and SCC facilities.
The implementation of weather displays and user access with the appropriate human factor considerations.
The design and implementation of necessary upgrading based upon the operational tests
AFOS upgrading at the SCC if necessary_
A design specification for an operational system.
89
5.1.4 Improved PIREP Procedures •
The goals are improved procedures for acquiring and disseminating
PIREPS. The major tasks are:
To develop improved procedures for use in the near term until the implementation of the DABS data link.
To plan for the automatic acquisition of airborne meteorological data from aircraft via the DABS data link.
One new idea to consider in the near term is described in Appendix A3.
•
90
5.2 ASR Modification for Weather
The goal is the depiction and forecast of hazardous weather to terminal
controllers with a radar weather processor integrated with the Moving Target
Detector (MTD).29, 70, 71
5.2.1 Validation of the Severe Weather Hypothesis and Prototype Development
5Recent MIT Lincoln Laboratory studies indicate that regions
hazardous to aviation due to convective turbulence can be identified with pre
cision measurement and processing of radar reflectivity maps. The goal of this
subtask is to validate this hypothesis and produce a prototype weather modifi
cation for the ASR. The major interrelated tasks are:
A prototype ASR weather processor suitable for testing in conjunction with the MTD.
Very short term forecast algorithm development
Pencil beam radar and flight test experiments to assess the association of small cells with aircraft hazards
5.2.2 NAFEC Testing and Flight Tests
The goal of this subtask is to demonstrate to the FAA the validity
and utility of the ASR weather processor. The major tasks are:
Integration of the weather processor output into an ARTS III display.
Validation flight tests.
A design specification for an integrated MID - weather processor
9]
5.3 Joint Use Weather Radar (FAA, NWS, AWS)
The goal of this subtask is a weather radar network to simultaneously sup
port FAA, NWS and AWS needs. The FAA should take a leadership role in this hard
ware development because their needs for fresh data are the most stringent.
5.3.1 Joint Use Feasibility Study
The goal of this study task is to conduct the preliminary investiga
tions necessary for development of a joint use weather radar. The major tasks
are:
Understanding the needs of each agency
Defining an experimental program to demonstrate the joint use desirability
Strawman radar designs
The cost benefits of a joint use weather radar network
5.3.2 Prototype Development
The goal of this subtask is to develop a prototype weather radar
suitable for joint use testing. The major tasks are:
The hardware development to implement the most promising strawman design
A test plan to demonstrate the joint use capability
5.3.3 Field Demonstration
The goal of this subtask is to demonstrate the joint use weather
radar in operational facilities. The major FAA tasks in this testing are:
To interface with the prototype AWEP being field demonstrated at this time
To determine the utility of the data for ATe.
92
5.3.4 Interagency Planning
The goal of this effort is to plan a comprehensive development and
implementation program for a new joint use weather radar national network which
would interface with user-agency systems for the 1980s and 1990s. The major
tasks include:
Prepare cost vs. benefit analyses
A final decision on joint use desirability and compatibility
Develop an engineering requirement (specification) for procuring the joint use weather radars
Develop an implementation plan
93
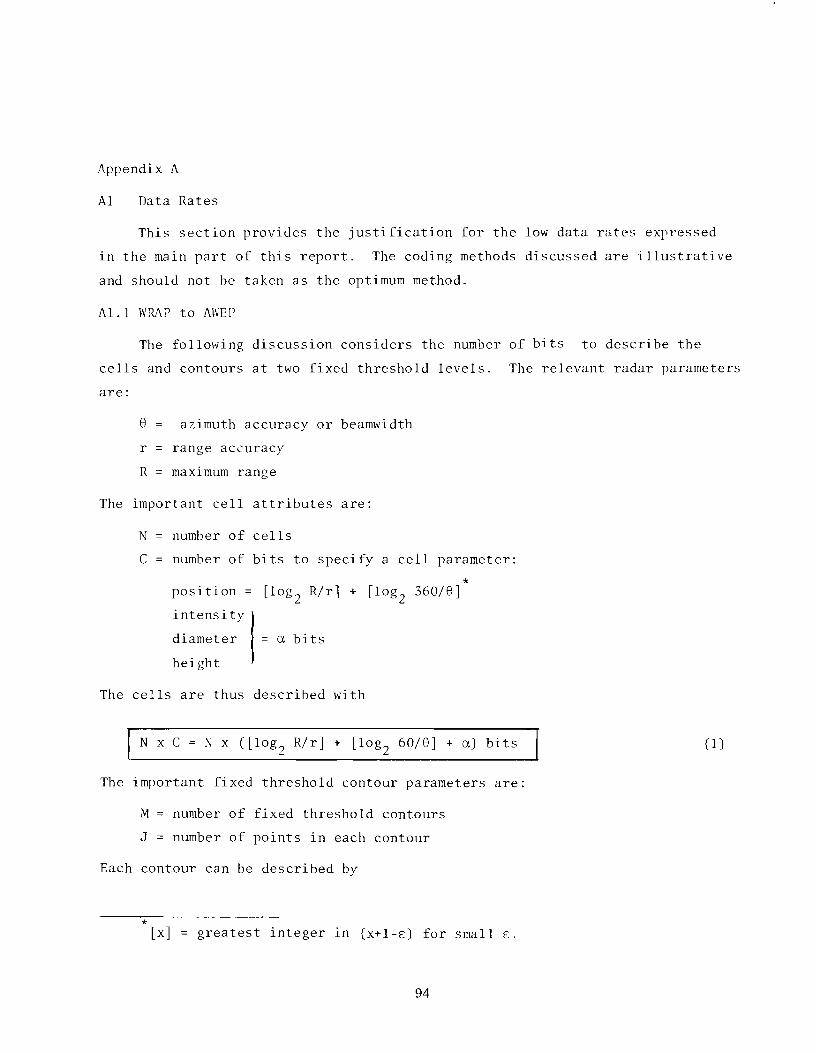
Appendix A
AIData Rates
This section provides the justification for the low data rates expressed
ln the main part of this report. The coding methods discussed are illustrative
and should not be taken as the optimum method.
AI. I WRAP to AWEP
The following discussion considers the number of bits to describe the
cells and contours at two fixed threshold levels. The relevant radar parameters
are:
8 azimuth accuracy or beamwidth
r range accuracy
R maximum range
The important cell attributes are:
N number of cells
C number of bits to specify a cell parameter:
* position = [log2 R/r] + [log2 360/8]
intensity
diameter a bits
height
The cells are thus described with
N x C = N x ([log2 R/r] + [log2 60/8] + a) bits (1)
The important fixed threshold contour parameters are:
M number of fixed threshold contours
J number of points in each contour
Each contour can be described by
* [x] greatest integer in (X+l-E) for small E.
94
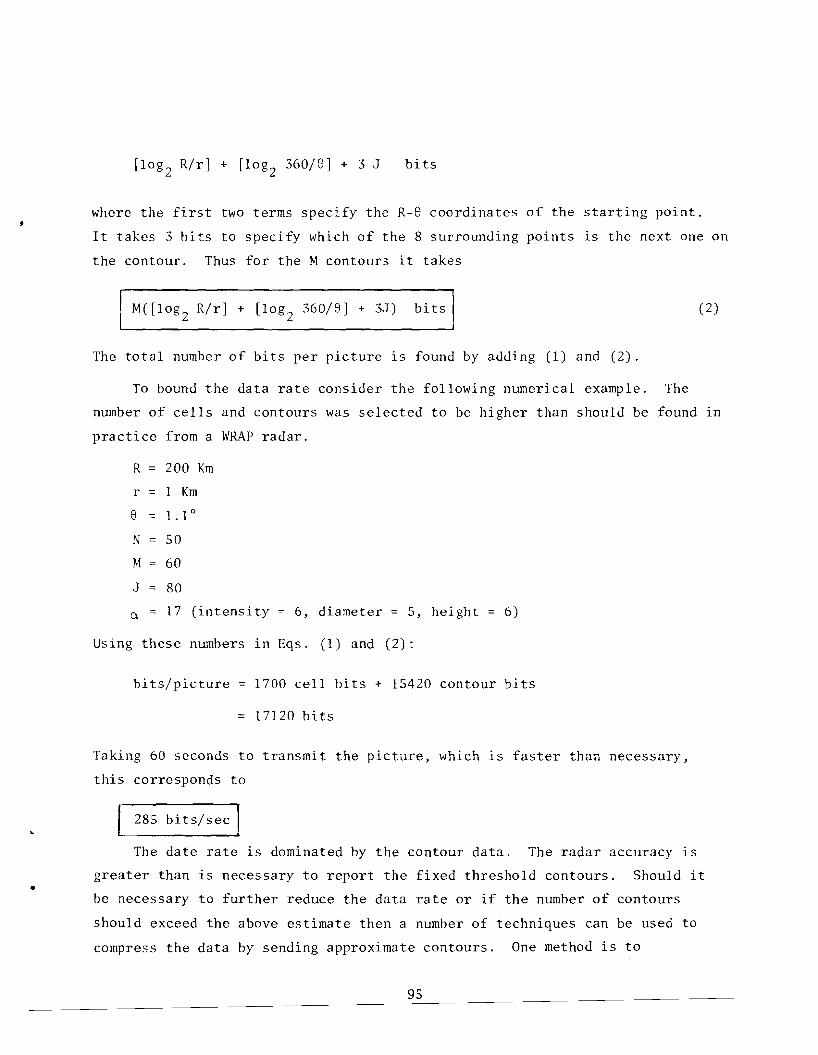
[10g2 R/r] + [logz 360/8] + 3 J bits
where the first two terms specify the R-8 coordinates of the starting point.
It takes 3 bits to specify which of the 8 surrounding points is the next one on
the contour. Thus for the M contours it takes
I M([10g2 R/r] + [10g2 360/8] + 3J) bits I (2)
The total number of bits per picture is found by adding (1) and (2).
To bound the data rate consider the following numerical example. The
number of cells and contours was selected to be higher than should be found in
practice from a WRAP radar.
R 200 Km
r 1 Km
e 1. 10
N 50
M 60
J 80
a =c =c17 (intensity 6, diameter 5, height 6)
Using these numbers in Eqs. (1) and (2):
bits/picture 1700 cell bits + 15420 contour bits
== 17120 bits
Taking 60 seconds to transmit the picture, which is faster than necessary,
this corresponds to
285 bi ts/ sec l The date rate is dominated by the contour data. The radar accuracy is
greater than is necessary to report the fixed threshold contours. Should it •
be necessary to further reduce the data rate or if the number of contours
should exceed the above estimate then a number of techniques can be used to
compress the data by sending approximate contours. One method is to
95
transmit every Kth contour point plus additional points in regions of high
curvature. A method of sensing high curvature is to compare the distance be
tween transmitted points to a threshold. The equation for the contour bits
then becomes •
2J [log2 (2K + 1)] M( [log2 R/ r] + [ log2 36 0/ e] + K ) bits
where it takes 2[log2(2K + 1)] bits to specify each successive transmitted point
following the first point and there are J/K points.
Using the same example as before with K = 7,
bits/picture 1700 cell bits + 9300 contour bits
10,000 bits
This corresponds to 167 bits/sec in 60 seconds.
The cell and contour data should suffer virtually no queing delay even
though it takes 60 seconds to transmit a picture since the cells and contours
will be produced by the radar sequentially. Actually the radar refresh rate
will be somewhere between 3 and 5 minutes which allows even more time to trans
mit the picture than was assumed in the above examples. However, it is felt
that sufficient capacity should be provided to transmit the picture in 1 minute.
Al.2 TWEP - AWEP
The data rates ln each direction are considered separately. The TWEP to
AWEP data includes the ASR radar data plus some surface observations for local
airports. The AWEP to TWEP data includes the netted radar data, very short
range cell forecast, surface observations from a few nearby airports and the
short range forecast. There are also special messages and PIREPs transmitted
in each direction; however, these add little to the data rates.
•
96
•
•
Al.2.l TWEP to AWEP
The data rate equations in the last section are also applicable here
for transmitting the ASR cell and contour data to the AWEP. Due to the shorter
range there are proportionally fewer contours and cells. Consider the following
parameters where the number of cells and contours was selected to be higher than
should be found in practice,
R 75 Km
r = 1 Km
e 1.1 0
N = 20
M 25
J 120
a = 11 (intensity 6, diameter 5, height = 0 )
Using Eqs. A.l.l and A.l.2 this results in
bits/ASR picture 540 cell bits + 6,400 contour bits
6,940 bits
The average Service A surface observation is 400 bits. With 10 peripheral
(a high estimate) airports this represents only 4,000 bits. Even if both the
radar and the surface observations needed to be transmitted in 60 seconds this
results in
180 bits/sec
Actually the radar picture updates are generated every 3 to 5 minutes and the
surface observations should rarely be more frequent than every 20 minutes. Thus
a 300 bit/sec channel would be idle for much of the time. However, this extra
capacity permits the rapid transmission of the radar data and allows for growth
potential.
97
Al.2.2 AWEP to TWEP
The data rate equations in Section Al.l are also applicable here
with small modification for transmitting the netted radar data and very short
term forecast. The very short term (0-30 min) cell forecast in 5 minute inter
vals requires 6 times the data rate given by Eq. (1). The contours require the
same data rate given in Eq. (2). Using the same numbers as in the example in
Section Al.2.l this results in
bits/picture 6 x 540 cell bit + 6400 contour bits
= 9,640 bits
Sending surface observations on 10 nearby airports results in 4,000 bits. Again
even if both the radar and surface observation needed to be transmitted in 60
seconds this results in
225 bits/sec
Actually the netted radar data and the very short term forecast are generated
every 3 to 5 minutes and the surface observations should rarely be more frequent
than every 20 minutes. Thus a 300 bit/sec channel half or full duplex would be
idle much of the time. This extra capacity will be partially used for special
messages, PIREPs, the short range forecast and allows for growth potential as
new meteorological uses are developed.
Al.3 SWEP-AWEP
The AWEP to SWEP data rate should be dominated by the radar cell and con
tour data, and surface observations. Twenty minute updates should be sufficient
for both. Using the bits/picture number derived in Section Al.l and assuming
30 airports to report surface observations for results in;
17120 bits/picture x 7 radars 100 bits/sec20 min. x 60 sec/min
•
98
400 bits/surface obs. x 30 obs. 10 bits/sec
20 min x 60 sec/min
for a total of 110 bits/sec.
The data rate from the SWEP to AWEP is difficult to estimate until the
products carried from the see are specified further. Peak data rates of 600
1200 bits/sec are assumed.
99
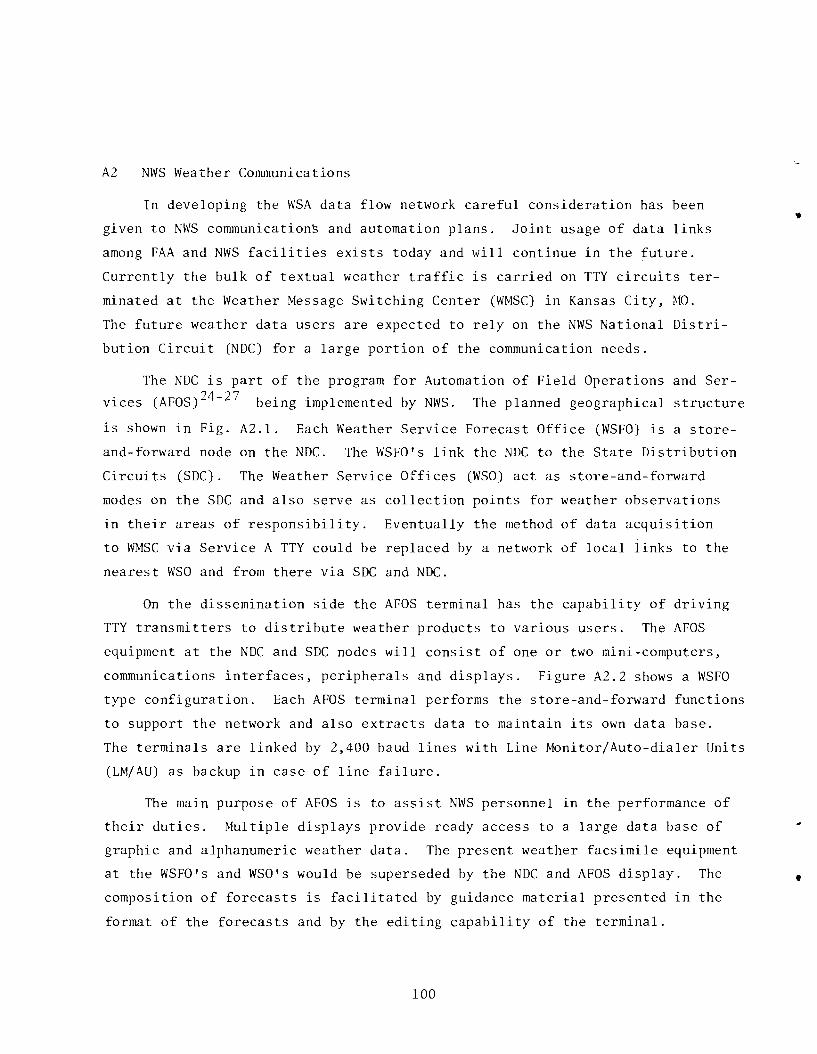
A2 NWS Weather Communications
In developing the WSA data flow network careful consideration has been
given to NWS communication~ and automation plans. Joint usage of data links
among FAA and NWS facilities exists today and will continue in the future.
Currently the bulk of textual weather traffic is carried on TTY circuits ter
minated at the Weather Message Switching Center (WMSC) in Kansas City, ~~.
The future weather data users are expected to rely on the NWS National Distri
bution Circuit (NDC) for a large portion of the communication needs.
The NDC is part of the program for Automation of Field Operations and Ser
vices (AFOS)24-27 being implemented by NWS. The planned geographical structure
is shown in Fig. A2.1. Each Weather Service Forecast Office (WSFO) is a store
and-forward node on the NDC. The WSFO's link the NDC to the State Distribution
Circuits (SDC). The Weather Service Offices (WSO) act as store-and-forward
modes on the SOC and also serve as collection points for weather observations
in their areas of responsibility. Eventually the method of data acquisition
to WMSC via Service A TTY could be replaced by a network of local links to the
nearest WSO and from there via SDC and NDC.
On the dissemination side the AFOS terminal has the capability of driving
TTY transmitters to distribute weather products to various users. The AFOS
equipment at the NDC and SOC nodes will consist of one or two mini-computers,
communications interfaces, peripherals and displays. Figure A2.2 shows a WSFO
type configuration. Each AFOS terminal performs the store-and-forward functions
to support the network and also extracts data to maintain its own data base.
The terminals are linked by 2,400 baud lines with Line Monitor/Auto-dialer Units
(LM/AU) as backup in case of line failure.
The main purpose of AFOS is to assist NWS personnel in the performance of
their duties. Multiple displays provide ready access to a large data base of
graphic and alphanumeric weather data. The present weather facsimile equipment
at the WSFO's and WSO's would be superseded by the NDC and AFOS display. The • composition of forecasts is facilitated by guidance material presented in the
format of the forecasts and by the editing capability of the terminal.
100
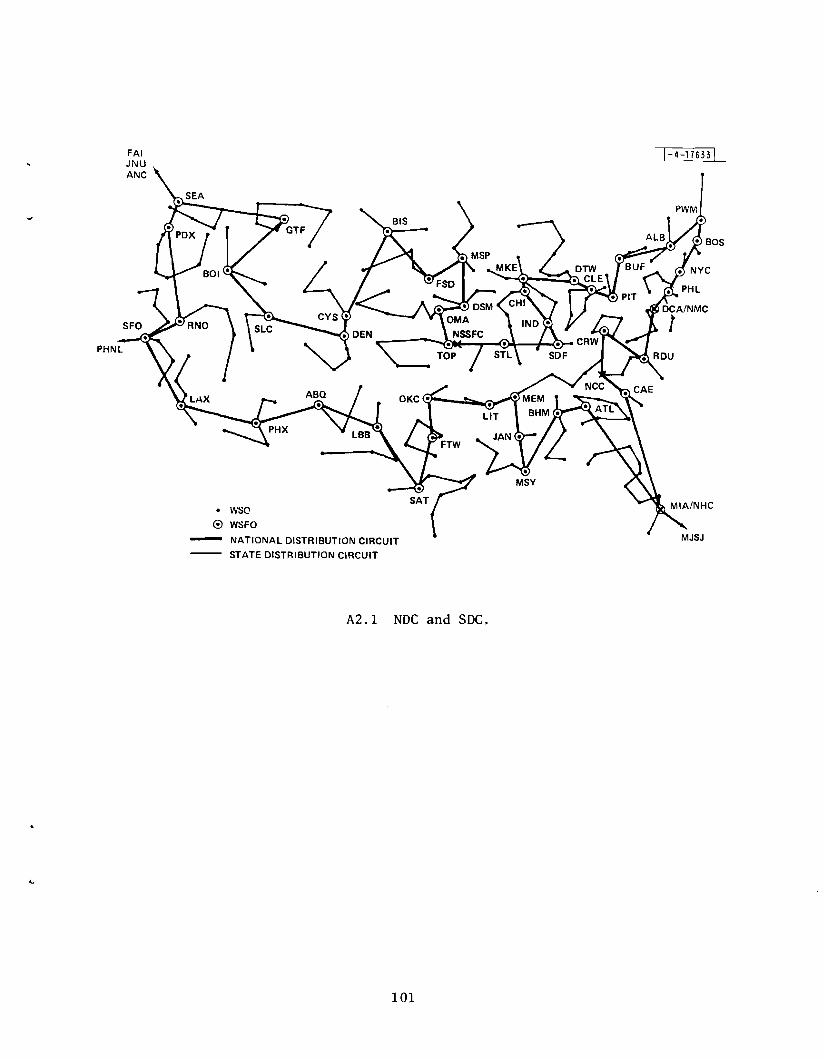
1-4-176331
• BOS
PHNL
• WSO
o WSFO
NATIONAL DISTRIBUTION CIRCUIT
STATE DISTRIBUTION CIRCUIT
A2.1 NDC and SDC.
101
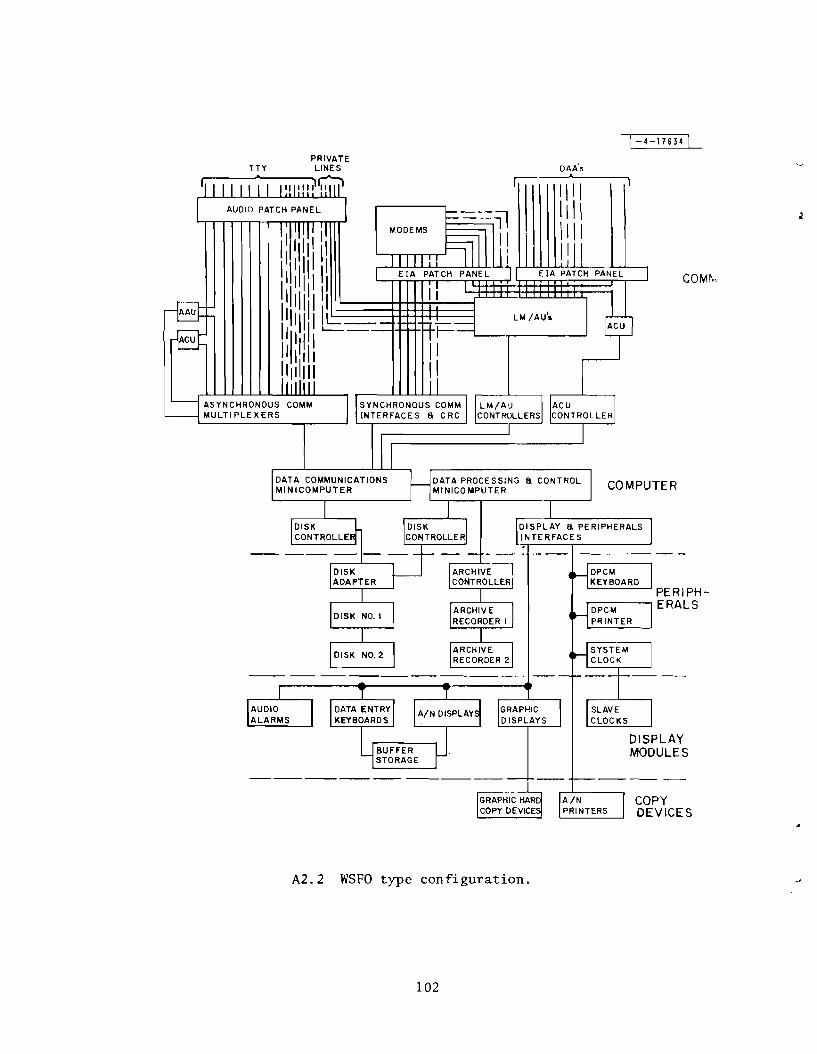
1-4-116341
COM~,
DISPLAY MODULES
COMPUTER
'------' PE RIPH...--- ERALS
DAA'..
[DISPLAY a PERIPHERALS l~NTERFACES
TTY
COpy DEVICES
A2.2 WSFO type configuration.
102
~ The features of graphic and textual data retrieval from a national data
base are desirable at the SCC for the benefit of the meteorologist and the
centrol flow controllers. The SWEP would, therefore, be implemented with a
link to a WSFO giving it access to the NDC and a data retrieval capability
similar to an AFOS terminal but without the store-and-forward task.
103
A3 Route Oriented PIREPs
A3.l Overview
Visits to FAA facilities and discussions with pilots indicate that PIREP
information would be significantly more valuable if improved procedures were
established for obtaining, interpreting and distributing the data. In the
long term these could be obtained automatically from airborne sensors via an
air to ground data link like DABS. However, in the short term one improved
method would be to solicit PIREPs from a small number of en route aircraft of
opportunity to establish a route oriented weather description. These PIREPs
should be collected for roughly 600 predetermined segments of the CONUS prefer
red air routes. Each segment should be 50 to 100 nmi long and should include
cloud tops, bases, layers, turbulence, icing, winds, temperature, etc. in all
weather conditions. A PIREP specialist should prepare route PIREP summaries
once an hour which should be distributed nationwide in a timely manner to the
FSS, NWS and ARTCC. Selected routes could also be broadcast over the TWEB.
These route oriented PIREPs are meant to supplement the present adverse weather
PIREPs. The interpreted PIREPs should be quickly disseminated to the controllers
responsible for these routes and the controllers feeding aircraft into these
routes. This route oriented PIREP development would require coordinated FSS
and ATC planning.
A3.2 Background
Reports of actual en route weather conditions are presently very hard
obtain before takeoff. PIREPs are usually only entered into Service A for
adverse or severe weather conditions. Better-than-forecast conditions are
to
often reported by pilots to controllers, but are very rarely entered into Ser
vice A. Significant conditions which usually go unreported include cloud tops
and layers, and the nonexistence of forecast hazards such as thunderstorms, ice,
or turbulence.
~
Perversely, this information is frequently available to the pilot in the air,
by soliciting information from other pilots through the controller. _Many con
trollers (work load permitting) run an informal briefing service, keeping track
of recent pilot comments and passing them along to other pilots upon request.
•
104
.,
•
•
As a result, a common technique for IFR General Aviation pilots is to go up to
look (and ask) around, continuing on to their destination or retreating to
their departure airport, depending on what actual weather is found .
Pilots in general are not trained weather observers. However, the pilot
who has just climbed or descended through clouds is able to provide reasonably
accurate cloud height information using his altimeter. Between or above cloud
layers the accuracy of these estimates depend upon the pilots ability. Some
information on clear space, especially when correlated with PIREPS from a few
other aircraft, would enable the specialist to piece together a good picture.
A3.3 Data Collection Method
Assume that a PIREP Specialist in each ARTCC collects the route oriented
PIREPS (roughly 30 per hour in each ARTCC) and severe weather PIREPS. With
collocation of the FSS in the ARTCC, this task may be given to the En Route
Flight Advisory Service (EFAS) persons.
In each control sector there would be an average of one or two routes for
which route oriented PIREPs are collected. These could be collected from each
sector, on a controller work load permitted basis, using one of the following
scenarios. In all cases the controller would select one or more aircraft which
have completed the desired route.
Scenario 1 - The PIREP specialist could key in the requested route which would appear on the appropriate PVD, CRD scope, or Flight Strip Printer. The controller could either collect the data himself from one or more aircraft (he may already know it) and phone it to the PIREP specialist, or ask the pilot to switch to a special PIREP specialist frequency. The last reported PIREP for each route should also appear and the controller should have the option of easily keying in "No Change,", "No Significant Information," "No Aircraft," or "Too Busy to Report."
Scenario 2 - The controller, when and if time permits, could collect the route PIREPs and routinely phone them in to the PIREP specialist once an hour or when conditions change. If no PIREP for a given route has been received for the last hour, then the computer could automatically remind the controller and indicate the last reported PIREP. Special requests from the PIREP specialists could be handled as in Scenario 1.
105
Scenario 3 - EFAS has a designated frequency for pilots to exchange weather information with the FSS. The PIREP specialist could broadcast requests for the route oriented PIREPs over this frequency. PIREPs from VFR (unavailable in scenarios 1 &2) and IFR pilots could be obtained in this way. If this frequency carried enough information, then pilots might routinely monitor it. This method could supplement or possibly replace scenarios 1 and 2.
A3.4 Manpower
The PIREP specialist would have to follow 30 route segments in each ARTCC
with updates every hour. Considering that weather conditions change very slowly,
most of these hourly updates could be made automatically when the controller
keys in "No Change" or "No Significant Weather." Thus this may not be a full
time job and the EFAS person may be able to handle these tasks. He would be
a prime user of the data and is receiving PIREPs from VFR aircraft. There may
be more than one EFAS geographic region in each ARTCC, which would further re
duce the work load.
•
106
ACKNOWLEDGEMENT•
Many individuals at Lincoln Laboratory have contributed to
the development concept and plan in this document. The authors
are particularly indebted to the following for valuable technical
inputs: R.K. Crane, D.L. Hogan. and I.G. Stiglitz. The authors
are also indebted for valuable consulting provided by W.B. Beckwith
of United Airlines.
107
REFERENCES
1. G. G. Beeker, "TOS#75- II: Terminal Information Processing System (TIPS) Results and Analysis of Terminal Flight Data," MITRE WPl09l3, Contract No: DOT-FA69\JS-162, (Feb. 1975).
2. A.I. Brunstein, "Study of Lesson to be Learned from Accidents Attributed to Turbulence," National Transportation Safety Board (Dec. 1971) NTSB-AAS71-1.
3. 1. R. Hurst, "The New York Severe Weather Avoidance Plan," J. of ATC, (July 1972).
4. Official Airline Guide, North American Edition, (Jan. 15, 1975).
5a. R.K. Crane, "Radar Detection of Thunderstorm Hazards for Air Traffic Control, Vol. I: Radar Systems," Lincoln Laboratory, M.I.T. Project Report ATC-67 (in preparation).
5b. S.M. Sussman, "Radar Detection of Thunderstorm Hazards for Air Traffic Control, Vol. II: Storm Cell Detection," Lincoln Laboratory, M. I. T. Project Report ATC-67 (in preparation).
6. FAA Report on Airport Capacity, Vol. I - National Summary, OSEM, FAA (Jan. 1974) FAA-EM-74-5, I.
7.. R.M. Hill and B.H. Metzger, "Results of Operations Rates Measurement Under Various Weather Conditions at LaGuardia," Sixth Conf. on Aerospace and Aeronautical Meteorology (Nov. 1974).
8. Airport/ATC System Improvement Prospects &Recommendations on FAA Development Priorities, (June 1974) Operations and Airports Department, Air Transport Association.
9. "Aviation Forecasts - Fiscal Years 1975-86," U.S. DOT-FAA Office Aviation Policy, Aviation Forecast Branch (Oct. 1974).
10. "Jet Operating Data, B-727-200, DC-9-30," Air Transport World (June 1975).
11. Aircraft Accident Report Ozark Air Lines, Inc. Fairchild Hiller FH227B N42l5 near the Lambert-St. Louis International Airport, St. Louis, Missouri (July 23, 1973) NTSB-AAR-74-3.
12. N.A. Lueurance, "Weather Supports to the Air Traffic System," J. of ATC (March 1970).
13. National Airspace System Program Office - Program Development Plan •En Route Automation 1973-82, Dept. of Trans., FAA.
14. Aircraft Accident Report, Delta Air Lines, Inc. McDonnell Douglas DC-9-32, N3323L Chattanooga Municipal Airport, Chattanooga, Tennessee (Nov. 27, 1973), NTSB-AAR-74-l3.
lOR
15. Aircraft Accident Report, Trans World Airlines, Inc., Boeing 707-l3lB, N757W. Los Angeles, CA (Jan. 18, 1974) NTSB-AAR-74-l0.
16. Aircraft Accident Report, Chicago Southern Airlines, Inc., Beech E18 S (ATECO Wentwind 11) N5lCS, Peoria, Illinois (Oct. 21, 1971) NTSB-AAR-72-l5.
17. Aircraft Accident Report, Pan American World Airways, Inc., Boeing 707-32lB, N454PA, Pago Pago, American Samoa (Jan. 30, 1974) NTSB-AAR-74l5.
18. Aircraft Accident Report - Piedmont Airlines, Boeing 727, N73lN Greensboro, N.C. (Oct. 1973), NTSB-AAR-74-7.
19. Aircraft Accident Report, Eastern Air Lines, Inc., McDonnell-Douglas DC-9-3l, N8967E Akron-Canton Regional Airport, North Canton, Ohio (Nov. 27, 1973) NTSB-AAR-74-l2.
20. Aircraft Accident Report. Delta Air Lines. Inc. McDonnell Douglas DC-9-l4, N3305L, Greater Southwest International Airport. Fort Worth, Texas (May 30. 1972) NTSB-AAR-73-3.
21. L.J. Garodz, D. Lawrence, N. Miller. "The Measurement of the McDonnellDouglas DC-9 Trailing Vortex System Using the Tower Fly-By Technique." NAFEC (Nov., 1974) Report No. FAA-RD-74-l73.
22. Meteorological and Aeronautical Presentation Subsystem (MAPS) - Program Report with Recommendation, FAA/SRDS, ATC Systems Division, En Route Branch (July 1975).
23. Integrated National Airspace Communication System (INACS) for the Support of Air Traffic Control Operations in the 1980's and 1990's - System Concept" (Sept. 8, 1975) FAA-INACS-06l-22l-SC.
24. "Program Development Plan, Automation of Field Operations and Service," NOAA/NWS (Nov. 1974).
25. Specification for Automation for Field Operations and Services (AFOS) Field Systems," Specification No. M020-SPOOl, NOAA/NWS (March 1974).
26. IEEE Transactions on Geoscience Electronics, Vol. GE-13, No.3 (July 1973).
27. National Weather Service Specification for Automation of Field Operations and Services (AFOS) Stage "A" Model System, NOAA (Jan. 12, 1973) Specifi cation No. MOlO-SPOOl.
28. C.G. Teschner, "Aviation-Automatic Weather Observing System (AV-AWOS) Preliminary System Description," MITRE Corp. (Jan. 1975) FAA-.J<D-75-S.
109
29. W.H. Drury, "Improved MTI Radar Signal Processor," Lincoln Laboratory, M.l.T. Project Report ATC-39 (3 April 1975) AD-AOI0478/6.
30. FAA Communications System Description (1973), Computer Sciences Corp. .. Falls Church, VA, FAA-RD-73-36.
31. J.C. Hansen, "Upgraded Third Generation Information Flow Requirements Analysis," Vols. 1&11 - Summary, Computer Science Corp. Falls Church, VA (Sept. 1973) FAA-RD-73-65.
32. Preliminary System Design Common Aviation Weather System Requirements Compilation, Borg-Warner Controls (June 1961), FAA Contract BRD-139, Task 9.
33. Common Aviation Weather System Preliminary Design, Borg-Warner Controls (April 1962), FAA Contract BRD-139, Task 9, Vols. 1&11.
34. National Airspace System Aviation Weather Subsystem Design," E. Bollay Associates, Inc. (Oct. 1964), FAA-SRDS-RD-64-129.
35. ATC Weather Presentation Studies for the National Airspace System, E. Bollay Associates, Inc. (Aug. 1965), SRDS Report No. RD-65-15.
36. Final Report of the Aviation Weather Review Group (AWRG), Dept. of Transportation, Federal Aviation Administration (June 25, 1967).
37. Engineering and Development Plan-Weather (Feb. 1973), FAA-ED-15-1.
38. Engineering and Development Program, Goals, Achievements and Trends, Dept. of Transportation, Federal Aviation Administration.
39. J.F. Ballantoni, J.R. Coonan, M.F. Medeiros, "Evaluation of the FAA Advanced Flow Control Procedures," Transportation Systems Center DOT-TSC-FAA-72-8.
40. R.M. Hill, R.F. Robinson, "TOS 111-43; Evaluation of Weather Radar Remoting to the Central Flow Control Function," MITRE Technical Report MTR-6323 (January 24, 1973).
41. G.G. Beeker, "Tower Cab Flight Data Handling Concept, TOS #142-59," The Mitre Corp. WP-I0581 (May 20, 1974).
42. M.F. Medeiros, J. Sussman, "Airport Information Retrieval System (AIRS) System Design" Final Report (July 1973), FAA-RD-73-77.
43. M.F. Medeiros, J. Sussman, "Airport Information Retrieval System (AIRS) • System Support Manual," (Oct. 1973) FAA-RD-73-122.
110
44. J.B. McCollough and L.K. Carpenter, "Airborne Meteorological Instrumentation System and DATA Reduction," FAA-RD-75-69.
45. National Airspace System - Configuration Management Document. ATC Operational Computer Program Description (Model 3) Rev. 1 (Feb. 17, 1973) NAS-MD-309.
46. Draft Operational Test Plan for Kansas City Air Route Traffic Control Center Test.
47. Kansas City Air Route Traffic Control Center (ARTCC) Weather Unit Operational Test and Evaluation (OT&E) Interim Report #1.
48. Federal Plan for Weather Radars & Remote Displays, Fiscal Years 19691973," U.S. Department of Commerce (Dec. 1969).
49. Federal Plan for Weather Radars (Nov. 1973) FCM 73-5.
50. Aviation Weather and NOTAM System (AWANS) (Aug. 27, 1973) FAA-ER-260-0l9b.
51. The Development Plan for the Aviation Automated Weather Observation System," System Development Office, National Weather Service (Dec. 1973).
52. Meteorological & Aeronautical Presentation Subsystem (MAPS) Installation Plan - Task II," Price, Williams & Associates, Inc. (Feb. 1975).
53. Preliminary Analysis of Civil Aviation Accidents January 1964-December 1972," (April 1975), FAA-AVP-75-2.
54. Special Study of Fatal Weather-Involved General Aviation Accidents, NTSBAAS-74-2.
55. Aircraft Accident Report, National Airlines, Inc., Boeing 747-135, N 77772 Near Lake Charles, Lousiana (Jan. 4, 1972).
56. Aircraft Accident Report, Iberia Linear Aereas De Espana (Iberia Airlines) McDonnell Douglas DC-lO-30, EC CBN. Logan International Airport, Boston, Mass. (Dec. 17, 1973).
57. Aircraft Accident Report - Texas International Airlines, Inc. Convair 600, N94230, Mena, Arkansas (Sept. 27, 1973).
58. Aircraft Accident Report, ALII Air Hawaii, Inc. Beech 0183, N5642V, Kalohi Channel, Hawaiian Island (Feb. 22, 1972).
59. En Route and Terminal ATC Radar for Weather Observation, National Air ~ Traffic Training Program, DOT-FAA, Aeronautical Center, ETM 7-Q-2.
60. En Route and Terminal Weather for Controllers, National Air Traffic Training Program, DOT-FAA, Aeronautical Center, ETM-7-0-l.
III
61. National Air Traffic Training Program Flight Service, The Weather Observer Position, DOT-FAA, Aeronautical Center, FAA Academy, F2-7 (July 1974).
62. National Air Traffic Training Program, Terminal Wake Turbulence, DOT-FAA Aeronautical Center, FAA Academy TM 12-0-1 (Oct. 1971).
63 Terminal Air Traffic Control, DOT-FAA Air Traffic Service, 7ll0.8C (Jan. 1, 1973).
64. En Route Air Traffic Control, DOT-FAA Air Traffic Service, 7110.90 (Jan. 1, 1975).
65. W.B. Beckwith, "The Effect of Weather on the Operations and Economics of Air Transportation Today," American Meteorological Soc. Bulletin Vol. 52 (Sept. 1971).
66. W.B. Beckwith, "Operational Forecasting and Analysis of Turbulence," International Conf. on Atmospheric Turbulence, London (May 18-21, 1971).
67. R.N. Buck, Weather Flying," The Macmillan Co., N.Y., N.Y. CollierMacmillan Ltd., London (1970).
68. Aviation Weather for Pilots and Flight Operations Personnel, FAA-Flight Standards Service and Dept. of Commerce - Weather Bureau (1965).
69. Aviation Forecasts - Fiscal Years 1975-86, U.S. DOT/FAA (Sept. 1974).
70. C.E. Muehe, L. Cartledge, W.H. Drury, E. Hofstetter, M. Labitt, P. McCorison, and V. Sferrino, "New Techniques Applied to Air Traffic Control Radars," Proc. IEEE Vol. 62, ~ (June 1974).
71. R.M. O'Donnell, C.E. Muehe, M. Labitt, L. Carledge, W. Drury, "Advanced Signal Processing for Airport Surveillance Radars," EASCON'74 (Oct. 1974).
72. Aviation Week and Space Technology, Shortlines - (March 27>. 1976) p. 37.
73. "Facility Management," (Oct. 1973) DOT-FAA-72l0-3B.
112
Recommended


![Software User Manual - ESAswe.ssa.esa.int/DOCS/SSA-DC/SSA-SWE-SWEP-SUM-0001.pdf[AD.29] SWE Portal Services – Software Requirements Specification SSA-SWE-SWEP-SRS-0200 [AD.30] File](https://img.pdfslide.us/doc/110x75/5f8dbc6dab6efb5e327aa85e/software-user-manual-ad29-swe-portal-services-a-software-requirements-specification.jpg)