Technical Report Documentation Page 1. Report No. FHWA/TX-04/0-2101-3
2. Government Accession No.
3. Recipient's Catalog No. 5. Report Date October 2003
4. Title and Subtitle FLEXURAL DESIGN OF HIGH STRENGTH CONCRETE PRESTRESSED BRIDGE GIRDERS – REVIEW OF CURRENT PRACTICE AND PARAMETRIC STUDY
6. Performing Organization Code
7. Author(s) Mary Beth D. Hueste and Gladys G. Cuadros
8. Performing Organization Report No. Report 0-2101-3 10. Work Unit No. (TRAIS)
9. Performing Organization Name and Address Texas Transportation Institute The Texas A&M University System College Station, Texas 77843-3135
11. Contract or Grant No. Project No. 0-2101 13. Type of Report and Period Covered Research: January 2000-May 2003
12. Sponsoring Agency Name and Address Texas Department of Transportation Research and Technology Implementation Office P. O. Box 5080 Austin, Texas 78763-5080
14. Sponsoring Agency Code
15. Supplementary Notes Research performed in cooperation with the Texas Department of Transportation and the U.S. Department of Transportation, Federal Highway Administration. Research Project Title: Allowable Stresses and Resistance Factors for High Strength Concrete 16. Abstract This is the third of four reports that document the findings of a Texas Department of Transportation sponsored project to evaluate the allowable stresses and resistance factors for high strength concrete (HSC) prestressed bridge girders. The second phase of this research study, which is documented in this volume, focused on three major objectives: (1) to determine the current state of practice for the design of HSC prestressed bridge girders, (2) to evaluate the controlling limit states for the design of HSC prestressed bridge girders and identify areas where some economy in design may be gained, and (3) to conduct a preliminary assessment of the impact of raising critical flexural design criteria with an objective of increasing the economy and potential span length of HSC prestressed girders.
The first objective was accomplished through a literature search and survey. The literature search included review of design criteria for both the American Association of State and Highway Transportation Officials (AASHTO) Standard and Load and Resistance Factor Design (LRFD) Specifications. Review of relevant case studies of the performance of HSC prestressed bridge girders as well as important design parameters for HSC were carried out. In addition, researchers conducted a survey to gather information and document critical aspects of current design practices for HSC prestressed bridges. The second objective was accomplished by conducting a parametric study for single-span HSC prestressed bridge girders to primarily investigate the controlling flexural limit states for both the AASHTO Standard and LRFD Specifications. AASHTO Type IV and Texas U54 girder sections were considered. The effects of changes in concrete strength, strand diameter, girder spacing, and span length were evaluated. Based on the results from the parametric study, the limiting design criteria for HSC prestressed U54 and Type IV girders using both the AASHTO Standard and LRFD Specifications for Highway Bridges were evaluated. Critical areas where some economy in design may be gained were identified. The third research objective was accomplished by evaluating the impact of raising the allowable tensile stress for service conditions. The stress limit selected for further study was based on the current limit for uncracked sections provided by the American Concrete Institute (ACI) 318-02 building code and the limit used for a specific case study bridge in Texas. Recommendations for improving some critical areas of current bridge designs and for increasing bridge span lengths are given. 17. Key Words Prestressed Concrete, High Strength Concrete, Survey of Practice, Allowable Stresses
18. Distribution Statement No restrictions. This document is available to the public through NTIS: National Technical Information Service 5285 Port Royal Road Springfield, Virginia 22161
19. Security Classif.(of this report) Unclassified
20. Security Classif.(of this page) Unclassified
21. No. of Pages 280
22. Price
Form DOT F 1700.7 (8-72) Reproduction of completed page authorized

FLEXURAL DESIGN OF HIGH STRENGTH CONCRETE PRESTRESSED BRIDGE GIRDERS – REVIEW OF CURRENT PRACTICE AND
PARAMETRIC STUDY
by
Mary Beth D. Hueste, P.E. Assistant Research Engineer
Texas Transportation Institute
and
Gladys G. Cuadros Graduate Research Assistant
Texas Transportation Institute
Report 0-2101-3
Project Number 0-2101 Research Project Title: Allowable Stresses and Resistance Factors for High Strength Concrete
Sponsored by the Texas Department of Transportation
In Cooperation with the U.S. Department of Transportation Federal Highway Administration
October 2003
TEXAS TRANSPORTATION INSTITUTE The Texas A&M University System College Station, Texas 77843-3135

v
DISCLAIMER
The contents of this report reflect the views of the authors, who are responsible for the
facts and accuracy of the data presented herein. The contents do not necessarily reflect the
official view or policies of the Texas Department of Transportation (TxDOT) or the Federal
Highway Administration (FHWA). This report does not constitute a standard, specification, or
regulation, nor is it intended for construction, bidding, or permit purposes. Trade names were
used solely for information and not for product endorsement. The engineer in charge was Mary
Beth D. Hueste, P.E. (TX 89660).
vi
ACKNOWLEDGMENTS
This project was performed in cooperation with TxDOT and the FHWA, and was
conducted at Texas A&M University (TAMU) through the Texas Transportation Institute (TTI)
as part of project 0-2101, “Allowable Stresses and Resistance Factors for High Strength
Concrete.” The authors are grateful to the individuals who were involved with this project and
provided invaluable assistance, including Kenny Ozuna (TxDOT, Research Project Director),
J.C. Liu (TxDOT, Research Program Coordinator), John Vogel (TxDOT), Peter Keating
(TAMU), David Trejo (TAMU), Daren Cline (TAMU), and Dennis Mertz (University of
Delaware).
vii
TABLE OF CONTENTS
Page
LIST OF FIGURES ....................................................................................................................... ix
LIST OF TABLES...........................................................................................................................x
1. INTRODUCTION .....................................................................................................................1
1.1 Background and Problem Statement.............................................................................1 1.2 Objectives and Scope....................................................................................................2 1.3 Research Plan................................................................................................................3 1.4 Outline of This Report ..................................................................................................4
2. PREVIOUS RESEARCH ..........................................................................................................5
2.1 General .........................................................................................................................5 2.2 Use of HSC for Prestressed Bridge Girders .................................................................5 2.3 Flexural Design of Prestressed Concrete Bridge Girders.............................................7 2.4 Development of the AASHTO LRFD Specifications...................................................9 2.5 Allowable Stress Limits for Prestressed Concrete Beams..........................................13 2.6 Critical Mechanical Properties of HSC for Design.....................................................16 2.7 Concrete Strengths at Transfer....................................................................................18
3. FLEXURAL DESIGN SPECIFICATIONS FOR PRESTRESSED CONCRETE BRIDGE GIRDERS ...............................................................................................................................19
3.1 General........................................................................................................................19 3.2 AASHTO Standard and LRFD Specifications ...........................................................19 3.3 Prestress Losses ..........................................................................................................25 3.4 Significant Changes in the AASHTO LRFD Specifications ......................................30 3.5 TxDOT Design Guidelines and Software ...................................................................35
4. SURVEY OF CURRENT PRACTICE ...................................................................................37
4.1 Introduction.................................................................................................................37 4.2 Part I: Current Design Practice for HSC Prestressed Members ................................38 4.3 Part II: Description of Typical Bridges with HSC Prestressed Bridge Members......56
5. OUTLINE OF PARAMETRIC STUDY AND ANALYSIS PROCEDURES .......................67
5.1 General........................................................................................................................67 5.2 Girder Sections............................................................................................................68 5.3 Analysis and Design Assumptions .............................................................................70 5.4 Design Parameters ......................................................................................................81 5.5 Case Studies ...............................................................................................................83
viii
6. RESULTS FOR U54 BEAMS.................................................................................................87 6.1 Introduction ................................................................................................................87 6.2 Description of Controlling Limit States .....................................................................88 6.3 Controlling Limit States for AASHTO Standard and LRFD Specifications .............90 6.4 Strand Diameter and Concrete Strength .....................................................................94 6.5 Comparison of AASHTO Standard and LRFD Specifications ................................100 6.6 Stresses at Transfer and Transfer Length .................................................................111 6.7 Effect of Allowable Tensile Stress at Service ..........................................................117
7. RESULTS FOR TYPE IV BEAMS .....................................................................................137
7.1 Introduction...............................................................................................................137 7.2 Description of Controlling Limit States....................................................................138 7.3 Controlling Limit States for AASHTO Standard and LRFD Specifications............139 7.4 Strand Diameter and Concrete Strength ...................................................................146 7.5 Comparison of AASHTO Standard and LRFD Specifications.................................153 7.6 Stresses at Transfer and Transfer Length..................................................................163 7.7 Effect of Allowable Tensile Stress at Service...........................................................169
8. SUMMARY, CONCLUSIONS, AND RECOMMENDATIONS.........................................189
8.1 Summary ..................................................................................................................189 8.2 Conclusions...............................................................................................................191 8.3 Recommendations for Flexural Design of HSC Prestressed Girders.......................204 8.4 Recommendations for Future Work..........................................................................205
REFERENCES ............................................................................................................................207
APPENDIX A – DISTRIBUTION FACTORS AND LIVE LOAD MOMENTS......................211
APPENDIX B – SURVEY OF CURRENT PRACTICE............................................................215
APPENDIX C – RESULTS FOR U54 BEAMS .........................................................................227
APPENDIX D – RESULTS FOR TYPE IV BEAMS.................................................................241
ix
LIST OF FIGURES FIGURE Page
4.1 Prevalence of Bridge Types with HSC Prestressed Girders ..............................................57 5.1 Configuration and Dimensions of the TxDOT U-Beam (adapted from TxDOT 2001b). ..........................................................................................69 5.2 Configuration and Dimensions of the Type IV Beam (adapted from PCI 1997) ...................................................................................................69 5.3 Positions of the Neutral Axis in the U54 Beam.................................................................78 5.4 Positions of the Neutral Axis in the Type IV Beam ..........................................................78 6.1 AASHTO Standard Specifications – Maximum Span Length versus Concrete Strength for U54 Girders ....................................................................................96 6.2 AASHTO LRFD Specifications – Maximum Span Length versus Concrete
Strength for U54 Girders ...................................................................................................97 6.3 AASHTO Standard Specifications – Maximum Span Length versus Girder
Spacing for U54 Girders ..................................................................................................101 6.4 AASHTO LRFD Specifications – Maximum Span Length versus Girder
Spacing for U54 Girders ..................................................................................................102 6.5 Number of Strands versus Span Lengths for Different Allowable Tensile Stresses
(LRFD Specifications, Strand Diameter = 0.6 in.) ..........................................................134 7.1 AASHTO Standard Specifications – Maximum Span Length versus Concrete
Strength for Type IV Girders...........................................................................................147 7.2 AASHTO LRFD Specifications – Maximum Span Length versus Concrete
Strength for Type IV Girders...........................................................................................148 7.3 AASHTO Standard Specifications – Maximum Span Length versus Girder
Spacing for Type IV Girders............................................................................................151 7.4 AASHTO LRFD Specifications – Maximum Span Length versus Girder
Spacing for Type IV Girders............................................................................................152 7.5 Number of Strands versus Span Lengths for Different Allowable Tensile
Stresses (LRFD Specifications, Strand Diameter = 0.6 in.) ............................................186
x
LIST OF TABLES TABLE Page 2.1 Allowable Stresses Specified by the AASHTO Standard and LRFD Specifications
(AASHTO 2002 a,b)..........................................................................................................14 2.2 Allowable Stresses Specified by ACI 318-02....................................................................14 3.1 Allowable Stresses Specified by the AASHTO Standard and LRFD Specifications
(AASHTO 2002 a,b)..........................................................................................................24 3.2 Stress Limits for Low Relaxation Prestressing Tendons Specified by the AASHTO
Standard and LRFD Specifications (AASHTO 2002 a,b) .................................................25 3.3 Important Differences between the Flexural Design Provisions for Prestressed
Concrete Bridge Girders in the AASHTO Standard and LRFD Specifications ................31 4.1 List of Respondents............................................................................................................38 4.2 Current Specifications........................................................................................................39 4.3 Additional Documents and References..............................................................................41 4.4 Numbers of HSC Bridges Constructed (Q 7) ....................................................................43 4.5 Typical Range for Specified Concrete Strength for Prestressed Girders (Q 8) .................46 4.6 Specific Information for Required Transfer Strength (Q 9) ..............................................47 4.7 Concerns Related to the Use of HSC (Q 10) .....................................................................51 4.8 Adjustments to Design Specifications for HSC Prestressed Bridge
Girders (Q 11) ....................................................................................................................54 4.9 Typical Bridges with HSC Prestressed Bridge Members ..................................................56 4.10 Typical Range for Span Lengths by Structural Type.........................................................58 4.11 Typical Range for Concrete Compressive Strengths by Structural Type ..........................58 4.12 Typical Bridges with HSC Prestressed Members - Structural Type: Slab ........................59 4.13 Typical Bridges with HSC Prestressed Members - Structural Type: Voided Slab............59
xi
TABLE Page 4.14 Typical Bridges with HSC Prestressed Members - Structural Type: Double T ................60 4.15 Typical Bridges with HSC Prestressed Members - Structural Type: Closed
Box CIP..............................................................................................................................61 4.16 Typical Bridges with HSC Prestressed Members - Structural Type: AASHTO
Beam ..................................................................................................................................61 4.17 Typical Bridges with HSC Prestressed Members - Structural Type: Bulb........................62 4.18 Typical Bridges with HSC Prestressed Members - Structural Type: Box Girder .............64 4.19 Typical Bridges with HSC Prestressed Members - Structural Type:
Other – Span Lengths.........................................................................................................64 4.20 Typical Bridges with HSC Prestressed Members - Structural Type:
Other – Concrete Strengths................................................................................................65 5.1 Allowable Stresses Specified by the AASHTO Standard and LRFD Specifications
(AASHTO 2002 a,b)..........................................................................................................74 5.2 Allowable Stresses during Transfer Used in the Parametric Study ...................................74 5.3 Design Parameters .............................................................................................................81 5.4 Additional Design Variables..............................................................................................81 5.5 U54 Case Study Bridges – Design Variables ....................................................................83 5.6 U54 Case Study Bridges – Comparison of Results ...........................................................84 5.7 Type IV Case Study Bridges – Design Variables..............................................................85 5.8 Type IV Case Study Bridges – Comparison of Results.....................................................86 6.1 Summary of Design Parameters.........................................................................................87 6.2 Controlling Flexural Limit States for U54 Girders............................................................89 6.3 Summary of Controlling Limit States and Maximum Spans (AASHTO
Standard Specifications, Strand Diameter = 0.5 in.)..........................................................91 6.4 Summary of Controlling Limit States and Maximum Spans (AASHTO
Standard Specifications, Strand Diameter = 0.6 in.)..........................................................91
xii
TABLE Page 6.5 Summary of Controlling Limit States and Maximum Spans (AASHTO
LRFD Specifications, Strand Diameter = 0.5 in.)..............................................................93
6.6 Summary of Controlling Limit States and Maximum Spans (AASHTO LRFD Specifications, Strand Diameter = 0.6 in.)..............................................................93
6.7 Effective Concrete Strength (U54 Beams) ........................................................................98 6.8 Maximum Spans for 0.5 in. and 0.6 in. Diameter Strands (AASHTO
Standard Specifications) ....................................................................................................99 6.9 Maximum Spans for 0.5 in. and 0.6 in. Diameter Strands (AASHTO
LRFD Specifications) ........................................................................................................99 6.10 Impact of Increasing Concrete Compressive Strengths ...................................................100 6.11 Comparison of Limit States that Control Maximum Span for AASHTO
Standard and LRFD Specifications (Strand Diameter = 0.5 in.) .....................................103 6.12 Comparison of Limit States that Control Maximum Span for AASHTO
Standard and LRFD Specifications (Strand Diameter = 0.6 in.) .....................................103 6.13 Comparison of Maximum Span Lengths for AASHTO Standard and LRFD
Specifications (Strand Diameter = 0.5 in.).......................................................................105 6.14 Comparison of Maximum Span Lengths for AASHTO Standard and LRFD
Specifications (Strand Diameter = 0.6 in.).......................................................................105 6.15 Maximum Difference in Maximum Span Lengths for LRFD Relative to
Standard Specifications....................................................................................................106 6.16 Comparison of Number of Strands – AASHTO Standard and LRFD
Specifications (Strand Diameter = 0.6 in., Girder Spacing = 8.5 ft.) ..............................108 6.17 Comparison of Number of Strands – AASHTO Standard and LRFD
Specifications (Strand Diameter = 0.6 in., Girder Spacing = 10 ft.) ...............................109
6.18 Comparison of Number of Strands – AASHTO Standard and LRFD Specifications (Strand Diameter = 0.6 in., Girder Spacing = 11.5 ft.) ............................110
6.19 Comparison of Number of Strands – AASHTO Standard and LRFD
Specifications (Strand Diameter = 0.6 in., Girder Spacing = 14 ft.) ...............................110
xiii
TABLE Page 6.20 Comparison of Number of Strands – AASHTO Standard and LRFD
Specifications (Strand Diameter = 0.6 in., Girder Spacing = 16.6 ft.) ............................111 6.21 Controlling Limit States for Maximum Spans for Different Allowable
Release Stresses and Transfer Lengths (AASHTO Standard Specifications, Strand Diameter = 0.6 in.) ...............................................................................................113
6.22 Controlling Limit States for Maximum Spans for Different Allowable
Release Stresses and Transfer Lengths (AASHTO LRFD Specifications, Strand Diameter = 0.6 in.) ...............................................................................................114
6.23 Maximum Span Lengths for Different Allowable Release Stresses and
Transfer Lengths (AASHTO Standard Specifications, Strand Diameter = 0.6 in.).........115 6.24 Maximum Span Lengths for Different Allowable Release Stresses and
Transfer Lengths (AASHTO LRFD Specifications - Strand Diameter = 0.6 in.) ...........117 6.25 Controlling Limit States for Different Allowable Tensile Stresses at Service
(Girder Spacing = 8.5 ft.).................................................................................................120 6.26 Controlling Limit States for Different Allowable Tensile Stresses at Service
(Girder Spacing = 10 ft.)..................................................................................................121 6.27 Controlling Limit States for Different Allowable Tensile Stresses at Service
(Girder Spacing = 11.5 ft.)...............................................................................................122 6.28 Controlling Limit States for Different Allowable Tensile Stresses at Service
(Girder Spacing = 14 ft.)..................................................................................................123 6.29 Controlling Limit States for Different Allowable Tensile Stresses at Service
(Girder Spacing = 16.6 ft.)...............................................................................................123 6.30 Number of Strands for Different Allowable Tensile Stresses at Service
(Girder Spacing = 8.5 ft.).................................................................................................125 6.31 Number of Strands for Different Allowable Tensile Stresses at Service
(Girder Spacing = 10 ft.)..................................................................................................126 6.32 Number of Strands for Different Allowable Tensile Stresses at Service
(Girder Spacing = 11.5 ft.)...............................................................................................127 6.33 Number of Strands for Different Allowable Tensile Stresses at Service
(Girder Spacing = 14 ft.)..................................................................................................128
xiv
TABLE Page 6.34 Number of Strands for Different Allowable Tensile Stresses at Service
(Girder Spacing = 16.6 ft.)...............................................................................................128 6.35 Controlling Limit States for Maximum Span Lengths for Different Allowable
Tensile Stresses at Service ...............................................................................................130 6.36 Maximum Span Lengths for Different Allowable Tensile Stresses at Service ...............133 7.1 Summary of Design Parameters.......................................................................................137 7.2 Controlling Limit States for Type IV Girders..................................................................139 7.3 Summary of Controlling Limit States and Maximum Spans (AASHTO
Standard Specifications, Strand Diameter = 0.5 in.).......................................................140 7.4 Summary of Controlling Limit States and Maximum Spans (AASHTO
Standard Specifications, Strand Diameter = 0.6 in.)........................................................140 7.5 Summary of Controlling Limit States and Maximum Spans (AASHTO LRFD
Specifications, Strand Diameter = 0.5 in.).......................................................................143 7.6 Summary of Controlling Limit States and Maximum Spans (AASHTO LRFD
Specifications, Strand Diameter = 0.6 in.).......................................................................143 7.7 Effective Concrete Strength (Type IV Beams)................................................................149 7.8 Maximum Spans for 0.5 in. and 0.6 in. Diameter Strands (AASHTO
Standard Specifications). .................................................................................................149 7.9 Maximum Spans for 0.5 in. and 0.6 in. Diameter Strands (AASHTO
LRFD Specifications) ......................................................................................................150 7.10 Impact of Increasing Concrete Compressive Strengths ...................................................153 7.11 Comparison of Limit States That Control Maximum Spans for AASHTO
Standard and LRFD Specifications (Strand Diameter = 0.5 in.) .....................................154 7.12 Comparison of Limit States That Control Maximum Spans for AASHTO
Standard and LRFD Specifications (Strand Diameter = 0.6 in.) .....................................154 7.13 Comparison of Maximum Span Lengths for AASHTO Standard and LRFD
Specifications (Strand Diameter = 0.5 in.).......................................................................156
xv
TABLE Page 7.14 Comparison of Maximum Span Lengths for AASHTO Standard and LRFD
Specifications (Strand Diameter = 0.6 in.).......................................................................156 7.15 Maximum Difference in Maximum Span Length for LRFD Relative to
Standard Specifications....................................................................................................157 7.16 Comparison of Number of Strands – AASHTO Standard and LRFD Specifications
(Strand Diameter = 0.6 in., Girder Spacing = 4.25 ft.) ....................................................158 7.17 Comparison of Number of Strands – AASHTO Standard and LRFD Specifications
(Strand Diameter = 0.6 in., Girder Spacing = 5 ft.) .........................................................159 7.18 Comparison of Number of Strands – AASHTO Standard and LRFD Specifications
(Strand Diameter = 0.6 in., Girder Spacing = 5.75 ft.) ....................................................160 7.19 Comparison of Number of Strands – AASHTO Standard and LRFD Specifications
(Strand Diameter = 0.6 in., Girder Spacing = 7 ft.) .........................................................161 7.20 Comparison of Number of Strands – AASHTO Standard and LRFD Specifications
(Strand Diameter = 0.6 in., Girder Spacing = 8.5 ft.) ......................................................162 7.21 Comparison of Number of Strands – AASHTO Standard and LRFD Specifications
(Strand Diameter = 0.6 in., Girder Spacing = 9 ft.) .........................................................162 7.22 Controlling Limit States for Maximum Spans for Different Allowable Release
Stresses and Transfer Lengths (AASHTO Standard Specifications, Strand Diameter = 0.6 in.) ...........................................................................................................164
7.23 Controlling Limit States for Maximum Spans for Different Allowable Release
Stresses and Transfer Lengths (AASHTO LRFD Specifications, Strand Diameter = 0.6 in.)...........................................................................................................................165
7.24 Maximum Span Lengths for Different Allowable Release Stresses and Transfer
Lengths (AASHTO Standard Specifications, Strand Diameter = 0.6 in.) .......................167 7.25 Maximum Span Lengths for Different Allowable Release Stresses and Transfer
Lengths (AASHTO LRFD Specifications, Strand Diameter = 0.6 in.) ...........................168 7.26 Controlling Limit States for Different Allowable Tensile Stresses at Service
(Girder Spacing = 4.25 ft.) ..............................................................................................171 7.27 Controlling Limit States for Different Allowable Tensile Stresses at Service
(Girder Spacing = 5 ft.) ...................................................................................................172
xvi
TABLE Page 7.28 Controlling Limit States for Different Allowable Tensile Stresses at Service
(Girder Spacing = 5.75 ft.) ..............................................................................................173 7.29 Controlling Limit States for Different Allowable Tensile Stresses at Service
(Girder Spacing = 7 ft.)....................................................................................................174
7.30 Controlling Limit States for Different Allowable Tensile Stresses at Service (Girder Spacing = 8.5 ft.) ................................................................................................175
7.31 Controlling Limit States for Different Allowable Tensile Stresses at Service
(Girder Spacing = 9 ft.) ...................................................................................................175 7.32 Number of Strands for Different Allowable Tensile Stresses at Service
(Girder Spacing = 4.25 ft.) ..............................................................................................176 7.33 Number of Strands for Different Allowable Tensile Stresses at Service
(Girder Spacing = 5 ft.) ...................................................................................................177 7.34 Number of Strands for Different Allowable Tensile Stresses at Service
(Girder Spacing = 5.75 ft.) ..............................................................................................178 7.35 Number of Strands for Different Allowable Tensile Stresses at Service
(Girder Spacing = 7 ft.) ...................................................................................................179 7.36 Number of Strands for Different Allowable Tensile Stresses at Service
(Girder Spacing = 8.5 ft.).................................................................................................180 7.37 Number of Strands for Different Allowable Tensile Stresses at Service
(Girder Spacing = 9 ft.)....................................................................................................180 7.38 Controlling Limit States for Maximum Span Lengths for Different
Allowable Tensile Stresses at Service .............................................................................181 7.39 Maximum Span Lengths for Different Allowable Tensile Stresses at Service ...............183 8.1 Design Parameters ...........................................................................................................190 8.2 Effective Concrete Strength (U54 Girders) .....................................................................195 8.3 Impact of Increasing Concrete Compressive Strengths (U54 Girders) ...........................196 8.4 Maximum Differences in Maximum Span Length for LRFD Relative to
Standard Specifications (U54 Girders) ...........................................................................197
xvii
TABLE Page 8.5 Effect of Strand Diameter and Strength on Maximum Span Lengths
(Type IV Girders) ............................................................................................................200 8.6 Impact of Increasing Concrete Compressive Strengths (Type IV Girders) .....................200 8.7 Maximum Differences in Maximum Span Length for LRFD Relative to
Standard Specifications (Type IV Girders).....................................................................201 A.1 Comparison of Distribution Factors and Live Load Moments for U54 Beams ..............212
A.2 Comparison of Distribution Factors and Live Load Moments for Type IV Beams .......213 B.1 Precasters per DOT (Q 6) ...............................................................................................220 B.2 Precasters and Supplied DOTs (Q 6) ..............................................................................223 C.1 U54 Beam Designs - AASHTO Standard Specifications
(Strand Diameter = 0.5 in., Girder Spacing = 8.5 ft.) ......................................................228 C.2 U54 Beam Designs - AASHTO Standard Specifications
(Strand Diameter = 0.5 in., Girder Spacing = 10 ft.) ......................................................228 C.3 U54 Beam Designs - AASHTO Standard Specifications
(Strand Diameter = 0.5 in., Girder Spacing = 11.5 ft.) ...................................................229 C.4 U54 Beam Designs - AASHTO Standard Specifications
(Strand Diameter = 0.5 in., Girder Spacing = 14 ft.) ......................................................229 C.5 U54 Beam Designs - AASHTO Standard Specifications
(Strand Diameter = 0.5 in., Girder Spacing = 16.6 ft.) ...................................................230 C.6 U54 Beam Designs - AASHTO Standard Specifications
(Strand Diameter = 0.6 in., Girder Spacing = 8.5 ft.) ....................................................230 C.7 U54 Beam Designs - AASHTO Standard Specifications
(Strand Diameter = 0.6 in., Girder Spacing = 10 ft.) ......................................................231 C.8 U54 Beam Designs - AASHTO Standard Specifications
(Strand Diameter = 0.6 in., Girder Spacing = 11.5 ft.) ...................................................231 C.9 U54 Beam Designs - AASHTO Standard Specifications
(Strand Diameter = 0.6 in., Girder Spacing = 14 ft.) ......................................................232
xviii
TABLE Page C.10 U54 Beam Designs - AASHTO Standard Specifications
(Strand Diameter = 0.6 in., Girder Spacing = 16.6 ft.) ...................................................232 C.11 U54 Beam Designs - AASHTO LRFD Specifications (Strand Diameter = 0.5 in.,
Girder Spacing = 8.5 ft.) .................................................................................................233 C.12 U54 Beam Designs - AASHTO LRFD Specifications (Strand Diameter = 0.5 in.,
Girder Spacing = 10 ft.) ..................................................................................................233 C.13 U54 Beam Designs - AASHTO LRFD Specifications (Strand Diameter = 0.5 in.,
Girder Spacing = 11.5 ft.) ...............................................................................................234
C.14 U54 Beam Designs - AASHTO LRFD Specifications (Strand Diameter = 0.5 in., Girder Spacing = 14 ft.) ..................................................................................................234
C.15 U54 Beam Designs - AASHTO LRFD Specifications (Strand Diameter = 0.5 in.,
Girder Spacing = 16.6 ft.) ...............................................................................................235 C.16 U54 Beam Designs - AASHTO LRFD Specifications (Strand Diameter = 0.6 in.,
Girder Spacing = 8.5 ft.) ................................................................................................235 C.17 U54 Beam Designs - AASHTO LRFD Specifications (Strand Diameter = 0.6 in.,
Girder Spacing = 10 ft.) ..................................................................................................236 C.18 U54 Beam Designs - AASHTO LRFD Specifications (Strand Diameter = 0.6 in.,
Girder Spacing = 11.5 ft.) ...............................................................................................236 C.19 U54 Beam Designs - AASHTO LRFD Specifications (Strand Diameter = 0.6 in.,
Girder Spacing = 14 ft.) ..................................................................................................237 C.20 U54 Beam Designs - AASHTO LRFD Specifications (Strand Diameter = 0.6 in.,
Girder Spacing = 16.6 ft.) ...............................................................................................237 C.21 Controlling Limit States and Maximum Span Lengths for ft = 6 cf ' and
ft = 7.5 cf ' (U54 Beams - AASHTO LRFD Specifications – Strand Diameter = 0.6 in.) .............................................................................................................................238
C.22 Controlling Limit States and Maximum Span Lengths for ft = 6 cf ' and
ft = 8 cf ' (U54 Beams - AASHTO LRFD Specifications – Strand Diameter = 0.6 in.) .............................................................................................................................239
xix
TABLE Page D.1 Type IV Beam Designs - AASHTO Standard Specifications (Strand Diameter =
0.5 in., Girder Spacing = 4.25 ft.) ...................................................................................242 D.2 Type IV Beam Designs - AASHTO Standard Specifications (Strand Diameter =
0.5 in., Girder Spacing = 5 ft.) ........................................................................................243 D.3 Type IV Beam Designs - AASHTO Standard Specifications (Strand Diameter =
0.5 in., Girder Spacing = 5.75 ft.) ...................................................................................244 D.4 Type IV Beam Designs - AASHTO Standard Specifications (Strand Diameter =
0.5 in., Girder Spacing = 7 ft.) ........................................................................................244 D.5 Type IV Beam Designs - AASHTO Standard Specifications (Strand Diameter =
0.5 in., Girder Spacing = 8.5 ft.) .....................................................................................245 D.6 Type IV Beam Designs - AASHTO Standard Specifications (Strand Diameter =
0.5 in., Girder Spacing = 9 ft.) ........................................................................................245 D.7 Type IV Beam Designs - AASHTO Standard Specifications (Strand Diameter =
0.6 in., Girder Spacing = 4.25 ft.) ..................................................................................246 D.8 Type IV Beam Designs - AASHTO Standard Specifications (Strand Diameter =
0.6 in., Girder Spacing = 5 ft.) ........................................................................................247 D.9 Type IV Beam Designs - AASHTO Standard Specifications (Strand Diameter =
0.6 in., Girder Spacing = 5.75 ft.) ..................................................................................248 D.10 Type IV Beam Designs - AASHTO Standard Specifications (Strand Diameter =
0.6 in., Girder Spacing = 7 ft.) ........................................................................................249 D.11 Type IV Beam Designs - AASHTO Standard Specifications (Strand Diameter =
0.6 in., Girder Spacing = 8.5 ft.) .....................................................................................249 D.12 Type IV Beam Designs - AASHTO Standard Specifications (Strand Diameter =
0.6 in., Girder Spacing = 9 ft.) ........................................................................................250 D.13 Type IV Beam Designs - AASHTO LRFD Specifications (Strand Diameter =
0.5 in., Girder Spacing = 4.25 ft.) .................................................................................250 D.14 Type IV Beam Designs - AASHTO LRFD Specifications (Strand Diameter =
0.5 in., Girder Spacing = 5 ft.) .......................................................................................251 D.15 Type IV Beam Designs - AASHTO LRFD Specifications (Strand Diameter =
0.5 in., Girder Spacing = 5.75 ft.) .................................................................................251
xx
TABLE Page D.16 Type IV Beam Designs - AASHTO LRFD Specifications (Strand Diameter =
0.5 in., Girder Spacing = 7 ft.) ........................................................................................252 D.17 Type IV Beam Designs - AASHTO LRFD Specifications (Strand Diameter =
0.5 in., Girder Spacing = 8.5 ft.) ....................................................................................252 D.18 Type IV Beam Designs - AASHTO LRFD Specifications (Strand Diameter =
0.5 in., Girder Spacing = 9 ft.) ........................................................................................253 D.19 U54 Beam Designs - AASHTO LRDF Specifications (Strand Diameter =
0.6 in., Girder Spacing = 4.25 ft.) ...................................................................................254 D.20 Type IV Beam Designs - AASHTO LRFD Specifications (Strand Diameter =
0.6 in., Girder Spacing = 5 ft.) ........................................................................................255 D.21 Type IV Beam Designs - AASHTO LRFD Specifications (Strand Diameter =
0.6 in., Girder Spacing = 5.75 ft.) ...................................................................................256 D.22 Type IV Beam Designs - AASHTO LRFD Specifications (Strand Diameter =
0.6 in., Girder Spacing = 7 ft.) ........................................................................................257 D.23 Type IV Beam Designs - AASHTO LRFD Specifications (Strand Diameter =
0.6 in., Girder Spacing = 8.5 ft.) .....................................................................................257 D.24 Type IV Beam Designs - AASHTO LRFD Specifications (Strand Diameter =
0.6 in., Girder Spacing = 9 ft.) ........................................................................................258 D.25 Controlling Limit States and Maximum Span Lengths for ft = 6 cf ' and
ft = 7.5 cf ' (Type IV Beams - AASHTO LRFD Specifications - Strand Diameter = 0.6 in.). ..........................................................................................................259
D.26 Controlling Limit States and Maximum Span Lengths for ft =6 cf ' and
ft = 8 cf ' (Type IV Beams - AASHTO LRFD Specifications – Strand Diameter = 0.6 in.) ...............................................................................................................................260
1
1 INTRODUCTION
1.1 BACKGROUND AND PROBLEM STATEMENT
Over the years, design procedures for engineered structures have been developed to
provide satisfactory margins of safety. Engineers based these procedures on their confidence in
the analysis of the load effects and the strength of the materials provided. As analysis techniques
and quality control for materials improve, the design procedures change. Current research and
changes in design practices for bridges tend to focus on the American Association of State and
Highway Transportation Officials (AASHTO) Standard and Load and Resistance Factor Design
(LRFD) Bridge Design Specifications (AASHTO 2002b).
The AASHTO Standard Specifications for Highway Bridges (AASHTO 2002a) use both
allowable stress design (ASD) and load factor design (LFD) philosophies. However, the
AASHTO LRFD Specifications, referred to as load and resistance factor design (LRFD), are
written in a probability-based limit state format. In this case, safety against structural failure is
quantified using reliability theory, where the selection of conservative load and resistance factors
take into account the statistical variability of the design parameters. Load and resistance factors
are determined for each ultimate limit state considered, and safety is measured in terms of the
target reliability index (Nowak and Collins 2000). As a result, the LRFD Specifications allow
for a more uniform safety level for various groups of bridges for the ultimate limit states.
However, for prestressed concrete design, traditional serviceability limit states are still used and
often control the flexural design of prestressed concrete bridge girders.
On the other hand, as technology has improved throughout the last decade, the
development of high strength concrete (HSC) has progressed at a considerable rate. Concrete
strengths up to 12000 psi or more can be obtained through the optimization of concrete mixture
proportions, materials, and admixtures. Despite this trend, bridge designers have been cautious
to specify HSC for their precast, prestressed concrete designs, and the application of HSC has
been limited primarily to important high-rise buildings. This reluctance is understandable given
2
the empirical nature of the design equations provided by the AASHTO codes for prestressed
concrete members, as well as the fact that these formulas were developed based on the
mechanical properties of normal strength concrete (NSC) of 6000 psi or less.
Highway bridge demands often result in the need for longer spans, fewer girders, and
consequently, fewer piers and foundations. The use of HSC prestressed bridge girders, along
with appropriate design criteria, would enable designers to utilize HSC to its full potential. This
would result in several practical advantages. Ralls (1985) anticipates longer span beams that are
cost-effective at the time of construction and during the life of the structures. Therefore, more
data on statistical parameters for the mechanical properties of HSC (more than 6000 psi) along
with identification of critical areas for refining current design provisions for HSC prestressed
bridge girders are needed to fully utilize HSC.
1.2 OBJECTIVES AND SCOPE
This report summarizes Phase 2 of the Texas Department of Transportation (TxDOT)
Research Project 0-2101, “Allowable Stresses and Resistance Factors for High Strength
Concrete.” The objective of this project was to evaluate the allowable stresses and resistance
factors in the AASHTO LRFD Specifications for design of HSC girders used in Texas bridges.
Hueste et al. (2003a) summarized the complete project. Phase 1 of this project (Hueste et al.
2003b) evaluated the applicability of current prediction equations for estimation of mechanical
properties of HSC and determined statistical parameters for mechanical properties of HSC. The
HSC samples for Phase 1 were collected from three Texas precasters that manufacture HSC
prestressed bridge girders. Phase 3 of this project assessed the impact of different curing
conditions on the compressive and flexural strength of HSC mixtures used for prestressed girders
in Texas (Hueste et al. 2003c). The portion of the research project addressed by this report
(Phase 2) includes defining the current state of practice for design of HSC prestressed girders
and identifying critical design parameters that limit the design of typical HSC prestressed bridge
girders. There are three specific objectives for this study:
3
1. determine the current state of practice for HSC prestressed bridge girders across the
United States,
2. evaluate the controlling limit states for the design of HSC prestressed bridge girders
and identify areas where some economy in design may be gained, and
3. conduct a preliminary assessment of the impact of revising critical design criteria
with an objective of increasing the economy of HSC prestressed girders.
1.3 RESEARCH PLAN
In order to accomplish these objectives, researchers performed the following major tasks.
Task 1: Review Previous Research and Current State of Practice
A literature review was conducted to document the current state of practice of
prestressed concrete bridge girders, including review of design criteria and relevant case studies
of the performance of HSC prestressed bridge girders. In addition to the literature search, a
survey was developed and distributed to all 50 state departments of transportation as well as to
several organizations involved in the design of bridge structures. The objective of this survey is
to gather information and document critical aspects of current design practices for HSC
prestressed bridge girders.
Task 2: Comparison of Design Provisions for Prestressed Concrete Bridge Girders
The main purpose of this task is to provide background information and a comparison of
the current AASHTO LRFD and Standard Specifications for prestressed concrete bridge girders.
Task 2 outlines the differences in the design philosophy and calculation procedures for these two
specifications.
Task 3: Parametric Study
A parametric study was conducted for single-span prestressed concrete bridge girders
mainly to investigate the controlling limit states for both the AASHTO Standard and LRFD
Specifications for Highway Bridges. Both Type IV and U54 girder sections were evaluated, with
4
consideration given to the effects of changes in concrete strength, strand diameter, girder
spacing, and span length.
Task 4: Evaluation of the Controlling Limit States for HSC Prestressed Bridge Girders
The purpose of this task is to evaluate the limiting design criteria for HSC prestressed
U54 and Type IV beams using both the AASHTO Standard and LRFD Specifications for
Highway Bridges. This evaluation uses results from the parametric study. The potential impact
of revised design criteria was also evaluated.
Task 5: Develop Summary, Conclusions, and Recommendations
This task includes a summary of work accomplished, description of findings,
conclusions, and recommendations. Critical areas for refining current design provisions for HSC
prestressed bridge girders are identified.
1.4 OUTLINE OF THIS REPORT
This report is organized as follows. Chapter 1 provides an introduction to the project.
Chapter 2 provides a review of previous research related to HSC prestressed bridge girders.
Chapter 3 provides a review of current specifications and practices for the design of prestressed
concrete bridge girders, along with applicable design documents used by TxDOT. Chapter 4
describes the results of the survey to document relevant aspects of current practice for the design
of HSC prestressed bridge girders. Chapter 5 outlines a parametric study for the Texas U54 and
AASHTO Type IV beams to mainly evaluate the controlling limit states for the design of HSC
prestressed bridge girders. Chapters 6 and 7 evaluate the results of the parametric study for the
U54 and Type IV beams, respectively, along with an assessment of the impact of potential
revisions to design criteria. Finally, Chapter 8 provides a summary of the project, conclusions,
and recommendations for future research. Additional information such as the questionnaire for
the survey, live load distribution factors and moments for the Standard and LRFD Specifications,
and complete designs for the U54 and Type IV beams are presented in the appendices.
5
2 PREVIOUS RESEARCH
2.1 GENERAL
Several studies have evaluated the use of HSC for prestressed bridge girders. Topics of
importance to this project, which are reviewed in this chapter, include the use of HSC for
prestressed bridge girders, flexural design of prestressed concrete bridge girders, development of
the AASHTO LRFD Specifications, allowable stress limits for prestressed concrete beams,
critical mechanical properties of HSC for design, and concrete strengths at transfer.
2.2 USE OF HSC FOR PRESTRESSED BRIDGE GIRDERS
2.2.1 Impact of HSC
Durning and Rear (1993) assessed the viability and performance of HSC for Texas bridge
girders. Results showed that for AASHTO Type C and Type IV girders with a girder spacing of
approximately 8.4 ft., an increase in concrete compressive strengths from 6000 to 10000 psi
results in approximately a 20 percent increase in the maximum span lengths. Type IV girders
with 0.5 in. diameter strands can fully utilize concrete compressive strengths up to 10000 psi.
Therefore, to effectively use higher concrete strengths (above 10000 psi), 0.6 in. diameter strands
should be used. They also found that when using HSC with 0.6 in. diameter strands, longer span
lengths can be reached and the girder spacing can be doubled for a given span length. This
reduces the number of girders in a bridge. Consequently, fewer piers and foundations are
required, resulting in substantial savings.
Russell (1994) reported that an increase in compressive strength from 6000 to 10000 psi
results in a 25 percent increase in span capacity for AASHTO Type IV girders and a 21 percent
increase in span capacity for Texas U54 girders when 0.5 in. diameter strands are used.
6
Adelman and Cousins (1990) evaluated the use of HSC bridge girders in Louisiana. They
found that an increase in concrete compressive strength from 6000 to 10000 psi results in a
10 percent average increase in span capacity for seven types of girders using 0.5 in. diameter
strands. In particular, an average of a 12 percent increase in span capacity for the AASHTO
Type IV girder, which included several girder spacings, was reported.
2.2.2 Example Structures
A description of two Texas bridges constructed with HSC prestressed girders is given
below to provide important applications and relevant background of such bridges.
2.2.2.1 Louetta Road Overpass, State Highway 249, Houston, Texas
The Louetta Road Overpass is a high performance concrete (HPC) bridge constructed in
1995 as a part of a research project conducted by TxDOT in cooperation with the University of
Texas at Austin. The benefits of the use of HSC in combination with HPC for the girder design
allowed for a simple span construction. In addition, the bridge met aesthetic considerations since
it used a reduced number of beams and piers. HPC was used not only because high concrete
strength was required but also because placement of the concrete in the U-beam formwork was
necessary. Thus, more workability was required and a set retarder and high-range water-
reducing admixture was used. No accelerated curing was used; cement was partially replaced
with fly ash.
The span length of the bridge is 130 ft. with precast pretensioned U54 Beams and precast
panels with a cast-in-place (CIP) topping slab. The required concrete strengths at service (at 56
days) were from 10000 to 13000 psi. Transfer (16-21 hours) concrete strengths were from 6900
to 8800 psi. These strengths varied according to the requirement for each particular beam. The
prestressing consisted of 0.6 in. diameter strands on a 1.97 in. grid spacing, with a total of 87
strands. The maximum debonding length was 30 ft., which is an exception to the typical
maximum debonding length of 20 ft. (Ralls 1995). Designers used a maximum allowable tensile
stress at transfer of 10 cif ' rather than the code limit of 7.5 cif ' (where f'ci is in psi units). An
7
allowable tensile stress at service of 8 cf ' rather than the code limit of 6 cf ' for 28 days was
used for design (where f'c is in psi units). Testing of the actual concrete mix showed that these
values are adequate (Ralls 1995).
2.2.2.2 San Angelo Bridge, U.S. Route 67, San Angelo, Texas
The San Angelo Bridge is an HPC bridge recently constructed by TxDOT (from 1995 to
1998). HPC was used because not only HSC was required but also placement of the concrete in
the I-beam was necessary (see Section 5 for geometry). Thus, TxDOT used a set retarder and
high-range water-reducing admixture. No accelerated curing was used, and cement was partially
replaced with fly ash.
The span length of the bridge is 153 ft., and the girders are precast pretensioned Type IV
beams using precast panels with a CIP topping slab. The required concrete strengths at service
(at 56 days) were from 5800 to 14700 psi. Transfer (16-21 hours) concrete strengths were from
8900 to 10800 psi. These strengths varied according to the requirements for each particular
beam. The prestressing consisted of 0.6 in diameter strands on a 2 in. grid spacing. Again, for
this bridge the benefits of the use of HSC in combination with HPC in the girder design allowed
for a simple span construction, and aesthetic considerations were met because fewer beams and
piers were required.
2.3 FLEXURAL DESIGN OF PRESTRESSED CONCRETE BRIDGE GIRDERS
2.3.1 Design Procedure
The basic flexural design procedure for prestressed concrete bridge girders is similar for
both the AASHTO Standard and LRFD Specifications. The traditional process consists of first
satisfying serviceability conditions and then checking the ultimate limit state. For flexure, the
required serviceability conditions to be checked consist of ensuring that the flexural stresses do
not exceed the allowable stresses at critical load stages. The ultimate state to be checked for
flexure involves verifying that the factored moment demand does not exceed the reduced
8
nominal moment strength. Current designs for prestressed concrete girders are typically
governed by the allowable stress requirements. The LRFD Specifications were calibrated
assuming that the maximum design load effect governs designs, and the load and resistance
factors were determined for ultimate conditions (Nowak 1999). The LRFD Specifications also
provide limit state design rules (Service I, Service III, and Strength I) for design of prestressed
concrete that only work consistently with the LRFD philosophy at the ultimate limit states
(Strength I). Additional details for the design of prestressed concrete bridge girders using both
the AASHTO Standard and the LRFD Specifications are provided in Sections 3 and 5.
2.3.2 Current Specifications
As of 2002, AASHTO had issued two design specifications for highway bridges: the
AASHTO Standard Specifications for Highway Bridges, 16th Edition and 2002 Interim
Revisions, and the AASHTO LRFD Bridge Design Specifications, 2nd Edition and 2002 Interim
Revisions (AASHTO 2002 a,b). In 2003, the Standard Specifications for Highway Bridges, 17th
Edition, was released (AASHTO 2003). This project references AASHTO (2002 a,b).
The AASHTO Standard Specifications use the ASD and the load LFD philosophies.
However, the AASHTO LRFD Specifications, referred to as load and resistance factor design,
are written in a probability-based limit state format where safety is provided through the
selection of conservative load and resistance factors. The LRFD specifications determine load
and resistance factors for each limit state considered and measure safety in terms of the target
reliability index (Nowak and Collins 2000). Unlike the Standard Specifications, the calibration
of the LRFD Specifications is based on reliability theory and allows for designs with a more
uniform level of safety.
Research discussed in Section 4 indicates that the departments of transportation in the
United States are moving toward using the new LRFD Specifications, although this transition is
gradual. The Standard Specifications are still widely used. Most states plan complete
implementation of the LRFD Specifications in the period of 2004 to 2007 (Section 4.2.1).
9
Three main reasons can be identified to explain the preference for the Standard
Specifications:
• LRFD uses a new probability-based limit state format that designers are still reluctant
to use.
• Some studies indicate that the choice of design specifications has little impact on the
span capabilities for a given type of beam.
• Experience has shown that bridges designed under the Standard Specifications are
performing as expected and most of them have worked well.
Some important differences exist between the flexural design provisions for the
AASHTO Standard and LRFD Specifications. The significant changes in the LRFD
Specifications include the introduction of a new live load model, a new impact load factor, new
live load distribution factors, as well as changes in the description of the limit states. Additional
information is provided in Section 3.
2.4 DEVELOPMENT OF THE AASHTO LRFD SPECIFICATIONS
To show the importance of the statistics and parameters of resistance, this section
summarizes the calibration procedure for the AASHTO LRFD Specifications. Load and
resistance factors are determined for the ultimate limit state, and safety is measured in terms of
the target reliability index (βT), which allows for a uniform and acceptably low probability of
failure (pf) for various groups of bridge girders. Relevant aspects of the calibration procedure are
the choice of the load and resistance statistical parameters as well as the target reliability index.
It should be noted that the statistical parameters for resistance of concrete members used in the
code calibration are based on mechanical properties for NSC. Phase 1 of this study determined
statistical parameters for HSC produced by Texas precasters (Hueste et al. 2003b).
The AASHTO LRFD Specifications were calibrated to provide design provisions for
steel girder bridges (composite and non-composite), reinforced concrete bridges (T-beams), and
prestressed concrete bridges (AASHTO girders) (Nowak 1999). The design provisions were
developed for the ultimate limit state. However, there is still a need to consider the allowable
10
stress design since serviceability limit states often govern the flexural design of prestressed
concrete bridge girders. Therefore, both the serviceability limit state (SLS) and the ultimate limit
state (ULS) prescribed by LRFD should be considered in the flexural design of prestressed
concrete bridge girders.
The objective of the calibration process for the LRFD Specifications was to select a set of
values for the load and resistance factors that would provide a uniform safety level in design
situations covered by the code. The required safety level was defined by a target reliability index
(βT.) The target reliability index for the ULS was taken as βT = 3.5. Although many
combinations of load and resistance factors can be used to attain the target reliability index, it is
desirable to have the same load factor for each load type for different types of construction.
Nowak (1999) summarized the procedure for calibration of the AASHTO LRFD Specifications
as follows.
1. Development of a database of sample current bridges
Approximately 200 bridges were selected from various regions of the United States.
The selection was based on structural type, material, and geographic location. Future trends
were considered by sending questionnaires to various departments of transportation. For
each bridge in the database, the loads indicated by the contract drawings were subdivided by
the following weights: factory-made elements, cast-in-place concrete members, wearing
surface, miscellaneous (railing, luminaries), HS20 live load, and dynamic loads.
2. Development of a set of bridge designs for calculation purposes
A simulated set of 175 bridge designs was developed based on the relative amount for
the loads identified above for each type of bridge, span, and girder spacing in the database.
3. Establishment of the statistical database for load and resistance parameters
Because the reliability indices are computed in terms of the mean and standard
deviations of load and resistance, determination of these statistical parameters was very
important. Statistical parameters of load and resistance were determined on the basis of the
available data, such as truck surveys and material testing, and by simulations.
11
4. Estimation of the reliability indices implicit in the current design
It was assumed that the total load (Q) is a normal random variable and the resistance
(R) is a log-normal random variable. The Rackwitz and Fiessler (1978) method was used to
compute the reliability indices, β. This method is an iterative procedure based on normal
approximations to non-normal distributions at a design point. For simplicity the method uses
only two random variables: the resistance, R, and total load effects, Q. The mean (mQ ) and
standard deviation (σQ) of Q were calculated using Turkstra’s rule (Nowak and Collins
2000), and the resistance parameters bias (λR ) and covariance (VR ) were calculated using
Monte Carlo simulation. Once the resistance parameters (Rn, λR, and VR) and the load
parameters (mQ and σQ) were determined, the reliability indices were calculated for each type
of bridge girder for the moment and shear limit state. R was computed using the equation
from the AASHTO Standard Specifications: [1.3D + 2.17(L+I)]/φ, where D corresponds to
the dead load demand and L+I corresponds to the live load plus impact. Also, the resistance
factors (φ) were from the AASHTO Standard Specifications.
5. Selection of the target reliability index
Reliability indices were calculated for each simulated bridge for both moment and
shear. The results gave a wide range of values for the reliability indices resulting from this
phase of the calibration process. However, this was expected since the designs were based
on the AASHTO Standard Specifications. From these calculated reliability indices and from
past calibration of other specifications, a target reliability index βT = 3.5 was chosen.
The most important parameters that determine the reliability index are span length and
girder spacing. In calibrating the LRFD Specifications, the corresponding safety level of 3.5
determined for a simple span moment, corresponding to girder spacing of 6 ft. and span of 60
ft. was considered acceptable. The reliability index is a comparative indicator, where a group
of bridges having a reliability index greater than a second group is safer (β = φ−1 [ pf ], where
pf is the probability of failure).
12
6. Computation of the load and resistance factors
To achieve a uniform safety level for all materials, spans, and girder spacings, the load
and resistance factors were determined. One way to find the load and resistance factors is to
select the load factors and then calculate the resistance factors, as follows:
• Factored load was defined as the average value of load, plus some number of
standard deviations (k) of the load: γi = λi (1 + kVi).
• For a given set of load factors, the value of the resistance factors can be
assumed. The corresponding reliability index is computed and compared with
the target reliability index (resistance factors are rounded to 0.05). If the values
are close, a suitable combination of load and resistance factors has found.
• If close values do not result, a new trial set of load factors has to be used and the
process is repeated until the reliability index is close to the target value.
After studies were conducted, a value for k = 2 was recommended. For prestressed
concrete bridge girders, values of φ = 1.0 for the moment limit state and φ = 0.95 for the
shear limit state were found. Recommended values of load factors corresponding to k = 2
are: [1.25D + 1.5DA + 1.7(L+I)]/φ, where D corresponds to the dead load demand, DA is the
weight of the asphalt, and L+I corresponds to the live load plus impact.
7. Computation of reliability indices
Finally, reliability indices were computed for designs found considering the new
calibrated LRFD load and resistance factors. Results were plotted, and they showed that the
new reliability indices closely matched the target reliability index (Nowak 1999).
13
2.5 ALLOWABLE STRESS LIMITS FOR PRESTRESSED CONCRETE BEAMS
The design of prestressed concrete members is typically governed by the service
condition where the flexural stresses at various load stages are limited to the corresponding
allowable stresses. Therefore, these allowable stresses are an indicator of the resistance and
these limits become more critical for designs using HSC. Current specifications provide
allowable stress limits that were developed based on the mechanical properties of NSC of 6000
psi or less. These allowable stresses that traditionally are conservative for standard designs using
NSC may not be appropriate for HSC designs. Therefore, current allowable stresses need to be
reviewed and, if appropriate, revised based on information from testing of HSC (see Hueste et al.
2003 a,b,d).
In this study, one of the objectives was to perform a preliminary assessment of the impact
of raising critical design criteria with the objective of increasing the economy of HSC prestressed
girders. Therefore, researchers studied the limit states that control the required number of
strands and, consequently, the span capacity were studied.
Allowable stresses for concrete specified by both the AASHTO Standard and LRFD
Specifications are shown in Table 2.1. Both specifications provide almost the same allowable
stresses except for the compressive stress at service, which was increased from 0.4 f'c to 0.45 f'c
in the LRFD Specifications. Maximum limits for the tensile stress at transfer are slightly
different (see note for Table 2.1). On the other hand, the American Concrete Institute (ACI)
318-02 building code (ACI Comm. 318 2002) provides serviceability requirements that are also
slightly different than those provided by the AASHTO Standard and LRFD Specifications.
Table 2.2 shows these limits.
In ACI 318-02, the allowable tensile stress at service is limited to 7.5 cf ' . This limit
results in an allowable tensile stress that is 25 percent greater than the corresponding limiting
stress given by both the AASHTO Standard and LRFD Specifications (6 cf ' ). However, ACI
318-02 specifies the same allowable compressive stress as the LRFD Specifications. In ACI
318-02, the maximum allowable tensile stress at transfer is 25 percent lower than that given by
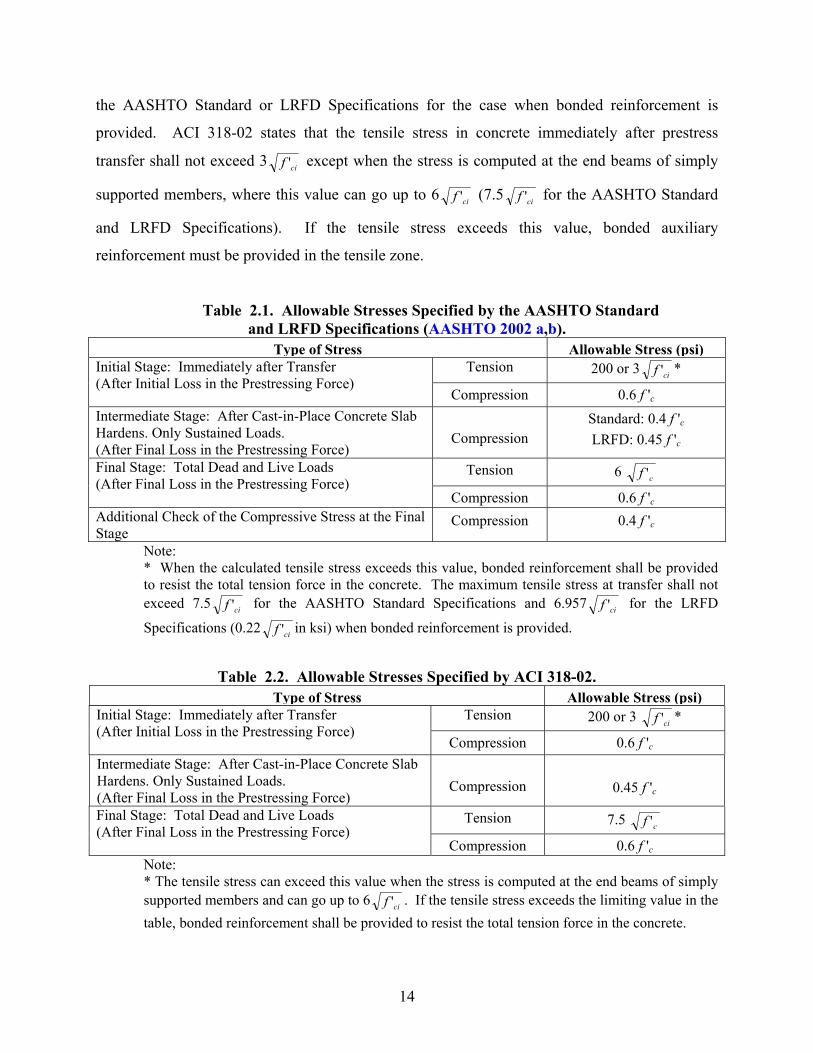
14
the AASHTO Standard or LRFD Specifications for the case when bonded reinforcement is
provided. ACI 318-02 states that the tensile stress in concrete immediately after prestress
transfer shall not exceed 3 cif ' except when the stress is computed at the end beams of simply
supported members, where this value can go up to 6 cif ' (7.5 cif ' for the AASHTO Standard
and LRFD Specifications). If the tensile stress exceeds this value, bonded auxiliary
reinforcement must be provided in the tensile zone.
Table 2.1. Allowable Stresses Specified by the AASHTO Standard and LRFD Specifications (AASHTO 2002 a,b).
Type of Stress Allowable Stress (psi)Tension 200 or 3 cif ' * Initial Stage: Immediately after Transfer
(After Initial Loss in the Prestressing Force) Compression 0.6 f 'c
Intermediate Stage: After Cast-in-Place Concrete Slab Hardens. Only Sustained Loads. (After Final Loss in the Prestressing Force)
Compression
Standard: 0.4 f 'c
LRFD: 0.45 f 'c
Tension 6 cf ' Final Stage: Total Dead and Live Loads (After Final Loss in the Prestressing Force)
Compression 0.6 f 'c Additional Check of the Compressive Stress at the Final Stage
Compression 0.4 f 'c
Note: * When the calculated tensile stress exceeds this value, bonded reinforcement shall be provided to resist the total tension force in the concrete. The maximum tensile stress at transfer shall not exceed 7.5 cif ' for the AASHTO Standard Specifications and 6.957 cif ' for the LRFD
Specifications (0.22 cif ' in ksi) when bonded reinforcement is provided.
Table 2.2. Allowable Stresses Specified by ACI 318-02. Type of Stress Allowable Stress (psi)
Tension 200 or 3 cif ' * Initial Stage: Immediately after Transfer (After Initial Loss in the Prestressing Force)
Compression 0.6 f 'c Intermediate Stage: After Cast-in-Place Concrete Slab Hardens. Only Sustained Loads. (After Final Loss in the Prestressing Force)
Compression
0.45 f 'c
Tension 7.5 cf ' Final Stage: Total Dead and Live Loads (After Final Loss in the Prestressing Force)
Compression 0.6 f 'c Note: * The tensile stress can exceed this value when the stress is computed at the end beams of simply supported members and can go up to 6 cif ' . If the tensile stress exceeds the limiting value in the table, bonded reinforcement shall be provided to resist the total tension force in the concrete.
15
In regard to the tensile stress limit, T.Y. Lin (1963) stated the following:
“What should be the tensile stress in continuous prestressed concrete beams at the point of cracking? Some engineers believe that the cracking tensile strength is higher than the modulus of rupture measured from plain concrete strength specimens. Experience however has shown that the modulus of rupture is a reasonably accurate measure of the start of cracking in continuous prestressed beams. Before the start of actual cracking, some plastic deformation is usually exhibited in the concrete. Such deformations occur only in limit regions and do not affect the general behavior of the structure as an elastic body. Hence, the validity of the elastic theory can still be counted on, up to and perhaps slightly beyond the cracking of concrete.”
Some basis for the compressive stress limit were found to explain the reasons for the
coefficients of the limits currently given in the code. T.Y. Lin (1963, p. 525) stated the
following:
“At jacking or at transfer of prestress the amount of prestress is rather accurately known, there is little likelihood of excessive loading, and there is no danger of fatigue; hence a relatively high stress is permissible. Most codes set 0.6 f'c as the maximum allowable compressive stress. Here the stress is not controlled by the consideration of overload capacities but rather by the possibility of excessive creep, camber, or other local strains.” “When considering the structure under service loads, there is a possibility of fatigue effect and occasional excessive overloads; hence lower values must be allowed. Generally 0.4 f'c for bridges and 0.45 f'c for buildings are the maximum. Higher values can be justified only after careful investigations of fatigue and ultimate strength. The value of f'c is usually based on the 28-day strength but may occasionally be based on the strength of concrete at the time of service if such strength can be assured. Depending on the shape of the section, the above allowable value will usually yield a factor of safety of 2.5 to 3, which is ample. Occasionally, a factor of safety of only about 2 is attained, which seems inadequate for concrete except where overloads and repeated loading are not at all likely.”
The commentary for ACI 318-02 (ACI Comm. 318 2002, p. 266) provides the following
explanation for the compressive stress limit:
“The compressive stress limit of 0.45 f 'c was conservatively established to decrease the probability of failure of prestressed concrete members due to repeated loads. This limit seemed reasonable to preclude excessive creep deformation. At higher values of stress, creep strains tend to increase more rapidly as applied stress increases.
16
The change in allowable stress in the 1995 code recognized that fatigue tests of prestressed concrete beams have shown that concrete failures are not the controlling criterion. Designs with transient live loads that are large compared to sustained live and dead loads have been penalized by the previous single compression stress limit. Therefore, the stress limit of 0.6 f 'c permits a one-third increase in allowable compression stress for members subject to transient loads. Sustained live load is any portion of the service live load that will be sustained for a sufficient period to cause significantly time-dependent deflections. Thus, when the sustained live and dead loads are a large percentage of total service load, the 0.45 f 'c limit may control. On the other hand, when a large portion of the total service load consists of a transient or temporary service live load, the increased stress limit of 18.4.2(b) [0.6 f 'c] may apply. The compression limit of 0.45 f 'c for prestress plus sustained loads will continue to control the long-term behavior of prestressed members.”
2.6 CRITICAL MECHANICAL PROPERTIES OF HSC FOR DESIGN
HSC and HPC are two terms that are sometimes used interchangeably. For HPC, the
aspect of most interest is not the strength, which may or may not be above normal, but the ease
of placement, long-term mechanical properties, early-age strength, toughness, or service life in
service environments. Therefore, HPC involves more attributes than high strength. The special
performance and uniformity requirements cannot always be achieved by using only conventional
materials with normal mixing, placing, and curing practices.
On the other hand, HSC has other physical properties that also make it a highly desirable
material. Its modulus of rupture (MOR), drying shrinkage and creep, porosity, permeability,
durability, corrosion resistance, thermal properties, and bond to steel are properties that tend to
be superior to those for NSC (Farny and Panarese 1994). HSC is achieved through proper
selection of materials, mixture proportioning, mixing, placing, curing, quality control, and
testing. In this study the definition of HSC is concrete with specified compressive strengths for
design of 6000 psi or greater, made without using exotic materials or techniques (ACI 363 1997).
Code changes need to address differences found for HSC, and it is important to
understand how HSC behaves differently from NSC to ensure a conservative design when using
17
codes developed for NSC. Relevant information for the MOR (fr) of HSC is provided below
because this is an important property related to the allowable tensile stress.
Adelman and Cousins (1990) reported material properties for HSC. A MOR of 1360 psi
(28 days) for a concrete strength of 11460 psi was obtained in this study, which would yield the
relationship 12.7 cf ' . This value is consistent with values reported in other literature for HSC
(ACI 363, 1997), as well as with the equation proposed by Carrasquillo et al. (1981), fr =
11.7 cf ' , for concrete strengths ranging from 3000 to 12000 psi. The current code (AASHTO
2002 a,b) equation, estimating fr = 7.5 cf ' (which was developed for NSC), yields a MOR
significantly lower than the 1360 psi found in the study by Adelman and Cousins (1990).
Phase 1 of this project (Hueste et al. 2003b) analyzed current prediction formulas that
relate mechanical properties to the compressive strength to determine whether they can be used
with sufficient accuracy for HSC produced by Texas precasters. Phase 1 evaluated prediction
relationships for the modulus of elasticity, splitting tensile strength, and MOR. HSC samples for
three specified concrete strength ranges (f'c = 6000, 8000 and 10000 psi) were collected from
three Texas precasters. In this study, the best-fit prediction formula for the MOR is fr = 10 cf '
for samples cured in the laboratory after curing in the field for the first day. Note that this
equation does not provide a lower bound. Phase 3 of this project (Hueste et al. 2003c) assessed
the impact of different curing conditions on the compressive strength and MOR of HSC and
found that different field curing conditions can lead to a significant reduction in the MOR. It
should be noted that Phase 3 was ongoing during the study documented within this report, and
therefore the Phase 3 findings were not directly implemented in the evaluation of different tensile
stress limits discussed later in this report. However, an evaluation of the final recommendations
from Phase 3 are provided by Hueste et al. (2003c).
Nilson (1985) indicated that due to curing conditions in the laboratory and in situ, the
actual MOR of a structural member would be less than that obtained in the laboratory. Nilson
recommends the use of the 7.5 cf ' as a conservative value for MOR. However, it should be
noted that this equation was based on normal concrete strengths.
18
2.7 CONCRETE STRENGTHS AT TRANSFER
Stresses at release and daily production requirements result in the need for a high early
concrete strength at transfer of the strand prestress to the girder. Moreover, research shows that
longer span lengths can be achieved using HSC. However, because the additional capacity in
some cases also requires higher initial concrete strengths at transfer, the allowable tensile stresses
at release may control designs.
Dolan et al. (1993) focused on the increased strength due to aging in HSC through
examination of the historical strength gain and determined if additional final design strength is
available. They reported that when additional span capacity comes at the expense of additional
prestressing strands, the additional prestress results in a larger initial tensile stress, and
consequently, larger initial concrete strengths during transfer are required. However, there was
not an established limit for the allowable concrete tensile stress at transfer in their study. They
concluded that many prestressed concrete girders display an actual concrete strength in excess of
the specified strength due to the strength gain after release that brings the 28-day strength to be
well above the specified 28-day requirement. The post-28 day strength gain depends on the
mixture proportions. Precasters often use mixture proportions that gain strength after release.
Mixtures that gain most of their strength before release and have much less strength gain
between 18 hours and 28 days are also possible. In the case of HSC, early strength gain is
typically necessary.
19
3 FLEXURAL DESIGN SPECIFICATIONS FOR PRESTRESSED CONCRETE BRIDGE GIRDERS
3.1 GENERAL
This section provides a review of current design provisions for prestressed concrete
bridge girders for existing specifications with a focus on the AASHTO LRFD Specifications.
Equations for prestress losses are presented. Significant changes in flexural design provisions in
the AASHTO LRFD Specifications versus the AASHTO Standard Specifications are noted.
Finally, relevant TxDOT documents are also reviewed.
3.2 AASHTO STANDARD AND LRFD SPECIFICATIONS
3.2.1 Philosophy
As of 2002, AASHTO had issued two design specifications for highway bridges: the
AASHTO Standard Specifications for Highway Bridges, 16th Edition and 2002 Interim
Specifications (AASHTO 2002a) and the AASHTO LRFD Bridge Design Specifications, 2nd
Edition and 2002 Interim Revisions (AASHTO 2002b). In 2003, the Standard Specifications for
Highway Bridges, 17th Edition, was released (AASHTO 2003). This study references AASHTO
(2002 a,b).
The AASHTO Standard Specifications use the ASD and the LFD philosophies. Whereas
the AASHTO LRFD Specifications, referred to as load and resistance factor design, are written
in a probability-based limit state format. For prestressed concrete design, both specifications
also include service load design criteria.
ASD was developed on the premise that safety can be established based primarily on
experience and judgment. Allowable stresses are indicators of resistance and are compared with
the resultant stresses from the elastic analysis of a structural member under design loads. Design
20
events are specified through the use of load combinations, but they do not recognize that some
combinations of loading are less likely to occur than others.
In LFD, a preliminary effort was made to recognize the variability of some loads. This
variability is considered by using a different multiplier for dead, live, and other loads. Thus,
loads are multiplied by factors and then added to produce load combinations. However, LFD
does not take into account the statistical variability of design parameters.
In contrast, LRFD is written in a probability-based limit state format where safety is
provided through the selection of conservative load and resistance factors. Load and resistance
factors are determined for each limit state considered, and safety is measured in terms of the
target reliability index (Nowak and Collins 2000). Unlike the AASHTO Standard Specifications,
the LRFD provisions allow for a more constant and uniform safety level for various groups of
bridges and construction types.
Numerous engineering disciplines use design based on probability, but its application to
bridge engineering has been relatively small. As an example, conventional code calibration
methods assume that the maximum factored design load effect governs designs, and then load
and resistance factors are determined for the ultimate limit state (Tabsh 1992). However, designs
for prestressed concrete and composite steel girder bridges are still governed by the allowable
stress requirements (stress limits). Therefore, in these cases, both the SLS and the ULS should
be considered.
3.2.2 Design Criteria for Prestressed Concrete Bridge Girders
This study focuses on the elastic flexural behavior of simply supported beams. Shear
stresses are generally not a controlling factor in limiting maximum span lengths; therefore, the
shear limit state was not considered in this study.
21
3.2.2.1 AASHTO Standard Specifications
In the AASHTO Standard Specifications, prestressed concrete bridge girders are
designed to satisfy ASD and LFD. To satisfy ASD, the prestressed concrete bridge girders must
satisfy allowable initial and final stresses at service load conditions. To satisfy LFD, the ultimate
flexural capacity of the section is checked. The AASHTO Standard Specifications call for the
structure to be able to withstand different load combinations for every group corresponding to
the ASD and LFD; however, only a few groups govern the designs. The general design
equation, the groups, and the load combinations for ASD and LFD are given by the equation
shown below.
φ Rn = 1.0 Rn ≥ Group (N)= γ Σ [ βi Li ] (3.1)
where:
φ is the resistance factor (=1.0 for flexural design of factory-produced precast
prestressed members),
Rn is the nominal resistance,
N is the group number (ASD and LFD = I),
γ is the load factor (1.0 for service and varies for LFD design based on grouping,
I = 1.3),
βi is a coefficient that varies with the type of load and depends on the load group and
design method (ASD = 1.0 for dead, live and impact loads; LFD = 1.0 for dead load
and 1.67 for live and impact loads), and
Li is the force effect (D = dead load, L = live load, I = live load impact).
The resistance factor φ, the group loading coefficients β, and the load factors γ are available in
the AASHTO Standard Specifications. Thus, applying Equation 3.1, and the corresponding
coefficients, the design equations for ASD (service) and LFD (strength) are as follows.
Service (ASD):
Group (1)= 1.0(D) + 1.0(L+I) (3.2)
22
Strength (LFD):
Group (1)= 1.3[1.0(D) + 1.67(L+I)] (3.3)
3.2.2.2 AASHTO LRFD Specifications
In the AASHTO LRFD Specifications, bridges are designed for specified limit states to
achieve the objectives of safety, serviceability, and constructability with due regard to issues of
inspectablity, economy, and aesthetics. Because safety is the most important aspect of design, it
is addressed in this section, while the other aspects are secondary but also important. In safety,
four basic limit states must be satisfied: (1) service, (2) fatigue and fracture, (3) strength, and (4)
extreme event limit states, where all limit states are considered of equal importance. However,
like the AASHTO Standard Specifications, prestressed concrete bridge girders are designed in
LRFD to satisfy the service limit states; the strength limit state is an additional, but important,
limit state that must also be satisfied.
In this study, actions to be considered in the service limit states are the concrete stresses.
The service limit states are based in part on experience related to provisions that cannot always
be derived solely from strength or statistical considerations. Service limit states for prestressed
concrete bridge members include Service I and Service III limit states. Service I is a load
combination relating to the normal operational use of the bridge with a 55 mph wind and all
loads taken at their nominal values. Compression in prestressed concrete components is
investigated using this load combination. Service III is a load combination relating only to
tensile stresses in prestressed concrete structures with the objective of crack control (AASHTO
2002b).
The Strength I limit state is the base load combination relating to the normal vehicular
use of the bridge without wind (AASHTO 2002b). Thus, regardless of the type of analysis used,
Equation 3.4 has to be satisfied for all specified force effects and combinations as specified for
each limit state.
φ Rn ≥ Q = Σ [ ni γi Qi ] (3.4)
23
where:
φ is the resistance factor (=1.0 for both the service limit states and the flexural strength
limit state),
Rn is the nominal flexural resistance,
γi is the statistical load factor applied to the force effects (Service I: = 1.0 for the dead
and live loads; Service III: = 1.0 for the dead and 0.8 for the live loads; Strength I: =
1.25 for the dead and 1.75 for the live loads),
Qi is the force effect (DC = dead load of structural components and nonstructural
attachments, LL = live load, IM = live load impact), and
ni is the load modification factor (ni = nD nR nI ≥ 0.95)
where nD is the ductility factor (for this study, for Strength I, nD = 1.0 for
conventional designs and details that comply with the specifications; for Service I
and Service III, nD = 1.0), nR is the redundancy factor (for this study, nR = 1.0 for
conventional levels of redundancy for Strength I; Service I and Service III, nR = 1.0),
and nI is the operational importance factor (for this study, nI = 1.0 for typical
bridges for Strength I; Service I and Service III, nI = 1.0). Therefore, for this study,
nI was taken as 1.0 for the Service I, Service III, and Strength I flexural limit states.
The conversion to a probability-based LRFD methodology could be thought of as a
mechanism to select the load and resistance factors more systematically and rationally than was
done with the information available when ASD and LFD designs were introduced. Moreover,
comparison of Equations 3.1 and 3.4 shows that LRFD requires consideration of ductility,
redundancy, and operational importance. These are important issues, which affect the margin of
safety of bridges, that are quantified in the AASHTO LRFD Specifications.
Applying the corresponding coefficients in Equation 3.4 the load equations for Service I,
Service III, and Strength I are as follows.
Service I (compression):
Q = 1.0(DC) + 1.0(LL+IM) (3.5)
Service III (tension):
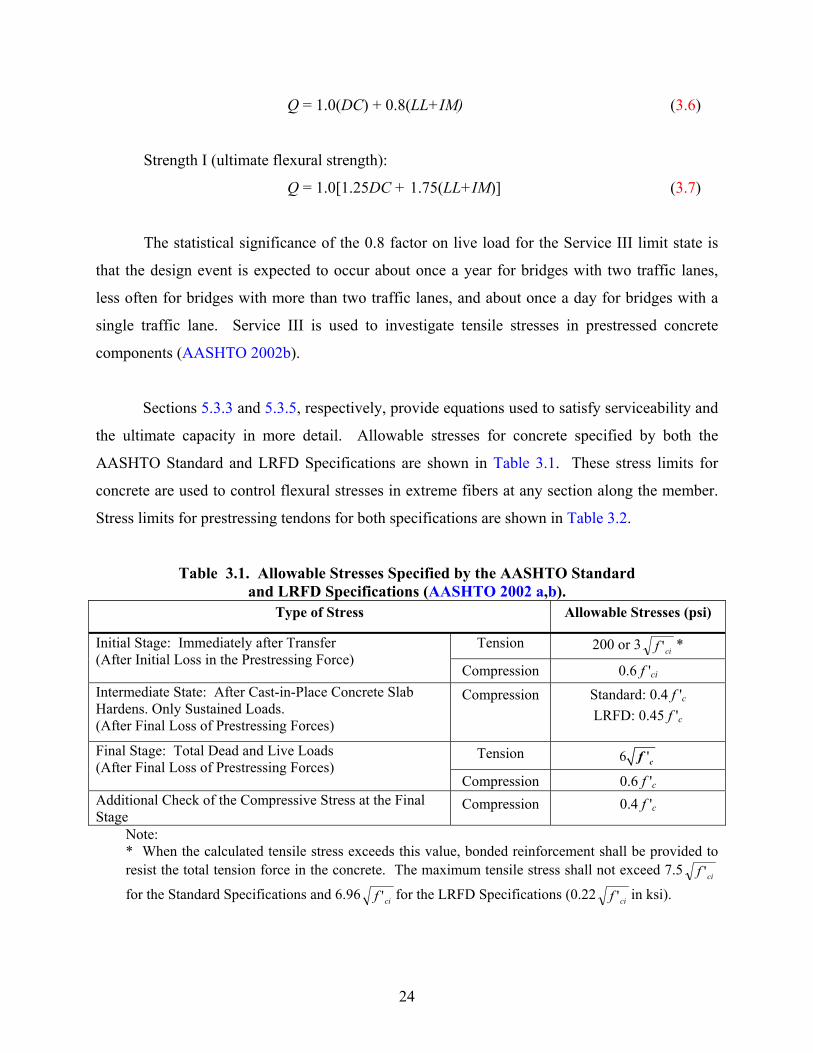
24
Q = 1.0(DC) + 0.8(LL+IM) (3.6)
Strength I (ultimate flexural strength):
Q = 1.0[1.25DC + 1.75(LL+IM)] (3.7)
The statistical significance of the 0.8 factor on live load for the Service III limit state is
that the design event is expected to occur about once a year for bridges with two traffic lanes,
less often for bridges with more than two traffic lanes, and about once a day for bridges with a
single traffic lane. Service III is used to investigate tensile stresses in prestressed concrete
components (AASHTO 2002b).
Sections 5.3.3 and 5.3.5, respectively, provide equations used to satisfy serviceability and
the ultimate capacity in more detail. Allowable stresses for concrete specified by both the
AASHTO Standard and LRFD Specifications are shown in Table 3.1. These stress limits for
concrete are used to control flexural stresses in extreme fibers at any section along the member.
Stress limits for prestressing tendons for both specifications are shown in Table 3.2.
Table 3.1. Allowable Stresses Specified by the AASHTO Standard and LRFD Specifications (AASHTO 2002 a,b).
Type of Stress Allowable Stresses (psi)
Tension 200 or 3 cif ' * Initial Stage: Immediately after Transfer (After Initial Loss in the Prestressing Force)
Compression 0.6 f 'ci Intermediate State: After Cast-in-Place Concrete Slab Hardens. Only Sustained Loads. (After Final Loss of Prestressing Forces)
Compression Standard: 0.4 f 'c
LRFD: 0.45 f 'c
Tension 6 'cf Final Stage: Total Dead and Live Loads (After Final Loss of Prestressing Forces)
Compression 0.6 f 'c Additional Check of the Compressive Stress at the Final Stage
Compression 0.4 f 'c
Note: * When the calculated tensile stress exceeds this value, bonded reinforcement shall be provided to resist the total tension force in the concrete. The maximum tensile stress shall not exceed 7.5 cif '
for the Standard Specifications and 6.96 cif ' for the LRFD Specifications (0.22 cif ' in ksi).
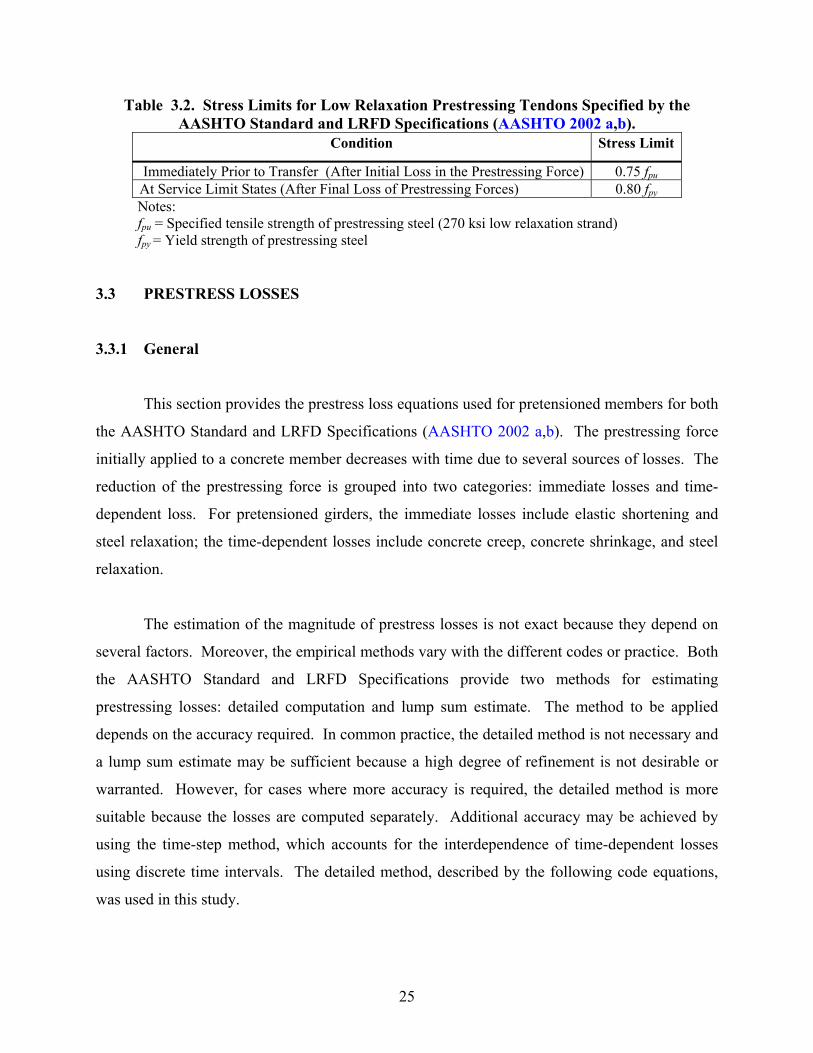
25
Table 3.2. Stress Limits for Low Relaxation Prestressing Tendons Specified by the AASHTO Standard and LRFD Specifications (AASHTO 2002 a,b).
Condition Stress Limit
Immediately Prior to Transfer (After Initial Loss in the Prestressing Force) 0.75 fpu At Service Limit States (After Final Loss of Prestressing Forces) 0.80 fpy Notes: fpu = Specified tensile strength of prestressing steel (270 ksi low relaxation strand) fpy = Yield strength of prestressing steel
3.3 PRESTRESS LOSSES
3.3.1 General
This section provides the prestress loss equations used for pretensioned members for both
the AASHTO Standard and LRFD Specifications (AASHTO 2002 a,b). The prestressing force
initially applied to a concrete member decreases with time due to several sources of losses. The
reduction of the prestressing force is grouped into two categories: immediate losses and time-
dependent loss. For pretensioned girders, the immediate losses include elastic shortening and
steel relaxation; the time-dependent losses include concrete creep, concrete shrinkage, and steel
relaxation.
The estimation of the magnitude of prestress losses is not exact because they depend on
several factors. Moreover, the empirical methods vary with the different codes or practice. Both
the AASHTO Standard and LRFD Specifications provide two methods for estimating
prestressing losses: detailed computation and lump sum estimate. The method to be applied
depends on the accuracy required. In common practice, the detailed method is not necessary and
a lump sum estimate may be sufficient because a high degree of refinement is not desirable or
warranted. However, for cases where more accuracy is required, the detailed method is more
suitable because the losses are computed separately. Additional accuracy may be achieved by
using the time-step method, which accounts for the interdependence of time-dependent losses
using discrete time intervals. The detailed method, described by the following code equations,
was used in this study.
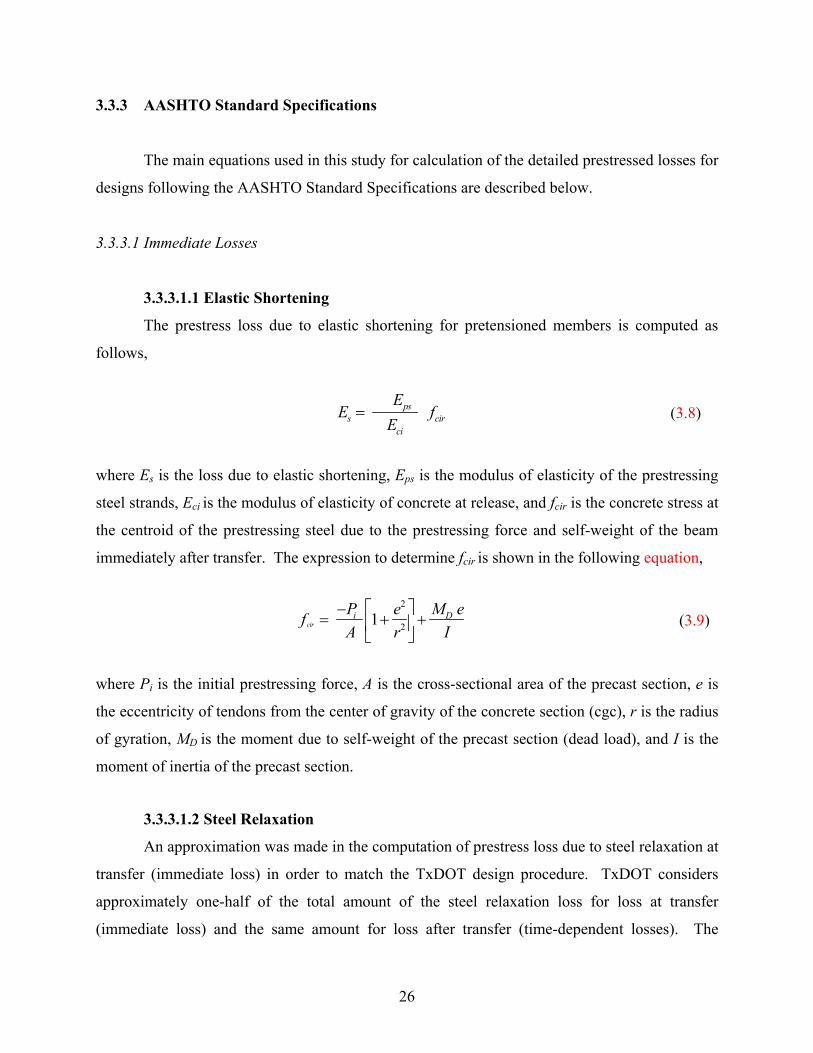
26
3.3.3 AASHTO Standard Specifications
The main equations used in this study for calculation of the detailed prestressed losses for
designs following the AASHTO Standard Specifications are described below.
3.3.3.1 Immediate Losses
3.3.3.1.1 Elastic Shortening
The prestress loss due to elastic shortening for pretensioned members is computed as
follows,
ps
s circi
EE f
E= (3.8)
where Es is the loss due to elastic shortening, Eps is the modulus of elasticity of the prestressing
steel strands, Eci is the modulus of elasticity of concrete at release, and fcir is the concrete stress at
the centroid of the prestressing steel due to the prestressing force and self-weight of the beam
immediately after transfer. The expression to determine fcir is shown in the following equation,
2
21ciri DP e M ef
A r I −
= + +
(3.9)
where Pi is the initial prestressing force, A is the cross-sectional area of the precast section, e is
the eccentricity of tendons from the center of gravity of the concrete section (cgc), r is the radius
of gyration, MD is the moment due to self-weight of the precast section (dead load), and I is the
moment of inertia of the precast section.
3.3.3.1.2 Steel Relaxation
An approximation was made in the computation of prestress loss due to steel relaxation at
transfer (immediate loss) in order to match the TxDOT design procedure. TxDOT considers
approximately one-half of the total amount of the steel relaxation loss for loss at transfer
(immediate loss) and the same amount for loss after transfer (time-dependent losses). The
27
equation for the total loss due to steel relaxation for pretensioned members using low relaxation
strands is as follows,
( )5000 0.1 0.05s s H CCR E S CR= − − + (3.10)
where CRs is the loss due to relaxation of the prestressing strands (psi), Es is the loss due to
elastic shortening (psi), SH is the loss due to concrete shrinkage (psi), and CRc is the loss due to
creep of concrete (psi). The values for Es, CRC, and SH are given by Equations 3.8, 3.11, and
3.13, respectively.
3.3.3.2 Time-Dependent Losses
3.3.3.2.1 Concrete Creep
The equation for the prestress loss due to concrete creep for pretensioned members is as
follows,
12 7C cir cdsCR f f= − (3.11)
where CRC is the loss due to concrete creep, fcir is the concrete stress at the centroid of the
prestressing steel due to the prestressing force and the self-weight of the beam immediately after
transfer (Equation 3.9), and fcds is the concrete stress at the centroid of the prestressing steel due
to all dead loads except the dead load present at the time the prestressing force is applied. The
value of fcds is found using the following equation,
( )bcb
C
CSDSDcds cce
IM
IeMf −++= (3.12)
where MSD is the moment due to the self-weight of the slab (superimposed dead load), MCSD is
the moment due to the self-weight of the rail (composite superimposed dead load), e is the
eccentricity of tendons from the concrete section center of gravity (cgc), I is the moment of
inertia of the precast section, IC is the moment of inertia of the precast section and slab composite
28
section, cb ,is the distance from the cgc to the extreme bottom fiber of the precast section, and ccb
is the distance from the cgc to the extreme bottom fiber of the composite section.
3.3.3.2.2 Concrete Shrinkage
The expression for the prestress loss due to concrete shrinkage for pretensioned members
is as follows,
17000 150HS RH= − (3.13)
where SH is the loss due to concrete shrinkage (psi) and RH is the mean annual ambient relative
humidity in percent.
3.3.3.2.3 Steel Relaxation
The equation for the total prestress loss due to steel relaxation for pretensioned members
using low relaxation strands is given in Equation 3.10. One-half of this total amount is
considered for the losses after transfer (time-dependent losses).
3.3.4 AASHTO LRFD Specifications
The main equations used in this study for calculation of the detailed prestressed losses for
designs following the AASHTO LRFD Specifications are described below.
3.3.4.1 Immediate Losses
3.3.4.1.1 Elastic Shortening
The equation (3.14) for the prestress loss due to elastic shortening (∆fpES) for
pretensioned members is the same as that for the AASHTO Standard Specifications shown in
Equation 3.8.
circi
pspES f
EE
f =∆ (3.14)
29
3.3.4.1.2 Steel Relaxation
The equation for the loss due to steel relaxation at transfer for pretensioned members
using low relaxation strands is as follows,
1log (24.0 ) 0.55
40.0pj
pR pjpy
ftf ff
∆ = −
(3.15)
where ∆fpR1 is the loss due to relaxation at transfer, fpj is the initial stress in the tendon after
stressing is complete, fpy is the specified yield strength of prestressing steel, and t is the estimated
time from stressing to transfer (days).
3.3.4.2 Time-Dependent Losses
3.3.4.2.1 Concrete Creep
The equation for the prestress loss due to concrete creep (∆fpCR) for pretensioned
members is the same as that for the AASHTO Standard Specifications shown in Equation 3.11.
0712 ≥−=∆ cdscirpCR fff (3.16)
3.3.4.2.2 Concrete Shrinkage
The equation for the prestress loss due to concrete shrinkage (∆fpSR) for pretensioned
members is the same as that for the AASHTO Standard Specifications shown in Equation 3.13.
In this case ∆fpSR is in ksi.
RHf pSR 15.00.17 −=∆ (3.17)
3.3.4.2.3 Steel Relaxation
Losses due to relaxation of prestressing strands with low relaxation properties for
pretensioned members is 30 percent of the prestress losses due to the steel relaxation of
prestressing steels with stress-relieved strands (∆fpR2) given in Equation 3.18. In this case ∆fpR2,
∆fpES, ∆fpSR , and ∆fpCR are in ksi.
30
∆fpR2 = 20.0 – 0.4 ∆fpES – 0.2(∆fpSR + ∆fpCR) (3.18)
3.4 SIGNIFICANT CHANGES IN THE AASHTO LRFD SPECIFICATIONS
3.4.1 General
Table 3.3 shows some important differences between the flexural design provisions for
prestressed concrete members when comparing the AASHTO Standard and LRFD
Specifications. The table presents these differences in the order they are provided in these
documents. The significant changes are the introduction of the new live load model, a new
expression for the impact loads, and new expressions for the live load distribution factor, as well
as changes in the limit states. These changes are discussed below.
3.4.2 Live Load Model
The live load is an important factor for bridge design. There is a significant change in the
live load model specified in the LRFD Specifications. The new HL93 live load model is a
superposition of the HS20 truck and the uniform lane load. In contrast, both of these
components are considered separately, with the maximum effect used for design in the AASHTO
Standard Specifications. The HL93 live load model is intended to be representative of the truck
population and is considered to provide a consistent safety margin for a wide spectrum of spans.
Table A.1 (Appendix A) shows a comparison of distribution factors and design live load
moments for U54 Beams. This table also provides a comparison of LRFD and Standard
Specifications live load moments “per lane” with the objective to compare only the effect of the
new live load model. Percentage increases between 48 and 70 percent (varying with the span
lengths but constant for a given span) were found for the LRFD Specifications. These
percentages show the significance of the new LRFD live load demands in terms of the lane
moments. However, refinements in the expressions used to compute the live load distribution
factor help to reduce the LRFD design live load moment per girder as shown in the next section.
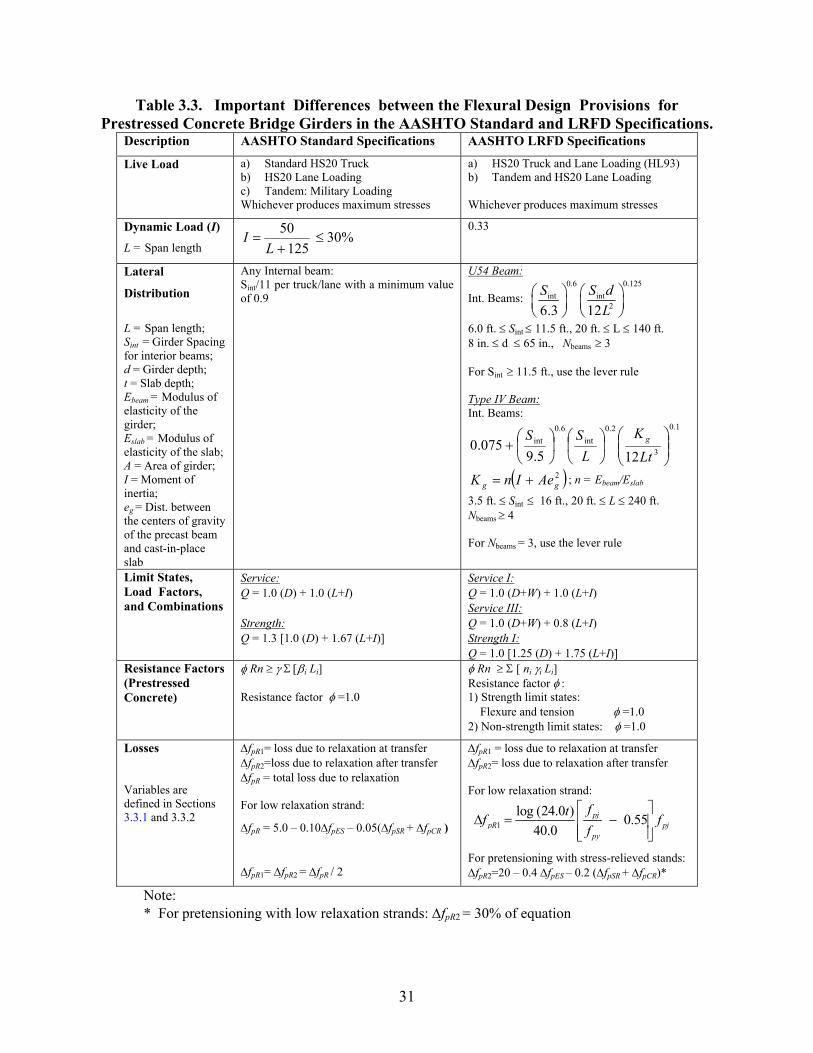
31
Table 3.3. Important Differences between the Flexural Design Provisions for Prestressed Concrete Bridge Girders in the AASHTO Standard and LRFD Specifications.
Description AASHTO Standard Specifications AASHTO LRFD Specifications
Live Load a) Standard HS20 Truck b) HS20 Lane Loading c) Tandem: Military Loading Whichever produces maximum stresses
a) HS20 Truck and Lane Loading (HL93) b) Tandem and HS20 Lane Loading Whichever produces maximum stresses
Dynamic Load (I)
L = Span length %30
12550
≤+
=L
I 0.33
Lateral
Distribution
L = Span length; Sint = Girder Spacing for interior beams; d = Girder depth; t = Slab depth; Ebeam = Modulus of elasticity of the girder; Eslab = Modulus of elasticity of the slab; A = Area of girder; I = Moment of inertia; eg = Dist. between the centers of gravity of the precast beam and cast-in-place slab
Any Internal beam: Sint/11 per truck/lane with a minimum value of 0.9
U54 Beam:
Int. Beams: 0.6 0.125
int int26.3 12
S S dL
6.0 ft. ≤ Sint ≤ 11.5 ft., 20 ft. ≤ L ≤ 140 ft. 8 in. ≤ d ≤ 65 in., Nbeams ≥ 3 For Sint ≥ 11.5 ft., use the lever rule Type IV Beam: Int. Beams:
1.0
3
2.0int
6.0int
125.9075.0
+Lt
KL
SS g
( )2gg AeInK += ; n = Ebeam/Eslab
3.5 ft. ≤ Sint ≤ 16 ft., 20 ft. ≤ L ≤ 240 ft. Nbeams ≥ 4 For Nbeams = 3, use the lever rule
Limit States, Load Factors, and Combinations
Service: Q = 1.0 (D) + 1.0 (L+I) Strength: Q = 1.3 [1.0 (D) + 1.67 (L+I)]
Service I: Q = 1.0 (D+W) + 1.0 (L+I) Service III: Q = 1.0 (D+W) + 0.8 (L+I) Strength I: Q = 1.0 [1.25 (D) + 1.75 (L+I)]
Resistance Factors (Prestressed Concrete)
φ Rn ≥ γ Σ [βi Li] Resistance factor φ =1.0
φ Rn ≥ Σ [ ni γi Li] Resistance factor φ : 1) Strength limit states: Flexure and tension φ =1.0 2) Non-strength limit states: φ =1.0
Losses
Variables are defined in Sections 3.3.1 and 3.3.2
∆fpR1= loss due to relaxation at transfer ∆fpR2=loss due to relaxation after transfer ∆fpR = total loss due to relaxation For low relaxation strand:
∆fpR = 5.0 – 0.10∆fpES – 0.05(∆fpSR + ∆fpCR )
∆fpR1= ∆fpR2 = ∆fpR / 2
∆fpR1 = loss due to relaxation at transfer ∆fpR2= loss due to relaxation after transfer For low relaxation strand:
1log (24.0 ) 0.55
40.0pj
pR pjpy
ftf ff
∆ = −
For pretensioning with stress-relieved stands: ∆fpR2=20 – 0.4 ∆fpES – 0.2 (∆fpSR + ∆fpCR)*
Note: * For pretensioning with low relaxation strands: ∆fpR2 = 30% of equation
32
3.4.3 Live Load Distribution Factors
The AASHTO LRFD Specifications provide new approximate methods of analysis for
the distribution factors (DFs) for typical materials and bridge sections based on an accurate
analysis and a statistical approach (AASHTO 2002b). However, these DFs are still considered to
be conservative since they are based on analyses for typical bridges.
3.4.3.1 Texas U54 Beams
In this study, the DFs for Texas U54 Beams were computed according to both the
AASHTO Standard and LRFD Specifications (see Table 3.3). For the LRFD Specifications, the
DFs for the U54 Beams were determined using expressions for the typical cross-section “c”,
which is referred to as “cast-in-place concrete slab on open precast concrete boxes.” However,
for the case of U54 Beams designed under the LRFD Specifications, the DFs are significantly
smaller than those obtained through the use of the simplified DF expression S/11, where S is the
girder spacing, provided in the AASHTO Standard Specifications.
Table A.1 (Appendix A) shows DFs for U54 Beams computed using both the Standard
and LRFD Specifications. The calculations were performed for spans ranging from 90 to 140 ft.,
and for each span five girder spacings were considered. For girder spacings less than 11.5 ft., the
DFs using the LRFD Specifications are 24 to 39 percent larger than the Standard Specifications
DFs, varying with the span lengths and girder spacings. However, the DFs for the wider girder
spacings are almost the same for both specifications, with an increase of 4.6 percent for the
LRFD Specifications. Where the lever rule was applied for LRFD designs (for wider girder
spacings), the resulting DFs for the Standard and LRFD designs are almost the same.
3.4.3.2 Type IV Beams
The DFs for the Type IV beams were determined using the equation provided in the
LRFD Specifications shown in Table 3.3. For the AASHTO Standard Specifications the
33
simplified expression S/11, where S is the girder spacing, provided in the Standard
Specifications, was used.
Table A.2 (Appendix A) shows DFs for AASHTO Type IV beams, computed using both
the Standard and LRFD Specifications. The calculations were performed for spans ranging from
90 to 140 ft., and for each span five girder spacings were considered. The DFs using the
Standard Specifications are larger (from 2 to 17 percent larger) for wider girder spacings (8.3 and
7 ft. for all spans and 5.75 ft. for spans larger than 110 ft.). For shorter spans and smaller girder
spacings, the DFs from the LRFD Specifications are larger (from 1 to 18 percent larger). These
results show the same trends as those reported for the calibration of the AASHTO LRFD
Specifications (Nowak 1999).
3.4.4 Design Live Load Moments
As noted earlier, the unfactored live load moments per lane were between 48 and 70
percent larger for the LRFD Specifications. This increase varied with the span length but was
constant for each span considered.
3.4.4.1 U54 Beams
Table A.1 (Appendix A) shows the live load moment per U54 beam after applying the
appropriate DFs for both the Standard and LRFD Specifications. The resulting live load
moments per beam are between 9 and 81 percent larger for the LRFD Specifications (varying
greatly with girder spacings and span lengths). However, when girder spacings wider than 11.5
ft. are not considered in the comparison, the range is reduced to a 9 to 29 percent increase for the
LRFD Specifications. For girder spacings wider than 11.5 ft. the lever rule was applied for
LRFD designs and the resulting DFs for the Standard and LRFD designs are almost the same.
This trend shows that the LRFD DFs for U54 Beams greatly reduce the live moments per beam,
relative to the S/11 expression.
34
Researchers made an evaluation of the use of the traditional S/11 DF expression from the
Standard Specifications in conjunction with the live load model in the LRFD Specifications.
Results in Table A.1 show that the resulting live load moments would be significantly larger
(from 60 to 90 percent) than those from the Standard Specifications. In comparison, the use of
the DF based on the LRFD Specifications led to a much smaller increase in the live load moment
per U54 beam (9 to 29 percent) over the Standard Specifications. Therefore, the advantage of
using the DF expression from the LRFD Specifications is clear and this factor was applied for
the U54 Beams in this study.
3.4.4.2 Type IV Beams
Table A.2 (Appendix A) shows DFs and live moments per lane and per beam for
AASHTO Type IV beams, computed using both the Standard and LRFD Specifications. The
calculations were performed for spans ranging from 90 to 140 ft., and for each span five girder
spacings were considered. The DFs using the Standard Specifications are from 2 to 17 percent
larger for wider girder spacings (8.3 and 7 ft. for all spans and 5.75 ft. for spans larger than 110
ft.). For shorter spans and shorter girder spacing, the DFs using the LRFD Specifications are
from 1 to 18 percent larger. However, the resulting live moment per beam shows percentage
increases from 49 to 101 percent for LRFD designs, indicating that the effect of the new live load
model on the LRFD live load moments per beam is significant. Results show that the Type IV
beam DFs do not vary as much for the two specifications as was observed for the U54 Beams.
3.4.5 Limit States
Three limit states are considered for LRFD prestressed concrete bridge girder designs:
Service I to check compressive stresses, Service III to check tensile stresses, and Strength I to
check the ultimate flexural moment. The Service III limit state is an addition to the traditional
design limit states included in the Standard Specifications, where allowable stresses at initial and
final load conditions (service) must be satisfied and the ultimate flexural capacity is also
checked. In the Service III limit state, a 0.8 factor is applied to the live load, where the tension
under live load is being investigated with the objective of crack control. This factor was
35
introduced in the LRFD Specifications to help to compensate for the additional live load effect
on the tensile stresses resulting from the use of the HL93 live load model. The statistical
significance of the 0.8 factor on live load for the Service III limit state is that the design event is
expected to occur about once a year for bridges with two traffic lanes, less often for bridges with
more than two traffic lanes, and about once a day for bridges with a single traffic lane.
3.5 TxDOT DESIGN GUIDELINES AND SOFTWARE
TxDOT has in-house design guidelines and software that were referred to during this
study to ensure consistency with current TxDOT practices. This section describes the relevant
documents.
TxDOT has issued its own Bridge Design Manual (TxDOT 2001a) and a Preliminary
Design Guide for U-Beam Bridges (TxDOT 2001b). These documents are intended to promote
consistency in design and details. Supplemental design criteria for prestressed concrete U54
Beams, such as geometric properties, debonded lengths, composite and non-composite dead load
requirements, maximum girder spacings, and maximum recommended span lengths, were taken
from the TxDOT Preliminary Design Guide for U-Beam Bridges. Supplemental design criteria
for the prestressed concrete Type IV beams, such as geometric properties, hold-down points,
harping, and maximum girder spacings, maximum recommended span lengths, were taken from
the TxDOT Bridge Design Manual. Some design parameters for the Type IV beam designs,
such as the composite and non-composite dead load requirements, were considered to be the
same as those for the U54 beam designs in order to compare the designs.
Finally, TxDOT uses the PSTRS14 (prestressed concrete bridge girder design program)
(TxDOT 1980) is used by TxDOT to design and analyze standard I, standard box, and non-
standard beams with either draped or straight (partially debonded) strands. This program has
been updated for design according to the AASHTO Standard Specifications for Highway
Bridges, 16th Edition (AASHTO 1996). Standard double T-beams and standard U-beams may
also be designed and analyzed as non-standard beams.

4 SURVEY OF CURRENT PRACTICE
4.1 INTRODUCTION
A survey entitled “Current Practice for Design of High Strength Concrete Prestressed
Members” was developed and distributed to all 52 state departments of transportation (DOTs)
and to six other organizations involved in the design of bridge structures. The objective of this
survey was to gather information and document critical aspects of current practice for the design
of HSC prestressed bridge girders. Responses from 41 state DOTs and two private organizations
were collected, giving a 74 percent response rate. A copy of the complete questionnaire is
provided in Appendix B.
The questionnaire consists of two parts. Part I: Current Design Practice for HSC
Prestressed Bridge Members contains 11 questions related to current specifications, additional
documents and references, construction using HSC, typical range of specified concrete strengths,
concrete strengths at transfer and at service, concerns related to the use of HSC, and adjustments
of the design specifications for HSC. Part II: Description of Typical Bridges using HSC
Prestressed Bridge Members queries for information on the span lengths and concrete strengths
for each type of bridge in which HSC has been used by the respondents. In the following
sections, tables summarizing the responses are presented.
Table 4.1 provides a list of respondents to the questionnaire. Of the 41 state DOTs that
provided a response, only one did not give permission to identify their organization when
reporting their response. This DOT is identified as “Undisclosed DOT.” The two structural
engineering firms listed are located in the state of Texas and were identified by TxDOT to be
recipients of the survey.
57
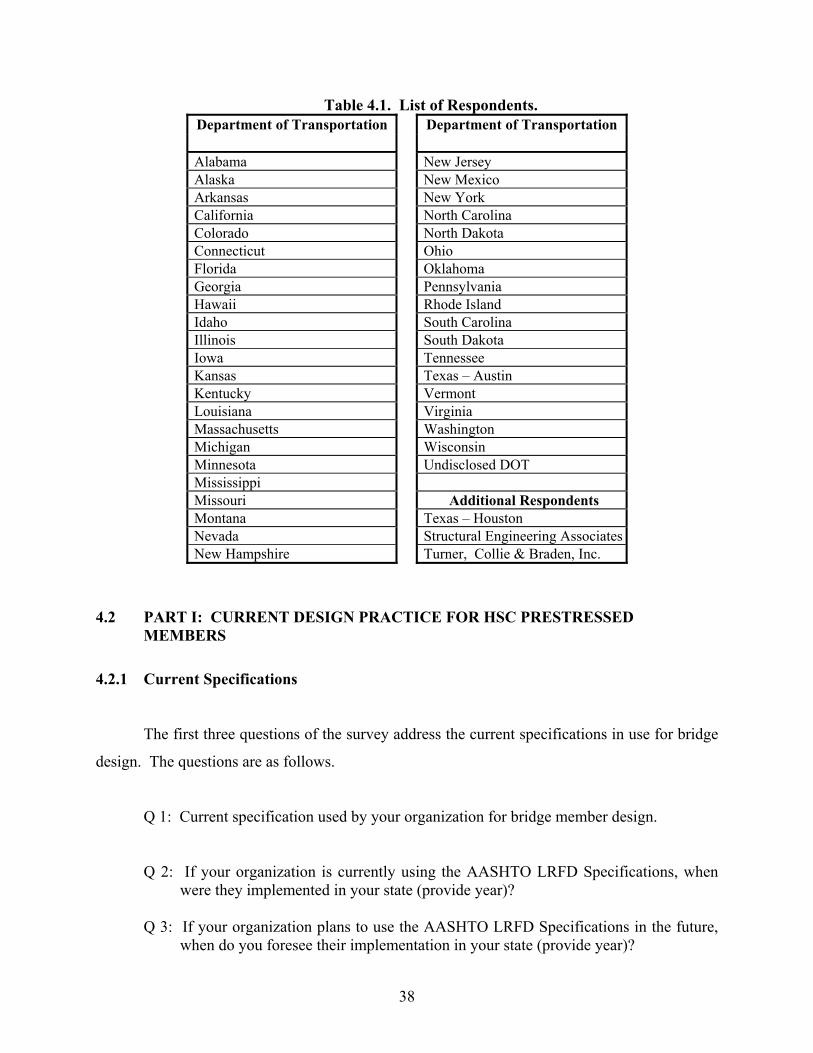
38
Table 4.1. List of Respondents. Department of Transportation Department of Transportation
Alabama New Jersey Alaska New Mexico Arkansas New York California North Carolina Colorado North Dakota Connecticut Ohio Florida Oklahoma Georgia Pennsylvania Hawaii Rhode Island Idaho South Carolina Illinois South Dakota Iowa Tennessee Kansas Texas – Austin Kentucky Vermont Louisiana Virginia Massachusetts Washington Michigan Wisconsin Minnesota Undisclosed DOT Mississippi Missouri Additional Respondents Montana Texas – Houston Nevada Structural Engineering Associates New Hampshire Turner, Collie & Braden, Inc.
4.2 PART I: CURRENT DESIGN PRACTICE FOR HSC PRESTRESSED
MEMBERS
4.2.1 Current Specifications
The first three questions of the survey address the current specifications in use for bridge
design. The questions are as follows.
Q 1: Current specification used by your organization for bridge member design.
Q 2: If your organization is currently using the AASHTO LRFD Specifications, when were they implemented in your state (provide year)?
Q 3: If your organization plans to use the AASHTO LRFD Specifications in the future,
when do you foresee their implementation in your state (provide year)?
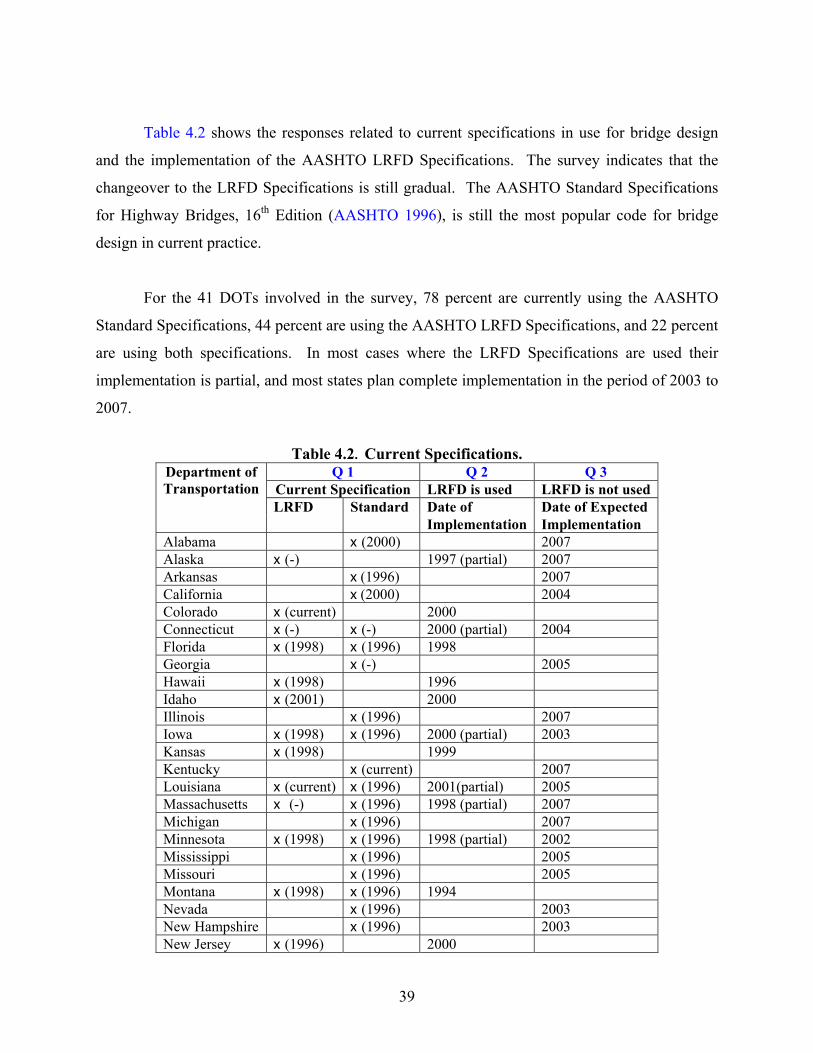
39
Table 4.2 shows the responses related to current specifications in use for bridge design
and the implementation of the AASHTO LRFD Specifications. The survey indicates that the
changeover to the LRFD Specifications is still gradual. The AASHTO Standard Specifications
for Highway Bridges, 16th Edition (AASHTO 1996), is still the most popular code for bridge
design in current practice.
For the 41 DOTs involved in the survey, 78 percent are currently using the AASHTO
Standard Specifications, 44 percent are using the AASHTO LRFD Specifications, and 22 percent
are using both specifications. In most cases where the LRFD Specifications are used their
implementation is partial, and most states plan complete implementation in the period of 2003 to
2007.
Table 4.2. Current Specifications.
Q 1 Q 2 Q 3 Current Specification LRFD is used LRFD is not used LRFD Standard Date of Date of Expected
Department of Transportation
Implementation Implementation Alabama x (2000) 2007 Alaska x (-) 1997 (partial) 2007 Arkansas x (1996) 2007 California x (2000) 2004 Colorado x (current) 2000 Connecticut x (-) x (-) 2000 (partial) 2004 Florida x (1998) x (1996) 1998 Georgia x (-) 2005 Hawaii x (1998) 1996 Idaho x (2001) 2000 Illinois x (1996) 2007 Iowa x (1998) x (1996) 2000 (partial) 2003 Kansas x (1998) 1999 Kentucky x (current) 2007 Louisiana x (current) x (1996) 2001(partial) 2005 Massachusetts x (-) x (1996) 1998 (partial) 2007 Michigan x (1996) 2007 Minnesota x (1998) x (1996) 1998 (partial) 2002 Mississippi x (1996) 2005 Missouri x (1996) 2005 Montana x (1998) x (1996) 1994 Nevada x (1996) 2003 New Hampshire x (1996) 2003 New Jersey x (1996) 2000
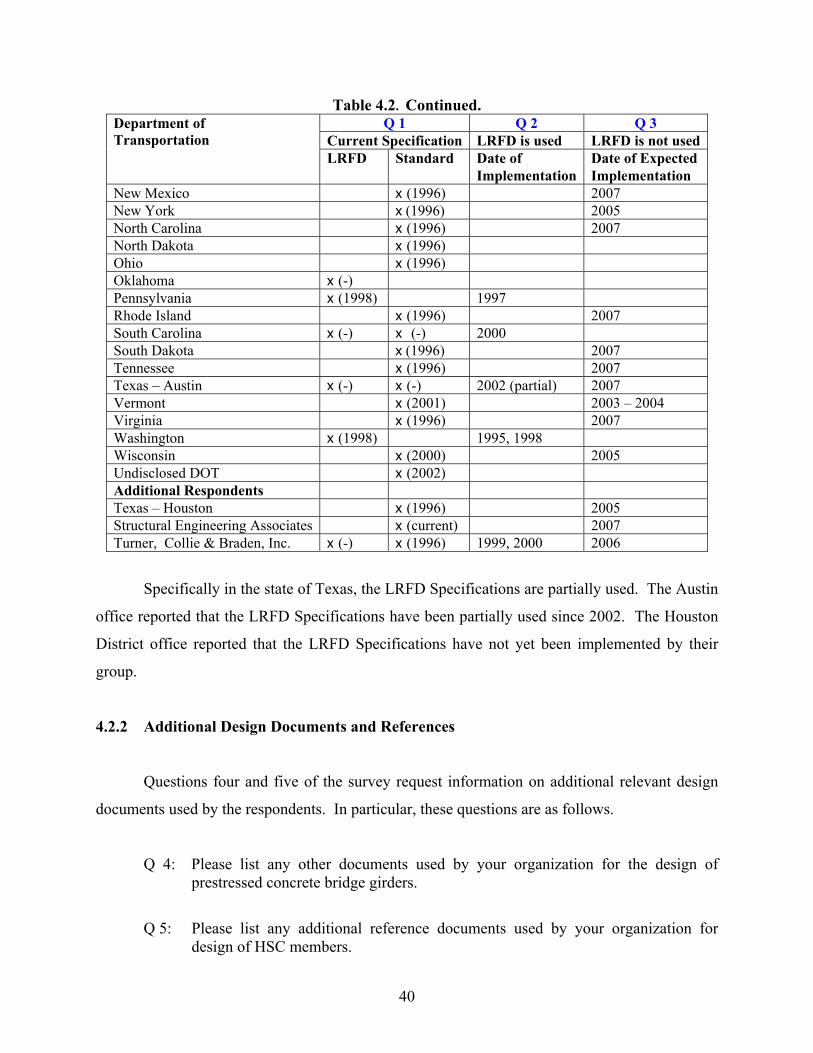
40
Table 4.2. Continued. Q 1 Q 2 Q 3
Current Specification LRFD is used LRFD is not usedLRFD Standard Date of Date of Expected
Department of Transportation
Implementation Implementation New Mexico x (1996) 2007 New York x (1996) 2005 North Carolina x (1996) 2007 North Dakota x (1996) Ohio x (1996) Oklahoma x (-) Pennsylvania x (1998) 1997 Rhode Island x (1996) 2007 South Carolina x (-) x (-) 2000 South Dakota x (1996) 2007 Tennessee x (1996) 2007 Texas – Austin x (-) x (-) 2002 (partial) 2007 Vermont x (2001) 2003 – 2004 Virginia x (1996) 2007 Washington x (1998) 1995, 1998 Wisconsin x (2000) 2005 Undisclosed DOT x (2002) Additional Respondents Texas – Houston x (1996) 2005 Structural Engineering Associates x (current) 2007 Turner, Collie & Braden, Inc. x (-) x (1996) 1999, 2000 2006
Specifically in the state of Texas, the LRFD Specifications are partially used. The Austin
office reported that the LRFD Specifications have been partially used since 2002. The Houston
District office reported that the LRFD Specifications have not yet been implemented by their
group.
4.2.2 Additional Design Documents and References
Questions four and five of the survey request information on additional relevant design
documents used by the respondents. In particular, these questions are as follows.
Q 4: Please list any other documents used by your organization for the design of prestressed concrete bridge girders.
Q 5: Please list any additional reference documents used by your organization for design of HSC members.
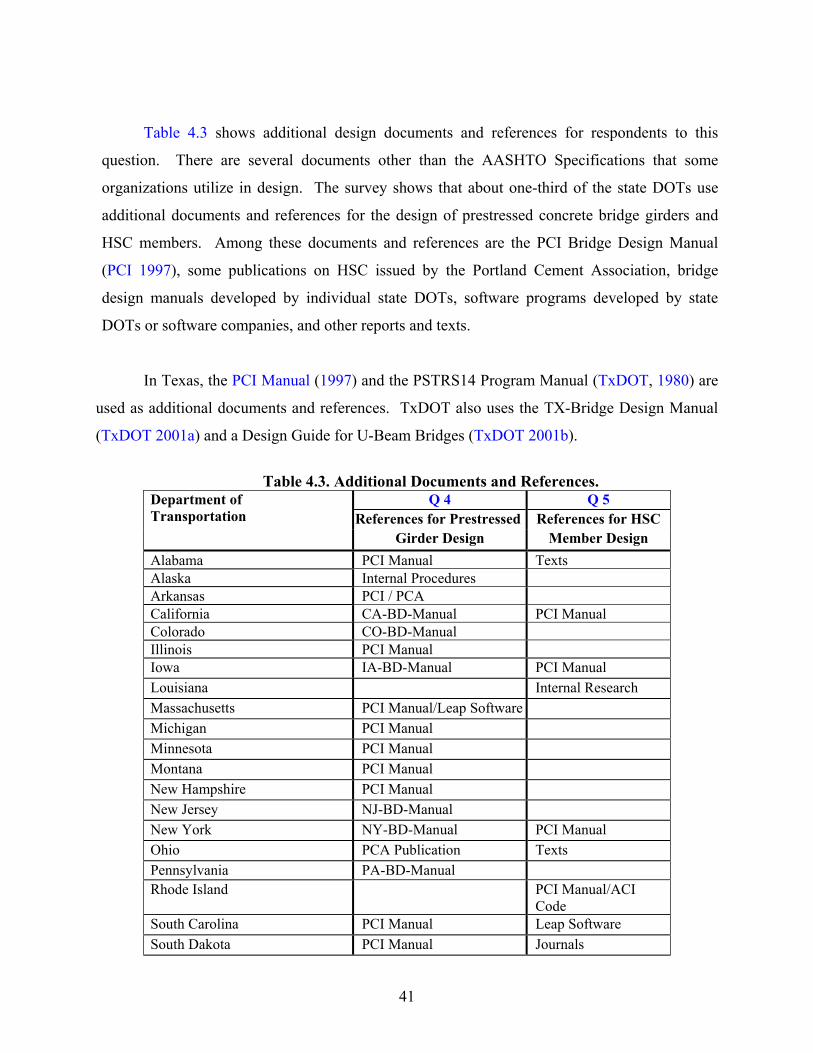
41
Table 4.3 shows additional design documents and references for respondents to this
question. There are several documents other than the AASHTO Specifications that some
organizations utilize in design. The survey shows that about one-third of the state DOTs use
additional documents and references for the design of prestressed concrete bridge girders and
HSC members. Among these documents and references are the PCI Bridge Design Manual
(PCI 1997), some publications on HSC issued by the Portland Cement Association, bridge
design manuals developed by individual state DOTs, software programs developed by state
DOTs or software companies, and other reports and texts.
In Texas, the PCI Manual (1997) and the PSTRS14 Program Manual (TxDOT, 1980) are
used as additional documents and references. TxDOT also uses the TX-Bridge Design Manual
(TxDOT 2001a) and a Design Guide for U-Beam Bridges (TxDOT 2001b).
Table 4.3. Additional Documents and References.
Q 4 Q 5 References for Prestressed References for HSC
Department of Transportation
Girder Design Member Design Alabama PCI Manual Texts Alaska Internal Procedures Arkansas PCI / PCA California CA-BD-Manual PCI Manual Colorado CO-BD-Manual Illinois PCI Manual Iowa IA-BD-Manual PCI Manual Louisiana Internal Research Massachusetts PCI Manual/Leap Software Michigan PCI Manual Minnesota PCI Manual Montana PCI Manual New Hampshire PCI Manual New Jersey NJ-BD-Manual New York NY-BD-Manual PCI Manual Ohio PCA Publication Texts Pennsylvania PA-BD-Manual Rhode Island PCI Manual/ACI
Code South Carolina PCI Manual Leap Software South Dakota PCI Manual Journals

42
Table 4.3. Continued. Q 4 Q 5
References for Prestressed References for HSC Department of Transportation
Girder Design Member Design Texas – Austin PCI / PRSTRS14 Manuals Vermont PCI Manual Virginia ACI Code Washington WS-BD-Manual PCI-BD Manual
Additional Respondents Texas - Houston Structural Engineering Associates TX-BD Manual Turner, Collie & Braden, Inc. PRSTRS14 - Ubeam guide
Note: BD Manual = Bridge Design Manual
4.2.3 HSC Prestressed Bridge Girder Precasters
Precasters names and locations were surveyed in question six, as follows.
Q 6: Please provide the names and locations of precasters that supply HSC prestressed girders for your bridge projects.
Table B.1 in Appendix B shows the name and locations of precasters that supply HSC
prestressed girders for each DOT. A total of 35 state DOTs and two organizations responded to
this question. The number of precasters that supply HSC prestressed girders used by each state
DOT and their corresponding locations by states are also shown in Table B.1. The survey shows
that a DOT may be served by one to as many as seven precasters. For example, five precasters
supply Florida and Iowa, six precasters supply Massachusetts, and seven precasters serve North
Carolina and Texas. Precasters serving a state DOT are not always located in the same state. For
example, Florida has five precasters supplying HSC prestressed girders, of which two are located
in other states (Mississippi and Georgia). Another example is Massachusetts where, from its six
suppliers, four are located in four different states including Connecticut, Vermont, New York,
and Nebraska.
Table B.2 in Appendix B provides a list of precasters and their different locations, as well
as the different states each precaster serves. Some HSC precasters not only supply to their own
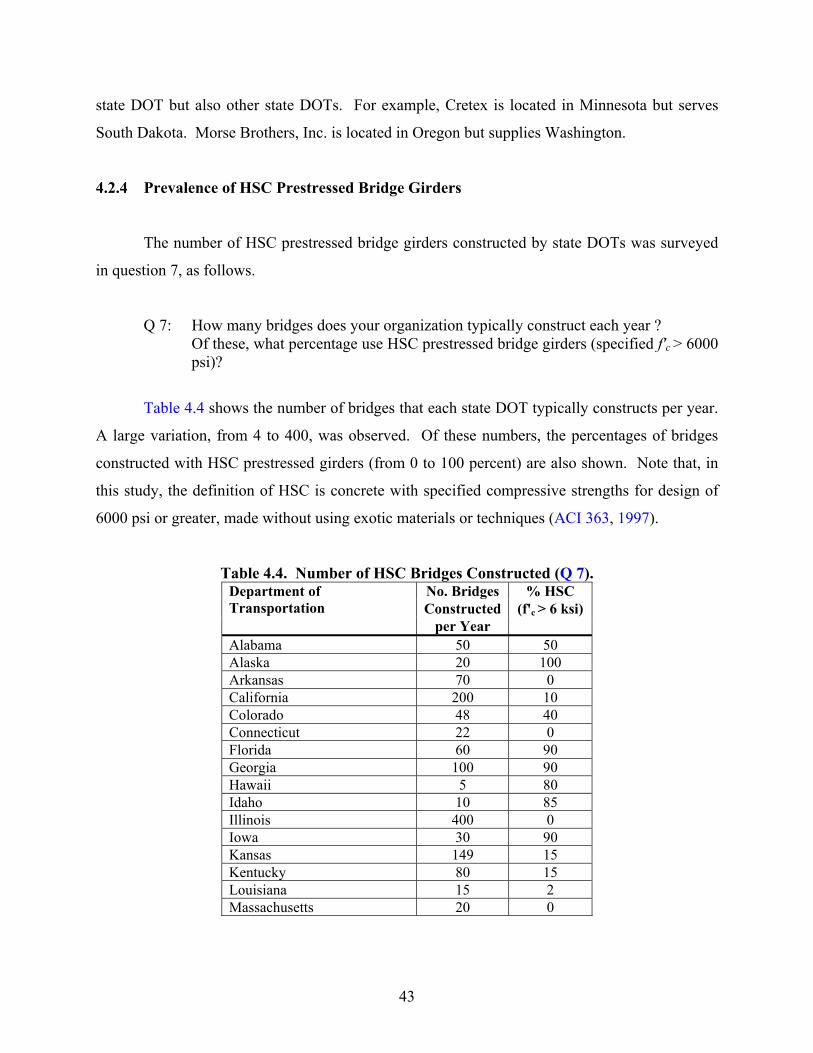
43
state DOT but also other state DOTs. For example, Cretex is located in Minnesota but serves
South Dakota. Morse Brothers, Inc. is located in Oregon but supplies Washington.
4.2.4 Prevalence of HSC Prestressed Bridge Girders
The number of HSC prestressed bridge girders constructed by state DOTs was surveyed
in question 7, as follows.
Q 7: How many bridges does your organization typically construct each year ? Of these, what percentage use HSC prestressed bridge girders (specified f'c > 6000
psi)?
Table 4.4 shows the number of bridges that each state DOT typically constructs per year.
A large variation, from 4 to 400, was observed. Of these numbers, the percentages of bridges
constructed with HSC prestressed girders (from 0 to 100 percent) are also shown. Note that, in
this study, the definition of HSC is concrete with specified compressive strengths for design of
6000 psi or greater, made without using exotic materials or techniques (ACI 363, 1997).
Table 4.4. Number of HSC Bridges Constructed (Q 7). No. Bridges % HSC Constructed (f'c > 6 ksi)
Department of Transportation
per Year Alabama 50 50 Alaska 20 100 Arkansas 70 0 California 200 10 Colorado 48 40 Connecticut 22 0 Florida 60 90 Georgia 100 90 Hawaii 5 80 Idaho 10 85 Illinois 400 0 Iowa 30 90 Kansas 149 15 Kentucky 80 15 Louisiana 15 2 Massachusetts 20 0
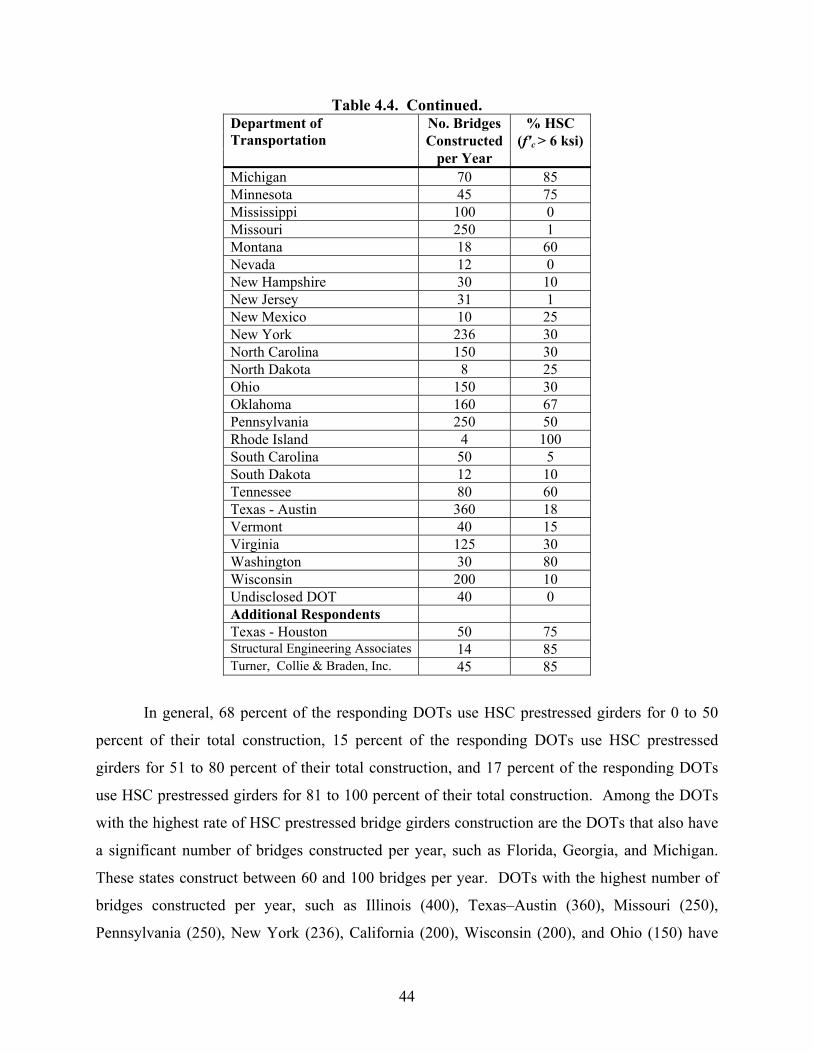
44
Table 4.4. Continued. No. Bridges % HSC Constructed (f'c > 6 ksi)
Department of Transportation
per Year Michigan 70 85 Minnesota 45 75 Mississippi 100 0 Missouri 250 1 Montana 18 60 Nevada 12 0 New Hampshire 30 10 New Jersey 31 1 New Mexico 10 25 New York 236 30 North Carolina 150 30 North Dakota 8 25 Ohio 150 30 Oklahoma 160 67 Pennsylvania 250 50 Rhode Island 4 100 South Carolina 50 5 South Dakota 12 10 Tennessee 80 60 Texas - Austin 360 18 Vermont 40 15 Virginia 125 30 Washington 30 80 Wisconsin 200 10 Undisclosed DOT 40 0 Additional Respondents Texas - Houston 50 75 Structural Engineering Associates 14 85 Turner, Collie & Braden, Inc. 45 85
In general, 68 percent of the responding DOTs use HSC prestressed girders for 0 to 50
percent of their total construction, 15 percent of the responding DOTs use HSC prestressed
girders for 51 to 80 percent of their total construction, and 17 percent of the responding DOTs
use HSC prestressed girders for 81 to 100 percent of their total construction. Among the DOTs
with the highest rate of HSC prestressed bridge girders construction are the DOTs that also have
a significant number of bridges constructed per year, such as Florida, Georgia, and Michigan.
These states construct between 60 and 100 bridges per year. DOTs with the highest number of
bridges constructed per year, such as Illinois (400), Texas–Austin (360), Missouri (250),
Pennsylvania (250), New York (236), California (200), Wisconsin (200), and Ohio (150) have
45
the lowest percentage of construction using HSC. For example, in Illinois, of 400 bridges built,
no bridges were constructed using HSC.
In Texas, which constructs the second largest number of bridges per year (360), only 18
percent of the total construction utilized HSC prestressed girders, as reported by the Austin
office. However, this does result in an important number of bridges using HSC prestressed
girders in Texas. In TxDOT’s Houston office, 75 percent of the total number of bridges
constructed per year (50) would also be considered as an important number of bridges using
HSC. Consequently, the use of HSC prestressed bridge girders in Texas is significant.
4.2.5 Specified Concrete Strength
Question eight of the survey focused on determining the range of the specified concrete
strength for prestressed concrete bridge girders. The question is as follows.
Q 8: Please provide the typical range of specified strength for prestressed concrete bridge girders used in current projects for your organization?
Table 4.5 shows typical ranges for specified concrete strength at transfer and service
conditions for current projects. The required concrete strength at transfer ranges from 3500 to
9000 psi, while the required concrete strength at service ranges from 4000 to 12000 psi.
Particularly, a typical range from 4000 to 6500 psi for f'ci and from 5000 to 8500 psi for f'c at
service were reported by TxDOT’s Austin office. A typical range from 4000 to 6200 psi for f'ci
and from 5000 to 8500 psi for f'c at service was reported by TxDOT’s Houston District office.
The Austin office reported designs for longer spans that required f'c up to 14000 psi (this strength
was not reported as a typical value).
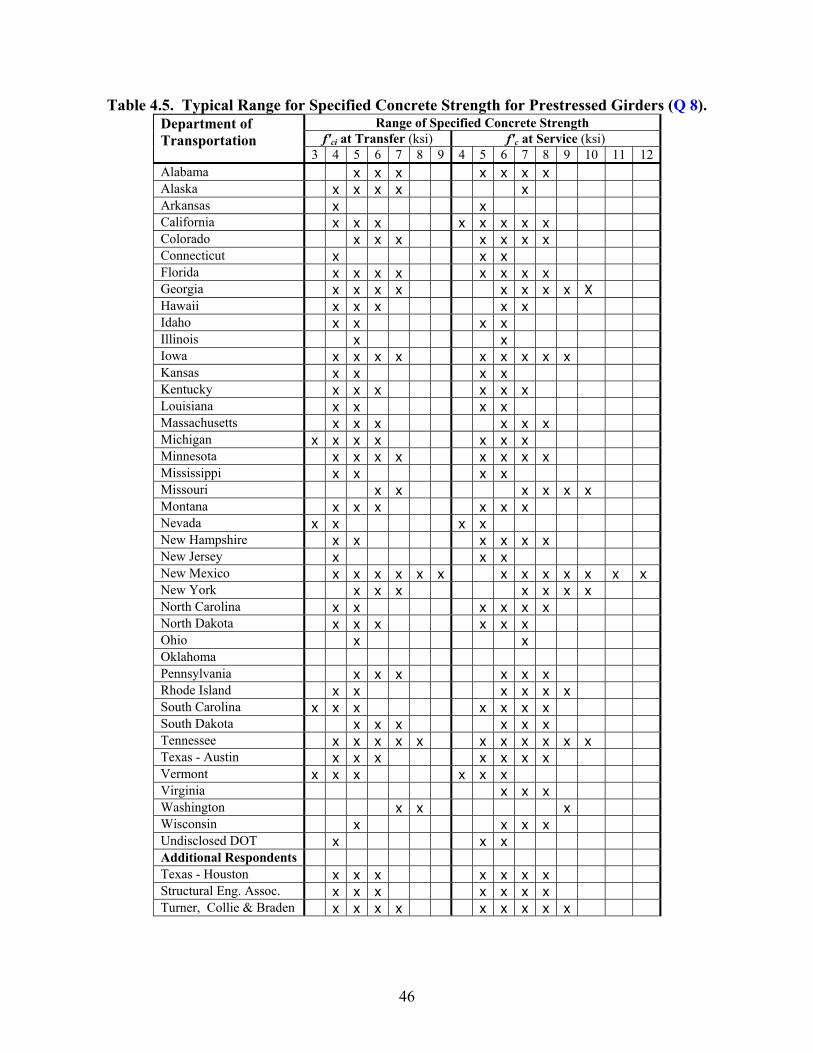
46
Table 4.5. Typical Range for Specified Concrete Strength for Prestressed Girders (Q 8). Range of Specified Concrete Strength
f'ci at Transfer (ksi) f'c at Service (ksi) Department of Transportation
3 4 5 6 7 8 9 4 5 6 7 8 9 10 11 12 Alabama x x x x x x x Alaska x x x x x Arkansas x x California x x x x x x x x Colorado x x x x x x x Connecticut x x x Florida x x x x x x x x Georgia x x x x x x x x X Hawaii x x x x x Idaho x x x x Illinois x x Iowa x x x x x x x x x Kansas x x x x Kentucky x x x x x x Louisiana x x x x Massachusetts x x x x x x Michigan x x x x x x x Minnesota x x x x x x x x Mississippi x x x x Missouri x x x x x x Montana x x x x x x Nevada x x x x New Hampshire x x x x x x New Jersey x x x New Mexico x x x x x x x x x x x x x New York x x x x x x x North Carolina x x x x x x North Dakota x x x x x x Ohio x x Oklahoma Pennsylvania x x x x x x Rhode Island x x x x x x South Carolina x x x x x x x South Dakota x x x x x x Tennessee x x x x x x x x x x x Texas - Austin x x x x x x x Vermont x x x x x x Virginia x x x Washington x x x Wisconsin x x x x Undisclosed DOT x x x Additional Respondents Texas - Houston x x x x x x x Structural Eng. Assoc. x x x x x x x Turner, Collie & Braden x x x x x x x x x
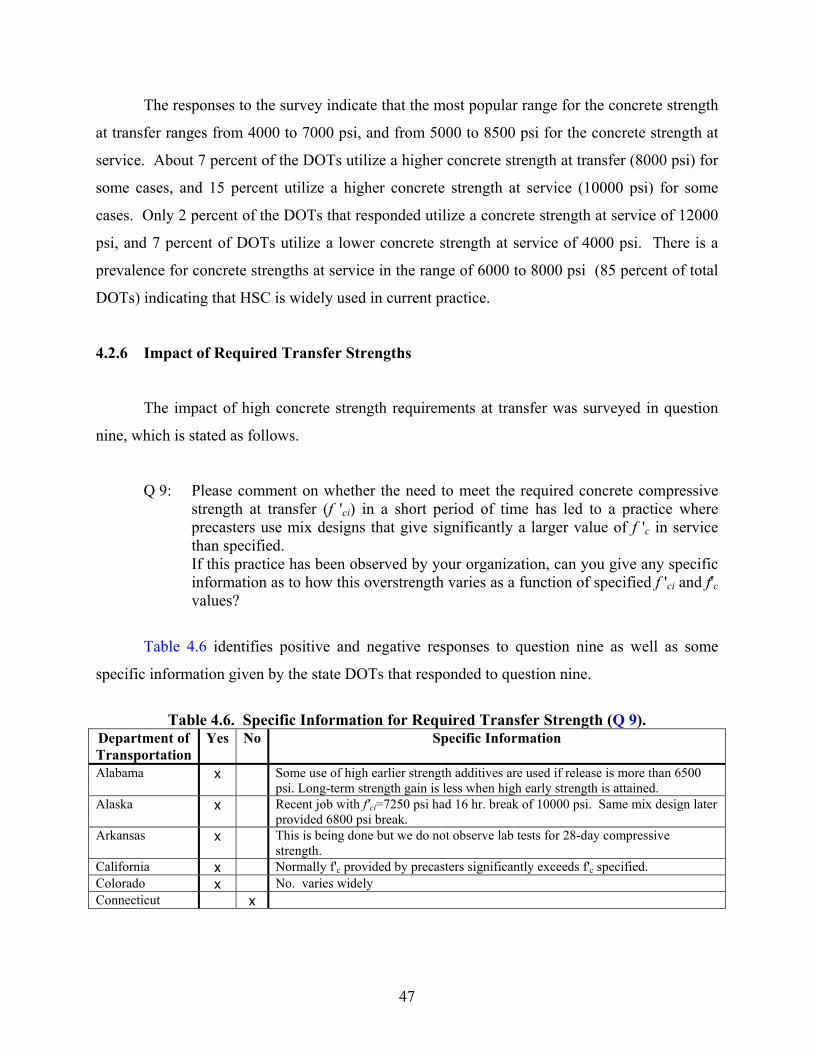
47
The responses to the survey indicate that the most popular range for the concrete strength
at transfer ranges from 4000 to 7000 psi, and from 5000 to 8500 psi for the concrete strength at
service. About 7 percent of the DOTs utilize a higher concrete strength at transfer (8000 psi) for
some cases, and 15 percent utilize a higher concrete strength at service (10000 psi) for some
cases. Only 2 percent of the DOTs that responded utilize a concrete strength at service of 12000
psi, and 7 percent of DOTs utilize a lower concrete strength at service of 4000 psi. There is a
prevalence for concrete strengths at service in the range of 6000 to 8000 psi (85 percent of total
DOTs) indicating that HSC is widely used in current practice.
4.2.6 Impact of Required Transfer Strengths
The impact of high concrete strength requirements at transfer was surveyed in question
nine, which is stated as follows.
Q 9: Please comment on whether the need to meet the required concrete compressive strength at transfer (f 'ci) in a short period of time has led to a practice where precasters use mix designs that give significantly a larger value of f 'c in service than specified.
If this practice has been observed by your organization, can you give any specific information as to how this overstrength varies as a function of specified f 'ci and f'c values?
Table 4.6 identifies positive and negative responses to question nine as well as some
specific information given by the state DOTs that responded to question nine.
Table 4.6. Specific Information for Required Transfer Strength (Q 9).
Department of Transportation
Yes No Specific Information
Alabama x Some use of high earlier strength additives are used if release is more than 6500 psi. Long-term strength gain is less when high early strength is attained.
Alaska x Recent job with f'ci=7250 psi had 16 hr. break of 10000 psi. Same mix design later provided 6800 psi break.
Arkansas x This is being done but we do not observe lab tests for 28-day compressive strength.
California x Normally f'c provided by precasters significantly exceeds f'c specified. Colorado x No. varies widely Connecticut x
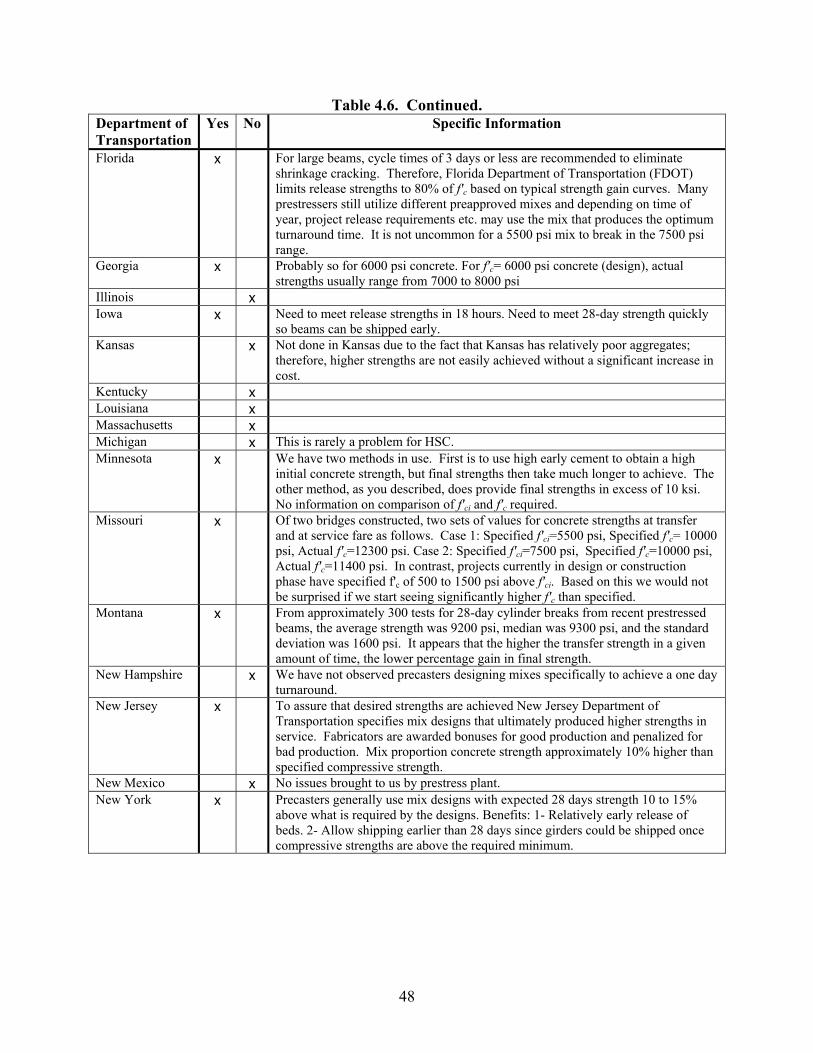
48
Table 4.6. Continued. Department of Transportation
Yes No Specific Information
Florida x For large beams, cycle times of 3 days or less are recommended to eliminate shrinkage cracking. Therefore, Florida Department of Transportation (FDOT) limits release strengths to 80% of f'c based on typical strength gain curves. Many prestressers still utilize different preapproved mixes and depending on time of year, project release requirements etc. may use the mix that produces the optimum turnaround time. It is not uncommon for a 5500 psi mix to break in the 7500 psi range.
Georgia x Probably so for 6000 psi concrete. For f'c= 6000 psi concrete (design), actual strengths usually range from 7000 to 8000 psi
Illinois x Iowa x Need to meet release strengths in 18 hours. Need to meet 28-day strength quickly
so beams can be shipped early. Kansas x Not done in Kansas due to the fact that Kansas has relatively poor aggregates;
therefore, higher strengths are not easily achieved without a significant increase in cost.
Kentucky x Louisiana x Massachusetts x Michigan x This is rarely a problem for HSC. Minnesota x We have two methods in use. First is to use high early cement to obtain a high
initial concrete strength, but final strengths then take much longer to achieve. The other method, as you described, does provide final strengths in excess of 10 ksi. No information on comparison of f'ci and f'c required.
Missouri x Of two bridges constructed, two sets of values for concrete strengths at transfer and at service fare as follows. Case 1: Specified f'ci=5500 psi, Specified f'c= 10000 psi, Actual f'c=12300 psi. Case 2: Specified f'ci=7500 psi, Specified f'c=10000 psi, Actual f'c=11400 psi. In contrast, projects currently in design or construction phase have specified f'c of 500 to 1500 psi above f'ci. Based on this we would not be surprised if we start seeing significantly higher f'c than specified.
Montana x From approximately 300 tests for 28-day cylinder breaks from recent prestressed beams, the average strength was 9200 psi, median was 9300 psi, and the standard deviation was 1600 psi. It appears that the higher the transfer strength in a given amount of time, the lower percentage gain in final strength.
New Hampshire x We have not observed precasters designing mixes specifically to achieve a one day turnaround.
New Jersey x To assure that desired strengths are achieved New Jersey Department of Transportation specifies mix designs that ultimately produced higher strengths in service. Fabricators are awarded bonuses for good production and penalized for bad production. Mix proportion concrete strength approximately 10% higher than specified compressive strength.
New Mexico x No issues brought to us by prestress plant. New York x Precasters generally use mix designs with expected 28 days strength 10 to 15%
above what is required by the designs. Benefits: 1- Relatively early release of beds. 2- Allow shipping earlier than 28 days since girders could be shipped once compressive strengths are above the required minimum.
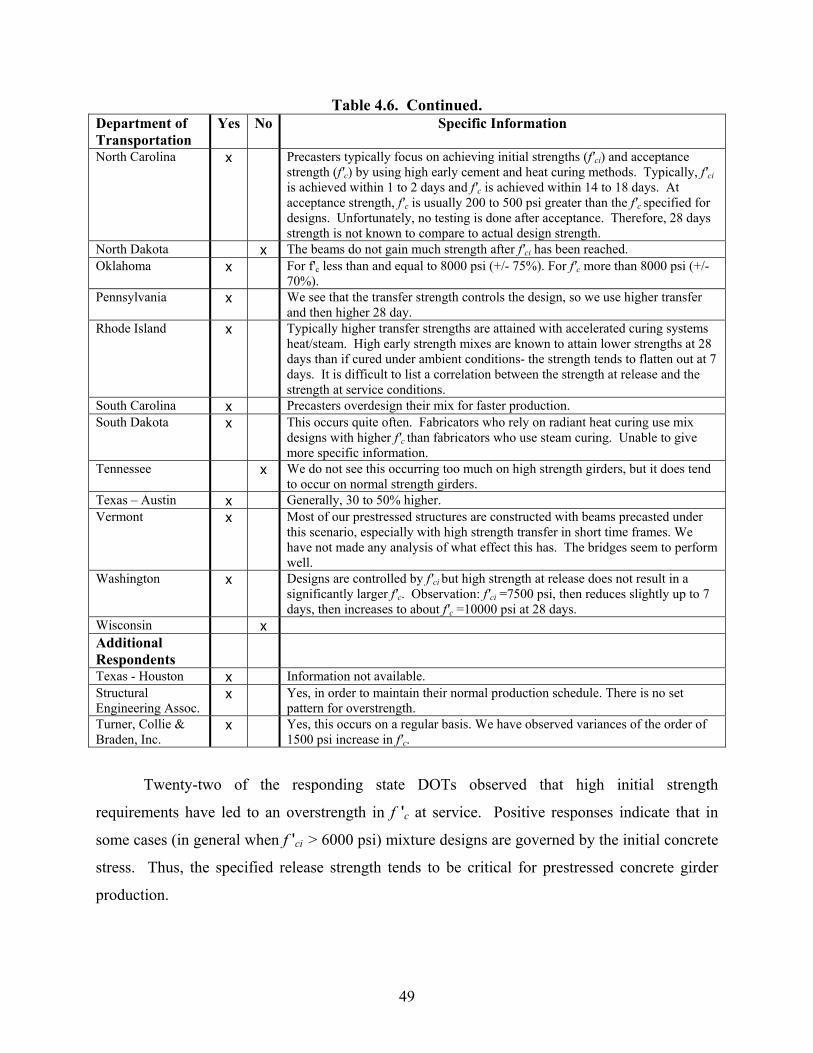
49
Table 4.6. Continued. Department of Transportation
Yes No Specific Information
North Carolina x Precasters typically focus on achieving initial strengths (f'ci) and acceptance strength (f'c) by using high early cement and heat curing methods. Typically, f'ci is achieved within 1 to 2 days and f'c is achieved within 14 to 18 days. At acceptance strength, f'c is usually 200 to 500 psi greater than the f'c specified for designs. Unfortunately, no testing is done after acceptance. Therefore, 28 days strength is not known to compare to actual design strength.
North Dakota x The beams do not gain much strength after f'ci has been reached. Oklahoma x For f'c less than and equal to 8000 psi (+/- 75%). For f'c more than 8000 psi (+/-
70%). Pennsylvania x We see that the transfer strength controls the design, so we use higher transfer
and then higher 28 day. Rhode Island x Typically higher transfer strengths are attained with accelerated curing systems
heat/steam. High early strength mixes are known to attain lower strengths at 28 days than if cured under ambient conditions- the strength tends to flatten out at 7 days. It is difficult to list a correlation between the strength at release and the strength at service conditions.
South Carolina x Precasters overdesign their mix for faster production. South Dakota x This occurs quite often. Fabricators who rely on radiant heat curing use mix
designs with higher f'c than fabricators who use steam curing. Unable to give more specific information.
Tennessee x We do not see this occurring too much on high strength girders, but it does tend to occur on normal strength girders.
Texas – Austin x Generally, 30 to 50% higher. Vermont x Most of our prestressed structures are constructed with beams precasted under
this scenario, especially with high strength transfer in short time frames. We have not made any analysis of what effect this has. The bridges seem to perform well.
Washington x Designs are controlled by f'ci but high strength at release does not result in a significantly larger f'c. Observation: f'ci =7500 psi, then reduces slightly up to 7 days, then increases to about f'c =10000 psi at 28 days.
Wisconsin x Additional Respondents
Texas - Houston x Information not available. Structural Engineering Assoc.
x Yes, in order to maintain their normal production schedule. There is no set pattern for overstrength.
Turner, Collie & Braden, Inc.
x Yes, this occurs on a regular basis. We have observed variances of the order of 1500 psi increase in f'c.
Twenty-two of the responding state DOTs observed that high initial strength
requirements have led to an overstrength in f 'c at service. Positive responses indicate that in
some cases (in general when f 'ci > 6000 psi) mixture designs are governed by the initial concrete
stress. Thus, the specified release strength tends to be critical for prestressed concrete girder
production.
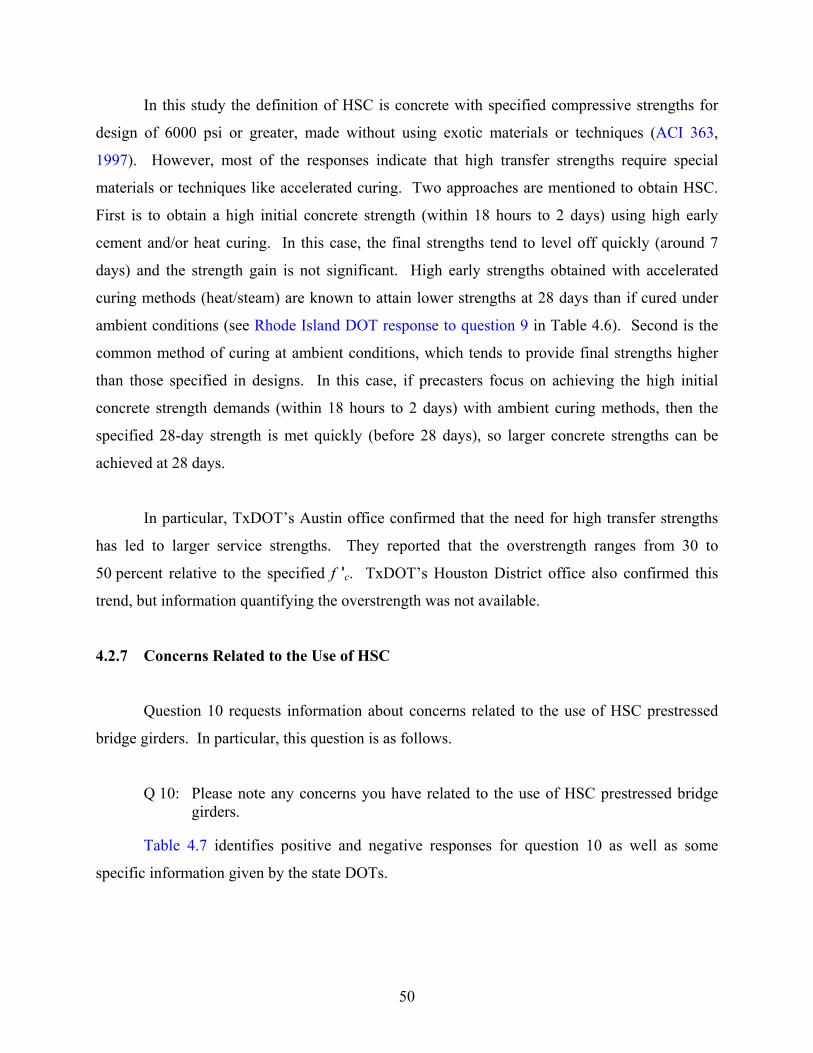
50
In this study the definition of HSC is concrete with specified compressive strengths for
design of 6000 psi or greater, made without using exotic materials or techniques (ACI 363,
1997). However, most of the responses indicate that high transfer strengths require special
materials or techniques like accelerated curing. Two approaches are mentioned to obtain HSC.
First is to obtain a high initial concrete strength (within 18 hours to 2 days) using high early
cement and/or heat curing. In this case, the final strengths tend to level off quickly (around 7
days) and the strength gain is not significant. High early strengths obtained with accelerated
curing methods (heat/steam) are known to attain lower strengths at 28 days than if cured under
ambient conditions (see Rhode Island DOT response to question 9 in Table 4.6). Second is the
common method of curing at ambient conditions, which tends to provide final strengths higher
than those specified in designs. In this case, if precasters focus on achieving the high initial
concrete strength demands (within 18 hours to 2 days) with ambient curing methods, then the
specified 28-day strength is met quickly (before 28 days), so larger concrete strengths can be
achieved at 28 days.
In particular, TxDOT’s Austin office confirmed that the need for high transfer strengths
has led to larger service strengths. They reported that the overstrength ranges from 30 to
50 percent relative to the specified f 'c. TxDOT’s Houston District office also confirmed this
trend, but information quantifying the overstrength was not available.
4.2.7 Concerns Related to the Use of HSC
Question 10 requests information about concerns related to the use of HSC prestressed
bridge girders. In particular, this question is as follows.
Q 10: Please note any concerns you have related to the use of HSC prestressed bridge girders.
Table 4.7 identifies positive and negative responses for question 10 as well as some
specific information given by the state DOTs.
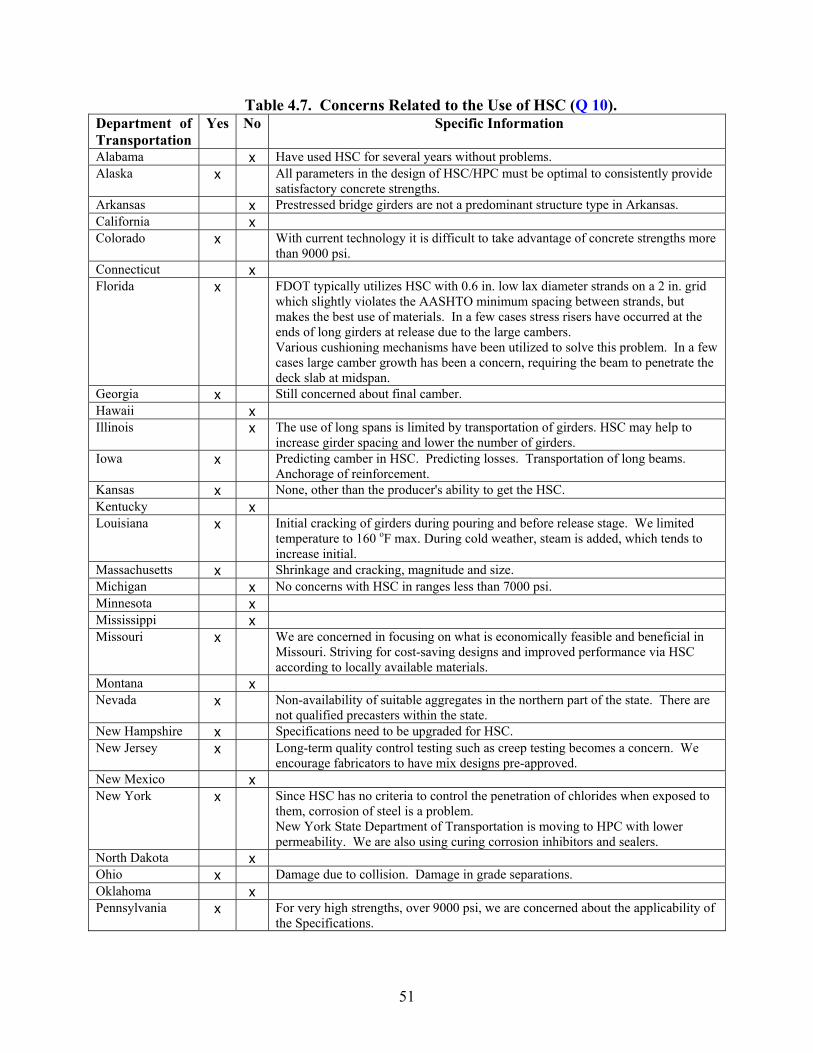
51
Table 4.7. Concerns Related to the Use of HSC (Q 10). Department of Transportation
Yes No Specific Information
Alabama x Have used HSC for several years without problems. Alaska x All parameters in the design of HSC/HPC must be optimal to consistently provide
satisfactory concrete strengths. Arkansas x Prestressed bridge girders are not a predominant structure type in Arkansas. California x Colorado x With current technology it is difficult to take advantage of concrete strengths more
than 9000 psi. Connecticut x Florida x FDOT typically utilizes HSC with 0.6 in. low lax diameter strands on a 2 in. grid
which slightly violates the AASHTO minimum spacing between strands, but makes the best use of materials. In a few cases stress risers have occurred at the ends of long girders at release due to the large cambers. Various cushioning mechanisms have been utilized to solve this problem. In a few cases large camber growth has been a concern, requiring the beam to penetrate the deck slab at midspan.
Georgia x Still concerned about final camber. Hawaii x Illinois x The use of long spans is limited by transportation of girders. HSC may help to
increase girder spacing and lower the number of girders. Iowa x Predicting camber in HSC. Predicting losses. Transportation of long beams.
Anchorage of reinforcement. Kansas x None, other than the producer's ability to get the HSC. Kentucky x Louisiana x Initial cracking of girders during pouring and before release stage. We limited
temperature to 160 oF max. During cold weather, steam is added, which tends to increase initial.
Massachusetts x Shrinkage and cracking, magnitude and size. Michigan x No concerns with HSC in ranges less than 7000 psi. Minnesota x Mississippi x Missouri x We are concerned in focusing on what is economically feasible and beneficial in
Missouri. Striving for cost-saving designs and improved performance via HSC according to locally available materials.
Montana x Nevada x Non-availability of suitable aggregates in the northern part of the state. There are
not qualified precasters within the state. New Hampshire x Specifications need to be upgraded for HSC. New Jersey x Long-term quality control testing such as creep testing becomes a concern. We
encourage fabricators to have mix designs pre-approved. New Mexico x New York x Since HSC has no criteria to control the penetration of chlorides when exposed to
them, corrosion of steel is a problem. New York State Department of Transportation is moving to HPC with lower permeability. We are also using curing corrosion inhibitors and sealers.
North Dakota x Ohio x Damage due to collision. Damage in grade separations. Oklahoma x Pennsylvania x For very high strengths, over 9000 psi, we are concerned about the applicability of
the Specifications.
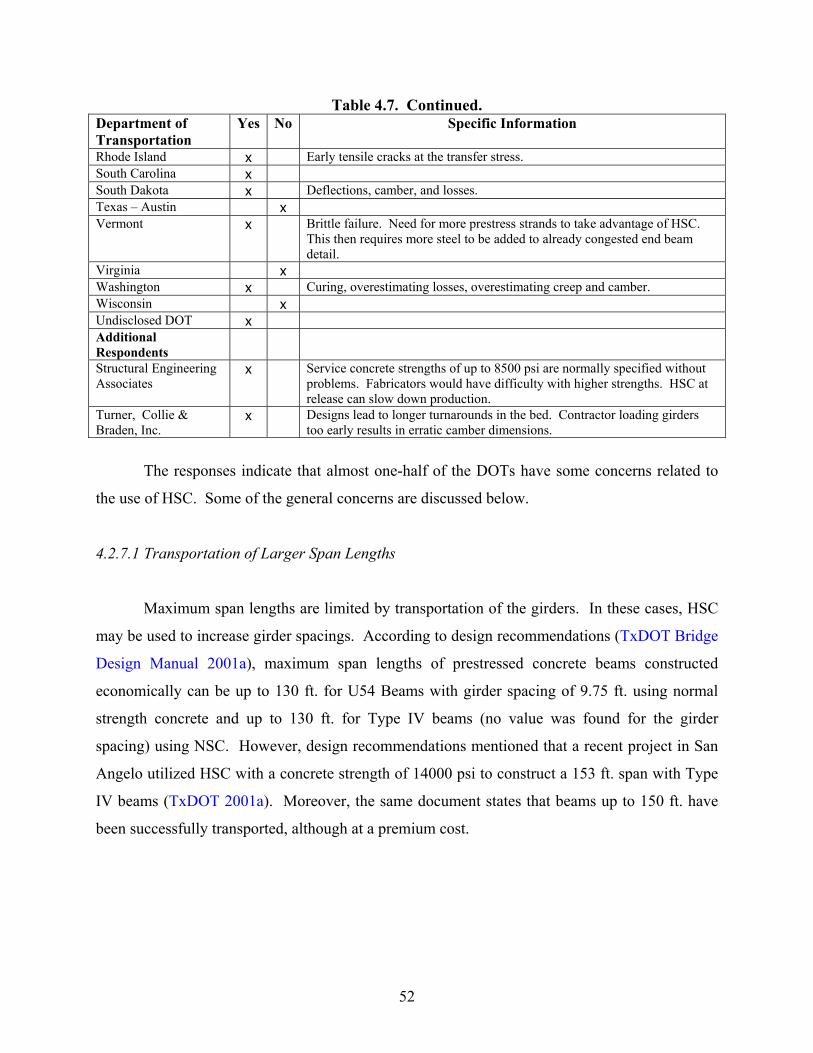
52
Table 4.7. Continued. Department of Transportation
Yes No Specific Information
Rhode Island x Early tensile cracks at the transfer stress. South Carolina x South Dakota x Deflections, camber, and losses. Texas – Austin x Vermont x Brittle failure. Need for more prestress strands to take advantage of HSC.
This then requires more steel to be added to already congested end beam detail.
Virginia x Washington x Curing, overestimating losses, overestimating creep and camber. Wisconsin x Undisclosed DOT x Additional Respondents
Structural Engineering Associates
x Service concrete strengths of up to 8500 psi are normally specified without problems. Fabricators would have difficulty with higher strengths. HSC at release can slow down production.
Turner, Collie & Braden, Inc.
x Designs lead to longer turnarounds in the bed. Contractor loading girders too early results in erratic camber dimensions.
The responses indicate that almost one-half of the DOTs have some concerns related to
the use of HSC. Some of the general concerns are discussed below.
4.2.7.1 Transportation of Larger Span Lengths
Maximum span lengths are limited by transportation of the girders. In these cases, HSC
may be used to increase girder spacings. According to design recommendations (TxDOT Bridge
Design Manual 2001a), maximum span lengths of prestressed concrete beams constructed
economically can be up to 130 ft. for U54 Beams with girder spacing of 9.75 ft. using normal
strength concrete and up to 130 ft. for Type IV beams (no value was found for the girder
spacing) using NSC. However, design recommendations mentioned that a recent project in San
Angelo utilized HSC with a concrete strength of 14000 psi to construct a 153 ft. span with Type
IV beams (TxDOT 2001a). Moreover, the same document states that beams up to 150 ft. have
been successfully transported, although at a premium cost.
53
4.2.7.2 Design Parameters for HSC
Design parameters in the AASHTO Specifications need to be upgraded for HSC of more
than approximately 8500 psi. Several DOTs are reluctant to specify concrete compressive
strengths at service (f'c) higher than 8500 psi. The survey showed that the most popular range for
the concrete strength at transfer (f'ci) ranges from 4000 to 7000 psi, and at service typical f'c
values range from 5000 to 8500 psi. However, 15 percent of the DOTs utilize a higher concrete
strength at service (10000 psi) for some cases, and 2 percent of the DOTs utilize a concrete
strength at service of 12000 psi. The design equations in the AASHTO codes for prestressed
concrete members are based on mechanical properties of NSC of 6000 psi or less. Information
about the mechanical properties for HSC produced by Texas precasters can be found in Hueste et
al. (2002 a,b).
4.2.7.3 Cracking
Initial cracking of girders during pouring and before the release stage is a concern.
TxDOT practice indicates that cracking at release is not a problem since transfer is a temporary
condition. Also, TxDOT engineers have provided input that this is not a major concern because
if a crack occurs in the top of the beam at the end regions, it will close when the concrete slab is
poured. More information on stress limits at transfer is available in Section 5.3.4.
4.2.7.4 Additional Concerns
Additional concerns include difficulties in providing 0.6 in. diameter strands at the proper
spacing for some standard girder configurations. Also, research is needed to address critical
issues, such as overestimation of losses and determination of creep, shrinkage, and camber for
HSC. In some areas, suitable aggregates are not available, and in some cases, there are no
qualified precasters to produce HSC prestressed girders.
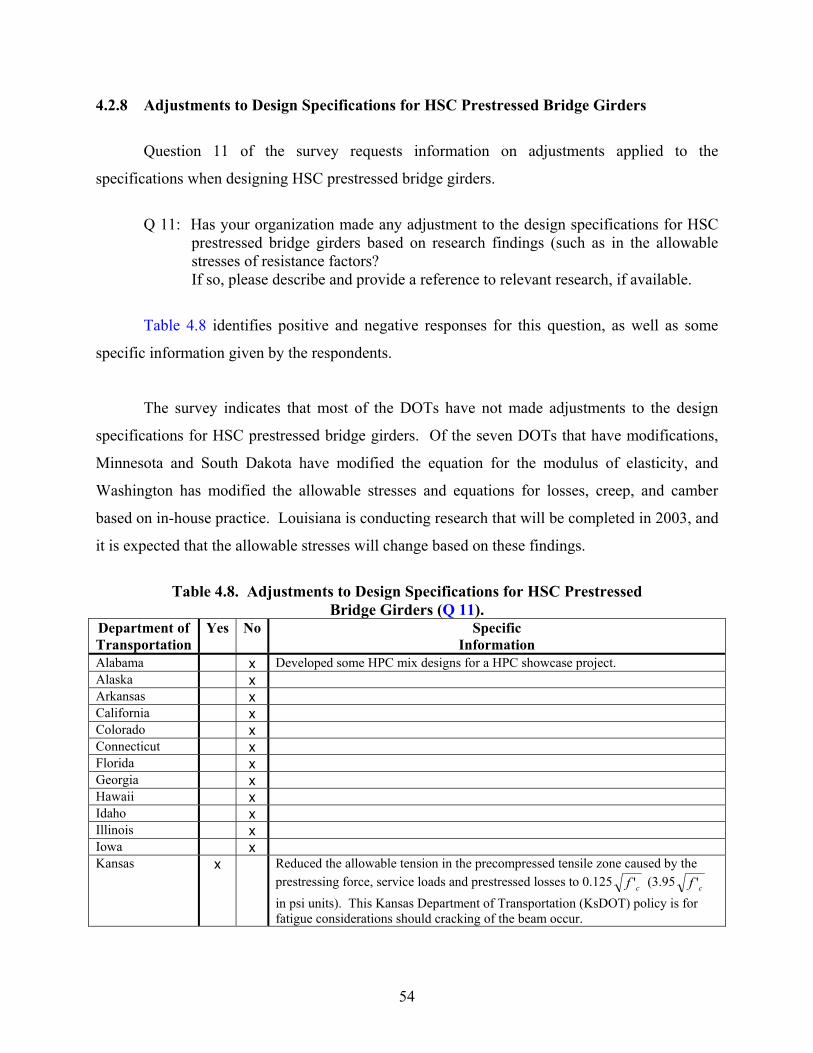
54
4.2.8 Adjustments to Design Specifications for HSC Prestressed Bridge Girders
Question 11 of the survey requests information on adjustments applied to the
specifications when designing HSC prestressed bridge girders.
Q 11: Has your organization made any adjustment to the design specifications for HSC
prestressed bridge girders based on research findings (such as in the allowable stresses of resistance factors?
If so, please describe and provide a reference to relevant research, if available.
Table 4.8 identifies positive and negative responses for this question, as well as some
specific information given by the respondents.
The survey indicates that most of the DOTs have not made adjustments to the design
specifications for HSC prestressed bridge girders. Of the seven DOTs that have modifications,
Minnesota and South Dakota have modified the equation for the modulus of elasticity, and
Washington has modified the allowable stresses and equations for losses, creep, and camber
based on in-house practice. Louisiana is conducting research that will be completed in 2003, and
it is expected that the allowable stresses will change based on these findings.
Table 4.8. Adjustments to Design Specifications for HSC Prestressed
Bridge Girders (Q 11). Department of Transportation
Yes No Specific Information
Alabama x Developed some HPC mix designs for a HPC showcase project. Alaska x Arkansas x California x Colorado x Connecticut x Florida x Georgia x Hawaii x Idaho x Illinois x Iowa x Kansas x Reduced the allowable tension in the precompressed tensile zone caused by the
prestressing force, service loads and prestressed losses to 0.125 cf ' (3.95 cf ' in psi units). This Kansas Department of Transportation (KsDOT) policy is for fatigue considerations should cracking of the beam occur.
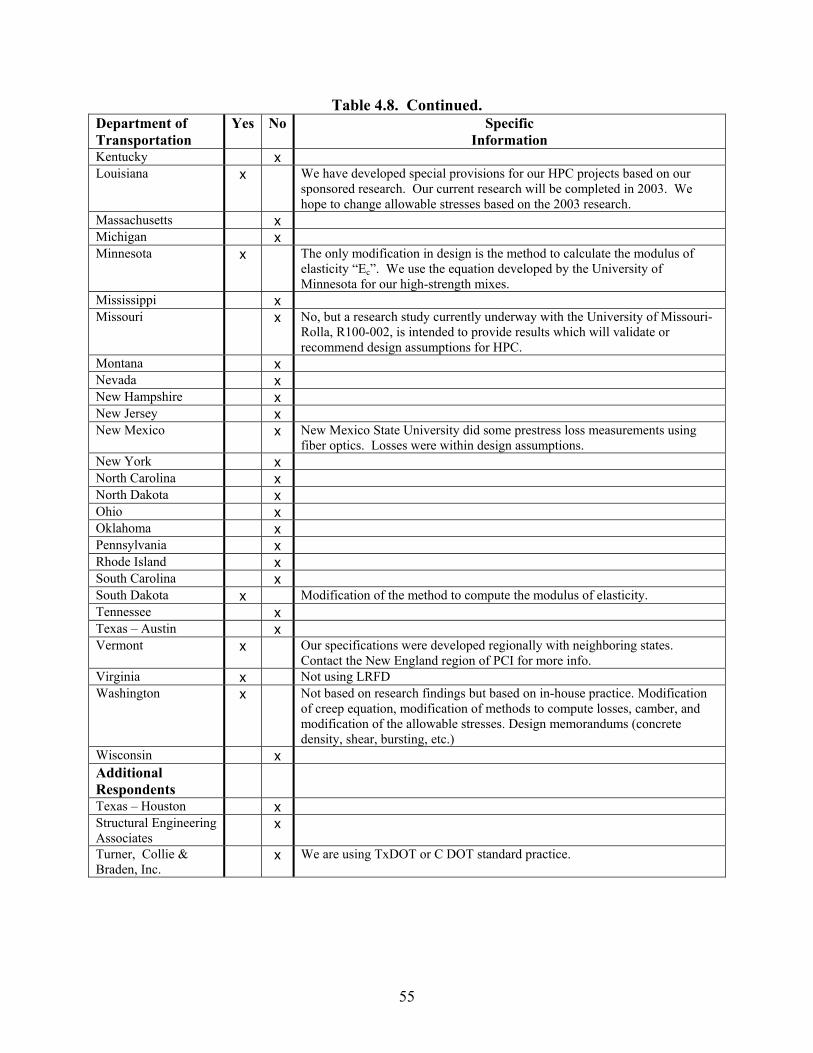
55
Table 4.8. Continued. Department of Transportation
Yes No Specific Information
Kentucky x Louisiana x We have developed special provisions for our HPC projects based on our
sponsored research. Our current research will be completed in 2003. We hope to change allowable stresses based on the 2003 research.
Massachusetts x Michigan x Minnesota x The only modification in design is the method to calculate the modulus of
elasticity “Ec”. We use the equation developed by the University of Minnesota for our high-strength mixes.
Mississippi x Missouri x No, but a research study currently underway with the University of Missouri-
Rolla, R100-002, is intended to provide results which will validate or recommend design assumptions for HPC.
Montana x Nevada x New Hampshire x New Jersey x New Mexico x New Mexico State University did some prestress loss measurements using
fiber optics. Losses were within design assumptions. New York x North Carolina x North Dakota x Ohio x Oklahoma x Pennsylvania x Rhode Island x South Carolina x South Dakota x Modification of the method to compute the modulus of elasticity. Tennessee x Texas – Austin x Vermont x Our specifications were developed regionally with neighboring states.
Contact the New England region of PCI for more info. Virginia x Not using LRFD Washington x Not based on research findings but based on in-house practice. Modification
of creep equation, modification of methods to compute losses, camber, and modification of the allowable stresses. Design memorandums (concrete density, shear, bursting, etc.)
Wisconsin x Additional Respondents
Texas – Houston x Structural Engineering Associates
x
Turner, Collie & Braden, Inc.
x We are using TxDOT or C DOT standard practice.
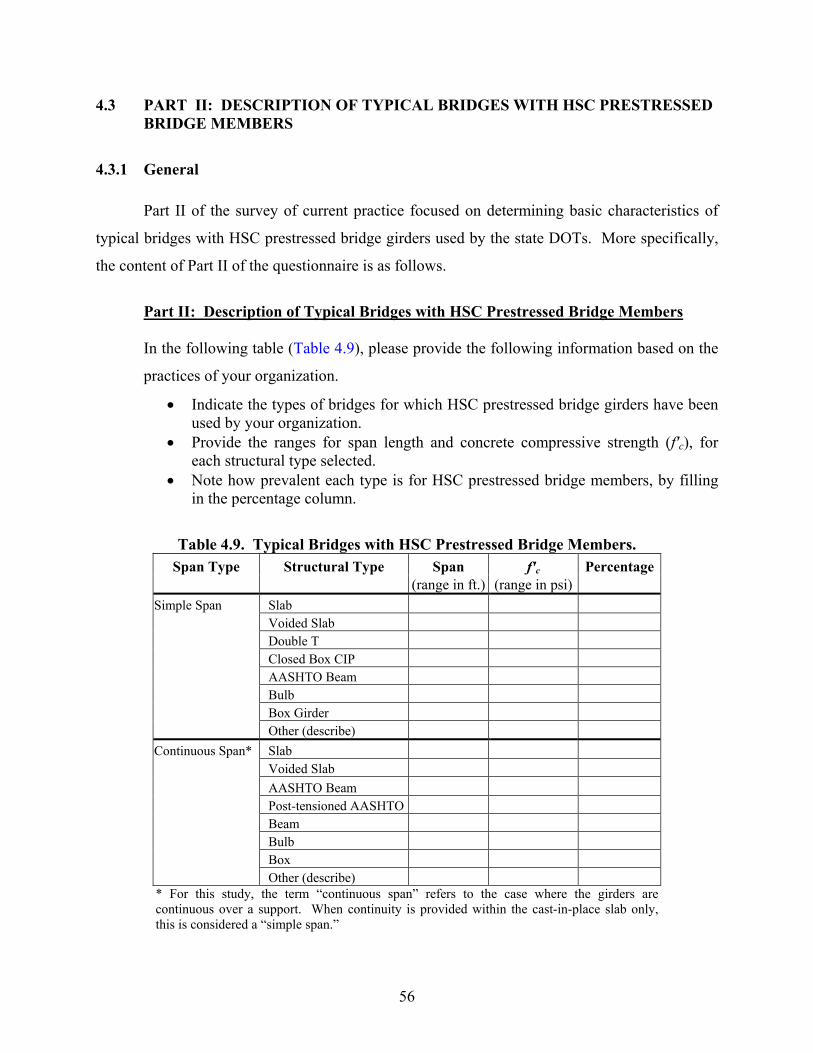
56
4.3 PART II: DESCRIPTION OF TYPICAL BRIDGES WITH HSC PRESTRESSED BRIDGE MEMBERS
4.3.1 General
Part II of the survey of current practice focused on determining basic characteristics of
typical bridges with HSC prestressed bridge girders used by the state DOTs. More specifically,
the content of Part II of the questionnaire is as follows.
Part II: Description of Typical Bridges with HSC Prestressed Bridge Members In the following table (Table 4.9), please provide the following information based on the
practices of your organization.
• Indicate the types of bridges for which HSC prestressed bridge girders have been used by your organization.
• Provide the ranges for span length and concrete compressive strength (f'c), for each structural type selected.
• Note how prevalent each type is for HSC prestressed bridge members, by filling in the percentage column.
Table 4.9. Typical Bridges with HSC Prestressed Bridge Members. Span Type Structural Type Span f'c Percentage
(range in ft.) (range in psi) Simple Span Slab Voided Slab Double T Closed Box CIP AASHTO Beam Bulb Box Girder Other (describe) Continuous Span* Slab Voided Slab AASHTO Beam Post-tensioned AASHTO Beam Bulb Box Other (describe) * For this study, the term “continuous span” refers to the case where the girders are continuous over a support. When continuity is provided within the cast-in-place slab only, this is considered a “simple span.”
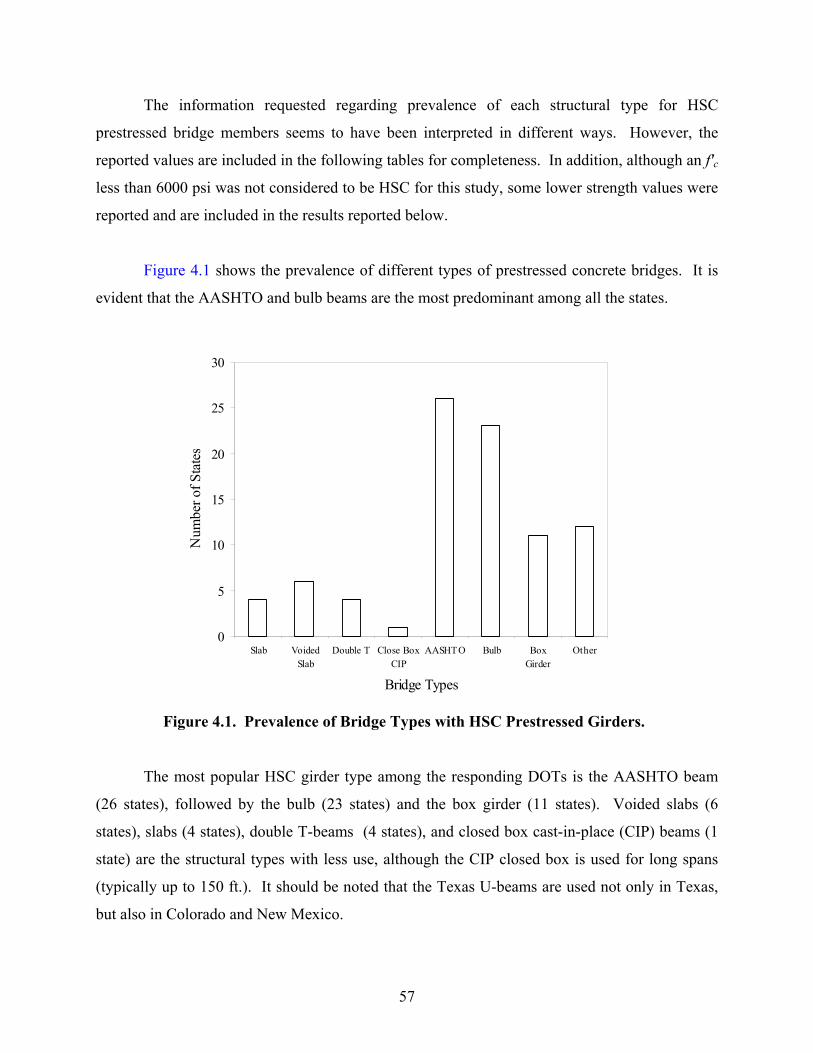
57
The information requested regarding prevalence of each structural type for HSC
prestressed bridge members seems to have been interpreted in different ways. However, the
reported values are included in the following tables for completeness. In addition, although an f'c
less than 6000 psi was not considered to be HSC for this study, some lower strength values were
reported and are included in the results reported below.
Figure 4.1 shows the prevalence of different types of prestressed concrete bridges. It is
evident that the AASHTO and bulb beams are the most predominant among all the states.
0
5
10
15
20
25
30
Slab VoidedSlab
Double T Close BoxCIP
AASHTO Bulb BoxGirder
Other
Bridge Types
Num
ber o
f Sta
tes
Figure 4.1. Prevalence of Bridge Types with HSC Prestressed Girders.
The most popular HSC girder type among the responding DOTs is the AASHTO beam
(26 states), followed by the bulb (23 states) and the box girder (11 states). Voided slabs (6
states), slabs (4 states), double T-beams (4 states), and closed box cast-in-place (CIP) beams (1
state) are the structural types with less use, although the CIP closed box is used for long spans
(typically up to 150 ft.). It should be noted that the Texas U-beams are used not only in Texas,
but also in Colorado and New Mexico.
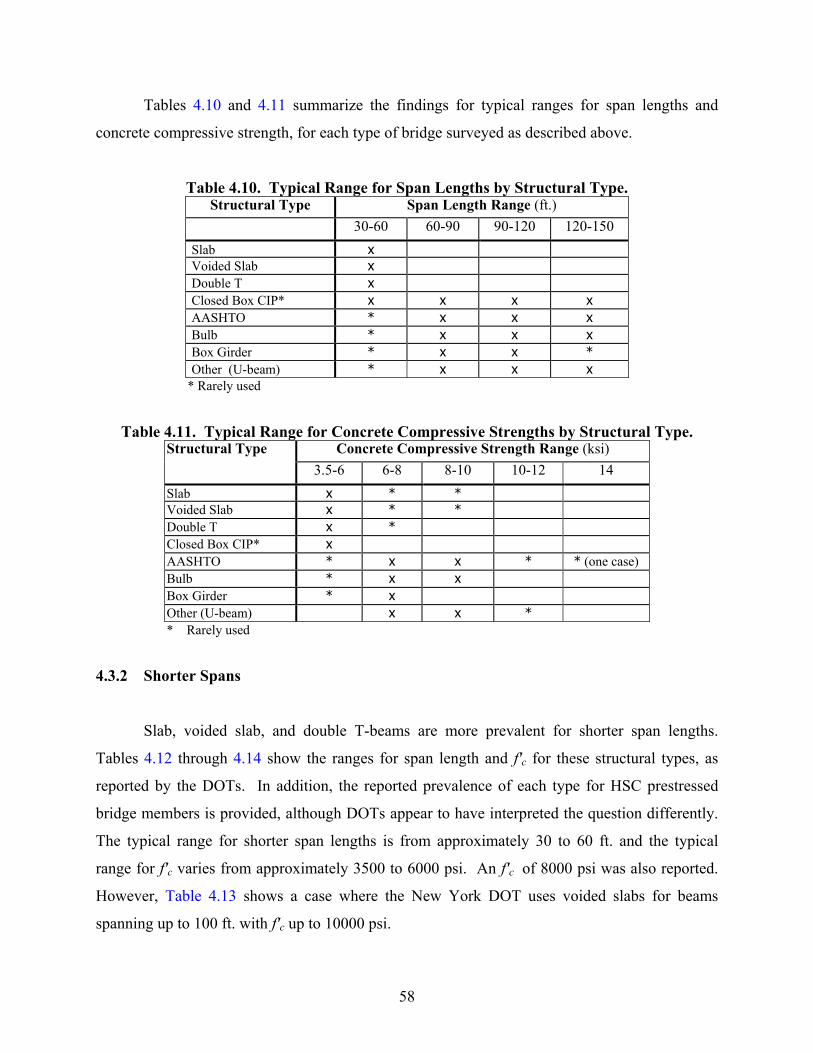
58
Tables 4.10 and 4.11 summarize the findings for typical ranges for span lengths and
concrete compressive strength, for each type of bridge surveyed as described above.
Table 4.10. Typical Range for Span Lengths by Structural Type. Structural Type Span Length Range (ft.)
30-60 60-90 90-120 120-150 Slab x Voided Slab x Double T x Closed Box CIP* x x x x AASHTO * x x x Bulb * x x x Box Girder * x x * Other (U-beam) * x x x
* Rarely used
Table 4.11. Typical Range for Concrete Compressive Strengths by Structural Type. Structural Type Concrete Compressive Strength Range (ksi)
3.5-6 6-8 8-10 10-12 14 Slab x * * Voided Slab x * * Double T x * Closed Box CIP* x AASHTO * x x * * (one case) Bulb * x x Box Girder * x Other (U-beam) x x * * Rarely used
4.3.2 Shorter Spans
Slab, voided slab, and double T-beams are more prevalent for shorter span lengths.
Tables 4.12 through 4.14 show the ranges for span length and f'c for these structural types, as
reported by the DOTs. In addition, the reported prevalence of each type for HSC prestressed
bridge members is provided, although DOTs appear to have interpreted the question differently.
The typical range for shorter span lengths is from approximately 30 to 60 ft. and the typical
range for f'c varies from approximately 3500 to 6000 psi. An f'c of 8000 psi was also reported.
However, Table 4.13 shows a case where the New York DOT uses voided slabs for beams
spanning up to 100 ft. with f'c up to 10000 psi.
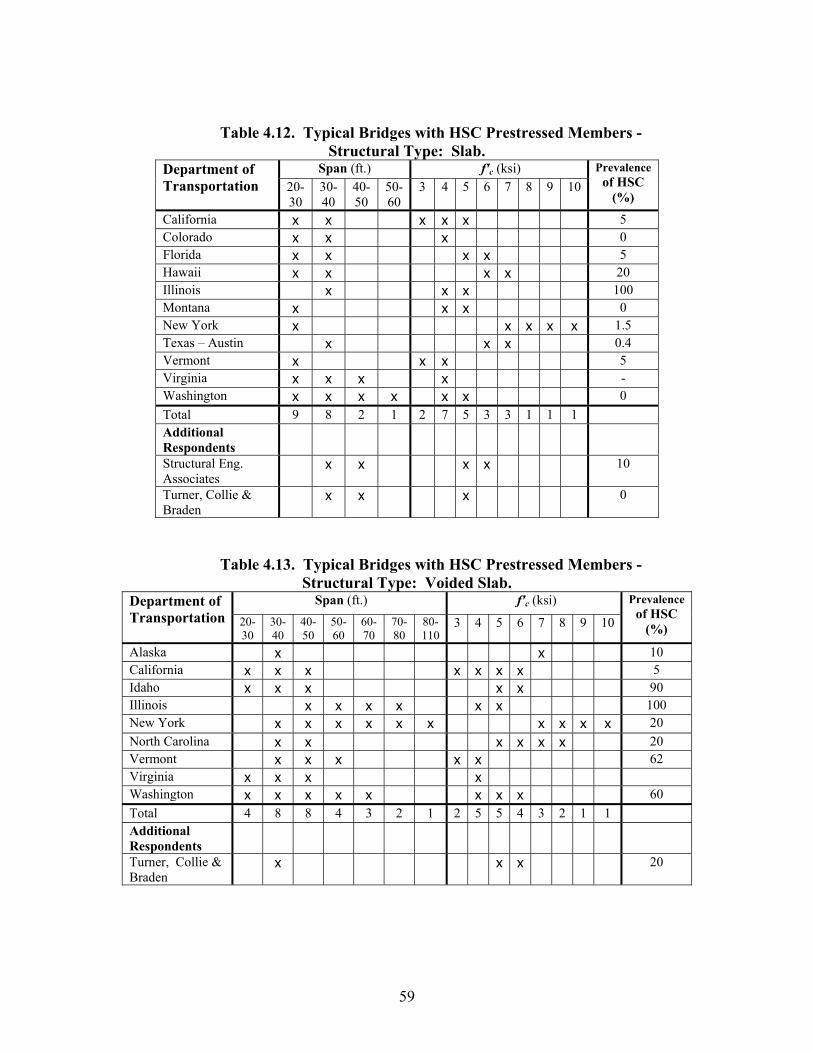
59
Table 4.12. Typical Bridges with HSC Prestressed Members - Structural Type: Slab.
Span (ft.) f'c (ksi) Department of Transportation 20-
30 30-40
40-50
50-60
3 4 5 6 7 8 9 10 Prevalence
of HSC (%)
California x x x x x 5 Colorado x x x 0 Florida x x x x 5 Hawaii x x x x 20 Illinois x x x 100 Montana x x x 0 New York x x x x x 1.5 Texas – Austin x x x 0.4 Vermont x x x 5 Virginia x x x x - Washington x x x x x x 0 Total 9 8 2 1 2 7 5 3 3 1 1 1 Additional Respondents
Structural Eng. Associates
x x x x 10
Turner, Collie & Braden
x x x 0
Table 4.13. Typical Bridges with HSC Prestressed Members - Structural Type: Voided Slab.
Span (ft.) f'c (ksi) Department of Transportation 20-
30 30-40
40-50
50-60
60-70
70-80
80-110
3 4 5 6 7 8 9 10
Prevalence of HSC
(%)
Alaska x x 10 California x x x x x x x 5 Idaho x x x x x 90 Illinois x x x x x x 100 New York x x x x x x x x x x 20 North Carolina x x x x x x 20 Vermont x x x x x 62 Virginia x x x x Washington x x x x x x x x 60 Total 4 8 8 4 3 2 1 2 5 5 4 3 2 1 1 Additional Respondents
Turner, Collie & Braden
x x x 20
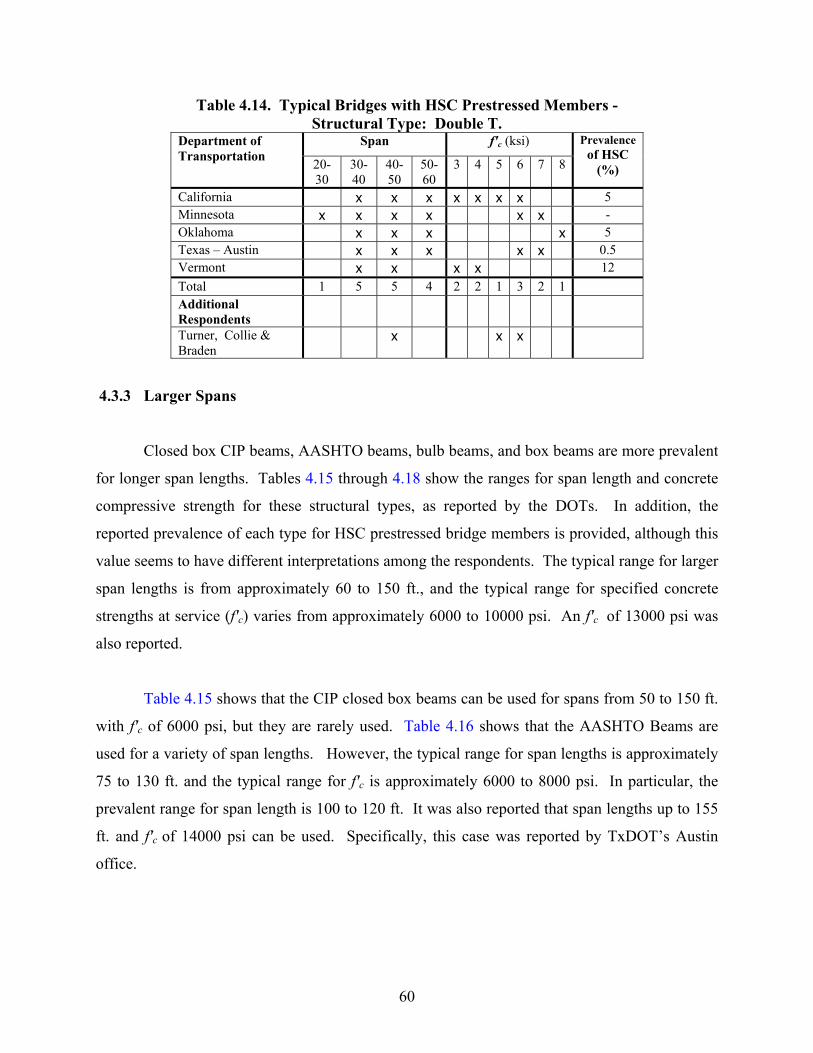
60
Table 4.14. Typical Bridges with HSC Prestressed Members - Structural Type: Double T.
Span f'c (ksi) Department of Transportation 20-
30 30-40
40-50
50-60
3 4 5 6 7 8
Prevalence of HSC
(%)
California x x x x x x x 5 Minnesota x x x x x x - Oklahoma x x x x 5 Texas – Austin x x x x x 0.5 Vermont x x x x 12 Total 1 5 5 4 2 2 1 3 2 1 Additional Respondents
Turner, Collie & Braden
x x x
4.3.3 Larger Spans
Closed box CIP beams, AASHTO beams, bulb beams, and box beams are more prevalent
for longer span lengths. Tables 4.15 through 4.18 show the ranges for span length and concrete
compressive strength for these structural types, as reported by the DOTs. In addition, the
reported prevalence of each type for HSC prestressed bridge members is provided, although this
value seems to have different interpretations among the respondents. The typical range for larger
span lengths is from approximately 60 to 150 ft., and the typical range for specified concrete
strengths at service (f'c) varies from approximately 6000 to 10000 psi. An f'c of 13000 psi was
also reported.
Table 4.15 shows that the CIP closed box beams can be used for spans from 50 to 150 ft.
with f'c of 6000 psi, but they are rarely used. Table 4.16 shows that the AASHTO Beams are
used for a variety of span lengths. However, the typical range for span lengths is approximately
75 to 130 ft. and the typical range for f'c is approximately 6000 to 8000 psi. In particular, the
prevalent range for span length is 100 to 120 ft. It was also reported that span lengths up to 155
ft. and f'c of 14000 psi can be used. Specifically, this case was reported by TxDOT’s Austin
office.
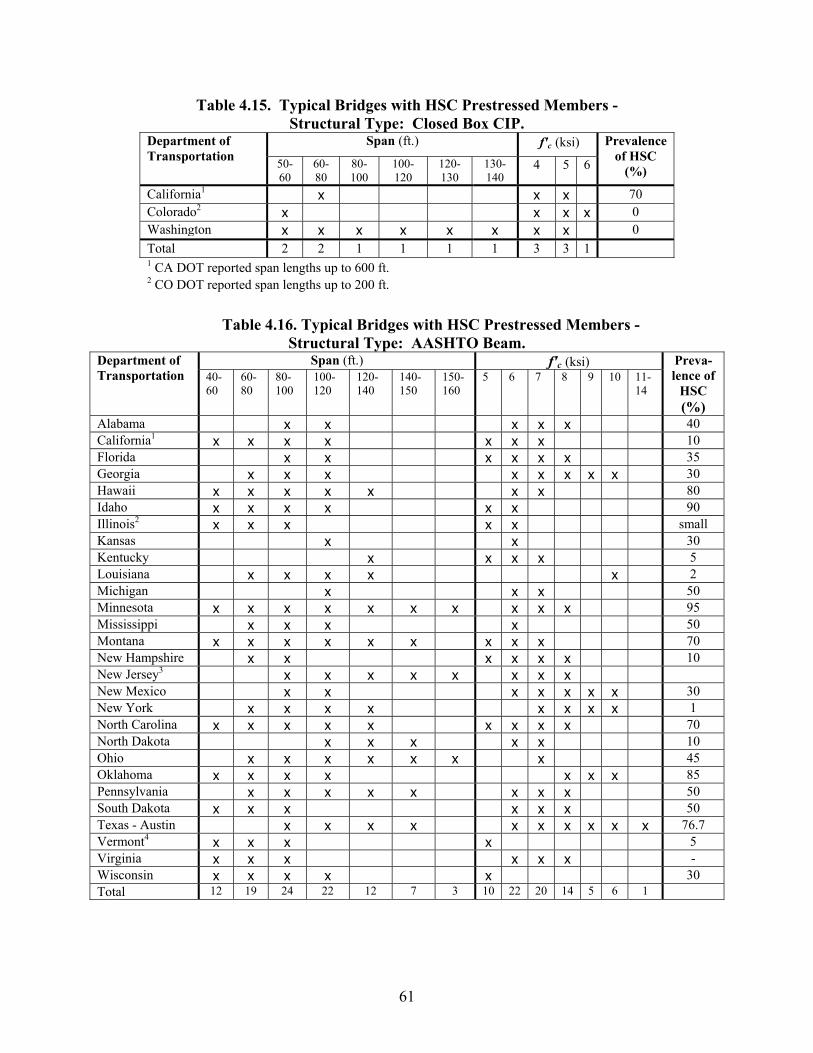
61
Table 4.15. Typical Bridges with HSC Prestressed Members - Structural Type: Closed Box CIP.
Span (ft.) f'c (ksi) Department of Transportation 50-
60 60-80
80-100
100-120
120-130
130-140
4 5 6
Prevalenceof HSC
(%) California1 x x x 70 Colorado2 x x x x 0 Washington x x x x x x x x 0 Total 2 2 1 1 1 1 3 3 1 1 CA DOT reported span lengths up to 600 ft. 2 CO DOT reported span lengths up to 200 ft.
Table 4.16. Typical Bridges with HSC Prestressed Members - Structural Type: AASHTO Beam.
Span (ft.) f'c (ksi) Department of Transportation 40-
60 60-80
80-100
100-120
120-140
140-150
150-160
5 6 7 8 9 10 11-14
Preva- lence of
HSC (%)
Alabama x x x x x 40 California1 x x x x x x x 10 Florida x x x x x x 35 Georgia x x x x x x x x 30 Hawaii x x x x x x x 80 Idaho x x x x x x 90 Illinois2 x x x x x small Kansas x x 30 Kentucky x x x x 5 Louisiana x x x x x 2 Michigan x x x 50 Minnesota x x x x x x x x x x 95 Mississippi x x x x 50 Montana x x x x x x x x x 70 New Hampshire x x x x x x 10 New Jersey3 x x x x x x x x New Mexico x x x x x x x 30 New York x x x x x x x x 1 North Carolina x x x x x x x x x 70 North Dakota x x x x x 10 Ohio x x x x x x x 45 Oklahoma x x x x x x x 85 Pennsylvania x x x x x x x x 50 South Dakota x x x x x x 50 Texas - Austin x x x x x x x x x x 76.7 Vermont4 x x x x 5 Virginia x x x x x x - Wisconsin x x x x x 30 Total 12 19 24 22 12 7 3 10 22 20 14 5 6 1
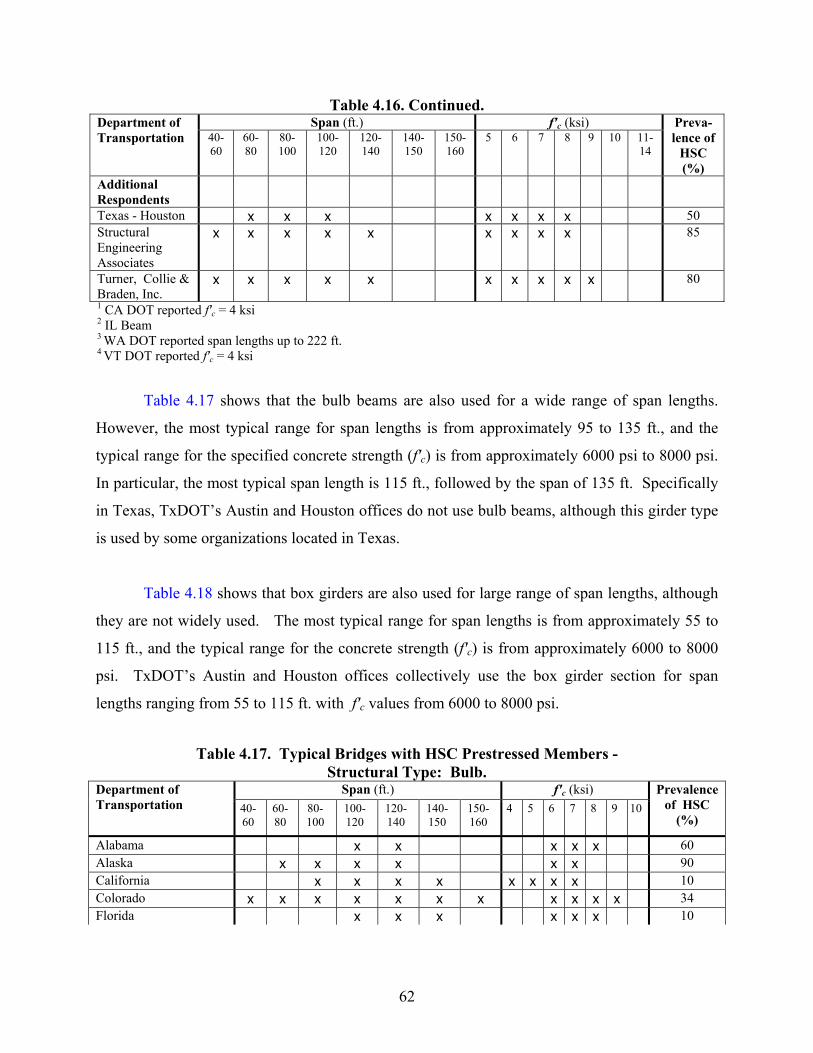
62
Table 4.16. Continued. Span (ft.) f'c (ksi) Department of
Transportation 40-60
60-80
80-100
100-120
120-140
140-150
150-160
5 6 7 8 9 10 11-14
Preva- lence of
HSC (%)
Additional Respondents
Texas - Houston x x x x x x x 50 Structural Engineering Associates
x x x x x x x x x 85
Turner, Collie & Braden, Inc.
x x x x x x x x x x 80
1 CA DOT reported f'c = 4 ksi 2 IL Beam 3 WA DOT reported span lengths up to 222 ft. 4 VT DOT reported f'c = 4 ksi
Table 4.17 shows that the bulb beams are also used for a wide range of span lengths.
However, the most typical range for span lengths is from approximately 95 to 135 ft., and the
typical range for the specified concrete strength (f'c) is from approximately 6000 psi to 8000 psi.
In particular, the most typical span length is 115 ft., followed by the span of 135 ft. Specifically
in Texas, TxDOT’s Austin and Houston offices do not use bulb beams, although this girder type
is used by some organizations located in Texas.
Table 4.18 shows that box girders are also used for large range of span lengths, although
they are not widely used. The most typical range for span lengths is from approximately 55 to
115 ft., and the typical range for the concrete strength (f'c) is from approximately 6000 to 8000
psi. TxDOT’s Austin and Houston offices collectively use the box girder section for span
lengths ranging from 55 to 115 ft. with f'c values from 6000 to 8000 psi.
Table 4.17. Typical Bridges with HSC Prestressed Members - Structural Type: Bulb.
Span (ft.) f'c (ksi) Department of Transportation 40-
60 60-80
80-100
100-120
120-140
140-150
150-160
4 5 6 7 8 9 10 Prevalence
of HSC (%)
Alabama x x x x x 60 Alaska x x x x x x 90 California x x x x x x x x 10 Colorado x x x x x x x x x x x 34 Florida x x x x x x 10
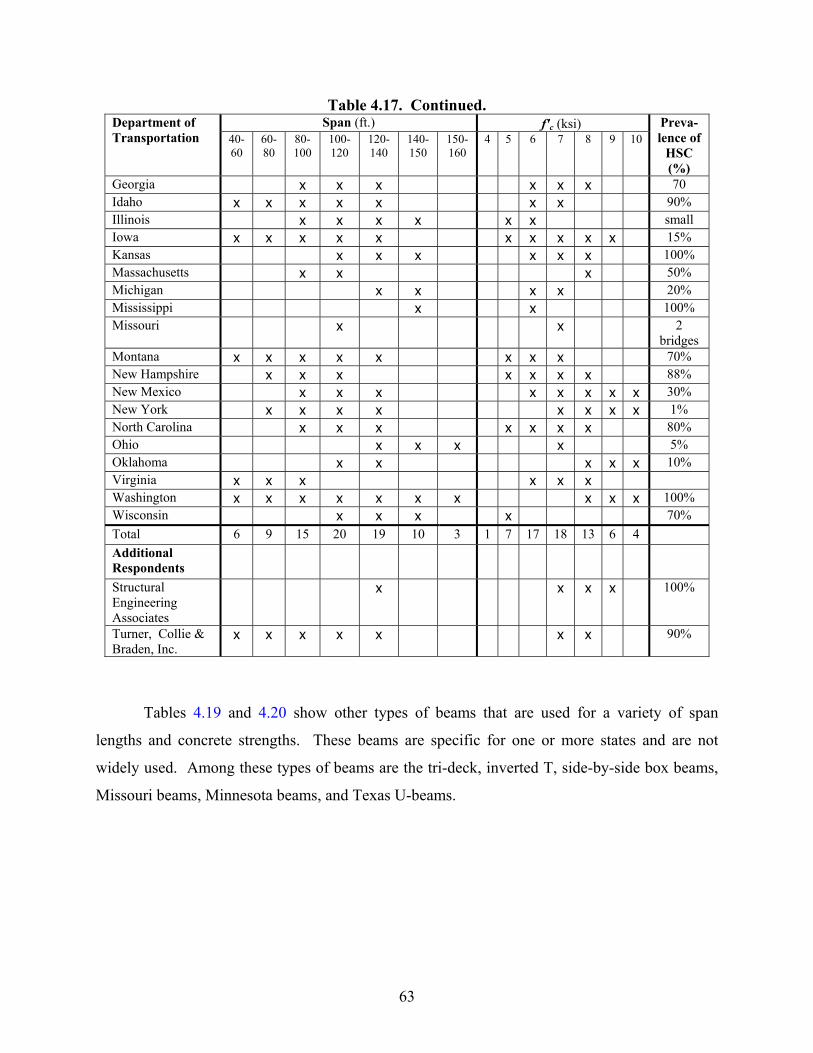
63
Table 4.17. Continued. Span (ft.) f'c (ksi) Department of
Transportation 40-60
60-80
80-100
100-120
120-140
140-150
150-160
4 5 6 7 8 9 10 Preva- lence of
HSC (%)
Georgia x x x x x x 70 Idaho x x x x x x x 90% Illinois x x x x x x small Iowa x x x x x x x x x x 15% Kansas x x x x x x 100% Massachusetts x x x 50% Michigan x x x x 20% Mississippi x x 100% Missouri x x 2
bridges Montana x x x x x x x x 70% New Hampshire x x x x x x x 88% New Mexico x x x x x x x x 30% New York x x x x x x x x 1% North Carolina x x x x x x x 80% Ohio x x x x 5% Oklahoma x x x x x 10% Virginia x x x x x x Washington x x x x x x x x x x 100% Wisconsin x x x x 70% Total 6 9 15 20 19 10 3 1 7 17 18 13 6 4 Additional Respondents
Structural Engineering Associates
x x x x 100%
Turner, Collie & Braden, Inc.
x x x x x x x 90%
Tables 4.19 and 4.20 show other types of beams that are used for a variety of span
lengths and concrete strengths. These beams are specific for one or more states and are not
widely used. Among these types of beams are the tri-deck, inverted T, side-by-side box beams,
Missouri beams, Minnesota beams, and Texas U-beams.
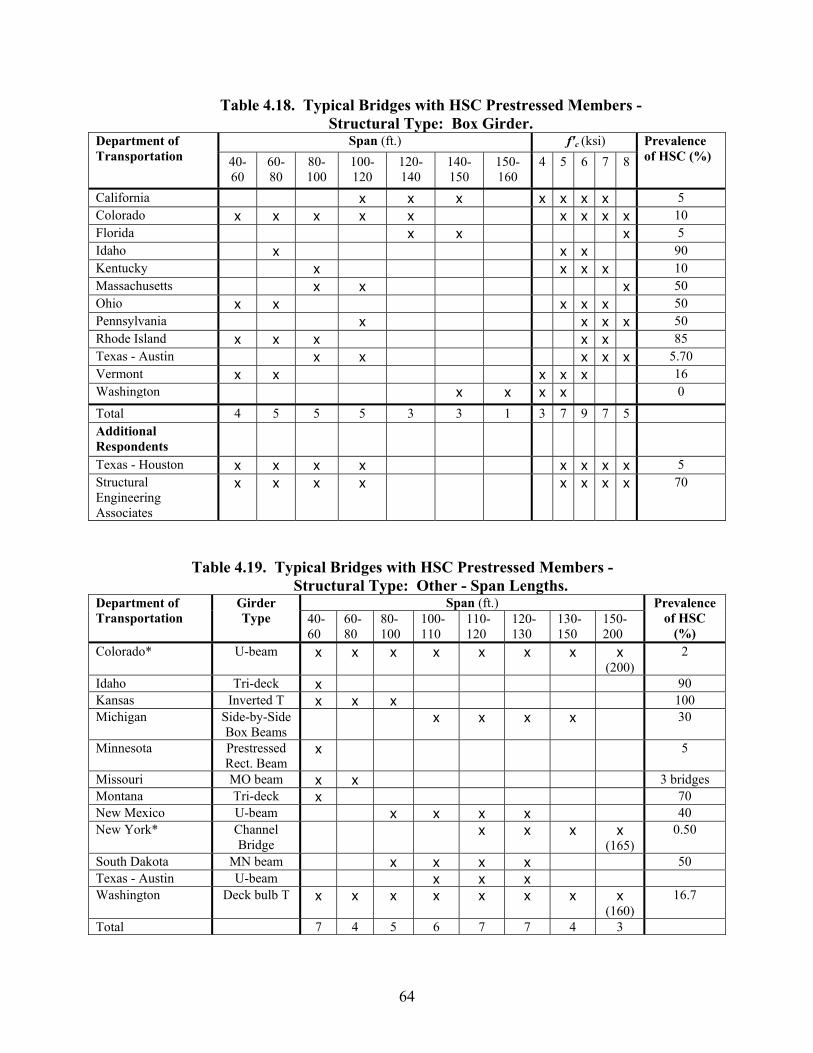
64
Table 4.18. Typical Bridges with HSC Prestressed Members - Structural Type: Box Girder.
Span (ft.) f'c (ksi) Department of Transportation 40-
60 60-80
80-100
100-120
120-140
140-150
150-160
4 5 6 7 8 Prevalence of HSC (%)
California x x x x x x x 5 Colorado x x x x x x x x x 10 Florida x x x 5 Idaho x x x 90 Kentucky x x x x 10 Massachusetts x x x 50 Ohio x x x x x 50 Pennsylvania x x x x 50 Rhode Island x x x x x 85 Texas - Austin x x x x x 5.70 Vermont x x x x x 16 Washington x x x x 0
Total 4 5 5 5 3 3 1 3 7 9 7 5 Additional Respondents
Texas - Houston x x x x x x x x 5 Structural Engineering Associates
x x x x x x x x 70
Table 4.19. Typical Bridges with HSC Prestressed Members -
Structural Type: Other - Span Lengths. Span (ft.) Department of
Transportation Girder Type 40-
60 60-80
80-100
100-110
110-120
120-130
130-150
150-200
Prevalence of HSC
(%) Colorado* U-beam x x x x x x x x
(200) 2
Idaho Tri-deck x 90 Kansas Inverted T x x x 100 Michigan Side-by-Side
Box Beams x x x x 30
Minnesota Prestressed Rect. Beam
x 5
Missouri MO beam x x 3 bridges Montana Tri-deck x 70 New Mexico U-beam x x x x 40 New York* Channel
Bridge x x x x
(165) 0.50
South Dakota MN beam x x x x 50 Texas - Austin U-beam x x x Washington Deck bulb T x x x x x x x x
(160) 16.7
Total 7 4 5 6 7 7 4 3
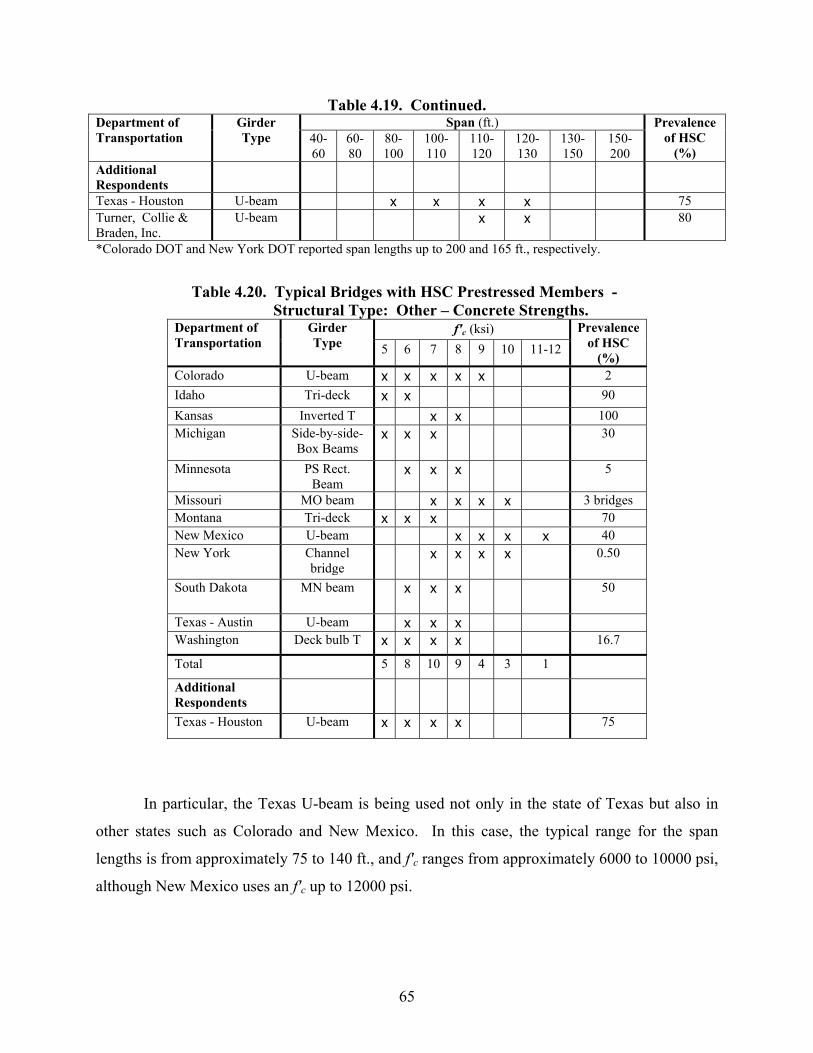
65
Table 4.19. Continued. Span (ft.) Department of
Transportation Girder Type 40-
60 60-80
80-100
100-110
110-120
120-130
130-150
150-200
Prevalence of HSC
(%) Additional Respondents
Texas - Houston U-beam x x x x 75 Turner, Collie & Braden, Inc.
U-beam x x 80
*Colorado DOT and New York DOT reported span lengths up to 200 and 165 ft., respectively.
Table 4.20. Typical Bridges with HSC Prestressed Members -
Structural Type: Other – Concrete Strengths. f'c (ksi) Department of
Transportation Girder Type 5 6 7 8 9 10 11-12
Prevalence of HSC
(%) Colorado U-beam x x x x x 2 Idaho Tri-deck x x 90 Kansas Inverted T x x 100 Michigan Side-by-side-
Box Beams x x x 30
Minnesota PS Rect. Beam
x x x 5
Missouri MO beam x x x x 3 bridges Montana Tri-deck x x x 70 New Mexico U-beam x x x x 40 New York Channel
bridge x x x x 0.50
South Dakota MN beam x x x 50
Texas - Austin U-beam x x x Washington Deck bulb T x x x x 16.7
Total 5 8 10 9 4 3 1
Additional Respondents
Texas - Houston U-beam x x x x 75
In particular, the Texas U-beam is being used not only in the state of Texas but also in
other states such as Colorado and New Mexico. In this case, the typical range for the span
lengths is from approximately 75 to 140 ft., and f'c ranges from approximately 6000 to 10000 psi,
although New Mexico uses an f'c up to 12000 psi.

67
5 OUTLINE OF PARAMETRIC STUDY AND ANALYSIS PROCEDURES
5.1 GENERAL
Researchers conducted a parametric study for single-span prestressed concrete bridge
girders to mainly investigate the controlling limit states for various concrete strengths using both
the AASHTO Standard and LRFD Specifications (2002 a,b). The effects of changes in concrete
strength, strand diameter, girder spacing, and span length were also considered. This study
focused only on limit states related to flexure for service and ultimate conditions, and additional
design limit states were not evaluated. TxDOT currently uses an HS25 truck loading for a
number of designs. The loading used in this study was based on the specified loads in the
AASHTO specifications, which reference an HS20 truck loading. To carry out the parametric
study, four subtasks were performed, as follows:
1. Develop spreadsheets to perform iterative design and analysis calculations.
2. Evaluate several case study bridges with U54 and Type IV beams designed using the
AASHTO Standard Specifications and compare the results with those from TxDOT
prestressed concrete bridge girder design program, PSTRS14 (TxDOT 1980). This
comparison is needed to check the procedures and equations used in this study with
those of TxDOT, based on the AASHTO Standard Specifications, as well as to ensure
consistency between results. Two case study designs using U54 Beams and two case
study designs using Type IV beams are presented.
3. Define analysis and design assumptions and design variables for the parametric study.
4. Perform the analysis for the parametric study.
This section describes the girder sections considered, the analysis and design
assumptions, the design parameters, and comparison of the analysis procedure to current TxDOT
practices. The results of the parametric study are reported in Sections 6 and 7.
68
5.2 GIRDER SECTIONS
5.2.1 U54 BEAMS
TxDOT began development of the Texas precast concrete U54 beam in the mid 1980s to
create an alternative to the AASHTO Type IV and Texas Type C precast concrete I sections. It
was not created to replace the precast concrete I-beam but to satisfy aesthetic demands with
economy and ease of construction (TxDOT 2001a). Since 1993, when the first U-beam was
constructed in Houston, research has been conducted to study the behavior of the U-beams. Two
U-beam sections for use as prestressed concrete bridge girders, U40 and U54, were developed.
The TxDOT U54 beam is trapezoidal in cross-section and is open at the top with two flanged
stems. The depth of the U54 beam is 54 in. with a total width at the top of the stems of 96 in., a
thickness of 5 in. per web, and the bottom flange thickness can accommodate three rows of
strands. Figure 5.1 shows the configuration and dimensions of the U54 beam cross-section. The
U40 section is similar in shape, with a depth of 40 in. For normal beam concrete strengths and
0.5 in. diameter strands, the recommended economical span length limit is 110 ft. (girder spacing
= 7.5 ft.) for the U40 beam and 130 ft. (girder spacing = 9.75 ft.) for the U54 beam (TxDOT
2001a). The U54 section was selected for this study because of the focus on long span bridges.
5.2.2 TYPE IV BEAMS
The Type IV beam is an AASHTO Standard beam and has been the dominant beam since
1986. This beam is considered as a tough stable beam, and it is recommended for span lengths
up to 130 ft. for normal concrete strengths and 0.5 in. diameter strands (TxDOT 2001a).
However, Type IV beams with a span of 153 ft. were constructed as a part of a project in San
Angelo, Texas, where HSC of 14000 psi was used (TxDOT 2001a). The Type IV beam is an I
cross-section with two flanges. The depth of the Type IV beam is 54 in. with a 20 in. wide top
flange and 26 in. wide bottom flange. This beam section has an 8 in. thick web, and the
thickness of the top and bottom flanges are 8 in. plus a variable section of 6 in. high. Figure 5.2
shows the configuration and dimensions of the Type IV beam cross-section.
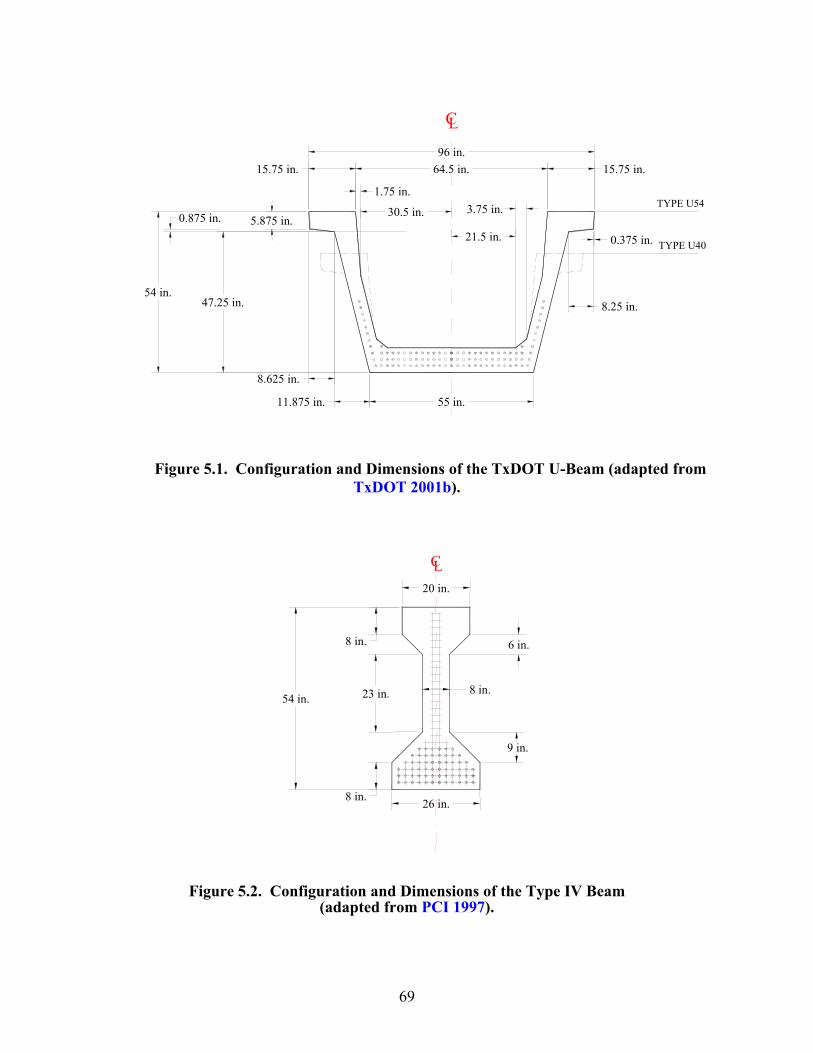
69
96 in.
1.75 in.
15.75 in. 64.5 in. 15.75 in.
30.5 in. 3.75 in.
21.5 in.
55 in.11.875 in. 8.625 in.
0.875 in.
47.25 in.
5.875 in.
54 in. 8.25 in.
TYPE U54
0.375 in. TYPE U40
CL
Figure 5.1. Configuration and Dimensions of the TxDOT U-Beam (adapted from TxDOT 2001b).
20 in.
6 in.
9 in.
8 in.
26 in.
54 in. 23 in.
8 in.
8 in.
Figure 5.2. Configuration and Dimensions of the Type IV Beam (adapted from PCI 1997).
70
5.3 ANALYSIS AND DESIGN ASSUMPTIONS
This section addresses the analysis and design assumptions for prestressed concrete
bridge girders based on the AASHTO Standard and LRFD Specifications. The Preliminary
Design Guide for U-Beam Bridges (TxDOT 2001b) as well as the TxDOT Bridge Design
Manual (TxDOT 2001a) were referenced.
5.3.1 Analysis
In both the AASHTO Standard and LRFD Specifications, the design of prestressed
concrete bridge girders is based on the calculation of stresses under service loads and their
comparison with specified allowable stresses. Allowable stresses in concrete are specified to
control flexural compressive and tensile stresses in extreme fibers at any section along the
member. Thus, the philosophy of prestressed concrete design resides in the emphasis on
serviceability conditions. Member proportioning and prestressing strand layouts are selected to
satisfy the serviceability criteria, and the ultimate capacity is seen as an additional, although
essential, condition that is verified at a later stage.
5.3.2 Design Assumptions
Some designs (including TxDOT designs) are selected to minimize the number of strands
required for a given span length, cross section, and girder spacing; then the corresponding
required concrete strengths at release and final conditions of service are found. For the
parametric study, the required minimum number of strands for a given span length and beam
spacing were also determined, but the concrete strength (f 'c) was set at certain value with an
initial concrete strength (f 'ci) of 0.75 f 'c. In this way, designs for different f 'c values can be
compared to better understand the benefit and sensitivity of varying f 'c . The initial concrete
strength was allowed to vary up to f 'c as PSTRS14 (TxDOT 1980) does in cases where
necessary. Thus, it is assumed that HSC can be achieved at the time corresponding to release,
which is typically at 1 day of age at a precast plant.
71
Prestress losses were computed based upon the detailed method, where elastic shortening,
relaxation, shrinkage, and creep were estimated separately. Estimation of the prestress losses
may be carried out at several levels. In common practical design cases, a lump sum estimate is
sufficient. For this study, where accuracy was required, the detailed analysis was used to
estimate separate losses that take into account the member geometry, material properties,
environmental conditions, and construction method. The equations used for the computation of
losses at transfer and at service conditions for designs using both the Standard and LRFD
Specifications are shown in Section 3.3. In designs under the Standard Specifications, however,
an approximation was made in the computation of loss due to relaxation at transfer in order to
match the TxDOT procedure. In the Standard Specifications, an equation is provided for the
total loss due to relaxation. TxDOT considers approximately one-half of this total amount for
both losses at transfer and after transfer. Therefore, in the parametric study the same approach
was used. In the LRFD Specifications, prestress loss due to relaxation at transfer is function of
the time estimated in days from stressing to transfer. Researchers used 1 day for the time
variable, as this is usually the time at which the girders are released from the forms.
5.3.3 Service Stresses for Flexural Design
This section provides the equations used to compute the stresses at the extreme top and
bottom fibers of the precast sections in unshored composite construction for a simply supported
beam. According to the conventional flexural design of composite beams (Nawy 2000) and the
allowable stresses given in the AASHTO Standard and LRFD Specifications, three different
stages were considered to compute the flexural stresses plus an additional check of the
compressive stress. These stresses are used in the design to verify that the allowable stresses are
not exceeded for service conditions. The sign convention for the resulting stresses is positive for
tension and negative for compression.
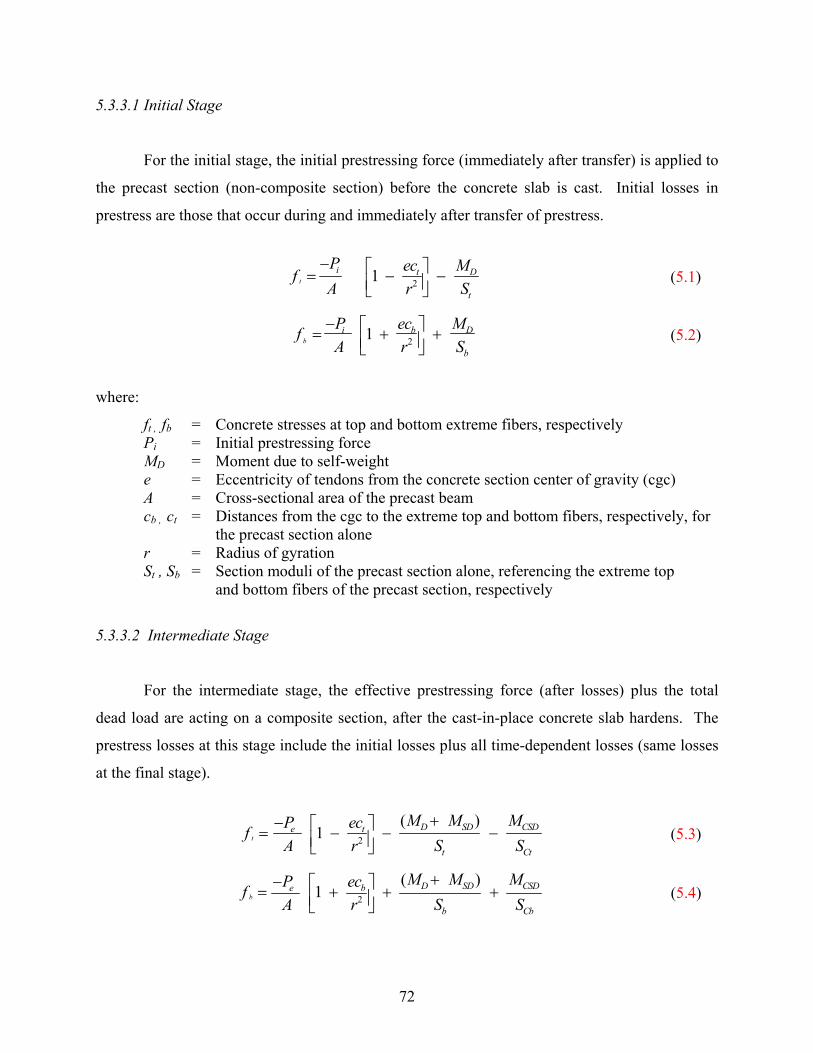
72
5.3.3.1 Initial Stage
For the initial stage, the initial prestressing force (immediately after transfer) is applied to
the precast section (non-composite section) before the concrete slab is cast. Initial losses in
prestress are those that occur during and immediately after transfer of prestress.
21ti t D
t
P ec MfA r S
− = − − (5.1)
21bi b D
b
P ec MfA r S
− = + + (5.2)
where:
ft , fb = Concrete stresses at top and bottom extreme fibers, respectively Pi = Initial prestressing force MD = Moment due to self-weight e = Eccentricity of tendons from the concrete section center of gravity (cgc) A = Cross-sectional area of the precast beam cb , ct = Distances from the cgc to the extreme top and bottom fibers, respectively, for
the precast section alone r = Radius of gyration St , Sb = Section moduli of the precast section alone, referencing the extreme top
and bottom fibers of the precast section, respectively
5.3.3.2 Intermediate Stage
For the intermediate stage, the effective prestressing force (after losses) plus the total
dead load are acting on a composite section, after the cast-in-place concrete slab hardens. The
prestress losses at this stage include the initial losses plus all time-dependent losses (same losses
at the final stage).
2
( )1t
D SD CSDe t
t Ct
M M MP ecfA r S S
+− = − − − (5.3)
2
( )1b
D SD CSDe b
b Cb
M M MP ecfA r S S
+− = + + + (5.4)
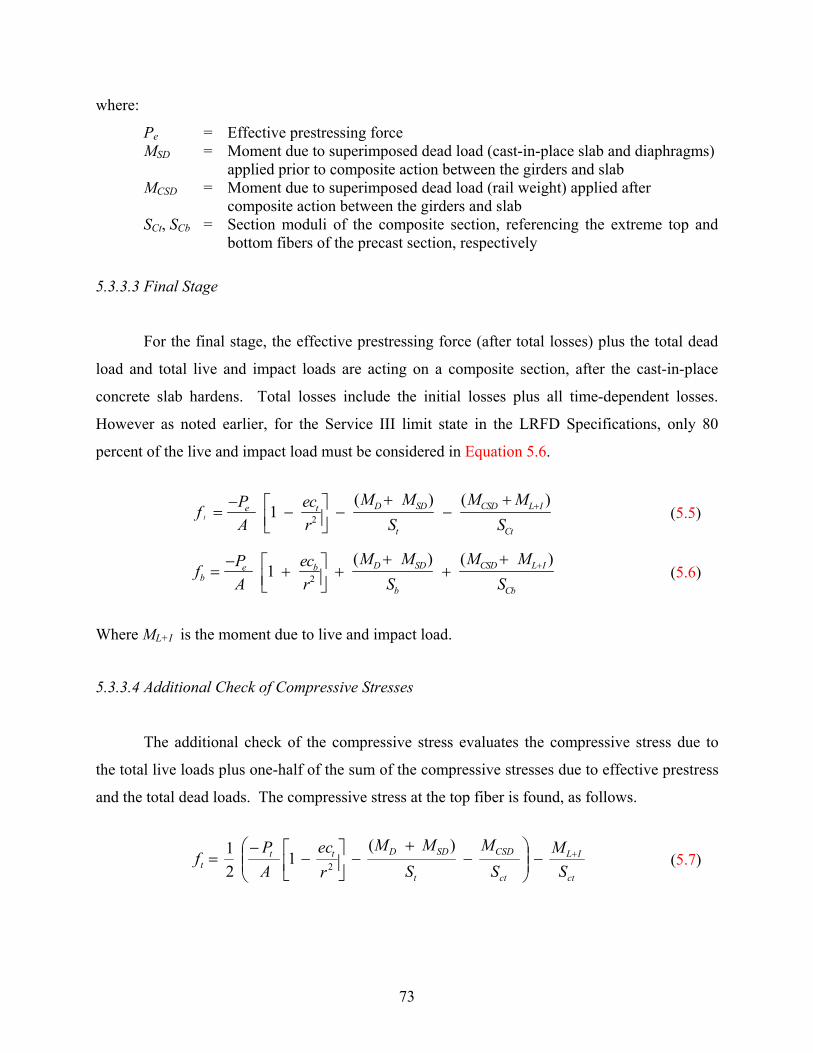
73
where:
Pe = Effective prestressing force MSD = Moment due to superimposed dead load (cast-in-place slab and diaphragms)
applied prior to composite action between the girders and slab MCSD = Moment due to superimposed dead load (rail weight) applied after
composite action between the girders and slab SCt, SCb = Section moduli of the composite section, referencing the extreme top and
bottom fibers of the precast section, respectively
5.3.3.3 Final Stage
For the final stage, the effective prestressing force (after total losses) plus the total dead
load and total live and impact loads are acting on a composite section, after the cast-in-place
concrete slab hardens. Total losses include the initial losses plus all time-dependent losses.
However as noted earlier, for the Service III limit state in the LRFD Specifications, only 80
percent of the live and impact load must be considered in Equation 5.6.
2
( ) ( )1t
D SD CSD L Ie t
t Ct
M M M MP ecfA r S S
++ +− = − − − (5.5)
2
( ) ( )1 D SD CSD L Ie b
bb Cb
M M M MP ecfA r S S
++ +− = + + + (5.6)
Where ML+I is the moment due to live and impact load.
5.3.3.4 Additional Check of Compressive Stresses
The additional check of the compressive stress evaluates the compressive stress due to
the total live loads plus one-half of the sum of the compressive stresses due to effective prestress
and the total dead loads. The compressive stress at the top fiber is found, as follows.
ct
IL
ct
CSD
t
SDDttt S
MS
MS
MMrec
AP
f +−
−
+−
−−
=)(
121
2 (5.7)
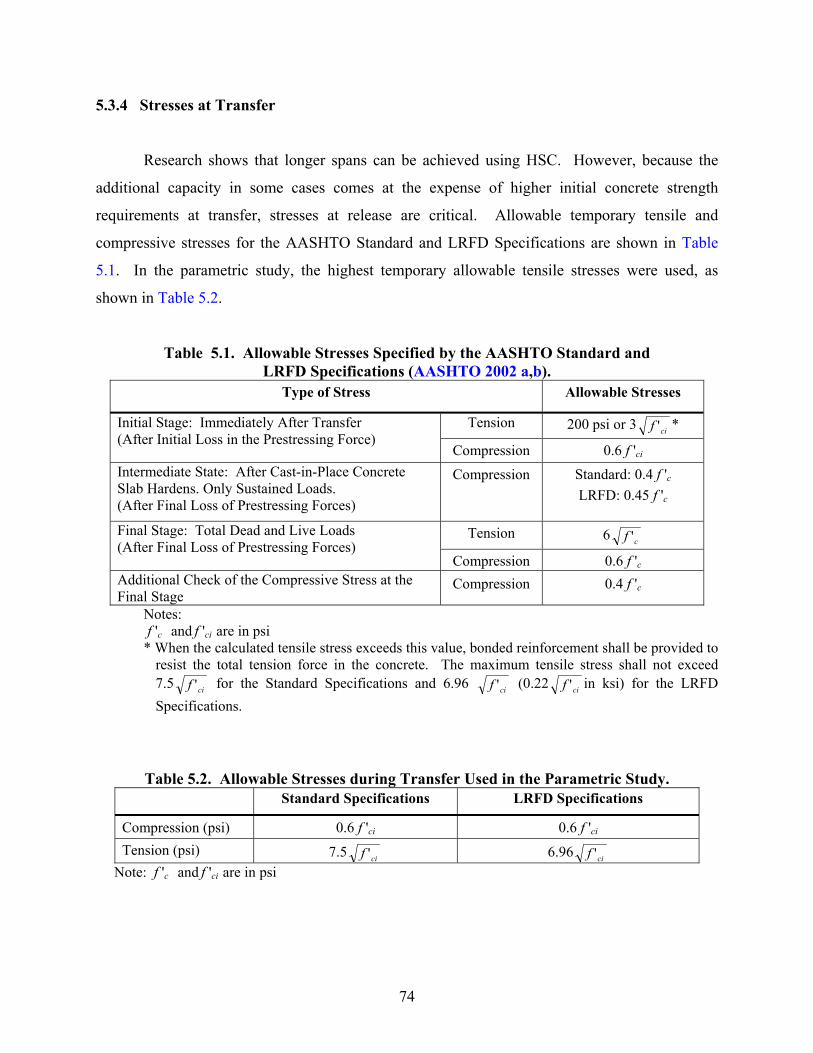
74
5.3.4 Stresses at Transfer
Research shows that longer spans can be achieved using HSC. However, because the
additional capacity in some cases comes at the expense of higher initial concrete strength
requirements at transfer, stresses at release are critical. Allowable temporary tensile and
compressive stresses for the AASHTO Standard and LRFD Specifications are shown in Table
5.1. In the parametric study, the highest temporary allowable tensile stresses were used, as
shown in Table 5.2.
Table 5.1. Allowable Stresses Specified by the AASHTO Standard and LRFD Specifications (AASHTO 2002 a,b).
Type of Stress Allowable Stresses
Tension 200 psi or 3 cif ' * Initial Stage: Immediately After Transfer (After Initial Loss in the Prestressing Force)
Compression 0.6 f 'ci Intermediate State: After Cast-in-Place Concrete Slab Hardens. Only Sustained Loads. (After Final Loss of Prestressing Forces)
Compression Standard: 0.4 f 'c
LRFD: 0.45 f 'c
Tension 6 cf ' Final Stage: Total Dead and Live Loads (After Final Loss of Prestressing Forces)
Compression 0.6 f 'c Additional Check of the Compressive Stress at the Final Stage
Compression 0.4 f 'c
Notes: f 'c and f 'ci are in psi * When the calculated tensile stress exceeds this value, bonded reinforcement shall be provided to
resist the total tension force in the concrete. The maximum tensile stress shall not exceed 7.5 cif ' for the Standard Specifications and 6.96 cif ' (0.22 cif ' in ksi) for the LRFD Specifications.
Table 5.2. Allowable Stresses during Transfer Used in the Parametric Study. Standard Specifications LRFD Specifications
Compression (psi) 0.6 f 'ci 0.6 f 'ci Tension (psi) 7.5 cif ' 6.96 cif '
Note: f 'c and f 'ci are in psi
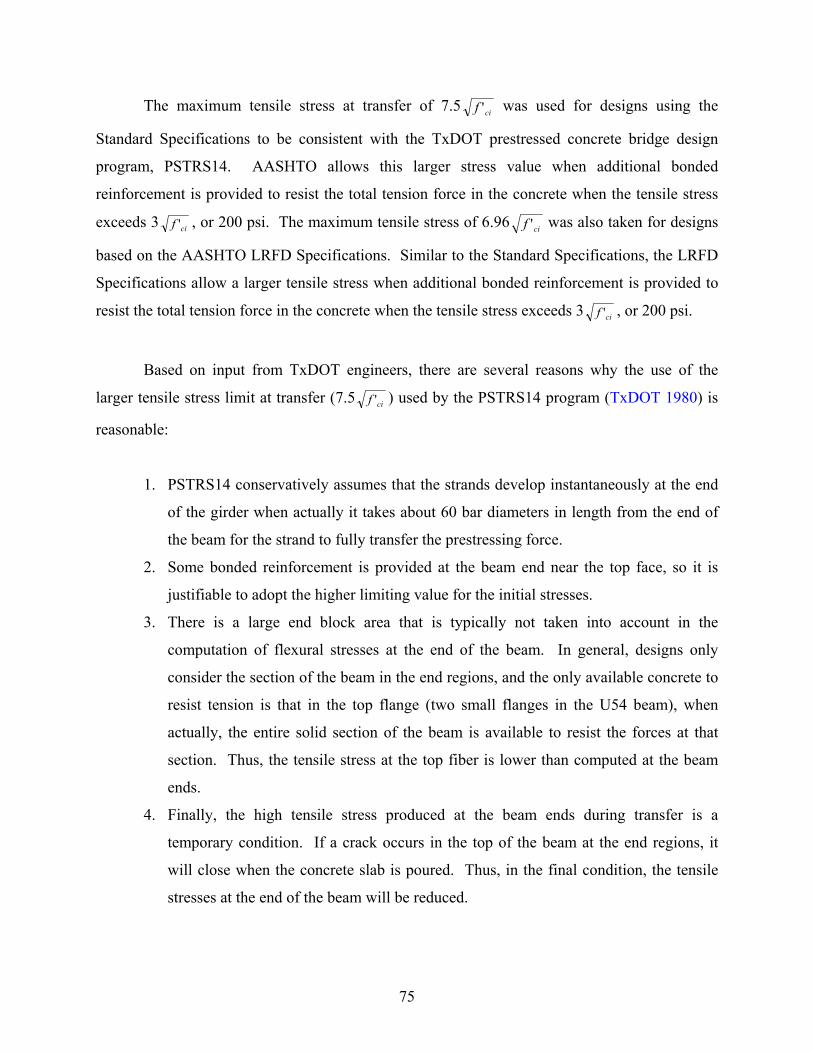
75
The maximum tensile stress at transfer of 7.5 cif ' was used for designs using the
Standard Specifications to be consistent with the TxDOT prestressed concrete bridge design
program, PSTRS14. AASHTO allows this larger stress value when additional bonded
reinforcement is provided to resist the total tension force in the concrete when the tensile stress
exceeds 3 cif ' , or 200 psi. The maximum tensile stress of 6.96 cif ' was also taken for designs
based on the AASHTO LRFD Specifications. Similar to the Standard Specifications, the LRFD
Specifications allow a larger tensile stress when additional bonded reinforcement is provided to
resist the total tension force in the concrete when the tensile stress exceeds 3 cif ' , or 200 psi.
Based on input from TxDOT engineers, there are several reasons why the use of the
larger tensile stress limit at transfer (7.5 cif ' ) used by the PSTRS14 program (TxDOT 1980) is
reasonable:
1. PSTRS14 conservatively assumes that the strands develop instantaneously at the end
of the girder when actually it takes about 60 bar diameters in length from the end of
the beam for the strand to fully transfer the prestressing force.
2. Some bonded reinforcement is provided at the beam end near the top face, so it is
justifiable to adopt the higher limiting value for the initial stresses.
3. There is a large end block area that is typically not taken into account in the
computation of flexural stresses at the end of the beam. In general, designs only
consider the section of the beam in the end regions, and the only available concrete to
resist tension is that in the top flange (two small flanges in the U54 beam), when
actually, the entire solid section of the beam is available to resist the forces at that
section. Thus, the tensile stress at the top fiber is lower than computed at the beam
ends.
4. Finally, the high tensile stress produced at the beam ends during transfer is a
temporary condition. If a crack occurs in the top of the beam at the end regions, it
will close when the concrete slab is poured. Thus, in the final condition, the tensile
stresses at the end of the beam will be reduced.
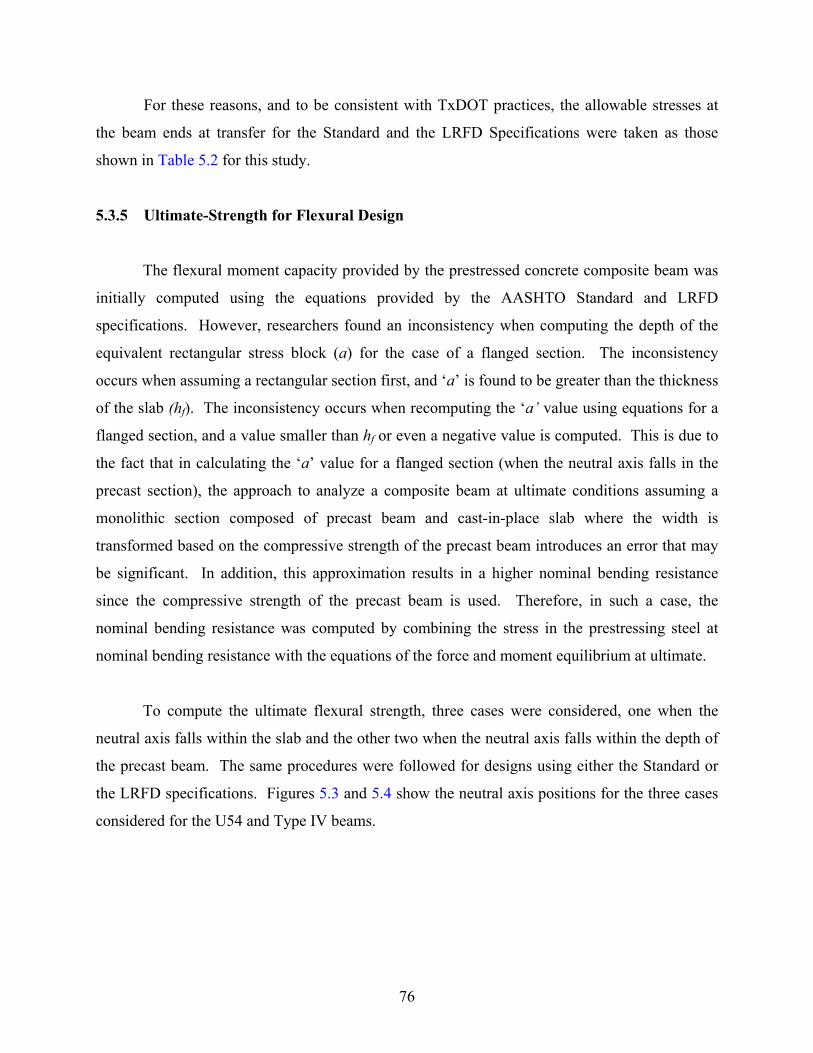
76
For these reasons, and to be consistent with TxDOT practices, the allowable stresses at
the beam ends at transfer for the Standard and the LRFD Specifications were taken as those
shown in Table 5.2 for this study.
5.3.5 Ultimate-Strength for Flexural Design
The flexural moment capacity provided by the prestressed concrete composite beam was
initially computed using the equations provided by the AASHTO Standard and LRFD
specifications. However, researchers found an inconsistency when computing the depth of the
equivalent rectangular stress block (a) for the case of a flanged section. The inconsistency
occurs when assuming a rectangular section first, and ‘a’ is found to be greater than the thickness
of the slab (hf). The inconsistency occurs when recomputing the ‘a’ value using equations for a
flanged section, and a value smaller than hf or even a negative value is computed. This is due to
the fact that in calculating the ‘a’ value for a flanged section (when the neutral axis falls in the
precast section), the approach to analyze a composite beam at ultimate conditions assuming a
monolithic section composed of precast beam and cast-in-place slab where the width is
transformed based on the compressive strength of the precast beam introduces an error that may
be significant. In addition, this approximation results in a higher nominal bending resistance
since the compressive strength of the precast beam is used. Therefore, in such a case, the
nominal bending resistance was computed by combining the stress in the prestressing steel at
nominal bending resistance with the equations of the force and moment equilibrium at ultimate.
To compute the ultimate flexural strength, three cases were considered, one when the
neutral axis falls within the slab and the other two when the neutral axis falls within the depth of
the precast beam. The same procedures were followed for designs using either the Standard or
the LRFD specifications. Figures 5.3 and 5.4 show the neutral axis positions for the three cases
considered for the U54 and Type IV beams.
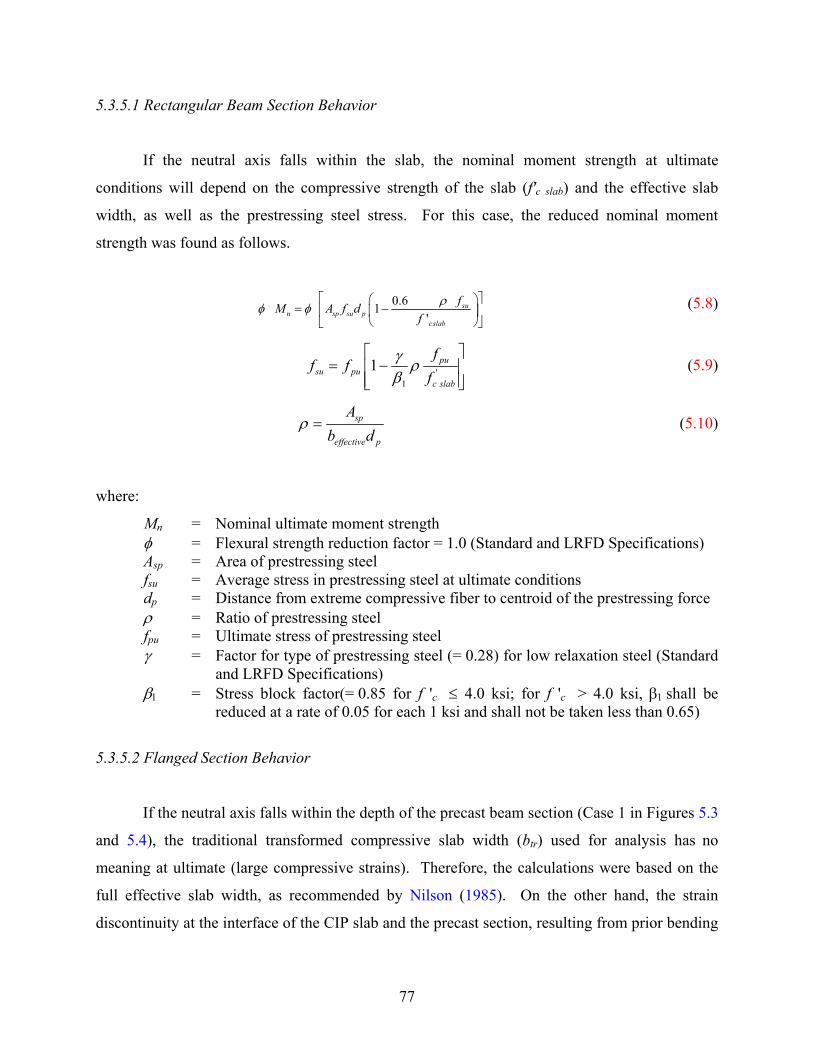
77
5.3.5.1 Rectangular Beam Section Behavior
If the neutral axis falls within the slab, the nominal moment strength at ultimate
conditions will depend on the compressive strength of the slab (f'c slab) and the effective slab
width, as well as the prestressing steel stress. For this case, the reduced nominal moment
strength was found as follows.
0.61'
sun sp su p
cslab
fM A f df
ρφ φ
= −
(5.8)
'1
1 pusu pu
c slab
ff f
fγ ρβ
= −
(5.9)
sp
effective p
Ab d
ρ = (5.10)
where:
Mn = Nominal ultimate moment strength φ = Flexural strength reduction factor = 1.0 (Standard and LRFD Specifications) Asp = Area of prestressing steel fsu = Average stress in prestressing steel at ultimate conditions dp = Distance from extreme compressive fiber to centroid of the prestressing force ρ = Ratio of prestressing steel fpu = Ultimate stress of prestressing steel γ = Factor for type of prestressing steel (= 0.28) for low relaxation steel (Standard
and LRFD Specifications) β1 = Stress block factor(= 0.85 for f 'c ≤ 4.0 ksi; for f 'c > 4.0 ksi, β1 shall be
reduced at a rate of 0.05 for each 1 ksi and shall not be taken less than 0.65)
5.3.5.2 Flanged Section Behavior
If the neutral axis falls within the depth of the precast beam section (Case 1 in Figures 5.3
and 5.4), the traditional transformed compressive slab width (btr) used for analysis has no
meaning at ultimate (large compressive strains). Therefore, the calculations were based on the
full effective slab width, as recommended by Nilson (1985). On the other hand, the strain
discontinuity at the interface of the CIP slab and the precast section, resulting from prior bending
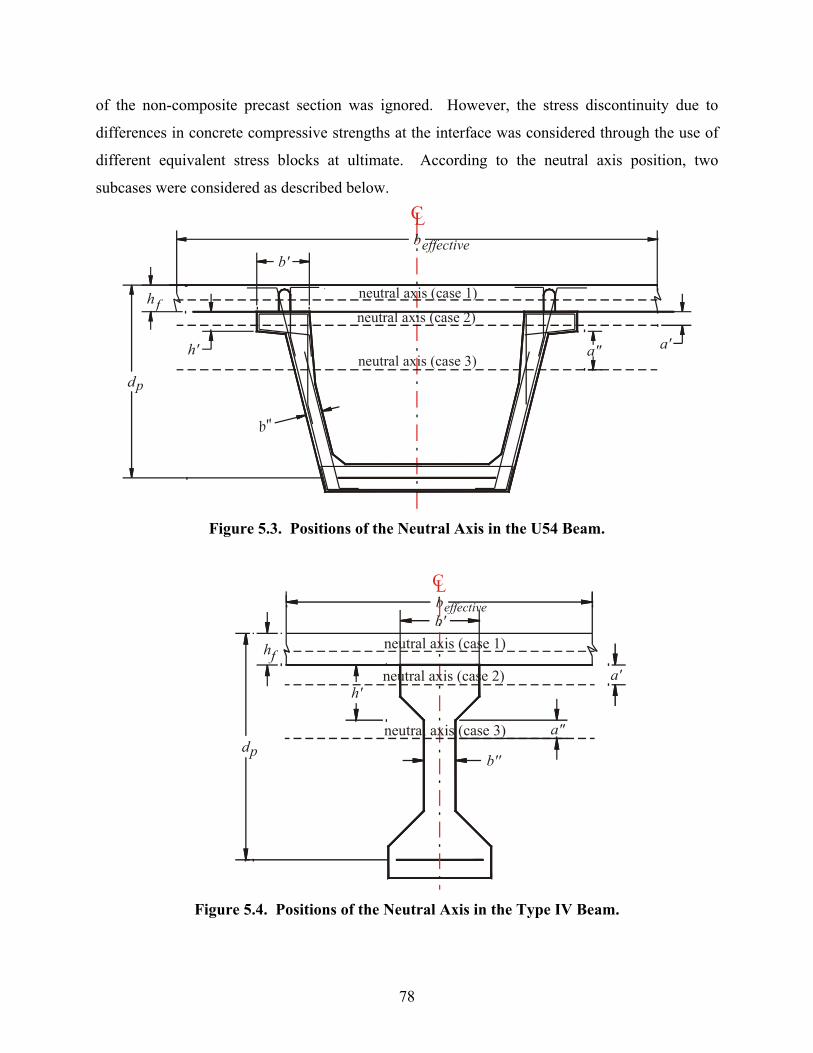
78
of the non-composite precast section was ignored. However, the stress discontinuity due to
differences in concrete compressive strengths at the interface was considered through the use of
different equivalent stress blocks at ultimate. According to the neutral axis position, two
subcases were considered as described below.
b
a'
hneutral axis (case 2)
h'
effective
neutral axis (case 3)
fneutral axis (case 1)
dp
b'
a"
b''
CL
Figure 5.3. Positions of the Neutral Axis in the U54 Beam.
h'
b''d
hf
neutral axis (case 3)
neutral axis (case 1)
neutral axis (case 2)
b'
a'
a"
CL
p
beffective
Figure 5.4. Positions of the Neutral Axis in the Type IV Beam.
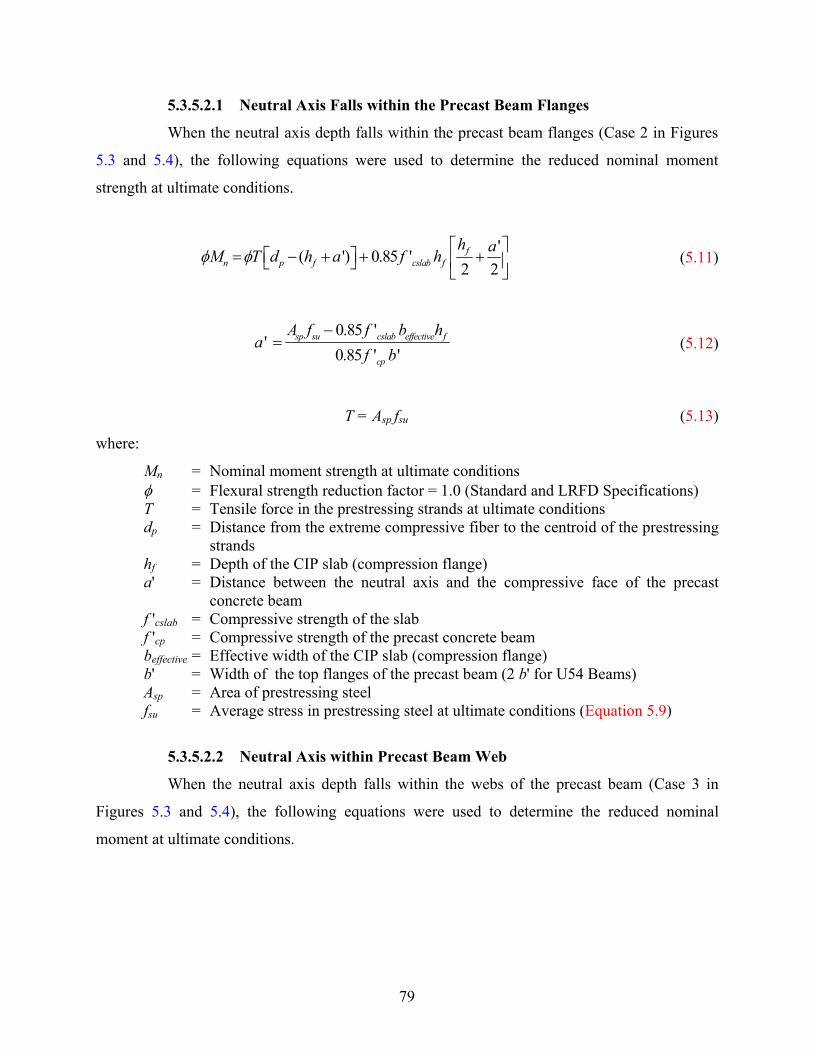
79
5.3.5.2.1 Neutral Axis Falls within the Precast Beam Flanges
When the neutral axis depth falls within the precast beam flanges (Case 2 in Figures
5.3 and 5.4), the following equations were used to determine the reduced nominal moment
strength at ultimate conditions.
'( ') 0.85 '2 2
fn p f cslab f
h aM T d h a f hφ φ = − + + +
(5.11)
0.85 '
'0.85 ' '
sp su cslab effective f
cp
A f f b ha
f b−
= (5.12)
T = Asp fsu (5.13)
where:
Mn = Nominal moment strength at ultimate conditions φ = Flexural strength reduction factor = 1.0 (Standard and LRFD Specifications) T = Tensile force in the prestressing strands at ultimate conditions dp = Distance from the extreme compressive fiber to the centroid of the prestressing
strands hf = Depth of the CIP slab (compression flange) a' = Distance between the neutral axis and the compressive face of the precast
concrete beam f 'cslab = Compressive strength of the slab f 'cp = Compressive strength of the precast concrete beam beffective = Effective width of the CIP slab (compression flange) b' = Width of the top flanges of the precast beam (2 b' for U54 Beams) Asp = Area of prestressing steel fsu = Average stress in prestressing steel at ultimate conditions (Equation 5.9)
5.3.5.2.2 Neutral Axis within Precast Beam Web
When the neutral axis depth falls within the webs of the precast beam (Case 3 in
Figures 5.3 and 5.4), the following equations were used to determine the reduced nominal
moment at ultimate conditions.
80
( )" " ' "' 0.85 ' ' 0.85 ' ' '2 2 2 2 2
fn p f cs effective f cp
ha a h aM T d h h f b h h f b hφ φ = − + + + + + + + (5.14)
0.85 ' (0.85 ' ' ')"
0.85 ' "sp su cslab effective f c
cp
A f f b h f b ha
f b− −
= (5.15)
T = Asp fsu (5.16)
where:
a'' = Distance between the neutral axis and the bottom face of the precast concrete beam
b'' = Width of the webs of the precast beam (2 b'' for U54 Beams) h' = Depth of the flange of the precast beam
5.3.5.3 Design Ultimate Moment Strength
The required ultimate moment for design according to the AASHTO Standard and LRFD
Specifications (AASHTO 2002 a,b) are as follows.
Mu = 1.30(MD + MSD + MCSD + 1.67ML+I) AASHTO Standard Specs. (5.17)
Mu = 1.00(1.25MD + MSD + MCSD + 1.75ML+I) AASHTO LRFD Specs. (5.18)
The designs must satisfy the following relationship.
φ Mn ≥ Mu (5.19)
where:
Mn = Nominal moment strength at ultimate conditions φ = Flexural strength reduction factor = 1.0 (Standard and LRFD Specifications) Mu = Required ultimate moment for design (factored moment)
81
5.4 DESIGN PARAMETERS
The selected variables for the overall parametric study are shown in Table 5.3. Table 5.4
shows additional design variables considered in the parametric study.
Table 5.3. Design Parameters. Variable Description / Selected Values
Codes AASHTO Standard and LRFD Specifications (AASHTO 2002 a,b)
Concrete Strength (psi) 6000, 8000, 10000, and 12000 (f 'ci is initially set at 0.75 f 'c, but allowed to vary up to f 'c)
Girder Sections Texas U54 and AASHTO Type IV Girder Spacing for U54 Beams (ft.)
8.5, 10, 11.5, 14.0, and 16.67
Girder Spacing for Type IV Beams (ft.)
4.25, 5, 5.75, 7.0, 8.5, and 9
Spans (L) 90 ft. to maximum span at 10 ft. intervals Diameter Strands (inches) 0.5 and 0.6
Table 5.4. Additional Design Variables. Category Description Selected Parameter
Ultimate Strength (fpu) 270 ksi – low relaxation Jacking Stress Limit (fpj) 0.75 fpu
Prestressing Strands
Yield Strength (fpy) 0.9 fpu Unit Weight (wc) 150 pcf Concrete-Precast Modulus of Elasticity (Ep) 33 wc
1.5 cf ' (f 'c precast)
Unit Weight (wc) 150 pcf Modulus of Elasticity (Ecip) 33 wc
1.5 cf ' (f 'c CIP)
Specified Compressive Strength (f 'c) 4000 psi
Concrete-CIP Slab
Modular ratio (n) Ecip/Ep Relative Humidity 75 % Non-composite dead loads
Two interior diaphragms of 3 kips each, accounted as two concentrated dead loads each located at 10 ft. from the beam midspan (only for U54 Beams). Haunch and overlay loads are not used
Other
Composite dead loads 1/3 of a T501 rail (1/3*0.333 klf = 0.110 klf)
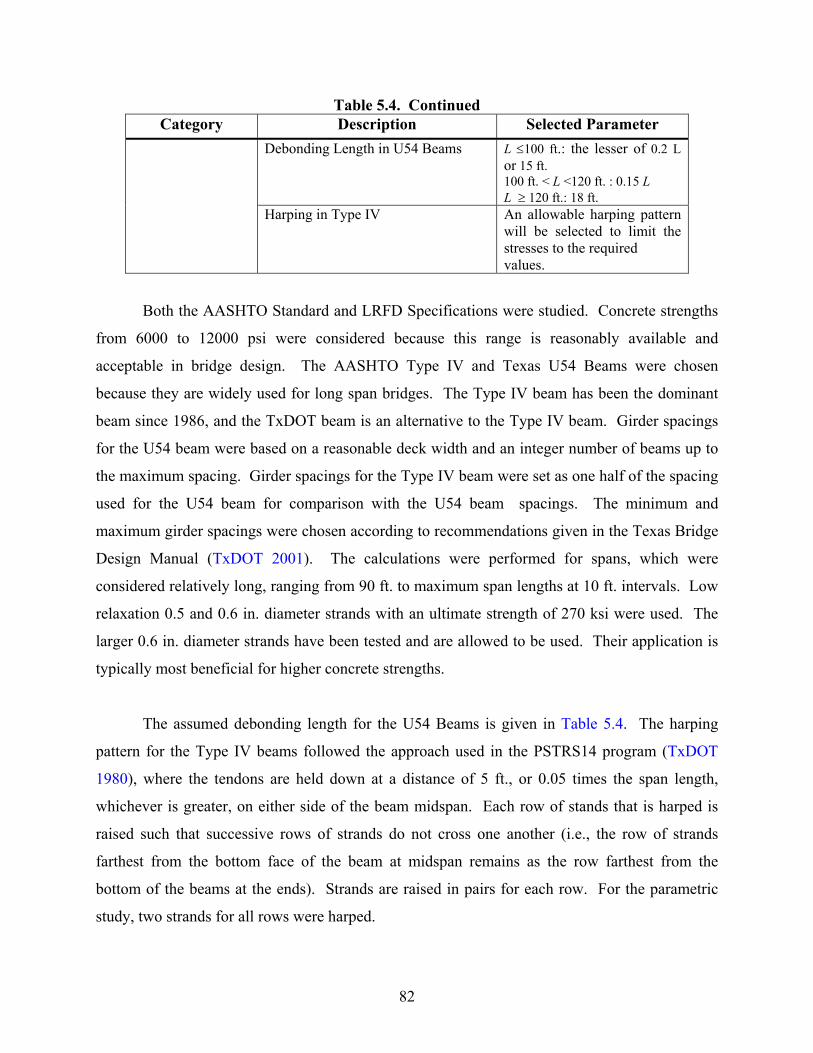
82
Table 5.4. Continued Category Description Selected Parameter
Debonding Length in U54 Beams L ≤100 ft.: the lesser of 0.2 L or 15 ft. 100 ft. < L <120 ft. : 0.15 L L ≥ 120 ft.: 18 ft.
Harping in Type IV An allowable harping pattern will be selected to limit the stresses to the required values.
Both the AASHTO Standard and LRFD Specifications were studied. Concrete strengths
from 6000 to 12000 psi were considered because this range is reasonably available and
acceptable in bridge design. The AASHTO Type IV and Texas U54 Beams were chosen
because they are widely used for long span bridges. The Type IV beam has been the dominant
beam since 1986, and the TxDOT beam is an alternative to the Type IV beam. Girder spacings
for the U54 beam were based on a reasonable deck width and an integer number of beams up to
the maximum spacing. Girder spacings for the Type IV beam were set as one half of the spacing
used for the U54 beam for comparison with the U54 beam spacings. The minimum and
maximum girder spacings were chosen according to recommendations given in the Texas Bridge
Design Manual (TxDOT 2001). The calculations were performed for spans, which were
considered relatively long, ranging from 90 ft. to maximum span lengths at 10 ft. intervals. Low
relaxation 0.5 and 0.6 in. diameter strands with an ultimate strength of 270 ksi were used. The
larger 0.6 in. diameter strands have been tested and are allowed to be used. Their application is
typically most beneficial for higher concrete strengths.
The assumed debonding length for the U54 Beams is given in Table 5.4. The harping
pattern for the Type IV beams followed the approach used in the PSTRS14 program (TxDOT
1980), where the tendons are held down at a distance of 5 ft., or 0.05 times the span length,
whichever is greater, on either side of the beam midspan. Each row of stands that is harped is
raised such that successive rows of strands do not cross one another (i.e., the row of strands
farthest from the bottom face of the beam at midspan remains as the row farthest from the
bottom of the beams at the ends). Strands are raised in pairs for each row. For the parametric
study, two strands for all rows were harped.
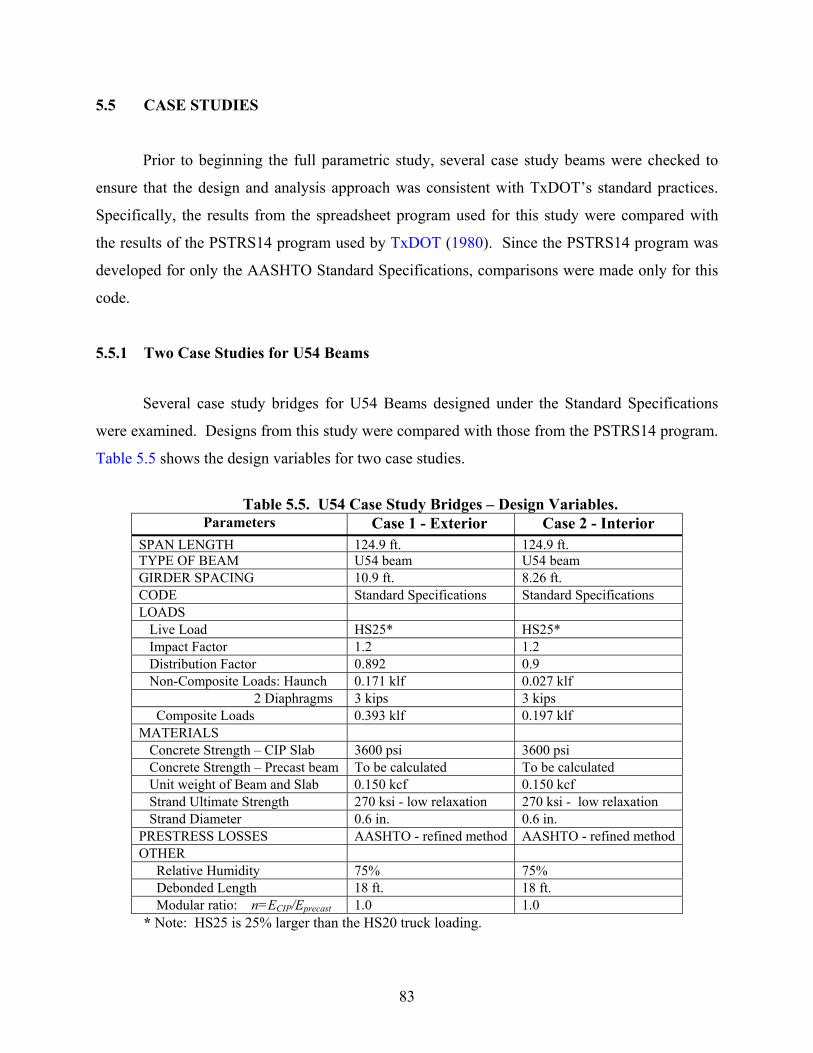
83
5.5 CASE STUDIES
Prior to beginning the full parametric study, several case study beams were checked to
ensure that the design and analysis approach was consistent with TxDOT’s standard practices.
Specifically, the results from the spreadsheet program used for this study were compared with
the results of the PSTRS14 program used by TxDOT (1980). Since the PSTRS14 program was
developed for only the AASHTO Standard Specifications, comparisons were made only for this
code.
5.5.1 Two Case Studies for U54 Beams
Several case study bridges for U54 Beams designed under the Standard Specifications
were examined. Designs from this study were compared with those from the PSTRS14 program.
Table 5.5 shows the design variables for two case studies.
Table 5.5. U54 Case Study Bridges – Design Variables.
Parameters Case 1 - Exterior Case 2 - Interior SPAN LENGTH 124.9 ft. 124.9 ft.TYPE OF BEAM U54 beam U54 beam GIRDER SPACING 10.9 ft. 8.26 ft. CODE Standard Specifications Standard Specifications LOADS Live Load HS25* HS25* Impact Factor 1.2 1.2 Distribution Factor 0.892 0.9 Non-Composite Loads: Haunch 0.171 klf 0.027 klf 2 Diaphragms 3 kips 3 kips Composite Loads 0.393 klf 0.197 klf MATERIALS Concrete Strength – CIP Slab 3600 psi 3600 psi Concrete Strength – Precast beam To be calculated To be calculated Unit weight of Beam and Slab 0.150 kcf 0.150 kcf Strand Ultimate Strength 270 ksi - low relaxation 270 ksi - low relaxation Strand Diameter 0.6 in. 0.6 in. PRESTRESS LOSSES AASHTO - refined method AASHTO - refined methodOTHER Relative Humidity 75% 75% Debonded Length 18 ft. 18 ft. Modular ratio: n=ECIP/Eprecast 1.0 1.0
* Note: HS25 is 25% larger than the HS20 truck loading.
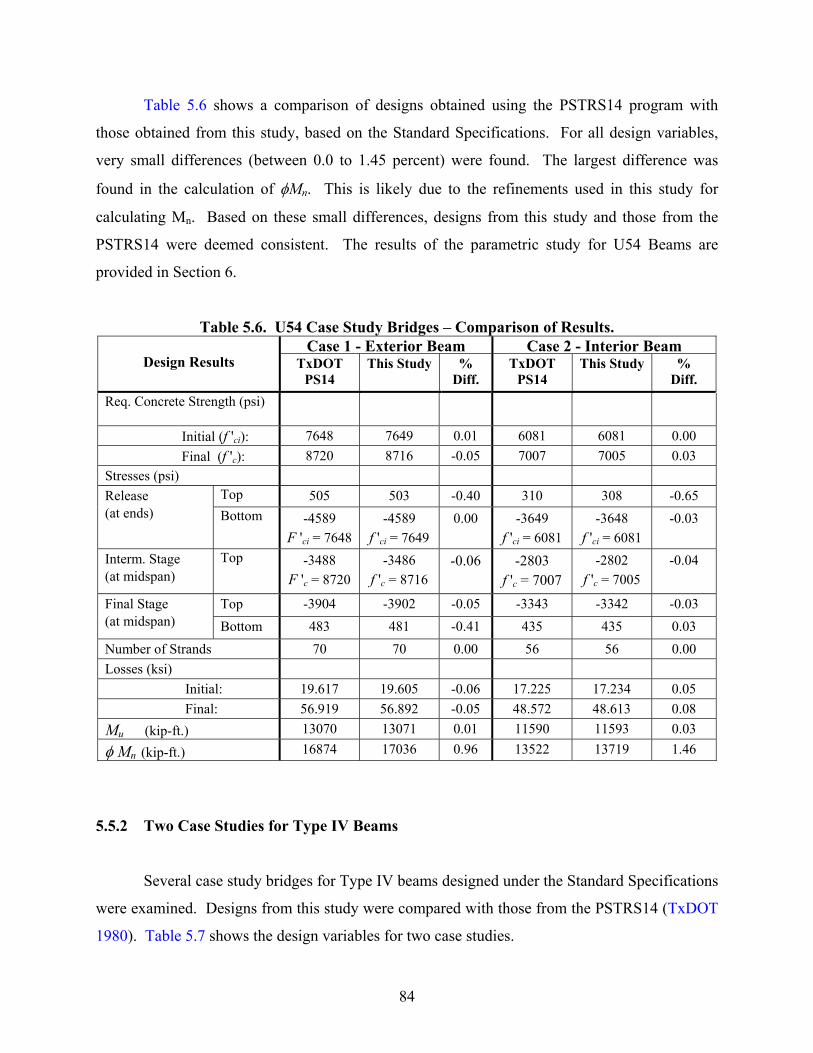
84
Table 5.6 shows a comparison of designs obtained using the PSTRS14 program with
those obtained from this study, based on the Standard Specifications. For all design variables,
very small differences (between 0.0 to 1.45 percent) were found. The largest difference was
found in the calculation of φMn. This is likely due to the refinements used in this study for
calculating Mn. Based on these small differences, designs from this study and those from the
PSTRS14 were deemed consistent. The results of the parametric study for U54 Beams are
provided in Section 6.
Table 5.6. U54 Case Study Bridges – Comparison of Results. Case 1 - Exterior Beam Case 2 - Interior Beam
Design Results TxDOT PS14
This Study % Diff.
TxDOT PS14
This Study % Diff.
Req. Concrete Strength (psi)
Initial (f 'ci): 7648 7649 0.01 6081 6081 0.00 Final (f 'c): 8720 8716 -0.05 7007 7005 0.03 Stresses (psi)
Top 505 503 -0.40 310 308 -0.65 Release (at ends) Bottom -4589
F 'ci = 7648 -4589
f 'ci = 7649 0.00 -3649
f 'ci = 6081 -3648
f 'ci = 6081 -0.03
Interm. Stage (at midspan)
Top -3488 F 'c = 8720
-3486 f 'c = 8716
-0.06 -2803 f 'c = 7007
-2802 f 'c = 7005
-0.04
Top -3904 -3902 -0.05 -3343 -3342 -0.03 Final Stage (at midspan) Bottom 483 481 -0.41 435 435 0.03 Number of Strands 70 70 0.00 56 56 0.00 Losses (ksi) Initial: 19.617 19.605 -0.06 17.225 17.234 0.05 Final: 56.919 56.892 -0.05 48.572 48.613 0.08 Mu (kip-ft.) 13070 13071 0.01 11590 11593 0.03
φ Mn (kip-ft.) 16874 17036 0.96 13522 13719 1.46
5.5.2 Two Case Studies for Type IV Beams
Several case study bridges for Type IV beams designed under the Standard Specifications
were examined. Designs from this study were compared with those from the PSTRS14 (TxDOT
1980). Table 5.7 shows the design variables for two case studies.
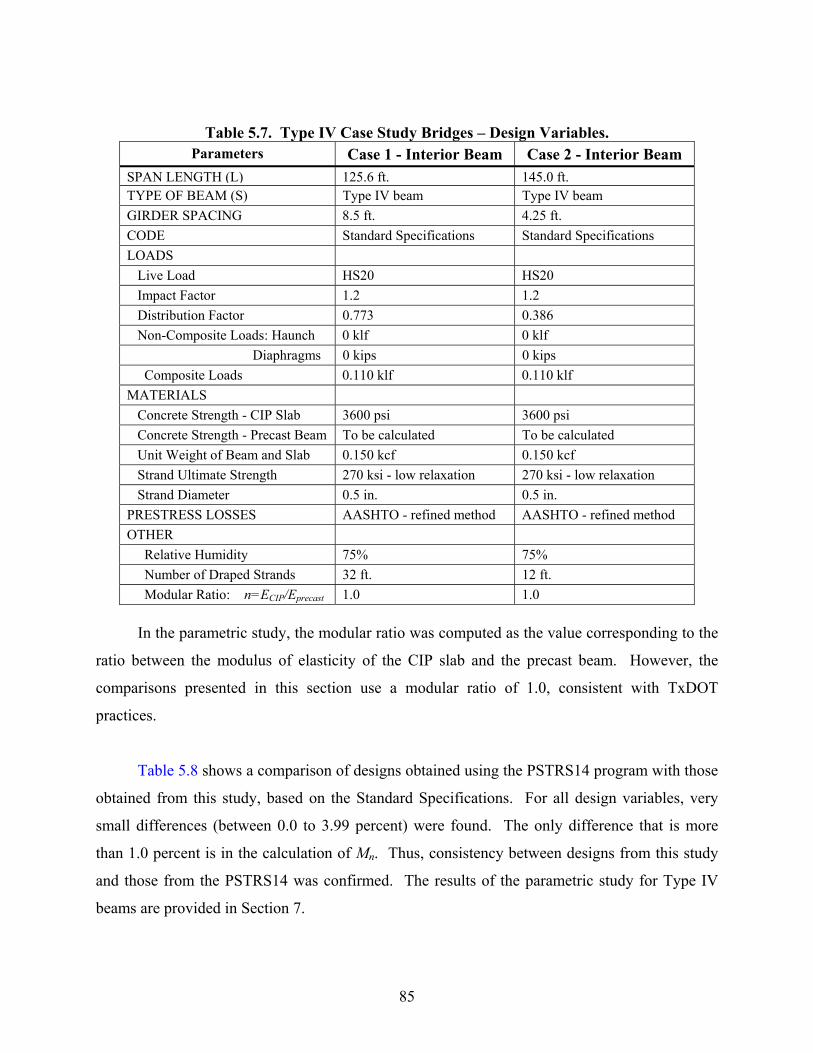
85
Table 5.7. Type IV Case Study Bridges – Design Variables. Parameters Case 1 - Interior Beam Case 2 - Interior Beam
SPAN LENGTH (L) 125.6 ft. 145.0 ft.TYPE OF BEAM (S) Type IV beam Type IV beam GIRDER SPACING 8.5 ft. 4.25 ft. CODE Standard Specifications Standard Specifications LOADS Live Load HS20 HS20 Impact Factor 1.2 1.2 Distribution Factor 0.773 0.386 Non-Composite Loads: Haunch 0 klf 0 klf Diaphragms 0 kips 0 kips Composite Loads 0.110 klf 0.110 klf MATERIALS Concrete Strength - CIP Slab 3600 psi 3600 psi Concrete Strength - Precast Beam To be calculated To be calculated Unit Weight of Beam and Slab 0.150 kcf 0.150 kcf Strand Ultimate Strength 270 ksi - low relaxation 270 ksi - low relaxation Strand Diameter 0.5 in. 0.5 in. PRESTRESS LOSSES AASHTO - refined method AASHTO - refined method OTHER Relative Humidity 75% 75% Number of Draped Strands 32 ft. 12 ft. Modular Ratio: n=ECIP/Eprecast 1.0 1.0
In the parametric study, the modular ratio was computed as the value corresponding to the
ratio between the modulus of elasticity of the CIP slab and the precast beam. However, the
comparisons presented in this section use a modular ratio of 1.0, consistent with TxDOT
practices.
Table 5.8 shows a comparison of designs obtained using the PSTRS14 program with those
obtained from this study, based on the Standard Specifications. For all design variables, very
small differences (between 0.0 to 3.99 percent) were found. The only difference that is more
than 1.0 percent is in the calculation of Mn. Thus, consistency between designs from this study
and those from the PSTRS14 was confirmed. The results of the parametric study for Type IV
beams are provided in Section 7.
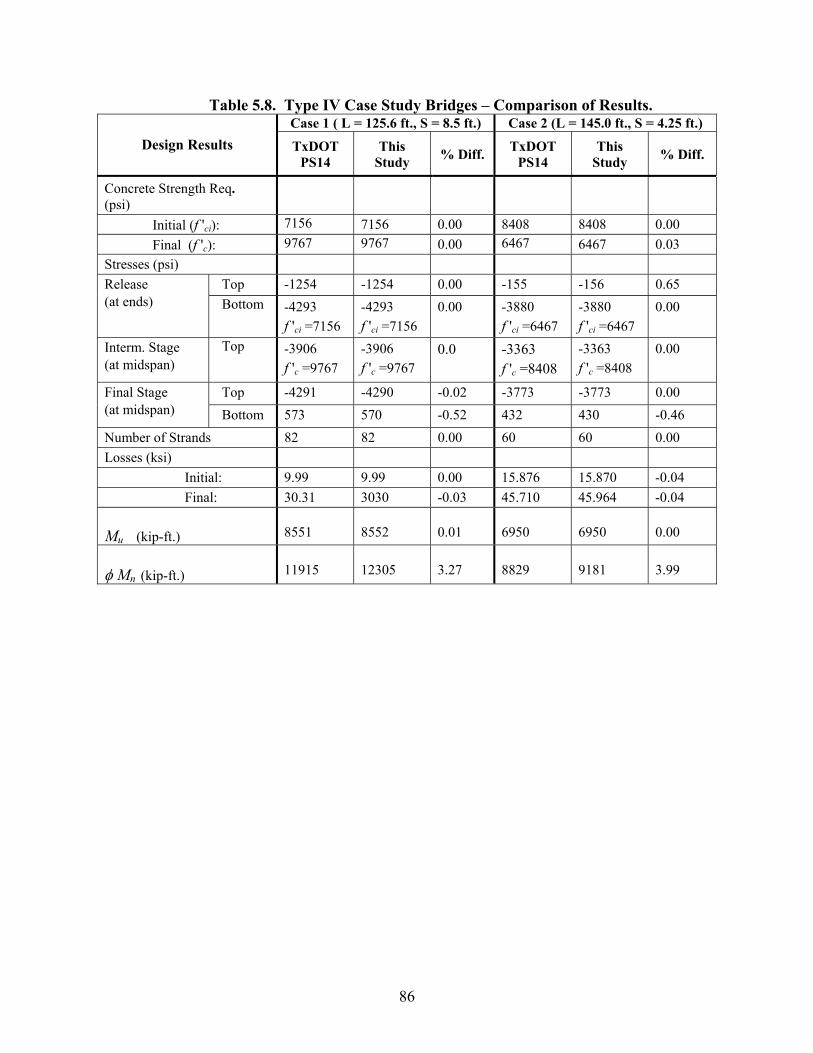
86
Table 5.8. Type IV Case Study Bridges – Comparison of Results. Case 1 ( L = 125.6 ft., S = 8.5 ft.) Case 2 (L = 145.0 ft., S = 4.25 ft.)
Design Results TxDOT PS14
This Study % Diff. TxDOT
PS14 This
Study % Diff.
Concrete Strength Req. (psi)
Initial (f 'ci): 7156 7156 0.00 8408 8408 0.00 Final (f 'c): 9767 9767 0.00 6467 6467 0.03 Stresses (psi)
Top -1254 -1254 0.00 -155 -156 0.65 Release (at ends) Bottom -4293
f 'ci =7156 -4293 f 'ci =7156
0.00 -3880 f 'ci =6467
-3880 f 'ci =6467
0.00
Interm. Stage (at midspan)
Top -3906 f 'c =9767
-3906 f 'c =9767
0.0 -3363 f 'c =8408
-3363 f 'c =8408
0.00
Top -4291 -4290 -0.02 -3773 -3773 0.00 Final Stage (at midspan) Bottom 573 570 -0.52 432 430 -0.46 Number of Strands 82 82 0.00 60 60 0.00 Losses (ksi) Initial: 9.99 9.99 0.00 15.876 15.870 -0.04 Final: 30.31 3030 -0.03 45.710 45.964 -0.04 Mu (kip-ft.)
8551
8552
0.01
6950
6950
0.00
φ Mn (kip-ft.)
11915
12305
3.27
8829
9181
3.99
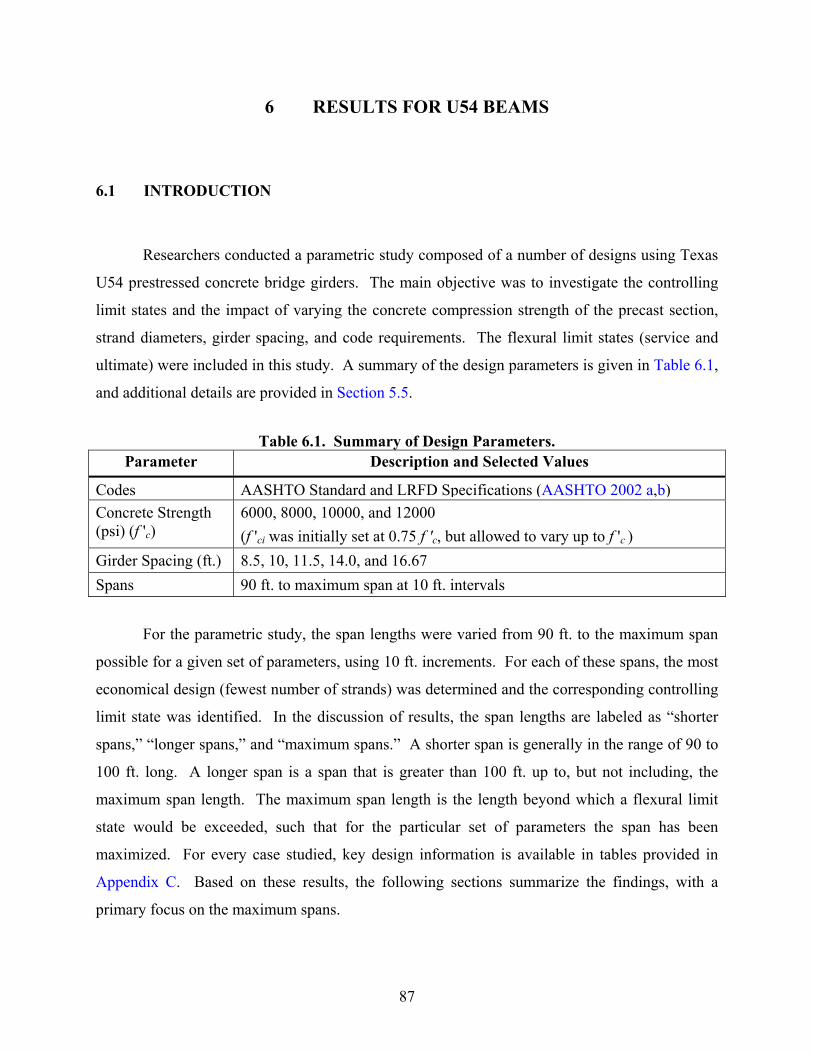
87
6 RESULTS FOR U54 BEAMS
6.1 INTRODUCTION
Researchers conducted a parametric study composed of a number of designs using Texas
U54 prestressed concrete bridge girders. The main objective was to investigate the controlling
limit states and the impact of varying the concrete compression strength of the precast section,
strand diameters, girder spacing, and code requirements. The flexural limit states (service and
ultimate) were included in this study. A summary of the design parameters is given in Table 6.1,
and additional details are provided in Section 5.5.
Table 6.1. Summary of Design Parameters.
Parameter Description and Selected Values
Codes AASHTO Standard and LRFD Specifications (AASHTO 2002 a,b)Concrete Strength (psi) (f 'c)
6000, 8000, 10000, and 12000 (f 'ci was initially set at 0.75 f 'c, but allowed to vary up to f 'c )
Girder Spacing (ft.) 8.5, 10, 11.5, 14.0, and 16.67 Spans 90 ft. to maximum span at 10 ft. intervals
For the parametric study, the span lengths were varied from 90 ft. to the maximum span
possible for a given set of parameters, using 10 ft. increments. For each of these spans, the most
economical design (fewest number of strands) was determined and the corresponding controlling
limit state was identified. In the discussion of results, the span lengths are labeled as “shorter
spans,” “longer spans,” and “maximum spans.” A shorter span is generally in the range of 90 to
100 ft. long. A longer span is a span that is greater than 100 ft. up to, but not including, the
maximum span length. The maximum span length is the length beyond which a flexural limit
state would be exceeded, such that for the particular set of parameters the span has been
maximized. For every case studied, key design information is available in tables provided in
Appendix C. Based on these results, the following sections summarize the findings, with a
primary focus on the maximum spans.
88
6.2 DESCRIPTION OF CONTROLLING LIMIT STATES
A controlling limit state is defined for this study as the flexural design limit state that
dictates the required number of strands for a given geometry and demand. In the case of
establishing the maximum span length, the controlling limit state is defined as the limit state that
would be exceeded if the span was increased. Limit states include satisfying the allowable
stresses and required ultimate flexural strength, both at the maximum moment section along the
span and at the beam ends. The required number of strands (prestressing force) is determined to
ensure that the allowable stresses are not exceeded as the beam is loaded from the initial to the
final service stage. In addition, the ultimate flexural strength is checked. The required number
of strands is computed using a systematic approach that is based on attaining actual stresses as
near as possible to the corresponding allowable stresses for the considered load stages to achieve
the most economical design (see Section 5.4).
The number of strands, and consequently span lengths, are primarily controlled by one of
the four allowable stresses: compressive and tensile stresses at the beam ends upon release of the
prestressing strands, compressive sustained load stresses, and tensile service load stress; or by
the required flexural strength at ultimate conditions. The compressive service load stress and the
stresses at midspan at release were also considered in the design, but were not critical.
Combinations of the controlling limit states were also considered for the cases where temporary
allowable stresses at the beam ends or eccentricity limitations initially control the number of
strands that may be used, followed by exceeding the allowable stresses for the sustained or
service load conditions. According to the limits above, Table 6.2 identifies flexural limit states
that control the required number of strands for maximum span lengths for the U54 girders.
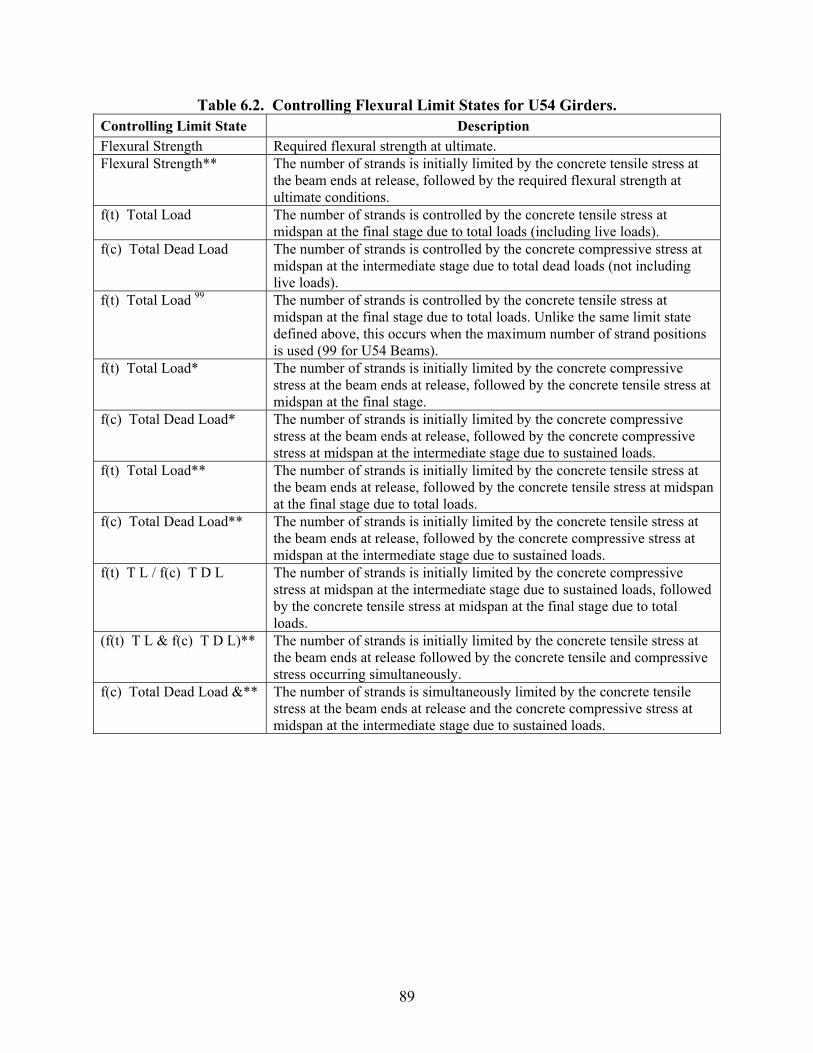
89
Table 6.2. Controlling Flexural Limit States for U54 Girders. Controlling Limit State Description Flexural Strength Required flexural strength at ultimate. Flexural Strength** The number of strands is initially limited by the concrete tensile stress at
the beam ends at release, followed by the required flexural strength at ultimate conditions.
f(t) Total Load The number of strands is controlled by the concrete tensile stress at midspan at the final stage due to total loads (including live loads).
f(c) Total Dead Load The number of strands is controlled by the concrete compressive stress at midspan at the intermediate stage due to total dead loads (not including live loads).
f(t) Total Load 99 The number of strands is controlled by the concrete tensile stress at midspan at the final stage due to total loads. Unlike the same limit state defined above, this occurs when the maximum number of strand positions is used (99 for U54 Beams).
f(t) Total Load* The number of strands is initially limited by the concrete compressive stress at the beam ends at release, followed by the concrete tensile stress at midspan at the final stage.
f(c) Total Dead Load* The number of strands is initially limited by the concrete compressive stress at the beam ends at release, followed by the concrete compressive stress at midspan at the intermediate stage due to sustained loads.
f(t) Total Load** The number of strands is initially limited by the concrete tensile stress at the beam ends at release, followed by the concrete tensile stress at midspan at the final stage due to total loads.
f(c) Total Dead Load** The number of strands is initially limited by the concrete tensile stress at the beam ends at release, followed by the concrete compressive stress at midspan at the intermediate stage due to sustained loads.
f(t) T L / f(c) T D L The number of strands is initially limited by the concrete compressive stress at midspan at the intermediate stage due to sustained loads, followed by the concrete tensile stress at midspan at the final stage due to total loads.
(f(t) T L & f(c) T D L)** The number of strands is initially limited by the concrete tensile stress at the beam ends at release followed by the concrete tensile and compressive stress occurring simultaneously.
f(c) Total Dead Load &** The number of strands is simultaneously limited by the concrete tensile stress at the beam ends at release and the concrete compressive stress at midspan at the intermediate stage due to sustained loads.
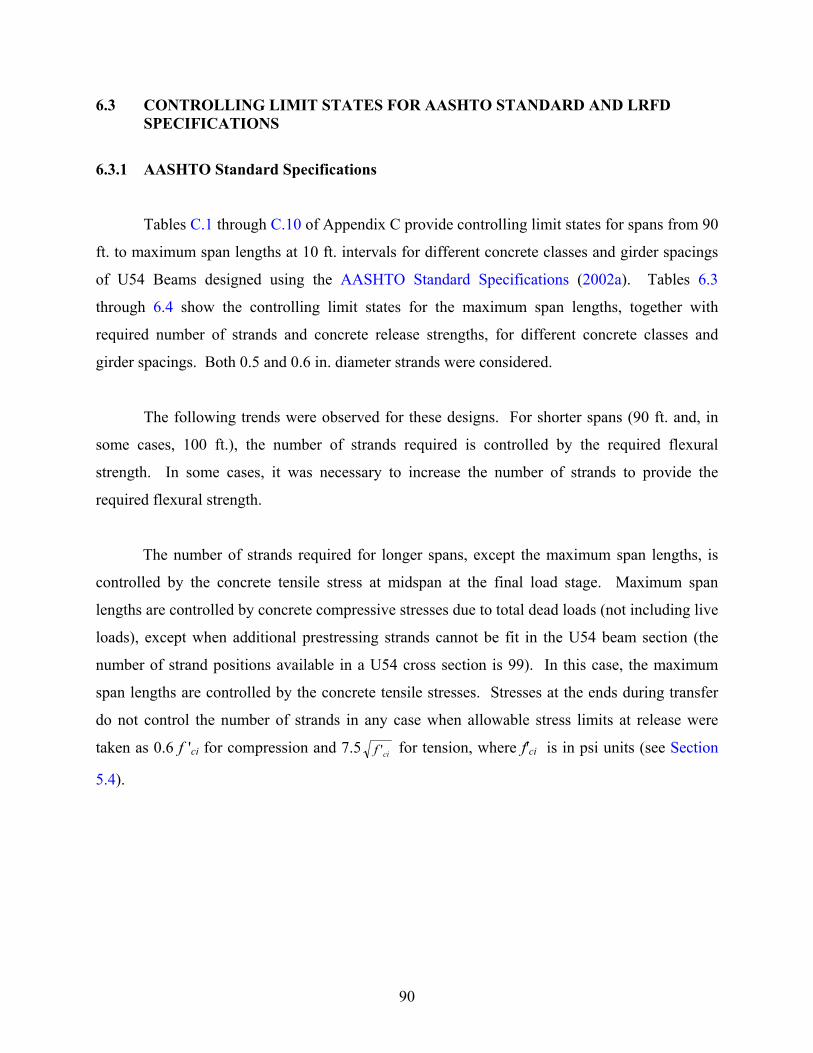
90
6.3 CONTROLLING LIMIT STATES FOR AASHTO STANDARD AND LRFD SPECIFICATIONS
6.3.1 AASHTO Standard Specifications
Tables C.1 through C.10 of Appendix C provide controlling limit states for spans from 90
ft. to maximum span lengths at 10 ft. intervals for different concrete classes and girder spacings
of U54 Beams designed using the AASHTO Standard Specifications (2002a). Tables 6.3
through 6.4 show the controlling limit states for the maximum span lengths, together with
required number of strands and concrete release strengths, for different concrete classes and
girder spacings. Both 0.5 and 0.6 in. diameter strands were considered.
The following trends were observed for these designs. For shorter spans (90 ft. and, in
some cases, 100 ft.), the number of strands required is controlled by the required flexural
strength. In some cases, it was necessary to increase the number of strands to provide the
required flexural strength.
The number of strands required for longer spans, except the maximum span lengths, is
controlled by the concrete tensile stress at midspan at the final load stage. Maximum span
lengths are controlled by concrete compressive stresses due to total dead loads (not including live
loads), except when additional prestressing strands cannot be fit in the U54 beam section (the
number of strand positions available in a U54 cross section is 99). In this case, the maximum
span lengths are controlled by the concrete tensile stresses. Stresses at the ends during transfer
do not control the number of strands in any case when allowable stress limits at release were
taken as 0.6 f 'ci for compression and 7.5 cif ' for tension, where f'ci is in psi units (see Section
5.4).
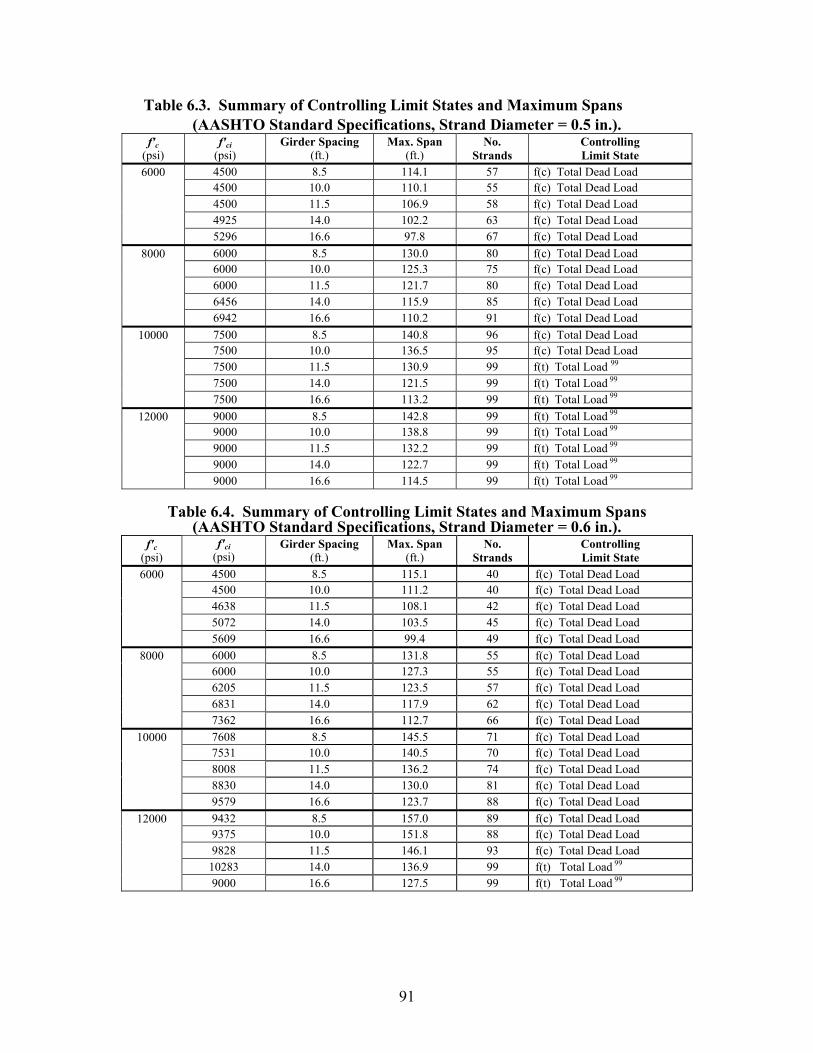
91
Table 6.3. Summary of Controlling Limit States and Maximum Spans (AASHTO Standard Specifications, Strand Diameter = 0.5 in.).
f'c (psi)
f'ci (psi)
Girder Spacing (ft.)
Max. Span (ft.)
No. Strands
Controlling Limit State
4500 8.5 114.1 57 f(c) Total Dead Load 6000 4500 10.0 110.1 55 f(c) Total Dead Load 4500 11.5 106.9 58 f(c) Total Dead Load 4925 14.0 102.2 63 f(c) Total Dead Load 5296 16.6 97.8 67 f(c) Total Dead Load
6000 8.5 130.0 80 f(c) Total Dead Load 8000 6000 10.0 125.3 75 f(c) Total Dead Load 6000 11.5 121.7 80 f(c) Total Dead Load 6456 14.0 115.9 85 f(c) Total Dead Load 6942 16.6 110.2 91 f(c) Total Dead Load
7500 8.5 140.8 96 f(c) Total Dead Load 10000 7500 10.0 136.5 95 f(c) Total Dead Load 7500 11.5 130.9 99 f(t) Total Load 99 7500 14.0 121.5 99 f(t) Total Load 99 7500 16.6 113.2 99 f(t) Total Load 99
9000 8.5 142.8 99 f(t) Total Load 99 12000 9000 10.0 138.8 99 f(t) Total Load 99 9000 11.5 132.2 99 f(t) Total Load 99 9000 14.0 122.7 99 f(t) Total Load 99 9000 16.6 114.5 99 f(t) Total Load 99
Table 6.4. Summary of Controlling Limit States and Maximum Spans
(AASHTO Standard Specifications, Strand Diameter = 0.6 in.). f'c
(psi) f'ci
(psi) Girder Spacing
(ft.) Max. Span
(ft.) No.
Strands Controlling Limit State
4500 8.5 115.1 40 f(c) Total Dead Load 6000 4500 10.0 111.2 40 f(c) Total Dead Load 4638 11.5 108.1 42 f(c) Total Dead Load 5072 14.0 103.5 45 f(c) Total Dead Load 5609 16.6 99.4 49 f(c) Total Dead Load
6000 8.5 131.8 55 f(c) Total Dead Load 8000 6000 10.0 127.3 55 f(c) Total Dead Load 6205 11.5 123.5 57 f(c) Total Dead Load 6831 14.0 117.9 62 f(c) Total Dead Load 7362 16.6 112.7 66 f(c) Total Dead Load
7608 8.5 145.5 71 f(c) Total Dead Load 10000 7531 10.0 140.5 70 f(c) Total Dead Load 8008 11.5 136.2 74 f(c) Total Dead Load 8830 14.0 130.0 81 f(c) Total Dead Load 9579 16.6 123.7 88 f(c) Total Dead Load
9432 8.5 157.0 89 f(c) Total Dead Load 12000 9375 10.0 151.8 88 f(c) Total Dead Load 9828 11.5 146.1 93 f(c) Total Dead Load 10283 14.0 136.9 99 f(t) Total Load 99 9000 16.6 127.5 99 f(t) Total Load 99
92
6.3.2 AASHTO LRFD Specifications
Tables C.11 through C.20 of Appendix C provide controlling limit states for spans from
90 ft. to maximum span lengths at 10 ft. intervals for different concrete strengths and spacing of
U54 girders designed under the AASHTO LRFD Specifications (2002). Tables 6.5 through 6.6
show the controlling limit states for maximum span lengths, together with the required number
of strands and concrete release strengths, for different concrete classes and girder spacings. Both
0.5 and 0.6 in. diameter strands were considered.
The following trends were observed for designs based on the AASHTO LRFD
Specifications. Like designs under the Standard Specifications, the number of strands required
for shorter spans (90 ft. and, in some cases, 100 ft.) is controlled by the required flexural strength
at ultimate conditions. In some cases, it was necessary to increase the number of strands to
provide the required flexural strength.
The number of strands required for longer spans, except the maximum span lengths, is
controlled by the concrete tensile stress under service loads at midspan. Maximum span lengths
are controlled by concrete compressive stresses due to total dead loads (not including live loads),
except when additional prestressing strands cannot be fit in the U54 beam. In this case,
maximum spans are controlled by the concrete tensile stress at service loads and at midspan.
Other exceptions were noted for wider girder spacings where maximum spans are limited
because the number of strands that could be used was controlled by the compressive or tensile
stress at the beam ends at release.
The concrete strength at release (f 'ci) is critical for LRFD designs with the wider girder
spacings (14 and 16.6 ft.) and concrete strengths up to 10000 psi. The stress limits at release
were taken as 0.6 f 'ci for compression and 6.96 cif ' for tension, where f 'ci is in psi units (see
Section 5.4).
93
Table 6.5. Summary of Controlling Limit States and Maximum Spans (AASHTO LRFD Specifications, Strand Diameter = 0.5 in.).
f'c (psi)
f'ci (psi)
Girder Spacing (ft.)
Max. Span (ft.)
No. Strands
Controlling Limit State
6000 4500 8.5 119.6 59 f(c) Total Dead Load 4547 10.0 115.7 61 f(c) Total Dead Load 4611 11.5 112.2 63 f(c) Total Dead Load 5973 14.0 106.3 77 f(t) Total Load* 5994 16.6 98.9 76 f(t) Total Load*
8000 6018 8.5 136.3 82 f(t) Total Dead Load 6276 10.0 131.8 85 f(c) Total Dead Load 6448 11.5 127.6 87 f(c) Total Dead Load 7228 14.0 115.0 99 f(t) Total Load 99 7347 16.6 107.6 99 f(t) Total Load 99
10000 7500 8.5 144.6 99 f(t) Total Load 99 7500 10.0 138.3 99 f(t) Total Load 99 7500 11.5 132.7 99 f(t) Total Load 99 7500 14.0 115.9 99 f(t) Total Load 99 7500 16.6 108.3 99 f(t) Total Load 99
12000 9000 8.5 145.9 99 f(t) Total Load 99 9000 10.0 139.5 99 f(t) Total Load 99 9000 11.5 133.9 99 f(t) Total Load 99 9000 14.0 116.9 99 f(t) Total Load 99 9000 16.6 109.3 99 f(t) Total Load 99
Table 6.6. Summary of Controlling Limit States and Maximum Spans (AASHTO LRFD Specifications, Strand Diameter = 0.6 in.).
f'c (psi)
f'ci (psi)
Girder Spacing (ft.)
Max. Span (ft.)
No. Strands
Controlling Limit State
6000 4500 8.5 120.9 43 f(c) Total Dead Load 4732 10.0 117.1 44 f(c) Total Dead Load 4909 11.5 113.6 45 f(c) Total Dead Load 5977 14.0 106.3 53 f(t) Total Load* 5932 16.6 95.8 48 f(t) Total Load**
8000 6301 8.5 138.3 59 f(c) Total Dead Load 6557 10.0 133.8 61 f(c) Total Dead Load 6699 11.5 129.6 62 f(c) Total Dead Load 7902 14.0 118.6 72 f(t) Total Load* 7965 16.6 101.9 55 f(t) Total Load**
10000 8195 8.5 152.9 77 f(c) Total Dead Load 8556 10.0 147.9 80 f(c) Total Dead Load 8902 11.5 143.2 83 f(c) Total Dead Load 9976 14.0 127.9 94 f(t) Total Load* 9777 16.6 110.1 68 f(t) Total Load**
12000 9937 8.5 162.8 97 f(t) T L / f(c) T D L 10093 10.0 155.9 99 f(t) Total Load 99 10135 11.5 149.5 99 f(t) Total Load 99 12277 14.0 129.5 99 f(t) Total Load 99 10343 16.6 120.9 99 f(t) Total Load 99
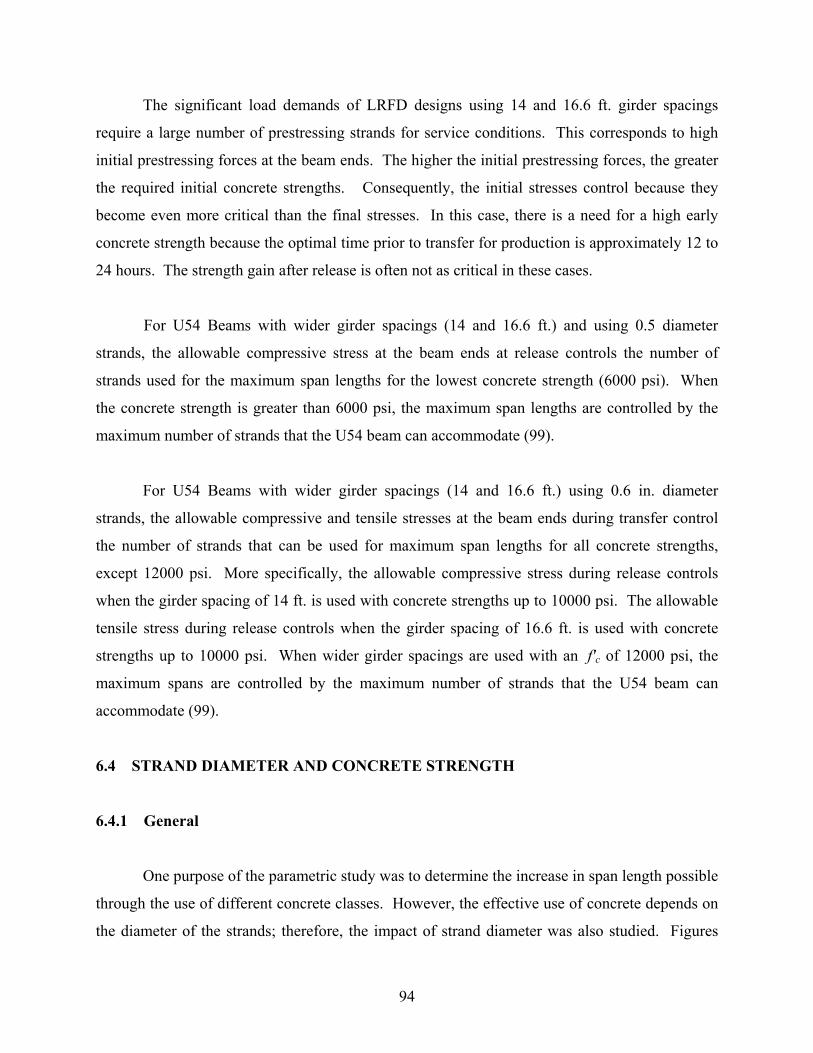
94
The significant load demands of LRFD designs using 14 and 16.6 ft. girder spacings
require a large number of prestressing strands for service conditions. This corresponds to high
initial prestressing forces at the beam ends. The higher the initial prestressing forces, the greater
the required initial concrete strengths. Consequently, the initial stresses control because they
become even more critical than the final stresses. In this case, there is a need for a high early
concrete strength because the optimal time prior to transfer for production is approximately 12 to
24 hours. The strength gain after release is often not as critical in these cases.
For U54 Beams with wider girder spacings (14 and 16.6 ft.) and using 0.5 diameter
strands, the allowable compressive stress at the beam ends at release controls the number of
strands used for the maximum span lengths for the lowest concrete strength (6000 psi). When
the concrete strength is greater than 6000 psi, the maximum span lengths are controlled by the
maximum number of strands that the U54 beam can accommodate (99).
For U54 Beams with wider girder spacings (14 and 16.6 ft.) using 0.6 in. diameter
strands, the allowable compressive and tensile stresses at the beam ends during transfer control
the number of strands that can be used for maximum span lengths for all concrete strengths,
except 12000 psi. More specifically, the allowable compressive stress during release controls
when the girder spacing of 14 ft. is used with concrete strengths up to 10000 psi. The allowable
tensile stress during release controls when the girder spacing of 16.6 ft. is used with concrete
strengths up to 10000 psi. When wider girder spacings are used with an f'c of 12000 psi, the
maximum spans are controlled by the maximum number of strands that the U54 beam can
accommodate (99).
6.4 STRAND DIAMETER AND CONCRETE STRENGTH
6.4.1 General
One purpose of the parametric study was to determine the increase in span length possible
through the use of different concrete classes. However, the effective use of concrete depends on
the diameter of the strands; therefore, the impact of strand diameter was also studied. Figures
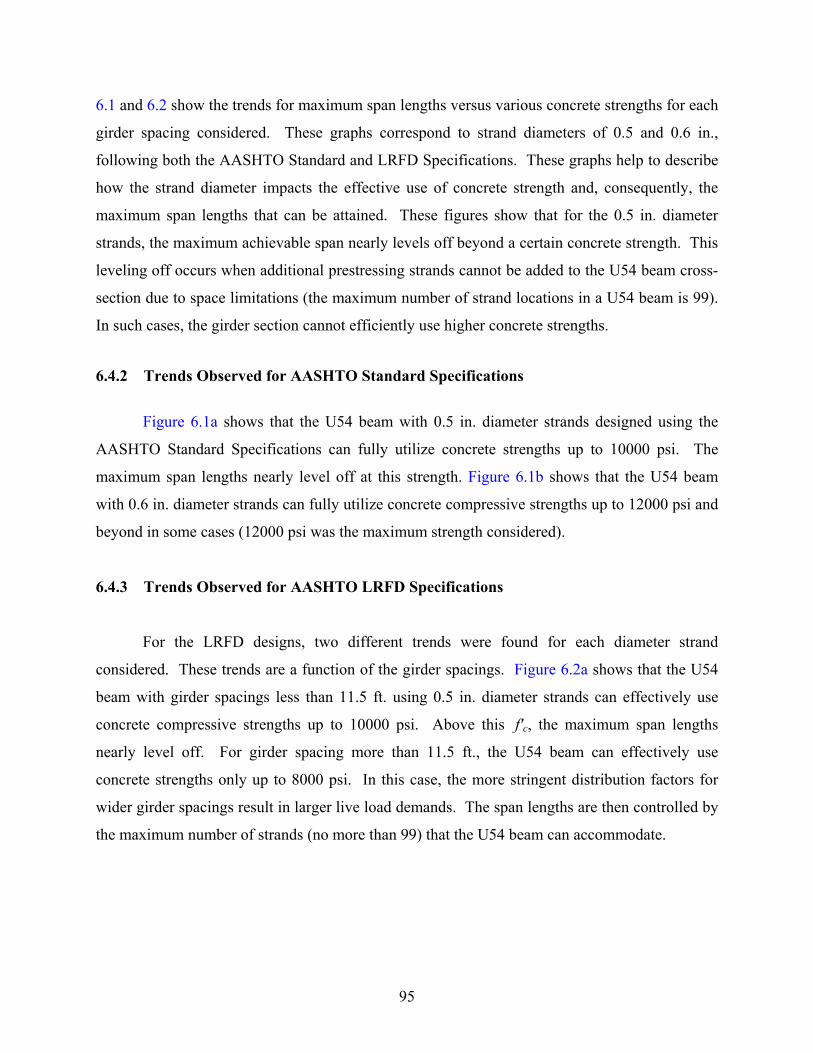
95
6.1 and 6.2 show the trends for maximum span lengths versus various concrete strengths for each
girder spacing considered. These graphs correspond to strand diameters of 0.5 and 0.6 in.,
following both the AASHTO Standard and LRFD Specifications. These graphs help to describe
how the strand diameter impacts the effective use of concrete strength and, consequently, the
maximum span lengths that can be attained. These figures show that for the 0.5 in. diameter
strands, the maximum achievable span nearly levels off beyond a certain concrete strength. This
leveling off occurs when additional prestressing strands cannot be added to the U54 beam cross-
section due to space limitations (the maximum number of strand locations in a U54 beam is 99).
In such cases, the girder section cannot efficiently use higher concrete strengths.
6.4.2 Trends Observed for AASHTO Standard Specifications
Figure 6.1a shows that the U54 beam with 0.5 in. diameter strands designed using the
AASHTO Standard Specifications can fully utilize concrete strengths up to 10000 psi. The
maximum span lengths nearly level off at this strength. Figure 6.1b shows that the U54 beam
with 0.6 in. diameter strands can fully utilize concrete compressive strengths up to 12000 psi and
beyond in some cases (12000 psi was the maximum strength considered).
6.4.3 Trends Observed for AASHTO LRFD Specifications
For the LRFD designs, two different trends were found for each diameter strand
considered. These trends are a function of the girder spacings. Figure 6.2a shows that the U54
beam with girder spacings less than 11.5 ft. using 0.5 in. diameter strands can effectively use
concrete compressive strengths up to 10000 psi. Above this f'c, the maximum span lengths
nearly level off. For girder spacing more than 11.5 ft., the U54 beam can effectively use
concrete strengths only up to 8000 psi. In this case, the more stringent distribution factors for
wider girder spacings result in larger live load demands. The span lengths are then controlled by
the maximum number of strands (no more than 99) that the U54 beam can accommodate.
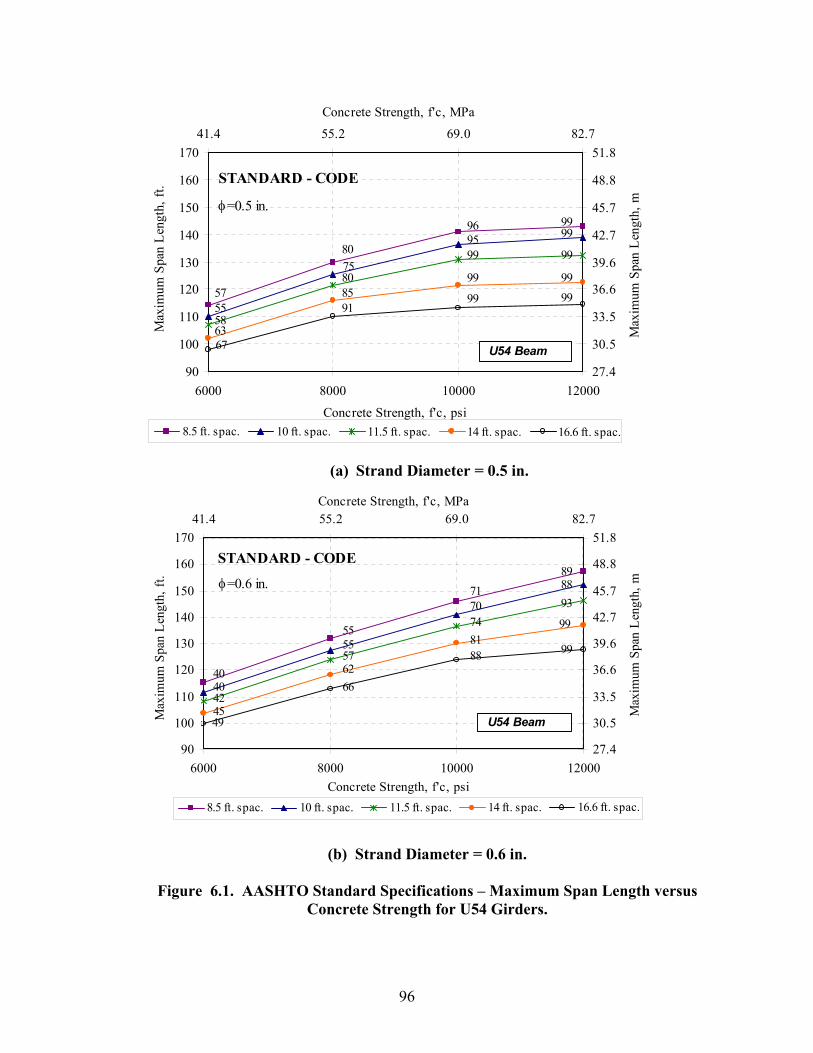
96
90
100
110
120
130
140
150
160
170
6000 8000 10000 12000
Concrete Strength, f'c, psi
Max
imum
Spa
n Le
ngth
, ft.
27.4
30.5
33.5
36.6
39.6
42.7
45.7
48.8
51.841.4 55.2 69.0 82.7
Concrete Strength, f'c, MPa
Max
imum
Spa
n Le
ngth
, m
8.5 ft. spac. 10 ft. spac. 11.5 ft. spac. 14 ft. spac. 16.6 ft. spac.
67
91
99 99
63
85
99 99
58
80
95 99
55
75
96 99
80
57 99 99
STANDARD - CODE
φ=0.5 in.
U54 Beam
(a) Strand Diameter = 0.5 in.
90
100
110
120
130
140
150
160
170
6000 8000 10000 12000Concrete Strength, f'c, psi
Max
imum
Spa
n Le
ngth
, ft.
27.4
30.5
33.5
36.6
39.6
42.7
45.7
48.8
51.841.4 55.2 69.0 82.7
Concrete Strength, f'c, MPa
Max
imum
Spa
n Le
ngth
, m
8.5 ft. spac. 10 ft. spac. 11.5 ft. spac. 14 ft. spac. 16.6 ft. spac.
49
66
81 99
45
62
74 93
42
57
70
88
40
55
7189
55
40 88 99
STANDARD - CODE
φ=0.6 in.
U54 Beam
(b) Strand Diameter = 0.6 in.
Figure 6.1. AASHTO Standard Specifications – Maximum Span Length versus
Concrete Strength for U54 Girders.
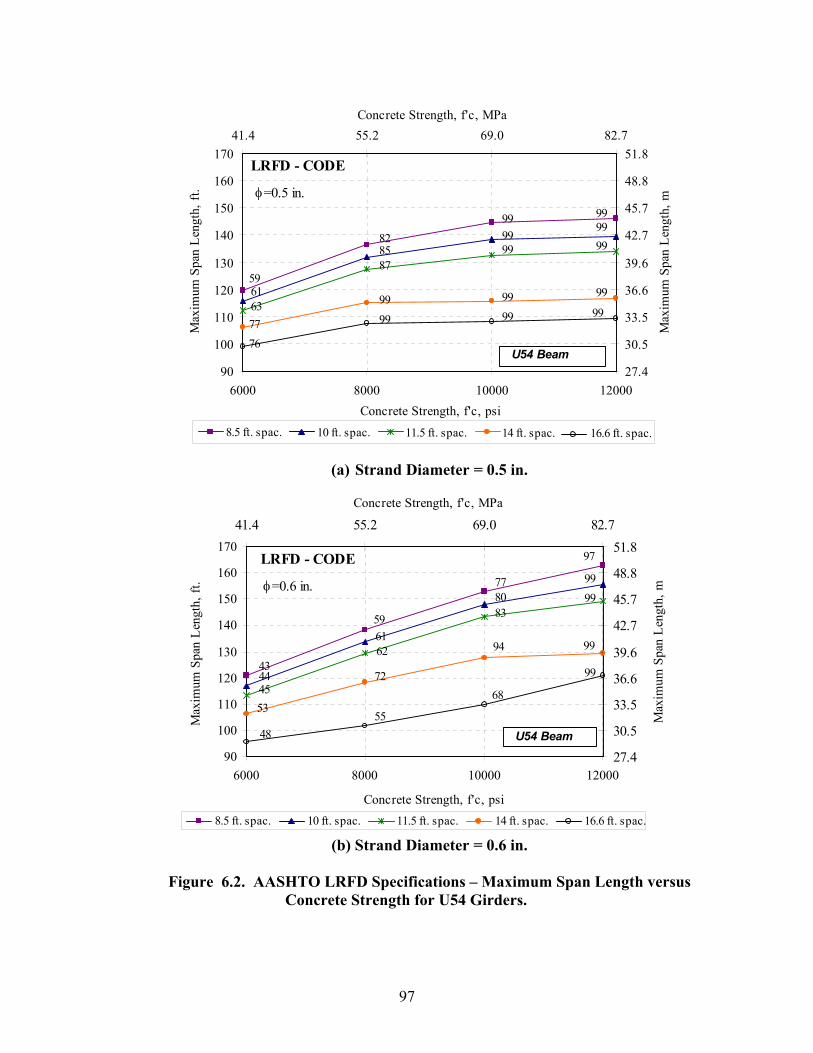
97
90
100
110
120
130
140
150
160
170
6000 8000 10000 12000Concrete Strength, f'c, psi
Max
imum
Spa
n Le
ngth
, ft.
27.4
30.5
33.5
36.6
39.6
42.7
45.7
48.8
51.841.4 55.2 69.0 82.7
Concrete Strength, f'c, MPa
Max
imum
Spa
n Le
ngth
, m
8.5 ft. spac. 10 ft. spac. 11.5 ft. spac. 14 ft. spac. 16.6 ft. spac.
76
99
99 99
77
99
99 99
63
87
9999
61
85
99 99
82
59
99 99
LRFD - CODE
φ=0.5 in.
U54 Beam
(a) Strand Diameter = 0.5 in.
90
100
110
120
130
140
150
160
170
6000 8000 10000 12000
Concrete Strength, f'c, psi
Max
imum
Spa
n Le
ngth
, ft.
27.4
30.5
33.5
36.6
39.6
42.7
45.7
48.8
51.841.4 55.2 69.0 82.7
Concrete Strength, f'c, MPa
Max
imum
Spa
n Le
ngth
, m
8.5 ft. spac. 10 ft. spac. 11.5 ft. spac. 14 ft. spac. 16.6 ft. spac.
48 55
94 99
53
72
83 99
45
62
80 99
44
61
77
97
59
43
68
99
LRFD - CODE
φ=0.6 in.
U54 Beam
(b) Strand Diameter = 0.6 in.
Figure 6.2. AASHTO LRFD Specifications – Maximum Span Length versus
Concrete Strength for U54 Girders.
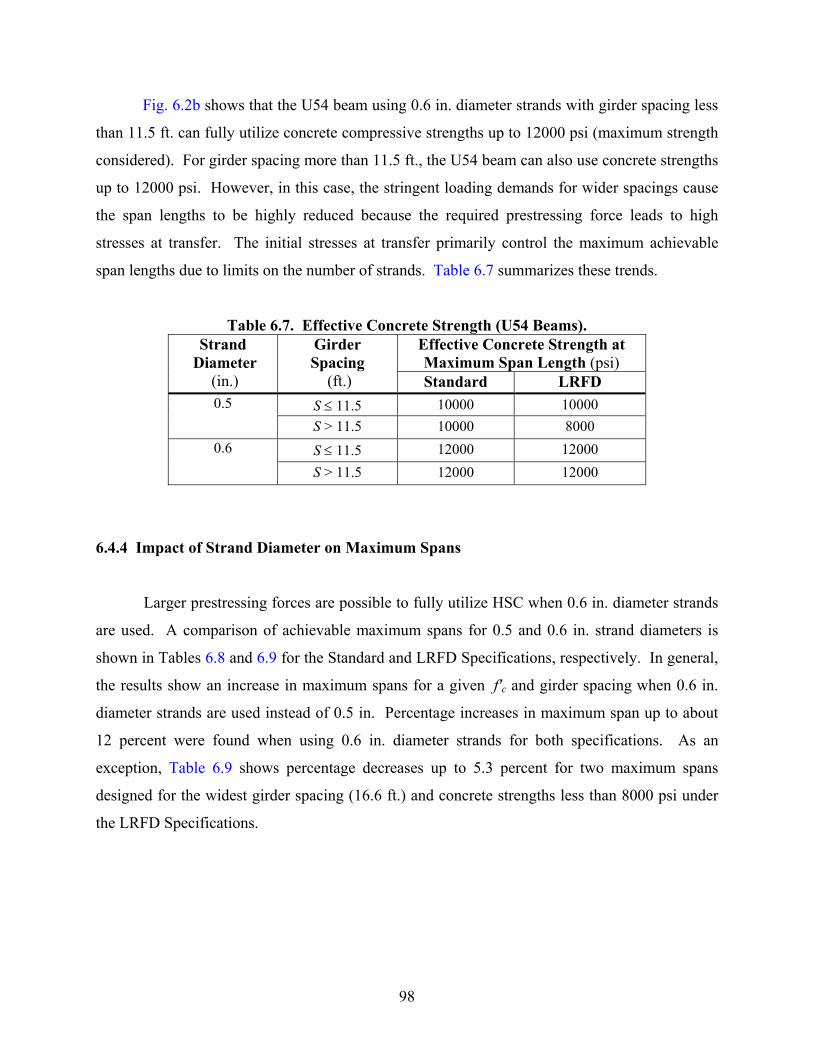
98
Fig. 6.2b shows that the U54 beam using 0.6 in. diameter strands with girder spacing less
than 11.5 ft. can fully utilize concrete compressive strengths up to 12000 psi (maximum strength
considered). For girder spacing more than 11.5 ft., the U54 beam can also use concrete strengths
up to 12000 psi. However, in this case, the stringent loading demands for wider spacings cause
the span lengths to be highly reduced because the required prestressing force leads to high
stresses at transfer. The initial stresses at transfer primarily control the maximum achievable
span lengths due to limits on the number of strands. Table 6.7 summarizes these trends.
Table 6.7. Effective Concrete Strength (U54 Beams). Effective Concrete Strength at Maximum Span Length (psi)
Strand Diameter
(in.)
Girder Spacing
(ft.) Standard LRFD S ≤ 11.5 10000 10000 0.5 S > 11.5 10000 8000
S ≤ 11.5 12000 12000 0.6
S > 11.5 12000 12000
6.4.4 Impact of Strand Diameter on Maximum Spans
Larger prestressing forces are possible to fully utilize HSC when 0.6 in. diameter strands
are used. A comparison of achievable maximum spans for 0.5 and 0.6 in. strand diameters is
shown in Tables 6.8 and 6.9 for the Standard and LRFD Specifications, respectively. In general,
the results show an increase in maximum spans for a given f'c and girder spacing when 0.6 in.
diameter strands are used instead of 0.5 in. Percentage increases in maximum span up to about
12 percent were found when using 0.6 in. diameter strands for both specifications. As an
exception, Table 6.9 shows percentage decreases up to 5.3 percent for two maximum spans
designed for the widest girder spacing (16.6 ft.) and concrete strengths less than 8000 psi under
the LRFD Specifications.
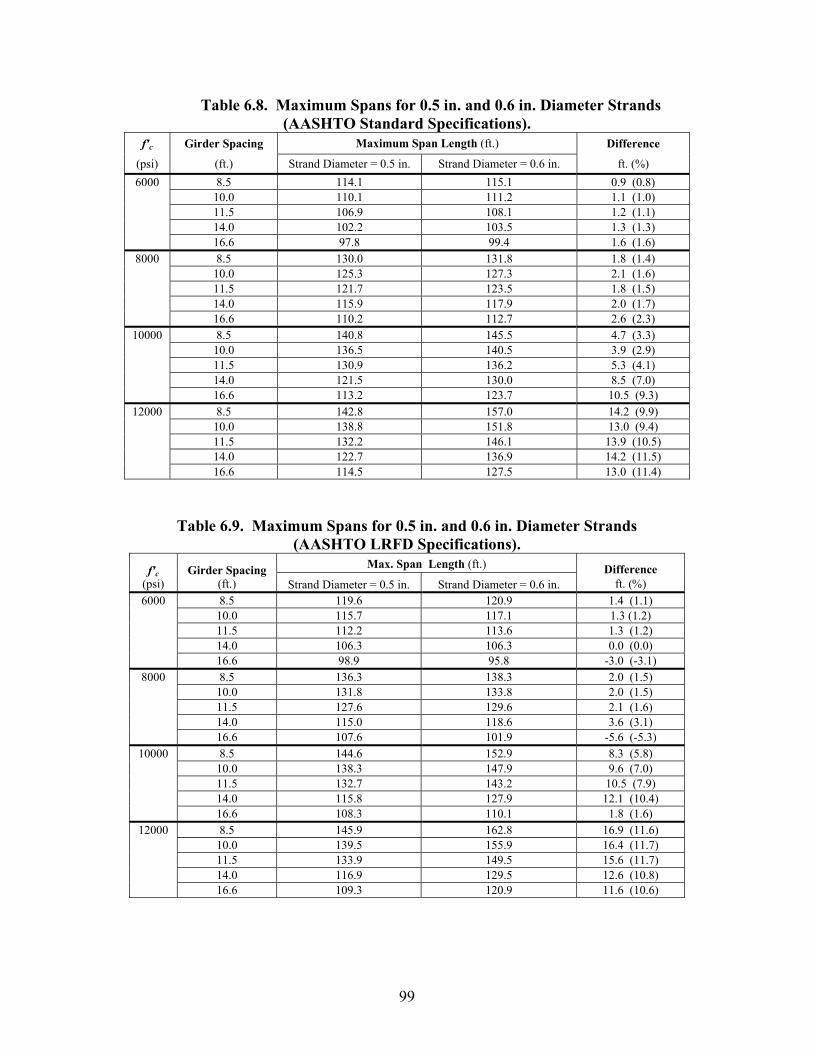
99
Table 6.8. Maximum Spans for 0.5 in. and 0.6 in. Diameter Strands (AASHTO Standard Specifications).
f'c Girder Spacing Maximum Span Length (ft.) Difference
(psi) (ft.) Strand Diameter = 0.5 in. Strand Diameter = 0.6 in. ft. (%) 6000 8.5 114.1 115.1 0.9 (0.8)
10.0 110.1 111.2 1.1 (1.0) 11.5 106.9 108.1 1.2 (1.1) 14.0 102.2 103.5 1.3 (1.3) 16.6 97.8 99.4 1.6 (1.6)
8000 8.5 130.0 131.8 1.8 (1.4) 10.0 125.3 127.3 2.1 (1.6) 11.5 121.7 123.5 1.8 (1.5) 14.0 115.9 117.9 2.0 (1.7) 16.6 110.2 112.7 2.6 (2.3)
10000 8.5 140.8 145.5 4.7 (3.3) 10.0 136.5 140.5 3.9 (2.9) 11.5 130.9 136.2 5.3 (4.1) 14.0 121.5 130.0 8.5 (7.0) 16.6 113.2 123.7 10.5 (9.3)
12000 8.5 142.8 157.0 14.2 (9.9) 10.0 138.8 151.8 13.0 (9.4) 11.5 132.2 146.1 13.9 (10.5) 14.0 122.7 136.9 14.2 (11.5) 16.6 114.5 127.5 13.0 (11.4)
Table 6.9. Maximum Spans for 0.5 in. and 0.6 in. Diameter Strands (AASHTO LRFD Specifications).
Max. Span Length (ft.) f'c (psi)
Girder Spacing (ft.) Strand Diameter = 0.5 in. Strand Diameter = 0.6 in.
Difference ft. (%)
6000 8.5 119.6 120.9 1.4 (1.1) 10.0 115.7 117.1 1.3 (1.2) 11.5 112.2 113.6 1.3 (1.2) 14.0 106.3 106.3 0.0 (0.0) 16.6 98.9 95.8 -3.0 (-3.1)
8000 8.5 136.3 138.3 2.0 (1.5) 10.0 131.8 133.8 2.0 (1.5) 11.5 127.6 129.6 2.1 (1.6) 14.0 115.0 118.6 3.6 (3.1) 16.6 107.6 101.9 -5.6 (-5.3)
10000 8.5 144.6 152.9 8.3 (5.8) 10.0 138.3 147.9 9.6 (7.0) 11.5 132.7 143.2 10.5 (7.9) 14.0 115.8 127.9 12.1 (10.4) 16.6 108.3 110.1 1.8 (1.6)
12000 8.5 145.9 162.8 16.9 (11.6) 10.0 139.5 155.9 16.4 (11.7) 11.5 133.9 149.5 15.6 (11.7) 14.0 116.9 129.5 12.6 (10.8) 16.6 109.3 120.9 11.6 (10.6)
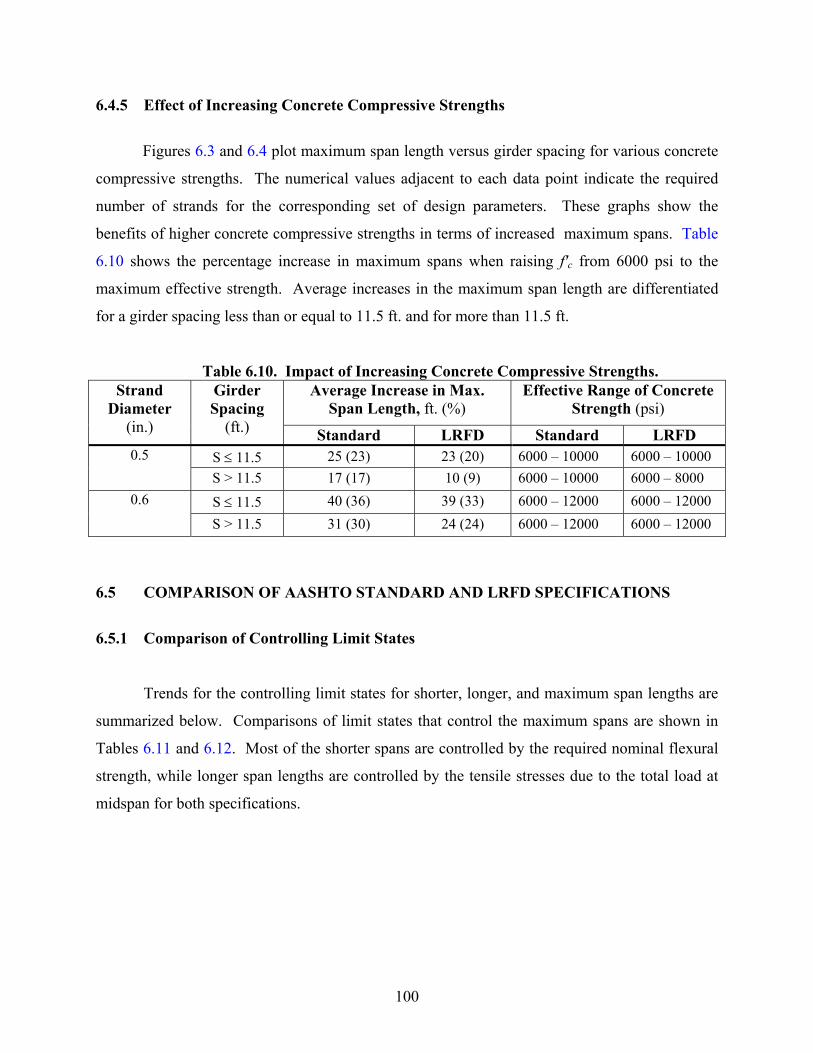
100
6.4.5 Effect of Increasing Concrete Compressive Strengths
Figures 6.3 and 6.4 plot maximum span length versus girder spacing for various concrete
compressive strengths. The numerical values adjacent to each data point indicate the required
number of strands for the corresponding set of design parameters. These graphs show the
benefits of higher concrete compressive strengths in terms of increased maximum spans. Table
6.10 shows the percentage increase in maximum spans when raising f'c from 6000 psi to the
maximum effective strength. Average increases in the maximum span length are differentiated
for a girder spacing less than or equal to 11.5 ft. and for more than 11.5 ft.
Table 6.10. Impact of Increasing Concrete Compressive Strengths. Average Increase in Max.
Span Length, ft. (%) Effective Range of Concrete
Strength (psi) Strand
Diameter (in.)
Girder Spacing
(ft.) Standard LRFD Standard LRFD S ≤ 11.5 25 (23) 23 (20) 6000 – 10000 6000 – 10000 0.5 S > 11.5 17 (17) 10 (9) 6000 – 10000 6000 – 8000
S ≤ 11.5 40 (36) 39 (33) 6000 – 12000 6000 – 12000 0.6
S > 11.5 31 (30) 24 (24) 6000 – 12000 6000 – 12000
6.5 COMPARISON OF AASHTO STANDARD AND LRFD SPECIFICATIONS
6.5.1 Comparison of Controlling Limit States
Trends for the controlling limit states for shorter, longer, and maximum span lengths are
summarized below. Comparisons of limit states that control the maximum spans are shown in
Tables 6.11 and 6.12. Most of the shorter spans are controlled by the required nominal flexural
strength, while longer span lengths are controlled by the tensile stresses due to the total load at
midspan for both specifications.
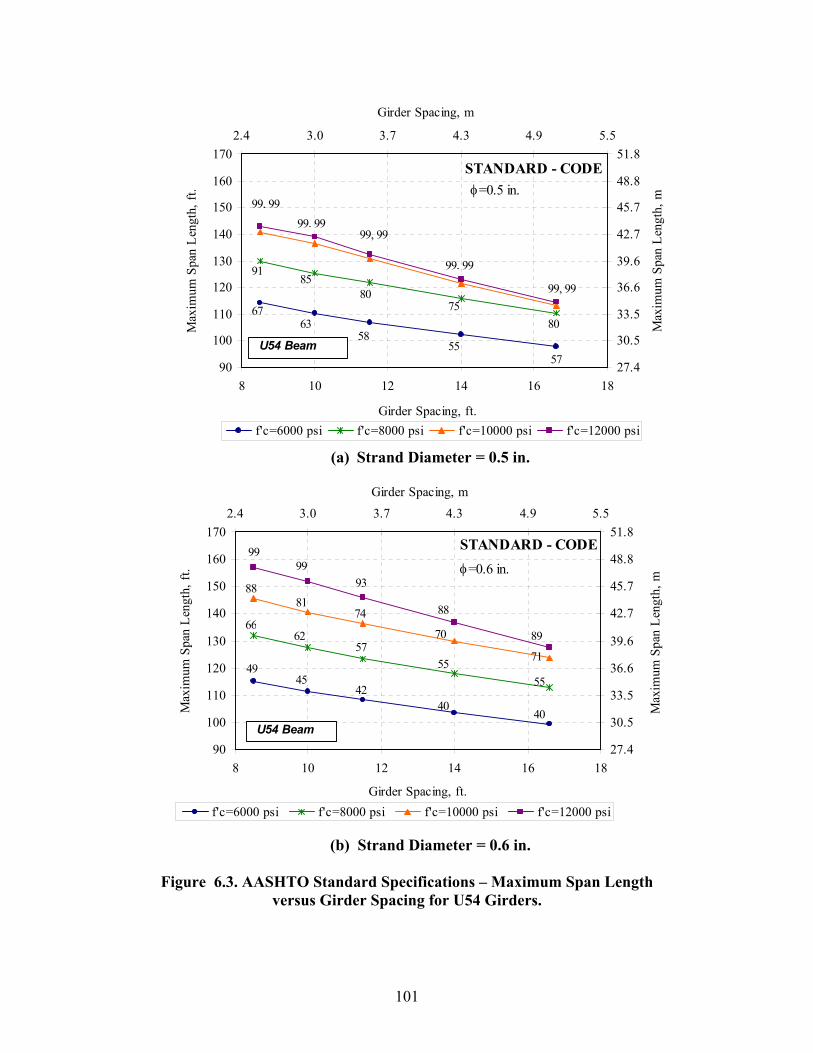
101
90
100
110
120
130
140
150
160
170
8 10 12 14 16 18
Girder Spacing, ft.
Max
imum
Spa
n Le
ngth
, ft.
27.4
30.5
33.5
36.6
39.6
42.7
45.7
48.8
51.82.4 3.0 3.7 4.3 4.9 5.5
Girder Spacing, m
Max
imum
Spa
n Le
ngth
, m
f'c=6000 psi f'c=8000 psi f'c=10000 psi f'c=12000 psi
φ=0.5 in.
63 58
67
55 57
91 85
80 75
99, 99 99, 99
99, 99
99, 99
99, 99
80
STANDARD - CODE
U54 Beam
(a) Strand Diameter = 0.5 in.
90
100
110
120
130
140
150
160
170
8 10 12 14 16 18
Girder Spacing, ft.
Max
imum
Spa
n Le
ngth
, ft.
27.4
30.5
33.5
36.6
39.6
42.7
45.7
48.8
51.82.4 3.0 3.7 4.3 4.9 5.5
Girder Spacing, m
Max
imum
Spa
n Le
ngth
, m
f'c=6000 psi f'c=8000 psi f'c=10000 psi f'c=12000 psi
φ=0.6 in.
4542
49
40 40
6662
5755
88 81 74
70
71
99 99
93 88
89
55
STANDARD - CODE
U54 Beam
(b) Strand Diameter = 0.6 in.
Figure 6.3. AASHTO Standard Specifications – Maximum Span Length
versus Girder Spacing for U54 Girders.
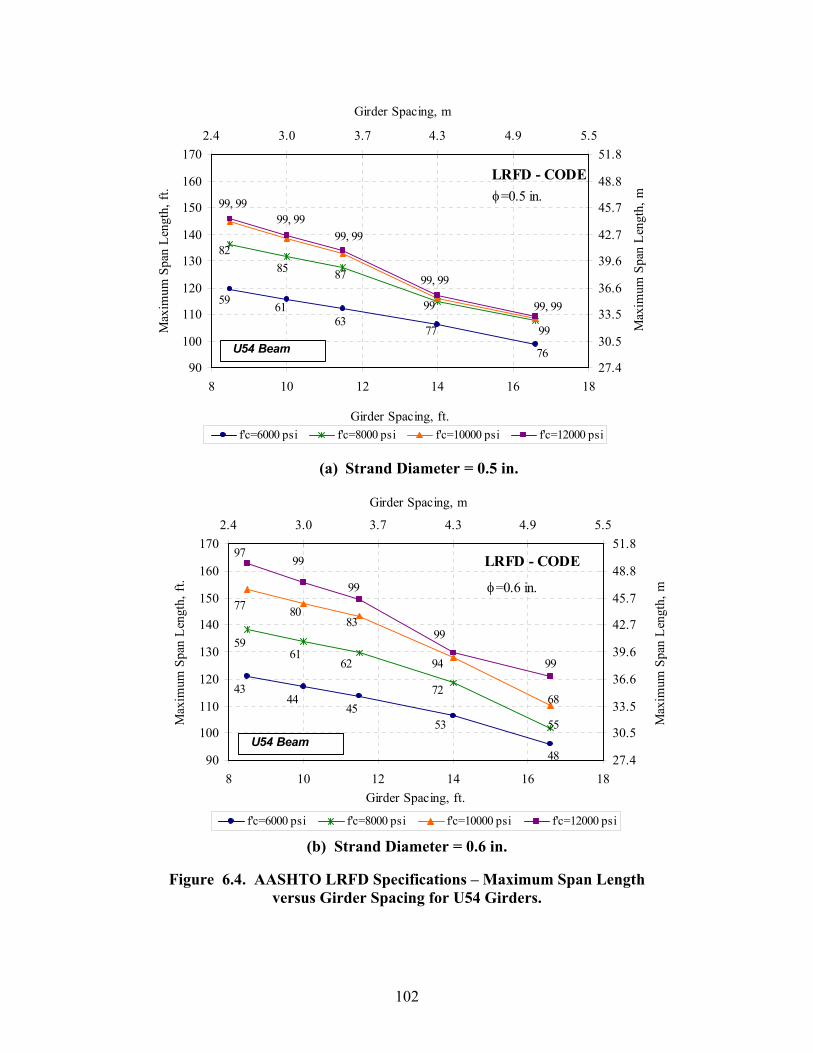
102
90
100
110
120
130
140
150
160
170
8 10 12 14 16 18
Girder Spacing, ft.
Max
imum
Spa
n Le
ngth
, ft.
27.4
30.5
33.5
36.6
39.6
42.7
45.7
48.8
51.82.4 3.0 3.7 4.3 4.9 5.5
Girder Spacing, m
Max
imum
Spa
n Le
ngth
, m
f'c=6000 psi f'c=8000 psi f'c=10000 psi f'c=12000 psi
φ=0.5 in.
6163
59
77
76
99, 99
99, 99
99, 99
99, 99
99, 99
LRFD - CODE
8285 87
99
99 U54 Beam
(a) Strand Diameter = 0.5 in.
90
100
110
120
130
140
150
160
170
8 10 12 14 16 18Girder Spacing, ft.
Max
imum
Spa
n Le
ngth
, ft.
27.4
30.5
33.5
36.6
39.6
42.7
45.7
48.8
51.82.4 3.0 3.7 4.3 4.9 5.5
Girder Spacing, m
Max
imum
Spa
n Le
ngth
, m
f'c=6000 psi f'c=8000 psi f'c=10000 psi f'c=12000 psi
φ=0.6 in.
44 45
43
53
48
59 61
62
72
77 80 83
94
68
99
99
99
99 97
55
LRFD - CODE
U54 Beam
(b) Strand Diameter = 0.6 in.
Figure 6.4. AASHTO LRFD Specifications – Maximum Span Length
versus Girder Spacing for U54 Girders.
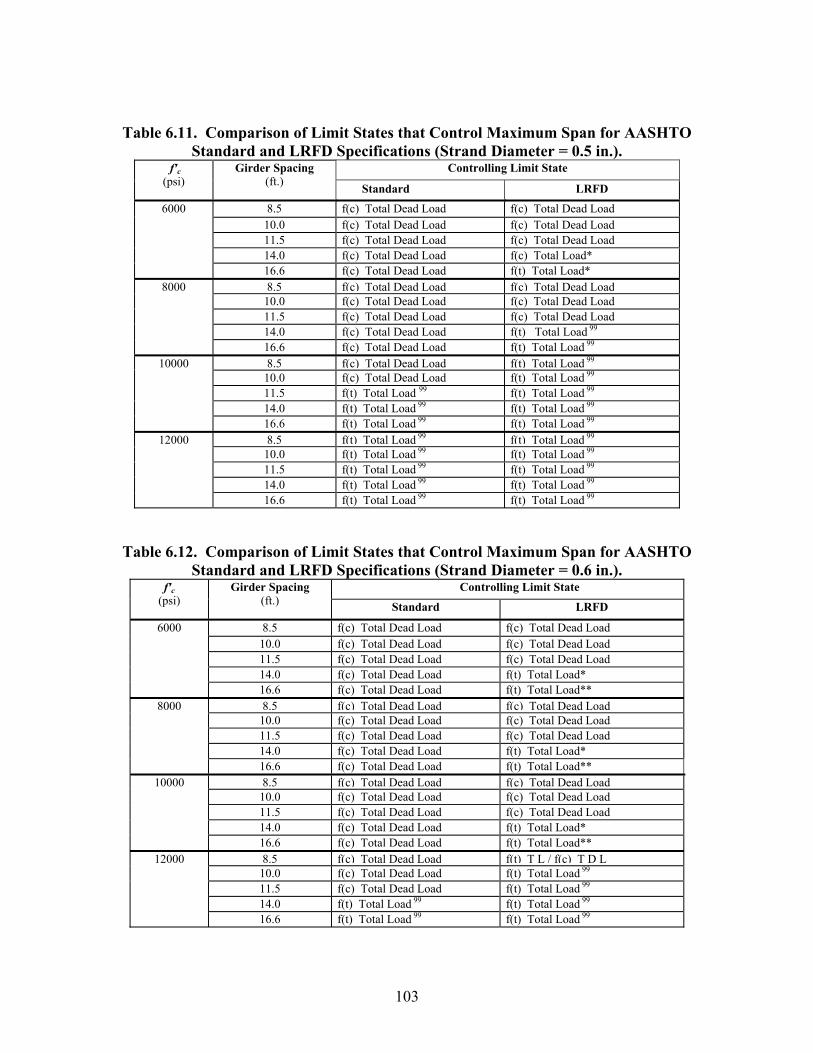
103
Table 6.11. Comparison of Limit States that Control Maximum Span for AASHTO Standard and LRFD Specifications (Strand Diameter = 0.5 in.).
Controlling Limit State f'c (psi)
Girder Spacing (ft.) Standard LRFD
6000 8.5 f(c) Total Dead Load f(c) Total Dead Load 10.0 f(c) Total Dead Load f(c) Total Dead Load 11.5 f(c) Total Dead Load f(c) Total Dead Load 14.0 f(c) Total Dead Load f(c) Total Load* 16.6 f(c) Total Dead Load f(t) Total Load*
8000 8.5 f(c) Total Dead Load f(c) Total Dead Load 10.0 f(c) Total Dead Load f(c) Total Dead Load 11.5 f(c) Total Dead Load f(c) Total Dead Load 14.0 f(c) Total Dead Load f(t) Total Load 99 16.6 f(c) Total Dead Load f(t) Total Load 99
10000 8.5 f(c) Total Dead Load f(t) Total Load 99 10.0 f(c) Total Dead Load f(t) Total Load 99 11.5 f(t) Total Load 99 f(t) Total Load 99 14.0 f(t) Total Load 99 f(t) Total Load 99 16.6 f(t) Total Load 99 f(t) Total Load 99
12000 8.5 f(t) Total Load 99 f(t) Total Load 99 10.0 f(t) Total Load 99 f(t) Total Load 99 11.5 f(t) Total Load 99 f(t) Total Load 99 14.0 f(t) Total Load 99 f(t) Total Load 99 16.6 f(t) Total Load 99 f(t) Total Load 99
Table 6.12. Comparison of Limit States that Control Maximum Span for AASHTO Standard and LRFD Specifications (Strand Diameter = 0.6 in.).
Controlling Limit State f'c (psi)
Girder Spacing (ft.) Standard LRFD
6000 8.5 f(c) Total Dead Load f(c) Total Dead Load 10.0 f(c) Total Dead Load f(c) Total Dead Load 11.5 f(c) Total Dead Load f(c) Total Dead Load 14.0 f(c) Total Dead Load f(t) Total Load* 16.6 f(c) Total Dead Load f(t) Total Load**
8000 8.5 f(c) Total Dead Load f(c) Total Dead Load 10.0 f(c) Total Dead Load f(c) Total Dead Load 11.5 f(c) Total Dead Load f(c) Total Dead Load 14.0 f(c) Total Dead Load f(t) Total Load* 16.6 f(c) Total Dead Load f(t) Total Load**
10000 8.5 f(c) Total Dead Load f(c) Total Dead Load 10.0 f(c) Total Dead Load f(c) Total Dead Load 11.5 f(c) Total Dead Load f(c) Total Dead Load 14.0 f(c) Total Dead Load f(t) Total Load* 16.6 f(c) Total Dead Load f(t) Total Load**
12000 8.5 f(c) Total Dead Load f(t) T L / f(c) T D L 10.0 f(c) Total Dead Load f(t) Total Load 99 11.5 f(c) Total Dead Load f(t) Total Load 99 14.0 f(t) Total Load 99 f(t) Total Load 99 16.6 f(t) Total Load 99 f(t) Total Load 99
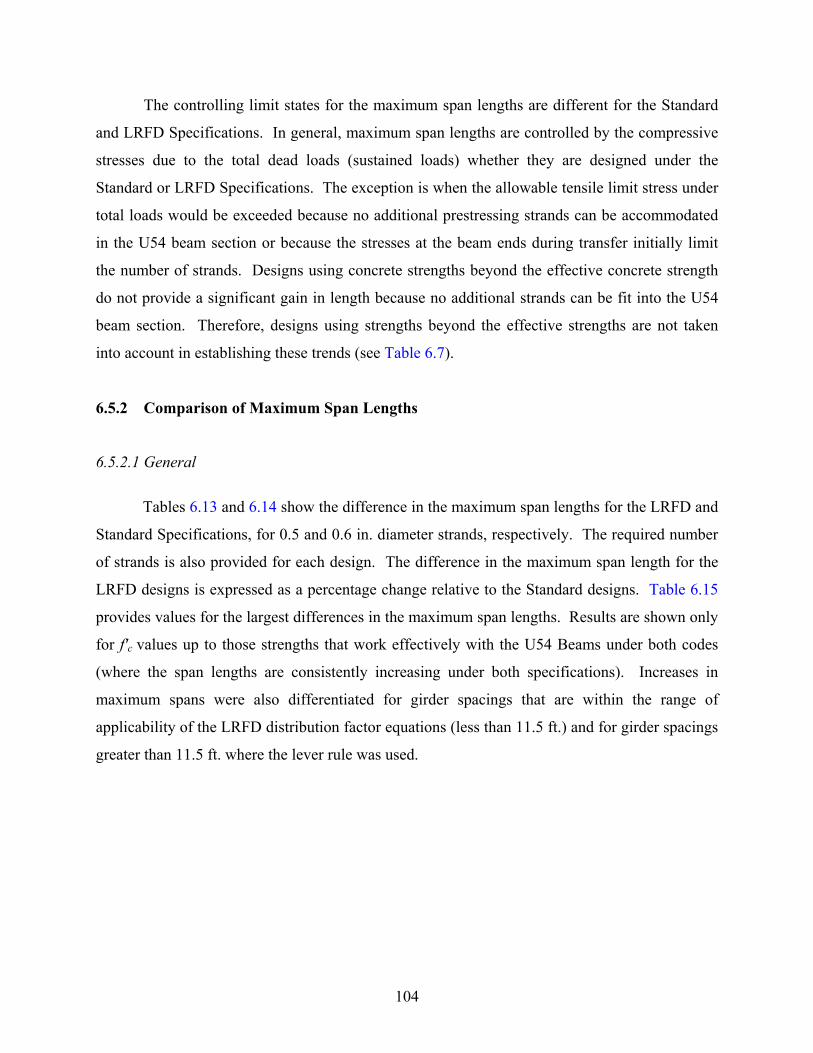
104
The controlling limit states for the maximum span lengths are different for the Standard
and LRFD Specifications. In general, maximum span lengths are controlled by the compressive
stresses due to the total dead loads (sustained loads) whether they are designed under the
Standard or LRFD Specifications. The exception is when the allowable tensile limit stress under
total loads would be exceeded because no additional prestressing strands can be accommodated
in the U54 beam section or because the stresses at the beam ends during transfer initially limit
the number of strands. Designs using concrete strengths beyond the effective concrete strength
do not provide a significant gain in length because no additional strands can be fit into the U54
beam section. Therefore, designs using strengths beyond the effective strengths are not taken
into account in establishing these trends (see Table 6.7).
6.5.2 Comparison of Maximum Span Lengths
6.5.2.1 General
Tables 6.13 and 6.14 show the difference in the maximum span lengths for the LRFD and
Standard Specifications, for 0.5 and 0.6 in. diameter strands, respectively. The required number
of strands is also provided for each design. The difference in the maximum span length for the
LRFD designs is expressed as a percentage change relative to the Standard designs. Table 6.15
provides values for the largest differences in the maximum span lengths. Results are shown only
for f'c values up to those strengths that work effectively with the U54 Beams under both codes
(where the span lengths are consistently increasing under both specifications). Increases in
maximum spans were also differentiated for girder spacings that are within the range of
applicability of the LRFD distribution factor equations (less than 11.5 ft.) and for girder spacings
greater than 11.5 ft. where the lever rule was used.
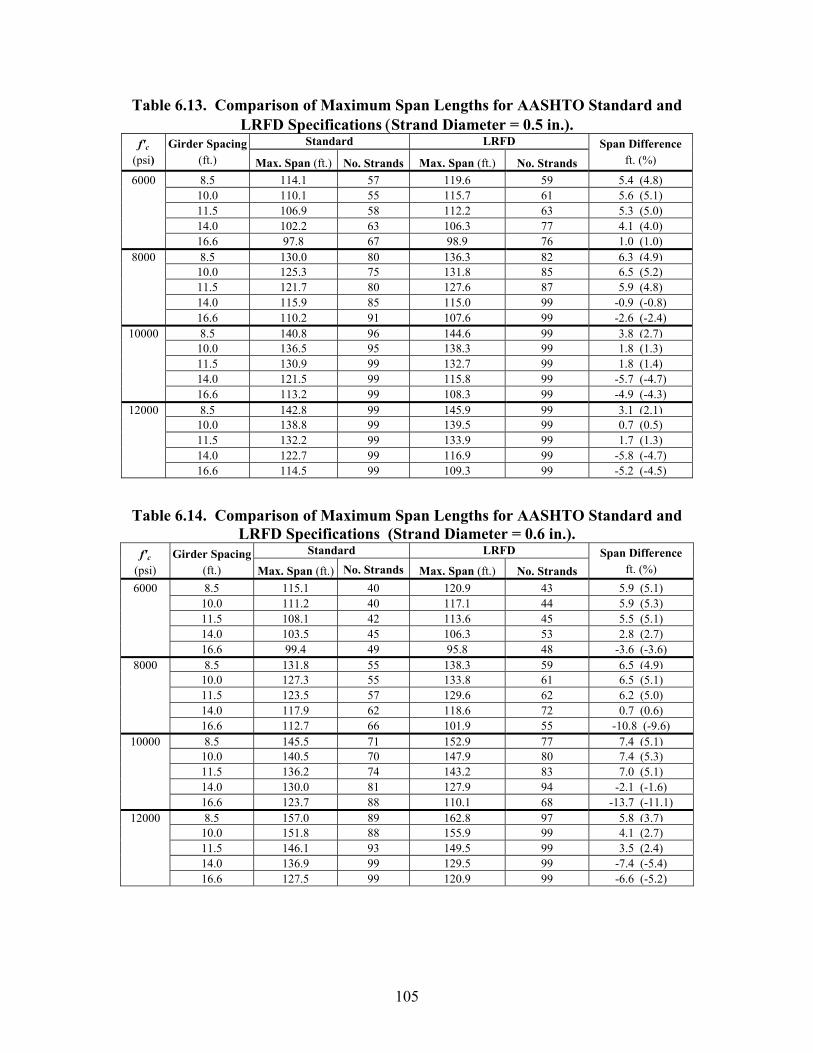
105
Table 6.13. Comparison of Maximum Span Lengths for AASHTO Standard and LRFD Specifications (Strand Diameter = 0.5 in.).
Standard LRFD f'c (psi)
Girder Spacing (ft.) Max. Span (ft.) No. Strands Max. Span (ft.) No. Strands
Span Difference ft. (%)
6000 8.5 114.1 57 119.6 59 5.4 (4.8) 10.0 110.1 55 115.7 61 5.6 (5.1) 11.5 106.9 58 112.2 63 5.3 (5.0) 14.0 102.2 63 106.3 77 4.1 (4.0) 16.6 97.8 67 98.9 76 1.0 (1.0)
8000 8.5 130.0 80 136.3 82 6.3 (4.9) 10.0 125.3 75 131.8 85 6.5 (5.2) 11.5 121.7 80 127.6 87 5.9 (4.8) 14.0 115.9 85 115.0 99 -0.9 (-0.8) 16.6 110.2 91 107.6 99 -2.6 (-2.4)
10000 8.5 140.8 96 144.6 99 3.8 (2.7) 10.0 136.5 95 138.3 99 1.8 (1.3) 11.5 130.9 99 132.7 99 1.8 (1.4) 14.0 121.5 99 115.8 99 -5.7 (-4.7) 16.6 113.2 99 108.3 99 -4.9 (-4.3)
12000 8.5 142.8 99 145.9 99 3.1 (2.1) 10.0 138.8 99 139.5 99 0.7 (0.5) 11.5 132.2 99 133.9 99 1.7 (1.3) 14.0 122.7 99 116.9 99 -5.8 (-4.7) 16.6 114.5 99 109.3 99 -5.2 (-4.5)
Table 6.14. Comparison of Maximum Span Lengths for AASHTO Standard and LRFD Specifications (Strand Diameter = 0.6 in.).
Standard LRFD f'c
(psi) Girder Spacing
(ft.) Max. Span (ft.) No. Strands Max. Span (ft.) No. Strands Span Difference
ft. (%) 6000 8.5 115.1 40 120.9 43 5.9 (5.1)
10.0 111.2 40 117.1 44 5.9 (5.3) 11.5 108.1 42 113.6 45 5.5 (5.1) 14.0 103.5 45 106.3 53 2.8 (2.7) 16.6 99.4 49 95.8 48 -3.6 (-3.6)
8000 8.5 131.8 55 138.3 59 6.5 (4.9) 10.0 127.3 55 133.8 61 6.5 (5.1) 11.5 123.5 57 129.6 62 6.2 (5.0) 14.0 117.9 62 118.6 72 0.7 (0.6) 16.6 112.7 66 101.9 55 -10.8 (-9.6)
10000 8.5 145.5 71 152.9 77 7.4 (5.1) 10.0 140.5 70 147.9 80 7.4 (5.3) 11.5 136.2 74 143.2 83 7.0 (5.1) 14.0 130.0 81 127.9 94 -2.1 (-1.6) 16.6 123.7 88 110.1 68 -13.7 (-11.1)
12000 8.5 157.0 89 162.8 97 5.8 (3.7) 10.0 151.8 88 155.9 99 4.1 (2.7) 11.5 146.1 93 149.5 99 3.5 (2.4) 14.0 136.9 99 129.5 99 -7.4 (-5.4) 16.6 127.5 99 120.9 99 -6.6 (-5.2)
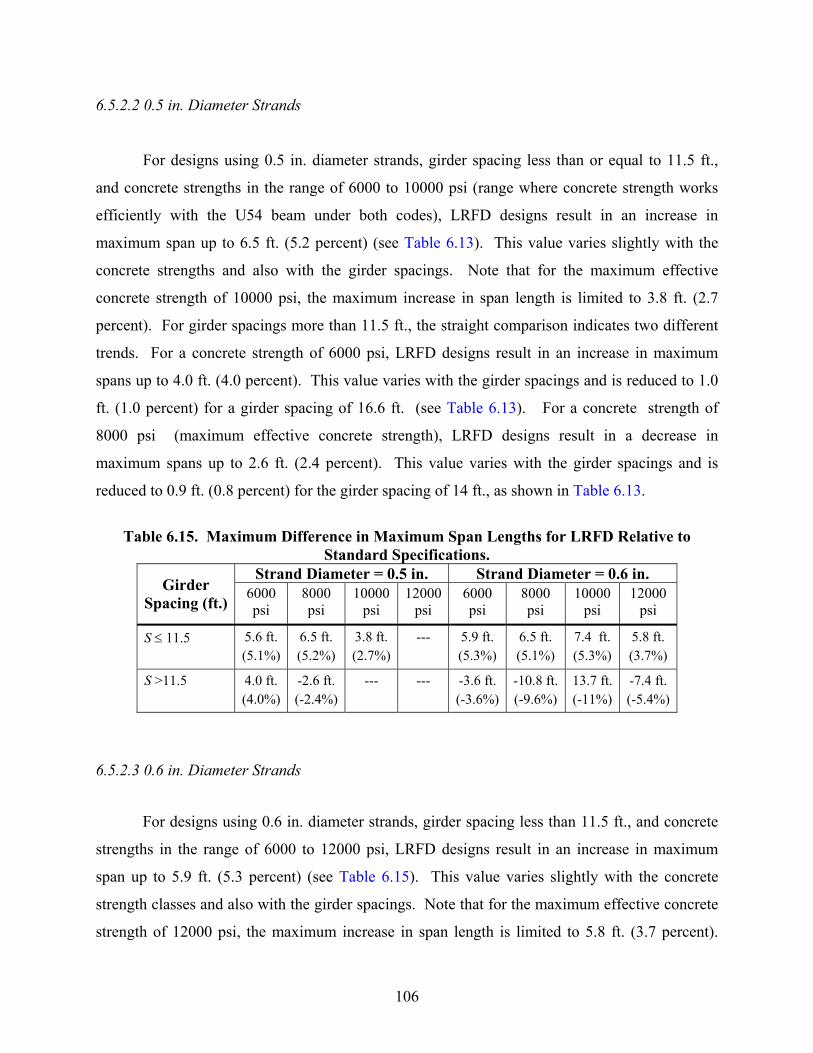
106
6.5.2.2 0.5 in. Diameter Strands
For designs using 0.5 in. diameter strands, girder spacing less than or equal to 11.5 ft.,
and concrete strengths in the range of 6000 to 10000 psi (range where concrete strength works
efficiently with the U54 beam under both codes), LRFD designs result in an increase in
maximum span up to 6.5 ft. (5.2 percent) (see Table 6.13). This value varies slightly with the
concrete strengths and also with the girder spacings. Note that for the maximum effective
concrete strength of 10000 psi, the maximum increase in span length is limited to 3.8 ft. (2.7
percent). For girder spacings more than 11.5 ft., the straight comparison indicates two different
trends. For a concrete strength of 6000 psi, LRFD designs result in an increase in maximum
spans up to 4.0 ft. (4.0 percent). This value varies with the girder spacings and is reduced to 1.0
ft. (1.0 percent) for a girder spacing of 16.6 ft. (see Table 6.13). For a concrete strength of
8000 psi (maximum effective concrete strength), LRFD designs result in a decrease in
maximum spans up to 2.6 ft. (2.4 percent). This value varies with the girder spacings and is
reduced to 0.9 ft. (0.8 percent) for the girder spacing of 14 ft., as shown in Table 6.13.
Table 6.15. Maximum Difference in Maximum Span Lengths for LRFD Relative to
Standard Specifications. Strand Diameter = 0.5 in. Strand Diameter = 0.6 in.
Girder Spacing (ft.)
6000 psi
8000 psi
10000 psi
12000 psi
6000 psi
8000 psi
10000 psi
12000 psi
S ≤ 11.5 5.6 ft. (5.1%)
6.5 ft. (5.2%)
3.8 ft. (2.7%)
--- 5.9 ft. (5.3%)
6.5 ft. (5.1%)
7.4 ft. (5.3%)
5.8 ft. (3.7%)
S >11.5 4.0 ft. (4.0%)
-2.6 ft. (-2.4%)
--- --- -3.6 ft. (-3.6%)
-10.8 ft. (-9.6%)
13.7 ft. (-11%)
-7.4 ft. (-5.4%)
6.5.2.3 0.6 in. Diameter Strands
For designs using 0.6 in. diameter strands, girder spacing less than 11.5 ft., and concrete
strengths in the range of 6000 to 12000 psi, LRFD designs result in an increase in maximum
span up to 5.9 ft. (5.3 percent) (see Table 6.15). This value varies slightly with the concrete
strength classes and also with the girder spacings. Note that for the maximum effective concrete
strength of 12000 psi, the maximum increase in span length is limited to 5.8 ft. (3.7 percent).
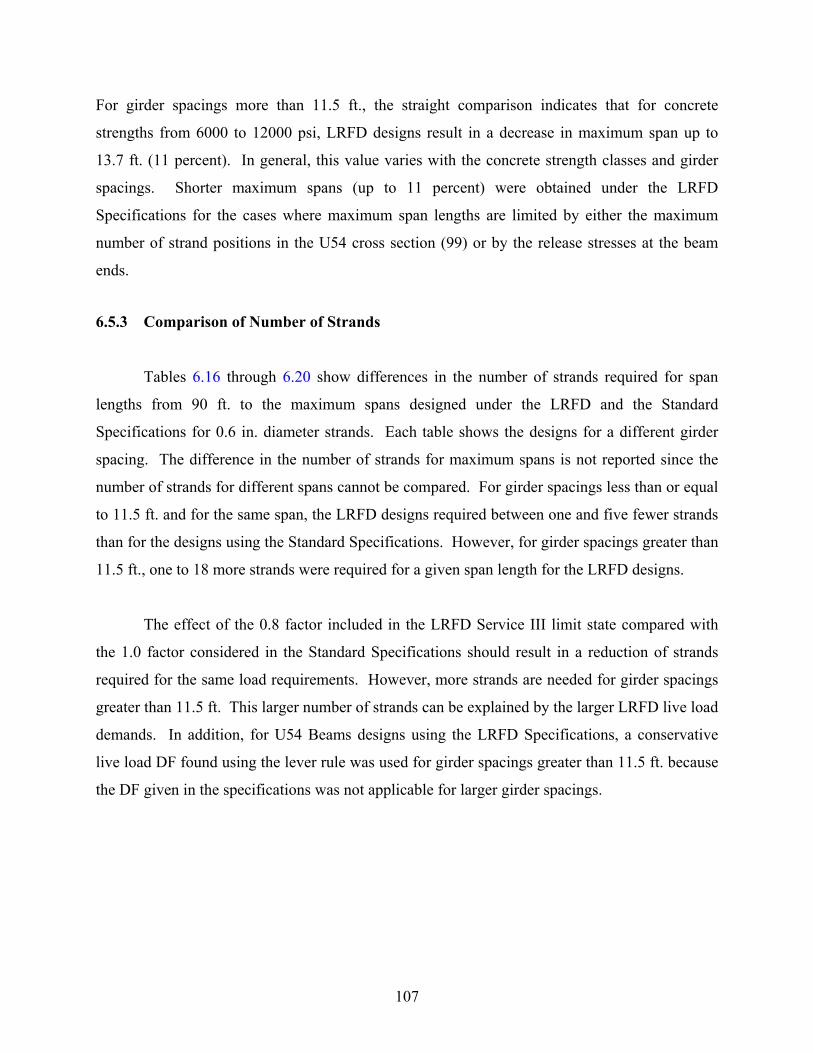
107
For girder spacings more than 11.5 ft., the straight comparison indicates that for concrete
strengths from 6000 to 12000 psi, LRFD designs result in a decrease in maximum span up to
13.7 ft. (11 percent). In general, this value varies with the concrete strength classes and girder
spacings. Shorter maximum spans (up to 11 percent) were obtained under the LRFD
Specifications for the cases where maximum span lengths are limited by either the maximum
number of strand positions in the U54 cross section (99) or by the release stresses at the beam
ends.
6.5.3 Comparison of Number of Strands
Tables 6.16 through 6.20 show differences in the number of strands required for span
lengths from 90 ft. to the maximum spans designed under the LRFD and the Standard
Specifications for 0.6 in. diameter strands. Each table shows the designs for a different girder
spacing. The difference in the number of strands for maximum spans is not reported since the
number of strands for different spans cannot be compared. For girder spacings less than or equal
to 11.5 ft. and for the same span, the LRFD designs required between one and five fewer strands
than for the designs using the Standard Specifications. However, for girder spacings greater than
11.5 ft., one to 18 more strands were required for a given span length for the LRFD designs.
The effect of the 0.8 factor included in the LRFD Service III limit state compared with
the 1.0 factor considered in the Standard Specifications should result in a reduction of strands
required for the same load requirements. However, more strands are needed for girder spacings
greater than 11.5 ft. This larger number of strands can be explained by the larger LRFD live load
demands. In addition, for U54 Beams designs using the LRFD Specifications, a conservative
live load DF found using the lever rule was used for girder spacings greater than 11.5 ft. because
the DF given in the specifications was not applicable for larger girder spacings.
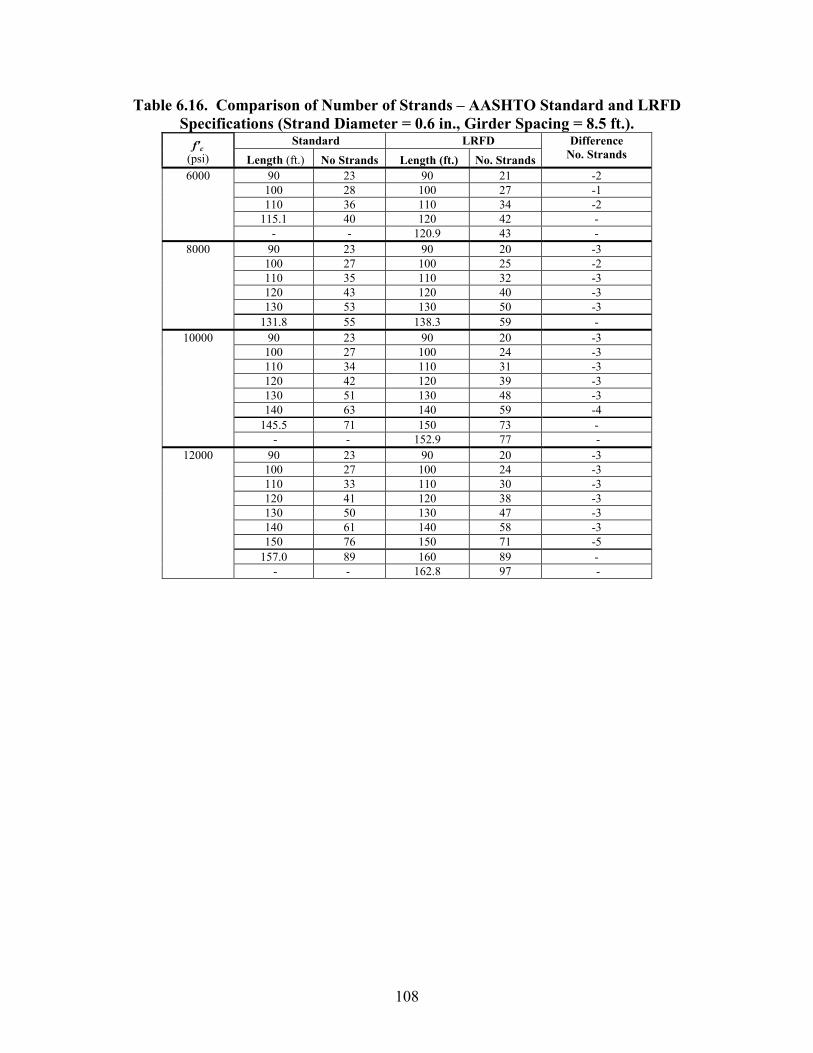
108
Table 6.16. Comparison of Number of Strands – AASHTO Standard and LRFD Specifications (Strand Diameter = 0.6 in., Girder Spacing = 8.5 ft.).
Standard LRFDf'c (psi) Length (ft.) No Strands Length (ft.) No. Strands
Difference No. Strands
6000 90 23 90 21 -2 100 28 100 27 -1 110 36 110 34 -2 115.1 40 120 42 - - - 120.9 43 -
8000 90 23 90 20 -3 100 27 100 25 -2 110 35 110 32 -3 120 43 120 40 -3 130 53 130 50 -3 131.8 55 138.3 59 -
10000 90 23 90 20 -3 100 27 100 24 -3 110 34 110 31 -3 120 42 120 39 -3 130 51 130 48 -3 140 63 140 59 -4 145.5 71 150 73 - - - 152.9 77 -
12000 90 23 90 20 -3 100 27 100 24 -3 110 33 110 30 -3 120 41 120 38 -3 130 50 130 47 -3 140 61 140 58 -3 150 76 150 71 -5 157.0 89 160 89 - - - 162.8 97 -
109
Table 6.17. Comparison of Number of Strands – AASHTO Standard and LRFD Specifications (Strand Diameter = 0.6 in., Girder Spacing = 10 ft.).
Standard LRFD f'c (psi) Length (ft.) No. Strands Length (ft.) No. Strands
Difference No. Strands
6000 90 24 90 23 -1 100 30 100 30 0 110 38 110 38 0 111.2 40 117.1 44 -
8000 90 23 90 22 -1 100 29 100 28 -1 110 37 110 36 -1 120 46 120 45 -1 127.3 55 130 56 - - - 133.8 61 -
10000 90 23 90 22 -1 100 28 100 27 -1 110 36 110 35 -1 120 45 120 44 -1 130 55 130 54 -1 140 69 140 68 -1 140.5 70 147.9 80 -
12000 90 23 90 22 -1 100 27 100 26 -1 110 35 110 34 -1 120 44 120 43 -1 130 54 130 53 -1 140 67 140 66 -1 150 84 150 82 -2 151.8 88 155.9 99 -
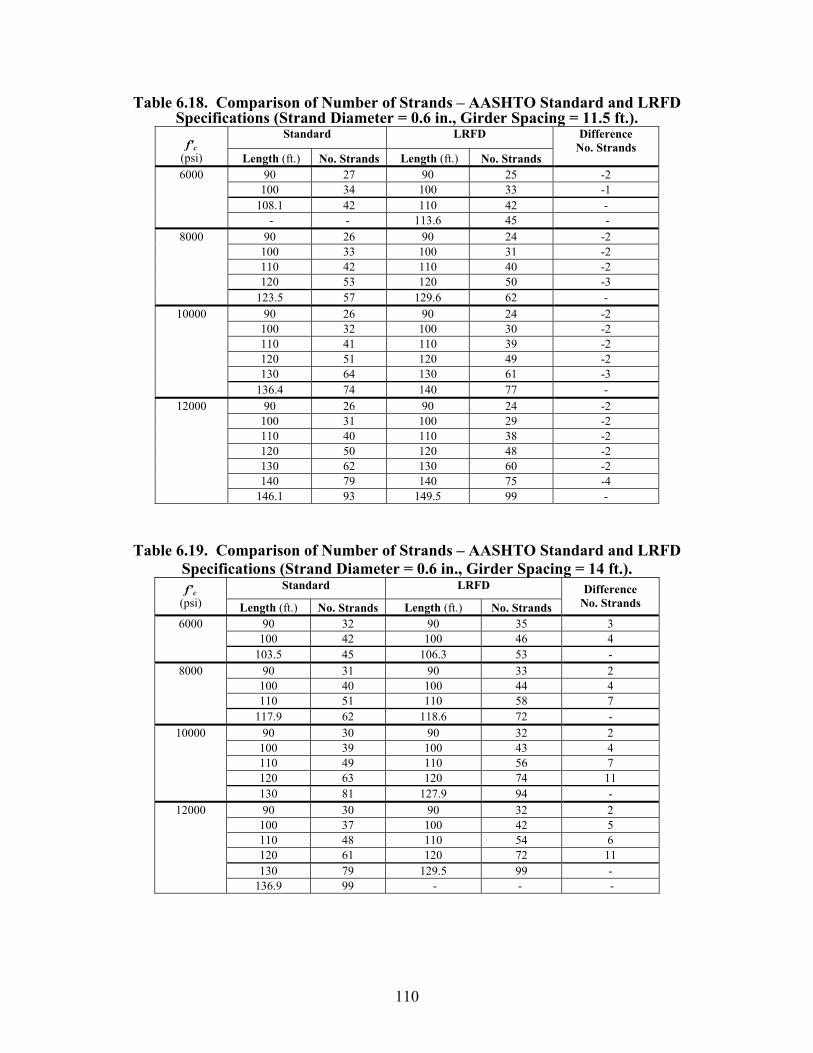
110
Table 6.18. Comparison of Number of Strands – AASHTO Standard and LRFD Specifications (Strand Diameter = 0.6 in., Girder Spacing = 11.5 ft.).
Standard LRFD f'c
(psi) Length (ft.) No. Strands Length (ft.) No. Strands
Difference No. Strands
6000 90 27 90 25 -2 100 34 100 33 -1 108.1 42 110 42 - - - 113.6 45 -
8000 90 26 90 24 -2 100 33 100 31 -2 110 42 110 40 -2 120 53 120 50 -3 123.5 57 129.6 62 -
10000 90 26 90 24 -2 100 32 100 30 -2 110 41 110 39 -2 120 51 120 49 -2 130 64 130 61 -3 136.4 74 140 77 -
12000 90 26 90 24 -2 100 31 100 29 -2 110 40 110 38 -2 120 50 120 48 -2 130 62 130 60 -2 140 79 140 75 -4 146.1 93 149.5 99 -
Table 6.19. Comparison of Number of Strands – AASHTO Standard and LRFD Specifications (Strand Diameter = 0.6 in., Girder Spacing = 14 ft.).
Standard LRFD f’c (psi) Length (ft.) No. Strands Length (ft.) No. Strands
Difference No. Strands
6000 90 32 90 35 3 100 42 100 46 4 103.5 45 106.3 53 -
8000 90 31 90 33 2 100 40 100 44 4 110 51 110 58 7 117.9 62 118.6 72 -
10000 90 30 90 32 2 100 39 100 43 4 110 49 110 56 7 120 63 120 74 11 130 81 127.9 94 -
12000 90 30 90 32 2 100 37 100 42 5 110 48 110 54 6 120 61 120 72 11 130 79 129.5 99 - 136.9 99 - - -
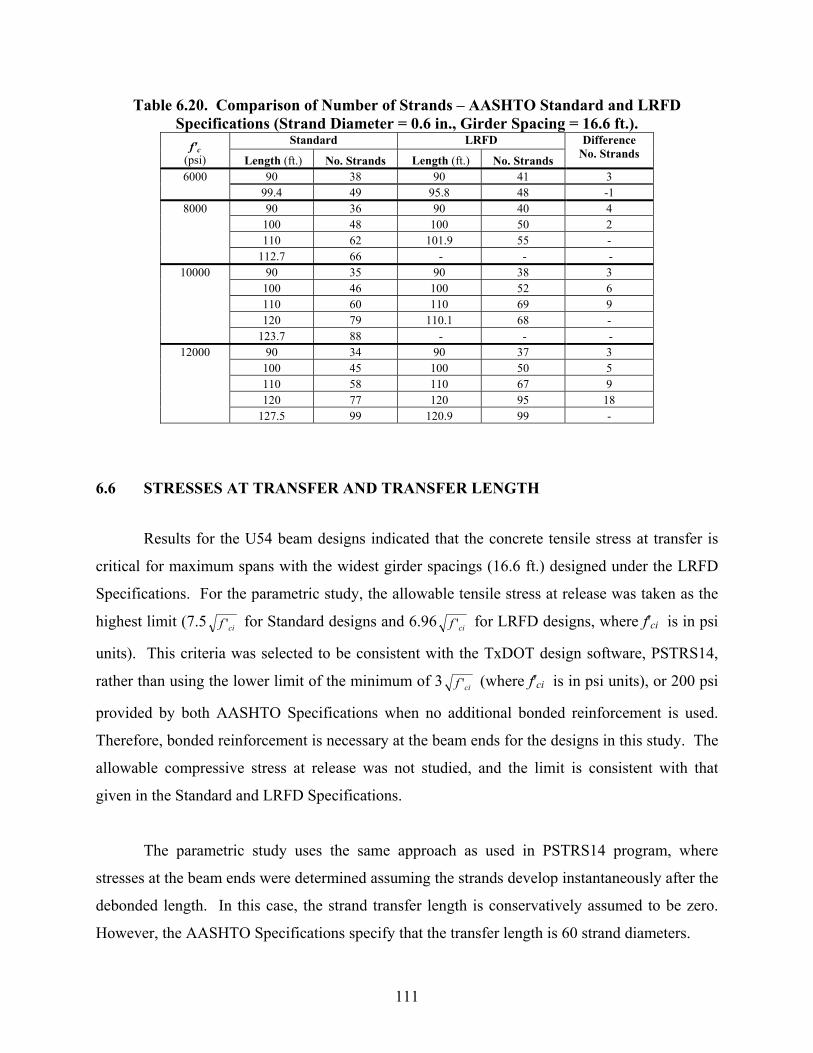
111
Table 6.20. Comparison of Number of Strands – AASHTO Standard and LRFD Specifications (Strand Diameter = 0.6 in., Girder Spacing = 16.6 ft.).
Standard LRFD f'c (psi) Length (ft.) No. Strands Length (ft.) No. Strands
Difference No. Strands
6000 90 38 90 41 3 99.4 49 95.8 48 -1
8000 90 36 90 40 4 100 48 100 50 2 110 62 101.9 55 - 112.7 66 - - -
10000 90 35 90 38 3 100 46 100 52 6 110 60 110 69 9 120 79 110.1 68 - 123.7 88 - - -
12000 90 34 90 37 3 100 45 100 50 5 110 58 110 67 9 120 77 120 95 18 127.5 99 120.9 99 -
6.6 STRESSES AT TRANSFER AND TRANSFER LENGTH
Results for the U54 beam designs indicated that the concrete tensile stress at transfer is
critical for maximum spans with the widest girder spacings (16.6 ft.) designed under the LRFD
Specifications. For the parametric study, the allowable tensile stress at release was taken as the
highest limit (7.5 cif ' for Standard designs and 6.96 cif ' for LRFD designs, where f'ci is in psi
units). This criteria was selected to be consistent with the TxDOT design software, PSTRS14,
rather than using the lower limit of the minimum of 3 cif ' (where f'ci is in psi units), or 200 psi
provided by both AASHTO Specifications when no additional bonded reinforcement is used.
Therefore, bonded reinforcement is necessary at the beam ends for the designs in this study. The
allowable compressive stress at release was not studied, and the limit is consistent with that
given in the Standard and LRFD Specifications.
The parametric study uses the same approach as used in PSTRS14 program, where
stresses at the beam ends were determined assuming the strands develop instantaneously after the
debonded length. In this case, the strand transfer length is conservatively assumed to be zero.
However, the AASHTO Specifications specify that the transfer length is 60 strand diameters.
112
To assess the impact of this conservative assumption for the transfer length, researches
conducted additional analysis for several critical cases was conducted. In addition, they
evaluated the impact of the lower tensile stress limit at release was evaluated. The cases
considered were the maximum spans using 0.6 in diameter strands for both specifications. The
allowable tensile stress at transfer specified as the minimum of 3 cif ' , or 200 psi, results in the
use of 200 psi, which seems more appropriate for normal strength concrete (up to 6000 psi). A
limit of 3 cif ' was used in this evaluation because the 200 psi limit would dramatically reduce
the span lengths for higher strength concrete.
6.6.1 Impact on the Controlling Limit States
6.6.1.1 Standard Specifications
Table 6.21 shows the impact of the allowable release stresses and transfer length on the
controlling limit states for maximum span lengths designed using the AASHTO Standard
Specifications and 0.6 in. diameter strands. For designs with an allowable tensile stress at
transfer of 7.5 cif ' , no differences were found on the controlling limit states for maximum spans
when transfer lengths of 0 and 60 strand diameters were used. Most of the maximum spans were
controlled by the compressive concrete stress due to total dead load. For designs with an
allowable tensile stress at transfer of 3 cif ' and a transfer length of 0 or 60 strand diameters,
the tensile stresses at transfer are critical. When the transfer length was considered to be zero,
most of the maximum span lengths were controlled by the tensile stress at the beam ends at
release. This limited the number of strands, except for the designs using girder spacings of 8.5
and 10 ft. at the lowest concrete strength (6000 psi). Moreover, maximum spans with the widest
girder spacing (16.6 ft.) were also controlled by the ultimate moment strength. When the transfer
length was considered as 60 strand diameters, only maximum spans with wider girder spacings
(14 and 16.6 ft.) were controlled by the tensile stress at the beam ends at release. In this case, the
ultimate moment strength did not control the maximum span length.
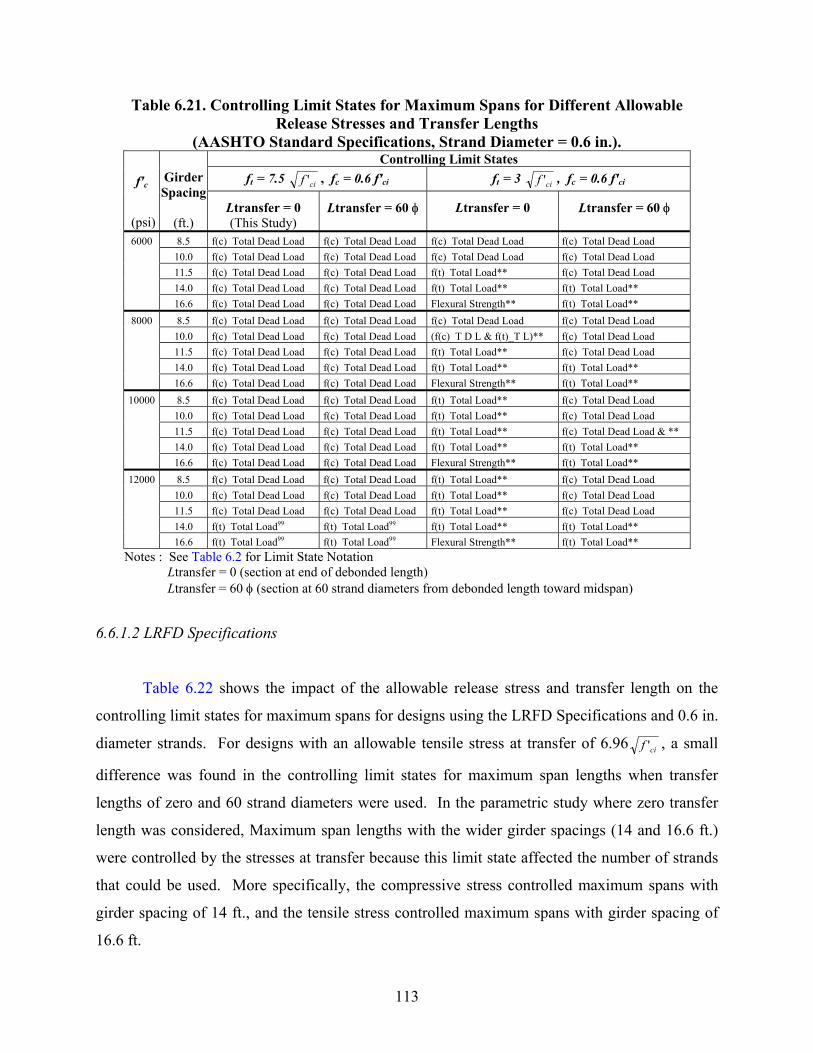
113
Table 6.21. Controlling Limit States for Maximum Spans for Different Allowable Release Stresses and Transfer Lengths
(AASHTO Standard Specifications, Strand Diameter = 0.6 in.). Controlling Limit States
ft = 7.5 cif ' , fc = 0.6 f'ci ft = 3 cif ' , fc = 0.6 f'ci f'c
(psi)
Girder Spacing
(ft.)
Ltransfer = 0 (This Study)
Ltransfer = 60 φ
Ltransfer = 0
Ltransfer = 60 φ
6000 8.5 f(c) Total Dead Load f(c) Total Dead Load f(c) Total Dead Load f(c) Total Dead Load 10.0 f(c) Total Dead Load f(c) Total Dead Load f(c) Total Dead Load f(c) Total Dead Load 11.5 f(c) Total Dead Load f(c) Total Dead Load f(t) Total Load** f(c) Total Dead Load 14.0 f(c) Total Dead Load f(c) Total Dead Load f(t) Total Load** f(t) Total Load** 16.6 f(c) Total Dead Load f(c) Total Dead Load Flexural Strength** f(t) Total Load**
8000 8.5 f(c) Total Dead Load f(c) Total Dead Load f(c) Total Dead Load f(c) Total Dead Load 10.0 f(c) Total Dead Load f(c) Total Dead Load (f(c) T D L & f(t)_T L)** f(c) Total Dead Load 11.5 f(c) Total Dead Load f(c) Total Dead Load f(t) Total Load** f(c) Total Dead Load 14.0 f(c) Total Dead Load f(c) Total Dead Load f(t) Total Load** f(t) Total Load** 16.6 f(c) Total Dead Load f(c) Total Dead Load Flexural Strength** f(t) Total Load**
10000 8.5 f(c) Total Dead Load f(c) Total Dead Load f(t) Total Load** f(c) Total Dead Load 10.0 f(c) Total Dead Load f(c) Total Dead Load f(t) Total Load** f(c) Total Dead Load 11.5 f(c) Total Dead Load f(c) Total Dead Load f(t) Total Load** f(c) Total Dead Load & ** 14.0 f(c) Total Dead Load f(c) Total Dead Load f(t) Total Load** f(t) Total Load** 16.6 f(c) Total Dead Load f(c) Total Dead Load Flexural Strength** f(t) Total Load**
12000 8.5 f(c) Total Dead Load f(c) Total Dead Load f(t) Total Load** f(c) Total Dead Load 10.0 f(c) Total Dead Load f(c) Total Dead Load f(t) Total Load** f(c) Total Dead Load 11.5 f(c) Total Dead Load f(c) Total Dead Load f(t) Total Load** f(c) Total Dead Load 14.0 f(t) Total Load99 f(t) Total Load99 f(t) Total Load** f(t) Total Load** 16.6 f(t) Total Load99 f(t) Total Load99 Flexural Strength** f(t) Total Load**
Notes : See Table 6.2 for Limit State Notation Ltransfer = 0 (section at end of debonded length) Ltransfer = 60 φ (section at 60 strand diameters from debonded length toward midspan)
6.6.1.2 LRFD Specifications
Table 6.22 shows the impact of the allowable release stress and transfer length on the
controlling limit states for maximum spans for designs using the LRFD Specifications and 0.6 in.
diameter strands. For designs with an allowable tensile stress at transfer of 6.96 cif ' , a small
difference was found in the controlling limit states for maximum span lengths when transfer
lengths of zero and 60 strand diameters were used. In the parametric study where zero transfer
length was considered, Maximum span lengths with the wider girder spacings (14 and 16.6 ft.)
were controlled by the stresses at transfer because this limit state affected the number of strands
that could be used. More specifically, the compressive stress controlled maximum spans with
girder spacing of 14 ft., and the tensile stress controlled maximum spans with girder spacing of
16.6 ft.
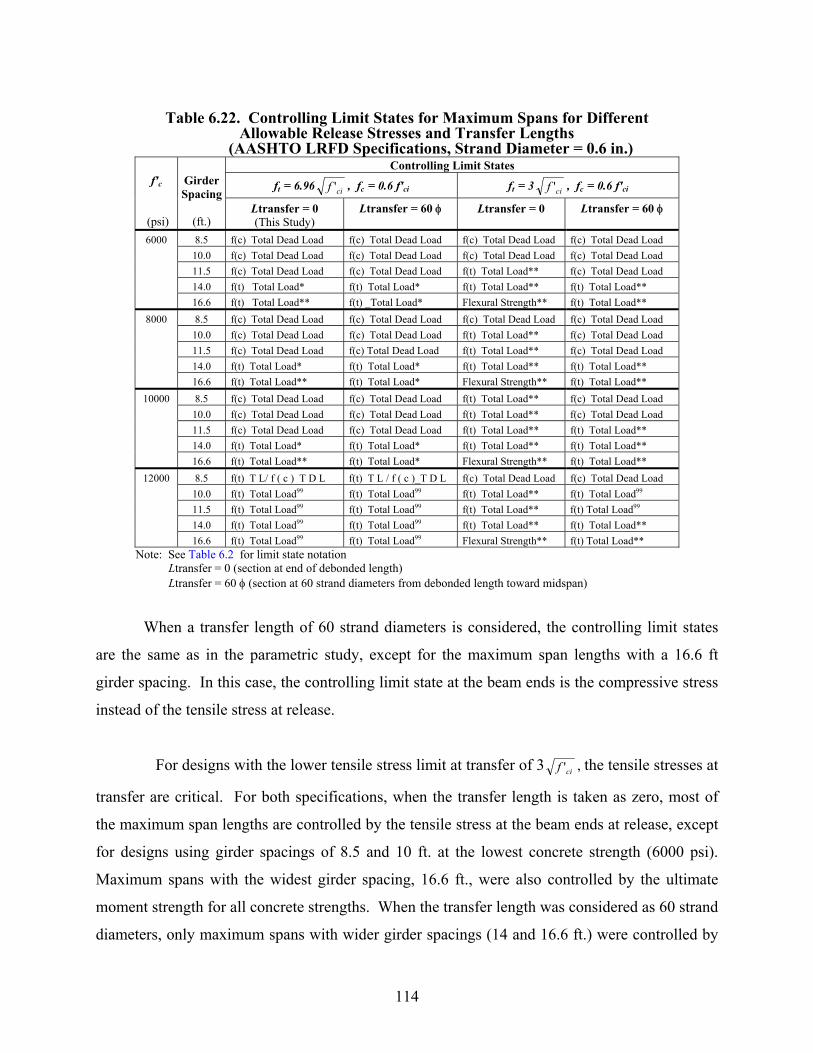
114
Table 6.22. Controlling Limit States for Maximum Spans for Different
Allowable Release Stresses and Transfer Lengths (AASHTO LRFD Specifications, Strand Diameter = 0.6 in.)
Controlling Limit States
ft = 6.96 cif ' , fc = 0.6 f'ci ft = 3 cif ' , fc = 0.6 f'ci f'c
(psi)
Girder Spacing
(ft.)
Ltransfer = 0 (This Study)
Ltransfer = 60 φ
Ltransfer = 0
Ltransfer = 60 φ
6000 8.5 f(c) Total Dead Load f(c) Total Dead Load f(c) Total Dead Load f(c) Total Dead Load 10.0 f(c) Total Dead Load f(c) Total Dead Load f(c) Total Dead Load f(c) Total Dead Load 11.5 f(c) Total Dead Load f(c) Total Dead Load f(t) Total Load** f(c) Total Dead Load 14.0 f(t) Total Load* f(t) Total Load* f(t) Total Load** f(t) Total Load** 16.6 f(t) Total Load** f(t) _Total Load* Flexural Strength** f(t) Total Load**
8000 8.5 f(c) Total Dead Load f(c) Total Dead Load f(c) Total Dead Load f(c) Total Dead Load 10.0 f(c) Total Dead Load f(c) Total Dead Load f(t) Total Load** f(c) Total Dead Load 11.5 f(c) Total Dead Load f(c) Total Dead Load f(t) Total Load** f(c) Total Dead Load 14.0 f(t) Total Load* f(t) Total Load* f(t) Total Load** f(t) Total Load** 16.6 f(t) Total Load** f(t) Total Load* Flexural Strength** f(t) Total Load**
10000 8.5 f(c) Total Dead Load f(c) Total Dead Load f(t) Total Load** f(c) Total Dead Load 10.0 f(c) Total Dead Load f(c) Total Dead Load f(t) Total Load** f(c) Total Dead Load 11.5 f(c) Total Dead Load f(c) Total Dead Load f(t) Total Load** f(t) Total Load** 14.0 f(t) Total Load* f(t) Total Load* f(t) Total Load** f(t) Total Load** 16.6 f(t) Total Load** f(t) Total Load* Flexural Strength** f(t) Total Load**
12000 8.5 f(t) T L/ f ( c ) T D L f(t) T L / f ( c )_T D L f(c) Total Dead Load f(c) Total Dead Load 10.0 f(t) Total Load99 f(t) Total Load99 f(t) Total Load** f(t) Total Load99 11.5 f(t) Total Load99 f(t) Total Load99 f(t) Total Load** f(t) Total Load99 14.0 f(t) Total Load99 f(t) Total Load99 f(t) Total Load** f(t) Total Load** 16.6 f(t) Total Load99 f(t) Total Load99 Flexural Strength** f(t) Total Load**
Note: See Table 6.2 for limit state notation Ltransfer = 0 (section at end of debonded length) Ltransfer = 60 φ (section at 60 strand diameters from debonded length toward midspan)
When a transfer length of 60 strand diameters is considered, the controlling limit states
are the same as in the parametric study, except for the maximum span lengths with a 16.6 ft
girder spacing. In this case, the controlling limit state at the beam ends is the compressive stress
instead of the tensile stress at release.
For designs with the lower tensile stress limit at transfer of 3 cif ' , the tensile stresses at
transfer are critical. For both specifications, when the transfer length is taken as zero, most of
the maximum span lengths are controlled by the tensile stress at the beam ends at release, except
for designs using girder spacings of 8.5 and 10 ft. at the lowest concrete strength (6000 psi).
Maximum spans with the widest girder spacing, 16.6 ft., were also controlled by the ultimate
moment strength for all concrete strengths. When the transfer length was considered as 60 strand
diameters, only maximum spans with wider girder spacings (14 and 16.6 ft.) were controlled by
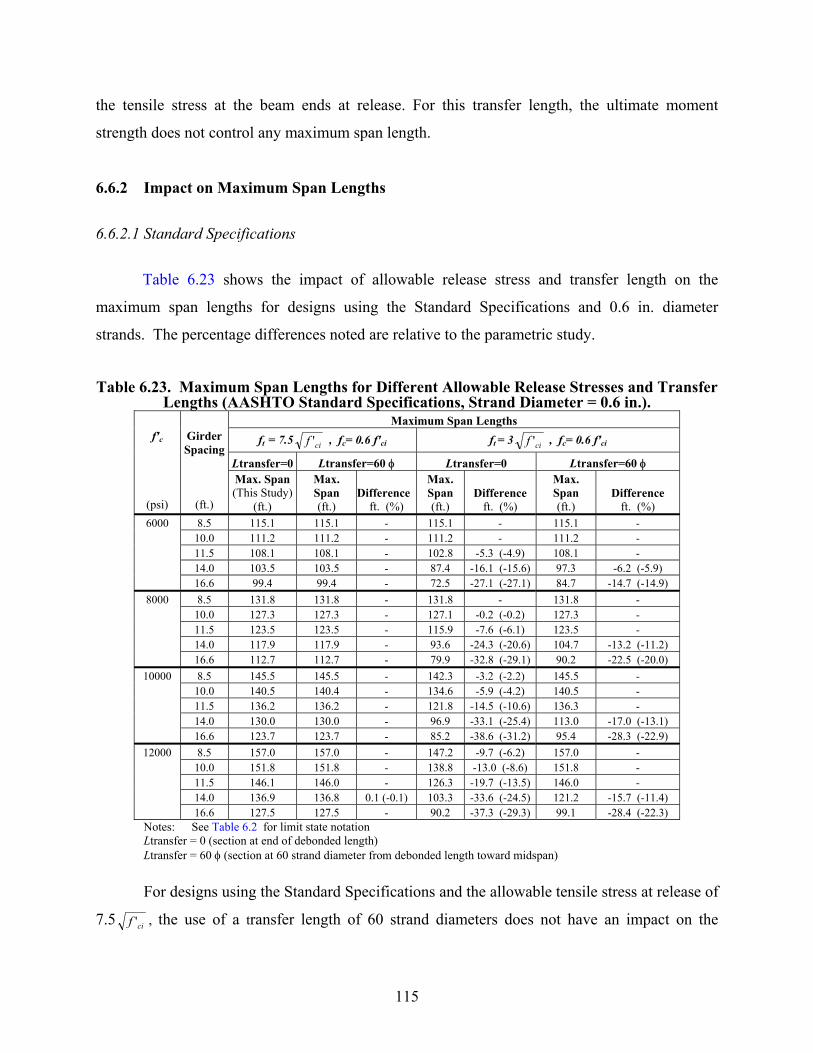
115
the tensile stress at the beam ends at release. For this transfer length, the ultimate moment
strength does not control any maximum span length.
6.6.2 Impact on Maximum Span Lengths
6.6.2.1 Standard Specifications
Table 6.23 shows the impact of allowable release stress and transfer length on the
maximum span lengths for designs using the Standard Specifications and 0.6 in. diameter
strands. The percentage differences noted are relative to the parametric study.
Table 6.23. Maximum Span Lengths for Different Allowable Release Stresses and Transfer
Lengths (AASHTO Standard Specifications, Strand Diameter = 0.6 in.). Maximum Span Lengths
ft = 7.5 cif ' , fc= 0.6 f'ci ft = 3 cif ' , fc= 0.6 f'ci
Ltransfer=0 Ltransfer=60 φ Ltransfer=0 Ltransfer=60 φ
f'c
(psi)
Girder Spacing
(ft.)
Max. Span (This Study)
(ft.)
Max. Span (ft.)
Differenceft. (%)
Max. Span (ft.)
Difference ft. (%)
Max. Span (ft.)
Difference ft. (%)
6000 8.5 115.1 115.1 - 115.1 - 115.1 - 10.0 111.2 111.2 - 111.2 - 111.2 - 11.5 108.1 108.1 - 102.8 -5.3 (-4.9) 108.1 - 14.0 103.5 103.5 - 87.4 -16.1 (-15.6) 97.3 -6.2 (-5.9) 16.6 99.4 99.4 - 72.5 -27.1 (-27.1) 84.7 -14.7 (-14.9)
8000 8.5 131.8 131.8 - 131.8 - 131.8 - 10.0 127.3 127.3 - 127.1 -0.2 (-0.2) 127.3 - 11.5 123.5 123.5 - 115.9 -7.6 (-6.1) 123.5 - 14.0 117.9 117.9 - 93.6 -24.3 (-20.6) 104.7 -13.2 (-11.2) 16.6 112.7 112.7 - 79.9 -32.8 (-29.1) 90.2 -22.5 (-20.0)
10000 8.5 145.5 145.5 - 142.3 -3.2 (-2.2) 145.5 - 10.0 140.5 140.4 - 134.6 -5.9 (-4.2) 140.5 - 11.5 136.2 136.2 - 121.8 -14.5 (-10.6) 136.3 - 14.0 130.0 130.0 - 96.9 -33.1 (-25.4) 113.0 -17.0 (-13.1) 16.6 123.7 123.7 - 85.2 -38.6 (-31.2) 95.4 -28.3 (-22.9)
12000 8.5 157.0 157.0 - 147.2 -9.7 (-6.2) 157.0 - 10.0 151.8 151.8 - 138.8 -13.0 (-8.6) 151.8 - 11.5 146.1 146.0 - 126.3 -19.7 (-13.5) 146.0 - 14.0 136.9 136.8 0.1 (-0.1) 103.3 -33.6 (-24.5) 121.2 -15.7 (-11.4) 16.6 127.5 127.5 - 90.2 -37.3 (-29.3) 99.1 -28.4 (-22.3)
Notes: See Table 6.2 for limit state notation Ltransfer = 0 (section at end of debonded length) Ltransfer = 60 φ (section at 60 strand diameter from debonded length toward midspan) For designs using the Standard Specifications and the allowable tensile stress at release of
7.5 cif ' , the use of a transfer length of 60 strand diameters does not have an impact on the
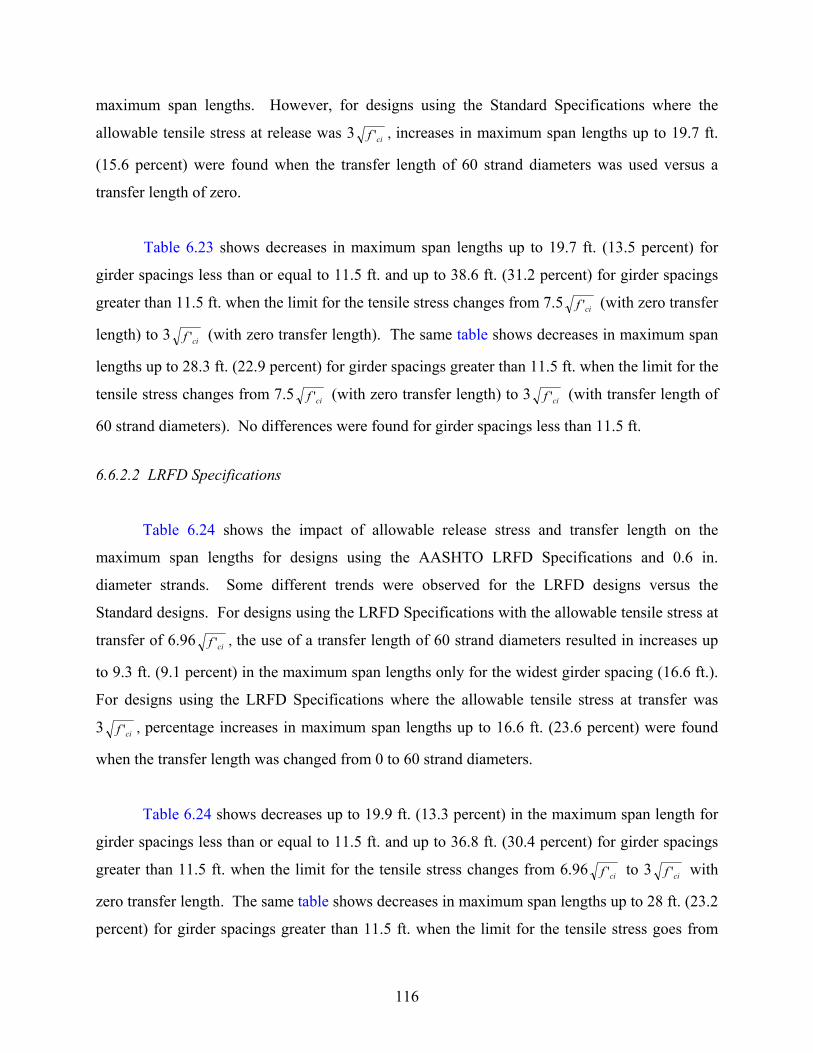
116
maximum span lengths. However, for designs using the Standard Specifications where the
allowable tensile stress at release was 3 cif ' , increases in maximum span lengths up to 19.7 ft.
(15.6 percent) were found when the transfer length of 60 strand diameters was used versus a
transfer length of zero.
Table 6.23 shows decreases in maximum span lengths up to 19.7 ft. (13.5 percent) for
girder spacings less than or equal to 11.5 ft. and up to 38.6 ft. (31.2 percent) for girder spacings
greater than 11.5 ft. when the limit for the tensile stress changes from 7.5 cif ' (with zero transfer
length) to 3 cif ' (with zero transfer length). The same table shows decreases in maximum span
lengths up to 28.3 ft. (22.9 percent) for girder spacings greater than 11.5 ft. when the limit for the
tensile stress changes from 7.5 cif ' (with zero transfer length) to 3 cif ' (with transfer length of
60 strand diameters). No differences were found for girder spacings less than 11.5 ft.
6.6.2.2 LRFD Specifications
Table 6.24 shows the impact of allowable release stress and transfer length on the
maximum span lengths for designs using the AASHTO LRFD Specifications and 0.6 in.
diameter strands. Some different trends were observed for the LRFD designs versus the
Standard designs. For designs using the LRFD Specifications with the allowable tensile stress at
transfer of 6.96 cif ' , the use of a transfer length of 60 strand diameters resulted in increases up
to 9.3 ft. (9.1 percent) in the maximum span lengths only for the widest girder spacing (16.6 ft.).
For designs using the LRFD Specifications where the allowable tensile stress at transfer was
3 cif ' , percentage increases in maximum span lengths up to 16.6 ft. (23.6 percent) were found
when the transfer length was changed from 0 to 60 strand diameters.
Table 6.24 shows decreases up to 19.9 ft. (13.3 percent) in the maximum span length for
girder spacings less than or equal to 11.5 ft. and up to 36.8 ft. (30.4 percent) for girder spacings
greater than 11.5 ft. when the limit for the tensile stress changes from 6.96 cif ' to 3 cif ' with
zero transfer length. The same table shows decreases in maximum span lengths up to 28 ft. (23.2
percent) for girder spacings greater than 11.5 ft. when the limit for the tensile stress goes from
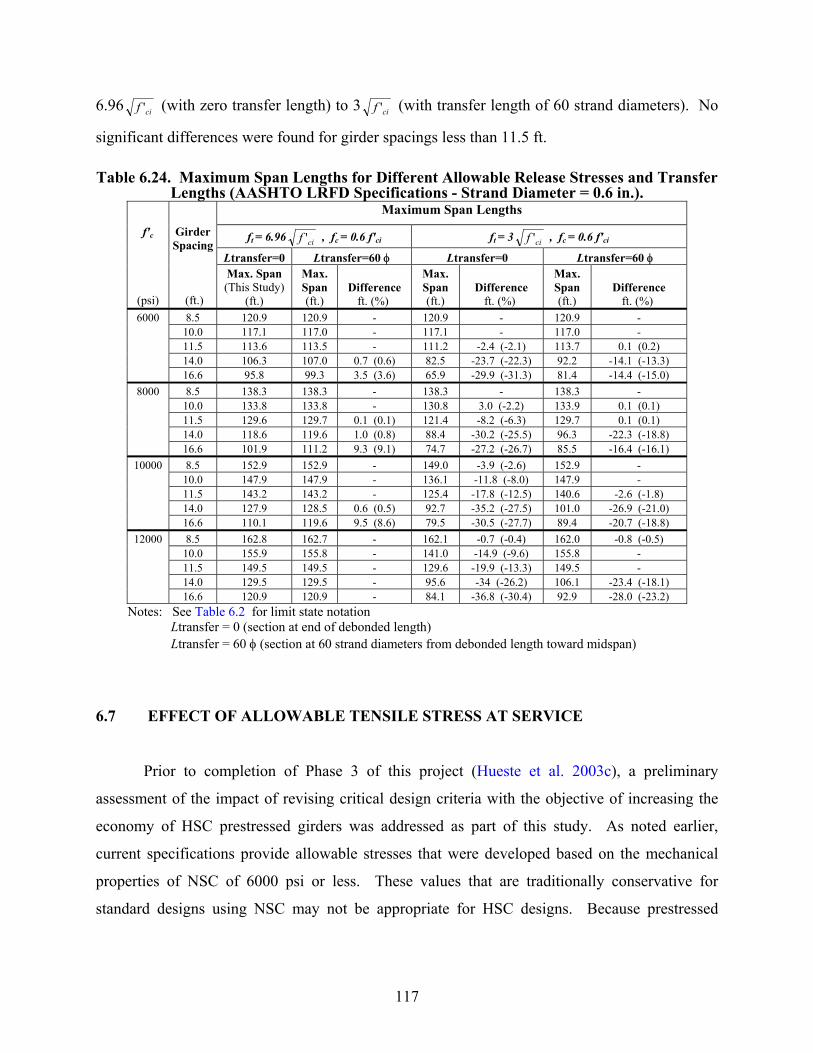
117
6.96 cif ' (with zero transfer length) to 3 cif ' (with transfer length of 60 strand diameters). No
significant differences were found for girder spacings less than 11.5 ft.
Table 6.24. Maximum Span Lengths for Different Allowable Release Stresses and Transfer Lengths (AASHTO LRFD Specifications - Strand Diameter = 0.6 in.).
Maximum Span Lengths
ft = 6.96 cif ' , fc = 0.6 f'ci ft = 3 cif ' , fc = 0.6 f'ci
Ltransfer=0 Ltransfer=60 φ Ltransfer=0 Ltransfer=60 φ
f'c
(psi)
Girder Spacing
(ft.)
Max. Span (This Study)
(ft.)
Max. Span (ft.)
Difference ft. (%)
Max. Span (ft.)
Difference ft. (%)
Max. Span (ft.)
Difference ft. (%)
6000 8.5 120.9 120.9 - 120.9 - 120.9 - 10.0 117.1 117.0 - 117.1 - 117.0 - 11.5 113.6 113.5 - 111.2 -2.4 (-2.1) 113.7 0.1 (0.2) 14.0 106.3 107.0 0.7 (0.6) 82.5 -23.7 (-22.3) 92.2 -14.1 (-13.3) 16.6 95.8 99.3 3.5 (3.6) 65.9 -29.9 (-31.3) 81.4 -14.4 (-15.0)
8000 8.5 138.3 138.3 - 138.3 - 138.3 - 10.0 133.8 133.8 - 130.8 3.0 (-2.2) 133.9 0.1 (0.1) 11.5 129.6 129.7 0.1 (0.1) 121.4 -8.2 (-6.3) 129.7 0.1 (0.1) 14.0 118.6 119.6 1.0 (0.8) 88.4 -30.2 (-25.5) 96.3 -22.3 (-18.8) 16.6 101.9 111.2 9.3 (9.1) 74.7 -27.2 (-26.7) 85.5 -16.4 (-16.1)
10000 8.5 152.9 152.9 - 149.0 -3.9 (-2.6) 152.9 - 10.0 147.9 147.9 - 136.1 -11.8 (-8.0) 147.9 - 11.5 143.2 143.2 - 125.4 -17.8 (-12.5) 140.6 -2.6 (-1.8) 14.0 127.9 128.5 0.6 (0.5) 92.7 -35.2 (-27.5) 101.0 -26.9 (-21.0) 16.6 110.1 119.6 9.5 (8.6) 79.5 -30.5 (-27.7) 89.4 -20.7 (-18.8)
12000 8.5 162.8 162.7 - 162.1 -0.7 (-0.4) 162.0 -0.8 (-0.5) 10.0 155.9 155.8 - 141.0 -14.9 (-9.6) 155.8 - 11.5 149.5 149.5 - 129.6 -19.9 (-13.3) 149.5 - 14.0 129.5 129.5 - 95.6 -34 (-26.2) 106.1 -23.4 (-18.1) 16.6 120.9 120.9 - 84.1 -36.8 (-30.4) 92.9 -28.0 (-23.2)
Notes: See Table 6.2 for limit state notation Ltransfer = 0 (section at end of debonded length) Ltransfer = 60 φ (section at 60 strand diameters from debonded length toward midspan)
6.7 EFFECT OF ALLOWABLE TENSILE STRESS AT SERVICE
Prior to completion of Phase 3 of this project (Hueste et al. 2003c), a preliminary
assessment of the impact of revising critical design criteria with the objective of increasing the
economy of HSC prestressed girders was addressed as part of this study. As noted earlier,
current specifications provide allowable stresses that were developed based on the mechanical
properties of NSC of 6000 psi or less. These values that are traditionally conservative for
standard designs using NSC may not be appropriate for HSC designs. Because prestressed
118
concrete design is often governed by the allowable stresses, researchers studied the effects of the
allowable stresses on the required number of strands and consequently on the span capability.
The results of the parametric study showed that the allowable tensile stress limit is
critical because it controls the designs (number of strands required) in most cases for longer
spans. Based on review of current allowable stresses (see Section 2.5) and considering the HSC
Louetta Bridge design (Ralls 1995), an allowable tensile stress of 7.5 cf ' (where f 'c is in psi
units) was selected for this preliminary assessment. This stress limit can also be compared to the
modulus of rupture for HSC determined in Phase 1 of this study (Hueste et al. 2003b), which was
found to have a best-fit equation of 10 cf ' , with a lower bound value of about 8 cf ' . Note that
Phase 3 focused on assessing the impact on field curing conditions on the compressive strength
and modulus of rupture of HSC (Hueste et al. 2003c). However, these results were not available
at the time this phase of the project took place.
The parametric study showed that HSC prestressed bridge girder designs are often
controlled by the compressive stress limits. In addition, Phase 1 of this study showed that for
HSC produced by Texas precasters, the actual concrete compressive strength at service is
typically greater than specified, where the ratio of the actual to specified f'c ranged from 1.01 to
1.89 (Hueste et al. 2003b). However, increases in the compressive stress limits were not selected
for evaluation in this study, and the allowable compressive stress was maintained as 0.45 f'c as
specified in the LRFD Specifications and in ACI 318-02. The reason for this is that the current
limits for the compressive stresses were established to limit excessive creep, camber, or other
local strains. The compressive stress limits for sustained loads (0.4 f'c to 0.45 f'c) are generally in
the linear range of behavior for NSC. An increase in the stress limit to 0.6 f'c is allowed for load
cases including transient loads. These limits were developed for NSC, and more studies are
needed to evaluate whether these limits are applicable to HSC. Assuming that the same
coefficients are appropriate for the compressive stress limits for HSC prestressed members, it is
not conservative to assume an overstrength will be provided in the design phase, because
production practices may change among precasters over time and this overstrength is not a
requirement. Potentially, the actual strength gain can be utilized by tailoring designs based
119
on strength data for a typical concrete mixture used by the selected precaster. However, the
precaster may not be identified in the initial design stage and so this may not always be practical.
6.7.1 Impact on the Controlling Limit States
Tables 6.25 through 6.29 provide controlling limit states for different allowable tensile
stresses at service for U54 Beams with spans from 90 ft. to maximum span lengths at 10 ft.
intervals. A separate table is provided for each girder spacing considered. Different concrete
classes are considered, and all cases are for 0.6 in. diameter strands with designs according to the
LRFD Specifications. The controlling limit states are the limit state that dictates the required
number of strands or limits the maximum span.
Results showed that for shorter spans (in several cases up to 100 ft., and 110 ft. in one
case), allowing a higher tensile stress has an impact on the ultimate strength of the beams
because increasing the tensile stress limit resulted in a reduction of the number of strands
required for a given span length. As girder spacings decrease and concrete strengths increase,
the flexural strength becomes more critical. For a given longer span length, except for maximum
span lengths, the use of ft = 7.5 cf ' resulted in designs that were controlled by the tensile stress
limit, as was the case when using ft = 6 cf ' . However, fewer strands were required when using
the higher tensile stress limit (see Sections 6.7.2 and 6.7.3).
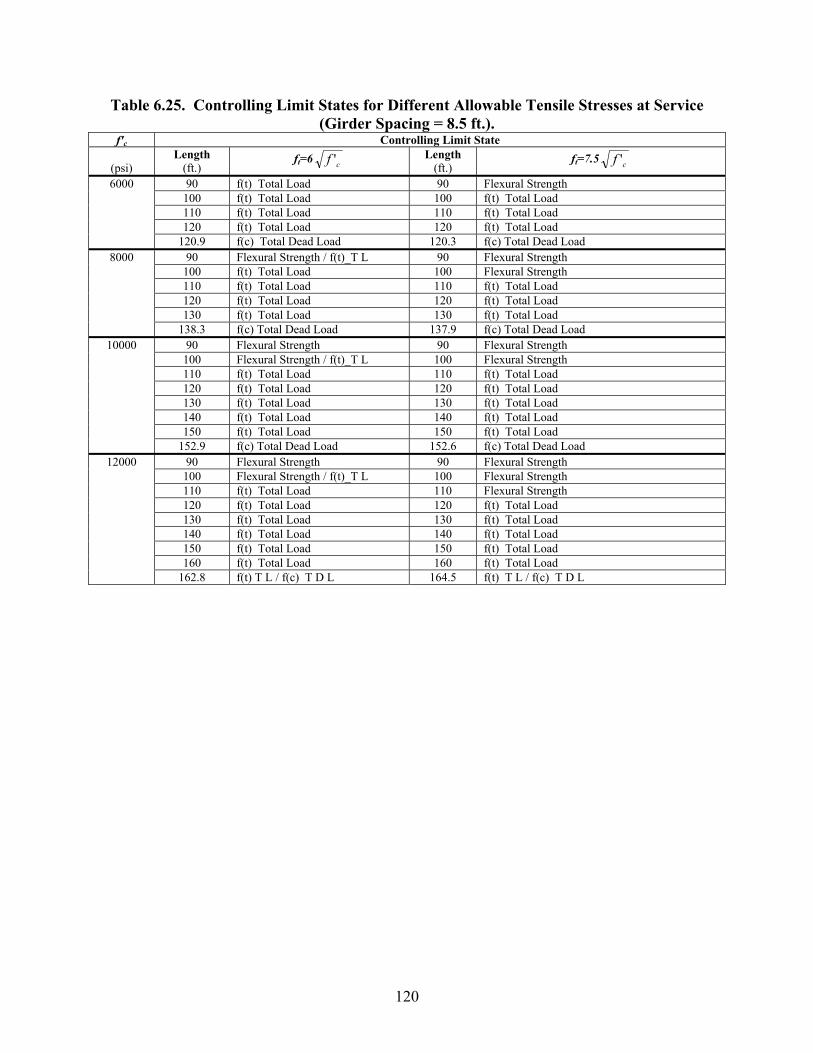
120
Table 6.25. Controlling Limit States for Different Allowable Tensile Stresses at Service (Girder Spacing = 8.5 ft.).
f'c Controlling Limit State
(psi) Length
(ft.) ft=6 cf ' Length
(ft.) ft=7.5 cf '
6000 90 f(t) Total Load 90 Flexural Strength 100 f(t) Total Load 100 f(t) Total Load 110 f(t) Total Load 110 f(t) Total Load 120 f(t) Total Load 120 f(t) Total Load 120.9 f(c) Total Dead Load 120.3 f(c) Total Dead Load
8000 90 Flexural Strength / f(t)_T L 90 Flexural Strength 100 f(t) Total Load 100 Flexural Strength 110 f(t) Total Load 110 f(t) Total Load 120 f(t) Total Load 120 f(t) Total Load 130 f(t) Total Load 130 f(t) Total Load 138.3 f(c) Total Dead Load 137.9 f(c) Total Dead Load
10000 90 Flexural Strength 90 Flexural Strength 100 Flexural Strength / f(t)_T L 100 Flexural Strength 110 f(t) Total Load 110 f(t) Total Load 120 f(t) Total Load 120 f(t) Total Load 130 f(t) Total Load 130 f(t) Total Load 140 f(t) Total Load 140 f(t) Total Load 150 f(t) Total Load 150 f(t) Total Load 152.9 f(c) Total Dead Load 152.6 f(c) Total Dead Load
12000 90 Flexural Strength 90 Flexural Strength 100 Flexural Strength / f(t)_T L 100 Flexural Strength 110 f(t) Total Load 110 Flexural Strength 120 f(t) Total Load 120 f(t) Total Load 130 f(t) Total Load 130 f(t) Total Load 140 f(t) Total Load 140 f(t) Total Load 150 f(t) Total Load 150 f(t) Total Load 160 f(t) Total Load 160 f(t) Total Load 162.8 f(t) T L / f(c) T D L 164.5 f(t) T L / f(c) T D L
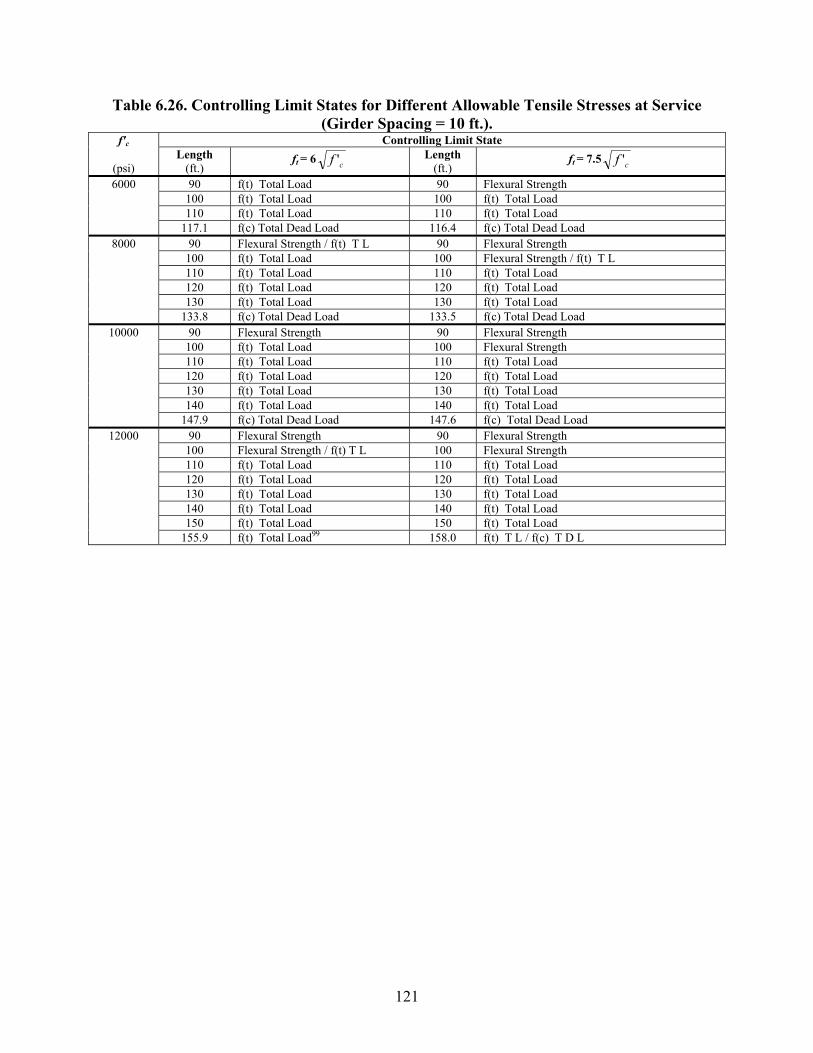
121
Table 6.26. Controlling Limit States for Different Allowable Tensile Stresses at Service (Girder Spacing = 10 ft.).
f'c Controlling Limit State
(psi) Length
(ft.) ft = 6 cf ' Length
(ft.) ft = 7.5 cf '
6000 90 f(t) Total Load 90 Flexural Strength 100 f(t) Total Load 100 f(t) Total Load 110 f(t) Total Load 110 f(t) Total Load 117.1 f(c) Total Dead Load 116.4 f(c) Total Dead Load
8000 90 Flexural Strength / f(t) T L 90 Flexural Strength 100 f(t) Total Load 100 Flexural Strength / f(t) T L 110 f(t) Total Load 110 f(t) Total Load 120 f(t) Total Load 120 f(t) Total Load 130 f(t) Total Load 130 f(t) Total Load 133.8 f(c) Total Dead Load 133.5 f(c) Total Dead Load
10000 90 Flexural Strength 90 Flexural Strength 100 f(t) Total Load 100 Flexural Strength 110 f(t) Total Load 110 f(t) Total Load 120 f(t) Total Load 120 f(t) Total Load 130 f(t) Total Load 130 f(t) Total Load 140 f(t) Total Load 140 f(t) Total Load 147.9 f(c) Total Dead Load 147.6 f(c) Total Dead Load
12000 90 Flexural Strength 90 Flexural Strength 100 Flexural Strength / f(t) T L 100 Flexural Strength 110 f(t) Total Load 110 f(t) Total Load 120 f(t) Total Load 120 f(t) Total Load 130 f(t) Total Load 130 f(t) Total Load 140 f(t) Total Load 140 f(t) Total Load 150 f(t) Total Load 150 f(t) Total Load 155.9 f(t) Total Load99 158.0 f(t) T L / f(c) T D L
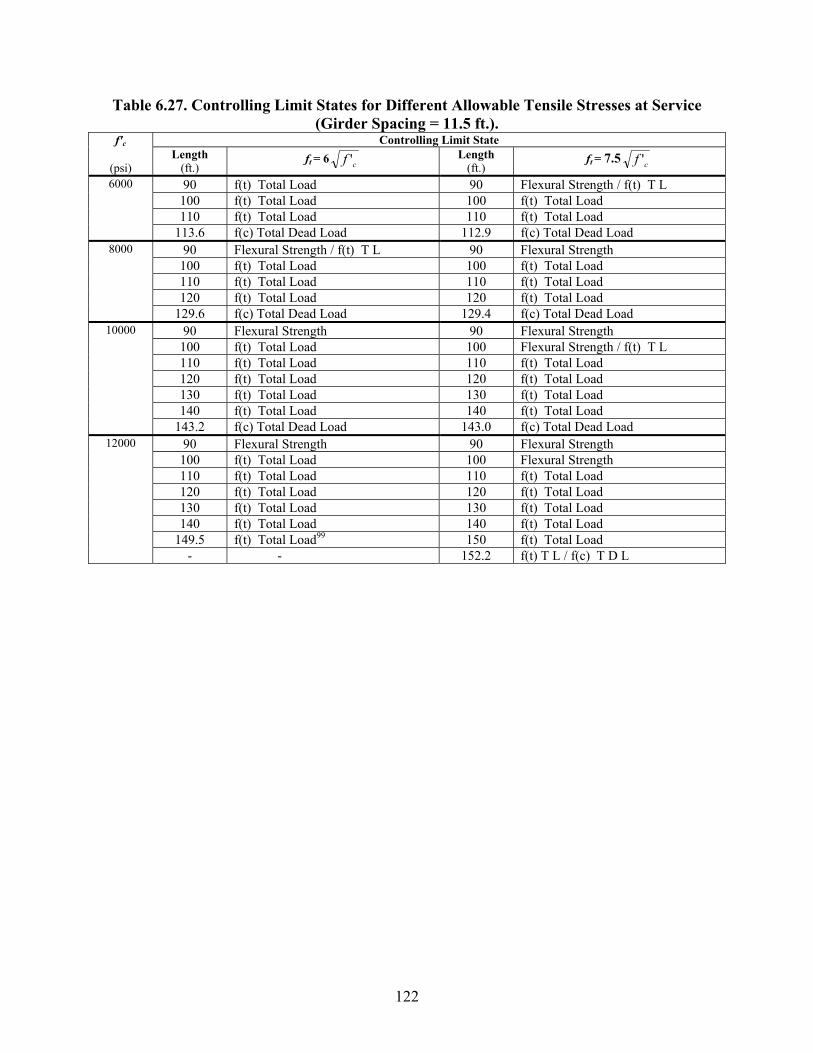
122
Table 6.27. Controlling Limit States for Different Allowable Tensile Stresses at Service (Girder Spacing = 11.5 ft.).
f'c Controlling Limit State
(psi) Length
(ft.) ft = 6 cf ' Length
(ft.) ft = 7.5 cf '
6000 90 f(t) Total Load 90 Flexural Strength / f(t) T L 100 f(t) Total Load 100 f(t) Total Load 110 f(t) Total Load 110 f(t) Total Load 113.6 f(c) Total Dead Load 112.9 f(c) Total Dead Load
8000 90 Flexural Strength / f(t) T L 90 Flexural Strength 100 f(t) Total Load 100 f(t) Total Load 110 f(t) Total Load 110 f(t) Total Load 120 f(t) Total Load 120 f(t) Total Load 129.6 f(c) Total Dead Load 129.4 f(c) Total Dead Load
10000 90 Flexural Strength 90 Flexural Strength 100 f(t) Total Load 100 Flexural Strength / f(t) T L 110 f(t) Total Load 110 f(t) Total Load 120 f(t) Total Load 120 f(t) Total Load 130 f(t) Total Load 130 f(t) Total Load 140 f(t) Total Load 140 f(t) Total Load 143.2 f(c) Total Dead Load 143.0 f(c) Total Dead Load
12000 90 Flexural Strength 90 Flexural Strength 100 f(t) Total Load 100 Flexural Strength 110 f(t) Total Load 110 f(t) Total Load 120 f(t) Total Load 120 f(t) Total Load 130 f(t) Total Load 130 f(t) Total Load 140 f(t) Total Load 140 f(t) Total Load 149.5 f(t) Total Load99 150 f(t) Total Load - - 152.2 f(t) T L / f(c) T D L
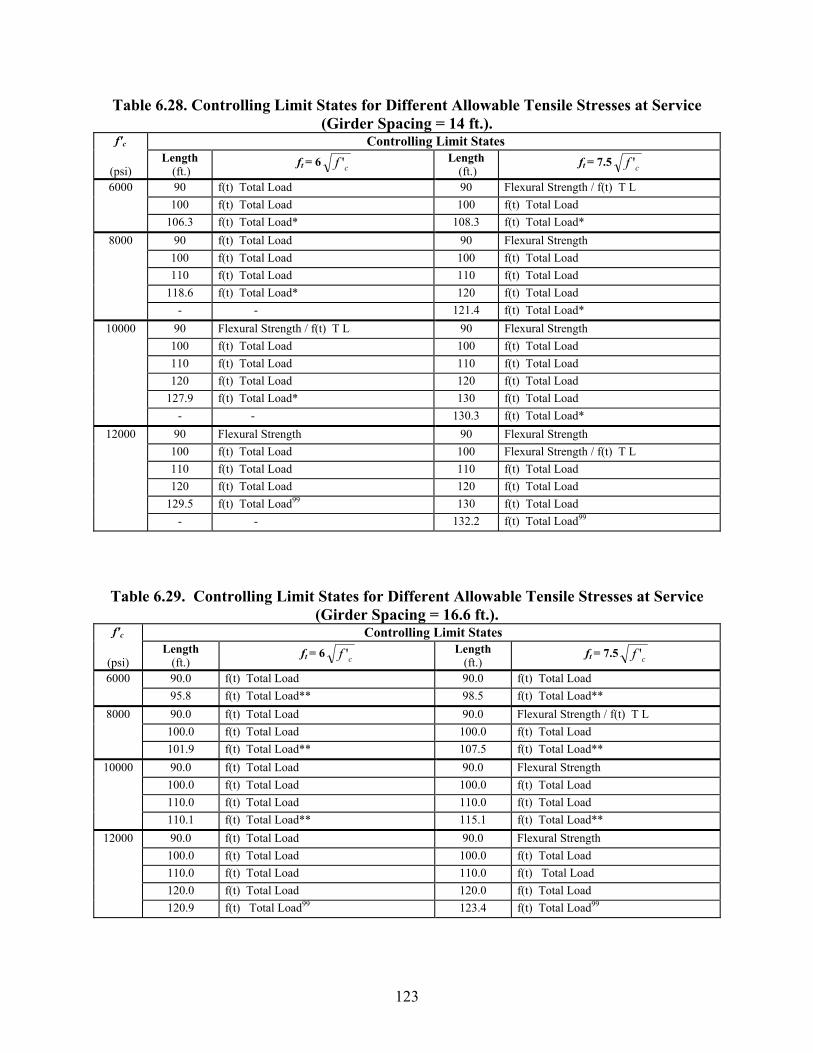
123
Table 6.28. Controlling Limit States for Different Allowable Tensile Stresses at Service (Girder Spacing = 14 ft.).
f'c Controlling Limit States
(psi) Length
(ft.) ft = 6 cf ' Length
(ft.) ft = 7.5 cf '
6000 90 f(t) Total Load 90 Flexural Strength / f(t) T L 100 f(t) Total Load 100 f(t) Total Load 106.3 f(t) Total Load* 108.3 f(t) Total Load*
8000 90 f(t) Total Load 90 Flexural Strength 100 f(t) Total Load 100 f(t) Total Load 110 f(t) Total Load 110 f(t) Total Load 118.6 f(t) Total Load* 120 f(t) Total Load - - 121.4 f(t) Total Load*
10000 90 Flexural Strength / f(t) T L 90 Flexural Strength 100 f(t) Total Load 100 f(t) Total Load 110 f(t) Total Load 110 f(t) Total Load 120 f(t) Total Load 120 f(t) Total Load 127.9 f(t) Total Load* 130 f(t) Total Load - - 130.3 f(t) Total Load*
90 Flexural Strength 90 Flexural Strength 100 f(t) Total Load 100 Flexural Strength / f(t) T L 110 f(t) Total Load 110 f(t) Total Load 120 f(t) Total Load 120 f(t) Total Load
129.5 f(t) Total Load99 130 f(t) Total Load
12000
- - 132.2 f(t) Total Load99
Table 6.29. Controlling Limit States for Different Allowable Tensile Stresses at Service (Girder Spacing = 16.6 ft.).
f'c Controlling Limit States
(psi) Length
(ft.) ft = 6 cf ' Length
(ft.) ft = 7.5 cf '
90.0 f(t) Total Load 90.0 f(t) Total Load 6000 95.8 f(t) Total Load** 98.5 f(t) Total Load** 90.0 f(t) Total Load 90.0 Flexural Strength / f(t) T L
100.0 f(t) Total Load 100.0 f(t) Total Load 8000
101.9 f(t) Total Load** 107.5 f(t) Total Load** 90.0 f(t) Total Load 90.0 Flexural Strength
100.0 f(t) Total Load 100.0 f(t) Total Load 110.0 f(t) Total Load 110.0 f(t) Total Load
10000
110.1 f(t) Total Load** 115.1 f(t) Total Load** 90.0 f(t) Total Load 90.0 Flexural Strength
100.0 f(t) Total Load 100.0 f(t) Total Load 110.0 f(t) Total Load 110.0 f(t) Total Load 120.0 f(t) Total Load 120.0 f(t) Total Load
12000
120.9 f(t) Total Load99 123.4 f(t) Total Load99
124
6.7.2 Impact on the Number of Strands
Tables 6.30 through 6.34 show the differences for the number of strands required for
spans from 90 ft. to maximum span lengths at 10 ft. intervals designed with two different
allowable tensile stress limits (ft = 6 cf ' and ft = 7.5 cf ' ) for different concrete classes and
girder spacings. The calculations were performed for U54 Beams with 0.6 in. diameter strands
designed using the LRFD Specifications.
The number of strands required for maximum span lengths is not compared in the tables
above but is discussed in Section 6.7.4. For the same span and for girder spacings up to 11.5 ft.,
designs using ft = 7.5 cf ' required between one to seven fewer strands than for designs using ft =
6 cf ' . For the same span and for girder spacings greater than 11.5 ft., designs using ft = 7.5 cf '
required between 1 and 11 fewer strands than for designs using ft = 6 cf ' . The percentage
reduction in the number of strands when using the larger allowable tensile stress ranged from 0
to 12 percent.
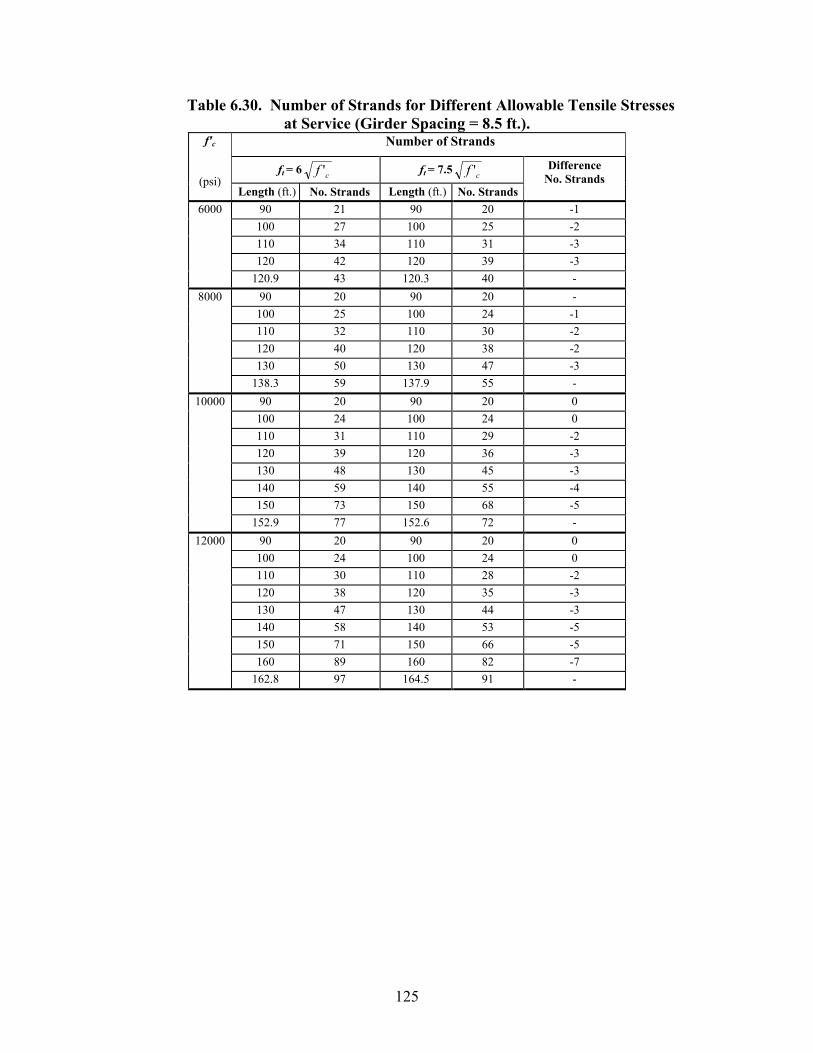
125
Table 6.30. Number of Strands for Different Allowable Tensile Stresses at Service (Girder Spacing = 8.5 ft.).
Number of Strands
ft = 6 cf ' ft = 7.5 cf '
f'c
(psi)
Length (ft.) No. Strands Length (ft.) No. Strands
Difference No. Strands
6000 90 21 90 20 -1 100 27 100 25 -2 110 34 110 31 -3 120 42 120 39 -3 120.9 43 120.3 40 -
8000 90 20 90 20 - 100 25 100 24 -1 110 32 110 30 -2 120 40 120 38 -2 130 50 130 47 -3
138.3 59 137.9 55 - 10000 90 20 90 20 0
100 24 100 24 0 110 31 110 29 -2 120 39 120 36 -3 130 48 130 45 -3 140 59 140 55 -4 150 73 150 68 -5 152.9 77 152.6 72 -
12000 90 20 90 20 0 100 24 100 24 0 110 30 110 28 -2 120 38 120 35 -3 130 47 130 44 -3 140 58 140 53 -5 150 71 150 66 -5
160 89 160 82 -7 162.8 97 164.5 91 -
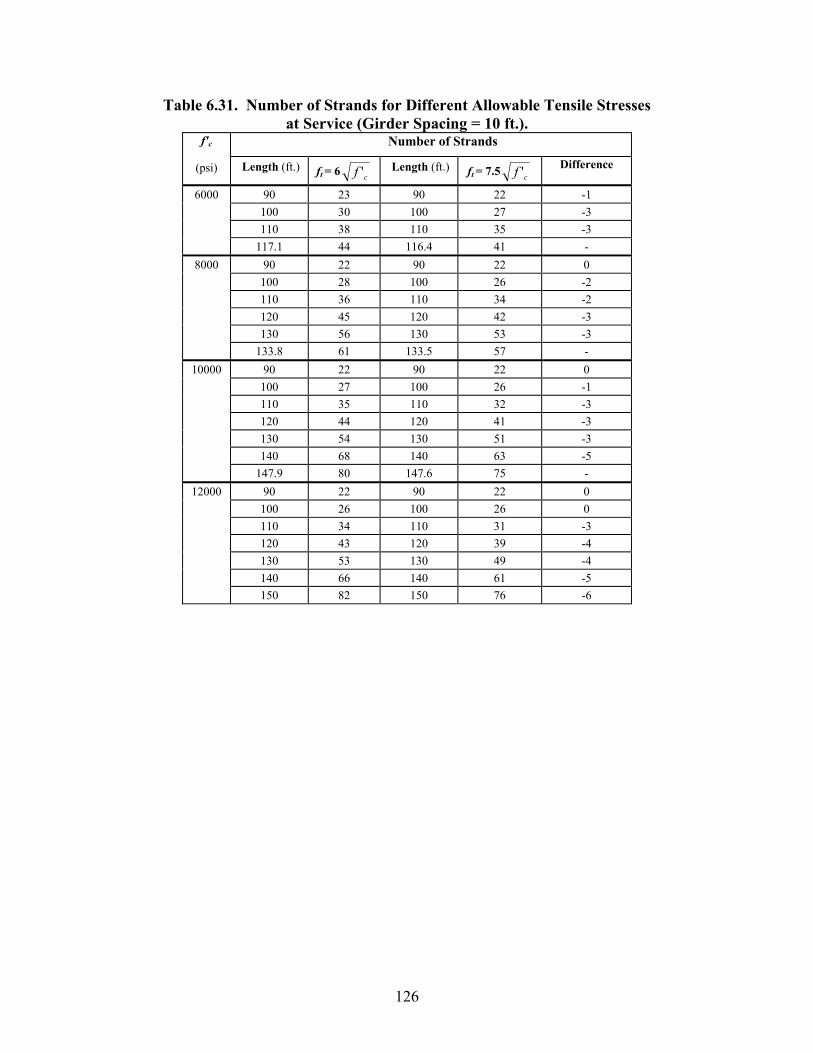
126
Table 6.31. Number of Strands for Different Allowable Tensile Stresses at Service (Girder Spacing = 10 ft.).
Number of Strands f'c
(psi) Length (ft.) ft = 6 cf ' Length (ft.) ft = 7.5 cf ' Difference
6000 90 23 90 22 -1 100 30 100 27 -3 110 38 110 35 -3 117.1 44 116.4 41 -
8000 90 22 90 22 0 100 28 100 26 -2 110 36 110 34 -2 120 45 120 42 -3 130 56 130 53 -3 133.8 61 133.5 57 -
10000 90 22 90 22 0 100 27 100 26 -1 110 35 110 32 -3 120 44 120 41 -3 130 54 130 51 -3 140 68 140 63 -5 147.9 80 147.6 75 -
12000 90 22 90 22 0 100 26 100 26 0 110 34 110 31 -3 120 43 120 39 -4 130 53 130 49 -4 140 66 140 61 -5 150 82 150 76 -6
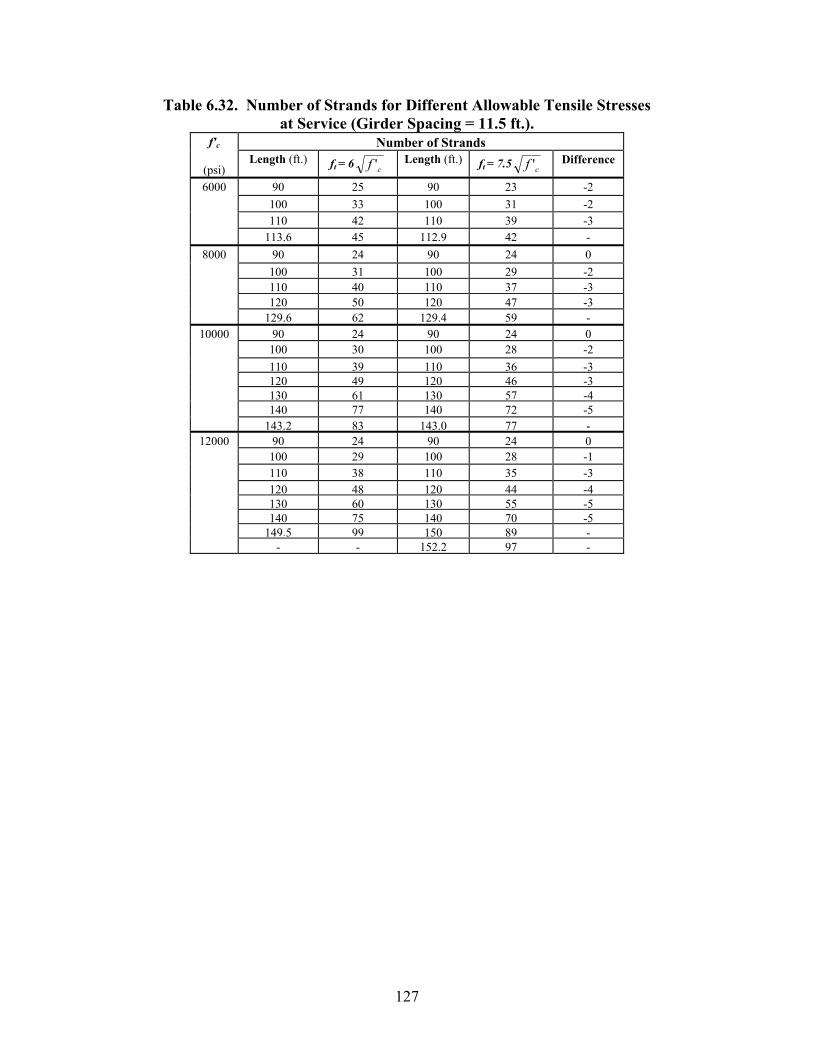
127
Table 6.32. Number of Strands for Different Allowable Tensile Stresses at Service (Girder Spacing = 11.5 ft.).
f'c Number of Strands
(psi) Length (ft.) ft = 6 cf ' Length (ft.) ft = 7.5 cf ' Difference
6000 90 25 90 23 -2 100 33 100 31 -2 110 42 110 39 -3 113.6 45 112.9 42 -
8000 90 24 90 24 0 100 31 100 29 -2 110 40 110 37 -3 120 50 120 47 -3 129.6 62 129.4 59 -
10000 90 24 90 24 0 100 30 100 28 -2 110 39 110 36 -3 120 49 120 46 -3 130 61 130 57 -4 140 77 140 72 -5 143.2 83 143.0 77 -
12000 90 24 90 24 0 100 29 100 28 -1 110 38 110 35 -3 120 48 120 44 -4 130 60 130 55 -5 140 75 140 70 -5 149.5 99 150 89 -
- - 152.2 97 -
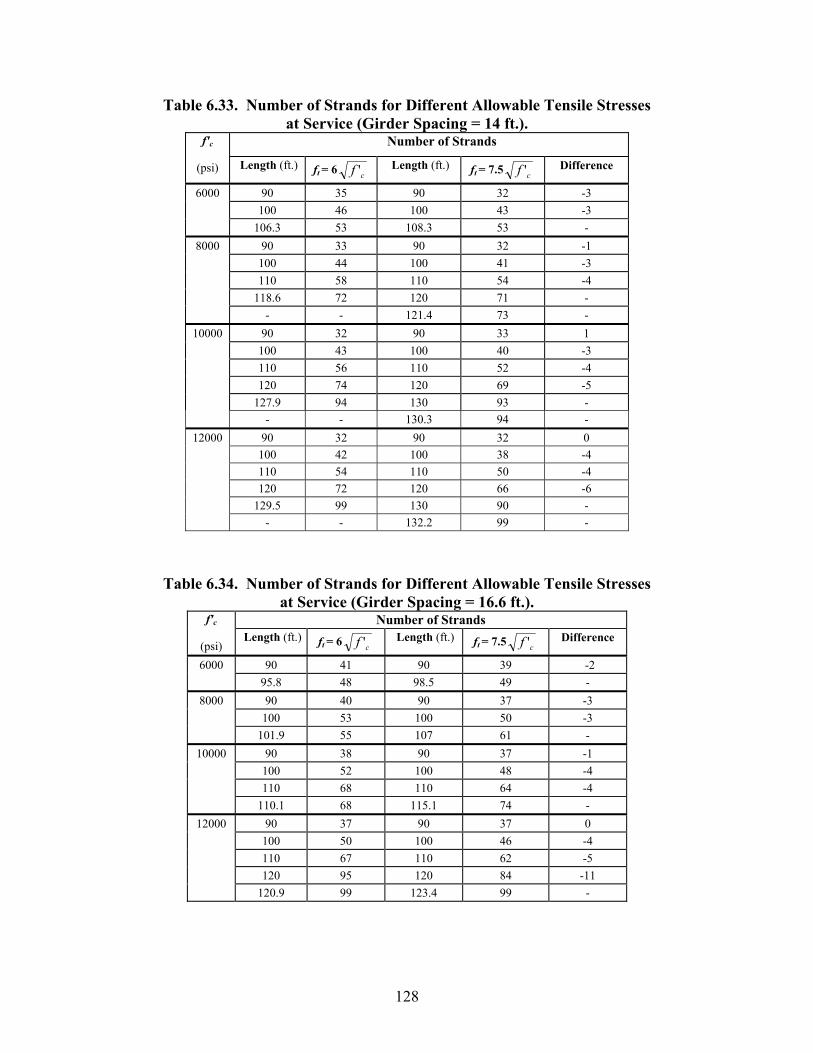
128
Table 6.33. Number of Strands for Different Allowable Tensile Stresses at Service (Girder Spacing = 14 ft.).
Number of Strands f'c
(psi) Length (ft.) ft = 6 cf ' Length (ft.) ft = 7.5 cf ' Difference
6000 90 35 90 32 -3 100 46 100 43 -3 106.3 53 108.3 53 -
8000 90 33 90 32 -1 100 44 100 41 -3 110 58 110 54 -4 118.6 72 120 71 - - - 121.4 73 -
10000 90 32 90 33 1 100 43 100 40 -3 110 56 110 52 -4 120 74 120 69 -5 127.9 94 130 93 - - - 130.3 94 -
12000 90 32 90 32 0 100 42 100 38 -4 110 54 110 50 -4 120 72 120 66 -6 129.5 99 130 90 - - - 132.2 99 -
Table 6.34. Number of Strands for Different Allowable Tensile Stresses at Service (Girder Spacing = 16.6 ft.).
Number of Strands f'c
(psi) Length (ft.) ft = 6 cf ' Length (ft.) ft = 7.5 cf ' Difference
6000 90 41 90 39 -2 95.8 48 98.5 49 -
8000 90 40 90 37 -3 100 53 100 50 -3 101.9 55 107 61 -
10000 90 38 90 37 -1 100 52 100 48 -4 110 68 110 64 -4 110.1 68 115.1 74 -
12000 90 37 90 37 0 100 50 100 46 -4 110 67 110 62 -5 120 95 120 84 -11 120.9 99 123.4 99 -
129
6.7.3 Impact on the Controlling Limit States for Maximum Span Lengths
Table 6.35 shows the controlling limit states for two different allowable tensile stresses at
service (ft = 6 cf ' and ft = 7.5 cf ' ) for maximum span lengths. The calculations were
performed for U54 Beams with 0.6 in. diameter strands designed using the LRFD Specifications.
To further study the impact of increasing the allowable tensile strength at service, additional
designs were performed using ft = 8 cf ' . Tables C.21 and C.22 in Appendix C show maximum
span lengths with their respective number of strands, initial concrete strengths, and controlling
limit states designed using ft = 8 cf ' .
Several major trends were observed. First, for concrete strengths up to 10000 psi and for
girder spacings less than or equal to 11.5 ft., maximum span lengths were controlled by the same
controlling limit states (compressive limit at the intermediate stage) when the limit for the tensile
stress at service changes from 6 cf ' to 7.5 cf ' . A reduction of number of strands is possible
because the tensile limit was increased. However, maximum span lengths do not increase
because maximum span lengths are controlled by the compressive limit at the intermediate state
(see Section 6.7.4). The same trend was observed when the tensile stress was increased to ft =
8 cf ' because the tensile stress does not control maximum span lengths for these cases (see
Tables C.21 and C.22 of Appendix C).
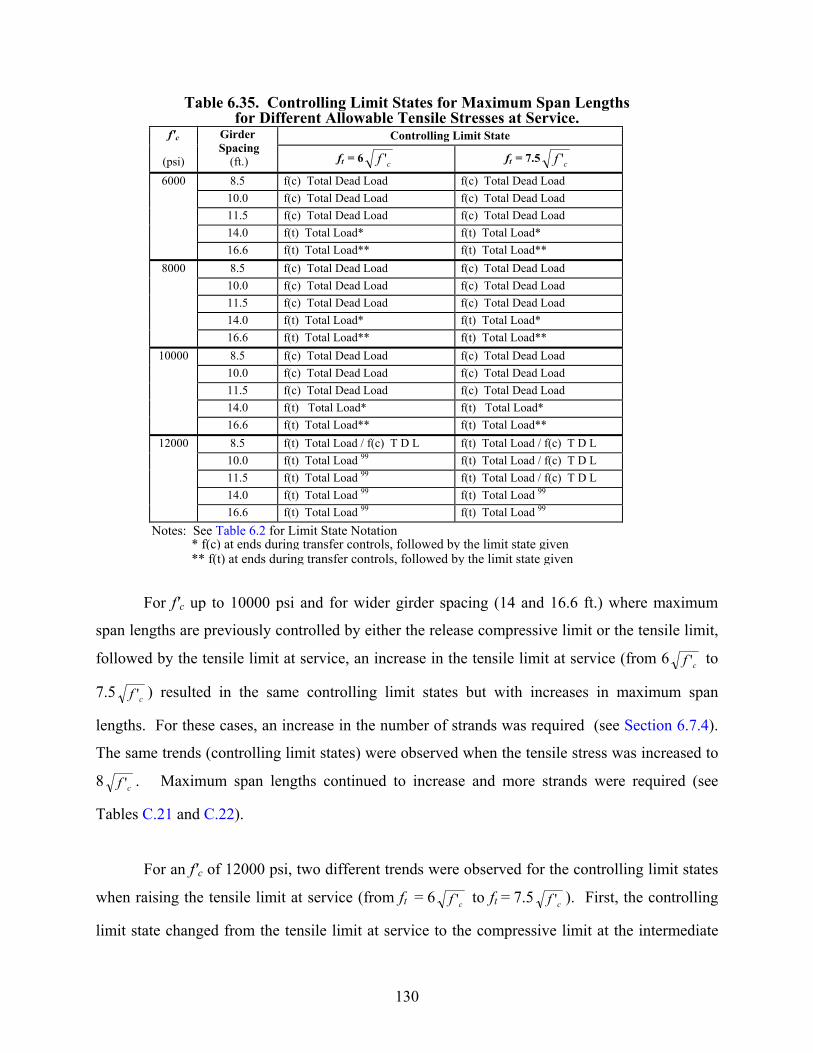
130
Table 6.35. Controlling Limit States for Maximum Span Lengths for Different Allowable Tensile Stresses at Service.
Controlling Limit State f'c
(psi)
Girder Spacing
(ft.) ft = 6 cf ' ft = 7.5 cf '
6000 8.5 f(c) Total Dead Load f(c) Total Dead Load 10.0 f(c) Total Dead Load f(c) Total Dead Load 11.5 f(c) Total Dead Load f(c) Total Dead Load 14.0 f(t) Total Load* f(t) Total Load* 16.6 f(t) Total Load** f(t) Total Load**
8000 8.5 f(c) Total Dead Load f(c) Total Dead Load 10.0 f(c) Total Dead Load f(c) Total Dead Load 11.5 f(c) Total Dead Load f(c) Total Dead Load 14.0 f(t) Total Load* f(t) Total Load* 16.6 f(t) Total Load** f(t) Total Load**
10000 8.5 f(c) Total Dead Load f(c) Total Dead Load 10.0 f(c) Total Dead Load f(c) Total Dead Load 11.5 f(c) Total Dead Load f(c) Total Dead Load 14.0 f(t) Total Load* f(t) Total Load* 16.6 f(t) Total Load** f(t) Total Load**
12000 8.5 f(t) Total Load / f(c) T D L f(t) Total Load / f(c) T D L 10.0 f(t) Total Load 99 f(t) Total Load / f(c) T D L 11.5 f(t) Total Load 99 f(t) Total Load / f(c) T D L 14.0 f(t) Total Load 99 f(t) Total Load 99 16.6 f(t) Total Load 99 f(t) Total Load 99
Notes: See Table 6.2 for Limit State Notation * f(c) at ends during transfer controls, followed by the limit state given ** f(t) at ends during transfer controls, followed by the limit state given
For f'c up to 10000 psi and for wider girder spacing (14 and 16.6 ft.) where maximum
span lengths are previously controlled by either the release compressive limit or the tensile limit,
followed by the tensile limit at service, an increase in the tensile limit at service (from 6 cf ' to
7.5 cf ' ) resulted in the same controlling limit states but with increases in maximum span
lengths. For these cases, an increase in the number of strands was required (see Section 6.7.4).
The same trends (controlling limit states) were observed when the tensile stress was increased to
8 cf ' . Maximum span lengths continued to increase and more strands were required (see
Tables C.21 and C.22).
For an f'c of 12000 psi, two different trends were observed for the controlling limit states
when raising the tensile limit at service (from ft = 6 cf ' to ft = 7.5 cf ' ). First, the controlling
limit state changed from the tensile limit at service to the compressive limit at the intermediate
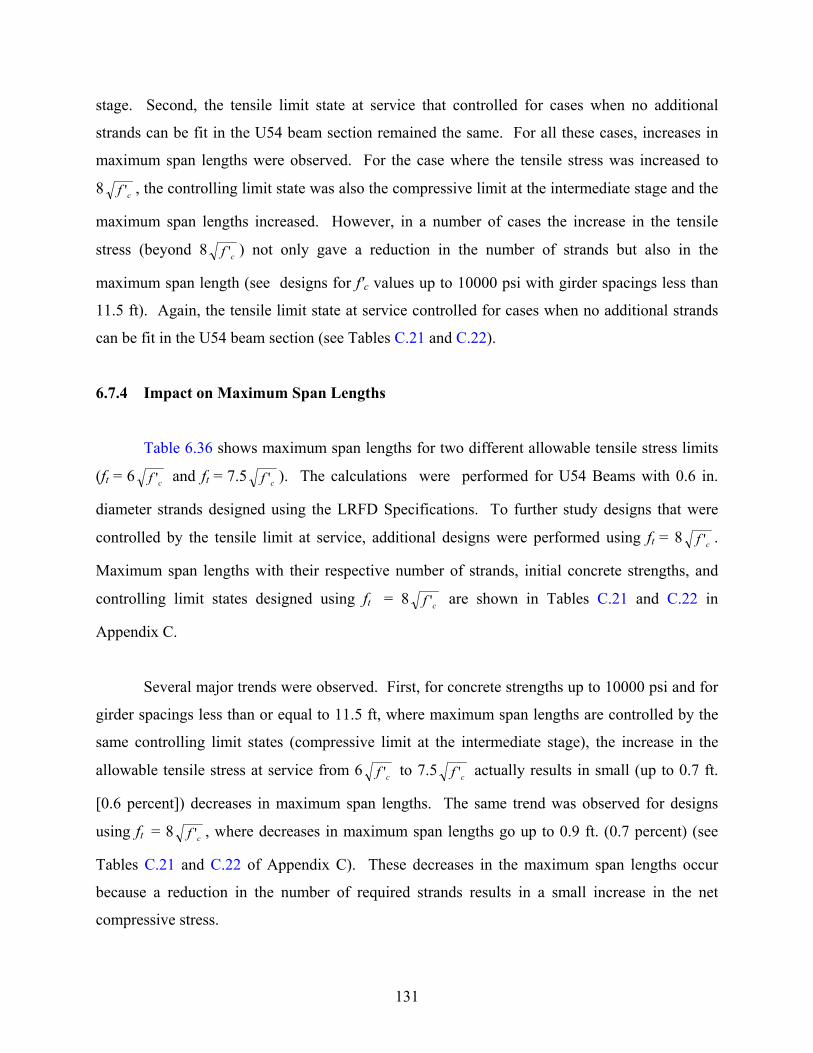
131
stage. Second, the tensile limit state at service that controlled for cases when no additional
strands can be fit in the U54 beam section remained the same. For all these cases, increases in
maximum span lengths were observed. For the case where the tensile stress was increased to
8 cf ' , the controlling limit state was also the compressive limit at the intermediate stage and the
maximum span lengths increased. However, in a number of cases the increase in the tensile
stress (beyond 8 cf ' ) not only gave a reduction in the number of strands but also in the
maximum span length (see designs for f'c values up to 10000 psi with girder spacings less than
11.5 ft). Again, the tensile limit state at service controlled for cases when no additional strands
can be fit in the U54 beam section (see Tables C.21 and C.22).
6.7.4 Impact on Maximum Span Lengths
Table 6.36 shows maximum span lengths for two different allowable tensile stress limits
(ft = 6 cf ' and ft = 7.5 cf ' ). The calculations were performed for U54 Beams with 0.6 in.
diameter strands designed using the LRFD Specifications. To further study designs that were
controlled by the tensile limit at service, additional designs were performed using ft = 8 cf ' .
Maximum span lengths with their respective number of strands, initial concrete strengths, and
controlling limit states designed using ft = 8 cf ' are shown in Tables C.21 and C.22 in
Appendix C.
Several major trends were observed. First, for concrete strengths up to 10000 psi and for
girder spacings less than or equal to 11.5 ft, where maximum span lengths are controlled by the
same controlling limit states (compressive limit at the intermediate stage), the increase in the
allowable tensile stress at service from 6 cf ' to 7.5 cf ' actually results in small (up to 0.7 ft.
[0.6 percent]) decreases in maximum span lengths. The same trend was observed for designs
using ft = 8 cf ' , where decreases in maximum span lengths go up to 0.9 ft. (0.7 percent) (see
Tables C.21 and C.22 of Appendix C). These decreases in the maximum span lengths occur
because a reduction in the number of required strands results in a small increase in the net
compressive stress.
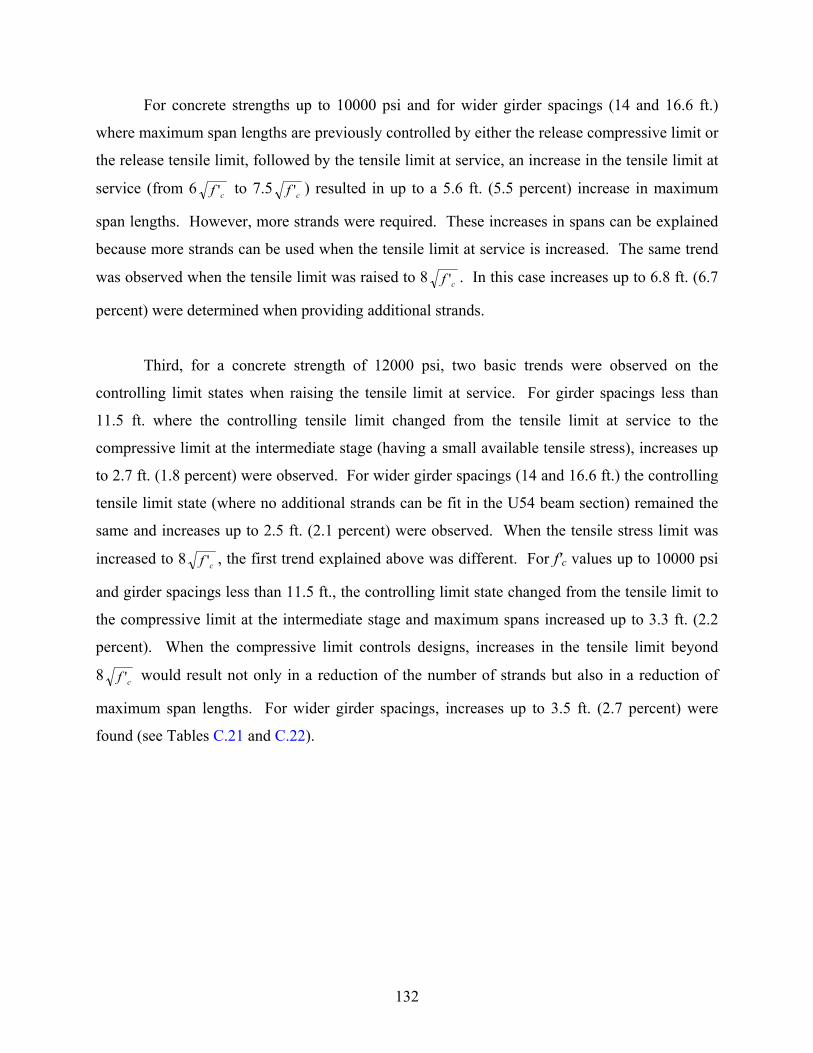
132
For concrete strengths up to 10000 psi and for wider girder spacings (14 and 16.6 ft.)
where maximum span lengths are previously controlled by either the release compressive limit or
the release tensile limit, followed by the tensile limit at service, an increase in the tensile limit at
service (from 6 cf ' to 7.5 cf ' ) resulted in up to a 5.6 ft. (5.5 percent) increase in maximum
span lengths. However, more strands were required. These increases in spans can be explained
because more strands can be used when the tensile limit at service is increased. The same trend
was observed when the tensile limit was raised to 8 cf ' . In this case increases up to 6.8 ft. (6.7
percent) were determined when providing additional strands.
Third, for a concrete strength of 12000 psi, two basic trends were observed on the
controlling limit states when raising the tensile limit at service. For girder spacings less than
11.5 ft. where the controlling tensile limit changed from the tensile limit at service to the
compressive limit at the intermediate stage (having a small available tensile stress), increases up
to 2.7 ft. (1.8 percent) were observed. For wider girder spacings (14 and 16.6 ft.) the controlling
tensile limit state (where no additional strands can be fit in the U54 beam section) remained the
same and increases up to 2.5 ft. (2.1 percent) were observed. When the tensile stress limit was
increased to 8 cf ' , the first trend explained above was different. For f'c values up to 10000 psi
and girder spacings less than 11.5 ft., the controlling limit state changed from the tensile limit to
the compressive limit at the intermediate stage and maximum spans increased up to 3.3 ft. (2.2
percent). When the compressive limit controls designs, increases in the tensile limit beyond
8 cf ' would result not only in a reduction of the number of strands but also in a reduction of
maximum span lengths. For wider girder spacings, increases up to 3.5 ft. (2.7 percent) were
found (see Tables C.21 and C.22).
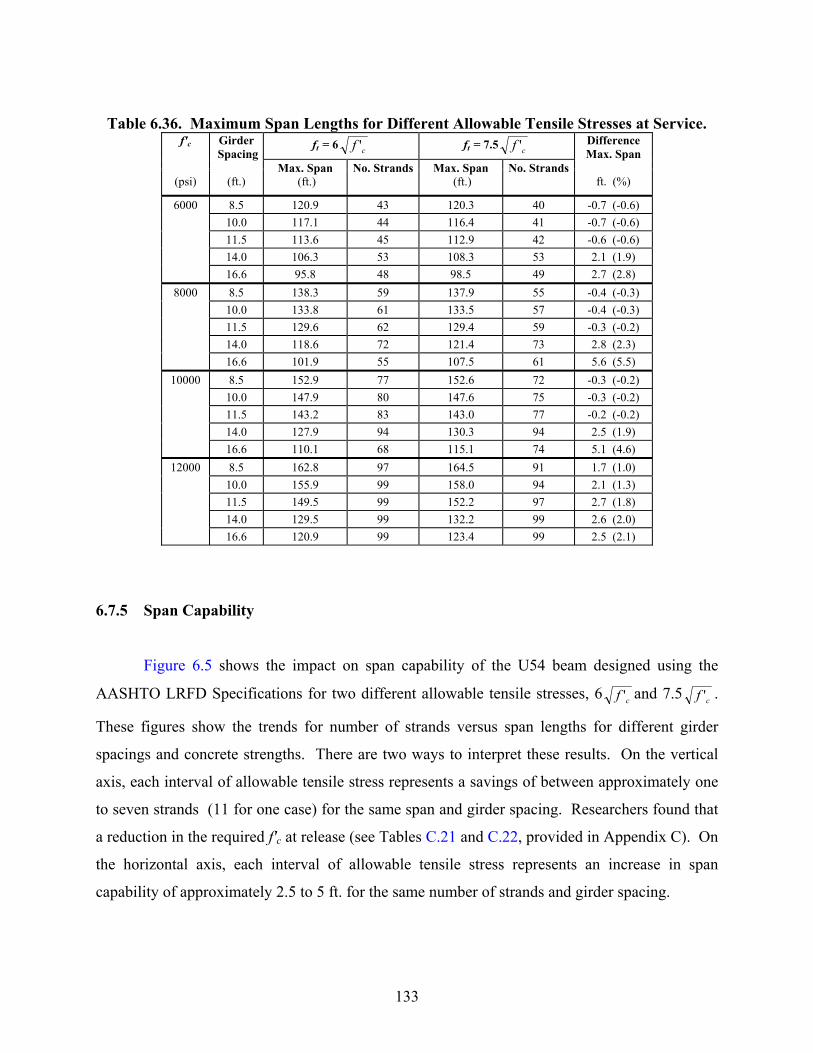
133
Table 6.36. Maximum Span Lengths for Different Allowable Tensile Stresses at Service.
ft = 6 cf ' ft = 7.5 cf ' f'c
(psi)
Girder Spacing
(ft.)
Max. Span (ft.)
No. Strands Max. Span (ft.)
No. Strands
Difference Max. Span
ft. (%)
6000 8.5 120.9 43 120.3 40 -0.7 (-0.6) 10.0 117.1 44 116.4 41 -0.7 (-0.6) 11.5 113.6 45 112.9 42 -0.6 (-0.6) 14.0 106.3 53 108.3 53 2.1 (1.9) 16.6 95.8 48 98.5 49 2.7 (2.8)
8000 8.5 138.3 59 137.9 55 -0.4 (-0.3) 10.0 133.8 61 133.5 57 -0.4 (-0.3) 11.5 129.6 62 129.4 59 -0.3 (-0.2) 14.0 118.6 72 121.4 73 2.8 (2.3) 16.6 101.9 55 107.5 61 5.6 (5.5)
10000 8.5 152.9 77 152.6 72 -0.3 (-0.2) 10.0 147.9 80 147.6 75 -0.3 (-0.2) 11.5 143.2 83 143.0 77 -0.2 (-0.2) 14.0 127.9 94 130.3 94 2.5 (1.9) 16.6 110.1 68 115.1 74 5.1 (4.6)
12000 8.5 162.8 97 164.5 91 1.7 (1.0) 10.0 155.9 99 158.0 94 2.1 (1.3) 11.5 149.5 99 152.2 97 2.7 (1.8) 14.0 129.5 99 132.2 99 2.6 (2.0) 16.6 120.9 99 123.4 99 2.5 (2.1)
6.7.5 Span Capability
Figure 6.5 shows the impact on span capability of the U54 beam designed using the
AASHTO LRFD Specifications for two different allowable tensile stresses, 6 cf ' and 7.5 cf ' .
These figures show the trends for number of strands versus span lengths for different girder
spacings and concrete strengths. There are two ways to interpret these results. On the vertical
axis, each interval of allowable tensile stress represents a savings of between approximately one
to seven strands (11 for one case) for the same span and girder spacing. Researchers found that
a reduction in the required f'c at release (see Tables C.21 and C.22, provided in Appendix C). On
the horizontal axis, each interval of allowable tensile stress represents an increase in span
capability of approximately 2.5 to 5 ft. for the same number of strands and girder spacing.
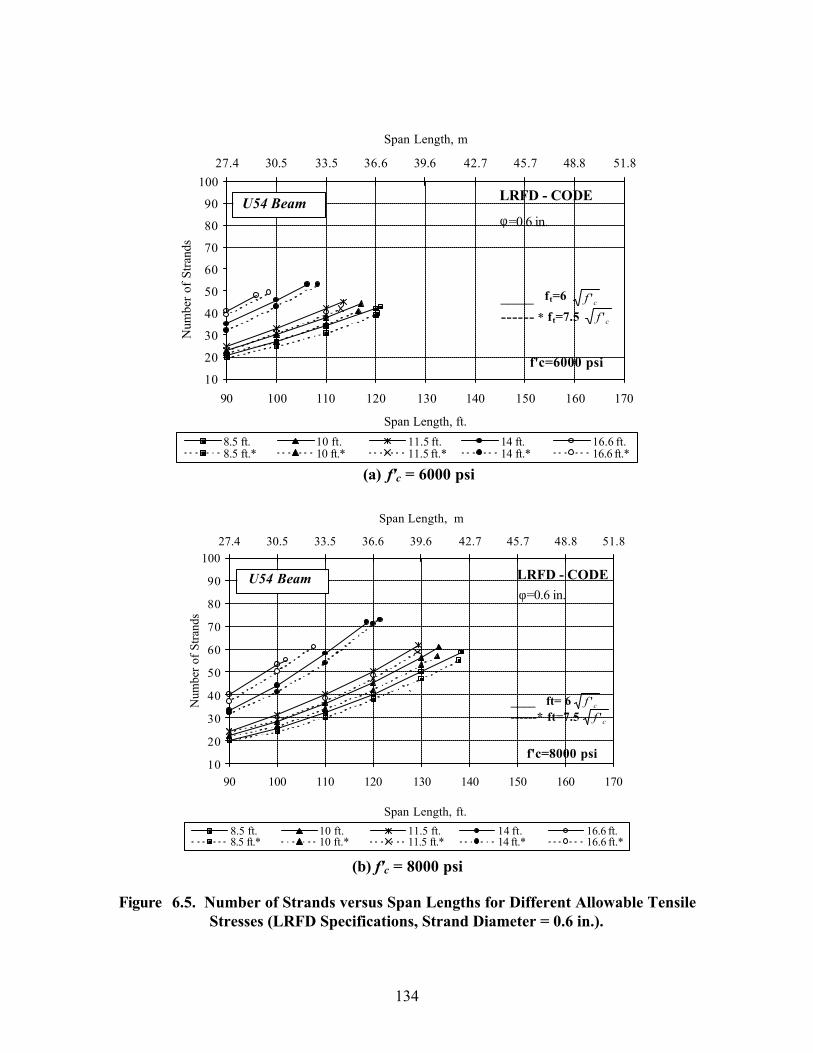
134
10
20
30
40
50
60
70
80
90
100
90 100 110 120 130 140 150 160 170
Span Length, ft.
Num
ber o
f Stra
nds
27.4 30.5 33.5 36.6 39.6 42.7 45.7 48.8 51.8
Span Length, m
8.5 ft. 10 ft. 11.5 ft. 14 ft. 16.6 ft.8.5 ft.* 10 ft.* 11.5 ft.* 14 ft.* 16.6 ft.*
f'c=6000 psi
LRFD - CODE
φ =0.6 in. U54 Beam
____ ft=6
------ * ft=7.5cf '
cf '
(a) f'c = 6000 psi
10
20
30
40
50
60
70
80
90
100
90 100 110 120 130 140 150 160 170
Span Length, ft.
Num
ber o
f Stra
nds
27.4 30.5 33.5 36.6 39.6 42.7 45.7 48.8 51.8
Span Length, m
8.5 ft. 10 ft. 11.5 ft. 14 ft. 16.6 ft.8.5 ft.* 10 ft.* 11.5 ft.* 14 ft.* 16.6 ft.*
f'c=8000 psi
`
LRFD - CODEφ=0.6 in.
U54 Beam
____ ft= 6 ------* ft=7.5
cf 'cf '
(b) f'c = 8000 psi
Figure 6.5. Number of Strands versus Span Lengths for Different Allowable Tensile
Stresses (LRFD Specifications, Strand Diameter = 0.6 in.).
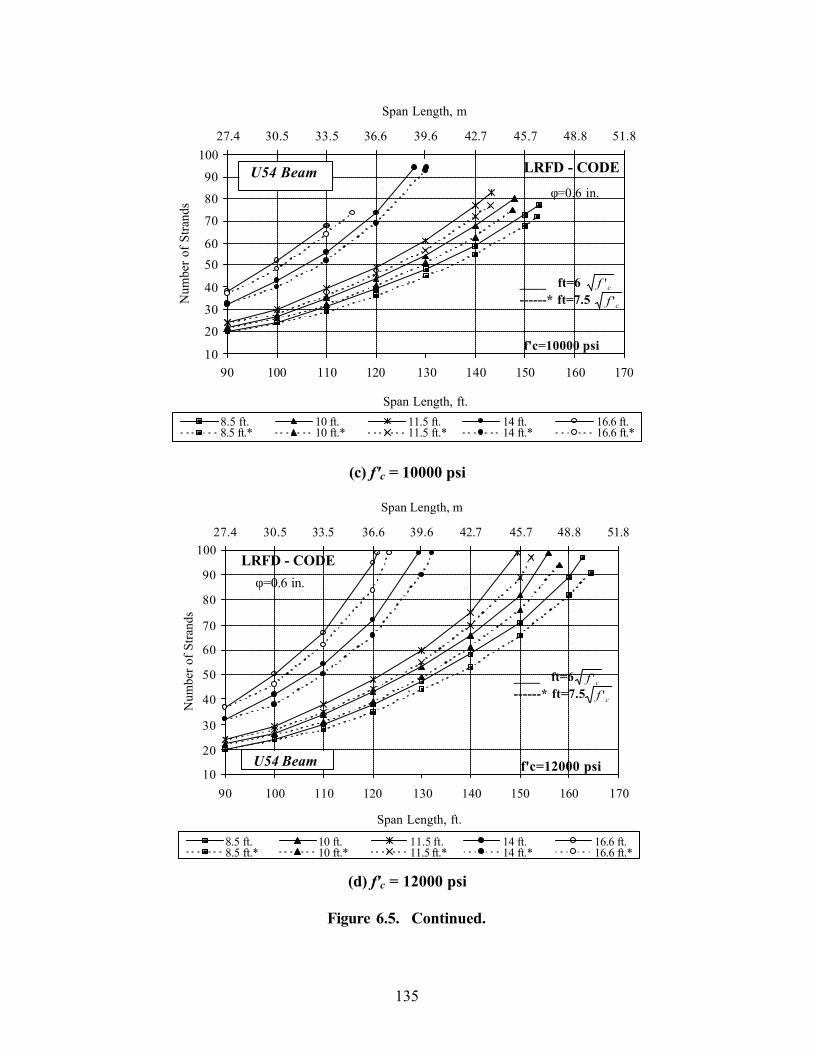
135
10
20
30
40
5060
70
80
90
100
90 100 110 120 130 140 150 160 170
Span Length, ft.
Num
ber o
f Stra
nds
27.4 30.5 33.5 36.6 39.6 42.7 45.7 48.8 51.8
Span Length, m
8.5 ft. 10 ft. 11.5 ft. 14 ft. 16.6 ft.8.5 ft.* 10 ft.* 11.5 ft.* 14 ft.* 16.6 ft.*
f'c=10000 psi
`
LRFD - CODE
φ=0.6 in. U54 Beam
____ ft=6 ------* ft=7.5
cf '
cf '
(c) f'c = 10000 psi
10
20
30
40
50
60
70
80
90
100
90 100 110 120 130 140 150 160 170
Span Length, ft.
Num
ber o
f Stra
nds
27.4 30.5 33.5 36.6 39.6 42.7 45.7 48.8 51.8
Span Length, m
8.5 ft. 10 ft. 11.5 ft. 14 ft. 16.6 ft.8.5 ft.* 10 ft.* 11.5 ft.* 14 ft.* 16.6 ft.*
f'c=12000 psi
`
LRFD - CODEφ=0.6 in.
U54 Beam
____ ft=6 ------* ft=7.5
cf 'cf '
(d) f'c = 12000 psi
Figure 6.5. Continued.

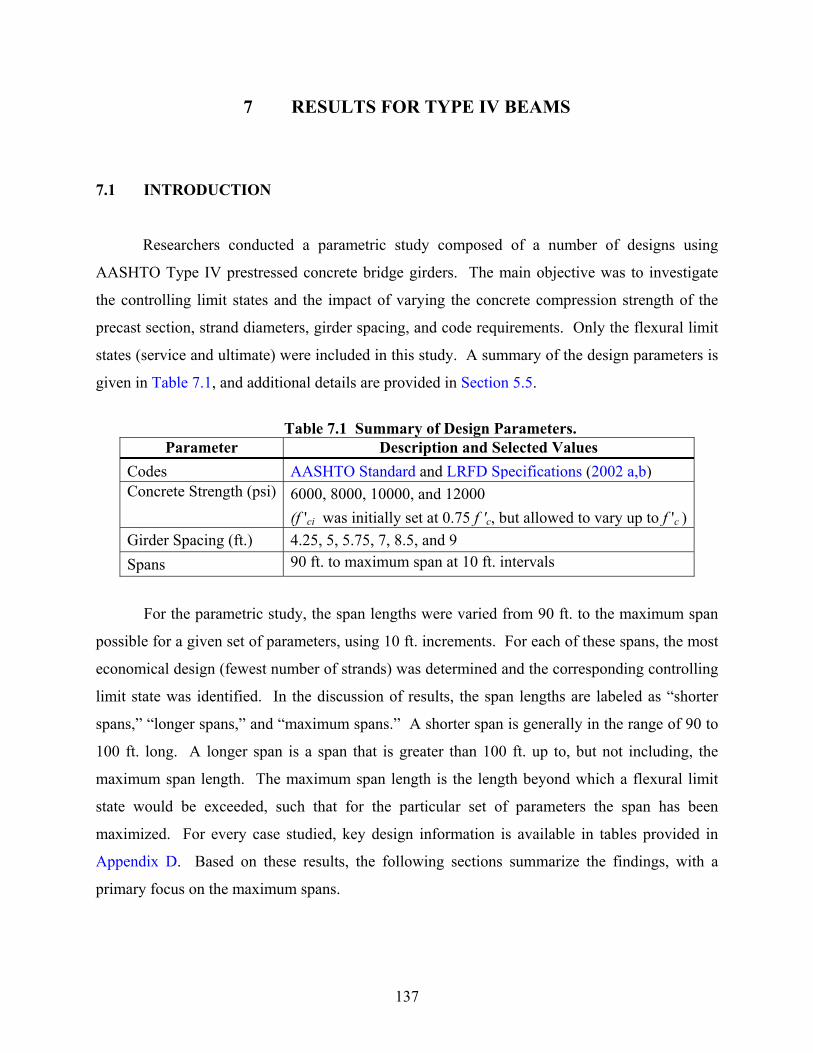
137
7 RESULTS FOR TYPE IV BEAMS
7.1 INTRODUCTION
Researchers conducted a parametric study composed of a number of designs using
AASHTO Type IV prestressed concrete bridge girders. The main objective was to investigate
the controlling limit states and the impact of varying the concrete compression strength of the
precast section, strand diameters, girder spacing, and code requirements. Only the flexural limit
states (service and ultimate) were included in this study. A summary of the design parameters is
given in Table 7.1, and additional details are provided in Section 5.5.
Table 7.1 Summary of Design Parameters.
Parameter Description and Selected Values Codes AASHTO Standard and LRFD Specifications (2002 a,b) Concrete Strength (psi) 6000, 8000, 10000, and 12000
(f 'ci was initially set at 0.75 f 'c, but allowed to vary up to f 'c )Girder Spacing (ft.) 4.25, 5, 5.75, 7, 8.5, and 9 Spans 90 ft. to maximum span at 10 ft. intervals
For the parametric study, the span lengths were varied from 90 ft. to the maximum span
possible for a given set of parameters, using 10 ft. increments. For each of these spans, the most
economical design (fewest number of strands) was determined and the corresponding controlling
limit state was identified. In the discussion of results, the span lengths are labeled as “shorter
spans,” “longer spans,” and “maximum spans.” A shorter span is generally in the range of 90 to
100 ft. long. A longer span is a span that is greater than 100 ft. up to, but not including, the
maximum span length. The maximum span length is the length beyond which a flexural limit
state would be exceeded, such that for the particular set of parameters the span has been
maximized. For every case studied, key design information is available in tables provided in
Appendix D. Based on these results, the following sections summarize the findings, with a
primary focus on the maximum spans.
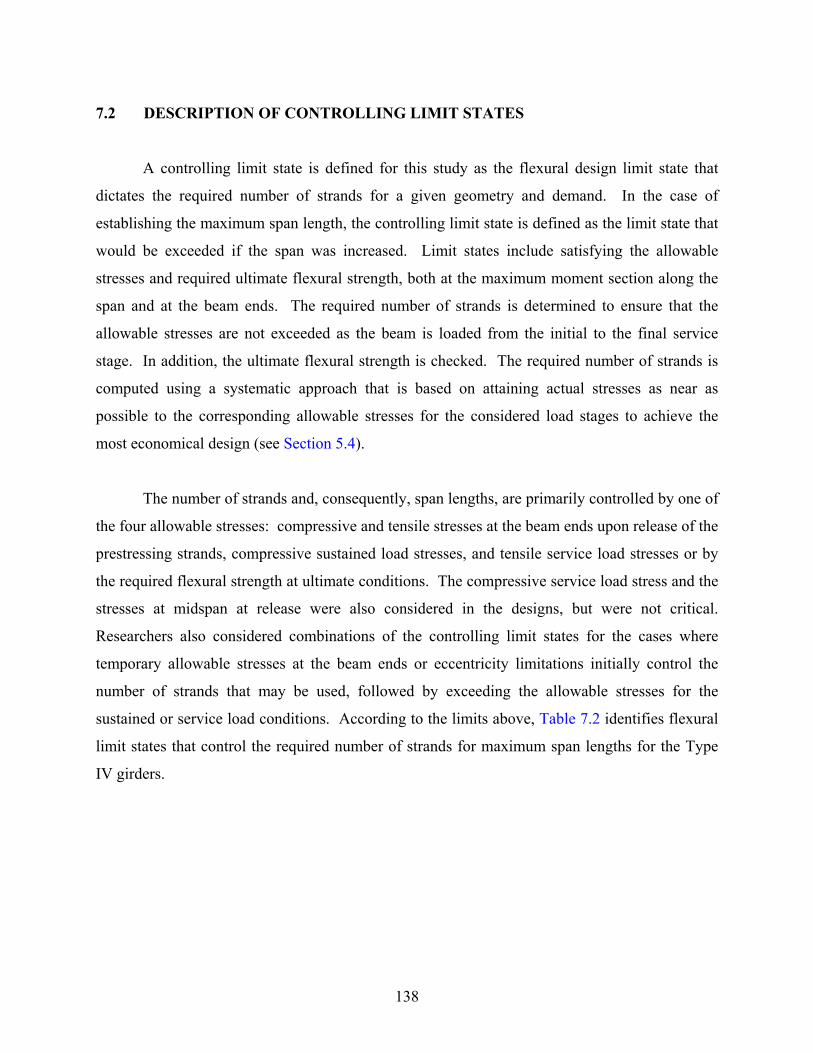
138
7.2 DESCRIPTION OF CONTROLLING LIMIT STATES
A controlling limit state is defined for this study as the flexural design limit state that
dictates the required number of strands for a given geometry and demand. In the case of
establishing the maximum span length, the controlling limit state is defined as the limit state that
would be exceeded if the span was increased. Limit states include satisfying the allowable
stresses and required ultimate flexural strength, both at the maximum moment section along the
span and at the beam ends. The required number of strands is determined to ensure that the
allowable stresses are not exceeded as the beam is loaded from the initial to the final service
stage. In addition, the ultimate flexural strength is checked. The required number of strands is
computed using a systematic approach that is based on attaining actual stresses as near as
possible to the corresponding allowable stresses for the considered load stages to achieve the
most economical design (see Section 5.4).
The number of strands and, consequently, span lengths, are primarily controlled by one of
the four allowable stresses: compressive and tensile stresses at the beam ends upon release of the
prestressing strands, compressive sustained load stresses, and tensile service load stresses or by
the required flexural strength at ultimate conditions. The compressive service load stress and the
stresses at midspan at release were also considered in the designs, but were not critical.
Researchers also considered combinations of the controlling limit states for the cases where
temporary allowable stresses at the beam ends or eccentricity limitations initially control the
number of strands that may be used, followed by exceeding the allowable stresses for the
sustained or service load conditions. According to the limits above, Table 7.2 identifies flexural
limit states that control the required number of strands for maximum span lengths for the Type
IV girders.
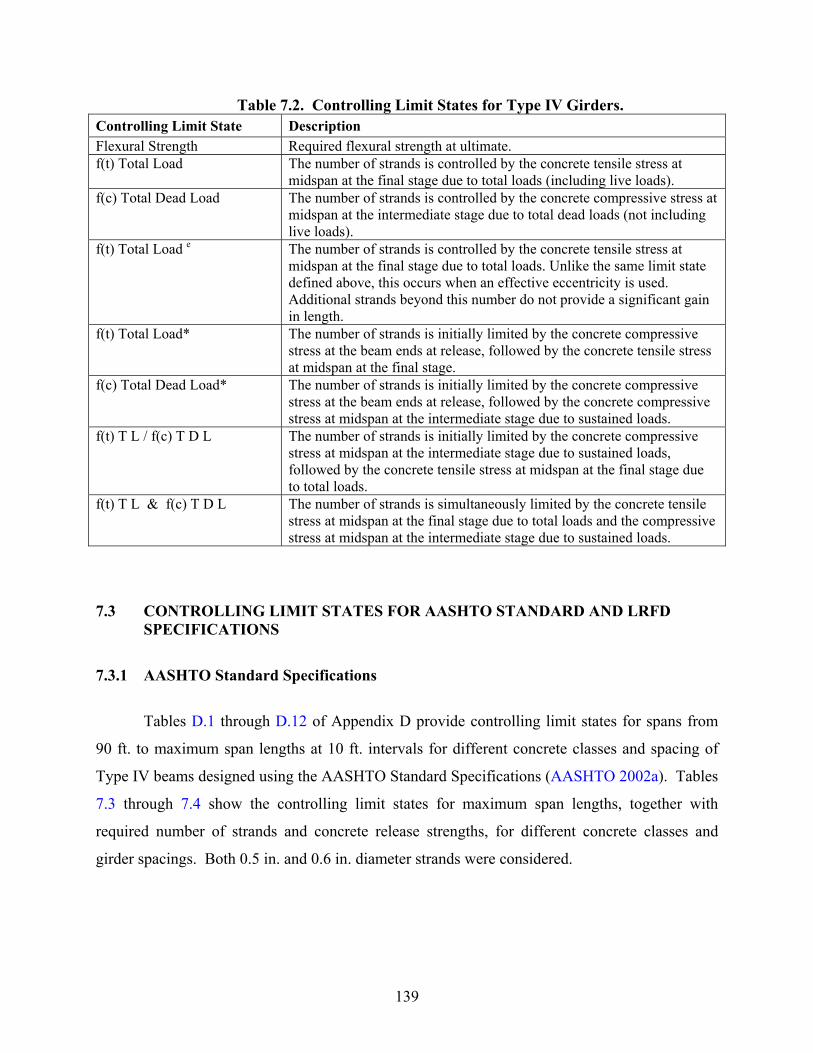
139
Table 7.2. Controlling Limit States for Type IV Girders. Controlling Limit State Description Flexural Strength Required flexural strength at ultimate. f(t) Total Load The number of strands is controlled by the concrete tensile stress at
midspan at the final stage due to total loads (including live loads). f(c) Total Dead Load The number of strands is controlled by the concrete compressive stress at
midspan at the intermediate stage due to total dead loads (not including live loads).
f(t) Total Load e The number of strands is controlled by the concrete tensile stress at midspan at the final stage due to total loads. Unlike the same limit state defined above, this occurs when an effective eccentricity is used. Additional strands beyond this number do not provide a significant gain in length.
f(t) Total Load* The number of strands is initially limited by the concrete compressive stress at the beam ends at release, followed by the concrete tensile stress at midspan at the final stage.
f(c) Total Dead Load* The number of strands is initially limited by the concrete compressive stress at the beam ends at release, followed by the concrete compressive stress at midspan at the intermediate stage due to sustained loads.
f(t) T L / f(c) T D L The number of strands is initially limited by the concrete compressive stress at midspan at the intermediate stage due to sustained loads, followed by the concrete tensile stress at midspan at the final stage due to total loads.
f(t) T L & f(c) T D L The number of strands is simultaneously limited by the concrete tensile stress at midspan at the final stage due to total loads and the compressive stress at midspan at the intermediate stage due to sustained loads.
7.3 CONTROLLING LIMIT STATES FOR AASHTO STANDARD AND LRFD SPECIFICATIONS
7.3.1 AASHTO Standard Specifications
Tables D.1 through D.12 of Appendix D provide controlling limit states for spans from
90 ft. to maximum span lengths at 10 ft. intervals for different concrete classes and spacing of
Type IV beams designed using the AASHTO Standard Specifications (AASHTO 2002a). Tables
7.3 through 7.4 show the controlling limit states for maximum span lengths, together with
required number of strands and concrete release strengths, for different concrete classes and
girder spacings. Both 0.5 in. and 0.6 in. diameter strands were considered.
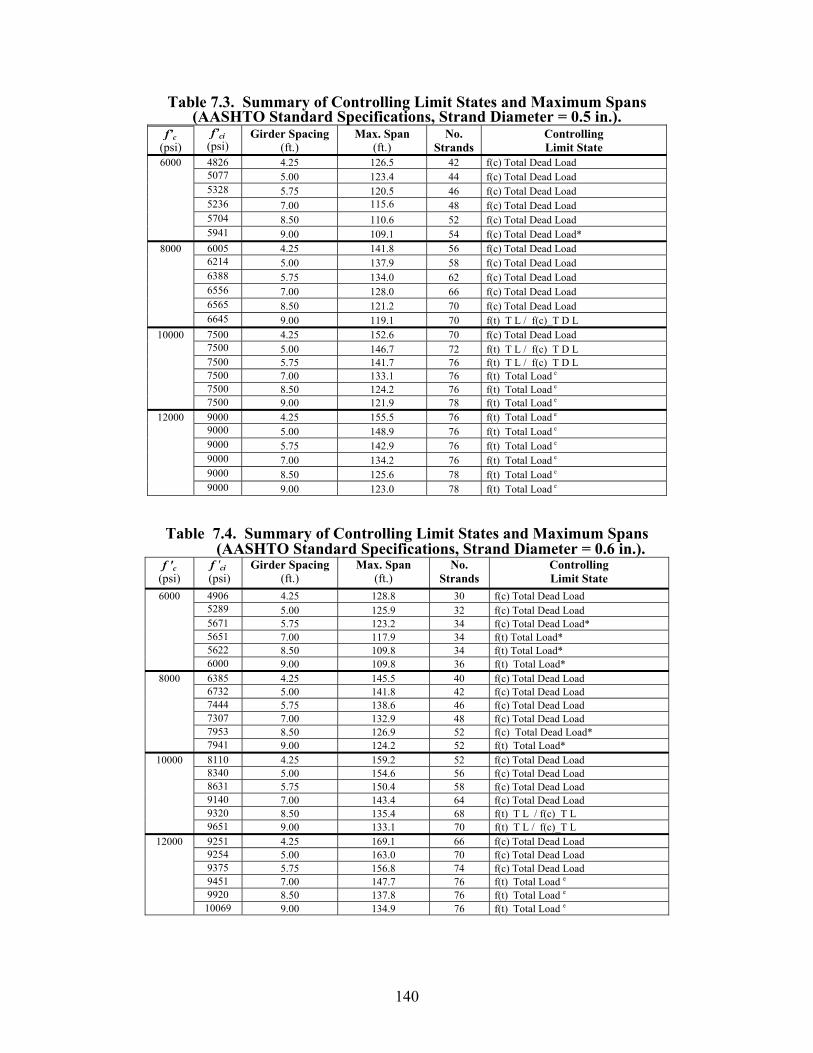
140
Table 7.3. Summary of Controlling Limit States and Maximum Spans (AASHTO Standard Specifications, Strand Diameter = 0.5 in.).
f’c (psi)
f’ci (psi)
Girder Spacing (ft.)
Max. Span (ft.)
No. Strands
Controlling Limit State
6000 4826 4.25 126.5 42 f(c) Total Dead Load 5077 5.00 123.4 44 f(c) Total Dead Load 5328 5.75 120.5 46 f(c) Total Dead Load 5236 7.00 115.6 48 f(c) Total Dead Load 5704 8.50 110.6 52 f(c) Total Dead Load 5941 9.00 109.1 54 f(c) Total Dead Load*
8000 6005 4.25 141.8 56 f(c) Total Dead Load 6214 5.00 137.9 58 f(c) Total Dead Load 6388 5.75 134.0 62 f(c) Total Dead Load 6556 7.00 128.0 66 f(c) Total Dead Load 6565 8.50 121.2 70 f(c) Total Dead Load 6645 9.00 119.1 70 f(t) T L / f(c)_T D L
10000 7500 4.25 152.6 70 f(c) Total Dead Load 7500 5.00 146.7 72 f(t) T L / f(c) T D L 7500 5.75 141.7 76 f(t) T L / f(c) T D L 7500 7.00 133.1 76 f(t) Total Load e 7500 8.50 124.2 76 f(t) Total Load e 7500 9.00 121.9 78 f(t) Total Load e
12000 9000 4.25 155.5 76 f(t) Total Load e 9000 5.00 148.9 76 f(t) Total Load e 9000 5.75 142.9 76 f(t) Total Load e 9000 7.00 134.2 76 f(t) Total Load e 9000 8.50 125.6 78 f(t) Total Load e 9000 9.00 123.0 78 f(t) Total Load e
Table 7.4. Summary of Controlling Limit States and Maximum Spans (AASHTO Standard Specifications, Strand Diameter = 0.6 in.).
f 'c (psi)
f 'ci (psi)
Girder Spacing (ft.)
Max. Span (ft.)
No. Strands
Controlling Limit State
6000 4906 4.25 128.8 30 f(c) Total Dead Load 5289 5.00 125.9 32 f(c) Total Dead Load 5671 5.75 123.2 34 f(c) Total Dead Load* 5651 7.00 117.9 34 f(t) Total Load* 5622 8.50 109.8 34 f(t) Total Load* 6000 9.00 109.8 36 f(t) Total Load*
8000 6385 4.25 145.5 40 f(c) Total Dead Load 6732 5.00 141.8 42 f(c) Total Dead Load 7444 5.75 138.6 46 f(c) Total Dead Load 7307 7.00 132.9 48 f(c) Total Dead Load 7953 8.50 126.9 52 f(c) Total Dead Load* 7941 9.00 124.2 52 f(t) Total Load*
10000 8110 4.25 159.2 52 f(c) Total Dead Load 8340 5.00 154.6 56 f(c) Total Dead Load 8631 5.75 150.4 58 f(c) Total Dead Load 9140 7.00 143.4 64 f(c) Total Dead Load 9320 8.50 135.4 68 f(t) T L / f(c)_T L 9651 9.00 133.1 70 f(t) T L / f(c)_T L
12000 9251 4.25 169.1 66 f(c) Total Dead Load 9254 5.00 163.0 70 f(c) Total Dead Load 9375 5.75 156.8 74 f(c) Total Dead Load 9451 7.00 147.7 76 f(t) Total Load e 9920 8.50 137.8 76 f(t) Total Load e 10069 9.00 134.9 76 f(t) Total Load e
141
The following trends were observed for designs based on the AASHTO Standard
Specifications. For shorter spans (90 ft. and, in some cases, 100 ft.), the number of strands
required is controlled by the required flexural strength. In some cases, it was necessary to
increase the number of strands to provide the required flexural strength.
The number of strands required for longer spans, except the maximum span lengths, is
controlled by the concrete tensile stress at midspan for the final load stage. Maximum span
lengths are controlled by the concrete compressive stresses due to total dead loads (not including
live loads), except when additional prestressing strands cannot be used because an effective
eccentricity is reached. In general, an effective eccentricity is reached when 76 or 78
prestressing strands are used, such that additional strands beyond this number do not provide a
significant gain in span length. In this case, maximum spans are controlled by the concrete
tensile stress under service loads and at midspan. Other exceptions were noted for wider girder
spacing (7 ft. or greater) where maximum spans were limited because the number of strands that
could be used was controlled by the compressive stress at the beam ends at release.
The concrete strength at release (f 'ci) is critical for AASHTO Standard designs for the
widest girder spacing (9 ft.) and the lowest concrete strength (6000 psi) when 0.5 in. diameter
strands are used, and for wider girder spacing (greater than or equal to 7 ft.) and concrete
strengths up to 8000 psi when 0.6 in. diameter strands are used. The stress limits at release were
taken as 0.6 f 'ci for compression and 7.5 cif ' for tension, where f 'ci is in psi units (see Section
5.4).
For Type IV beams with the widest girder spacing (9 ft.) and using 0.5 in. diameter
strands, the allowable compressive stress at the beam ends during transfer controls the number of
strands used for the maximum span length for an f 'c of 6000 psi. When f 'c is 8000 psi,
maximum span lengths for wider girder spacings (greater than 7 ft.) are controlled by the
compressive stress. When f 'c is 10000 or 12000 psi, maximum span lengths for wider girder
spacings are controlled by the maximum number of strands that the Type IV beam can use (once
the effective eccentricity is reached). In other words, because maximum span lengths are
controlled by the maximum number of strands that produces a gain in length, no increase in
142
maximum span lengths for wider girder spacings (in this case from 5.75 to 9 ft.) using concrete
strengths of more than 10000 psi is possible. Moreover, increasing f 'c to be more than 12000 psi
does not lead to increases in the maximum span lengths for any of the girder spacings considered
(see Table 7.3).
For Type IV beams with wider girder spacing (generally greater than 7 ft.) and using 0.6
in. diameter strands, the allowable compressive stress at the beam ends during transfer controls
the number of strands used for maximum span lengths for f 'c values of 6000 and 8000 psi.
When f 'c is 10000 psi, maximum span lengths for wider girder spacings (greater than 7 ft.) are
controlled by the compressive stress. When f 'c is 12000 psi, maximum span lengths for wider
girder spacings are controlled by the maximum number of strands that the Type IV beam can
accommodate. Longer maximum span lengths are possible by adjusting the number of 0.6 in.
diameter strands for Type IV beams with girder spacings less than or equal to 7 ft. with an f 'c
greater than 12000 psi (see Table 7.4).
7.3.2 AASHTO LRFD Specifications
Tables D.13 through D.24 of Appendix D provide controlling limit states for spans from
90 ft. to maximum span lengths at 10 ft. intervals for different concrete strengths and spacings
for Type IV beams designed using the AASHTO LRFD Specifications (AASHTO 2002b).
Tables 7.5 and 7.6 show the controlling limit states for the maximum span lengths, together with
the required number of strands and concrete release strengths.
Like designs under the Standard Specifications, the number of strands required for
shorter spans (90 ft. and, in some cases, 100 ft.) is controlled by the flexural moment strength. In
some cases, it was necessary to increase the number of strands to provide the required flexural
moment strength.
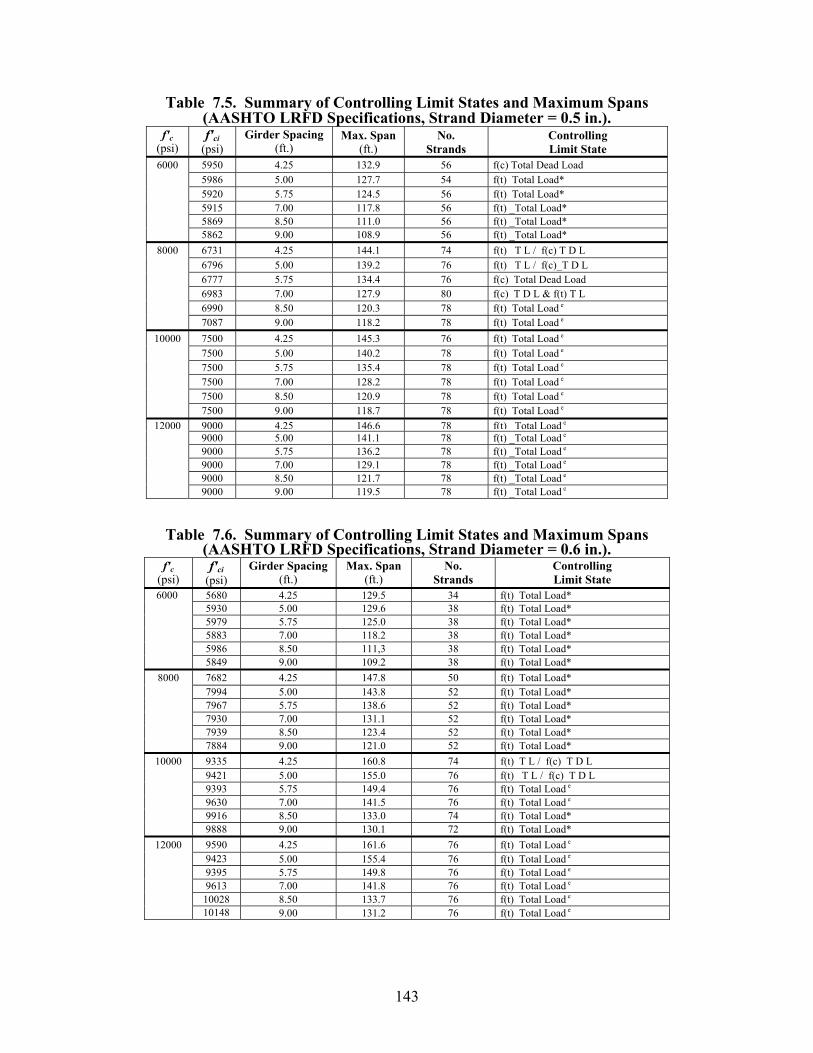
143
Table 7.5. Summary of Controlling Limit States and Maximum Spans (AASHTO LRFD Specifications, Strand Diameter = 0.5 in.).
f'c (psi)
f'ci (psi)
Girder Spacing (ft.)
Max. Span (ft.)
No. Strands
Controlling Limit State
6000 5950 4.25 132.9 56 f(c) Total Dead Load 5986 5.00 127.7 54 f(t) Total Load* 5920 5.75 124.5 56 f(t) Total Load* 5915 7.00 117.8 56 f(t) _Total Load* 5869 8.50 111.0 56 f(t) _Total Load* 5862 9.00 108.9 56 f(t) _Total Load*
8000 6731 4.25 144.1 74 f(t) T L / f(c) T D L 6796 5.00 139.2 76 f(t) T L / f(c)_T D L 6777 5.75 134.4 76 f(c) Total Dead Load 6983 7.00 127.9 80 f(c) T D L & f(t) T L 6990 8.50 120.3 78 f(t) Total Load e 7087 9.00 118.2 78 f(t) Total Load e
10000 7500 4.25 145.3 76 f(t) Total Load e 7500 5.00 140.2 78 f(t) Total Load e 7500 5.75 135.4 78 f(t) Total Load e 7500 7.00 128.2 78 f(t) Total Load e 7500 8.50 120.9 78 f(t) Total Load e 7500 9.00 118.7 78 f(t) Total Load e
12000 9000 4.25 146.6 78 f(t) Total Load e
9000 5.00 141.1 78 f(t) _Total Load e 9000 5.75 136.2 78 f(t) _Total Load e 9000 7.00 129.1 78 f(t) _Total Load e 9000 8.50 121.7 78 f(t) _Total Load e 9000 9.00 119.5 78 f(t) _Total Load e
Table 7.6. Summary of Controlling Limit States and Maximum Spans (AASHTO LRFD Specifications, Strand Diameter = 0.6 in.).
f'c (psi)
f'ci (psi)
Girder Spacing (ft.)
Max. Span (ft.)
No. Strands
Controlling Limit State
5680 4.25 129.5 34 f(t) Total Load* 5930 5.00 129.6 38 f(t) Total Load* 5979 5.75 125.0 38 f(t) Total Load* 5883 7.00 118.2 38 f(t) Total Load* 5986 8.50 111,3 38 f(t) Total Load*
6000
5849 9.00 109.2 38 f(t) Total Load* 8000 7682 4.25 147.8 50 f(t) Total Load*
7994 5.00 143.8 52 f(t) Total Load* 7967 5.75 138.6 52 f(t) Total Load* 7930 7.00 131.1 52 f(t) Total Load* 7939 8.50 123.4 52 f(t) Total Load* 7884 9.00 121.0 52 f(t) Total Load*
10000 9335 4.25 160.8 74 f(t) T L / f(c) T D L 9421 5.00 155.0 76 f(t) T L / f(c) T D L 9393 5.75 149.4 76 f(t) Total Load e 9630 7.00 141.5 76 f(t) Total Load e 9916 8.50 133.0 74 f(t) Total Load* 9888 9.00 130.1 72 f(t) Total Load*
12000 9590 4.25 161.6 76 f(t) Total Load e 9423 5.00 155.4 76 f(t) Total Load e 9395 5.75 149.8 76 f(t) Total Load e 9613 7.00 141.8 76 f(t) Total Load e 10028 8.50 133.7 76 f(t) Total Load e 10148 9.00 131.2 76 f(t) Total Load e
144
The number of strands required for longer spans, except the maximum span lengths, is
controlled by the concrete tensile stress under service loads at midspan. Maximum span lengths
are controlled by concrete compressive stresses due to total dead loads (not including live loads),
except when additional prestressing strands cannot be used because an effective eccentricity is
reached. In general, an effective eccentricity is reached when 76 or 78 prestressing strands are
used. Additional strands beyond this number do not provide a significant gain in length because
the addition of strands actually results in a reduction in the eccentricity. In this case, maximum
spans are controlled by the concrete tensile stress at midspan under service loads. Other
exceptions were noted for wider girder spacing (typically greater than 7 ft.), where maximum
spans were limited because the number of strands that could be used was controlled by the
tensile or compressive stress at the beam ends at release.
The concrete strength at release (f 'ci) is critical for LRFD designs for all girder spacings
and concrete strength of 6000 psi when 0.5 in. diameter strands are used and for all girder
spacings and concrete strengths up to 10000 psi when 0.6 in. diameter strands are used. The
stress limits at release were taken as 0.6 f 'ci for compression and 6.96 cif ' for tension, where f 'ci
is in psi units (see Section 5.4). The significant load demands of LRFD designs using all girder
spacings require a large number of prestressing strands for service conditions. This corresponds
to high initial prestressing forces at the beam ends during release. The higher the initial
prestressing forces, the greater the required initial concrete strengths. Consequently, the initial
stresses control because they become even more critical than the final stresses. In this case, there
is a need for a high early concrete strength because the optimal amount of time prior to transfer
for production purposes is approximately 12 to 24 hours. The strength gain after release is not as
critical in these cases.
For LRFD designs using Type IV beams, several maximum span lengths with all girder
spacings were controlled by the allowable release compressive stress. However, for LRFD
designs for U54 Beams, only the wider girder spacings were controlled by the allowable tensile
and compressive release stresses. For Type IV beams with all girder spacings except 4.25 ft. and
using 0.5 in. diameter strands, the allowable compressive stress at the beam ends at release
controls the number of strands used for the maximum span length for the lowest f 'c of 6000 psi.
145
When f 'c is greater than or equal to 8000 psi, the maximum span lengths for wider girder
spacings (greater than 7 ft.) are controlled by the maximum number of strands (76 or 78) that the
Type IV beam can accommodate. Additional strands beyond this number do not provide a
significant gain in length. Moreover, longer maximum span lengths are not possible for Type IV
beams with any girder spacing for f 'c values greater than 8000 psi (see Table 7.5 and Figure 7.3).
For Type IV beams with 0.6 in. diameter strands, the allowable compressive stress at the
beam ends during transfer controls the number of strands used for maximum span length for f 'c
values up to 8000 psi for all girder spacings. When f 'c is 10000 psi, maximum span lengths for
wider girder spacings (greater than 7 ft.) are controlled by the compressive stress at the beam
end during transfer, with a number of strands close to the maximum number because the
effective eccentricity is used. When f'c is 12000 psi, maximum span lengths for all girder
spacings are controlled by the maximum number of strands (76 or 78) that the Type IV beam
can accommodate, such that additional strands beyond this number do not provide a significant
gain in length. Moreover, researchers concluded that longer maximum span lengths are not
possible for Type IV beams with any of the girder spacings studied for concrete strengths more
than 10000 psi (see Table 7.6 and Figure 7.4).
These trends indicate that for LRFD designs, the concrete strength at release is critical for
several maximum span lengths and all girder spacings, where the allowable stress limits at
release were taken as 0.6 f 'ci for compression and 6.96 cif ' for tension (see Section 5.4). The
significant live load demands for the LRFD designs result in large initial prestressing forces at
the beam ends during release. As the initial prestressing force increases, the required initial
concrete strengths must also increase. Consequently, initial stresses control because they
become even more critical than the final stresses. In this case, there is a need for a high early
concrete strength because the optimal amount of time prior to transfer is typically between 12 to
24 hours for production. The strength gain after release is not the most critical factor in these
cases.
146
7.4 STRAND DIAMETER AND CONCRETE STRENGTH
7.4.1 General
One purpose of the parametric study was to determine the increase in span length possible
through the use of different concrete classes. However, the effective use of concrete depends on
the diameter of the strands; therefore, the impact of strand diameter was also studied. Figures
7.1 and 7.2 show the trends for maximum span lengths versus various concrete strengths for each
girder spacing considered. These graphs correspond to strand diameters of 0.5 and 0.6 in., with
designs following both the AASHTO Standard and LRFD Specifications (AASHTO 2002 a,b).
These graphs help to describe how strand diameter impacts the effective use of concrete strength
and, consequently, the maximum span lengths that can be obtained. The maximum span based
on the flexural design nearly levels off beyond a certain concrete strength. This leveling off
occurs when additional prestressing strands (no more than 76 or 78) do not produce any gain in
length.
7.4.2 Trends Observed for AASHTO Standard Specifications
Figure 7.1a shows that the Type IV beam with 0.5 in. diameter strands designed under the
AASHTO Standard Specifications can fully utilize concrete strengths up to 10000 psi. The
maximum span lengths nearly level off at this strength. Figure 7.1b shows that the Type IV
beam with 0.6 in. diameter strands can fully utilize concrete compressive strengths up to 12000
psi and beyond in some cases (12000 psi was the maximum strength considered).
7.4.3 Trends Observed for AASHTO LRFD Specifications
Figure 7.2a shows that the Type IV beam with 0.5 in. diameter strands designed under the
AASHTO LRFD Specifications can fully utilize concrete compressive strengths up to 8000 psi.
The maximum span lengths nearly level off at this strength. Figure 7.2b shows that the Type IV
beam with 0.6 in. diameter strands designed under the AASHTO LRFD Specifications can fully
utilize concrete compressive strengths up to 10000 psi. Table 7.7 summarizes these trends.
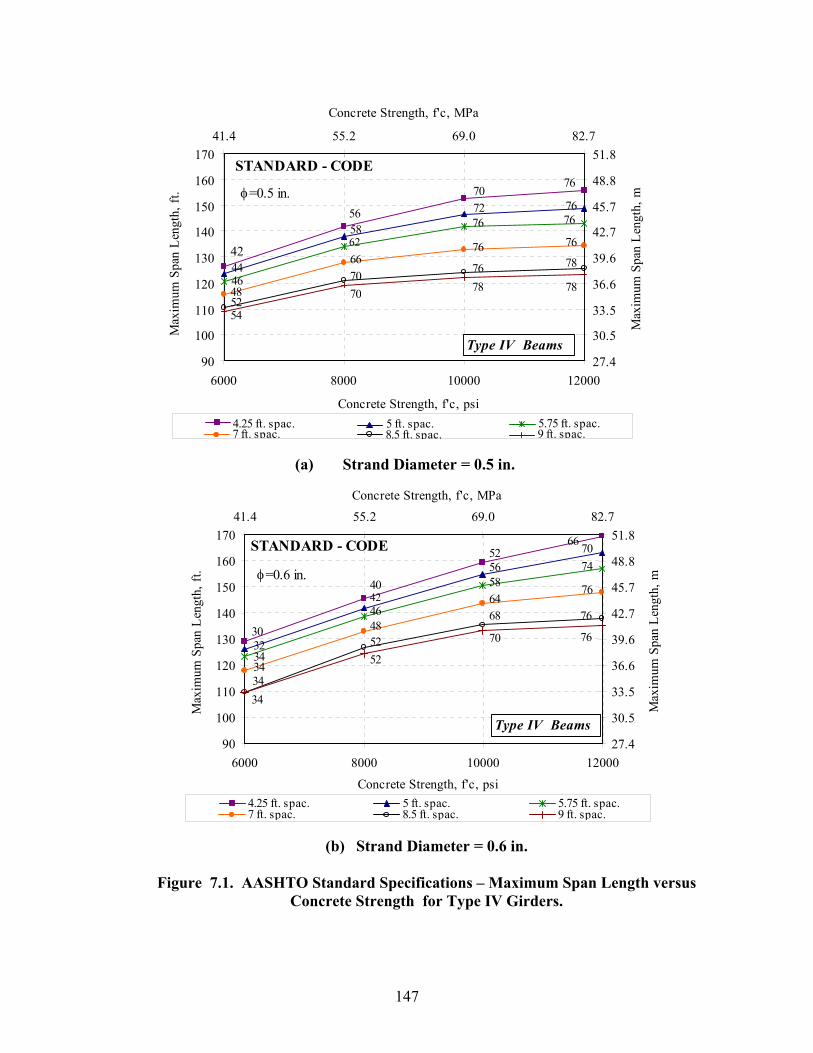
147
90
100
110
120
130
140
150
160
170
6000 8000 10000 12000
Concrete Strength, f'c, psi
Max
imum
Spa
n Le
ngth
, ft.
27.4
30.5
33.5
36.6
39.6
42.7
45.7
48.8
51.841.4 55.2 69.0 82.7
Concrete Strength, f'c, MPa
Max
imum
Spa
n Le
ngth
, m
4.25 ft. spac. 5 ft. spac. 5.75 ft. spac.7 ft. spac. 8.5 ft. spac. 9 ft. spac.
54
70
76
48
66
76
46
62
72
44
58
70 76
56
42
STANDARD - CODE
φ=0.5 in.
52 70
Type IV Beams
76 76
76
78 76 78 78
(a) Strand Diameter = 0.5 in.
90
100
110
120
130
140
150
160
170
6000 8000 10000 12000Concrete Strength, f'c, psi
Max
imum
Spa
n Le
ngth
, ft.
27.4
30.5
33.5
36.6
39.6
42.7
45.7
48.8
51.841.4 55.2 69.0 82.7
Concrete Strength, f'c, MPa
Max
imum
Spa
n Le
ngth
, m
4.25 ft. spac. 5 ft. spac. 5.75 ft. spac.7 ft. spac. 8.5 ft. spac. 9 ft. spac.
34
52
64 76
34
48
58 76
34
46
56 70
32
42
52 66
40
30 68
76
STANDARD - CODE
φ=0.6 in.
34
52
70
74
Type IV Beams
(b) Strand Diameter = 0.6 in.
Figure 7.1. AASHTO Standard Specifications – Maximum Span Length versus
Concrete Strength for Type IV Girders.
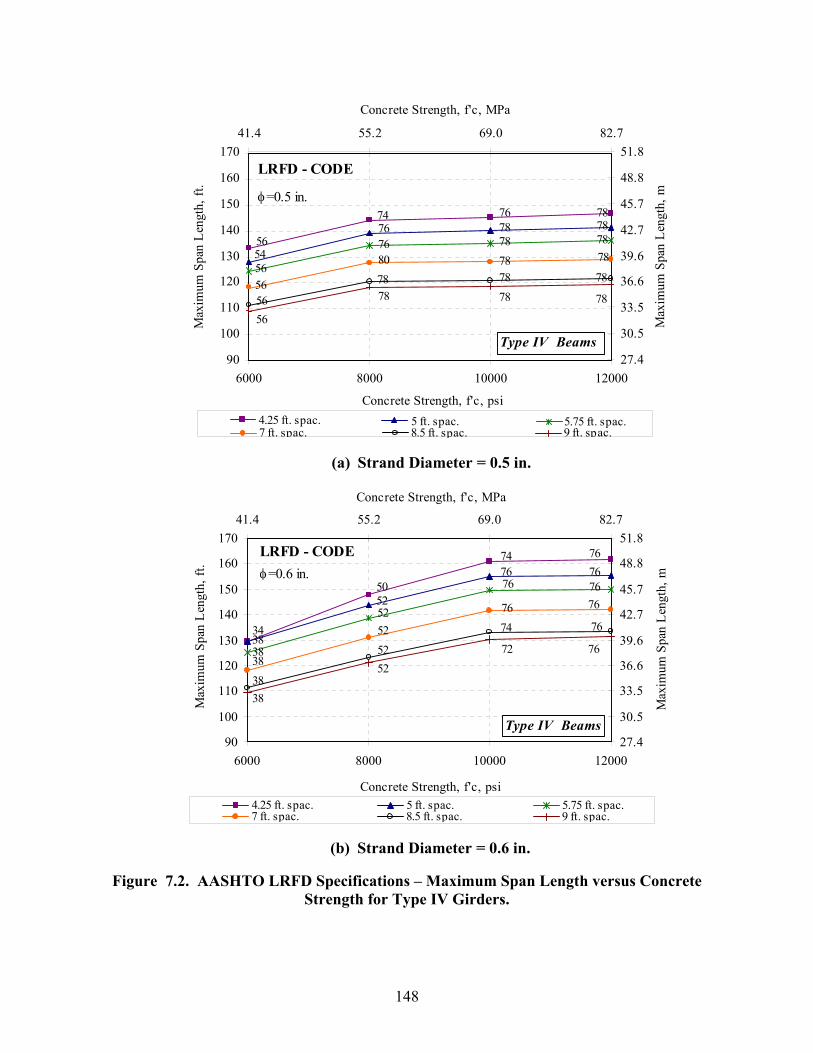
148
90
100
110
120
130
140
150
160
170
6000 8000 10000 12000
Concrete Strength, f'c, psi
Max
imum
Spa
n Le
ngth
, ft.
27.4
30.5
33.5
36.6
39.6
42.7
45.7
48.8
51.841.4 55.2 69.0 82.7
Concrete Strength, f'c, MPa
Max
imum
Spa
n Le
ngth
, m
4.25 ft. spac. 5 ft. spac. 5.75 ft. spac.7 ft. spac. 8.5 ft. spac. 9 ft. spac.
78 78
78 56
80 78
78 56
76 78 78
54
76 76 78 74
56
78 78
LRFD - CODE
φ=0.5 in.
56 78 78
78
56
Type IV Beams
(a) Strand Diameter = 0.5 in.
90
100
110
120
130
140
150
160
170
6000 8000 10000 12000
Concrete Strength, f'c, psi
Max
imum
Spa
n Le
ngth
, ft.
27.4
30.5
33.5
36.6
39.6
42.7
45.7
48.8
51.841.4 55.2 69.0 82.7
Concrete Strength, f'c, MPa
Max
imum
Spa
n Le
ngth
, m
4.25 ft. spac. 5 ft. spac. 5.75 ft. spac.7 ft. spac. 8.5 ft. spac. 9 ft. spac.
38
52
76 76
38
52
76
76
38
52
76 76
38
52
74 76
50
34 74
76
LRFD - CODEφ=0.6 in.
3852
72
76
Type IV Beams
(b) Strand Diameter = 0.6 in.
Figure 7.2. AASHTO LRFD Specifications – Maximum Span Length versus Concrete
Strength for Type IV Girders.
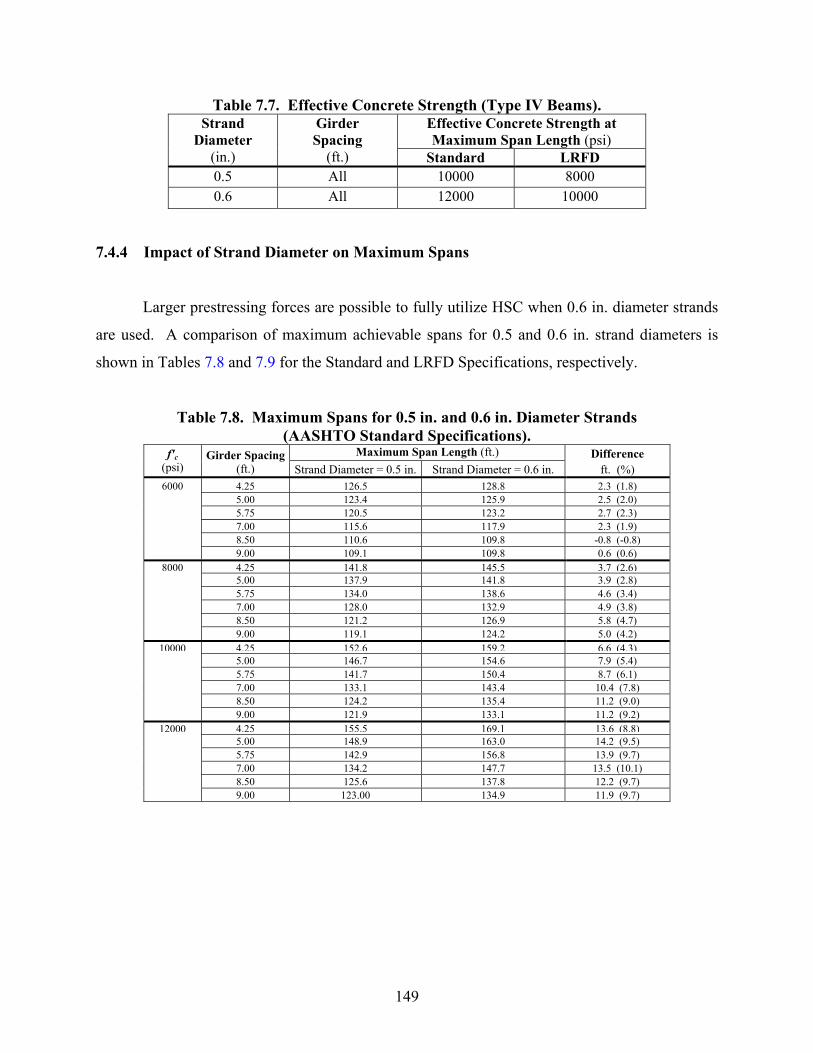
149
Table 7.7. Effective Concrete Strength (Type IV Beams). Effective Concrete Strength at Maximum Span Length (psi)
Strand Diameter
(in.)
Girder Spacing
(ft.) Standard LRFD 0.5 All 10000 8000 0.6 All 12000 10000
7.4.4 Impact of Strand Diameter on Maximum Spans
Larger prestressing forces are possible to fully utilize HSC when 0.6 in. diameter strands
are used. A comparison of maximum achievable spans for 0.5 and 0.6 in. strand diameters is
shown in Tables 7.8 and 7.9 for the Standard and LRFD Specifications, respectively.
Table 7.8. Maximum Spans for 0.5 in. and 0.6 in. Diameter Strands (AASHTO Standard Specifications).
Maximum Span Length (ft.) Difference f'c (psi)
Girder Spacing (ft.) Strand Diameter = 0.5 in. Strand Diameter = 0.6 in. ft. (%)
6000 4.25 126.5 128.8 2.3 (1.8) 5.00 123.4 125.9 2.5 (2.0) 5.75 120.5 123.2 2.7 (2.3) 7.00 115.6 117.9 2.3 (1.9) 8.50 110.6 109.8 -0.8 (-0.8) 9.00 109.1 109.8 0.6 (0.6)
8000 4.25 141.8 145.5 3.7 (2.6) 5.00 137.9 141.8 3.9 (2.8) 5.75 134.0 138.6 4.6 (3.4) 7.00 128.0 132.9 4.9 (3.8) 8.50 121.2 126.9 5.8 (4.7) 9.00 119.1 124.2 5.0 (4.2)
10000 4.25 152.6 159.2 6.6 (4.3) 5.00 146.7 154.6 7.9 (5.4) 5.75 141.7 150.4 8.7 (6.1) 7.00 133.1 143.4 10.4 (7.8) 8.50 124.2 135.4 11.2 (9.0) 9.00 121.9 133.1 11.2 (9.2)
12000 4.25 155.5 169.1 13.6 (8.8) 5.00 148.9 163.0 14.2 (9.5) 5.75 142.9 156.8 13.9 (9.7) 7.00 134.2 147.7 13.5 (10.1) 8.50 125.6 137.8 12.2 (9.7) 9.00 123.00 134.9 11.9 (9.7)
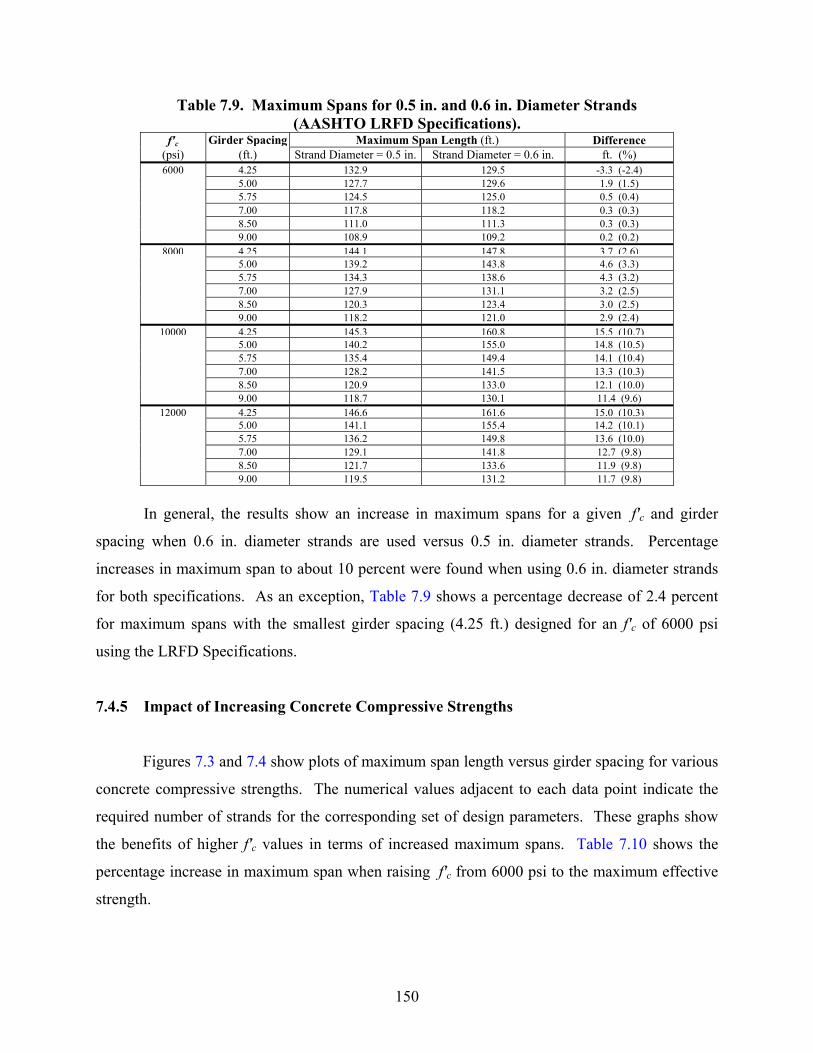
150
Table 7.9. Maximum Spans for 0.5 in. and 0.6 in. Diameter Strands (AASHTO LRFD Specifications).
f'c Girder Spacing Maximum Span Length (ft.) Difference (psi) (ft.) Strand Diameter = 0.5 in. Strand Diameter = 0.6 in. ft. (%) 6000 4.25 132.9 129.5 -3.3 (-2.4)
5.00 127.7 129.6 1.9 (1.5) 5.75 124.5 125.0 0.5 (0.4) 7.00 117.8 118.2 0.3 (0.3) 8.50 111.0 111.3 0.3 (0.3) 9.00 108.9 109.2 0.2 (0.2)
8000 4.25 144.1 147.8 3.7 (2.6) 5.00 139.2 143.8 4.6 (3.3) 5.75 134.3 138.6 4.3 (3.2) 7.00 127.9 131.1 3.2 (2.5) 8.50 120.3 123.4 3.0 (2.5) 9.00 118.2 121.0 2.9 (2.4)
10000 4.25 145.3 160.8 15.5 (10.7) 5.00 140.2 155.0 14.8 (10.5) 5.75 135.4 149.4 14.1 (10.4) 7.00 128.2 141.5 13.3 (10.3) 8.50 120.9 133.0 12.1 (10.0) 9.00 118.7 130.1 11.4 (9.6)
12000 4.25 146.6 161.6 15.0 (10.3) 5.00 141.1 155.4 14.2 (10.1) 5.75 136.2 149.8 13.6 (10.0) 7.00 129.1 141.8 12.7 (9.8) 8.50 121.7 133.6 11.9 (9.8) 9.00 119.5 131.2 11.7 (9.8)
In general, the results show an increase in maximum spans for a given f'c and girder
spacing when 0.6 in. diameter strands are used versus 0.5 in. diameter strands. Percentage
increases in maximum span to about 10 percent were found when using 0.6 in. diameter strands
for both specifications. As an exception, Table 7.9 shows a percentage decrease of 2.4 percent
for maximum spans with the smallest girder spacing (4.25 ft.) designed for an f'c of 6000 psi
using the LRFD Specifications.
7.4.5 Impact of Increasing Concrete Compressive Strengths
Figures 7.3 and 7.4 show plots of maximum span length versus girder spacing for various
concrete compressive strengths. The numerical values adjacent to each data point indicate the
required number of strands for the corresponding set of design parameters. These graphs show
the benefits of higher f'c values in terms of increased maximum spans. Table 7.10 shows the
percentage increase in maximum span when raising f'c from 6000 psi to the maximum effective
strength.
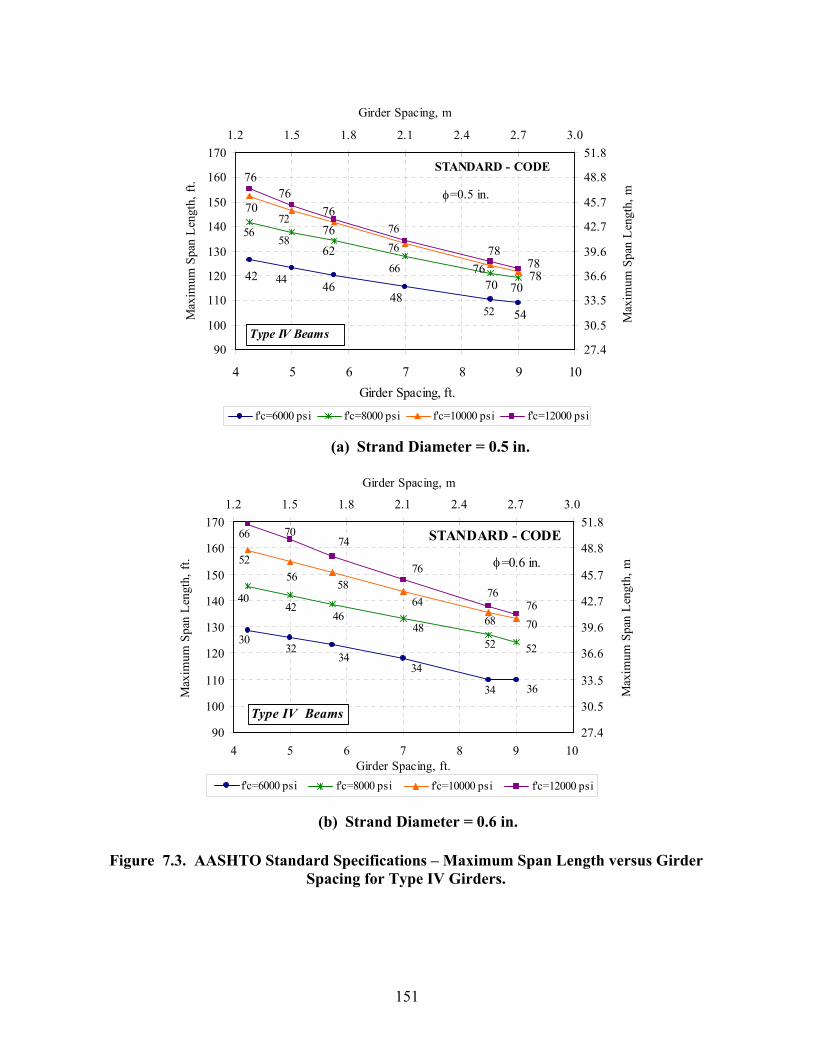
151
90
100
110
120
130
140
150
160
170
4 5 6 7 8 9 10Girder Spacing, ft.
Max
imum
Spa
n Le
ngth
, ft.
27.4
30.5
33.5
36.6
39.6
42.7
45.7
48.8
51.81.2 1.5 1.8 2.1 2.4 2.7 3.0
Girder Spacing, m
Max
imum
Spa
n Le
ngth
, m
f'c=6000 psi f'c=8000 psi f'c=10000 psi f'c=12000 psi
φ=0.5 in.
58 62
42
48
56 72
76
66
76 76
7676
78 76
STANDARD - CODE
70
44 46
76
52
78 78
70
54Type IV Beams
70
(a) Strand Diameter = 0.5 in.
90
100
110
120
130
140
150
160
170
4 5 6 7 8 9 10Girder Spacing, ft.
Max
imum
Spa
n Le
ngth
, ft.
27.4
30.5
33.5
36.6
39.6
42.7
45.7
48.8
51.81.2 1.5 1.8 2.1 2.4 2.7 3.0
Girder Spacing, m
Max
imum
Spa
n Le
ngth
, m
f'c=6000 psi f'c=8000 psi f'c=10000 psi f'c=12000 psi
φ=0.6 in.
42 46
30
34
52
40
5658
48
66 70 74
76
76
68
STANDARD - CODE52
3234
64
34
52
36
Type IV Beams
76 70
(b) Strand Diameter = 0.6 in.
Figure 7.3. AASHTO Standard Specifications – Maximum Span Length versus Girder
Spacing for Type IV Girders.
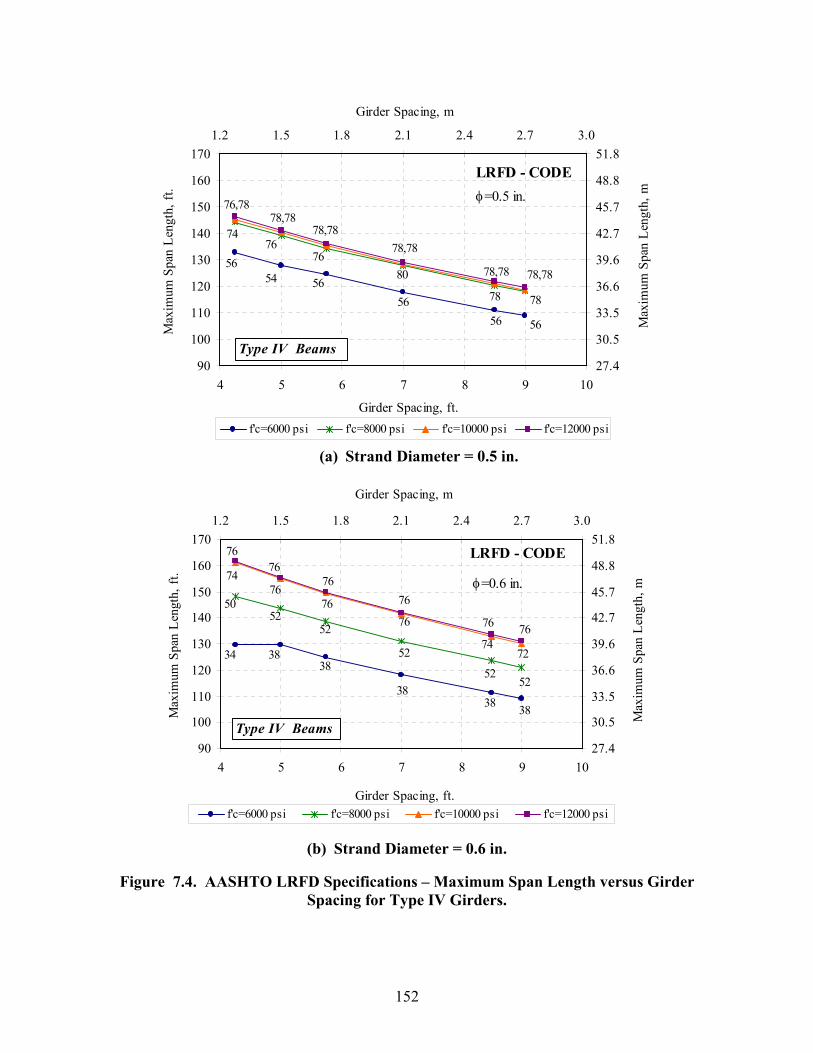
152
90
100
110
120
130
140
150
160
170
4 5 6 7 8 9 10
Girder Spacing, ft.
Max
imum
Spa
n Le
ngth
, ft.
27.4
30.5
33.5
36.6
39.6
42.7
45.7
48.8
51.81.2 1.5 1.8 2.1 2.4 2.7 3.0
Girder Spacing, m
Max
imum
Spa
n Le
ngth
, m
f'c=6000 psi f'c=8000 psi f'c=10000 psi f'c=12000 psi
φ=0.5 in.
76 7656
56 78
7478,78
80
78,7878,78
78,78
LRFD - CODE
76,78
54 56
56
78,78
78
56
Type IV Beams
(a) Strand Diameter = 0.5 in.
90
100
110
120
130
140
150
160
170
4 5 6 7 8 9 10
Girder Spacing, ft.
Max
imum
Spa
n Le
ngth
, ft.
27.4
30.5
33.5
36.6
39.6
42.7
45.7
48.8
51.81.2 1.5 1.8 2.1 2.4 2.7 3.0
Girder Spacing, m
Max
imum
Spa
n Le
ngth
, m
f'c=6000 psi f'c=8000 psi f'c=10000 psi f'c=12000 psi
φ=0.6 in.
52 52
34
38 52
50 76
76
52
76 76
76 76
76
74
LRFD - CODE74
38 38
76
38
76
72
52
38 Type IV Beams
(b) Strand Diameter = 0.6 in.
Figure 7.4. AASHTO LRFD Specifications – Maximum Span Length versus Girder
Spacing for Type IV Girders.
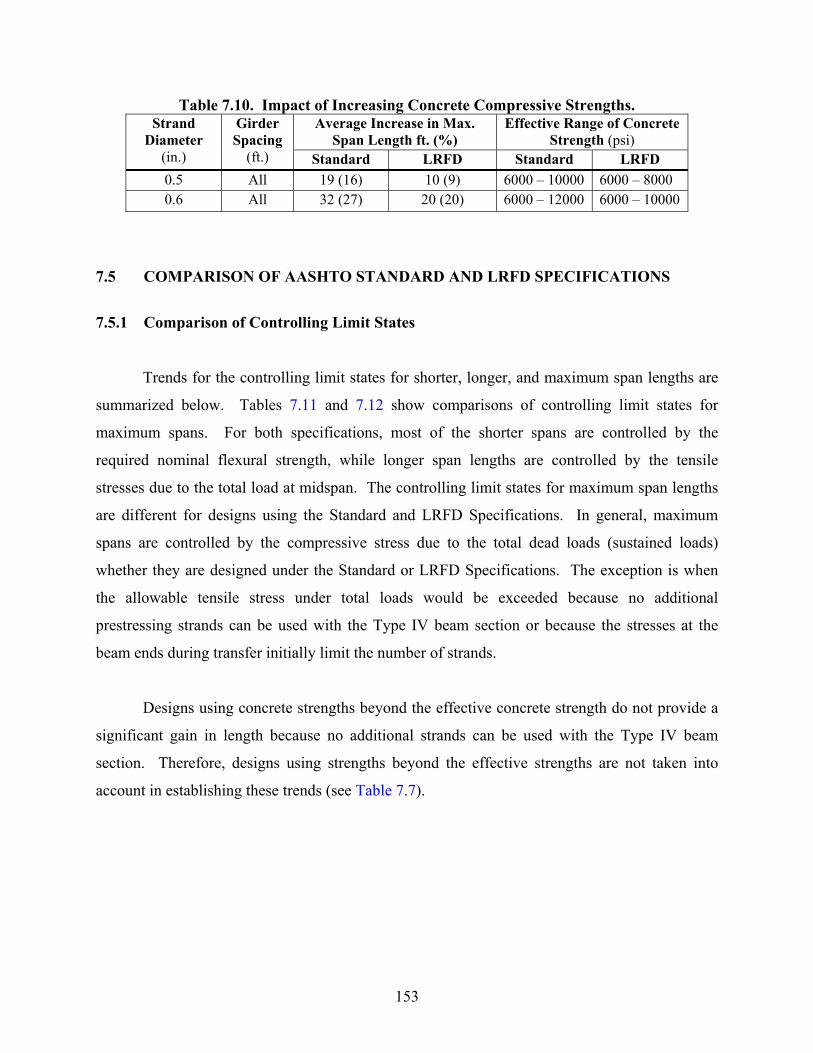
153
Table 7.10. Impact of Increasing Concrete Compressive Strengths. Average Increase in Max.
Span Length ft. (%) Effective Range of Concrete
Strength (psi) Strand
Diameter (in.)
Girder Spacing
(ft.) Standard LRFD Standard LRFD 0.5 All 19 (16) 10 (9) 6000 – 10000 6000 – 8000 0.6 All 32 (27) 20 (20) 6000 – 12000 6000 – 10000
7.5 COMPARISON OF AASHTO STANDARD AND LRFD SPECIFICATIONS
7.5.1 Comparison of Controlling Limit States
Trends for the controlling limit states for shorter, longer, and maximum span lengths are
summarized below. Tables 7.11 and 7.12 show comparisons of controlling limit states for
maximum spans. For both specifications, most of the shorter spans are controlled by the
required nominal flexural strength, while longer span lengths are controlled by the tensile
stresses due to the total load at midspan. The controlling limit states for maximum span lengths
are different for designs using the Standard and LRFD Specifications. In general, maximum
spans are controlled by the compressive stress due to the total dead loads (sustained loads)
whether they are designed under the Standard or LRFD Specifications. The exception is when
the allowable tensile stress under total loads would be exceeded because no additional
prestressing strands can be used with the Type IV beam section or because the stresses at the
beam ends during transfer initially limit the number of strands.
Designs using concrete strengths beyond the effective concrete strength do not provide a
significant gain in length because no additional strands can be used with the Type IV beam
section. Therefore, designs using strengths beyond the effective strengths are not taken into
account in establishing these trends (see Table 7.7).
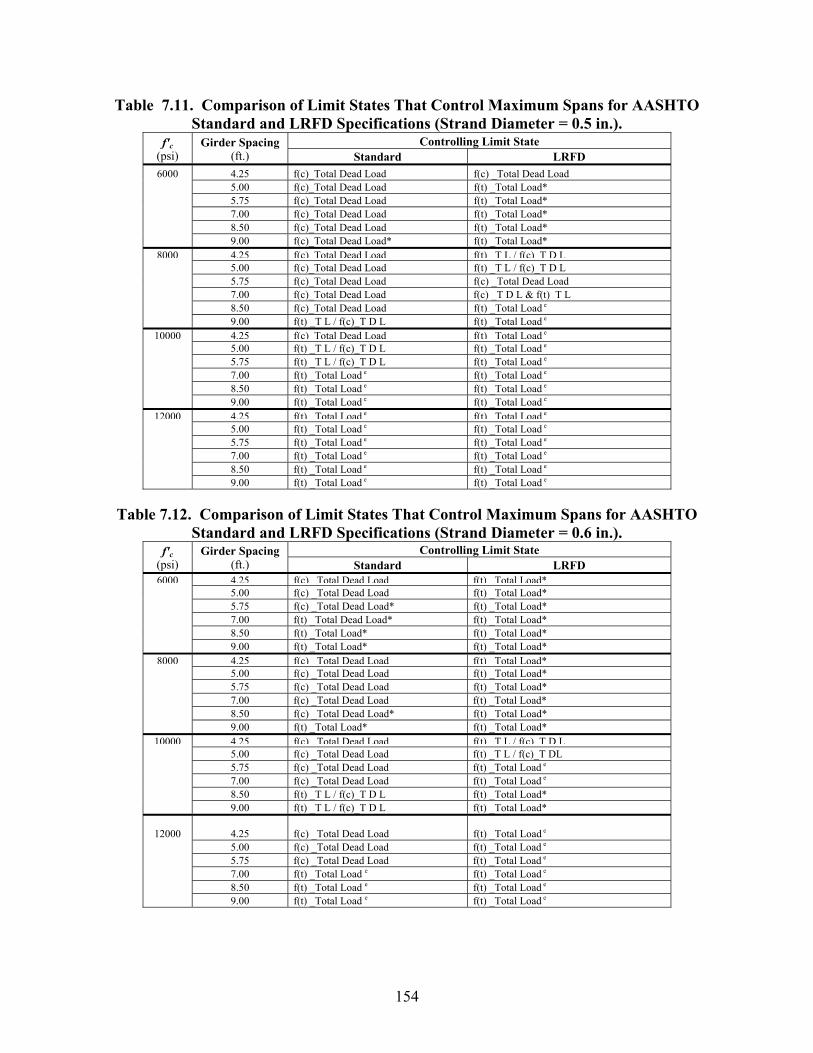
154
Table 7.11. Comparison of Limit States That Control Maximum Spans for AASHTO Standard and LRFD Specifications (Strand Diameter = 0.5 in.).
Controlling Limit State f'c (psi)
Girder Spacing (ft.) Standard LRFD
6000 4.25 f(c)_Total Dead Load f(c) _Total Dead Load 5.00 f(c)_Total Dead Load f(t) _Total Load* 5.75 f(c)_Total Dead Load f(t) _Total Load* 7.00 f(c)_Total Dead Load f(t) _Total Load* 8.50 f(c)_Total Dead Load f(t) _Total Load* 9.00 f(c)_Total Dead Load* f(t) _Total Load*
8000 4.25 f(c) Total Dead Load f(t) T L / f(c) T D L 5.00 f(c)_Total Dead Load f(t) _T L / f(c)_T D L 5.75 f(c)_Total Dead Load f(c) _Total Dead Load 7.00 f(c)_Total Dead Load f(c) _T D L & f(t) T L 8.50 f(c)_Total Dead Load f(t) _Total Load e 9.00 f(t) _T L / f(c)_T D L f(t) _Total Load e
10000 4.25 f(c) Total Dead Load f(t) Total Load e
5.00 f(t) _T L / f(c)_T D L f(t) _Total Load e 5.75 f(t) _T L / f(c)_T D L f(t) _Total Load e 7.00 f(t) _Total Load e f(t) _Total Load e 8.50 f(t) _Total Load e f(t) _Total Load e 9.00 f(t) _Total Load e f(t) _Total Load e
12000 4.25 f(t) Total Load e f(t) Total Load e
5.00 f(t) _Total Load e f(t) _Total Load e 5.75 f(t) _Total Load e f(t) _Total Load e 7.00 f(t) _Total Load e f(t) _Total Load e 8.50 f(t) _Total Load e f(t) _Total Load e 9.00 f(t) _Total Load e f(t) _Total Load e
Table 7.12. Comparison of Limit States That Control Maximum Spans for AASHTO
Standard and LRFD Specifications (Strand Diameter = 0.6 in.). Controlling Limit State f'c
(psi) Girder Spacing
(ft.) Standard LRFD 6000 4.25 f(c) Total Dead Load f(t) Total Load*
5.00 f(c) _Total Dead Load f(t) _Total Load* 5.75 f(c) _Total Dead Load* f(t) _Total Load* 7.00 f(t) _Total Dead Load* f(t) _Total Load* 8.50 f(t) _Total Load* f(t) _Total Load* 9.00 f(t) _Total Load* f(t) _Total Load*
8000 4.25 f(c) Total Dead Load f(t) Total Load* 5.00 f(c) _Total Dead Load f(t) _Total Load* 5.75 f(c) _Total Dead Load f(t) _Total Load* 7.00 f(c) _Total Dead Load f(t) _Total Load* 8.50 f(c) _Total Dead Load* f(t) _Total Load* 9.00 f(t) _Total Load* f(t) _Total Load*
10000 4.25 f(c) Total Dead Load f(t) T L / f(c) T D L 5.00 f(c) _Total Dead Load f(t) _T L / f(c)_T DL 5.75 f(c) _Total Dead Load f(t) _Total Load e 7.00 f(c) _Total Dead Load f(t) _Total Load e 8.50 f(t) _T L / f(c)_T D L f(t) _Total Load* 9.00 f(t) _T L / f(c)_T D L f(t) _Total Load*
12000 4.25 f(c) _Total Dead Load f(t) _Total Load e 5.00 f(c) _Total Dead Load f(t) _Total Load e 5.75 f(c) _Total Dead Load f(t) _Total Load e 7.00 f(t) _Total Load e f(t) _Total Load e 8.50 f(t) _Total Load e f(t) _Total Load e 9.00 f(t) _Total Load e f(t) _Total Load e
155
Unlike the U54 beam designs, the compressive stresses at the beam ends during transfer
control some of the maximum spans for Type IV beams with wider spacings designed using the
Standard Specifications. Like the U54 beam designs, several maximum spans are controlled by
the compressive stresses at transfer when they are designed under the LRFD Specifications.
However, in this case, not just maximum spans with wider girder spacings are affected rather
maximum span lengths for all girder spacings are limited by the compressive stress at transfer
(except for one case, see Table 7.5).
7.5.2 Comparison of Maximum Span Lengths
7.5.2.1 General
Tables 7.13 and 7.14 show a comparison of maximum span lengths for designs according
to the AASHTO Standard and LRFD Specifications, using 0.5 and 0.6 in. diameter strands,
respectively. The tables also provide the required number of strands for each design. The
difference in the maximum span length for the LRFD designs is expressed as a percentage
change relative to the designs for the Standard Specifications. Table 7.15 provides values for the
largest differences in the maximum span lengths for f'c values up to those strengths that work
effectively with the Type IV beam under both codes. Increases in maximum spans are
differentiated for girder spacings less than or equal to 5.75 ft. and for girder spacings more than
5.75 ft.
7.5.2.2 0.5 in. Diameter Strands
For designs using 0.5 in. diameter strands, girder spacing less than or equal to 5.75 ft.,
and f'c values between 6000 and 8000 psi (range where concrete strength works efficiently with
the Type IV beam under both codes), LRFD designs result in increases up to 6.4 ft. (5 percent) in
maximum span lengths. Note that for the maximum effective concrete strength of 8000 psi, the
maximum increase in maximum span lengths is limited to 2.3 ft. (1.6 percent). For girder
spacings more than 5.75 ft. and for f'c in the range of 6000 to 8000 psi, LRFD designs result in a
small decrease of up to 0.9 ft. (0.8 percent). in maximum spans lengths.
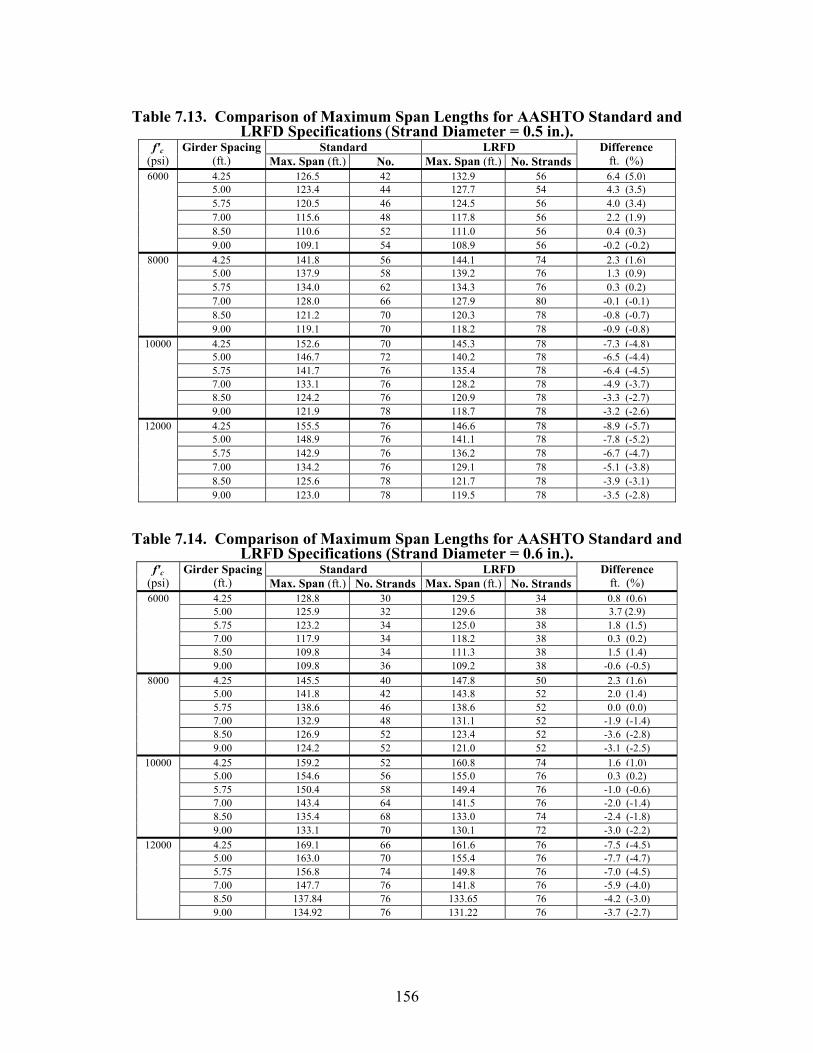
156
Table 7.13. Comparison of Maximum Span Lengths for AASHTO Standard and
LRFD Specifications (Strand Diameter = 0.5 in.). Standard LRFDf'c
(psi) Girder Spacing
(ft.) Max. Span (ft.) No. Max. Span (ft.) No. Strands Difference
ft. (%) 6000 4.25 126.5 42 132.9 56 6.4 (5.0)
5.00 123.4 44 127.7 54 4.3 (3.5) 5.75 120.5 46 124.5 56 4.0 (3.4) 7.00 115.6 48 117.8 56 2.2 (1.9) 8.50 110.6 52 111.0 56 0.4 (0.3) 9.00 109.1 54 108.9 56 -0.2 (-0.2)
8000 4.25 141.8 56 144.1 74 2.3 (1.6) 5.00 137.9 58 139.2 76 1.3 (0.9) 5.75 134.0 62 134.3 76 0.3 (0.2) 7.00 128.0 66 127.9 80 -0.1 (-0.1) 8.50 121.2 70 120.3 78 -0.8 (-0.7) 9.00 119.1 70 118.2 78 -0.9 (-0.8)
10000 4.25 152.6 70 145.3 78 -7.3 (-4.8) 5.00 146.7 72 140.2 78 -6.5 (-4.4) 5.75 141.7 76 135.4 78 -6.4 (-4.5) 7.00 133.1 76 128.2 78 -4.9 (-3.7) 8.50 124.2 76 120.9 78 -3.3 (-2.7) 9.00 121.9 78 118.7 78 -3.2 (-2.6)
12000 4.25 155.5 76 146.6 78 -8.9 (-5.7) 5.00 148.9 76 141.1 78 -7.8 (-5.2) 5.75 142.9 76 136.2 78 -6.7 (-4.7) 7.00 134.2 76 129.1 78 -5.1 (-3.8) 8.50 125.6 78 121.7 78 -3.9 (-3.1) 9.00 123.0 78 119.5 78 -3.5 (-2.8)
Table 7.14. Comparison of Maximum Span Lengths for AASHTO Standard and LRFD Specifications (Strand Diameter = 0.6 in.).
Standard LRFDf'c (psi)
Girder Spacing (ft.) Max. Span (ft.) No. Strands Max. Span (ft.) No. Strands
Difference ft. (%)
6000 4.25 128.8 30 129.5 34 0.8 (0.6) 5.00 125.9 32 129.6 38 3.7 (2.9) 5.75 123.2 34 125.0 38 1.8 (1.5) 7.00 117.9 34 118.2 38 0.3 (0.2) 8.50 109.8 34 111.3 38 1.5 (1.4) 9.00 109.8 36 109.2 38 -0.6 (-0.5)
8000 4.25 145.5 40 147.8 50 2.3 (1.6) 5.00 141.8 42 143.8 52 2.0 (1.4) 5.75 138.6 46 138.6 52 0.0 (0.0) 7.00 132.9 48 131.1 52 -1.9 (-1.4) 8.50 126.9 52 123.4 52 -3.6 (-2.8) 9.00 124.2 52 121.0 52 -3.1 (-2.5)
10000 4.25 159.2 52 160.8 74 1.6 (1.0) 5.00 154.6 56 155.0 76 0.3 (0.2) 5.75 150.4 58 149.4 76 -1.0 (-0.6) 7.00 143.4 64 141.5 76 -2.0 (-1.4) 8.50 135.4 68 133.0 74 -2.4 (-1.8) 9.00 133.1 70 130.1 72 -3.0 (-2.2)
12000 4.25 169.1 66 161.6 76 -7.5 (-4.5) 5.00 163.0 70 155.4 76 -7.7 (-4.7) 5.75 156.8 74 149.8 76 -7.0 (-4.5) 7.00 147.7 76 141.8 76 -5.9 (-4.0) 8.50 137.84 76 133.65 76 -4.2 (-3.0) 9.00 134.92 76 131.22 76 -3.7 (-2.7)
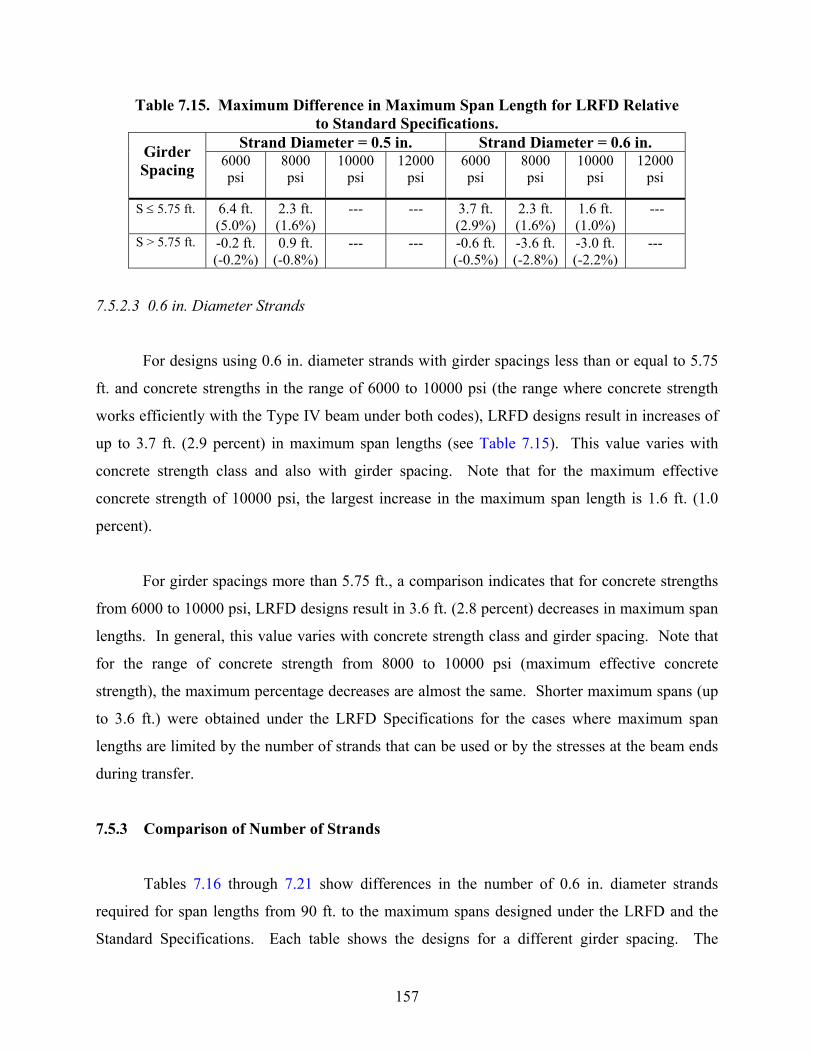
157
Table 7.15. Maximum Difference in Maximum Span Length for LRFD Relative to Standard Specifications.
Strand Diameter = 0.5 in. Strand Diameter = 0.6 in. Girder Spacing
6000 psi
8000 psi
10000 psi
12000 psi
6000 psi
8000 psi
10000 psi
12000 psi
S ≤ 5.75 ft. 6.4 ft. (5.0%)
2.3 ft. (1.6%)
--- --- 3.7 ft. (2.9%)
2.3 ft. (1.6%)
1.6 ft. (1.0%)
---
S > 5.75 ft. -0.2 ft. (-0.2%)
0.9 ft. (-0.8%)
--- --- -0.6 ft. (-0.5%)
-3.6 ft. (-2.8%)
-3.0 ft. (-2.2%)
---
7.5.2.3 0.6 in. Diameter Strands
For designs using 0.6 in. diameter strands with girder spacings less than or equal to 5.75
ft. and concrete strengths in the range of 6000 to 10000 psi (the range where concrete strength
works efficiently with the Type IV beam under both codes), LRFD designs result in increases of
up to 3.7 ft. (2.9 percent) in maximum span lengths (see Table 7.15). This value varies with
concrete strength class and also with girder spacing. Note that for the maximum effective
concrete strength of 10000 psi, the largest increase in the maximum span length is 1.6 ft. (1.0
percent).
For girder spacings more than 5.75 ft., a comparison indicates that for concrete strengths
from 6000 to 10000 psi, LRFD designs result in 3.6 ft. (2.8 percent) decreases in maximum span
lengths. In general, this value varies with concrete strength class and girder spacing. Note that
for the range of concrete strength from 8000 to 10000 psi (maximum effective concrete
strength), the maximum percentage decreases are almost the same. Shorter maximum spans (up
to 3.6 ft.) were obtained under the LRFD Specifications for the cases where maximum span
lengths are limited by the number of strands that can be used or by the stresses at the beam ends
during transfer.
7.5.3 Comparison of Number of Strands
Tables 7.16 through 7.21 show differences in the number of 0.6 in. diameter strands
required for span lengths from 90 ft. to the maximum spans designed under the LRFD and the
Standard Specifications. Each table shows the designs for a different girder spacing. The
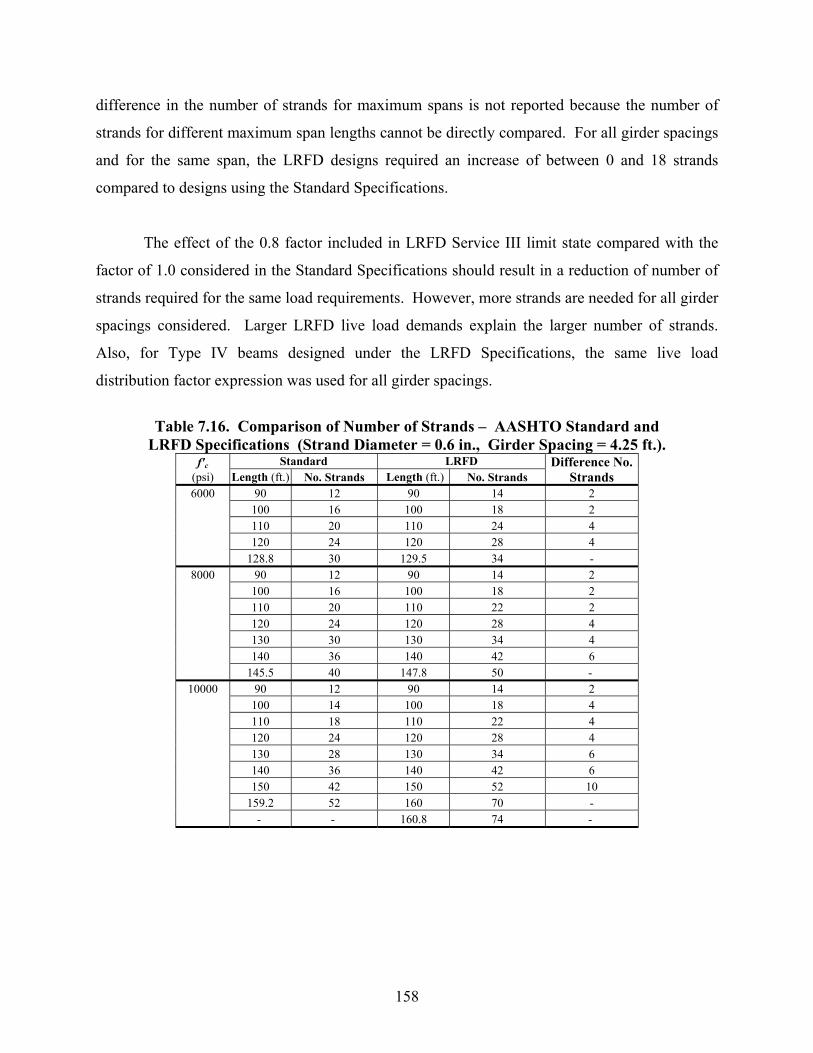
158
difference in the number of strands for maximum spans is not reported because the number of
strands for different maximum span lengths cannot be directly compared. For all girder spacings
and for the same span, the LRFD designs required an increase of between 0 and 18 strands
compared to designs using the Standard Specifications.
The effect of the 0.8 factor included in LRFD Service III limit state compared with the
factor of 1.0 considered in the Standard Specifications should result in a reduction of number of
strands required for the same load requirements. However, more strands are needed for all girder
spacings considered. Larger LRFD live load demands explain the larger number of strands.
Also, for Type IV beams designed under the LRFD Specifications, the same live load
distribution factor expression was used for all girder spacings.
Table 7.16. Comparison of Number of Strands – AASHTO Standard and
LRFD Specifications (Strand Diameter = 0.6 in., Girder Spacing = 4.25 ft.). f'c Standard LRFD Difference No.
(psi) Length (ft.) No. Strands Length (ft.) No. Strands Strands 6000 90 12 90 14 2
100 16 100 18 2 110 20 110 24 4 120 24 120 28 4 128.8 30 129.5 34 -
8000 90 12 90 14 2 100 16 100 18 2 110 20 110 22 2 120 24 120 28 4 130 30 130 34 4 140 36 140 42 6 145.5 40 147.8 50 -
10000 90 12 90 14 2 100 14 100 18 4 110 18 110 22 4 120 24 120 28 4 130 28 130 34 6 140 36 140 42 6 150 42 150 52 10 159.2 52 160 70 - - - 160.8 74 -
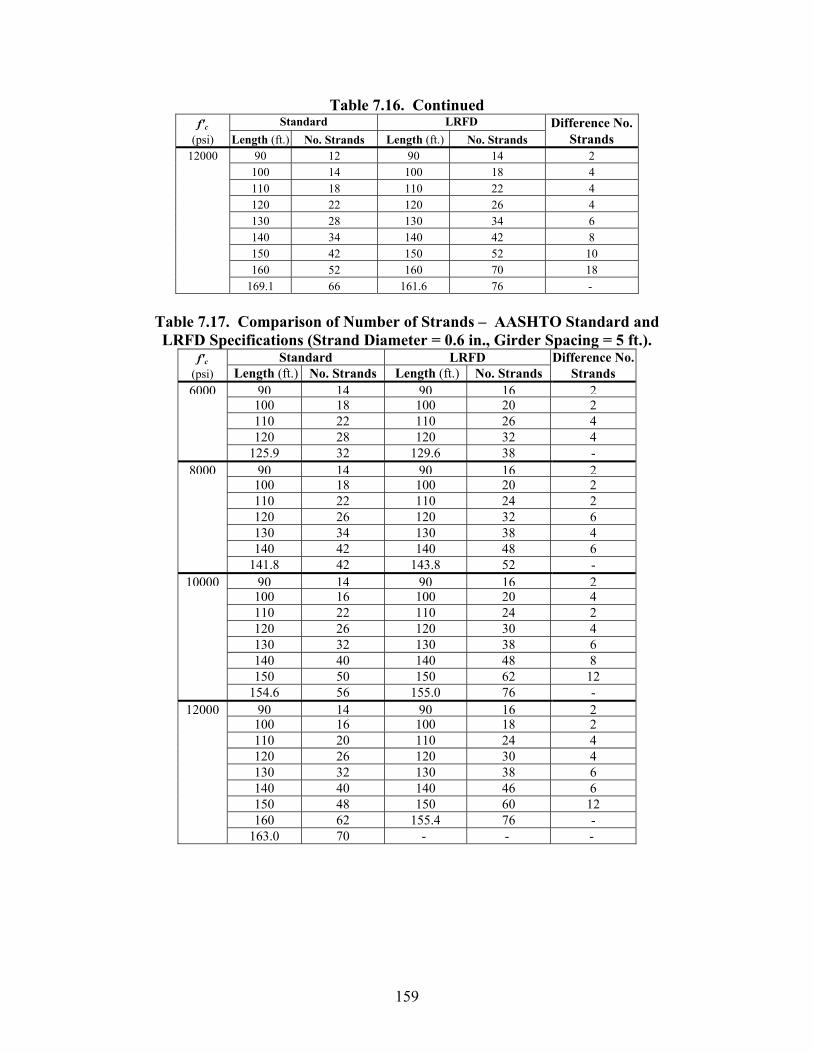
159
Table 7.16. Continued f'c Standard LRFD Difference No.
(psi) Length (ft.) No. Strands Length (ft.) No. Strands Strands 12000 90 12 90 14 2
100 14 100 18 4 110 18 110 22 4 120 22 120 26 4 130 28 130 34 6 140 34 140 42 8 150 42 150 52 10 160 52 160 70 18 169.1 66 161.6 76 -
Table 7.17. Comparison of Number of Strands – AASHTO Standard and LRFD Specifications (Strand Diameter = 0.6 in., Girder Spacing = 5 ft.).
f'c Standard LRFD Difference No. (psi) Length (ft.) No. Strands Length (ft.) No. Strands Strands 6000 90 14 90 16 2
100 18 100 20 2 110 22 110 26 4 120 28 120 32 4 125.9 32 129.6 38 -
8000 90 14 90 16 2 100 18 100 20 2 110 22 110 24 2 120 26 120 32 6 130 34 130 38 4 140 42 140 48 6 141.8 42 143.8 52 -
10000 90 14 90 16 2 100 16 100 20 4 110 22 110 24 2 120 26 120 30 4 130 32 130 38 6 140 40 140 48 8 150 50 150 62 12 154.6 56 155.0 76 -
12000 90 14 90 16 2 100 16 100 18 2 110 20 110 24 4 120 26 120 30 4 130 32 130 38 6 140 40 140 46 6 150 48 150 60 12 160 62 155.4 76 - 163.0 70 - - -
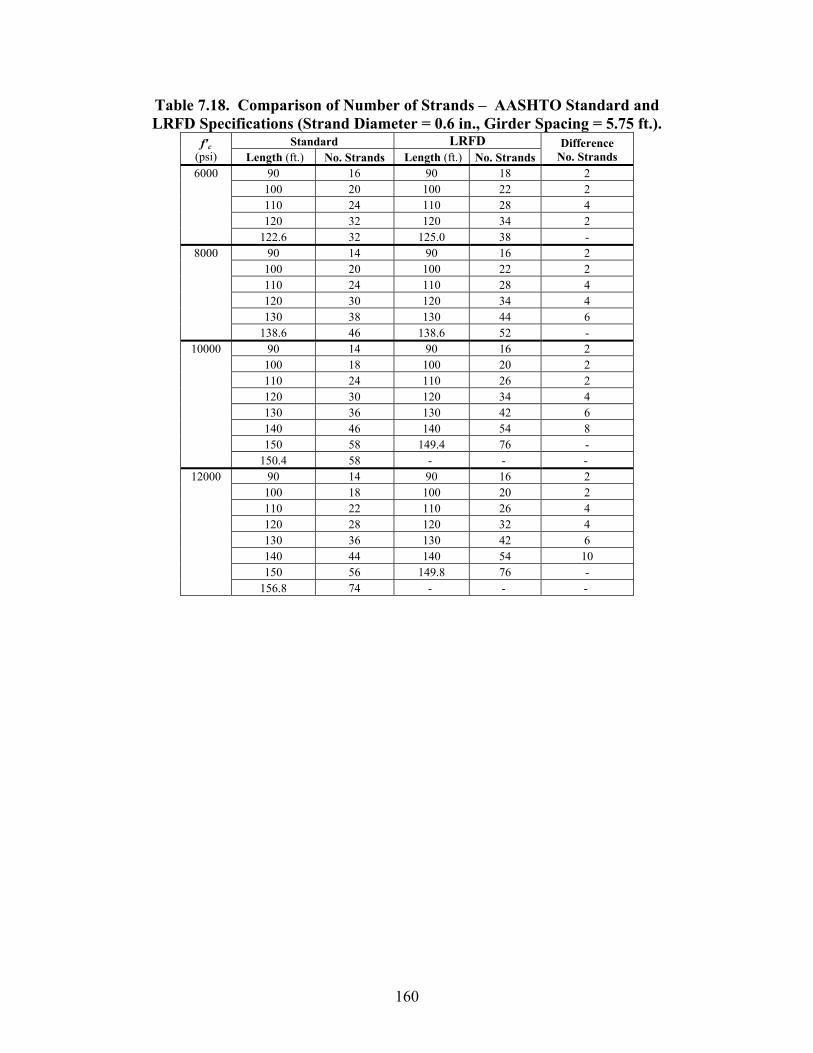
160
Table 7.18. Comparison of Number of Strands – AASHTO Standard and LRFD Specifications (Strand Diameter = 0.6 in., Girder Spacing = 5.75 ft.).
Standard LRFDf'c (psi) Length (ft.) No. Strands Length (ft.) No. Strands
Difference No. Strands
6000 90 16 90 18 2 100 20 100 22 2 110 24 110 28 4 120 32 120 34 2 122.6 32 125.0 38 -
8000 90 14 90 16 2 100 20 100 22 2 110 24 110 28 4 120 30 120 34 4 130 38 130 44 6 138.6 46 138.6 52 -
10000 90 14 90 16 2 100 18 100 20 2 110 24 110 26 2 120 30 120 34 4 130 36 130 42 6 140 46 140 54 8 150 58 149.4 76 - 150.4 58 - - -
12000 90 14 90 16 2 100 18 100 20 2 110 22 110 26 4 120 28 120 32 4 130 36 130 42 6 140 44 140 54 10 150 56 149.8 76 - 156.8 74 - - -
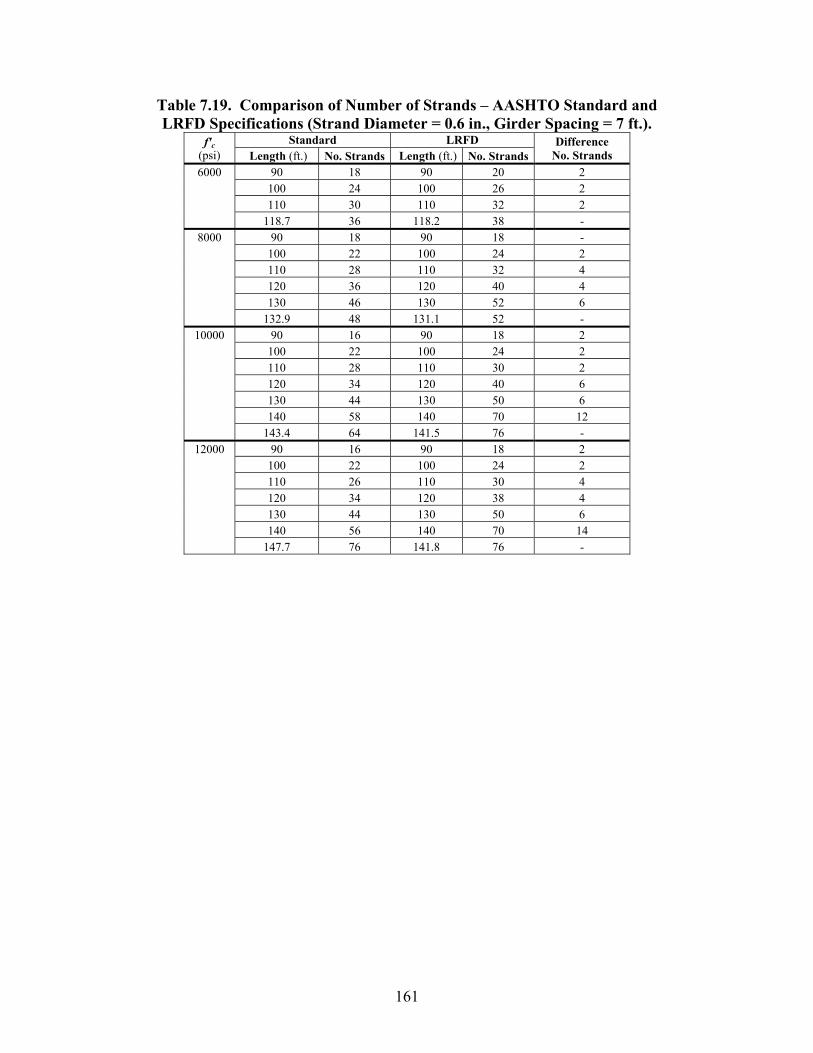
161
Table 7.19. Comparison of Number of Strands – AASHTO Standard and LRFD Specifications (Strand Diameter = 0.6 in., Girder Spacing = 7 ft.).
Standard LRFD f'c (psi) Length (ft.) No. Strands Length (ft.) No. Strands
Difference No. Strands
6000 90 18 90 20 2 100 24 100 26 2 110 30 110 32 2 118.7 36 118.2 38 -
8000 90 18 90 18 - 100 22 100 24 2 110 28 110 32 4 120 36 120 40 4 130 46 130 52 6 132.9 48 131.1 52 -
10000 90 16 90 18 2 100 22 100 24 2 110 28 110 30 2 120 34 120 40 6 130 44 130 50 6 140 58 140 70 12 143.4 64 141.5 76 -
12000 90 16 90 18 2 100 22 100 24 2 110 26 110 30 4 120 34 120 38 4 130 44 130 50 6 140 56 140 70 14 147.7 76 141.8 76 -
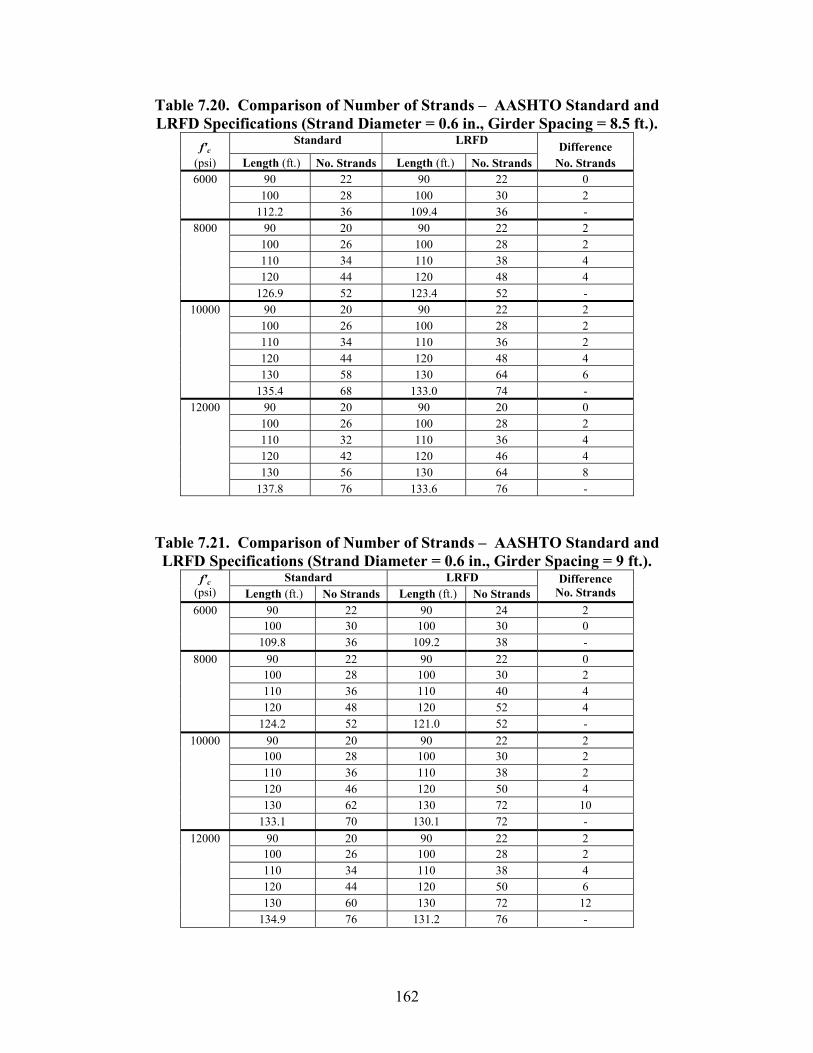
162
Table 7.20. Comparison of Number of Strands – AASHTO Standard and LRFD Specifications (Strand Diameter = 0.6 in., Girder Spacing = 8.5 ft.).
f'c Standard LRFD Difference
(psi) Length (ft.) No. Strands Length (ft.) No. Strands No. Strands 6000 90 22 90 22 0
100 28 100 30 2 112.2 36 109.4 36 -
8000 90 20 90 22 2 100 26 100 28 2 110 34 110 38 4 120 44 120 48 4 126.9 52 123.4 52 -
10000 90 20 90 22 2 100 26 100 28 2 110 34 110 36 2 120 44 120 48 4 130 58 130 64 6 135.4 68 133.0 74 -
12000 90 20 90 20 0 100 26 100 28 2 110 32 110 36 4 120 42 120 46 4 130 56 130 64 8 137.8 76 133.6 76 -
Table 7.21. Comparison of Number of Strands – AASHTO Standard and LRFD Specifications (Strand Diameter = 0.6 in., Girder Spacing = 9 ft.).
Standard LRFD f'c (psi) Length (ft.) No Strands Length (ft.) No Strands
Difference No. Strands
6000 90 22 90 24 2 100 30 100 30 0 109.8 36 109.2 38 -
8000 90 22 90 22 0 100 28 100 30 2 110 36 110 40 4 120 48 120 52 4 124.2 52 121.0 52 -
10000 90 20 90 22 2 100 28 100 30 2 110 36 110 38 2 120 46 120 50 4 130 62 130 72 10 133.1 70 130.1 72 -
12000 90 20 90 22 2 100 26 100 28 2 110 34 110 38 4 120 44 120 50 6 130 60 130 72 12 134.9 76 131.2 76 -
163
7.6 STRESSES AT TRANSFER AND TRANSFER LENGTH
Results for the Type IV beam designs indicate that the concrete tensile stress at transfer
does not control any maximum spans designed under the Standard or LRFD Specifications. For
the parametric study, the allowable tensile stress at release was taken as the highest limit
(7.5 cif ' for Standard designs and 6.96 cif ' for LRFD designs, where f 'ci is in psi units).
Researchers selected this criterion to be consistent with the TxDOT design software, PSTRS14
(TxDOT 1980), rather than using the lower limit of the minimum of 3 cif ' (where f 'ci is in psi
units) or 200 psi, provided by both AASHTO Specifications, when no additional bonded
reinforcement is used. Therefore, bonded reinforcement is necessary at the beam ends for the
designs in this study. The allowable compressive stress at release was not varied, and the limit is
consistent with that given in the Standard and LRFD Specifications.
The parametric study uses the same approach as that used in PSTRS14 program, where
stresses at the beam ends were determined assuming the strands develop instantaneously after the
debonded length. In this case, the strand transfer length is conservatively assumed to be zero.
However, the AASHTO Specifications specify that the transfer length is 60 strand diameters.
To assess the impact of this conservative assumption for the transfer length, researchers
conducted additional analysis for several critical cases. In addition, the impact of the lower
tensile stress limit at release was evaluated. The cases considered were the maximum spans
using 0.6 in. diameter strands for both specifications. The allowable tensile stress at transfer
specified as the minimum of 3 cif ' or 200 psi, results in the use of 200 psi, which seems more
appropriate for normal strength concrete (up to 6000 psi). Therefore, a limit of 3 cif ' was used
in this evaluation because the 200 psi limit would dramatically reduce the span lengths for higher
strength concrete.
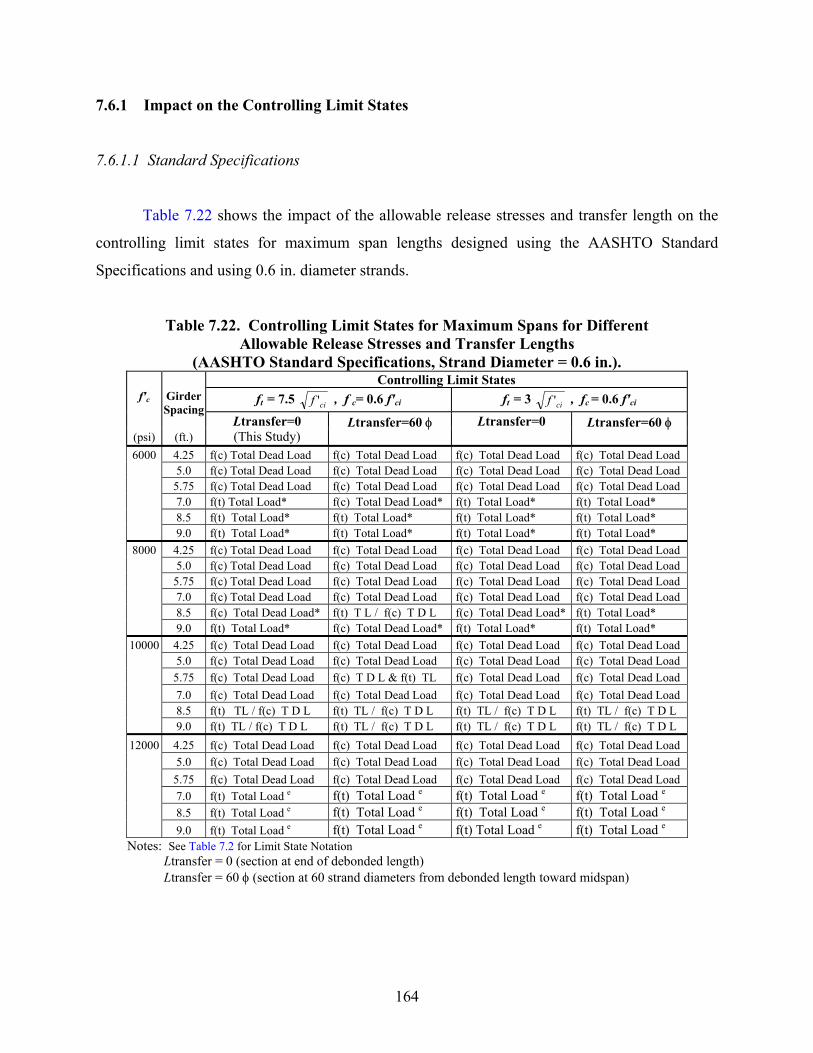
164
7.6.1 Impact on the Controlling Limit States
7.6.1.1 Standard Specifications
Table 7.22 shows the impact of the allowable release stresses and transfer length on the
controlling limit states for maximum span lengths designed using the AASHTO Standard
Specifications and using 0.6 in. diameter strands.
Table 7.22. Controlling Limit States for Maximum Spans for Different Allowable Release Stresses and Transfer Lengths
(AASHTO Standard Specifications, Strand Diameter = 0.6 in.). Controlling Limit States
ft = 7.5 cif ' , f c= 0.6 f'ci ft = 3 cif ' , fc = 0.6 f'ci f'c
(psi)
Girder Spacing
(ft.)
Ltransfer=0 (This Study)
Ltransfer=60 φ
Ltransfer=0
Ltransfer=60 φ
6000 4.25 f(c) Total Dead Load f(c) Total Dead Load f(c) Total Dead Load f(c) Total Dead Load 5.0 f(c) Total Dead Load f(c) Total Dead Load f(c) Total Dead Load f(c) Total Dead Load
5.75 f(c) Total Dead Load f(c) Total Dead Load f(c) Total Dead Load f(c) Total Dead Load 7.0 f(t) Total Load* f(c) Total Dead Load* f(t) Total Load* f(t) Total Load* 8.5 f(t) Total Load* f(t) Total Load* f(t) Total Load* f(t) Total Load* 9.0 f(t) Total Load* f(t) Total Load* f(t) Total Load* f(t) Total Load*
8000 4.25 f(c) Total Dead Load f(c) Total Dead Load f(c) Total Dead Load f(c) Total Dead Load 5.0 f(c) Total Dead Load f(c) Total Dead Load f(c) Total Dead Load f(c) Total Dead Load 5.75 f(c) Total Dead Load f(c) Total Dead Load f(c) Total Dead Load f(c) Total Dead Load 7.0 f(c) Total Dead Load f(c) Total Dead Load f(c) Total Dead Load f(c) Total Dead Load 8.5 f(c) Total Dead Load* f(t) T L / f(c) T D L f(c) Total Dead Load* f(t) Total Load* 9.0 f(t) Total Load* f(c) Total Dead Load* f(t) Total Load* f(t) Total Load*
10000 4.25 f(c) Total Dead Load f(c) Total Dead Load f(c) Total Dead Load f(c) Total Dead Load 5.0 f(c) Total Dead Load f(c) Total Dead Load f(c) Total Dead Load f(c) Total Dead Load 5.75 f(c) Total Dead Load f(c) T D L & f(t) TL f(c) Total Dead Load f(c) Total Dead Load 7.0 f(c) Total Dead Load f(c) Total Dead Load f(c) Total Dead Load f(c) Total Dead Load 8.5 f(t) TL / f(c) T D L f(t) TL / f(c) T D L f(t) TL / f(c) T D L f(t) TL / f(c) T D L 9.0 f(t) TL / f(c) T D L f(t) TL / f(c) T D L f(t) TL / f(c) T D L f(t) TL / f(c) T D L
12000 4.25 f(c) Total Dead Load f(c) Total Dead Load f(c) Total Dead Load f(c) Total Dead Load 5.0 f(c) Total Dead Load f(c) Total Dead Load f(c) Total Dead Load f(c) Total Dead Load 5.75 f(c) Total Dead Load f(c) Total Dead Load f(c) Total Dead Load f(c) Total Dead Load 7.0 f(t) Total Load e f(t) Total Load e f(t) Total Load e f(t) Total Load e 8.5 f(t) Total Load e f(t) Total Load e f(t) Total Load e f(t) Total Load e 9.0 f(t) Total Load e f(t) Total Load e f(t) Total Load e f(t) Total Load e
Notes: See Table 7.2 for Limit State Notation Ltransfer = 0 (section at end of debonded length) Ltransfer = 60 φ (section at 60 strand diameters from debonded length toward midspan)
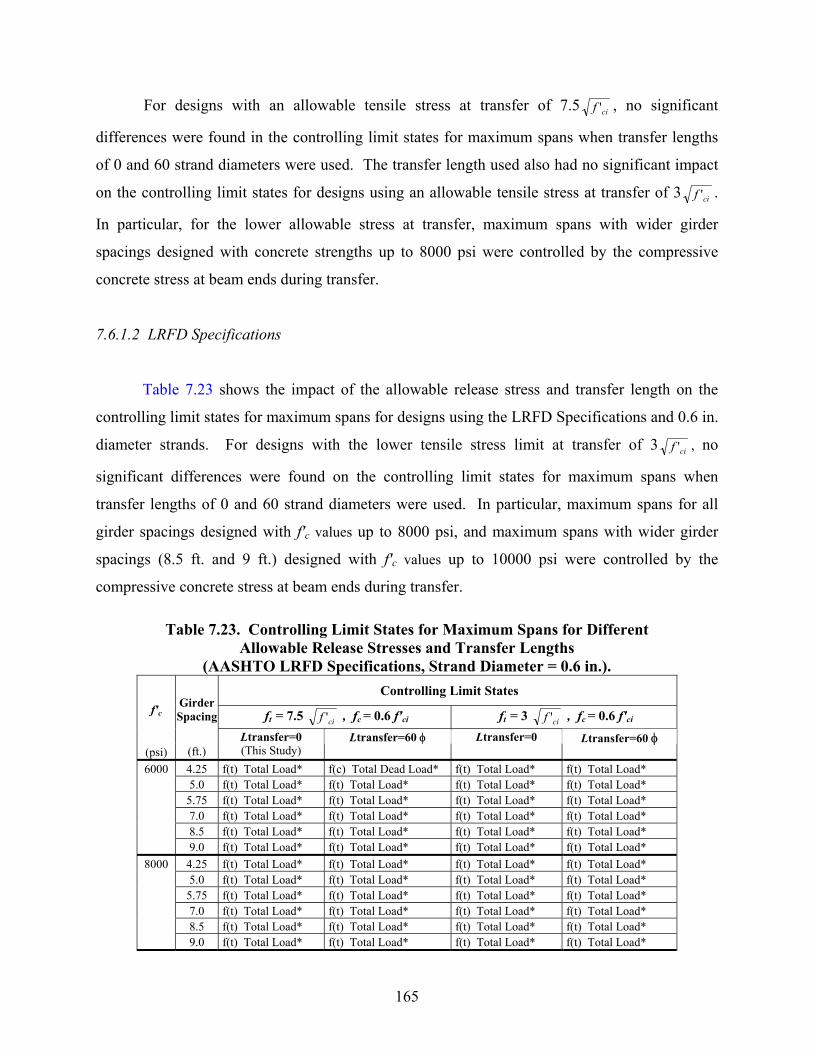
165
For designs with an allowable tensile stress at transfer of 7.5 cif ' , no significant
differences were found in the controlling limit states for maximum spans when transfer lengths
of 0 and 60 strand diameters were used. The transfer length used also had no significant impact
on the controlling limit states for designs using an allowable tensile stress at transfer of 3 cif ' .
In particular, for the lower allowable stress at transfer, maximum spans with wider girder
spacings designed with concrete strengths up to 8000 psi were controlled by the compressive
concrete stress at beam ends during transfer.
7.6.1.2 LRFD Specifications
Table 7.23 shows the impact of the allowable release stress and transfer length on the
controlling limit states for maximum spans for designs using the LRFD Specifications and 0.6 in.
diameter strands. For designs with the lower tensile stress limit at transfer of 3 cif ' , no
significant differences were found on the controlling limit states for maximum spans when
transfer lengths of 0 and 60 strand diameters were used. In particular, maximum spans for all
girder spacings designed with f'c values up to 8000 psi, and maximum spans with wider girder
spacings (8.5 ft. and 9 ft.) designed with f'c values up to 10000 psi were controlled by the
compressive concrete stress at beam ends during transfer.
Table 7.23. Controlling Limit States for Maximum Spans for Different Allowable Release Stresses and Transfer Lengths
(AASHTO LRFD Specifications, Strand Diameter = 0.6 in.). Controlling Limit States
ft = 7.5 cif ' , fc = 0.6 f'ci ft = 3 cif ' , fc = 0.6 f'ci f'c
Girder Spacing
(psi) (ft.) Ltransfer=0 (This Study)
Ltransfer=60 φ
Ltransfer=0
Ltransfer=60 φ
6000 4.25 f(t) Total Load* f(c) Total Dead Load* f(t) Total Load* f(t) Total Load* 5.0 f(t) Total Load* f(t) Total Load* f(t) Total Load* f(t) Total Load* 5.75 f(t) Total Load* f(t) Total Load* f(t) Total Load* f(t) Total Load* 7.0 f(t) Total Load* f(t) Total Load* f(t) Total Load* f(t) Total Load* 8.5 f(t) Total Load* f(t) Total Load* f(t) Total Load* f(t) Total Load* 9.0 f(t) Total Load* f(t) Total Load* f(t) Total Load* f(t) Total Load*
8000 4.25 f(t) Total Load* f(t) Total Load* f(t) Total Load* f(t) Total Load* 5.0 f(t) Total Load* f(t) Total Load* f(t) Total Load* f(t) Total Load* 5.75 f(t) Total Load* f(t) Total Load* f(t) Total Load* f(t) Total Load* 7.0 f(t) Total Load* f(t) Total Load* f(t) Total Load* f(t) Total Load* 8.5 f(t) Total Load* f(t) Total Load* f(t) Total Load* f(t) Total Load* 9.0 f(t) Total Load* f(t) Total Load* f(t) Total Load* f(t) Total Load*
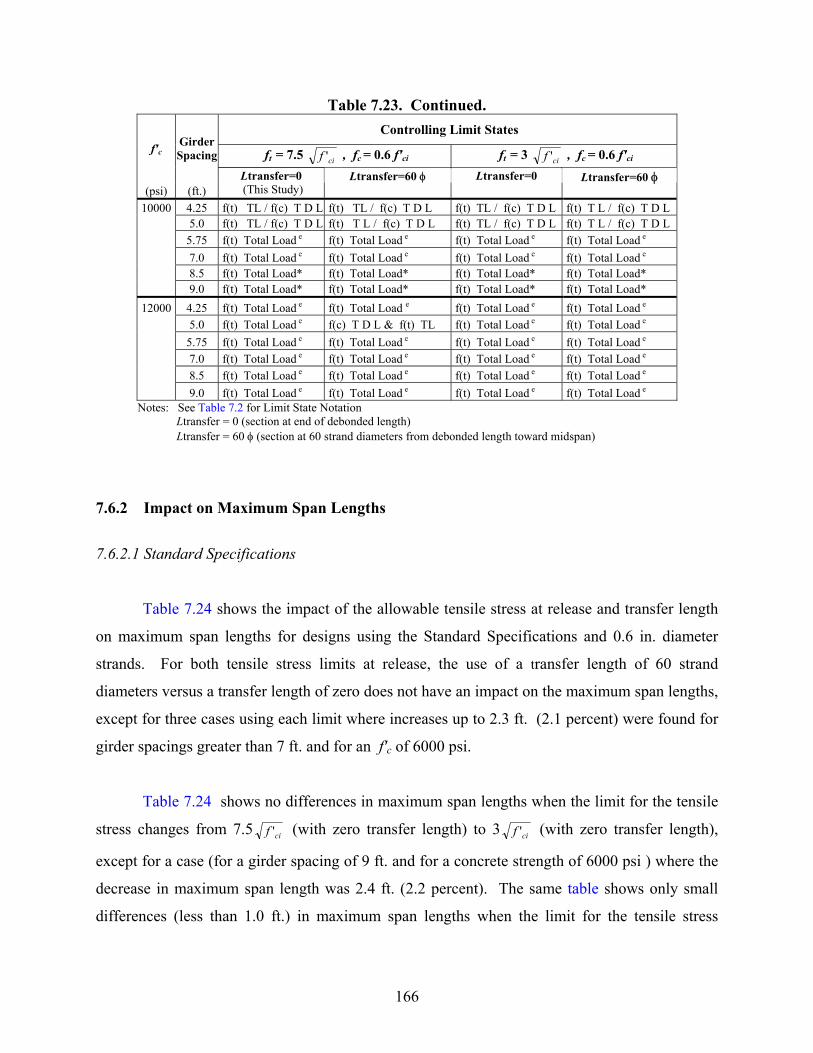
166
Table 7.23. Continued. Controlling Limit States
ft = 7.5 cif ' , fc = 0.6 f'ci ft = 3 cif ' , fc = 0.6 f'ci f'c
Girder Spacing
(psi) (ft.) Ltransfer=0 (This Study)
Ltransfer=60 φ
Ltransfer=0
Ltransfer=60 φ
10000 4.25 f(t) TL / f(c) T D L f(t) TL / f(c) T D L f(t) TL / f(c) T D L f(t) T L / f(c) T D L 5.0 f(t) TL / f(c) T D L f(t) T L / f(c) T D L f(t) TL / f(c) T D L f(t) T L / f(c) T D L 5.75 f(t) Total Load e f(t) Total Load e f(t) Total Load e f(t) Total Load e 7.0 f(t) Total Load e f(t) Total Load e f(t) Total Load e f(t) Total Load e 8.5 f(t) Total Load* f(t) Total Load* f(t) Total Load* f(t) Total Load* 9.0 f(t) Total Load* f(t) Total Load* f(t) Total Load* f(t) Total Load*
12000 4.25 f(t) Total Load e f(t) Total Load e f(t) Total Load e f(t) Total Load e 5.0 f(t) Total Load e f(c) T D L & f(t) TL f(t) Total Load e f(t) Total Load e 5.75 f(t) Total Load e f(t) Total Load e f(t) Total Load e f(t) Total Load e 7.0 f(t) Total Load e f(t) Total Load e f(t) Total Load e f(t) Total Load e 8.5 f(t) Total Load e f(t) Total Load e f(t) Total Load e f(t) Total Load e 9.0 f(t) Total Load e f(t) Total Load e f(t) Total Load e f(t) Total Load e
Notes: See Table 7.2 for Limit State Notation Ltransfer = 0 (section at end of debonded length) Ltransfer = 60 φ (section at 60 strand diameters from debonded length toward midspan)
7.6.2 Impact on Maximum Span Lengths
7.6.2.1 Standard Specifications
Table 7.24 shows the impact of the allowable tensile stress at release and transfer length
on maximum span lengths for designs using the Standard Specifications and 0.6 in. diameter
strands. For both tensile stress limits at release, the use of a transfer length of 60 strand
diameters versus a transfer length of zero does not have an impact on the maximum span lengths,
except for three cases using each limit where increases up to 2.3 ft. (2.1 percent) were found for
girder spacings greater than 7 ft. and for an f'c of 6000 psi.
Table 7.24 shows no differences in maximum span lengths when the limit for the tensile
stress changes from 7.5 cif ' (with zero transfer length) to 3 cif ' (with zero transfer length),
except for a case (for a girder spacing of 9 ft. and for a concrete strength of 6000 psi ) where the
decrease in maximum span length was 2.4 ft. (2.2 percent). The same table shows only small
differences (less than 1.0 ft.) in maximum span lengths when the limit for the tensile stress
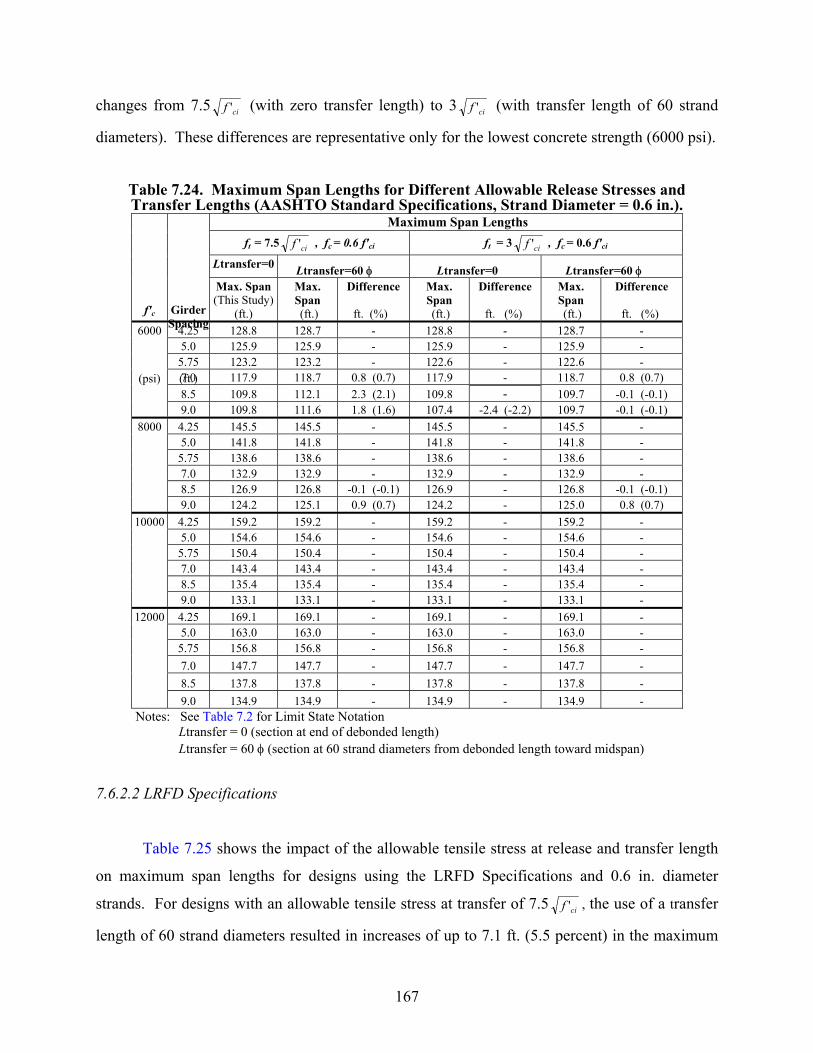
167
changes from 7.5 cif ' (with zero transfer length) to 3 cif ' (with transfer length of 60 strand
diameters). These differences are representative only for the lowest concrete strength (6000 psi).
Table 7.24. Maximum Span Lengths for Different Allowable Release Stresses and Transfer Lengths (AASHTO Standard Specifications, Strand Diameter = 0.6 in.).
Maximum Span Lengths ft = 7.5 cif ' , fc = 0.6 f'ci ft = 3 cif ' , fc = 0.6 f'ci
Ltransfer=0 Ltransfer=60 φ Ltransfer=0 Ltransfer=60 φ
f'c
(psi)
Girder Spacing
(ft.)
Max. Span (This Study)
(ft.)
Max. Span (ft.)
Difference
ft. (%)
Max. Span (ft.)
Difference
ft. (%)
Max. Span (ft.)
Difference
ft. (%) 6000 4.25 128.8 128.7 - 128.8 - 128.7 -
5.0 125.9 125.9 - 125.9 - 125.9 - 5.75 123.2 123.2 - 122.6 - 122.6 - 7.0 117.9 118.7 0.8 (0.7) 117.9 - 118.7 0.8 (0.7) 8.5 109.8 112.1 2.3 (2.1) 109.8 - 109.7 -0.1 (-0.1) 9.0 109.8 111.6 1.8 (1.6) 107.4 -2.4 (-2.2) 109.7 -0.1 (-0.1)
8000 4.25 145.5 145.5 - 145.5 - 145.5 - 5.0 141.8 141.8 - 141.8 - 141.8 - 5.75 138.6 138.6 - 138.6 - 138.6 - 7.0 132.9 132.9 - 132.9 - 132.9 - 8.5 126.9 126.8 -0.1 (-0.1) 126.9 - 126.8 -0.1 (-0.1) 9.0 124.2 125.1 0.9 (0.7) 124.2 - 125.0 0.8 (0.7)
10000 4.25 159.2 159.2 - 159.2 - 159.2 - 5.0 154.6 154.6 - 154.6 - 154.6 - 5.75 150.4 150.4 - 150.4 - 150.4 - 7.0 143.4 143.4 - 143.4 - 143.4 - 8.5 135.4 135.4 - 135.4 - 135.4 - 9.0 133.1 133.1 - 133.1 - 133.1 -
12000 4.25 169.1 169.1 - 169.1 - 169.1 - 5.0 163.0 163.0 - 163.0 - 163.0 - 5.75 156.8 156.8 - 156.8 - 156.8 - 7.0 147.7 147.7 - 147.7 - 147.7 - 8.5 137.8 137.8 - 137.8 - 137.8 - 9.0 134.9 134.9 - 134.9 - 134.9 -
Notes: See Table 7.2 for Limit State Notation Ltransfer = 0 (section at end of debonded length) Ltransfer = 60 φ (section at 60 strand diameters from debonded length toward midspan)
7.6.2.2 LRFD Specifications
Table 7.25 shows the impact of the allowable tensile stress at release and transfer length
on maximum span lengths for designs using the LRFD Specifications and 0.6 in. diameter
strands. For designs with an allowable tensile stress at transfer of 7.5 cif ' , the use of a transfer
length of 60 strand diameters resulted in increases of up to 7.1 ft. (5.5 percent) in the maximum
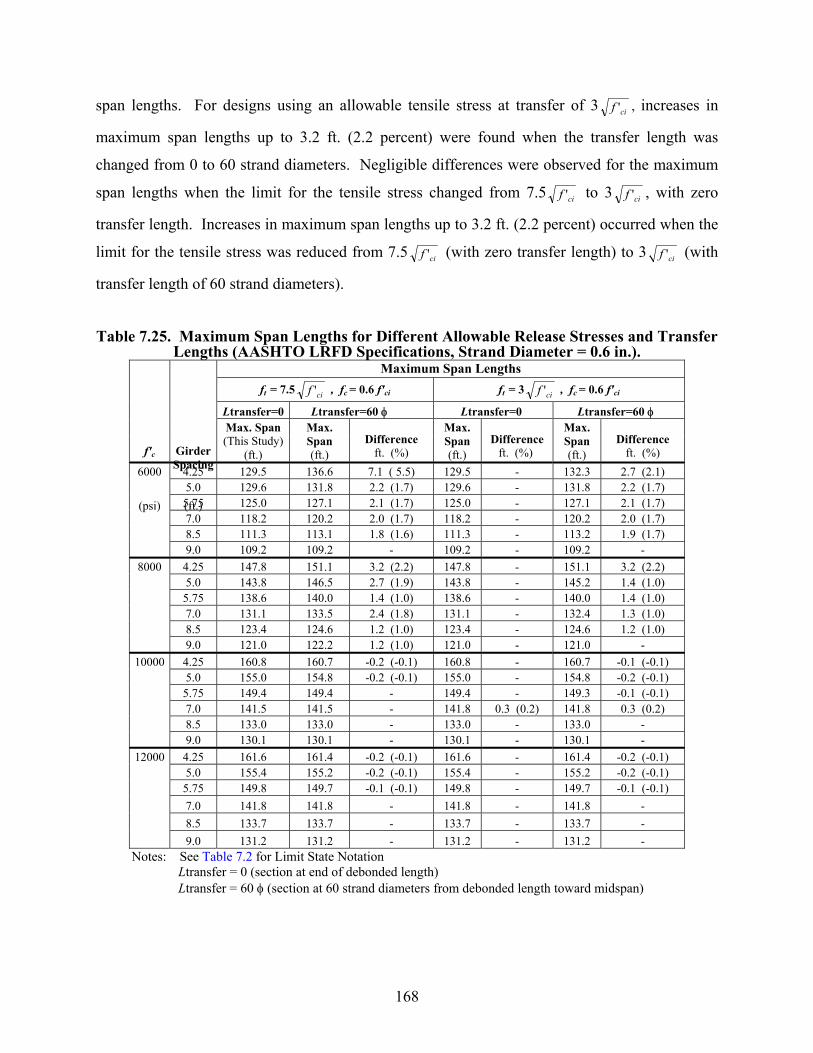
168
span lengths. For designs using an allowable tensile stress at transfer of 3 cif ' , increases in
maximum span lengths up to 3.2 ft. (2.2 percent) were found when the transfer length was
changed from 0 to 60 strand diameters. Negligible differences were observed for the maximum
span lengths when the limit for the tensile stress changed from 7.5 cif ' to 3 cif ' , with zero
transfer length. Increases in maximum span lengths up to 3.2 ft. (2.2 percent) occurred when the
limit for the tensile stress was reduced from 7.5 cif ' (with zero transfer length) to 3 cif ' (with
transfer length of 60 strand diameters).
Table 7.25. Maximum Span Lengths for Different Allowable Release Stresses and Transfer
Lengths (AASHTO LRFD Specifications, Strand Diameter = 0.6 in.). Maximum Span Lengths
ft = 7.5 cif ' , fc = 0.6 f'ci ft = 3 cif ' , fc = 0.6 f'ci
Ltransfer=0 Ltransfer=60 φ Ltransfer=0 Ltransfer=60 φ
f'c
(psi)
Girder Spacing
(ft.)
Max. Span (This Study)
(ft.)
Max. Span (ft.)
Difference ft. (%)
Max. Span (ft.)
Difference ft. (%)
Max. Span (ft.)
Difference ft. (%)
6000 4.25 129.5 136.6 7.1 ( 5.5) 129.5 - 132.3 2.7 (2.1) 5.0 129.6 131.8 2.2 (1.7) 129.6 - 131.8 2.2 (1.7) 5.75 125.0 127.1 2.1 (1.7) 125.0 - 127.1 2.1 (1.7) 7.0 118.2 120.2 2.0 (1.7) 118.2 - 120.2 2.0 (1.7) 8.5 111.3 113.1 1.8 (1.6) 111.3 - 113.2 1.9 (1.7) 9.0 109.2 109.2 - 109.2 - 109.2 -
8000 4.25 147.8 151.1 3.2 (2.2) 147.8 - 151.1 3.2 (2.2) 5.0 143.8 146.5 2.7 (1.9) 143.8 - 145.2 1.4 (1.0) 5.75 138.6 140.0 1.4 (1.0) 138.6 - 140.0 1.4 (1.0) 7.0 131.1 133.5 2.4 (1.8) 131.1 - 132.4 1.3 (1.0) 8.5 123.4 124.6 1.2 (1.0) 123.4 - 124.6 1.2 (1.0) 9.0 121.0 122.2 1.2 (1.0) 121.0 - 121.0 -
10000 4.25 160.8 160.7 -0.2 (-0.1) 160.8 - 160.7 -0.1 (-0.1) 5.0 155.0 154.8 -0.2 (-0.1) 155.0 - 154.8 -0.2 (-0.1) 5.75 149.4 149.4 - 149.4 - 149.3 -0.1 (-0.1) 7.0 141.5 141.5 - 141.8 0.3 (0.2) 141.8 0.3 (0.2) 8.5 133.0 133.0 - 133.0 - 133.0 - 9.0 130.1 130.1 - 130.1 - 130.1 -
12000 4.25 161.6 161.4 -0.2 (-0.1) 161.6 - 161.4 -0.2 (-0.1) 5.0 155.4 155.2 -0.2 (-0.1) 155.4 - 155.2 -0.2 (-0.1) 5.75 149.8 149.7 -0.1 (-0.1) 149.8 - 149.7 -0.1 (-0.1) 7.0 141.8 141.8 - 141.8 - 141.8 - 8.5 133.7 133.7 - 133.7 - 133.7 - 9.0 131.2 131.2 - 131.2 - 131.2 -
Notes: See Table 7.2 for Limit State Notation Ltransfer = 0 (section at end of debonded length) Ltransfer = 60 φ (section at 60 strand diameters from debonded length toward midspan)
169
7.7 EFFECT OF ALLOWABLE TENSILE STRESS AT SERVICE
Prior to completion of Phase 3 of this project (Hueste et al. 2003c), this study conducted a
preliminary assessment of the impact of revising critical design criteria with the objective of
increasing the economy of HSC prestressed girders. As noted earlier, current specifications
provide allowable stresses that were developed based on the mechanical properties of NSC of
6000 psi or less. These values that are traditionally conservative for standard designs using
NSC may not be appropriate for HSC designs. Because prestressed concrete design is often
governed by the allowable stresses, the effects of the allowable stresses on the required number
of strands and, consequently, on the span capability were studied.
The results of the parametric study showed that the allowable tensile stress limit is critical
because it controls the designs (number of strands required) for most of the cases for longer
spans. Based on review of current allowable stresses (see Section 2.5) and considering the HSC
Louetta Bridge design (Ralls 1995), an allowable tensile stress of 7.5 cf ' (where f 'c is in psi
units) was selected for this preliminary assessment. This stress limit can also be compared to the
modulus of rupture for HSC determined in Phase 1 of this study (Hueste et al. 2003b), which was
found to have a best-fit equation of 10 cf ' , with a lower bound value of about 8 cf ' . Note that
Phase 3 focused on assessing the impact on field curing conditions on the compressive strength
and modulus of rupture of HSC (Hueste et al. 2002d). However, these results were not available
at the time this study took place.
The parametric study showed that HSC prestressed bridge girder designs are often
controlled by the compressive stress limits. In addition, Phase 1 of this study showed that for
HSC produced by Texas precasters, the actual concrete compressive strength at service is
typically greater than that specified, where the ratio of the actual to specified f'c ranged from 1.01
to 1.89 (Hueste et al. 2003b). However, increases in the compressive stress limits were not
selected for evaluation in this study, and the allowable compressive stress was maintained as
0.45 f'c as specified in the LRFD Specifications and in ACI 318-02. The reason for this is that
the current limits for the compressive stresses were established to limit excessive creep, camber,
or other local strains. The compressive stress limits for sustained loads (0.4 f'c to 0.45 f'c) are
170
generally in the linear range of behavior for NSC. An increase in the stress limit to 0.6 f'c is
allowed for load cases including transient loads. These limits were developed for NSC, and
more studies are needed to evaluate whether these limits are applicable to HSC. Assuming that
the same coefficients are appropriate for the compressive stress limits for HSC prestressed
members, it is not conservative to assume an overstrength will be provided in the design phase
because production practices may change among precasters over time and this overstrength is not
a requirement. Potentially, the actual strength gain can be utilized by tailoring designs based on
strength data for a typical concrete mixture used by the selected precaster. However, the
precaster may not be identified in the initial design stage and so this may not always be practical.
7.7.1 Impact on the Controlling Limit States
Tables 7.26 through 7.31 provide controlling limit states for different allowable tensile
stresses at service for Type IV beams with spans from 90 ft. to maximum span lengths at 10 ft.
intervals. A separate table is provided for each girder spacing considered. Different concrete
classes are considered, and all cases are for 0.6 in. diameter strands with designs according to the
LRFD Specifications. The controlling limit states are defined as the limit state that dictates the
required number of strands or limits the maximum span.
Results showed that for shorter spans (in several cases up to 110 ft., and 120 ft., in one
case), allowing a higher tensile stress has an important impact on the ultimate strength of the
beams because increasing the tensile stress limit resulted in a reduction of the number of strands
required for a given span length. As girder spacings decrease and concrete strengths increase,
the flexural strength becomes more critical.
For a given longer span length, except for maximum span lengths, the use of ft =
7.5 cf ' resulted in designs that were controlled by the tensile stress limit, as was the case when
using ft = 6 cf ' . However, fewer strands were required when using the higher tensile stress
limit (see Sections 7.7.2 and 7.7.3).
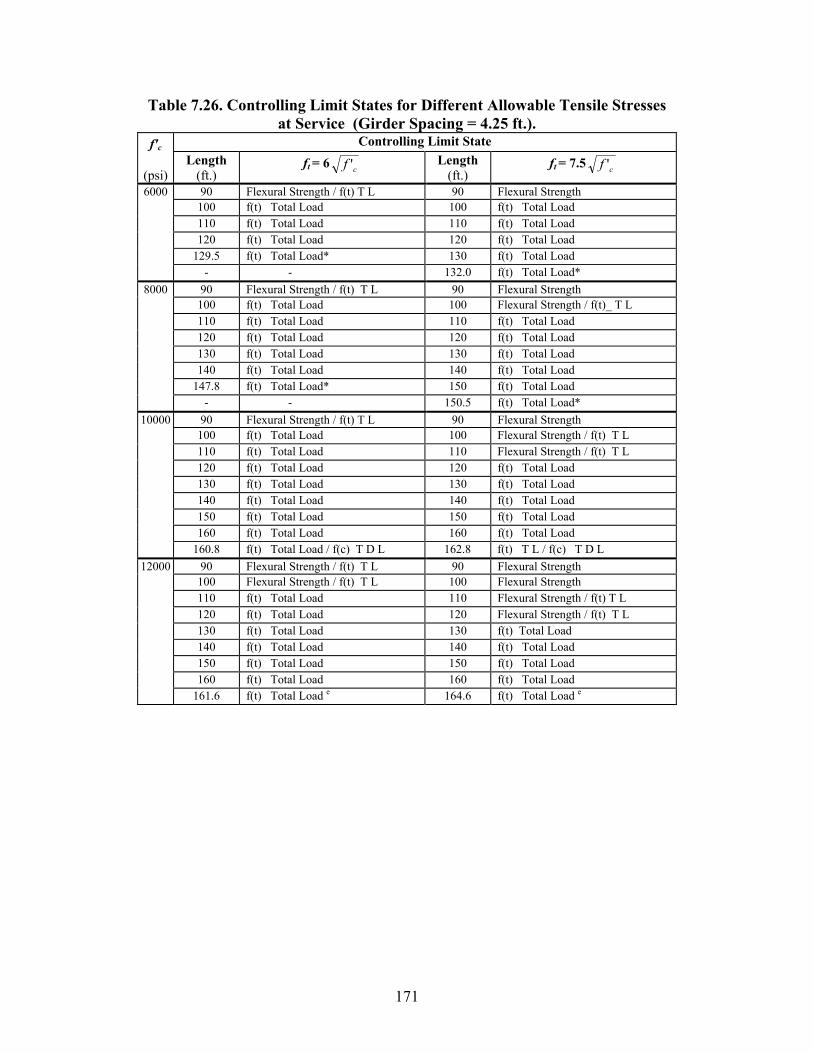
171
Table 7.26. Controlling Limit States for Different Allowable Tensile Stresses at Service (Girder Spacing = 4.25 ft.).
f'c Controlling Limit State
(psi) Length
(ft.) ft = 6 cf ' Length
(ft.) ft = 7.5 cf '
6000 90 Flexural Strength / f(t) T L 90 Flexural Strength 100 f(t) Total Load 100 f(t) Total Load 110 f(t) Total Load 110 f(t) Total Load 120 f(t) Total Load 120 f(t) Total Load 129.5 f(t) Total Load* 130 f(t) Total Load - - 132.0 f(t) Total Load*
8000 90 Flexural Strength / f(t) T L 90 Flexural Strength 100 f(t) Total Load 100 Flexural Strength / f(t)_ T L 110 f(t) Total Load 110 f(t) Total Load 120 f(t) Total Load 120 f(t) Total Load 130 f(t) Total Load 130 f(t) Total Load 140 f(t) Total Load 140 f(t) Total Load
147.8 f(t) Total Load* 150 f(t) Total Load - - 150.5 f(t) Total Load*
10000 90 Flexural Strength / f(t) T L 90 Flexural Strength 100 f(t) Total Load 100 Flexural Strength / f(t) T L 110 f(t) Total Load 110 Flexural Strength / f(t) T L 120 f(t) Total Load 120 f(t) Total Load 130 f(t) Total Load 130 f(t) Total Load 140 f(t) Total Load 140 f(t) Total Load 150 f(t) Total Load 150 f(t) Total Load 160 f(t) Total Load 160 f(t) Total Load 160.8 f(t) Total Load / f(c) T D L 162.8 f(t) T L / f(c) T D L
12000 90 Flexural Strength / f(t) T L 90 Flexural Strength 100 Flexural Strength / f(t) T L 100 Flexural Strength 110 f(t) Total Load 110 Flexural Strength / f(t) T L 120 f(t) Total Load 120 Flexural Strength / f(t) T L 130 f(t) Total Load 130 f(t) Total Load 140 f(t) Total Load 140 f(t) Total Load 150 f(t) Total Load 150 f(t) Total Load
160 f(t) Total Load 160 f(t) Total Load 161.6 f(t) Total Load e 164.6 f(t) Total Load e
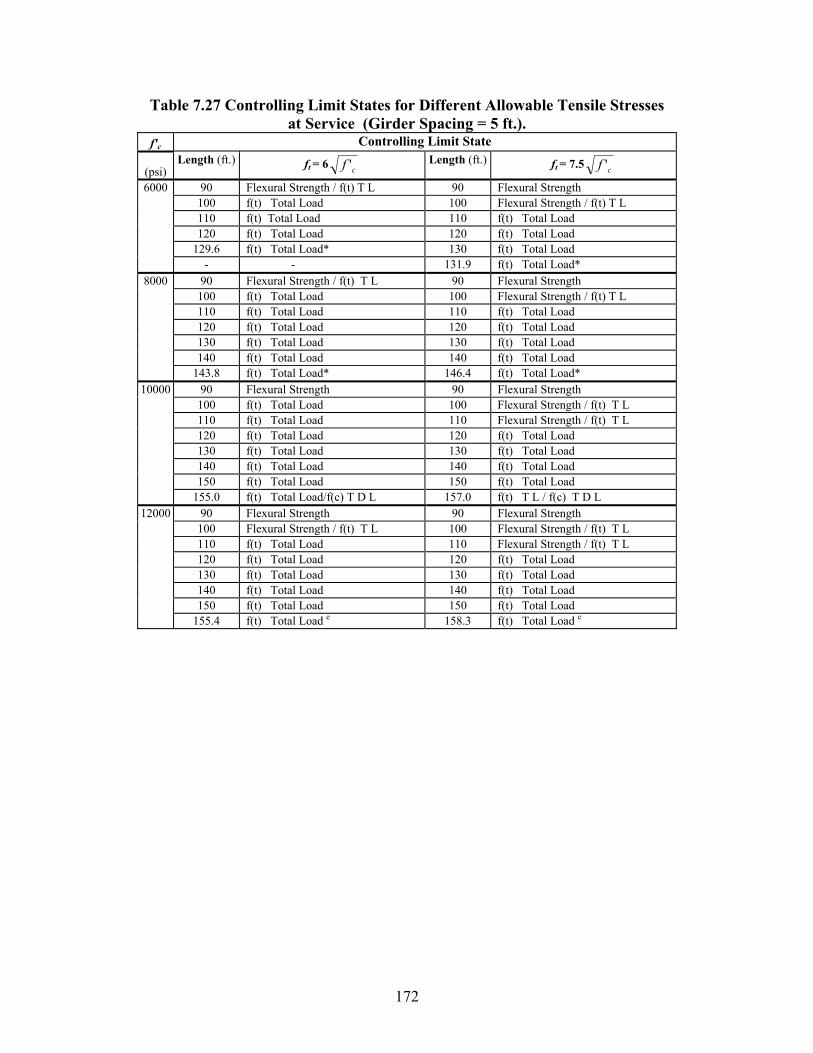
172
Table 7.27 Controlling Limit States for Different Allowable Tensile Stresses at Service (Girder Spacing = 5 ft.).
f'c Controlling Limit State
(psi) Length (ft.) ft = 6 cf ' Length (ft.) ft = 7.5 cf '
6000 90 Flexural Strength / f(t) T L 90 Flexural Strength 100 f(t) Total Load 100 Flexural Strength / f(t) T L 110 f(t) Total Load 110 f(t) Total Load 120 f(t) Total Load 120 f(t) Total Load 129.6 f(t) Total Load* 130 f(t) Total Load - - 131.9 f(t) Total Load*
8000 90 Flexural Strength / f(t) T L 90 Flexural Strength 100 f(t) Total Load 100 Flexural Strength / f(t) T L 110 f(t) Total Load 110 f(t) Total Load 120 f(t) Total Load 120 f(t) Total Load 130 f(t) Total Load 130 f(t) Total Load
140 f(t) Total Load 140 f(t) Total Load 143.8 f(t) Total Load* 146.4 f(t) Total Load*
10000 90 Flexural Strength 90 Flexural Strength 100 f(t) Total Load 100 Flexural Strength / f(t) T L 110 f(t) Total Load 110 Flexural Strength / f(t) T L 120 f(t) Total Load 120 f(t) Total Load 130 f(t) Total Load 130 f(t) Total Load 140 f(t) Total Load 140 f(t) Total Load 150 f(t) Total Load 150 f(t) Total Load 155.0 f(t) Total Load/f(c) T D L 157.0 f(t) T L / f(c) T D L
12000 90 Flexural Strength 90 Flexural Strength 100 Flexural Strength / f(t) T L 100 Flexural Strength / f(t) T L 110 f(t) Total Load 110 Flexural Strength / f(t) T L 120 f(t) Total Load 120 f(t) Total Load 130 f(t) Total Load 130 f(t) Total Load 140 f(t) Total Load 140 f(t) Total Load 150 f(t) Total Load 150 f(t) Total Load
155.4 f(t) Total Load e 158.3 f(t) Total Load e
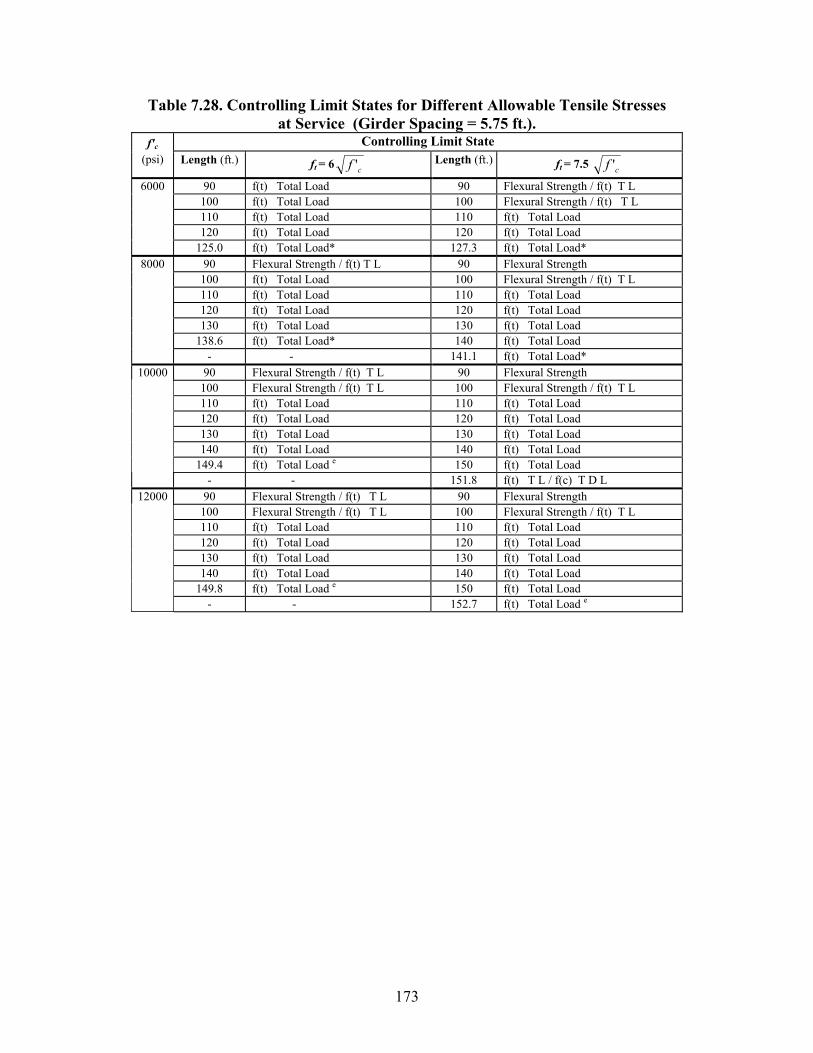
173
Table 7.28. Controlling Limit States for Different Allowable Tensile Stresses at Service (Girder Spacing = 5.75 ft.).
Controlling Limit State f'c (psi) Length (ft.) ft = 6 cf ' Length (ft.) ft = 7.5 cf '
6000 90 f(t) Total Load 90 Flexural Strength / f(t) T L 100 f(t) Total Load 100 Flexural Strength / f(t) T L 110 f(t) Total Load 110 f(t) Total Load 120 f(t) Total Load 120 f(t) Total Load 125.0 f(t) Total Load* 127.3 f(t) Total Load*
8000 90 Flexural Strength / f(t) T L 90 Flexural Strength 100 f(t) Total Load 100 Flexural Strength / f(t) T L 110 f(t) Total Load 110 f(t) Total Load 120 f(t) Total Load 120 f(t) Total Load 130 f(t) Total Load 130 f(t) Total Load
138.6 f(t) Total Load* 140 f(t) Total Load - - 141.1 f(t) Total Load*
10000 90 Flexural Strength / f(t) T L 90 Flexural Strength 100 Flexural Strength / f(t) T L 100 Flexural Strength / f(t) T L 110 f(t) Total Load 110 f(t) Total Load 120 f(t) Total Load 120 f(t) Total Load 130 f(t) Total Load 130 f(t) Total Load 140 f(t) Total Load 140 f(t) Total Load 149.4 f(t) Total Load e 150 f(t) Total Load - - 151.8 f(t) T L / f(c) T D L
12000 90 Flexural Strength / f(t) T L 90 Flexural Strength 100 Flexural Strength / f(t) T L 100 Flexural Strength / f(t) T L 110 f(t) Total Load 110 f(t) Total Load 120 f(t) Total Load 120 f(t) Total Load 130 f(t) Total Load 130 f(t) Total Load 140 f(t) Total Load 140 f(t) Total Load 149.8 f(t) Total Load e 150 f(t) Total Load
- - 152.7 f(t) Total Load e
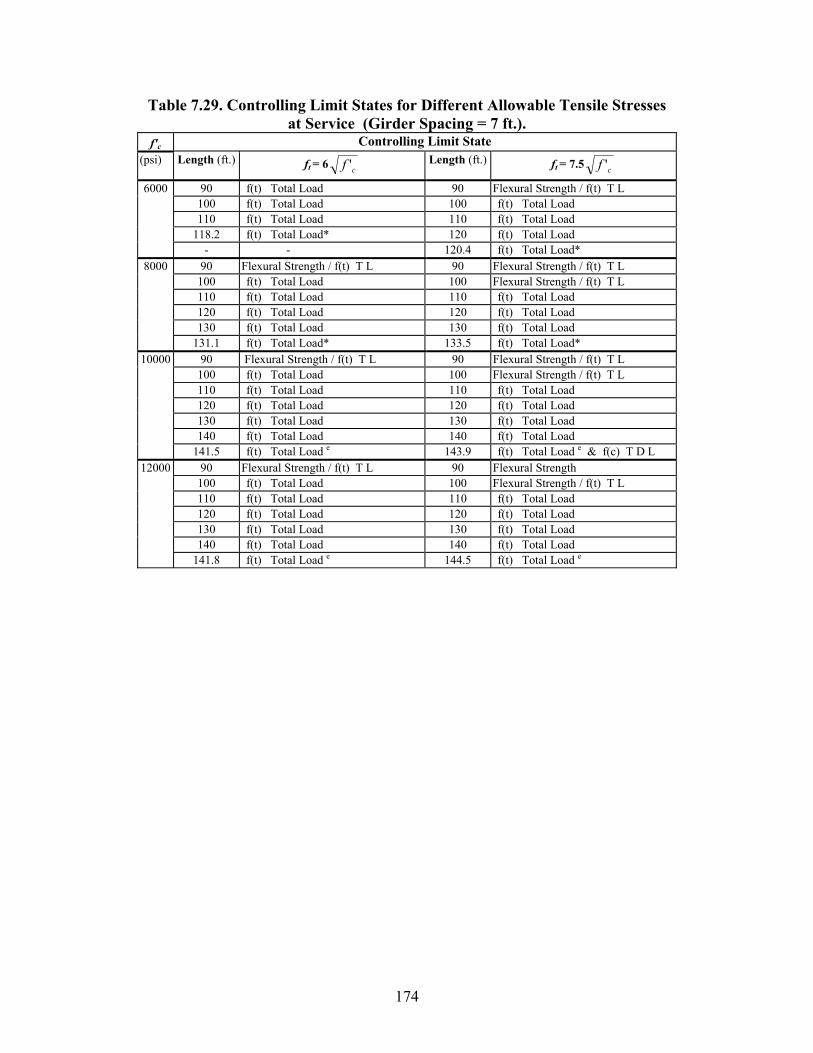
174
Table 7.29. Controlling Limit States for Different Allowable Tensile Stresses at Service (Girder Spacing = 7 ft.).
f'c Controlling Limit State (psi) Length (ft.) ft = 6 cf ' Length (ft.) ft = 7.5 cf '
6000 90 f(t) Total Load 90 Flexural Strength / f(t) T L 100 f(t) Total Load 100 f(t) Total Load 110 f(t) Total Load 110 f(t) Total Load 118.2 f(t) Total Load* 120 f(t) Total Load - - 120.4 f(t) Total Load*
8000 90 Flexural Strength / f(t) T L 90 Flexural Strength / f(t) T L 100 f(t) Total Load 100 Flexural Strength / f(t) T L 110 f(t) Total Load 110 f(t) Total Load 120 f(t) Total Load 120 f(t) Total Load 130 f(t) Total Load 130 f(t) Total Load
131.1 f(t) Total Load* 133.5 f(t) Total Load* 10000 90 Flexural Strength / f(t) T L 90 Flexural Strength / f(t) T L
100 f(t) Total Load 100 Flexural Strength / f(t) T L 110 f(t) Total Load 110 f(t) Total Load 120 f(t) Total Load 120 f(t) Total Load 130 f(t) Total Load 130 f(t) Total Load 140 f(t) Total Load 140 f(t) Total Load 141.5 f(t) Total Load e 143.9 f(t) Total Load e & f(c) T D L
12000 90 Flexural Strength / f(t) T L 90 Flexural Strength 100 f(t) Total Load 100 Flexural Strength / f(t) T L 110 f(t) Total Load 110 f(t) Total Load 120 f(t) Total Load 120 f(t) Total Load 130 f(t) Total Load 130 f(t) Total Load 140 f(t) Total Load 140 f(t) Total Load 141.8 f(t) Total Load e 144.5 f(t) Total Load e
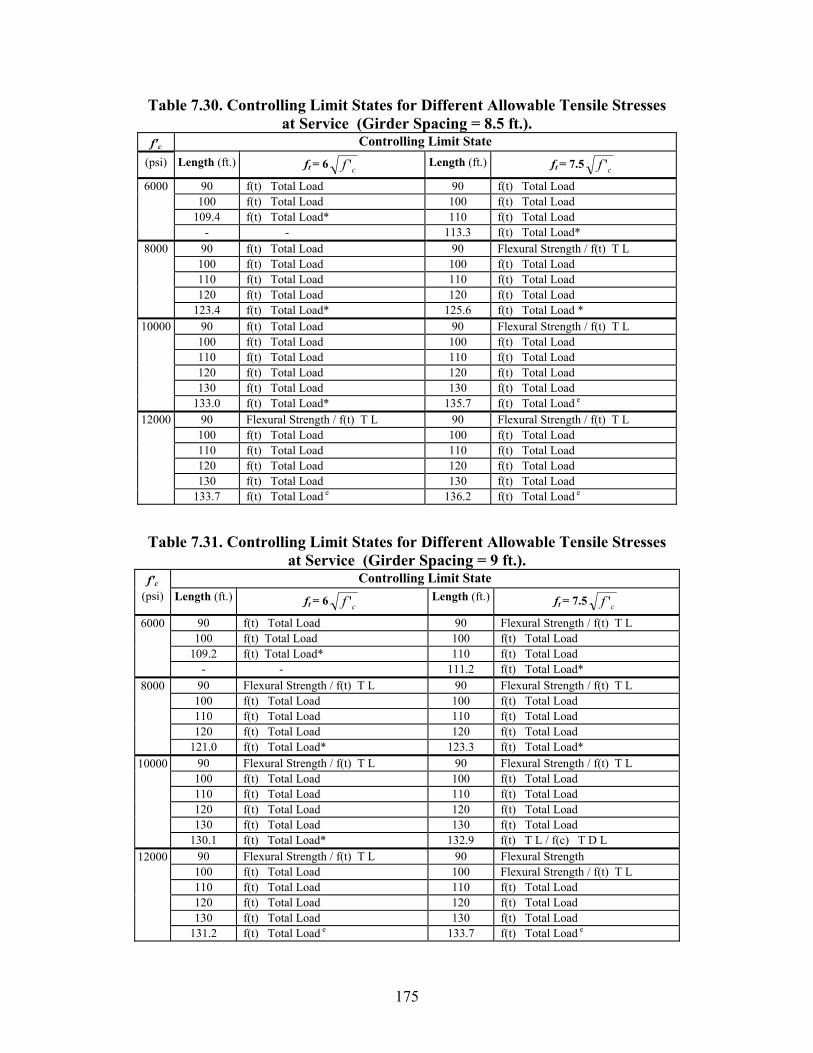
175
Table 7.30. Controlling Limit States for Different Allowable Tensile Stresses at Service (Girder Spacing = 8.5 ft.).
f'c Controlling Limit State (psi) Length (ft.) ft = 6 cf ' Length (ft.) ft = 7.5 cf '
6000 90 f(t) Total Load 90 f(t) Total Load 100 f(t) Total Load 100 f(t) Total Load 109.4 f(t) Total Load* 110 f(t) Total Load - - 113.3 f(t) Total Load*
8000 90 f(t) Total Load 90 Flexural Strength / f(t) T L 100 f(t) Total Load 100 f(t) Total Load 110 f(t) Total Load 110 f(t) Total Load 120 f(t) Total Load 120 f(t) Total Load 123.4 f(t) Total Load* 125.6 f(t) Total Load *
10000 90 f(t) Total Load 90 Flexural Strength / f(t) T L 100 f(t) Total Load 100 f(t) Total Load 110 f(t) Total Load 110 f(t) Total Load 120 f(t) Total Load 120 f(t) Total Load 130 f(t) Total Load 130 f(t) Total Load 133.0 f(t) Total Load* 135.7 f(t) Total Load e
12000 90 Flexural Strength / f(t) T L 90 Flexural Strength / f(t) T L 100 f(t) Total Load 100 f(t) Total Load 110 f(t) Total Load 110 f(t) Total Load 120 f(t) Total Load 120 f(t) Total Load 130 f(t) Total Load 130 f(t) Total Load 133.7 f(t) Total Load e 136.2 f(t) Total Load e
Table 7.31. Controlling Limit States for Different Allowable Tensile Stresses at Service (Girder Spacing = 9 ft.).
Controlling Limit State f'c (psi) Length (ft.) ft = 6 cf ' Length (ft.) ft = 7.5 cf '
6000 90 f(t) Total Load 90 Flexural Strength / f(t) T L 100 f(t) Total Load 100 f(t) Total Load 109.2 f(t) Total Load* 110 f(t) Total Load - - 111.2 f(t) Total Load*
8000 90 Flexural Strength / f(t) T L 90 Flexural Strength / f(t) T L 100 f(t) Total Load 100 f(t) Total Load 110 f(t) Total Load 110 f(t) Total Load 120 f(t) Total Load 120 f(t) Total Load 121.0 f(t) Total Load* 123.3 f(t) Total Load*
10000 90 Flexural Strength / f(t) T L 90 Flexural Strength / f(t) T L 100 f(t) Total Load 100 f(t) Total Load 110 f(t) Total Load 110 f(t) Total Load 120 f(t) Total Load 120 f(t) Total Load 130 f(t) Total Load 130 f(t) Total Load 130.1 f(t) Total Load* 132.9 f(t) T L / f(c) T D L
12000 90 Flexural Strength / f(t) T L 90 Flexural Strength 100 f(t) Total Load 100 Flexural Strength / f(t) T L 110 f(t) Total Load 110 f(t) Total Load 120 f(t) Total Load 120 f(t) Total Load 130 f(t) Total Load 130 f(t) Total Load 131.2 f(t) Total Load e 133.7 f(t) Total Load e
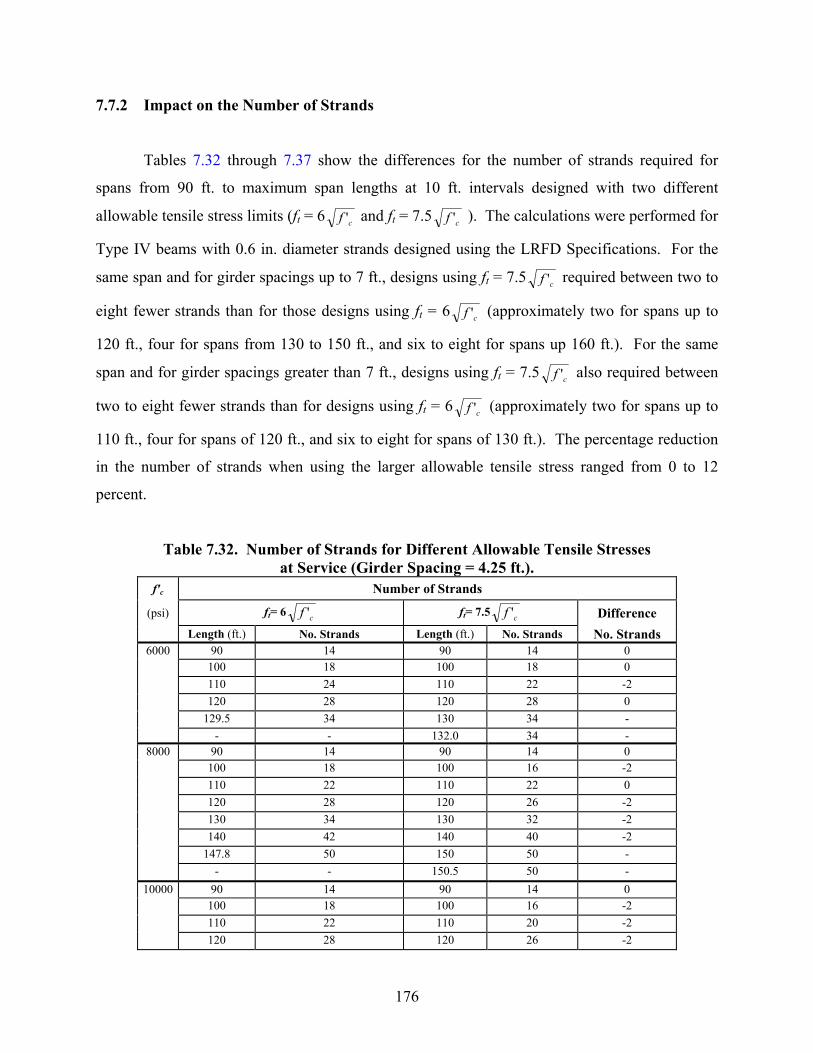
176
7.7.2 Impact on the Number of Strands
Tables 7.32 through 7.37 show the differences for the number of strands required for
spans from 90 ft. to maximum span lengths at 10 ft. intervals designed with two different
allowable tensile stress limits (ft = 6 cf ' and ft = 7.5 cf ' ). The calculations were performed for
Type IV beams with 0.6 in. diameter strands designed using the LRFD Specifications. For the
same span and for girder spacings up to 7 ft., designs using ft = 7.5 cf ' required between two to
eight fewer strands than for those designs using ft = 6 cf ' (approximately two for spans up to
120 ft., four for spans from 130 to 150 ft., and six to eight for spans up 160 ft.). For the same
span and for girder spacings greater than 7 ft., designs using ft = 7.5 cf ' also required between
two to eight fewer strands than for designs using ft = 6 cf ' (approximately two for spans up to
110 ft., four for spans of 120 ft., and six to eight for spans of 130 ft.). The percentage reduction
in the number of strands when using the larger allowable tensile stress ranged from 0 to 12
percent.
Table 7.32. Number of Strands for Different Allowable Tensile Stresses at Service (Girder Spacing = 4.25 ft.).
f'c Number of Strands
(psi) ft= 6 cf ' ft= 7.5 cf ' Difference Length (ft.) No. Strands Length (ft.) No. Strands No. Strands
6000 90 14 90 14 0 100 18 100 18 0 110 24 110 22 -2 120 28 120 28 0 129.5 34 130 34 - - - 132.0 34 -
8000 90 14 90 14 0 100 18 100 16 -2 110 22 110 22 0 120 28 120 26 -2 130 34 130 32 -2 140 42 140 40 -2 147.8 50 150 50 - - - 150.5 50 -
10000 90 14 90 14 0 100 18 100 16 -2 110 22 110 20 -2 120 28 120 26 -2
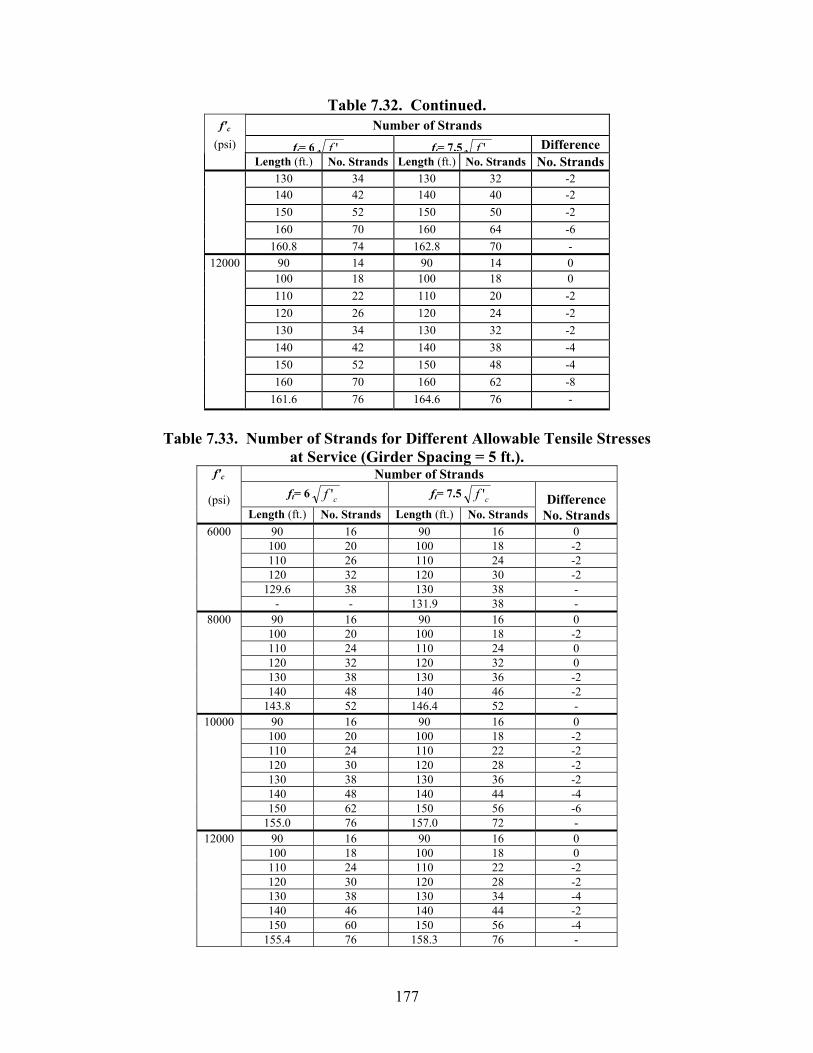
177
Table 7.32. Continued. f'c Number of Strands
(psi) ft= 6 f ' ft= 7.5 f ' Difference Length (ft.) No. Strands Length (ft.) No. Strands No. Strands 130 34 130 32 -2 140 42 140 40 -2 150 52 150 50 -2 160 70 160 64 -6 160.8 74 162.8 70 -
12000 90 14 90 14 0 100 18 100 18 0 110 22 110 20 -2 120 26 120 24 -2 130 34 130 32 -2 140 42 140 38 -4 150 52 150 48 -4 160 70 160 62 -8 161.6 76 164.6 76 -
Table 7.33. Number of Strands for Different Allowable Tensile Stresses
at Service (Girder Spacing = 5 ft.). f'c Number of Strands
(psi) ft= 6 cf ' ft= 7.5 cf ' Difference Length (ft.) No. Strands Length (ft.) No. Strands No. Strands
6000 90 16 90 16 0 100 20 100 18 -2 110 26 110 24 -2 120 32 120 30 -2 129.6 38 130 38 - - - 131.9 38 -
8000 90 16 90 16 0 100 20 100 18 -2 110 24 110 24 0 120 32 120 32 0 130 38 130 36 -2 140 48 140 46 -2 143.8 52 146.4 52 -
10000 90 16 90 16 0 100 20 100 18 -2 110 24 110 22 -2 120 30 120 28 -2 130 38 130 36 -2 140 48 140 44 -4 150 62 150 56 -6 155.0 76 157.0 72 -
12000 90 16 90 16 0 100 18 100 18 0 110 24 110 22 -2 120 30 120 28 -2 130 38 130 34 -4 140 46 140 44 -2 150 60 150 56 -4 155.4 76 158.3 76 -
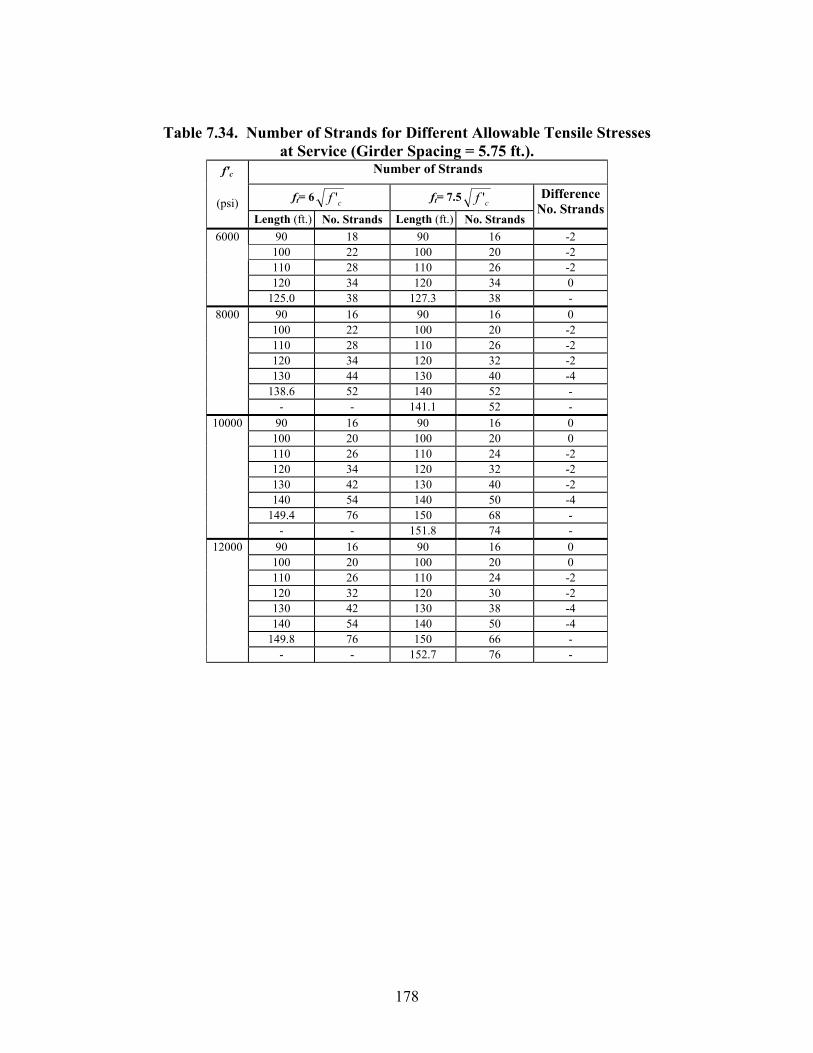
178
Table 7.34. Number of Strands for Different Allowable Tensile Stresses at Service (Girder Spacing = 5.75 ft.).
Number of Strands
ft= 6 cf ' ft= 7.5 cf '
f'c
(psi)
Length (ft.) No. Strands Length (ft.) No. Strands
Difference No. Strands
6000 90 18 90 16 -2 100 22 100 20 -2 110 28 110 26 -2 120 34 120 34 0 125.0 38 127.3 38 -
8000 90 16 90 16 0 100 22 100 20 -2 110 28 110 26 -2 120 34 120 32 -2 130 44 130 40 -4 138.6 52 140 52 - - - 141.1 52 -
10000 90 16 90 16 0 100 20 100 20 0 110 26 110 24 -2 120 34 120 32 -2 130 42 130 40 -2 140 54 140 50 -4 149.4 76 150 68 - - - 151.8 74 -
12000 90 16 90 16 0 100 20 100 20 0 110 26 110 24 -2 120 32 120 30 -2 130 42 130 38 -4 140 54 140 50 -4 149.8 76 150 66 - - - 152.7 76 -
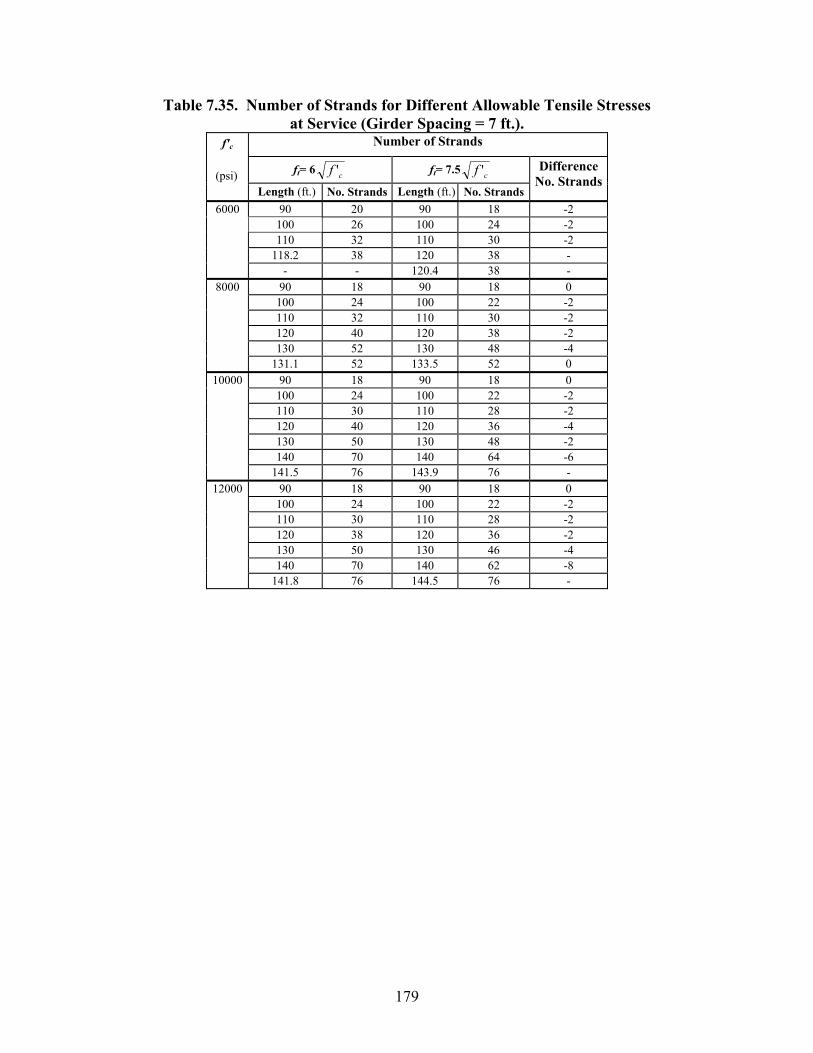
179
Table 7.35. Number of Strands for Different Allowable Tensile Stresses at Service (Girder Spacing = 7 ft.).
Number of Strands
ft= 6 cf ' ft= 7.5 cf '
f'c
(psi)
Length (ft.) No. Strands Length (ft.) No. Strands
Difference No. Strands
6000 90 20 90 18 -2 100 26 100 24 -2 110 32 110 30 -2 118.2 38 120 38 - - - 120.4 38 -
8000 90 18 90 18 0 100 24 100 22 -2 110 32 110 30 -2 120 40 120 38 -2 130 52 130 48 -4 131.1 52 133.5 52 0
10000 90 18 90 18 0 100 24 100 22 -2 110 30 110 28 -2 120 40 120 36 -4 130 50 130 48 -2 140 70 140 64 -6 141.5 76 143.9 76 -
12000 90 18 90 18 0 100 24 100 22 -2 110 30 110 28 -2 120 38 120 36 -2 130 50 130 46 -4 140 70 140 62 -8 141.8 76 144.5 76 -
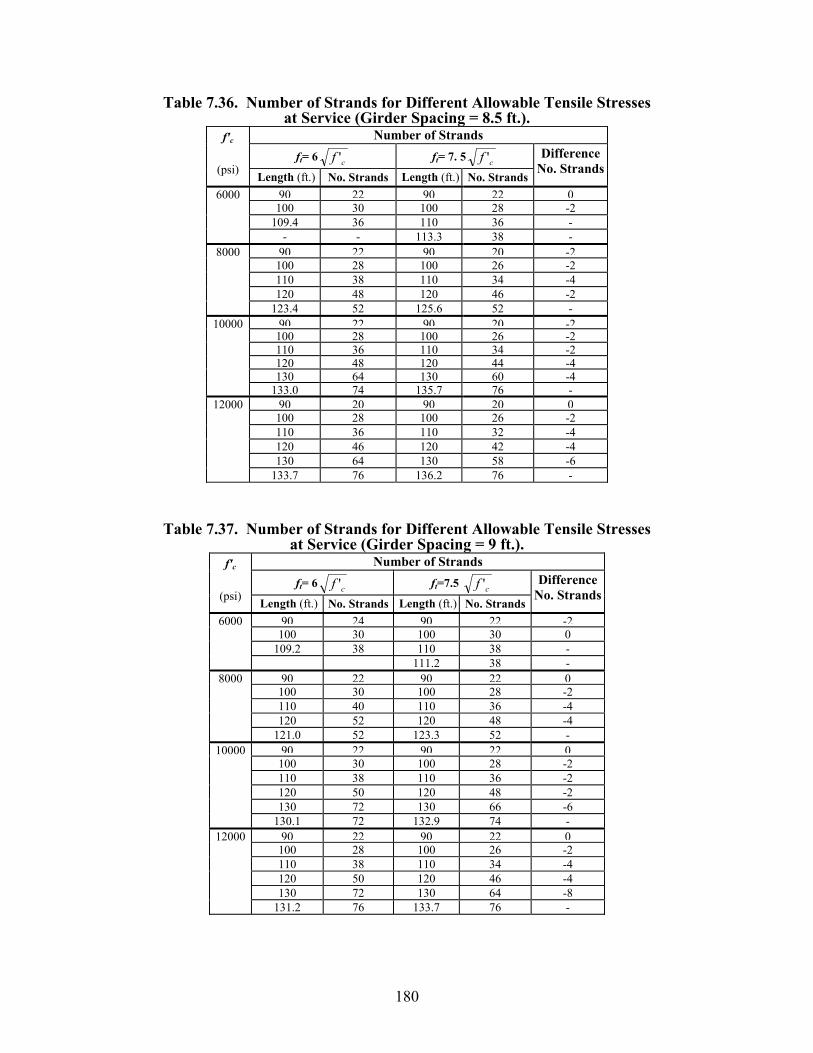
180
Table 7.36. Number of Strands for Different Allowable Tensile Stresses at Service (Girder Spacing = 8.5 ft.).
Number of Strandsft= 6 cf ' ft= 7. 5 cf '
f'c
(psi) Length (ft.) No. Strands Length (ft.) No. Strands
Difference No. Strands
90 22 90 22 0100 30 100 28 -2
109.4 36 110 36 -
6000
- - 113.3 38 - 90 22 90 20 -2100 28 100 26 -2 110 38 110 34 -4 120 48 120 46 -2
8000
123.4 52 125.6 52 - 90 22 90 20 -2100 28 100 26 -2 110 36 110 34 -2 120 48 120 44 -4 130 64 130 60 -4
10000
133.0 74 135.7 76 - 90 20 90 20 0100 28 100 26 -2 110 36 110 32 -4 120 46 120 42 -4 130 64 130 58 -6
12000
133.7 76 136.2 76 -
Table 7.37. Number of Strands for Different Allowable Tensile Stresses at Service (Girder Spacing = 9 ft.).
Number of Strandsft= 6 cf ' ft=7.5 cf '
f'c
(psi) Length (ft.) No. Strands Length (ft.) No. Strands
Difference No. Strands
90 24 90 22 -2100 30 100 30 0
109.2 38 110 38 -
6000
111.2 38 -90 22 90 22 0100 30 100 28 -2 110 40 110 36 -4 120 52 120 48 -4
8000
121.0 52 123.3 52 -90 22 90 22 0100 30 100 28 -2 110 38 110 36 -2 120 50 120 48 -2 130 72 130 66 -6
10000
130.1 72 132.9 74 -90 22 90 22 0100 28 100 26 -2 110 38 110 34 -4 120 50 120 46 -4 130 72 130 64 -8
12000
131.2 76 133.7 76 -
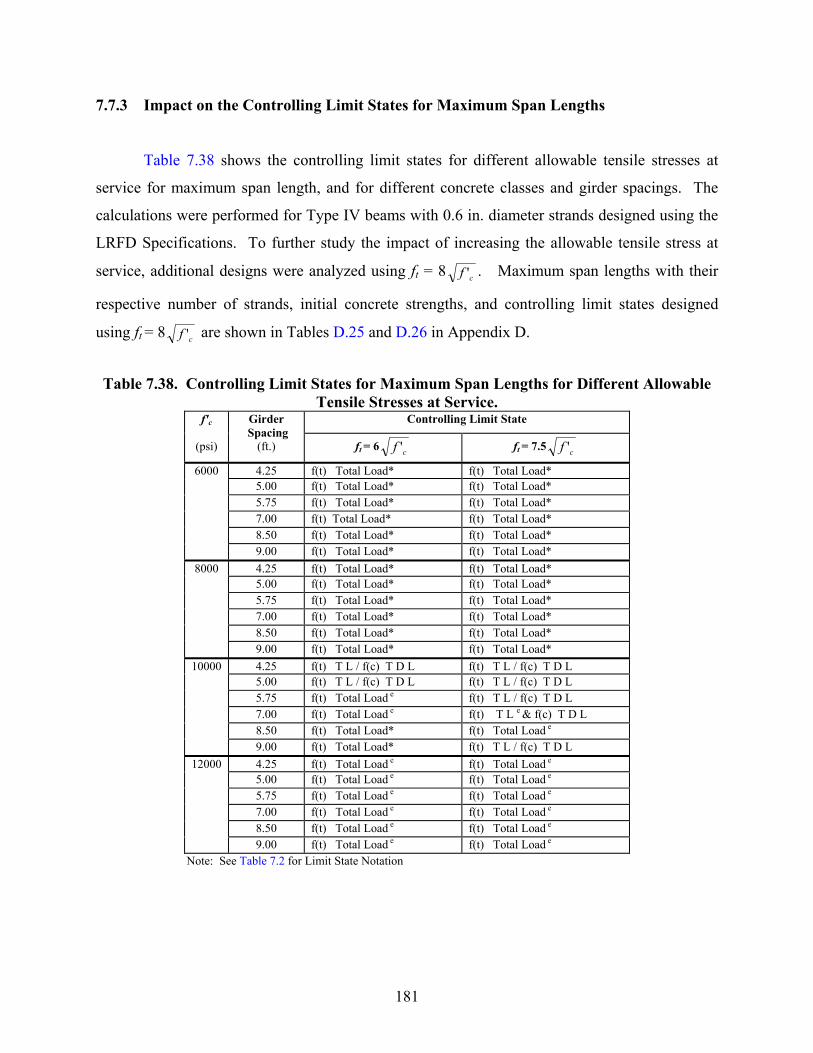
181
7.7.3 Impact on the Controlling Limit States for Maximum Span Lengths
Table 7.38 shows the controlling limit states for different allowable tensile stresses at
service for maximum span length, and for different concrete classes and girder spacings. The
calculations were performed for Type IV beams with 0.6 in. diameter strands designed using the
LRFD Specifications. To further study the impact of increasing the allowable tensile stress at
service, additional designs were analyzed using ft = 8 cf ' . Maximum span lengths with their
respective number of strands, initial concrete strengths, and controlling limit states designed
using ft = 8 cf ' are shown in Tables D.25 and D.26 in Appendix D.
Table 7.38. Controlling Limit States for Maximum Span Lengths for Different Allowable
Tensile Stresses at Service. Controlling Limit State f'c
(psi)
Girder Spacing
(ft.) ft = 6 cf ' ft = 7.5 cf '
6000 4.25 f(t) Total Load* f(t) Total Load* 5.00 f(t) Total Load* f(t) Total Load* 5.75 f(t) Total Load* f(t) Total Load* 7.00 f(t) Total Load* f(t) Total Load* 8.50 f(t) Total Load* f(t) Total Load* 9.00 f(t) Total Load* f(t) Total Load*
8000 4.25 f(t) Total Load* f(t) Total Load* 5.00 f(t) Total Load* f(t) Total Load* 5.75 f(t) Total Load* f(t) Total Load* 7.00 f(t) Total Load* f(t) Total Load* 8.50 f(t) Total Load* f(t) Total Load* 9.00 f(t) Total Load* f(t) Total Load*
10000 4.25 f(t) T L / f(c) T D L f(t) T L / f(c) T D L 5.00 f(t) T L / f(c) T D L f(t) T L / f(c) T D L 5.75 f(t) Total Load e f(t) T L / f(c) T D L 7.00 f(t) Total Load e f(t) T L e & f(c) T D L 8.50 f(t) Total Load* f(t) Total Load e
9.00 f(t) Total Load* f(t) T L / f(c) T D L 12000 4.25 f(t) Total Load e f(t) Total Load e
5.00 f(t) Total Load e f(t) Total Load e
5.75 f(t) Total Load e f(t) Total Load e
7.00 f(t) Total Load e f(t) Total Load e
8.50 f(t) Total Load e f(t) Total Load e
9.00 f(t) Total Load e f(t) Total Load e
Note: See Table 7.2 for Limit State Notation
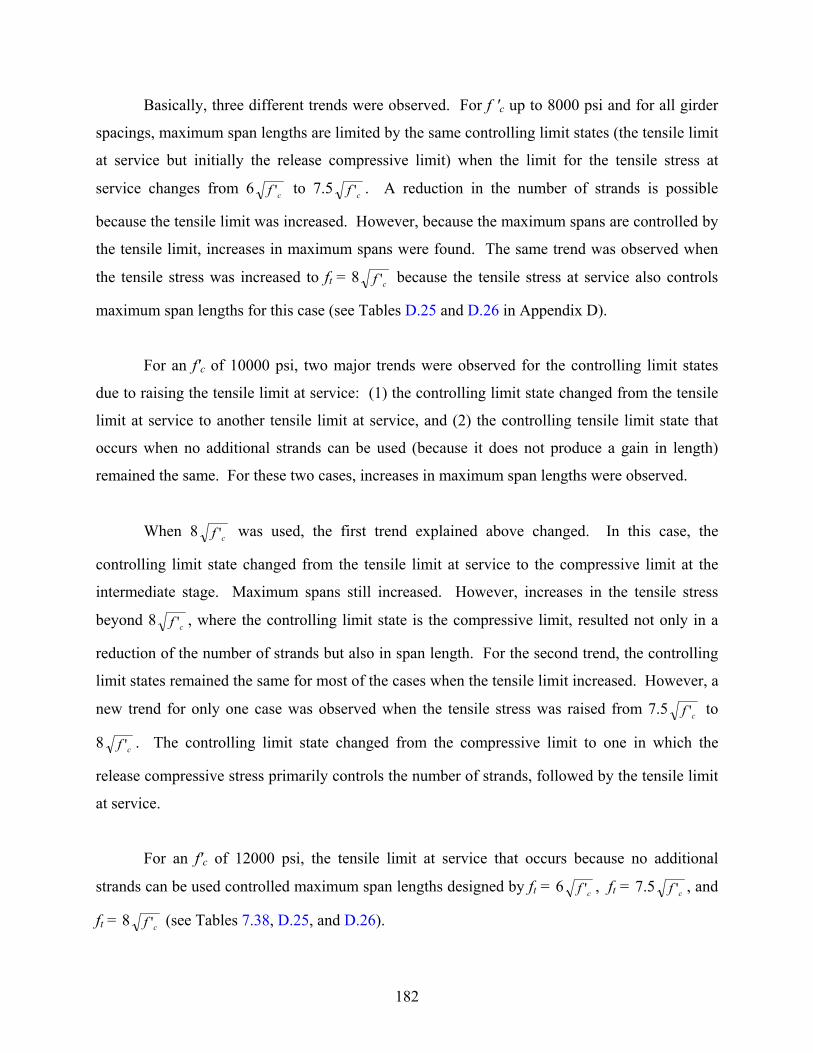
182
Basically, three different trends were observed. For f 'c up to 8000 psi and for all girder
spacings, maximum span lengths are limited by the same controlling limit states (the tensile limit
at service but initially the release compressive limit) when the limit for the tensile stress at
service changes from 6 cf ' to 7.5 cf ' . A reduction in the number of strands is possible
because the tensile limit was increased. However, because the maximum spans are controlled by
the tensile limit, increases in maximum spans were found. The same trend was observed when
the tensile stress was increased to ft = 8 cf ' because the tensile stress at service also controls
maximum span lengths for this case (see Tables D.25 and D.26 in Appendix D).
For an f'c of 10000 psi, two major trends were observed for the controlling limit states
due to raising the tensile limit at service: (1) the controlling limit state changed from the tensile
limit at service to another tensile limit at service, and (2) the controlling tensile limit state that
occurs when no additional strands can be used (because it does not produce a gain in length)
remained the same. For these two cases, increases in maximum span lengths were observed.
When 8 cf ' was used, the first trend explained above changed. In this case, the
controlling limit state changed from the tensile limit at service to the compressive limit at the
intermediate stage. Maximum spans still increased. However, increases in the tensile stress
beyond 8 cf ' , where the controlling limit state is the compressive limit, resulted not only in a
reduction of the number of strands but also in span length. For the second trend, the controlling
limit states remained the same for most of the cases when the tensile limit increased. However, a
new trend for only one case was observed when the tensile stress was raised from 7.5 cf ' to
8 cf ' . The controlling limit state changed from the compressive limit to one in which the
release compressive stress primarily controls the number of strands, followed by the tensile limit
at service.
For an f'c of 12000 psi, the tensile limit at service that occurs because no additional
strands can be used controlled maximum span lengths designed by ft = 6 cf ' , ft = 7.5 cf ' , and
ft = 8 cf ' (see Tables 7.38, D.25, and D.26).
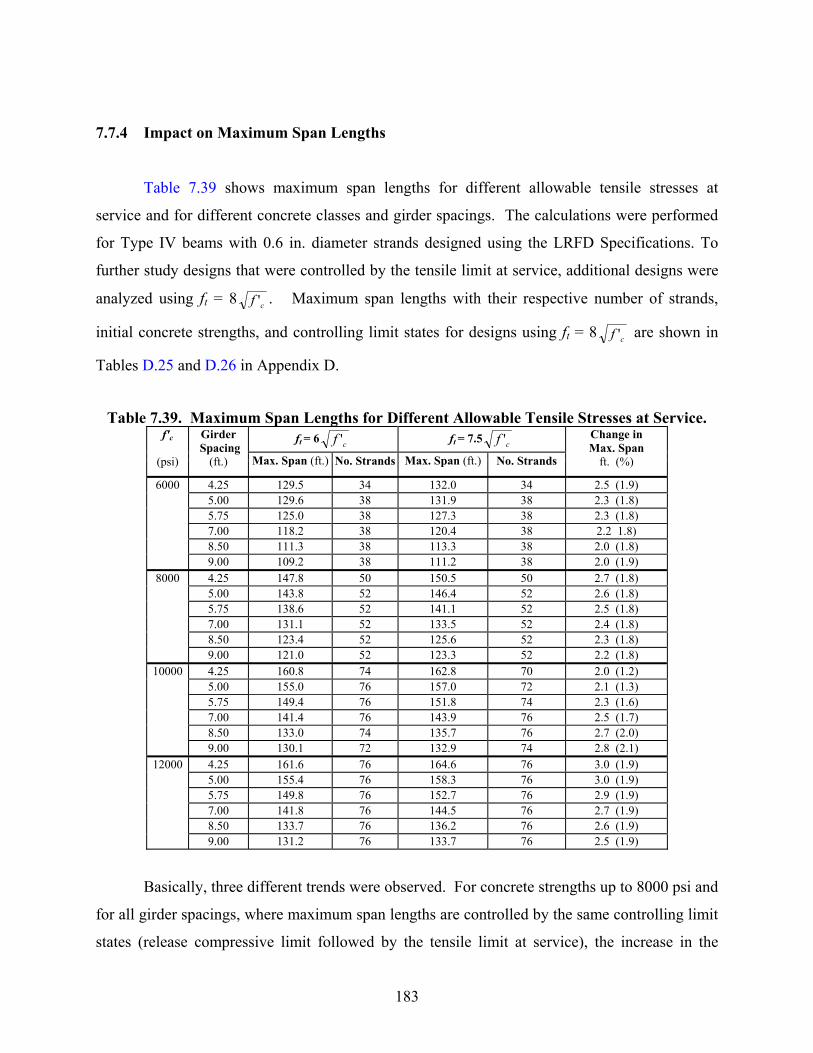
183
7.7.4 Impact on Maximum Span Lengths
Table 7.39 shows maximum span lengths for different allowable tensile stresses at
service and for different concrete classes and girder spacings. The calculations were performed
for Type IV beams with 0.6 in. diameter strands designed using the LRFD Specifications. To
further study designs that were controlled by the tensile limit at service, additional designs were
analyzed using ft = 8 cf ' . Maximum span lengths with their respective number of strands,
initial concrete strengths, and controlling limit states for designs using ft = 8 cf ' are shown in
Tables D.25 and D.26 in Appendix D.
Table 7.39. Maximum Span Lengths for Different Allowable Tensile Stresses at Service.
ft = 6 cf ' ft = 7.5 cf ' f'c
(psi)
Girder Spacing
(ft.) Max. Span (ft.) No. Strands Max. Span (ft.) No. Strands
Change in Max. Span
ft. (%)
6000 4.25 129.5 34 132.0 34 2.5 (1.9) 5.00 129.6 38 131.9 38 2.3 (1.8) 5.75 125.0 38 127.3 38 2.3 (1.8) 7.00 118.2 38 120.4 38 2.2 1.8) 8.50 111.3 38 113.3 38 2.0 (1.8) 9.00 109.2 38 111.2 38 2.0 (1.9)
8000 4.25 147.8 50 150.5 50 2.7 (1.8) 5.00 143.8 52 146.4 52 2.6 (1.8) 5.75 138.6 52 141.1 52 2.5 (1.8) 7.00 131.1 52 133.5 52 2.4 (1.8) 8.50 123.4 52 125.6 52 2.3 (1.8) 9.00 121.0 52 123.3 52 2.2 (1.8)
10000 4.25 160.8 74 162.8 70 2.0 (1.2) 5.00 155.0 76 157.0 72 2.1 (1.3) 5.75 149.4 76 151.8 74 2.3 (1.6) 7.00 141.4 76 143.9 76 2.5 (1.7) 8.50 133.0 74 135.7 76 2.7 (2.0) 9.00 130.1 72 132.9 74 2.8 (2.1)
12000 4.25 161.6 76 164.6 76 3.0 (1.9) 5.00 155.4 76 158.3 76 3.0 (1.9) 5.75 149.8 76 152.7 76 2.9 (1.9) 7.00 141.8 76 144.5 76 2.7 (1.9) 8.50 133.7 76 136.2 76 2.6 (1.9) 9.00 131.2 76 133.7 76 2.5 (1.9)
Basically, three different trends were observed. For concrete strengths up to 8000 psi and
for all girder spacings, where maximum span lengths are controlled by the same controlling limit
states (release compressive limit followed by the tensile limit at service), the increase in the
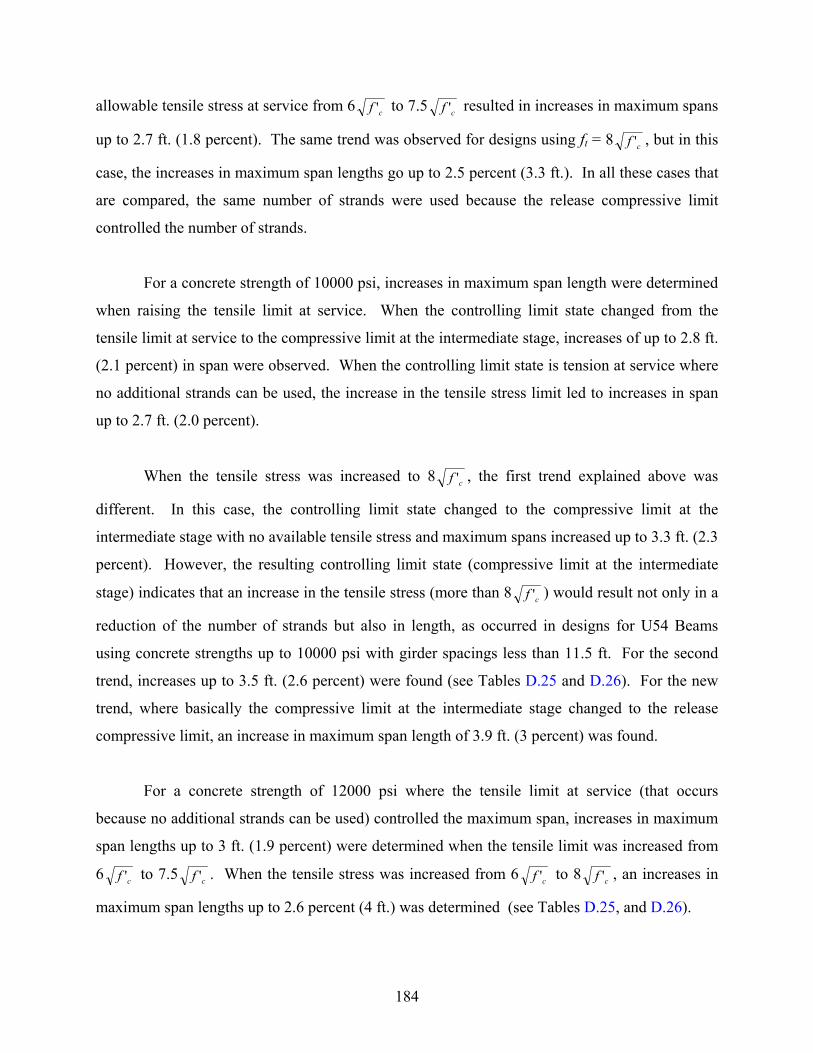
184
allowable tensile stress at service from 6 cf ' to 7.5 cf ' resulted in increases in maximum spans
up to 2.7 ft. (1.8 percent). The same trend was observed for designs using ft = 8 cf ' , but in this
case, the increases in maximum span lengths go up to 2.5 percent (3.3 ft.). In all these cases that
are compared, the same number of strands were used because the release compressive limit
controlled the number of strands.
For a concrete strength of 10000 psi, increases in maximum span length were determined
when raising the tensile limit at service. When the controlling limit state changed from the
tensile limit at service to the compressive limit at the intermediate stage, increases of up to 2.8 ft.
(2.1 percent) in span were observed. When the controlling limit state is tension at service where
no additional strands can be used, the increase in the tensile stress limit led to increases in span
up to 2.7 ft. (2.0 percent).
When the tensile stress was increased to 8 cf ' , the first trend explained above was
different. In this case, the controlling limit state changed to the compressive limit at the
intermediate stage with no available tensile stress and maximum spans increased up to 3.3 ft. (2.3
percent). However, the resulting controlling limit state (compressive limit at the intermediate
stage) indicates that an increase in the tensile stress (more than 8 cf ' ) would result not only in a
reduction of the number of strands but also in length, as occurred in designs for U54 Beams
using concrete strengths up to 10000 psi with girder spacings less than 11.5 ft. For the second
trend, increases up to 3.5 ft. (2.6 percent) were found (see Tables D.25 and D.26). For the new
trend, where basically the compressive limit at the intermediate stage changed to the release
compressive limit, an increase in maximum span length of 3.9 ft. (3 percent) was found.
For a concrete strength of 12000 psi where the tensile limit at service (that occurs
because no additional strands can be used) controlled the maximum span, increases in maximum
span lengths up to 3 ft. (1.9 percent) were determined when the tensile limit was increased from
6 cf ' to 7.5 cf ' . When the tensile stress was increased from 6 cf ' to 8 cf ' , an increases in
maximum span lengths up to 2.6 percent (4 ft.) was determined (see Tables D.25, and D.26).
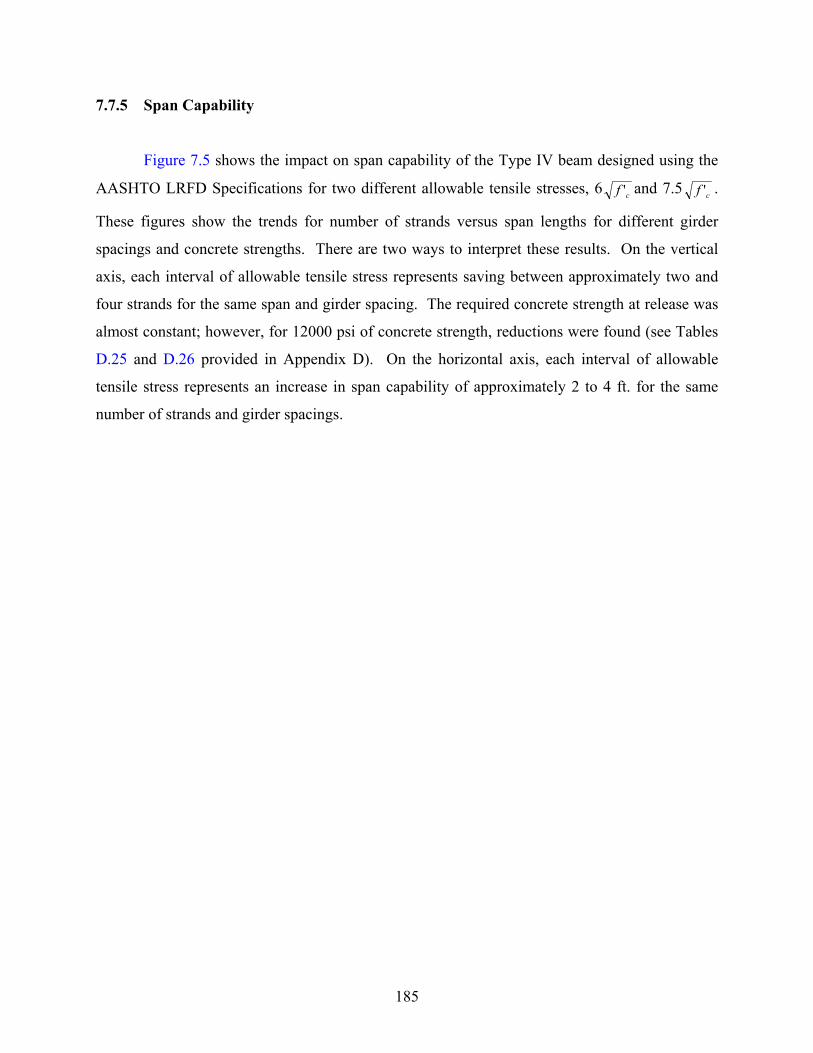
185
7.7.5 Span Capability
Figure 7.5 shows the impact on span capability of the Type IV beam designed using the
AASHTO LRFD Specifications for two different allowable tensile stresses, 6 cf ' and 7.5 cf ' .
These figures show the trends for number of strands versus span lengths for different girder
spacings and concrete strengths. There are two ways to interpret these results. On the vertical
axis, each interval of allowable tensile stress represents saving between approximately two and
four strands for the same span and girder spacing. The required concrete strength at release was
almost constant; however, for 12000 psi of concrete strength, reductions were found (see Tables
D.25 and D.26 provided in Appendix D). On the horizontal axis, each interval of allowable
tensile stress represents an increase in span capability of approximately 2 to 4 ft. for the same
number of strands and girder spacings.
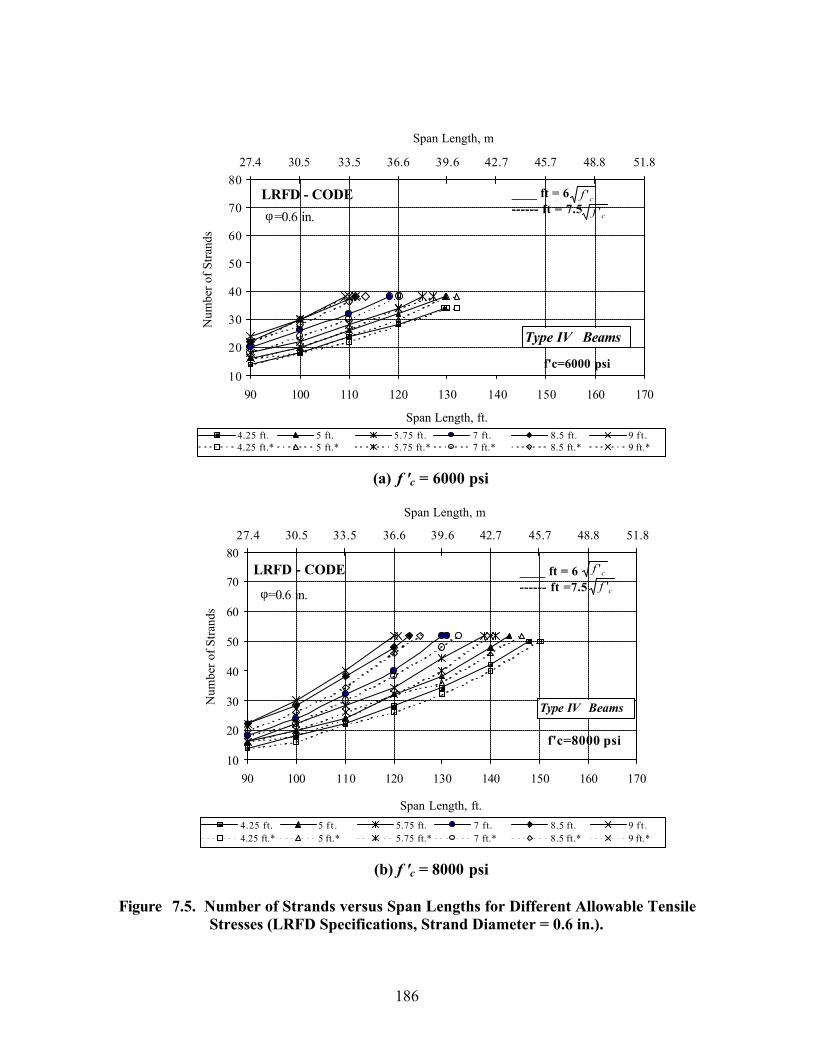
186
10
20
30
40
50
60
70
80
90 100 110 120 130 140 150 160 170
Span Length, ft.
Num
ber o
f Stra
nds
27.4 30.5 33.5 36.6 39.6 42.7 45.7 48.8 51.8
Span Length, m
4.25 ft. 5 ft. 5.75 ft. 7 ft. 8.5 ft. 9 f t .4.25 ft.* 5 ft.* 5.75 ft.* 7 ft.* 8.5 ft.* 9 ft.*
f'c=6000 psi
LRFD - CODEφ =0.6 in.
Type IV Beams
____ ft = 6 ------ ft = 7.5
cf 'cf '
(a) f 'c = 6000 psi
10
20
30
40
50
60
70
80
90 100 110 120 130 140 150 160 170
Span Length, ft.
Num
ber o
f Stra
nds
27.4 30.5 33.5 36.6 39.6 42.7 45.7 48.8 51.8
Span Length, m
4.25 ft. 5 f t . 5.75 ft. 7 ft. 8.5 ft. 9 f t .4.25 ft.* 5 ft.* 5.75 ft.* 7 ft.* 8.5 ft.* 9 ft.*
f'c=8000 psi
LRFD - CODE
φ=0.6 in.
Type IV Beams
____ ft = 6 ------ ft =7.5
.
cf '
cf '
(b) f 'c = 8000 psi
Figure 7.5. Number of Strands versus Span Lengths for Different Allowable Tensile
Stresses (LRFD Specifications, Strand Diameter = 0.6 in.).
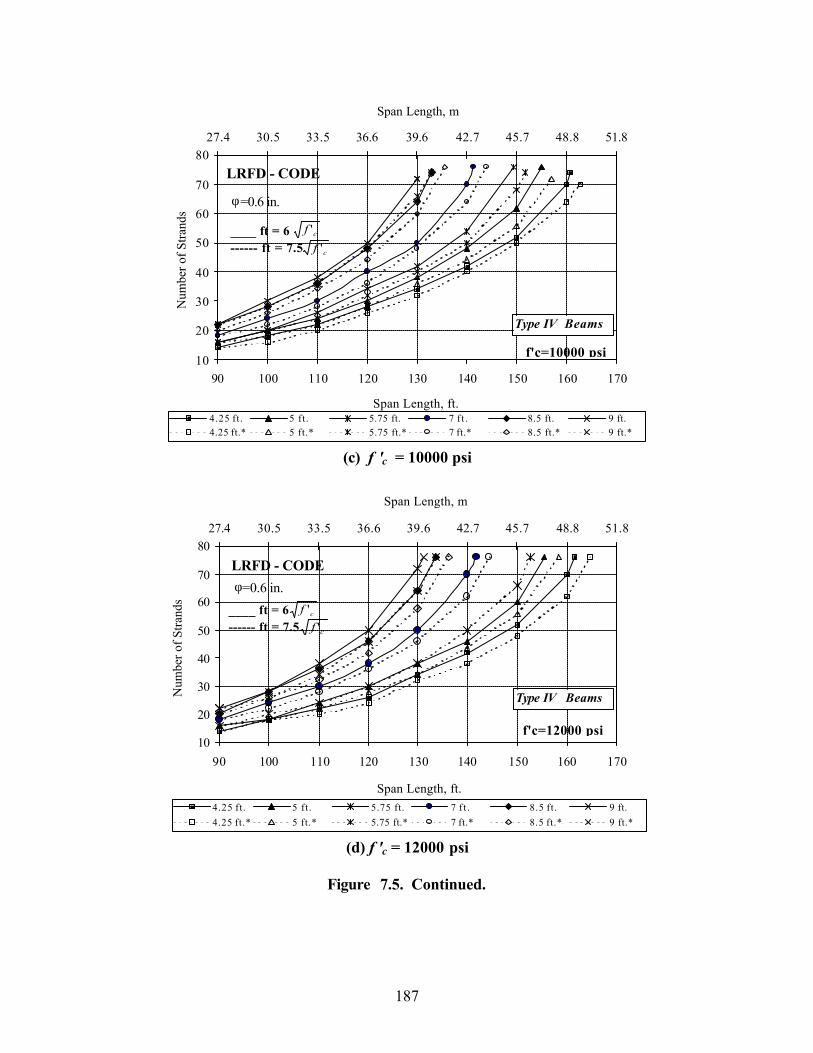
187
10
20
30
40
50
60
70
80
90 100 110 120 130 140 150 160 170
Span Length, ft.
Num
ber o
f Stra
nds
27.4 30.5 33.5 36.6 39.6 42.7 45.7 48.8 51.8
Span Length, m
4.25 ft. 5 ft. 5.75 ft. 7 f t . 8.5 ft. 9 ft.4.25 ft.* 5 ft.* 5.75 ft.* 7 ft.* 8.5 ft.* 9 ft.*
f'c=10000 psi
LRFD - CODE
φ =0.6 in.
Type IV Beams
____ ft = 6 ------ ft = 7.5
cf '
cf '
(c) f 'c = 10000 psi
10
20
30
40
50
60
70
80
90 100 110 120 130 140 150 160 170
Span Length, ft.
Num
ber o
f Stra
nds
27.4 30.5 33.5 36.6 39.6 42.7 45.7 48.8 51.8
Span Length, m
4.25 ft. 5 ft. 5.75 ft. 7 f t . 8.5 ft. 9 ft.4.25 ft.* 5 ft.* 5.75 ft.* 7 ft.* 8.5 ft.* 9 ft.*
f'c=12000 psi
LRFD - CODEφ=0.6 in.
Type IV Beams
____ ft = 6 ------ ft = 7.5
cf '
cf '
(d) f 'c = 12000 psi
Figure 7.5. Continued.

189
8 SUMMARY, CONCLUSIONS, AND RECOMMENDATIONS
8.1 SUMMARY
This report summarizes Phase 2 of TxDOT Research Project 0-2101, “Allowable Stresses
and Resistance Factors for High Strength Concrete.” The objective of this project was to
evaluate the allowable stresses and resistance factors in the AASHTO LRFD Specifications for
design of HSC girders used in Texas bridges. Hueste et al. (2003a) summarized the complete
project. Phase 1 of this project (Hueste et al. 2003b) evaluated the applicability of current
prediction equations for estimation of mechanical properties of HSC and also determined
statistical parameters for mechanical properties of HSC. The HSC samples for Phase 1 were
collected from three Texas precasters that manufacture HSC prestressed bridge girders. Phase 3
of this project assessed the impact of different curing conditions on the compressive and flexural
strength of HSC mixtures used for prestressed girders in Texas (Hueste et al. 2003c). The
portion of the research project addressed by this study (Phase 2) includes defining the current
state of practice for design of HSC prestressed girders and identifying critical design parameters
that limit the design of typical HSC prestressed bridge girders. There are three specific research
objectives for this study: (1) to determine the current state of practice for HSC prestressed bridge
girders across the United States, (2) to evaluate the controlling limit states for the design of HSC
prestressed bridge girders and identify areas where some economy in design may be gained, and
(3) to conduct a preliminary assessment of the impact of revising critical design criteria with an
objective of increasing the economy of HSC prestressed girders.
The first objective was accomplished through a literature search and survey. The
literature search included review of design criteria for both the AASHTO Standard and LRFD
Specifications and relevant case studies of the performance of HSC prestressed bridge girders.
In addition, a survey was conducted to gather information and document critical aspect of current
design practices for HSC prestressed bridges. Researchers collected responses from 41 state
DOTs and two private organizations, giving a 74 percent response rate to the survey.
190
The second objective was accomplished by conducting a parametric study for single-span
HSC prestressed bridge girders to primarily investigate the controlling flexural limit states for
both the AASHTO Standard and LRFD Specifications (AASHTO 2002 a,b). The selected
variables for the overall parametric study are shown in Table 8.1. AASHTO Type IV and Texas
U54 Beams were considered. The effects of changes in concrete strength, strand diameter, girder
spacing and span length were evaluated. Several case study bridges with U54 and Type IV
beams were designed using the Standard Specifications, and the results were compared with
those from PSTRS14 (TxDOT 1980) to ensure consistency of the parametric study with TxDOT
design practices. Based on the results from the parametric study, the limiting design criteria for
HSC prestressed U54 and Type IV girders using both the AASHTO Standard and LRFD
Specifications for Highway Bridges were identified.
Table 8.1. Design Parameters.
Variable Description / Selected Values Codes AASHTO Standard and LRFD Specifications (AASHTO
2002 a,b) Concrete Strength (psi) 6000, 8000, 10000, and 12000
(f 'ci is initially set at 0.75 f 'c, but allowed to vary up to f 'c) Girder Sections Texas U54 and AASHTO Type IV Girder Spacing for U54 Beams (ft)
8.5, 10, 11.5, 14.0, and 16.67
Girder Spacing for Type IV Beams (ft)
4.25, 5, 5.75, 7.0, 8.5. and 9.
Spans (L) 90 ft. to maximum span at 10 ft. intervals Diameter Strands (inches) 0.5 and 0.6
The third research objective was accomplished by making a preliminary evaluation of the
impact of raising the allowable tensile stress for service conditions. At the time of this study, the
results of the experimental work related to curing effects on concrete strength were not yet
available (see Hueste et al. 2003c). Therefore, the tensile stress limit selected for this evaluation
was based on the current limit for uncracked sections provided by the ACI 318 code (ACI
Comm. 318 2002) and the limit used for a specific case study bridge (Ralls 1995). The potential
increase in bridge span lengths based on the increased tensile stress limit at service was
evaluated. In addition, other refinements in the flexural design to achieve increased span lengths
or to reduce the number of strands required for a specific span were evaluated.
191
8.2 CONCLUSIONS
Major conclusions derived from this study are noted below. The conclusions are
organized according to the major research objectives.
8.2.1 Current State of Practice
Codes and Documents
For the 41 DOTs involved in the survey, 78 percent are currently using the AASHTO
Standard Specifications, 44 percent are using the AASHTO LRFD Specifications, and 22
percent are using both specifications. Most states that use the LRFD Specifications only
partially implement the specification; most states plan complete implementation in the period of
2003 to 2007. The survey shows that about one-third of the state DOTs use additional
documents and references for the design of prestressed concrete bridge girders and HSC
members. These documents and references include the PCI Bridge Design Manual (1997),
some publications on HSC issued by the Portland Cement Association, bridge design manuals
developed by individual states, software programs developed by some states or software
companies, and other reports and texts.
Prevalence of HSC Prestressed Bridge Girders
Of the 41 responding DOTs, 68 percent use HSC prestressed girders for 0 to 50 percent
of their total construction, 15 percent of the responding DOTs use HSC prestressed girders for 51
to 80 percent of their total construction, and 17 percent of the responding DOTs use HSC
prestressed girders for 81 to 100 percent of their total construction.
Specified Concrete Strengths
The most typical range for the specified concrete strength at transfer (f 'ci) is 4000 to 7000
psi, while the specified concrete strength at service (f 'c) typically ranges from 5000 to 8500 psi.
Only 15 percent of the DOTs utilize a higher concrete strength at service (10000 psi) for some
cases, and just 2 percent of the DOTs utilize a concrete strength at service of 12000 psi.
192
Impact of Required Transfer Strength
The respondents indicated that the specified release strength tends to be critical for
prestressed concrete girder production because mixture designs are governed by the required
concrete strength at release. Twenty-two of the state DOTs have observed that high initial
strength requirements have led to an overstrength in actual concrete strength at service. In this
study, the definition of HSC is concrete with specified compressive strengths for design of 6000
psi or greater, made without using exotic materials or techniques (ACI 363 1997). However,
most of the responses indicate that high transfer strengths require special materials or techniques
like accelerated curing. Two methods are mentioned to obtain HSC. First is to obtain a high
initial concrete strength (within 18 hours to 2 days) using high early cement and/or heat curing.
In this case, the final strengths tend to level off quickly (around 7 days) and the strength gain is
not significant. Second is the common method of curing at ambient conditions, which tends to
provide final strengths higher than those specified in designs. In this case, if precasters focus on
achieving the high initial concrete strength demands with ambient curing methods, then the
specified 28-day strength is met quickly and larger concrete strengths are typically achieved at
28 days.
Concerns Related to the Use of HSC
The survey indicates that almost one-half of the DOTs have some concerns related to the
use of HSC. Some of the concerns related to this study follow:
• Girder transportation limits maximum span lengths. However, design recommendations
mentioned that a recent project in San Angelo, Texas, utilized HSC with a concrete strength
(f'c) of 14000 psi to construct a 153 ft. span with Type IV beams (TxDOT 2001a). Moreover,
the same document states that beams up to 150 ft. have been successfully transported,
although at a premium cost.
• Several DOTs are reluctant to use f'c values higher than 8500 psi. There is a concern that
design parameters in the AASHTO specifications need to be modified for use with HSC
because the current design equations in the AASHTO specifications for prestressed concrete
members are based on mechanical properties of normal concrete strengths of 6000 psi or less.
193
• Initial cracking of girders during pouring and before release is a concern. However, TxDOT
practice indicates that cracking at release is not a major problem in practice because transfer
is a temporary condition. If a crack occurs in the top of the beam at the end regions, it will
close when the concrete slab is poured.
Suppliers
The survey shows that a single DOT may be served by one to seven precasters that can
supply HSC girders. HSC precasters not only supply to their own state DOT but may also
supply to other state DOTs. In addition, in some areas, there is an unavailability of suitable
aggregates and/or no qualified precasters to produce HSC prestressed girders.
Adjustments to Design Specifications for HSC Prestressed Bridge Girders
The survey indicates that most DOTs have not made adjustments to the design
specifications for the design of HSC prestressed bridge girders. Of the seven DOTs that have
made modifications, in-house design documents include modifications for the equation for the
modulus of elasticity, the allowable stresses, and the equation for losses, creep, and camber.
Typical Bridges with HSC Prestressed Bridge Members
The HSC prestressed girder types that are most popular among the responding DOTs
include the AASHTO beam (26 states), followed by the bulb beam (23 states), and the box girder
(11 states). Voided slabs (6 states), slabs (4 states), double T-beams (4 states), and closed box
CIP beams (1 state) are the structural types with less use, although the closed box CIP girder is
used for long spans (typically up to 150 ft.). The Texas U-beams are used not only in Texas, but
also in Colorado and New Mexico.
Slab, voided slab, and double T-beams are more prevalent for shorter span lengths. The
typical range for shorter span lengths is from approximately 30 to 60 ft., and the typical range for
specified concrete strengths at service (f'c) varies from approximately 3500 to 6000 psi. Note
that this strength range would not be considered to be HSC for this study.
194
Closed box CIP beams, AASHTO beams, bulb beams, and box beams are more prevalent
for longer span lengths. The typical range for longer span lengths is from approximately 60 to
150 ft., and the typical range for specified concrete strengths at service (f'c) varies from
approximately 6000 to 10000 psi. More details are provided in Section 4.3.
8.2.2 Parametric Study Using Current Specifications
Researchers derived the following conclusions for the parametric study. This study
focused only on limit states related to flexure for service and ultimate conditions. Additional
design limit states were not evaluated. TxDOT currently uses an HS25 truck loading for a
number of designs. The loading used in this study was based on the specified loads in the
AASHTO specifications, which reference an HS20 truck loading.
8.2.2.1 Trends for U54 Girders
Controlling Limit States
1. The ultimate flexural limit state does not produce an impact in terms of limiting
maximum span lengths because this limit state only controls shorter span lengths (90 ft.
and, in some cases, 100 ft.).
2. The concrete tensile stress at full service loads controlled the number of strands required
for longer spans, except for the maximum span lengths, whether they are designed under
the Standard or the LRFD Specifications.
3. The concrete compressive stress due to total dead loads (sustained loads) controlled the
number of strands required for maximum span lengths of beams designed under both the
Standard and LRFD Specifications. The exception is when the allowable tensile stress
limit under total loads would be exceeded because no additional prestressing strands can
be accommodated in the U54 beam section or because the stresses at the beam ends
during transfer initially limit the number of strands.
4. Stresses at the beam ends at release do not control any maximum span length of U54
Beams designed under the Standard Specifications. Stresses at the beam ends at release
control some maximum span lengths for U54 Beams with wider girder spacings (14 and
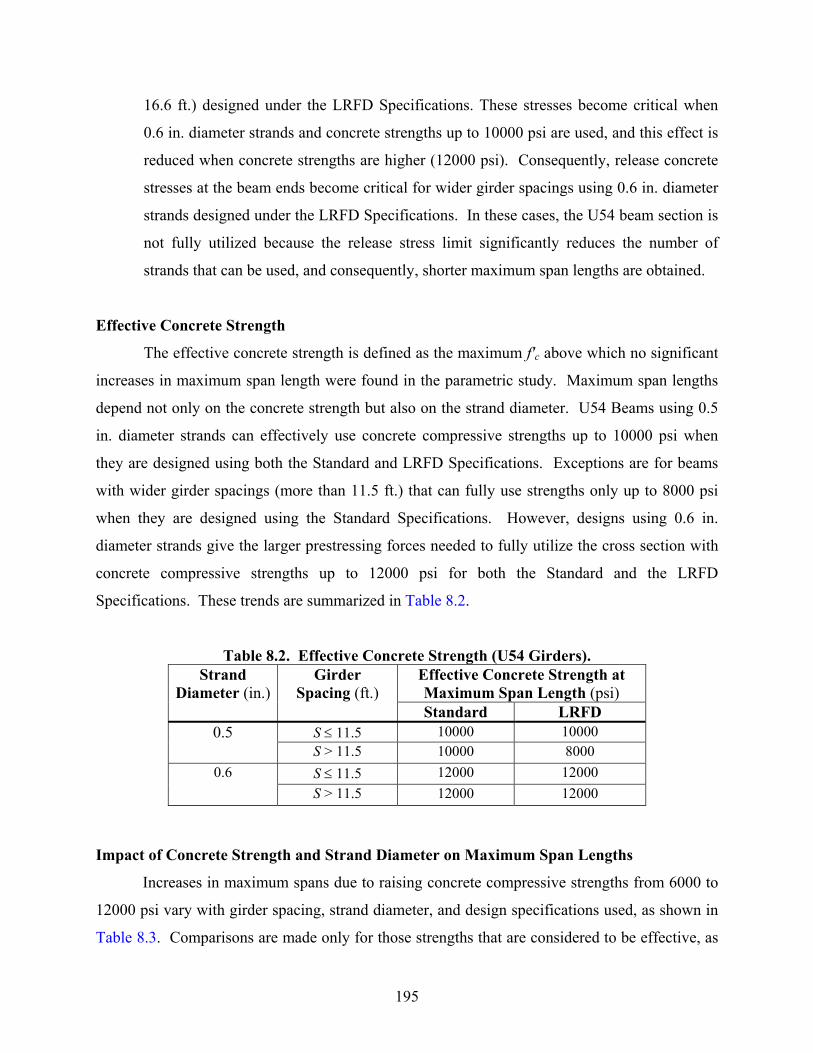
195
16.6 ft.) designed under the LRFD Specifications. These stresses become critical when
0.6 in. diameter strands and concrete strengths up to 10000 psi are used, and this effect is
reduced when concrete strengths are higher (12000 psi). Consequently, release concrete
stresses at the beam ends become critical for wider girder spacings using 0.6 in. diameter
strands designed under the LRFD Specifications. In these cases, the U54 beam section is
not fully utilized because the release stress limit significantly reduces the number of
strands that can be used, and consequently, shorter maximum span lengths are obtained.
Effective Concrete Strength
The effective concrete strength is defined as the maximum f'c above which no significant
increases in maximum span length were found in the parametric study. Maximum span lengths
depend not only on the concrete strength but also on the strand diameter. U54 Beams using 0.5
in. diameter strands can effectively use concrete compressive strengths up to 10000 psi when
they are designed using both the Standard and LRFD Specifications. Exceptions are for beams
with wider girder spacings (more than 11.5 ft.) that can fully use strengths only up to 8000 psi
when they are designed using the Standard Specifications. However, designs using 0.6 in.
diameter strands give the larger prestressing forces needed to fully utilize the cross section with
concrete compressive strengths up to 12000 psi for both the Standard and the LRFD
Specifications. These trends are summarized in Table 8.2.
Table 8.2. Effective Concrete Strength (U54 Girders). Effective Concrete Strength at Maximum Span Length (psi)
Strand Diameter (in.)
Girder Spacing (ft.)
Standard LRFD S ≤ 11.5 10000 10000 0.5 S > 11.5 10000 8000 S ≤ 11.5 12000 12000 0.6 S > 11.5 12000 12000
Impact of Concrete Strength and Strand Diameter on Maximum Span Lengths
Increases in maximum spans due to raising concrete compressive strengths from 6000 to
12000 psi vary with girder spacing, strand diameter, and design specifications used, as shown in
Table 8.3. Comparisons are made only for those strengths that are considered to be effective, as
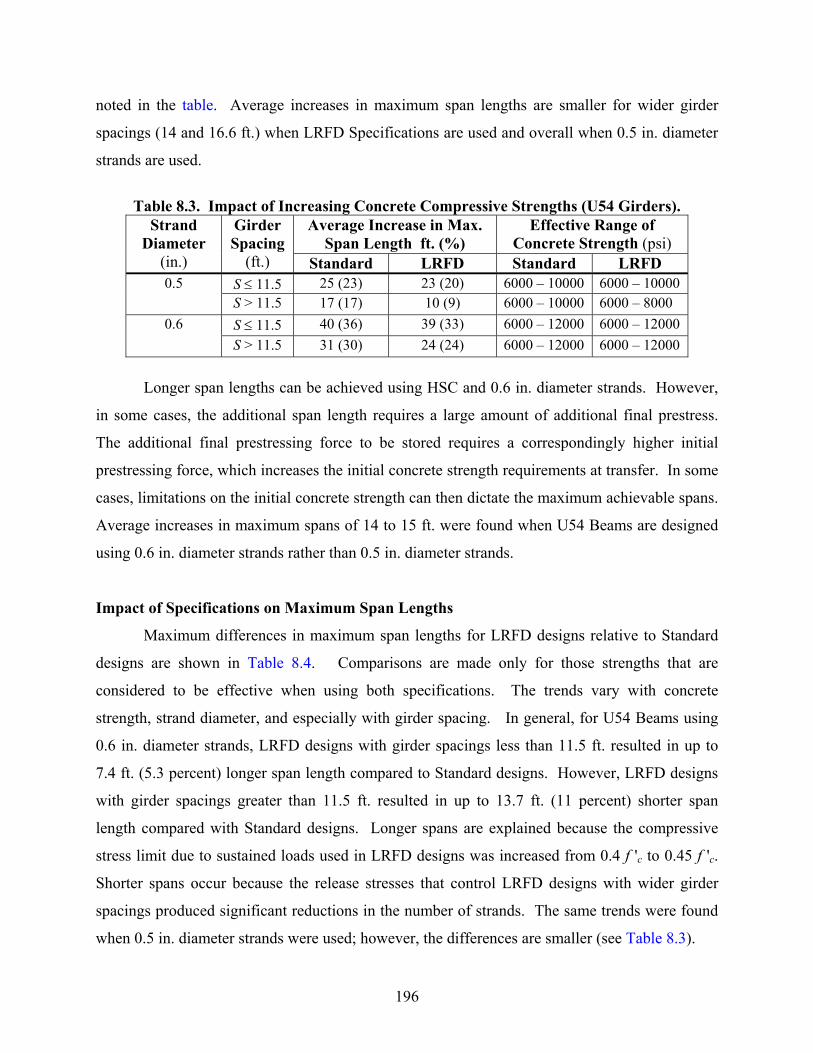
196
noted in the table. Average increases in maximum span lengths are smaller for wider girder
spacings (14 and 16.6 ft.) when LRFD Specifications are used and overall when 0.5 in. diameter
strands are used.
Table 8.3. Impact of Increasing Concrete Compressive Strengths (U54 Girders).
Average Increase in Max. Span Length ft. (%)
Effective Range of Concrete Strength (psi)
Strand Diameter
(in.)
Girder Spacing
(ft.) Standard LRFD Standard LRFD S ≤ 11.5 25 (23) 23 (20) 6000 – 10000 6000 – 10000 0.5 S > 11.5 17 (17) 10 (9) 6000 – 10000 6000 – 8000 S ≤ 11.5 40 (36) 39 (33) 6000 – 12000 6000 – 12000 0.6 S > 11.5 31 (30) 24 (24) 6000 – 12000 6000 – 12000
Longer span lengths can be achieved using HSC and 0.6 in. diameter strands. However,
in some cases, the additional span length requires a large amount of additional final prestress.
The additional final prestressing force to be stored requires a correspondingly higher initial
prestressing force, which increases the initial concrete strength requirements at transfer. In some
cases, limitations on the initial concrete strength can then dictate the maximum achievable spans.
Average increases in maximum spans of 14 to 15 ft. were found when U54 Beams are designed
using 0.6 in. diameter strands rather than 0.5 in. diameter strands.
Impact of Specifications on Maximum Span Lengths
Maximum differences in maximum span lengths for LRFD designs relative to Standard
designs are shown in Table 8.4. Comparisons are made only for those strengths that are
considered to be effective when using both specifications. The trends vary with concrete
strength, strand diameter, and especially with girder spacing. In general, for U54 Beams using
0.6 in. diameter strands, LRFD designs with girder spacings less than 11.5 ft. resulted in up to
7.4 ft. (5.3 percent) longer span length compared to Standard designs. However, LRFD designs
with girder spacings greater than 11.5 ft. resulted in up to 13.7 ft. (11 percent) shorter span
length compared with Standard designs. Longer spans are explained because the compressive
stress limit due to sustained loads used in LRFD designs was increased from 0.4 f 'c to 0.45 f 'c.
Shorter spans occur because the release stresses that control LRFD designs with wider girder
spacings produced significant reductions in the number of strands. The same trends were found
when 0.5 in. diameter strands were used; however, the differences are smaller (see Table 8.3).
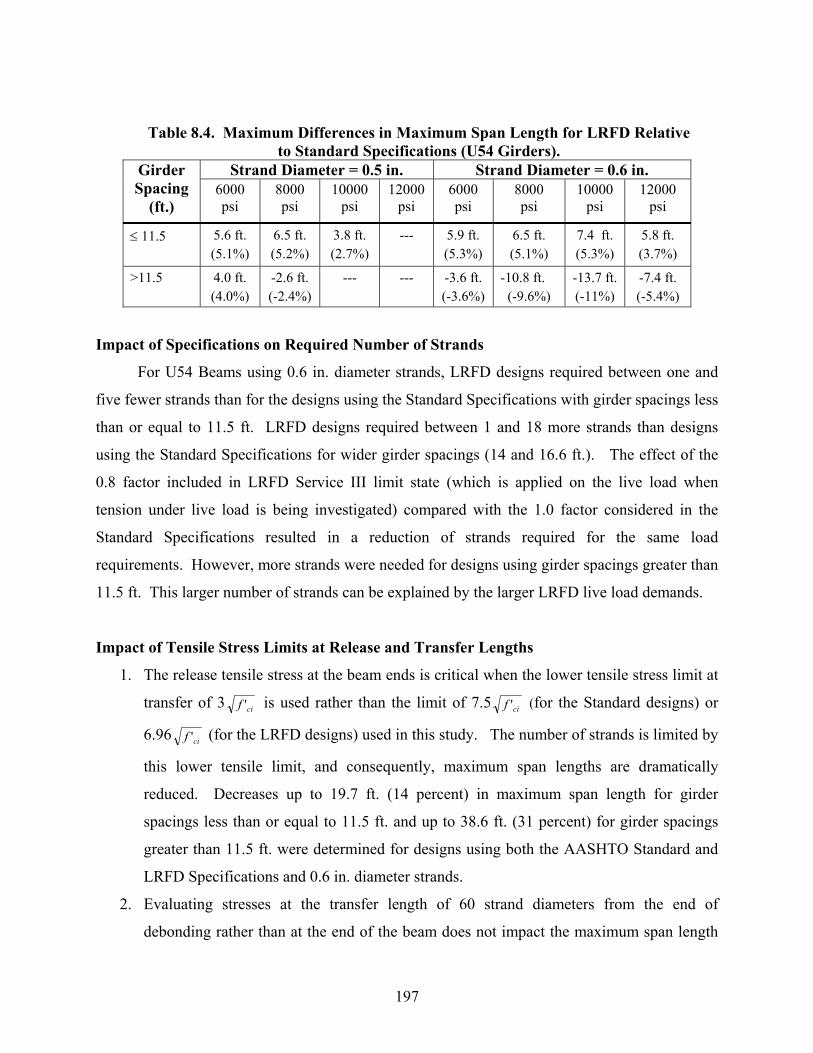
197
Table 8.4. Maximum Differences in Maximum Span Length for LRFD Relative to Standard Specifications (U54 Girders).
Strand Diameter = 0.5 in. Strand Diameter = 0.6 in. Girder Spacing
(ft.) 6000 psi
8000 psi
10000 psi
12000 psi
6000 psi
8000 psi
10000 psi
12000 psi
≤ 11.5 5.6 ft. (5.1%)
6.5 ft. (5.2%)
3.8 ft. (2.7%)
--- 5.9 ft. (5.3%)
6.5 ft. (5.1%)
7.4 ft. (5.3%)
5.8 ft. (3.7%)
>11.5 4.0 ft. (4.0%)
-2.6 ft. (-2.4%)
--- --- -3.6 ft. (-3.6%)
-10.8 ft. (-9.6%)
-13.7 ft. (-11%)
-7.4 ft. (-5.4%)
Impact of Specifications on Required Number of Strands
For U54 Beams using 0.6 in. diameter strands, LRFD designs required between one and
five fewer strands than for the designs using the Standard Specifications with girder spacings less
than or equal to 11.5 ft. LRFD designs required between 1 and 18 more strands than designs
using the Standard Specifications for wider girder spacings (14 and 16.6 ft.). The effect of the
0.8 factor included in LRFD Service III limit state (which is applied on the live load when
tension under live load is being investigated) compared with the 1.0 factor considered in the
Standard Specifications resulted in a reduction of strands required for the same load
requirements. However, more strands were needed for designs using girder spacings greater than
11.5 ft. This larger number of strands can be explained by the larger LRFD live load demands.
Impact of Tensile Stress Limits at Release and Transfer Lengths
1. The release tensile stress at the beam ends is critical when the lower tensile stress limit at
transfer of 3 cif ' is used rather than the limit of 7.5 cif ' (for the Standard designs) or
6.96 cif ' (for the LRFD designs) used in this study. The number of strands is limited by
this lower tensile limit, and consequently, maximum span lengths are dramatically
reduced. Decreases up to 19.7 ft. (14 percent) in maximum span length for girder
spacings less than or equal to 11.5 ft. and up to 38.6 ft. (31 percent) for girder spacings
greater than 11.5 ft. were determined for designs using both the AASHTO Standard and
LRFD Specifications and 0.6 in. diameter strands.
2. Evaluating stresses at the transfer length of 60 strand diameters from the end of
debonding rather than at the end of the beam does not impact the maximum span length
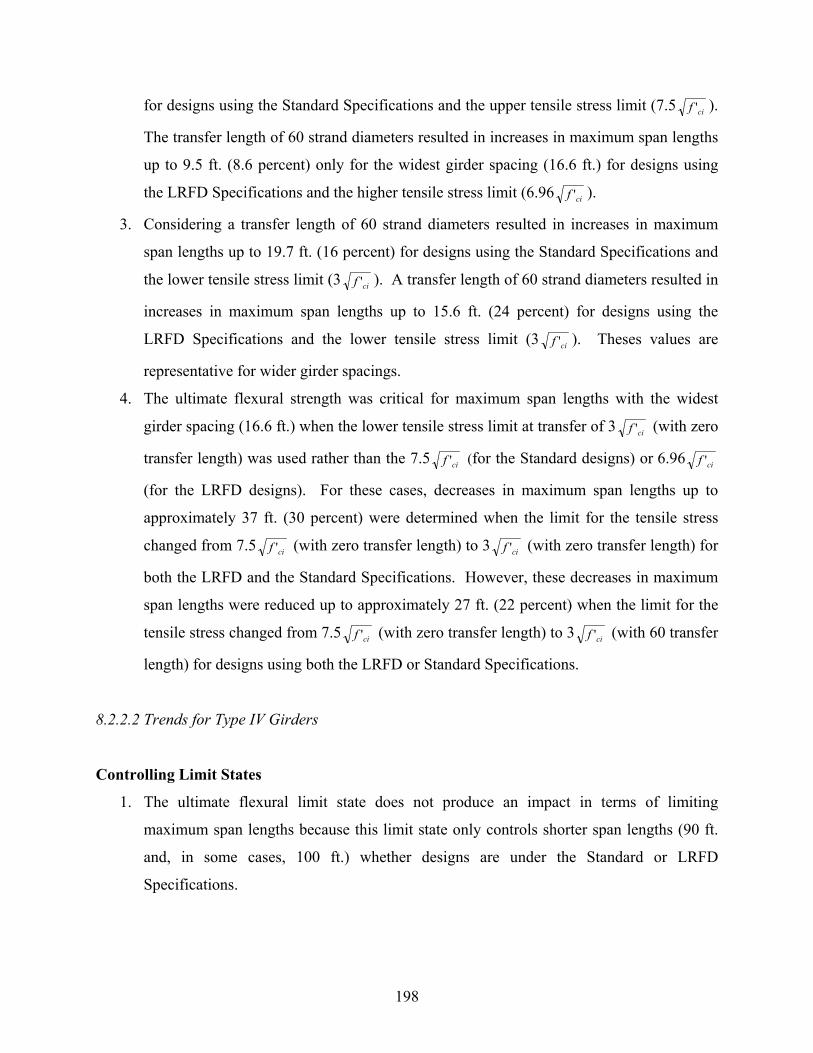
198
for designs using the Standard Specifications and the upper tensile stress limit (7.5 cif ' ).
The transfer length of 60 strand diameters resulted in increases in maximum span lengths
up to 9.5 ft. (8.6 percent) only for the widest girder spacing (16.6 ft.) for designs using
the LRFD Specifications and the higher tensile stress limit (6.96 cif ' ).
3. Considering a transfer length of 60 strand diameters resulted in increases in maximum
span lengths up to 19.7 ft. (16 percent) for designs using the Standard Specifications and
the lower tensile stress limit (3 cif ' ). A transfer length of 60 strand diameters resulted in
increases in maximum span lengths up to 15.6 ft. (24 percent) for designs using the
LRFD Specifications and the lower tensile stress limit (3 cif ' ). Theses values are
representative for wider girder spacings.
4. The ultimate flexural strength was critical for maximum span lengths with the widest
girder spacing (16.6 ft.) when the lower tensile stress limit at transfer of 3 cif ' (with zero
transfer length) was used rather than the 7.5 cif ' (for the Standard designs) or 6.96 cif '
(for the LRFD designs). For these cases, decreases in maximum span lengths up to
approximately 37 ft. (30 percent) were determined when the limit for the tensile stress
changed from 7.5 cif ' (with zero transfer length) to 3 cif ' (with zero transfer length) for
both the LRFD and the Standard Specifications. However, these decreases in maximum
span lengths were reduced up to approximately 27 ft. (22 percent) when the limit for the
tensile stress changed from 7.5 cif ' (with zero transfer length) to 3 cif ' (with 60 transfer
length) for designs using both the LRFD or Standard Specifications.
8.2.2.2 Trends for Type IV Girders
Controlling Limit States
1. The ultimate flexural limit state does not produce an impact in terms of limiting
maximum span lengths because this limit state only controls shorter span lengths (90 ft.
and, in some cases, 100 ft.) whether designs are under the Standard or LRFD
Specifications.
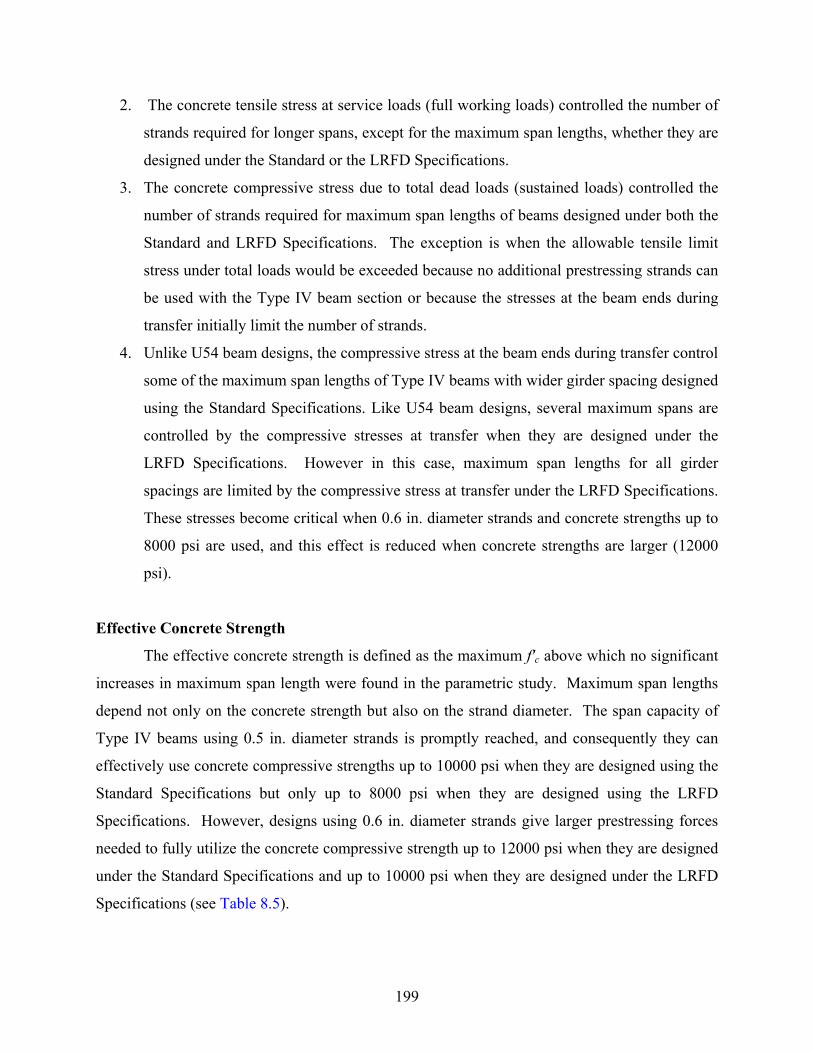
199
2. The concrete tensile stress at service loads (full working loads) controlled the number of
strands required for longer spans, except for the maximum span lengths, whether they are
designed under the Standard or the LRFD Specifications.
3. The concrete compressive stress due to total dead loads (sustained loads) controlled the
number of strands required for maximum span lengths of beams designed under both the
Standard and LRFD Specifications. The exception is when the allowable tensile limit
stress under total loads would be exceeded because no additional prestressing strands can
be used with the Type IV beam section or because the stresses at the beam ends during
transfer initially limit the number of strands.
4. Unlike U54 beam designs, the compressive stress at the beam ends during transfer control
some of the maximum span lengths of Type IV beams with wider girder spacing designed
using the Standard Specifications. Like U54 beam designs, several maximum spans are
controlled by the compressive stresses at transfer when they are designed under the
LRFD Specifications. However in this case, maximum span lengths for all girder
spacings are limited by the compressive stress at transfer under the LRFD Specifications.
These stresses become critical when 0.6 in. diameter strands and concrete strengths up to
8000 psi are used, and this effect is reduced when concrete strengths are larger (12000
psi).
Effective Concrete Strength
The effective concrete strength is defined as the maximum f'c above which no significant
increases in maximum span length were found in the parametric study. Maximum span lengths
depend not only on the concrete strength but also on the strand diameter. The span capacity of
Type IV beams using 0.5 in. diameter strands is promptly reached, and consequently they can
effectively use concrete compressive strengths up to 10000 psi when they are designed using the
Standard Specifications but only up to 8000 psi when they are designed using the LRFD
Specifications. However, designs using 0.6 in. diameter strands give larger prestressing forces
needed to fully utilize the concrete compressive strength up to 12000 psi when they are designed
under the Standard Specifications and up to 10000 psi when they are designed under the LRFD
Specifications (see Table 8.5).
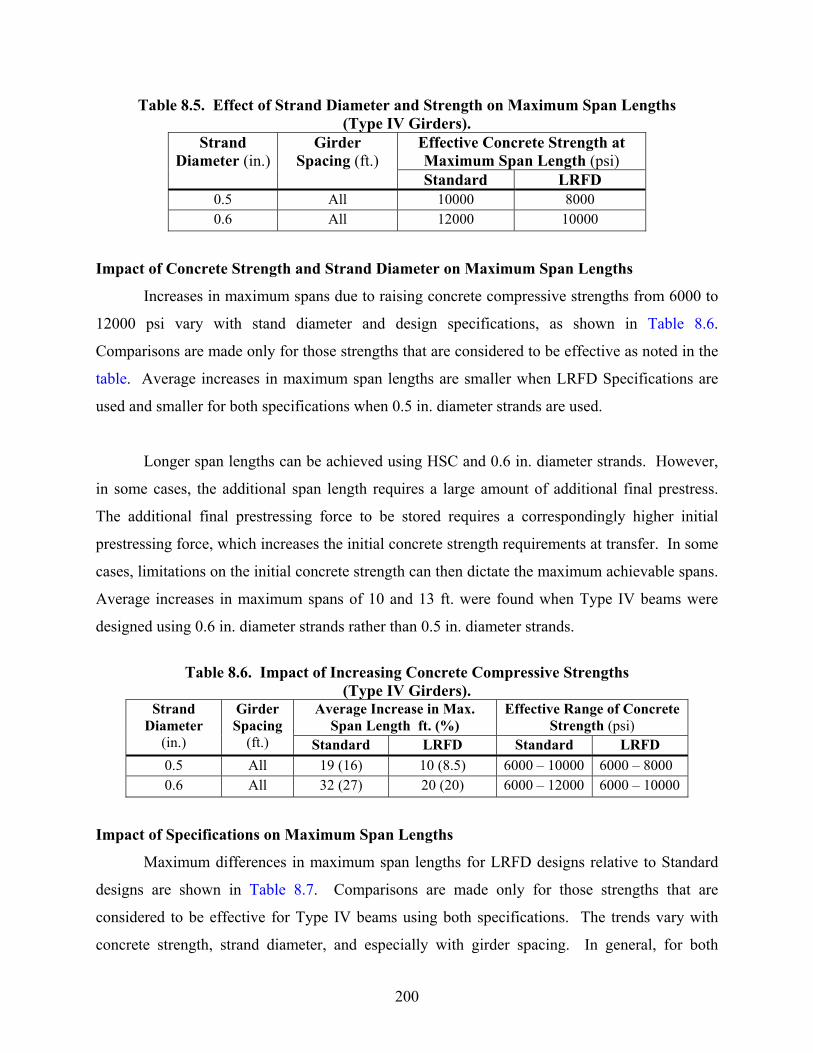
200
Table 8.5. Effect of Strand Diameter and Strength on Maximum Span Lengths (Type IV Girders).
Effective Concrete Strength at Maximum Span Length (psi)
Strand Diameter (in.)
Girder Spacing (ft.)
Standard LRFD 0.5 All 10000 8000 0.6 All 12000 10000
Impact of Concrete Strength and Strand Diameter on Maximum Span Lengths
Increases in maximum spans due to raising concrete compressive strengths from 6000 to
12000 psi vary with stand diameter and design specifications, as shown in Table 8.6.
Comparisons are made only for those strengths that are considered to be effective as noted in the
table. Average increases in maximum span lengths are smaller when LRFD Specifications are
used and smaller for both specifications when 0.5 in. diameter strands are used.
Longer span lengths can be achieved using HSC and 0.6 in. diameter strands. However,
in some cases, the additional span length requires a large amount of additional final prestress.
The additional final prestressing force to be stored requires a correspondingly higher initial
prestressing force, which increases the initial concrete strength requirements at transfer. In some
cases, limitations on the initial concrete strength can then dictate the maximum achievable spans.
Average increases in maximum spans of 10 and 13 ft. were found when Type IV beams were
designed using 0.6 in. diameter strands rather than 0.5 in. diameter strands.
Table 8.6. Impact of Increasing Concrete Compressive Strengths
(Type IV Girders). Average Increase in Max.
Span Length ft. (%) Effective Range of Concrete
Strength (psi) Strand
Diameter (in.)
Girder Spacing
(ft.) Standard LRFD Standard LRFD 0.5 All 19 (16) 10 (8.5) 6000 – 10000 6000 – 8000 0.6 All 32 (27) 20 (20) 6000 – 12000 6000 – 10000
Impact of Specifications on Maximum Span Lengths
Maximum differences in maximum span lengths for LRFD designs relative to Standard
designs are shown in Table 8.7. Comparisons are made only for those strengths that are
considered to be effective for Type IV beams using both specifications. The trends vary with
concrete strength, strand diameter, and especially with girder spacing. In general, for both
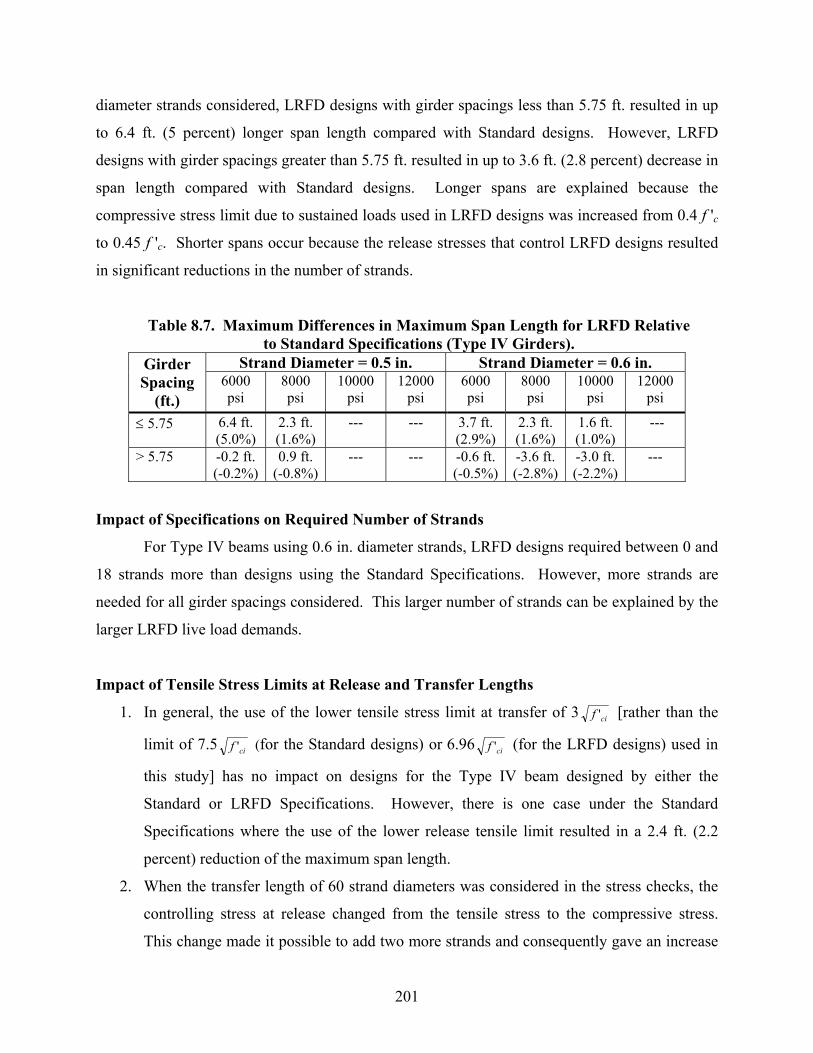
201
diameter strands considered, LRFD designs with girder spacings less than 5.75 ft. resulted in up
to 6.4 ft. (5 percent) longer span length compared with Standard designs. However, LRFD
designs with girder spacings greater than 5.75 ft. resulted in up to 3.6 ft. (2.8 percent) decrease in
span length compared with Standard designs. Longer spans are explained because the
compressive stress limit due to sustained loads used in LRFD designs was increased from 0.4 f 'c
to 0.45 f 'c. Shorter spans occur because the release stresses that control LRFD designs resulted
in significant reductions in the number of strands.
Table 8.7. Maximum Differences in Maximum Span Length for LRFD Relative to Standard Specifications (Type IV Girders).
Strand Diameter = 0.5 in. Strand Diameter = 0.6 in. Girder Spacing
(ft.) 6000 psi
8000 psi
10000 psi
12000 psi
6000 psi
8000 psi
10000 psi
12000 psi
≤ 5.75 6.4 ft. (5.0%)
2.3 ft. (1.6%)
--- --- 3.7 ft. (2.9%)
2.3 ft. (1.6%)
1.6 ft. (1.0%)
---
> 5.75 -0.2 ft. (-0.2%)
0.9 ft. (-0.8%)
--- --- -0.6 ft. (-0.5%)
-3.6 ft. (-2.8%)
-3.0 ft. (-2.2%)
---
Impact of Specifications on Required Number of Strands
For Type IV beams using 0.6 in. diameter strands, LRFD designs required between 0 and
18 strands more than designs using the Standard Specifications. However, more strands are
needed for all girder spacings considered. This larger number of strands can be explained by the
larger LRFD live load demands.
Impact of Tensile Stress Limits at Release and Transfer Lengths
1. In general, the use of the lower tensile stress limit at transfer of 3 cif ' [rather than the
limit of 7.5 cif ' (for the Standard designs) or 6.96 cif ' (for the LRFD designs) used in
this study] has no impact on designs for the Type IV beam designed by either the
Standard or LRFD Specifications. However, there is one case under the Standard
Specifications where the use of the lower release tensile limit resulted in a 2.4 ft. (2.2
percent) reduction of the maximum span length.
2. When the transfer length of 60 strand diameters was considered in the stress checks, the
controlling stress at release changed from the tensile stress to the compressive stress.
This change made it possible to add two more strands and consequently gave an increase
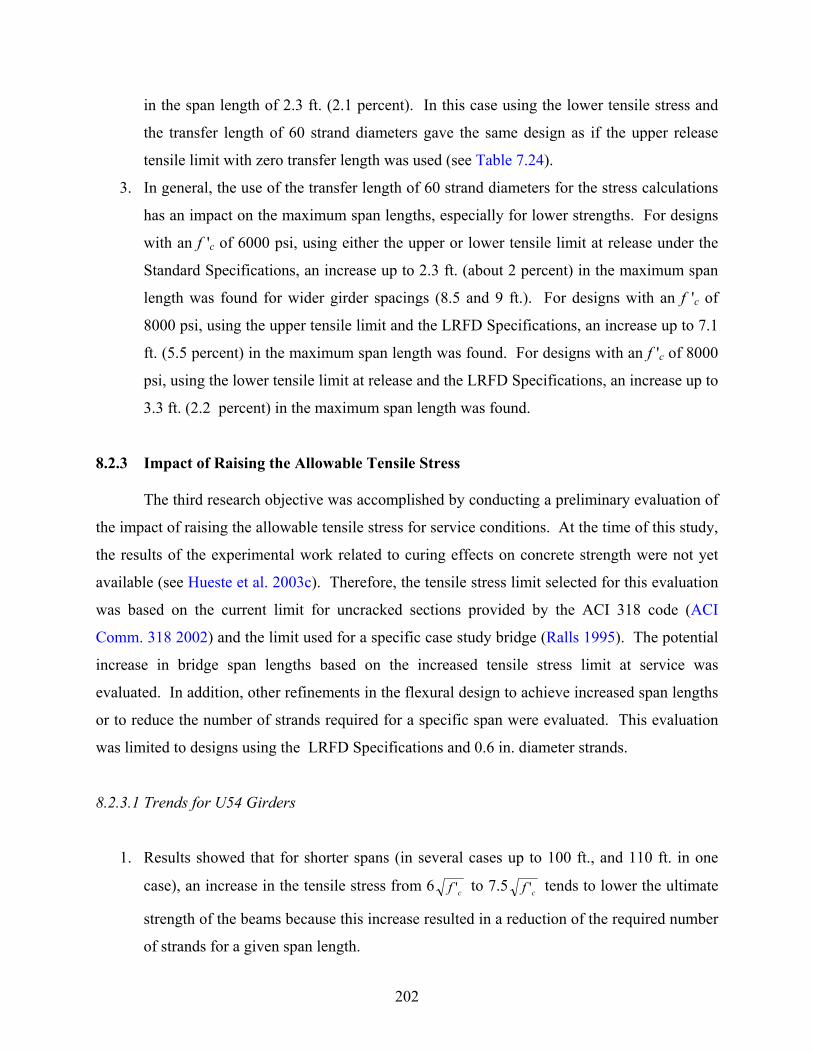
202
in the span length of 2.3 ft. (2.1 percent). In this case using the lower tensile stress and
the transfer length of 60 strand diameters gave the same design as if the upper release
tensile limit with zero transfer length was used (see Table 7.24).
3. In general, the use of the transfer length of 60 strand diameters for the stress calculations
has an impact on the maximum span lengths, especially for lower strengths. For designs
with an f 'c of 6000 psi, using either the upper or lower tensile limit at release under the
Standard Specifications, an increase up to 2.3 ft. (about 2 percent) in the maximum span
length was found for wider girder spacings (8.5 and 9 ft.). For designs with an f 'c of
8000 psi, using the upper tensile limit and the LRFD Specifications, an increase up to 7.1
ft. (5.5 percent) in the maximum span length was found. For designs with an f 'c of 8000
psi, using the lower tensile limit at release and the LRFD Specifications, an increase up to
3.3 ft. (2.2 percent) in the maximum span length was found.
8.2.3 Impact of Raising the Allowable Tensile Stress The third research objective was accomplished by conducting a preliminary evaluation of
the impact of raising the allowable tensile stress for service conditions. At the time of this study,
the results of the experimental work related to curing effects on concrete strength were not yet
available (see Hueste et al. 2003c). Therefore, the tensile stress limit selected for this evaluation
was based on the current limit for uncracked sections provided by the ACI 318 code (ACI
Comm. 318 2002) and the limit used for a specific case study bridge (Ralls 1995). The potential
increase in bridge span lengths based on the increased tensile stress limit at service was
evaluated. In addition, other refinements in the flexural design to achieve increased span lengths
or to reduce the number of strands required for a specific span were evaluated. This evaluation
was limited to designs using the LRFD Specifications and 0.6 in. diameter strands.
8.2.3.1 Trends for U54 Girders
1. Results showed that for shorter spans (in several cases up to 100 ft., and 110 ft. in one
case), an increase in the tensile stress from 6 cf ' to 7.5 cf ' tends to lower the ultimate
strength of the beams because this increase resulted in a reduction of the required number
of strands for a given span length.
203
2. For the same span length, an increase in the tensile stress from 6 cf ' to 7.5 cf ' resulted
in between one and seven (11 for one case) fewer strands. Reductions in the required
concrete strength at release were also found.
3. An increase in the tensile stress limit at service has an impact on maximum span lengths
only for U54 Beams with wider girder spacings (14 and 16.6 ft.) where the tensile stress
limit controls. An increase in the tensile limit at service from 6 cf ' to 7.5 cf ' resulted
in an increase in maximum span lengths up to 5.5 percent in these cases, with an increase
of six strands required.
4. An increase in the tensile limit at service from 6 cf ' to 7.5 cf ' resulted in an increase in
maximum span lengths of between approximately 2.5 and 4 ft. for the same number of
strands and girder spacing.
8.2.3.2 Trends for Type IV Girders
1. Results showed that for shorter spans (in several cases up to 110 ft., and 120 ft. in one
case) an increase in the tensile stress from 6 cf ' to 7.5 cf ' tended to lower the ultimate
strength of the beams because this increase resulted in a reduction of the required number
of strands for a given span length.
2. For the same span length, an increase in the tensile stress from 6 cf ' to 7.5 cf ' resulted
in between two and eight fewer strands required. However, no reductions in the required
concrete strength at release (f 'ci) were found.
3. An increase in the tensile stress limit at service from 6 cf ' to 7.5 cf ' impacted
maximum span lengths for all girder spacings where the tensile stress limit controls. An
increase in the tensile limit at service resulted in an increase in maximum span lengths up
to 2.1 percent (3.6 percent for one case); however, an increase of two strands was
required.
4. An increase in the tensile limit at service from 6 cf ' to 7.5 cf ' resulted in an increase
in maximum span lengths of between 2 and 4 ft. for the same number of strands and
girder spacing.
204
8.3 RECOMMENDATIONS FOR FLEXURAL DESIGN OF HSC PRESTRESSED GIRDERS
1. In general, for Type IV and U54 girders, designs should consider 0.6 in. diameter strands
to effectively use larger concrete strengths (12000 psi), whether they are designed under
the Standard or LRFD Specifications. For the same prestressing force, the use of 0.6 in.
diameter strands led to a number of strands less than the number required if 0.5 in.
diameter strands were used. Consequently, larger prestressing forces could be developed
to more fully utilize HSC.
2. For Type IV and U54 girders, considering a transfer length of 60 strand diameters in
design can provide additional span capability.
3. For Type IV and U54 girders, the use of the upper limit for the release tensile stress at the
beam ends (7.5 cif ' for the Standard Specifications and 6.96 cif ' for the LRFD
Specifications) rather than the lower limit of 3 cif ' leads to a significant increase in the
number of strands that can be used, and consequently, increased maximum span lengths
can be achieved. This approach is consistent with current TxDOT practices. The
parametric study indicated increases in span lengths up to 13 percent for girder spacings
less than or equal to 11.5 ft. and up to 30 percent for girder spacings greater than 11.5 ft.
for U54 Beams using 0.6 in. diameter strands.
4. The LRFD live load distribution factor equations (for typical cross section “c,” referred to
as cast-in-place concrete slab on open precast concrete boxes) used in this study for U54
girder spacings less than 11.5 ft. resulted in a significant reduction in the live load
moment demand compared with those obtained using the simplified expression S/11 for
designs under the Standard Specifications. Therefore, this refined distribution factor
expression is suggested for use in LRFD designs for U54 Beams.
205
8.4 RECOMMENDATIONS FOR FUTURE WORK
Based on the findings from this study, the following recommendations are made for future
studies.
1. This study focuses on AASHTO Type IV and Texas U54 prestressed concrete bridge
girders. It would also be useful to evaluate the impact of LRFD Specifications on other
types of bridge girders, as well as to evaluate the potential benefit of using HSC for other
types of bridge girders.
2. A preliminary assessment was made to determine the benefit of increasing the tensile
stress limit at service from the current value of 6 cf ' to 7.5 cf ' . More studies are
recommended to evaluate an increase in the allowable tensile stress at service conditions
for prestressed bridge girders. Objections have been raised as to increasing the tensile
stress limit because structures under service conditions may be subjected to overloads,
resulting in cracking of the concrete, since allowable stresses are specified on a more or
less empirical basis. It should be noted that the ACI 318-02 Building Code (ACI 318
2002) now allows design of prestressed members that are allowed to crack under service
condition. On the other hand, selection of allowable tensile stresses may include
considerations such as the type of girder, strength of concrete (NSC or HSC), and the
amount of prestressing and nonprestressing reinforcement. Concerns associated with
allowing an increase in the tensile stress include that this limit would tend to lower the
ultimate strength of the girder and to increase deflections under overloads due to reduced
area of prestressing steel for some cases. Also, cracking may expose the prestressing
steel to corrosion and, consequently, to possible fatigue failure. The acceptability of a
cracked prestressed section in bridge applications must be considered in refining stress
limits. The appropriateness of raising this limit is evaluated further in the report
documenting Phase 3 of this study (Hueste et al. 2003c).
3. HSC prestressed bridge girder designs are often controlled by the compressive stress
limits. The current limits for the compressive stresses were established to limit excessive
creep, camber, or other local strains. Evaluation of the appropriate compressive stress
limits for HSC was not within the scope of this project. Because the current code limits
are based on NSC properties and because they were found to be critical design criteria,
206
additional study would be useful to further assess whether these limits should be
modified for HSC prestressed girders
4. Safety and serviceability are controlled not only through the use of safety factors but also
by statistically defining specified loads and material properties and developing limits that
assure an acceptably low probability of failure of exceeding a limit state. The AASHTO
LRFD Specifications were developed using reliability theory to calibrate the load and
resistance factors for strength limit states. Service limit states should also be evaluated
using reliability analysis to assure more consistent safety margins against exceeding
conditions that ensure serviceability.
207
REFERENCES
AASHTO (1996). Standard Specifications for Highway Bridges, 16th Ed. American Association of State and Highway Transportation Officials (AASHTO), Washington, D.C.
AASHTO (2002a). Standard Specifications for Highway Bridges, 16th Ed., 2002 Interim
Revisions. American Association of State and Highway Transportation Officials (AASHTO), Washington, D.C.
AASHTO (2002b). AASHTO LRFD Bridge Design Specifications, 2nd Ed., 2002 Interim
Revisions. American Association of State and Highway Transportation Officials (AASHTO), Washington, D.C.
AASHTO (2003). Standard Specifications for Highway Bridges, 17th Ed., American Association
of State and Highway Transportation Officials (AASHTO), Washington, D.C. ACI Committee 318 (2002). “Building Code Requirements for Structural Concrete (ACI 318-02)
and Commentary (318R-99).” ACI 318-02/318R-02. ACI, Farmington Hills, Michigan. ACI Committee 363 (1997). “State of the Art Report on High Strength Concrete.” ACI 363R-92
(reapproved 1997). ACI, Farmington Hills, Michigan. ACI Committee 363 (1997). “State of the Art Report on High Strength Concrete.” ACI J., 81(4),
364-411. Adelman, D. and Cousins, T. (1990). “Evaluation of the Use of High Strength Concrete Bridge
Girders in Louisiana.” PCI J., 35(5), 70-78. Carrasquillo, R. L., Nilson, A. H., and Slate, F. O. (1981). “Properties of High Strength Concrete
Subject to Short Term Loads.” ACI J., 78(3), 171-178. Dolan, C. W., Ballinger, C. A., and LaFraugh, R. W. (1993). “High Strength Concrete in the
Precast Concrete Industry.” PCI J., 38(3), 16-19. Durning, T. A., and Rear, K. B. (1993). “Braker Lane Bridge-High Strength Concrete in
Prestressed Bridge Girders.” PCI J., 38(3), 46-51. Farny, J., and Panarese, W. (1994). “High Strength Concrete,” PCA Engineering Bulletin,
Skokie, Illinois.
208
Hueste, M.D., Trejo, D., Cline, D. and Keating, P. (2003a). “Investigation of Flexural Design Parameters for High Strength Concrete Prestressed Bridge Girders – Project Overview,” Research Report 2101-1, Texas Transportation Institute and Texas Department of Transportation, College Station, TX.
Hueste, M. D., Chompreda, P., Trejo, D., Cline, D., and Keating, P. (2003b). “Mechanical
Properties of High Strength Concrete Produced for Prestressed Bridge Girders.” Research Report 2101-2, Texas Transportation Institute and Texas Department of Transportation, College Station, TX.
Hueste, M. D., Moutassem, F., Trejo, D., and Cline, D. (2003c). “Impact of Field Exposure
Conditions on High Strength Concrete Produced for Prestressed Bridge Girders,” Research Report 2101-4, Texas Transportation Institute and Texas Department of Transportation, College Station, TX.
Lin, T. Y. (1963). Design of Prestressed Concrete Structures. 2nd Ed., John Wiley & Sons, New
York. Nawy, E. (2000). Prestressed Concrete. 2nd Ed., Prentice-Hall, Inc., New Jersey. Nilson, A. H. (1985). Design of Prestressed Concrete. John Wiley and Sons, New York. Nowak, A. (1999). “Calibration of LRFD Bridge Design Code.” NCHRP Report 368, National
Research Council, Washington, D.C. Nowak, A., and Collins, K. (2000). Reliability of Structures. International Edition, McGraw
Hill, Singapore. PCI (1997). Bridge Design Manual. 4th Ed. Precast/Prestressed Concrete Institute (PCI).
Chicago, Illinois. Rackwitz, R. and Fiessler, B. (1978). “Structural Reliability under Combined Random Load
Sequences.” Computers and Structures, 9, 489-494. Ralls, M. L. (1995). “High Performance Concrete U-Beam Bridge: From Research to
Construction.” Proc., 4th International Bridge Engineering Conference. 2, 207-212. Russell, B. W. (1994). “Impact of High Strength Concrete on the Design and Construction of
Pretensioned Girder Bridges.” PCI J., 39(4), 76-89. Tabsh, S. W., (1992). “Reliability Based Parametric Study of Pretensioned AASHTO Bridge
Girders.” PCI J., 3(5), 56-67. TxDOT (1980). Prestressed Concrete Bridge Girder Design Program, PSTRS14. Texas
Department of Transportation (TxDOT), Austin, Texas.
209
TxDOT (2001a). Bridge Division. “Bridge Design Manual,” Texas Department of Transportation (TxDOT), Austin, Texas.
TxDOT (2001b). Bridge Division. “Preliminary Design Guide for U-Beam Bridges.” Texas
Department of Transportation.

211
APPENDIX A
DISTRIBUTION FACTORS AND LIVE LOAD MOMENTS
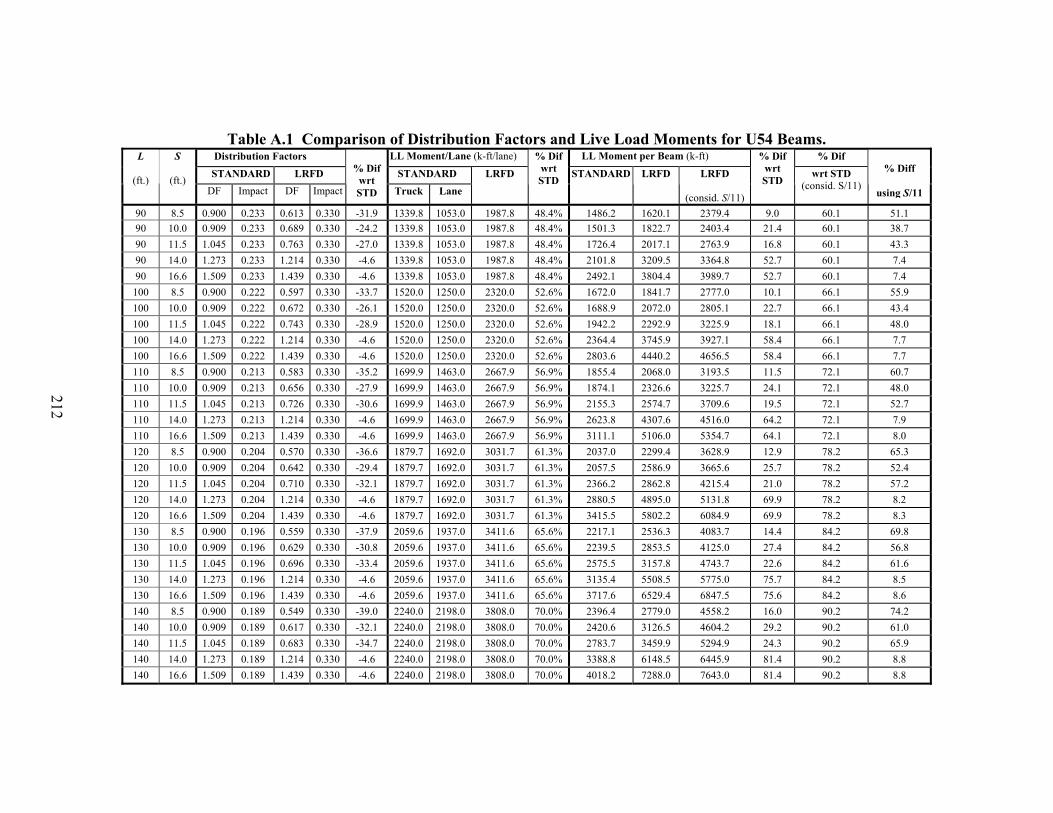
212
Table A.1 Comparison of Distribution Factors and Live Load Moments for U54 Beams. Distribution Factors LL Moment/Lane (k-ft/lane) LL Moment per Beam (k-ft) % Dif
STANDARD LRFD STANDARD
L
(ft.)
S
(ft.) DF Impact DF Impact
% Dif
wrt STD Truck Lane
LRFD
% Difwrt STD STANDARD LRFD LRFD
(consid. S/11)
% Dif wrt STD wrt STD
(consid. S/11)
% Diff
using S/11
90 8.5 0.900 0.233 0.613 0.330 -31.9 1339.8 1053.0 1987.8 48.4% 1486.2 1620.1 2379.4 9.0 60.1 51.190 10.0 0.909 0.233 0.689 0.330 -24.2 1339.8 1053.0 1987.8 48.4% 1501.3 1822.7 2403.4 21.4 60.1 38.7 90 11.5 1.045 0.233 0.763 0.330 -27.0 1339.8 1053.0 1987.8 48.4% 1726.4 2017.1 2763.9 16.8 60.1 43.3 90 14.0 1.273 0.233 1.214 0.330 -4.6 1339.8 1053.0 1987.8 48.4% 2101.8 3209.5 3364.8 52.7 60.1 7.4 90 16.6 1.509 0.233 1.439 0.330 -4.6 1339.8 1053.0 1987.8 48.4% 2492.1 3804.4 3989.7 52.7 60.1 7.4
100 8.5 0.900 0.222 0.597 0.330 -33.7 1520.0 1250.0 2320.0 52.6% 1672.0 1841.7 2777.0 10.1 66.1 55.9 100 10.0 0.909 0.222 0.672 0.330 -26.1 1520.0 1250.0 2320.0 52.6% 1688.9 2072.0 2805.1 22.7 66.1 43.4 100 11.5 1.045 0.222 0.743 0.330 -28.9 1520.0 1250.0 2320.0 52.6% 1942.2 2292.9 3225.9 18.1 66.1 48.0 100 14.0 1.273 0.222 1.214 0.330 -4.6 1520.0 1250.0 2320.0 52.6% 2364.4 3745.9 3927.1 58.4 66.1 7.7 100 16.6 1.509 0.222 1.439 0.330 -4.6 1520.0 1250.0 2320.0 52.6% 2803.6 4440.2 4656.5 58.4 66.1 7.7 110 8.5 0.900 0.213 0.583 0.330 -35.2 1699.9 1463.0 2667.9 56.9% 1855.4 2068.0 3193.5 11.5 72.1 60.7 110 10.0 0.909 0.213 0.656 0.330 -27.9 1699.9 1463.0 2667.9 56.9% 1874.1 2326.6 3225.7 24.1 72.1 48.0 110 11.5 1.045 0.213 0.726 0.330 -30.6 1699.9 1463.0 2667.9 56.9% 2155.3 2574.7 3709.6 19.5 72.1 52.7 110 14.0 1.273 0.213 1.214 0.330 -4.6 1699.9 1463.0 2667.9 56.9% 2623.8 4307.6 4516.0 64.2 72.1 7.9 110 16.6 1.509 0.213 1.439 0.330 -4.6 1699.9 1463.0 2667.9 56.9% 3111.1 5106.0 5354.7 64.1 72.1 8.0 120 8.5 0.900 0.204 0.570 0.330 -36.6 1879.7 1692.0 3031.7 61.3% 2037.0 2299.4 3628.9 12.9 78.2 65.3 120 10.0 0.909 0.204 0.642 0.330 -29.4 1879.7 1692.0 3031.7 61.3% 2057.5 2586.9 3665.6 25.7 78.2 52.4 120 11.5 1.045 0.204 0.710 0.330 -32.1 1879.7 1692.0 3031.7 61.3% 2366.2 2862.8 4215.4 21.0 78.2 57.2 120 14.0 1.273 0.204 1.214 0.330 -4.6 1879.7 1692.0 3031.7 61.3% 2880.5 4895.0 5131.8 69.9 78.2 8.2 120 16.6 1.509 0.204 1.439 0.330 -4.6 1879.7 1692.0 3031.7 61.3% 3415.5 5802.2 6084.9 69.9 78.2 8.3 130 8.5 0.900 0.196 0.559 0.330 -37.9 2059.6 1937.0 3411.6 65.6% 2217.1 2536.3 4083.7 14.4 84.2 69.8 130 10.0 0.909 0.196 0.629 0.330 -30.8 2059.6 1937.0 3411.6 65.6% 2239.5 2853.5 4125.0 27.4 84.2 56.8 130 11.5 1.045 0.196 0.696 0.330 -33.4 2059.6 1937.0 3411.6 65.6% 2575.5 3157.8 4743.7 22.6 84.2 61.6 130 14.0 1.273 0.196 1.214 0.330 -4.6 2059.6 1937.0 3411.6 65.6% 3135.4 5508.5 5775.0 75.7 84.2 8.5 130 16.6 1.509 0.196 1.439 0.330 -4.6 2059.6 1937.0 3411.6 65.6% 3717.6 6529.4 6847.5 75.6 84.2 8.6 140 8.5 0.900 0.189 0.549 0.330 -39.0 2240.0 2198.0 3808.0 70.0% 2396.4 2779.0 4558.2 16.0 90.2 74.2 140 10.0 0.909 0.189 0.617 0.330 -32.1 2240.0 2198.0 3808.0 70.0% 2420.6 3126.5 4604.2 29.2 90.2 61.0 140 11.5 1.045 0.189 0.683 0.330 -34.7 2240.0 2198.0 3808.0 70.0% 2783.7 3459.9 5294.9 24.3 90.2 65.9 140 14.0 1.273 0.189 1.214 0.330 -4.6 2240.0 2198.0 3808.0 70.0% 3388.8 6148.5 6445.9 81.4 90.2 8.8 140 16.6 1.509 0.189 1.439 0.330 -4.6 2240.0 2198.0 3808.0 70.0% 4018.2 7288.0 7643.0 81.4 90.2 8.8
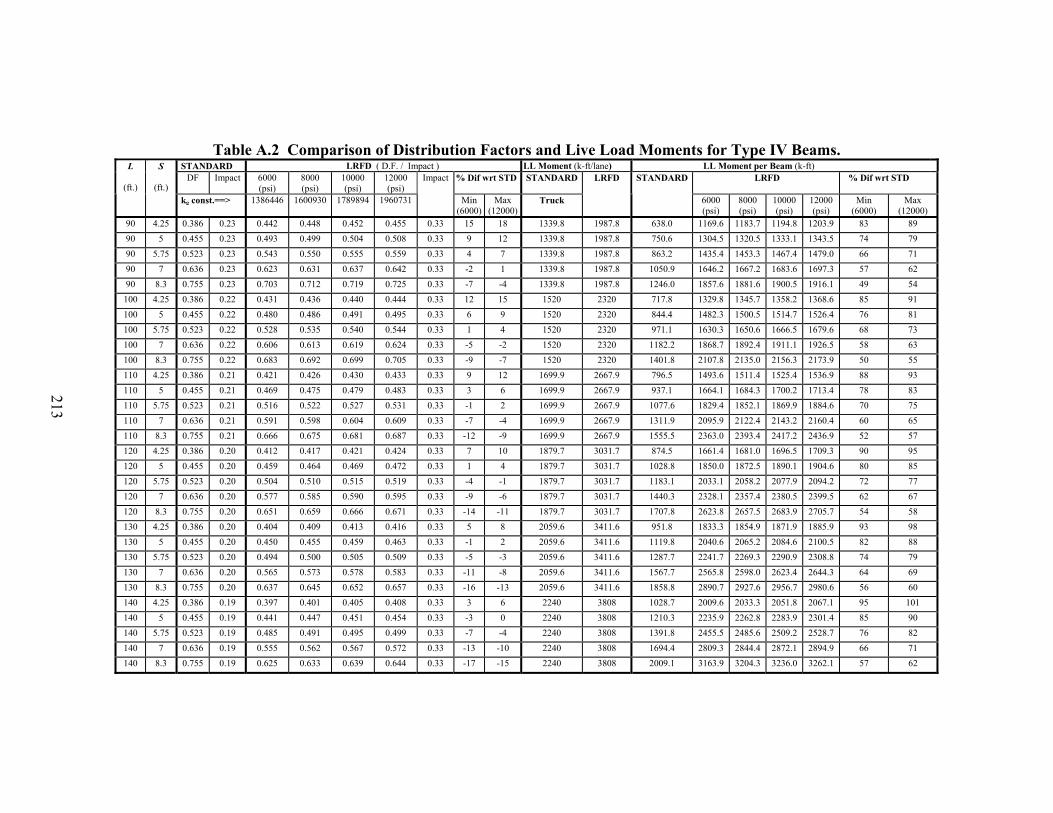
213
Table A.2 Comparison of Distribution Factors and Live Load Moments for Type IV Beams. STANDARD LRFD ( D.F. / Impact ) LL Moment (k-ft/lane) LL Moment per Beam (k-ft)
DF Impact 6000 (psi)
8000 (psi)
10000 (psi)
12000 (psi)
% Dif wrt STD STANDARD LRFD % Dif wrt STD L
(ft.)
S
(ft.) kg const.==> 1386446 1600930 1789894 1960731
Impact
Min (6000)
Max (12000)
Truck
LRFD STANDARD
6000(psi)
8000(psi)
10000(psi)
12000(psi)
Min (6000)
Max (12000)
90 4.25 0.386 0.23 0.442 0.448 0.452 0.455 0.33 15 18 1339.8 1987.8 638.0 1169.6 1183.7 1194.8 1203.9 83 89 90 5 0.455 0.23 0.493 0.499 0.504 0.508 0.33 9 12 1339.8 1987.8 750.6 1304.5 1320.5 1333.1 1343.5 74 79 90 5.75 0.523 0.23 0.543 0.550 0.555 0.559 0.33 4 7 1339.8 1987.8 863.2 1435.4 1453.3 1467.4 1479.0 66 71 90 7 0.636 0.23 0.623 0.631 0.637 0.642 0.33 -2 1 1339.8 1987.8 1050.9 1646.2 1667.2 1683.6 1697.3 57 62 90 8.3 0.755 0.23 0.703 0.712 0.719 0.725 0.33 -7 -4 1339.8 1987.8 1246.0 1857.6 1881.6 1900.5 1916.1 49 54 100 4.25 0.386 0.22 0.431 0.436 0.440 0.444 0.33 12 15 1520 2320 717.8 1329.8 1345.7 1358.2 1368.6 85 91 100 5 0.455 0.22 0.480 0.486 0.491 0.495 0.33 6 9 1520 2320 844.4 1482.3 1500.5 1514.7 1526.4 76 81 100 5.75 0.523 0.22 0.528 0.535 0.540 0.544 0.33 1 4 1520 2320 971.1 1630.3 1650.6 1666.5 1679.6 68 73 100 7 0.636 0.22 0.606 0.613 0.619 0.624 0.33 -5 -2 1520 2320 1182.2 1868.7 1892.4 1911.1 1926.5 58 63 100 8.3 0.755 0.22 0.683 0.692 0.699 0.705 0.33 -9 -7 1520 2320 1401.8 2107.8 2135.0 2156.3 2173.9 50 55 110 4.25 0.386 0.21 0.421 0.426 0.430 0.433 0.33 9 12 1699.9 2667.9 796.5 1493.6 1511.4 1525.4 1536.9 88 93 110 5 0.455 0.21 0.469 0.475 0.479 0.483 0.33 3 6 1699.9 2667.9 937.1 1664.1 1684.3 1700.2 1713.4 78 83 110 5.75 0.523 0.21 0.516 0.522 0.527 0.531 0.33 -1 2 1699.9 2667.9 1077.6 1829.4 1852.1 1869.9 1884.6 70 75 110 7 0.636 0.21 0.591 0.598 0.604 0.609 0.33 -7 -4 1699.9 2667.9 1311.9 2095.9 2122.4 2143.2 2160.4 60 65 110 8.3 0.755 0.21 0.666 0.675 0.681 0.687 0.33 -12 -9 1699.9 2667.9 1555.5 2363.0 2393.4 2417.2 2436.9 52 57 120 4.25 0.386 0.20 0.412 0.417 0.421 0.424 0.33 7 10 1879.7 3031.7 874.5 1661.4 1681.0 1696.5 1709.3 90 95 120 5 0.455 0.20 0.459 0.464 0.469 0.472 0.33 1 4 1879.7 3031.7 1028.8 1850.0 1872.5 1890.1 1904.6 80 85 120 5.75 0.523 0.20 0.504 0.510 0.515 0.519 0.33 -4 -1 1879.7 3031.7 1183.1 2033.1 2058.2 2077.9 2094.2 72 77 120 7 0.636 0.20 0.577 0.585 0.590 0.595 0.33 -9 -6 1879.7 3031.7 1440.3 2328.1 2357.4 2380.5 2399.5 62 67 120 8.3 0.755 0.20 0.651 0.659 0.666 0.671 0.33 -14 -11 1879.7 3031.7 1707.8 2623.8 2657.5 2683.9 2705.7 54 58 130 4.25 0.386 0.20 0.404 0.409 0.413 0.416 0.33 5 8 2059.6 3411.6 951.8 1833.3 1854.9 1871.9 1885.9 93 98 130 5 0.455 0.20 0.450 0.455 0.459 0.463 0.33 -1 2 2059.6 3411.6 1119.8 2040.6 2065.2 2084.6 2100.5 82 88 130 5.75 0.523 0.20 0.494 0.500 0.505 0.509 0.33 -5 -3 2059.6 3411.6 1287.7 2241.7 2269.3 2290.9 2308.8 74 79 130 7 0.636 0.20 0.565 0.573 0.578 0.583 0.33 -11 -8 2059.6 3411.6 1567.7 2565.8 2598.0 2623.4 2644.3 64 69 130 8.3 0.755 0.20 0.637 0.645 0.652 0.657 0.33 -16 -13 2059.6 3411.6 1858.8 2890.7 2927.6 2956.7 2980.6 56 60 140 4.25 0.386 0.19 0.397 0.401 0.405 0.408 0.33 3 6 2240 3808 1028.7 2009.6 2033.3 2051.8 2067.1 95 101 140 5 0.455 0.19 0.441 0.447 0.451 0.454 0.33 -3 0 2240 3808 1210.3 2235.9 2262.8 2283.9 2301.4 85 90 140 5.75 0.523 0.19 0.485 0.491 0.495 0.499 0.33 -7 -4 2240 3808 1391.8 2455.5 2485.6 2509.2 2528.7 76 82 140 7 0.636 0.19 0.555 0.562 0.567 0.572 0.33 -13 -10 2240 3808 1694.4 2809.3 2844.4 2872.1 2894.9 66 71 140 8.3 0.755 0.19 0.625 0.633 0.639 0.644 0.33 -17 -15 2240 3808 2009.1 3163.9 3204.3 3236.0 3262.1 57 62

215
APPENDIX B
SURVEY OF CURRENT PRACTICE
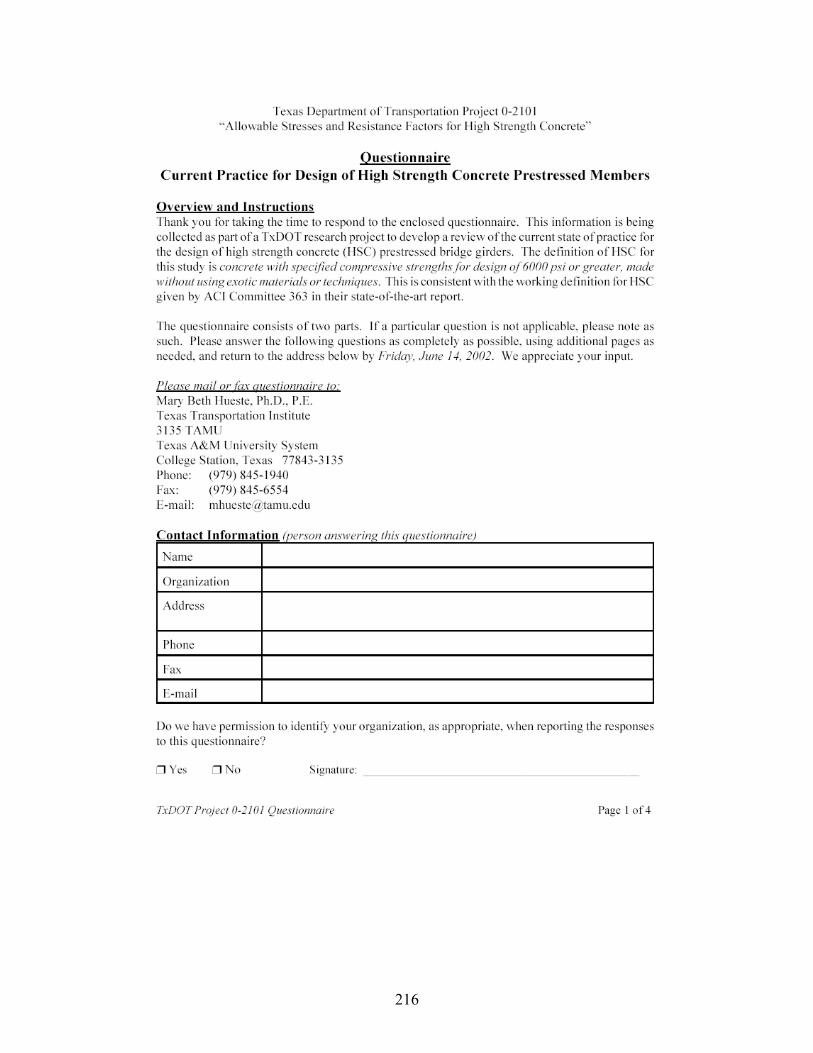
216
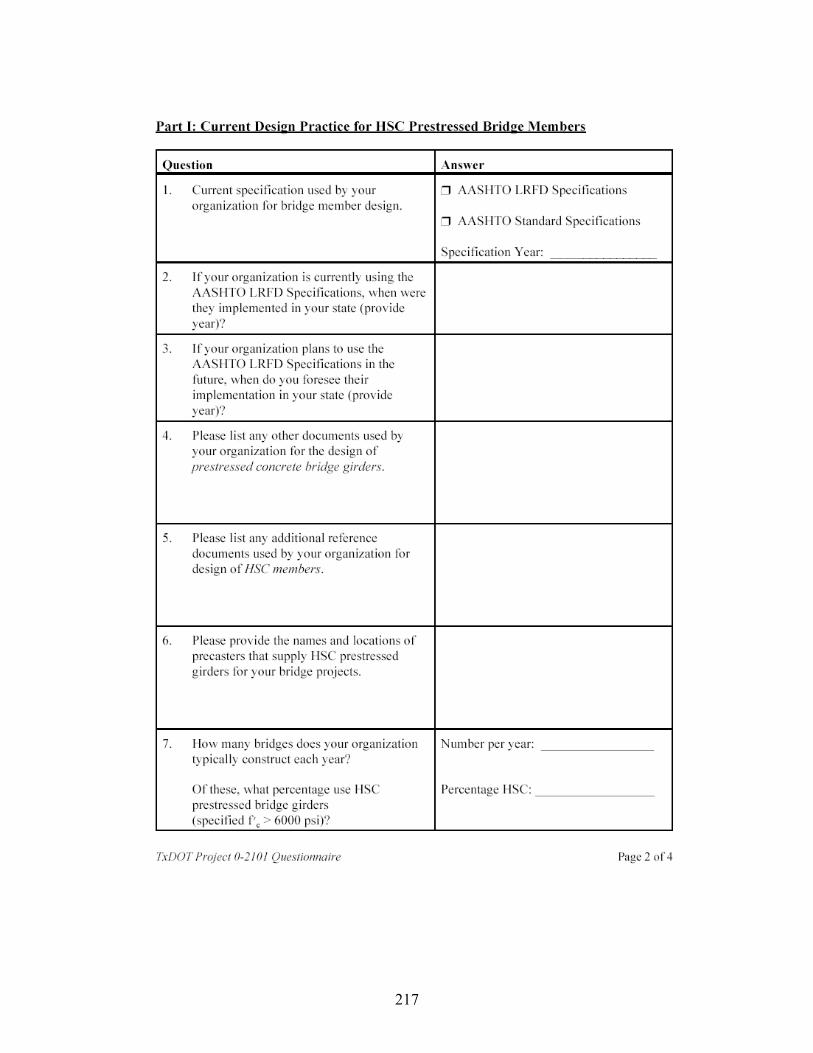
217
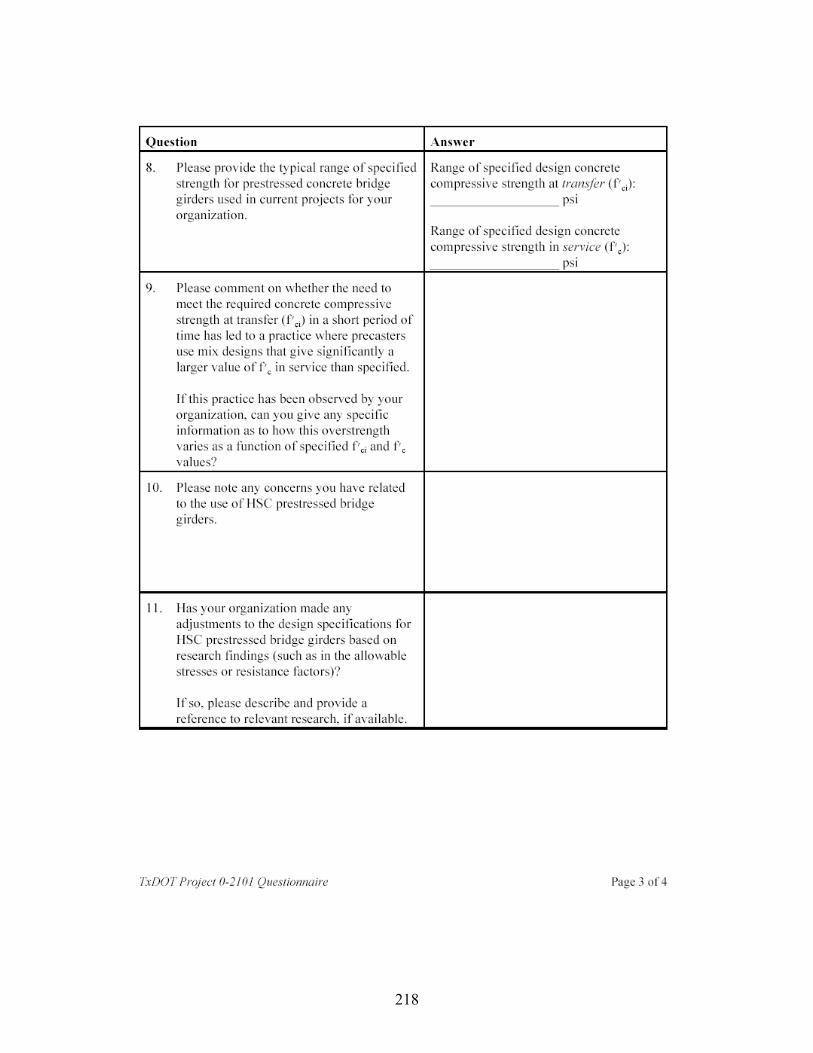
218
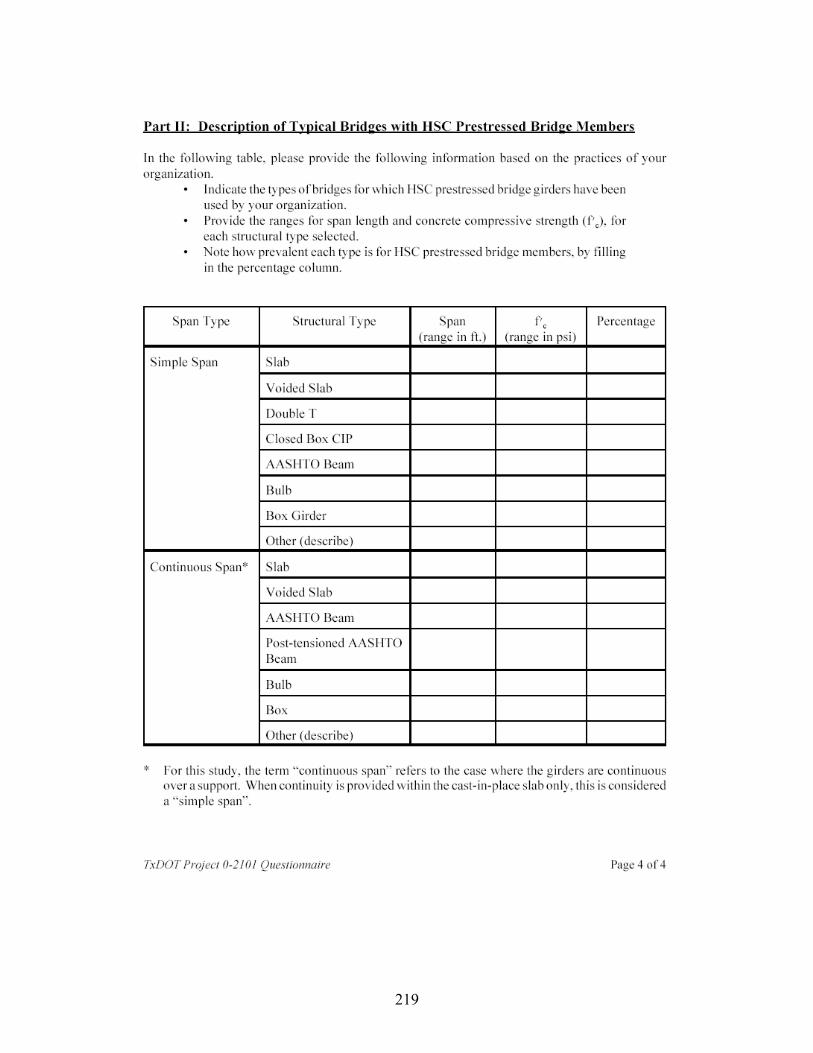
219
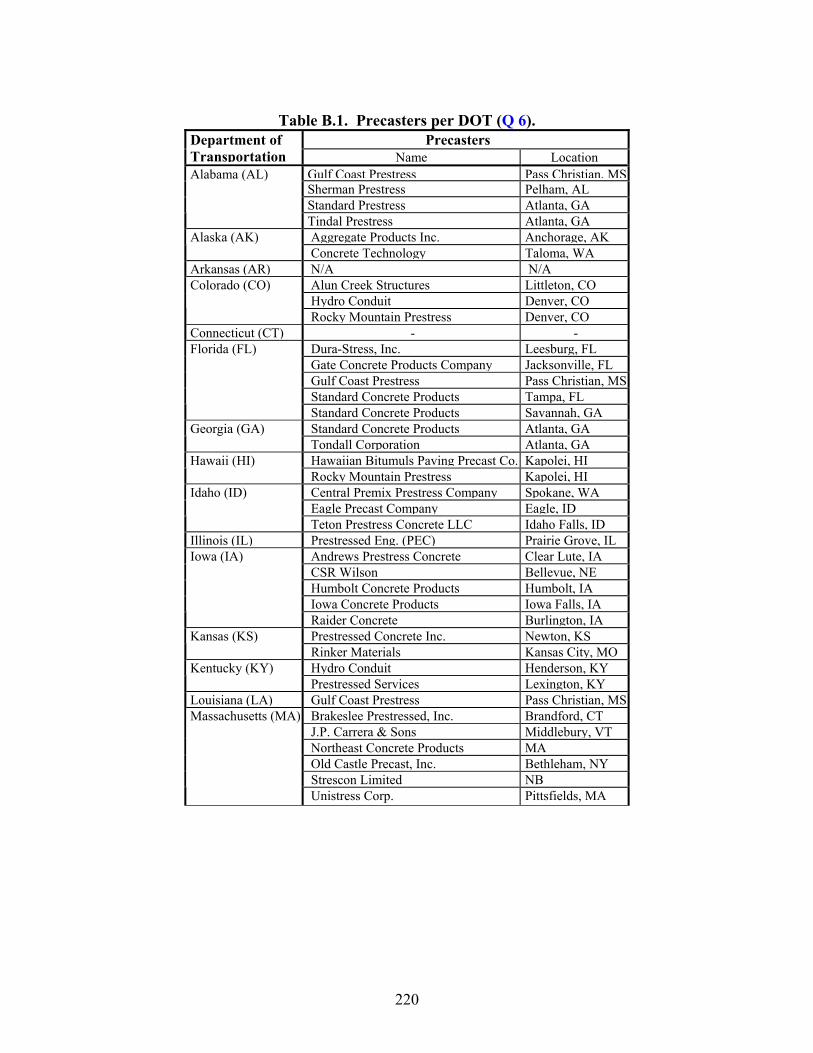
220
Table B.1. Precasters per DOT (Q 6).
Precasters Department of Transportation Name Location
Gulf Coast Prestress Pass Christian, MSSherman Prestress Pelham, AL Standard Prestress Atlanta, GA
Alabama (AL)
Tindal Prestress Atlanta, GA Aggregate Products Inc. Anchorage, AK Alaska (AK) Concrete Technology Taloma, WA
Arkansas (AR) N/A N/A Alun Creek Structures Littleton, CO Hydro Conduit Denver, CO
Colorado (CO)
Rocky Mountain Prestress Denver, CO Connecticut (CT) - -
Dura-Stress, Inc. Leesburg, FL Gate Concrete Products Company Jacksonville, FL Gulf Coast Prestress Pass Christian, MS Standard Concrete Products Tampa, FL
Florida (FL)
Standard Concrete Products Savannah, GA Standard Concrete Products Atlanta, GA Georgia (GA) Tondall Corporation Atlanta, GA Hawaiian Bitumuls Paving Precast Co. Kapolei, HI Hawaii (HI) Rocky Mountain Prestress Kapolei, HI Central Premix Prestress Company Spokane, WA Eagle Precast Company Eagle, ID
Idaho (ID)
Teton Prestress Concrete LLC Idaho Falls, ID Illinois (IL) Prestressed Eng. (PEC) Prairie Grove, IL
Andrews Prestress Concrete Clear Lute, IA CSR Wilson Bellevue, NE Humbolt Concrete Products Humbolt, IA Iowa Concrete Products Iowa Falls, IA
Iowa (IA)
Raider Concrete Burlington, IA Prestressed Concrete Inc. Newton, KS Kansas (KS) Rinker Materials Kansas City, MO Hydro Conduit Henderson, KY Kentucky (KY) Prestressed Services Lexington, KY
Louisiana (LA) Gulf Coast Prestress Pass Christian, MS Brakeslee Prestressed, Inc. Brandford, CT J.P. Carrera & Sons Middlebury, VT Northeast Concrete Products MA Old Castle Precast, Inc. Bethleham, NY Strescon Limited NB
Massachusetts (MA)
Unistress Corp. Pittsfields, MA
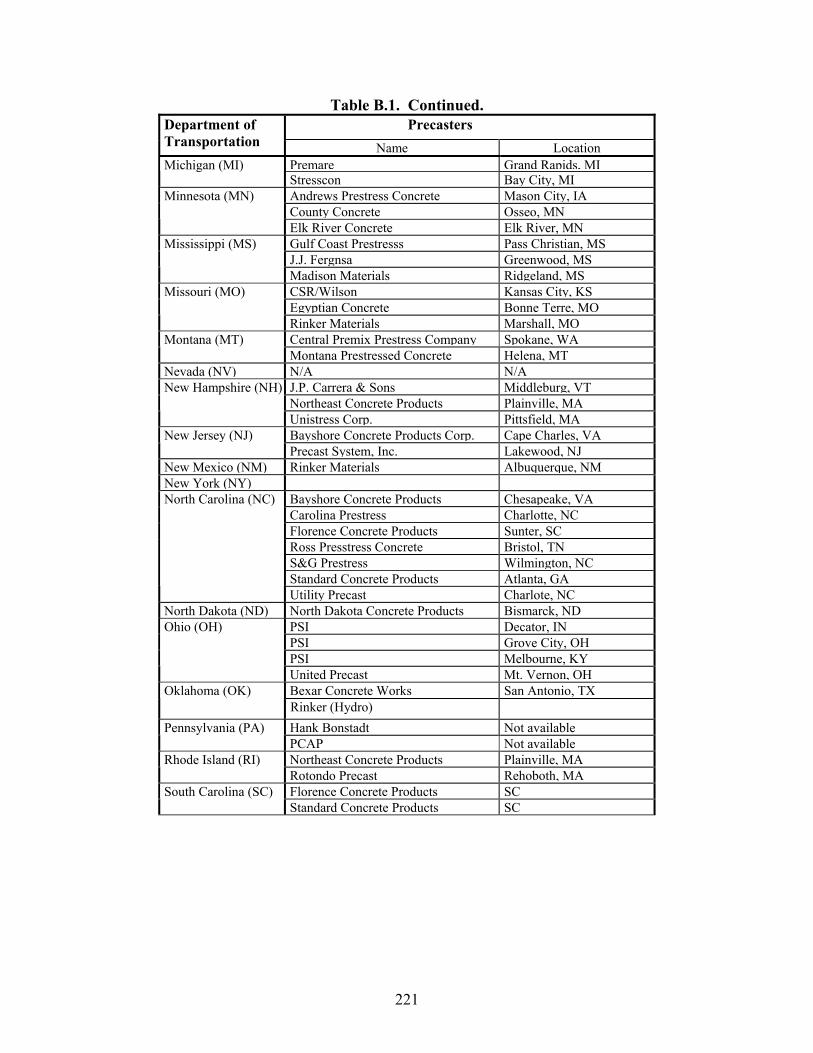
221
Table B.1. Continued. Precasters Department of
Transportation Name Location Premare Grand Rapids, MIMichigan (MI) Stresscon Bay City, MI Andrews Prestress Concrete Mason City, IA County Concrete Osseo, MN
Minnesota (MN)
Elk River Concrete Elk River, MN Gulf Coast Prestresss Pass Christian, MS J.J. Fergnsa Greenwood, MS
Mississippi (MS)
Madison Materials Ridgeland, MS CSR/Wilson Kansas City, KS Egyptian Concrete Bonne Terre, MO
Missouri (MO)
Rinker Materials Marshall, MO Central Premix Prestress Company Spokane, WA Montana (MT) Montana Prestressed Concrete Helena, MT
Nevada (NV) N/A N/AJ.P. Carrera & Sons Middleburg, VT Northeast Concrete Products Plainville, MA
New Hampshire (NH)
Unistress Corp. Pittsfield, MA Bayshore Concrete Products Corp. Cape Charles, VA New Jersey (NJ) Precast System, Inc. Lakewood, NJ
New Mexico (NM) Rinker Materials Albuquerque, NM New York (NY)
Bayshore Concrete Products Chesapeake, VA Carolina Prestress Charlotte, NC Florence Concrete Products Sunter, SCRoss Presstress Concrete Bristol, TNS&G Prestress Wilmington, NC Standard Concrete Products Atlanta, GA
North Carolina (NC)
Utility Precast Charlote, NC North Dakota (ND) North Dakota Concrete Products Bismarck, ND
PSI Decator, INPSI Grove City, OH PSI Melbourne, KY
Ohio (OH)
United Precast Mt. Vernon, OH Bexar Concrete Works San Antonio, TX Oklahoma (OK)
Rinker (Hydro) Hank Bonstadt Not available Pennsylvania (PA) PCAP Not available Northeast Concrete Products Plainville, MA Rhode Island (RI) Rotondo Precast Rehoboth, MA Florence Concrete Products SCSouth Carolina (SC) Standard Concrete Products SC
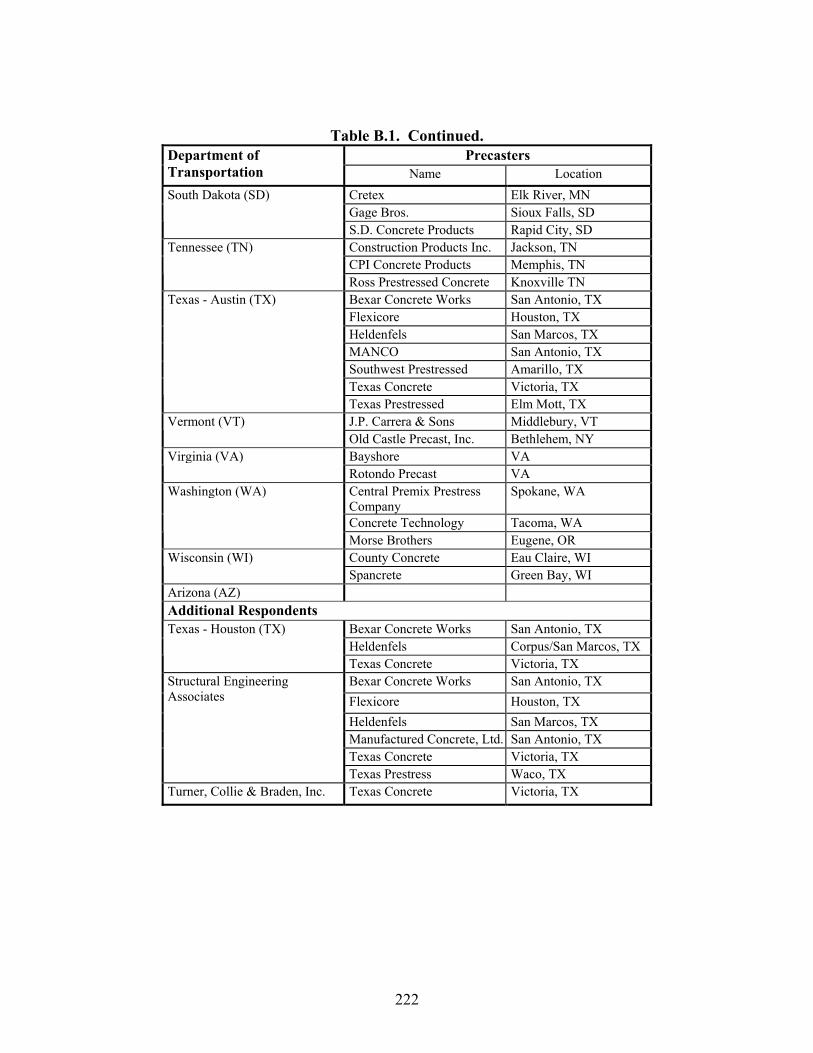
222
Table B.1. Continued. Precasters Department of
Transportation Name Location Cretex Elk River, MN Gage Bros. Sioux Falls, SD
South Dakota (SD)
S.D. Concrete Products Rapid City, SD Construction Products Inc. Jackson, TN CPI Concrete Products Memphis, TN
Tennessee (TN)
Ross Prestressed Concrete Knoxville TN Bexar Concrete Works San Antonio, TX Flexicore Houston, TX Heldenfels San Marcos, TX MANCO San Antonio, TX Southwest Prestressed Amarillo, TX Texas Concrete Victoria, TX
Texas - Austin (TX)
Texas Prestressed Elm Mott, TX J.P. Carrera & Sons Middlebury, VT Vermont (VT) Old Castle Precast, Inc. Bethlehem, NY Bayshore VA Virginia (VA) Rotondo Precast VA Central Premix Prestress Company
Spokane, WA
Concrete Technology Tacoma, WA
Washington (WA)
Morse Brothers Eugene, OR County Concrete Eau Claire, WI Wisconsin (WI) Spancrete Green Bay, WI
Arizona (AZ) Additional Respondents
Bexar Concrete Works San Antonio, TX Heldenfels Corpus/San Marcos, TX
Texas - Houston (TX)
Texas Concrete Victoria, TX Bexar Concrete Works San Antonio, TX Flexicore Houston, TX Heldenfels San Marcos, TX Manufactured Concrete, Ltd. San Antonio, TX Texas Concrete Victoria, TX
Structural Engineering Associates
Texas Prestress Waco, TX Turner, Collie & Braden, Inc. Texas Concrete Victoria, TX
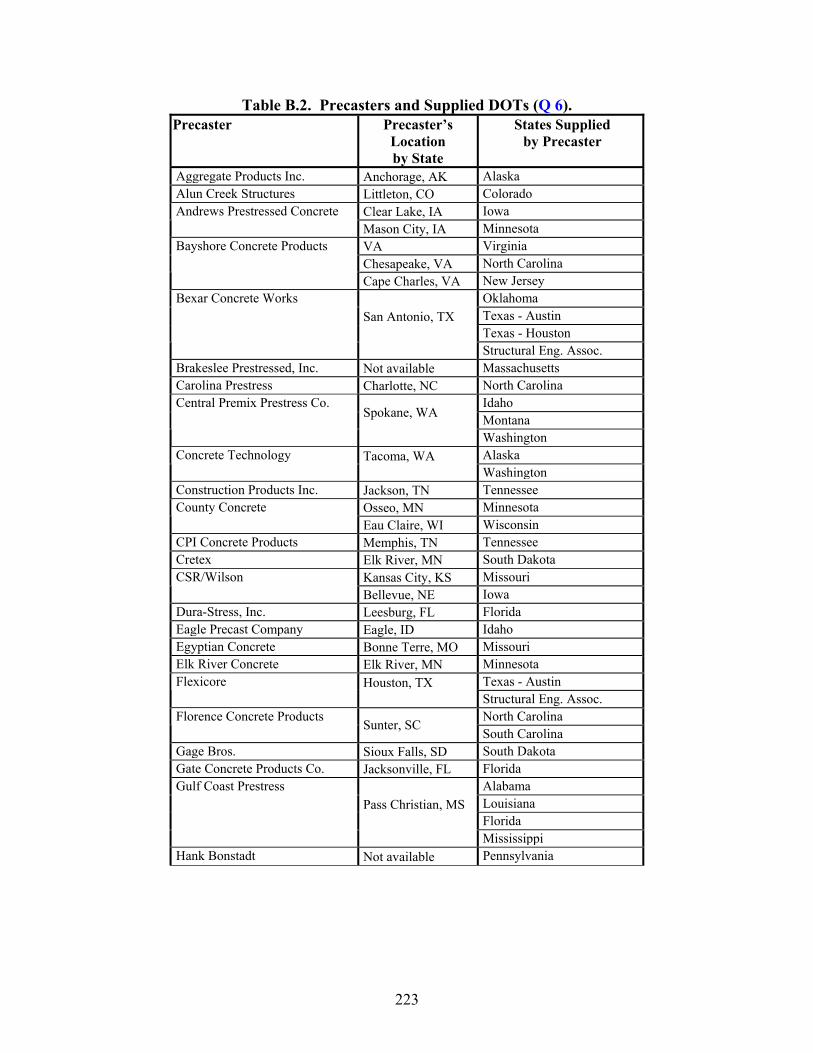
223
Table B.2. Precasters and Supplied DOTs (Q 6). Precaster Precaster’s
Location by State
States Supplied by Precaster
Aggregate Products Inc. Anchorage, AK Alaska Alun Creek Structures Littleton, CO Colorado
Clear Lake, IA Iowa Andrews Prestressed Concrete Mason City, IA Minnesota VA Virginia Chesapeake, VA North Carolina
Bayshore Concrete Products
Cape Charles, VA New Jersey Oklahoma Texas - Austin Texas - Houston
Bexar Concrete Works San Antonio, TX
Structural Eng. Assoc. Brakeslee Prestressed, Inc. Not available Massachusetts Carolina Prestress Charlotte, NC North Carolina
Idaho Montana
Central Premix Prestress Co. Spokane, WA
Washington Alaska Concrete Technology Tacoma, WA
Washington Construction Products Inc. Jackson, TN Tennessee
Osseo, MN Minnesota County Concrete Eau Claire, WI Wisconsin
CPI Concrete Products Memphis, TN Tennessee Cretex Elk River, MN South Dakota
Kansas City, KS Missouri CSR/Wilson Bellevue, NE Iowa
Dura-Stress, Inc. Leesburg, FL Florida Eagle Precast Company Eagle, ID Idaho Egyptian Concrete Bonne Terre, MO Missouri Elk River Concrete Elk River, MN Minnesota
Texas - Austin Flexicore Houston, TX Structural Eng. Assoc.
North Carolina Florence Concrete Products Sunter, SC South Carolina
Gage Bros. Sioux Falls, SD South Dakota Gate Concrete Products Co. Jacksonville, FL Florida
Alabama Louisiana Florida
Gulf Coast Prestress Pass Christian, MS
Mississippi Hank Bonstadt Not available Pennsylvania
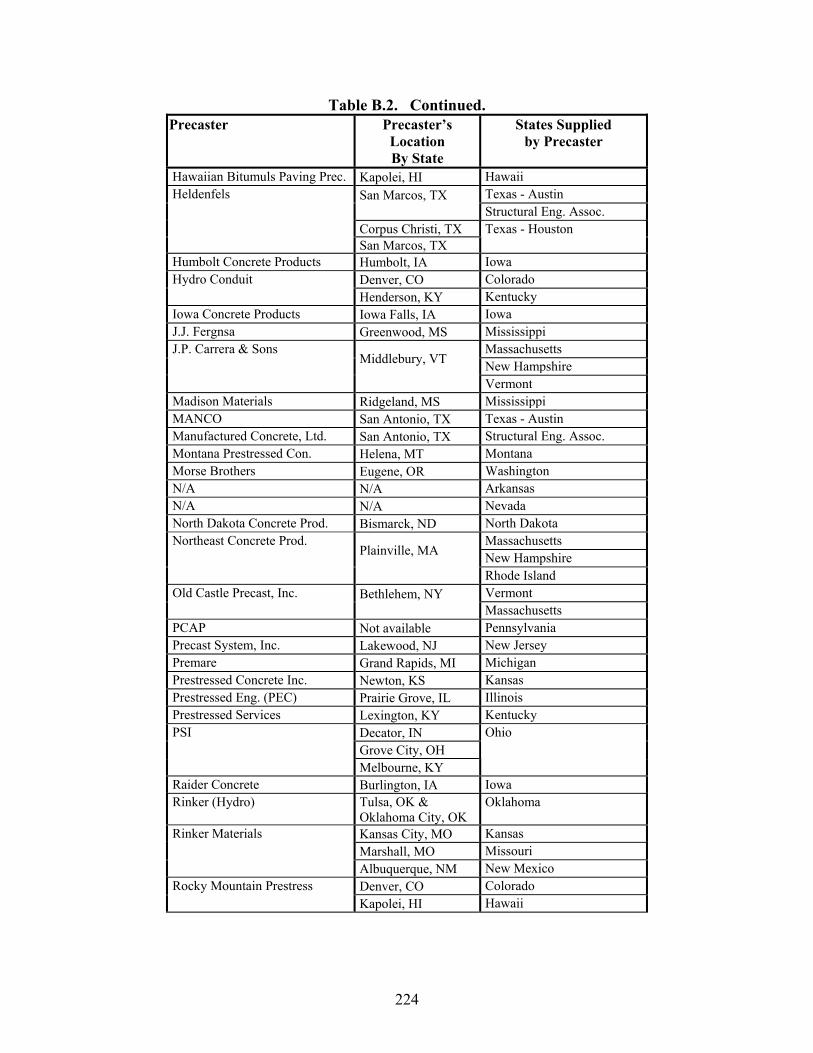
224
Table B.2. Continued. Precaster Precaster’s
Location By State
States Supplied by Precaster
Hawaiian Bitumuls Paving Prec. Kapolei, HI Hawaii Texas - Austin San Marcos, TX
Structural Eng. Assoc. Corpus Christi, TX
Heldenfels
San Marcos, TX Texas - Houston
Humbolt Concrete Products Humbolt, IA Iowa Denver, CO Colorado Hydro Conduit Henderson, KY Kentucky
Iowa Concrete Products Iowa Falls, IA Iowa J.J. Fergnsa Greenwood, MS Mississippi
Massachusetts New Hampshire
J.P. Carrera & Sons Middlebury, VT
Vermont Madison Materials Ridgeland, MS Mississippi MANCO San Antonio, TX Texas - Austin Manufactured Concrete, Ltd. San Antonio, TX Structural Eng. Assoc. Montana Prestressed Con. Helena, MT Montana Morse Brothers Eugene, OR Washington N/A N/A Arkansas N/A N/A Nevada North Dakota Concrete Prod. Bismarck, ND North Dakota
Massachusetts New Hampshire
Northeast Concrete Prod. Plainville, MA
Rhode Island Vermont Old Castle Precast, Inc. Bethlehem, NY
Massachusetts PCAP Not available Pennsylvania Precast System, Inc. Lakewood, NJ New Jersey Premare Grand Rapids, MI Michigan Prestressed Concrete Inc. Newton, KS Kansas Prestressed Eng. (PEC) Prairie Grove, IL Illinois Prestressed Services Lexington, KY Kentucky
Decator, IN Grove City, OH
PSI
Melbourne, KY
Ohio
Raider Concrete Burlington, IA Iowa Rinker (Hydro) Tulsa, OK &
Oklahoma City, OK Oklahoma
Kansas City, MO Kansas Marshall, MO Missouri
Rinker Materials
Albuquerque, NM New Mexico Denver, CO Colorado Rocky Mountain Prestress Kapolei, HI Hawaii
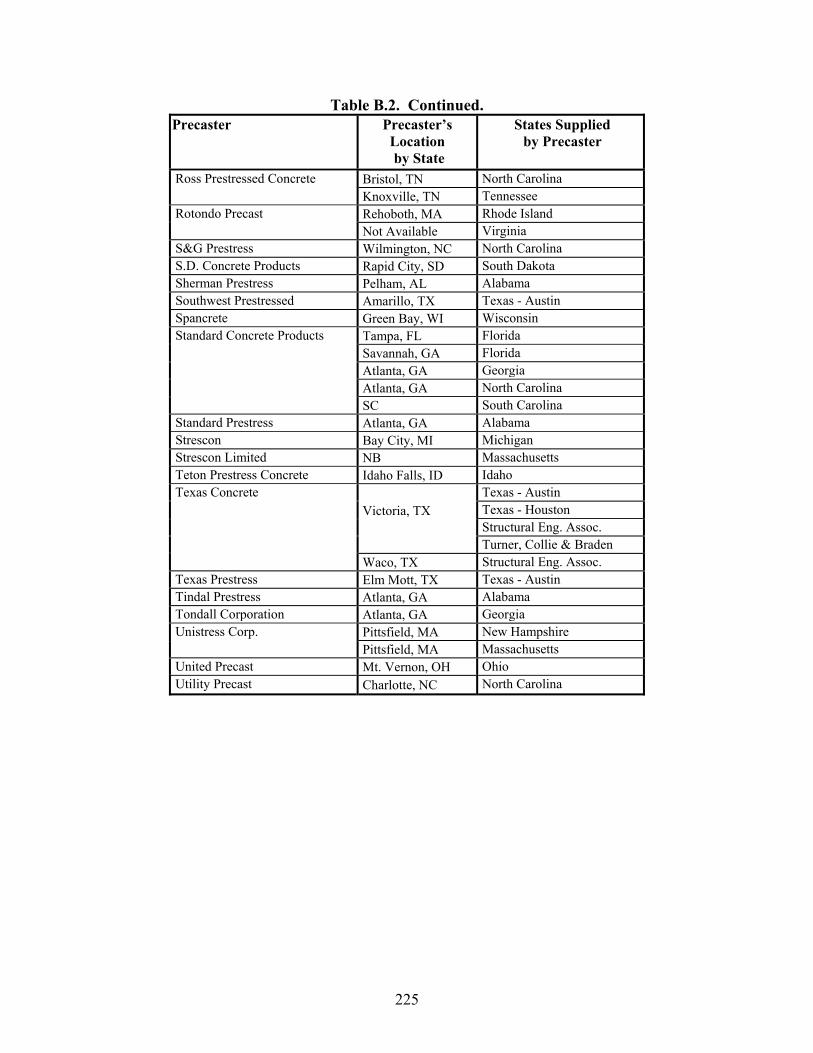
225
Table B.2. Continued. Precaster Precaster’s
Location by State
States Supplied by Precaster
Bristol, TN North Carolina Ross Prestressed Concrete Knoxville, TN Tennessee Rehoboth, MA Rhode Island Rotondo Precast Not Available Virginia
S&G Prestress Wilmington, NC North Carolina S.D. Concrete Products Rapid City, SD South Dakota Sherman Prestress Pelham, AL Alabama Southwest Prestressed Amarillo, TX Texas - Austin Spancrete Green Bay, WI Wisconsin
Tampa, FL Florida Savannah, GA Florida Atlanta, GA Georgia Atlanta, GA North Carolina
Standard Concrete Products
SC South Carolina Standard Prestress Atlanta, GA Alabama Strescon Bay City, MI Michigan Strescon Limited NB Massachusetts Teton Prestress Concrete Idaho Falls, ID Idaho
Texas - Austin Texas - Houston Structural Eng. Assoc.
Victoria, TX
Turner, Collie & Braden
Texas Concrete
Waco, TX Structural Eng. Assoc. Texas Prestress Elm Mott, TX Texas - Austin Tindal Prestress Atlanta, GA Alabama Tondall Corporation Atlanta, GA Georgia
Pittsfield, MA New Hampshire Unistress Corp. Pittsfield, MA Massachusetts
United Precast Mt. Vernon, OH Ohio Utility Precast Charlotte, NC North Carolina

227
APPENDIX C
RESULTS FOR U54 BEAMS
Note: For a description of the controlling limit states, refer to Table 6.2.
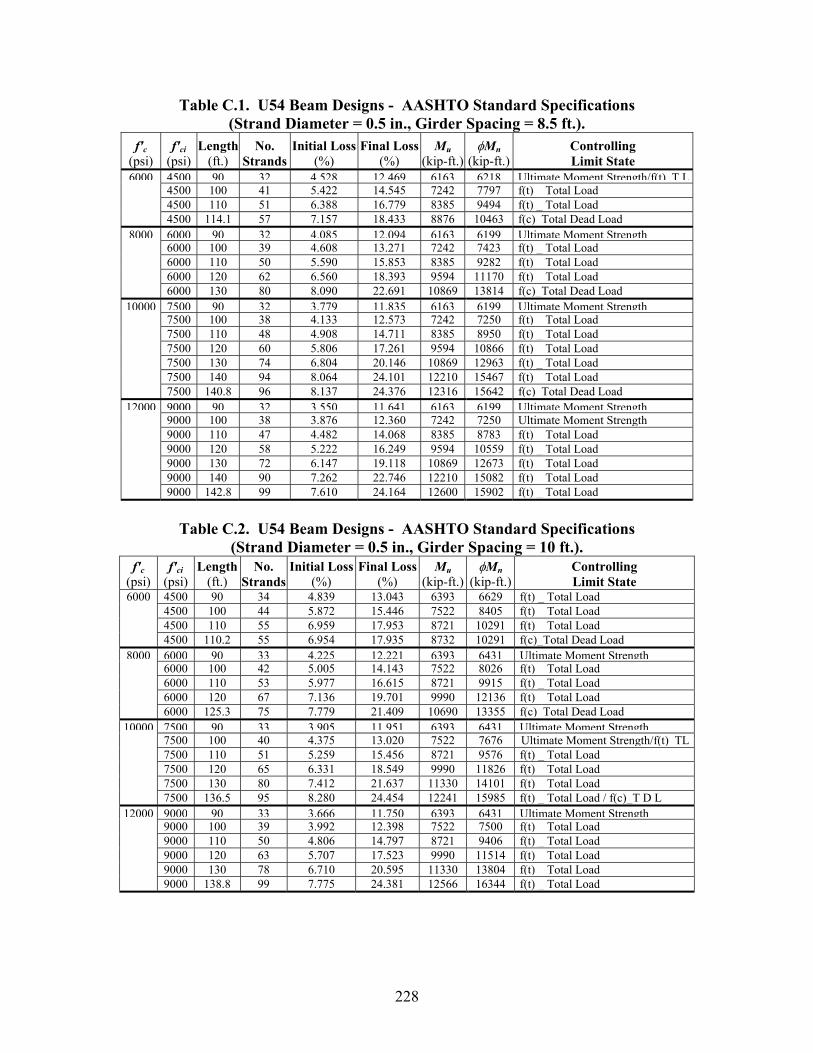
228
Table C.1. U54 Beam Designs - AASHTO Standard Specifications (Strand Diameter = 0.5 in., Girder Spacing = 8.5 ft.).
f'c (psi)
f'ci (psi)
Length (ft.)
No. Strands
Initial Loss(%)
Final Loss(%)
Mu (kip-ft.)
φMn (kip-ft.)
Controlling Limit State
6000 4500 90 32 4.528 12.469 6163 6218 Ultimate Moment Strength/f(t) T L 4500 100 41 5.422 14.545 7242 7797 f(t) _ Total Load 4500 110 51 6.388 16.779 8385 9494 f(t) _ Total Load 4500 114.1 57 7.157 18.433 8876 10463 f(c)_Total Dead Load
8000 6000 90 32 4.085 12.094 6163 6199 Ultimate Moment Strength 6000 100 39 4.608 13.271 7242 7423 f(t) _ Total Load 6000 110 50 5.590 15.853 8385 9282 f(t) _ Total Load 6000 120 62 6.560 18.393 9594 11170 f(t) _ Total Load 6000 130 80 8.090 22.691 10869 13814 f(c)_Total Dead Load
10000 7500 90 32 3.779 11.835 6163 6199 Ultimate Moment Strength 7500 100 38 4.133 12.573 7242 7250 f(t) _ Total Load 7500 110 48 4.908 14.711 8385 8950 f(t) _ Total Load 7500 120 60 5.806 17.261 9594 10866 f(t) _ Total Load 7500 130 74 6.804 20.146 10869 12963 f(t) _ Total Load 7500 140 94 8.064 24.101 12210 15467 f(t) _ Total Load 7500 140.8 96 8.137 24.376 12316 15642 f(c)_Total Dead Load
12000 9000 90 32 3.550 11.641 6163 6199 Ultimate Moment Strength 9000 100 38 3.876 12.360 7242 7250 Ultimate Moment Strength 9000 110 47 4.482 14.068 8385 8783 f(t) _ Total Load 9000 120 58 5.222 16.249 9594 10559 f(t) _ Total Load 9000 130 72 6.147 19.118 10869 12673 f(t) _ Total Load 9000 140 90 7.262 22.746 12210 15082 f(t) _ Total Load 9000 142.8 99 7.610 24.164 12600 15902 f(t) _ Total Load
Table C.2. U54 Beam Designs - AASHTO Standard Specifications
(Strand Diameter = 0.5 in., Girder Spacing = 10 ft.). f'c
(psi) f'ci
(psi) Length
(ft.) No.
Strands Initial Loss
(%) Final Loss
(%) Mu
(kip-ft.)φMn
(kip-ft.)Controlling Limit State
6000 4500 90 34 4.839 13.043 6393 6629 f(t) _ Total Load 4500 100 44 5.872 15.446 7522 8405 f(t) _ Total Load 4500 110 55 6.959 17.953 8721 10291 f(t) _ Total Load 4500 110.2 55 6.954 17.935 8732 10291 f(c)_Total Dead Load
8000 6000 90 33 4.225 12.221 6393 6431 Ultimate Moment Strength 6000 100 42 5.005 14.143 7522 8026 f(t) _ Total Load 6000 110 53 5.977 16.615 8721 9915 f(t) _ Total Load 6000 120 67 7.136 19.701 9990 12136 f(t) _ Total Load 6000 125.3 75 7.779 21.409 10690 13355 f(c)_Total Dead Load
10000 7500 90 33 3.905 11.951 6393 6431 Ultimate Moment Strength 7500 100 40 4.375 13.020 7522 7676 Ultimate Moment Strength/f(t)_TL 7500 110 51 5.259 15.456 8721 9576 f(t) _ Total Load 7500 120 65 6.331 18.549 9990 11826 f(t) _ Total Load 7500 130 80 7.412 21.637 11330 14101 f(t) _ Total Load 7500 136.5 95 8.280 24.454 12241 15985 f(t) _ Total Load / f(c)_T D L
12000 9000 90 33 3.666 11.750 6393 6431 Ultimate Moment Strength 9000 100 39 3.992 12.398 7522 7500 f(t) _ Total Load 9000 110 50 4.806 14.797 8721 9406 f(t) _ Total Load 9000 120 63 5.707 17.523 9990 11514 f(t) _ Total Load 9000 130 78 6.710 20.595 11330 13804 f(t) _ Total Load 9000 138.8 99 7.775 24.381 12566 16344 f(t) _ Total Load
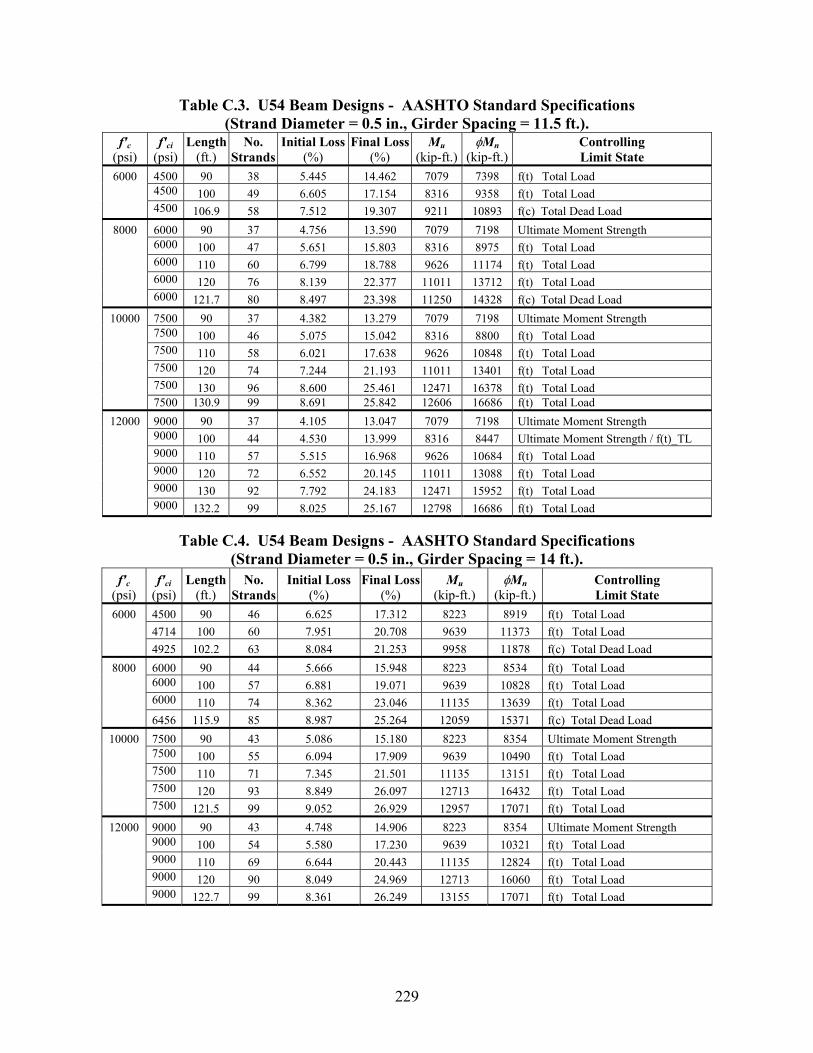
229
Table C.3. U54 Beam Designs - AASHTO Standard Specifications (Strand Diameter = 0.5 in., Girder Spacing = 11.5 ft.).
f'c (psi)
f'ci (psi)
Length (ft.)
No. Strands
Initial Loss(%)
Final Loss(%)
Mu (kip-ft.)
φMn (kip-ft.)
Controlling Limit State
6000 4500 90 38 5.445 14.462 7079 7398 f(t) Total Load 4500 100 49 6.605 17.154 8316 9358 f(t) Total Load 4500 106.9 58 7.512 19.307 9211 10893 f(c) Total Dead Load
8000 6000 90 37 4.756 13.590 7079 7198 Ultimate Moment Strength 6000 100 47 5.651 15.803 8316 8975 f(t) Total Load 6000 110 60 6.799 18.788 9626 11174 f(t) Total Load 6000 120 76 8.139 22.377 11011 13712 f(t) Total Load 6000 121.7 80 8.497 23.398 11250 14328 f(c) Total Dead Load
10000 7500 90 37 4.382 13.279 7079 7198 Ultimate Moment Strength 7500 100 46 5.075 15.042 8316 8800 f(t) Total Load 7500 110 58 6.021 17.638 9626 10848 f(t) Total Load 7500 120 74 7.244 21.193 11011 13401 f(t) Total Load 7500 130 96 8.600 25.461 12471 16378 f(t) Total Load 7500 130.9 99 8.691 25.842 12606 16686 f(t) Total Load
12000 9000 90 37 4.105 13.047 7079 7198 Ultimate Moment Strength 9000 100 44 4.530 13.999 8316 8447 Ultimate Moment Strength / f(t)_TL 9000 110 57 5.515 16.968 9626 10684 f(t) Total Load 9000 120 72 6.552 20.145 11011 13088 f(t) Total Load 9000 130 92 7.792 24.183 12471 15952 f(t) Total Load 9000 132.2 99 8.025 25.167 12798 16686 f(t) Total Load
Table C.4. U54 Beam Designs - AASHTO Standard Specifications
(Strand Diameter = 0.5 in., Girder Spacing = 14 ft.). f'c
(psi) f'ci
(psi) Length
(ft.) No.
Strands Initial Loss
(%) Final Loss
(%) Mu
(kip-ft.) φMn
(kip-ft.)Controlling Limit State
6000 4500 90 46 6.625 17.312 8223 8919 f(t) Total Load 4714 100 60 7.951 20.708 9639 11373 f(t) Total Load 4925 102.2 63 8.084 21.253 9958 11878 f(c) Total Dead Load
8000 6000 90 44 5.666 15.948 8223 8534 f(t) Total Load 6000 100 57 6.881 19.071 9639 10828 f(t) Total Load 6000 110 74 8.362 23.046 11135 13639 f(t) Total Load 6456 115.9 85 8.987 25.264 12059 15371 f(c) Total Dead Load
10000 7500 90 43 5.086 15.180 8223 8354 Ultimate Moment Strength 7500 100 55 6.094 17.909 9639 10490 f(t) Total Load 7500 110 71 7.345 21.501 11135 13151 f(t) Total Load 7500 120 93 8.849 26.097 12713 16432 f(t) Total Load 7500 121.5 99 9.052 26.929 12957 17071 f(t) Total Load
12000 9000 90 43 4.748 14.906 8223 8354 Ultimate Moment Strength 9000 100 54 5.580 17.230 9639 10321 f(t) Total Load 9000 110 69 6.644 20.443 11135 12824 f(t) Total Load 9000 120 90 8.049 24.969 12713 16060 f(t) Total Load 9000 122.7 99 8.361 26.249 13155 17071 f(t) Total Load
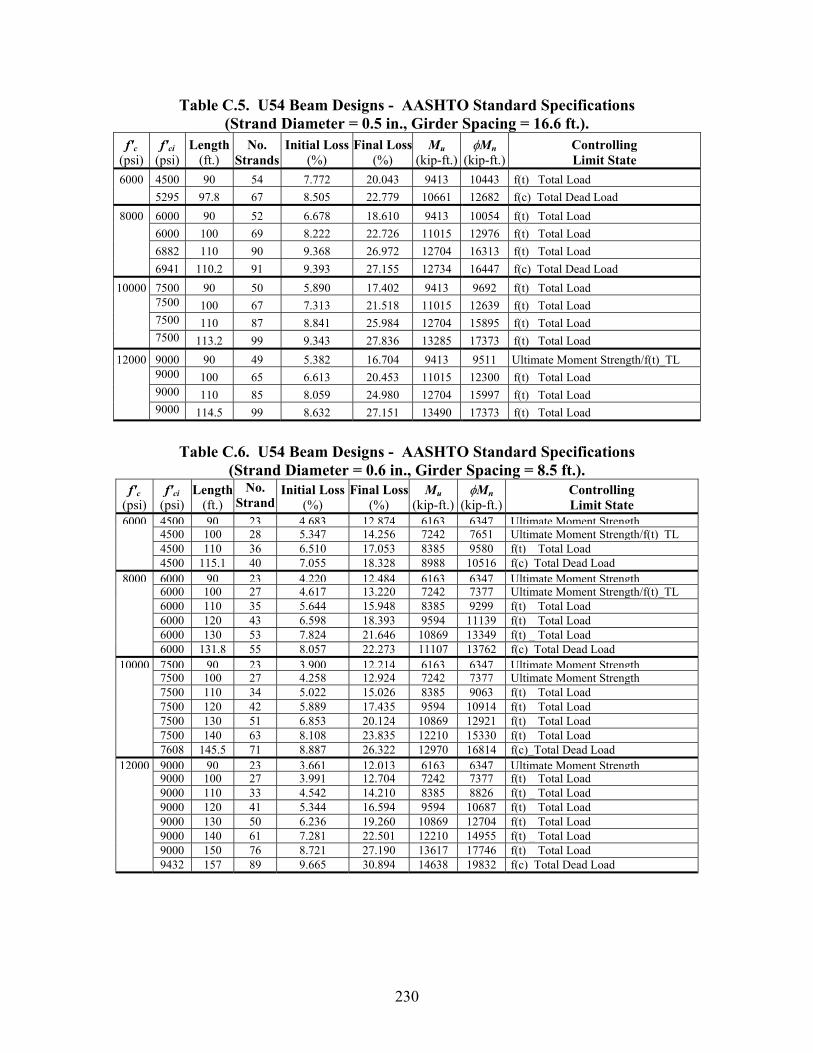
230
Table C.5. U54 Beam Designs - AASHTO Standard Specifications (Strand Diameter = 0.5 in., Girder Spacing = 16.6 ft.).
f'c (psi)
f'ci (psi)
Length (ft.)
No. Strands
Initial Loss(%)
Final Loss(%)
Mu (kip-ft.)
φMn (kip-ft.)
Controlling Limit State
6000 4500 90 54 7.772 20.043 9413 10443 f(t) Total Load 5295 97.8 67 8.505 22.779 10661 12682 f(c) Total Dead Load
8000 6000 90 52 6.678 18.610 9413 10054 f(t) Total Load 6000 100 69 8.222 22.726 11015 12976 f(t) Total Load 6882 110 90 9.368 26.972 12704 16313 f(t) Total Load 6941 110.2 91 9.393 27.155 12734 16447 f(c) Total Dead Load
10000 7500 90 50 5.890 17.402 9413 9692 f(t) Total Load 7500 100 67 7.313 21.518 11015 12639 f(t) Total Load 7500 110 87 8.841 25.984 12704 15895 f(t) Total Load 7500 113.2 99 9.343 27.836 13285 17373 f(t) Total Load
12000 9000 90 49 5.382 16.704 9413 9511 Ultimate Moment Strength/f(t)_TL 9000 100 65 6.613 20.453 11015 12300 f(t) Total Load 9000 110 85 8.059 24.980 12704 15997 f(t) Total Load 9000 114.5 99 8.632 27.151 13490 17373 f(t) Total Load
Table C.6. U54 Beam Designs - AASHTO Standard Specifications (Strand Diameter = 0.6 in., Girder Spacing = 8.5 ft.).
f'c (psi)
f'ci (psi)
Length (ft.)
No. Strand
Initial Loss(%)
Final Loss(%)
Mu (kip-ft.)
φMn (kip-ft.)
Controlling Limit State
6000 4500 90 23 4.683 12.874 6163 6347 Ultimate Moment Strength 4500 100 28 5.347 14.256 7242 7651 Ultimate Moment Strength/f(t)_TL 4500 110 36 6.510 17.053 8385 9580 f(t) _ Total Load 4500 115.1 40 7.055 18.328 8988 10516 f(c)_Total Dead Load
8000 6000 90 23 4.220 12.484 6163 6347 Ultimate Moment Strength 6000 100 27 4.617 13.220 7242 7377 Ultimate Moment Strength/f(t)_TL 6000 110 35 5.644 15.948 8385 9299 f(t) _ Total Load 6000 120 43 6.598 18.393 9594 11139 f(t) _ Total Load 6000 130 53 7.824 21.646 10869 13349 f(t) _ Total Load
6000 131.8 55 8.057 22.273 11107 13762 f(c)_Total Dead Load 10000 7500 90 23 3.900 12.214 6163 6347 Ultimate Moment Strength
7500 100 27 4.258 12.924 7242 7377 Ultimate Moment Strength 7500 110 34 5.022 15.026 8385 9063 f(t) _ Total Load 7500 120 42 5.889 17.435 9594 10914 f(t) _ Total Load 7500 130 51 6.853 20.124 10869 12921 f(t) _ Total Load 7500 140 63 8.108 23.835 12210 15330 f(t) _ Total Load 7608 145.5 71 8.887 26.322 12970 16814 f(c)_Total Dead Load
12000 9000 90 23 3.661 12.013 6163 6347 Ultimate Moment Strength 9000 100 27 3.991 12.704 7242 7377 f(t) _ Total Load 9000 110 33 4.542 14.210 8385 8826 f(t) _ Total Load 9000 120 41 5.344 16.594 9594 10687 f(t) _ Total Load 9000 130 50 6.236 19.260 10869 12704 f(t) _ Total Load 9000 140 61 7.281 22.501 12210 14955 f(t) _ Total Load 9000 150 76 8.721 27.190 13617 17746 f(t) _ Total Load
9432 157 89 9.665 30.894 14638 19832 f(c)_Total Dead Load
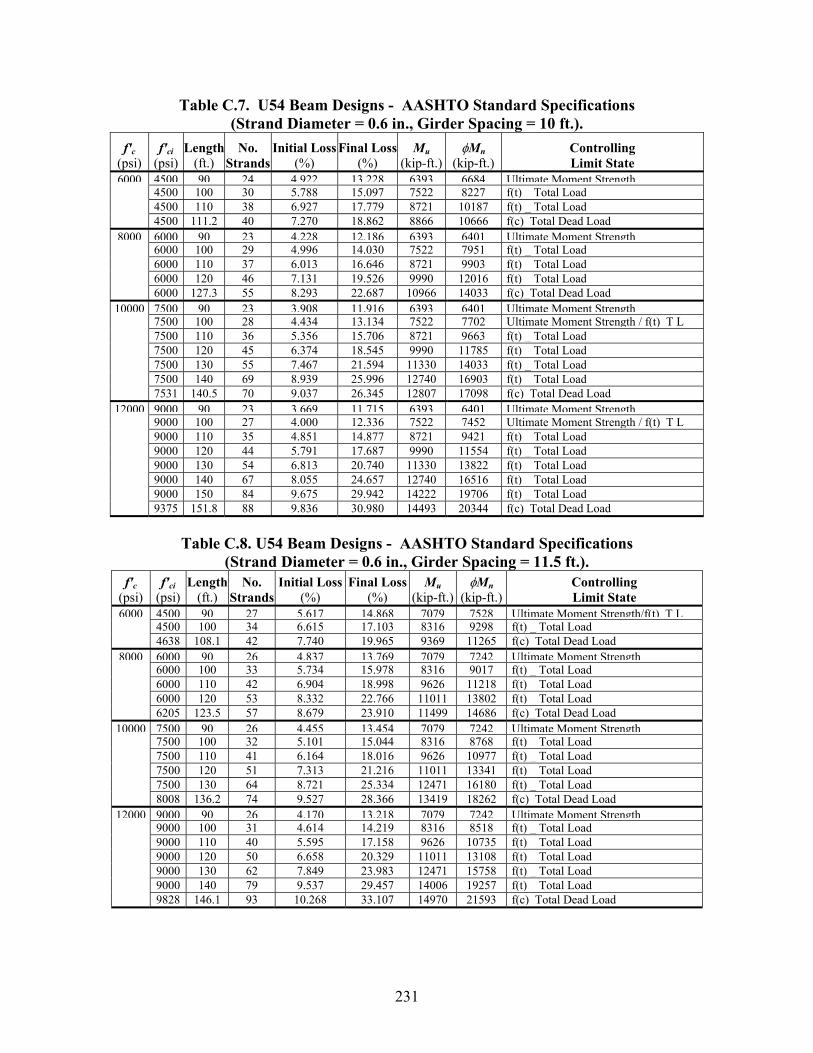
231
Table C.7. U54 Beam Designs - AASHTO Standard Specifications (Strand Diameter = 0.6 in., Girder Spacing = 10 ft.).
f'c (psi)
f'ci (psi)
Length(ft.)
No. Strands
Initial Loss(%)
Final Loss(%)
Mu (kip-ft.)
φMn (kip-ft.)
Controlling Limit State
6000 4500 90 24 4.922 13.228 6393 6684 Ultimate Moment Strength 4500 100 30 5.788 15.097 7522 8227 f(t) _ Total Load 4500 110 38 6.927 17.779 8721 10187 f(t) _ Total Load 4500 111.2 40 7.270 18.862 8866 10666 f(c)_Total Dead Load
8000 6000 90 23 4.228 12.186 6393 6401 Ultimate Moment Strength 6000 100 29 4.996 14.030 7522 7951 f(t) _ Total Load 6000 110 37 6.013 16.646 8721 9903 f(t) _ Total Load 6000 120 46 7.131 19.526 9990 12016 f(t) _ Total Load 6000 127.3 55 8.293 22.687 10966 14033 f(c)_Total Dead Load
10000 7500 90 23 3.908 11.916 6393 6401 Ultimate Moment Strength 7500 100 28 4.434 13.134 7522 7702 Ultimate Moment Strength / f(t)_T L 7500 110 36 5.356 15.706 8721 9663 f(t) _ Total Load 7500 120 45 6.374 18.545 9990 11785 f(t) _ Total Load 7500 130 55 7.467 21.594 11330 14033 f(t) _ Total Load 7500 140 69 8.939 25.996 12740 16903 f(t) _ Total Load 7531 140.5 70 9.037 26.345 12807 17098 f(c)_Total Dead Load
12000 9000 90 23 3.669 11.715 6393 6401 Ultimate Moment Strength 9000 100 27 4.000 12.336 7522 7452 Ultimate Moment Strength / f(t)_T L 9000 110 35 4.851 14.877 8721 9421 f(t) _ Total Load 9000 120 44 5.791 17.687 9990 11554 f(t) _ Total Load 9000 130 54 6.813 20.740 11330 13822 f(t) _ Total Load 9000 140 67 8.055 24.657 12740 16516 f(t) _ Total Load 9000 150 84 9.675 29.942 14222 19706 f(t) _ Total Load
9375 151.8 88 9.836 30.980 14493 20344 f(c)_Total Dead Load
Table C.8. U54 Beam Designs - AASHTO Standard Specifications (Strand Diameter = 0.6 in., Girder Spacing = 11.5 ft.).
f'c (psi)
f'ci (psi)
Length (ft.)
No. Strands
Initial Loss(%)
Final Loss(%)
Mu (kip-ft.)
φMn (kip-ft.)
Controlling Limit State
6000 4500 90 27 5.617 14.868 7079 7528 Ultimate Moment Strength/f(t) T L 4500 100 34 6.615 17.103 8316 9298 f(t) _ Total Load 4638 108.1 42 7.740 19.965 9369 11265 f(c)_Total Dead Load
8000 6000 90 26 4.837 13.769 7079 7242 Ultimate Moment Strength 6000 100 33 5.734 15.978 8316 9017 f(t) _ Total Load 6000 110 42 6.904 18.998 9626 11218 f(t) _ Total Load 6000 120 53 8.332 22.766 11011 13802 f(t) _ Total Load 6205 123.5 57 8.679 23.910 11499 14686 f(c)_Total Dead Load
10000 7500 90 26 4.455 13.454 7079 7242 Ultimate Moment Strength 7500 100 32 5.101 15.044 8316 8768 f(t) _ Total Load 7500 110 41 6.164 18.016 9626 10977 f(t) _ Total Load 7500 120 51 7.313 21.216 11011 13341 f(t) _ Total Load 7500 130 64 8.721 25.334 12471 16180 f(t) _ Total Load 8008 136.2 74 9.527 28.366 13419 18262 f(c)_Total Dead Load
12000 9000 90 26 4.170 13.218 7079 7242 Ultimate Moment Strength 9000 100 31 4.614 14.219 8316 8518 f(t) _ Total Load 9000 110 40 5.595 17.158 9626 10735 f(t) _ Total Load 9000 120 50 6.658 20.329 11011 13108 f(t) _ Total Load 9000 130 62 7.849 23.983 12471 15758 f(t) _ Total Load 9000 140 79 9.537 29.457 14006 19257 f(t) _ Total Load 9828 146.1 93 10.268 33.107 14970 21593 f(c)_Total Dead Load
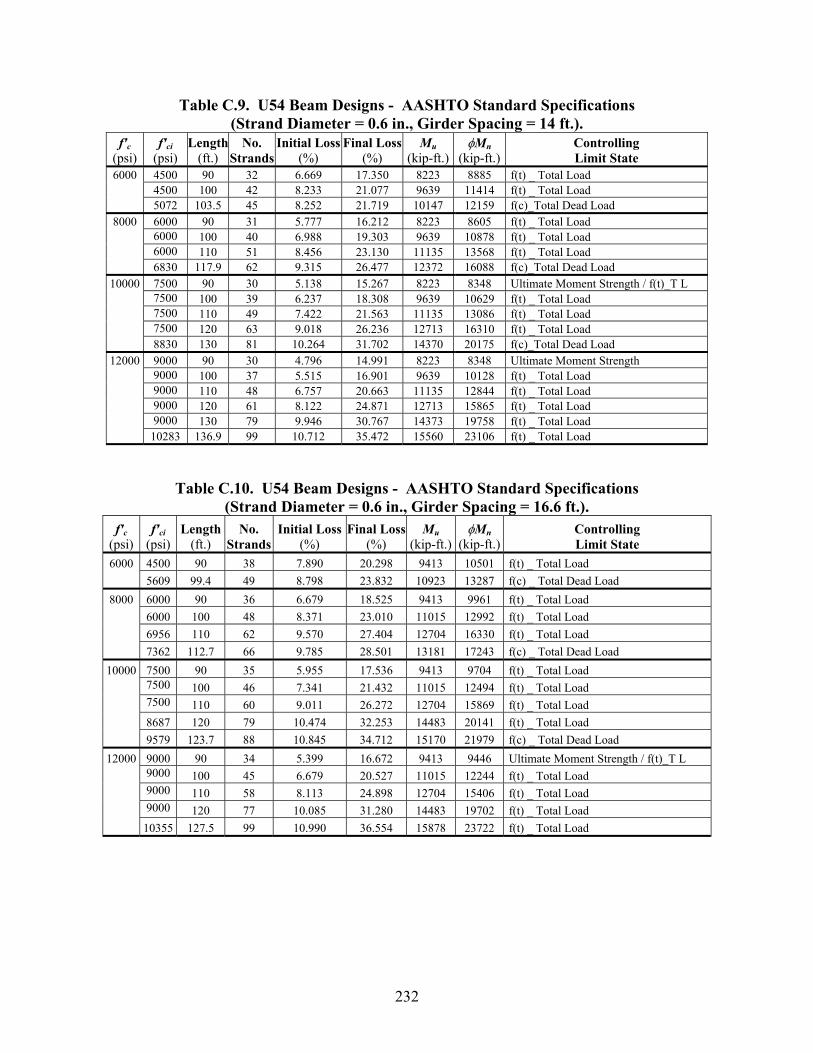
232
Table C.9. U54 Beam Designs - AASHTO Standard Specifications (Strand Diameter = 0.6 in., Girder Spacing = 14 ft.).
f'c (psi)
f'ci (psi)
Length(ft.)
No. Strands
Initial Loss(%)
Final Loss(%)
Mu (kip-ft.)
φMn (kip-ft.)
Controlling Limit State
6000 4500 90 32 6.669 17.350 8223 8885 f(t) _ Total Load 4500 100 42 8.233 21.077 9639 11414 f(t) _ Total Load 5072 103.5 45 8.252 21.719 10147 12159 f(c)_Total Dead Load
8000 6000 90 31 5.777 16.212 8223 8605 f(t) _ Total Load 6000 100 40 6.988 19.303 9639 10878 f(t) _ Total Load 6000 110 51 8.456 23.130 11135 13568 f(t) _ Total Load 6830 117.9 62 9.315 26.477 12372 16088 f(c)_Total Dead Load
10000 7500 90 30 5.138 15.267 8223 8348 Ultimate Moment Strength / f(t)_T L 7500 100 39 6.237 18.308 9639 10629 f(t) _ Total Load 7500 110 49 7.422 21.563 11135 13086 f(t) _ Total Load 7500 120 63 9.018 26.236 12713 16310 f(t) _ Total Load 8830 130 81 10.264 31.702 14370 20175 f(c)_Total Dead Load
12000 9000 90 30 4.796 14.991 8223 8348 Ultimate Moment Strength 9000 100 37 5.515 16.901 9639 10128 f(t) _ Total Load 9000 110 48 6.757 20.663 11135 12844 f(t) _ Total Load 9000 120 61 8.122 24.871 12713 15865 f(t) _ Total Load 9000 130 79 9.946 30.767 14373 19758 f(t) _ Total Load 10283 136.9 99 10.712 35.472 15560 23106 f(t) _ Total Load
Table C.10. U54 Beam Designs - AASHTO Standard Specifications (Strand Diameter = 0.6 in., Girder Spacing = 16.6 ft.).
f'c (psi)
f'ci (psi)
Length (ft.)
No. Strands
Initial Loss(%)
Final Loss(%)
Mu (kip-ft.)
φMn (kip-ft.)
Controlling Limit State
6000 4500 90 38 7.890 20.298 9413 10501 f(t) _ Total Load 5609 99.4 49 8.798 23.832 10923 13287 f(c) _ Total Dead Load
8000 6000 90 36 6.679 18.525 9413 9961 f(t) _ Total Load 6000 100 48 8.371 23.010 11015 12992 f(t) _ Total Load 6956 110 62 9.570 27.404 12704 16330 f(t) _ Total Load 7362 112.7 66 9.785 28.501 13181 17243 f(c) _ Total Dead Load
10000 7500 90 35 5.955 17.536 9413 9704 f(t) _ Total Load 7500 100 46 7.341 21.432 11015 12494 f(t) _ Total Load 7500 110 60 9.011 26.272 12704 15869 f(t) _ Total Load 8687 120 79 10.474 32.253 14483 20141 f(t) _ Total Load 9579 123.7 88 10.845 34.712 15170 21979 f(c) _ Total Dead Load
12000 9000 90 34 5.399 16.672 9413 9446 Ultimate Moment Strength / f(t)_T L 9000 100 45 6.679 20.527 11015 12244 f(t) _ Total Load 9000 110 58 8.113 24.898 12704 15406 f(t) _ Total Load 9000 120 77 10.085 31.280 14483 19702 f(t) _ Total Load 10355 127.5 99 10.990 36.554 15878 23722 f(t) _ Total Load
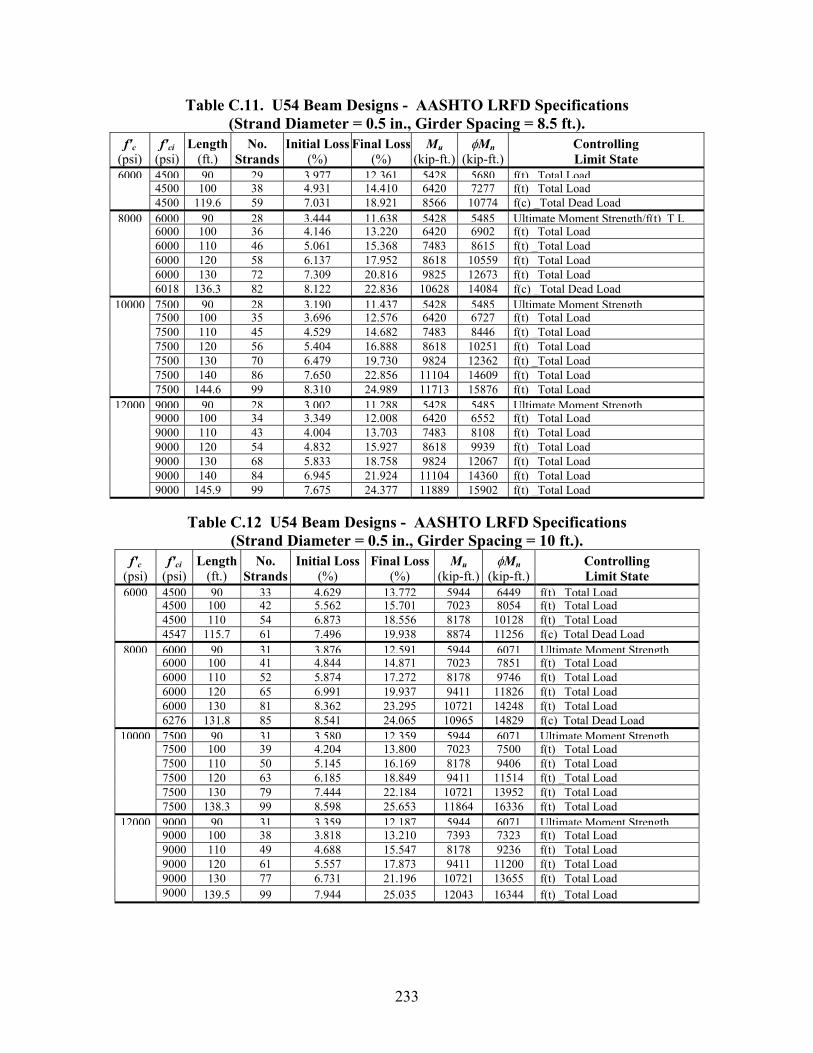
233
Table C.11. U54 Beam Designs - AASHTO LRFD Specifications (Strand Diameter = 0.5 in., Girder Spacing = 8.5 ft.).
f'c (psi)
f'ci (psi)
Length (ft.)
No. Strands
Initial Loss(%)
Final Loss(%)
Mu (kip-ft.)
φMn (kip-ft.)
Controlling Limit State
6000 4500 90 29 3.977 12.361 5428 5680 f(t) Total Load 4500 100 38 4.931 14.410 6420 7277 f(t) _Total Load 4500 119.6 59 7.031 18.921 8566 10774 f(c) _Total Dead Load
8000 6000 90 28 3.444 11.638 5428 5485 Ultimate Moment Strength/f(t) T L 6000 100 36 4.146 13.220 6420 6902 f(t) _Total Load 6000 110 46 5.061 15.368 7483 8615 f(t) _Total Load 6000 120 58 6.137 17.952 8618 10559 f(t) _Total Load 6000 130 72 7.309 20.816 9825 12673 f(t) _Total Load
6018 136.3 82 8.122 22.836 10628 14084 f(c) _Total Dead Load 10000 7500 90 28 3.190 11.437 5428 5485 Ultimate Moment Strength
7500 100 35 3.696 12.576 6420 6727 f(t) _Total Load 7500 110 45 4.529 14.682 7483 8446 f(t) _Total Load 7500 120 56 5.404 16.888 8618 10251 f(t) _Total Load 7500 130 70 6.479 19.730 9824 12362 f(t) _Total Load 7500 140 86 7.650 22.856 11104 14609 f(t) _Total Load 7500 144.6 99 8.310 24.989 11713 15876 f(t) _Total Load
12000 9000 90 28 3.002 11.288 5428 5485 Ultimate Moment Strength 9000 100 34 3.349 12.008 6420 6552 f(t) _Total Load 9000 110 43 4.004 13.703 7483 8108 f(t) _Total Load 9000 120 54 4.832 15.927 8618 9939 f(t) _Total Load 9000 130 68 5.833 18.758 9824 12067 f(t) _Total Load 9000 140 84 6.945 21.924 11104 14360 f(t) _Total Load 9000 145.9 99 7.675 24.377 11889 15902 f(t) _Total Load
Table C.12 U54 Beam Designs - AASHTO LRFD Specifications
(Strand Diameter = 0.5 in., Girder Spacing = 10 ft.). f'c
(psi) f'ci
(psi) Length
(ft.) No.
Strands Initial Loss
(%) Final Loss
(%) Mu
(kip-ft.)φMn
(kip-ft.)Controlling Limit State
6000 4500 90 33 4.629 13.772 5944 6449 f(t) Total Load 4500 100 42 5.562 15.701 7023 8054 f(t) _Total Load 4500 110 54 6.873 18.556 8178 10128 f(t) _Total Load 4547 115.7 61 7.496 19.938 8874 11256 f(c)_Total Dead Load
8000 6000 90 31 3.876 12.591 5944 6071 Ultimate Moment Strength 6000 100 41 4.844 14.871 7023 7851 f(t) _Total Load 6000 110 52 5.874 17.272 8178 9746 f(t) _Total Load 6000 120 65 6.991 19.937 9411 11826 f(t) _Total Load 6000 130 81 8.362 23.295 10721 14248 f(t) _Total Load
6276 131.8 85 8.541 24.065 10965 14829 f(c)_Total Dead Load 10000 7500 90 31 3.580 12.359 5944 6071 Ultimate Moment Strength
7500 100 39 4.204 13.800 7023 7500 f(t) _Total Load 7500 110 50 5.145 16.169 8178 9406 f(t) _Total Load 7500 120 63 6.185 18.849 9411 11514 f(t) _Total Load 7500 130 79 7.444 22.184 10721 13952 f(t) _Total Load 7500 138.3 99 8.598 25.653 11864 16336 f(t) _Total Load
12000 9000 90 31 3.359 12.187 5944 6071 Ultimate Moment Strength 9000 100 38 3.818 13.210 7393 7323 f(t) _Total Load 9000 110 49 4.688 15.547 8178 9236 f(t) _Total Load 9000 120 61 5.557 17.873 9411 11200 f(t) _Total Load 9000 130 77 6.731 21.196 10721 13655 f(t) _Total Load 9000 139.5 99 7.944 25.035 12043 16344 f(t) _Total Load
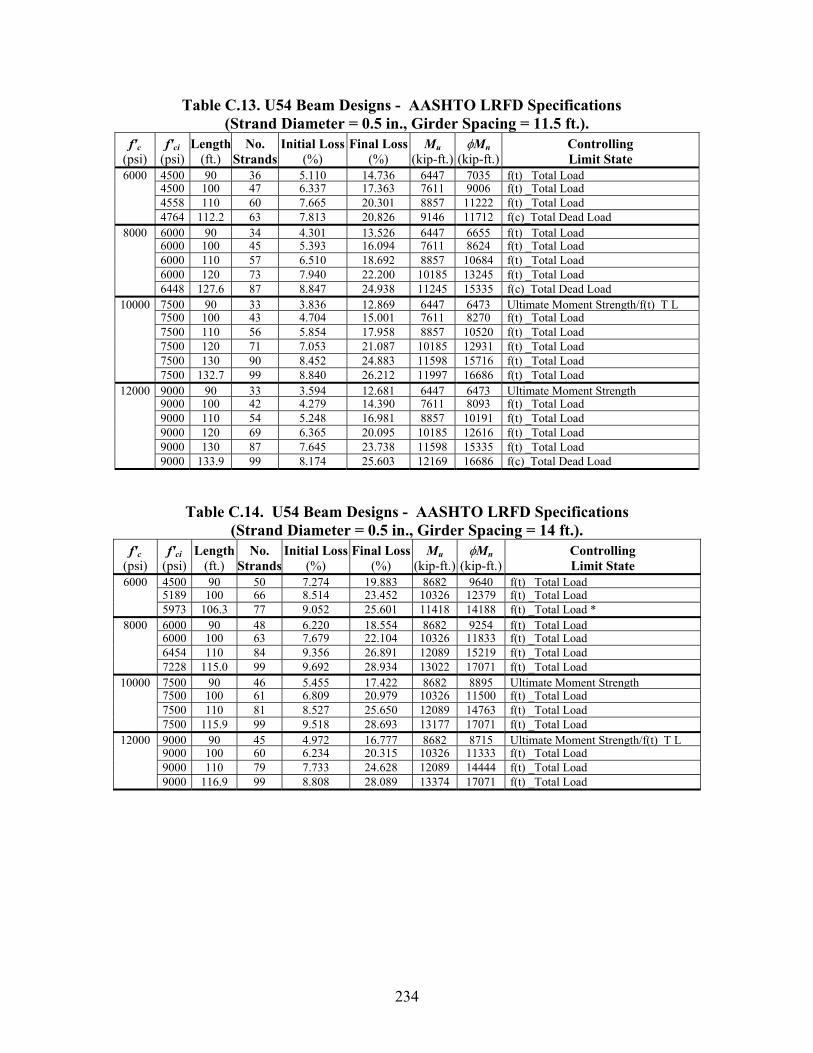
234
Table C.13. U54 Beam Designs - AASHTO LRFD Specifications (Strand Diameter = 0.5 in., Girder Spacing = 11.5 ft.).
f'c (psi)
f'ci (psi)
Length (ft.)
No. Strands
Initial Loss(%)
Final Loss(%)
Mu (kip-ft.)
φMn (kip-ft.)
Controlling Limit State
6000 4500 90 36 5.110 14.736 6447 7035 f(t) Total Load 4500 100 47 6.337 17.363 7611 9006 f(t) _Total Load 4558 110 60 7.665 20.301 8857 11222 f(t) _Total Load 4764 112.2 63 7.813 20.826 9146 11712 f(c)_Total Dead Load
8000 6000 90 34 4.301 13.526 6447 6655 f(t) Total Load 6000 100 45 5.393 16.094 7611 8624 f(t) _Total Load 6000 110 57 6.510 18.692 8857 10684 f(t) _Total Load 6000 120 73 7.940 22.200 10185 13245 f(t) _Total Load 6448 127.6 87 8.847 24.938 11245 15335 f(c)_Total Dead Load
10000 7500 90 33 3.836 12.869 6447 6473 Ultimate Moment Strength/f(t) T L 7500 100 43 4.704 15.001 7611 8270 f(t) _Total Load 7500 110 56 5.854 17.958 8857 10520 f(t) _Total Load 7500 120 71 7.053 21.087 10185 12931 f(t) _Total Load 7500 130 90 8.452 24.883 11598 15716 f(t) _Total Load 7500 132.7 99 8.840 26.212 11997 16686 f(t) _Total Load
12000 9000 90 33 3.594 12.681 6447 6473 Ultimate Moment Strength 9000 100 42 4.279 14.390 7611 8093 f(t) _Total Load 9000 110 54 5.248 16.981 8857 10191 f(t) _Total Load 9000 120 69 6.365 20.095 10185 12616 f(t) _Total Load 9000 130 87 7.645 23.738 11598 15335 f(t) _Total Load 9000 133.9 99 8.174 25.603 12169 16686 f(c)_Total Dead Load
Table C.14. U54 Beam Designs - AASHTO LRFD Specifications (Strand Diameter = 0.5 in., Girder Spacing = 14 ft.).
f'c (psi)
f'ci (psi)
Length (ft.)
No. Strands
Initial Loss(%)
Final Loss(%)
Mu (kip-ft.)
φMn (kip-ft.)
Controlling Limit State
6000 4500 90 50 7.274 19.883 8682 9640 f(t) Total Load 5189 100 66 8.514 23.452 10326 12379 f(t) _Total Load 5973 106.3 77 9.052 25.601 11418 14188 f(t) _Total Load *
8000 6000 90 48 6.220 18.554 8682 9254 f(t) Total Load 6000 100 63 7.679 22.104 10326 11833 f(t) _Total Load 6454 110 84 9.356 26.891 12089 15219 f(t) _Total Load 7228 115.0 99 9.692 28.934 13022 17071 f(t) _Total Load
10000 7500 90 46 5.455 17.422 8682 8895 Ultimate Moment Strength 7500 100 61 6.809 20.979 10326 11500 f(t) _Total Load 7500 110 81 8.527 25.650 12089 14763 f(t) _Total Load 7500 115.9 99 9.518 28.693 13177 17071 f(t) _Total Load
12000 9000 90 45 4.972 16.777 8682 8715 Ultimate Moment Strength/f(t) T L 9000 100 60 6.234 20.315 10326 11333 f(t) _Total Load 9000 110 79 7.733 24.628 12089 14444 f(t) _Total Load 9000 116.9 99 8.808 28.089 13374 17071 f(t) _Total Load
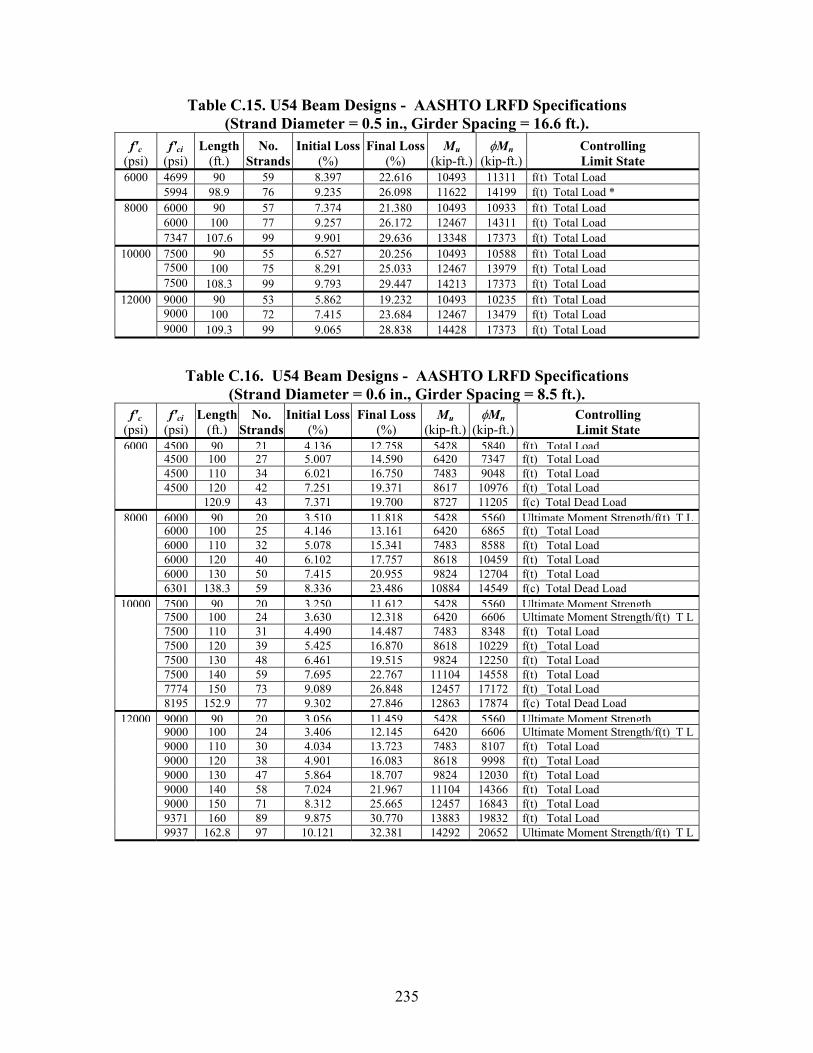
235
Table C.15. U54 Beam Designs - AASHTO LRFD Specifications (Strand Diameter = 0.5 in., Girder Spacing = 16.6 ft.).
f'c (psi)
f'ci (psi)
Length (ft.)
No. Strands
Initial Loss(%)
Final Loss(%)
Mu (kip-ft.)
φMn (kip-ft.)
Controlling Limit State
6000 4699 90 59 8.397 22.616 10493 11311 f(t) Total Load 5994 98.9 76 9.235 26.098 11622 14199 f(t) Total Load *
8000 6000 90 57 7.374 21.380 10493 10933 f(t) Total Load 6000 100 77 9.257 26.172 12467 14311 f(t) Total Load 7347 107.6 99 9.901 29.636 13348 17373 f(t) Total Load
10000 7500 90 55 6.527 20.256 10493 10588 f(t) Total Load 7500 100 75 8.291 25.033 12467 13979 f(t) Total Load 7500 108.3 99 9.793 29.447 14213 17373 f(t) Total Load
12000 9000 90 53 5.862 19.232 10493 10235 f(t) Total Load 9000 100 72 7.415 23.684 12467 13479 f(t) Total Load 9000 109.3 99 9.065 28.838 14428 17373 f(t) Total Load
Table C.16. U54 Beam Designs - AASHTO LRFD Specifications (Strand Diameter = 0.6 in., Girder Spacing = 8.5 ft.).
f'c (psi)
f'ci (psi)
Length (ft.)
No. Strands
Initial Loss(%)
Final Loss(%)
Mu (kip-ft.)
φMn (kip-ft.)
Controlling Limit State
6000 4500 90 21 4.136 12.758 5428 5840 f(t) Total Load 4500 100 27 5.007 14.590 6420 7347 f(t) _Total Load 4500 110 34 6.021 16.750 7483 9048 f(t) _Total Load 4500 120 42 7.251 19.371 8617 10976 f(t) _Total Load 120.9 43 7.371 19.700 8727 11205 f(c)_Total Dead Load
8000 6000 90 20 3.510 11.818 5428 5560 Ultimate Moment Strength/f(t) T L 6000 100 25 4.146 13.161 6420 6865 f(t) _Total Load 6000 110 32 5.078 15.341 7483 8588 f(t) _Total Load 6000 120 40 6.102 17.757 8618 10459 f(t) _Total Load 6000 130 50 7.415 20.955 9824 12704 f(t) _Total Load
6301 138.3 59 8.336 23.486 10884 14549 f(c)_Total Dead Load 10000 7500 90 20 3.250 11.612 5428 5560 Ultimate Moment Strength
7500 100 24 3.630 12.318 6420 6606 Ultimate Moment Strength/f(t)_T L 7500 110 31 4.490 14.487 7483 8348 f(t) _Total Load 7500 120 39 5.425 16.870 8618 10229 f(t) _Total Load 7500 130 48 6.461 19.515 9824 12250 f(t) _Total Load 7500 140 59 7.695 22.767 11104 14558 f(t) _Total Load 7774 150 73 9.089 26.848 12457 17172 f(t) _Total Load 8195 152.9 77 9.302 27.846 12863 17874 f(c)_Total Dead Load
12000 9000 90 20 3.056 11.459 5428 5560 Ultimate Moment Strength 9000 100 24 3.406 12.145 6420 6606 Ultimate Moment Strength/f(t)_T L 9000 110 30 4.034 13.723 7483 8107 f(t) _Total Load 9000 120 38 4.901 16.083 8618 9998 f(t) _Total Load 9000 130 47 5.864 18.707 9824 12030 f(t) _Total Load 9000 140 58 7.024 21.967 11104 14366 f(t) _Total Load 9000 150 71 8.312 25.665 12457 16843 f(t) _Total Load
9371 160 89 9.875 30.770 13883 19832 f(t) _Total Load 9937 162.8 97 10.121 32.381 14292 20652 Ultimate Moment Strength/f(t)_T L
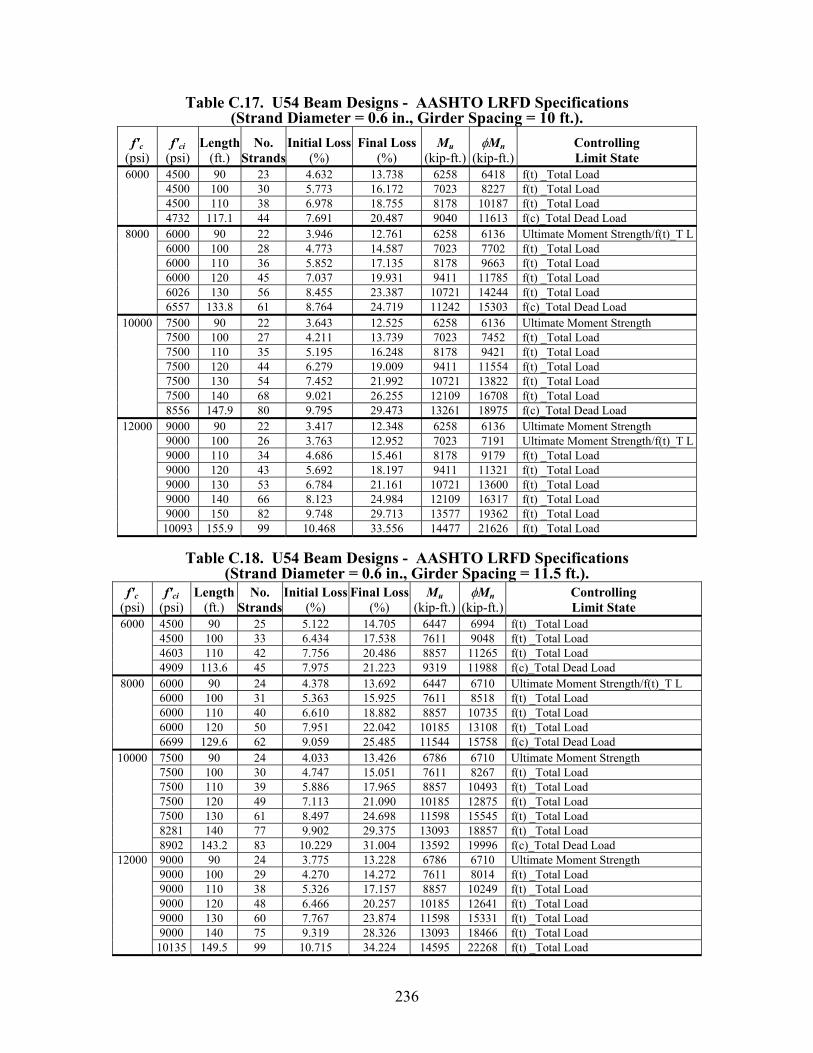
236
Table C.17. U54 Beam Designs - AASHTO LRFD Specifications (Strand Diameter = 0.6 in., Girder Spacing = 10 ft.).
f'c (psi)
f'ci (psi)
Length (ft.)
No. Strands
Initial Loss(%)
Final Loss(%)
Mu (kip-ft.)
φMn (kip-ft.)
Controlling Limit State
6000 4500 90 23 4.632 13.738 6258 6418 f(t) _Total Load 4500 100 30 5.773 16.172 7023 8227 f(t) _Total Load 4500 110 38 6.978 18.755 8178 10187 f(t) _Total Load 4732 117.1 44 7.691 20.487 9040 11613 f(c)_Total Dead Load
8000 6000 90 22 3.946 12.761 6258 6136 Ultimate Moment Strength/f(t)_T L 6000 100 28 4.773 14.587 7023 7702 f(t) _Total Load 6000 110 36 5.852 17.135 8178 9663 f(t) _Total Load 6000 120 45 7.037 19.931 9411 11785 f(t) _Total Load 6026 130 56 8.455 23.387 10721 14244 f(t) _Total Load
6557 133.8 61 8.764 24.719 11242 15303 f(c)_Total Dead Load 10000 7500 90 22 3.643 12.525 6258 6136 Ultimate Moment Strength
7500 100 27 4.211 13.739 7023 7452 f(t) _Total Load 7500 110 35 5.195 16.248 8178 9421 f(t) _Total Load 7500 120 44 6.279 19.009 9411 11554 f(t) _Total Load 7500 130 54 7.452 21.992 10721 13822 f(t) _Total Load 7500 140 68 9.021 26.255 12109 16708 f(t) _Total Load 8556 147.9 80 9.795 29.473 13261 18975 f(c)_Total Dead Load
12000 9000 90 22 3.417 12.348 6258 6136 Ultimate Moment Strength 9000 100 26 3.763 12.952 7023 7191 Ultimate Moment Strength/f(t)_T L 9000 110 34 4.686 15.461 8178 9179 f(t) _Total Load 9000 120 43 5.692 18.197 9411 11321 f(t) _Total Load 9000 130 53 6.784 21.161 10721 13600 f(t) _Total Load 9000 140 66 8.123 24.984 12109 16317 f(t) _Total Load 9000 150 82 9.748 29.713 13577 19362 f(t) _Total Load
10093 155.9 99 10.468 33.556 14477 21626 f(t) _Total Load
Table C.18. U54 Beam Designs - AASHTO LRFD Specifications (Strand Diameter = 0.6 in., Girder Spacing = 11.5 ft.).
f'c (psi)
f'ci (psi)
Length (ft.)
No. Strands
Initial Loss(%)
Final Loss(%)
Mu (kip-ft.)
φMn (kip-ft.)
Controlling Limit State
6000 4500 90 25 5.122 14.705 6447 6994 f(t) _Total Load 4500 100 33 6.434 17.538 7611 9048 f(t) _Total Load 4603 110 42 7.756 20.486 8857 11265 f(t) _Total Load 4909 113.6 45 7.975 21.223 9319 11988 f(c)_Total Dead Load
8000 6000 90 24 4.378 13.692 6447 6710 Ultimate Moment Strength/f(t)_T L 6000 100 31 5.363 15.925 7611 8518 f(t) _Total Load 6000 110 40 6.610 18.882 8857 10735 f(t) _Total Load 6000 120 50 7.951 22.042 10185 13108 f(t) _Total Load 6699 129.6 62 9.059 25.485 11544 15758 f(c)_Total Dead Load
10000 7500 90 24 4.033 13.426 6786 6710 Ultimate Moment Strength 7500 100 30 4.747 15.051 7611 8267 f(t) _Total Load 7500 110 39 5.886 17.965 8857 10493 f(t) _Total Load 7500 120 49 7.113 21.090 10185 12875 f(t) _Total Load 7500 130 61 8.497 24.698 11598 15545 f(t) _Total Load 8281 140 77 9.902 29.375 13093 18857 f(t) _Total Load 8902 143.2 83 10.229 31.004 13592 19996 f(c)_Total Dead Load
12000 9000 90 24 3.775 13.228 6786 6710 Ultimate Moment Strength 9000 100 29 4.270 14.272 7611 8014 f(t) _Total Load 9000 110 38 5.326 17.157 8857 10249 f(t) _Total Load 9000 120 48 6.466 20.257 10185 12641 f(t) _Total Load 9000 130 60 7.767 23.874 11598 15331 f(t) _Total Load 9000 140 75 9.319 28.326 13093 18466 f(t) _Total Load 10135 149.5 99 10.715 34.224 14595 22268 f(t) _Total Load
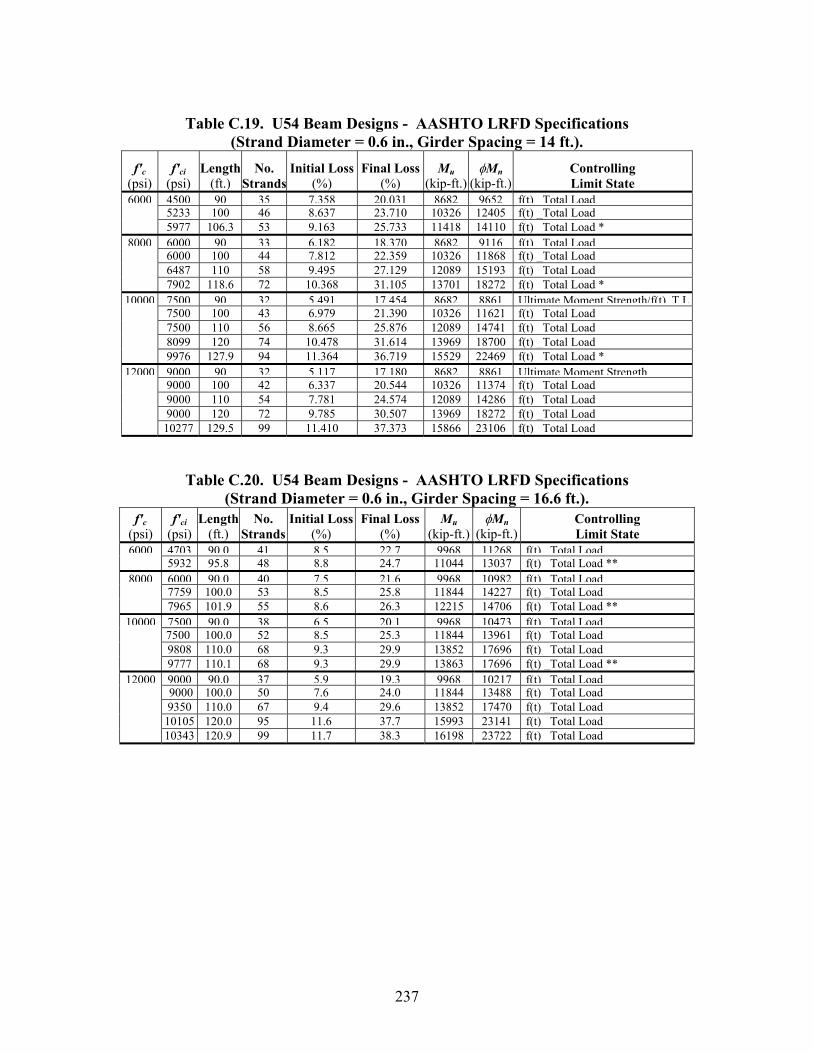
237
Table C.19. U54 Beam Designs - AASHTO LRFD Specifications
(Strand Diameter = 0.6 in., Girder Spacing = 14 ft.). f'c
(psi) f'ci
(psi) Length
(ft.) No.
StrandsInitial Loss
(%) Final Loss
(%) Mu
(kip-ft.)φMn
(kip-ft.)Controlling Limit State
6000 4500 90 35 7.358 20.031 8682 9652 f(t) Total Load 5233 100 46 8.637 23.710 10326 12405 f(t) _Total Load 5977 106.3 53 9.163 25.733 11418 14110 f(t) _Total Load *
8000 6000 90 33 6.182 18.370 8682 9116 f(t) Total Load 6000 100 44 7.812 22.359 10326 11868 f(t) _Total Load 6487 110 58 9.495 27.129 12089 15193 f(t) _Total Load 7902 118.6 72 10.368 31.105 13701 18272 f(t) _Total Load *
10000 7500 90 32 5.491 17.454 8682 8861 Ultimate Moment Strength/f(t) T L 7500 100 43 6.979 21.390 10326 11621 f(t) _Total Load 7500 110 56 8.665 25.876 12089 14741 f(t) _Total Load 8099 120 74 10.478 31.614 13969 18700 f(t) _Total Load 9976 127.9 94 11.364 36.719 15529 22469 f(t) _Total Load *
12000 9000 90 32 5.117 17.180 8682 8861 Ultimate Moment Strength 9000 100 42 6.337 20.544 10326 11374 f(t) _Total Load 9000 110 54 7.781 24.574 12089 14286 f(t) _Total Load 9000 120 72 9.785 30.507 13969 18272 f(t) _Total Load 10277 129.5 99 11.410 37.373 15866 23106 f(t) _Total Load
Table C.20. U54 Beam Designs - AASHTO LRFD Specifications (Strand Diameter = 0.6 in., Girder Spacing = 16.6 ft.).
f'c (psi)
f'ci (psi)
Length (ft.)
No. Strands
Initial Loss(%)
Final Loss(%)
Mu (kip-ft.)
φMn (kip-ft.)
Controlling Limit State
6000 4703 90.0 41 8.5 22.7 9968 11268 f(t) Total Load 5932 95.8 48 8.8 24.7 11044 13037 f(t) _Total Load **
8000 6000 90.0 40 7.5 21.6 9968 10982 f(t) Total Load 7759 100.0 53 8.5 25.8 11844 14227 f(t) _Total Load 7965 101.9 55 8.6 26.3 12215 14706 f(t) _Total Load **
10000 7500 90.0 38 6.5 20.1 9968 10473 f(t) Total Load 7500 100.0 52 8.5 25.3 11844 13961 f(t) _Total Load 9808 110.0 68 9.3 29.9 13852 17696 f(t) _Total Load 9777 110.1 68 9.3 29.9 13863 17696 f(t) _Total Load **
12000 9000 90.0 37 5.9 19.3 9968 10217 f(t) Total Load 9000 100.0 50 7.6 24.0 11844 13488 f(t) _Total Load 9350 110.0 67 9.4 29.6 13852 17470 f(t) _Total Load 10105 120.0 95 11.6 37.7 15993 23141 f(t) _Total Load 10343 120.9 99 11.7 38.3 16198 23722 f(t) _Total Load
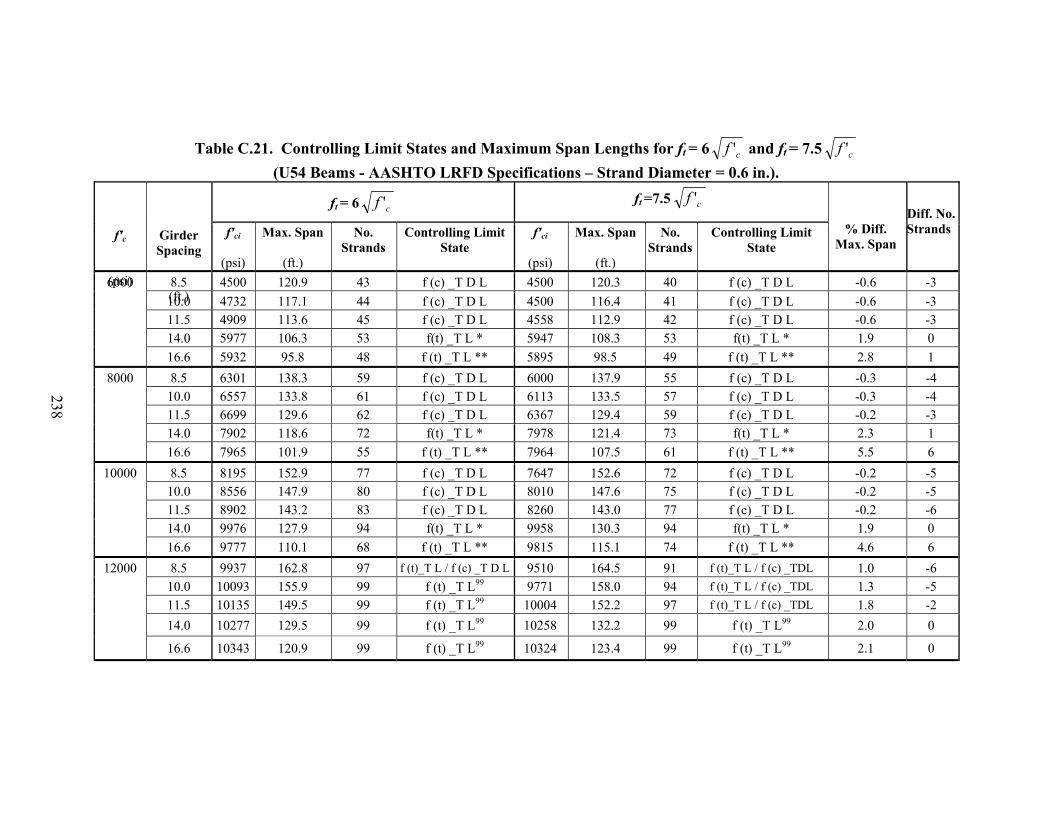
238
Table C.21. Controlling Limit States and Maximum Span Lengths for ft = 6 cf ' and ft = 7.5 cf '
(U54 Beams - AASHTO LRFD Specifications – Strand Diameter = 0.6 in.).
ft = 6 cf ' ft =7.5 cf '
f'c
(psi)
Girder Spacing
(ft.)
f'ci
(psi)
Max. Span
(ft.)
No. Strands
Controlling Limit State
f'ci
(psi)
Max. Span
(ft.)
No. Strands
Controlling Limit State
% Diff.
Max. Span
Diff. No.Strands
6000 8.5 4500 120.9 43 f (c) _T D L 4500 120.3 40 f (c) _T D L -0.6 -3 10.0 4732 117.1 44 f (c) _T D L 4500 116.4 41 f (c) _T D L -0.6 -3 11.5 4909 113.6 45 f (c) _T D L 4558 112.9 42 f (c) _T D L -0.6 -3 14.0 5977 106.3 53 f(t) _T L * 5947 108.3 53 f(t) _T L * 1.9 0 16.6 5932 95.8 48 f (t) _T L ** 5895 98.5 49 f (t) _T L ** 2.8 1
8000 8.5 6301 138.3 59 f (c) _T D L 6000 137.9 55 f (c) _T D L -0.3 -4 10.0 6557 133.8 61 f (c) _T D L 6113 133.5 57 f (c) _T D L -0.3 -4 11.5 6699 129.6 62 f (c) _T D L 6367 129.4 59 f (c) _T D L -0.2 -3 14.0 7902 118.6 72 f(t) _T L * 7978 121.4 73 f(t) _T L * 2.3 1 16.6 7965 101.9 55 f (t) _T L ** 7964 107.5 61 f (t) _T L ** 5.5 6
10000 8.5 8195 152.9 77 f (c) _T D L 7647 152.6 72 f (c) _T D L -0.2 -5 10.0 8556 147.9 80 f (c) _T D L 8010 147.6 75 f (c) _T D L -0.2 -5 11.5 8902 143.2 83 f (c) _T D L 8260 143.0 77 f (c) _T D L -0.2 -6 14.0 9976 127.9 94 f(t) _T L * 9958 130.3 94 f(t) _T L * 1.9 0 16.6 9777 110.1 68 f (t) _T L ** 9815 115.1 74 f (t) _T L ** 4.6 6
12000 8.5 9937 162.8 97 f (t)_T L / f (c) _T D L 9510 164.5 91 f (t)_T L / f (c) _TDL 1.0 -6 10.0 10093 155.9 99 f (t) _T L99 9771 158.0 94 f (t)_T L / f (c) _TDL 1.3 -5 11.5 10135 149.5 99 f (t) _T L99 10004 152.2 97 f (t)_T L / f (c) _TDL 1.8 -2 14.0 10277 129.5 99 f (t) _T L99 10258 132.2 99 f (t) _T L99 2.0 0
16.6 10343 120.9 99 f (t) _T L99 10324 123.4 99 f (t) _T L99 2.1 0
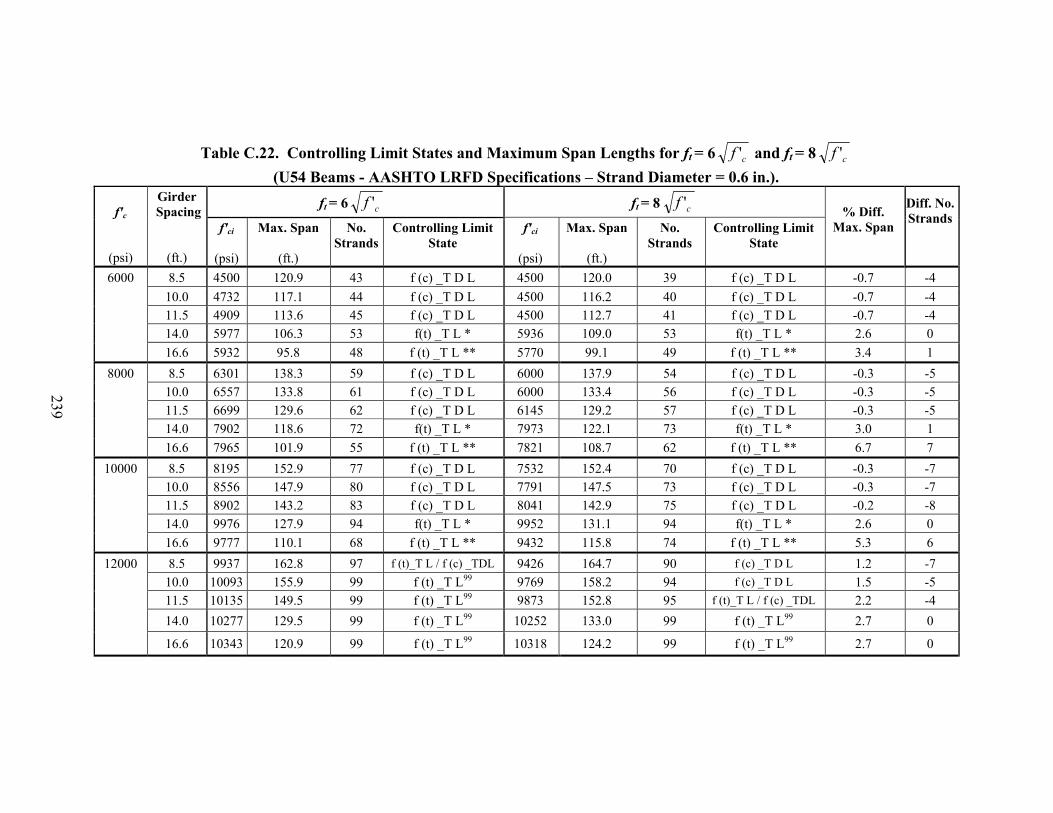
239
Table C.22. Controlling Limit States and Maximum Span Lengths for ft = 6 cf ' and ft = 8 cf '
(U54 Beams - AASHTO LRFD Specifications – Strand Diameter = 0.6 in.). ft = 6 cf ' ft = 8 cf '
f'c
(psi)
Girder Spacing
(ft.)
f'ci
(psi)
Max. Span
(ft.)
No. Strands
Controlling Limit State
f'ci
(psi)
Max. Span
(ft.)
No. Strands
Controlling Limit State
% Diff.
Max. Span
Diff. No.Strands
6000 8.5 4500 120.9 43 f (c) _T D L 4500 120.0 39 f (c) _T D L -0.7 -4 10.0 4732 117.1 44 f (c) _T D L 4500 116.2 40 f (c) _T D L -0.7 -4 11.5 4909 113.6 45 f (c) _T D L 4500 112.7 41 f (c) _T D L -0.7 -4 14.0 5977 106.3 53 f(t) _T L * 5936 109.0 53 f(t) _T L * 2.6 0 16.6 5932 95.8 48 f (t) _T L ** 5770 99.1 49 f (t) _T L ** 3.4 1
8000 8.5 6301 138.3 59 f (c) _T D L 6000 137.9 54 f (c) _T D L -0.3 -5 10.0 6557 133.8 61 f (c) _T D L 6000 133.4 56 f (c) _T D L -0.3 -5 11.5 6699 129.6 62 f (c) _T D L 6145 129.2 57 f (c) _T D L -0.3 -5 14.0 7902 118.6 72 f(t) _T L * 7973 122.1 73 f(t) _T L * 3.0 1 16.6 7965 101.9 55 f (t) _T L ** 7821 108.7 62 f (t) _T L ** 6.7 7
10000 8.5 8195 152.9 77 f (c) _T D L 7532 152.4 70 f (c) _T D L -0.3 -7 10.0 8556 147.9 80 f (c) _T D L 7791 147.5 73 f (c) _T D L -0.3 -7 11.5 8902 143.2 83 f (c) _T D L 8041 142.9 75 f (c) _T D L -0.2 -8 14.0 9976 127.9 94 f(t) _T L * 9952 131.1 94 f(t) _T L * 2.6 0 16.6 9777 110.1 68 f (t) _T L ** 9432 115.8 74 f (t) _T L ** 5.3 6
12000 8.5 9937 162.8 97 f (t)_T L / f (c) _TDL 9426 164.7 90 f (c) _T D L 1.2 -7 10.0 10093 155.9 99 f (t) _T L99 9769 158.2 94 f (c) _T D L 1.5 -5 11.5 10135 149.5 99 f (t) _T L99 9873 152.8 95 f (t)_T L / f (c) _TDL 2.2 -4 14.0 10277 129.5 99 f (t) _T L99 10252 133.0 99 f (t) _T L99 2.7 0
16.6 10343 120.9 99 f (t) _T L99 10318 124.2 99 f (t) _T L99 2.7 0

241
APPENDIX D
RESULTS FOR TYPE IV BEAMS
Note: For a description of the controlling limit states, refer to Table 7.2.
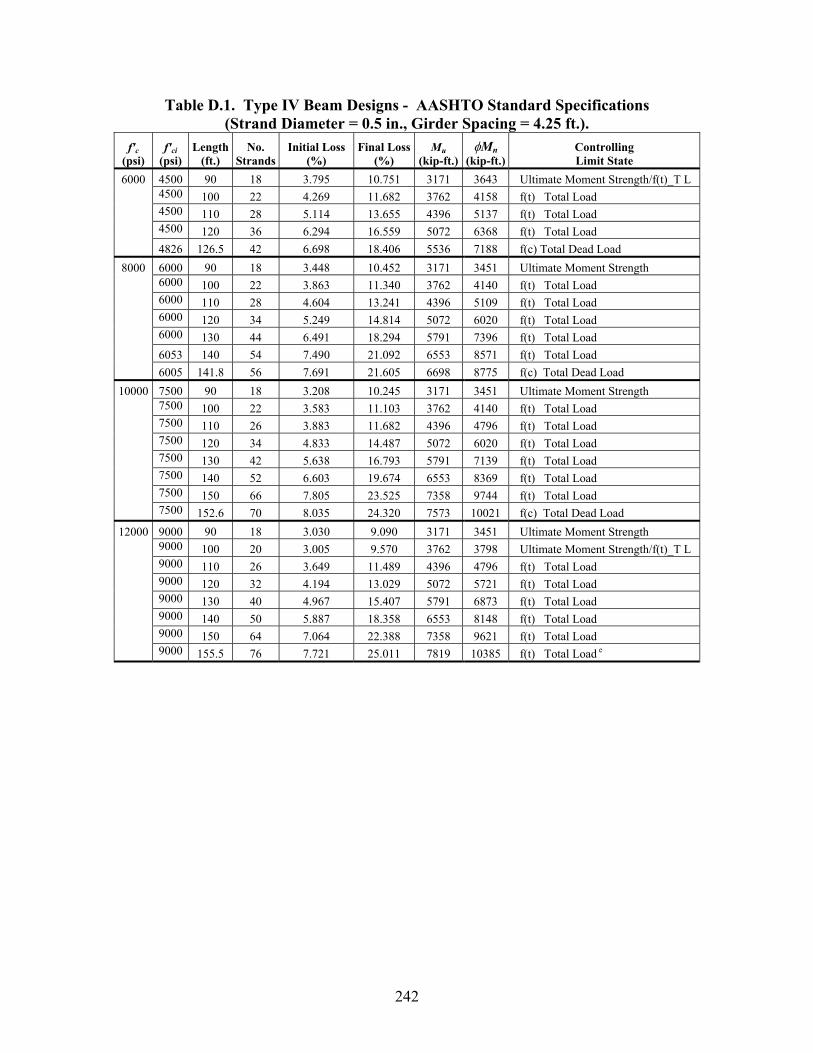
242
Table D.1. Type IV Beam Designs - AASHTO Standard Specifications (Strand Diameter = 0.5 in., Girder Spacing = 4.25 ft.).
f'c (psi)
f'ci (psi)
Length (ft.)
No. Strands
Initial Loss (%)
Final Loss(%)
Mu (kip-ft.)
φMn (kip-ft.)
Controlling Limit State
6000 4500 90 18 3.795 10.751 3171 3643 Ultimate Moment Strength/f(t)_T L 4500 100 22 4.269 11.682 3762 4158 f(t) Total Load 4500 110 28 5.114 13.655 4396 5137 f(t) Total Load 4500 120 36 6.294 16.559 5072 6368 f(t) Total Load 4826 126.5 42 6.698 18.406 5536 7188 f(c) Total Dead Load
8000 6000 90 18 3.448 10.452 3171 3451 Ultimate Moment Strength 6000 100 22 3.863 11.340 3762 4140 f(t) Total Load 6000 110 28 4.604 13.241 4396 5109 f(t) Total Load 6000 120 34 5.249 14.814 5072 6020 f(t) Total Load 6000 130 44 6.491 18.294 5791 7396 f(t) Total Load
6053 140 54 7.490 21.092 6553 8571 f(t) Total Load 6005 141.8 56 7.691 21.605 6698 8775 f(c) Total Dead Load 10000 7500 90 18 3.208 10.245 3171 3451 Ultimate Moment Strength
7500 100 22 3.583 11.103 3762 4140 f(t) Total Load 7500 110 26 3.883 11.682 4396 4796 f(t) Total Load 7500 120 34 4.833 14.487 5072 6020 f(t) Total Load 7500 130 42 5.638 16.793 5791 7139 f(t) Total Load 7500 140 52 6.603 19.674 6553 8369 f(t) Total Load 7500 150 66 7.805 23.525 7358 9744 f(t) Total Load 7500 152.6 70 8.035 24.320 7573 10021 f(c) Total Dead Load
12000 9000 90 18 3.030 9.090 3171 3451 Ultimate Moment Strength 9000 100 20 3.005 9.570 3762 3798 Ultimate Moment Strength/f(t)_T L 9000 110 26 3.649 11.489 4396 4796 f(t) Total Load 9000 120 32 4.194 13.029 5072 5721 f(t) Total Load 9000 130 40 4.967 15.407 5791 6873 f(t) Total Load 9000 140 50 5.887 18.358 6553 8148 f(t) Total Load 9000 150 64 7.064 22.388 7358 9621 f(t) Total Load
9000 155.5 76 7.721 25.011 7819 10385 f(t) Total Load e
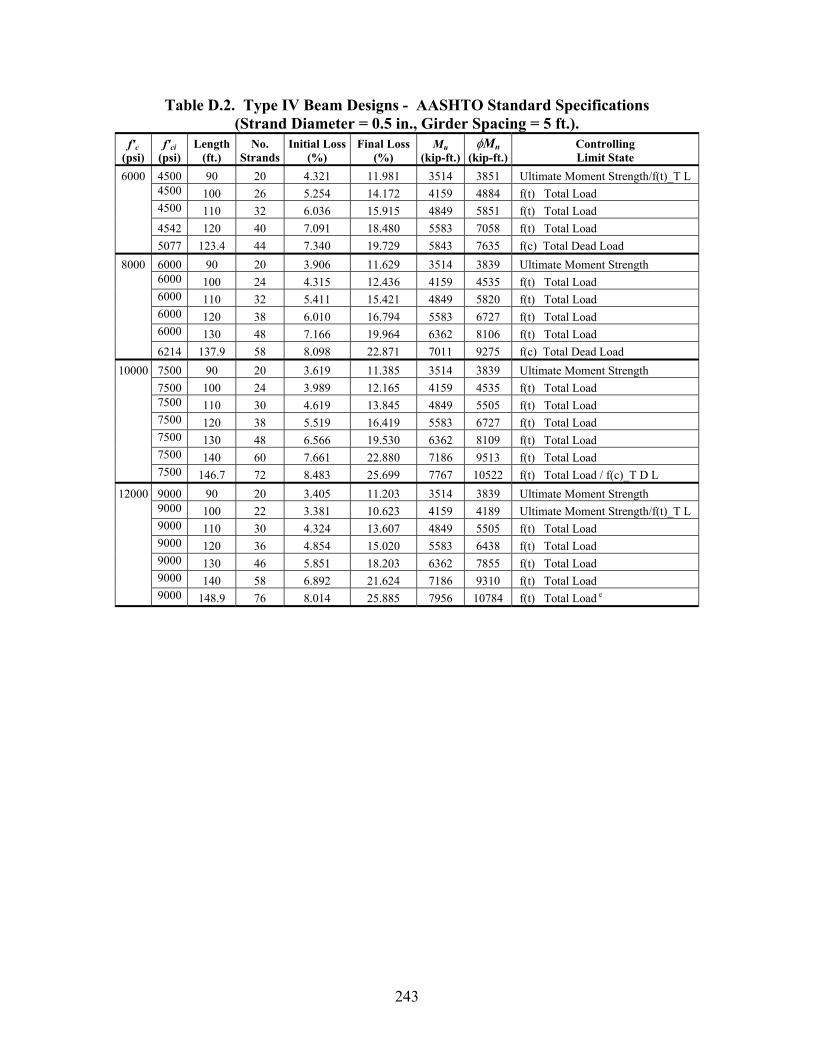
243
Table D.2. Type IV Beam Designs - AASHTO Standard Specifications (Strand Diameter = 0.5 in., Girder Spacing = 5 ft.).
f'c (psi)
f'ci (psi)
Length (ft.)
No. Strands
Initial Loss(%)
Final Loss (%)
Mu (kip-ft.)
φMn (kip-ft.)
Controlling Limit State
6000 4500 90 20 4.321 11.981 3514 3851 Ultimate Moment Strength/f(t)_T L 4500 100 26 5.254 14.172 4159 4884 f(t) Total Load 4500 110 32 6.036 15.915 4849 5851 f(t) Total Load 4542 120 40 7.091 18.480 5583 7058 f(t) Total Load 5077 123.4 44 7.340 19.729 5843 7635 f(c) Total Dead Load
8000 6000 90 20 3.906 11.629 3514 3839 Ultimate Moment Strength 6000 100 24 4.315 12.436 4159 4535 f(t) Total Load 6000 110 32 5.411 15.421 4849 5820 f(t) Total Load 6000 120 38 6.010 16.794 5583 6727 f(t) Total Load 6000 130 48 7.166 19.964 6362 8106 f(t) Total Load
6214 137.9 58 8.098 22.871 7011 9275 f(c) Total Dead Load 10000 7500 90 20 3.619 11.385 3514 3839 Ultimate Moment Strength
7500 100 24 3.989 12.165 4159 4535 f(t) Total Load 7500 110 30 4.619 13.845 4849 5505 f(t) Total Load 7500 120 38 5.519 16.419 5583 6727 f(t) Total Load 7500 130 48 6.566 19.530 6362 8109 f(t) Total Load 7500 140 60 7.661 22.880 7186 9513 f(t) Total Load 7500 146.7 72 8.483 25.699 7767 10522 f(t) Total Load / f(c)_T D L
12000 9000 90 20 3.405 11.203 3514 3839 Ultimate Moment Strength 9000 100 22 3.381 10.623 4159 4189 Ultimate Moment Strength/f(t)_T L 9000 110 30 4.324 13.607 4849 5505 f(t) Total Load 9000 120 36 4.854 15.020 5583 6438 f(t) Total Load 9000 130 46 5.851 18.203 6362 7855 f(t) Total Load 9000 140 58 6.892 21.624 7186 9310 f(t) Total Load 9000 148.9 76 8.014 25.885 7956 10784 f(t) Total Load e
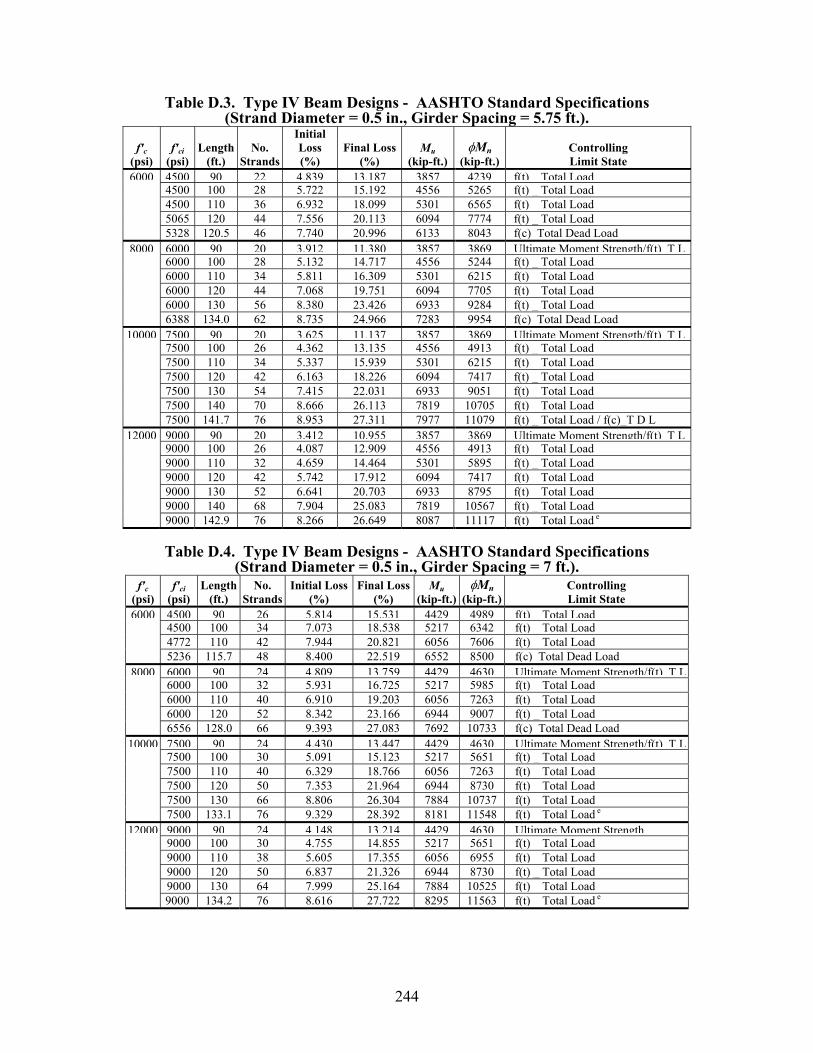
244
Table D.3. Type IV Beam Designs - AASHTO Standard Specifications (Strand Diameter = 0.5 in., Girder Spacing = 5.75 ft.).
f'c (psi)
f'ci (psi)
Length (ft.)
No. Strands
Initial Loss (%)
Final Loss(%)
Mu (kip-ft.)
φMn (kip-ft.)
Controlling Limit State
6000 4500 90 22 4.839 13.187 3857 4239 f(t) Total Load 4500 100 28 5.722 15.192 4556 5265 f(t) _ Total Load 4500 110 36 6.932 18.099 5301 6565 f(t) _ Total Load 5065 120 44 7.556 20.113 6094 7774 f(t) _ Total Load 5328 120.5 46 7.740 20.996 6133 8043 f(c)_Total Dead Load
8000 6000 90 20 3.912 11.380 3857 3869 Ultimate Moment Strength/f(t) T L 6000 100 28 5.132 14.717 4556 5244 f(t) _ Total Load 6000 110 34 5.811 16.309 5301 6215 f(t) _ Total Load 6000 120 44 7.068 19.751 6094 7705 f(t) _ Total Load 6000 130 56 8.380 23.426 6933 9284 f(t) _ Total Load 6388 134.0 62 8.735 24.966 7283 9954 f(c)_Total Dead Load
10000 7500 90 20 3.625 11.137 3857 3869 Ultimate Moment Strength/f(t) T L 7500 100 26 4.362 13.135 4556 4913 f(t) _ Total Load 7500 110 34 5.337 15.939 5301 6215 f(t) _ Total Load 7500 120 42 6.163 18.226 6094 7417 f(t) _ Total Load 7500 130 54 7.415 22.031 6933 9051 f(t) _ Total Load 7500 140 70 8.666 26.113 7819 10705 f(t) _ Total Load 7500 141.7 76 8.953 27.311 7977 11079 f(t) _ Total Load / f(c)_T D L
12000 9000 90 20 3.412 10.955 3857 3869 Ultimate Moment Strength/f(t) T L 9000 100 26 4.087 12.909 4556 4913 f(t) _ Total Load 9000 110 32 4.659 14.464 5301 5895 f(t) _ Total Load 9000 120 42 5.742 17.912 6094 7417 f(t) _ Total Load 9000 130 52 6.641 20.703 6933 8795 f(t) _ Total Load 9000 140 68 7.904 25.083 7819 10567 f(t) _ Total Load 9000 142.9 76 8.266 26.649 8087 11117 f(t) _ Total Load e
Table D.4. Type IV Beam Designs - AASHTO Standard Specifications
(Strand Diameter = 0.5 in., Girder Spacing = 7 ft.). f'c
(psi) f'ci
(psi) Length
(ft.) No.
Strands Initial Loss
(%) Final Loss
(%) Mu
(kip-ft.)φMn
(kip-ft.) Controlling Limit State
6000 4500 90 26 5.814 15.531 4429 4989 f(t) Total Load 4500 100 34 7.073 18.538 5217 6342 f(t) _ Total Load 4772 110 42 7.944 20.821 6056 7606 f(t) _ Total Load 5236 115.7 48 8.400 22.519 6552 8500 f(c)_Total Dead Load
8000 6000 90 24 4.809 13.759 4429 4630 Ultimate Moment Strength/f(t) T L 6000 100 32 5.931 16.725 5217 5985 f(t) _ Total Load 6000 110 40 6.910 19.203 6056 7263 f(t) _ Total Load 6000 120 52 8.342 23.166 6944 9007 f(t) _ Total Load 6556 128.0 66 9.393 27.083 7692 10733 f(c)_Total Dead Load
10000 7500 90 24 4.430 13.447 4429 4630 Ultimate Moment Strength/f(t) T L 7500 100 30 5.091 15.123 5217 5651 f(t) _ Total Load 7500 110 40 6.329 18.766 6056 7263 f(t) _ Total Load 7500 120 50 7.353 21.964 6944 8730 f(t) _ Total Load 7500 130 66 8.806 26.304 7884 10737 f(t) _ Total Load 7500 133.1 76 9.329 28.392 8181 11548 f(t) _ Total Load e
12000 9000 90 24 4.148 13.214 4429 4630 Ultimate Moment Strength 9000 100 30 4.755 14.855 5217 5651 f(t) _ Total Load 9000 110 38 5.605 17.355 6056 6955 f(t) _ Total Load 9000 120 50 6.837 21.326 6944 8730 f(t) _ Total Load 9000 130 64 7.999 25.164 7884 10525 f(t) _ Total Load 9000 134.2 76 8.616 27.722 8295 11563 f(t) _ Total Load e
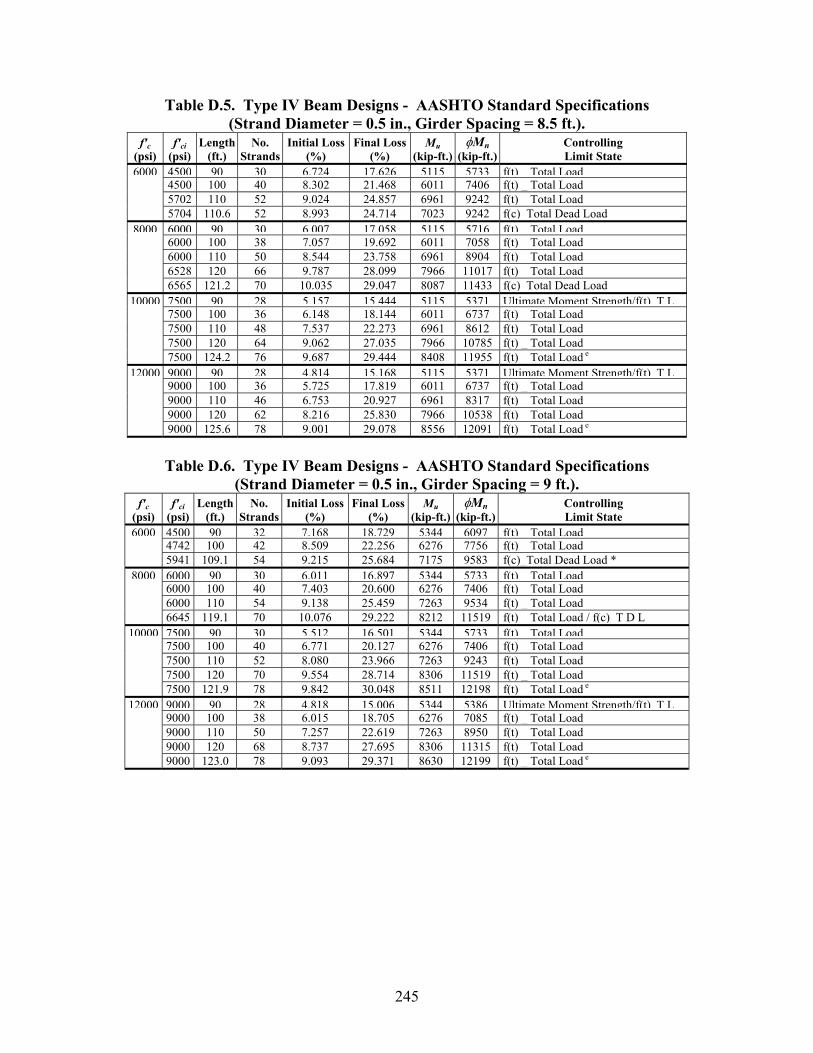
245
Table D.5. Type IV Beam Designs - AASHTO Standard Specifications (Strand Diameter = 0.5 in., Girder Spacing = 8.5 ft.).
f'c (psi)
f'ci (psi)
Length (ft.)
No. Strands
Initial Loss(%)
Final Loss(%)
Mu (kip-ft.)
φMn (kip-ft.)
Controlling Limit State
6000 4500 90 30 6.724 17.626 5115 5733 f(t) Total Load 4500 100 40 8.302 21.468 6011 7406 f(t) _ Total Load 5702 110 52 9.024 24.857 6961 9242 f(t) _ Total Load 5704 110.6 52 8.993 24.714 7023 9242 f(c)_Total Dead Load
8000 6000 90 30 6.007 17.058 5115 5716 f(t) Total Load 6000 100 38 7.057 19.692 6011 7058 f(t) _ Total Load 6000 110 50 8.544 23.758 6961 8904 f(t) _ Total Load 6528 120 66 9.787 28.099 7966 11017 f(t) _ Total Load 6565 121.2 70 10.035 29.047 8087 11433 f(c)_Total Dead Load
10000 7500 90 28 5.157 15.444 5115 5371 Ultimate Moment Strength/f(t) T L 7500 100 36 6.148 18.144 6011 6737 f(t) _ Total Load 7500 110 48 7.537 22.273 6961 8612 f(t) _ Total Load 7500 120 64 9.062 27.035 7966 10785 f(t) _ Total Load 7500 124.2 76 9.687 29.444 8408 11955 f(t) _ Total Load e
12000 9000 90 28 4.814 15.168 5115 5371 Ultimate Moment Strength/f(t) T L 9000 100 36 5.725 17.819 6011 6737 f(t) _ Total Load 9000 110 46 6.753 20.927 6961 8317 f(t) _ Total Load 9000 120 62 8.216 25.830 7966 10538 f(t) _ Total Load 9000 125.6 78 9.001 29.078 8556 12091 f(t) _ Total Load e
Table D.6. Type IV Beam Designs - AASHTO Standard Specifications
(Strand Diameter = 0.5 in., Girder Spacing = 9 ft.). f'c
(psi) f'ci
(psi) Length
(ft.) No.
Strands Initial Loss
(%) Final Loss
(%) Mu
(kip-ft.)φMn
(kip-ft.) Controlling Limit State
6000 4500 90 32 7.168 18.729 5344 6097 f(t) Total Load 4742 100 42 8.509 22.256 6276 7756 f(t) _ Total Load 5941 109.1 54 9.215 25.684 7175 9583 f(c)_Total Dead Load *
8000 6000 90 30 6.011 16.897 5344 5733 f(t) Total Load 6000 100 40 7.403 20.600 6276 7406 f(t) _ Total Load 6000 110 54 9.138 25.459 7263 9534 f(t) _ Total Load 6645 119.1 70 10.076 29.222 8212 11519 f(t) _ Total Load / f(c)_T D L
10000 7500 90 30 5.512 16.501 5344 5733 f(t) Total Load 7500 100 40 6.771 20.127 6276 7406 f(t) _ Total Load 7500 110 52 8.080 23.966 7263 9243 f(t) _ Total Load 7500 120 70 9.554 28.714 8306 11519 f(t) _ Total Load 7500 121.9 78 9.842 30.048 8511 12198 f(t) _ Total Load e
12000 9000 90 28 4.818 15.006 5344 5386 Ultimate Moment Strength/f(t) T L 9000 100 38 6.015 18.705 6276 7085 f(t) _ Total Load 9000 110 50 7.257 22.619 7263 8950 f(t) _ Total Load 9000 120 68 8.737 27.695 8306 11315 f(t) _ Total Load 9000 123.0 78 9.093 29.371 8630 12199 f(t) _ Total Load e
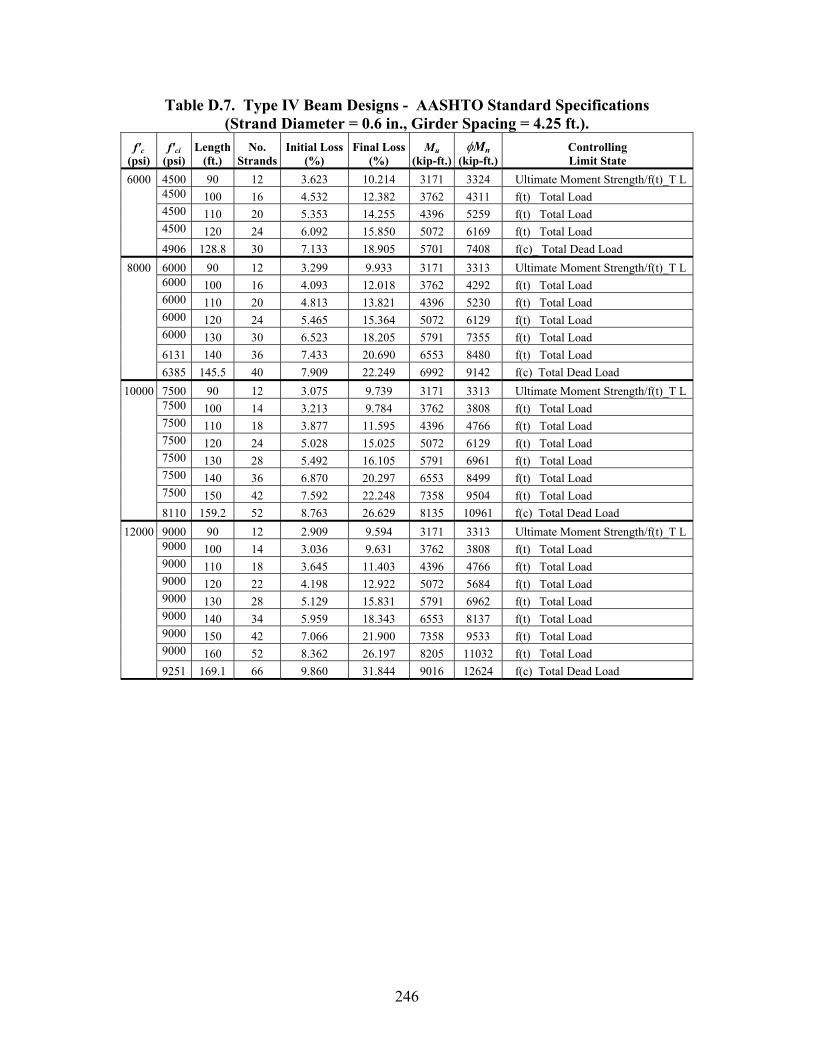
246
Table D.7. Type IV Beam Designs - AASHTO Standard Specifications (Strand Diameter = 0.6 in., Girder Spacing = 4.25 ft.).
f'c (psi)
f'ci (psi)
Length (ft.)
No. Strands
Initial Loss(%)
Final Loss(%)
Mu (kip-ft.)
φMn (kip-ft.)
Controlling Limit State
6000 4500 90 12 3.623 10.214 3171 3324 Ultimate Moment Strength/f(t)_T L 4500 100 16 4.532 12.382 3762 4311 f(t) Total Load 4500 110 20 5.353 14.255 4396 5259 f(t) Total Load 4500 120 24 6.092 15.850 5072 6169 f(t) Total Load 4906 128.8 30 7.133 18.905 5701 7408 f(c)_ Total Dead Load
8000 6000 90 12 3.299 9.933 3171 3313 Ultimate Moment Strength/f(t)_T L 6000 100 16 4.093 12.018 3762 4292 f(t) Total Load 6000 110 20 4.813 13.821 4396 5230 f(t) Total Load 6000 120 24 5.465 15.364 5072 6129 f(t) Total Load 6000 130 30 6.523 18.205 5791 7355 f(t) Total Load
6131 140 36 7.433 20.690 6553 8480 f(t) Total Load 6385 145.5 40 7.909 22.249 6992 9142 f(c) Total Dead Load 10000 7500 90 12 3.075 9.739 3171 3313 Ultimate Moment Strength/f(t)_T L
7500 100 14 3.213 9.784 3762 3808 f(t) Total Load 7500 110 18 3.877 11.595 4396 4766 f(t) Total Load 7500 120 24 5.028 15.025 5072 6129 f(t) Total Load 7500 130 28 5.492 16.105 5791 6961 f(t) Total Load 7500 140 36 6.870 20.297 6553 8499 f(t) Total Load 7500 150 42 7.592 22.248 7358 9504 f(t) Total Load 8110 159.2 52 8.763 26.629 8135 10961 f(c) Total Dead Load
12000 9000 90 12 2.909 9.594 3171 3313 Ultimate Moment Strength/f(t)_T L 9000 100 14 3.036 9.631 3762 3808 f(t) Total Load 9000 110 18 3.645 11.403 4396 4766 f(t) Total Load 9000 120 22 4.198 12.922 5072 5684 f(t) Total Load 9000 130 28 5.129 15.831 5791 6962 f(t) Total Load 9000 140 34 5.959 18.343 6553 8137 f(t) Total Load 9000 150 42 7.066 21.900 7358 9533 f(t) Total Load
9000 160 52 8.362 26.197 8205 11032 f(t) Total Load 9251 169.1 66 9.860 31.844 9016 12624 f(c) Total Dead Load
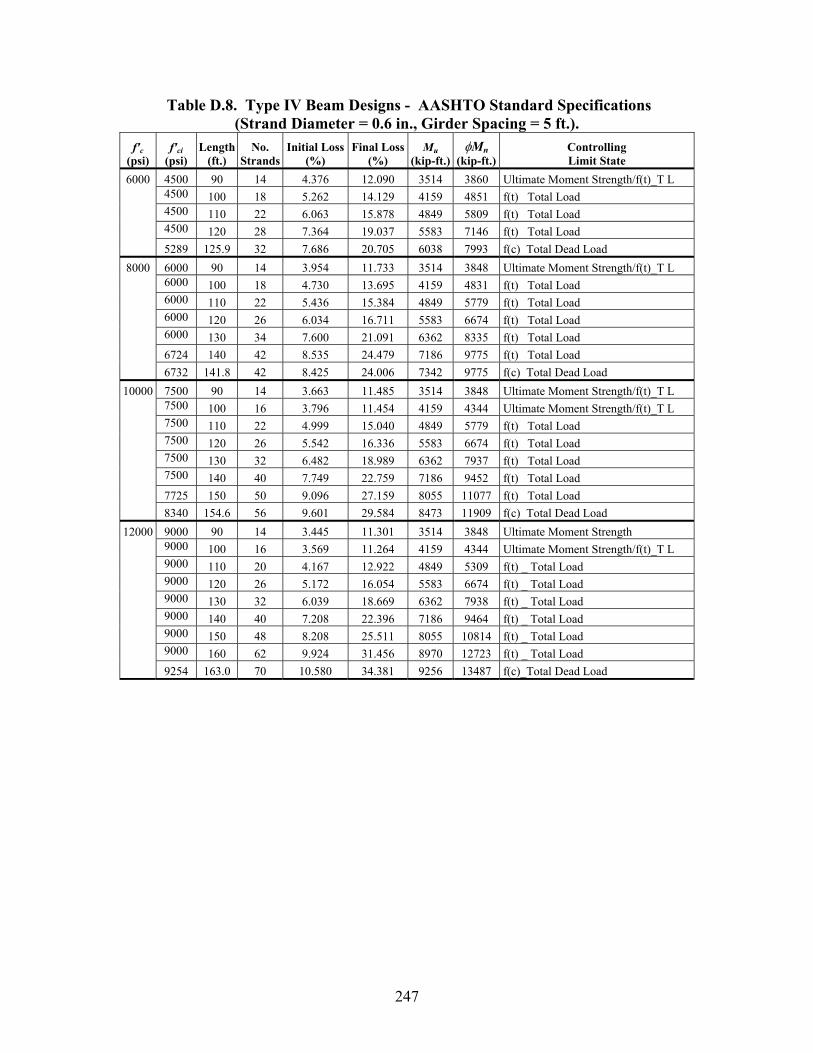
247
Table D.8. Type IV Beam Designs - AASHTO Standard Specifications (Strand Diameter = 0.6 in., Girder Spacing = 5 ft.).
f'c (psi)
f'ci (psi)
Length (ft.)
No. Strands
Initial Loss(%)
Final Loss(%)
Mu (kip-ft.)
φMn (kip-ft.)
Controlling Limit State
6000 4500 90 14 4.376 12.090 3514 3860 Ultimate Moment Strength/f(t)_T L 4500 100 18 5.262 14.129 4159 4851 f(t) Total Load 4500 110 22 6.063 15.878 4849 5809 f(t) Total Load 4500 120 28 7.364 19.037 5583 7146 f(t) Total Load 5289 125.9 32 7.686 20.705 6038 7993 f(c) Total Dead Load
8000 6000 90 14 3.954 11.733 3514 3848 Ultimate Moment Strength/f(t)_T L 6000 100 18 4.730 13.695 4159 4831 f(t) Total Load 6000 110 22 5.436 15.384 4849 5779 f(t) Total Load 6000 120 26 6.034 16.711 5583 6674 f(t) Total Load 6000 130 34 7.600 21.091 6362 8335 f(t) Total Load
6724 140 42 8.535 24.479 7186 9775 f(t) Total Load 6732 141.8 42 8.425 24.006 7342 9775 f(c) Total Dead Load
10000 7500 90 14 3.663 11.485 3514 3848 Ultimate Moment Strength/f(t)_T L 7500 100 16 3.796 11.454 4159 4344 Ultimate Moment Strength/f(t)_T L 7500 110 22 4.999 15.040 4849 5779 f(t) Total Load 7500 120 26 5.542 16.336 5583 6674 f(t) Total Load 7500 130 32 6.482 18.989 6362 7937 f(t) Total Load 7500 140 40 7.749 22.759 7186 9452 f(t) Total Load 7725 150 50 9.096 27.159 8055 11077 f(t) Total Load 8340 154.6 56 9.601 29.584 8473 11909 f(c) Total Dead Load
12000 9000 90 14 3.445 11.301 3514 3848 Ultimate Moment Strength 9000 100 16 3.569 11.264 4159 4344 Ultimate Moment Strength/f(t)_T L 9000 110 20 4.167 12.922 4849 5309 f(t) _ Total Load 9000 120 26 5.172 16.054 5583 6674 f(t) _ Total Load 9000 130 32 6.039 18.669 6362 7938 f(t) _ Total Load 9000 140 40 7.208 22.396 7186 9464 f(t) _ Total Load 9000 150 48 8.208 25.511 8055 10814 f(t) _ Total Load
9000 160 62 9.924 31.456 8970 12723 f(t) _ Total Load 9254 163.0 70 10.580 34.381 9256 13487 f(c)_Total Dead Load
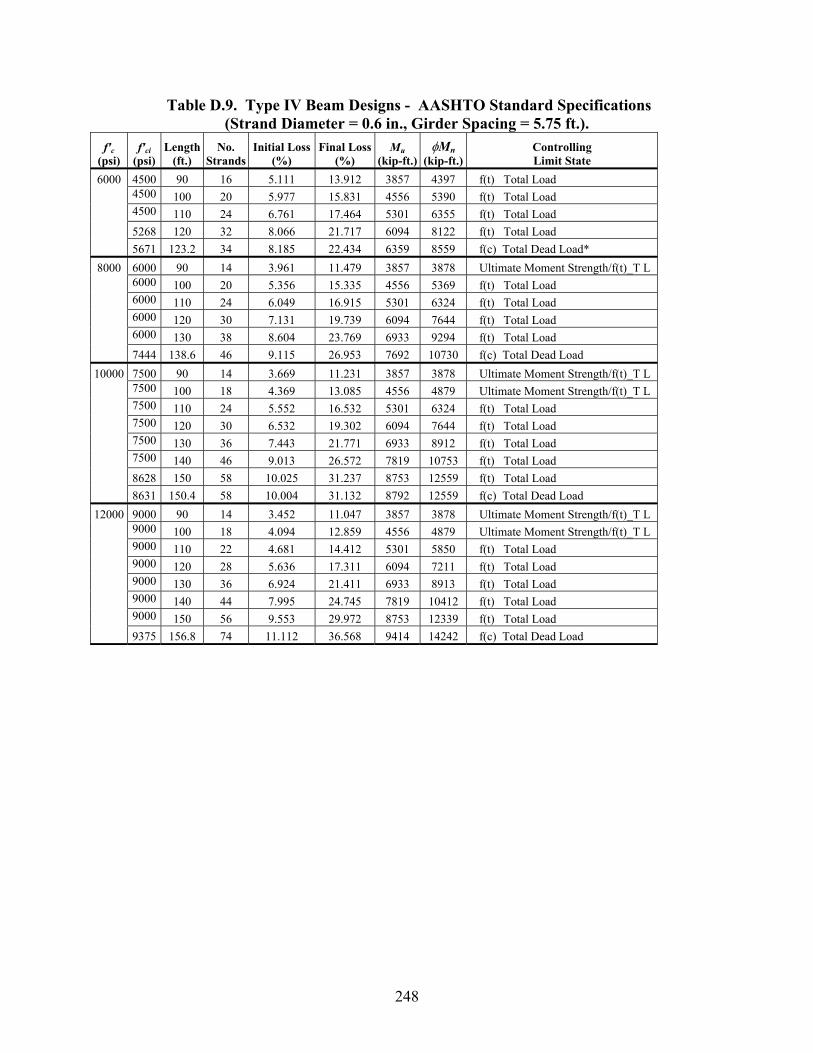
248
Table D.9. Type IV Beam Designs - AASHTO Standard Specifications (Strand Diameter = 0.6 in., Girder Spacing = 5.75 ft.).
f'c (psi)
f'ci (psi)
Length (ft.)
No. Strands
Initial Loss (%)
Final Loss(%)
Mu (kip-ft.)
φMn (kip-ft.)
Controlling Limit State
6000 4500 90 16 5.111 13.912 3857 4397 f(t) Total Load 4500 100 20 5.977 15.831 4556 5390 f(t) Total Load 4500 110 24 6.761 17.464 5301 6355 f(t) Total Load 5268 120 32 8.066 21.717 6094 8122 f(t) Total Load 5671 123.2 34 8.185 22.434 6359 8559 f(c) Total Dead Load*
8000 6000 90 14 3.961 11.479 3857 3878 Ultimate Moment Strength/f(t)_T L 6000 100 20 5.356 15.335 4556 5369 f(t) Total Load 6000 110 24 6.049 16.915 5301 6324 f(t) Total Load 6000 120 30 7.131 19.739 6094 7644 f(t) Total Load 6000 130 38 8.604 23.769 6933 9294 f(t) Total Load 7444 138.6 46 9.115 26.953 7692 10730 f(c) Total Dead Load
10000 7500 90 14 3.669 11.231 3857 3878 Ultimate Moment Strength/f(t)_T L 7500 100 18 4.369 13.085 4556 4879 Ultimate Moment Strength/f(t)_T L 7500 110 24 5.552 16.532 5301 6324 f(t) Total Load 7500 120 30 6.532 19.302 6094 7644 f(t) Total Load 7500 130 36 7.443 21.771 6933 8912 f(t) Total Load 7500 140 46 9.013 26.572 7819 10753 f(t) Total Load 8628 150 58 10.025 31.237 8753 12559 f(t) Total Load
8631 150.4 58 10.004 31.132 8792 12559 f(c) Total Dead Load 12000 9000 90 14 3.452 11.047 3857 3878 Ultimate Moment Strength/f(t)_T L
9000 100 18 4.094 12.859 4556 4879 Ultimate Moment Strength/f(t)_T L 9000 110 22 4.681 14.412 5301 5850 f(t) Total Load 9000 120 28 5.636 17.311 6094 7211 f(t) Total Load 9000 130 36 6.924 21.411 6933 8913 f(t) Total Load 9000 140 44 7.995 24.745 7819 10412 f(t) Total Load 9000 150 56 9.553 29.972 8753 12339 f(t) Total Load
9375 156.8 74 11.112 36.568 9414 14242 f(c) Total Dead Load
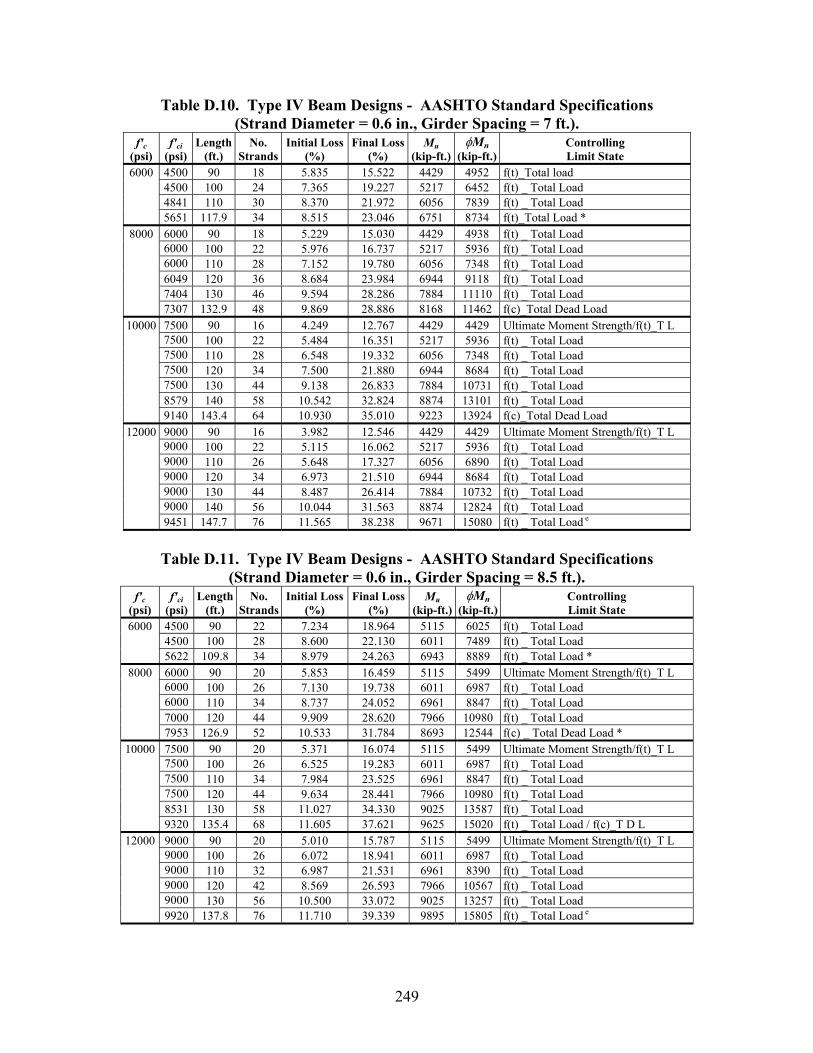
249
Table D.10. Type IV Beam Designs - AASHTO Standard Specifications (Strand Diameter = 0.6 in., Girder Spacing = 7 ft.).
f'c (psi)
f'ci (psi)
Length (ft.)
No. Strands
Initial Loss(%)
Final Loss(%)
Mu (kip-ft.)
φMn (kip-ft.)
Controlling Limit State
6000 4500 90 18 5.835 15.522 4429 4952 f(t)_Total load 4500 100 24 7.365 19.227 5217 6452 f(t) _ Total Load 4841 110 30 8.370 21.972 6056 7839 f(t) _ Total Load 5651 117.9 34 8.515 23.046 6751 8734 f(t)_Total Load *
8000 6000 90 18 5.229 15.030 4429 4938 f(t) _ Total Load 6000 100 22 5.976 16.737 5217 5936 f(t) _ Total Load 6000 110 28 7.152 19.780 6056 7348 f(t) _ Total Load 6049 120 36 8.684 23.984 6944 9118 f(t) _ Total Load 7404 130 46 9.594 28.286 7884 11110 f(t) _ Total Load
7307 132.9 48 9.869 28.886 8168 11462 f(c)_Total Dead Load 10000 7500 90 16 4.249 12.767 4429 4429 Ultimate Moment Strength/f(t)_T L
7500 100 22 5.484 16.351 5217 5936 f(t) _ Total Load 7500 110 28 6.548 19.332 6056 7348 f(t) _ Total Load 7500 120 34 7.500 21.880 6944 8684 f(t) _ Total Load 7500 130 44 9.138 26.833 7884 10731 f(t) _ Total Load 8579 140 58 10.542 32.824 8874 13101 f(t) _ Total Load 9140 143.4 64 10.930 35.010 9223 13924 f(c)_Total Dead Load
12000 9000 90 16 3.982 12.546 4429 4429 Ultimate Moment Strength/f(t)_T L 9000 100 22 5.115 16.062 5217 5936 f(t) _ Total Load 9000 110 26 5.648 17.327 6056 6890 f(t) _ Total Load 9000 120 34 6.973 21.510 6944 8684 f(t) _ Total Load 9000 130 44 8.487 26.414 7884 10732 f(t) _ Total Load 9000 140 56 10.044 31.563 8874 12824 f(t) _ Total Load 9451 147.7 76 11.565 38.238 9671 15080 f(t) _ Total Load e
Table D.11. Type IV Beam Designs - AASHTO Standard Specifications
(Strand Diameter = 0.6 in., Girder Spacing = 8.5 ft.). f'c
(psi) f'ci
(psi) Length
(ft.) No.
Strands Initial Loss
(%) Final Loss
(%) Mu
(kip-ft.)φMn
(kip-ft.) Controlling Limit State
6000 4500 90 22 7.234 18.964 5115 6025 f(t) _ Total Load 4500 100 28 8.600 22.130 6011 7489 f(t) _ Total Load 5622 109.8 34 8.979 24.263 6943 8889 f(t) _ Total Load *
8000 6000 90 20 5.853 16.459 5115 5499 Ultimate Moment Strength/f(t)_T L 6000 100 26 7.130 19.738 6011 6987 f(t) _ Total Load 6000 110 34 8.737 24.052 6961 8847 f(t) _ Total Load 7000 120 44 9.909 28.620 7966 10980 f(t) _ Total Load 7953 126.9 52 10.533 31.784 8693 12544 f(c) _ Total Dead Load *
10000 7500 90 20 5.371 16.074 5115 5499 Ultimate Moment Strength/f(t)_T L 7500 100 26 6.525 19.283 6011 6987 f(t) _ Total Load 7500 110 34 7.984 23.525 6961 8847 f(t) _ Total Load 7500 120 44 9.634 28.441 7966 10980 f(t) _ Total Load 8531 130 58 11.027 34.330 9025 13587 f(t) _ Total Load 9320 135.4 68 11.605 37.621 9625 15020 f(t) _ Total Load / f(c)_T D L
12000 9000 90 20 5.010 15.787 5115 5499 Ultimate Moment Strength/f(t)_T L 9000 100 26 6.072 18.941 6011 6987 f(t) _ Total Load 9000 110 32 6.987 21.531 6961 8390 f(t) _ Total Load 9000 120 42 8.569 26.593 7966 10567 f(t) _ Total Load 9000 130 56 10.500 33.072 9025 13257 f(t) _ Total Load 9920 137.8 76 11.710 39.339 9895 15805 f(t) _ Total Load e
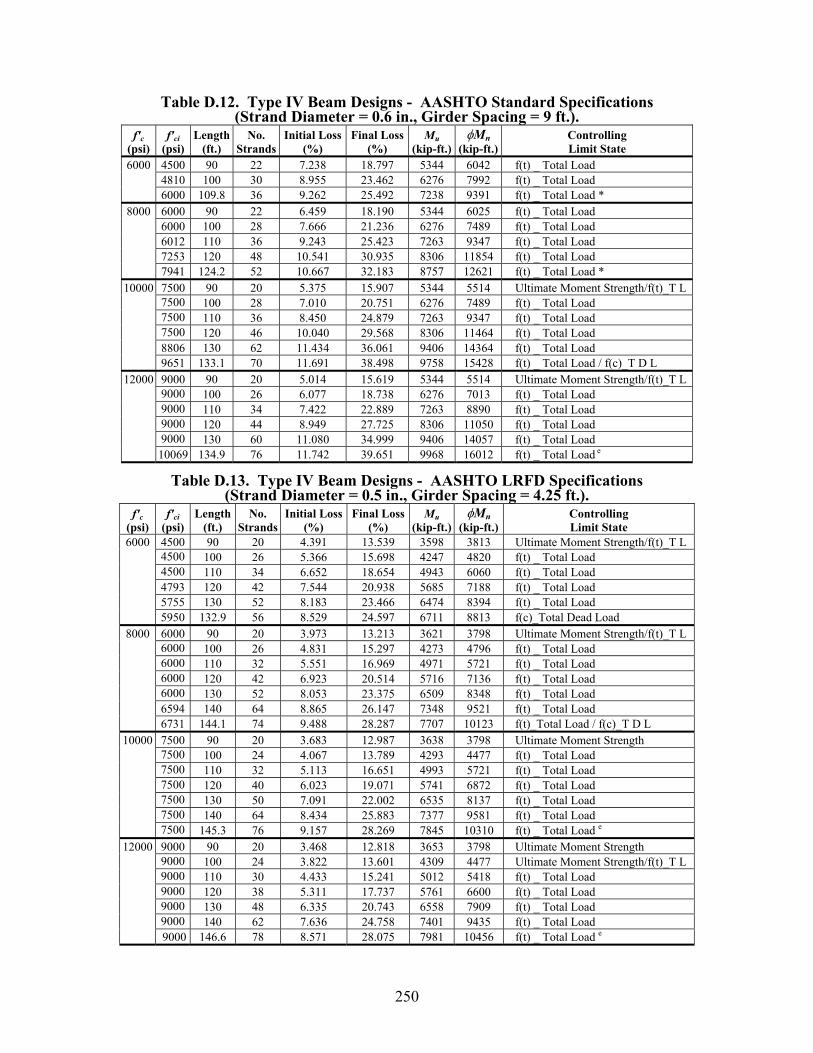
250
Table D.12. Type IV Beam Designs - AASHTO Standard Specifications (Strand Diameter = 0.6 in., Girder Spacing = 9 ft.).
f'c (psi)
f'ci (psi)
Length (ft.)
No. Strands
Initial Loss(%)
Final Loss(%)
Mu (kip-ft.)
φMn (kip-ft.)
Controlling Limit State
6000 4500 90 22 7.238 18.797 5344 6042 f(t) _ Total Load 4810 100 30 8.955 23.462 6276 7992 f(t) _ Total Load 6000 109.8 36 9.262 25.492 7238 9391 f(t) _ Total Load *
8000 6000 90 22 6.459 18.190 5344 6025 f(t) _ Total Load 6000 100 28 7.666 21.236 6276 7489 f(t) _ Total Load 6012 110 36 9.243 25.423 7263 9347 f(t) _ Total Load 7253 120 48 10.541 30.935 8306 11854 f(t) _ Total Load 7941 124.2 52 10.667 32.183 8757 12621 f(t) _ Total Load *
10000 7500 90 20 5.375 15.907 5344 5514 Ultimate Moment Strength/f(t)_T L 7500 100 28 7.010 20.751 6276 7489 f(t) _ Total Load 7500 110 36 8.450 24.879 7263 9347 f(t) _ Total Load 7500 120 46 10.040 29.568 8306 11464 f(t) _ Total Load 8806 130 62 11.434 36.061 9406 14364 f(t) _ Total Load 9651 133.1 70 11.691 38.498 9758 15428 f(t) _ Total Load / f(c)_T D L
12000 9000 90 20 5.014 15.619 5344 5514 Ultimate Moment Strength/f(t)_T L 9000 100 26 6.077 18.738 6276 7013 f(t) _ Total Load 9000 110 34 7.422 22.889 7263 8890 f(t) _ Total Load 9000 120 44 8.949 27.725 8306 11050 f(t) _ Total Load 9000 130 60 11.080 34.999 9406 14057 f(t) _ Total Load 10069 134.9 76 11.742 39.651 9968 16012 f(t) _ Total Load e
Table D.13. Type IV Beam Designs - AASHTO LRFD Specifications
(Strand Diameter = 0.5 in., Girder Spacing = 4.25 ft.). f'c
(psi) f'ci
(psi) Length
(ft.) No.
Strands Initial Loss
(%) Final Loss
(%) Mu
(kip-ft.)φMn
(kip-ft.) Controlling Limit State
6000 4500 90 20 4.391 13.539 3598 3813 Ultimate Moment Strength/f(t)_T L 4500 100 26 5.366 15.698 4247 4820 f(t) _ Total Load 4500 110 34 6.652 18.654 4943 6060 f(t) _ Total Load 4793 120 42 7.544 20.938 5685 7188 f(t) _ Total Load 5755 130 52 8.183 23.466 6474 8394 f(t) _ Total Load
5950 132.9 56 8.529 24.597 6711 8813 f(c)_Total Dead Load 8000 6000 90 20 3.973 13.213 3621 3798 Ultimate Moment Strength/f(t)_T L
6000 100 26 4.831 15.297 4273 4796 f(t) _ Total Load 6000 110 32 5.551 16.969 4971 5721 f(t) _ Total Load 6000 120 42 6.923 20.514 5716 7136 f(t) _ Total Load 6000 130 52 8.053 23.375 6509 8348 f(t) _ Total Load
6594 140 64 8.865 26.147 7348 9521 f(t) _ Total Load 6731 144.1 74 9.488 28.287 7707 10123 f(t)_Total Load / f(c)_T D L 10000 7500 90 20 3.683 12.987 3638 3798 Ultimate Moment Strength
7500 100 24 4.067 13.789 4293 4477 f(t) _ Total Load 7500 110 32 5.113 16.651 4993 5721 f(t) _ Total Load 7500 120 40 6.023 19.071 5741 6872 f(t) _ Total Load 7500 130 50 7.091 22.002 6535 8137 f(t) _ Total Load 7500 140 64 8.434 25.883 7377 9581 f(t) _ Total Load 7500 145.3 76 9.157 28.269 7845 10310 f(t) _ Total Load e
12000 9000 90 20 3.468 12.818 3653 3798 Ultimate Moment Strength 9000 100 24 3.822 13.601 4309 4477 Ultimate Moment Strength/f(t)_T L 9000 110 30 4.433 15.241 5012 5418 f(t) _ Total Load 9000 120 38 5.311 17.737 5761 6600 f(t) _ Total Load 9000 130 48 6.335 20.743 6558 7909 f(t) _ Total Load 9000 140 62 7.636 24.758 7401 9435 f(t) _ Total Load 9000 146.6 78 8.571 28.075 7981 10456 f(t) _ Total Load e
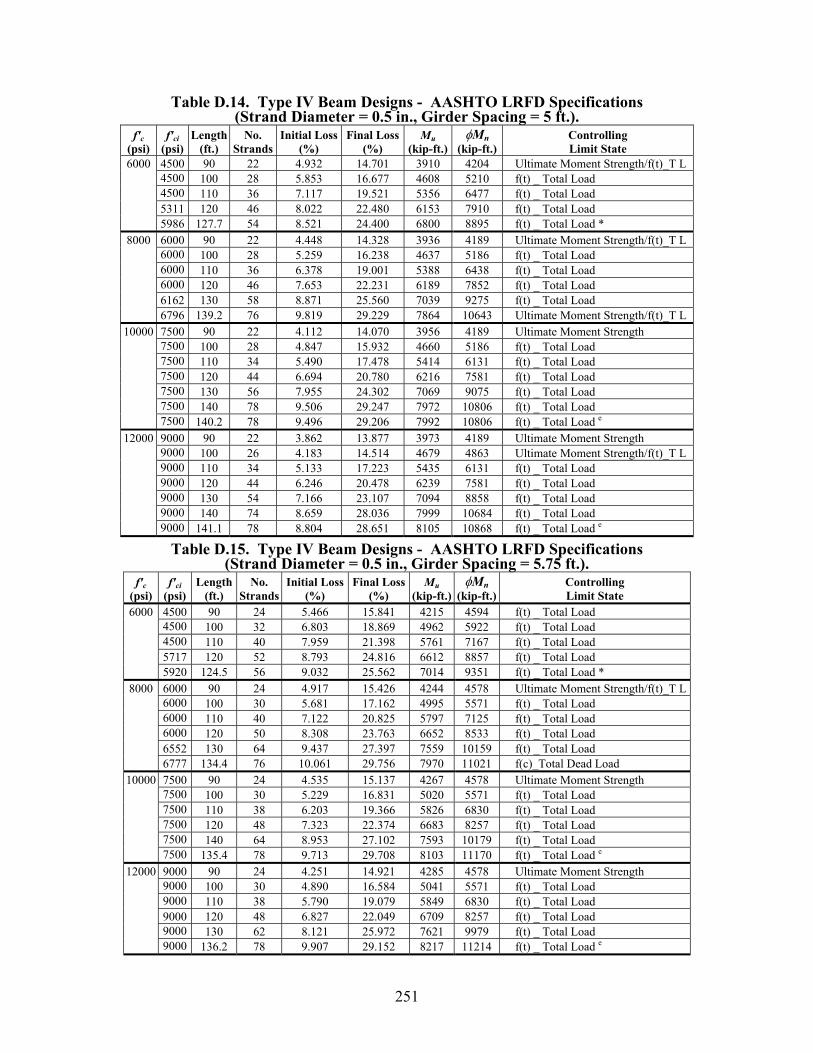
251
Table D.14. Type IV Beam Designs - AASHTO LRFD Specifications (Strand Diameter = 0.5 in., Girder Spacing = 5 ft.).
f'c (psi)
f'ci (psi)
Length (ft.)
No. Strands
Initial Loss(%)
Final Loss(%)
Mu (kip-ft.)
φMn (kip-ft.)
Controlling Limit State
6000 4500 90 22 4.932 14.701 3910 4204 Ultimate Moment Strength/f(t)_T L 4500 100 28 5.853 16.677 4608 5210 f(t) _ Total Load 4500 110 36 7.117 19.521 5356 6477 f(t) _ Total Load 5311 120 46 8.022 22.480 6153 7910 f(t) _ Total Load 5986 127.7 54 8.521 24.400 6800 8895 f(t) _ Total Load *
8000 6000 90 22 4.448 14.328 3936 4189 Ultimate Moment Strength/f(t)_T L 6000 100 28 5.259 16.238 4637 5186 f(t) _ Total Load 6000 110 36 6.378 19.001 5388 6438 f(t) _ Total Load 6000 120 46 7.653 22.231 6189 7852 f(t) _ Total Load 6162 130 58 8.871 25.560 7039 9275 f(t) _ Total Load
6796 139.2 76 9.819 29.229 7864 10643 Ultimate Moment Strength/f(t)_T L 10000 7500 90 22 4.112 14.070 3956 4189 Ultimate Moment Strength
7500 100 28 4.847 15.932 4660 5186 f(t) _ Total Load 7500 110 34 5.490 17.478 5414 6131 f(t) _ Total Load 7500 120 44 6.694 20.780 6216 7581 f(t) _ Total Load 7500 130 56 7.955 24.302 7069 9075 f(t) _ Total Load 7500 140 78 9.506 29.247 7972 10806 f(t) _ Total Load 7500 140.2 78 9.496 29.206 7992 10806 f(t) _ Total Load e
12000 9000 90 22 3.862 13.877 3973 4189 Ultimate Moment Strength 9000 100 26 4.183 14.514 4679 4863 Ultimate Moment Strength/f(t)_T L 9000 110 34 5.133 17.223 5435 6131 f(t) _ Total Load 9000 120 44 6.246 20.478 6239 7581 f(t) _ Total Load 9000 130 54 7.166 23.107 7094 8858 f(t) _ Total Load 9000 140 74 8.659 28.036 7999 10684 f(t) _ Total Load 9000 141.1 78 8.804 28.651 8105 10868 f(t) _ Total Load e
Table D.15. Type IV Beam Designs - AASHTO LRFD Specifications (Strand Diameter = 0.5 in., Girder Spacing = 5.75 ft.).
f'c (psi)
f'ci (psi)
Length (ft.)
No. Strands
Initial Loss(%)
Final Loss(%)
Mu (kip-ft.)
φMn (kip-ft.)
Controlling Limit State
6000 4500 90 24 5.466 15.841 4215 4594 f(t) _ Total Load 4500 100 32 6.803 18.869 4962 5922 f(t) _ Total Load 4500 110 40 7.959 21.398 5761 7167 f(t) _ Total Load 5717 120 52 8.793 24.816 6612 8857 f(t) _ Total Load 5920 124.5 56 9.032 25.562 7014 9351 f(t) _ Total Load *
8000 6000 90 24 4.917 15.426 4244 4578 Ultimate Moment Strength/f(t)_T L 6000 100 30 5.681 17.162 4995 5571 f(t) _ Total Load 6000 110 40 7.122 20.825 5797 7125 f(t) _ Total Load 6000 120 50 8.308 23.763 6652 8533 f(t) _ Total Load 6552 130 64 9.437 27.397 7559 10159 f(t) _ Total Load 6777 134.4 76 10.061 29.756 7970 11021 f(c)_Total Dead Load
10000 7500 90 24 4.535 15.137 4267 4578 Ultimate Moment Strength 7500 100 30 5.229 16.831 5020 5571 f(t) _ Total Load 7500 110 38 6.203 19.366 5826 6830 f(t) _ Total Load 7500 120 48 7.323 22.374 6683 8257 f(t) _ Total Load 7500 140 64 8.953 27.102 7593 10179 f(t) _ Total Load 7500 135.4 78 9.713 29.708 8103 11170 f(t) _ Total Load e
12000 9000 90 24 4.251 14.921 4285 4578 Ultimate Moment Strength 9000 100 30 4.890 16.584 5041 5571 f(t) _ Total Load 9000 110 38 5.790 19.079 5849 6830 f(t) _ Total Load 9000 120 48 6.827 22.049 6709 8257 f(t) _ Total Load 9000 130 62 8.121 25.972 7621 9979 f(t) _ Total Load 9000 136.2 78 9.907 29.152 8217 11214 f(t) _ Total Load e
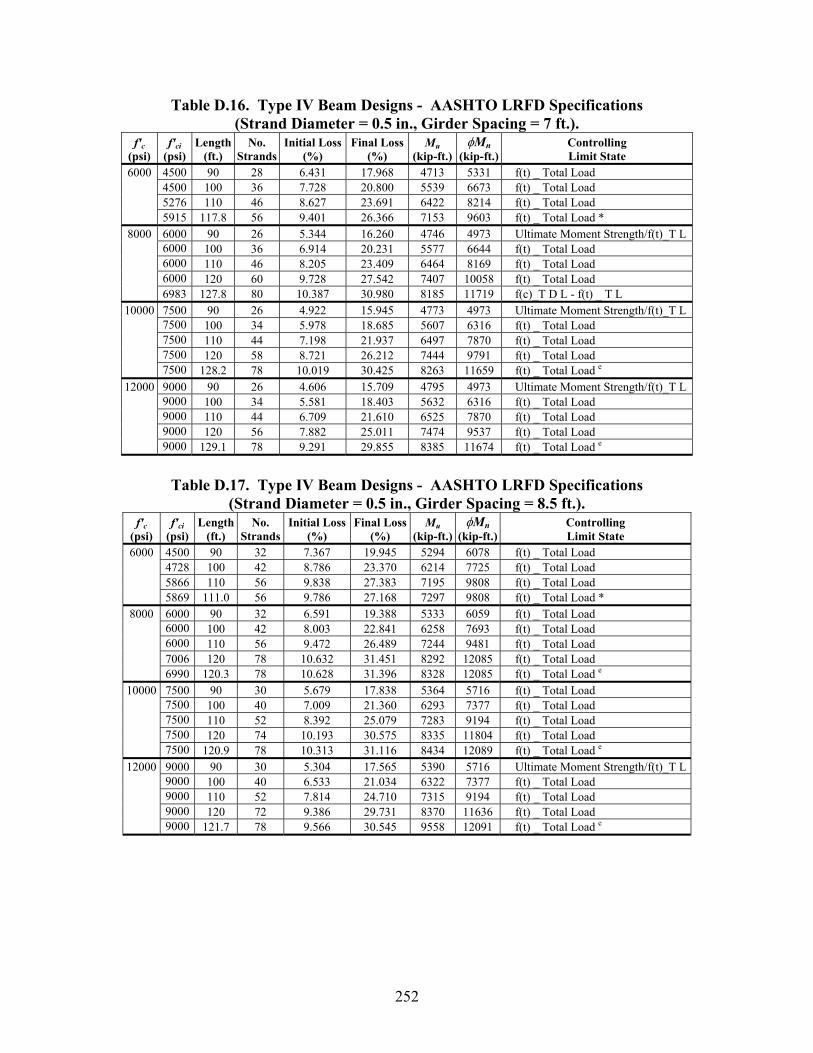
252
Table D.16. Type IV Beam Designs - AASHTO LRFD Specifications (Strand Diameter = 0.5 in., Girder Spacing = 7 ft.).
f'c (psi)
f'ci (psi)
Length (ft.)
No. Strands
Initial Loss(%)
Final Loss(%)
Mu (kip-ft.)
φMn (kip-ft.)
Controlling Limit State
6000 4500 90 28 6.431 17.968 4713 5331 f(t) _ Total Load 4500 100 36 7.728 20.800 5539 6673 f(t) _ Total Load 5276 110 46 8.627 23.691 6422 8214 f(t) _ Total Load 5915 117.8 56 9.401 26.366 7153 9603 f(t) _ Total Load *
8000 6000 90 26 5.344 16.260 4746 4973 Ultimate Moment Strength/f(t)_T L 6000 100 36 6.914 20.231 5577 6644 f(t) _ Total Load 6000 110 46 8.205 23.409 6464 8169 f(t) _ Total Load 6000 120 60 9.728 27.542 7407 10058 f(t) _ Total Load 6983 127.8 80 10.387 30.980 8185 11719 f(c)_T D L - f(t) _ T L
10000 7500 90 26 4.922 15.945 4773 4973 Ultimate Moment Strength/f(t)_T L 7500 100 34 5.978 18.685 5607 6316 f(t) _ Total Load 7500 110 44 7.198 21.937 6497 7870 f(t) _ Total Load 7500 120 58 8.721 26.212 7444 9791 f(t) _ Total Load 7500 128.2 78 10.019 30.425 8263 11659 f(t) _ Total Load e
12000 9000 90 26 4.606 15.709 4795 4973 Ultimate Moment Strength/f(t)_T L 9000 100 34 5.581 18.403 5632 6316 f(t) _ Total Load 9000 110 44 6.709 21.610 6525 7870 f(t) _ Total Load 9000 120 56 7.882 25.011 7474 9537 f(t) _ Total Load 9000 129.1 78 9.291 29.855 8385 11674 f(t) _ Total Load e
Table D.17. Type IV Beam Designs - AASHTO LRFD Specifications
(Strand Diameter = 0.5 in., Girder Spacing = 8.5 ft.). f'c
(psi) f'ci
(psi) Length
(ft.) No.
Strands Initial Loss
(%) Final Loss
(%) Mu
(kip-ft.)φMn
(kip-ft.) Controlling Limit State
6000 4500 90 32 7.367 19.945 5294 6078 f(t) _ Total Load 4728 100 42 8.786 23.370 6214 7725 f(t) _ Total Load 5866 110 56 9.838 27.383 7195 9808 f(t) _ Total Load 5869 111.0 56 9.786 27.168 7297 9808 f(t) _ Total Load *
8000 6000 90 32 6.591 19.388 5333 6059 f(t) _ Total Load 6000 100 42 8.003 22.841 6258 7693 f(t) _ Total Load 6000 110 56 9.472 26.489 7244 9481 f(t) _ Total Load 7006 120 78 10.632 31.451 8292 12085 f(t) _ Total Load 6990 120.3 78 10.628 31.396 8328 12085 f(t) _ Total Load e
10000 7500 90 30 5.679 17.838 5364 5716 f(t) _ Total Load 7500 100 40 7.009 21.360 6293 7377 f(t) _ Total Load 7500 110 52 8.392 25.079 7283 9194 f(t) _ Total Load 7500 120 74 10.193 30.575 8335 11804 f(t) _ Total Load 7500 120.9 78 10.313 31.116 8434 12089 f(t) _ Total Load e
12000 9000 90 30 5.304 17.565 5390 5716 Ultimate Moment Strength/f(t)_T L 9000 100 40 6.533 21.034 6322 7377 f(t) _ Total Load 9000 110 52 7.814 24.710 7315 9194 f(t) _ Total Load 9000 120 72 9.386 29.731 8370 11636 f(t) _ Total Load 9000 121.7 78 9.566 30.545 9558 12091 f(t) _ Total Load e
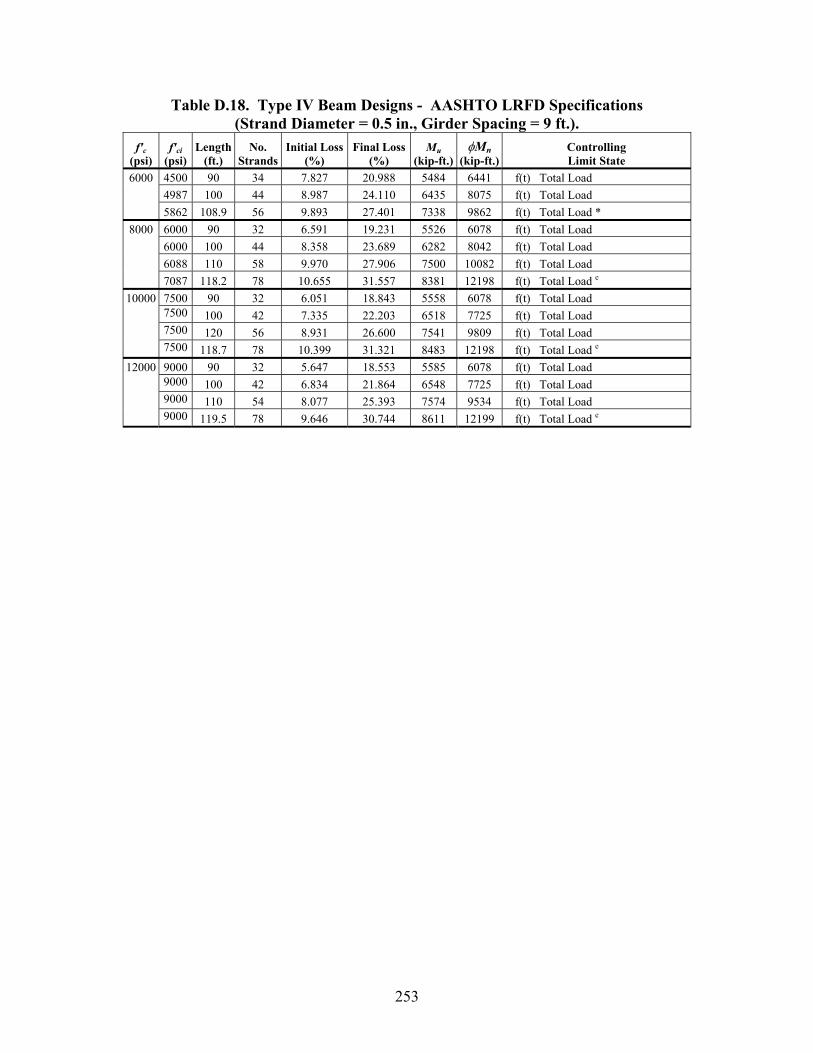
253
Table D.18. Type IV Beam Designs - AASHTO LRFD Specifications (Strand Diameter = 0.5 in., Girder Spacing = 9 ft.).
f'c (psi)
f'ci (psi)
Length (ft.)
No. Strands
Initial Loss(%)
Final Loss(%)
Mu (kip-ft.)
φMn (kip-ft.)
Controlling Limit State
6000 4500 90 34 7.827 20.988 5484 6441 f(t) Total Load 4987 100 44 8.987 24.110 6435 8075 f(t) Total Load 5862 108.9 56 9.893 27.401 7338 9862 f(t) Total Load *
8000 6000 90 32 6.591 19.231 5526 6078 f(t) Total Load 6000 100 44 8.358 23.689 6282 8042 f(t) Total Load 6088 110 58 9.970 27.906 7500 10082 f(t) Total Load 7087 118.2 78 10.655 31.557 8381 12198 f(t) Total Load e
10000 7500 90 32 6.051 18.843 5558 6078 f(t) Total Load 7500 100 42 7.335 22.203 6518 7725 f(t) Total Load 7500 120 56 8.931 26.600 7541 9809 f(t) Total Load 7500 118.7 78 10.399 31.321 8483 12198 f(t) Total Load e
12000 9000 90 32 5.647 18.553 5585 6078 f(t) Total Load 9000 100 42 6.834 21.864 6548 7725 f(t) Total Load 9000 110 54 8.077 25.393 7574 9534 f(t) Total Load 9000 119.5 78 9.646 30.744 8611 12199 f(t) Total Load e
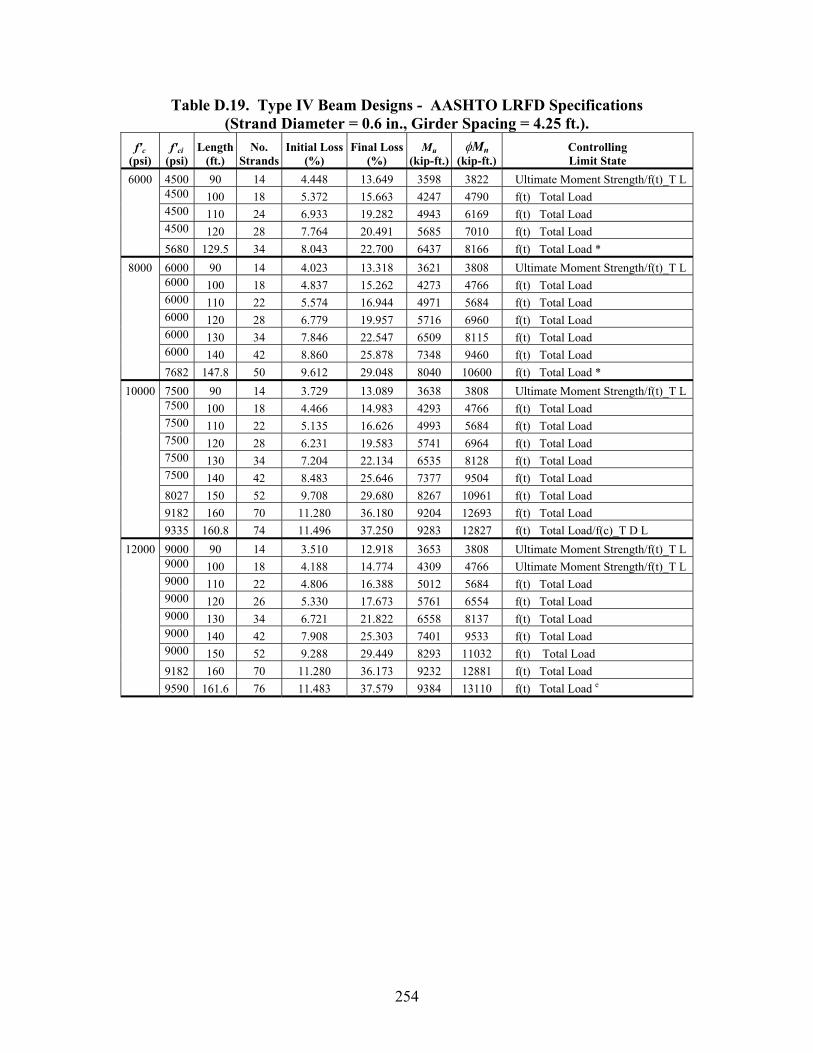
254
Table D.19. Type IV Beam Designs - AASHTO LRFD Specifications (Strand Diameter = 0.6 in., Girder Spacing = 4.25 ft.).
f'c (psi)
f'ci (psi)
Length (ft.)
No. Strands
Initial Loss(%)
Final Loss(%)
Mu (kip-ft.)
φMn (kip-ft.)
Controlling Limit State
6000 4500 90 14 4.448 13.649 3598 3822 Ultimate Moment Strength/f(t)_T L 4500 100 18 5.372 15.663 4247 4790 f(t) Total Load 4500 110 24 6.933 19.282 4943 6169 f(t) Total Load 4500 120 28 7.764 20.491 5685 7010 f(t) Total Load 5680 129.5 34 8.043 22.700 6437 8166 f(t) Total Load *
8000 6000 90 14 4.023 13.318 3621 3808 Ultimate Moment Strength/f(t)_T L 6000 100 18 4.837 15.262 4273 4766 f(t) Total Load 6000 110 22 5.574 16.944 4971 5684 f(t) Total Load 6000 120 28 6.779 19.957 5716 6960 f(t) Total Load 6000 130 34 7.846 22.547 6509 8115 f(t) Total Load
6000 140 42 8.860 25.878 7348 9460 f(t) Total Load 7682 147.8 50 9.612 29.048 8040 10600 f(t) Total Load * 10000 7500 90 14 3.729 13.089 3638 3808 Ultimate Moment Strength/f(t)_T L
7500 100 18 4.466 14.983 4293 4766 f(t) Total Load 7500 110 22 5.135 16.626 4993 5684 f(t) Total Load 7500 120 28 6.231 19.583 5741 6964 f(t) Total Load 7500 130 34 7.204 22.134 6535 8128 f(t) Total Load 7500 140 42 8.483 25.646 7377 9504 f(t) Total Load 8027 150 52 9.708 29.680 8267 10961 f(t) Total Load 9182 160 70 11.280 36.180 9204 12693 f(t) Total Load 9335 160.8 74 11.496 37.250 9283 12827 f(t) Total Load/f(c)_T D L
12000 9000 90 14 3.510 12.918 3653 3808 Ultimate Moment Strength/f(t)_T L 9000 100 18 4.188 14.774 4309 4766 Ultimate Moment Strength/f(t)_T L 9000 110 22 4.806 16.388 5012 5684 f(t) Total Load 9000 120 26 5.330 17.673 5761 6554 f(t) Total Load 9000 130 34 6.721 21.822 6558 8137 f(t) Total Load 9000 140 42 7.908 25.303 7401 9533 f(t) Total Load 9000 150 52 9.288 29.449 8293 11032 f(t) Total Load
9182 160 70 11.280 36.173 9232 12881 f(t) Total Load 9590 161.6 76 11.483 37.579 9384 13110 f(t) Total Load e
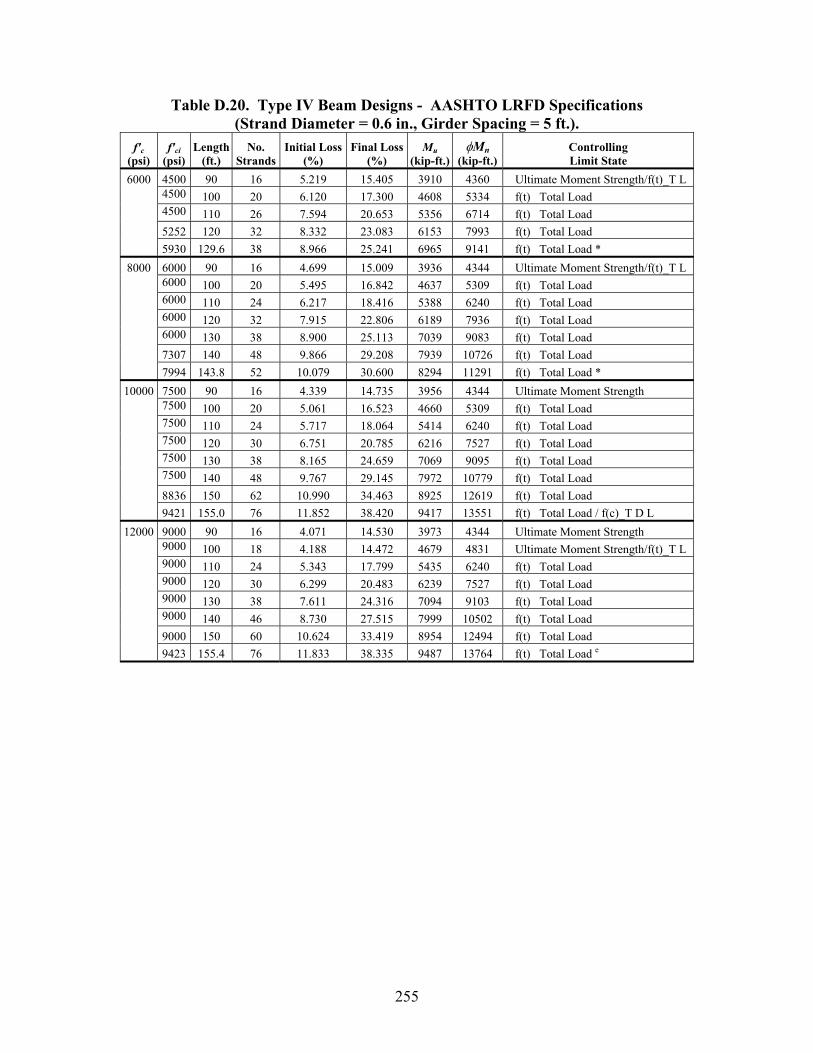
255
Table D.20. Type IV Beam Designs - AASHTO LRFD Specifications (Strand Diameter = 0.6 in., Girder Spacing = 5 ft.).
f'c (psi)
f'ci (psi)
Length (ft.)
No. Strands
Initial Loss(%)
Final Loss(%)
Mu (kip-ft.)
φMn (kip-ft.)
Controlling Limit State
6000 4500 90 16 5.219 15.405 3910 4360 Ultimate Moment Strength/f(t)_T L 4500 100 20 6.120 17.300 4608 5334 f(t) Total Load 4500 110 26 7.594 20.653 5356 6714 f(t) Total Load 5252 120 32 8.332 23.083 6153 7993 f(t) Total Load 5930 129.6 38 8.966 25.241 6965 9141 f(t) Total Load *
8000 6000 90 16 4.699 15.009 3936 4344 Ultimate Moment Strength/f(t)_T L 6000 100 20 5.495 16.842 4637 5309 f(t) Total Load 6000 110 24 6.217 18.416 5388 6240 f(t) Total Load 6000 120 32 7.915 22.806 6189 7936 f(t) Total Load 6000 130 38 8.900 25.113 7039 9083 f(t) Total Load
7307 140 48 9.866 29.208 7939 10726 f(t) Total Load 7994 143.8 52 10.079 30.600 8294 11291 f(t) Total Load *
10000 7500 90 16 4.339 14.735 3956 4344 Ultimate Moment Strength 7500 100 20 5.061 16.523 4660 5309 f(t) Total Load 7500 110 24 5.717 18.064 5414 6240 f(t) Total Load 7500 120 30 6.751 20.785 6216 7527 f(t) Total Load 7500 130 38 8.165 24.659 7069 9095 f(t) Total Load 7500 140 48 9.767 29.145 7972 10779 f(t) Total Load 8836 150 62 10.990 34.463 8925 12619 f(t) Total Load 9421 155.0 76 11.852 38.420 9417 13551 f(t) Total Load / f(c)_T D L
12000 9000 90 16 4.071 14.530 3973 4344 Ultimate Moment Strength 9000 100 18 4.188 14.472 4679 4831 Ultimate Moment Strength/f(t)_T L 9000 110 24 5.343 17.799 5435 6240 f(t) Total Load 9000 120 30 6.299 20.483 6239 7527 f(t) Total Load 9000 130 38 7.611 24.316 7094 9103 f(t) Total Load 9000 140 46 8.730 27.515 7999 10502 f(t) Total Load 9000 150 60 10.624 33.419 8954 12494 f(t) Total Load
9423 155.4 76 11.833 38.335 9487 13764 f(t) Total Load e
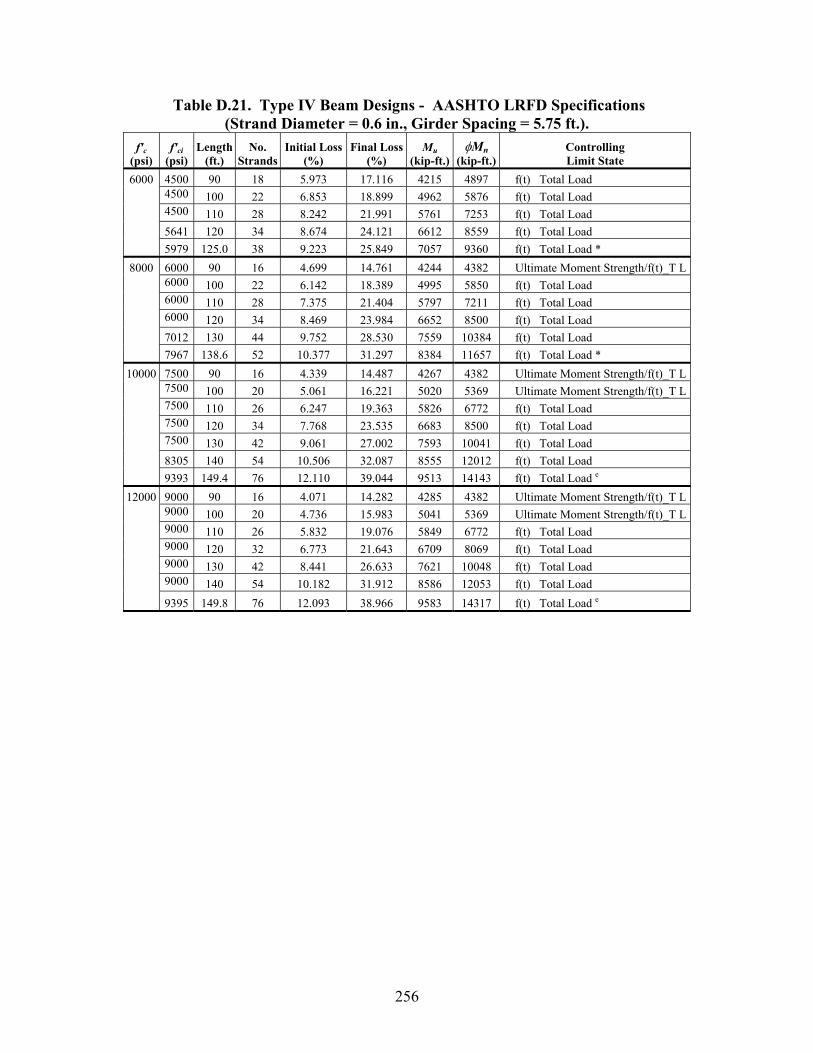
256
Table D.21. Type IV Beam Designs - AASHTO LRFD Specifications (Strand Diameter = 0.6 in., Girder Spacing = 5.75 ft.).
f'c (psi)
f'ci (psi)
Length (ft.)
No. Strands
Initial Loss(%)
Final Loss(%)
Mu (kip-ft.)
φMn (kip-ft.)
Controlling Limit State
6000 4500 90 18 5.973 17.116 4215 4897 f(t) Total Load 4500 100 22 6.853 18.899 4962 5876 f(t) Total Load 4500 110 28 8.242 21.991 5761 7253 f(t) Total Load 5641 120 34 8.674 24.121 6612 8559 f(t) Total Load 5979 125.0 38 9.223 25.849 7057 9360 f(t) Total Load *
8000 6000 90 16 4.699 14.761 4244 4382 Ultimate Moment Strength/f(t)_T L 6000 100 22 6.142 18.389 4995 5850 f(t) Total Load 6000 110 28 7.375 21.404 5797 7211 f(t) Total Load 6000 120 34 8.469 23.984 6652 8500 f(t) Total Load 7012 130 44 9.752 28.530 7559 10384 f(t) Total Load 7967 138.6 52 10.377 31.297 8384 11657 f(t) Total Load *
10000 7500 90 16 4.339 14.487 4267 4382 Ultimate Moment Strength/f(t)_T L 7500 100 20 5.061 16.221 5020 5369 Ultimate Moment Strength/f(t)_T L 7500 110 26 6.247 19.363 5826 6772 f(t) Total Load 7500 120 34 7.768 23.535 6683 8500 f(t) Total Load 7500 130 42 9.061 27.002 7593 10041 f(t) Total Load 8305 140 54 10.506 32.087 8555 12012 f(t) Total Load 9393 149.4 76 12.110 39.044 9513 14143 f(t) Total Load e
12000 9000 90 16 4.071 14.282 4285 4382 Ultimate Moment Strength/f(t)_T L 9000 100 20 4.736 15.983 5041 5369 Ultimate Moment Strength/f(t)_T L 9000 110 26 5.832 19.076 5849 6772 f(t) Total Load 9000 120 32 6.773 21.643 6709 8069 f(t) Total Load 9000 130 42 8.441 26.633 7621 10048 f(t) Total Load 9000 140 54 10.182 31.912 8586 12053 f(t) Total Load 9395 149.8 76 12.093 38.966 9583 14317 f(t) Total Load e
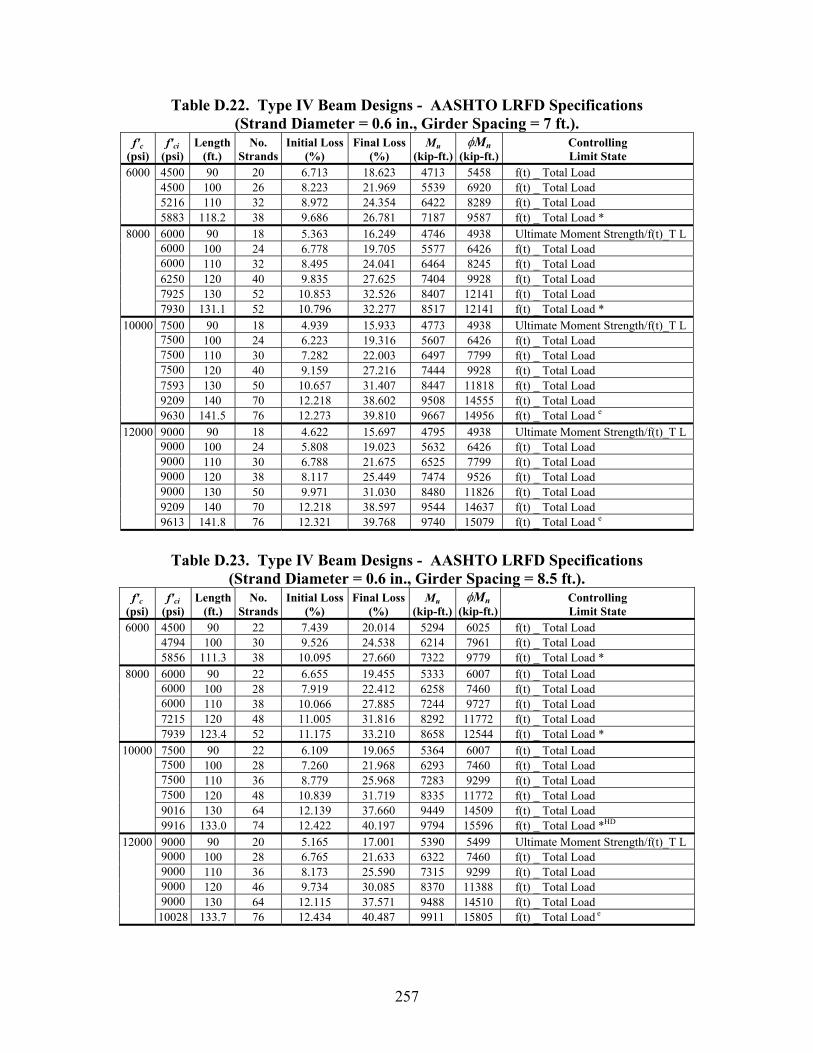
257
Table D.22. Type IV Beam Designs - AASHTO LRFD Specifications (Strand Diameter = 0.6 in., Girder Spacing = 7 ft.).
f'c (psi)
f'ci (psi)
Length (ft.)
No. Strands
Initial Loss(%)
Final Loss(%)
Mu (kip-ft.)
φMn (kip-ft.)
Controlling Limit State
6000 4500 90 20 6.713 18.623 4713 5458 f(t) _ Total Load 4500 100 26 8.223 21.969 5539 6920 f(t) _ Total Load 5216 110 32 8.972 24.354 6422 8289 f(t) _ Total Load 5883 118.2 38 9.686 26.781 7187 9587 f(t) _ Total Load *
8000 6000 90 18 5.363 16.249 4746 4938 Ultimate Moment Strength/f(t)_T L 6000 100 24 6.778 19.705 5577 6426 f(t) _ Total Load 6000 110 32 8.495 24.041 6464 8245 f(t) _ Total Load 6250 120 40 9.835 27.625 7404 9928 f(t) _ Total Load 7925 130 52 10.853 32.526 8407 12141 f(t) _ Total Load
7930 131.1 52 10.796 32.277 8517 12141 f(t) _ Total Load * 10000 7500 90 18 4.939 15.933 4773 4938 Ultimate Moment Strength/f(t)_T L
7500 100 24 6.223 19.316 5607 6426 f(t) _ Total Load 7500 110 30 7.282 22.003 6497 7799 f(t) _ Total Load 7500 120 40 9.159 27.216 7444 9928 f(t) _ Total Load 7593 130 50 10.657 31.407 8447 11818 f(t) _ Total Load 9209 140 70 12.218 38.602 9508 14555 f(t) _ Total Load 9630 141.5 76 12.273 39.810 9667 14956 f(t) _ Total Load e
12000 9000 90 18 4.622 15.697 4795 4938 Ultimate Moment Strength/f(t)_T L 9000 100 24 5.808 19.023 5632 6426 f(t) _ Total Load 9000 110 30 6.788 21.675 6525 7799 f(t) _ Total Load 9000 120 38 8.117 25.449 7474 9526 f(t) _ Total Load 9000 130 50 9.971 31.030 8480 11826 f(t) _ Total Load 9209 140 70 12.218 38.597 9544 14637 f(t) _ Total Load 9613 141.8 76 12.321 39.768 9740 15079 f(t) _ Total Load e
Table D.23. Type IV Beam Designs - AASHTO LRFD Specifications
(Strand Diameter = 0.6 in., Girder Spacing = 8.5 ft.). f'c
(psi) f'ci
(psi) Length
(ft.) No.
Strands Initial Loss
(%) Final Loss
(%) Mu
(kip-ft.)φMn
(kip-ft.) Controlling Limit State
6000 4500 90 22 7.439 20.014 5294 6025 f(t) _ Total Load 4794 100 30 9.526 24.538 6214 7961 f(t) _ Total Load 5856 111.3 38 10.095 27.660 7322 9779 f(t) _ Total Load *
8000 6000 90 22 6.655 19.455 5333 6007 f(t) _ Total Load 6000 100 28 7.919 22.412 6258 7460 f(t) _ Total Load 6000 110 38 10.066 27.885 7244 9727 f(t) _ Total Load 7215 120 48 11.005 31.816 8292 11772 f(t) _ Total Load 7939 123.4 52 11.175 33.210 8658 12544 f(t) _ Total Load *
10000 7500 90 22 6.109 19.065 5364 6007 f(t) _ Total Load 7500 100 28 7.260 21.968 6293 7460 f(t) _ Total Load 7500 110 36 8.779 25.968 7283 9299 f(t) _ Total Load 7500 120 48 10.839 31.719 8335 11772 f(t) _ Total Load 9016 130 64 12.139 37.660 9449 14509 f(t) _ Total Load 9916 133.0 74 12.422 40.197 9794 15596 f(t) _ Total Load *HD
12000 9000 90 20 5.165 17.001 5390 5499 Ultimate Moment Strength/f(t)_T L 9000 100 28 6.765 21.633 6322 7460 f(t) _ Total Load 9000 110 36 8.173 25.590 7315 9299 f(t) _ Total Load 9000 120 46 9.734 30.085 8370 11388 f(t) _ Total Load 9000 130 64 12.115 37.571 9488 14510 f(t) _ Total Load 10028 133.7 76 12.434 40.487 9911 15805 f(t) _ Total Load e
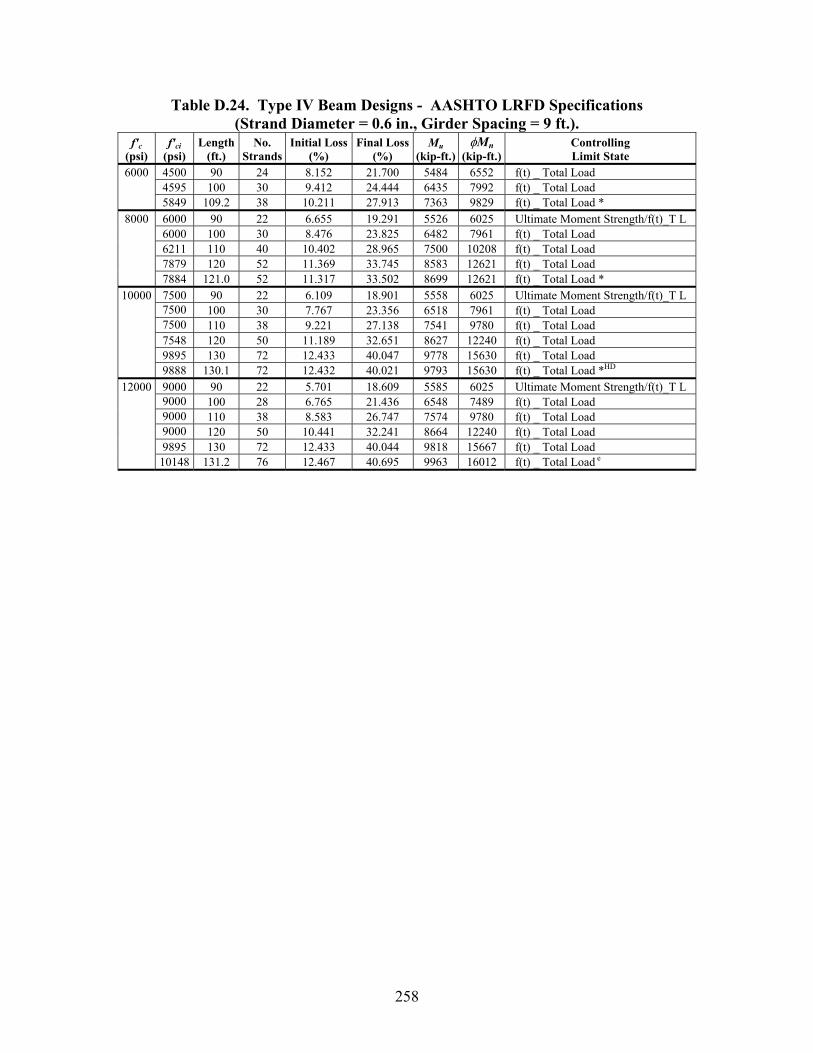
258
Table D.24. Type IV Beam Designs - AASHTO LRFD Specifications (Strand Diameter = 0.6 in., Girder Spacing = 9 ft.).
f'c (psi)
f'ci (psi)
Length (ft.)
No. Strands
Initial Loss(%)
Final Loss(%)
Mu (kip-ft.)
φMn (kip-ft.)
Controlling Limit State
6000 4500 90 24 8.152 21.700 5484 6552 f(t) _ Total Load 4595 100 30 9.412 24.444 6435 7992 f(t) _ Total Load 5849 109.2 38 10.211 27.913 7363 9829 f(t) _ Total Load *
8000 6000 90 22 6.655 19.291 5526 6025 Ultimate Moment Strength/f(t)_T L 6000 100 30 8.476 23.825 6482 7961 f(t) _ Total Load 6211 110 40 10.402 28.965 7500 10208 f(t) _ Total Load 7879 120 52 11.369 33.745 8583 12621 f(t) _ Total Load 7884 121.0 52 11.317 33.502 8699 12621 f(t) _ Total Load *
10000 7500 90 22 6.109 18.901 5558 6025 Ultimate Moment Strength/f(t)_T L 7500 100 30 7.767 23.356 6518 7961 f(t) _ Total Load 7500 110 38 9.221 27.138 7541 9780 f(t) _ Total Load 7548 120 50 11.189 32.651 8627 12240 f(t) _ Total Load 9895 130 72 12.433 40.047 9778 15630 f(t) _ Total Load 9888 130.1 72 12.432 40.021 9793 15630 f(t) _ Total Load *HD
12000 9000 90 22 5.701 18.609 5585 6025 Ultimate Moment Strength/f(t)_T L 9000 100 28 6.765 21.436 6548 7489 f(t) _ Total Load 9000 110 38 8.583 26.747 7574 9780 f(t) _ Total Load 9000 120 50 10.441 32.241 8664 12240 f(t) _ Total Load 9895 130 72 12.433 40.044 9818 15667 f(t) _ Total Load 10148 131.2 76 12.467 40.695 9963 16012 f(t) _ Total Load e
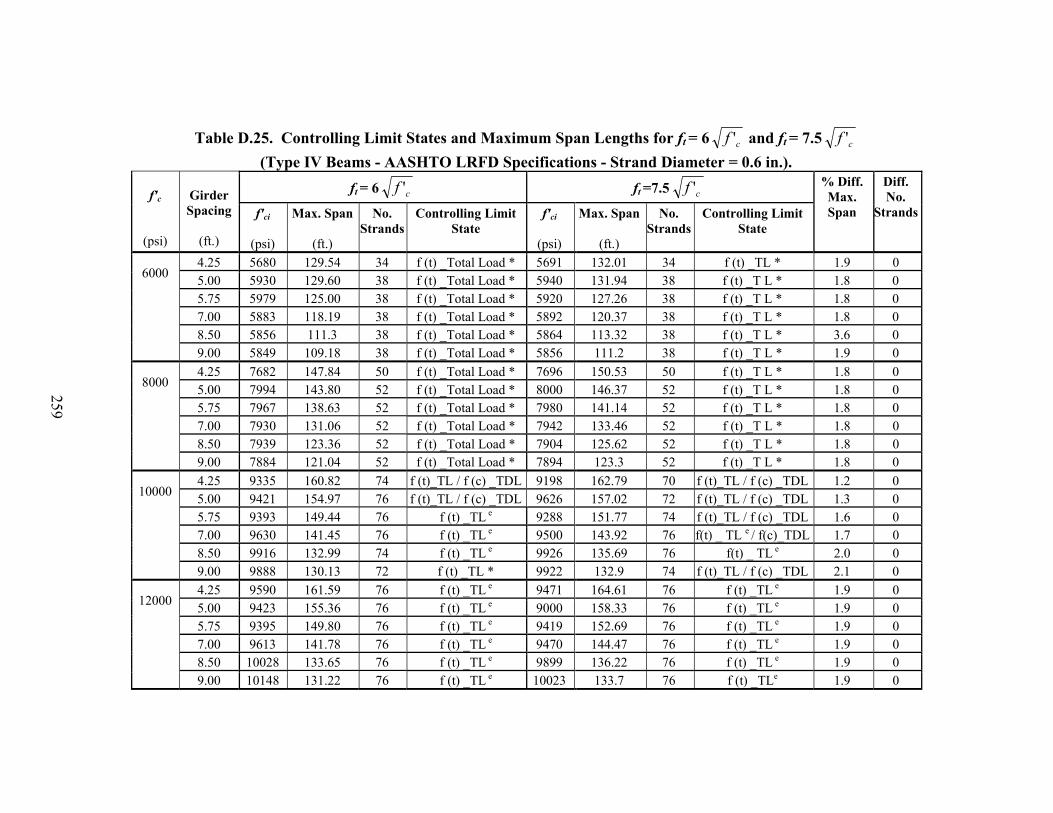
259
Table D.25. Controlling Limit States and Maximum Span Lengths for ft = 6 cf ' and ft = 7.5 cf '
(Type IV Beams - AASHTO LRFD Specifications - Strand Diameter = 0.6 in.). ft = 6 cf ' ft =7.5 cf ' f'c
(psi)
Girder Spacing
(ft.)
f'ci
(psi)
Max. Span
(ft.)
No. Strands
Controlling Limit State
f'ci
(psi)
Max. Span
(ft.)
No. Strands
Controlling Limit State
% Diff. Max. Span
Diff. No.
Strands
4.25 5680 129.54 34 f (t) _Total Load * 5691 132.01 34 f (t) _TL * 1.9 0 5.00 5930 129.60 38 f (t) _Total Load * 5940 131.94 38 f (t) _T L * 1.8 0 5.75 5979 125.00 38 f (t) _Total Load * 5920 127.26 38 f (t) _T L * 1.8 0 7.00 5883 118.19 38 f (t) _Total Load * 5892 120.37 38 f (t) _T L * 1.8 0 8.50 5856 111.3 38 f (t) _Total Load * 5864 113.32 38 f (t) _T L * 3.6 0
6000 9.00 5849 109.18 38 f (t) _Total Load * 5856 111.2 38 f (t) _T L * 1.9 0
4.25 7682 147.84 50 f (t) _Total Load * 7696 150.53 50 f (t) _T L * 1.8 0 5.00 7994 143.80 52 f (t) _Total Load * 8000 146.37 52 f (t) _T L * 1.8 0 5.75 7967 138.63 52 f (t) _Total Load * 7980 141.14 52 f (t) _T L * 1.8 0 7.00 7930 131.06 52 f (t) _Total Load * 7942 133.46 52 f (t) _T L * 1.8 0 8.50 7939 123.36 52 f (t) _Total Load * 7904 125.62 52 f (t) _T L * 1.8 0
8000 9.00 7884 121.04 52 f (t) _Total Load * 7894 123.3 52 f (t) _T L * 1.8 0
4.25 9335 160.82 74 f (t)_TL / f (c) _TDL 9198 162.79 70 f (t)_TL / f (c) _TDL 1.2 0 5.00 9421 154.97 76 f (t)_TL / f (c) _TDL 9626 157.02 72 f (t)_TL / f (c) _TDL 1.3 0 5.75 9393 149.44 76 f (t) _TL e 9288 151.77 74 f (t)_TL / f (c) _TDL 1.6 0 7.00 9630 141.45 76 f (t) _TL e 9500 143.92 76 f(t) _ TL e / f(c)_TDL 1.7 0 8.50 9916 132.99 74 f (t) _TL e 9926 135.69 76 f(t) _ TL e 2.0 0
10000 9.00 9888 130.13 72 f (t) _TL * 9922 132.9 74 f (t)_TL / f (c) _TDL 2.1 0
4.25 9590 161.59 76 f (t) _TL e 9471 164.61 76 f (t) _TL e 1.9 0 5.00 9423 155.36 76 f (t) _TL e 9000 158.33 76 f (t) _TL e 1.9 0 5.75 9395 149.80 76 f (t) _TL e 9419 152.69 76 f (t) _TL e 1.9 0 7.00 9613 141.78 76 f (t) _TL e 9470 144.47 76 f (t) _TL e 1.9 0 8.50 10028 133.65 76 f (t) _TL e 9899 136.22 76 f (t) _TL e 1.9 0
12000 9.00 10148 131.22 76 f (t) _TL e 10023 133.7 76 f (t) _TLe 1.9 0
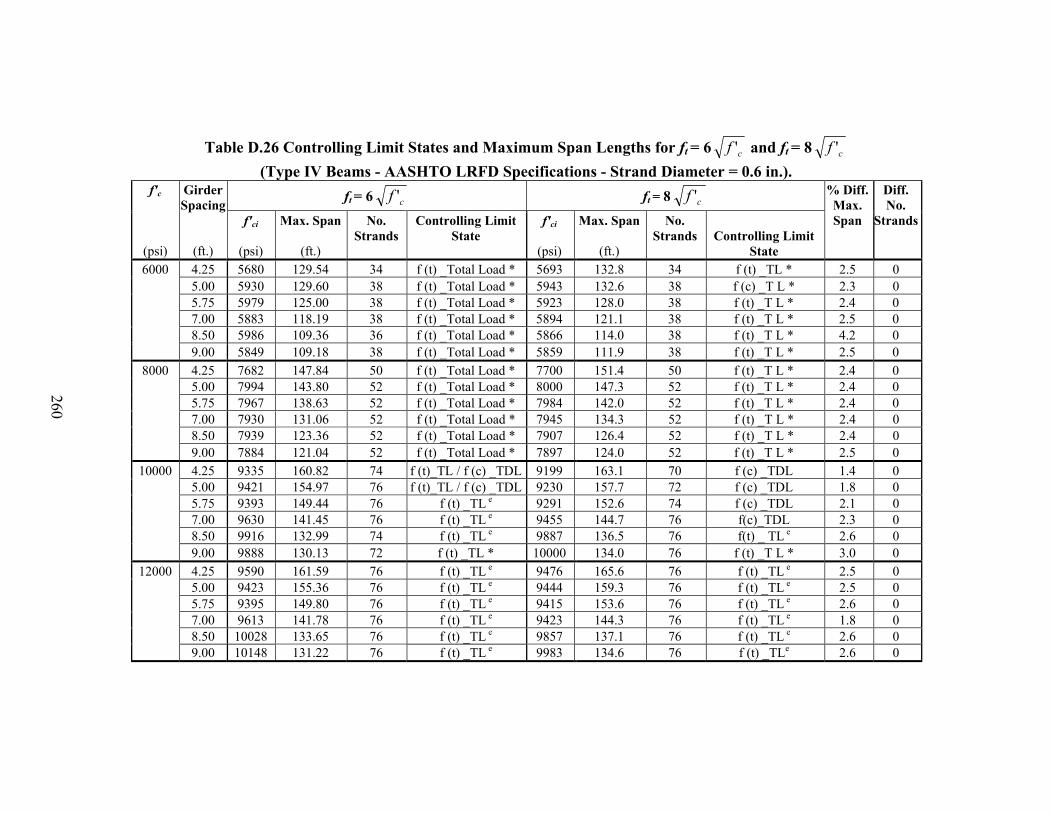
260
Table D.26 Controlling Limit States and Maximum Span Lengths for ft = 6 cf ' and ft = 8 cf '
(Type IV Beams - AASHTO LRFD Specifications - Strand Diameter = 0.6 in.). ft = 6 cf ' ft = 8 cf ' f'c
(psi)
Girder Spacing
(ft.)
f'ci
(psi)
Max. Span
(ft.)
No. Strands
Controlling Limit State
f'ci
(psi)
Max. Span
(ft.)
No. Strands
Controlling Limit
State
% Diff.Max. Span
Diff. No.
Strands
6000 4.25 5680 129.54 34 f (t) _Total Load * 5693 132.8 34 f (t) _TL * 2.5 0 5.00 5930 129.60 38 f (t) _Total Load * 5943 132.6 38 f (c) _T L * 2.3 0 5.75 5979 125.00 38 f (t) _Total Load * 5923 128.0 38 f (t) _T L * 2.4 0 7.00 5883 118.19 38 f (t) _Total Load * 5894 121.1 38 f (t) _T L * 2.5 0 8.50 5986 109.36 36 f (t) _Total Load * 5866 114.0 38 f (t) _T L * 4.2 0 9.00 5849 109.18 38 f (t) _Total Load * 5859 111.9 38 f (t) _T L * 2.5 0
8000 4.25 7682 147.84 50 f (t) _Total Load * 7700 151.4 50 f (t) _T L * 2.4 0 5.00 7994 143.80 52 f (t) _Total Load * 8000 147.3 52 f (t) _T L * 2.4 0 5.75 7967 138.63 52 f (t) _Total Load * 7984 142.0 52 f (t) _T L * 2.4 0 7.00 7930 131.06 52 f (t) _Total Load * 7945 134.3 52 f (t) _T L * 2.4 0 8.50 7939 123.36 52 f (t) _Total Load * 7907 126.4 52 f (t) _T L * 2.4 0 9.00 7884 121.04 52 f (t) _Total Load * 7897 124.0 52 f (t) _T L * 2.5 0
10000 4.25 9335 160.82 74 f (t)_TL / f (c) _TDL 9199 163.1 70 f (c) _TDL 1.4 0 5.00 9421 154.97 76 f (t)_TL / f (c) _TDL 9230 157.7 72 f (c) _TDL 1.8 0 5.75 9393 149.44 76 f (t) _TL e 9291 152.6 74 f (c) _TDL 2.1 0 7.00 9630 141.45 76 f (t) _TL e 9455 144.7 76 f(c)_TDL 2.3 0 8.50 9916 132.99 74 f (t) _TL e 9887 136.5 76 f(t) _ TL e 2.6 0 9.00 9888 130.13 72 f (t) _TL * 10000 134.0 76 f (t) _T L * 3.0 0
12000 4.25 9590 161.59 76 f (t) _TL e 9476 165.6 76 f (t) _TL e 2.5 0 5.00 9423 155.36 76 f (t) _TL e 9444 159.3 76 f (t) _TL e 2.5 0 5.75 9395 149.80 76 f (t) _TL e 9415 153.6 76 f (t) _TL e 2.6 0 7.00 9613 141.78 76 f (t) _TL e 9423 144.3 76 f (t) _TL e 1.8 0 8.50 10028 133.65 76 f (t) _TL e 9857 137.1 76 f (t) _TL e 2.6 0 9.00 10148 131.22 76 f (t) _TL e 9983 134.6 76 f (t) _TLe 2.6 0

Recommended