Technical Report Documentation Page 1. Report No.
FHWA/TX-06/0-4085-52. Government Accession No.
3. Recipient’s Catalog No.
5. Report Date November 2005; Revised June 2006
4. Title and Subtitle
Preventing ASR/DEF in New Concrete: Final Report 6. Performing Organization Code
7. Author(s) Kevin J. Folliard, Ryan Barborak, Thano Drimalas, Dr. Lianxiang Du, Sabrina Garber, Jason Ideker, Tyler Ley, Stephanie Williams, Maria Juenger, Benoit Fournier, and Michael D.A. Thomas
8. Performing Organization Report No. 0-4085
10. Work Unit No. (TRAIS) 9. Performing Organization Name and Address Center for Transportation Research The University of Texas at Austin 3208 Red River, Suite 200 Austin, TX 78705-2650
11. Contract or Grant No. 0-4085
13. Type of Report and Period Covered Technical Report September 2000–August 2005
12. Sponsoring Agency Name and Address Texas Department of Transportation Research and Technology Implementation Office P.O. Box 5080 Austin, TX 78763-5080
14. Sponsoring Agency Code
15. Supplementary Notes Project performed in cooperation with the Texas Department of Transportation and the Federal Highway Administration.
16. Abstract The state of Texas has been widely impacted by materials-related distress in various transportation structures. This distress has been mainly attributed to alkali-silica reaction (ASR) and delayed ettringite formation (DEF) and has been commonly referred toby the Texas Department of Transportation (TxDOT) as “premature concrete deterioration.” In response to these problems, TxDOT has aggressively sought to prevent cases in new concrete structures by implementing new ASR specifications (initially as TxDOT Special Provision to Item 421). The specifications, and updates since, require contractors to address ASR through prescriptive options (e.g., 20–35 percent Class F fly ash) or performance testing. The research detailed in this report was performed in support of this new specification, with the intention of improving upon the initial specification efforts and increasing the service life of transportation applications.
This report summarizes the overall findings of TxDOT Project 0-4085, “Preventing ASR and DEF in New Concrete.” This research project was 4 1/2 years in duration, with an emphasis on both laboratory and field evaluations. The work was performedat the Concrete Durability Center (CDC) at The University of Texas at Austin (UT Austin).
The main objectives and goals of this project can be summarized as follows:
1. Understand the underlying mechanisms behind ASR and/or DEF 2. Review available test methods for aggregate reactivity and for preventive measures and recommend test method(s)
to prevent ASR and/or DEF in new concrete 3. Develop specification and guidelines to prevent ASR and/or DEF in new concrete 4. Identify and implement strategies for preventing ASR and/or DEF, with emphasis on prudent use of supplementary
cementing materials (SCMs) 5. Develop protocol for evaluating the cause, extent, and future potential for damage owing to ASR and/or DEF in
existing concrete structures 6. Transfer knowledge and experience gained from this project to TxDOT practice to increase the service life of
transportation structures
17. Key Words alkali-silica reaction, delayed ettringite formation, SCM, Lithium, aggregate reactivity, test methods, mitigation
18. Distribution Statement No restrictions. This document is available to the public through the National Technical Information Service, Springfield, Virginia 22161; www.ntis.gov.
19. Security Classif. (of report) Unclassified
20. Security Classif. (of this page) Unclassified
21. No. of pages 266
22. Price
Form DOT F 1700.7 (8-72) Reproduction of completed page authorized

PREVENTING ASR/DEF IN NEW CONCRETE: FINAL REPORT
Kevin J. Folliard Ryan Barborak Thano Drimalas Dr. Lianxiang Du Sabrina Garber Jason Ideker Tyler Ley Stephanie Williams Maria Juenger Benoit Fournier Michael D.A. Thomas
CTR Technical Report: 0-4085-5 Report Date: November 2005; June 2006 Research Project: 0-4085 Research Project Title: Preventing ASR/DEF in New Concrete: Final ReportSponsoring Agency: Texas Department of Transportation Performing Agency: Center for Transportation Research at The University of Texas at Austin
Project performed in cooperation with the Texas Department of Transportation and the Federal Highway Administration.
Center for Transportation Research The University of Texas at Austin 3208 Red River Austin, TX 78705
www.utexas.edu/research/ctr
Copyright © 2006 Center for Transportation Research The University of Texas at Austin
All rights reserved Printed in the United States of America
v
Disclaimers
Authors’ Disclaimer: The contents of this report reflect the views of the authors, who are responsible for the facts and the accuracy of the data presented herein. The contents do not necessarily reflect the official view or policies of the Federal Highway Administration or the Texas Department of Transportation. This report does not constitute a standard, specification, or regulation.
Patent Disclaimer: There was no invention or discovery conceived or first actually reduced to practice in the course of or under this contract, including any art, method, process, machine manufacture, design or composition of matter, or any new useful improvement thereof, or any variety of plant, which is or may be patentable under the patent laws of the United States of America or any foreign country.
Notice: The United States Government and the State of Texas do not endorse products or manufacturers. If trade or manufacturers’ names appear herein, it is solely because they are considered essential to the object of this report.
Engineering Disclaimer
NOT INTENDED FOR CONSTRUCTION, BIDDING, OR PERMIT PURPOSES.
Project Engineer: Dr. David W. Fowler Professional Engineer License Number: Texas No. 27859
P. E. Designation: Researcher
vi
Acknowledgments
The authors express appreciation to the TxDOT Project Directors (Dr. Moon Won and Mr. Joe Roche), members of the Project Monitoring Committee, and the staff at the Concrete Durability Center.
vii
Table of Contents 1. Introduction................................................................................................................................1
1.1 Introduction and Background ..............................................................................................1 1.2 Project Objectives ................................................................................................................31.3 Research Team.....................................................................................................................31.4 Outline of Remainder of Report ..........................................................................................3
2. Materials Used in Research Project .........................................................................................52.1 Summary of Testing Materials.............................................................................................5 2.2 Fine Aggregates ...................................................................................................................52.3 Coarse Aggregates ...............................................................................................................52.4 International Center for Aggregates Research 302 Aggregates...........................................6 2.5 Portland Cement...................................................................................................................62.6 Supplementary Cementing Materials...................................................................................7
2.6.1 Fly Ash........................................................................................................................72.6.2 Slag .............................................................................................................................92.6.3 Silica Fume .................................................................................................................92.6.4 Metakaolin ..................................................................................................................9
2.7 Chemical Admixtures ........................................................................................................102.7.1 Lithium Nitrate..........................................................................................................10
2.8 Material Processing............................................................................................................103. American Society for Testing and Materials C 1260: The Accelerated Mortar Bar
Test ..........................................................................................................................................113.1 Introduction........................................................................................................................113.2 Standard American Society for Testing and Materials C 1260 Testing Procedures..........12 3.3 American Society for Testing and Materials C 1260 Results—Fine and Coarse
Aggregates .........................................................................................................................133.4 Effects of Temperature on Expansion in American Society for Testing and
Materials C 1260 Testing Regime .....................................................................................16 3.5 Effects of Soak-Solution Normality on Expansion in American Society for
Testing and Materials C 1260 Testing Regime..................................................................17 3.6 Evaluation of Supplementary Cementing Materials Using American Society for
Testing and Materials C 1260............................................................................................21 3.6.1 Evaluation of Texas Fly Ashes Using American Society for Testing and
Materials C 1260.......................................................................................................22 3.6.2 Effects of Cement Alkalinity on Expansion When Testing Fly Ash in
American Society for Testing and Materials C 1260................................................27 3.7 Use of American Society for Testing and Materials C 1260 for Preliminary
Selection of Mixtures for Showcase Bridge ......................................................................29 3.8 Summary ............................................................................................................................31
4. American Society for Testing and Materials C 1293: The Concrete Prism Test..............33
viii
4.1 Test Background ................................................................................................................334.2 Accelerated 140° F (60° C) American Society for Testing and Materials C 1293...........34 4.3 Overview of Tests Performed ............................................................................................36 4.4 Aggregate Results ..............................................................................................................37
4.4.1 Fine Aggregates ........................................................................................................374.4.2 Coarse Aggregates ....................................................................................................39
4.5 Use of Supplementary Cementing Materials and LiNO3 (selection of showcase bridge mixtures) .................................................................................................................414.5.1 American Society for Testing and Materials C 1260 Testing—Potential
Showcase Bridge Mixtures .......................................................................................41 4.5.2 American Society for Testing and Materials C 1293 Testing—Selected
Bridge Mixtures ........................................................................................................43 4.5.3 Further American Society for Testing and Materials C 1293 Testing Using
Supplementary Cementing Materials and/or LiNO3 ................................................45 4.6 Accelerated American Society for Testing and Materials C 1293, Conducted at
140° F (60° C)....................................................................................................................49 4.6.1 Correlation of Accelerated Results with Traditional Results ...................................49 4.6.2 Interlaboratory Study—January 2002.......................................................................57
4.7 Summary ............................................................................................................................615. Outdoor Exposure Site ............................................................................................................63
5.1 Background........................................................................................................................635.2 Significance........................................................................................................................635.3 Exposure Site .....................................................................................................................64
5.3.1 Location and Layout .................................................................................................64 5.3.2 Measurement.............................................................................................................665.3.3 Role of Climate .........................................................................................................68
5.4 Test Results and Discussion...............................................................................................715.4.1 Fine Aggregate Results .............................................................................................71 5.4.2 Coarse Aggregates ....................................................................................................75 5.4.3 Showcase Bridge Mixtures .......................................................................................80 5.4.4 Other Mixtures Containing Supplementary Cementing Materials and/or
Lithium Nitrate..........................................................................................................82 5.4.5 International Center for Aggregates Research Block Series with
Supplementary Cementing Materials........................................................................83 5.4.6 Blocks with Varying Cement Alkalinity..................................................................84
5.5 Summary ............................................................................................................................876. Lithium Compounds for Preventing or Mitigating Alkali-Silica Reaction .......................89
6.1 Introduction........................................................................................................................896.2 Objective ............................................................................................................................896.3 Material Selection ..............................................................................................................90
6.3.1 Cement ......................................................................................................................906.3.2 Aggregates ................................................................................................................916.3.3 Lithium Compounds .................................................................................................91
ix
6.4 Material Preparation and Quantities ..................................................................................91 6.4.1 Material Grading and Quantities...............................................................................91 6.4.2 Sodium Hydroxide ....................................................................................................92 6.4.3 Lithium Compounds .................................................................................................93
6.5 Experimental Procedures ...................................................................................................946.5.1 Mixing and Measurements for the Admixture Study ...............................................94 6.5.2 Mixing and Measurements for the Post-Treatment Study ........................................95
6.6 Results and Discussion ......................................................................................................976.6.1 LiNO3 Admixture Results.........................................................................................97 6.6.2 Treating Alkali-Silica Reaction-Affected Concrete with Lithium: Single
Post-Treatment Results ...........................................................................................102 6.6.3 Treating Alkali-Silica Reaction-Affected Concrete with Lithium: Multiple
Post-Treatment Results ...........................................................................................116 6.7 Summary ..........................................................................................................................118
7. Delayed Ettringite Formation...............................................................................................1217.1 Background......................................................................................................................1217.2 Test Methods....................................................................................................................122
7.2.1 Kelham Test Method...............................................................................................122 7.2.2 Fu Test Method.......................................................................................................124 7.2.3 Modified American Society for Testing and Materials C 227 Test Procedure......125
7.3 Materials and Mixture Proportions ..................................................................................125 7.3.1 Materials .................................................................................................................1267.3.2 Mixture Proportions ................................................................................................127
7.4 Accelerated Delayed Ettringite Formation Testing Regimes and Parameters.................129 7.4.1 Effects of Maximum Curing Temperature on Delayed Ettringite
Formation—Induced Expansion .............................................................................130 7.4.2 Effects of Cement Types on Delayed Ettringite Formation—Induced
Expansion................................................................................................................131 7.4.3 Effects of Supplementary Cementing Materials on Delayed Ettringite
Formation................................................................................................................134 7.4.4 Relationship between Mass Gain and Delayed Ettringite Formation.....................138 7.4.5 Comparison of Kelham and Fu Testing Regimes ...................................................143 7.4.6 Comparison of Curing Temperatures Using the Fu Method ..................................147 7.4.7 Effects of Microcracking in the Fu Test Method....................................................148 7.4.8 Effects of Aggregates on Expansion Owing to Delayed Ettringite Formation......153 7.4.9 Modified American Society for Testing and Materials C 227 Test Results ...........156 7.4.10 Summary of Mortar Bar Expansion Tests ............................................................159
7.5 Delayed Ettringite Formation Exposure Blocks ..............................................................160 7.5.1 Materials .................................................................................................................1607.5.2 Exposure Procedure for Casting Blocks and Related Specimens...........................160 7.5.3 Behavior of Exposure Site Blocks and Related Specimens....................................162 7.5.4 Summary of Delayed Ettringite Formation Exposure Block Data .........................171
7.6 Summary ..........................................................................................................................1728. Showcase Bridge.....................................................................................................................173
x
8.1 Introduction......................................................................................................................1738.2 Showcase Bridge..............................................................................................................1738.3 Control Structure..............................................................................................................1748.4 Type B Beam Details .......................................................................................................1758.5 Instrumentation Background............................................................................................177
8.5.1 Gage Placement ......................................................................................................177 8.6 Thermocouples.................................................................................................................1838.7 Weather Station................................................................................................................1848.8 Concrete Surface Strain Measurement.............................................................................185 8.9 Summary ..........................................................................................................................187
9. A Case Study in Premature Concrete Deterioration: The San Antonio Y......................1899.1 Introduction......................................................................................................................1899.2 Background and Motivation for Research .......................................................................189 9.3 Selected Elements ............................................................................................................190
9.3.2 A-18SR, A-18SL, and H-19C.................................................................................191 9.4 DD-6, DD-7, DD-8, and AA-10C....................................................................................193
9.4.2 D-35C and D-37C...................................................................................................195 9.5 Testing Regime ................................................................................................................196
9.5.2 Expansion Measurements .......................................................................................197 9.5.3 Forensic Evaluation ................................................................................................200 9.5.4 Water-Soluble Alkali Test ......................................................................................204
9.6 Summary ..........................................................................................................................20810. Conclusions...........................................................................................................................211
10.1 Conclusions....................................................................................................................21110.2 Alkali-Silica Reaction....................................................................................................211
10.2.1 Test Methods for Alkali-Silica Reaction ..............................................................211 10.2.2 Options for Preventing Alkali-Silica Reaction in New Concrete .........................212 10.2.3 Specifications for Alkali-Silica Reaction..............................................................213 10.2.4 Showcase Bridge...................................................................................................214
10.3 Delayed Ettringite Formation ........................................................................................214 10.3.1 Test Methods for Delayed Ettringite Formation...................................................214 10.3.2 Options for Preventing Delayed Ettringite Formation in New Concrete..............215 10.3.3 Specifications for Delayed Ettringite Formation ..................................................215
10.4 Protocol for Evaluating Existing Structures ..................................................................215 10.5 Economic Benefits of Project Deliverables ...................................................................216
References...................................................................................................................................217Appendix A: Additional Information on the San Antonio Y.................................................223Appendix B: Results of Aggregate Testing..............................................................................227Appendix C: Exposure Block Expansion Summary...............................................................233
xi
List of Figures Figure 3.1 Cracking of Mortar Bars after ASTM C 1260 Testing .............................................14
Figure 3.2 Reduced Soak Solution with F1 at 40% and 100% (by mass of total aggregates) ................................................................................................................21
Figure 3.3 ASTM C 1260 Results for Aggregate F4 with Various Fly Ashes...........................24
Figure 3.4 ASTM C 1260 Results for Aggregate F3 with Various Fly Ashes...........................24
Figure 3.5 ASTM C 1260 Results for Aggregate F7 with Various Fly Ashes...........................25
Figure 3.6 ASTM C 1260 Results for Aggregate C3 with Various Fly Ashes ..........................25
Figure 3.7 ASTM C 1260 Results for Aggregate F5 with Various Fly Ashes...........................26
Figure 3.8 Effects of CaO Content of Fly Ash on Expansion for Mortar Mixtures Containing Various Reactive Aggregates.................................................................27
Figure 3.9 Varying Cement Alkalinity with F7 and 40% FA4-C ..............................................28
Figure 3.10 Varying Cement Alkalinity with F1 and 20% FA2-F...............................................29
Figure 3.11 Varying Cement Alkalinity with C7 and 20% FA2-F ..............................................29
Figure 4.1 Comparison of Expansions in Accelerated versus Standard Concrete Prism Tests from Various Laboratories ....................................................................35
Figure 4.2 Comparison of Expansions in Accelerated versus Standard Concrete Prism Tests for Various Preventive Measures after Touma 2000 ............................36
Figure 4.3 Fine Aggregate (F7) Tested Mitigation Options Using ASTM C 1260 ...................42
Figure 4.4 Fine Aggregate (F7) Tested Mitigation Options Using ASTM C 1260 ...................42
Figure 4.5 ASTM C 1293 Expansion Results at 2 Years for Mitigated Bridge Mixtures ....................................................................................................................44
Figure 4.6 ASTM C 1293 Expansion Results at 2 Years for Mitigated Bridge Mixtures ....................................................................................................................44
Figure 4.7 ASTM C 1293 Coarse and Fine Aggregate: 12-Month Expansion at100° F versus 3-Month Expansion at 140° F............................................................50
Figure 4.8 ASTM C 1293 Expansions at 100° F (38° C)—Spratt and Sudbury Coarse Aggregates ....................................................................................................51
Figure 4.9 ASTM C 1293 Expansions at 100° F (38° C) versus 140° F (60° C)—Spratt Coarse Aggregate ...........................................................................................52
Figure 4.10 ASTM C 1293 Expansions at 100° F (38° C) versus 140° F (60° C)—Sudbury Coarse Aggregate .......................................................................................52
Figure 4.11 ASTM C 1293 Expansions of Spratt Aggregate at Varying Temperatures..............54
Figure 4.12 Mass Loss in ASTM C 1293 at 100° F (38° C), 120° F (49° C), and140° F (60° C) with Spratt coarse Aggregate ...........................................................55
xii
Figure 4.13 Relative Leaching of Alkalies as Measured from Leachate Concentration from Bottom of ASTM C 1293 Container for Spratt Coarse Aggregate..................56
Figure 4.14 ASTM C 1293 at 100° F (38° C) and 140° F (60° C) Spratt ....................................57
Figure 4.15 Comparison of Series of Spratt Prisms in ASTM C 1293 at Accelerated Temperature with Different Variables......................................................................59
Figure 4.16 ASTM C 1293 Comparison of Different Nonreactive Fine Aggregate and Cement Type with Spratt Coarse Aggregate......................................................60
Figure 5.1 Typical Outdoor Exposure Block .............................................................................65
Figure 5.2 Exposure Site November 2001 .................................................................................65
Figure 5.3 Exposure Site December 2005..................................................................................66
Figure 5.4 Exposure Block Measurement Locations .................................................................66
Figure 5.5 10-Inch Digital Strain Gage ......................................................................................67
Figure 5.6 Expansion of Exposure Block Cast with Fine Aggregate F7 and 1.25% Na2Oe at 1,184 days ..................................................................................................68
Figure 5.7 Average Daily Maximum Temperature for Austin and Ottawa ...............................69
Figure 5.8 Average Daily Minimum Temperature for Austin and Ottawa ................................69
Figure 5.9 Average Daily Humidity Values for Austin and Ottawa ..........................................70
Figure 5.10 Average Monthly Precipitation Values for Austin and Ottawa ................................70
Figure 5.11 Average Expansion of Blocks Containing Fine Aggregate and Boosted Alkalies .....................................................................................................................72
Figure 5.12 Difference between Measured Expansions and Expansion Limits for ASTM C 1260 and ASTM C 1293 ...........................................................................74
Figure 5.13 Average Expansion of Blocks Containing Coarse Aggregate (C1-C10) and Boosted Alkalies ................................................................................................75
Figure 5.14 Average Expansion of Blocks Containing Coarse Aggregate (C11-C17) and Boosted Alkalies ................................................................................................77
Figure 5.15 Difference between Measured Expansions and Expansion Limits for ASTM C 1260 and ASTM C 1293 ...........................................................................79
Figure 5.16 Expansions in Outdoor Exposure Block Testing for Showcase Bridge Mixtures ....................................................................................................................81
Figure 5.17 ASTM C 1293 Expansions with Different Cement Alkalinities and F1 ..................86
Figure 5.18 Expansions in Exposure Blocks with F1 and Varying Cement Alkalinities................................................................................................................86
Figure 6.1 Typical Flow Diagram of Single Post-Treatment Test Method................................96
Figure 6.2 Average Expansion of C10 with Cements of Varying Alkalinities with 75% of the Recommended Dosage of LiNO3 ..........................................................99
xiii
Figure 6.3 Average Expansion of C10 with 75% of the Recommended Dosage of LiNO3......................................................................................................................100
Figure 6.4 F1 Single-Treatment Results...................................................................................103
Figure 6.5 C7 Single-Treatment Results ..................................................................................103
Figure 6.6 C8 Single-Treatment Results ..................................................................................104
Figure 6.7 C10 Single-Treatment Results ................................................................................105
Figure 6.8 C7 Treated with LiNO3 and Renew at 0 and 1Days ...............................................106
Figure 6.9 C7 Treated with LiNO3 and Renew at 3 and 5 Days ..............................................107
Figure 6.10 C7 Treated with LiOH at 0, 1, 3, and 5 Days .........................................................108
Figure 6.11 C7 Treated with 4N LiNO3 and 4N Renew at 0, 3, and 5 Days .............................108
Figure 6.12 C8 Treated with LiNO3 and Renew at 0, 42, and 63 Days at a Temperature of 120° F............................................................................................109
Figure 6.13 C8 Treated with LiOH at 0, 42, and 63 Days at a Temperature of 120° F .............110
Figure 6.14 C10 Treated with LiNO3 and Renew at 0 and 21 Days at a Temperature of 120° F .................................................................................................................111
Figure 6.15 C10 Treated with LiOH at 0 and 21 Days at a Temperature of 120° F ..................111
Figure 6.16 C8 Treated with LiNO3 and Water Using the ASTM C 227 Approach .................112
Figure 6.17 C7 Treated with Various Forms of Lithium and Water at a Select Time Using the ASTM C 227 Approach .........................................................................113
Figure 6.18 C7 Transferred to a Solution Containing 100% of the Recommended Dosage of Lithium after Initiating ASR for Selected Periods of Time ..................114
Figure 6.19 F1 Transferred to a Solution Containing 100% of the Recommended Dosage of Lithium after Initiating ASR for Selected Periods of Time ..................115
Figure 6.20 C8 Transferred to a Solution Containing 100% of the Recommended Dosage of Lithium after Initiating ASR for Selected Periods of Time ..................115
Figure 6.21 C7 Multiple Treatment Results...............................................................................117
Figure 6.22 C8 Multiple Treatment Results...............................................................................117
Figure 6.23 C10 Multiple Treatment Results.............................................................................118
Figure 7.1 Kelham Test's Curing Temperature Cycle (Thomas 2003) ....................................123
Figure 7.2 Predicted Expansions Compared to Experimental Expansions (Kelham 1996) .......................................................................................................................124
Figure 7.3 Fu Test Curing Temperature Cycle (Thomas 2003) ...............................................124
Figure 7.4 F5 Aggregate with PC-CI Cement, Heat-Cured at Varying Temperatures ............130
Figure 7.5 F6 Aggregate with PC-CI Cement, Heat-Cured at Varying Temperatures ............131
Figure 7.6 F7 Aggregate with PC-CI Cement, Heat-Cured at Varying Temperatures ............131
xiv
Figure 7.7 Cement Composition Effects on F5 Aggregate Heat Cured at 203° F (95° C) ....................................................................................................................132
Figure 7.8 Cement Composition Effects on F6 Aggregate Heat-Cured at 203° F(95° C) ....................................................................................................................132
Figure 7.9 Cement Composition Effects on F7 Aggregate Heat-Cured at 203° F(95° C) ....................................................................................................................133
Figure 7.10 Type V Cement Heat-Cured at 203° F (95° C) Shows Little, if any, Expansion with the Three Different Aggregates ....................................................134
Figure 7.11 F7 and PC-CI in Combination with Various SCMs [203° F (95° C)] ....................135
Figure 7.12 F7 and PC-BIII in Combination with Various SCMs [203° F (95° C)] .................135
Figure 7.13 F5 and PC-CI in Combination with Various SCMs [203° F (95° C)] ....................136
Figure 7.14 F6 and PC-CI in Combination with Various SCMs [203° F (95° C)] ....................136
Figure 7.15 F7 and PC-C1 in Combination with Various SCMs [149° F (65° C)] ...................137
Figure 7.16 F5 and PC-C1 in Combination with Various SCMs [149° F (65° C)] ...................137
Figure 7.17 F6 and PC-C1 in Combination with Various SCMs [73° F (23° C)] .....................138
Figure 7.18 F7 and PC-CI in Combination with Various SCMs [73° F (23° C)] ......................138
Figure 7.19 Expansion Data for F6 in Combination with PC-CI [203° F (95° C)]Maximum Curing Temperature).............................................................................139
Figure 7.20 Mass Gain Data for F6 in Combination with PC-CI [203° F (95° C)]Maximum Curing Temperature).............................................................................140
Figure 7.21 Expansion Data for F6 in Combination with PC-CI [149° F (65° C)Maximum Curing Temperature].............................................................................140
Figure 7.22 Mass Gain Data for F6 in Combination with PC-CI [149° F (65° C)Maximum Curing Temperature].............................................................................141
Figure 7.23 Expansion Data for F5 in Combination with PC-BIII [149° F (65° C)Maximum Curing Temperature].............................................................................141
Figure 7.24 Mass Gain Data for F5 in Combination with PC-BIII [149° F (65° C)Maximum Curing Temperature].............................................................................142
Figure 7.25 Expansion Data for F5 in Combination with PC-CI [149° F (65° C)Maximum Curing Temperature].............................................................................142
Figure 7.26 Mass Gain Data for F5 in Combination with PC-CI [149° F ( 65° C) Maximum Curing Temperature).............................................................................143
Figure 7.27 F5 with PC-BI Comparing Fu and Kelham Methods [203° F (95° C)]..................144
Figure 7.28 F7 with PC-AIII Comparing Fu and Kelham Methods [203° F (95° C)] ...............144
Figure 7.29 F5 with PC-BIII Comparing Fu and Kelham Methods [203° F (95° C)] ...............145
xv
Figure 7.30 F5 Combination with Five Cements Using the Fu Method [149° F (65° C)] ...........................................................................................................................146
Figure 7.31 F7 Combination with Five Cements Using the Fu Method [149° F (65° C)] ...........................................................................................................................146
Figure 7.32 F7 with PC-AI and SCMs Comparing the Fu and Kelham Methods [(203° F (95° C)].....................................................................................................147
Figure 7.33 F7 in Combination with PC-BIII Using the Fu Method at Different Temperatures ..........................................................................................................148
Figure 7.34 F5 in Combination with PC-BIII Using the Fu Method at Different Temperatures ..........................................................................................................148
Figure 7.35 F5 Aggregate with PC-CI Using the Fu Method [203° F (95° C)], with and without the Drying Cycle.................................................................................149
Figure 7.36 F7 Aggregate with PC-CI Using the Fu Method [203° F (95° C)], with and without the Drying Cycle.................................................................................150
Figure 7.37 F6 Aggregate with PC-CI Using the Fu Method [203° F (95° C)], with and without the Drying Cycle.................................................................................150
Figure 7.38 F5 Aggregate with PC-CI Cement Using Fu Method [203° F (95° C)], Resistivity Measurements with and without the Drying Cycle ..............................151
Figure 7.39 F7 Aggregate with PC-CI Cement Using Fu Method [203° F (95° C)], Resistivity Measurements with and without the Drying Cycle ..............................152
Figure 7.40 F6 Aggregate with PC-CI Cement Using Fu Method [203° F (95° C)], Resistivity Measurements with and without the Drying Cycle ..............................152
Figure 7.41 Effects of Aggregates on Expansion with PC-CI Using the Kelham Method, with a Maximum Curing Temperature of 203° F (95° C)........................153
Figure 7.42 Effects of Aggregates on Expansion with PC-AIII Using the Kelham Method, with a Maximum Curing Temperature of 203° F (95° C)........................154
Figure 7.43 Effects of Aggregates on Expansion with PC-CI Using the Fu Method, with a Maximum Curing Temperature of 203° F (95° C) ......................................154
Figure 7.44 Backscattered Image of F1 with PC-AIII Cement. .................................................155
Figure 7.45 Backscattered Image of F6 with PC-AIII Cement..................................................156
Figure 7.46 Expansions of ASTM C 227 Specimens Made with Aggregate F5........................158
Figure 7.47 Expansions of ASTM C 227 Specimens Made with Aggregate F6........................158
Figure 7.48 Expansions of ASTM C 227 Specimens Made with Aggregate F7........................159
Figure 7.49 Specimens Created from Each Batch of Concrete..................................................162
Figure 7.50 Exposure Block Expansions for Non–Heat-Cured Block.......................................163
Figure 7.51 Expansion from Fu and Kelham Tests for Heat-Cured Nonreactive Block (C6 and F6 aggregate with PC-CI)..............................................................163
xvi
Figure 7.52 Expansion from Fu and Kelham Tests for Non–Heat-Cured Nonreactive Block (C6 and F6 aggregate with PC-CI)...............................................................164
Figure 7.53 Comparison of Preheated Materials to Non-Preheated Materials...........................164
Figure 7.54 Average of Expansion between Both Exposure Blocks .........................................165
Figure 7.55 Expansion from Fu and Kelham Tests for Heat-Cured Moderately Reactive Block (C8 and F6 aggregate with PC-CI)................................................166
Figure 7.56 Expansion from Fu and Kelham Tests for Non–Heat-Cured Moderately Reactive Block (C8 and F6 aggregate with PC-CI)................................................166
Figure 7.57 Comparison between Materials Used in the Fu Test ..............................................167
Figure 7.58 Comparison of Preheated Materials to Non-Preheated Materials...........................168
Figure 7.59 Average Expansions between Exposure Blocks .....................................................169
Figure 7.60 Heat-Cured Block Showing Signs of Distress after 400 Days ...............................169
Figure 7.61 Expansion from Fu and Kelham tests for Heat-Cured Highly Reactive Block (C8 and F7 aggregate with PC-CI)...............................................................170
Figure 7.62 Expansion from Fu and Kelham Tests for Non–Heat-Cured Highly Reactive Block (C8 and F7 aggregate with PC-CI)................................................170
Figure 7.63 Comparison of Preheated Materials to Non-Preheated Materials...........................171
Figure 8.1 Layout of the Showcase Bridge ..............................................................................174
Figure 8.2 Layout for the Control Bridge.................................................................................175
Figure 8.3 Cross Section of Texas Type B Girder ...................................................................176
Figure 8.4 Reinforcing Layout for the Midspan of the Type B Girder ....................................176
Figure 8.5 Basic Layout of Instrumentation for the Showcase Bridge ....................................177
Figure 8.6 Dimensions of Gage Layout for the Showcase Bridge...........................................179
Figure 8.7 Dimensions of Gage Layout for the Control Structure...........................................180
Figure 8.8 Proposed Method of Attachment for Vertical Gages between the Shear Stirrups....................................................................................................................181
Figure 8.9 Gage Shown in Horizontal Orientation Attached to Small Rebar between the Shear Stirrups .....................................................................................181
Figure 8.10 Purposed Attachment Method for a Middle Longitudinal Gage ............................182
Figure 8.11 Wires Attached to Gage for Longitudinal Orientation in the Bottom of the Beam .................................................................................................................182
Figure 8.12 The Bottom Longitudinal Gage Placed in a Matrix of Rebar at the Same Spacing as the Prestressing Strands Used in the Project ........................................183
Figure 8.13 A Type T Thermocouple with Epoxy-Injected PVC Incasing................................184
Figure 8.14 A Weather Station Used at the Concrete Durability Center Exposure Site............185
xvii
Figure 8.15 Measurement Gage for Demac Points from Mays Instruments Ltd. ......................186
Figure 8.16 Demac Point Layout ...............................................................................................186
Figure 9.1 Locations of the Elements Selected for Evaluation of the San Antonio Y.............191
Figure 9.2 Orientation of the Straddle Cap A-18S...................................................................192
Figure 9.3 Element H-19C with Copious Amounts of Efflorescence on Its Surface...............193
Figure 9.4 The East Face of DD-6 Has the Most Exposure to Weather and the Most Extensive Cracking........................................................................................194
Figure 9.5 Cantilever Bents and Their Critical Sections from TxDOT Project 1364 ..............195
Figure 9.6 Tendon Layout for D-35C ......................................................................................196
Figure 9.7 Testing Regime for Concrete Cores Obtained from the San Antonio Y ................197
Figure 9.8 Expansion Observed in Concrete Cores Owing to ASR.........................................198
Figure 9.9 Expansion Observed in Concrete Cores Owing to DEF.........................................200
Figure 9.10 SEM Image of Concrete Taken from H-19C..........................................................202
Figure 9.11 SEM Image of Concrete Taken from DD-6............................................................203
Figure 9.12 Graphical Representation of the Data from the Water-Soluble Alkali Test..........................................................................................................................207

xviii
xix
List of Tables Table 2.1 Fine Aggregates ..........................................................................................................5
Table 2.2 Basic Coarse Aggregates ............................................................................................6
Table 2.3 ICAR 302 Aggregates.................................................................................................6
Table 2.4 Cement Properties.......................................................................................................7
Table 2.5 Fly Ash Properties.......................................................................................................8
Table 2.6 Slag, Silica Fume, and Metakaolin Properties ..........................................................10
Table 3.1 ASTM C 1260 Results for TxDOT 0-4085 Fine Aggregates ...................................14
Table 3.2 ASTM C 1260 Results for TxDOT 0-4085 Coarse Aggregates ...............................15
Table 3.3 ASTM C 1260 Results for ICAR 302 Aggregates....................................................15
Table 3.4 Aggregates that Pass ASTM C 1260 but Fail ASTM C1293 ...................................16
Table 3.5 Reactivity Ratios for Aggregates Tested at Different Temperatures........................17
Table 3.6 Aggregate Expansion in Different Normality Soak Solutions..................................19
Table 3.7 Aggregate Expansion in Different Normality Soak Solutions..................................19
Table 3.8 Intermediate Normality Testing with F1, F7, and F10 .............................................20
Table 3.9 Chemical Composition of the Fly Ash Used in ASTM C 1260 Study .....................23
Table 3.10 Required Fly Ash Dosage to Control ASR-Induced Expansion (below 0.10% at 14 days) for Various Aggregates ...............................................................26
Table 3.11 Approximate % Required to Suppress ASR for Aggregate F1.................................30
Table 3.12 Approximate % Required to Suppress ASR for Aggregate F7.................................31
Table 4.1 ASTM C 1293 and ASTM C 1260 Test Results—Fine Aggregates ........................38
Table 4.2 ASTM C 1293 and ASTM C 1260 Test Results—Fine Aggregates ........................39
Table 4.3 Additional Mitigation Options for Aggregate F7—ASTM C 1293..........................45
Table 4.4 Lithium Nitrate with Selected Aggregates—ASTM C 1293 Testing.......................46
Table 4.5 ICAR Fly Ash Characteristics ..................................................................................47
Table 4.6 ICAR 302 Aggregates with Various SCM Tested in ASTM C 1293 .......................48
Table 5.1 Fine Aggregate Expansions in ASTM C 1260 and 1293 and Outdoor Exposure Blocks .......................................................................................................73
Table 5.2 TxDOT 0-4085 Coarse Aggregate Expansions in ASTM C 1260, 1293, and Exposure Blocks ................................................................................................76
Table 5.3 ICAR 302 Coarse Aggregate Expansions in ASTM C 1260, 1293, and Exposure Blocks .......................................................................................................78
Table 5.4 Expansions of Showcase Bridge Mixtures in Exposure Block Testing....................82
xx
Table 5.5 Outdoor Exposure Block Expansions for Additional SCMs and Lithium Nitrate .......................................................................................................................83
Table 5.6 ICAR 302 Fly Ash Properties ...................................................................................84
Table 5.7 ICAR 302 Block Series with SCMs..........................................................................84
Table 5.8 Expansions for Exposure Block Cement Alkalinity Series ......................................85
Table 6.1 Chemical Analysis of CM3 and CM5.......................................................................90
Table 6.2 Identification and Location of Aggregates ...............................................................91
Table 6.3 Grading Requirements for ASTM C 1260................................................................92
Table 6.4 Actual Quantities of Materials Used in Mixture.......................................................92
Table 6.5 Proportions for 1L of Soak Solution for ASTM C 1260 ..........................................93
Table 6.6 Strength as a Function of Time.................................................................................95
Table 6.7 Results of Admixture LiNO3 Treatments .................................................................98
Table 6.8 ASTM C 1293 Results Using LiNO3 as an Admixture ..........................................101
Table 7.1 Aggregates Used in DEF Testing Program.............................................................126
Table 7.2 Chemical Compositions of the Portland Cements ..................................................127
Table 7.3 Chemical Compositions of the Supplementary Cementing Materials....................127
Table 7.4 Mix Proportions for ASTM C 1260........................................................................128
Table 7.5 Gradation for DEF Testing for Three Mortar Bars.................................................128
Table 7.6 Materials Used for Comparing Kelham and Fu Methods.......................................143
Table 7.7 Comparisons between Fu and Kelham Testing Regimes .......................................145
Table 7.8 Analysis Using Microprobe for Mixture Containing F1 and PC-AIII....................155
Table 7.9 Analysis Using Microprobe for Mixture Containing F6 and PC-AIII....................156
Table 7.10 Aggregate Combinations Used in Testing ..............................................................160
Table 9.1 Damage Rating Indices for Selected Elements.......................................................201
Table 9.2 Notation and Constants Used in the Water-Soluble Alkali Test.............................205
Table 9.3 Data from the Water-Soluble Alkali Test ...............................................................206
1
1. Introduction
1.1 Introduction and Background The state of Texas has been widely impacted by materials-related distress in various
transportation structures. This distress has been mainly attributed to alkali-silica reaction (ASR) and delayed ettringite formation (DEF) and has been commonly referred to by the Texas Department of Transportation (TxDOT) as “premature concrete deterioration.” In response to these problems, TxDOT has aggressively sought to prevent cases in new concrete structures by implementing new ASR specifications (initially as a TxDOT Special Provision to Item 421). The specifications, and updates since, require contractors to address ASR through prescriptive options (e.g., 20–35 percent Class F fly ash) or performance testing. The research detailed in this report was performed in support of this new specification, with the intention of improving upon the initial specification efforts and increasing the service life of transportation applications.
This report summarizes the overall findings of TxDOT Project 0-4085, “Preventing ASR and DEF in New Concrete.” This research project was 4 ½ years in duration, with an emphasis on both laboratory and field evaluations. The work was performed at the Concrete Durability Center (CDC) at The University of Texas at Austin and was the subject of the following masters’ theses:
Williams, Stephanie, “Structures Affected by Premature Concrete Deterioration: Diagnosis and Assessment of Deterioration Mechanisms,” 2005
Drimalas, Thano, “Laboratory Testing and Investigations of Delayed Ettringite Formation,” 2004
Ideker, Jason, “Toward Accurate Test Methods to Assess Alkali-Silica Reaction in Concrete,” (CE Departmental Report), 2004
Pugh, Joshua, “On the Ability of Accelerated Test Methods to Assess Potential for Alkali-Silica Reaction,” 2003
Cornell, Brian, “Laboratory Investigations of Alkali-Silica Reaction Using the Concrete Prism Test and Its Modifications,” 2002
Hall, Joseph, “Long-Term Laboratory and Field Evaluation of Concrete Subjected to Alkali-Silica Reaction and Delayed Ettringite Formations,” 2002
Ley, Tyler, “The Instrumentation of a Prestressed Bridge to Monitor Alkali-Silica Reaction,” 2002
Bauer, Stacy, “Laboratory Investigations of Alkali-Silica Reaction Using the Concrete Prism Test and Its Modifications,” 2002
Figurski, David, “Laboratory and Field Investigations of Alkali-Silica Reaction in Portland Cement Concrete,” 2001
Miralles, Jorge, “High-Temperature Effects on Alkali-Silica Reaction and Delayed Ettringite Formation,” 2001
In addition to the above publications, the research team has been active in publishing selected works in various journals and conference proceedings. The intent of the final project report is not to go into detail on all of these published efforts, but to briefly summarize the key findings and focus on the impact of these studies on current practice in Texas. For additional coverage on specific topics within this report, the reader is urged to refer to the aforementioned
2
theses and other products from this research. Following a brief description of the basics of ASR and DEF, the overall objectives of this research project are presented. Lastly, a chapter-by-chapter breakdown of the remainder of this report is given.
ASR is an internal form of concrete deterioration in which hydroxyl ions in pore solution react with the certain siliceous phases in some aggregates, forming a gel-like layer on the surface of the aggregate. The negatively charged species in this gel attract positively charged alkalies in the pore solution. When sodium and potassium ions are incorporated into the gel, it develops the potential to absorb water and expand. ASR is one of the most common concrete durability problems worldwide, second perhaps only to corrosion of reinforcing steel. ASR-induced expansion will occur only if the following three conditions are met: (1) the aggregates in the concrete mixture contain reactive forms of silica, (2) sufficient alkalies and, consequently, hydroxyl ions are present in the pore solution, and (3) sufficient moisture is available in the hardened concrete. Preventing any of these three conditions from being a reality is sufficient to prevent deterioration and is often the emphasis of prevention strategies.
DEF is another form of internal chemical degradation. It is not as common as ASR or as understood. Ramlochan (2003) and Hall (2003) both provide in-depth discussions of the various theories regarding these two issues. Generally, it is accepted that DEF may be in concretes that were initially subjected to temperatures in excess of 158° F (70° C) during curing. High temperatures may inhibit the normal formation of ettringite (C4AŠ3H32
∗) and accelerate the formation of calcium silicate hydrate (C-S-H) during cement hydration. The sulfate (and aluminate resulting from the incongruous dissolution of ettringite) that would usually form ettringite at normal temperatures is instead absorbed by the rapidly forming C-S-H. Later, the sulfate and aluminate ions absorbed by the C-S-H are released into the pore solution of the hardened cement paste to react with available monosulfate hydrate to form ettringite, resulting in expansion and cracking.
In order for DEF to occur in concrete structures, two necessary but not sufficient conditions must be met: (1) the internal temperature of the concrete must have exceeded 158° F during curing, and (2) sufficient moisture must be available, intermittently or permanently, in the hardened concrete to allow for the formation of ettringite (Taylor et al. 2001). The absence of one of these conditions prohibits the formation of late ettringite. In addition, even when concrete temperatures exceed 158° F, the presence of sufficient dosages of supplementary cementing materials can chemically suppress DEF from ever being a concern, through modifications to early-age hydration processes and in internal microstructure. Prior to TxDOT Project 0-4085, there were no temperature restrictions placed on concrete to attempt to prevent DEF. There were some restrictions on cement chemistry in Special Provision to Item 421, specifically the optimal sulfate content of cement, but this limit is not sufficient to control DEF when concrete temperatures become excessive in the early days after placement.
The brief descriptions provided above on ASR and DEF are expanded in the various theses to date, as well as in later chapters of this report. Although the definitions of the two forms of distress were presented separately, it should be acknowledged that these forms of distress often coincide in actual structures. The most common interplay between the two is that ASR occurs first, dropping the pore solution pH (as the alkalies enter the gel), thereby triggering the aluminates and sulfates to be released from C-S-H, leading to delayed formation of ettringite and subsequent expansion and cracking. These two distress mechanisms, ASR and DEF, were
∗ In cement chemistry notation, where C = CaO, S = SiO2, Š = SO3, A = Al2O3, and H = H2O.
3
evaluated throughout this project, either as sole causes of distress or in combination with one another. Through these investigations, valuable information on mechanisms, test methods, and preventive options was gained.
1.2 Project ObjectivesThe main objectives and goals of this project are summarized as follows:
• Understand the underlying mechanisms behind ASR and/or DEF
• Review available test methods for aggregate reactivity and preventive measures and recommend test method(s) to prevent ASR and/or DEF in new concrete
• Develop specifications and guidelines to prevent ASR and/or DEF in new concrete
• Identify and implement strategies for preventing ASR and/or DEF, with emphasis on prudent use of supplementary cementing materials (SCMs)
• Develop protocol for evaluating the cause, extent, and future potential for damage due to ASR and/or DEF in existing concrete structures
• Transfer knowledge and experience gained from this project to TxDOT practice to increase the service life of transportation structures
1.3 Research Team To meet the above objectives, a comprehensive laboratory- and field-based investigation
was initiated. The research team consisted of researchers from the CDC, with Dr. Kevin Folliard serving as the principal investigator, and relied significantly on the technical input from Dr. Michael D. A. Thomas at the University of New Brunswick. Dr. Maria Juenger from the CDC was an important contributor to this project and co-supervised several of the graduate student researchers. The graduate students listed in Section 1.1 were joined by several other graduate students, including Ryan Barborak, who focused primarily on lithium compounds, and a range of undergraduate student researchers. The technical and administrative staff at the CDC also played instrumental roles in this research project. The research team was complemented by the expertise and input of several TxDOT engineers and project panel members, especially Dr. Moon Won and Dr. Joe Roche, who served as project directors.
1.4 Outline of Remainder of Report The remainder of this final project report is organized in the following fashion:
Chapter 2—Materials Used in Research Project Chapter 3—ASTM C 1260 (The Accelerated Mortar Bar Test) Chapter 4—ASTM C 1293 (The Concrete Prism Test) Chapter 5—Outdoor Exposure Site Chapter 6—Lithium Compounds for Preventing or Mitigating ASR Chapter 7—Delayed Ettringite Formation Chapter 8—Showcase Bridge Chapter 9—A Case Study in Premature Concrete Deterioration: The San Antonio “Y” Chapter 10—Conclusions References

4
5
2. Materials Used in Research Project
2.1 Summary of Testing Materials This chapter describes the materials that have been used throughout this research project.
All pertinent aggregates, cements, and admixtures have been included. All material properties are based on mill certificates, manufacturer’s data sheets, or analytical testing (in-house or subcontracted).
Initial materials used in this investigation include seventeen different aggregates, two cements, two fly ashes, silica fume, metakaolin, ultra-fine fly ash, and grade 120 ground granulated blast-furnace slag. Beyond this initial catalog of aggregates, additional aggregates were procured during summer 2002. The mineralogy and contents of these materials are presented in this section. To be consistent with other reports and theses regarding this project, the materials are presented using previously established, generic designations.
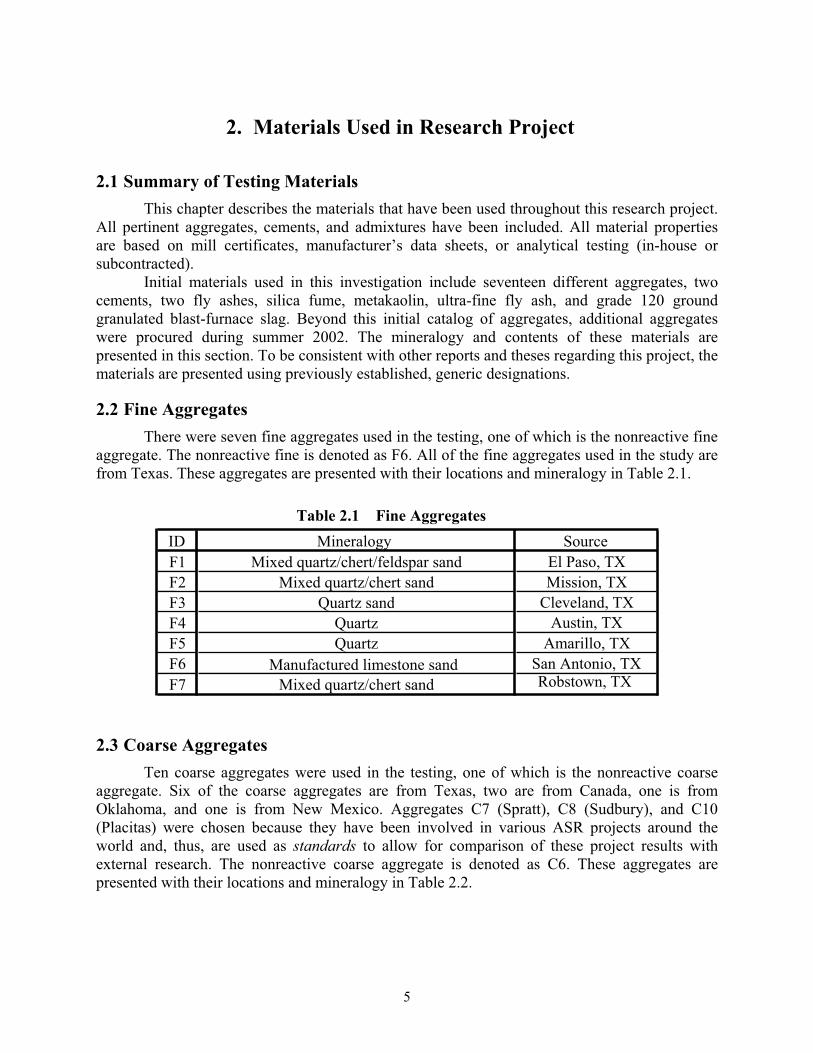
2.2 Fine Aggregates There were seven fine aggregates used in the testing, one of which is the nonreactive fine
aggregate. The nonreactive fine is denoted as F6. All of the fine aggregates used in the study are from Texas. These aggregates are presented with their locations and mineralogy in Table 2.1.
Table 2.1 Fine Aggregates
2.3 Coarse Aggregates Ten coarse aggregates were used in the testing, one of which is the nonreactive coarse
aggregate. Six of the coarse aggregates are from Texas, two are from Canada, one is from Oklahoma, and one is from New Mexico. Aggregates C7 (Spratt), C8 (Sudbury), and C10 (Placitas) were chosen because they have been involved in various ASR projects around the world and, thus, are used as standards to allow for comparison of these project results with external research. The nonreactive coarse aggregate is denoted as C6. These aggregates are presented with their locations and mineralogy in Table 2.2.
ID Mineralogy SourceF1 Mixed quartz/chert/feldspar sand El Paso, TXF2 Mixed quartz/chert sand Mission, TX F3 Quartz sand Cleveland, TXF4 Quartz Austin, TX F5 Quartz Amarillo, TX F6 Manufactured limestone sand San Antonio, TX F7 Mixed quartz/chert sand Robstown, TX
6
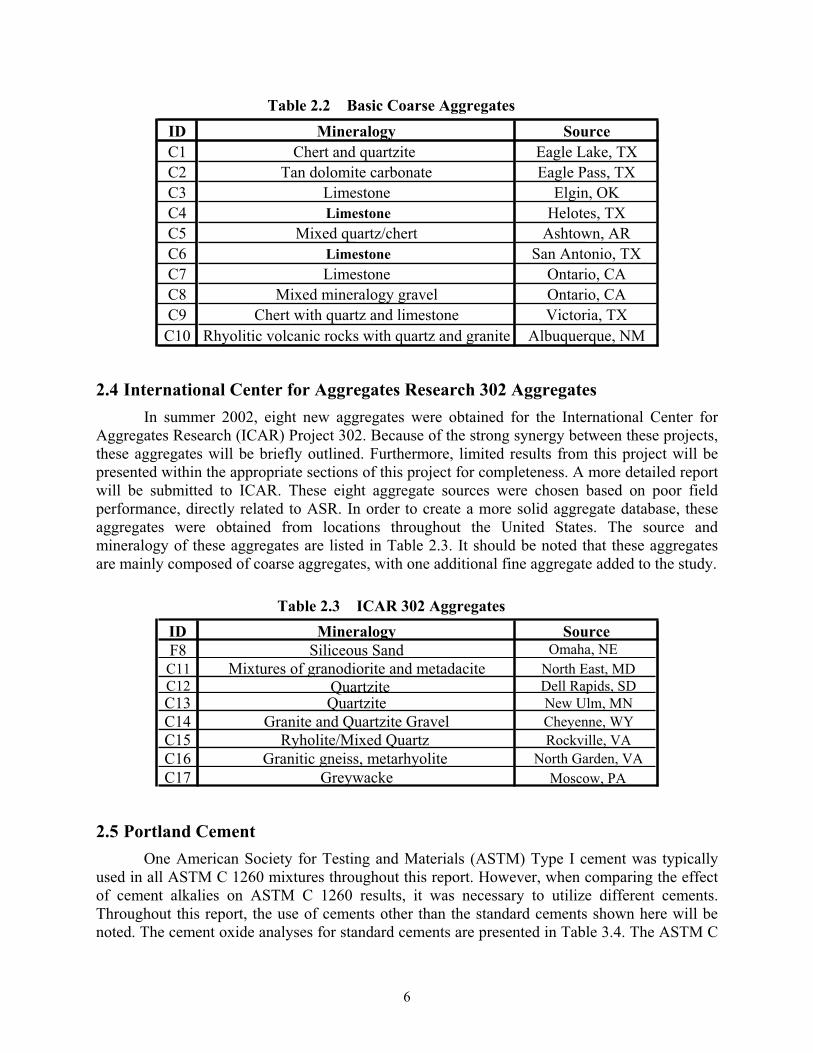
Table 2.2 Basic Coarse Aggregates
2.4 International Center for Aggregates Research 302 Aggregates In summer 2002, eight new aggregates were obtained for the International Center for
Aggregates Research (ICAR) Project 302. Because of the strong synergy between these projects, these aggregates will be briefly outlined. Furthermore, limited results from this project will be presented within the appropriate sections of this project for completeness. A more detailed report will be submitted to ICAR. These eight aggregate sources were chosen based on poor field performance, directly related to ASR. In order to create a more solid aggregate database, these aggregates were obtained from locations throughout the United States. The source and mineralogy of these aggregates are listed in Table 2.3. It should be noted that these aggregates are mainly composed of coarse aggregates, with one additional fine aggregate added to the study.
Table 2.3 ICAR 302 Aggregates
2.5 Portland Cement One American Society for Testing and Materials (ASTM) Type I cement was typically
used in all ASTM C 1260 mixtures throughout this report. However, when comparing the effect of cement alkalies on ASTM C 1260 results, it was necessary to utilize different cements. Throughout this report, the use of cements other than the standard cements shown here will be noted. The cement oxide analyses for standard cements are presented in Table 3.4. The ASTM C
ID Mineralogy SourceC1 Chert and quartzite Eagle Lake, TX C2 Tan dolomite carbonate Eagle Pass, TX C3 Limestone Elgin, OK C4 Limestone Helotes, TX C5 Mixed quartz/chert Ashtown, AR C6 Limestone San Antonio, TX C7 Limestone Ontario, CA C8 Mixed mineralogy gravel Ontario, CA C9 Chert with quartz and limestone Victoria, TX
C10 Rhyolitic volcanic rocks with quartz and granite Albuquerque, NM
ID Mineralogy SourceF8 Siliceous Sand Omaha, NE C11 Mixtures of granodiorite and metadacite North East, MDC12 Quartzite Dell Rapids, SDC13 Quartzite New Ulm, MNC14 Granite and Quartzite Gravel Cheyenne, WYC15 Ryholite/Mixed Quartz Rockville, VAC16 Granitic gneiss, metarhyolite North Garden, VAC17 Greywacke Moscow, PA
7
1260 specification states that any cement to be used in the test must pass the 850 μm (No. 20) sieve to remove any clumps before use. Therefore, all cements were sieved prior to use in ASTM C 1260 testing.
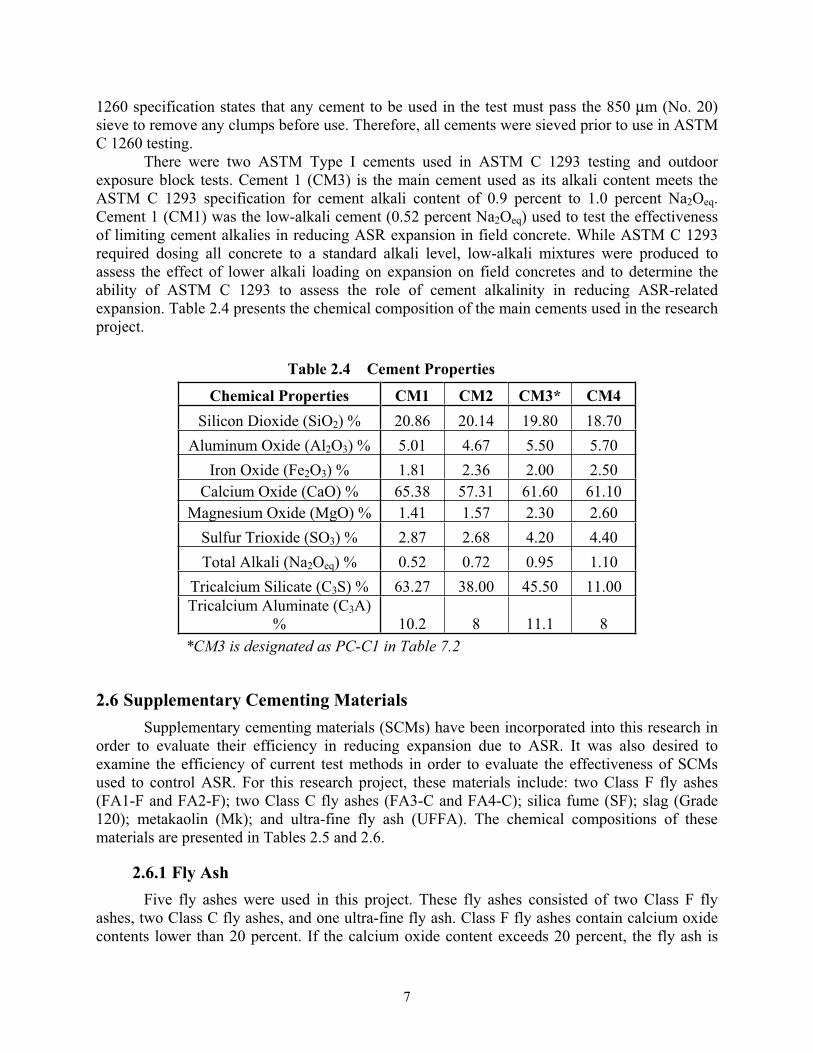
There were two ASTM Type I cements used in ASTM C 1293 testing and outdoor exposure block tests. Cement 1 (CM3) is the main cement used as its alkali content meets the ASTM C 1293 specification for cement alkali content of 0.9 percent to 1.0 percent Na2Oeq.Cement 1 (CM1) was the low-alkali cement (0.52 percent Na2Oeq) used to test the effectiveness of limiting cement alkalies in reducing ASR expansion in field concrete. While ASTM C 1293 required dosing all concrete to a standard alkali level, low-alkali mixtures were produced to assess the effect of lower alkali loading on expansion on field concretes and to determine the ability of ASTM C 1293 to assess the role of cement alkalinity in reducing ASR-related expansion. Table 2.4 presents the chemical composition of the main cements used in the research project.
Table 2.4 Cement Properties
Chemical Properties CM1 CM2 CM3* CM4 Silicon Dioxide (SiO2) % 20.86 20.14 19.80 18.70
Aluminum Oxide (Al2O3) % 5.01 4.67 5.50 5.70 Iron Oxide (Fe2O3) % 1.81 2.36 2.00 2.50
Calcium Oxide (CaO) % 65.38 57.31 61.60 61.10 Magnesium Oxide (MgO) % 1.41 1.57 2.30 2.60
Sulfur Trioxide (SO3) % 2.87 2.68 4.20 4.40 Total Alkali (Na2Oeq) % 0.52 0.72 0.95 1.10
Tricalcium Silicate (C3S) % 63.27 38.00 45.50 11.00 Tricalcium Aluminate (C3A)
% 10.2 8 11.1 8 *CM3 is designated as PC-C1 in Table 7.2
2.6 Supplementary Cementing MaterialsSupplementary cementing materials (SCMs) have been incorporated into this research in
order to evaluate their efficiency in reducing expansion due to ASR. It was also desired to examine the efficiency of current test methods in order to evaluate the effectiveness of SCMs used to control ASR. For this research project, these materials include: two Class F fly ashes (FA1-F and FA2-F); two Class C fly ashes (FA3-C and FA4-C); silica fume (SF); slag (Grade 120); metakaolin (Mk); and ultra-fine fly ash (UFFA). The chemical compositions of these materials are presented in Tables 2.5 and 2.6.
2.6.1 Fly Ash Five fly ashes were used in this project. These fly ashes consisted of two Class F fly
ashes, two Class C fly ashes, and one ultra-fine fly ash. Class F fly ashes contain calcium oxide contents lower than 20 percent. If the calcium oxide content exceeds 20 percent, the fly ash is
8
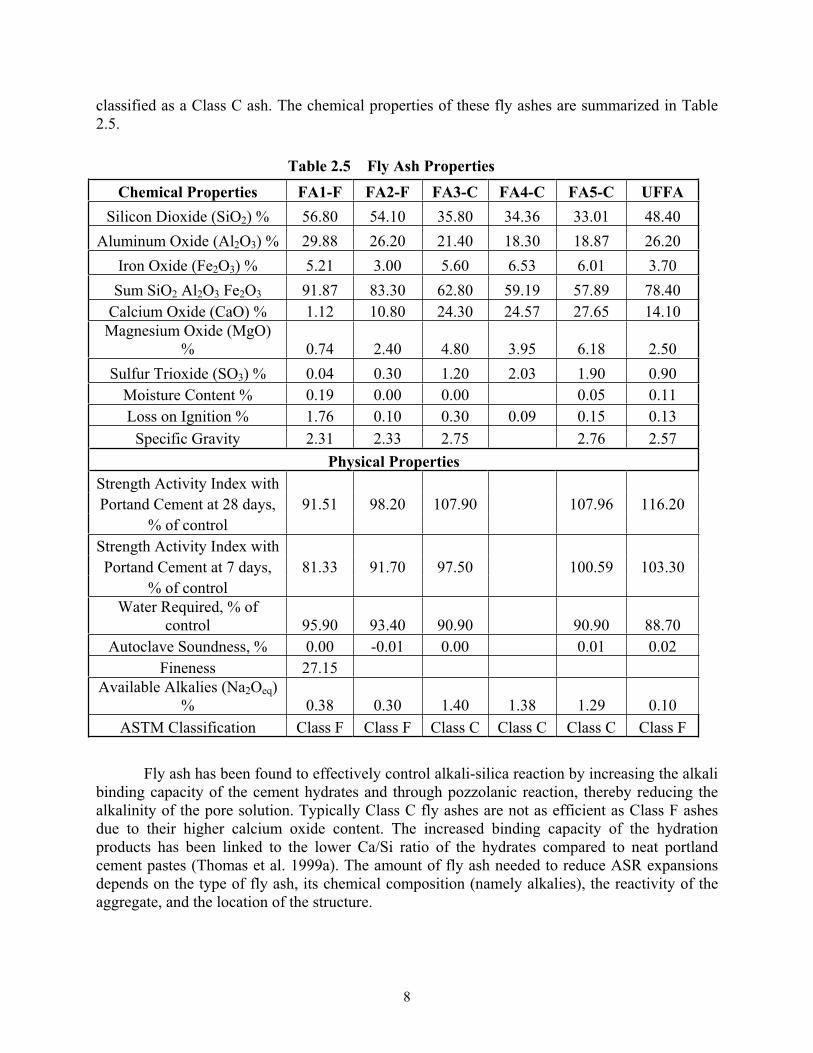
classified as a Class C ash. The chemical properties of these fly ashes are summarized in Table 2.5.
Table 2.5 Fly Ash Properties Chemical Properties FA1-F FA2-F FA3-C FA4-C FA5-C UFFA
Silicon Dioxide (SiO2) % 56.80 54.10 35.80 34.36 33.01 48.40 Aluminum Oxide (Al2O3) % 29.88 26.20 21.40 18.30 18.87 26.20
Iron Oxide (Fe2O3) % 5.21 3.00 5.60 6.53 6.01 3.70 Sum SiO2 Al2O3 Fe2O3 91.87 83.30 62.80 59.19 57.89 78.40
Calcium Oxide (CaO) % 1.12 10.80 24.30 24.57 27.65 14.10 Magnesium Oxide (MgO)
% 0.74 2.40 4.80 3.95 6.18 2.50 Sulfur Trioxide (SO3) % 0.04 0.30 1.20 2.03 1.90 0.90
Moisture Content % 0.19 0.00 0.00 0.05 0.11 Loss on Ignition % 1.76 0.10 0.30 0.09 0.15 0.13
Specific Gravity 2.31 2.33 2.75 2.76 2.57 Physical Properties
Strength Activity Index with Portand Cement at 28 days, 91.51 98.20 107.90 107.96 116.20
% of control Strength Activity Index with Portand Cement at 7 days, 81.33 91.70 97.50 100.59 103.30
% of control Water Required, % of
control 95.90 93.40 90.90 90.90 88.70 Autoclave Soundness, % 0.00 -0.01 0.00 0.01 0.02
Fineness 27.15 Available Alkalies (Na2Oeq)
% 0.38 0.30 1.40 1.38 1.29 0.10 ASTM Classification Class F Class F Class C Class C Class C Class F
Fly ash has been found to effectively control alkali-silica reaction by increasing the alkali binding capacity of the cement hydrates and through pozzolanic reaction, thereby reducing the alkalinity of the pore solution. Typically Class C fly ashes are not as efficient as Class F ashes due to their higher calcium oxide content. The increased binding capacity of the hydration products has been linked to the lower Ca/Si ratio of the hydrates compared to neat portland cement pastes (Thomas et al. 1999a). The amount of fly ash needed to reduce ASR expansions depends on the type of fly ash, its chemical composition (namely alkalies), the reactivity of the aggregate, and the location of the structure.
9
2.6.2 SlagA single Grade 120 slag was used in this study, as described in Table 2.6. Slag is
effective in limiting expansion from ASR. This minimum level is a function of the aggregate reactivity and the alkali level in the concrete. Slag is able to reduce ASR expansion by creating a reduction of ionic mobility and water permeability in concrete (Thomas and Innis 1998). Slag contents (by mass replacement of portland cement) of 35 to 50 percent are typical for cases in which ASR controls are required.
2.6.3 Silica Fume The chemical composition of the silica fume used in this study is shown in Table 2.6. A
superplasticizer was used in all mixtures containing silica fume to ensure adequate dispersion of the silica fume particles. Silica fume can help reduce expansion caused by ASR through several methods (Thomas 1996):
• Reducing the pore solution alkalinity
• Reducing ionic diffusion and water permeability
• Consuming Ca(OH)2
• Improving Ca(OH)2 distribution in the interfacial transition zone
Silica fume, a by-product of the ferro-silicon metal industry, is often used as a replacement for cement to control the adverse affects of ASR. Silica fume decreases the permeability of concrete, thereby reducing the mobility of ions in the pore solution, which may lead to a reduction in ASR. It is commonly accepted that silica fume reacts pozzolanically. Silica (SiO2) reacts with calcium hydroxide [Ca(OH2)] to form calcium silica hydrate (CaOSiO2H2O).It has been purported that calcium silica hydrate (C-S-H) formed through this reaction has a low CaO/SiO2 (C/S) ratio. Calcium hydroxide (CH) is reduced and the low C/S ratio allows the binding of alkalies. This reduces the amount of hydroxyl ions available to participate in an alkali-silica reaction (Duchesne and Bérubé 1994).
2.6.4 MetakaolinMetakaolin is derived from one of the most ubiquitous clay minerals, kaolin. It is used, in
limited application, as a pozzolanic addition to portland cement concrete. Incorporation of metakaolin into portland cement concrete provides many improvements in concrete performance and durability. Metakaolin has been shown to increase strength, reduce permeability (greater resistance to chloride ion ingress), improve corrosion resistance for rebar, and increase resistance to ASR and sulfate attack. It is generally accepted that the reaction between metakaolin and calcium hydroxide (CH) is a significant factor in its improvement to portland cement concrete (Barnes and Bensted 2002). Properties of the metakaolin used for this project are found in Table 2.6.
10
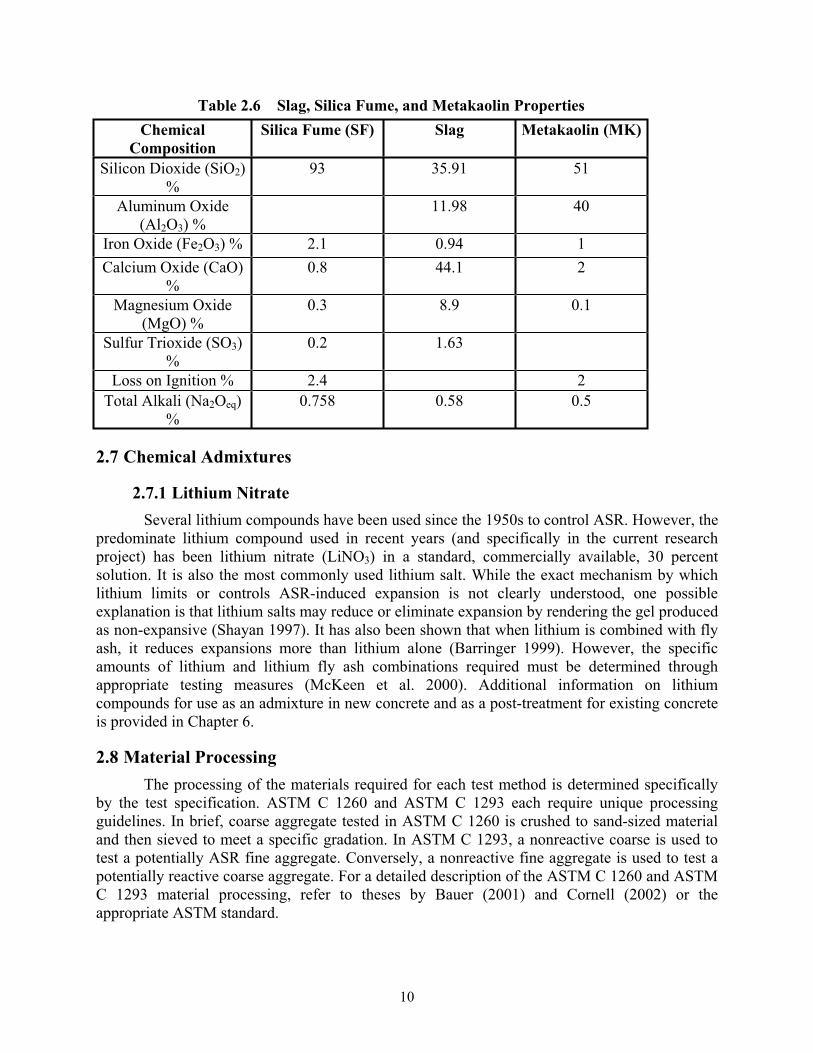
Table 2.6 Slag, Silica Fume, and Metakaolin Properties Chemical
Composition Silica Fume (SF) Slag Metakaolin (MK)
Silicon Dioxide (SiO2)%
93 35.91 51
Aluminum Oxide (Al2O3) %
11.98 40
Iron Oxide (Fe2O3) % 2.1 0.94 1 Calcium Oxide (CaO)
%0.8 44.1 2
Magnesium Oxide (MgO) %
0.3 8.9 0.1
Sulfur Trioxide (SO3)%
0.2 1.63
Loss on Ignition % 2.4 2 Total Alkali (Na2Oeq)
%0.758 0.58 0.5
2.7 Chemical Admixtures
2.7.1 Lithium Nitrate Several lithium compounds have been used since the 1950s to control ASR. However, the
predominate lithium compound used in recent years (and specifically in the current research project) has been lithium nitrate (LiNO3) in a standard, commercially available, 30 percent solution. It is also the most commonly used lithium salt. While the exact mechanism by which lithium limits or controls ASR-induced expansion is not clearly understood, one possible explanation is that lithium salts may reduce or eliminate expansion by rendering the gel produced as non-expansive (Shayan 1997). It has also been shown that when lithium is combined with fly ash, it reduces expansions more than lithium alone (Barringer 1999). However, the specific amounts of lithium and lithium fly ash combinations required must be determined through appropriate testing measures (McKeen et al. 2000). Additional information on lithium compounds for use as an admixture in new concrete and as a post-treatment for existing concrete is provided in Chapter 6.
2.8 Material Processing The processing of the materials required for each test method is determined specifically
by the test specification. ASTM C 1260 and ASTM C 1293 each require unique processing guidelines. In brief, coarse aggregate tested in ASTM C 1260 is crushed to sand-sized material and then sieved to meet a specific gradation. In ASTM C 1293, a nonreactive coarse is used to test a potentially ASR fine aggregate. Conversely, a nonreactive fine aggregate is used to test a potentially reactive coarse aggregate. For a detailed description of the ASTM C 1260 and ASTM C 1293 material processing, refer to theses by Bauer (2001) and Cornell (2002) or the appropriate ASTM standard.
11
3. American Society for Testing and Materials C 1260: The Accelerated Mortar Bar Test
3.1 IntroductionThe accelerated mortar bar test (AMBT), American Society for Testing and Materials
(ASTM) C 1260, is based on the method developed by Oberholster and Davies (1986) at the National Building Research Institute in South Africa. Mortar bars are cast containing the subject aggregate, which is processed to a standard gradation, removed from the molds after 24 hours, and placed in water at 80 °C for the next 24 hours. After removal from the water bath, the bars are measured for initial length and then stored in a 1N NaOH solution for 14 days. Length change measurements are made periodically during this storage period, but only the total expansion at the end of the 14-day soaking period is typically used in specifications.
Because of the extreme nature of this test (e.g., highly alkaline soak solution and high temperature), the test is quite severe and may identify some aggregates as being reactive, even though they have performed well in concrete prism testing, which will be discussed further in this report, and in field applications. Thus, aggregates should not be rejected solely based on American Association of State Highway and Transportation Officials (AASHTO) T 303 results unless petrographic examination (ASTM C 295) confirms that the material is similar to known deleteriously reactive aggregates (ACI 1998).
Recently, ASTM has adopted a version of the mortar bar test for assessing the efficacy of supplementary cementing materials (SCMs) in preventing ASR-induced expansion. This test, ASTM C 1567, is similar in nature to ASTM C 1260, with the exception that the SCM of interest is used in lieu of a portion of the portland cement. It is anticipated, based on recent ASTM deliberations, that the expansion limit for this test will also be a 14-day value of 0.10 percent.
Significant emphasis was placed on evaluating ASTM C 1260 (and various modifications thereof) throughout the course of this project. A major reason for this concentrated effort is that the Texas Department of Transportation (TxDOT) has specified the use of a test similar to ASTM C 1260 for the past several years under Special Provision to Item 421. The differences between ASTM C 1260 and the TxDOT version are described later in this chapter. For most of the mixtures tested under this project, the standard ASTM C 1260 was used as it is a more widely recognized test. There were some tests conducted that specifically followed the TxDOT testing protocol, as described later. It should be noted that one output of TxDOT 0-4085 was recommending to TxDOT that the standard ASTM C 1260 test for aggregate reactivity be followed; this recommendation was adopted in 2004, and the standard ASTM C 1260 test is now specified.
The remainder of this chapter is organized as follows:
• Section 3.2 describes the ASTM C 1260 testing procedure. It also briefly highlights the differences between this standard test and the TxDOT-specified method.
• Section 3.3 presents the results of ASTM C 1260 for all aggregates included in TxDOT 0-4085, as well as those tested under ICAR 302.
12
• Section 3.4 explores the effects of temperature of bar storage on expansion. Various temperatures were evaluated, with the standard 176° F temperature being the highest.
• Section 3.5 explores the effects of soak solution normality.
• Section 3.6 presents results of testing SCMs using an ASTM C 1260 testing regime (note: ASTM C 1260 testing using lithium nitrate is presented separately in Chapter 6).
• Section 3.7 focuses specifically on the impact of cement alkalinity on the expansion of mixtures containing SCMs. This specific issue was found to be quite important with regard to the TxDOT version of ASTM C 1260.
• Section 3.8 presents the ASTM C 1260 data for the showcase bridge design mixtures.
• Section 3.9 concludes this chapter and summarizes briefly the key findings of testing using the accelerated mortar bar test (and its variations).
3.2 Standard American Society for Testing and Materials C 1260 Testing Procedures
The ASTM C 1260 standard test method involves processing aggregate followed by testing of mortar bars. Aggregate processing is done according to the following guidelines:
• The aggregate is dried in an oven for 24 hours in order to remove any existing moisture.
• Coarse aggregates are crushed to achieve a particle size distribution identical to that of fine aggregates.
• Both fine and crushed coarse aggregates are sieved using a sieving machine. The aggregate particles are separated by means of five standard sieve sizes: #8, #16, #30, #50, and #100.
• The aggregates retained on each of those five sieve sizes are then washed in order to remove any smaller particles present on their surfaces.
• After this, the washed aggregates are placed again in the oven to dry completely.
• The #8, #16, #30, #50, and #100 aggregates are stored in small containers to be available for future testing as needed.
Testing is performed in accordance to the following procedures:
• Mortar bars are mixed following closely the specifications of ASTM C 305.
• Once the mortar is placed in the molds, the molds are covered and taken to a moist-curing room at 73° F where the mortar bars are allowed to hydrate for 24 hours.
• After this time, the mortar bars are demolded and properly identified. Initial readings are taken on these bars using a length comparator such as the one shown in Figure 3.1.Following this, the bars are stored in water in a sealed container at 176o F.
13
• Twenty-four hours later, the mortar bars are pulled from the oven, and the 0-day readings are taken. The bars are then stored in a NaOH 1N solution at (176o F).
• Successive readings are then taken at 5, 8, 12, and 14 days.
Once the 14-day data are available, expansions can be readily calculated as a percentage of the 0-day length. There are various approaches to interpreting the 14-day expansion data. ASTM C 1260 identifies expansion of:
• < 0.1% as nonreactive
• 0.1% to 0.2% as potentially reactive
• 0.2% as reactive
Recent deliberations within an ASTM task group (led by Dr. Michael Thomas) on ASR test limits and expansion criteria have yielded a consensus 14-day expansion limit of 0.10 percent for testing SCMs. For comparison, the Canadian Standards Association (CSA) specifies an expansion limit of 0.15 percent for all aggregates, except limestone aggregates, which have a limit of 0.10 percent (Fournier et al. 1999).
As described above, ASTM C 1260 is intended primarily to test the potential reactivity of aggregates, although researchers and practitioners have used a similar testing regime to test SCMs and lithium. Special Provision to Item 421 under TxDOT specifications allowed for the use of a modified version of ASTM C 1260 to essentially test a job mixture. That is, the TxDOT version required that the actual cement (and SCM, if applicable) be tested with both the job coarse and fine aggregates (each graded to the ASTM C 1260 and combined volumetrically). This modified version is somewhat ambitious and attempts to extend the abilities of ASTM C 1260 beyond its original intention. When one attempts to stretch ASTM C 1260 beyond its capabilities, side effects may become evident, such as pessimum effects or cement/fly ash interactions. Some of the research performed under this project investigated some of these possible issues associated with job mix testing using the ASTM C 1260 testing regime.
3.3 American Society for Testing and Materials C 1260 Results—Fine and Coarse Aggregates
This section presents ASTM C 1260 data on all aggregates included in TxDOT 0-4085, followed by the aggregates studied under ICAR 302. Twenty aggregates (ten fine and ten coarse) were initially selected for TxDOT 0-4085 and are mainly from Texas; however, one is from New Mexico and two are from Canada. The two Canadian aggregates have been tested extensively by many researchers and are included to provide comparison with previously reported ASR expansion data. The use of these internal standards will provide for more widespread applicability of the project findings.
This section summarizes the ASTM C 1260 results for all fine and coarse aggregates tested under TxDOT 0-4085 and ICAR 302. For brevity, only the final expansion values at 14 days are presented. More detailed information can be found in Bauer (2001) and Pugh (2003).
Depending on the level of expansion observed in a given test, the mortar bar samples may show anywhere from no distress or cracking to major cracking. Significant cracking was particularly observed to occur when expansion values exceed 0.30 percent (Bauer 2001). Figure 3.1 shows two mortar bars, each made of an expansive aggregate. The top bar is made of a
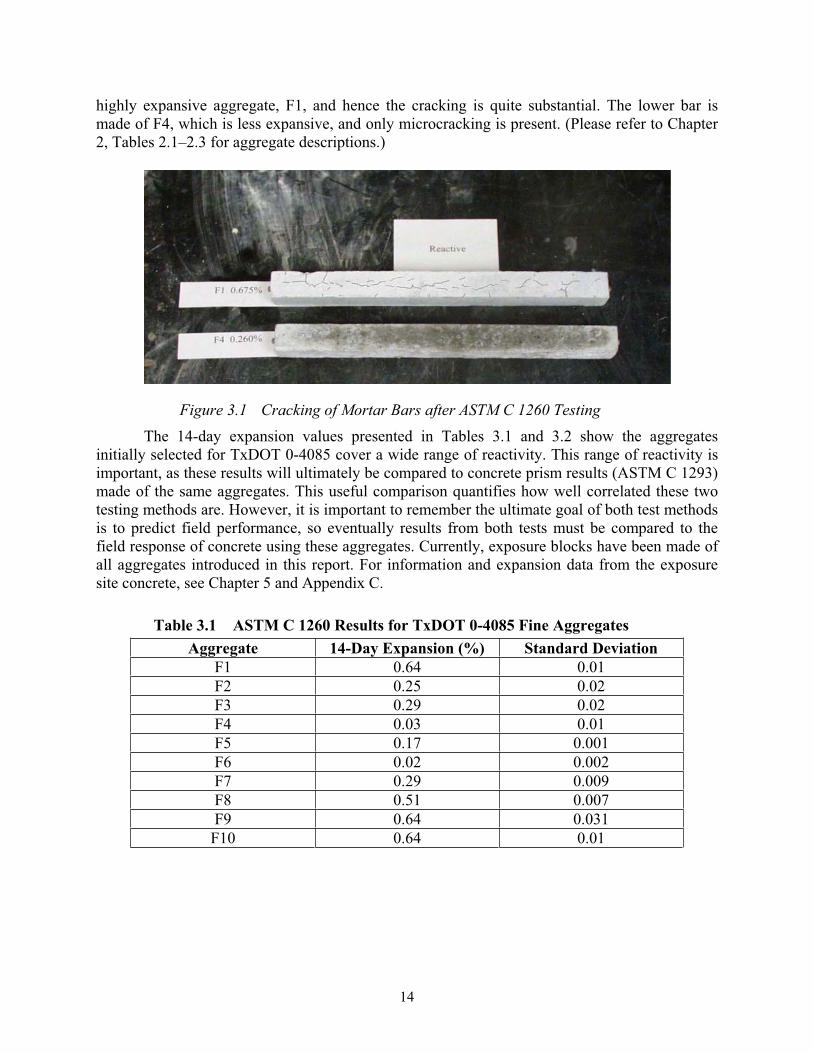
14
highly expansive aggregate, F1, and hence the cracking is quite substantial. The lower bar is made of F4, which is less expansive, and only microcracking is present. (Please refer to Chapter 2, Tables 2.1–2.3 for aggregate descriptions.)
Figure 3.1 Cracking of Mortar Bars after ASTM C 1260 Testing The 14-day expansion values presented in Tables 3.1 and 3.2 show the aggregates
initially selected for TxDOT 0-4085 cover a wide range of reactivity. This range of reactivity is important, as these results will ultimately be compared to concrete prism results (ASTM C 1293) made of the same aggregates. This useful comparison quantifies how well correlated these two testing methods are. However, it is important to remember the ultimate goal of both test methods is to predict field performance, so eventually results from both tests must be compared to the field response of concrete using these aggregates. Currently, exposure blocks have been made of all aggregates introduced in this report. For information and expansion data from the exposure site concrete, see Chapter 5 and Appendix C.
Table 3.1 ASTM C 1260 Results for TxDOT 0-4085 Fine Aggregates Aggregate 14-Day Expansion (%) Standard Deviation
F1 0.64 0.01 F2 0.25 0.02 F3 0.29 0.02 F4 0.03 0.01 F5 0.17 0.001 F6 0.02 0.002 F7 0.29 0.009 F8 0.51 0.007 F9 0.64 0.031
F10 0.64 0.01
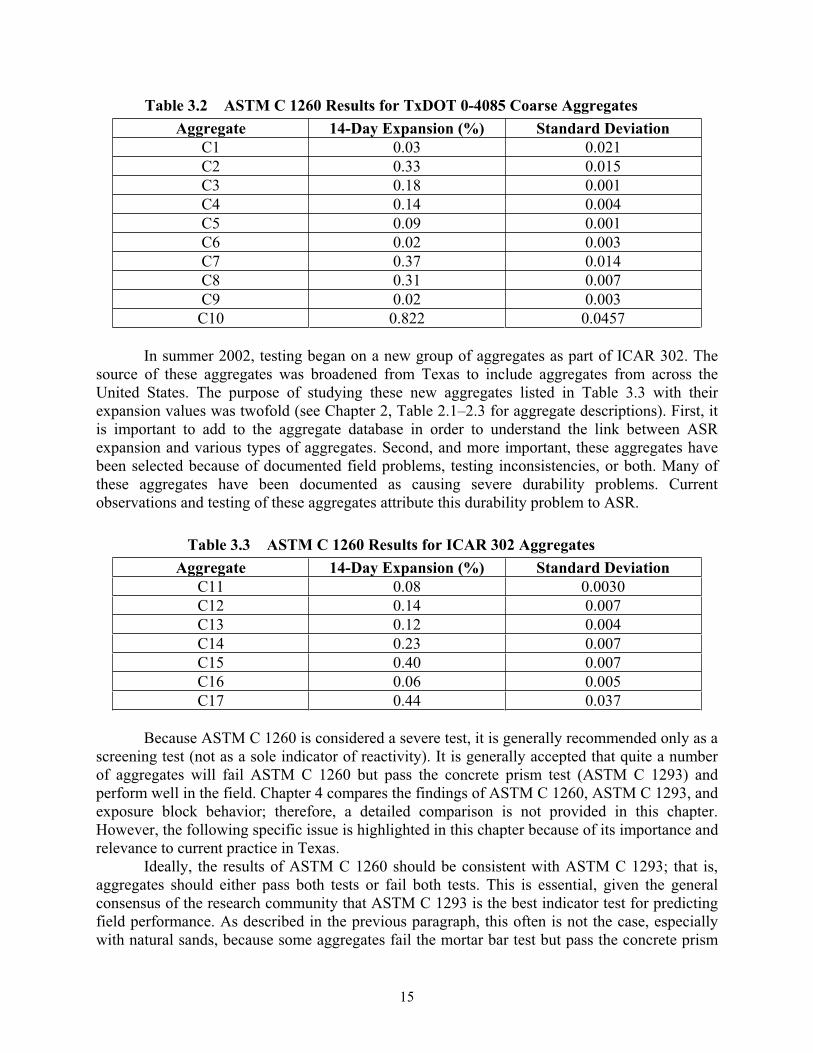
15
Table 3.2 ASTM C 1260 Results for TxDOT 0-4085 Coarse Aggregates Aggregate 14-Day Expansion (%) Standard Deviation
C1 0.03 0.021 C2 0.33 0.015 C3 0.18 0.001 C4 0.14 0.004 C5 0.09 0.001 C6 0.02 0.003 C7 0.37 0.014 C8 0.31 0.007 C9 0.02 0.003 C10 0.822 0.0457
In summer 2002, testing began on a new group of aggregates as part of ICAR 302. The source of these aggregates was broadened from Texas to include aggregates from across the United States. The purpose of studying these new aggregates listed in Table 3.3 with their expansion values was twofold (see Chapter 2, Table 2.1–2.3 for aggregate descriptions). First, it is important to add to the aggregate database in order to understand the link between ASR expansion and various types of aggregates. Second, and more important, these aggregates have been selected because of documented field problems, testing inconsistencies, or both. Many of these aggregates have been documented as causing severe durability problems. Current observations and testing of these aggregates attribute this durability problem to ASR.
Table 3.3 ASTM C 1260 Results for ICAR 302 Aggregates Aggregate 14-Day Expansion (%) Standard Deviation
C11 0.08 0.0030 C12 0.14 0.007 C13 0.12 0.004 C14 0.23 0.007 C15 0.40 0.007 C16 0.06 0.005 C17 0.44 0.037
Because ASTM C 1260 is considered a severe test, it is generally recommended only as a screening test (not as a sole indicator of reactivity). It is generally accepted that quite a number of aggregates will fail ASTM C 1260 but pass the concrete prism test (ASTM C 1293) and perform well in the field. Chapter 4 compares the findings of ASTM C 1260, ASTM C 1293, and exposure block behavior; therefore, a detailed comparison is not provided in this chapter. However, the following specific issue is highlighted in this chapter because of its importance and relevance to current practice in Texas.
Ideally, the results of ASTM C 1260 should be consistent with ASTM C 1293; that is, aggregates should either pass both tests or fail both tests. This is essential, given the general consensus of the research community that ASTM C 1293 is the best indicator test for predicting field performance. As described in the previous paragraph, this often is not the case, especially with natural sands, because some aggregates fail the mortar bar test but pass the concrete prism
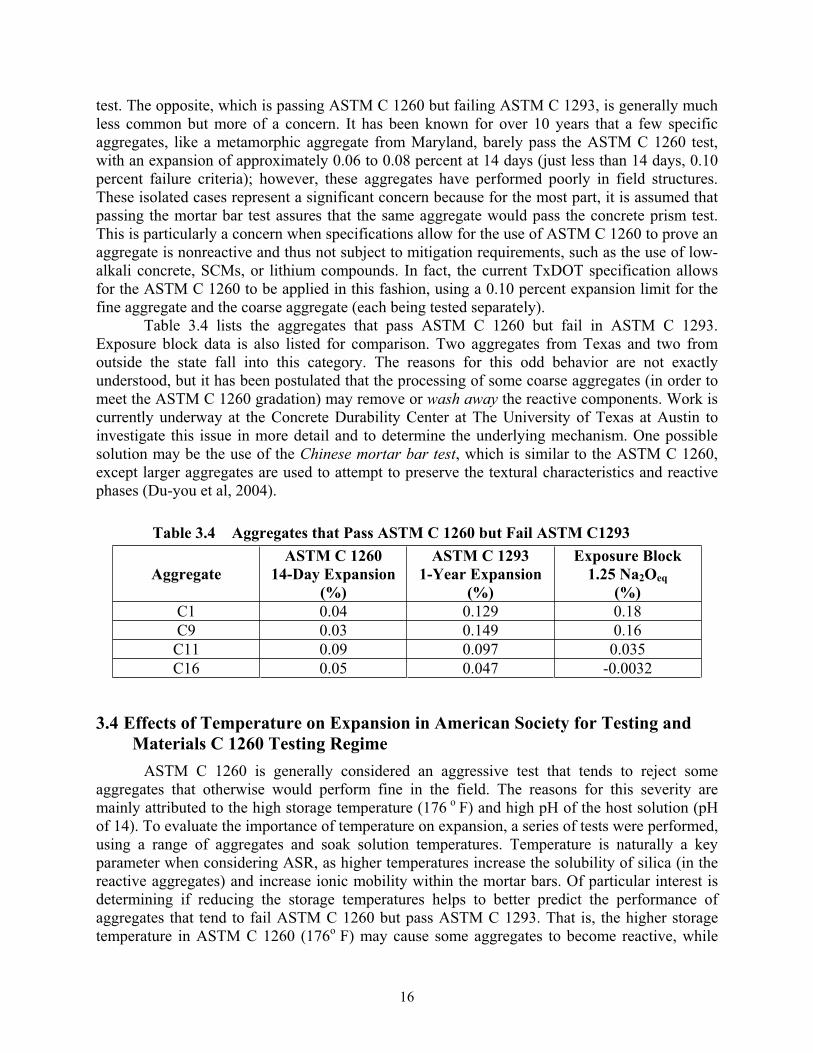
16
test. The opposite, which is passing ASTM C 1260 but failing ASTM C 1293, is generally much less common but more of a concern. It has been known for over 10 years that a few specific aggregates, like a metamorphic aggregate from Maryland, barely pass the ASTM C 1260 test, with an expansion of approximately 0.06 to 0.08 percent at 14 days (just less than 14 days, 0.10 percent failure criteria); however, these aggregates have performed poorly in field structures. These isolated cases represent a significant concern because for the most part, it is assumed that passing the mortar bar test assures that the same aggregate would pass the concrete prism test. This is particularly a concern when specifications allow for the use of ASTM C 1260 to prove an aggregate is nonreactive and thus not subject to mitigation requirements, such as the use of low-alkali concrete, SCMs, or lithium compounds. In fact, the current TxDOT specification allows for the ASTM C 1260 to be applied in this fashion, using a 0.10 percent expansion limit for the fine aggregate and the coarse aggregate (each being tested separately).
Table 3.4 lists the aggregates that pass ASTM C 1260 but fail in ASTM C 1293. Exposure block data is also listed for comparison. Two aggregates from Texas and two from outside the state fall into this category. The reasons for this odd behavior are not exactly understood, but it has been postulated that the processing of some coarse aggregates (in order to meet the ASTM C 1260 gradation) may remove or wash away the reactive components. Work is currently underway at the Concrete Durability Center at The University of Texas at Austin to investigate this issue in more detail and to determine the underlying mechanism. One possible solution may be the use of the Chinese mortar bar test, which is similar to the ASTM C 1260, except larger aggregates are used to attempt to preserve the textural characteristics and reactive phases (Du-you et al, 2004).
Table 3.4 Aggregates that Pass ASTM C 1260 but Fail ASTM C1293
AggregateASTM C 1260
14-Day Expansion (%)
ASTM C 1293 1-Year Expansion
(%)
Exposure Block 1.25 Na2Oeq
(%) C1 0.04 0.129 0.18 C9 0.03 0.149 0.16
C11 0.09 0.097 0.035 C16 0.05 0.047 -0.0032
3.4 Effects of Temperature on Expansion in American Society for Testing and Materials C 1260 Testing Regime
ASTM C 1260 is generally considered an aggressive test that tends to reject some aggregates that otherwise would perform fine in the field. The reasons for this severity are mainly attributed to the high storage temperature (176 o F) and high pH of the host solution (pH of 14). To evaluate the importance of temperature on expansion, a series of tests were performed, using a range of aggregates and soak solution temperatures. Temperature is naturally a key parameter when considering ASR, as higher temperatures increase the solubility of silica (in the reactive aggregates) and increase ionic mobility within the mortar bars. Of particular interest is determining if reducing the storage temperatures helps to better predict the performance of aggregates that tend to fail ASTM C 1260 but pass ASTM C 1293. That is, the higher storage temperature in ASTM C 1260 (176o F) may cause some aggregates to become reactive, while
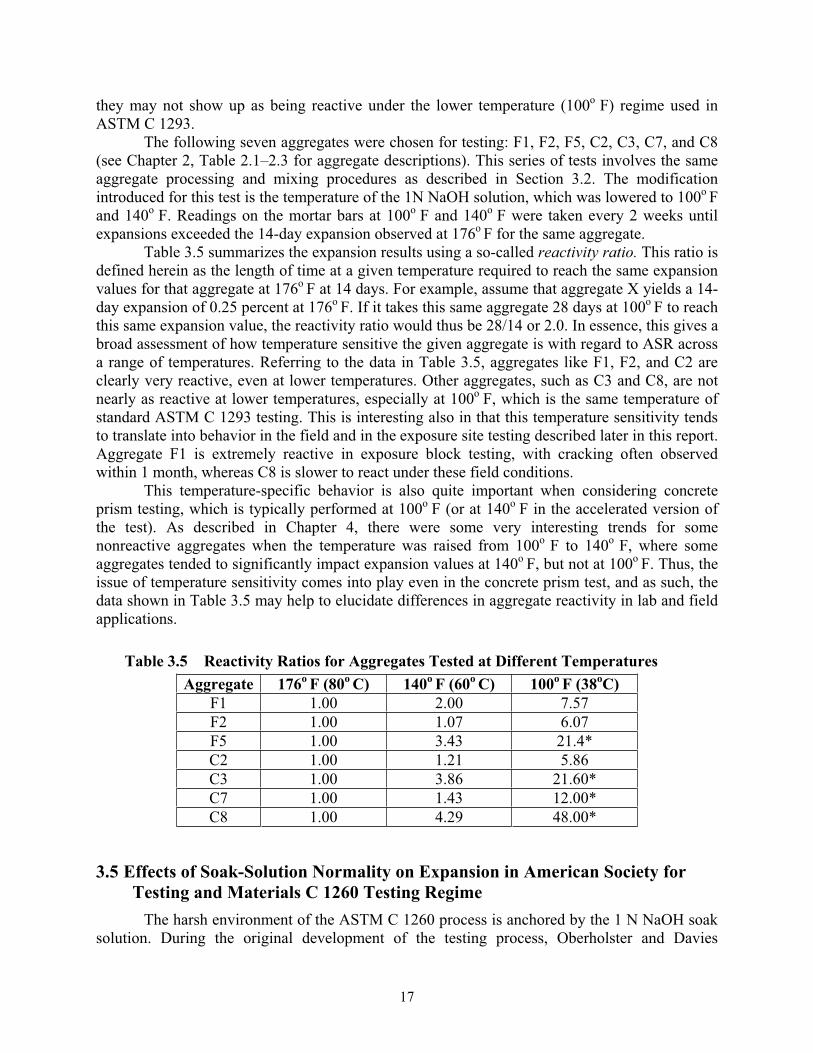
17
they may not show up as being reactive under the lower temperature (100o F) regime used in ASTM C 1293.
The following seven aggregates were chosen for testing: F1, F2, F5, C2, C3, C7, and C8 (see Chapter 2, Table 2.1–2.3 for aggregate descriptions). This series of tests involves the same aggregate processing and mixing procedures as described in Section 3.2. The modification introduced for this test is the temperature of the 1N NaOH solution, which was lowered to 100o Fand 140o F. Readings on the mortar bars at 100o F and 140o F were taken every 2 weeks until expansions exceeded the 14-day expansion observed at 176o F for the same aggregate.
Table 3.5 summarizes the expansion results using a so-called reactivity ratio. This ratio is defined herein as the length of time at a given temperature required to reach the same expansion values for that aggregate at 176o F at 14 days. For example, assume that aggregate X yields a 14-day expansion of 0.25 percent at 176o F. If it takes this same aggregate 28 days at 100o F to reach this same expansion value, the reactivity ratio would thus be 28/14 or 2.0. In essence, this gives a broad assessment of how temperature sensitive the given aggregate is with regard to ASR across a range of temperatures. Referring to the data in Table 3.5, aggregates like F1, F2, and C2 are clearly very reactive, even at lower temperatures. Other aggregates, such as C3 and C8, are not nearly as reactive at lower temperatures, especially at 100o F, which is the same temperature of standard ASTM C 1293 testing. This is interesting also in that this temperature sensitivity tends to translate into behavior in the field and in the exposure site testing described later in this report. Aggregate F1 is extremely reactive in exposure block testing, with cracking often observed within 1 month, whereas C8 is slower to react under these field conditions.
This temperature-specific behavior is also quite important when considering concrete prism testing, which is typically performed at 100o F (or at 140o F in the accelerated version of the test). As described in Chapter 4, there were some very interesting trends for some nonreactive aggregates when the temperature was raised from 100o F to 140o F, where some aggregates tended to significantly impact expansion values at 140o F, but not at 100o F. Thus, the issue of temperature sensitivity comes into play even in the concrete prism test, and as such, the data shown in Table 3.5 may help to elucidate differences in aggregate reactivity in lab and field applications.
Table 3.5 Reactivity Ratios for Aggregates Tested at Different Temperatures Aggregate 176o F (80o C) 140o F (60o C) 100o F (38oC)
F1 1.00 2.00 7.57 F2 1.00 1.07 6.07 F5 1.00 3.43 21.4* C2 1.00 1.21 5.86 C3 1.00 3.86 21.60* C7 1.00 1.43 12.00* C8 1.00 4.29 48.00*
3.5 Effects of Soak-Solution Normality on Expansion in American Society for Testing and Materials C 1260 Testing Regime
The harsh environment of the ASTM C 1260 process is anchored by the 1 N NaOH soak solution. During the original development of the testing process, Oberholster and Davies
18
experimented with different concentrations of this soak solution (ACI 221.1R-98, 1998). The concentrations investigated were 0.25N, 0.50N, 0.75N, 1.0N, 2.0N, and 4.0N. While the 2.0N and 4.0N solutions caused higher expansions at very early ages, by two weeks of age, this expansion was lower than that of specimens immersed in less concentrated solutions. Based on their experimental data, maximum expansions measured after two weeks of soaking occurred at a concentration of 1.0N, which is now the basis for the ASTM C 1260 testing regime.
Research by Stark suggested the use of a sliding expansion criterion, based on soak solution normality (Stark 1994). Stark proposed that the following equation could be used to relate soak solution normality at 176o F to internal alkali loading in concrete.
LmolescwONaOH /06.0022.0
/2339.0][ ±+=−
Stark also proposed using different expansion criteria for the different solution normalities. This proposed scale consisted of a 0.10 percent expansion limit (which is currently the expansion criteria) with the use of a 1.0 N solution; however, the proposed expansion limit was lowered to a value of 0.02 percent at a solution concentration of 0.6N (Stark 1994). This procedure was deemed sufficient, as all aggregates tested by Stark exhibited lower expansion levels while submersed in solutions with lower concentrations than 1.0N NaOH. Based on the work of Stark and others, there were recent overtures within ASTM to allow a modified version of ASTM C 1260 (with soak solution normalities of 0.25, 0.5, 0.75, and 1N) to be used as an index for predicting safe alkali loadings in field concrete. However, this proposal was ultimately rejected (in a task group led by Michael Thomas of the University of New Brunswick) based primarily on data generated under TxDOT 0-4085, as discussed next.
Significant emphasis was placed on varying soak solution normalities in the TxDOT 0-4085 research program. The motivation was primarily to determine if one can predict the response of concrete in the field to alkali loading based on the response of a given aggregate to varying soak solution normality. Much of this work was integrated into the ASTM Task Group on Performance Limits for ASR.
A series of aggregates were tested at 176o F using a range of different soak solution normalities, with the results summarized in Tables 3.6 and 3.7. Most aggregates tend to decrease in expansion as the normality is reduced below 1.0 N, but some (F1, F8, F9) increase in expansion as the normality is reduced. This illustrates the point clearly that the 1.0N soak solution specified under ASTM C 1260 is somewhat arbitrary—it tended to yield the highest expansion values for South Africa aggregates tested by Oberholster and Davies. Each aggregate will experience a peak expansion at certain solution normality, perhaps owing to a pessimum effect in which the maximum expansion is achieved in certain silica to alkali ratio, and variations on either side of this ratio result in lower expansion values. The key is being able to interpret these results in a way that links to field performance of concrete (or ASTM C 1293 test results). The effects of alkali loading in concrete prism and exposure blocks are described in Chapter 4, with comparisons shown between these results and standard ASTM C 1260 results.
As discussed in Chapter 4, none of the aggregates tested in the concrete prism test or in exposure blocks showed inverse relationships between alkali loading and expansion (as ASTM C 1260 tests might suggest for F1, F8, and F9), but some very intriguing trends can be gleaned from exposure block testing. In general, it appears that those aggregates that show peak expansions at 14 days less than 1 N NaOH tend to be the most sensitive to alkali loading in
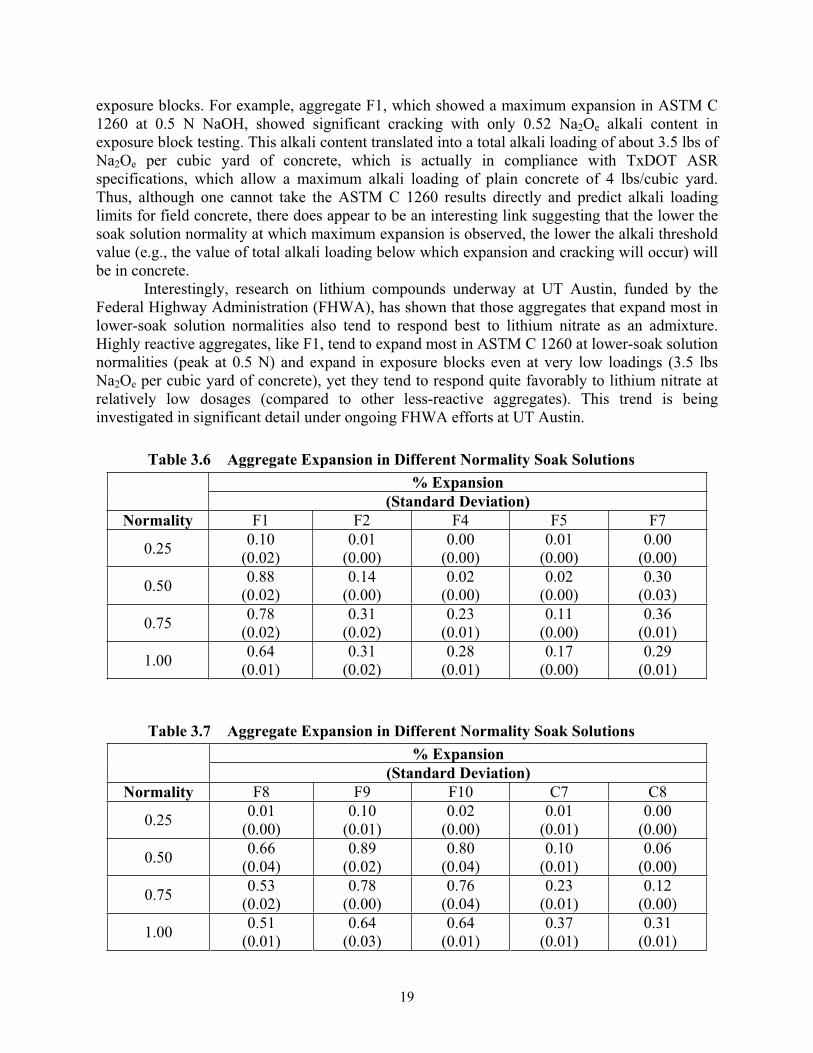
19
exposure blocks. For example, aggregate F1, which showed a maximum expansion in ASTM C 1260 at 0.5 N NaOH, showed significant cracking with only 0.52 Na2Oe alkali content in exposure block testing. This alkali content translated into a total alkali loading of about 3.5 lbs of Na2Oe per cubic yard of concrete, which is actually in compliance with TxDOT ASR specifications, which allow a maximum alkali loading of plain concrete of 4 lbs/cubic yard. Thus, although one cannot take the ASTM C 1260 results directly and predict alkali loading limits for field concrete, there does appear to be an interesting link suggesting that the lower the soak solution normality at which maximum expansion is observed, the lower the alkali threshold value (e.g., the value of total alkali loading below which expansion and cracking will occur) will be in concrete.
Interestingly, research on lithium compounds underway at UT Austin, funded by the Federal Highway Administration (FHWA), has shown that those aggregates that expand most in lower-soak solution normalities also tend to respond best to lithium nitrate as an admixture. Highly reactive aggregates, like F1, tend to expand most in ASTM C 1260 at lower-soak solution normalities (peak at 0.5 N) and expand in exposure blocks even at very low loadings (3.5 lbs Na2Oe per cubic yard of concrete), yet they tend to respond quite favorably to lithium nitrate at relatively low dosages (compared to other less-reactive aggregates). This trend is being investigated in significant detail under ongoing FHWA efforts at UT Austin.
Table 3.6 Aggregate Expansion in Different Normality Soak Solutions % Expansion
(Standard Deviation) Normality F1 F2 F4 F5 F7
0.25 0.10(0.02)
0.01(0.00)
0.00(0.00)
0.01(0.00)
0.00(0.00)
0.50 0.88(0.02)
0.14(0.00)
0.02(0.00)
0.02(0.00)
0.30(0.03)
0.75 0.78(0.02)
0.31(0.02)
0.23(0.01)
0.11(0.00)
0.36(0.01)
1.00 0.64(0.01)
0.31(0.02)
0.28(0.01)
0.17(0.00)
0.29(0.01)
Table 3.7 Aggregate Expansion in Different Normality Soak Solutions % Expansion
(Standard Deviation) Normality F8 F9 F10 C7 C8
0.25 0.01(0.00)
0.10(0.01)
0.02(0.00)
0.01(0.01)
0.00(0.00)
0.50 0.66(0.04)
0.89(0.02)
0.80(0.04)
0.10(0.01)
0.06(0.00)
0.75 0.53(0.02)
0.78(0.00)
0.76(0.04)
0.23(0.01)
0.12(0.00)
1.00 0.51(0.01)
0.64(0.03)
0.64(0.01)
0.37(0.01)
0.31(0.01)
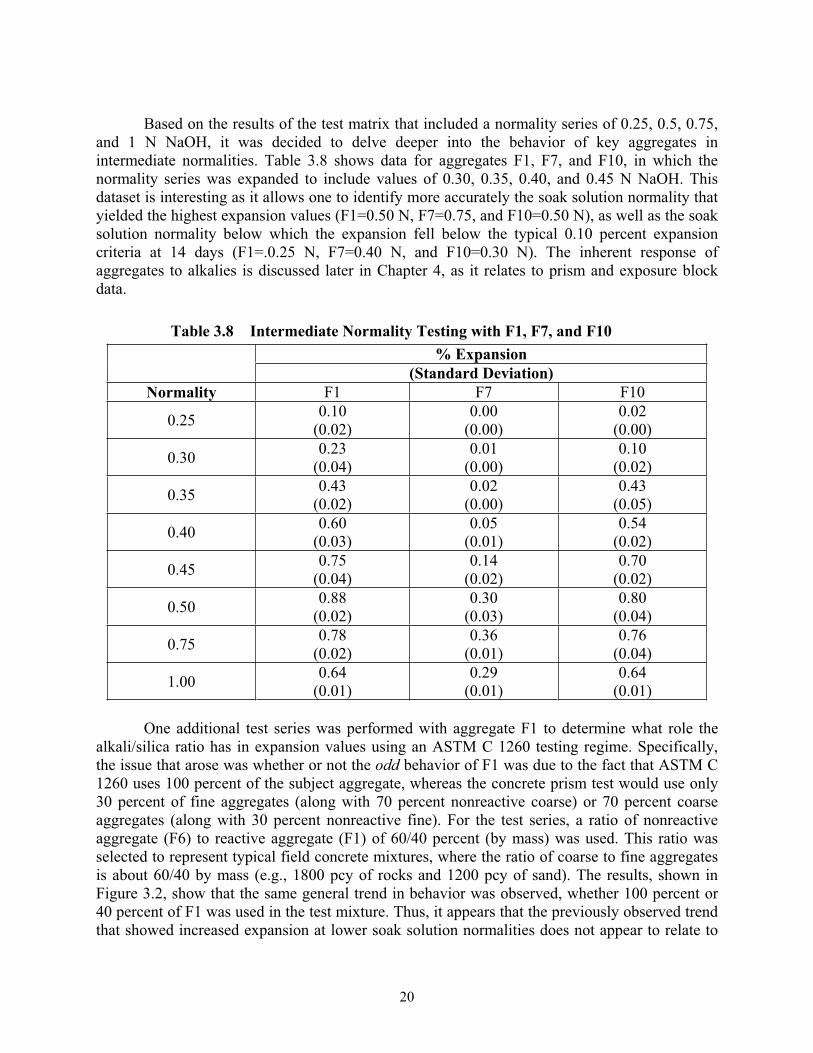
20
Based on the results of the test matrix that included a normality series of 0.25, 0.5, 0.75, and 1 N NaOH, it was decided to delve deeper into the behavior of key aggregates in intermediate normalities. Table 3.8 shows data for aggregates F1, F7, and F10, in which the normality series was expanded to include values of 0.30, 0.35, 0.40, and 0.45 N NaOH. This dataset is interesting as it allows one to identify more accurately the soak solution normality that yielded the highest expansion values (F1=0.50 N, F7=0.75, and F10=0.50 N), as well as the soak solution normality below which the expansion fell below the typical 0.10 percent expansion criteria at 14 days (F1=.0.25 N, F7=0.40 N, and F10=0.30 N). The inherent response of aggregates to alkalies is discussed later in Chapter 4, as it relates to prism and exposure block data.
Table 3.8 Intermediate Normality Testing with F1, F7, and F10 % Expansion
(Standard Deviation) Normality F1 F7 F10
0.25 0.10(0.02)
0.00(0.00)
0.02(0.00)
0.30 0.23(0.04)
0.01(0.00)
0.10(0.02)
0.35 0.43(0.02)
0.02(0.00)
0.43(0.05)
0.40 0.60(0.03)
0.05(0.01)
0.54(0.02)
0.45 0.75(0.04)
0.14(0.02)
0.70(0.02)
0.50 0.88(0.02)
0.30(0.03)
0.80(0.04)
0.75 0.78(0.02)
0.36(0.01)
0.76(0.04)
1.00 0.64(0.01)
0.29(0.01)
0.64(0.01)
One additional test series was performed with aggregate F1 to determine what role the alkali/silica ratio has in expansion values using an ASTM C 1260 testing regime. Specifically, the issue that arose was whether or not the odd behavior of F1 was due to the fact that ASTM C 1260 uses 100 percent of the subject aggregate, whereas the concrete prism test would use only 30 percent of fine aggregates (along with 70 percent nonreactive coarse) or 70 percent coarse aggregates (along with 30 percent nonreactive fine). For the test series, a ratio of nonreactive aggregate (F6) to reactive aggregate (F1) of 60/40 percent (by mass) was used. This ratio was selected to represent typical field concrete mixtures, where the ratio of coarse to fine aggregates is about 60/40 by mass (e.g., 1800 pcy of rocks and 1200 pcy of sand). The results, shown in Figure 3.2, show that the same general trend in behavior was observed, whether 100 percent or 40 percent of F1 was used in the test mixture. Thus, it appears that the previously observed trend that showed increased expansion at lower soak solution normalities does not appear to relate to
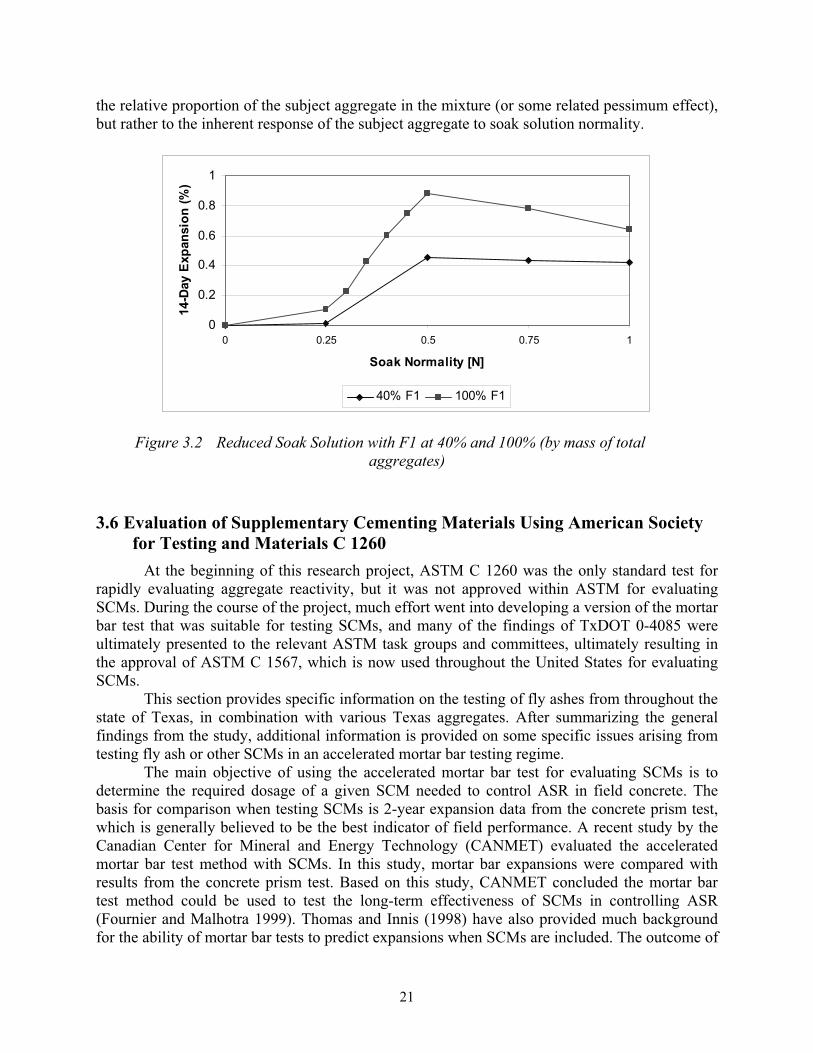
21
the relative proportion of the subject aggregate in the mixture (or some related pessimum effect), but rather to the inherent response of the subject aggregate to soak solution normality.
0
0.2
0.4
0.6
0.8
1
0 0.25 0.5 0.75 1
Soak Normality [N]
14-D
ay E
xpan
sion
(%)
40% F1 100% F1
Figure 3.2 Reduced Soak Solution with F1 at 40% and 100% (by mass of total aggregates)
3.6 Evaluation of Supplementary Cementing Materials Using American Society for Testing and Materials C 1260
At the beginning of this research project, ASTM C 1260 was the only standard test for rapidly evaluating aggregate reactivity, but it was not approved within ASTM for evaluating SCMs. During the course of the project, much effort went into developing a version of the mortar bar test that was suitable for testing SCMs, and many of the findings of TxDOT 0-4085 were ultimately presented to the relevant ASTM task groups and committees, ultimately resulting in the approval of ASTM C 1567, which is now used throughout the United States for evaluating SCMs.
This section provides specific information on the testing of fly ashes from throughout the state of Texas, in combination with various Texas aggregates. After summarizing the general findings from the study, additional information is provided on some specific issues arising from testing fly ash or other SCMs in an accelerated mortar bar testing regime.
The main objective of using the accelerated mortar bar test for evaluating SCMs is to determine the required dosage of a given SCM needed to control ASR in field concrete. The basis for comparison when testing SCMs is 2-year expansion data from the concrete prism test, which is generally believed to be the best indicator of field performance. A recent study by the Canadian Center for Mineral and Energy Technology (CANMET) evaluated the accelerated mortar bar test method with SCMs. In this study, mortar bar expansions were compared with results from the concrete prism test. Based on this study, CANMET concluded the mortar bar test method could be used to test the long-term effectiveness of SCMs in controlling ASR (Fournier and Malhotra 1999). Thomas and Innis (1998) have also provided much background for the ability of mortar bar tests to predict expansions when SCMs are included. The outcome of
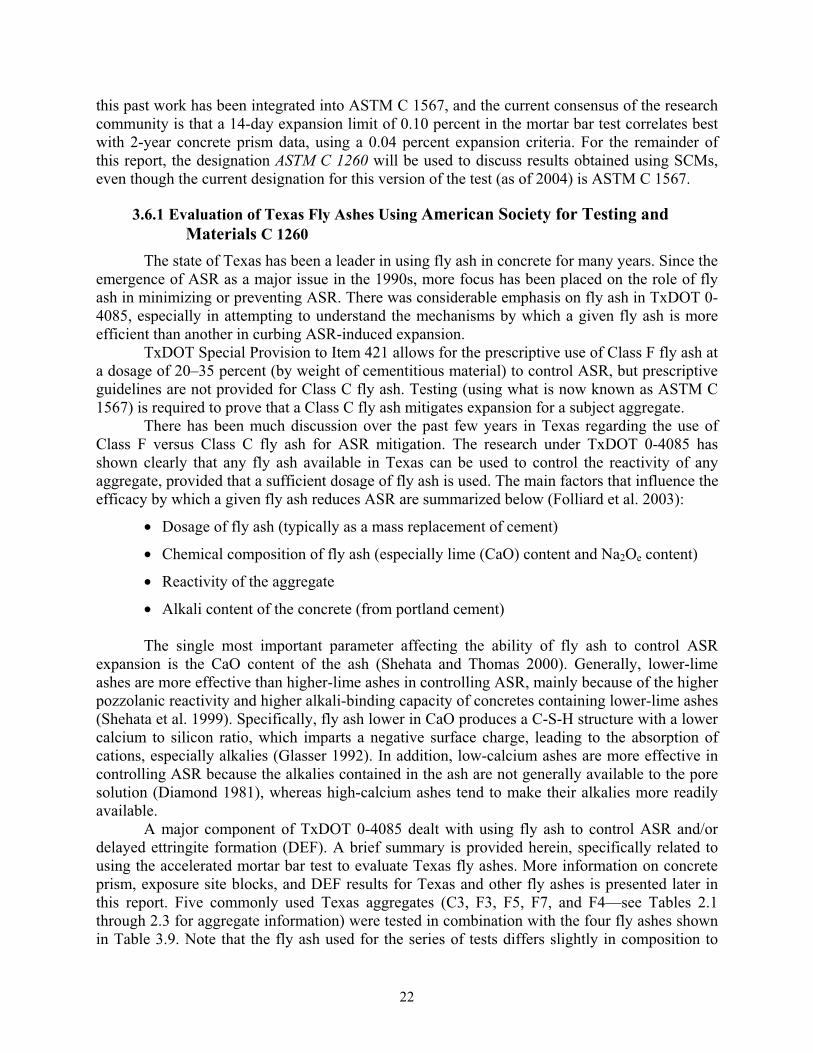
22
this past work has been integrated into ASTM C 1567, and the current consensus of the research community is that a 14-day expansion limit of 0.10 percent in the mortar bar test correlates best with 2-year concrete prism data, using a 0.04 percent expansion criteria. For the remainder of this report, the designation ASTM C 1260 will be used to discuss results obtained using SCMs, even though the current designation for this version of the test (as of 2004) is ASTM C 1567.
3.6.1 Evaluation of Texas Fly Ashes Using American Society for Testing and Materials C 1260
The state of Texas has been a leader in using fly ash in concrete for many years. Since the emergence of ASR as a major issue in the 1990s, more focus has been placed on the role of fly ash in minimizing or preventing ASR. There was considerable emphasis on fly ash in TxDOT 0-4085, especially in attempting to understand the mechanisms by which a given fly ash is more efficient than another in curbing ASR-induced expansion.
TxDOT Special Provision to Item 421 allows for the prescriptive use of Class F fly ash at a dosage of 20–35 percent (by weight of cementitious material) to control ASR, but prescriptive guidelines are not provided for Class C fly ash. Testing (using what is now known as ASTM C 1567) is required to prove that a Class C fly ash mitigates expansion for a subject aggregate.
There has been much discussion over the past few years in Texas regarding the use of Class F versus Class C fly ash for ASR mitigation. The research under TxDOT 0-4085 has shown clearly that any fly ash available in Texas can be used to control the reactivity of any aggregate, provided that a sufficient dosage of fly ash is used. The main factors that influence the efficacy by which a given fly ash reduces ASR are summarized below (Folliard et al. 2003):
• Dosage of fly ash (typically as a mass replacement of cement)
• Chemical composition of fly ash (especially lime (CaO) content and Na2Oe content)
• Reactivity of the aggregate
• Alkali content of the concrete (from portland cement)
The single most important parameter affecting the ability of fly ash to control ASR expansion is the CaO content of the ash (Shehata and Thomas 2000). Generally, lower-lime ashes are more effective than higher-lime ashes in controlling ASR, mainly because of the higher pozzolanic reactivity and higher alkali-binding capacity of concretes containing lower-lime ashes (Shehata et al. 1999). Specifically, fly ash lower in CaO produces a C-S-H structure with a lower calcium to silicon ratio, which imparts a negative surface charge, leading to the absorption of cations, especially alkalies (Glasser 1992). In addition, low-calcium ashes are more effective in controlling ASR because the alkalies contained in the ash are not generally available to the pore solution (Diamond 1981), whereas high-calcium ashes tend to make their alkalies more readily available.
A major component of TxDOT 0-4085 dealt with using fly ash to control ASR and/or delayed ettringite formation (DEF). A brief summary is provided herein, specifically related to using the accelerated mortar bar test to evaluate Texas fly ashes. More information on concrete prism, exposure site blocks, and DEF results for Texas and other fly ashes is presented later in this report. Five commonly used Texas aggregates (C3, F3, F5, F7, and F4—see Tables 2.1 through 2.3 for aggregate information) were tested in combination with the four fly ashes shown in Table 3.9. Note that the fly ash used for the series of tests differs slightly in composition to
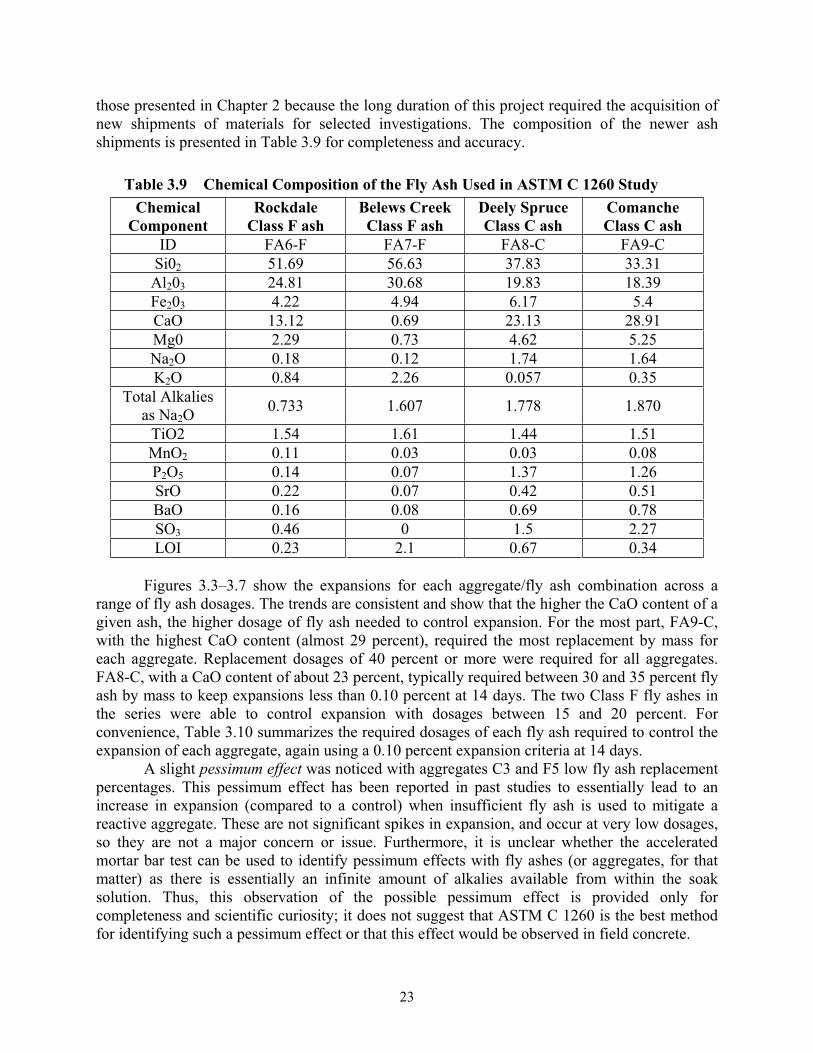
23
those presented in Chapter 2 because the long duration of this project required the acquisition of new shipments of materials for selected investigations. The composition of the newer ash shipments is presented in Table 3.9 for completeness and accuracy.
Table 3.9 Chemical Composition of the Fly Ash Used in ASTM C 1260 Study Chemical
ComponentRockdale
Class F ash Belews Creek Class F ash
Deely Spruce Class C ash
ComancheClass C ash
ID FA6-F FA7-F FA8-C FA9-C Si02 51.69 56.63 37.83 33.31 Al203 24.81 30.68 19.83 18.39 Fe203 4.22 4.94 6.17 5.4 CaO 13.12 0.69 23.13 28.91 Mg0 2.29 0.73 4.62 5.25 Na2O 0.18 0.12 1.74 1.64 K2O 0.84 2.26 0.057 0.35
Total Alkalies as Na2O
0.733 1.607 1.778 1.870
TiO2 1.54 1.61 1.44 1.51 MnO2 0.11 0.03 0.03 0.08 P2O5 0.14 0.07 1.37 1.26 SrO 0.22 0.07 0.42 0.51 BaO 0.16 0.08 0.69 0.78 SO3 0.46 0 1.5 2.27 LOI 0.23 2.1 0.67 0.34
Figures 3.3–3.7 show the expansions for each aggregate/fly ash combination across a range of fly ash dosages. The trends are consistent and show that the higher the CaO content of a given ash, the higher dosage of fly ash needed to control expansion. For the most part, FA9-C, with the highest CaO content (almost 29 percent), required the most replacement by mass for each aggregate. Replacement dosages of 40 percent or more were required for all aggregates. FA8-C, with a CaO content of about 23 percent, typically required between 30 and 35 percent fly ash by mass to keep expansions less than 0.10 percent at 14 days. The two Class F fly ashes in the series were able to control expansion with dosages between 15 and 20 percent. For convenience, Table 3.10 summarizes the required dosages of each fly ash required to control the expansion of each aggregate, again using a 0.10 percent expansion criteria at 14 days.
A slight pessimum effect was noticed with aggregates C3 and F5 low fly ash replacement percentages. This pessimum effect has been reported in past studies to essentially lead to an increase in expansion (compared to a control) when insufficient fly ash is used to mitigate a reactive aggregate. These are not significant spikes in expansion, and occur at very low dosages, so they are not a major concern or issue. Furthermore, it is unclear whether the accelerated mortar bar test can be used to identify pessimum effects with fly ashes (or aggregates, for that matter) as there is essentially an infinite amount of alkalies available from within the soak solution. Thus, this observation of the possible pessimum effect is provided only for completeness and scientific curiosity; it does not suggest that ASTM C 1260 is the best method for identifying such a pessimum effect or that this effect would be observed in field concrete.
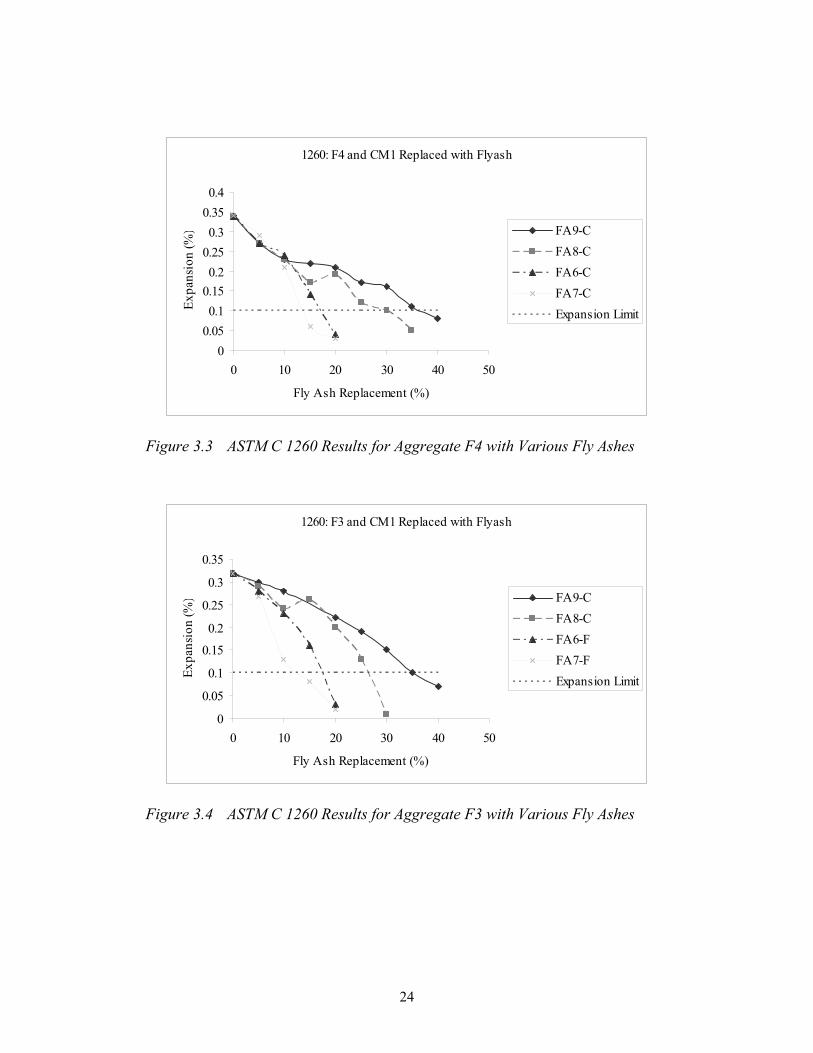
24
1260: F4 and CM1 Replaced with Flyash
00.050.1
0.150.2
0.250.3
0.350.4
0 10 20 30 40 50
Fly Ash Replacement (%)
Expa
nsio
n (%
) FA9-CFA8-CFA6-CFA7-CExpansion Limit
Figure 3.3 ASTM C 1260 Results for Aggregate F4 with Various Fly Ashes
1260: F3 and CM1 Replaced with Flyash
0
0.05
0.1
0.15
0.2
0.25
0.3
0.35
0 10 20 30 40 50
Fly Ash Replacement (%)
Expa
nsio
n (%
) FA9-CFA8-CFA6-FFA7-FExpansion Limit
Figure 3.4 ASTM C 1260 Results for Aggregate F3 with Various Fly Ashes
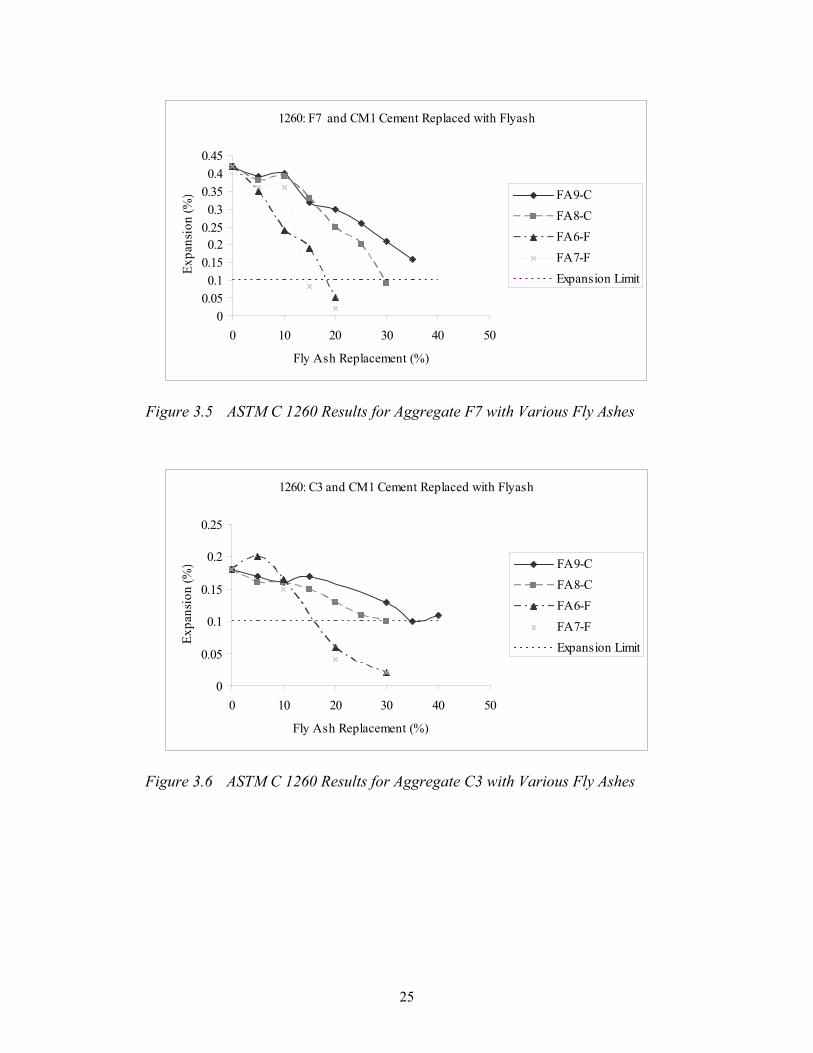
25
1260: F7 and CM1 Cement Replaced with Flyash
00.050.1
0.150.2
0.250.3
0.350.4
0.45
0 10 20 30 40 50
Fly Ash Replacement (%)
Expa
nsio
n (%
) FA9-CFA8-CFA6-FFA7-FExpansion Limit
Figure 3.5 ASTM C 1260 Results for Aggregate F7 with Various Fly Ashes
1260: C3 and CM1 Cement Replaced with Flyash
0
0.05
0.1
0.15
0.2
0.25
0 10 20 30 40 50
Fly Ash Replacement (%)
Expa
nsio
n (%
) FA9-CFA8-CFA6-FFA7-FExpansion Limit
Figure 3.6 ASTM C 1260 Results for Aggregate C3 with Various Fly Ashes
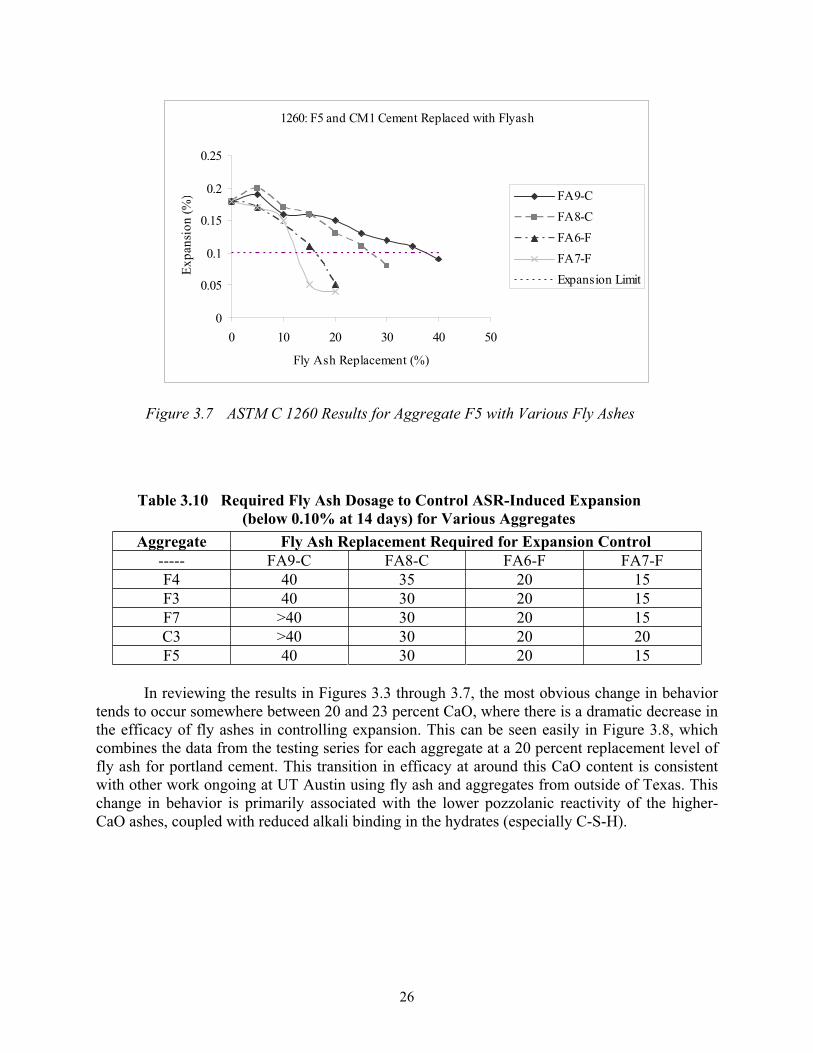
26
1260: F5 and CM1 Cement Replaced with Flyash
0
0.05
0.1
0.15
0.2
0.25
0 10 20 30 40 50
Fly Ash Replacement (%)
Expa
nsio
n (%
) FA9-CFA8-CFA6-FFA7-FExpansion Limit
Figure 3.7 ASTM C 1260 Results for Aggregate F5 with Various Fly Ashes
Table 3.10 Required Fly Ash Dosage to Control ASR-Induced Expansion (below 0.10% at 14 days) for Various Aggregates
Aggregate Fly Ash Replacement Required for Expansion Control ----- FA9-C FA8-C FA6-F FA7-F F4 40 35 20 15 F3 40 30 20 15 F7 >40 30 20 15 C3 >40 30 20 20 F5 40 30 20 15
In reviewing the results in Figures 3.3 through 3.7, the most obvious change in behavior tends to occur somewhere between 20 and 23 percent CaO, where there is a dramatic decrease in the efficacy of fly ashes in controlling expansion. This can be seen easily in Figure 3.8, which combines the data from the testing series for each aggregate at a 20 percent replacement level of fly ash for portland cement. This transition in efficacy at around this CaO content is consistent with other work ongoing at UT Austin using fly ash and aggregates from outside of Texas. This change in behavior is primarily associated with the lower pozzolanic reactivity of the higher-CaO ashes, coupled with reduced alkali binding in the hydrates (especially C-S-H).
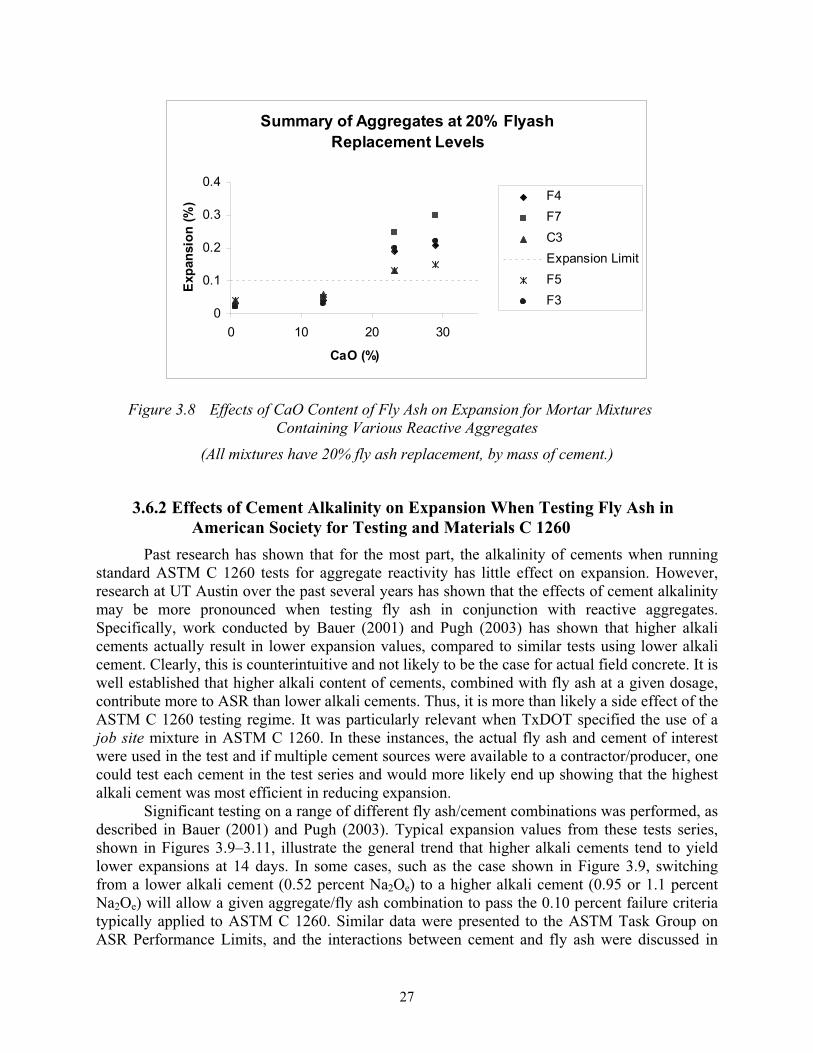
27
Summary of Aggregates at 20% Flyash Replacement Levels
0
0.1
0.2
0.3
0.4
0 10 20 30
CaO (%)
Exp
ansi
on (%
) F4F7C3Expansion LimitF5F3
Figure 3.8 Effects of CaO Content of Fly Ash on Expansion for Mortar Mixtures Containing Various Reactive Aggregates
(All mixtures have 20% fly ash replacement, by mass of cement.)
3.6.2 Effects of Cement Alkalinity on Expansion When Testing Fly Ash in American Society for Testing and Materials C 1260
Past research has shown that for the most part, the alkalinity of cements when running standard ASTM C 1260 tests for aggregate reactivity has little effect on expansion. However, research at UT Austin over the past several years has shown that the effects of cement alkalinity may be more pronounced when testing fly ash in conjunction with reactive aggregates. Specifically, work conducted by Bauer (2001) and Pugh (2003) has shown that higher alkali cements actually result in lower expansion values, compared to similar tests using lower alkali cement. Clearly, this is counterintuitive and not likely to be the case for actual field concrete. It is well established that higher alkali content of cements, combined with fly ash at a given dosage, contribute more to ASR than lower alkali cements. Thus, it is more than likely a side effect of the ASTM C 1260 testing regime. It was particularly relevant when TxDOT specified the use of a job site mixture in ASTM C 1260. In these instances, the actual fly ash and cement of interest were used in the test and if multiple cement sources were available to a contractor/producer, one could test each cement in the test series and would more likely end up showing that the highest alkali cement was most efficient in reducing expansion.
Significant testing on a range of different fly ash/cement combinations was performed, as described in Bauer (2001) and Pugh (2003). Typical expansion values from these tests series, shown in Figures 3.9–3.11, illustrate the general trend that higher alkali cements tend to yield lower expansions at 14 days. In some cases, such as the case shown in Figure 3.9, switching from a lower alkali cement (0.52 percent Na2Oe) to a higher alkali cement (0.95 or 1.1 percent Na2Oe) will allow a given aggregate/fly ash combination to pass the 0.10 percent failure criteria typically applied to ASTM C 1260. Similar data were presented to the ASTM Task Group on ASR Performance Limits, and the interactions between cement and fly ash were discussed in
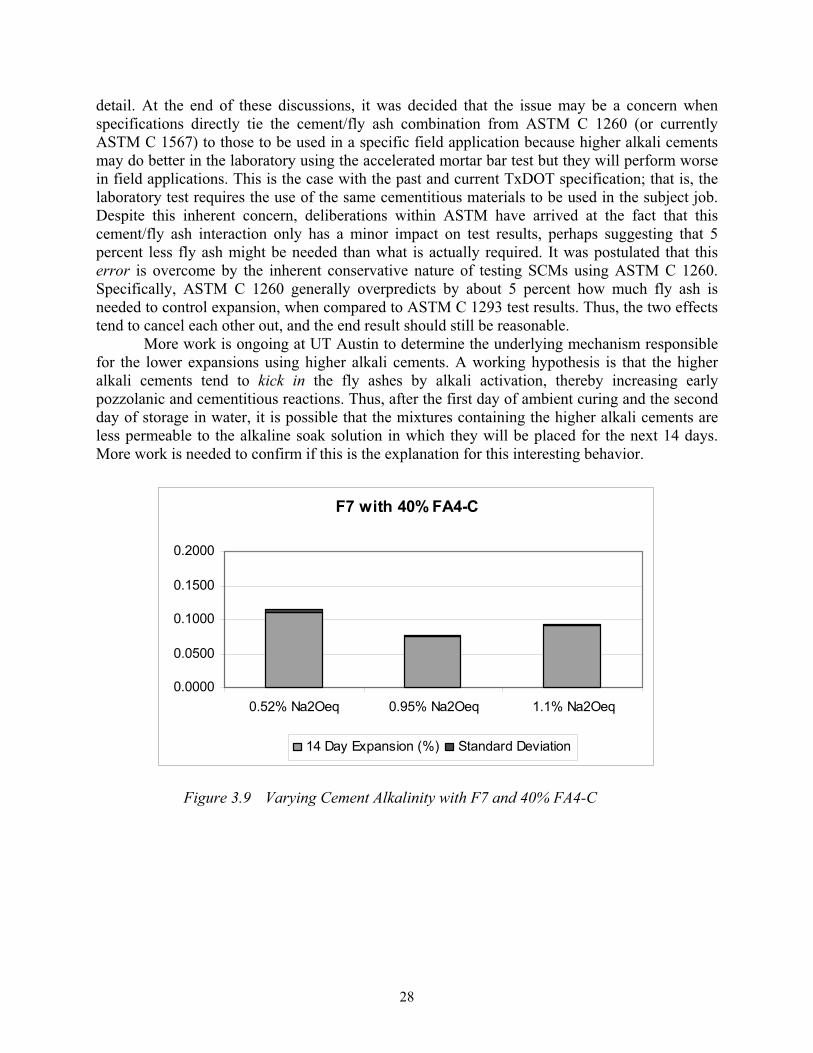
28
detail. At the end of these discussions, it was decided that the issue may be a concern when specifications directly tie the cement/fly ash combination from ASTM C 1260 (or currently ASTM C 1567) to those to be used in a specific field application because higher alkali cements may do better in the laboratory using the accelerated mortar bar test but they will perform worse in field applications. This is the case with the past and current TxDOT specification; that is, the laboratory test requires the use of the same cementitious materials to be used in the subject job. Despite this inherent concern, deliberations within ASTM have arrived at the fact that this cement/fly ash interaction only has a minor impact on test results, perhaps suggesting that 5 percent less fly ash might be needed than what is actually required. It was postulated that this error is overcome by the inherent conservative nature of testing SCMs using ASTM C 1260. Specifically, ASTM C 1260 generally overpredicts by about 5 percent how much fly ash is needed to control expansion, when compared to ASTM C 1293 test results. Thus, the two effects tend to cancel each other out, and the end result should still be reasonable.
More work is ongoing at UT Austin to determine the underlying mechanism responsible for the lower expansions using higher alkali cements. A working hypothesis is that the higher alkali cements tend to kick in the fly ashes by alkali activation, thereby increasing early pozzolanic and cementitious reactions. Thus, after the first day of ambient curing and the second day of storage in water, it is possible that the mixtures containing the higher alkali cements are less permeable to the alkaline soak solution in which they will be placed for the next 14 days. More work is needed to confirm if this is the explanation for this interesting behavior.
F7 with 40% FA4-C
0.0000
0.0500
0.1000
0.1500
0.2000
0.52% Na2Oeq 0.95% Na2Oeq 1.1% Na2Oeq
14 Day Expansion (%) Standard Deviation
Figure 3.9 Varying Cement Alkalinity with F7 and 40% FA4-C
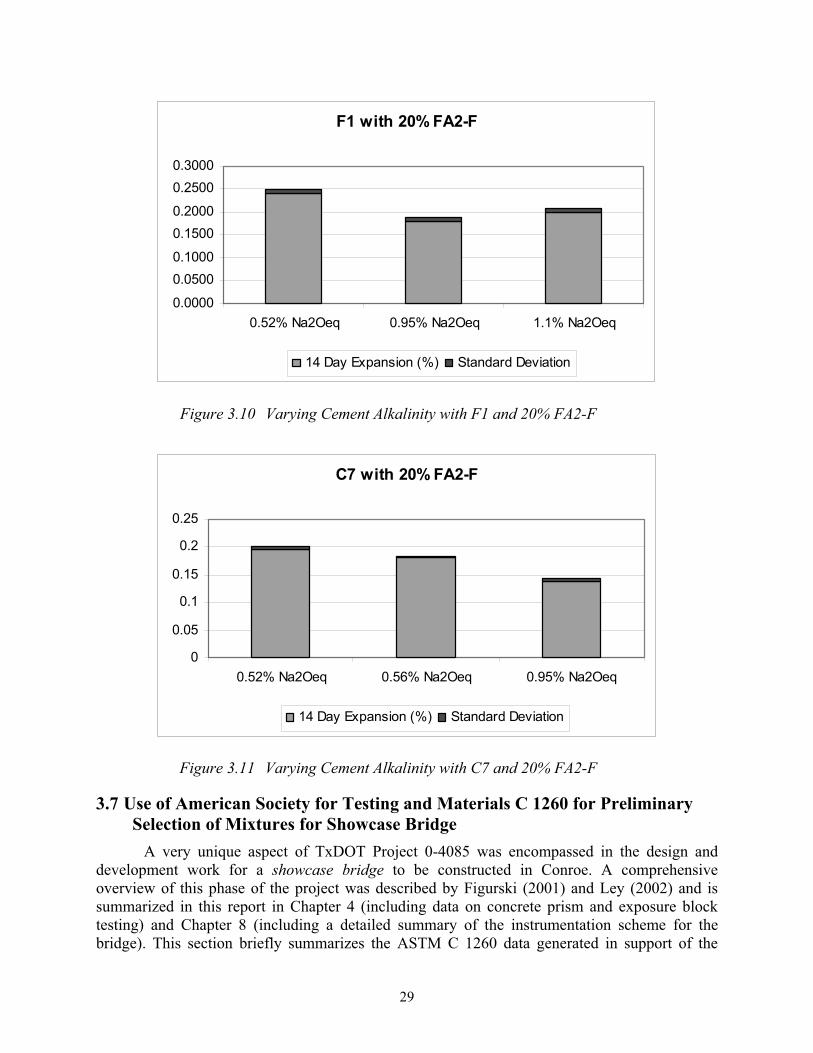
29
F1 with 20% FA2-F
0.0000
0.05000.1000
0.15000.2000
0.25000.3000
0.52% Na2Oeq 0.95% Na2Oeq 1.1% Na2Oeq
14 Day Expansion (%) Standard Deviation
Figure 3.10 Varying Cement Alkalinity with F1 and 20% FA2-F
C7 with 20% FA2-F
0
0.05
0.1
0.15
0.2
0.25
0.52% Na2Oeq 0.56% Na2Oeq 0.95% Na2Oeq
14 Day Expansion (%) Standard Deviation
Figure 3.11 Varying Cement Alkalinity with C7 and 20% FA2-F
3.7 Use of American Society for Testing and Materials C 1260 for Preliminary Selection of Mixtures for Showcase Bridge
A very unique aspect of TxDOT Project 0-4085 was encompassed in the design and development work for a showcase bridge to be constructed in Conroe. A comprehensive overview of this phase of the project was described by Figurski (2001) and Ley (2002) and is summarized in this report in Chapter 4 (including data on concrete prism and exposure block testing) and Chapter 8 (including a detailed summary of the instrumentation scheme for the bridge). This section briefly summarizes the ASTM C 1260 data generated in support of the
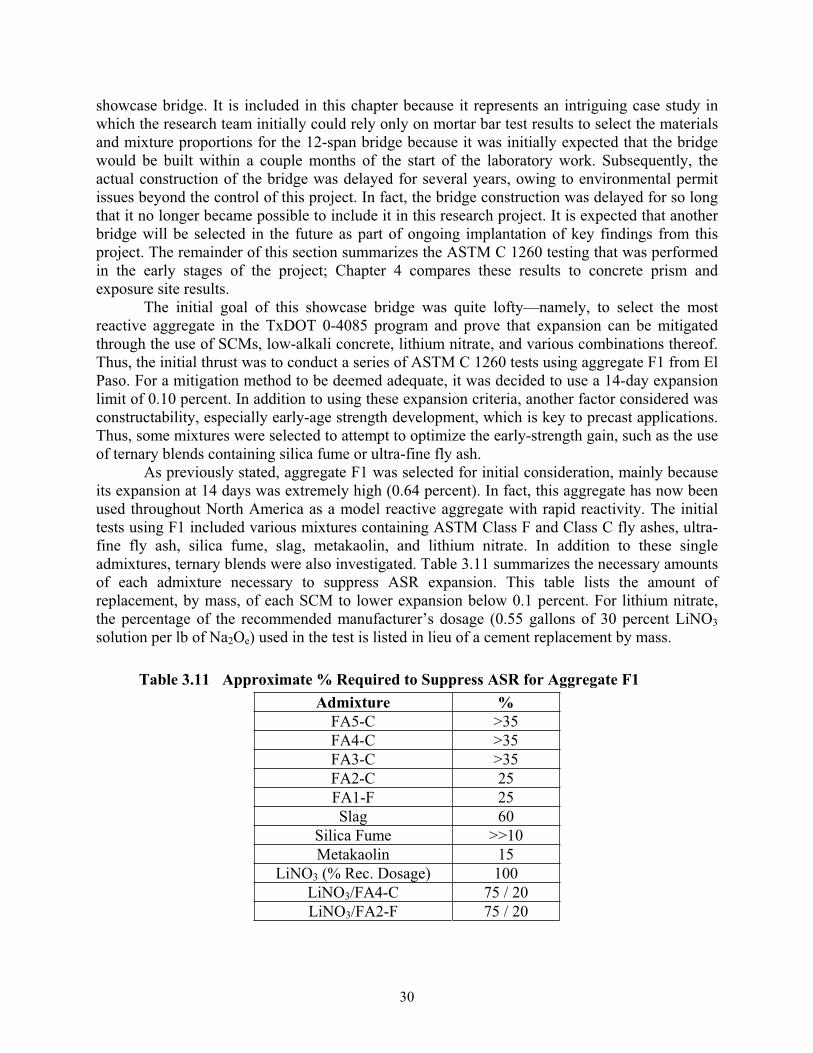
30
showcase bridge. It is included in this chapter because it represents an intriguing case study in which the research team initially could rely only on mortar bar test results to select the materials and mixture proportions for the 12-span bridge because it was initially expected that the bridge would be built within a couple months of the start of the laboratory work. Subsequently, the actual construction of the bridge was delayed for several years, owing to environmental permit issues beyond the control of this project. In fact, the bridge construction was delayed for so long that it no longer became possible to include it in this research project. It is expected that another bridge will be selected in the future as part of ongoing implantation of key findings from this project. The remainder of this section summarizes the ASTM C 1260 testing that was performed in the early stages of the project; Chapter 4 compares these results to concrete prism and exposure site results.
The initial goal of this showcase bridge was quite lofty—namely, to select the most reactive aggregate in the TxDOT 0-4085 program and prove that expansion can be mitigated through the use of SCMs, low-alkali concrete, lithium nitrate, and various combinations thereof. Thus, the initial thrust was to conduct a series of ASTM C 1260 tests using aggregate F1 from El Paso. For a mitigation method to be deemed adequate, it was decided to use a 14-day expansion limit of 0.10 percent. In addition to using these expansion criteria, another factor considered was constructability, especially early-age strength development, which is key to precast applications. Thus, some mixtures were selected to attempt to optimize the early-strength gain, such as the use of ternary blends containing silica fume or ultra-fine fly ash.
As previously stated, aggregate F1 was selected for initial consideration, mainly because its expansion at 14 days was extremely high (0.64 percent). In fact, this aggregate has now been used throughout North America as a model reactive aggregate with rapid reactivity. The initial tests using F1 included various mixtures containing ASTM Class F and Class C fly ashes, ultra-fine fly ash, silica fume, slag, metakaolin, and lithium nitrate. In addition to these single admixtures, ternary blends were also investigated. Table 3.11 summarizes the necessary amounts of each admixture necessary to suppress ASR expansion. This table lists the amount of replacement, by mass, of each SCM to lower expansion below 0.1 percent. For lithium nitrate, the percentage of the recommended manufacturer’s dosage (0.55 gallons of 30 percent LiNO3solution per lb of Na2Oe) used in the test is listed in lieu of a cement replacement by mass.
Table 3.11 Approximate % Required to Suppress ASR for Aggregate F1 Admixture %
FA5-C >35 FA4-C >35 FA3-C >35 FA2-C 25 FA1-F 25 Slag 60
Silica Fume >>10 Metakaolin 15
LiNO3 (% Rec. Dosage) 100 LiNO3/FA4-C 75 / 20 LiNO3/FA2-F 75 / 20
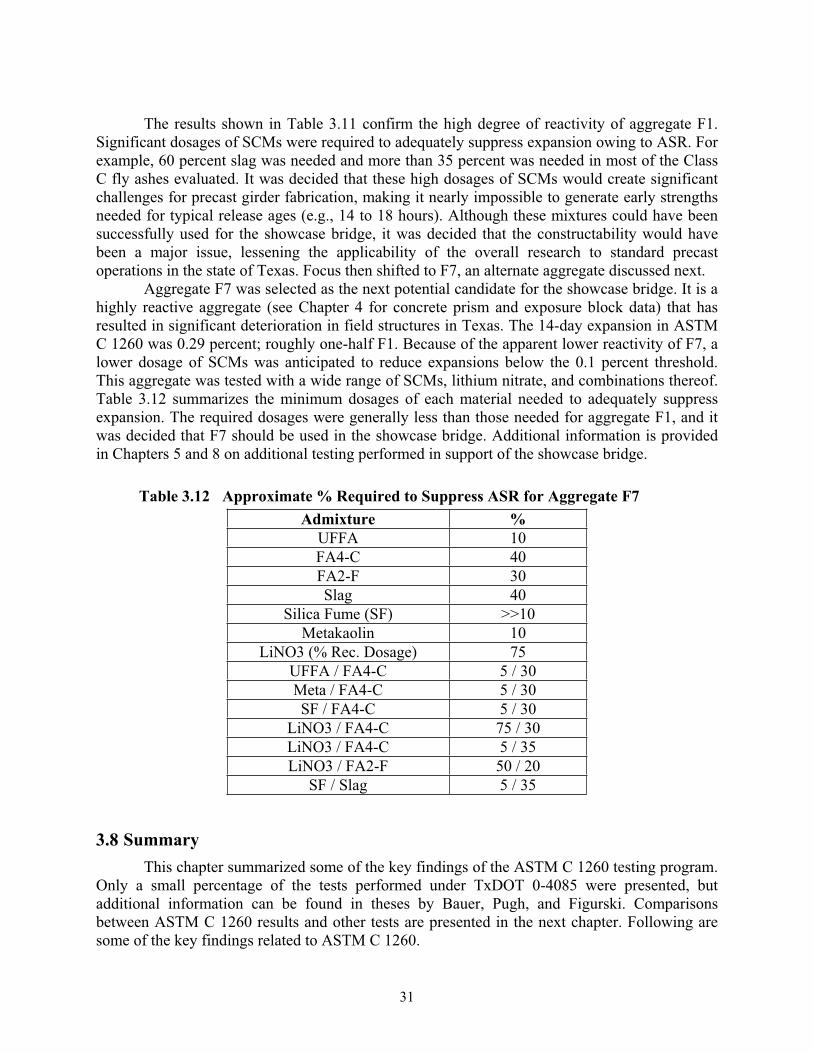
31
The results shown in Table 3.11 confirm the high degree of reactivity of aggregate F1. Significant dosages of SCMs were required to adequately suppress expansion owing to ASR. For example, 60 percent slag was needed and more than 35 percent was needed in most of the Class C fly ashes evaluated. It was decided that these high dosages of SCMs would create significant challenges for precast girder fabrication, making it nearly impossible to generate early strengths needed for typical release ages (e.g., 14 to 18 hours). Although these mixtures could have been successfully used for the showcase bridge, it was decided that the constructability would have been a major issue, lessening the applicability of the overall research to standard precast operations in the state of Texas. Focus then shifted to F7, an alternate aggregate discussed next.
Aggregate F7 was selected as the next potential candidate for the showcase bridge. It is a highly reactive aggregate (see Chapter 4 for concrete prism and exposure block data) that has resulted in significant deterioration in field structures in Texas. The 14-day expansion in ASTM C 1260 was 0.29 percent; roughly one-half F1. Because of the apparent lower reactivity of F7, a lower dosage of SCMs was anticipated to reduce expansions below the 0.1 percent threshold. This aggregate was tested with a wide range of SCMs, lithium nitrate, and combinations thereof. Table 3.12 summarizes the minimum dosages of each material needed to adequately suppress expansion. The required dosages were generally less than those needed for aggregate F1, and it was decided that F7 should be used in the showcase bridge. Additional information is provided in Chapters 5 and 8 on additional testing performed in support of the showcase bridge.
Table 3.12 Approximate % Required to Suppress ASR for Aggregate F7 Admixture %
UFFA 10 FA4-C 40 FA2-F 30 Slag 40
Silica Fume (SF) >>10 Metakaolin 10
LiNO3 (% Rec. Dosage) 75 UFFA / FA4-C 5 / 30 Meta / FA4-C 5 / 30 SF / FA4-C 5 / 30
LiNO3 / FA4-C 75 / 30 LiNO3 / FA4-C 5 / 35 LiNO3 / FA2-F 50 / 20
SF / Slag 5 / 35
3.8 SummaryThis chapter summarized some of the key findings of the ASTM C 1260 testing program.
Only a small percentage of the tests performed under TxDOT 0-4085 were presented, but additional information can be found in theses by Bauer, Pugh, and Figurski. Comparisons between ASTM C 1260 results and other tests are presented in the next chapter. Following are some of the key findings related to ASTM C 1260.
32
• ASTM C 1260 is a screening test that can be used effectively in many cases to assess aggregate reactivity. However, in some cases, the test may predict that an aggregate will be reactive in concrete, when in reality it is actually quite durable in laboratory and field concrete. Conversely, for several of the aggregates included in this project (including two from Texas), ASTM C 1260 would suggest that the aggregate is nonreactive, but concrete containing the aggregate is actually reactive in the laboratory and in the field. More work is needed to determine the limitations of ASTM C 1260 for use as a predictor of true reactivity. More discussion on this topic is provided in the next chapter.
• The effects of cement alkalinity on expansion of ASTM C 1260 mixtures containing SCMs can be significant and counterintuitive. Specifically, it has been shown for some cases that higher alkali cements yield lower expansion values in combination with SCMs than lower alkali cements. This can represent a problem when testing requires the use of the actual blend of cementitious materials to be used on a given job. Research is underway to better understand the mechanisms responsible for this trend in behavior; the working hypothesis is that higher alkali cements tend to activate SCMs at early ages, producing a denser, less permeable matrix that slows down the ingress of the host alkaline solution.
• ASTM C 1260 was found to be a useful tool in rapidly screening aggregates and SCMs for the showcase bridge. As discussed later in this report, for the most part, the ASTM C 1260 results generated in support of the showcase bridge correlated pretty well with concrete prism and exposure block results.
33
4. American Society for Testing and Materials C 1293: The Concrete Prism Test
4.1 Test Background The general trend in alkali-silica reaction (ASR) testing is that the most-rapid tests tend to
be the most severe in terms of testing conditions (e.g., high temperature and increased alkalinity) and often yield results that do not reflect actual field performance. On the other hand, the one method that is relatively less severe and is commonly accepted as the best predictor of field performance is American Society for Testing and Materials (ASTM) C 1293, “Test Method for Concrete Aggregates by Determination of Length Change of Concrete Due To Alkali-Silica Reaction.” This test is also referred to as the concrete prism test (CPT). However, it is not without its drawbacks as it takes a full year to complete when assessing aggregate reactivity [or 2 years to evaluate the efficacy of supplementary cementing materials (SCMs)]; this length of time is often deemed excessive when an aggregate must be tested for specification requirements or job acceptance. Therefore, an extensive portion of the ASTM C 1293 testing in this project focused on the potential of accelerating the concrete prism test [by testing at 140° F (60° C) instead of 100° F (38° C)] to shorten the test duration, while hopefully still retaining a strong correlation with field performance. Before presenting the details of the testing program and results, some of the important nuances of the test will be discussed.
As mentioned above, ASTM C 1293 is generally accepted to be the best predictor of field performance. In this test, concrete prisms are cast with square cross sections of 3.00 ± (75 ± 0.7 mm) and are 11.25 in (285 mm) in length. A cement content of 708 lb/ft3 (420 kg/m3) using ASTM C 150 Type I Cement with a 0.9 ± 0.1 Na2Oeq (equivalent alkali) is specified for this test method. Then, the required amount of alkalies (NaOH) are added to the mixing water to obtain a total alkali content of 1.25 percent Na2Oeq (by mass of cement), which equates to a total alkali content in the concrete mixture of 4 lb/ft3 (5.25 kg/m3). This is referred to within the ASR research community as a boosted mixture. Magni and coworkers found that this boosted alkali content was necessary to identify slowly reactive aggregates, including argillites and greywackes (Magni et al. 1987). A mixture where the alkali content is not raised to 1.25 Na2Oeq, but rather remains at 0.9 ± 0.1 Na2Oeq, is referred to as unboosted. Gage studs are cast in both ends of each prism to give an effective gage length of 10 in. (250 mm). Prisms are demolded after 24 ± 2 h and are measured for an initial length reading. Prisms are then stored at 100 ± 3° F (38 ± 2° C) and measured periodically over a period of 1 year for concrete containing no SCMs. The storage length is increased to 2 years for mixtures containing SCMs. Specimens are brought to 70 ± 3° F (23 ± 2° C) for 16 ± 4 h prior to length change measurement so that thermal changes do not affect length measurements.
In recent years, more and more countries and agencies have adopted the concrete prism test as a standard method. An expansion limit of 0.04 percent (at the end of the 1- or 2-year test) is typically specified as this value has been reported to correlate well with cracking of test prisms, as well as field structures suffering from ASR (Grattan-Bellew 1989). This expansion limit (0.04 percent) is referenced in the appendix to ASTM C 1293, its appendix, and in ASTM C 33 as well as Canadian Standards Association (CSA) A23.1-04/A23.2-04. As part of the most
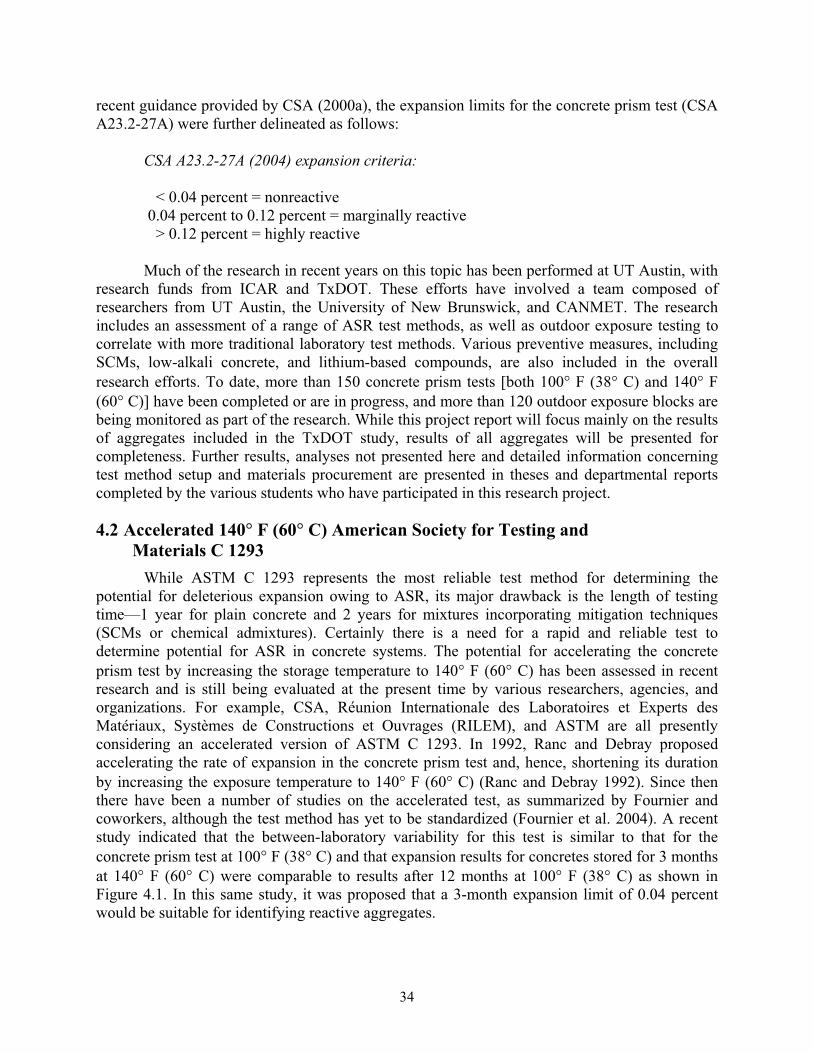
34
recent guidance provided by CSA (2000a), the expansion limits for the concrete prism test (CSA A23.2-27A) were further delineated as follows:
CSA A23.2-27A (2004) expansion criteria:
< 0.04 percent = nonreactive 0.04 percent to 0.12 percent = marginally reactive > 0.12 percent = highly reactive
Much of the research in recent years on this topic has been performed at UT Austin, with research funds from ICAR and TxDOT. These efforts have involved a team composed of researchers from UT Austin, the University of New Brunswick, and CANMET. The research includes an assessment of a range of ASR test methods, as well as outdoor exposure testing to correlate with more traditional laboratory test methods. Various preventive measures, including SCMs, low-alkali concrete, and lithium-based compounds, are also included in the overall research efforts. To date, more than 150 concrete prism tests [both 100° F (38° C) and 140° F (60° C)] have been completed or are in progress, and more than 120 outdoor exposure blocks are being monitored as part of the research. While this project report will focus mainly on the results of aggregates included in the TxDOT study, results of all aggregates will be presented for completeness. Further results, analyses not presented here and detailed information concerning test method setup and materials procurement are presented in theses and departmental reports completed by the various students who have participated in this research project.
4.2 Accelerated 140° F (60° C) American Society for Testing andMaterials C 1293
While ASTM C 1293 represents the most reliable test method for determining the potential for deleterious expansion owing to ASR, its major drawback is the length of testing time—1 year for plain concrete and 2 years for mixtures incorporating mitigation techniques (SCMs or chemical admixtures). Certainly there is a need for a rapid and reliable test to determine potential for ASR in concrete systems. The potential for accelerating the concrete prism test by increasing the storage temperature to 140° F (60° C) has been assessed in recent research and is still being evaluated at the present time by various researchers, agencies, and organizations. For example, CSA, Réunion Internationale des Laboratoires et Experts des Matériaux, Systèmes de Constructions et Ouvrages (RILEM), and ASTM are all presently considering an accelerated version of ASTM C 1293. In 1992, Ranc and Debray proposed accelerating the rate of expansion in the concrete prism test and, hence, shortening its duration by increasing the exposure temperature to 140° F (60° C) (Ranc and Debray 1992). Since then there have been a number of studies on the accelerated test, as summarized by Fournier and coworkers, although the test method has yet to be standardized (Fournier et al. 2004). A recent study indicated that the between-laboratory variability for this test is similar to that for the concrete prism test at 100° F (38° C) and that expansion results for concretes stored for 3 months at 140° F (60° C) were comparable to results after 12 months at 100° F (38° C) as shown in Figure 4.1. In this same study, it was proposed that a 3-month expansion limit of 0.04 percent would be suitable for identifying reactive aggregates.
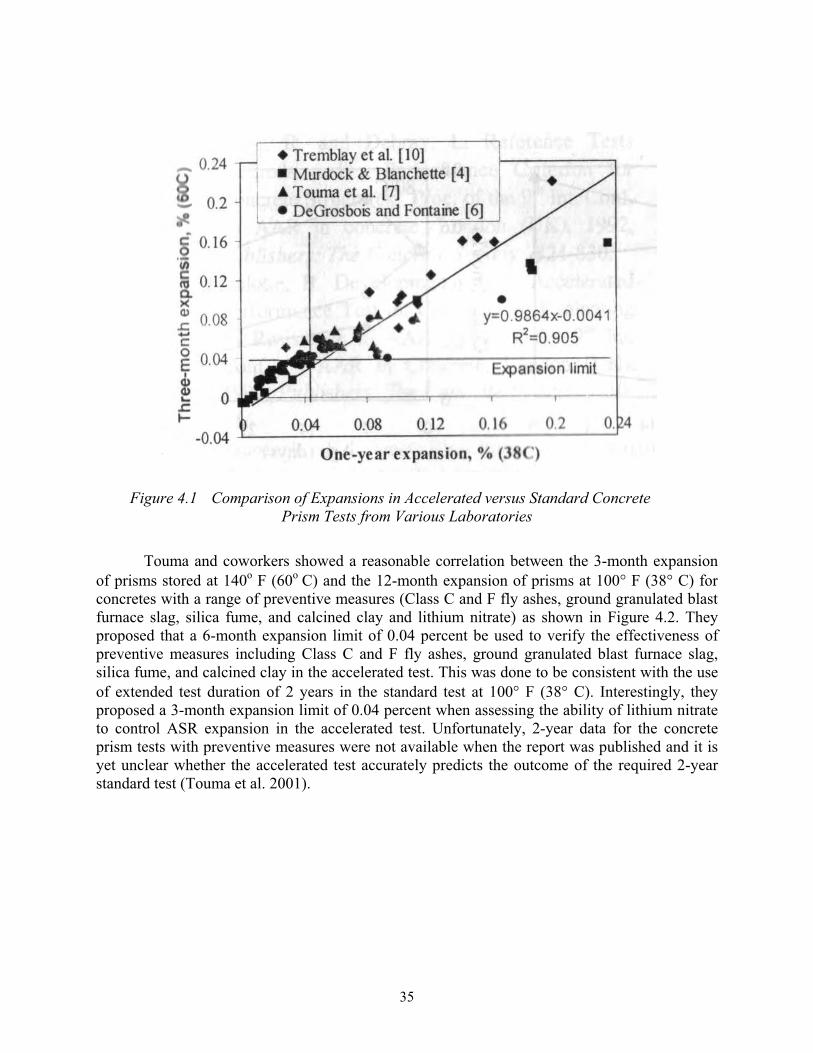
35
Figure 4.1 Comparison of Expansions in Accelerated versus Standard Concrete Prism Tests from Various Laboratories
Touma and coworkers showed a reasonable correlation between the 3-month expansion of prisms stored at 140o F (60o C) and the 12-month expansion of prisms at 100° F (38° C) for concretes with a range of preventive measures (Class C and F fly ashes, ground granulated blast furnace slag, silica fume, and calcined clay and lithium nitrate) as shown in Figure 4.2. They proposed that a 6-month expansion limit of 0.04 percent be used to verify the effectiveness of preventive measures including Class C and F fly ashes, ground granulated blast furnace slag, silica fume, and calcined clay in the accelerated test. This was done to be consistent with the use of extended test duration of 2 years in the standard test at 100° F (38° C). Interestingly, they proposed a 3-month expansion limit of 0.04 percent when assessing the ability of lithium nitrate to control ASR expansion in the accelerated test. Unfortunately, 2-year data for the concrete prism tests with preventive measures were not available when the report was published and it is yet unclear whether the accelerated test accurately predicts the outcome of the required 2-year standard test (Touma et al. 2001).
36
y = 0.8526x + 0.0034R2 = 0.9732
0.000
0.050
0.100
0.150
0.200
0.250
0.300
0.350
0.400
0.450
0.500
0.00 0.05 0.10 0.15 0.20 0.25 0.30 0.35 0.40 0.45 0.50 0.55
13-Week Accelerated C 1293 Expansion, %
One
-Yea
r St
anda
rd C
129
3 E
xpan
sion
, %
Figure 4.2 Comparison of Expansions in Accelerated versus Standard Concrete Prism Tests for Various Preventive Measures after Touma 2000
It has been suggested that the accelerated test be extended to 6 months for also evaluating lithium-based admixtures, although more data are required to validate the use of this test for this purpose and to determine appropriate performance limits (Tremblay et al. 2004).
It has been observed that the higher temperature in the accelerated concrete prism test increases the rate of alkali leaching, reduces the pore solution pH due to sulfate ions replacing some of the hydroxyl ions in solution, and renders the outcome of the test more sensitive to the selection of the nonreactive aggregate for combining with the aggregate under test (Fournier et al. 2004). These issues need to be resolved before the test achieves wider acceptance and will be discussed in more detail in a future paper by the authors.
4.3 Overview of Tests Performed This chapter focuses on the results obtained from all standard ASTM C 1293 tests that
have been performed as part of both TxDOT Project 0-4085 and ICAR Project 302. Owing to the length of time required by ASTM C 1293 to predict aggregate reactivity, many of the tests incorporating SCMs as part of the ICAR project are only reported up to 1 year of testing. Complete results will be conveyed in the final ICAR Project 302 Project Report. Tests currently underway have been included to provide as much insight into the testing issues and outcomes as possible. In most cases, however, even tests that have not yet completed the entire ASTM C 1293 regime can still provide insight for the trends in the testing method.
37
This chapter is further divided into five subsections:
• 4.4 - Aggregate Results
• 4.5 - Use of SCMs and LiNO3 (Selection of Showcase Bridge Mixtures)
• 4.6 - Accelerated ASTM C 1293 Testing
• 4.7 - Effect of Cement Alkalies on Test
• 4.8 - Other Test Anomalies and Discussion
For brevity only 1- and 2-year results (or the latest measured data) will be provided for all tests within the body of this report. It should be noted that tests conducted in the accelerated ASTM C 1293 will likely have only results to a maximum of 6 months to 1 year of testing owing to the shortened duration of the test. Furthermore, not all results from accelerated concrete prism testing will be presented owing to the current issues with accelerating the test. However, an in-depth discussion of the associated problems with this test highlighting relevant supporting data will be presented. Additionally, ASTM C 1260 data, where available, are presented for comparison and discussion purposes.
4.4 Aggregate Results This section presents results of testing performed on fine and coarse aggregates from
TxDOT 0-4085 and ICAR 302. For TxDOT Project 0-4085, ASTM C 1293 testing began in spring 2001. When testing began, fifteen aggregates were selected to provide an initial database for possible aggregates to be used in the TxDOT showcase bridge (Figurski 2001). All but three of these aggregates are from Texas, with two others from Canada, and one from New Mexico. Testing for ICAR Project 302 commenced in June 2002 and added one fine aggregate and seven coarse aggregates from across North America. Beyond simply performing a straight ASTM C 1293 test with each aggregate, it was also decided to run an accelerated test regime. This test is identical to the original ASTM C 1293 test, however it is stored at 140° F (60° C) for the duration of the test over the traditional 100° F (38° C) test. This higher temperature accelerates the test and was done in order to validate previous research and provide a further database of test results.
4.4.1 Fine Aggregates Table 4.1 shows the results of ASTM C 1293 and companion ASTM C 1260 results for
testing on the fine aggregates included in both projects.
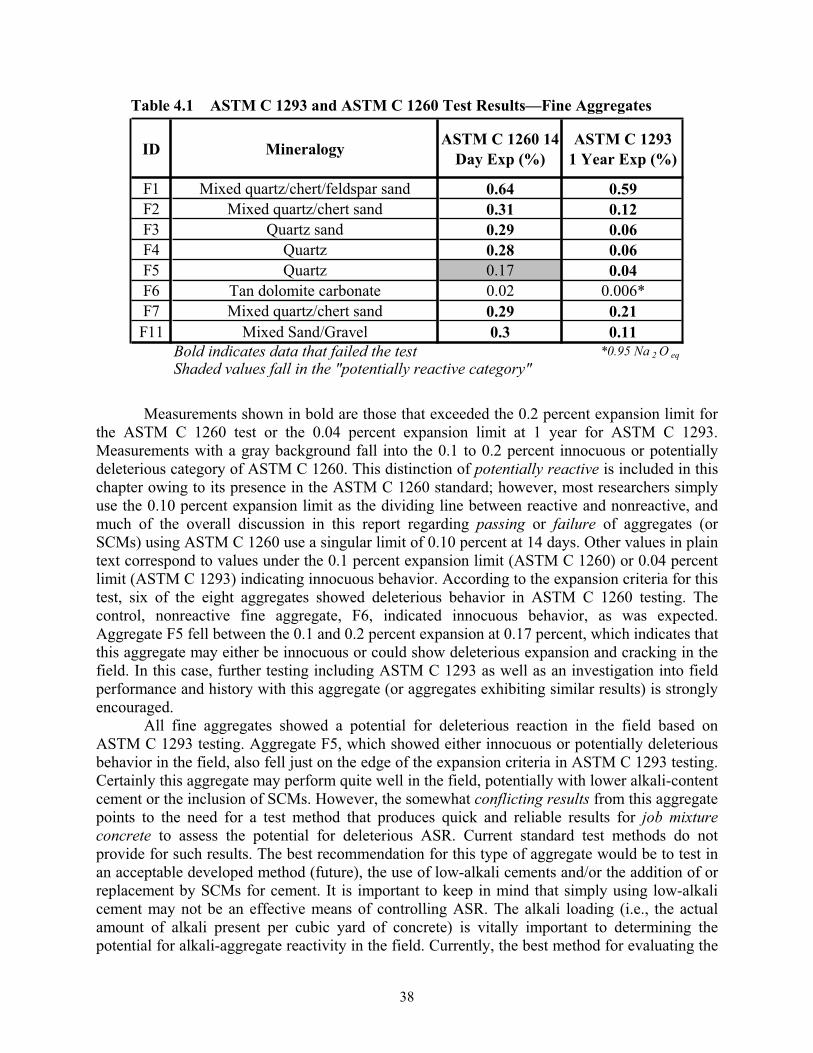
38
Table 4.1 ASTM C 1293 and ASTM C 1260 Test Results—Fine Aggregates
ID Mineralogy ASTM C 1260 14 Day Exp (%)
ASTM C 1293 1 Year Exp (%)
F1 Mixed quartz/chert/feldspar sand 0.64 0.59F2 Mixed quartz/chert sand 0.31 0.12F3 Quartz sand 0.29 0.06F4 Quartz 0.28 0.06F5 Quartz 0.17 0.04F6 Tan dolomite carbonate 0.02 0.006*F7 Mixed quartz/chert sand 0.29 0.21F11 Mixed Sand/Gravel 0.3 0.11
*0.95 Na 2 O eqBold indicates data that failed the testShaded values fall in the "potentially reactive category"
Measurements shown in bold are those that exceeded the 0.2 percent expansion limit for the ASTM C 1260 test or the 0.04 percent expansion limit at 1 year for ASTM C 1293. Measurements with a gray background fall into the 0.1 to 0.2 percent innocuous or potentially deleterious category of ASTM C 1260. This distinction of potentially reactive is included in this chapter owing to its presence in the ASTM C 1260 standard; however, most researchers simply use the 0.10 percent expansion limit as the dividing line between reactive and nonreactive, and much of the overall discussion in this report regarding passing or failure of aggregates (or SCMs) using ASTM C 1260 use a singular limit of 0.10 percent at 14 days. Other values in plain text correspond to values under the 0.1 percent expansion limit (ASTM C 1260) or 0.04 percent limit (ASTM C 1293) indicating innocuous behavior. According to the expansion criteria for this test, six of the eight aggregates showed deleterious behavior in ASTM C 1260 testing. The control, nonreactive fine aggregate, F6, indicated innocuous behavior, as was expected. Aggregate F5 fell between the 0.1 and 0.2 percent expansion at 0.17 percent, which indicates that this aggregate may either be innocuous or could show deleterious expansion and cracking in the field. In this case, further testing including ASTM C 1293 as well as an investigation into field performance and history with this aggregate (or aggregates exhibiting similar results) is strongly encouraged.
All fine aggregates showed a potential for deleterious reaction in the field based on ASTM C 1293 testing. Aggregate F5, which showed either innocuous or potentially deleterious behavior in the field, also fell just on the edge of the expansion criteria in ASTM C 1293 testing. Certainly this aggregate may perform quite well in the field, potentially with lower alkali-content cement or the inclusion of SCMs. However, the somewhat conflicting results from this aggregate points to the need for a test method that produces quick and reliable results for job mixture concrete to assess the potential for deleterious ASR. Current standard test methods do not provide for such results. The best recommendation for this type of aggregate would be to test in an acceptable developed method (future), the use of low-alkali cements and/or the addition of or replacement by SCMs for cement. It is important to keep in mind that simply using low-alkali cement may not be an effective means of controlling ASR. The alkali loading (i.e., the actual amount of alkali present per cubic yard of concrete) is vitally important to determining the potential for alkali-aggregate reactivity in the field. Currently, the best method for evaluating the
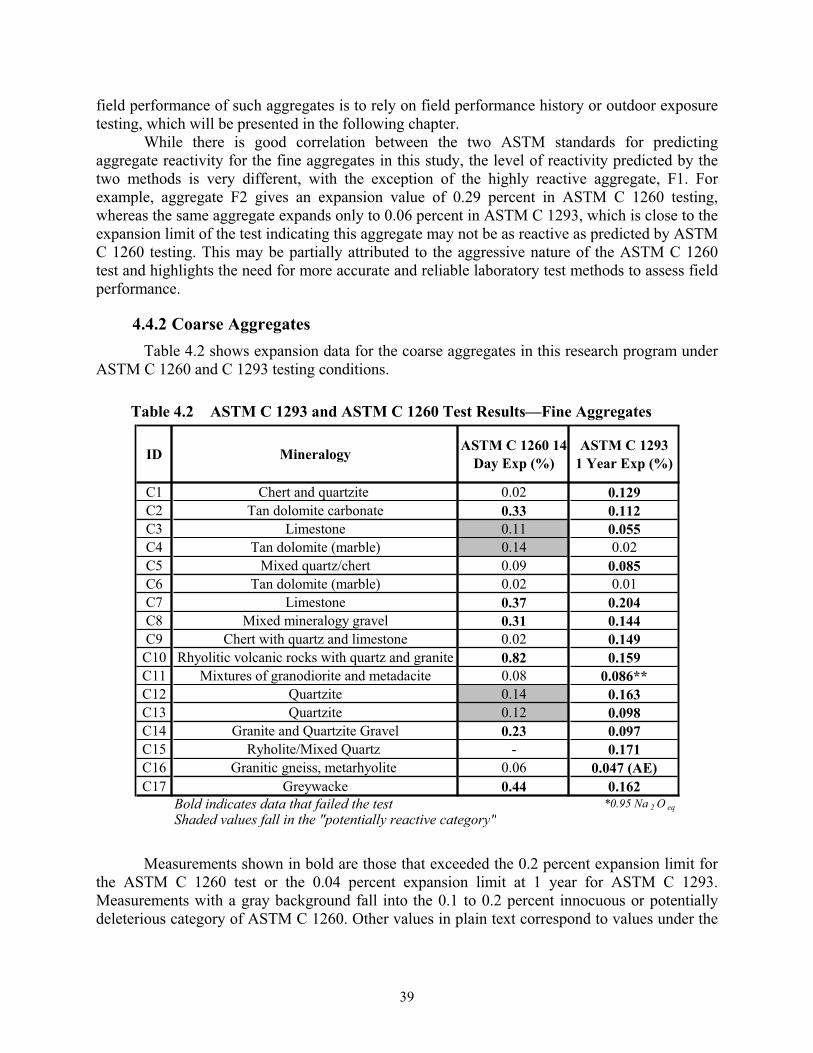
39
field performance of such aggregates is to rely on field performance history or outdoor exposure testing, which will be presented in the following chapter.
While there is good correlation between the two ASTM standards for predicting aggregate reactivity for the fine aggregates in this study, the level of reactivity predicted by the two methods is very different, with the exception of the highly reactive aggregate, F1. For example, aggregate F2 gives an expansion value of 0.29 percent in ASTM C 1260 testing, whereas the same aggregate expands only to 0.06 percent in ASTM C 1293, which is close to the expansion limit of the test indicating this aggregate may not be as reactive as predicted by ASTM C 1260 testing. This may be partially attributed to the aggressive nature of the ASTM C 1260 test and highlights the need for more accurate and reliable laboratory test methods to assess field performance.
4.4.2 Coarse Aggregates Table 4.2 shows expansion data for the coarse aggregates in this research program under
ASTM C 1260 and C 1293 testing conditions.
Table 4.2 ASTM C 1293 and ASTM C 1260 Test Results—Fine Aggregates
ID Mineralogy ASTM C 1260 14 Day Exp (%)
ASTM C 1293 1 Year Exp (%)
C1 Chert and quartzite 0.02 0.129C2 Tan dolomite carbonate 0.33 0.112C3 Limestone 0.11 0.055C4 Tan dolomite (marble) 0.14 0.02C5 Mixed quartz/chert 0.09 0.085C6 Tan dolomite (marble) 0.02 0.01C7 Limestone 0.37 0.204C8 Mixed mineralogy gravel 0.31 0.144C9 Chert with quartz and limestone 0.02 0.149
C10 Rhyolitic volcanic rocks with quartz and granite 0.82 0.159C11 Mixtures of granodiorite and metadacite 0.08 0.086**C12 Quartzite 0.14 0.163C13 Quartzite 0.12 0.098C14 Granite and Quartzite Gravel 0.23 0.097C15 Ryholite/Mixed Quartz - 0.171C16 Granitic gneiss, metarhyolite 0.06 0.047 (AE)C17 Greywacke 0.44 0.162
*0.95 Na 2 O eqBold indicates data that failed the testShaded values fall in the "potentially reactive category"
Measurements shown in bold are those that exceeded the 0.2 percent expansion limit for the ASTM C 1260 test or the 0.04 percent expansion limit at 1 year for ASTM C 1293. Measurements with a gray background fall into the 0.1 to 0.2 percent innocuous or potentially deleterious category of ASTM C 1260. Other values in plain text correspond to values under the
40
0.1 percent expansion limit (ASTM C 1260) or 0.04 percent limit (ASTM C 1293) indicating innocuous behavior.
It is important to note that in the ASTM C 1260 tests, the coarse aggregates have been crushed to meet the grading requirements of the test so that they may be used in a mortar. This crushing may significantly alter a given aggregate’s reactivity by affecting its textural characteristics, and it is also possible that some reactive phases may essentially be washed awayduring this processing. Further research, spurred by the TxDOT 0-4085 project, is now underway using a different test method, the so-called Chinese mortar bar test, which uses a specific, larger particle size range, with the intention of preserving textural features and better capturing the inherent behavior of coarse aggregates when tested in a mortar bar-type test (Du-you et al. 2004). There was generally good agreement between fine aggregates that failed ASTM C 1260 and failed ASTM C 1293. However, there is not a strong agreement between the two tests for coarse aggregates. According to ASTM C 1260 testing, six of the coarse aggregates showed innocuous behavior. As expected the nonreactive control aggregate exhibited little expansion (0.02 percent) at 16 days of age. At the other end of the spectrum, six of the coarse aggregates showed expansions above 0.2 percent, indicating a higher reactivity among these aggregates. Furthermore, four aggregates in the study fell between expansion levels of 0.1 and 0.2 percent at 16 days, indicating the possibility of either reactive behavior or innocuous behavior in the field. While these results may not seem particularly significant yet, it is the subsequent results in ASTM C 1293 testing and further outdoor exposure block testing that bring attention to the discrepancies between standard test methods.
When the same coarse aggregates are tested in ASTM C 1293 conditions, it is surprising that fifteen of the seventeen aggregates exceeded the 0.04 percent expansion limit at 1 year, which points to aggregates that have a potential for deleterious expansion in the field. Only six of these aggregates would be said to have failed the ASTM C 1260 test. Also of interest, the only other aggregate that would be said to pass this test (1293) did not pass the ASTM C 1260 test. Instead it fell within the 0.1 to 0.2 percent expansion criteria indicating that it may be potentially expansive in the field. The only aggregates that passed both tests were the nonreactive control coarse and fine aggregates. Although it can be said that the ASTM C 1260 is an aggressive test, it is often treated as a screening test and aggregates that fail ASTM C 1260 are often then tested in ASTM C 1293 to determine their potential for reactivity.
It is also generally agreed that if an aggregate passes ASTM C 1260, it is either not ASR or it has a low-reactivity level, which will not show deleterious expansion in the field. However, these results show that five of the aggregates that passed the ASTM C 1260 test failed the more reliable ASTM C 1293 test. Many testing agencies would thus never perform ASTM C 1293 testing on these aggregates and would allow their use without mitigation options in structural concrete. Additionally, three aggregates that fell in the gray area of expansion for ASTM C 1260 testing failed the ASTM C 1293 test with expansion values above 0.04 percent at 1 year. Clearly, there is a need for more reliable testing methods to predict reactivity and provide comparable results between accepted standards. It is also important to remember that these aggregates represent a wide range of mineralogical compositions from across North America, which indicates that this is not a problem for aggregates from only one area or one mineralogical composition. Slowly reactive rocks such as certain gneisses, greywackes, argillites, quartzites, and metavolcanics may not expand in this test when combined with high-alkali cement (Grattan-Bellew 1978; Stark 1980).
41
4.5 Use of Supplementary Cementing Materials and LiNO3(selection of showcase bridge mixtures)
Integral to this project in its infancy was the future construction of a showcase bridge. This bridge would be constructed of girders that incorporated known ASR aggregate(s) and proven mitigation options from this research project. Initially, the construction of this bridge was on a fast track and as a result only ASTM C 1260 testing would provide the necessary results for selected mixtures in the short duration that was given for mixture design. For this process, a 14-day expansion limit of 0.10 percent was used as an index for delineating potentially durable from non-durable mixtures. This time-expansion limit as well as the ability to assess SCM has been adopted as ASTM C 1567. After the initial selection of mixture designs using ASTM C 1260 testing, companion mixtures were cast in ASTM C 1293 and in an outdoor exposure block testing facility at the Concrete Durability Center on the J. J. Pickle Research Campus at The University of Texas at Austin. While the details of this mixture selection are carefully outlined in previous theses from this research, and most of the ASTM C 1260 results were recapped in Chapter 3, a brief synopsis will be given so that long-term data may be conveyed in the context of this section of the report.
4.5.1 American Society for Testing and Materials C 1260 Testing—Potential Showcase Bridge Mixtures
As discussed in Chapter 3, aggregate F1 was initially chosen as the fine aggregate for construction of the showcase bridge owing to its high reactivity level (0.64 percent expansion at 14 days of age in ASTM C 1260). However, the levels of SCM replacement, primarily fly ash were so high that the mixtures would not be feasible for construction in a precast operation. Ultimately one of the goals of this project was to demonstrate that reactive aggregates could be used with a wide variety of mitigation options. Aggregate F1 had several limited mitigation options that would actually work in the precast environment. While aggregate F1 was not chosen for this project owing to the nature of construction (precast) and issues with some of the mixtures and the need for high-early strengths it would likely be suitable for a variety of other projects such as pavement applications and cast-in-place structural concrete coupled with less stringent early strength requirements and with proper mitigation options.
After considering other potential aggregate sources for the showcase bridge, an alternative fine aggregate was selected that showed poor field performance in bridge structures in Texas. This aggregate, F7, was also found to be highly reactive in laboratory testing (0.37 percent at 14 days in ASTM C 1260) and more amenable to mitigation methods.
Numerous mitigation techniques were tested using aggregate F7. Figures 4.3 and 4.4 depict the most effective mitigation options.
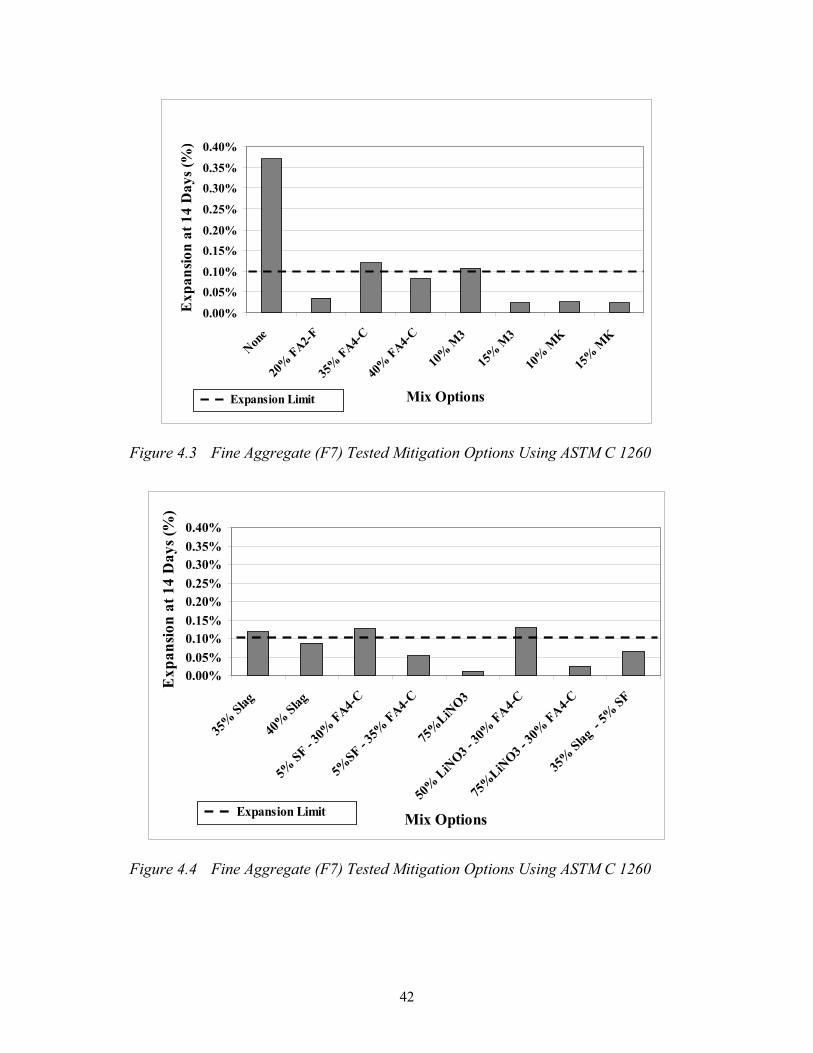
42
0.00%
0.05%0.10%
0.15%0.20%
0.25%
0.30%0.35%
0.40%
None
20%
FA2-F
35%
FA4-C
40%
FA4-C
10%
M3
15%
M3
10%
MK
15%
MK
Mix Options
Exp
ansio
n at
14
Day
s (%
)
Expansion Limit
Figure 4.3 Fine Aggregate (F7) Tested Mitigation Options Using ASTM C 1260
0.00%0.05%0.10%0.15%0.20%0.25%0.30%0.35%0.40%
35%
Slag
40%
Slag
5%SF - 30
% FA4-C
5%SF - 3
5% FA4-C
75%
LiNO3
50%
LiNO3 - 30
% FA4-C
75%
LiNO3 -
30%
FA4-C
35%
Slag- 5%
SF
Mix Options
Exp
ansio
n at
14
Day
s (%
)
Expansion Limit
Figure 4.4 Fine Aggregate (F7) Tested Mitigation Options Using ASTM C 1260
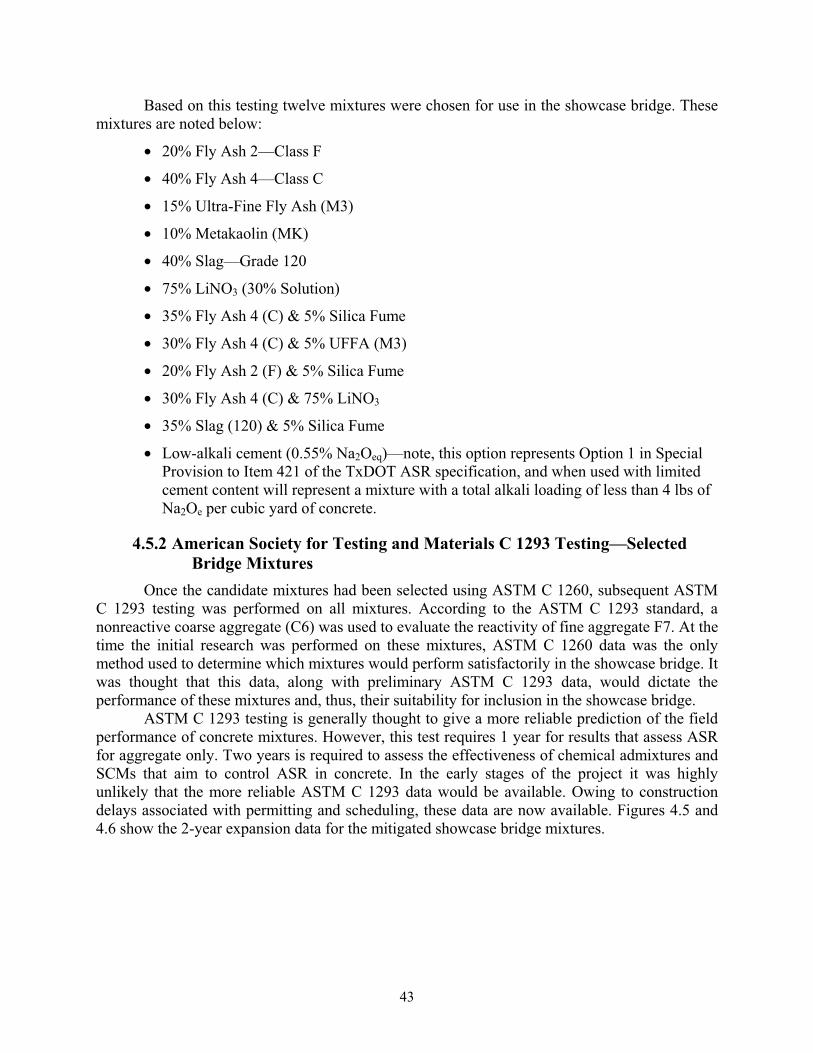
43
Based on this testing twelve mixtures were chosen for use in the showcase bridge. These mixtures are noted below:
• 20% Fly Ash 2—Class F
• 40% Fly Ash 4—Class C
• 15% Ultra-Fine Fly Ash (M3)
• 10% Metakaolin (MK)
• 40% Slag—Grade 120
• 75% LiNO3 (30% Solution)
• 35% Fly Ash 4 (C) & 5% Silica Fume
• 30% Fly Ash 4 (C) & 5% UFFA (M3)
• 20% Fly Ash 2 (F) & 5% Silica Fume
• 30% Fly Ash 4 (C) & 75% LiNO3
• 35% Slag (120) & 5% Silica Fume
• Low-alkali cement (0.55% Na2Oeq)—note, this option represents Option 1 in Special Provision to Item 421 of the TxDOT ASR specification, and when used with limited cement content will represent a mixture with a total alkali loading of less than 4 lbs of Na2Oe per cubic yard of concrete.
4.5.2 American Society for Testing and Materials C 1293 Testing—Selected Bridge Mixtures
Once the candidate mixtures had been selected using ASTM C 1260, subsequent ASTM C 1293 testing was performed on all mixtures. According to the ASTM C 1293 standard, a nonreactive coarse aggregate (C6) was used to evaluate the reactivity of fine aggregate F7. At the time the initial research was performed on these mixtures, ASTM C 1260 data was the only method used to determine which mixtures would perform satisfactorily in the showcase bridge. It was thought that this data, along with preliminary ASTM C 1293 data, would dictate the performance of these mixtures and, thus, their suitability for inclusion in the showcase bridge.
ASTM C 1293 testing is generally thought to give a more reliable prediction of the field performance of concrete mixtures. However, this test requires 1 year for results that assess ASR for aggregate only. Two years is required to assess the effectiveness of chemical admixtures and SCMs that aim to control ASR in concrete. In the early stages of the project it was highly unlikely that the more reliable ASTM C 1293 data would be available. Owing to construction delays associated with permitting and scheduling, these data are now available. Figures 4.5 and 4.6 show the 2-year expansion data for the mitigated showcase bridge mixtures.
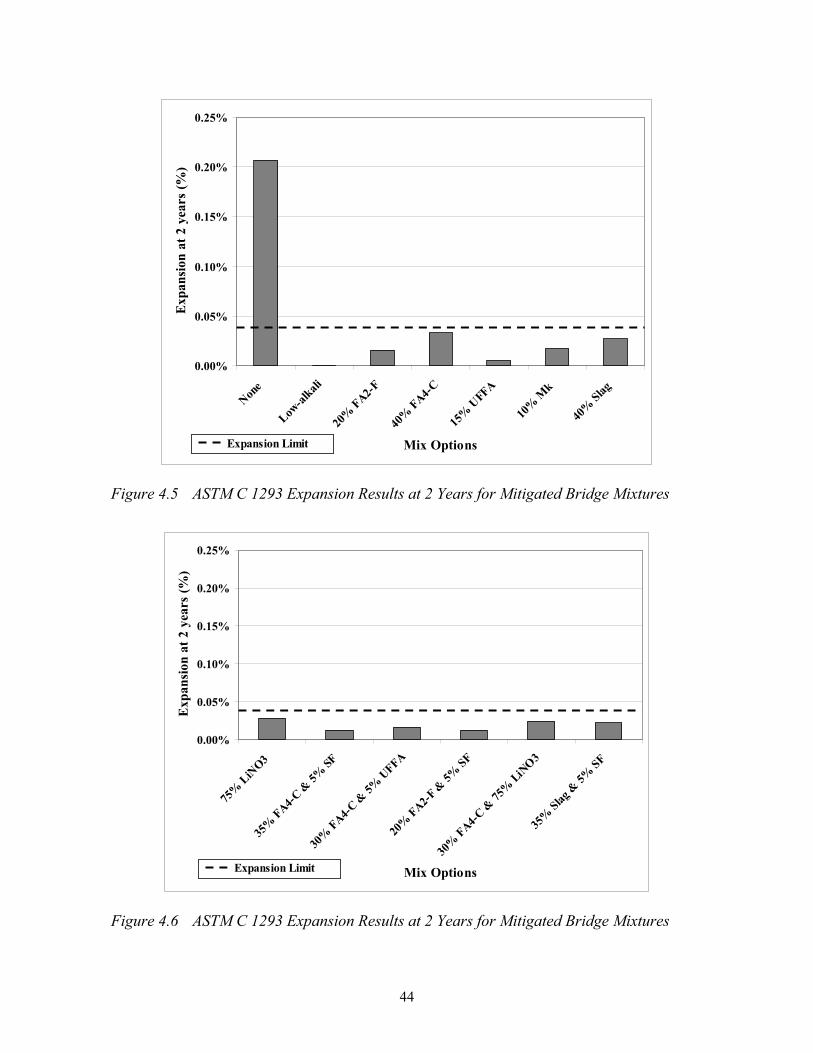
44
0.00%
0.05%
0.10%
0.15%
0.20%
0.25%
None
Low-al
kali
20%
FA2-F
40%
FA4-C
15%
UFFA
10%
Mk
40%
Slag
Mix Options
Exp
ansi
on a
t 2 y
ears
(%)
Expansion Limit
Figure 4.5 ASTM C 1293 Expansion Results at 2 Years for Mitigated Bridge Mixtures
0.00%
0.05%
0.10%
0.15%
0.20%
0.25%
75%
LiNO3
35%
FA4-C &
5% SF
30%
FA4-C& 5%
UFFA
20%
FA2-F& 5%
SF
30%
FA4-C& 75
% LiN
O3
35%
Slag &
5%SF
Mix Options
Exp
ansi
on a
t 2 y
ears
(%)
Expansion Limit
Figure 4.6 ASTM C 1293 Expansion Results at 2 Years for Mitigated Bridge Mixtures
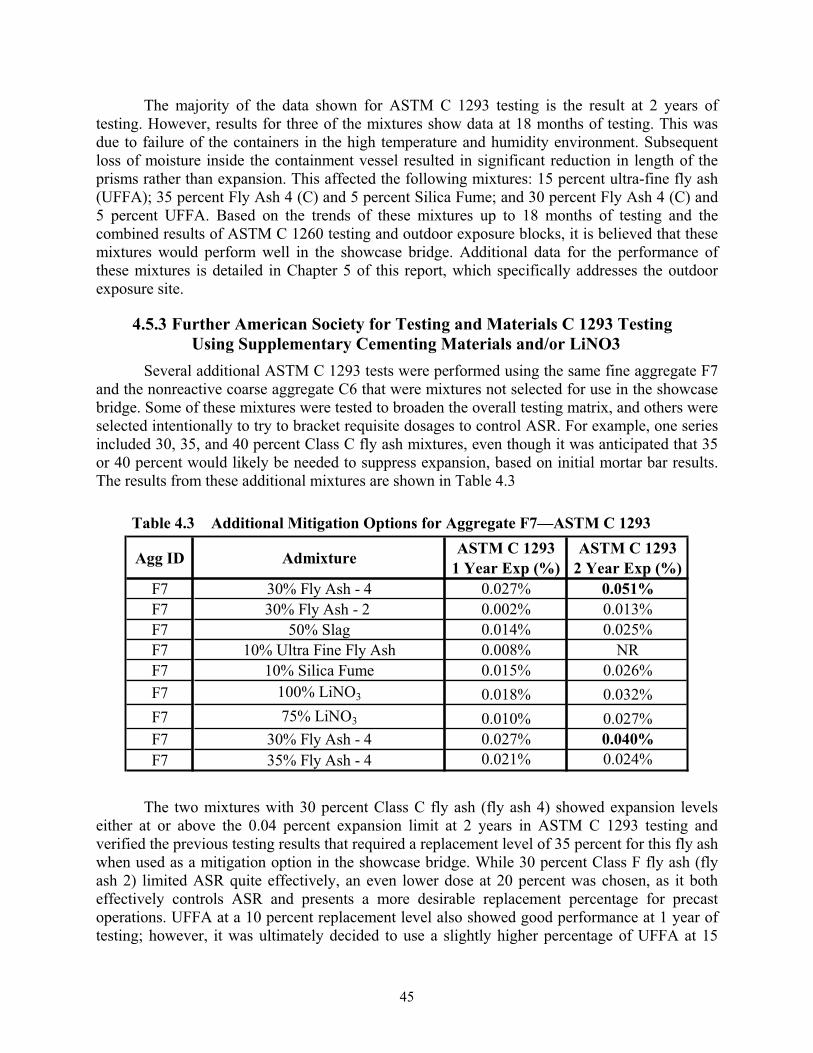
45
The majority of the data shown for ASTM C 1293 testing is the result at 2 years of testing. However, results for three of the mixtures show data at 18 months of testing. This was due to failure of the containers in the high temperature and humidity environment. Subsequent loss of moisture inside the containment vessel resulted in significant reduction in length of the prisms rather than expansion. This affected the following mixtures: 15 percent ultra-fine fly ash (UFFA); 35 percent Fly Ash 4 (C) and 5 percent Silica Fume; and 30 percent Fly Ash 4 (C) and 5 percent UFFA. Based on the trends of these mixtures up to 18 months of testing and the combined results of ASTM C 1260 testing and outdoor exposure blocks, it is believed that these mixtures would perform well in the showcase bridge. Additional data for the performance of these mixtures is detailed in Chapter 5 of this report, which specifically addresses the outdoor exposure site.
4.5.3 Further American Society for Testing and Materials C 1293 Testing Using Supplementary Cementing Materials and/or LiNO3
Several additional ASTM C 1293 tests were performed using the same fine aggregate F7 and the nonreactive coarse aggregate C6 that were mixtures not selected for use in the showcase bridge. Some of these mixtures were tested to broaden the overall testing matrix, and others were selected intentionally to try to bracket requisite dosages to control ASR. For example, one series included 30, 35, and 40 percent Class C fly ash mixtures, even though it was anticipated that 35 or 40 percent would likely be needed to suppress expansion, based on initial mortar bar results. The results from these additional mixtures are shown in Table 4.3
Table 4.3 Additional Mitigation Options for Aggregate F7—ASTM C 1293
Agg ID Admixture ASTM C 1293 1 Year Exp (%)
ASTM C 1293 2 Year Exp (%)
F7 30% Fly Ash - 4 0.027% 0.051%F7 30% Fly Ash - 2 0.002% 0.013%F7 50% Slag 0.014% 0.025%F7 10% Ultra Fine Fly Ash 0.008% NRF7 10% Silica Fume 0.015% 0.026%F7 100% LiNO3 0.018% 0.032%F7 75% LiNO3 0.010% 0.027%F7 30% Fly Ash - 4 0.027% 0.040%F7 35% Fly Ash - 4 0.021% 0.024%
The two mixtures with 30 percent Class C fly ash (fly ash 4) showed expansion levels either at or above the 0.04 percent expansion limit at 2 years in ASTM C 1293 testing and verified the previous testing results that required a replacement level of 35 percent for this fly ash when used as a mitigation option in the showcase bridge. While 30 percent Class F fly ash (fly ash 2) limited ASR quite effectively, an even lower dose at 20 percent was chosen, as it both effectively controls ASR and presents a more desirable replacement percentage for precast operations. UFFA at a 10 percent replacement level also showed good performance at 1 year of testing; however, it was ultimately decided to use a slightly higher percentage of UFFA at 15
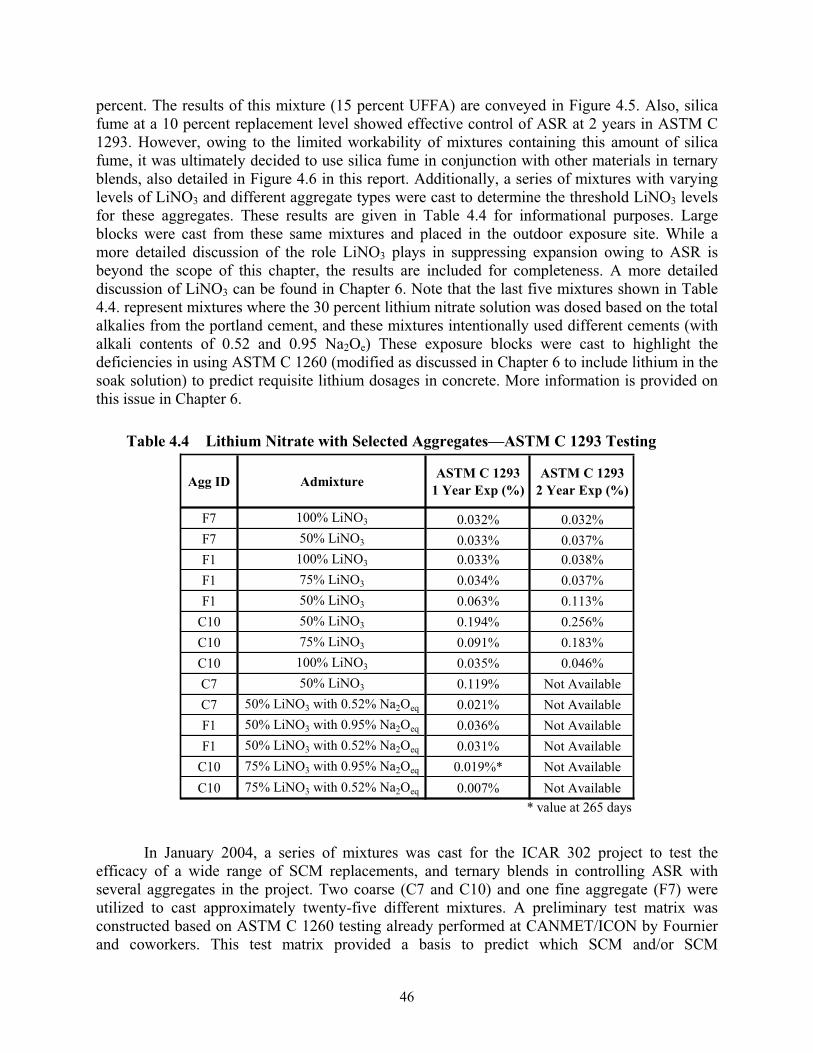
46
percent. The results of this mixture (15 percent UFFA) are conveyed in Figure 4.5. Also, silica fume at a 10 percent replacement level showed effective control of ASR at 2 years in ASTM C 1293. However, owing to the limited workability of mixtures containing this amount of silica fume, it was ultimately decided to use silica fume in conjunction with other materials in ternary blends, also detailed in Figure 4.6 in this report. Additionally, a series of mixtures with varying levels of LiNO3 and different aggregate types were cast to determine the threshold LiNO3 levels for these aggregates. These results are given in Table 4.4 for informational purposes. Large blocks were cast from these same mixtures and placed in the outdoor exposure site. While a more detailed discussion of the role LiNO3 plays in suppressing expansion owing to ASR is beyond the scope of this chapter, the results are included for completeness. A more detailed discussion of LiNO3 can be found in Chapter 6. Note that the last five mixtures shown in Table 4.4. represent mixtures where the 30 percent lithium nitrate solution was dosed based on the total alkalies from the portland cement, and these mixtures intentionally used different cements (with alkali contents of 0.52 and 0.95 Na2Oe) These exposure blocks were cast to highlight the deficiencies in using ASTM C 1260 (modified as discussed in Chapter 6 to include lithium in the soak solution) to predict requisite lithium dosages in concrete. More information is provided on this issue in Chapter 6.
Table 4.4 Lithium Nitrate with Selected Aggregates—ASTM C 1293 Testing
Agg ID Admixture ASTM C 1293 1 Year Exp (%)
ASTM C 12932 Year Exp (%)
F7 100% LiNO3 0.032% 0.032%F7 50% LiNO3 0.033% 0.037%F1 100% LiNO3 0.033% 0.038%F1 75% LiNO3 0.034% 0.037%F1 50% LiNO3 0.063% 0.113%
C10 50% LiNO3 0.194% 0.256%C10 75% LiNO3 0.091% 0.183%C10 100% LiNO3 0.035% 0.046%C7 50% LiNO3 0.119% Not AvailableC7 50% LiNO3 with 0.52% Na2Oeq 0.021% Not AvailableF1 50% LiNO3 with 0.95% Na2Oeq 0.036% Not AvailableF1 50% LiNO3 with 0.52% Na2Oeq 0.031% Not Available
C10 75% LiNO3 with 0.95% Na2Oeq 0.019%* Not AvailableC10 75% LiNO3 with 0.52% Na2Oeq 0.007% Not Available
* value at 265 days
In January 2004, a series of mixtures was cast for the ICAR 302 project to test the efficacy of a wide range of SCM replacements, and ternary blends in controlling ASR with several aggregates in the project. Two coarse (C7 and C10) and one fine aggregate (F7) were utilized to cast approximately twenty-five different mixtures. A preliminary test matrix was constructed based on ASTM C 1260 testing already performed at CANMET/ICON by Fournier and coworkers. This test matrix provided a basis to predict which SCM and/or SCM
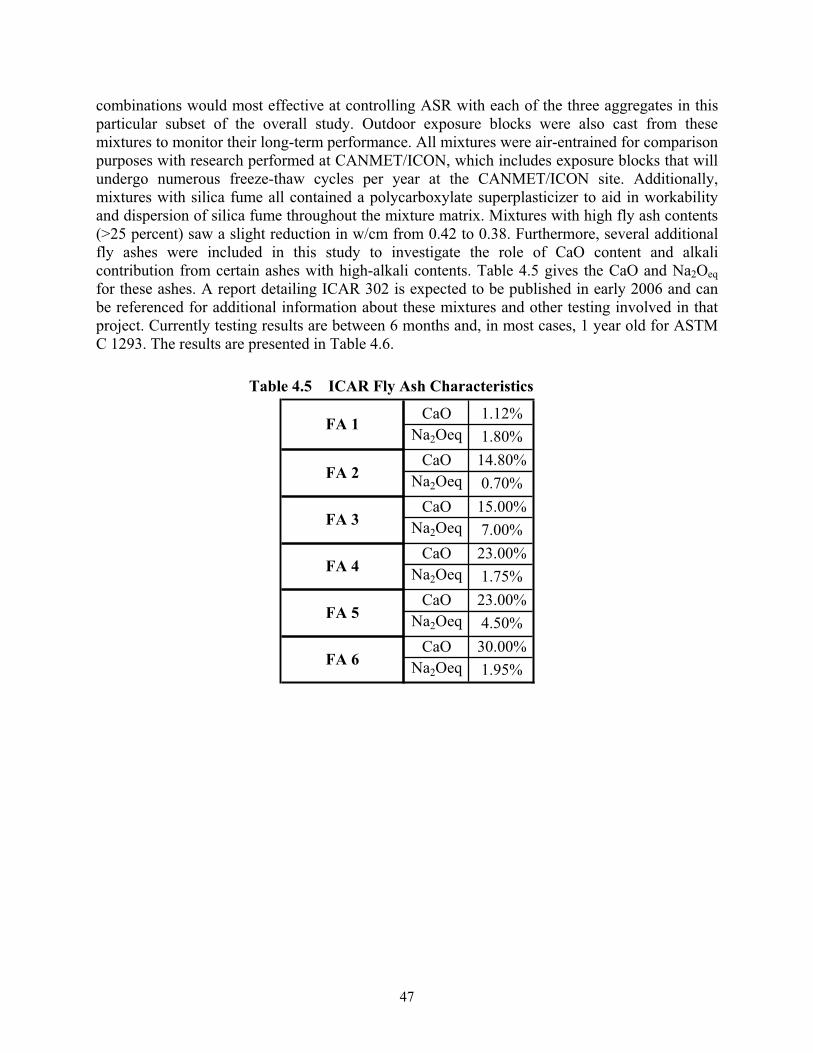
47
combinations would most effective at controlling ASR with each of the three aggregates in this particular subset of the overall study. Outdoor exposure blocks were also cast from these mixtures to monitor their long-term performance. All mixtures were air-entrained for comparison purposes with research performed at CANMET/ICON, which includes exposure blocks that will undergo numerous freeze-thaw cycles per year at the CANMET/ICON site. Additionally, mixtures with silica fume all contained a polycarboxylate superplasticizer to aid in workability and dispersion of silica fume throughout the mixture matrix. Mixtures with high fly ash contents (>25 percent) saw a slight reduction in w/cm from 0.42 to 0.38. Furthermore, several additional fly ashes were included in this study to investigate the role of CaO content and alkali contribution from certain ashes with high-alkali contents. Table 4.5 gives the CaO and Na2Oeqfor these ashes. A report detailing ICAR 302 is expected to be published in early 2006 and can be referenced for additional information about these mixtures and other testing involved in that project. Currently testing results are between 6 months and, in most cases, 1 year old for ASTM C 1293. The results are presented in Table 4.6.
Table 4.5 ICAR Fly Ash Characteristics
CaO 1.12%Na2Oeq 1.80%
CaO 14.80%Na2Oeq 0.70%
CaO 15.00%Na2Oeq 7.00%
CaO 23.00%Na2Oeq 1.75%
CaO 23.00%Na2Oeq 4.50%
CaO 30.00%Na2Oeq 1.95%
FA 5
FA 6
FA 1
FA 2
FA 3
FA 4
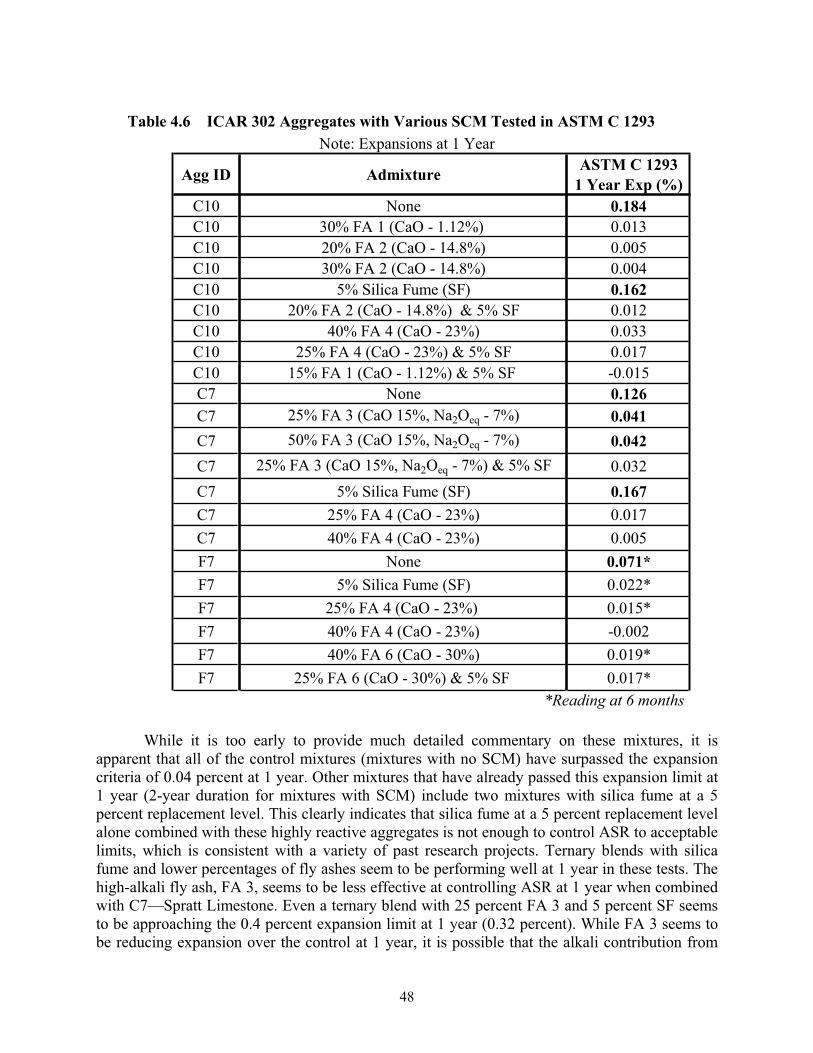
48
Table 4.6 ICAR 302 Aggregates with Various SCM Tested in ASTM C 1293 Note: Expansions at 1 Year
Agg ID Admixture ASTM C 1293 1 Year Exp (%)
C10 None 0.184C10 30% FA 1 (CaO - 1.12%) 0.013C10 20% FA 2 (CaO - 14.8%) 0.005C10 30% FA 2 (CaO - 14.8%) 0.004C10 5% Silica Fume (SF) 0.162C10 20% FA 2 (CaO - 14.8%) & 5% SF 0.012C10 40% FA 4 (CaO - 23%) 0.033C10 25% FA 4 (CaO - 23%) & 5% SF 0.017C10 15% FA 1 (CaO - 1.12%) & 5% SF -0.015C7 None 0.126C7 25% FA 3 (CaO 15%, Na2Oeq - 7%) 0.041C7 50% FA 3 (CaO 15%, Na2Oeq - 7%) 0.042C7 25% FA 3 (CaO 15%, Na2Oeq - 7%) & 5% SF 0.032C7 5% Silica Fume (SF) 0.167C7 25% FA 4 (CaO - 23%) 0.017C7 40% FA 4 (CaO - 23%) 0.005F7 None 0.071*F7 5% Silica Fume (SF) 0.022*F7 25% FA 4 (CaO - 23%) 0.015*F7 40% FA 4 (CaO - 23%) -0.002F7 40% FA 6 (CaO - 30%) 0.019*F7 25% FA 6 (CaO - 30%) & 5% SF 0.017*
*Reading at 6 months
While it is too early to provide much detailed commentary on these mixtures, it is apparent that all of the control mixtures (mixtures with no SCM) have surpassed the expansion criteria of 0.04 percent at 1 year. Other mixtures that have already passed this expansion limit at 1 year (2-year duration for mixtures with SCM) include two mixtures with silica fume at a 5 percent replacement level. This clearly indicates that silica fume at a 5 percent replacement level alone combined with these highly reactive aggregates is not enough to control ASR to acceptable limits, which is consistent with a variety of past research projects. Ternary blends with silica fume and lower percentages of fly ashes seem to be performing well at 1 year in these tests. The high-alkali fly ash, FA 3, seems to be less effective at controlling ASR at 1 year when combined with C7—Spratt Limestone. Even a ternary blend with 25 percent FA 3 and 5 percent SF seems to be approaching the 0.4 percent expansion limit at 1 year (0.32 percent). While FA 3 seems to be reducing expansion over the control at 1 year, it is possible that the alkali contribution from
49
this particular fly ash is enough to make it virtually ineffective at controlling ASR with highly reactive aggregate such as Spratt Limestone.
4.6 Accelerated American Society for Testing and Materials C 1293, Conducted at 140° F (60° C)
As mentioned in Section 4.2 of this report, much attention has been given to accelerating the traditional ASTM C 1293 or CPT by increasing the storage temperature from 100° F (38° C) to 140° F (60° C). While there have been many papers published purporting the potential use of such a test and a variety of expansion criteria proposed (often based on aggregate type), this test has yet to gain widespread acceptance in the testing community and as of this report has not been accepted as a standard to major testing bodies such as ASTM, CSA, American Association of State Highway and Transportation Officials (AASHTO), or RILEM. Reasons for reluctant acceptance of this test center on the lack of strong evidence and often conflicting test results showing a correlation between the traditional 1-year test length and a shortened length of 3–6 months. One of the goals of this research project was to corroborate previous work done under ICAR 301 by Touma and coworkers (Touma 2000; Touma et. al 2001). It was thought initiallythat several verification tests would demonstrate the strong correlation found under that research project and a subsequent strong push for acceptance of this test method would be made with appropriate agencies. However, initial testing found quite contrary results and a lengthy study ensued to determine the variability in test results. The discussion for these limitations to accelerating the current test methods will be provided in two sections: correlation of accelerated results with traditional results and interlaboratory discrepancies at 140° F (60° C). The results conveyed will focus on two coarse aggregates, Spratt and Sudbury, as the majority of work between various testing agencies and laboratories within this study use these two aggregates as interlaboratory standards. Spratt is a limestone and Sudbury is mixed mineralogy gravel.
4.6.1 Correlation of Accelerated Results with Traditional Results
Expansion Results Appendix B, Tables 1-5 and Appendix C, Table 1 summarize the expansion data for the
fine aggregates and coarse aggregates included in the overall study, respectively. The tables include the expansion values at various test ages for tests conducted at both 100° F (38° C) and 140° F (60° C); each data point represents the average of four concrete prisms. This comparison only includes those aggregates for which a complete set of data was available up to these test ages (e.g., 3 months at 60° C and 1 year at 38° C); some of the mixtures had not yet reached these ages of testing and are designated with “-” in the two tables (Folliard et al. in press).
Given that previous studies [Touma et al. (2001) and De Grosbois and Fontaine (2000)] tend to compare expansion data after 1 year of testing at 100° F (38° C) to expansions after 3 months at 140° F (60° C), such comparisons are of interest for the current research project. This comparison is also relevant in that organizations such as ASTM, CSA, and RILEM are evaluating the accelerated version of the test and are considering data in the 2- to 4-month range as potential indicators of standard ASTM C 1293 tests conducted at 100° F (38° C) after 1 year. In evaluating the data in Tables 1-5, it is evident that there is not a strong correlation between 3-month expansion data at 140° F (60° C) and 1-year expansion data at 100° F (38° C). Three-month expansions at 140° F (60° C) were approximately 62 percent and 53 percent of the 1-year
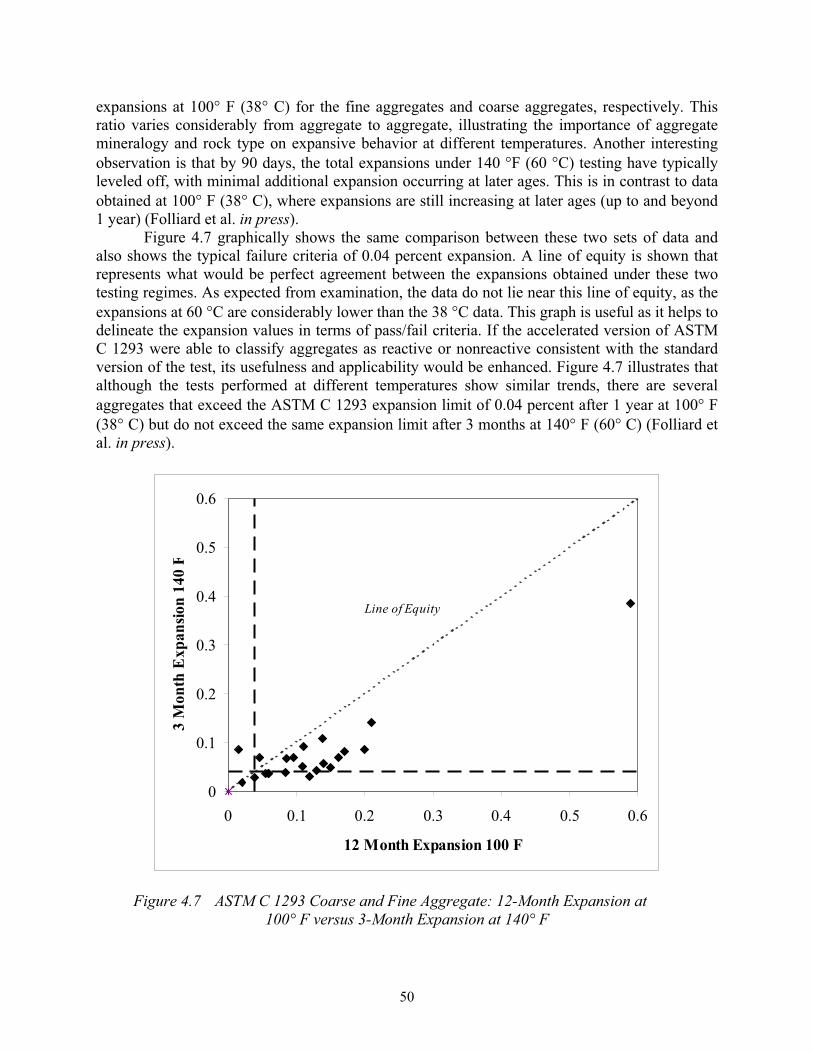
50
expansions at 100° F (38° C) for the fine aggregates and coarse aggregates, respectively. This ratio varies considerably from aggregate to aggregate, illustrating the importance of aggregate mineralogy and rock type on expansive behavior at different temperatures. Another interesting observation is that by 90 days, the total expansions under 140 °F (60 °C) testing have typically leveled off, with minimal additional expansion occurring at later ages. This is in contrast to data obtained at 100° F (38° C), where expansions are still increasing at later ages (up to and beyond 1 year) (Folliard et al. in press).
Figure 4.7 graphically shows the same comparison between these two sets of data and also shows the typical failure criteria of 0.04 percent expansion. A line of equity is shown that represents what would be perfect agreement between the expansions obtained under these two testing regimes. As expected from examination, the data do not lie near this line of equity, as the expansions at 60 °C are considerably lower than the 38 °C data. This graph is useful as it helps to delineate the expansion values in terms of pass/fail criteria. If the accelerated version of ASTM C 1293 were able to classify aggregates as reactive or nonreactive consistent with the standard version of the test, its usefulness and applicability would be enhanced. Figure 4.7 illustrates that although the tests performed at different temperatures show similar trends, there are several aggregates that exceed the ASTM C 1293 expansion limit of 0.04 percent after 1 year at 100° F (38° C) but do not exceed the same expansion limit after 3 months at 140° F (60° C) (Folliard et al. in press).
0
0.1
0.2
0.3
0.4
0.5
0.6
0 0.1 0.2 0.3 0.4 0.5 0.6
12 Month Expansion 100 F
3 M
onth
Exp
ansio
n 14
0 F
Line of Equity
Figure 4.7 ASTM C 1293 Coarse and Fine Aggregate: 12-Month Expansion at 100° F versus 3-Month Expansion at 140° F
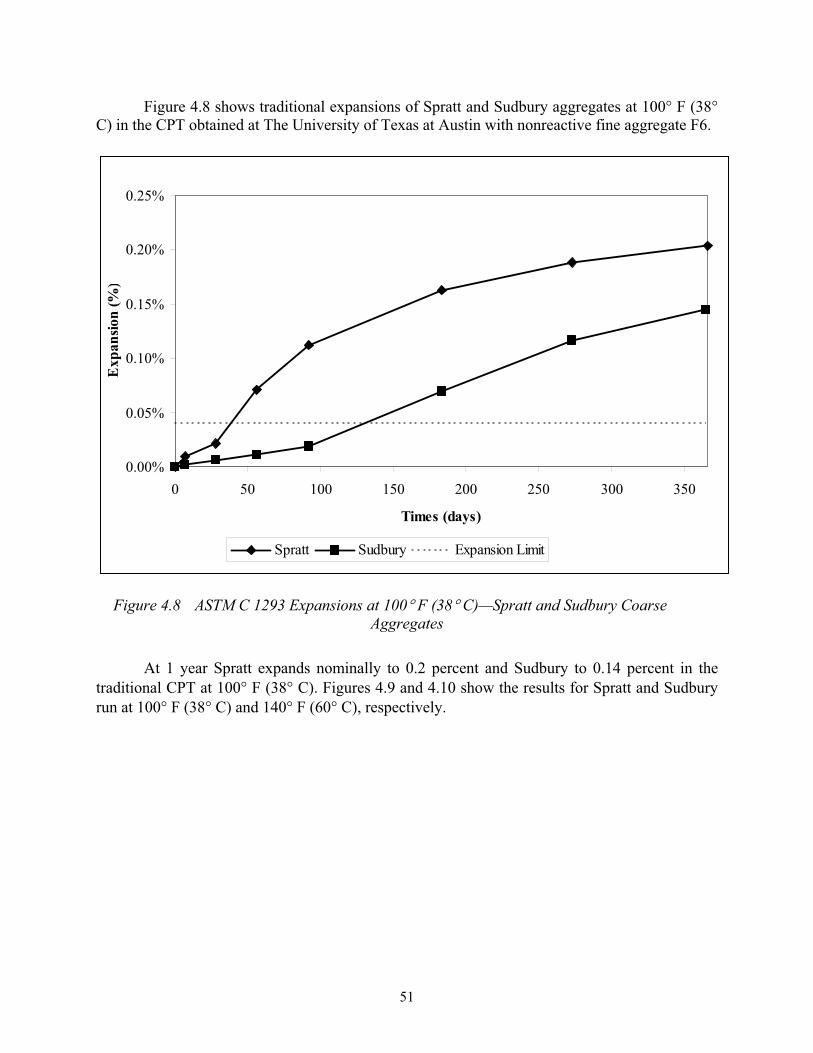
51
Figure 4.8 shows traditional expansions of Spratt and Sudbury aggregates at 100° F (38°C) in the CPT obtained at The University of Texas at Austin with nonreactive fine aggregate F6.
0.00%
0.05%
0.10%
0.15%
0.20%
0.25%
0 50 100 150 200 250 300 350
Times (days)
Exp
ansio
n (%
)
Spratt Sudbury Expansion Limit
Figure 4.8 ASTM C 1293 Expansions at 100° F (38° C)—Spratt and Sudbury Coarse Aggregates
At 1 year Spratt expands nominally to 0.2 percent and Sudbury to 0.14 percent in the traditional CPT at 100° F (38° C). Figures 4.9 and 4.10 show the results for Spratt and Sudbury run at 100° F (38° C) and 140° F (60° C), respectively.
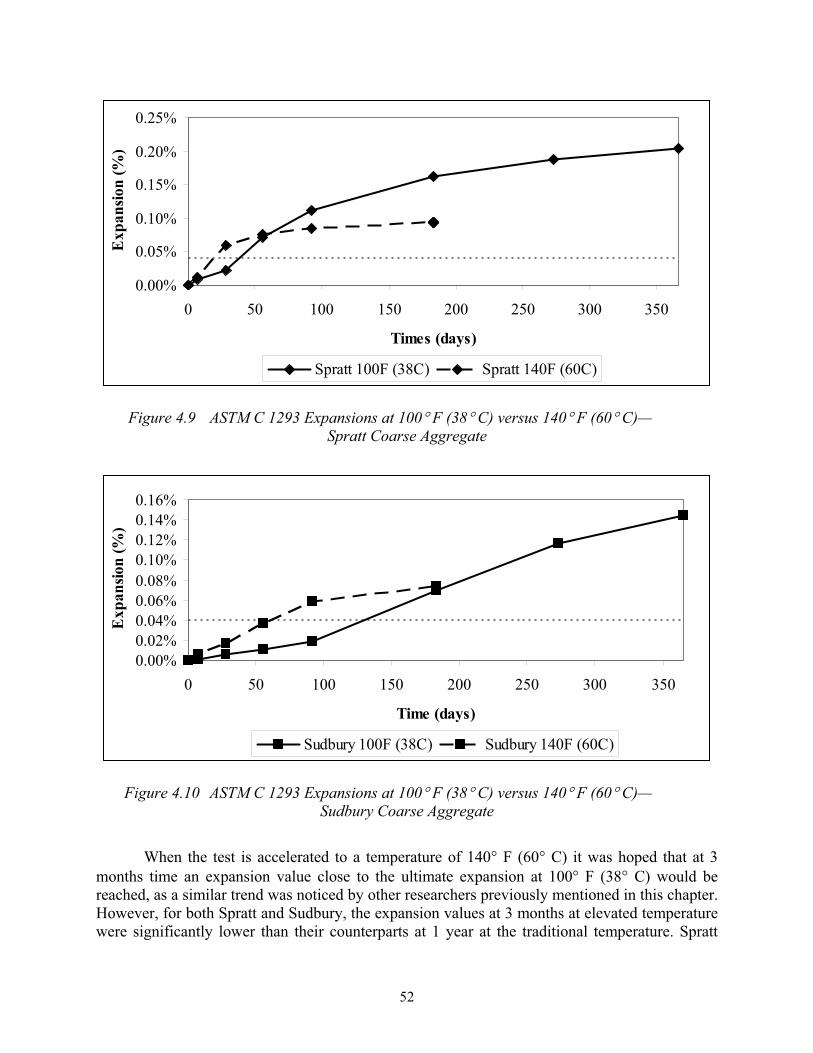
52
0.00%
0.05%
0.10%
0.15%
0.20%
0.25%
0 50 100 150 200 250 300 350
Times (days)
Exp
ansio
n (%
)
Spratt 100F (38C) Spratt 140F (60C)
Figure 4.9 ASTM C 1293 Expansions at 100° F (38° C) versus 140° F (60° C)—Spratt Coarse Aggregate
0.00%0.02%0.04%0.06%0.08%0.10%0.12%0.14%0.16%
0 50 100 150 200 250 300 350
Time (days)
Exp
ansio
n (%
)
Sudbury 100F (38C) Sudbury 140F (60C)
Figure 4.10 ASTM C 1293 Expansions at 100° F (38° C) versus 140° F (60° C)—Sudbury Coarse Aggregate
When the test is accelerated to a temperature of 140° F (60° C) it was hoped that at 3 months time an expansion value close to the ultimate expansion at 100° F (38° C) would be reached, as a similar trend was noticed by other researchers previously mentioned in this chapter. However, for both Spratt and Sudbury, the expansion values at 3 months at elevated temperature were significantly lower than their counterparts at 1 year at the traditional temperature. Spratt
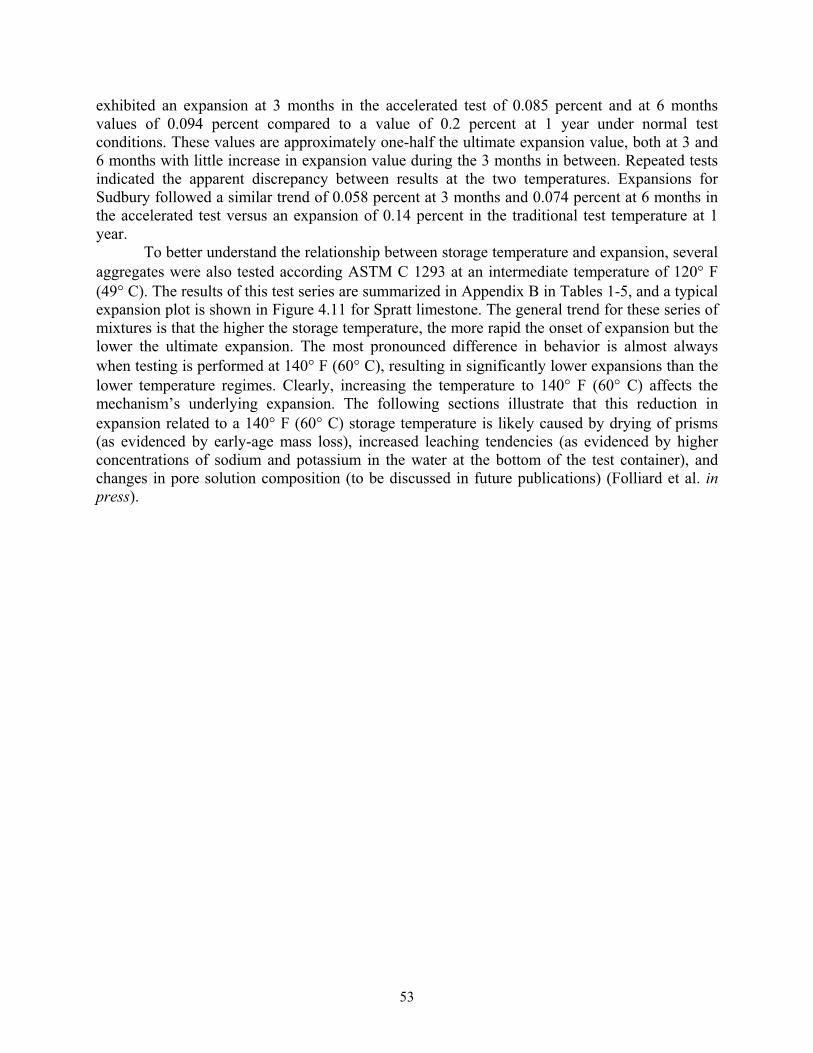
53
exhibited an expansion at 3 months in the accelerated test of 0.085 percent and at 6 months values of 0.094 percent compared to a value of 0.2 percent at 1 year under normal test conditions. These values are approximately one-half the ultimate expansion value, both at 3 and 6 months with little increase in expansion value during the 3 months in between. Repeated tests indicated the apparent discrepancy between results at the two temperatures. Expansions for Sudbury followed a similar trend of 0.058 percent at 3 months and 0.074 percent at 6 months in the accelerated test versus an expansion of 0.14 percent in the traditional test temperature at 1 year.
To better understand the relationship between storage temperature and expansion, several aggregates were also tested according ASTM C 1293 at an intermediate temperature of 120° F (49° C). The results of this test series are summarized in Appendix B in Tables 1-5, and a typical expansion plot is shown in Figure 4.11 for Spratt limestone. The general trend for these series of mixtures is that the higher the storage temperature, the more rapid the onset of expansion but the lower the ultimate expansion. The most pronounced difference in behavior is almost always when testing is performed at 140° F (60° C), resulting in significantly lower expansions than the lower temperature regimes. Clearly, increasing the temperature to 140° F (60° C) affects the mechanism’s underlying expansion. The following sections illustrate that this reduction in expansion related to a 140° F (60° C) storage temperature is likely caused by drying of prisms (as evidenced by early-age mass loss), increased leaching tendencies (as evidenced by higher concentrations of sodium and potassium in the water at the bottom of the test container), and changes in pore solution composition (to be discussed in future publications) (Folliard et al. in press).
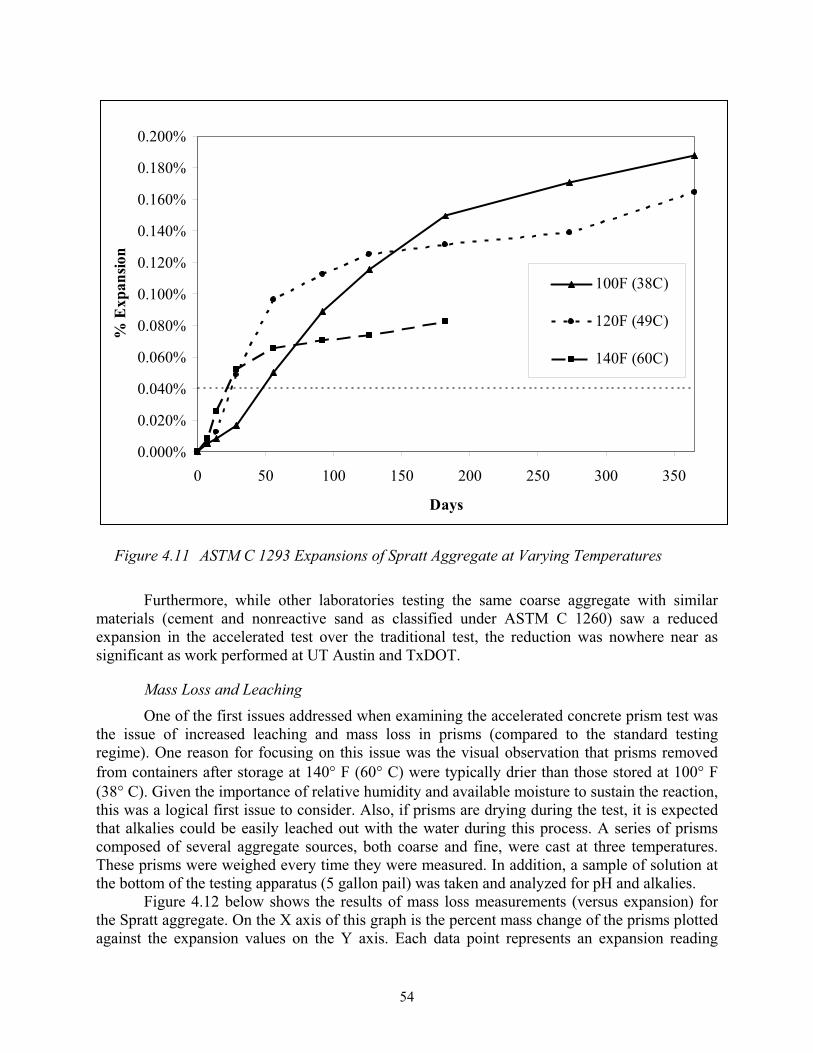
54
0.000%
0.020%
0.040%
0.060%
0.080%
0.100%
0.120%
0.140%
0.160%
0.180%
0.200%
0 50 100 150 200 250 300 350
Days
% E
xpan
sion
100F (38C)
120F (49C)
140F (60C)
Figure 4.11 ASTM C 1293 Expansions of Spratt Aggregate at Varying Temperatures
Furthermore, while other laboratories testing the same coarse aggregate with similar materials (cement and nonreactive sand as classified under ASTM C 1260) saw a reduced expansion in the accelerated test over the traditional test, the reduction was nowhere near as significant as work performed at UT Austin and TxDOT.
Mass Loss and Leaching One of the first issues addressed when examining the accelerated concrete prism test was
the issue of increased leaching and mass loss in prisms (compared to the standard testing regime). One reason for focusing on this issue was the visual observation that prisms removed from containers after storage at 140° F (60° C) were typically drier than those stored at 100° F (38° C). Given the importance of relative humidity and available moisture to sustain the reaction, this was a logical first issue to consider. Also, if prisms are drying during the test, it is expected that alkalies could be easily leached out with the water during this process. A series of prisms composed of several aggregate sources, both coarse and fine, were cast at three temperatures. These prisms were weighed every time they were measured. In addition, a sample of solution at the bottom of the testing apparatus (5 gallon pail) was taken and analyzed for pH and alkalies.
Figure 4.12 below shows the results of mass loss measurements (versus expansion) for the Spratt aggregate. On the X axis of this graph is the percent mass change of the prisms plotted against the expansion values on the Y axis. Each data point represents an expansion reading
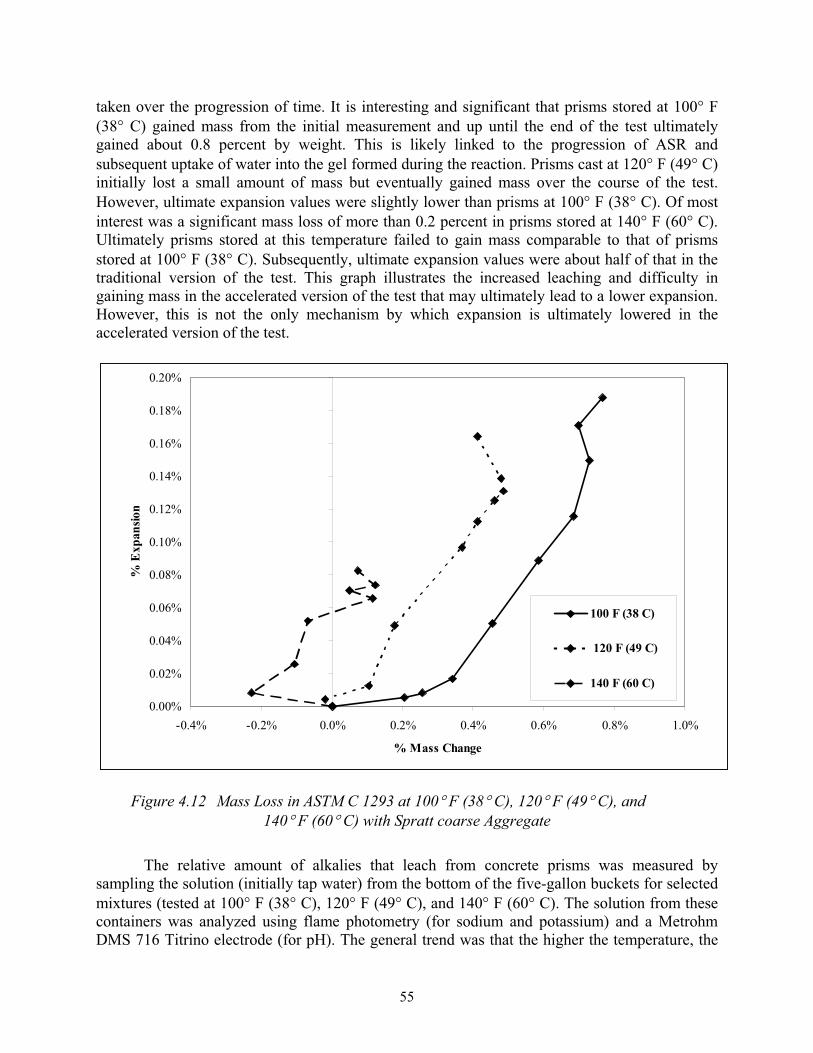
55
taken over the progression of time. It is interesting and significant that prisms stored at 100° F (38° C) gained mass from the initial measurement and up until the end of the test ultimately gained about 0.8 percent by weight. This is likely linked to the progression of ASR and subsequent uptake of water into the gel formed during the reaction. Prisms cast at 120° F (49° C) initially lost a small amount of mass but eventually gained mass over the course of the test. However, ultimate expansion values were slightly lower than prisms at 100° F (38° C). Of most interest was a significant mass loss of more than 0.2 percent in prisms stored at 140° F (60° C). Ultimately prisms stored at this temperature failed to gain mass comparable to that of prisms stored at 100° F (38° C). Subsequently, ultimate expansion values were about half of that in the traditional version of the test. This graph illustrates the increased leaching and difficulty in gaining mass in the accelerated version of the test that may ultimately lead to a lower expansion. However, this is not the only mechanism by which expansion is ultimately lowered in the accelerated version of the test.
0.00%
0.02%
0.04%
0.06%
0.08%
0.10%
0.12%
0.14%
0.16%
0.18%
0.20%
-0.4% -0.2% 0.0% 0.2% 0.4% 0.6% 0.8% 1.0%
% Mass Change
% E
xpan
sion
100 F (38 C)
120 F (49 C)
140 F (60 C)
Figure 4.12 Mass Loss in ASTM C 1293 at 100° F (38° C), 120° F (49° C), and 140° F (60° C) with Spratt coarse Aggregate
The relative amount of alkalies that leach from concrete prisms was measured by sampling the solution (initially tap water) from the bottom of the five-gallon buckets for selected mixtures (tested at 100° F (38° C), 120° F (49° C), and 140° F (60° C). The solution from these containers was analyzed using flame photometry (for sodium and potassium) and a Metrohm DMS 716 Titrino electrode (for pH). The general trend was that the higher the temperature, the
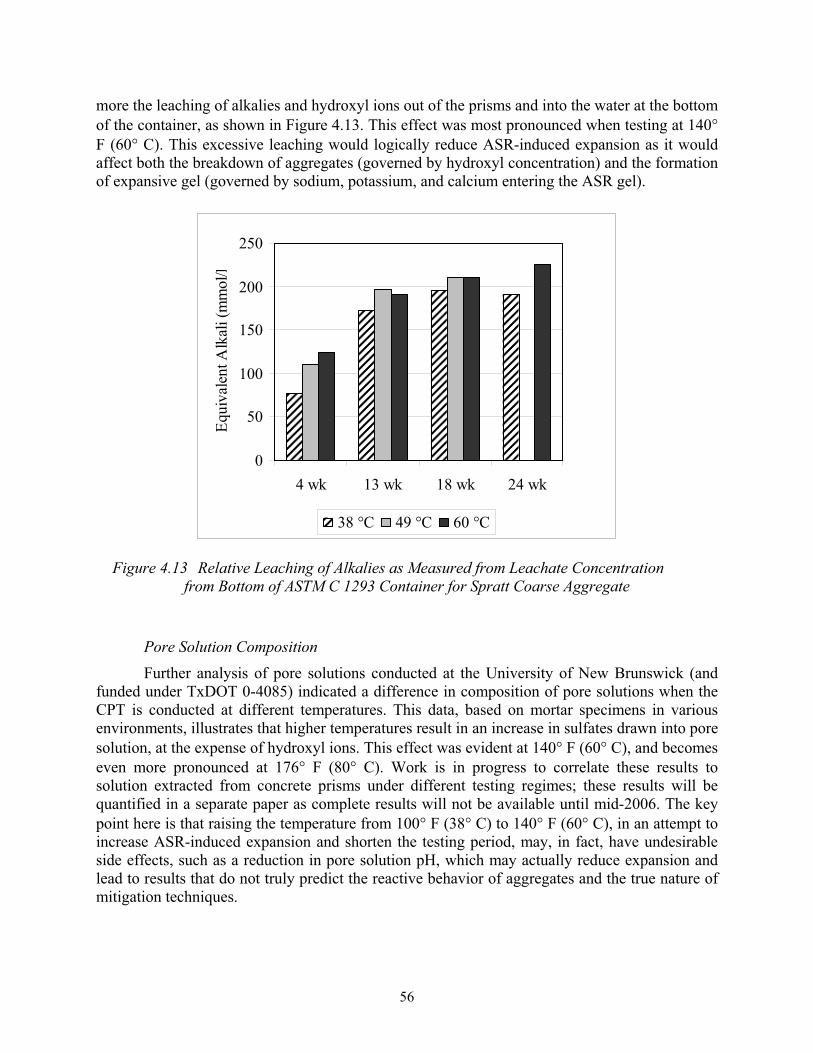
56
more the leaching of alkalies and hydroxyl ions out of the prisms and into the water at the bottom of the container, as shown in Figure 4.13. This effect was most pronounced when testing at 140°F (60° C). This excessive leaching would logically reduce ASR-induced expansion as it would affect both the breakdown of aggregates (governed by hydroxyl concentration) and the formation of expansive gel (governed by sodium, potassium, and calcium entering the ASR gel).
Figure 4.13 Relative Leaching of Alkalies as Measured from Leachate Concentration from Bottom of ASTM C 1293 Container for Spratt Coarse Aggregate
Pore Solution Composition Further analysis of pore solutions conducted at the University of New Brunswick (and
funded under TxDOT 0-4085) indicated a difference in composition of pore solutions when the CPT is conducted at different temperatures. This data, based on mortar specimens in various environments, illustrates that higher temperatures result in an increase in sulfates drawn into pore solution, at the expense of hydroxyl ions. This effect was evident at 140° F (60° C), and becomes even more pronounced at 176° F (80° C). Work is in progress to correlate these results to solution extracted from concrete prisms under different testing regimes; these results will be quantified in a separate paper as complete results will not be available until mid-2006. The key point here is that raising the temperature from 100° F (38° C) to 140° F (60° C), in an attempt to increase ASR-induced expansion and shorten the testing period, may, in fact, have undesirable side effects, such as a reduction in pore solution pH, which may actually reduce expansion and lead to results that do not truly predict the reactive behavior of aggregates and the true nature of mitigation techniques.
0
50
100
150
200
250
4 wk 13 wk 18 wk 24 wk
Equi
vale
nt A
lkal
i (m
mol
/L
38 °C 49 °C 60 °C
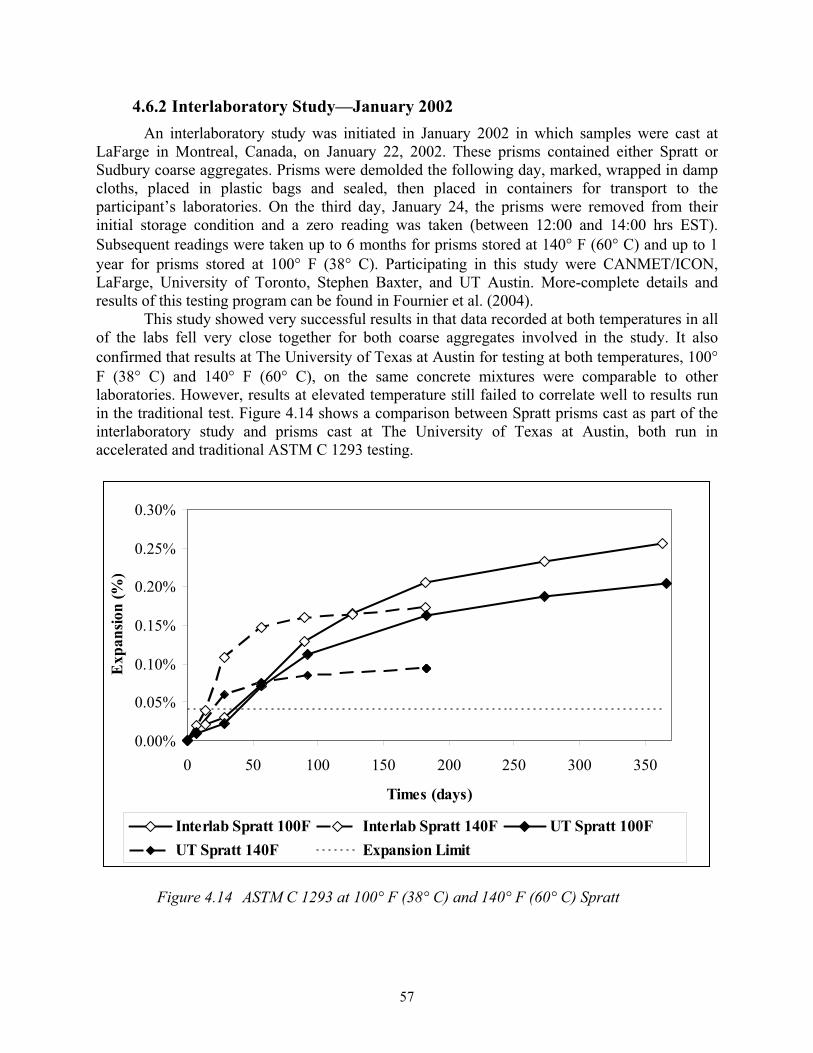
57
4.6.2 Interlaboratory Study—January 2002 An interlaboratory study was initiated in January 2002 in which samples were cast at
LaFarge in Montreal, Canada, on January 22, 2002. These prisms contained either Spratt or Sudbury coarse aggregates. Prisms were demolded the following day, marked, wrapped in damp cloths, placed in plastic bags and sealed, then placed in containers for transport to the participant’s laboratories. On the third day, January 24, the prisms were removed from their initial storage condition and a zero reading was taken (between 12:00 and 14:00 hrs EST). Subsequent readings were taken up to 6 months for prisms stored at 140° F (60° C) and up to 1 year for prisms stored at 100° F (38° C). Participating in this study were CANMET/ICON, LaFarge, University of Toronto, Stephen Baxter, and UT Austin. More-complete details and results of this testing program can be found in Fournier et al. (2004).
This study showed very successful results in that data recorded at both temperatures in all of the labs fell very close together for both coarse aggregates involved in the study. It also confirmed that results at The University of Texas at Austin for testing at both temperatures, 100°F (38° C) and 140° F (60° C), on the same concrete mixtures were comparable to other laboratories. However, results at elevated temperature still failed to correlate well to results run in the traditional test. Figure 4.14 shows a comparison between Spratt prisms cast as part of the interlaboratory study and prisms cast at The University of Texas at Austin, both run in accelerated and traditional ASTM C 1293 testing.
0.00%
0.05%
0.10%
0.15%
0.20%
0.25%
0.30%
0 50 100 150 200 250 300 350
Times (days)
Exp
ansio
n (%
)
Interlab Spratt 100F Interlab Spratt 140F UT Spratt 100FUT Spratt 140F Expansion Limit
Figure 4.14 ASTM C 1293 at 100° F (38° C) and 140° F (60° C) Spratt
58
This graph shows a reasonable correlation at 100° F (38° C) for prisms measured in the same laboratory but cast at different locations when the same coarse aggregate type (sources within the quarry may vary) is used. This agreement is also good in the conventional ASTM C 1293 when prisms are cast and measured at different laboratories. For brevity, detailed results of such testing will not be conveyed. However, what is important to notice is that expansions in the accelerated version of the test vary significantly between materials batched and cast in one location as compared to tests run using materials specific to the laboratory at The University of Texas (coarse aggregate source the same). Certainly, one of the goals of modifying a test method is reproducible results within a laboratory and between other laboratories performing the same test.
Overall the expansion in the accelerated version is likely reduced owing to increased leaching and a change in pore solution composition at elevated temperature, as previously discussed. It is also likely that reaction kinetics play an important role in altering results at increased temperatures. However, what is extremely odd is the large difference in expansion at 140° F (60° C) between different laboratories. In the summer 2003, an extensive study to examine any possible difference between testing laboratories was initiated. Possible reasons for a difference are included below and were the starting point for the laboratories’ investigative strategy.
• Cement differences
• Water
• Aggregate source - fine
• Aggregate source - coarse
• Mold differences
• Mold release agent
• Mixing procedures
• Storage containers
• Measurement procedures
• Ovens
• Elevation
The interlaboratory study conducted in 2002 effectively eliminates the following from this list: aggregate source—coarse, storage containers, measurement procedures, ovens, and elevation. Because results from each lab were quite close, these parameters were not affecting the difference in expansions between the labs at elevated temperature. This narrowed the list slightly to:
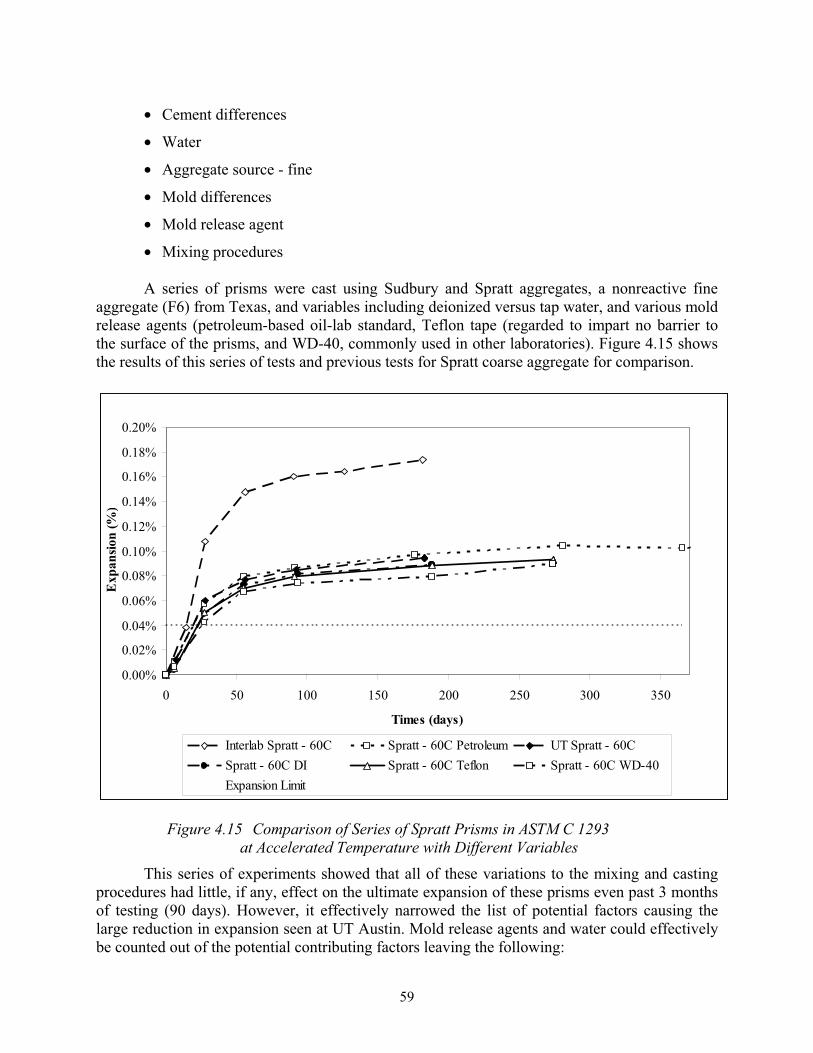
59
• Cement differences
• Water
• Aggregate source - fine
• Mold differences
• Mold release agent
• Mixing procedures
A series of prisms were cast using Sudbury and Spratt aggregates, a nonreactive fine aggregate (F6) from Texas, and variables including deionized versus tap water, and various mold release agents (petroleum-based oil-lab standard, Teflon tape (regarded to impart no barrier to the surface of the prisms, and WD-40, commonly used in other laboratories). Figure 4.15 shows the results of this series of tests and previous tests for Spratt coarse aggregate for comparison.
0.00%
0.02%
0.04%
0.06%
0.08%
0.10%
0.12%
0.14%
0.16%
0.18%
0.20%
0 50 100 150 200 250 300 350
Times (days)
Exp
ansio
n (%
)
Interlab Spratt - 60C Spratt - 60C Petroleum UT Spratt - 60CSpratt - 60C DI Spratt - 60C Teflon Spratt - 60C WD-40Expansion Limit
Figure 4.15 Comparison of Series of Spratt Prisms in ASTM C 1293 at Accelerated Temperature with Different Variables
This series of experiments showed that all of these variations to the mixing and casting procedures had little, if any, effect on the ultimate expansion of these prisms even past 3 months of testing (90 days). However, it effectively narrowed the list of potential factors causing the large reduction in expansion seen at UT Austin. Mold release agents and water could effectively be counted out of the potential contributing factors leaving the following:
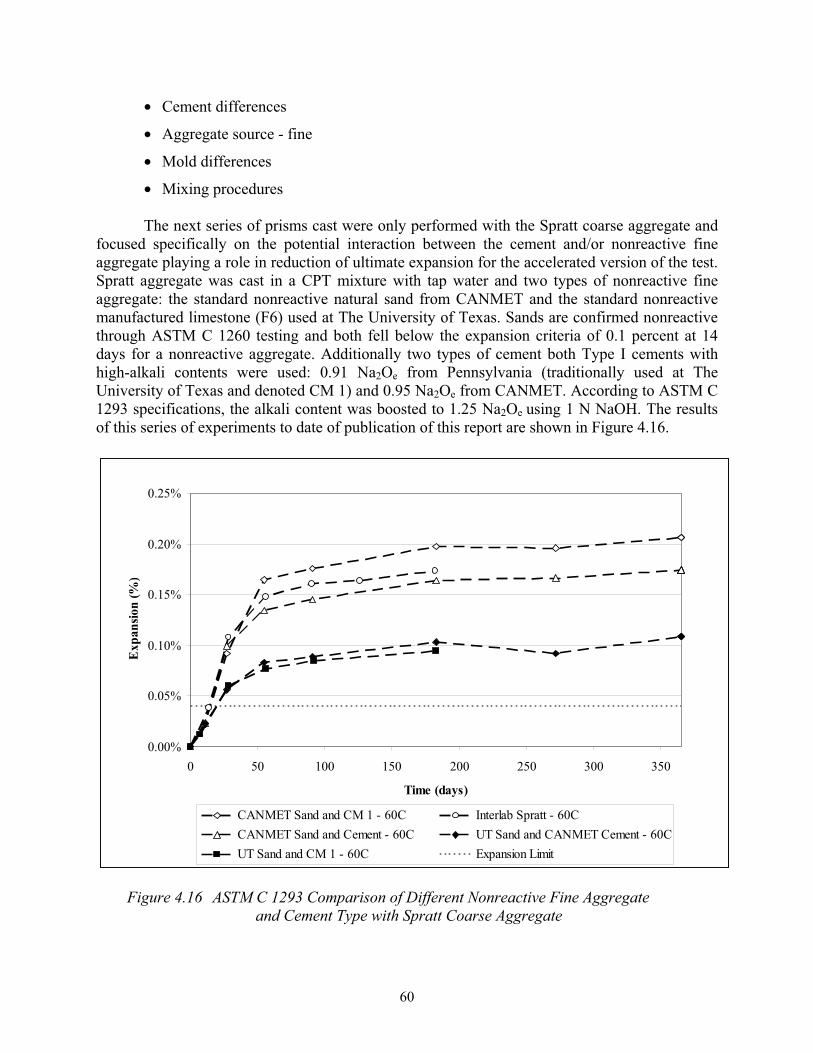
60
• Cement differences
• Aggregate source - fine
• Mold differences
• Mixing procedures
The next series of prisms cast were only performed with the Spratt coarse aggregate and focused specifically on the potential interaction between the cement and/or nonreactive fine aggregate playing a role in reduction of ultimate expansion for the accelerated version of the test. Spratt aggregate was cast in a CPT mixture with tap water and two types of nonreactive fine aggregate: the standard nonreactive natural sand from CANMET and the standard nonreactive manufactured limestone (F6) used at The University of Texas. Sands are confirmed nonreactive through ASTM C 1260 testing and both fell below the expansion criteria of 0.1 percent at 14 days for a nonreactive aggregate. Additionally two types of cement both Type I cements with high-alkali contents were used: 0.91 Na2Oe from Pennsylvania (traditionally used at The University of Texas and denoted CM 1) and 0.95 Na2Oe from CANMET. According to ASTM C 1293 specifications, the alkali content was boosted to 1.25 Na2Oe using 1 N NaOH. The results of this series of experiments to date of publication of this report are shown in Figure 4.16.
0.00%
0.05%
0.10%
0.15%
0.20%
0.25%
0 50 100 150 200 250 300 350
Time (days)
Exp
ansio
n (%
)
CANMET Sand and CM 1 - 60C Interlab Spratt - 60CCANMET Sand and Cement - 60C UT Sand and CANMET Cement - 60CUT Sand and CM 1 - 60C Expansion Limit
Figure 4.16 ASTM C 1293 Comparison of Different Nonreactive Fine Aggregate and Cement Type with Spratt Coarse Aggregate
61
The first thing to notice about this graph is that the two mixtures, both with the nonreactive sand (F6) from UT Austin and two different cements (0.91 and 0.95) exhibited the same reduction in expansion observed in earlier testing. What is significant is that the mixtures cast with the nonreactive sand supplied by CANMET and the two different cements straddled the results of the interlaboratory testing done with Spratt aggregate from 2002. Finally, it had become apparent that the selection of a nonreactive fine aggregate (in this case owing to the reactive coarse aggregate under test) played a significant role in further reduction of accelerated testing results in the case of the nonreactive fine aggregate used in Texas.
Furthermore, there is a minor discrepancy between the two types of cement used in the study even when alkali contents are boosted to the same 1.25 Na2Oe. This is likely due to the difference in contribution from either sodium or potassium from the two cements to the overall 0.91 or 0.95 alkali content. It remains unclear if the sand from CANMET is actually contributingto more expansion at elevated temperature through possible further ASR or if it results in less reduction of expansion owing to some other mechanism. It is also possible that the manufactured nonreactive fine aggregate from Texas is further reducing expansion through some type of suppression ASR or by some other mechanism. A series of tests is currently underway both in Canada at CANMET/ICON and at The University of Texas at Austin to determine the mechanism behind this key role played by the selection of a nonreactive fine. Additionally, testing is being formed to ascertain the role of a nonreactive coarse aggregate selected for testing a potentially alkali-silica reactive fine aggregate. These results will be conveyed in future technical journal publications.
It is important to note that the role of cement type and nonreactive fine aggregate is not exhibited in the traditional version of the ASTM C 1293 test 100° F (38° C), as evidenced by strong agreement among tests performed with a wide variety of aggregates in this study and the ICAR 302 project. More details of this testing can be found in the report from the completion of ICAR 302.
4.7 SummarySo what can we say about the ASTM C 1293 test? Based on the work performed under
TxDOT Project 0-4085 and other work performed by members of this research team, it certainly provides the most reliable prediction of field performance for aggregate reactivity owing to ASR. It allows for testing realistic concrete mixtures and the efficacy of SCMs, lithium compounds, and other materials in suppressing ASR-induced expansion.
However, as with any laboratory test, there are certain drawbacks, the largest of which being the time it takes to complete the test. There is also evidence of discrepancy between this test and the more aggressive ASTM C 1260 test. Often an aggregate failing the ASTM C 1260 test is thought to be more accurately depicted in regard to reactivity level in the ASTM C 1293 test. However, it has been shown that aggregates that may pass the ASTM C 1260 test may actually fail the ASTM C 1293 test and show the potential for deleterious reaction in the field. Another drawback, discussed in more detail in Chapter 5, is that leaching of alkalies from concrete prisms—even at 100° F (38° C)—can adversely affect test results, especially when one attempts to define the alkali threshold value for a given aggregate. Evidence of this is provided in Chapter 5, in which it is shown that the concrete prism test underestimates the expansion of mixtures with relatively low-alkali loadings (e.g., less than 4 lb/yd3 of alkalies), while companion exposure blocks exhibit significant expansion and cracking. While these cases are

62
limited, it does point to lack of absolutes provided by laboratory testing and the need for corroboration of field performance of actual concrete testing over the course of time.
To this end, there is also need for the development of a truly universal laboratory test that provides accurate prediction of aggregate reactivity in a reasonable amount of time. Simply accelerating the test through increased temperature creates a new host of problems and, thus, may not be the best method for detecting deleterious alkali-silica reactivity.
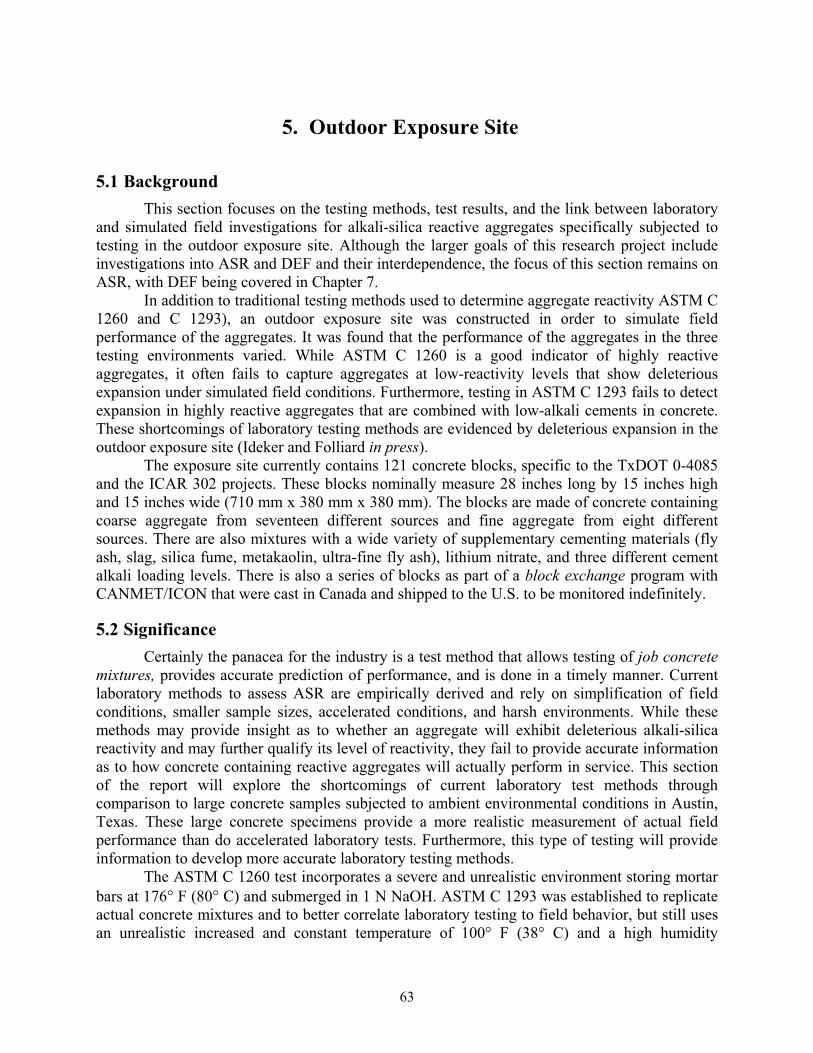
63
5. Outdoor Exposure Site
5.1 BackgroundThis section focuses on the testing methods, test results, and the link between laboratory
and simulated field investigations for alkali-silica reactive aggregates specifically subjected to testing in the outdoor exposure site. Although the larger goals of this research project include investigations into ASR and DEF and their interdependence, the focus of this section remains on ASR, with DEF being covered in Chapter 7.
In addition to traditional testing methods used to determine aggregate reactivity ASTM C 1260 and C 1293), an outdoor exposure site was constructed in order to simulate field performance of the aggregates. It was found that the performance of the aggregates in the three testing environments varied. While ASTM C 1260 is a good indicator of highly reactive aggregates, it often fails to capture aggregates at low-reactivity levels that show deleterious expansion under simulated field conditions. Furthermore, testing in ASTM C 1293 fails to detect expansion in highly reactive aggregates that are combined with low-alkali cements in concrete. These shortcomings of laboratory testing methods are evidenced by deleterious expansion in the outdoor exposure site (Ideker and Folliard in press).
The exposure site currently contains 121 concrete blocks, specific to the TxDOT 0-4085 and the ICAR 302 projects. These blocks nominally measure 28 inches long by 15 inches high and 15 inches wide (710 mm x 380 mm x 380 mm). The blocks are made of concrete containing coarse aggregate from seventeen different sources and fine aggregate from eight different sources. There are also mixtures with a wide variety of supplementary cementing materials (fly ash, slag, silica fume, metakaolin, ultra-fine fly ash), lithium nitrate, and three different cement alkali loading levels. There is also a series of blocks as part of a block exchange program with CANMET/ICON that were cast in Canada and shipped to the U.S. to be monitored indefinitely.
5.2 Significance Certainly the panacea for the industry is a test method that allows testing of job concrete
mixtures, provides accurate prediction of performance, and is done in a timely manner. Current laboratory methods to assess ASR are empirically derived and rely on simplification of field conditions, smaller sample sizes, accelerated conditions, and harsh environments. While these methods may provide insight as to whether an aggregate will exhibit deleterious alkali-silica reactivity and may further qualify its level of reactivity, they fail to provide accurate information as to how concrete containing reactive aggregates will actually perform in service. This section of the report will explore the shortcomings of current laboratory test methods through comparison to large concrete samples subjected to ambient environmental conditions in Austin, Texas. These large concrete specimens provide a more realistic measurement of actual field performance than do accelerated laboratory tests. Furthermore, this type of testing will provide information to develop more accurate laboratory testing methods.
The ASTM C 1260 test incorporates a severe and unrealistic environment storing mortar bars at 176° F (80° C) and submerged in 1 N NaOH. ASTM C 1293 was established to replicate actual concrete mixtures and to better correlate laboratory testing to field behavior, but still uses an unrealistic increased and constant temperature of 100° F (38° C) and a high humidity
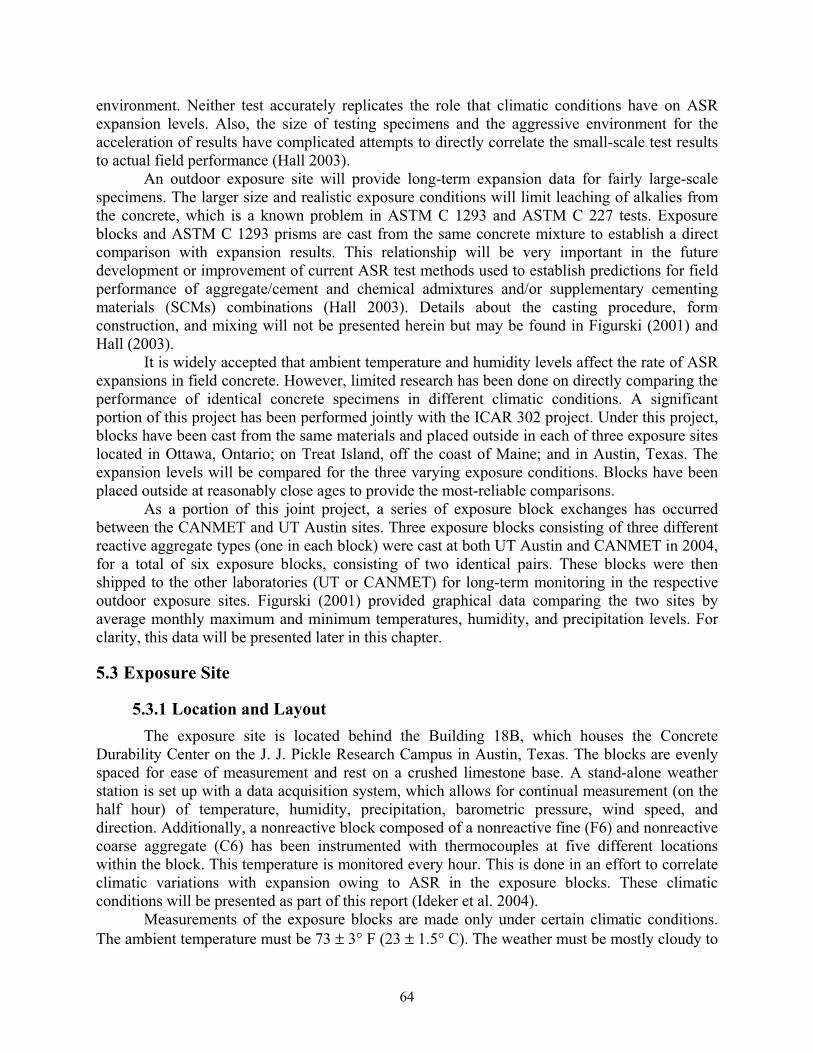
64
environment. Neither test accurately replicates the role that climatic conditions have on ASR expansion levels. Also, the size of testing specimens and the aggressive environment for the acceleration of results have complicated attempts to directly correlate the small-scale test results to actual field performance (Hall 2003).
An outdoor exposure site will provide long-term expansion data for fairly large-scale specimens. The larger size and realistic exposure conditions will limit leaching of alkalies from the concrete, which is a known problem in ASTM C 1293 and ASTM C 227 tests. Exposure blocks and ASTM C 1293 prisms are cast from the same concrete mixture to establish a direct comparison with expansion results. This relationship will be very important in the future development or improvement of current ASR test methods used to establish predictions for field performance of aggregate/cement and chemical admixtures and/or supplementary cementing materials (SCMs) combinations (Hall 2003). Details about the casting procedure, form construction, and mixing will not be presented herein but may be found in Figurski (2001) and Hall (2003).
It is widely accepted that ambient temperature and humidity levels affect the rate of ASR expansions in field concrete. However, limited research has been done on directly comparing the performance of identical concrete specimens in different climatic conditions. A significant portion of this project has been performed jointly with the ICAR 302 project. Under this project, blocks have been cast from the same materials and placed outside in each of three exposure sites located in Ottawa, Ontario; on Treat Island, off the coast of Maine; and in Austin, Texas. The expansion levels will be compared for the three varying exposure conditions. Blocks have been placed outside at reasonably close ages to provide the most-reliable comparisons.
As a portion of this joint project, a series of exposure block exchanges has occurred between the CANMET and UT Austin sites. Three exposure blocks consisting of three different reactive aggregate types (one in each block) were cast at both UT Austin and CANMET in 2004, for a total of six exposure blocks, consisting of two identical pairs. These blocks were then shipped to the other laboratories (UT or CANMET) for long-term monitoring in the respective outdoor exposure sites. Figurski (2001) provided graphical data comparing the two sites by average monthly maximum and minimum temperatures, humidity, and precipitation levels. For clarity, this data will be presented later in this chapter.
5.3 Exposure Site
5.3.1 Location and Layout The exposure site is located behind the Building 18B, which houses the Concrete
Durability Center on the J. J. Pickle Research Campus in Austin, Texas. The blocks are evenly spaced for ease of measurement and rest on a crushed limestone base. A stand-alone weather station is set up with a data acquisition system, which allows for continual measurement (on the half hour) of temperature, humidity, precipitation, barometric pressure, wind speed, and direction. Additionally, a nonreactive block composed of a nonreactive fine (F6) and nonreactive coarse aggregate (C6) has been instrumented with thermocouples at five different locations within the block. This temperature is monitored every hour. This is done in an effort to correlate climatic variations with expansion owing to ASR in the exposure blocks. These climatic conditions will be presented as part of this report (Ideker et al. 2004).
Measurements of the exposure blocks are made only under certain climatic conditions. The ambient temperature must be 73 ± 3° F (23 ± 1.5° C). The weather must be mostly cloudy to
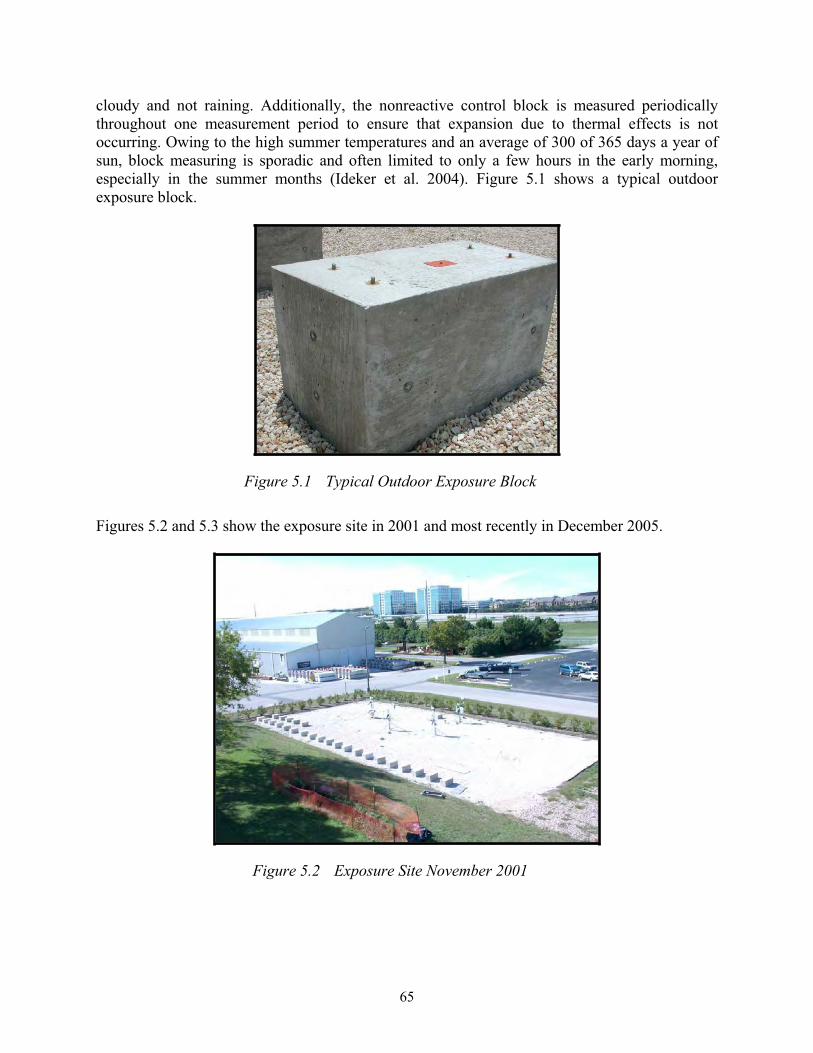
65
cloudy and not raining. Additionally, the nonreactive control block is measured periodically throughout one measurement period to ensure that expansion due to thermal effects is not occurring. Owing to the high summer temperatures and an average of 300 of 365 days a year of sun, block measuring is sporadic and often limited to only a few hours in the early morning, especially in the summer months (Ideker et al. 2004). Figure 5.1 shows a typical outdoor exposure block.
Figure 5.1 Typical Outdoor Exposure Block
Figures 5.2 and 5.3 show the exposure site in 2001 and most recently in December 2005.
Figure 5.2 Exposure Site November 2001
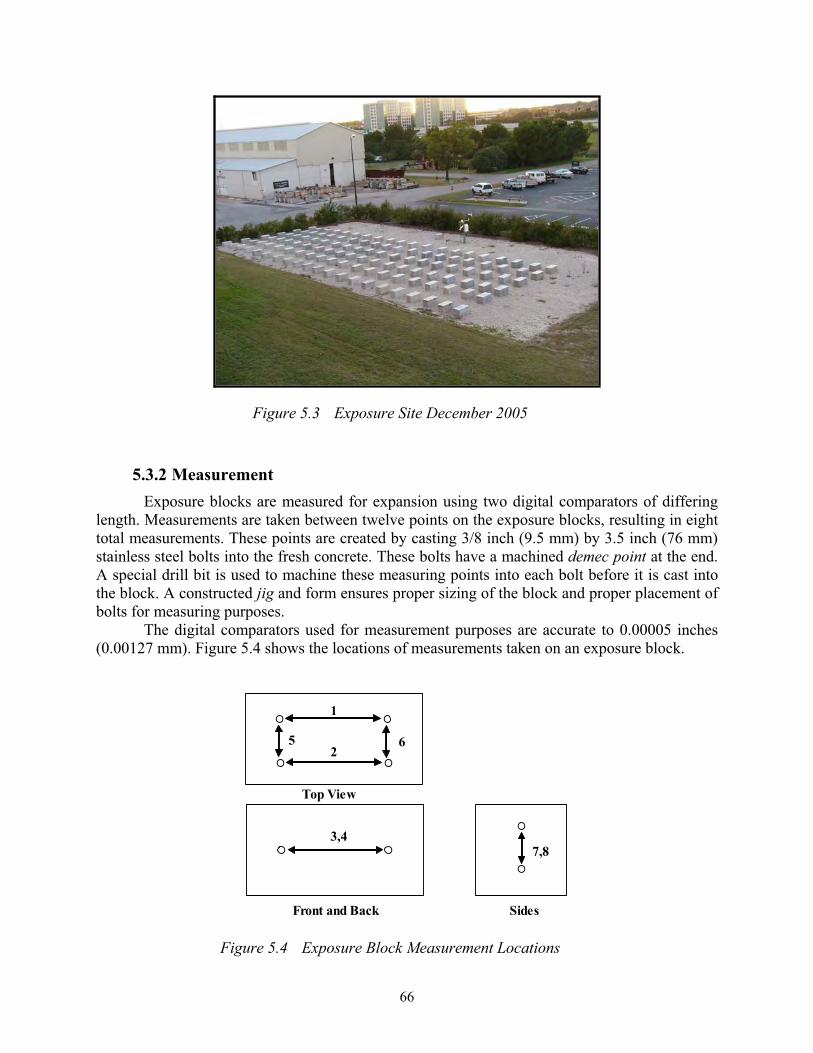
66
Figure 5.3 Exposure Site December 2005
5.3.2 MeasurementExposure blocks are measured for expansion using two digital comparators of differing
length. Measurements are taken between twelve points on the exposure blocks, resulting in eight total measurements. These points are created by casting 3/8 inch (9.5 mm) by 3.5 inch (76 mm) stainless steel bolts into the fresh concrete. These bolts have a machined demec point at the end. A special drill bit is used to machine these measuring points into each bolt before it is cast into the block. A constructed jig and form ensures proper sizing of the block and proper placement of bolts for measuring purposes.
The digital comparators used for measurement purposes are accurate to 0.00005 inches (0.00127 mm). Figure 5.4 shows the locations of measurements taken on an exposure block.
1
26
3,47,8
5
Front and Back
Top View
Sides
Figure 5.4 Exposure Block Measurement Locations
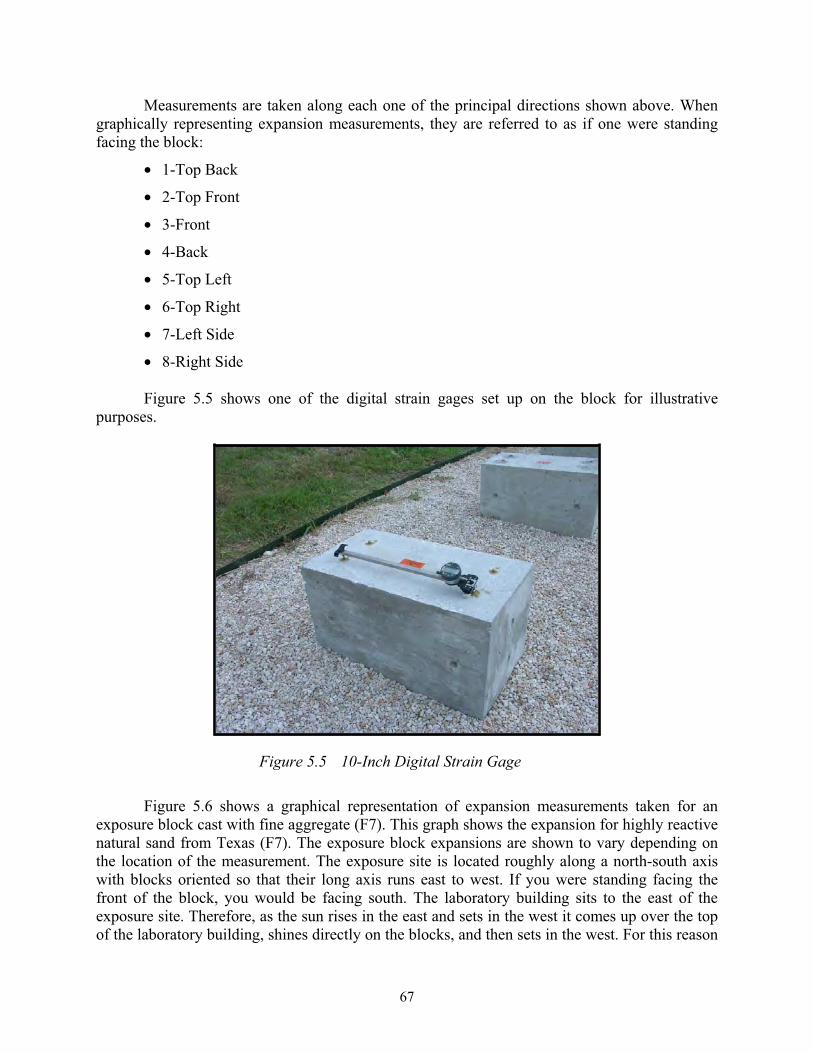
67
Measurements are taken along each one of the principal directions shown above. When graphically representing expansion measurements, they are referred to as if one were standing facing the block:
• 1-Top Back
• 2-Top Front
• 3-Front
• 4-Back
• 5-Top Left
• 6-Top Right
• 7-Left Side
• 8-Right Side
Figure 5.5 shows one of the digital strain gages set up on the block for illustrative purposes.
Figure 5.5 10-Inch Digital Strain Gage
Figure 5.6 shows a graphical representation of expansion measurements taken for an exposure block cast with fine aggregate (F7). This graph shows the expansion for highly reactive natural sand from Texas (F7). The exposure block expansions are shown to vary depending on the location of the measurement. The exposure site is located roughly along a north-south axis with blocks oriented so that their long axis runs east to west. If you were standing facing the front of the block, you would be facing south. The laboratory building sits to the east of the exposure site. Therefore, as the sun rises in the east and sets in the west it comes up over the top of the laboratory building, shines directly on the blocks, and then sets in the west. For this reason
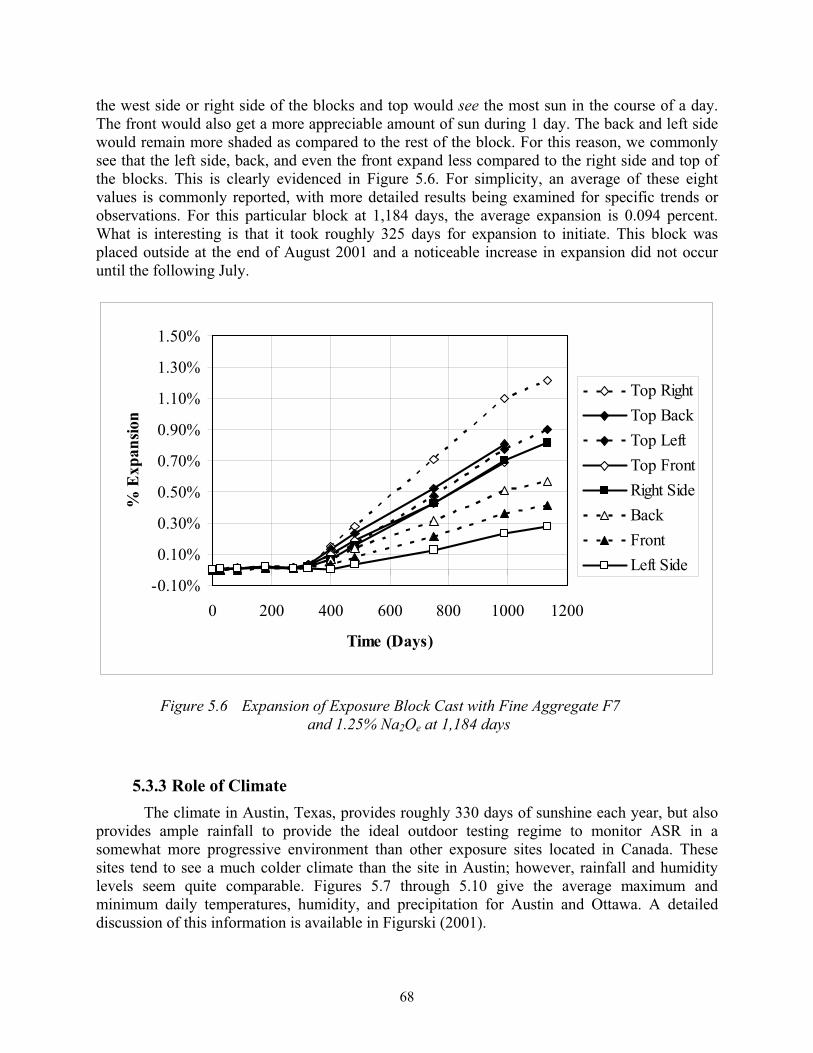
68
the west side or right side of the blocks and top would see the most sun in the course of a day. The front would also get a more appreciable amount of sun during 1 day. The back and left side would remain more shaded as compared to the rest of the block. For this reason, we commonly see that the left side, back, and even the front expand less compared to the right side and top of the blocks. This is clearly evidenced in Figure 5.6. For simplicity, an average of these eight values is commonly reported, with more detailed results being examined for specific trends or observations. For this particular block at 1,184 days, the average expansion is 0.094 percent. What is interesting is that it took roughly 325 days for expansion to initiate. This block was placed outside at the end of August 2001 and a noticeable increase in expansion did not occur until the following July.
Figure 5.6 Expansion of Exposure Block Cast with Fine Aggregate F7 and 1.25% Na2Oe at 1,184 days
5.3.3 Role of Climate The climate in Austin, Texas, provides roughly 330 days of sunshine each year, but also
provides ample rainfall to provide the ideal outdoor testing regime to monitor ASR in a somewhat more progressive environment than other exposure sites located in Canada. These sites tend to see a much colder climate than the site in Austin; however, rainfall and humidity levels seem quite comparable. Figures 5.7 through 5.10 give the average maximum and minimum daily temperatures, humidity, and precipitation for Austin and Ottawa. A detailed discussion of this information is available in Figurski (2001).
-0.10%
0.10%
0.30%
0.50%
0.70%
0.90%
1.10%
1.30%
1.50%
0 200 400 600 800 1000 1200
Time (Days)
% E
xpan
sion
Top RightTop BackTop LeftTop FrontRight SideBackFrontLeft Side
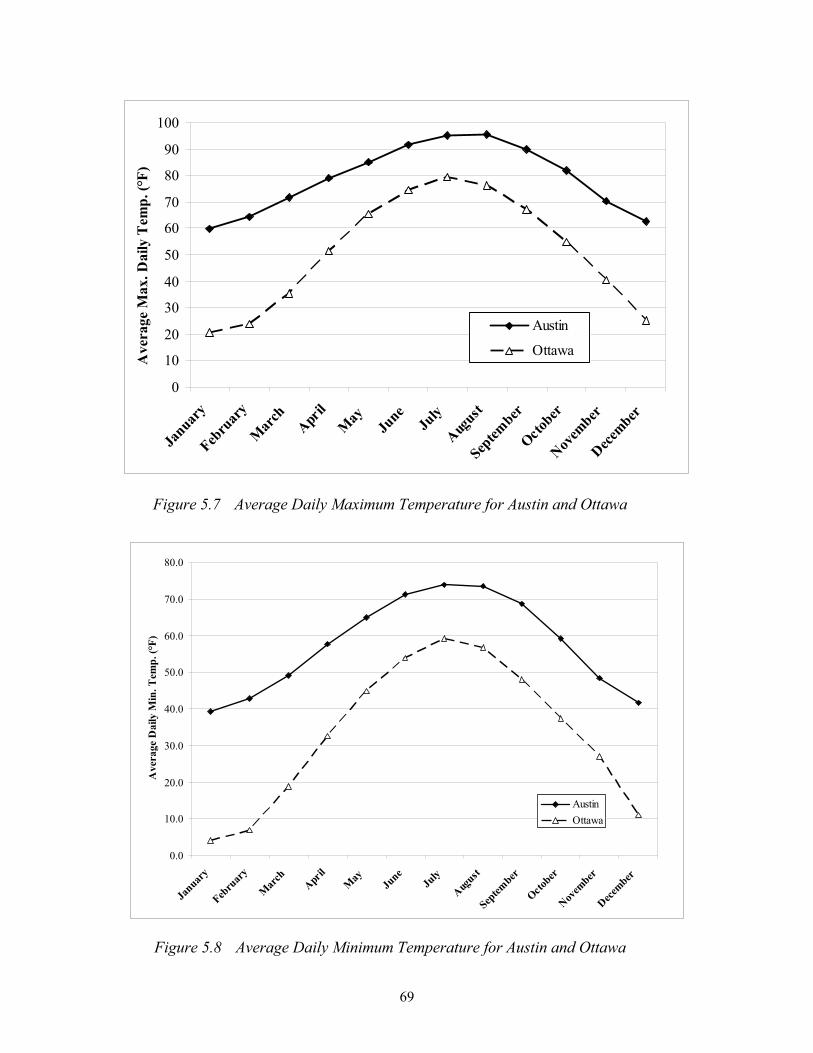
69
0
10
20
30
40
50
60
70
80
90
100
Januar
yFeb
ruar
yM
arch
April
May
June
July
August
Septem
berOcto
berNov
ember
December
Ave
rage
Max
. Dai
ly T
emp.
(°F)
Austin
Ottawa
Figure 5.7 Average Daily Maximum Temperature for Austin and Ottawa
0.0
10.0
20.0
30.0
40.0
50.0
60.0
70.0
80.0
Januar
y
Febru
ary
March
April
May
June
July
August
Septem
ber
October
Novem
ber
December
Ave
rage
Dai
ly M
in. T
emp.
(°F)
AustinOttawa
Figure 5.8 Average Daily Minimum Temperature for Austin and Ottawa
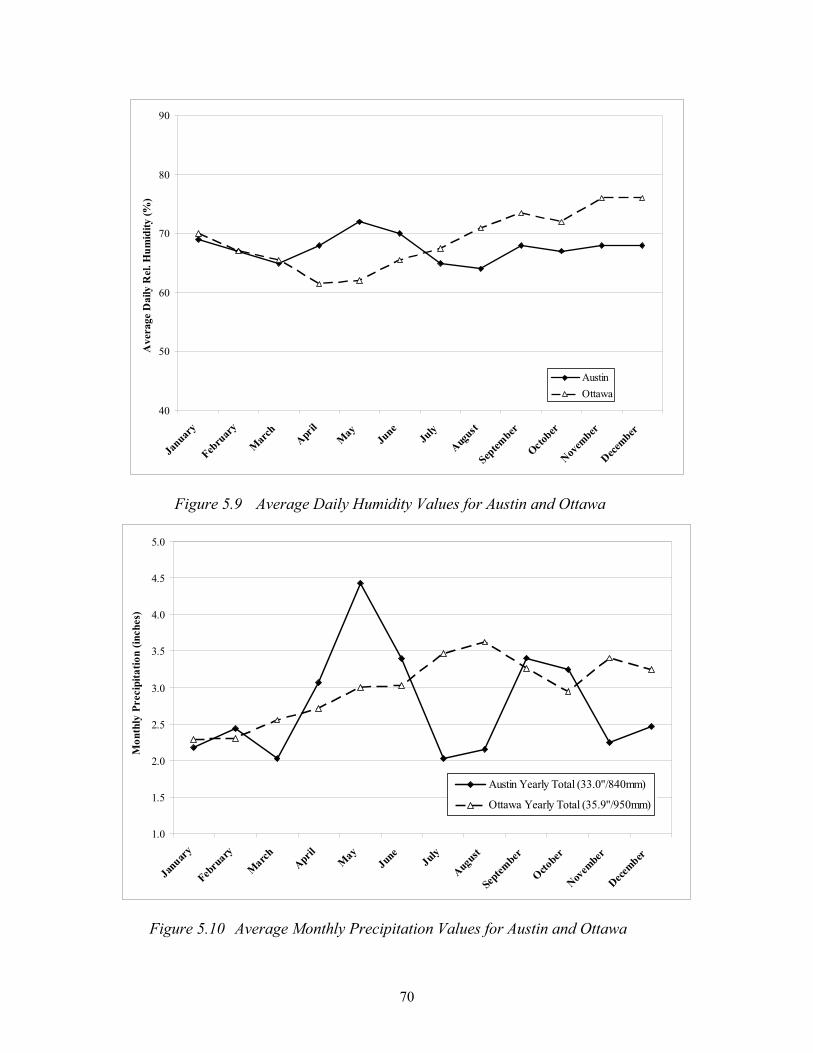
70
40
50
60
70
80
90
Januar
y
Febru
ary
March
Apr
ilM
ayJu
neJu
ly
August
Septem
ber
October
Novem
ber
December
Ave
rage
Dai
ly R
el. H
umid
ity (%
)
AustinOttawa
Figure 5.9 Average Daily Humidity Values for Austin and Ottawa
1.0
1.5
2.0
2.5
3.0
3.5
4.0
4.5
5.0
January
Febru
ary
March
AprilM
ayJune
July
August
Septe
mber
Octobe
r
Novem
ber
December
Mon
thly
Pre
cipi
tatio
n (in
ches
)
Austin Yearly Total (33.0''/840mm)
Ottawa Yearly Total (35.9''/950mm)
Figure 5.10 Average Monthly Precipitation Values for Austin and Ottawa
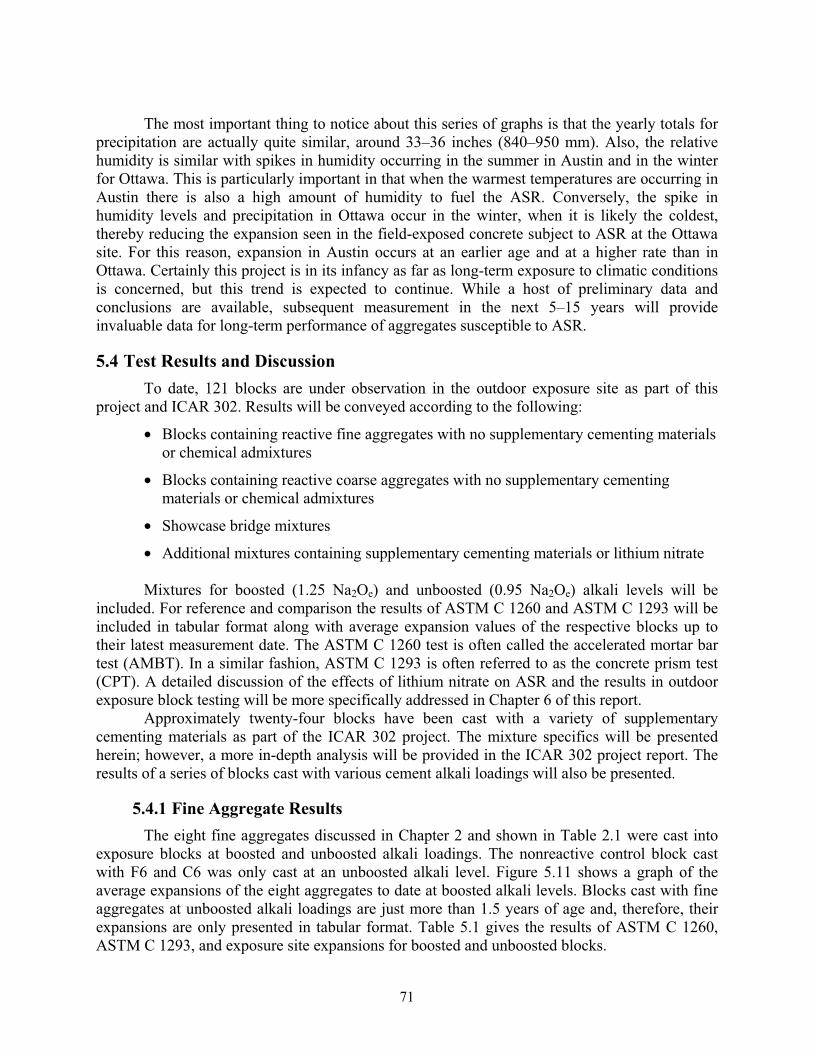
71
The most important thing to notice about this series of graphs is that the yearly totals for precipitation are actually quite similar, around 33–36 inches (840–950 mm). Also, the relative humidity is similar with spikes in humidity occurring in the summer in Austin and in the winter for Ottawa. This is particularly important in that when the warmest temperatures are occurring in Austin there is also a high amount of humidity to fuel the ASR. Conversely, the spike in humidity levels and precipitation in Ottawa occur in the winter, when it is likely the coldest, thereby reducing the expansion seen in the field-exposed concrete subject to ASR at the Ottawa site. For this reason, expansion in Austin occurs at an earlier age and at a higher rate than in Ottawa. Certainly this project is in its infancy as far as long-term exposure to climatic conditions is concerned, but this trend is expected to continue. While a host of preliminary data and conclusions are available, subsequent measurement in the next 5–15 years will provide invaluable data for long-term performance of aggregates susceptible to ASR.
5.4 Test Results and Discussion To date, 121 blocks are under observation in the outdoor exposure site as part of this
project and ICAR 302. Results will be conveyed according to the following:
• Blocks containing reactive fine aggregates with no supplementary cementing materials or chemical admixtures
• Blocks containing reactive coarse aggregates with no supplementary cementing materials or chemical admixtures
• Showcase bridge mixtures
• Additional mixtures containing supplementary cementing materials or lithium nitrate
Mixtures for boosted (1.25 Na2Oe) and unboosted (0.95 Na2Oe) alkali levels will be included. For reference and comparison the results of ASTM C 1260 and ASTM C 1293 will be included in tabular format along with average expansion values of the respective blocks up to their latest measurement date. The ASTM C 1260 test is often called the accelerated mortar bar test (AMBT). In a similar fashion, ASTM C 1293 is often referred to as the concrete prism test (CPT). A detailed discussion of the effects of lithium nitrate on ASR and the results in outdoor exposure block testing will be more specifically addressed in Chapter 6 of this report.
Approximately twenty-four blocks have been cast with a variety of supplementary cementing materials as part of the ICAR 302 project. The mixture specifics will be presented herein; however, a more in-depth analysis will be provided in the ICAR 302 project report. The results of a series of blocks cast with various cement alkali loadings will also be presented.
5.4.1 Fine Aggregate Results The eight fine aggregates discussed in Chapter 2 and shown in Table 2.1 were cast into
exposure blocks at boosted and unboosted alkali loadings. The nonreactive control block cast with F6 and C6 was only cast at an unboosted alkali level. Figure 5.11 shows a graph of the average expansions of the eight aggregates to date at boosted alkali levels. Blocks cast with fine aggregates at unboosted alkali loadings are just more than 1.5 years of age and, therefore, their expansions are only presented in tabular format. Table 5.1 gives the results of ASTM C 1260, ASTM C 1293, and exposure site expansions for boosted and unboosted blocks.
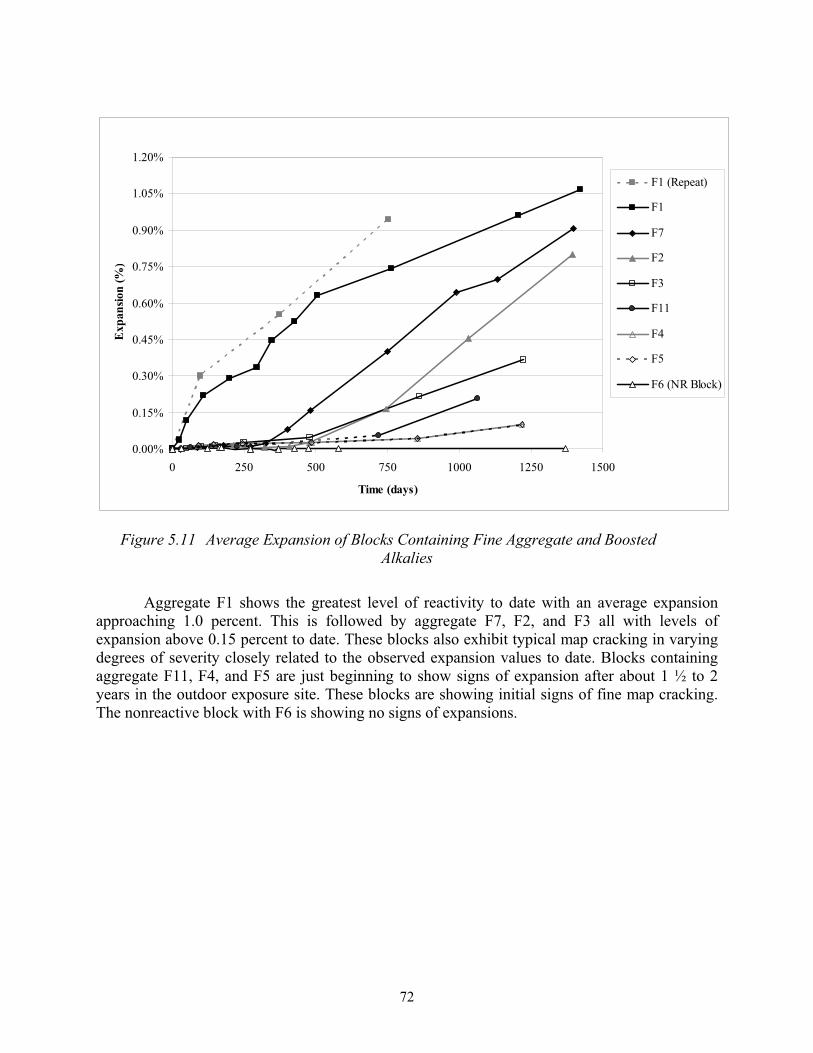
72
0.00%
0.15%
0.30%
0.45%
0.60%
0.75%
0.90%
1.05%
1.20%
0 250 500 750 1000 1250 1500
Time (days)
Exp
ansio
n (%
)
F1 (Repeat)
F1
F7
F2
F3
F11
F4
F5
F6 (NR Block)
Figure 5.11 Average Expansion of Blocks Containing Fine Aggregate and Boosted Alkalies
Aggregate F1 shows the greatest level of reactivity to date with an average expansion approaching 1.0 percent. This is followed by aggregate F7, F2, and F3 all with levels of expansion above 0.15 percent to date. These blocks also exhibit typical map cracking in varying degrees of severity closely related to the observed expansion values to date. Blocks containing aggregate F11, F4, and F5 are just beginning to show signs of expansion after about 1 ½ to 2 years in the outdoor exposure site. These blocks are showing initial signs of fine map cracking. The nonreactive block with F6 is showing no signs of expansions.
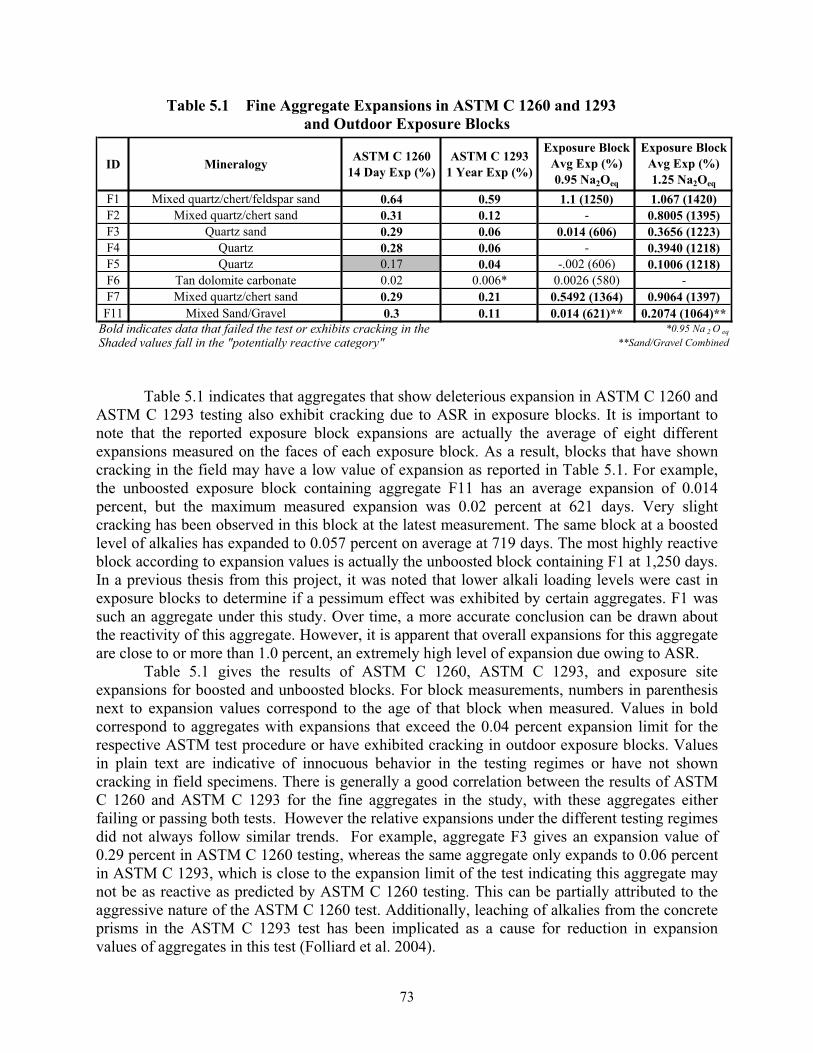
73
Table 5.1 Fine Aggregate Expansions in ASTM C 1260 and 1293and Outdoor Exposure Blocks
ID Mineralogy ASTM C 1260 14 Day Exp (%)
ASTM C 1293 1 Year Exp (%)
Exposure Block Avg Exp (%) 0.95 Na2Oeq
Exposure Block Avg Exp (%) 1.25 Na2Oeq
F1 Mixed quartz/chert/feldspar sand 0.64 0.59 1.1 (1250) 1.067 (1420)F2 Mixed quartz/chert sand 0.31 0.12 - 0.8005 (1395)F3 Quartz sand 0.29 0.06 0.014 (606) 0.3656 (1223)F4 Quartz 0.28 0.06 - 0.3940 (1218)F5 Quartz 0.17 0.04 -.002 (606) 0.1006 (1218)F6 Tan dolomite carbonate 0.02 0.006* 0.0026 (580) -F7 Mixed quartz/chert sand 0.29 0.21 0.5492 (1364) 0.9064 (1397)F11 Mixed Sand/Gravel 0.3 0.11 0.014 (621)** 0.2074 (1064)**
*0.95 Na 2 O eq
**Sand/Gravel CombinedBold indicates data that failed the test or exhibits cracking in the Shaded values fall in the "potentially reactive category"
Table 5.1 indicates that aggregates that show deleterious expansion in ASTM C 1260 and ASTM C 1293 testing also exhibit cracking due to ASR in exposure blocks. It is important to note that the reported exposure block expansions are actually the average of eight different expansions measured on the faces of each exposure block. As a result, blocks that have shown cracking in the field may have a low value of expansion as reported in Table 5.1. For example, the unboosted exposure block containing aggregate F11 has an average expansion of 0.014 percent, but the maximum measured expansion was 0.02 percent at 621 days. Very slight cracking has been observed in this block at the latest measurement. The same block at a boosted level of alkalies has expanded to 0.057 percent on average at 719 days. The most highly reactive block according to expansion values is actually the unboosted block containing F1 at 1,250 days. In a previous thesis from this project, it was noted that lower alkali loading levels were cast in exposure blocks to determine if a pessimum effect was exhibited by certain aggregates. F1 was such an aggregate under this study. Over time, a more accurate conclusion can be drawn about the reactivity of this aggregate. However, it is apparent that overall expansions for this aggregate are close to or more than 1.0 percent, an extremely high level of expansion due owing to ASR.
Table 5.1 gives the results of ASTM C 1260, ASTM C 1293, and exposure site expansions for boosted and unboosted blocks. For block measurements, numbers in parenthesis next to expansion values correspond to the age of that block when measured. Values in bold correspond to aggregates with expansions that exceed the 0.04 percent expansion limit for the respective ASTM test procedure or have exhibited cracking in outdoor exposure blocks. Values in plain text are indicative of innocuous behavior in the testing regimes or have not shown cracking in field specimens. There is generally a good correlation between the results of ASTM C 1260 and ASTM C 1293 for the fine aggregates in the study, with these aggregates either failing or passing both tests. However the relative expansions under the different testing regimes did not always follow similar trends. For example, aggregate F3 gives an expansion value of 0.29 percent in ASTM C 1260 testing, whereas the same aggregate only expands to 0.06 percent in ASTM C 1293, which is close to the expansion limit of the test indicating this aggregate may not be as reactive as predicted by ASTM C 1260 testing. This can be partially attributed to the aggressive nature of the ASTM C 1260 test. Additionally, leaching of alkalies from the concrete prisms in the ASTM C 1293 test has been implicated as a cause for reduction in expansion values of aggregates in this test (Folliard et al. 2004).
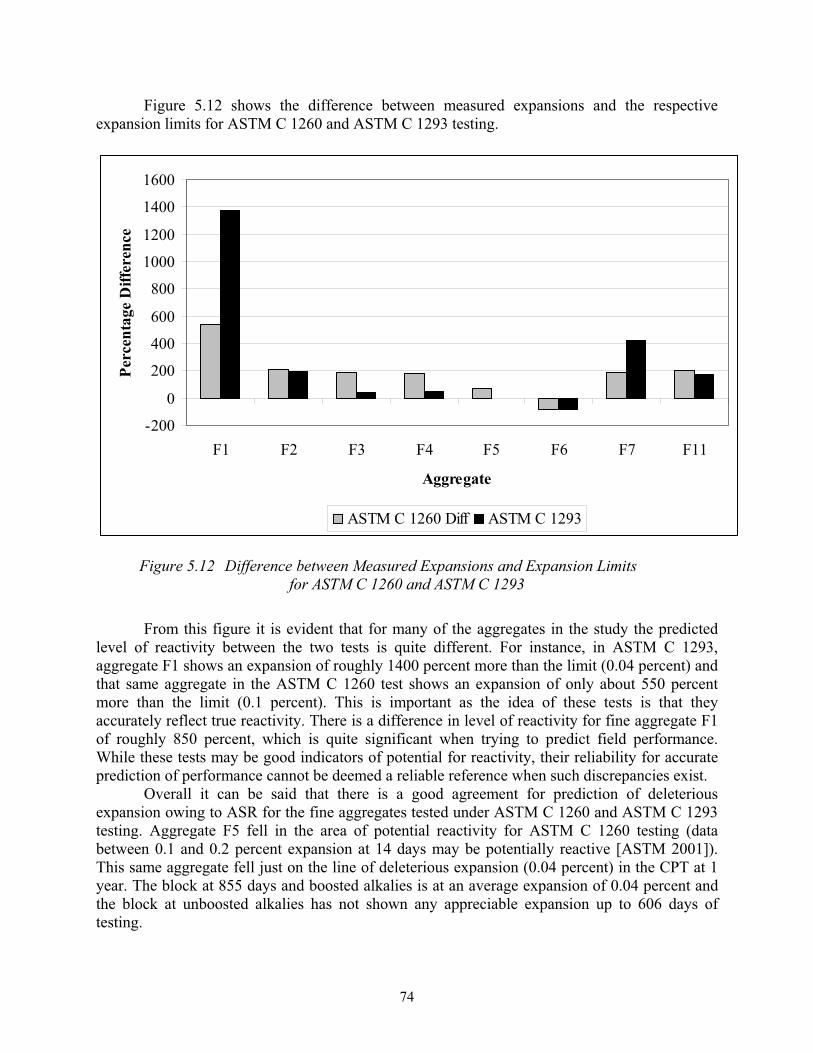
74
Figure 5.12 shows the difference between measured expansions and the respective expansion limits for ASTM C 1260 and ASTM C 1293 testing.
-200
0
200
400
600
800
1000
1200
1400
1600
F1 F2 F3 F4 F5 F6 F7 F11
Aggregate
Perc
enta
ge D
iffer
ence
ASTM C 1260 Diff ASTM C 1293
Figure 5.12 Difference between Measured Expansions and Expansion Limits for ASTM C 1260 and ASTM C 1293
From this figure it is evident that for many of the aggregates in the study the predicted level of reactivity between the two tests is quite different. For instance, in ASTM C 1293, aggregate F1 shows an expansion of roughly 1400 percent more than the limit (0.04 percent) and that same aggregate in the ASTM C 1260 test shows an expansion of only about 550 percent more than the limit (0.1 percent). This is important as the idea of these tests is that they accurately reflect true reactivity. There is a difference in level of reactivity for fine aggregate F1 of roughly 850 percent, which is quite significant when trying to predict field performance. While these tests may be good indicators of potential for reactivity, their reliability for accurate prediction of performance cannot be deemed a reliable reference when such discrepancies exist.
Overall it can be said that there is a good agreement for prediction of deleterious expansion owing to ASR for the fine aggregates tested under ASTM C 1260 and ASTM C 1293 testing. Aggregate F5 fell in the area of potential reactivity for ASTM C 1260 testing (data between 0.1 and 0.2 percent expansion at 14 days may be potentially reactive [ASTM 2001]). This same aggregate fell just on the line of deleterious expansion (0.04 percent) in the CPT at 1 year. The block at 855 days and boosted alkalies is at an average expansion of 0.04 percent and the block at unboosted alkalies has not shown any appreciable expansion up to 606 days of testing.
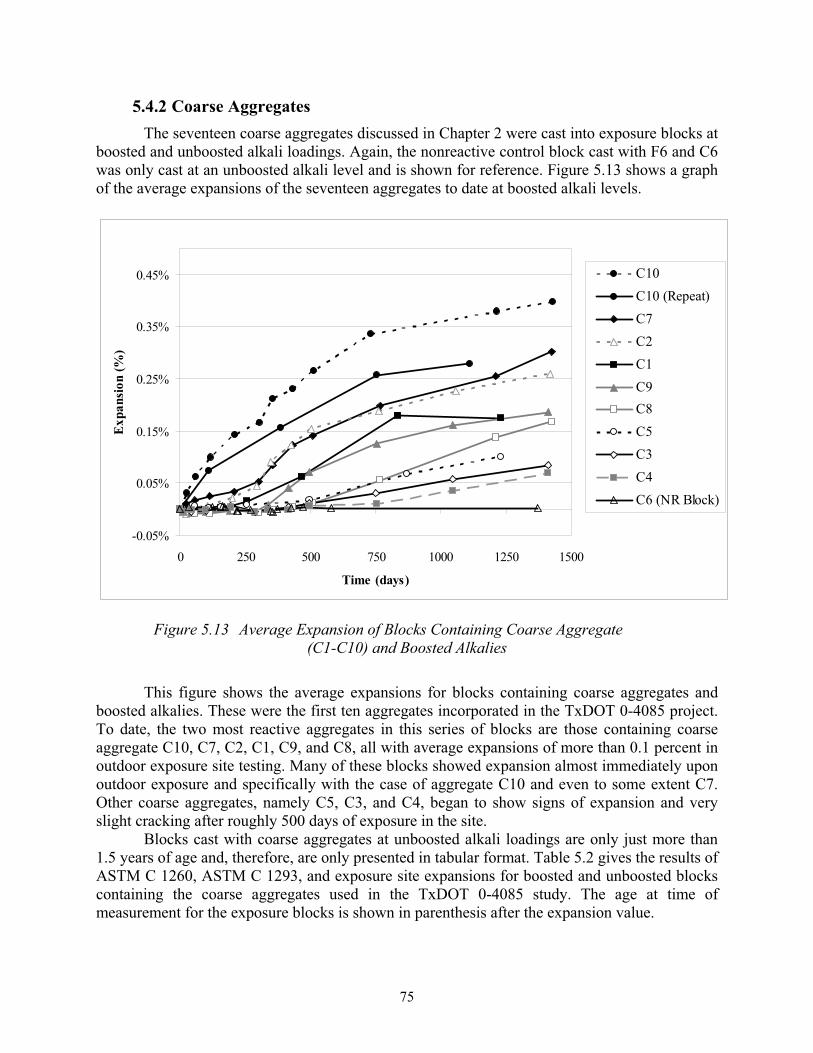
75
5.4.2 Coarse Aggregates The seventeen coarse aggregates discussed in Chapter 2 were cast into exposure blocks at
boosted and unboosted alkali loadings. Again, the nonreactive control block cast with F6 and C6 was only cast at an unboosted alkali level and is shown for reference. Figure 5.13 shows a graph of the average expansions of the seventeen aggregates to date at boosted alkali levels.
-0.05%
0.05%
0.15%
0.25%
0.35%
0.45%
0 250 500 750 1000 1250 1500
Time (days)
Exp
ansi
on (%
)
C10C10 (Repeat)C7C2C1C9C8C5C3C4C6 (NR Block)
Figure 5.13 Average Expansion of Blocks Containing Coarse Aggregate (C1-C10) and Boosted Alkalies
This figure shows the average expansions for blocks containing coarse aggregates and boosted alkalies. These were the first ten aggregates incorporated in the TxDOT 0-4085 project. To date, the two most reactive aggregates in this series of blocks are those containing coarse aggregate C10, C7, C2, C1, C9, and C8, all with average expansions of more than 0.1 percent in outdoor exposure site testing. Many of these blocks showed expansion almost immediately upon outdoor exposure and specifically with the case of aggregate C10 and even to some extent C7. Other coarse aggregates, namely C5, C3, and C4, began to show signs of expansion and very slight cracking after roughly 500 days of exposure in the site.
Blocks cast with coarse aggregates at unboosted alkali loadings are only just more than 1.5 years of age and, therefore, are only presented in tabular format. Table 5.2 gives the results of ASTM C 1260, ASTM C 1293, and exposure site expansions for boosted and unboosted blocks containing the coarse aggregates used in the TxDOT 0-4085 study. The age at time of measurement for the exposure blocks is shown in parenthesis after the expansion value.
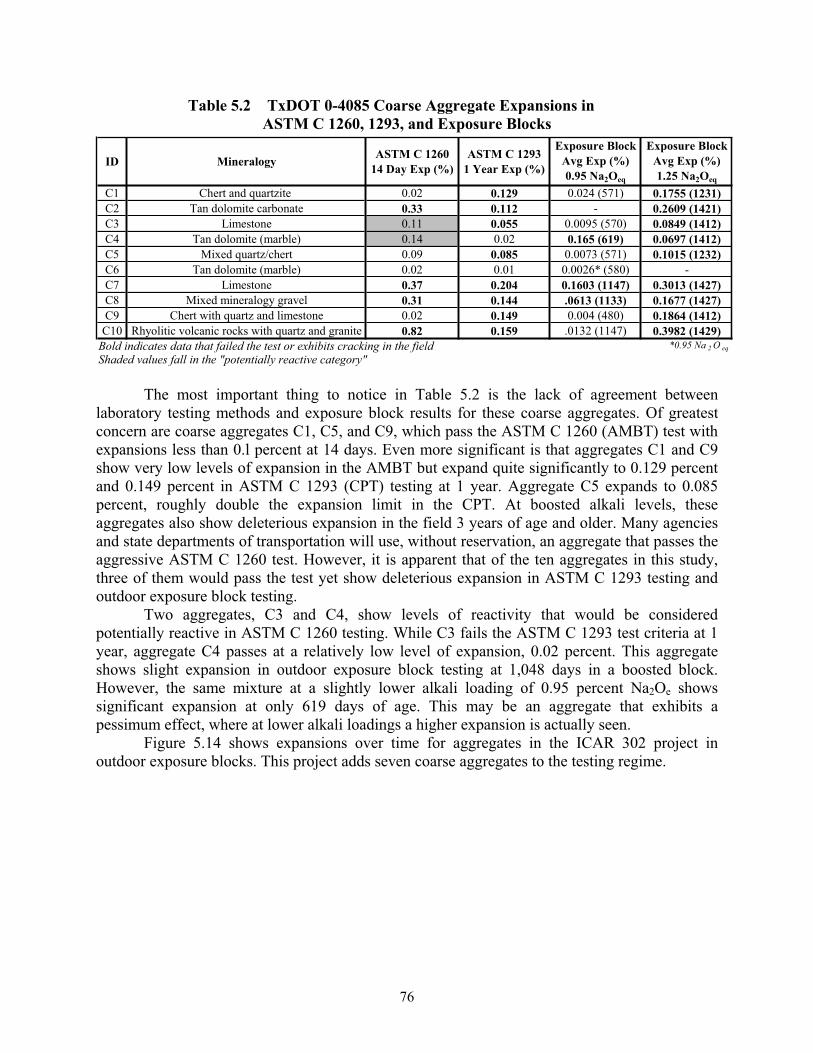
76
Table 5.2 TxDOT 0-4085 Coarse Aggregate Expansions inASTM C 1260, 1293, and Exposure Blocks
ID Mineralogy ASTM C 1260 14 Day Exp (%)
ASTM C 1293 1 Year Exp (%)
Exposure Block Avg Exp (%) 0.95 Na2Oeq
Exposure Block Avg Exp (%) 1.25 Na2Oeq
C1 Chert and quartzite 0.02 0.129 0.024 (571) 0.1755 (1231)C2 Tan dolomite carbonate 0.33 0.112 - 0.2609 (1421)C3 Limestone 0.11 0.055 0.0095 (570) 0.0849 (1412)C4 Tan dolomite (marble) 0.14 0.02 0.165 (619) 0.0697 (1412)C5 Mixed quartz/chert 0.09 0.085 0.0073 (571) 0.1015 (1232)C6 Tan dolomite (marble) 0.02 0.01 0.0026* (580) -C7 Limestone 0.37 0.204 0.1603 (1147) 0.3013 (1427)C8 Mixed mineralogy gravel 0.31 0.144 .0613 (1133) 0.1677 (1427)C9 Chert with quartz and limestone 0.02 0.149 0.004 (480) 0.1864 (1412)
C10 Rhyolitic volcanic rocks with quartz and granite 0.82 0.159 .0132 (1147) 0.3982 (1429)*0.95 Na 2 O eqBold indicates data that failed the test or exhibits cracking in the field
Shaded values fall in the "potentially reactive category"
The most important thing to notice in Table 5.2 is the lack of agreement between laboratory testing methods and exposure block results for these coarse aggregates. Of greatest concern are coarse aggregates C1, C5, and C9, which pass the ASTM C 1260 (AMBT) test with expansions less than 0.l percent at 14 days. Even more significant is that aggregates C1 and C9 show very low levels of expansion in the AMBT but expand quite significantly to 0.129 percent and 0.149 percent in ASTM C 1293 (CPT) testing at 1 year. Aggregate C5 expands to 0.085 percent, roughly double the expansion limit in the CPT. At boosted alkali levels, these aggregates also show deleterious expansion in the field 3 years of age and older. Many agencies and state departments of transportation will use, without reservation, an aggregate that passes the aggressive ASTM C 1260 test. However, it is apparent that of the ten aggregates in this study, three of them would pass the test yet show deleterious expansion in ASTM C 1293 testing and outdoor exposure block testing.
Two aggregates, C3 and C4, show levels of reactivity that would be considered potentially reactive in ASTM C 1260 testing. While C3 fails the ASTM C 1293 test criteria at 1 year, aggregate C4 passes at a relatively low level of expansion, 0.02 percent. This aggregate shows slight expansion in outdoor exposure block testing at 1,048 days in a boosted block. However, the same mixture at a slightly lower alkali loading of 0.95 percent Na2Oe shows significant expansion at only 619 days of age. This may be an aggregate that exhibits a pessimum effect, where at lower alkali loadings a higher expansion is actually seen.
Figure 5.14 shows expansions over time for aggregates in the ICAR 302 project in outdoor exposure blocks. This project adds seven coarse aggregates to the testing regime.
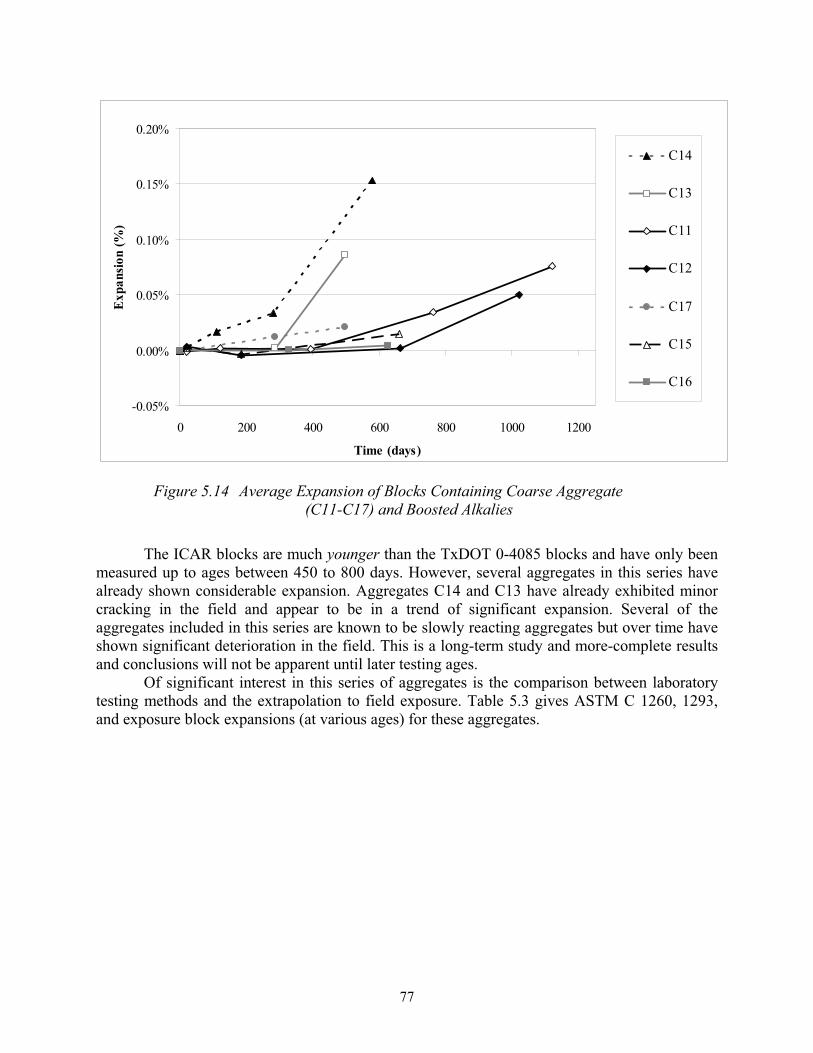
77
-0.05%
0.00%
0.05%
0.10%
0.15%
0.20%
0 200 400 600 800 1000 1200
Time (days)
Exp
ansi
on (%
)
C14
C13
C11
C12
C17
C15
C16
Figure 5.14 Average Expansion of Blocks Containing Coarse Aggregate (C11-C17) and Boosted Alkalies
The ICAR blocks are much younger than the TxDOT 0-4085 blocks and have only been measured up to ages between 450 to 800 days. However, several aggregates in this series have already shown considerable expansion. Aggregates C14 and C13 have already exhibited minor cracking in the field and appear to be in a trend of significant expansion. Several of the aggregates included in this series are known to be slowly reacting aggregates but over time have shown significant deterioration in the field. This is a long-term study and more-complete results and conclusions will not be apparent until later testing ages.
Of significant interest in this series of aggregates is the comparison between laboratory testing methods and the extrapolation to field exposure. Table 5.3 gives ASTM C 1260, 1293, and exposure block expansions (at various ages) for these aggregates.
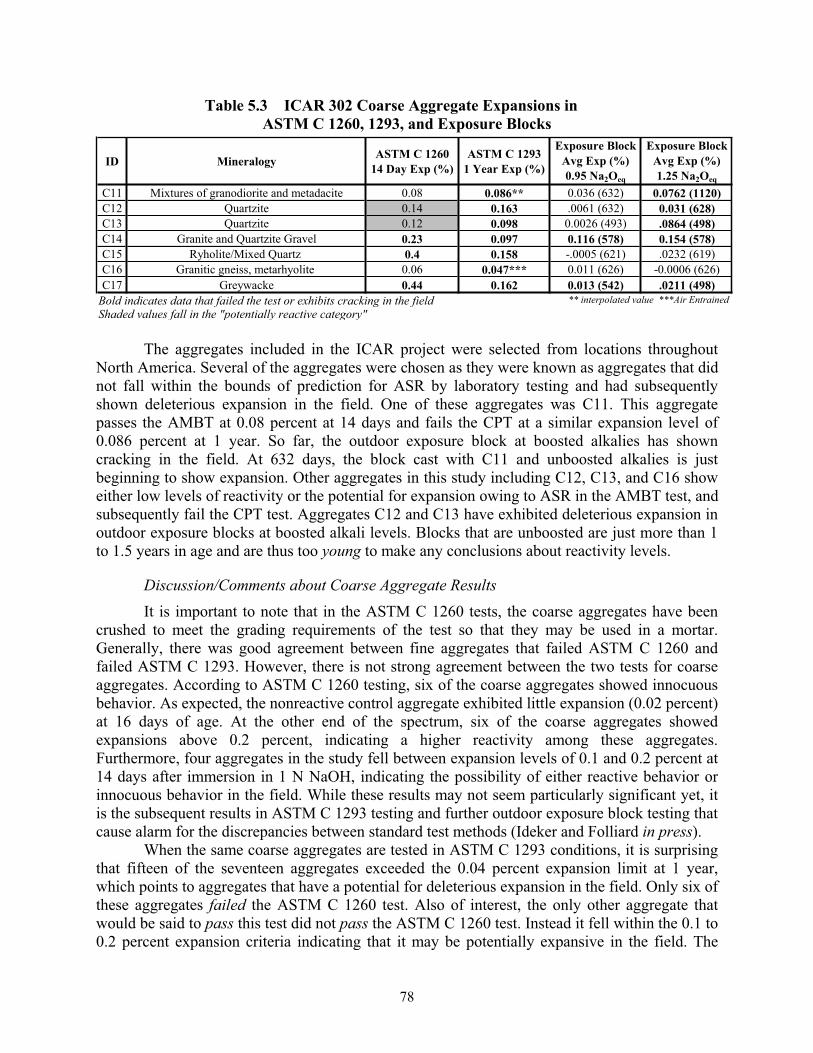
78
Table 5.3 ICAR 302 Coarse Aggregate Expansions inASTM C 1260, 1293, and Exposure Blocks
ID Mineralogy ASTM C 1260 14 Day Exp (%)
ASTM C 1293 1 Year Exp (%)
Exposure Block Avg Exp (%) 0.95 Na2Oeq
Exposure Block Avg Exp (%) 1.25 Na2Oeq
C11 Mixtures of granodiorite and metadacite 0.08 0.086** 0.036 (632) 0.0762 (1120)C12 Quartzite 0.14 0.163 .0061 (632) 0.031 (628)C13 Quartzite 0.12 0.098 0.0026 (493) .0864 (498)C14 Granite and Quartzite Gravel 0.23 0.097 0.116 (578) 0.154 (578)C15 Ryholite/Mixed Quartz 0.4 0.158 -.0005 (621) .0232 (619)C16 Granitic gneiss, metarhyolite 0.06 0.047*** 0.011 (626) -0.0006 (626)C17 Greywacke 0.44 0.162 0.013 (542) .0211 (498)
** interpolated value ***Air EntrainedBold indicates data that failed the test or exhibits cracking in the fieldShaded values fall in the "potentially reactive category"
The aggregates included in the ICAR project were selected from locations throughout North America. Several of the aggregates were chosen as they were known as aggregates that did not fall within the bounds of prediction for ASR by laboratory testing and had subsequently shown deleterious expansion in the field. One of these aggregates was C11. This aggregate passes the AMBT at 0.08 percent at 14 days and fails the CPT at a similar expansion level of 0.086 percent at 1 year. So far, the outdoor exposure block at boosted alkalies has shown cracking in the field. At 632 days, the block cast with C11 and unboosted alkalies is just beginning to show expansion. Other aggregates in this study including C12, C13, and C16 show either low levels of reactivity or the potential for expansion owing to ASR in the AMBT test, and subsequently fail the CPT test. Aggregates C12 and C13 have exhibited deleterious expansion in outdoor exposure blocks at boosted alkali levels. Blocks that are unboosted are just more than 1 to 1.5 years in age and are thus too young to make any conclusions about reactivity levels.
Discussion/Comments about Coarse Aggregate Results It is important to note that in the ASTM C 1260 tests, the coarse aggregates have been
crushed to meet the grading requirements of the test so that they may be used in a mortar. Generally, there was good agreement between fine aggregates that failed ASTM C 1260 and failed ASTM C 1293. However, there is not strong agreement between the two tests for coarse aggregates. According to ASTM C 1260 testing, six of the coarse aggregates showed innocuous behavior. As expected, the nonreactive control aggregate exhibited little expansion (0.02 percent) at 16 days of age. At the other end of the spectrum, six of the coarse aggregates showed expansions above 0.2 percent, indicating a higher reactivity among these aggregates. Furthermore, four aggregates in the study fell between expansion levels of 0.1 and 0.2 percent at 14 days after immersion in 1 N NaOH, indicating the possibility of either reactive behavior or innocuous behavior in the field. While these results may not seem particularly significant yet, it is the subsequent results in ASTM C 1293 testing and further outdoor exposure block testing that cause alarm for the discrepancies between standard test methods (Ideker and Folliard in press).
When the same coarse aggregates are tested in ASTM C 1293 conditions, it is surprising that fifteen of the seventeen aggregates exceeded the 0.04 percent expansion limit at 1 year, which points to aggregates that have a potential for deleterious expansion in the field. Only six of these aggregates failed the ASTM C 1260 test. Also of interest, the only other aggregate that would be said to pass this test did not pass the ASTM C 1260 test. Instead it fell within the 0.1 to 0.2 percent expansion criteria indicating that it may be potentially expansive in the field. The
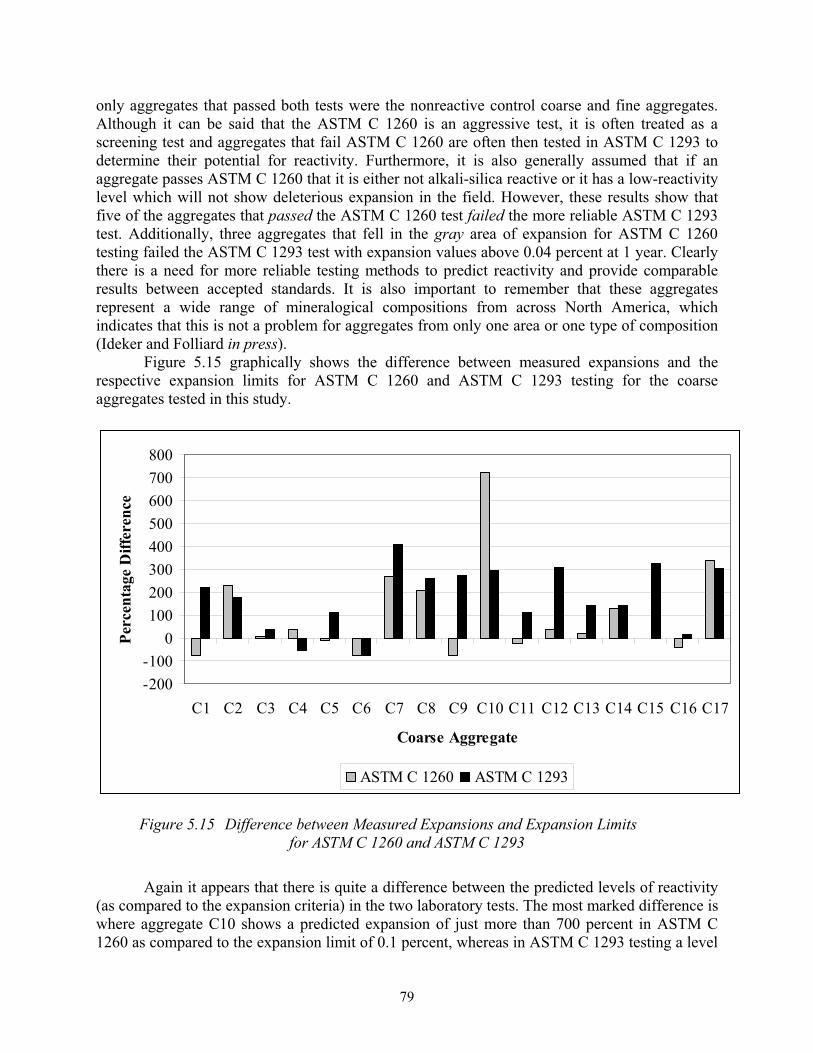
79
only aggregates that passed both tests were the nonreactive control coarse and fine aggregates. Although it can be said that the ASTM C 1260 is an aggressive test, it is often treated as a screening test and aggregates that fail ASTM C 1260 are often then tested in ASTM C 1293 to determine their potential for reactivity. Furthermore, it is also generally assumed that if an aggregate passes ASTM C 1260 that it is either not alkali-silica reactive or it has a low-reactivity level which will not show deleterious expansion in the field. However, these results show that five of the aggregates that passed the ASTM C 1260 test failed the more reliable ASTM C 1293 test. Additionally, three aggregates that fell in the gray area of expansion for ASTM C 1260 testing failed the ASTM C 1293 test with expansion values above 0.04 percent at 1 year. Clearly there is a need for more reliable testing methods to predict reactivity and provide comparable results between accepted standards. It is also important to remember that these aggregates represent a wide range of mineralogical compositions from across North America, which indicates that this is not a problem for aggregates from only one area or one type of composition (Ideker and Folliard in press).
Figure 5.15 graphically shows the difference between measured expansions and the respective expansion limits for ASTM C 1260 and ASTM C 1293 testing for the coarse aggregates tested in this study.
-200-100
0100200300400500600700800
C1 C2 C3 C4 C5 C6 C7 C8 C9 C10 C11 C12 C13 C14 C15 C16 C17
Coarse Aggregate
Perc
enta
ge D
iffer
ence
ASTM C 1260 ASTM C 1293
Figure 5.15 Difference between Measured Expansions and Expansion Limits for ASTM C 1260 and ASTM C 1293
Again it appears that there is quite a difference between the predicted levels of reactivity (as compared to the expansion criteria) in the two laboratory tests. The most marked difference is where aggregate C10 shows a predicted expansion of just more than 700 percent in ASTM C 1260 as compared to the expansion limit of 0.1 percent, whereas in ASTM C 1293 testing a level
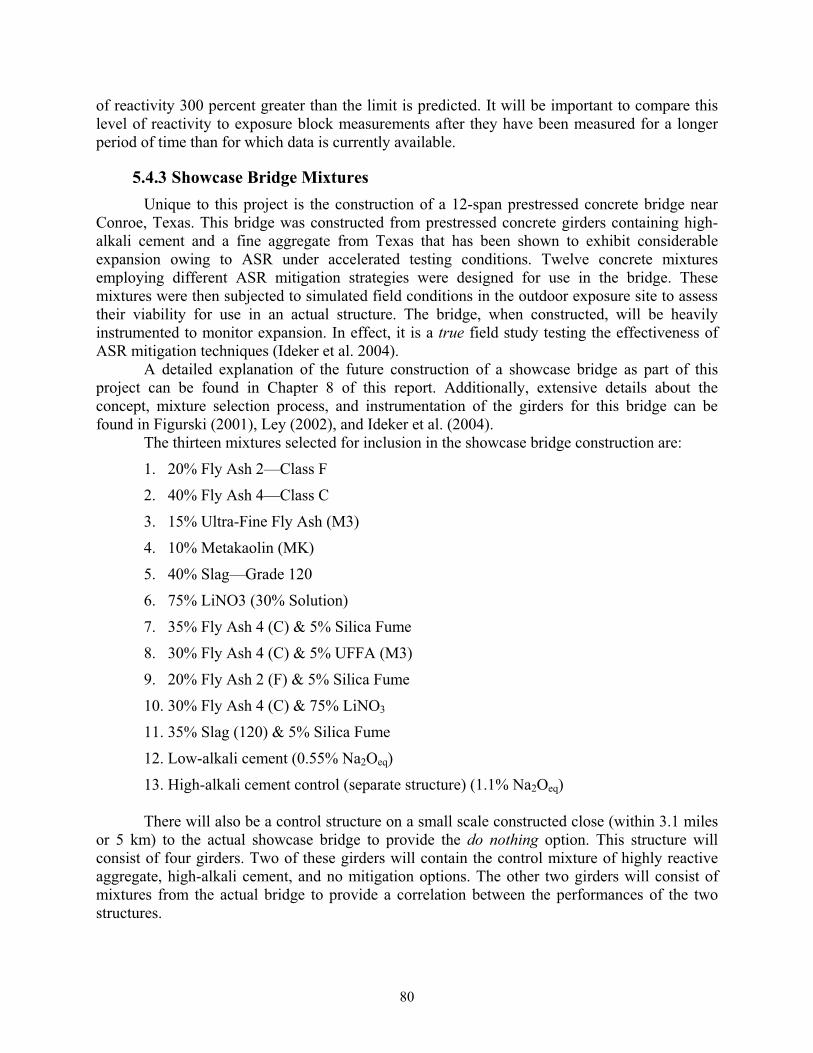
80
of reactivity 300 percent greater than the limit is predicted. It will be important to compare this level of reactivity to exposure block measurements after they have been measured for a longer period of time than for which data is currently available.
5.4.3 Showcase Bridge Mixtures Unique to this project is the construction of a 12-span prestressed concrete bridge near
Conroe, Texas. This bridge was constructed from prestressed concrete girders containing high-alkali cement and a fine aggregate from Texas that has been shown to exhibit considerable expansion owing to ASR under accelerated testing conditions. Twelve concrete mixtures employing different ASR mitigation strategies were designed for use in the bridge. These mixtures were then subjected to simulated field conditions in the outdoor exposure site to assess their viability for use in an actual structure. The bridge, when constructed, will be heavily instrumented to monitor expansion. In effect, it is a true field study testing the effectiveness of ASR mitigation techniques (Ideker et al. 2004).
A detailed explanation of the future construction of a showcase bridge as part of this project can be found in Chapter 8 of this report. Additionally, extensive details about the concept, mixture selection process, and instrumentation of the girders for this bridge can be found in Figurski (2001), Ley (2002), and Ideker et al. (2004).
The thirteen mixtures selected for inclusion in the showcase bridge construction are:
1. 20% Fly Ash 2—Class F
2. 40% Fly Ash 4—Class C
3. 15% Ultra-Fine Fly Ash (M3)
4. 10% Metakaolin (MK)
5. 40% Slag—Grade 120
6. 75% LiNO3 (30% Solution)
7. 35% Fly Ash 4 (C) & 5% Silica Fume
8. 30% Fly Ash 4 (C) & 5% UFFA (M3)
9. 20% Fly Ash 2 (F) & 5% Silica Fume
10. 30% Fly Ash 4 (C) & 75% LiNO3
11. 35% Slag (120) & 5% Silica Fume
12. Low-alkali cement (0.55% Na2Oeq)
13. High-alkali cement control (separate structure) (1.1% Na2Oeq)
There will also be a control structure on a small scale constructed close (within 3.1 miles or 5 km) to the actual showcase bridge to provide the do nothing option. This structure will consist of four girders. Two of these girders will contain the control mixture of highly reactive aggregate, high-alkali cement, and no mitigation options. The other two girders will consist of mixtures from the actual bridge to provide a correlation between the performances of the two structures.
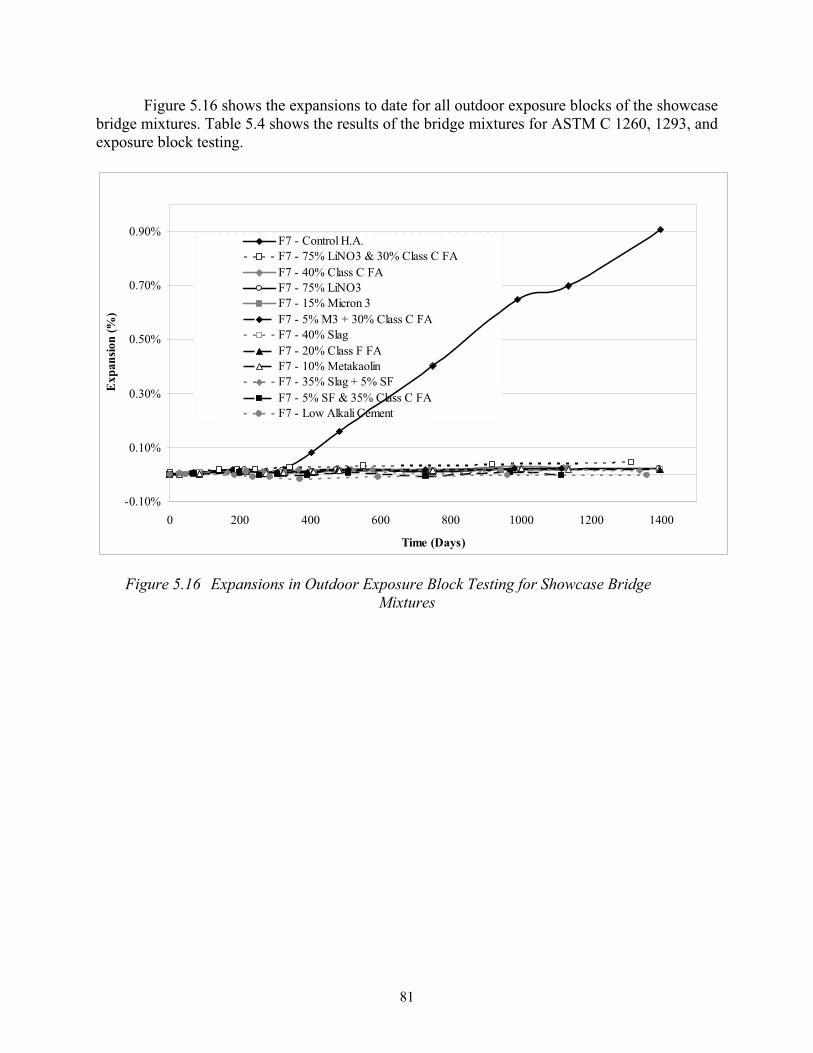
81
Figure 5.16 shows the expansions to date for all outdoor exposure blocks of the showcase bridge mixtures. Table 5.4 shows the results of the bridge mixtures for ASTM C 1260, 1293, and exposure block testing.
-0.10%
0.10%
0.30%
0.50%
0.70%
0.90%
0 200 400 600 800 1000 1200 1400
Time (Days)
Exp
ansio
n (%
)
F7 - Control H.A.F7 - 75% LiNO3 & 30% Class C FAF7 - 40% Class C FAF7 - 75% LiNO3F7 - 15% Micron 3F7 - 5% M3 + 30% Class C FAF7 - 40% SlagF7 - 20% Class F FAF7 - 10% MetakaolinF7 - 35% Slag + 5% SFF7 - 5% SF & 35% Class C FAF7 - Low Alkali Cement
Figure 5.16 Expansions in Outdoor Exposure Block Testing for Showcase Bridge Mixtures
82
Table 5.4 Expansions of Showcase Bridge Mixtures in Exposure Block Testing AMBT CPT
Showcase Bridge Mixtures - F7 14 day Expansion (%)
2 year Expansion (%)
Average Expansion (%) Age (days)
Control - F7 (1.25% Na2Oe) 0.29 0.21 0.9064 139720% FA2-F 0.04 0.016 0.0159 139540% FA4-C 0.08 0.007 0.0247 112215% UFFA 0.02 0.005* 0.0216 1134
10% Metakaolin 0.03 0.017 0.0201 113440% Slag 0.12 0.027 0.0192 1395
75% LiNO3 0.01 0.028 0.0212 139335% FA4-C & 5% SF 0.06 0.013 -0.0039 1115
30% FA4-C & 5% UFFA 0.06 0.017 0.0216 111520% FA2-F & 5% SF - 0.013 0.0077 1317
30% FA4-C & 75% LiNO3 0.02 0.025 0.0463 131435% Slag & 5% SF 0.07 0.023 0.0138 1338
Low Alkali Cement (0.52% Na2Oe) 0.23 0.001** -0.0021 1357*measurement at 18 months
**measurement at 1 year
Exposure Blocks
Bold indicates data that failed the test or exhibits cracking in the field
To date, the exposure block mixtures are performing very well in the field. The non-mitigated control at boosted alkalies has expanded to a value of 0.697 percent at 1,134 days. The low-alkali cement mixture (0.52 percent Na2Oe) seems to be showing the lowest expansion with an actual average negative value at 961 days. Originally, the schedule for the showcase bridge was on such a fast track that initial mixture selection was based on ASTM C 1260 data only. At the time, using supplementary cementing materials was not even covered by this test method. However, in 2004, ASTM C 1567 was adopted to include the use of SCMs in this testing regime to detect deleterious expansion owing to ASR. Subsequently, 2-year measurements in the ASTM C 1293 and now even exposure block expansions (3 + years old data) are available to corroborate the early ASTM C 1260 results.
5.4.4 Other Mixtures Containing Supplementary Cementing Materials and/or Lithium Nitrate
Table 5.5 gives expansion results for outdoor exposure blocks and corresponding ASTM C 1293 and, in some cases, ASTM C 1260 testing for other mixtures containing supplementary cementing materials or lithium nitrate. For mixtures containing lithium nitrate, the AMBT data is not included herein because there is no general consensus on how to best conduct this test when evaluating lithium compounds. This, along with other intricacies of laboratory testing with lithium, will be explored later in this report.
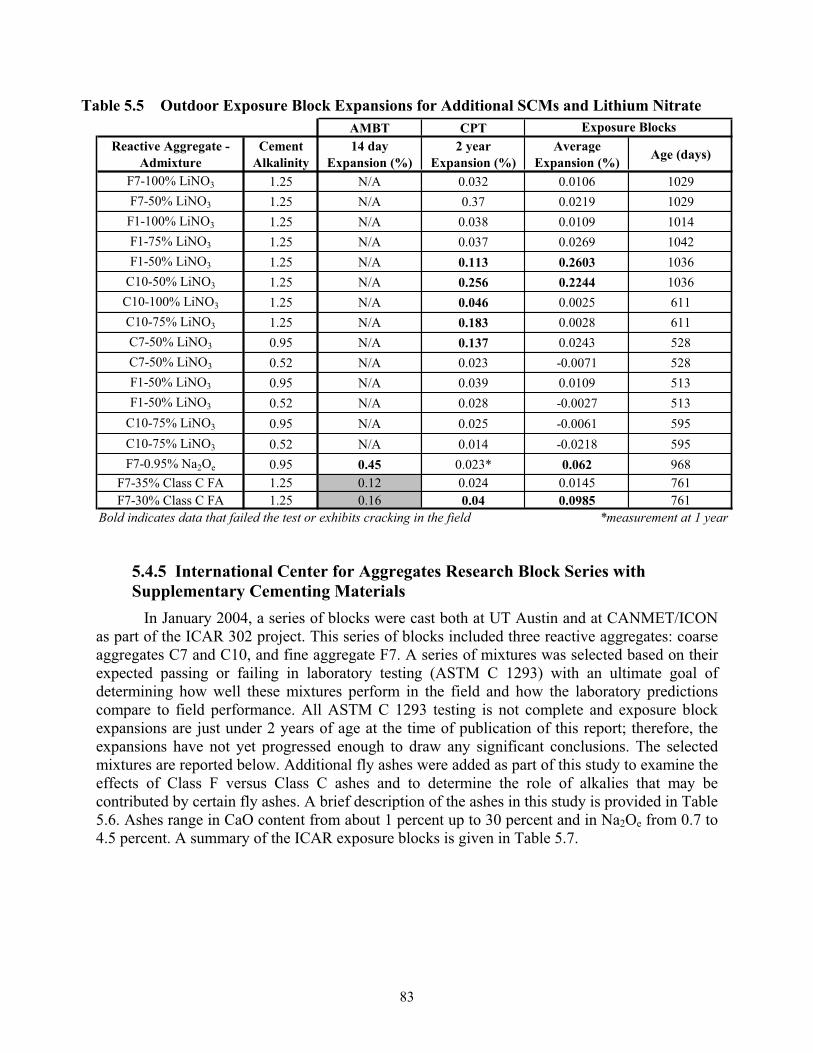
83
Table 5.5 Outdoor Exposure Block Expansions for Additional SCMs and Lithium Nitrate AMBT CPT
Reactive Aggregate - Admixture
Cement Alkalinity
14 day Expansion (%)
2 year Expansion (%)
Average Expansion (%) Age (days)
F7-100% LiNO3 1.25 N/A 0.032 0.0106 1029F7-50% LiNO3 1.25 N/A 0.37 0.0219 1029F1-100% LiNO3 1.25 N/A 0.038 0.0109 1014F1-75% LiNO3 1.25 N/A 0.037 0.0269 1042F1-50% LiNO3 1.25 N/A 0.113 0.2603 1036
C10-50% LiNO3 1.25 N/A 0.256 0.2244 1036C10-100% LiNO3 1.25 N/A 0.046 0.0025 611C10-75% LiNO3 1.25 N/A 0.183 0.0028 611C7-50% LiNO3 0.95 N/A 0.137 0.0243 528C7-50% LiNO3 0.52 N/A 0.023 -0.0071 528F1-50% LiNO3 0.95 N/A 0.039 0.0109 513F1-50% LiNO3 0.52 N/A 0.028 -0.0027 513
C10-75% LiNO3 0.95 N/A 0.025 -0.0061 595C10-75% LiNO3 0.52 N/A 0.014 -0.0218 595F7-0.95% Na2Oe 0.95 0.45 0.023* 0.062 968
F7-35% Class C FA 1.25 0.12 0.024 0.0145 761F7-30% Class C FA 1.25 0.16 0.04 0.0985 761
Bold indicates data that failed the test or exhibits cracking in the field *measurement at 1 year
Exposure Blocks
5.4.5 International Center for Aggregates Research Block Series with Supplementary Cementing Materials
In January 2004, a series of blocks were cast both at UT Austin and at CANMET/ICON as part of the ICAR 302 project. This series of blocks included three reactive aggregates: coarse aggregates C7 and C10, and fine aggregate F7. A series of mixtures was selected based on their expected passing or failing in laboratory testing (ASTM C 1293) with an ultimate goal of determining how well these mixtures perform in the field and how the laboratory predictions compare to field performance. All ASTM C 1293 testing is not complete and exposure block expansions are just under 2 years of age at the time of publication of this report; therefore, the expansions have not yet progressed enough to draw any significant conclusions. The selected mixtures are reported below. Additional fly ashes were added as part of this study to examine the effects of Class F versus Class C ashes and to determine the role of alkalies that may be contributed by certain fly ashes. A brief description of the ashes in this study is provided in Table 5.6. Ashes range in CaO content from about 1 percent up to 30 percent and in Na2Oe from 0.7 to 4.5 percent. A summary of the ICAR exposure blocks is given in Table 5.7.
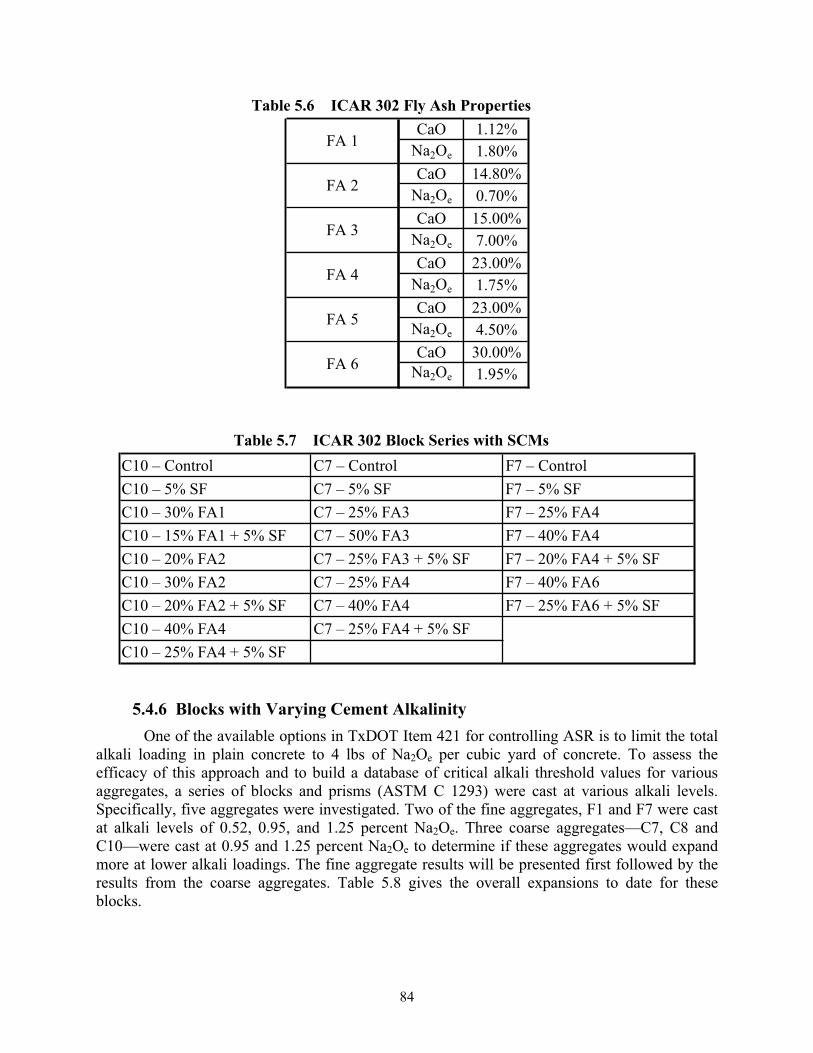
84
Table 5.6 ICAR 302 Fly Ash Properties CaO 1.12%
Na2Oe 1.80%CaO 14.80%
Na2Oe 0.70%CaO 15.00%
Na2Oe 7.00%CaO 23.00%
Na2Oe 1.75%CaO 23.00%
Na2Oe 4.50%CaO 30.00%
Na2Oe 1.95%
FA 5
FA 6
FA 1
FA 2
FA 3
FA 4
Table 5.7 ICAR 302 Block Series with SCMs C10 – Control C7 – Control F7 – ControlC10 – 5% SF C7 – 5% SF F7 – 5% SFC10 – 30% FA1 C7 – 25% FA3 F7 – 25% FA4C10 – 15% FA1 + 5% SF C7 – 50% FA3 F7 – 40% FA4C10 – 20% FA2 C7 – 25% FA3 + 5% SF F7 – 20% FA4 + 5% SFC10 – 30% FA2 C7 – 25% FA4 F7 – 40% FA6C10 – 20% FA2 + 5% SF C7 – 40% FA4 F7 – 25% FA6 + 5% SFC10 – 40% FA4 C7 – 25% FA4 + 5% SFC10 – 25% FA4 + 5% SF
5.4.6 Blocks with Varying Cement Alkalinity One of the available options in TxDOT Item 421 for controlling ASR is to limit the total
alkali loading in plain concrete to 4 lbs of Na2Oe per cubic yard of concrete. To assess the efficacy of this approach and to build a database of critical alkali threshold values for various aggregates, a series of blocks and prisms (ASTM C 1293) were cast at various alkali levels. Specifically, five aggregates were investigated. Two of the fine aggregates, F1 and F7 were cast at alkali levels of 0.52, 0.95, and 1.25 percent Na2Oe. Three coarse aggregates—C7, C8 and C10—were cast at 0.95 and 1.25 percent Na2Oe to determine if these aggregates would expand more at lower alkali loadings. The fine aggregate results will be presented first followed by the results from the coarse aggregates. Table 5.8 gives the overall expansions to date for these blocks.
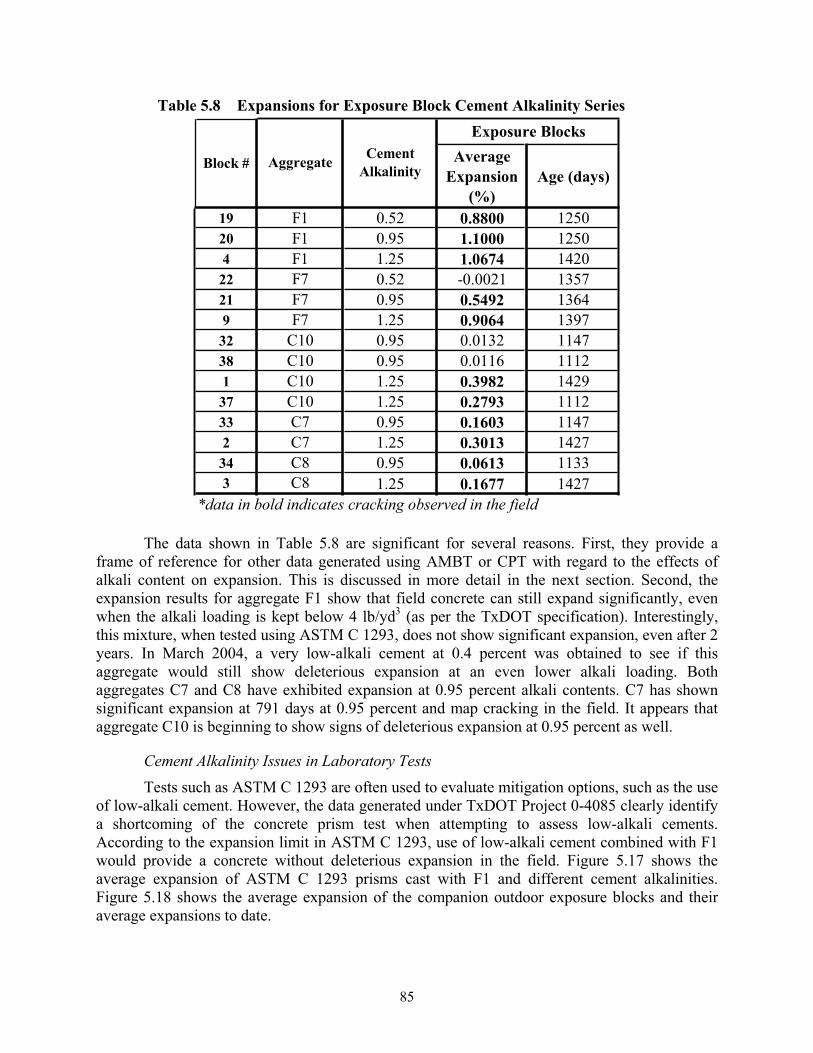
85
Table 5.8 Expansions for Exposure Block Cement Alkalinity Series
AverageExpansion
(%)Age (days)
19 F1 0.52 0.8800 125020 F1 0.95 1.1000 12504 F1 1.25 1.0674 1420
22 F7 0.52 -0.0021 135721 F7 0.95 0.5492 13649 F7 1.25 0.9064 1397
32 C10 0.95 0.0132 114738 C10 0.95 0.0116 11121 C10 1.25 0.3982 1429
37 C10 1.25 0.2793 111233 C7 0.95 0.1603 11472 C7 1.25 0.3013 1427
34 C8 0.95 0.0613 11333 C8 1.25 0.1677 1427
*data in bold indicates cracking observed in the field
Exposure Blocks
Block # Aggregate Cement Alkalinity
The data shown in Table 5.8 are significant for several reasons. First, they provide a frame of reference for other data generated using AMBT or CPT with regard to the effects of alkali content on expansion. This is discussed in more detail in the next section. Second, the expansion results for aggregate F1 show that field concrete can still expand significantly, even when the alkali loading is kept below 4 lb/yd3 (as per the TxDOT specification). Interestingly, this mixture, when tested using ASTM C 1293, does not show significant expansion, even after 2 years. In March 2004, a very low-alkali cement at 0.4 percent was obtained to see if this aggregate would still show deleterious expansion at an even lower alkali loading. Both aggregates C7 and C8 have exhibited expansion at 0.95 percent alkali contents. C7 has shown significant expansion at 791 days at 0.95 percent and map cracking in the field. It appears that aggregate C10 is beginning to show signs of deleterious expansion at 0.95 percent as well.
Cement Alkalinity Issues in Laboratory Tests Tests such as ASTM C 1293 are often used to evaluate mitigation options, such as the use
of low-alkali cement. However, the data generated under TxDOT Project 0-4085 clearly identify a shortcoming of the concrete prism test when attempting to assess low-alkali cements. According to the expansion limit in ASTM C 1293, use of low-alkali cement combined with F1 would provide a concrete without deleterious expansion in the field. Figure 5.17 shows the average expansion of ASTM C 1293 prisms cast with F1 and different cement alkalinities. Figure 5.18 shows the average expansion of the companion outdoor exposure blocks and their average expansions to date.
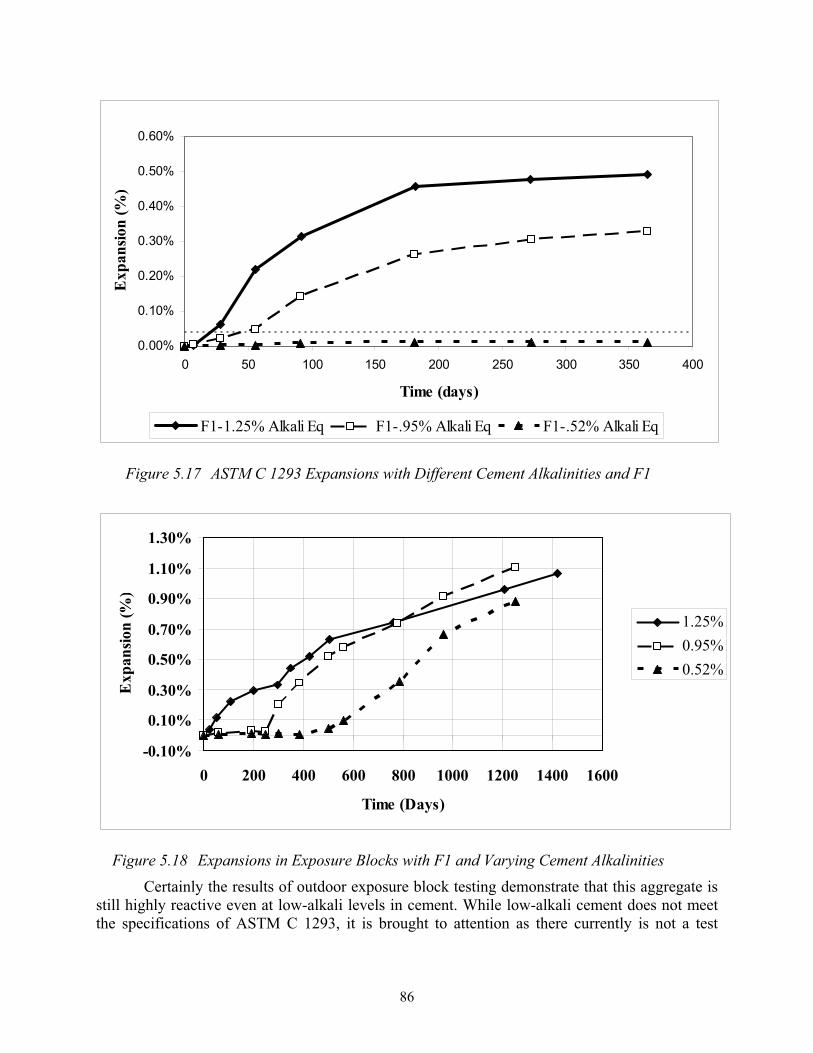
86
0.00%
0.10%
0.20%
0.30%
0.40%
0.50%
0.60%
0 50 100 150 200 250 300 350 400
Time (days)
Exp
ansio
n (%
)
F1-1.25% Alkali Eq F1-.95% Alkali Eq F1-.52% Alkali Eq
Figure 5.17 ASTM C 1293 Expansions with Different Cement Alkalinities and F1
-0.10%
0.10%
0.30%
0.50%
0.70%
0.90%
1.10%
1.30%
0 200 400 600 800 1000 1200 1400 1600
Time (Days)
Exp
ansio
n (%
)
1.25%0.95%0.52%
Figure 5.18 Expansions in Exposure Blocks with F1 and Varying Cement Alkalinities Certainly the results of outdoor exposure block testing demonstrate that this aggregate is
still highly reactive even at low-alkali levels in cement. While low-alkali cement does not meet the specifications of ASTM C 1293, it is brought to attention as there currently is not a test
87
which is capable of reliably predicting the performance of low-alkali cement combined with reactive aggregates.
5.5 SummaryOne of the most innovative portions of this TxDOT 0-4085 project has been the
development of an outdoor exposure site. It is the only one of its kind in the U.S. and should provide a wealth of long-term data for the State of Texas. This site has allowed for preliminary comparisons or laboratory testing methods for potential ASR in aggregates, namely ASTM C 1260 and ASTM C 1293. Overall these tests provide decent predictions of aggregate reactivity and the potential for deleterious expansion in the field. However, comparisons between the predicted levels of reactivity between laboratory tests are often impractical if not completely impossible. A corroboration of these testing methods with field performance is necessary to better develop future laboratory tests that may provide a better link between the laboratory and the field. However, inherent to laboratory testing is the need to accelerate actual field conditions and along with this necessity comes more inherent error and lack of correlation to real field performance. The outdoor exposure site aims to supply actual field performance data to validate laboratory testing and to provide researchers with the necessary data to more accurately develop newer tests.

88
89
6. Lithium Compounds for Preventing or Mitigating Alkali-Silica Reaction
6.1 IntroductionThe ability of lithium compounds to control expansion owing to alkali-silica reaction
(ASR) was first reported by McCoy and Caldwell (1951). After testing a wide range of chemical compounds using the ASTM C 227 mortar bar test (with Pyrex glass as the reactive aggregate), McCoy and Caldwell discovered that the most promising candidates in reducing ASR expansion were lithium compounds (LiCl, Li2CO3, LiF, Li2SiO3, LiNO3, and Li2SO4), which essentially eliminated expansion after 8 weeks of storage at 100° F, provided they were used in sufficient quantity.
After McCoy and Caldwell published the findings of their study in 1951, there was little interest and only a few studies on using lithium compounds to control ASR for about 40 years. In the past 10 years or so, however, there has been resurgence in the interest in lithium-bearing compounds, which has been reflected in an increase in scientific publications and field applications.
Most of the work done to date on lithium compounds has involved their use as a chemical admixture in mortar and concrete. There have also been publications related to using lithium compounds to treat concrete already suffering from ASR-induced expansion. Research by Stark et al. (1993) and Stokes et al. (2000b) have shown that lithium can help in the post-treatment of existing mortar or concrete already suffering from ASR. Much of the work to date on using lithium to mitigate ASR-induced damage in hardened concrete has relied on accelerated laboratory tests involving storing mortar or concrete specimens above water at higher temperatures (e.g., 100° F). The work presented in this chapter seeks to extend this research to include comprehensive testing using mortar bars fully immersed in alkaline solutions at elevated temperatures. In addition, the effectiveness of lithium as an admixture is also presented and correlations between the test methods ASTM C 1260 and ASTM C 1293 are discussed. In addition to the results shown in this chapter, there is significant ongoing research at UT Austin, funded by the Federal Highway Administration (FHWA),that is focusing entirely on using lithium to mitigate or prevent ASR in new and existing concrete. Information on this project will be forthcoming in other publications.
6.2 ObjectiveMuch progress has been made over the years to prevent ASR-induced damage in newly
constructed concrete structures. New and improved test methods and specifications have provided practitioners with the necessary tools to avoid ASR through the use of supplementary cementing materials (SCMs), low-alkali concrete, and chemical admixtures, such as lithium-based compounds. Although these preventive measures have helped to reduce the instances of ASR in new concrete, there is still a need to provide guidance on treating existing structures already suffering from ASR-induced expansion and cracking. The research reported in this chapter is aimed at developing accelerated tests to determine the efficacy of using lithium as an admixture in fresh concrete, as well as a post-treatment for hardened concrete already suffering from expansion and cracking owing to ASR.
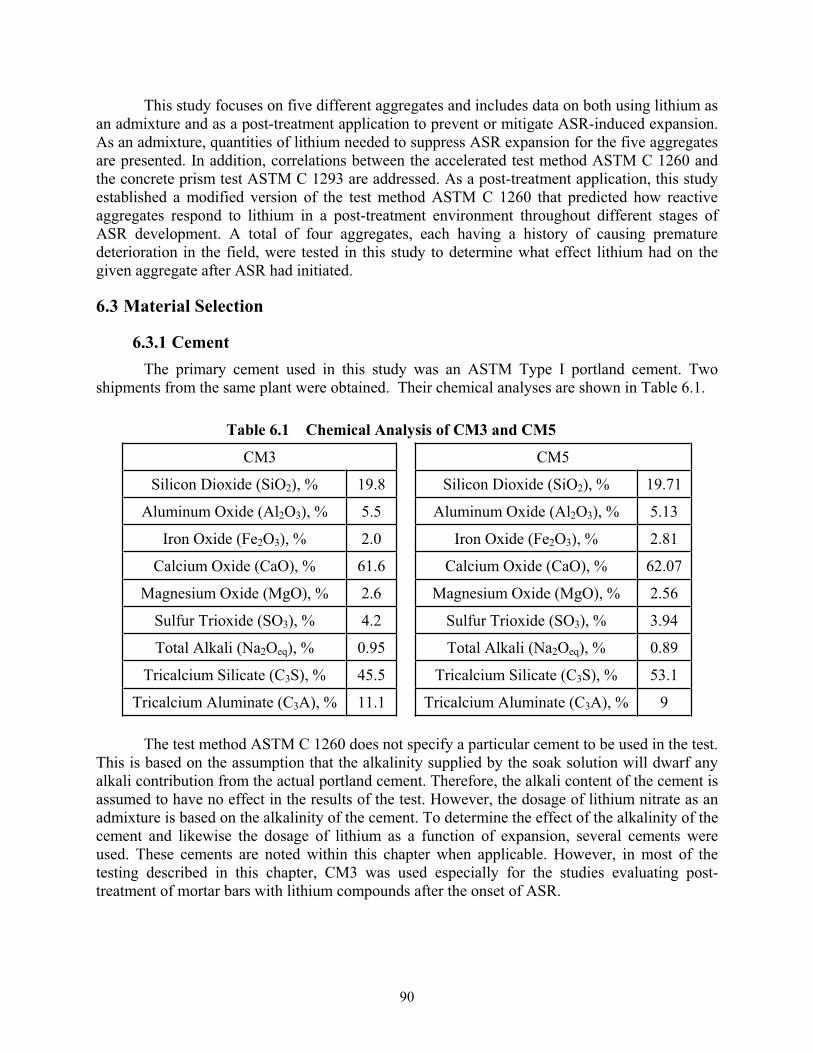
90
This study focuses on five different aggregates and includes data on both using lithium as an admixture and as a post-treatment application to prevent or mitigate ASR-induced expansion. As an admixture, quantities of lithium needed to suppress ASR expansion for the five aggregates are presented. In addition, correlations between the accelerated test method ASTM C 1260 and the concrete prism test ASTM C 1293 are addressed. As a post-treatment application, this study established a modified version of the test method ASTM C 1260 that predicted how reactive aggregates respond to lithium in a post-treatment environment throughout different stages of ASR development. A total of four aggregates, each having a history of causing premature deterioration in the field, were tested in this study to determine what effect lithium had on the given aggregate after ASR had initiated.
6.3 Material Selection
6.3.1 CementThe primary cement used in this study was an ASTM Type I portland cement. Two
shipments from the same plant were obtained. Their chemical analyses are shown in Table 6.1.
Table 6.1 Chemical Analysis of CM3 and CM5
CM3 CM5
Silicon Dioxide (SiO2), % 19.8 Silicon Dioxide (SiO2), % 19.71
Aluminum Oxide (Al2O3), % 5.5 Aluminum Oxide (Al2O3), % 5.13
Iron Oxide (Fe2O3), % 2.0 Iron Oxide (Fe2O3), % 2.81
Calcium Oxide (CaO), % 61.6 Calcium Oxide (CaO), % 62.07
Magnesium Oxide (MgO), % 2.6 Magnesium Oxide (MgO), % 2.56
Sulfur Trioxide (SO3), % 4.2 Sulfur Trioxide (SO3), % 3.94
Total Alkali (Na2Oeq), % 0.95 Total Alkali (Na2Oeq), % 0.89
Tricalcium Silicate (C3S), % 45.5 Tricalcium Silicate (C3S), % 53.1
Tricalcium Aluminate (C3A), % 11.1 Tricalcium Aluminate (C3A), % 9
The test method ASTM C 1260 does not specify a particular cement to be used in the test. This is based on the assumption that the alkalinity supplied by the soak solution will dwarf any alkali contribution from the actual portland cement. Therefore, the alkali content of the cement is assumed to have no effect in the results of the test. However, the dosage of lithium nitrate as an admixture is based on the alkalinity of the cement. To determine the effect of the alkalinity of the cement and likewise the dosage of lithium as a function of expansion, several cements were used. These cements are noted within this chapter when applicable. However, in most of the testing described in this chapter, CM3 was used especially for the studies evaluating post-treatment of mortar bars with lithium compounds after the onset of ASR.
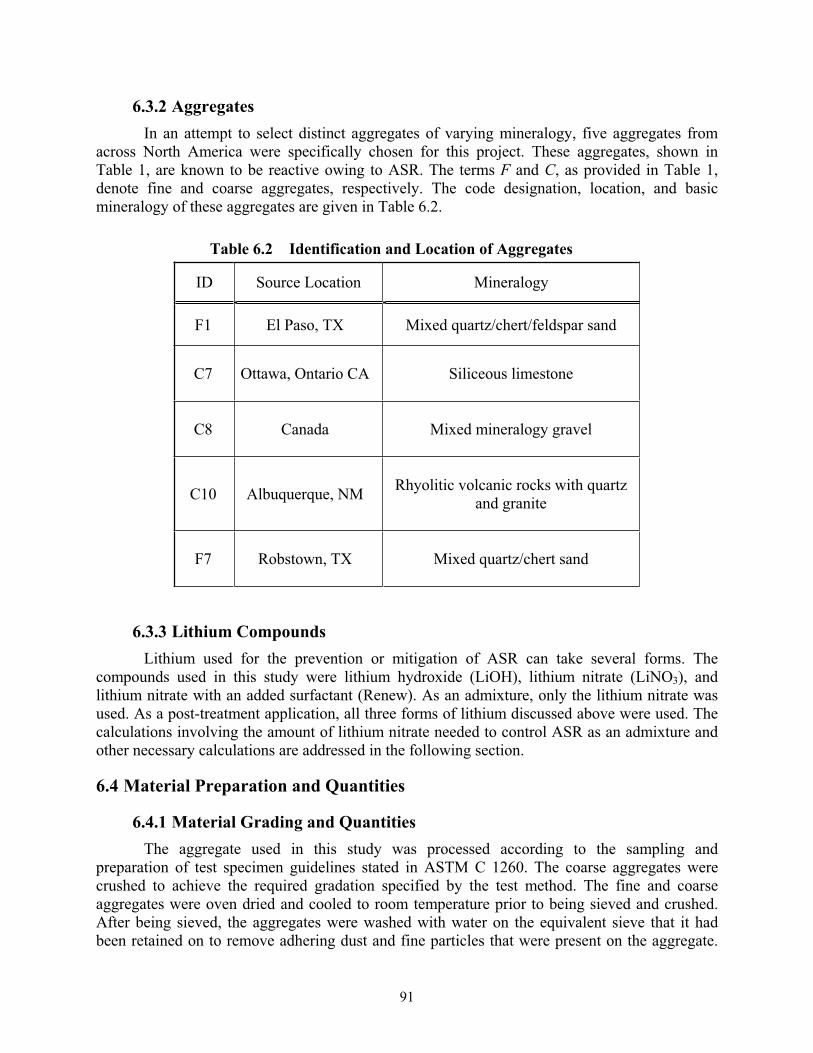
91
6.3.2 AggregatesIn an attempt to select distinct aggregates of varying mineralogy, five aggregates from
across North America were specifically chosen for this project. These aggregates, shown in Table 1, are known to be reactive owing to ASR. The terms F and C, as provided in Table 1, denote fine and coarse aggregates, respectively. The code designation, location, and basic mineralogy of these aggregates are given in Table 6.2.
Table 6.2 Identification and Location of Aggregates
ID Source Location Mineralogy
F1 El Paso, TX Mixed quartz/chert/feldspar sand
C7 Ottawa, Ontario CA Siliceous limestone
C8 Canada Mixed mineralogy gravel
C10 Albuquerque, NM Rhyolitic volcanic rocks with quartz and granite
F7 Robstown, TX Mixed quartz/chert sand
6.3.3 Lithium Compounds Lithium used for the prevention or mitigation of ASR can take several forms. The
compounds used in this study were lithium hydroxide (LiOH), lithium nitrate (LiNO3), and lithium nitrate with an added surfactant (Renew). As an admixture, only the lithium nitrate was used. As a post-treatment application, all three forms of lithium discussed above were used. The calculations involving the amount of lithium nitrate needed to control ASR as an admixture and other necessary calculations are addressed in the following section.
6.4 Material Preparation and Quantities
6.4.1 Material Grading and Quantities The aggregate used in this study was processed according to the sampling and
preparation of test specimen guidelines stated in ASTM C 1260. The coarse aggregates were crushed to achieve the required gradation specified by the test method. The fine and coarse aggregates were oven dried and cooled to room temperature prior to being sieved and crushed. After being sieved, the aggregates were washed with water on the equivalent sieve that it had been retained on to remove adhering dust and fine particles that were present on the aggregate.
92
After washing, the aggregate remaining on the sieve was oven dried and then cooled to room temperature before use in the test. Table 6.3 presents the grading requirements for the test method ASTM C 1260.
Table 6.3 Grading Requirements for ASTM C 1260 Passing Sieve Retained on Sieve Mass %
4.75mm (No. 4) 2.36 mm (No. 8) 10 2.36 mm (No. 8) 1.18 mm (No. 16) 25 1.18 mm (No. 16) 600 μm (No. 30) 25600 μm (No. 30) 300 μm (No. 50) 25300 μm (No. 50) 150 μm (No. 100) 15
The standard water-to-cement ratio (w/c) for ASTM C 1260 is 0.47 by mass and remains constant in every mixture. Likewise, the cement-to-aggregate ratio in each mixture also remains constant. This ratio is 1 part cement to 2.25 parts of aggregate and the cement is passed through a No. 20 sieve prior to mixing. The quantities necessary to cast three mortar bars are listed in Table 6.4.
Table 6.4 Actual Quantities of Materials Used in Mixture
Sieve No. Percent by Mass (%) Amount of Aggregate (g) 8 10 99 16 25 247.5 30 25 247.5 50 25 247.5 100 15 148.5
Water (g) 206.8
Cement (g) 440
6.4.2 Sodium Hydroxide The test method ASTM C 1260 specifies a 1N sodium hydroxide (NaOH) soak solution.
The sodium hydroxide solution initially contains approximately 50 percent sodium hydroxide and 50 percent water. The necessary amount of solution to obtain one liter of one normal sodium hydroxide soak solution, assuming the solution is 50 percent NaOH, is given in Table 6.5. These amounts were adjusted based on the lot analysis furnished by the manufacturer.
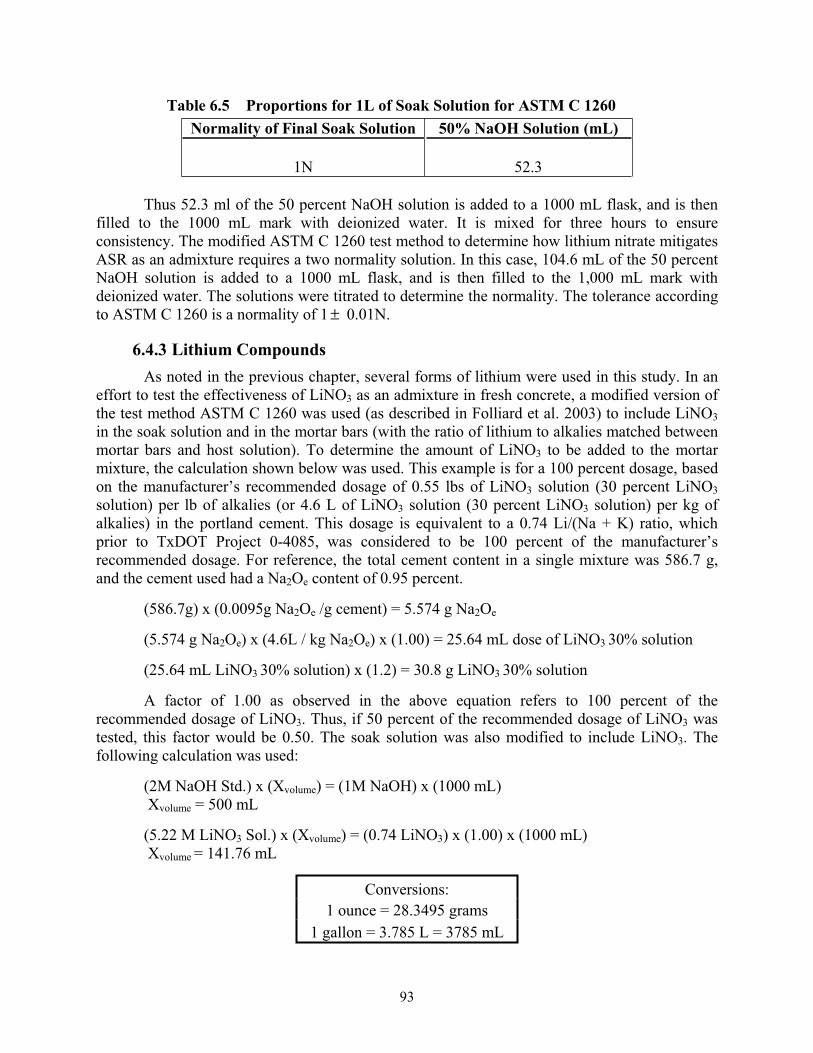
93
Table 6.5 Proportions for 1L of Soak Solution for ASTM C 1260 Normality of Final Soak Solution 50% NaOH Solution (mL)
1N 52.3
Thus 52.3 ml of the 50 percent NaOH solution is added to a 1000 mL flask, and is then filled to the 1000 mL mark with deionized water. It is mixed for three hours to ensure consistency. The modified ASTM C 1260 test method to determine how lithium nitrate mitigates ASR as an admixture requires a two normality solution. In this case, 104.6 mL of the 50 percent NaOH solution is added to a 1000 mL flask, and is then filled to the 1,000 mL mark with deionized water. The solutions were titrated to determine the normality. The tolerance according to ASTM C 1260 is a normality of 1 ± 0.01N.
6.4.3 Lithium Compounds As noted in the previous chapter, several forms of lithium were used in this study. In an
effort to test the effectiveness of LiNO3 as an admixture in fresh concrete, a modified version of the test method ASTM C 1260 was used (as described in Folliard et al. 2003) to include LiNO3in the soak solution and in the mortar bars (with the ratio of lithium to alkalies matched between mortar bars and host solution). To determine the amount of LiNO3 to be added to the mortar mixture, the calculation shown below was used. This example is for a 100 percent dosage, based on the manufacturer’s recommended dosage of 0.55 lbs of LiNO3 solution (30 percent LiNO3solution) per lb of alkalies (or 4.6 L of LiNO3 solution (30 percent LiNO3 solution) per kg of alkalies) in the portland cement. This dosage is equivalent to a 0.74 Li/(Na + K) ratio, which prior to TxDOT Project 0-4085, was considered to be 100 percent of the manufacturer’s recommended dosage. For reference, the total cement content in a single mixture was 586.7 g, and the cement used had a Na2Oe content of 0.95 percent.
(586.7g) x (0.0095g Na2Oe /g cement) = 5.574 g Na2Oe
(5.574 g Na2Oe) x (4.6L / kg Na2Oe) x (1.00) = 25.64 mL dose of LiNO3 30% solution
(25.64 mL LiNO3 30% solution) x (1.2) = 30.8 g LiNO3 30% solution
A factor of 1.00 as observed in the above equation refers to 100 percent of the recommended dosage of LiNO3. Thus, if 50 percent of the recommended dosage of LiNO3 was tested, this factor would be 0.50. The soak solution was also modified to include LiNO3. The following calculation was used:
(2M NaOH Std.) x (Xvolume) = (1M NaOH) x (1000 mL) Xvolume = 500 mL
(5.22 M LiNO3 Sol.) x (Xvolume) = (0.74 LiNO3) x (1.00) x (1000 mL) Xvolume = 141.76 mL
Conversions:1 ounce = 28.3495 grams
1 gallon = 3.785 L = 3785 mL
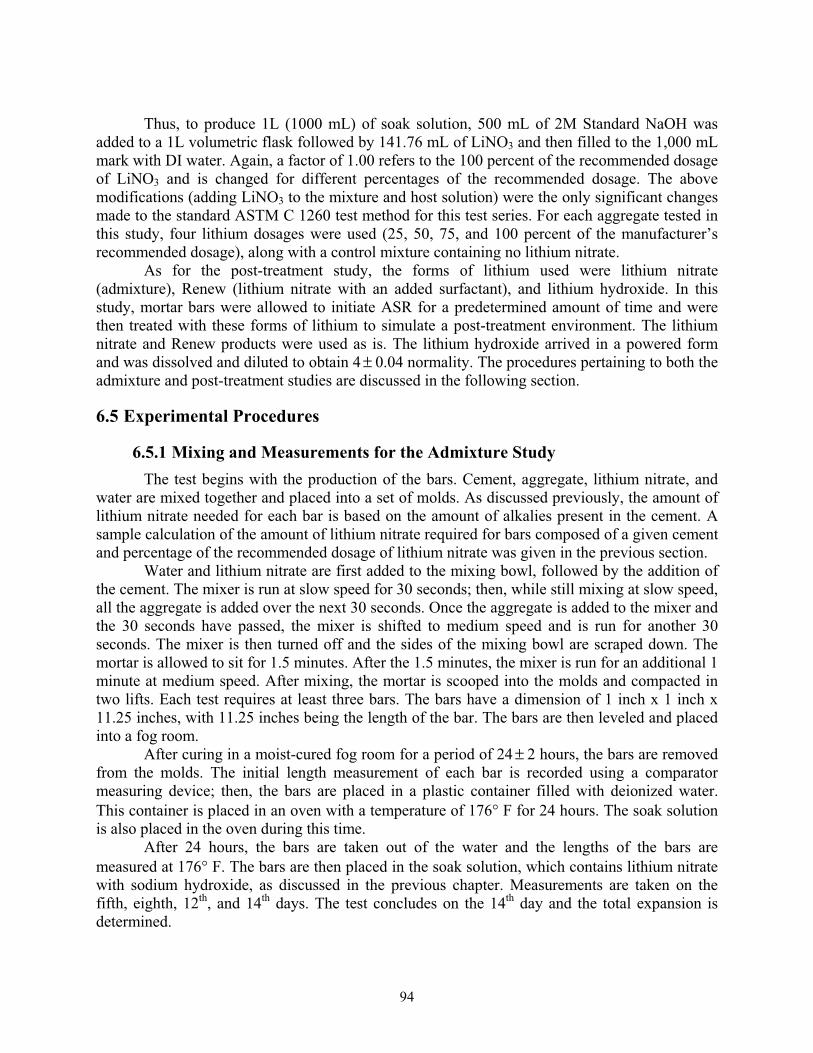
94
Thus, to produce 1L (1000 mL) of soak solution, 500 mL of 2M Standard NaOH was added to a 1L volumetric flask followed by 141.76 mL of LiNO3 and then filled to the 1,000 mL mark with DI water. Again, a factor of 1.00 refers to the 100 percent of the recommended dosage of LiNO3 and is changed for different percentages of the recommended dosage. The above modifications (adding LiNO3 to the mixture and host solution) were the only significant changes made to the standard ASTM C 1260 test method for this test series. For each aggregate tested in this study, four lithium dosages were used (25, 50, 75, and 100 percent of the manufacturer’s recommended dosage), along with a control mixture containing no lithium nitrate.
As for the post-treatment study, the forms of lithium used were lithium nitrate (admixture), Renew (lithium nitrate with an added surfactant), and lithium hydroxide. In this study, mortar bars were allowed to initiate ASR for a predetermined amount of time and were then treated with these forms of lithium to simulate a post-treatment environment. The lithium nitrate and Renew products were used as is. The lithium hydroxide arrived in a powered form and was dissolved and diluted to obtain 4 ± 0.04 normality. The procedures pertaining to both the admixture and post-treatment studies are discussed in the following section.
6.5 Experimental Procedures
6.5.1 Mixing and Measurements for the Admixture Study The test begins with the production of the bars. Cement, aggregate, lithium nitrate, and
water are mixed together and placed into a set of molds. As discussed previously, the amount of lithium nitrate needed for each bar is based on the amount of alkalies present in the cement. A sample calculation of the amount of lithium nitrate required for bars composed of a given cement and percentage of the recommended dosage of lithium nitrate was given in the previous section.
Water and lithium nitrate are first added to the mixing bowl, followed by the addition of the cement. The mixer is run at slow speed for 30 seconds; then, while still mixing at slow speed, all the aggregate is added over the next 30 seconds. Once the aggregate is added to the mixer and the 30 seconds have passed, the mixer is shifted to medium speed and is run for another 30 seconds. The mixer is then turned off and the sides of the mixing bowl are scraped down. The mortar is allowed to sit for 1.5 minutes. After the 1.5 minutes, the mixer is run for an additional 1 minute at medium speed. After mixing, the mortar is scooped into the molds and compacted in two lifts. Each test requires at least three bars. The bars have a dimension of 1 inch x 1 inch x 11.25 inches, with 11.25 inches being the length of the bar. The bars are then leveled and placed into a fog room.
After curing in a moist-cured fog room for a period of 24 ± 2 hours, the bars are removed from the molds. The initial length measurement of each bar is recorded using a comparator measuring device; then, the bars are placed in a plastic container filled with deionized water. This container is placed in an oven with a temperature of 176° F for 24 hours. The soak solution is also placed in the oven during this time.
After 24 hours, the bars are taken out of the water and the lengths of the bars are measured at 176° F. The bars are then placed in the soak solution, which contains lithium nitrate with sodium hydroxide, as discussed in the previous chapter. Measurements are taken on the fifth, eighth, 12th, and 14th days. The test concludes on the 14th day and the total expansion is determined.
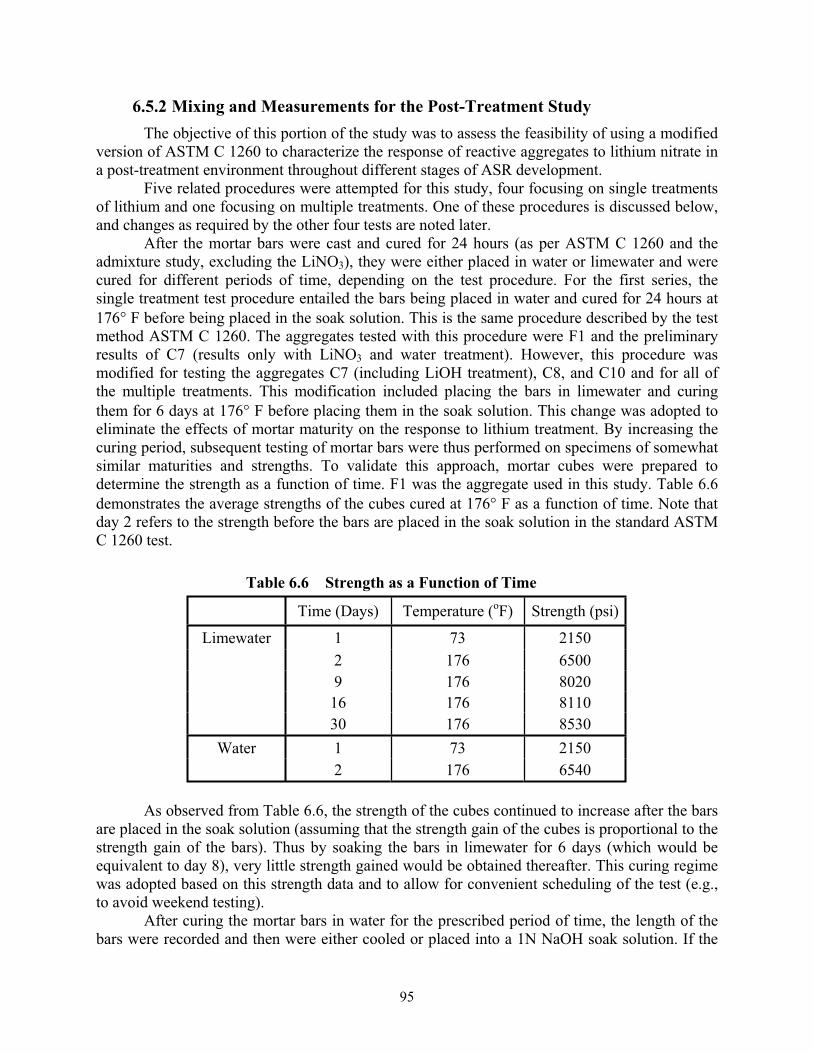
95
6.5.2 Mixing and Measurements for the Post-Treatment Study The objective of this portion of the study was to assess the feasibility of using a modified
version of ASTM C 1260 to characterize the response of reactive aggregates to lithium nitrate in a post-treatment environment throughout different stages of ASR development.
Five related procedures were attempted for this study, four focusing on single treatments of lithium and one focusing on multiple treatments. One of these procedures is discussed below, and changes as required by the other four tests are noted later.
After the mortar bars were cast and cured for 24 hours (as per ASTM C 1260 and the admixture study, excluding the LiNO3), they were either placed in water or limewater and were cured for different periods of time, depending on the test procedure. For the first series, the single treatment test procedure entailed the bars being placed in water and cured for 24 hours at 176° F before being placed in the soak solution. This is the same procedure described by the test method ASTM C 1260. The aggregates tested with this procedure were F1 and the preliminary results of C7 (results only with LiNO3 and water treatment). However, this procedure was modified for testing the aggregates C7 (including LiOH treatment), C8, and C10 and for all of the multiple treatments. This modification included placing the bars in limewater and curing them for 6 days at 176° F before placing them in the soak solution. This change was adopted to eliminate the effects of mortar maturity on the response to lithium treatment. By increasing the curing period, subsequent testing of mortar bars were thus performed on specimens of somewhat similar maturities and strengths. To validate this approach, mortar cubes were prepared to determine the strength as a function of time. F1 was the aggregate used in this study. Table 6.6 demonstrates the average strengths of the cubes cured at 176° F as a function of time. Note that day 2 refers to the strength before the bars are placed in the soak solution in the standard ASTM C 1260 test.
Table 6.6 Strength as a Function of Time
Time (Days) Temperature (oF) Strength (psi)
Limewater 1 73 2150 2 176 6500 9 176 8020 16 176 8110 30 176 8530
Water 1 73 2150 2 176 6540
As observed from Table 6.6, the strength of the cubes continued to increase after the bars are placed in the soak solution (assuming that the strength gain of the cubes is proportional to the strength gain of the bars). Thus by soaking the bars in limewater for 6 days (which would be equivalent to day 8), very little strength gained would be obtained thereafter. This curing regime was adopted based on this strength data and to allow for convenient scheduling of the test (e.g., to avoid weekend testing).
After curing the mortar bars in water for the prescribed period of time, the length of the bars were recorded and then were either cooled or placed into a 1N NaOH soak solution. If the
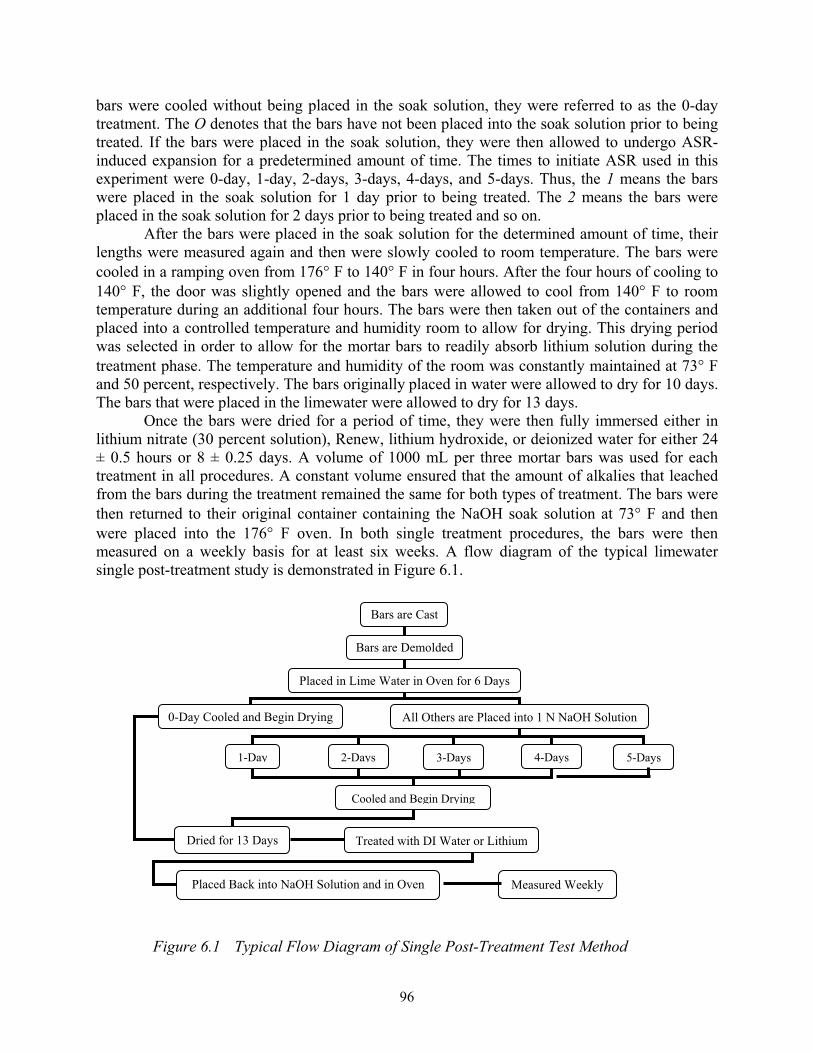
96
bars were cooled without being placed in the soak solution, they were referred to as the 0-day treatment. The O denotes that the bars have not been placed into the soak solution prior to being treated. If the bars were placed in the soak solution, they were then allowed to undergo ASR-induced expansion for a predetermined amount of time. The times to initiate ASR used in this experiment were 0-day, 1-day, 2-days, 3-days, 4-days, and 5-days. Thus, the 1 means the bars were placed in the soak solution for 1 day prior to being treated. The 2 means the bars were placed in the soak solution for 2 days prior to being treated and so on.
After the bars were placed in the soak solution for the determined amount of time, their lengths were measured again and then were slowly cooled to room temperature. The bars were cooled in a ramping oven from 176° F to 140° F in four hours. After the four hours of cooling to 140° F, the door was slightly opened and the bars were allowed to cool from 140° F to room temperature during an additional four hours. The bars were then taken out of the containers and placed into a controlled temperature and humidity room to allow for drying. This drying period was selected in order to allow for the mortar bars to readily absorb lithium solution during the treatment phase. The temperature and humidity of the room was constantly maintained at 73° F and 50 percent, respectively. The bars originally placed in water were allowed to dry for 10 days. The bars that were placed in the limewater were allowed to dry for 13 days.
Once the bars were dried for a period of time, they were then fully immersed either in lithium nitrate (30 percent solution), Renew, lithium hydroxide, or deionized water for either 24 ± 0.5 hours or 8 ± 0.25 days. A volume of 1000 mL per three mortar bars was used for each treatment in all procedures. A constant volume ensured that the amount of alkalies that leached from the bars during the treatment remained the same for both types of treatment. The bars were then returned to their original container containing the NaOH soak solution at 73° F and then were placed into the 176° F oven. In both single treatment procedures, the bars were then measured on a weekly basis for at least six weeks. A flow diagram of the typical limewater single post-treatment study is demonstrated in Figure 6.1.
Figure 6.1 Typical Flow Diagram of Single Post-Treatment Test Method
Bars are Cast
Bars are Demolded
Placed in Lime Water in Oven for 6 Days
0-Day Cooled and Begin Drying All Others are Placed into 1 N NaOH Solution
1-Day 2-Days 3-Days 4-Days 5-Days
Cooled and Begin Drying
Dried for 13 Days Treated with DI Water or Lithium
Placed Back into NaOH Solution and in Oven Measured Weekly
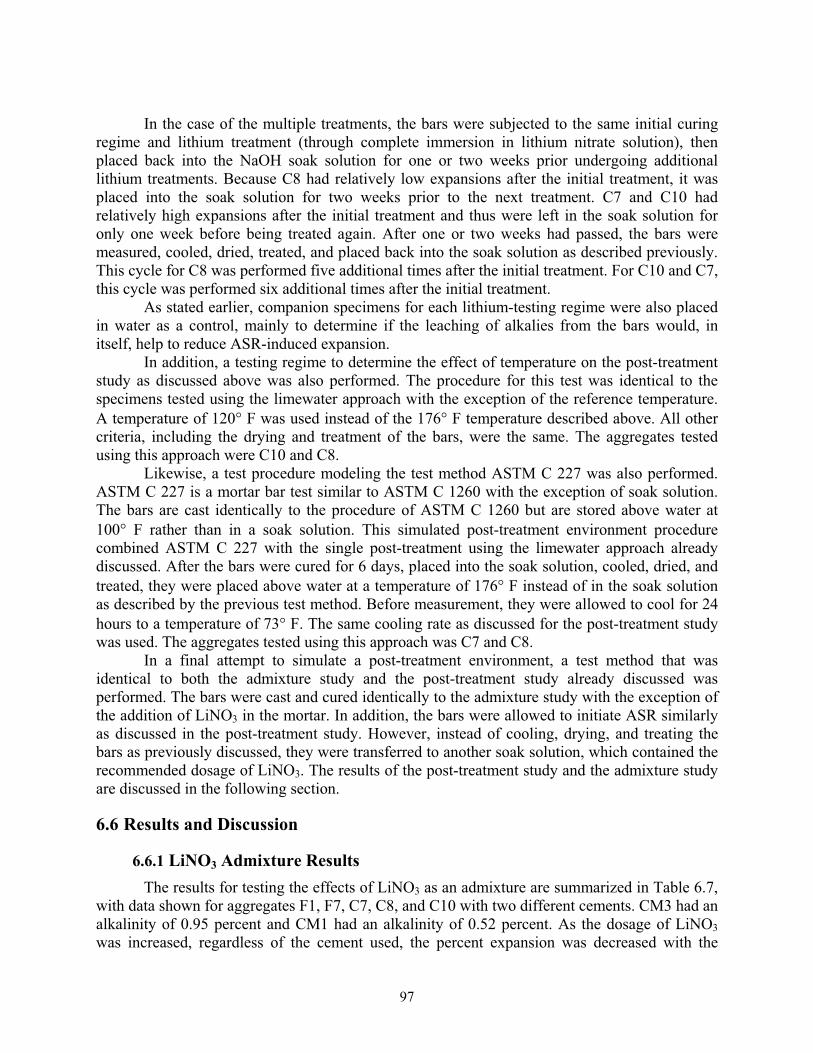
97
In the case of the multiple treatments, the bars were subjected to the same initial curing regime and lithium treatment (through complete immersion in lithium nitrate solution), then placed back into the NaOH soak solution for one or two weeks prior undergoing additional lithium treatments. Because C8 had relatively low expansions after the initial treatment, it was placed into the soak solution for two weeks prior to the next treatment. C7 and C10 had relatively high expansions after the initial treatment and thus were left in the soak solution for only one week before being treated again. After one or two weeks had passed, the bars were measured, cooled, dried, treated, and placed back into the soak solution as described previously. This cycle for C8 was performed five additional times after the initial treatment. For C10 and C7, this cycle was performed six additional times after the initial treatment.
As stated earlier, companion specimens for each lithium-testing regime were also placed in water as a control, mainly to determine if the leaching of alkalies from the bars would, in itself, help to reduce ASR-induced expansion.
In addition, a testing regime to determine the effect of temperature on the post-treatment study as discussed above was also performed. The procedure for this test was identical to the specimens tested using the limewater approach with the exception of the reference temperature. A temperature of 120° F was used instead of the 176° F temperature described above. All other criteria, including the drying and treatment of the bars, were the same. The aggregates tested using this approach were C10 and C8.
Likewise, a test procedure modeling the test method ASTM C 227 was also performed. ASTM C 227 is a mortar bar test similar to ASTM C 1260 with the exception of soak solution. The bars are cast identically to the procedure of ASTM C 1260 but are stored above water at 100° F rather than in a soak solution. This simulated post-treatment environment procedure combined ASTM C 227 with the single post-treatment using the limewater approach already discussed. After the bars were cured for 6 days, placed into the soak solution, cooled, dried, and treated, they were placed above water at a temperature of 176° F instead of in the soak solution as described by the previous test method. Before measurement, they were allowed to cool for 24 hours to a temperature of 73° F. The same cooling rate as discussed for the post-treatment study was used. The aggregates tested using this approach was C7 and C8.
In a final attempt to simulate a post-treatment environment, a test method that was identical to both the admixture study and the post-treatment study already discussed was performed. The bars were cast and cured identically to the admixture study with the exception of the addition of LiNO3 in the mortar. In addition, the bars were allowed to initiate ASR similarly as discussed in the post-treatment study. However, instead of cooling, drying, and treating the bars as previously discussed, they were transferred to another soak solution, which contained the recommended dosage of LiNO3. The results of the post-treatment study and the admixture study are discussed in the following section.
6.6 Results and Discussion
6.6.1 LiNO3 Admixture ResultsThe results for testing the effects of LiNO3 as an admixture are summarized in Table 6.7,
with data shown for aggregates F1, F7, C7, C8, and C10 with two different cements. CM3 had an alkalinity of 0.95 percent and CM1 had an alkalinity of 0.52 percent. As the dosage of LiNO3was increased, regardless of the cement used, the percent expansion was decreased with the
98
exception of C7, which had a higher expansion at 25 percent of the recommended dosage of lithium than the control. The selection of the actual cement used in the test can have a major impact on expansions, as discussed later in this section. Independent of the cement issue, it was found that lithium dosages between 50 and 75 percent were adequate for most of the aggregates to suppress expansion below the 0.10 percent expansion limit at 14 days. Only aggregate C10 was found to require a 100 percent lithium dosage, and this was only when the low-alkali cement was used. Data from concrete prism testing are provided later in this chapter, which is the best indicator of actual field performance.
Table 6.7 Results of Admixture LiNO3 Treatments CM3 (0.95%) CM1 (0.52%)
Aggregate 14-Day Standard 14-Day Standard Expansion (%)DeviationExpansion (%) Deviation
F1-Control 0.78 0.038 0.68 0.007 F1-100% Rec. Dosage 0.02 0.002 0.01 0.001 F1-75% Rec. Dosage 0.03 0.002 0.05 0.008 F1-50% Rec. Dosage 0.20 0.005 0.27 0.008 F1-25% Rec. Dosage 0.56 0.024 0.49 0.011
F7-Control 0.48 0.014 0.36 0.013 F7-100% Rec. Dosage 0.01 0.003 0.00 0.002 F7-75% Rec. Dosage 0.02 0.002 0.02 0.003 F7-50% Rec. Dosage 0.11 0.015 0.14 0.016 F7-25% Rec. Dosage 0.38 0.008 0.28 0.005
C7-Control 0.45 0.013 0.35 0.014 C7-100% Rec. Dosage 0.03 0.001 0.02 0.002 C7-75% Rec. Dosage 0.03 0.001 0.06 0.003 C7-50% Rec. Dosage 0.16 0.013 0.24 0.012 C7-25% Rec. Dosage 0.55 0.021 0.34 0.007
C8-Control 0.34 0.013 0.29 0.011 C8-100% Rec. Dosage 0.01 0.004 0.00 0.002 C8-75% Rec. Dosage 0.01 0.002 0.00 0.001 C8-50% Rec. Dosage 0.03 0.005 0.03 0.001 C8-25% Rec. Dosage 0.25 0.006 0.20 0.009
C10-Control 1.15 0.038 1.05 0.009 C10-100% Rec. Dosage 0.03 0.002 0.04 0.005 C10-75% Rec. Dosage 0.08 0.006 0.29 0.015 C10-50% Rec. Dosage 0.66 0.038 0.66 0.023 C10-25% Rec. Dosage 1.00 0.041 0.82 0.015
As stated previously, the test method ASTM C 1260 does not specify a particular cement to be used in the test owing to the assumption that the alkalinity supplied by the soak solution overwhelming controls the contribution of alkalies to the aggregates. However, as Table 6.7 suggests, the cement alkalinity plays a major role in the 14-day expansion owing to the amount of lithium dosage during the mixing stage. The expansions in bold represent potentially or
99
reactive results for that particular aggregate and dosage of LiNO3, and the expansions shaded in gray denote the aggregate passed the test.
As shown in Table 6.7, C10 either passed or failed the test based on the specific cement used at 75 percent of the recommended dosage of LiNO3. The difference in expansion when using the two different cements was tremendous, with an expansion of 0.29 percent for the low-alkali cement and 0.08 for the high-alkali cement. This difference is major and clearly is a side effect of the test method, as opposed to an actual reflection of behavior in field concrete. This highlights the deficiencies of using the modified version of ASTM C 1260 to assess lithium compounds, as the sensitivity to cement alkalinity (and hence internal lithium bar dosage) yields results with high variability’s and little relation to actual field performance. To better understand the effect of the LiNO3 dosage (which is based on cement alkalinity) on expansion, the aggregate C10 was tested with 13 different cements with varying alkalinities. The results from this study are summarized in Figure 6.2.
0
0.05
0.1
0.15
0.2
0.25
0.3
0.35
0.4
0 5 10 15
Time (Days)
Expa
nsio
n (%
)
Capito l Type III (=0.43%)
Alamo Type III (=0.50%)
Rio Grande Type V (=0.52%)
Capito l Type I (=0.52%)
Alamo Type I (=0.59%)
Lo ne Sta r Dallas Type III (=0.62%)
Lo ne S ta r Dallas Type I (=0.72%)
Texas Lehigh Type I (=0.73%)
New Allento wn (0.89%)
LaFarge Type III (=0.92%)
Capito l Type I + Alka lis (=0.95%)
Allento wn Type I (=0.95%)
LaFarge Type I (=1.10%)
No n-Reac tive
Reactive
Figure 6.2 Average Expansion of C10 with Cements of Varying Alkalinitieswith 75% of the Recommended Dosage of LiNO3
As Figure 6.2 suggests, an aggregate can either pass or fail the test depending on the alkalinity of the cement used in the test. This is due to the amount of lithium added to the fresh mortar. As the alkalinity of the cement is increased, the expansion is decreased, regardless of any other properties of the cement (i.e., type, composition).
Figure 6.3 demonstrates dosing CM3 with the dosage of CM1, dosing CM1 with the dosage of CM3, and dosing CM1 with twice the dosage of CM3. Again, Figure 6.3 demonstrates the importance of the amount of lithium added to the mortar during the production of the bars. As noted above, dosing CM3 with the dosage of CM1 and dosing CM1 with the dosage of CM3 result in very similar expansions. The aggregate passed this test quite easily with dosing CM1 with twice the dosage of CM3.
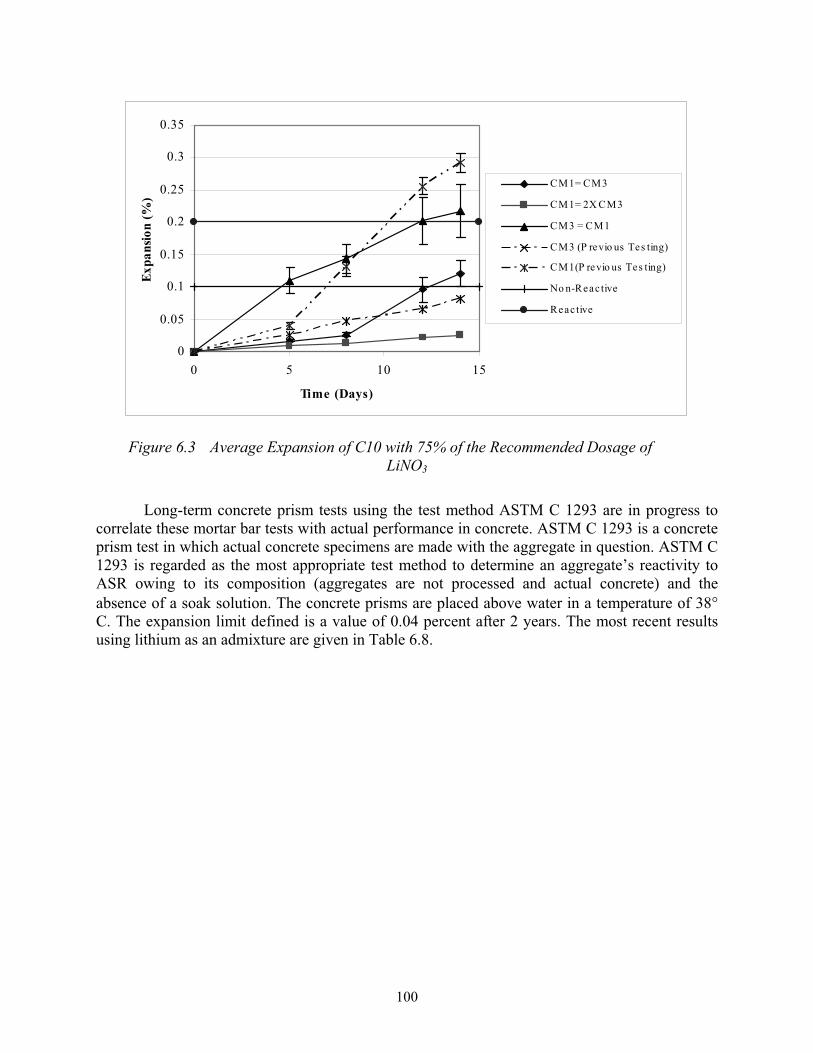
100
0
0.05
0.1
0.15
0.2
0.25
0.3
0.35
0 5 10 15
Time (Days)
Expa
nsio
n (%
)
CM1 = CM3
CM1 = 2X CM3
CM3 = CM1
CM3 (P revio us Tes ting)
CM1 (P revio us Tes ting)
No n-Reac tive
Reac tive
Figure 6.3 Average Expansion of C10 with 75% of the Recommended Dosage of LiNO3
Long-term concrete prism tests using the test method ASTM C 1293 are in progress to correlate these mortar bar tests with actual performance in concrete. ASTM C 1293 is a concrete prism test in which actual concrete specimens are made with the aggregate in question. ASTM C 1293 is regarded as the most appropriate test method to determine an aggregate’s reactivity to ASR owing to its composition (aggregates are not processed and actual concrete) and the absence of a soak solution. The concrete prisms are placed above water in a temperature of 38°C. The expansion limit defined is a value of 0.04 percent after 2 years. The most recent results using lithium as an admixture are given in Table 6.8.
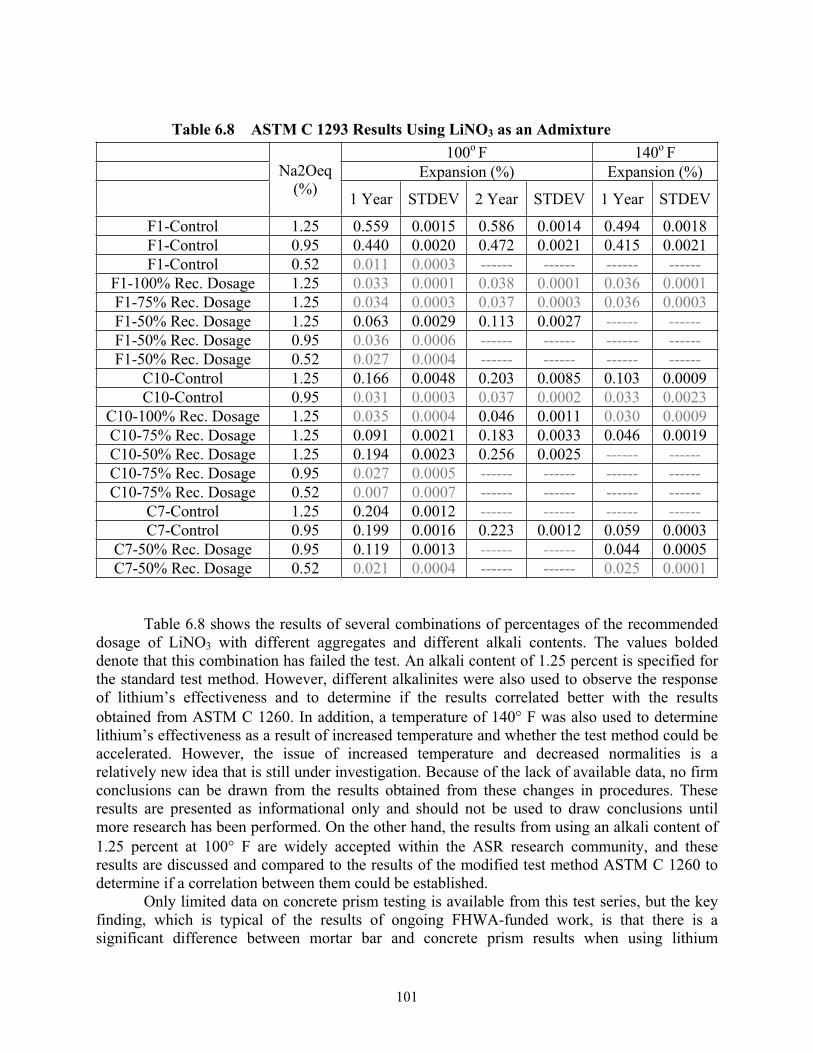
101
Table 6.8 ASTM C 1293 Results Using LiNO3 as an Admixture 100o F 140o F
Expansion (%) Expansion (%) Na2Oeq(%) 1 Year STDEV 2 Year STDEV 1 Year STDEV
F1-Control 1.25 0.559 0.0015 0.586 0.0014 0.494 0.0018 F1-Control 0.95 0.440 0.0020 0.472 0.0021 0.415 0.0021 F1-Control 0.52 0.011 0.0003 ------ ------ ------ ------
F1-100% Rec. Dosage 1.25 0.033 0.0001 0.038 0.0001 0.036 0.0001 F1-75% Rec. Dosage 1.25 0.034 0.0003 0.037 0.0003 0.036 0.0003 F1-50% Rec. Dosage 1.25 0.063 0.0029 0.113 0.0027 ------ ------ F1-50% Rec. Dosage 0.95 0.036 0.0006 ------ ------ ------ ------ F1-50% Rec. Dosage 0.52 0.027 0.0004 ------ ------ ------ ------
C10-Control 1.25 0.166 0.0048 0.203 0.0085 0.103 0.0009 C10-Control 0.95 0.031 0.0003 0.037 0.0002 0.033 0.0023
C10-100% Rec. Dosage 1.25 0.035 0.0004 0.046 0.0011 0.030 0.0009 C10-75% Rec. Dosage 1.25 0.091 0.0021 0.183 0.0033 0.046 0.0019 C10-50% Rec. Dosage 1.25 0.194 0.0023 0.256 0.0025 ------ ------ C10-75% Rec. Dosage 0.95 0.027 0.0005 ------ ------ ------ ------ C10-75% Rec. Dosage 0.52 0.007 0.0007 ------ ------ ------ ------
C7-Control 1.25 0.204 0.0012 ------ ------ ------ ------ C7-Control 0.95 0.199 0.0016 0.223 0.0012 0.059 0.0003
C7-50% Rec. Dosage 0.95 0.119 0.0013 ------ ------ 0.044 0.0005 C7-50% Rec. Dosage 0.52 0.021 0.0004 ------ ------ 0.025 0.0001
Table 6.8 shows the results of several combinations of percentages of the recommended dosage of LiNO3 with different aggregates and different alkali contents. The values bolded denote that this combination has failed the test. An alkali content of 1.25 percent is specified for the standard test method. However, different alkalinites were also used to observe the response of lithium’s effectiveness and to determine if the results correlated better with the results obtained from ASTM C 1260. In addition, a temperature of 140° F was also used to determine lithium’s effectiveness as a result of increased temperature and whether the test method could be accelerated. However, the issue of increased temperature and decreased normalities is a relatively new idea that is still under investigation. Because of the lack of available data, no firm conclusions can be drawn from the results obtained from these changes in procedures. These results are presented as informational only and should not be used to draw conclusions until more research has been performed. On the other hand, the results from using an alkali content of 1.25 percent at 100° F are widely accepted within the ASR research community, and these results are discussed and compared to the results of the modified test method ASTM C 1260 to determine if a correlation between them could be established.
Only limited data on concrete prism testing is available from this test series, but the key finding, which is typical of the results of ongoing FHWA-funded work, is that there is a significant difference between mortar bar and concrete prism results when using lithium
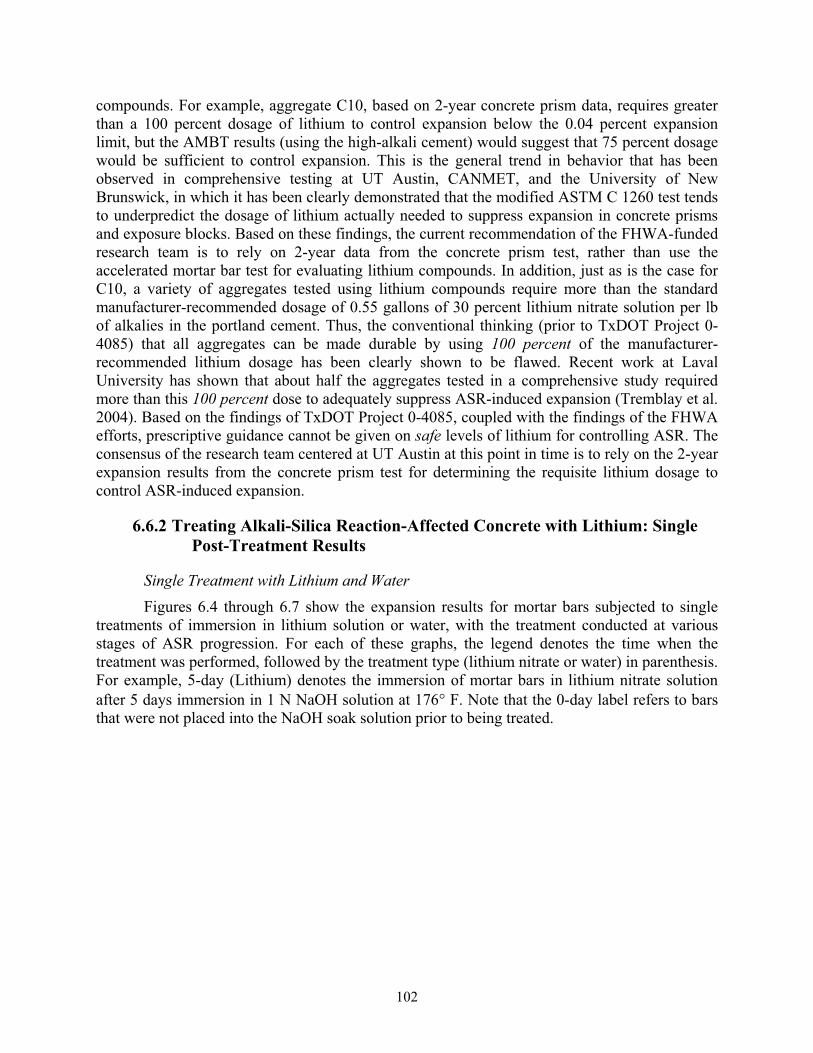
102
compounds. For example, aggregate C10, based on 2-year concrete prism data, requires greater than a 100 percent dosage of lithium to control expansion below the 0.04 percent expansion limit, but the AMBT results (using the high-alkali cement) would suggest that 75 percent dosage would be sufficient to control expansion. This is the general trend in behavior that has been observed in comprehensive testing at UT Austin, CANMET, and the University of New Brunswick, in which it has been clearly demonstrated that the modified ASTM C 1260 test tends to underpredict the dosage of lithium actually needed to suppress expansion in concrete prisms and exposure blocks. Based on these findings, the current recommendation of the FHWA-funded research team is to rely on 2-year data from the concrete prism test, rather than use the accelerated mortar bar test for evaluating lithium compounds. In addition, just as is the case for C10, a variety of aggregates tested using lithium compounds require more than the standard manufacturer-recommended dosage of 0.55 gallons of 30 percent lithium nitrate solution per lb of alkalies in the portland cement. Thus, the conventional thinking (prior to TxDOT Project 0-4085) that all aggregates can be made durable by using 100 percent of the manufacturer-recommended lithium dosage has been clearly shown to be flawed. Recent work at Laval University has shown that about half the aggregates tested in a comprehensive study required more than this 100 percent dose to adequately suppress ASR-induced expansion (Tremblay et al. 2004). Based on the findings of TxDOT Project 0-4085, coupled with the findings of the FHWA efforts, prescriptive guidance cannot be given on safe levels of lithium for controlling ASR. The consensus of the research team centered at UT Austin at this point in time is to rely on the 2-year expansion results from the concrete prism test for determining the requisite lithium dosage to control ASR-induced expansion.
6.6.2 Treating Alkali-Silica Reaction-Affected Concrete with Lithium: Single Post-Treatment Results
Single Treatment with Lithium and Water Figures 6.4 through 6.7 show the expansion results for mortar bars subjected to single
treatments of immersion in lithium solution or water, with the treatment conducted at various stages of ASR progression. For each of these graphs, the legend denotes the time when the treatment was performed, followed by the treatment type (lithium nitrate or water) in parenthesis. For example, 5-day (Lithium) denotes the immersion of mortar bars in lithium nitrate solution after 5 days immersion in 1 N NaOH solution at 176° F. Note that the 0-day label refers to bars that were not placed into the NaOH soak solution prior to being treated.
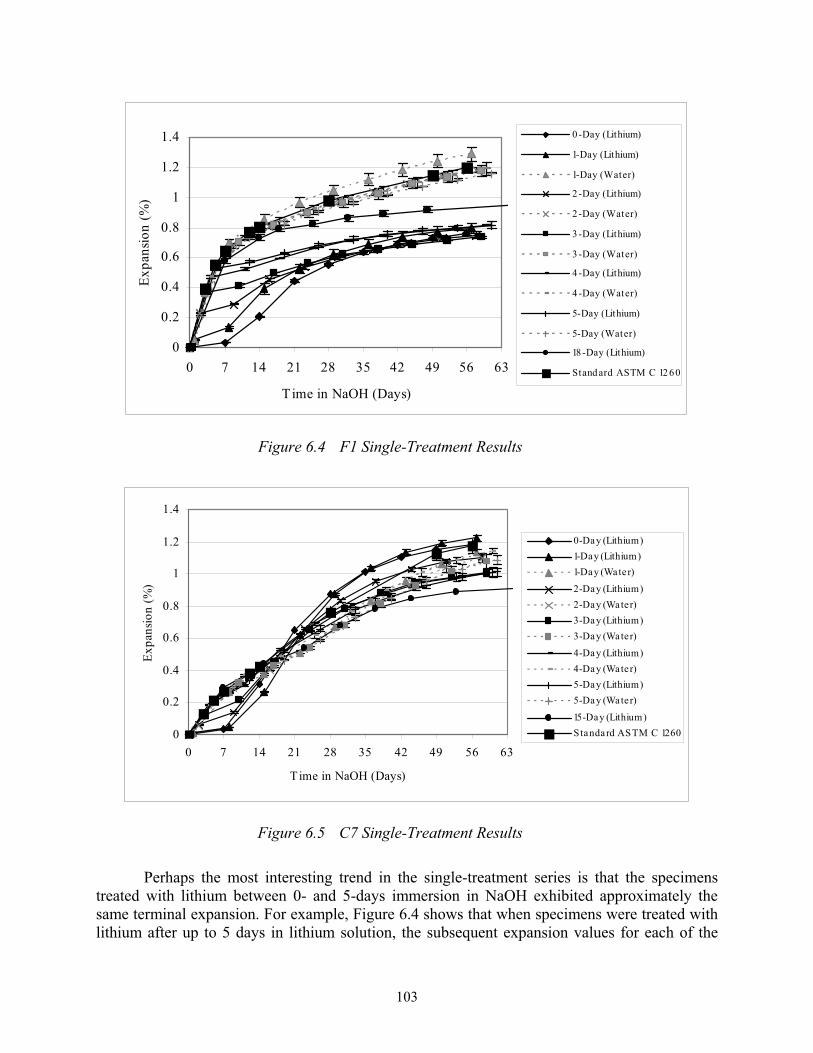
103
0
0.2
0.4
0.6
0.8
1
1.2
1.4
0 7 14 21 28 35 42 49 56 63
Time in NaOH (Days)
Expa
nsio
n (%
)0 -Day (Lithium)
1-Day (Lithium)
1-Day (Water)
2 -Day (Lithium)
2 -Day (Water)
3 -Day (Lithium)
3 -Day (Water)
4 -Day (Lithium)
4 -Day (Water)
5-Day (Lithium)
5-Day (Water)
18 -Day (Lithium)
Stand ard ASTM C 12 60
Figure 6.4 F1 Single-Treatment Results
0
0.2
0.4
0.6
0.8
1
1.2
1.4
0 7 14 21 28 35 42 49 56 63
Time in NaOH (Days)
Expa
nsio
n (%
)
0-Day (Lithium)1-Day (Lithium)1-Day (Water)
2-Day (Lithium)2-Day (Water)3-Day (Lithium)3-Day (Water)
4-Day (Lithium)4-Day (Water)5-Day (Lithium)5-Day (Water)
15-Day (Lithium)Standard ASTM C 1260
Figure 6.5 C7 Single-Treatment Results
Perhaps the most interesting trend in the single-treatment series is that the specimens treated with lithium between 0- and 5-days immersion in NaOH exhibited approximately the same terminal expansion. For example, Figure 6.4 shows that when specimens were treated with lithium after up to 5 days in lithium solution, the subsequent expansion values for each of the
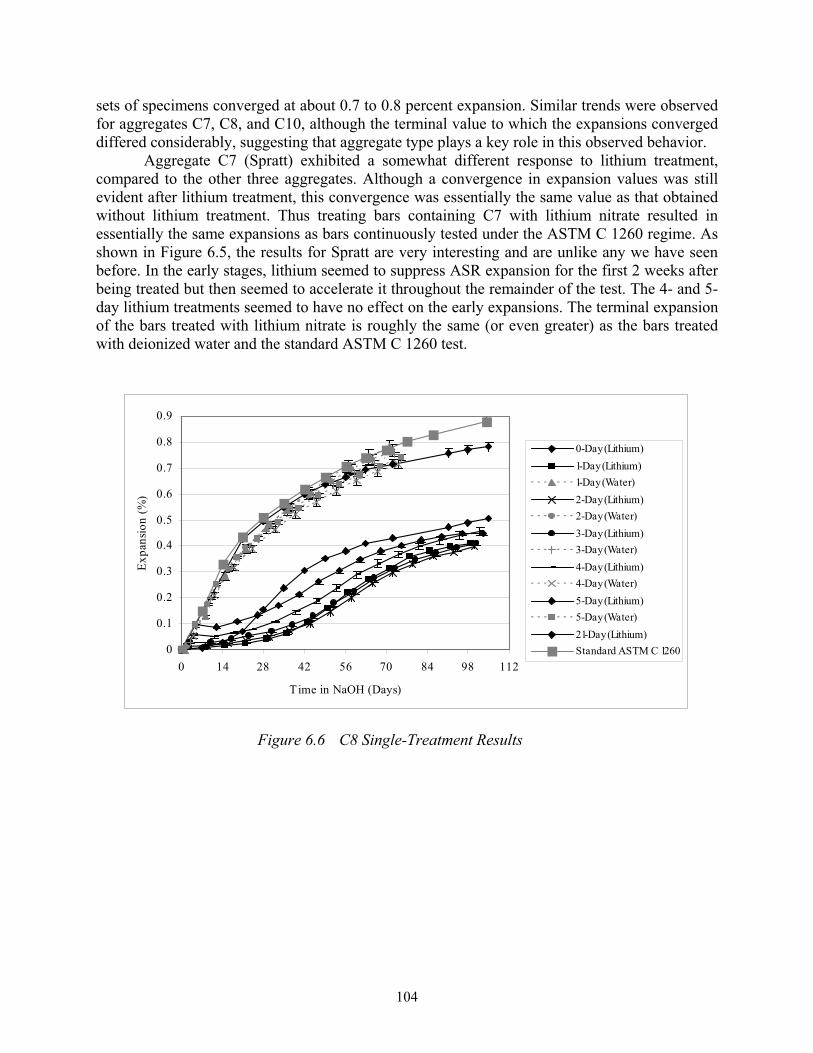
104
sets of specimens converged at about 0.7 to 0.8 percent expansion. Similar trends were observed for aggregates C7, C8, and C10, although the terminal value to which the expansions converged differed considerably, suggesting that aggregate type plays a key role in this observed behavior.
Aggregate C7 (Spratt) exhibited a somewhat different response to lithium treatment, compared to the other three aggregates. Although a convergence in expansion values was still evident after lithium treatment, this convergence was essentially the same value as that obtained without lithium treatment. Thus treating bars containing C7 with lithium nitrate resulted in essentially the same expansions as bars continuously tested under the ASTM C 1260 regime. As shown in Figure 6.5, the results for Spratt are very interesting and are unlike any we have seen before. In the early stages, lithium seemed to suppress ASR expansion for the first 2 weeks after being treated but then seemed to accelerate it throughout the remainder of the test. The 4- and 5-day lithium treatments seemed to have no effect on the early expansions. The terminal expansion of the bars treated with lithium nitrate is roughly the same (or even greater) as the bars treated with deionized water and the standard ASTM C 1260 test.
0
0.1
0.2
0.3
0.4
0.5
0.6
0.7
0.8
0.9
0 14 28 42 56 70 84 98 112
Time in NaOH (Days)
Expa
nsio
n (%
)
0-Day (Lithium)1-Day (Lithium)1-Day (Water)2-Day (Lithium)2-Day (Water)3-Day (Lithium)3-Day (Water)4-Day (Lithium)4-Day (Water)5-Day (Lithium)5-Day (Water)21-Day (Lithium)Standard ASTM C 1260
Figure 6.6 C8 Single-Treatment Results
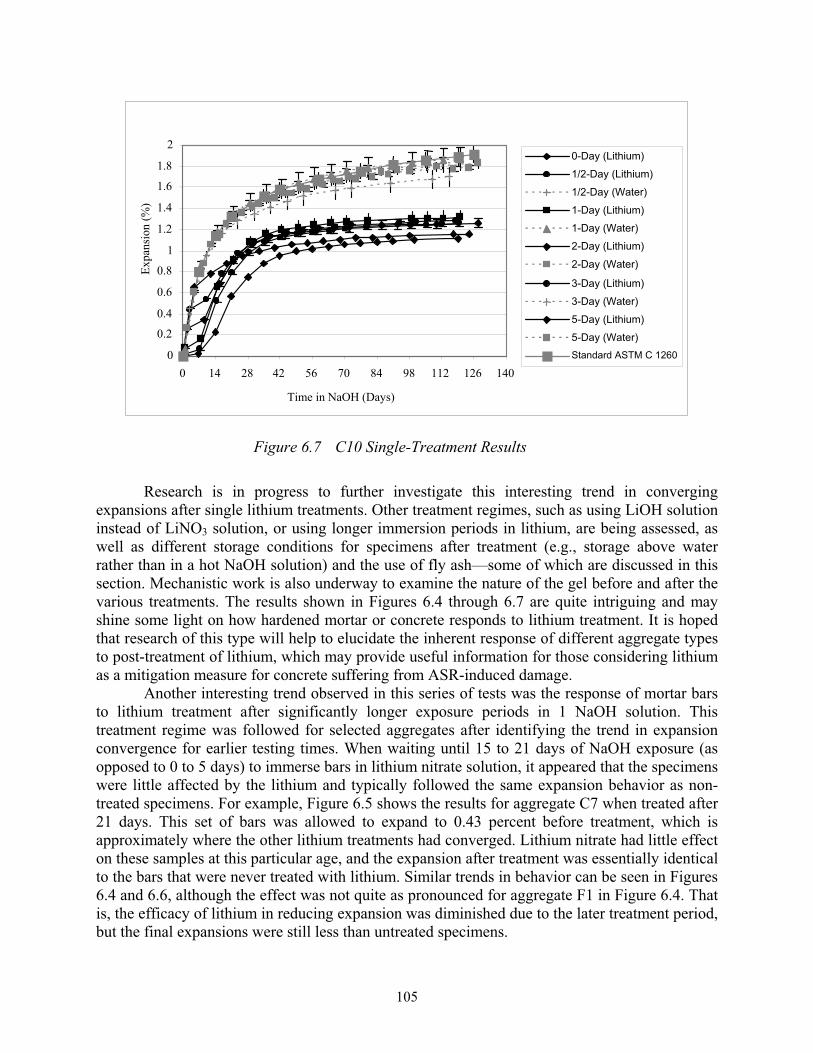
105
Figure 6.7 C10 Single-Treatment Results
Research is in progress to further investigate this interesting trend in converging expansions after single lithium treatments. Other treatment regimes, such as using LiOH solution instead of LiNO3 solution, or using longer immersion periods in lithium, are being assessed, as well as different storage conditions for specimens after treatment (e.g., storage above water rather than in a hot NaOH solution) and the use of fly ash—some of which are discussed in this section. Mechanistic work is also underway to examine the nature of the gel before and after the various treatments. The results shown in Figures 6.4 through 6.7 are quite intriguing and may shine some light on how hardened mortar or concrete responds to lithium treatment. It is hoped that research of this type will help to elucidate the inherent response of different aggregate types to post-treatment of lithium, which may provide useful information for those considering lithium as a mitigation measure for concrete suffering from ASR-induced damage.
Another interesting trend observed in this series of tests was the response of mortar bars to lithium treatment after significantly longer exposure periods in 1 NaOH solution. This treatment regime was followed for selected aggregates after identifying the trend in expansion convergence for earlier testing times. When waiting until 15 to 21 days of NaOH exposure (as opposed to 0 to 5 days) to immerse bars in lithium nitrate solution, it appeared that the specimens were little affected by the lithium and typically followed the same expansion behavior as non-treated specimens. For example, Figure 6.5 shows the results for aggregate C7 when treated after 21 days. This set of bars was allowed to expand to 0.43 percent before treatment, which is approximately where the other lithium treatments had converged. Lithium nitrate had little effect on these samples at this particular age, and the expansion after treatment was essentially identical to the bars that were never treated with lithium. Similar trends in behavior can be seen in Figures 6.4 and 6.6, although the effect was not quite as pronounced for aggregate F1 in Figure 6.4. That is, the efficacy of lithium in reducing expansion was diminished due to the later treatment period, but the final expansions were still less than untreated specimens.
0
0.2
0.4
0.6
0.8
1
1.2
1.4
1.6
1.8
2
0 14 28 42 56 70 84 98 112 126 140
Time in NaOH (Days)
Expa
nsio
n (%
)0-Day (Lithium)
1/2-Day (Lithium)
1/2-Day (Water)
1-Day (Lithium)
1-Day (Water)
2-Day (Lithium)
2-Day (Water)
3-Day (Lithium)
3-Day (Water)
5-Day (Lithium)
5-Day (Water)Standard ASTM C 1260
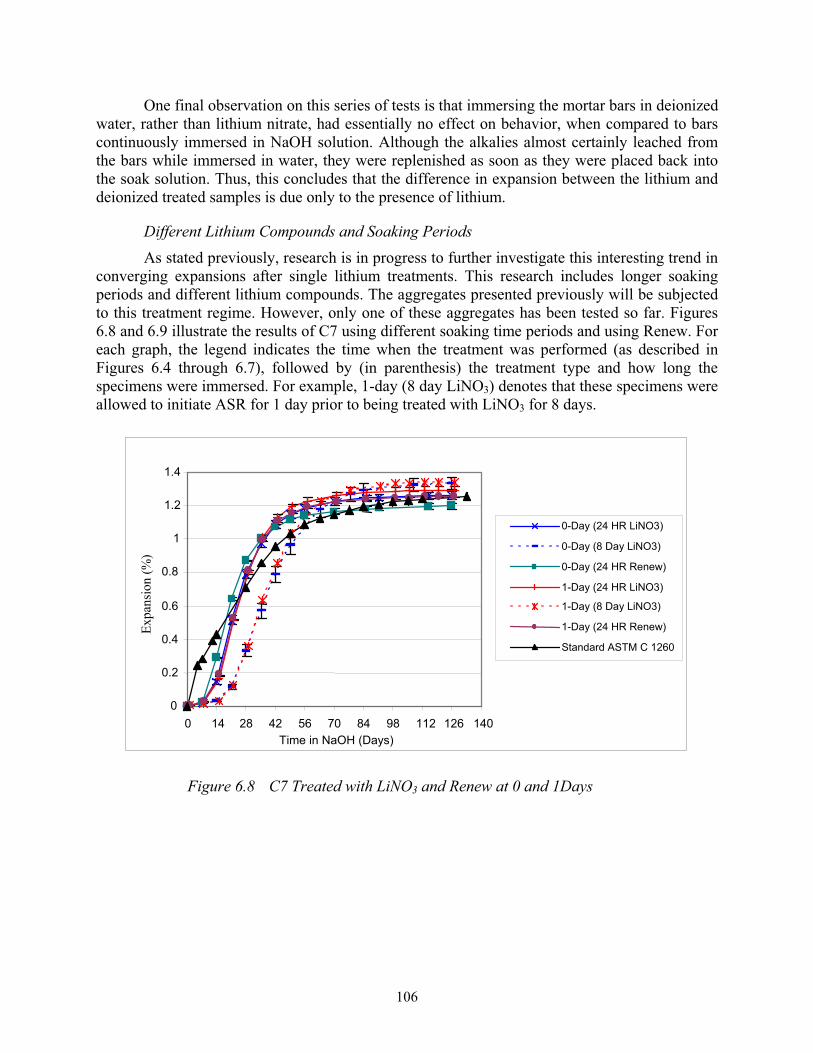
106
One final observation on this series of tests is that immersing the mortar bars in deionized water, rather than lithium nitrate, had essentially no effect on behavior, when compared to bars continuously immersed in NaOH solution. Although the alkalies almost certainly leached from the bars while immersed in water, they were replenished as soon as they were placed back into the soak solution. Thus, this concludes that the difference in expansion between the lithium and deionized treated samples is due only to the presence of lithium.
Different Lithium Compounds and Soaking Periods As stated previously, research is in progress to further investigate this interesting trend in
converging expansions after single lithium treatments. This research includes longer soaking periods and different lithium compounds. The aggregates presented previously will be subjected to this treatment regime. However, only one of these aggregates has been tested so far. Figures 6.8 and 6.9 illustrate the results of C7 using different soaking time periods and using Renew. For each graph, the legend indicates the time when the treatment was performed (as described in Figures 6.4 through 6.7), followed by (in parenthesis) the treatment type and how long the specimens were immersed. For example, 1-day (8 day LiNO3) denotes that these specimens were allowed to initiate ASR for 1 day prior to being treated with LiNO3 for 8 days.
Figure 6.8 C7 Treated with LiNO3 and Renew at 0 and 1Days
0
0.2
0.4
0.6
0.8
1
1.2
1.4
0 14 28 42 56 70 84 98 112 126 140Time in NaOH (Days)
0-Day (24 HR LiNO3)
0-Day (8 Day LiNO3)
0-Day (24 HR Renew)
1-Day (24 HR LiNO3)
1-Day (8 Day LiNO3)
1-Day (24 HR Renew)
Standard ASTM C 1260
Expa
nsio
n (%
)
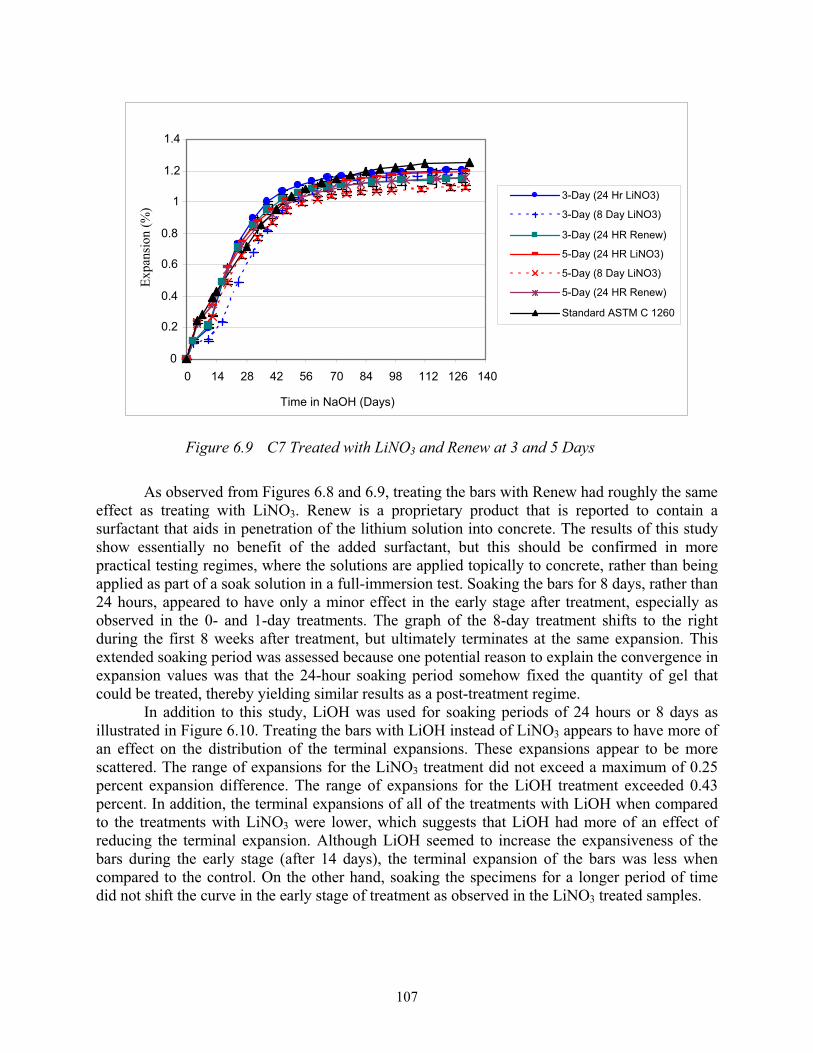
107
Figure 6.9 C7 Treated with LiNO3 and Renew at 3 and 5 Days
As observed from Figures 6.8 and 6.9, treating the bars with Renew had roughly the same effect as treating with LiNO3. Renew is a proprietary product that is reported to contain a surfactant that aids in penetration of the lithium solution into concrete. The results of this study show essentially no benefit of the added surfactant, but this should be confirmed in more practical testing regimes, where the solutions are applied topically to concrete, rather than being applied as part of a soak solution in a full-immersion test. Soaking the bars for 8 days, rather than 24 hours, appeared to have only a minor effect in the early stage after treatment, especially as observed in the 0- and 1-day treatments. The graph of the 8-day treatment shifts to the right during the first 8 weeks after treatment, but ultimately terminates at the same expansion. This extended soaking period was assessed because one potential reason to explain the convergence in expansion values was that the 24-hour soaking period somehow fixed the quantity of gel that could be treated, thereby yielding similar results as a post-treatment regime.
In addition to this study, LiOH was used for soaking periods of 24 hours or 8 days as illustrated in Figure 6.10. Treating the bars with LiOH instead of LiNO3 appears to have more of an effect on the distribution of the terminal expansions. These expansions appear to be more scattered. The range of expansions for the LiNO3 treatment did not exceed a maximum of 0.25 percent expansion difference. The range of expansions for the LiOH treatment exceeded 0.43 percent. In addition, the terminal expansions of all of the treatments with LiOH when compared to the treatments with LiNO3 were lower, which suggests that LiOH had more of an effect of reducing the terminal expansion. Although LiOH seemed to increase the expansiveness of the bars during the early stage (after 14 days), the terminal expansion of the bars was less when compared to the control. On the other hand, soaking the specimens for a longer period of time did not shift the curve in the early stage of treatment as observed in the LiNO3 treated samples.
0
0.2
0.4
0.6
0.8
1
1.2
1.4
0 14 28 42 56 70 84 98 112 126 140
Time in NaOH (Days)
3-Day (24 Hr LiNO3)
3-Day (8 Day LiNO3)
3-Day (24 HR Renew)
5-Day (24 HR LiNO3)
5-Day (8 Day LiNO3)
5-Day (24 HR Renew)
Standard ASTM C 1260
Expa
nsio
n (%
)
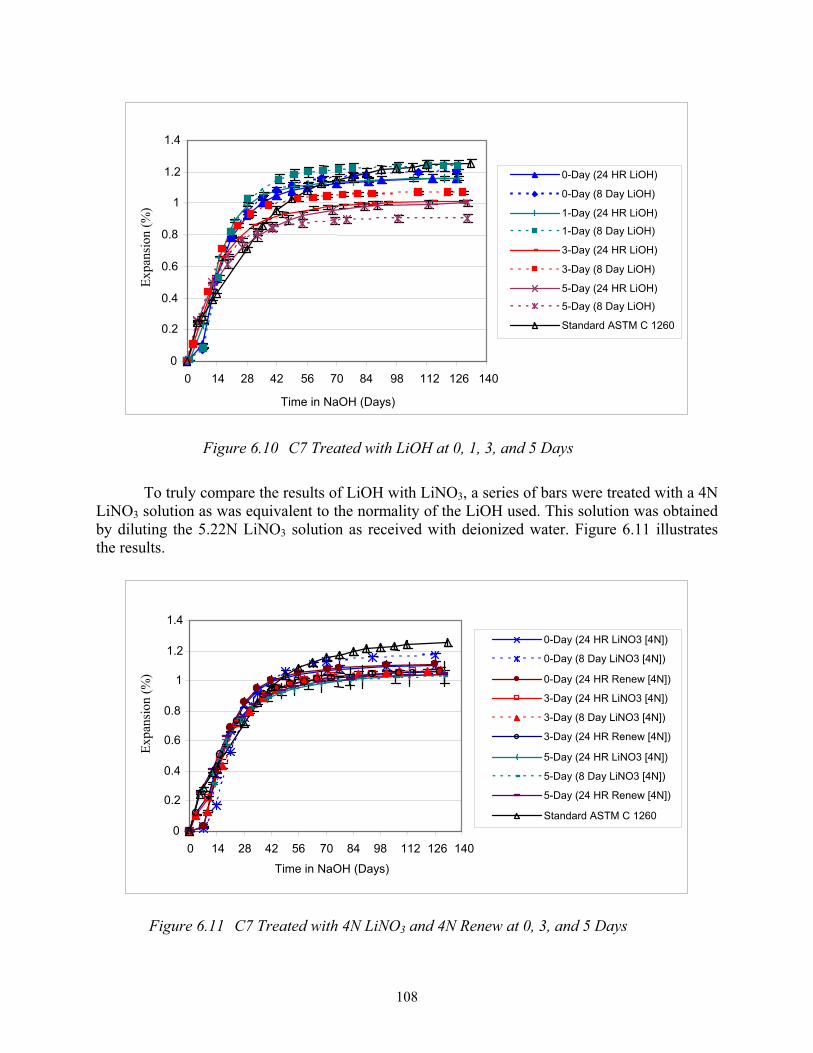
108
Figure 6.10 C7 Treated with LiOH at 0, 1, 3, and 5 Days
To truly compare the results of LiOH with LiNO3, a series of bars were treated with a 4N LiNO3 solution as was equivalent to the normality of the LiOH used. This solution was obtained by diluting the 5.22N LiNO3 solution as received with deionized water. Figure 6.11 illustrates the results.
Figure 6.11 C7 Treated with 4N LiNO3 and 4N Renew at 0, 3, and 5 Days
0
0.2
0.4
0.6
0.8
1
1.2
1.4
0 14 28 42 56 70 84 98 112 126 140
Time in NaOH (Days)
0-Day (24 HR LiOH)
0-Day (8 Day LiOH)
1-Day (24 HR LiOH)
1-Day (8 Day LiOH)
3-Day (24 HR LiOH)
3-Day (8 Day LiOH)
5-Day (24 HR LiOH)
5-Day (8 Day LiOH)
Standard ASTM C 1260
Expa
nsio
n (%
)
0
0.2
0.4
0.6
0.8
1
1.2
1.4
0 14 28 42 56 70 84 98 112 126 140
Time in NaOH (Days)
0-Day (24 HR LiNO3 [4N])
0-Day (8 Day LiNO3 [4N])
0-Day (24 HR Renew [4N])
3-Day (24 HR LiNO3 [4N])
3-Day (8 Day LiNO3 [4N])
3-Day (24 HR Renew [4N])
5-Day (24 HR LiNO3 [4N])
5-Day (8 Day LiNO3 [4N])
5-Day (24 HR Renew [4N])
Standard ASTM C 1260
Expa
nsio
n (%
)
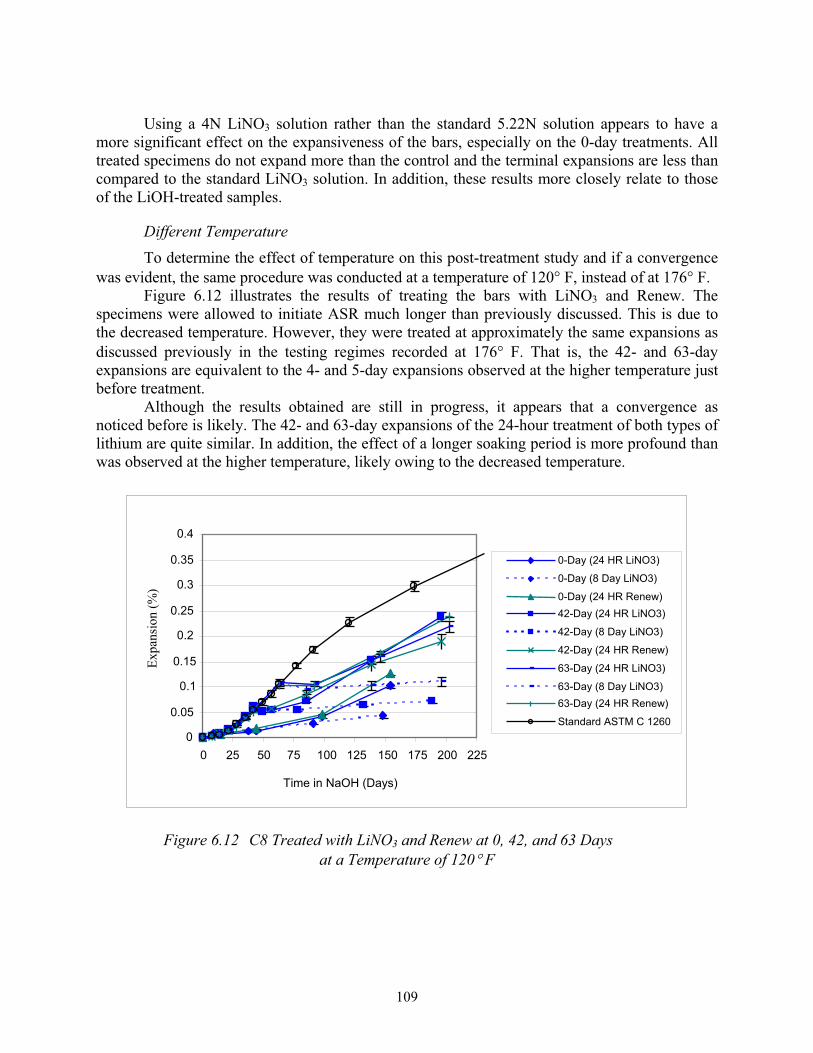
109
Using a 4N LiNO3 solution rather than the standard 5.22N solution appears to have a more significant effect on the expansiveness of the bars, especially on the 0-day treatments. All treated specimens do not expand more than the control and the terminal expansions are less than compared to the standard LiNO3 solution. In addition, these results more closely relate to those of the LiOH-treated samples.
Different Temperature To determine the effect of temperature on this post-treatment study and if a convergence
was evident, the same procedure was conducted at a temperature of 120° F, instead of at 176° F.Figure 6.12 illustrates the results of treating the bars with LiNO3 and Renew. The
specimens were allowed to initiate ASR much longer than previously discussed. This is due to the decreased temperature. However, they were treated at approximately the same expansions as discussed previously in the testing regimes recorded at 176° F. That is, the 42- and 63-day expansions are equivalent to the 4- and 5-day expansions observed at the higher temperature just before treatment.
Although the results obtained are still in progress, it appears that a convergence as noticed before is likely. The 42- and 63-day expansions of the 24-hour treatment of both types of lithium are quite similar. In addition, the effect of a longer soaking period is more profound than was observed at the higher temperature, likely owing to the decreased temperature.
Figure 6.12 C8 Treated with LiNO3 and Renew at 0, 42, and 63 Daysat a Temperature of 120° F
0
0.05
0.1
0.15
0.2
0.25
0.3
0.35
0.4
0 25 50 75 100 125 150 175 200 225
Time in NaOH (Days)
0-Day (24 HR LiNO3)
0-Day (8 Day LiNO3)
0-Day (24 HR Renew)42-Day (24 HR LiNO3)
42-Day (8 Day LiNO3)
42-Day (24 HR Renew)
63-Day (24 HR LiNO3)
63-Day (8 Day LiNO3)63-Day (24 HR Renew)
Standard ASTM C 1260
Expa
nsio
n (%
)
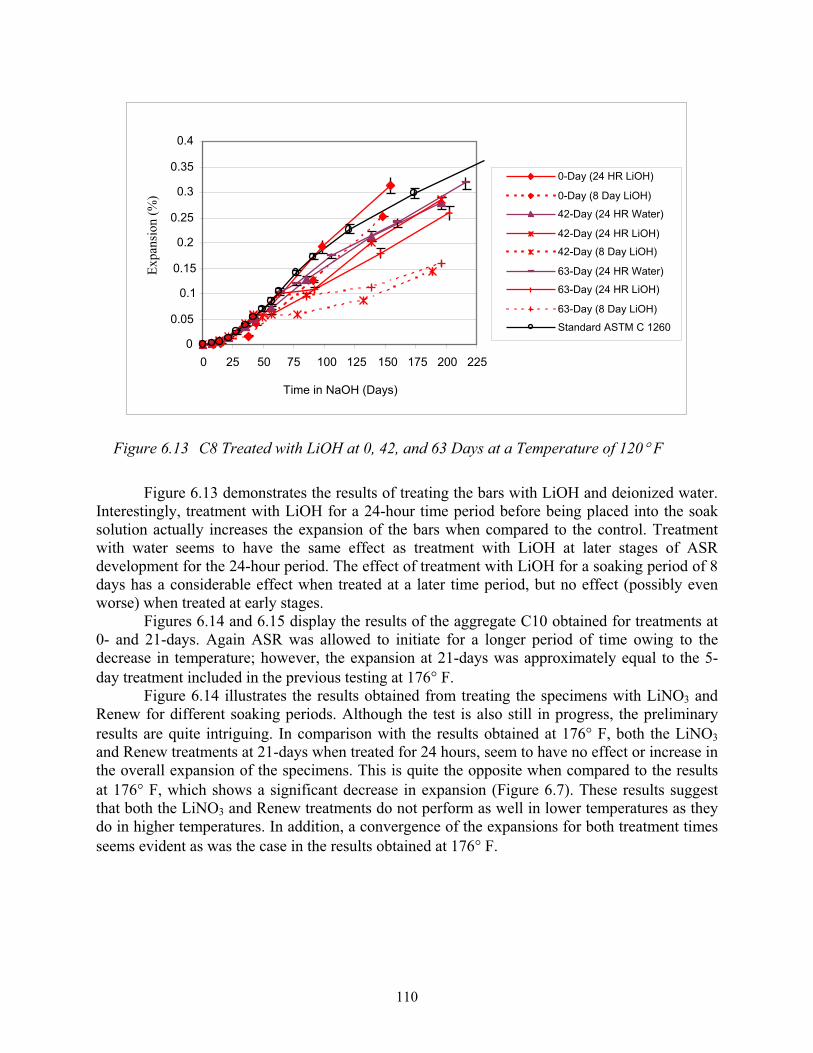
110
Figure 6.13 C8 Treated with LiOH at 0, 42, and 63 Days at a Temperature of 120° F
Figure 6.13 demonstrates the results of treating the bars with LiOH and deionized water. Interestingly, treatment with LiOH for a 24-hour time period before being placed into the soak solution actually increases the expansion of the bars when compared to the control. Treatment with water seems to have the same effect as treatment with LiOH at later stages of ASR development for the 24-hour period. The effect of treatment with LiOH for a soaking period of 8 days has a considerable effect when treated at a later time period, but no effect (possibly even worse) when treated at early stages.
Figures 6.14 and 6.15 display the results of the aggregate C10 obtained for treatments at 0- and 21-days. Again ASR was allowed to initiate for a longer period of time owing to the decrease in temperature; however, the expansion at 21-days was approximately equal to the 5-day treatment included in the previous testing at 176° F.
Figure 6.14 illustrates the results obtained from treating the specimens with LiNO3 and Renew for different soaking periods. Although the test is also still in progress, the preliminary results are quite intriguing. In comparison with the results obtained at 176° F, both the LiNO3and Renew treatments at 21-days when treated for 24 hours, seem to have no effect or increase in the overall expansion of the specimens. This is quite the opposite when compared to the results at 176° F, which shows a significant decrease in expansion (Figure 6.7). These results suggest that both the LiNO3 and Renew treatments do not perform as well in lower temperatures as they do in higher temperatures. In addition, a convergence of the expansions for both treatment times seems evident as was the case in the results obtained at 176° F.
0
0.05
0.1
0.15
0.2
0.25
0.3
0.35
0.4
0 25 50 75 100 125 150 175 200 225
Time in NaOH (Days)
0-Day (24 HR LiOH)
0-Day (8 Day LiOH)
42-Day (24 HR Water)
42-Day (24 HR LiOH)
42-Day (8 Day LiOH)
63-Day (24 HR Water)
63-Day (24 HR LiOH)
63-Day (8 Day LiOH)
Standard ASTM C 1260
Expa
nsio
n (%
)
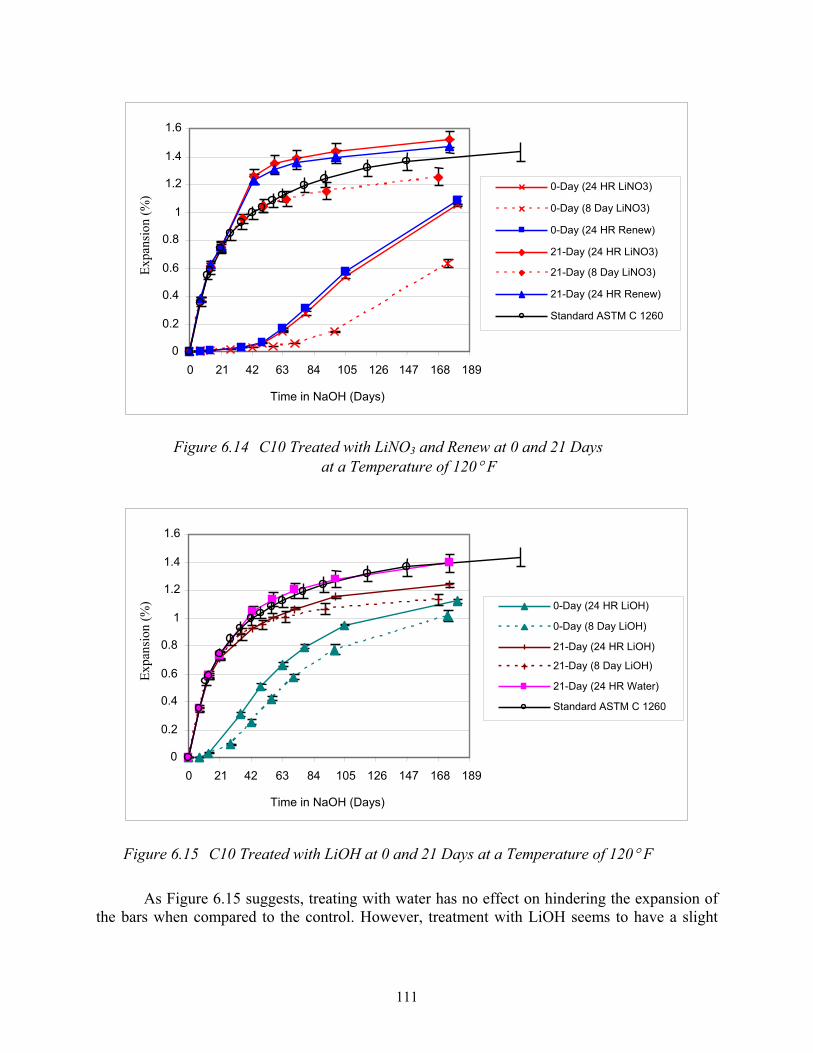
111
Figure 6.14 C10 Treated with LiNO3 and Renew at 0 and 21 Days at a Temperature of 120° F
Figure 6.15 C10 Treated with LiOH at 0 and 21 Days at a Temperature of 120° F
As Figure 6.15 suggests, treating with water has no effect on hindering the expansion of the bars when compared to the control. However, treatment with LiOH seems to have a slight
0
0.2
0.4
0.6
0.8
1
1.2
1.4
1.6
0 21 42 63 84 105 126 147 168 189
Time in NaOH (Days)
0-Day (24 HR LiNO3)
0-Day (8 Day LiNO3)
0-Day (24 HR Renew)
21-Day (24 HR LiNO3)
21-Day (8 Day LiNO3)
21-Day (24 HR Renew)
Standard ASTM C 1260
Expa
nsio
n (%
)
0
0.2
0.4
0.6
0.8
1
1.2
1.4
1.6
0 21 42 63 84 105 126 147 168 189
Time in NaOH (Days)
0-Day (24 HR LiOH)
0-Day (8 Day LiOH)
21-Day (24 HR LiOH)
21-Day (8 Day LiOH)
21-Day (24 HR Water)
Standard ASTM C 1260
Expa
nsio
n (%
)
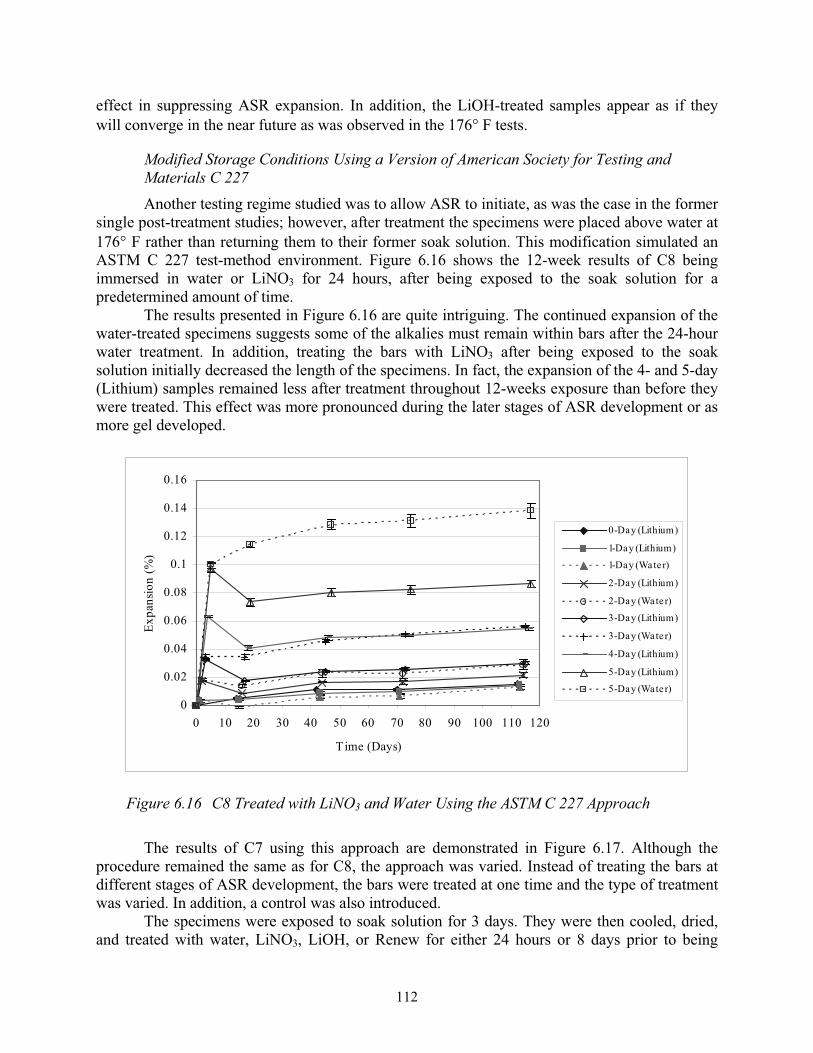
112
effect in suppressing ASR expansion. In addition, the LiOH-treated samples appear as if they will converge in the near future as was observed in the 176° F tests.
Modified Storage Conditions Using a Version of American Society for Testing and Materials C 227 Another testing regime studied was to allow ASR to initiate, as was the case in the former
single post-treatment studies; however, after treatment the specimens were placed above water at 176° F rather than returning them to their former soak solution. This modification simulated an ASTM C 227 test-method environment. Figure 6.16 shows the 12-week results of C8 being immersed in water or LiNO3 for 24 hours, after being exposed to the soak solution for a predetermined amount of time.
The results presented in Figure 6.16 are quite intriguing. The continued expansion of the water-treated specimens suggests some of the alkalies must remain within bars after the 24-hour water treatment. In addition, treating the bars with LiNO3 after being exposed to the soak solution initially decreased the length of the specimens. In fact, the expansion of the 4- and 5-day (Lithium) samples remained less after treatment throughout 12-weeks exposure than before they were treated. This effect was more pronounced during the later stages of ASR development or as more gel developed.
0
0.02
0.04
0.06
0.08
0.1
0.12
0.14
0.16
0 10 20 30 40 50 60 70 80 90 100 110 120
Time (Days)
Expa
nsio
n (%
)
0-Day (Lithium)
1-Day (Lithium)
1-Day (Wate r)
2-Day (Lithium)
2-Day (Wate r)
3-Day (Lithium)
3-Day (Wate r)
4-Day (Lithium)
5-Day (Lithium)
5-Day (Wate r)
Figure 6.16 C8 Treated with LiNO3 and Water Using the ASTM C 227 Approach
The results of C7 using this approach are demonstrated in Figure 6.17. Although the procedure remained the same as for C8, the approach was varied. Instead of treating the bars at different stages of ASR development, the bars were treated at one time and the type of treatment was varied. In addition, a control was also introduced.
The specimens were exposed to soak solution for 3 days. They were then cooled, dried, and treated with water, LiNO3, LiOH, or Renew for either 24 hours or 8 days prior to being
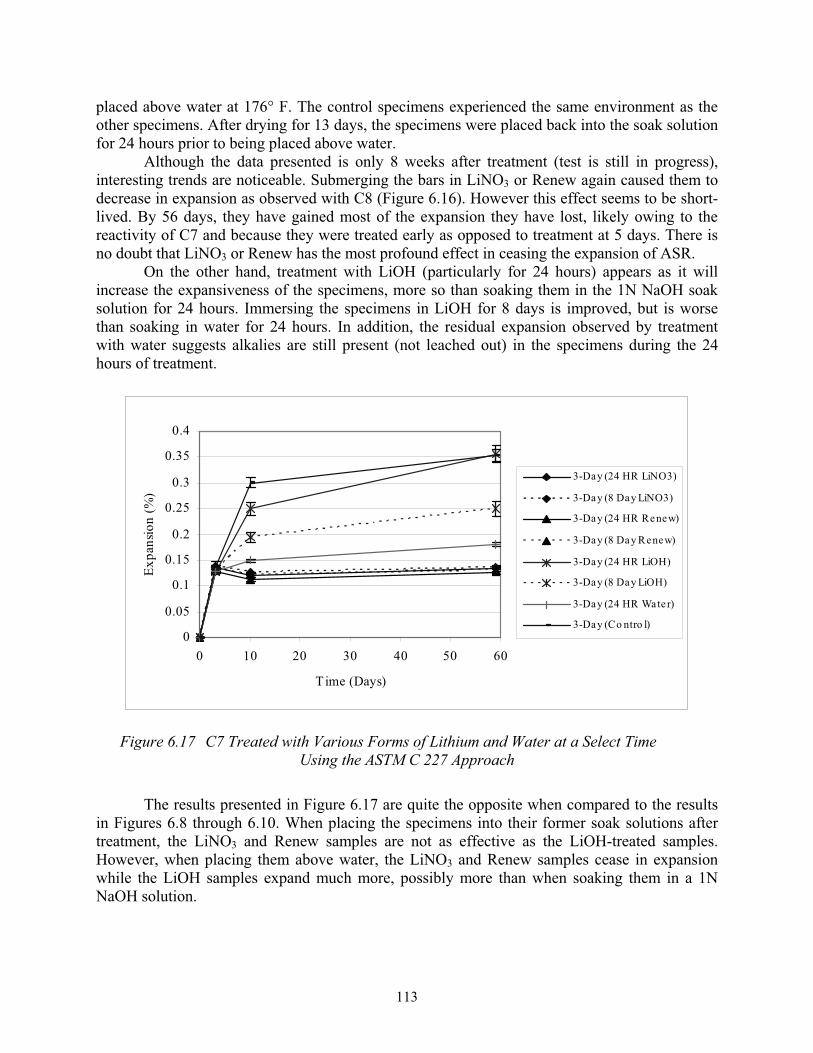
113
placed above water at 176° F. The control specimens experienced the same environment as the other specimens. After drying for 13 days, the specimens were placed back into the soak solution for 24 hours prior to being placed above water.
Although the data presented is only 8 weeks after treatment (test is still in progress), interesting trends are noticeable. Submerging the bars in LiNO3 or Renew again caused them to decrease in expansion as observed with C8 (Figure 6.16). However this effect seems to be short-lived. By 56 days, they have gained most of the expansion they have lost, likely owing to the reactivity of C7 and because they were treated early as opposed to treatment at 5 days. There is no doubt that LiNO3 or Renew has the most profound effect in ceasing the expansion of ASR.
On the other hand, treatment with LiOH (particularly for 24 hours) appears as it will increase the expansiveness of the specimens, more so than soaking them in the 1N NaOH soak solution for 24 hours. Immersing the specimens in LiOH for 8 days is improved, but is worse than soaking in water for 24 hours. In addition, the residual expansion observed by treatment with water suggests alkalies are still present (not leached out) in the specimens during the 24 hours of treatment.
0
0.05
0.1
0.15
0.2
0.25
0.3
0.35
0.4
0 10 20 30 40 50 60
Time (Days)
Expa
nsio
n (%
)
3-Day (24 HR LiNO3)
3-Day (8 Day LiNO3)
3-Day (24 HR Renew)
3-Day (8 Day Renew)
3-Day (24 HR LiOH)
3-Day (8 Day LiOH)
3-Day (24 HR Wate r)
3-Day (Co ntro l)
Figure 6.17 C7 Treated with Various Forms of Lithium and Water at a Select Time Using the ASTM C 227 Approach
The results presented in Figure 6.17 are quite the opposite when compared to the results in Figures 6.8 through 6.10. When placing the specimens into their former soak solutions after treatment, the LiNO3 and Renew samples are not as effective as the LiOH-treated samples. However, when placing them above water, the LiNO3 and Renew samples cease in expansion while the LiOH samples expand much more, possibly more than when soaking them in a 1N NaOH solution.
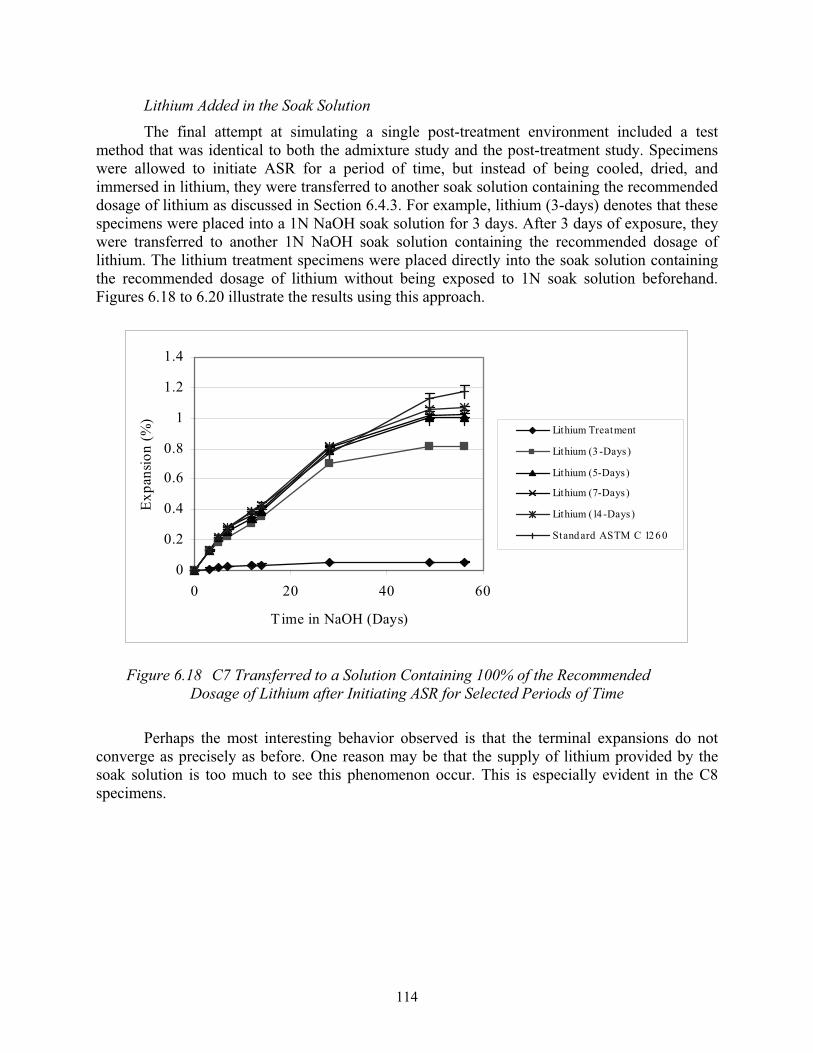
114
Lithium Added in the Soak Solution The final attempt at simulating a single post-treatment environment included a test
method that was identical to both the admixture study and the post-treatment study. Specimens were allowed to initiate ASR for a period of time, but instead of being cooled, dried, and immersed in lithium, they were transferred to another soak solution containing the recommended dosage of lithium as discussed in Section 6.4.3. For example, lithium (3-days) denotes that these specimens were placed into a 1N NaOH soak solution for 3 days. After 3 days of exposure, they were transferred to another 1N NaOH soak solution containing the recommended dosage of lithium. The lithium treatment specimens were placed directly into the soak solution containing the recommended dosage of lithium without being exposed to 1N soak solution beforehand. Figures 6.18 to 6.20 illustrate the results using this approach.
0
0.2
0.4
0.6
0.8
1
1.2
1.4
0 20 40 60
Time in NaOH (Days)
Expa
nsio
n (%
)
Lithium Treatment
Lithium (3 -Days)
Lithium (5-Days)
Lithium (7-Days)
Lithium (14 -Days)
Standard ASTM C 126 0
Figure 6.18 C7 Transferred to a Solution Containing 100% of the Recommended Dosage of Lithium after Initiating ASR for Selected Periods of Time
Perhaps the most interesting behavior observed is that the terminal expansions do not converge as precisely as before. One reason may be that the supply of lithium provided by the soak solution is too much to see this phenomenon occur. This is especially evident in the C8 specimens.
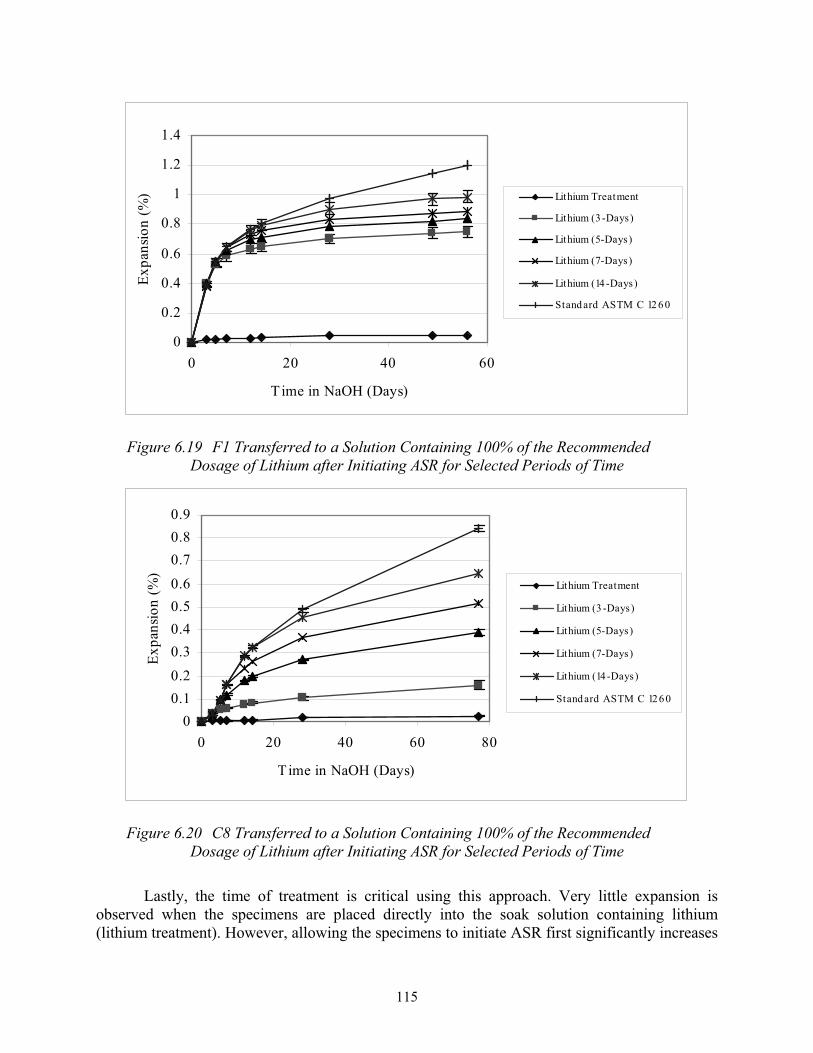
115
0
0.2
0.4
0.6
0.8
1
1.2
1.4
0 20 40 60
Time in NaOH (Days)
Expa
nsio
n (%
) Lithium Treatment
Lithium (3 -Days)
Lithium (5-Days)
Lithium (7-Days)
Lithium (14 -Days)
Stand ard ASTM C 12 6 0
Figure 6.19 F1 Transferred to a Solution Containing 100% of the Recommended Dosage of Lithium after Initiating ASR for Selected Periods of Time
00.10.20.30.40.50.60.70.80.9
0 20 40 60 80
Time in NaOH (Days)
Expa
nsio
n (%
)
Lithium Treatment
Lithium (3 -Days)
Lithium (5-Days)
Lithium (7-Days)
Lithium (14-Days)
Stand ard ASTM C 126 0
Figure 6.20 C8 Transferred to a Solution Containing 100% of the Recommended Dosage of Lithium after Initiating ASR for Selected Periods of Time
Lastly, the time of treatment is critical using this approach. Very little expansion is observed when the specimens are placed directly into the soak solution containing lithium (lithium treatment). However, allowing the specimens to initiate ASR first significantly increases
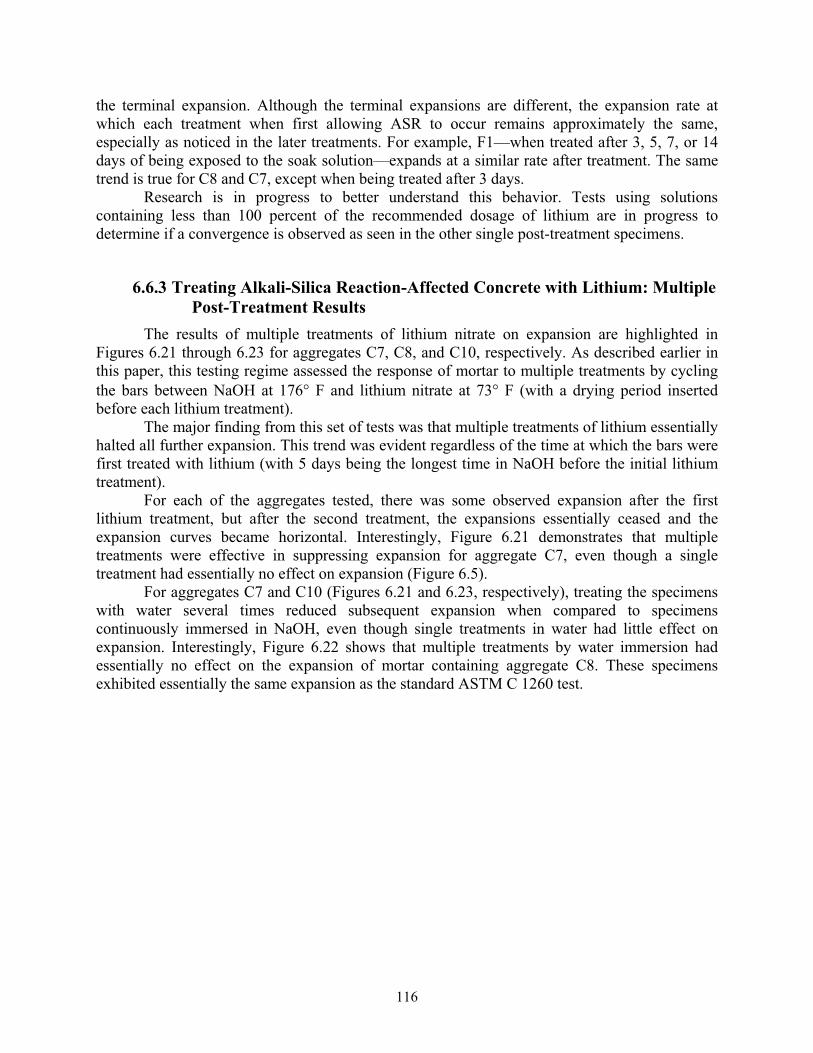
116
the terminal expansion. Although the terminal expansions are different, the expansion rate at which each treatment when first allowing ASR to occur remains approximately the same, especially as noticed in the later treatments. For example, F1—when treated after 3, 5, 7, or 14 days of being exposed to the soak solution—expands at a similar rate after treatment. The same trend is true for C8 and C7, except when being treated after 3 days.
Research is in progress to better understand this behavior. Tests using solutions containing less than 100 percent of the recommended dosage of lithium are in progress to determine if a convergence is observed as seen in the other single post-treatment specimens.
6.6.3 Treating Alkali-Silica Reaction-Affected Concrete with Lithium: Multiple Post-Treatment Results
The results of multiple treatments of lithium nitrate on expansion are highlighted in Figures 6.21 through 6.23 for aggregates C7, C8, and C10, respectively. As described earlier in this paper, this testing regime assessed the response of mortar to multiple treatments by cycling the bars between NaOH at 176° F and lithium nitrate at 73° F (with a drying period inserted before each lithium treatment).
The major finding from this set of tests was that multiple treatments of lithium essentially halted all further expansion. This trend was evident regardless of the time at which the bars were first treated with lithium (with 5 days being the longest time in NaOH before the initial lithium treatment).
For each of the aggregates tested, there was some observed expansion after the first lithium treatment, but after the second treatment, the expansions essentially ceased and the expansion curves became horizontal. Interestingly, Figure 6.21 demonstrates that multiple treatments were effective in suppressing expansion for aggregate C7, even though a single treatment had essentially no effect on expansion (Figure 6.5).
For aggregates C7 and C10 (Figures 6.21 and 6.23, respectively), treating the specimens with water several times reduced subsequent expansion when compared to specimens continuously immersed in NaOH, even though single treatments in water had little effect on expansion. Interestingly, Figure 6.22 shows that multiple treatments by water immersion had essentially no effect on the expansion of mortar containing aggregate C8. These specimens exhibited essentially the same expansion as the standard ASTM C 1260 test.
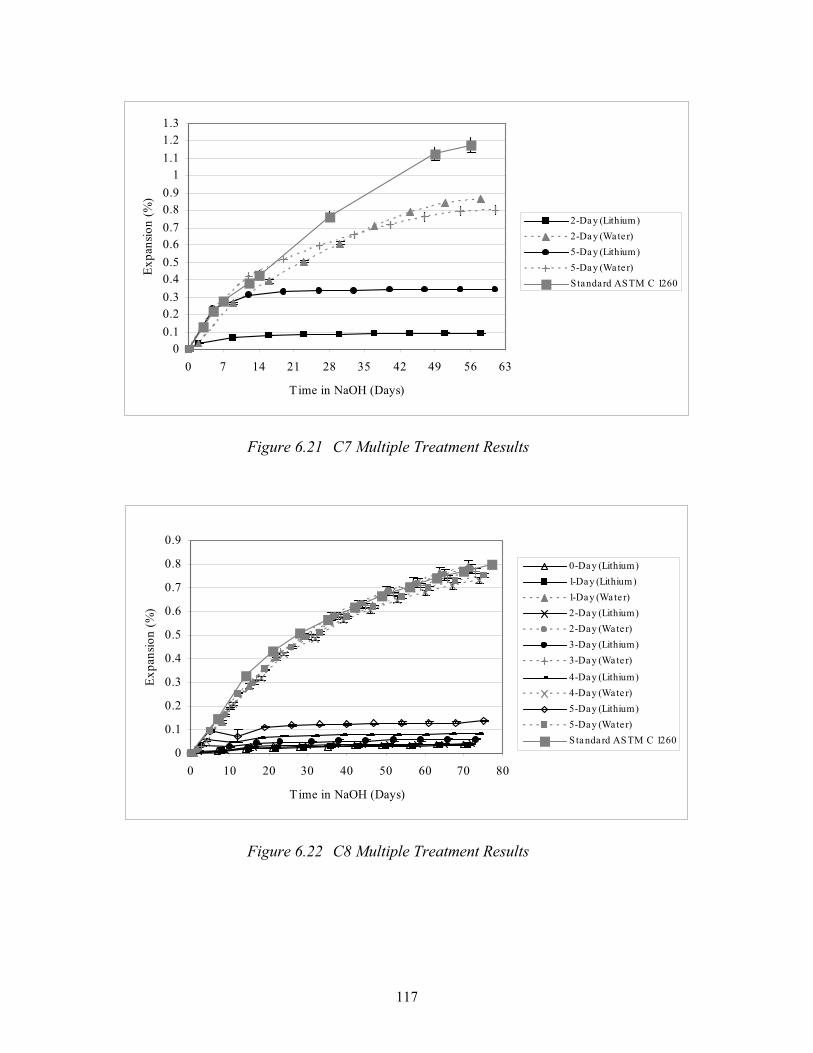
117
00.10.20.30.40.50.60.70.80.9
11.11.21.3
0 7 14 21 28 35 42 49 56 63
Time in NaOH (Days)
Expa
nsio
n (%
)
2-Day (Lithium)2-Day (Water)5-Day (Lithium)5-Day (Water)Standard ASTM C 1260
Figure 6.21 C7 Multiple Treatment Results
0
0.1
0.2
0.3
0.4
0.5
0.6
0.7
0.8
0.9
0 10 20 30 40 50 60 70 80
Time in NaOH (Days)
Expa
nsio
n (%
)
0-Day (Lithium)1-Day (Lithium)1-Day (Wate r)2-Day (Lithium)2-Day (Wate r)3-Day (Lithium)3-Day (Wate r)
4-Day (Lithium)4-Day (Wate r)5-Day (Lithium)5-Day (Wate r)S tandard ASTM C 1260
Figure 6.22 C8 Multiple Treatment Results
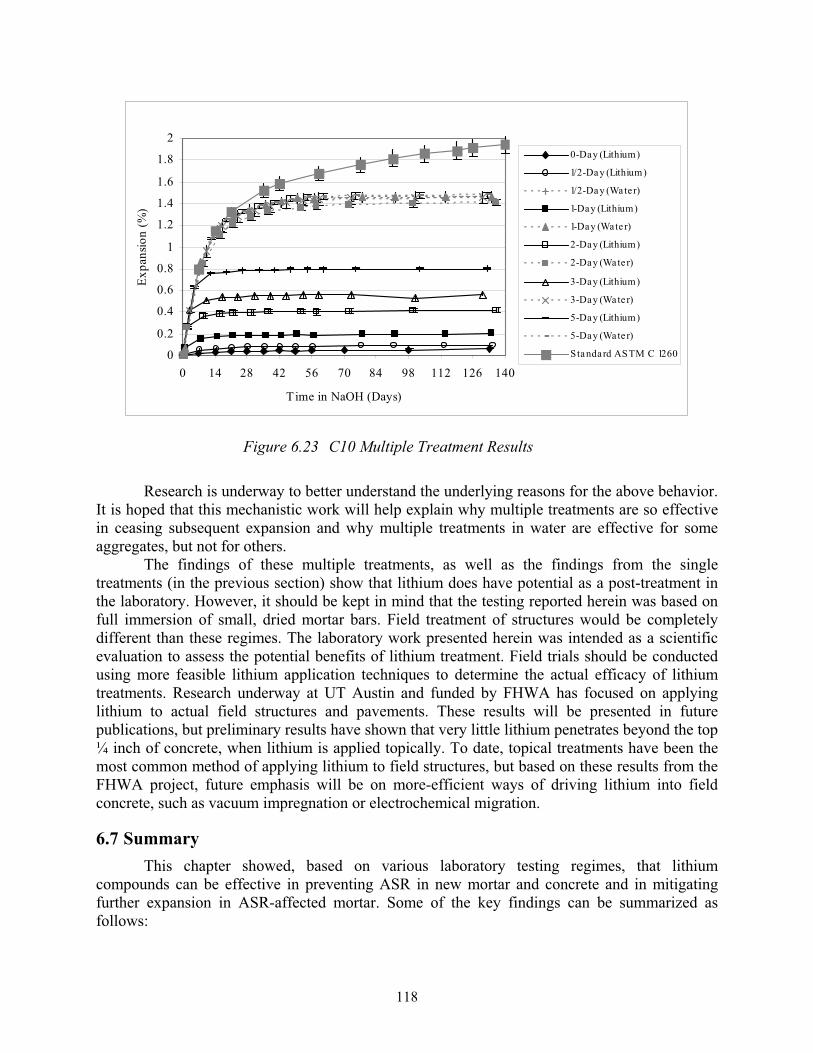
118
0
0.2
0.4
0.6
0.8
1
1.2
1.4
1.6
1.8
2
0 14 28 42 56 70 84 98 112 126 140
Time in NaOH (Days)
Expa
nsio
n (%
)0-Day (Lithium)
1/2-Day (Lithium)
1/2-Day (Water)
1-Day (Lithium)
1-Day (Wate r)
2-Day (Lithium)
2-Day (Wate r)
3-Day (Lithium)
3-Day (Wate r)
5-Day (Lithium)
5-Day (Wate r)
Standard ASTM C 1260
Figure 6.23 C10 Multiple Treatment Results
Research is underway to better understand the underlying reasons for the above behavior. It is hoped that this mechanistic work will help explain why multiple treatments are so effective in ceasing subsequent expansion and why multiple treatments in water are effective for some aggregates, but not for others.
The findings of these multiple treatments, as well as the findings from the single treatments (in the previous section) show that lithium does have potential as a post-treatment in the laboratory. However, it should be kept in mind that the testing reported herein was based on full immersion of small, dried mortar bars. Field treatment of structures would be completely different than these regimes. The laboratory work presented herein was intended as a scientific evaluation to assess the potential benefits of lithium treatment. Field trials should be conducted using more feasible lithium application techniques to determine the actual efficacy of lithium treatments. Research underway at UT Austin and funded by FHWA has focused on applying lithium to actual field structures and pavements. These results will be presented in future publications, but preliminary results have shown that very little lithium penetrates beyond the top ¼ inch of concrete, when lithium is applied topically. To date, topical treatments have been the most common method of applying lithium to field structures, but based on these results from the FHWA project, future emphasis will be on more-efficient ways of driving lithium into field concrete, such as vacuum impregnation or electrochemical migration.
6.7 SummaryThis chapter showed, based on various laboratory testing regimes, that lithium
compounds can be effective in preventing ASR in new mortar and concrete and in mitigating further expansion in ASR-affected mortar. Some of the key findings can be summarized as follows:
119
Lithium nitrate, when used in sufficient amount, can eliminate or minimize ASR-induced expansion in mortar and concrete. However, the actual dosage required to suppress expansion varies, depending on aggregate type and mineralogy.
A key finding from this project is that more than 100 percent of the manufacturer-recommended dosage is needed for some aggregates, thus making it difficult or impossible to specify a prescriptive dosage to control the expansion of a given aggregate. The current TxDOT specification, which allows for the prescriptive use of 100 percent recommended dosage or 0.55 gallons of 30 percent lithium per lb of Na2Oe (based on portland cement) deserves further consideration and should perhaps be modified to require 2-year concrete prism test data as acceptance criteria for a given aggregate source.
The modified version of ASTM C 1260, in which lithium is added to the mortar bar and soak solution at identical ratios of Li to Na+K, tends to overestimate the benefits of lithium, compared to the concrete prism test. As such, the accelerated mortar bar test is not recommended at this time as a predictor of lithium dosage for field concrete. TxDOT specifications should be modified to remove this version of the test in lieu of the concrete prism test, using a 0.04 percent expansion criteria at 2 years.
In accelerated laboratory tests, lithium appears quite effective as a post-treatment in reducing future expansion of mortar already suffering from ASR-induced expansion. However, it should be recognized that the testing described in this chapter involved an unrealistic treatment regime, specifically the total immersion of small mortar bars in concentrated lithium nitrate solution. The results cannot be directly extrapolated to treatment of actual field structures. In fact, recent results from topical treatment of concrete pavements (under a parallel research project funded by FHWA) have shown that lithium penetrates very little (e.g., less than ¼ inch) when applied topically, even when the concrete is severely cracked. Thus, although lithium shows potential for suppressing expansion when applied to existing concrete in the laboratory, future field work should focus on methods of driving lithium into hardened concrete structures (e.g., via vacuum impregnation or by electrochemical means). Topical application of lithium to field structures should be avoided owing to the lack of penetration of the lithium solution.

120
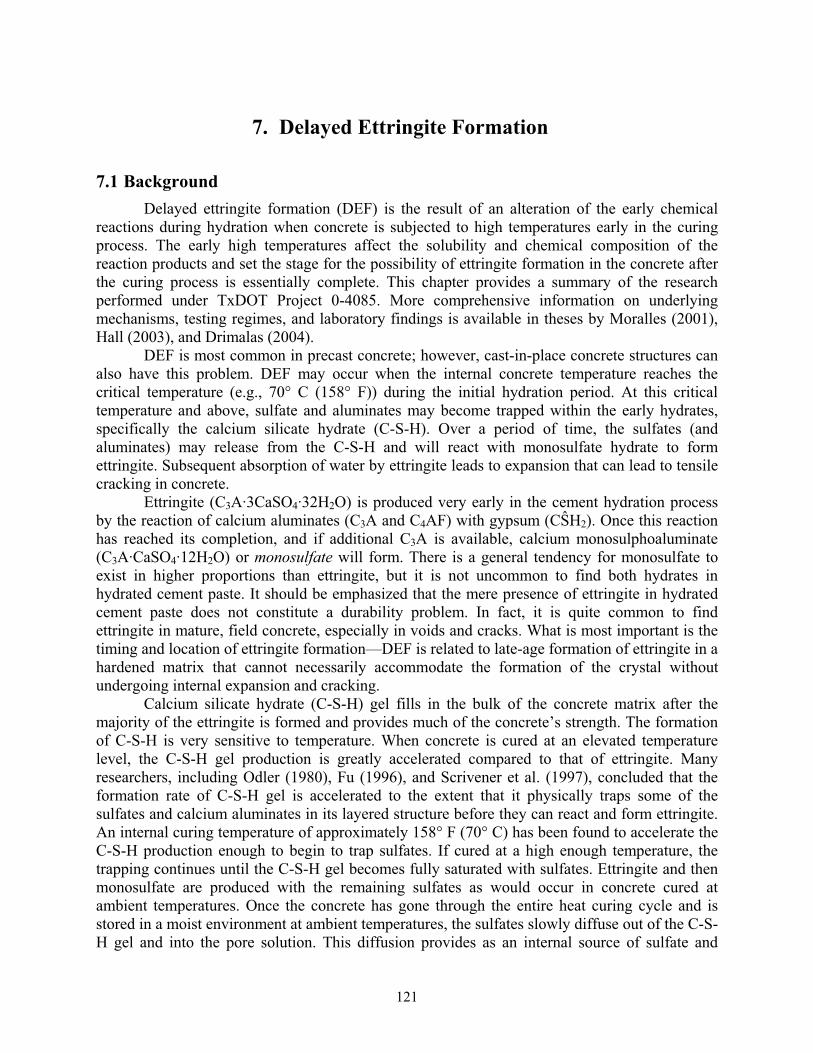
121
7. Delayed Ettringite Formation
7.1 BackgroundDelayed ettringite formation (DEF) is the result of an alteration of the early chemical
reactions during hydration when concrete is subjected to high temperatures early in the curing process. The early high temperatures affect the solubility and chemical composition of the reaction products and set the stage for the possibility of ettringite formation in the concrete after the curing process is essentially complete. This chapter provides a summary of the research performed under TxDOT Project 0-4085. More comprehensive information on underlying mechanisms, testing regimes, and laboratory findings is available in theses by Moralles (2001), Hall (2003), and Drimalas (2004).
DEF is most common in precast concrete; however, cast-in-place concrete structures can also have this problem. DEF may occur when the internal concrete temperature reaches the critical temperature (e.g., 70° C (158° F)) during the initial hydration period. At this critical temperature and above, sulfate and aluminates may become trapped within the early hydrates, specifically the calcium silicate hydrate (C-S-H). Over a period of time, the sulfates (and aluminates) may release from the C-S-H and will react with monosulfate hydrate to form ettringite. Subsequent absorption of water by ettringite leads to expansion that can lead to tensile cracking in concrete.
Ettringite (C3A·3CaSO4·32H2O) is produced very early in the cement hydration process by the reaction of calcium aluminates (C3A and C4AF) with gypsum (C H2). Once this reaction has reached its completion, and if additional C3A is available, calcium monosulphoaluminate (C3A·CaSO4·12H2O) or monosulfate will form. There is a general tendency for monosulfate to exist in higher proportions than ettringite, but it is not uncommon to find both hydrates in hydrated cement paste. It should be emphasized that the mere presence of ettringite in hydrated cement paste does not constitute a durability problem. In fact, it is quite common to find ettringite in mature, field concrete, especially in voids and cracks. What is most important is the timing and location of ettringite formation—DEF is related to late-age formation of ettringite in a hardened matrix that cannot necessarily accommodate the formation of the crystal without undergoing internal expansion and cracking.
Calcium silicate hydrate (C-S-H) gel fills in the bulk of the concrete matrix after the majority of the ettringite is formed and provides much of the concrete’s strength. The formation of C-S-H is very sensitive to temperature. When concrete is cured at an elevated temperature level, the C-S-H gel production is greatly accelerated compared to that of ettringite. Many researchers, including Odler (1980), Fu (1996), and Scrivener et al. (1997), concluded that the formation rate of C-S-H gel is accelerated to the extent that it physically traps some of the sulfates and calcium aluminates in its layered structure before they can react and form ettringite. An internal curing temperature of approximately 158° F (70° C) has been found to accelerate the C-S-H production enough to begin to trap sulfates. If cured at a high enough temperature, the trapping continues until the C-S-H gel becomes fully saturated with sulfates. Ettringite and then monosulfate are produced with the remaining sulfates as would occur in concrete cured at ambient temperatures. Once the concrete has gone through the entire heat curing cycle and is stored in a moist environment at ambient temperatures, the sulfates slowly diffuse out of the C-S-H gel and into the pore solution. This diffusion provides as an internal source of sulfate and
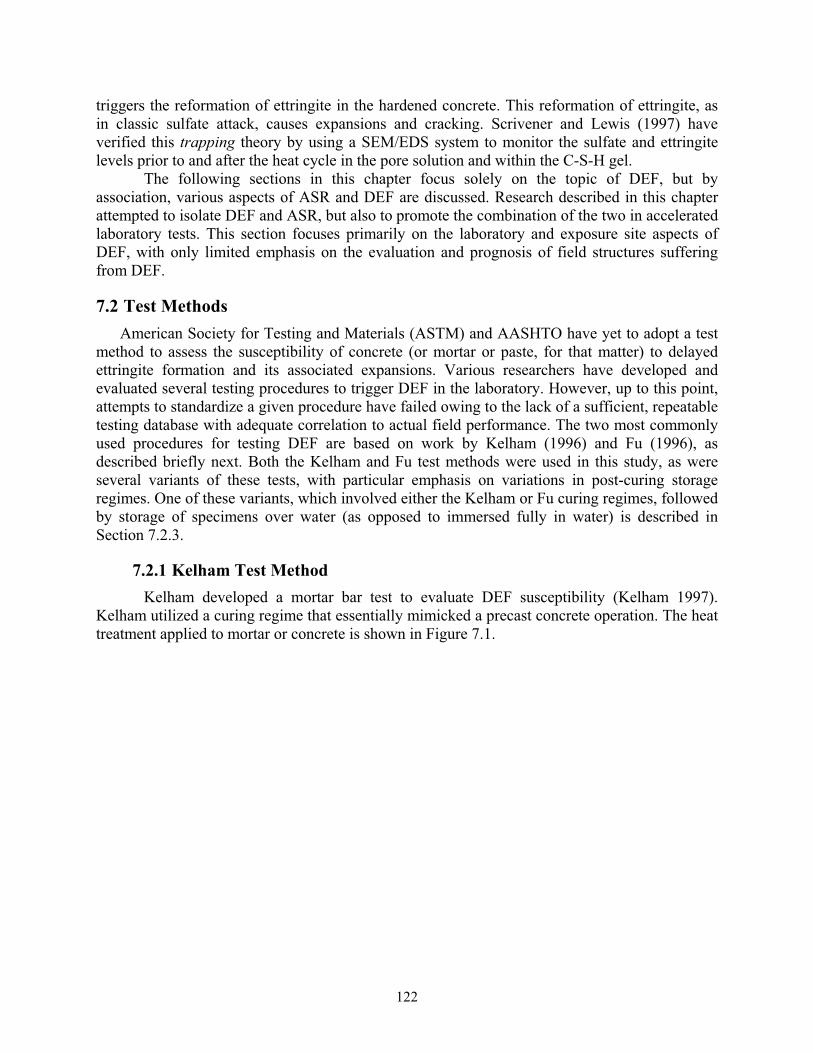
122
triggers the reformation of ettringite in the hardened concrete. This reformation of ettringite, as in classic sulfate attack, causes expansions and cracking. Scrivener and Lewis (1997) have verified this trapping theory by using a SEM/EDS system to monitor the sulfate and ettringite levels prior to and after the heat cycle in the pore solution and within the C-S-H gel.
The following sections in this chapter focus solely on the topic of DEF, but by association, various aspects of ASR and DEF are discussed. Research described in this chapter attempted to isolate DEF and ASR, but also to promote the combination of the two in accelerated laboratory tests. This section focuses primarily on the laboratory and exposure site aspects of DEF, with only limited emphasis on the evaluation and prognosis of field structures suffering from DEF.
7.2 Test Methods American Society for Testing and Materials (ASTM) and AASHTO have yet to adopt a test
method to assess the susceptibility of concrete (or mortar or paste, for that matter) to delayed ettringite formation and its associated expansions. Various researchers have developed and evaluated several testing procedures to trigger DEF in the laboratory. However, up to this point, attempts to standardize a given procedure have failed owing to the lack of a sufficient, repeatable testing database with adequate correlation to actual field performance. The two most commonly used procedures for testing DEF are based on work by Kelham (1996) and Fu (1996), as described briefly next. Both the Kelham and Fu test methods were used in this study, as were several variants of these tests, with particular emphasis on variations in post-curing storage regimes. One of these variants, which involved either the Kelham or Fu curing regimes, followed by storage of specimens over water (as opposed to immersed fully in water) is described in Section 7.2.3.
7.2.1 Kelham Test Method Kelham developed a mortar bar test to evaluate DEF susceptibility (Kelham 1997).
Kelham utilized a curing regime that essentially mimicked a precast concrete operation. The heat treatment applied to mortar or concrete is shown in Figure 7.1.
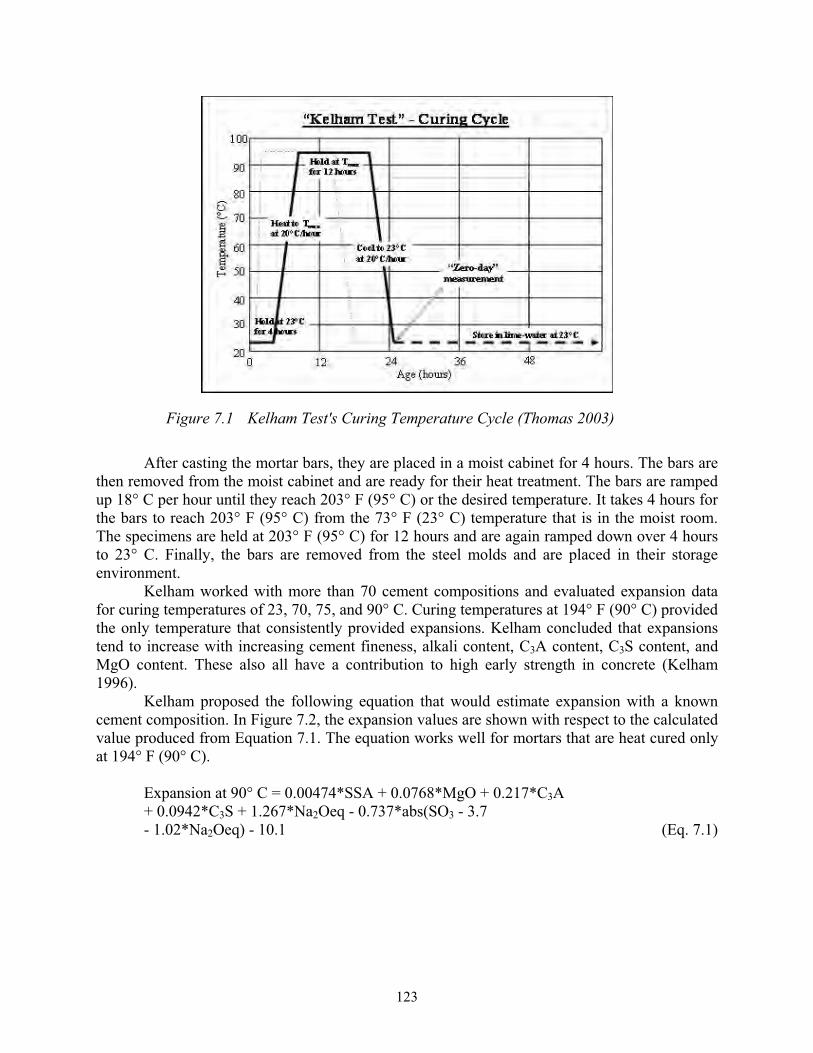
123
Figure 7.1 Kelham Test's Curing Temperature Cycle (Thomas 2003)
After casting the mortar bars, they are placed in a moist cabinet for 4 hours. The bars are then removed from the moist cabinet and are ready for their heat treatment. The bars are ramped up 18° C per hour until they reach 203° F (95° C) or the desired temperature. It takes 4 hours for the bars to reach 203° F (95° C) from the 73° F (23° C) temperature that is in the moist room. The specimens are held at 203° F (95° C) for 12 hours and are again ramped down over 4 hours to 23° C. Finally, the bars are removed from the steel molds and are placed in their storage environment.
Kelham worked with more than 70 cement compositions and evaluated expansion data for curing temperatures of 23, 70, 75, and 90° C. Curing temperatures at 194° F (90° C) provided the only temperature that consistently provided expansions. Kelham concluded that expansions tend to increase with increasing cement fineness, alkali content, C3A content, C3S content, and MgO content. These also all have a contribution to high early strength in concrete (Kelham 1996).
Kelham proposed the following equation that would estimate expansion with a known cement composition. In Figure 7.2, the expansion values are shown with respect to the calculated value produced from Equation 7.1. The equation works well for mortars that are heat cured only at 194° F (90° C).
Expansion at 90° C = 0.00474*SSA + 0.0768*MgO + 0.217*C3A + 0.0942*C3S + 1.267*Na2Oeq - 0.737*abs(SO3 - 3.7 - 1.02*Na2Oeq) - 10.1 (Eq. 7.1)
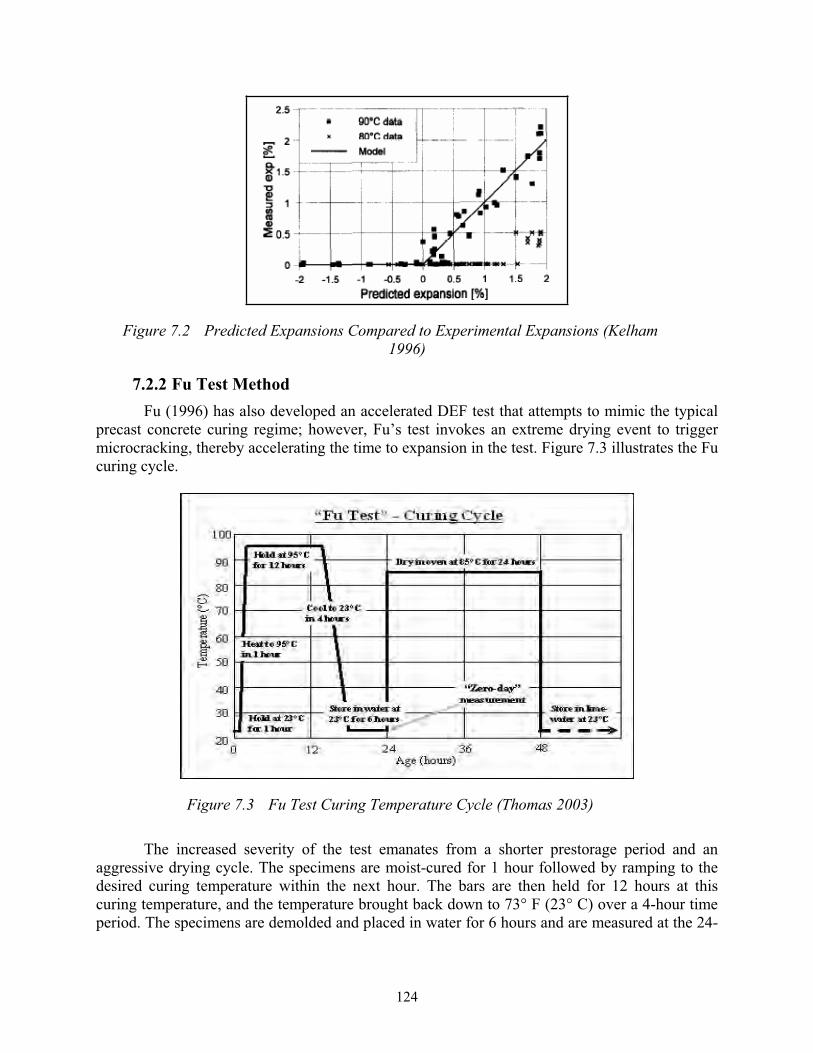
124
Figure 7.2 Predicted Expansions Compared to Experimental Expansions (Kelham 1996)
7.2.2 Fu Test Method Fu (1996) has also developed an accelerated DEF test that attempts to mimic the typical
precast concrete curing regime; however, Fu’s test invokes an extreme drying event to trigger microcracking, thereby accelerating the time to expansion in the test. Figure 7.3 illustrates the Fu curing cycle.
Figure 7.3 Fu Test Curing Temperature Cycle (Thomas 2003)
The increased severity of the test emanates from a shorter prestorage period and an aggressive drying cycle. The specimens are moist-cured for 1 hour followed by ramping to the desired curing temperature within the next hour. The bars are then held for 12 hours at this curing temperature, and the temperature brought back down to 73° F (23° C) over a 4-hour time period. The specimens are demolded and placed in water for 6 hours and are measured at the 24-
125
hour mark. The specimens then undergo a drying cycle, which lasts for 24 hours at a temperature of 185° F (85° C). The drying cycle is used to introduce microcracks in the cement paste.
Fu’s test is a more severe test than the Kelham method owing to the short pre-curing time, quick ramping period, and the drying cycle. Beginning the ramping period only within an hour and only allowing 1 hour to reach the maximum curing temperature can allow changes in chemical composition other than breakdown of ettringite to monosulfate. The drying cycle severity comes from the harsh environment that the specimen undergoes. The high temperature during the drying cycle can change chemical compositions in the specimen.
7.2.3 Modified American Society for Testing and Materials C 227 Test Procedure
In addition to the Kelham and Fu regimes, which both involve storage of mortar bars in water, research under TxDOT Project 0-4085 included a modified version of ASTM C 227 to further study the synergies between ASR and DEF. The storage regime used in ASTM C 227 is essentially the same as ASTM C 1293, which entails storing specimens above water at 100 ºF (38 ºC). This environment allows ASR to occur uninhibited because leaching of alkalies out of the bars will be much less than in the limewater bath storage. This storage regime was used on selected test specimens to attempt to activate both DEF and ASR, recognizing that storing specimens directly in water will leach out most of the alkalies, which tends to promote DEF but suppress ASR.
A testing matrix was initiated under this project that included a range of aggregates, cements, and SCMs, which were subjected to various curing regimes, prior to storage of the test prisms above water. The mortar bars were mixed in the same manner as the ASTM C 1260 and DEF test bars. The heat-cured specimens were subjected to curing regimes as described in Sections 7.2.1 and 7.2.2. The non–heat-cured specimens were moist-cured at 73 ºF (23 ºC) for the 24-hour period. The specimens were then demolded, labeled, and initial measurements were recorded. The mortar bars are placed on end in a brass rack positioned above water in a sealed container. The containers were then stored at 100 ºF (38 ºC). The storage container and metal racks conformed to the standards set in ASTM C 227. However, the wicking material was removed to limit the leaching of alkalies out of the bars.
The containers were removed from the 100 ºF (38 ºC) oven 24 hours prior to subsequent length measurements and allowed to cool to 73 ºF (23 ºC). The specimens were removed from the containers and measured. Meanwhile, the containers were cleaned and fresh water was placed at the bottom. The specimens were resealed in the containers and returned to the 38 ºC oven until the next measurement sequence. Length measurements were taken at 0, 14, and 28 days and every 28 days thereafter.
7.3 Materials and Mixture Proportions A wide range of materials were used throughout this testing program, including various
types and sources of aggregates, portland cements, SCMs, and chemical admixtures. This section describes the materials used in the study and discusses the equipment and facilities used to conduct the research.
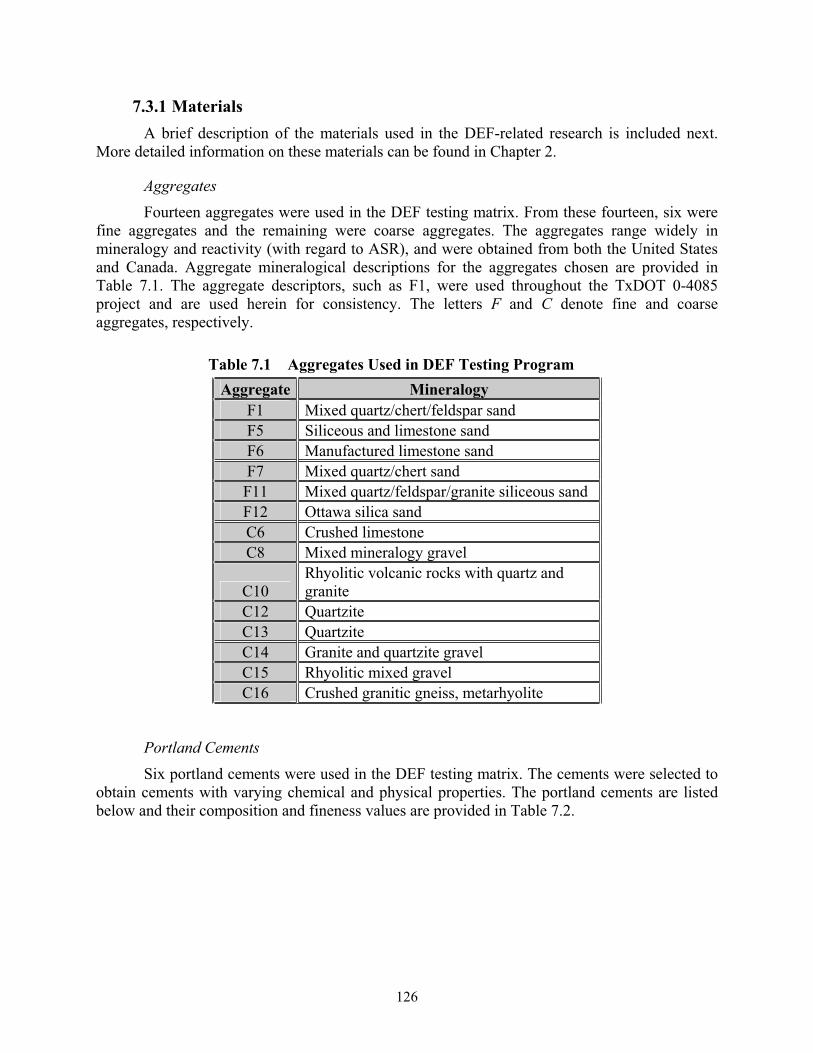
126
7.3.1 MaterialsA brief description of the materials used in the DEF-related research is included next.
More detailed information on these materials can be found in Chapter 2.
AggregatesFourteen aggregates were used in the DEF testing matrix. From these fourteen, six were
fine aggregates and the remaining were coarse aggregates. The aggregates range widely in mineralogy and reactivity (with regard to ASR), and were obtained from both the United States and Canada. Aggregate mineralogical descriptions for the aggregates chosen are provided in Table 7.1. The aggregate descriptors, such as F1, were used throughout the TxDOT 0-4085 project and are used herein for consistency. The letters F and C denote fine and coarse aggregates, respectively.
Table 7.1 Aggregates Used in DEF Testing Program Aggregate Mineralogy
F1 Mixed quartz/chert/feldspar sand F5 Siliceous and limestone sand F6 Manufactured limestone sand F7 Mixed quartz/chert sand F11 Mixed quartz/feldspar/granite siliceous sand F12 Ottawa silica sand C6 Crushed limestone C8 Mixed mineralogy gravel
C10Rhyolitic volcanic rocks with quartz and granite
C12 Quartzite C13 Quartzite C14 Granite and quartzite gravel C15 Rhyolitic mixed gravel C16 Crushed granitic gneiss, metarhyolite
Portland Cements Six portland cements were used in the DEF testing matrix. The cements were selected to
obtain cements with varying chemical and physical properties. The portland cements are listed below and their composition and fineness values are provided in Table 7.2.
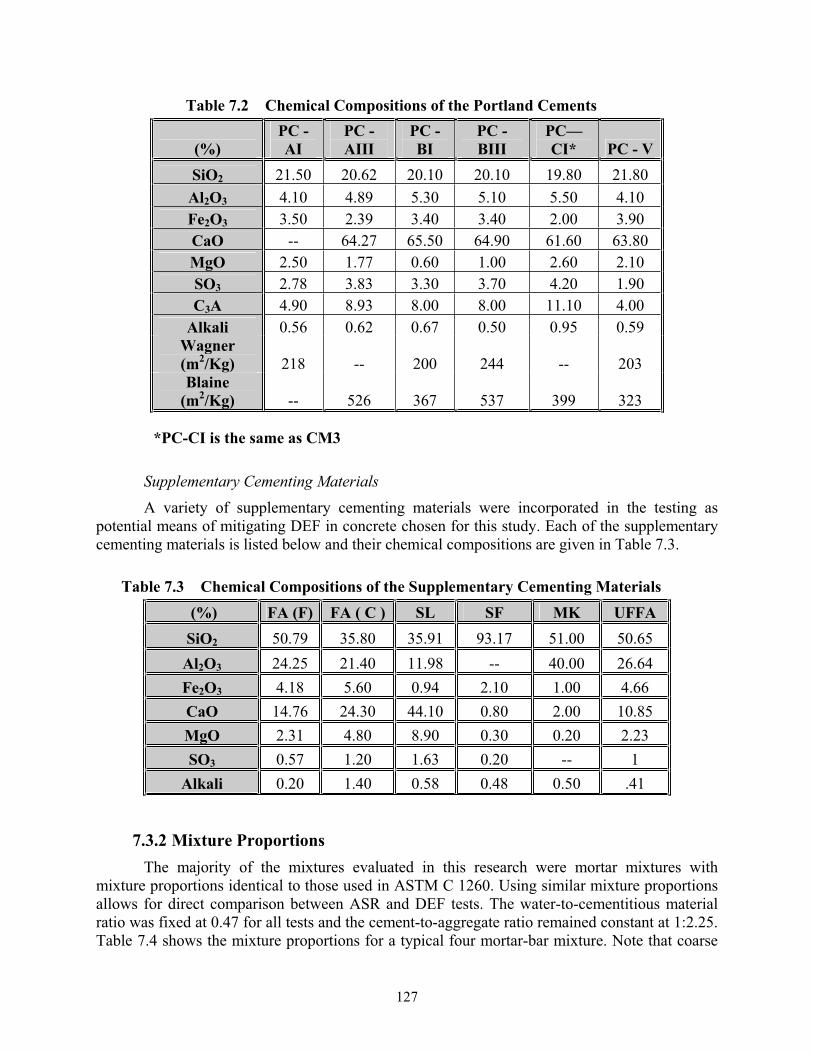
127
Table 7.2 Chemical Compositions of the Portland Cements
(%) PC - AI
PC - AIII
PC - BI
PC - BIII
PC—CI* PC - V
SiO2 21.50 20.62 20.10 20.10 19.80 21.80 Al2O3 4.10 4.89 5.30 5.10 5.50 4.10 Fe2O3 3.50 2.39 3.40 3.40 2.00 3.90 CaO -- 64.27 65.50 64.90 61.60 63.80 MgO 2.50 1.77 0.60 1.00 2.60 2.10 SO3 2.78 3.83 3.30 3.70 4.20 1.90 C3A 4.90 8.93 8.00 8.00 11.10 4.00
Alkali 0.56 0.62 0.67 0.50 0.95 0.59 Wagner(m2/Kg) 218 -- 200 244 -- 203 Blaine
(m2/Kg) -- 526 367 537 399 323
*PC-CI is the same as CM3
Supplementary Cementing Materials A variety of supplementary cementing materials were incorporated in the testing as
potential means of mitigating DEF in concrete chosen for this study. Each of the supplementary cementing materials is listed below and their chemical compositions are given in Table 7.3.
Table 7.3 Chemical Compositions of the Supplementary Cementing Materials (%) FA (F) FA ( C ) SL SF MK UFFASiO2 50.79 35.80 35.91 93.17 51.00 50.65 Al2O3 24.25 21.40 11.98 -- 40.00 26.64 Fe2O3 4.18 5.60 0.94 2.10 1.00 4.66 CaO 14.76 24.30 44.10 0.80 2.00 10.85 MgO 2.31 4.80 8.90 0.30 0.20 2.23 SO3 0.57 1.20 1.63 0.20 -- 1
Alkali 0.20 1.40 0.58 0.48 0.50 .41
7.3.2 Mixture Proportions The majority of the mixtures evaluated in this research were mortar mixtures with
mixture proportions identical to those used in ASTM C 1260. Using similar mixture proportions allows for direct comparison between ASR and DEF tests. The water-to-cementitious material ratio was fixed at 0.47 for all tests and the cement-to-aggregate ratio remained constant at 1:2.25. Table 7.4 shows the mixture proportions for a typical four mortar-bar mixture. Note that coarse
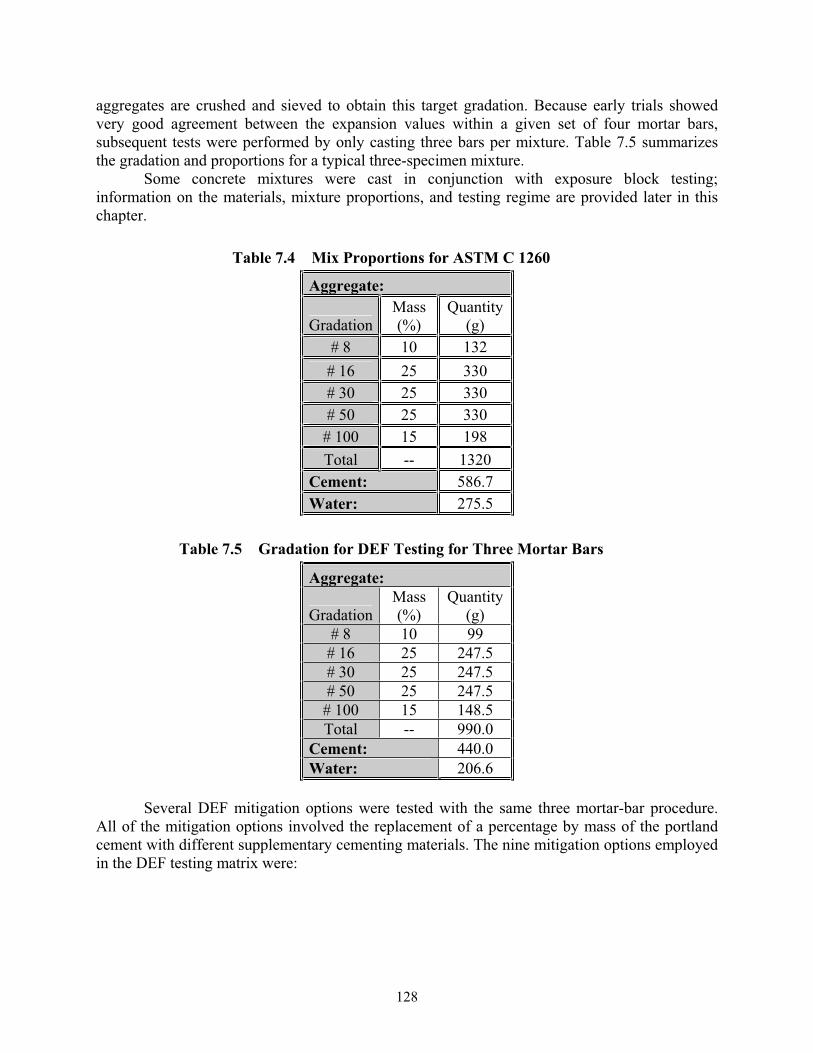
128
aggregates are crushed and sieved to obtain this target gradation. Because early trials showed very good agreement between the expansion values within a given set of four mortar bars, subsequent tests were performed by only casting three bars per mixture. Table 7.5 summarizes the gradation and proportions for a typical three-specimen mixture.
Some concrete mixtures were cast in conjunction with exposure block testing; information on the materials, mixture proportions, and testing regime are provided later in this chapter.
Table 7.4 Mix Proportions for ASTM C 1260
Aggregate:
GradationMass(%)
Quantity (g)
# 8 10 132 # 16 25 330 # 30 25 330 # 50 25 330 # 100 15 198 Total -- 1320
Cement: 586.7Water: 275.5
Table 7.5 Gradation for DEF Testing for Three Mortar Bars
Aggregate:
GradationMass(%)
Quantity (g)
# 8 10 99 # 16 25 247.5 # 30 25 247.5 # 50 25 247.5 # 100 15 148.5 Total -- 990.0
Cement: 440.0Water: 206.6
Several DEF mitigation options were tested with the same three mortar-bar procedure. All of the mitigation options involved the replacement of a percentage by mass of the portland cement with different supplementary cementing materials. The nine mitigation options employed in the DEF testing matrix were:
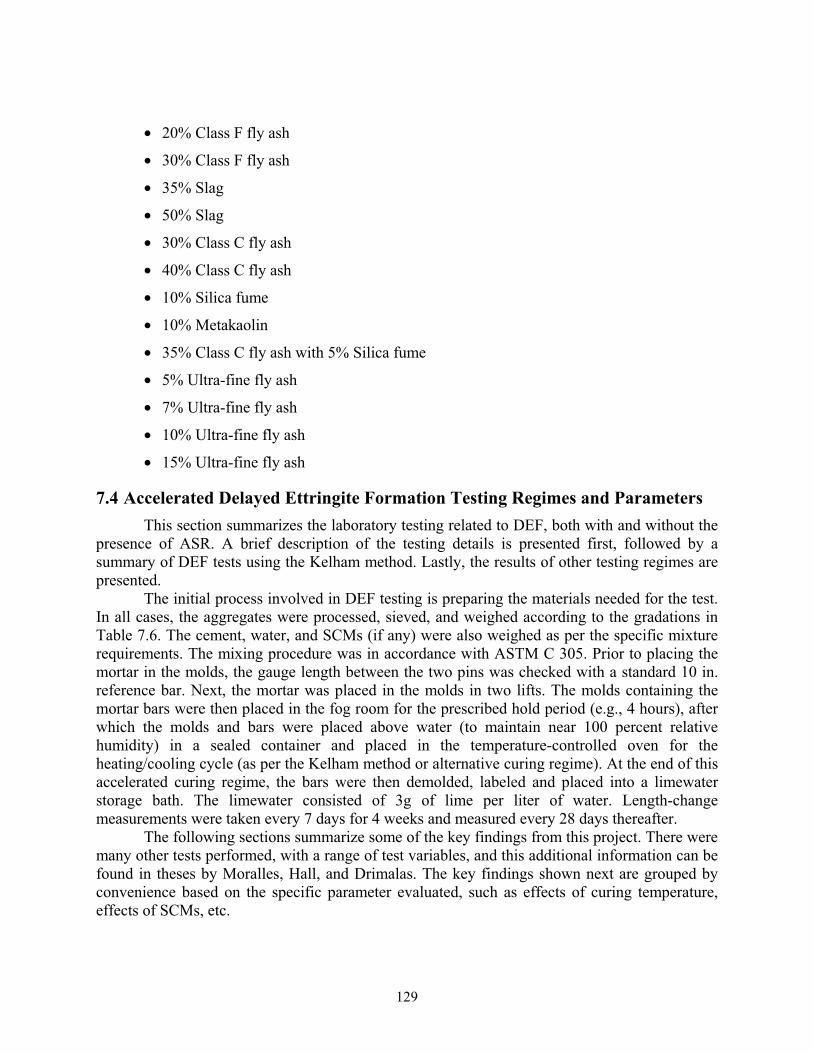
129
• 20% Class F fly ash
• 30% Class F fly ash
• 35% Slag
• 50% Slag
• 30% Class C fly ash
• 40% Class C fly ash
• 10% Silica fume
• 10% Metakaolin
• 35% Class C fly ash with 5% Silica fume
• 5% Ultra-fine fly ash
• 7% Ultra-fine fly ash
• 10% Ultra-fine fly ash
• 15% Ultra-fine fly ash
7.4 Accelerated Delayed Ettringite Formation Testing Regimes and Parameters This section summarizes the laboratory testing related to DEF, both with and without the
presence of ASR. A brief description of the testing details is presented first, followed by a summary of DEF tests using the Kelham method. Lastly, the results of other testing regimes are presented.
The initial process involved in DEF testing is preparing the materials needed for the test. In all cases, the aggregates were processed, sieved, and weighed according to the gradations in Table 7.6. The cement, water, and SCMs (if any) were also weighed as per the specific mixture requirements. The mixing procedure was in accordance with ASTM C 305. Prior to placing the mortar in the molds, the gauge length between the two pins was checked with a standard 10 in. reference bar. Next, the mortar was placed in the molds in two lifts. The molds containing the mortar bars were then placed in the fog room for the prescribed hold period (e.g., 4 hours), after which the molds and bars were placed above water (to maintain near 100 percent relative humidity) in a sealed container and placed in the temperature-controlled oven for the heating/cooling cycle (as per the Kelham method or alternative curing regime). At the end of this accelerated curing regime, the bars were then demolded, labeled and placed into a limewater storage bath. The limewater consisted of 3g of lime per liter of water. Length-change measurements were taken every 7 days for 4 weeks and measured every 28 days thereafter.
The following sections summarize some of the key findings from this project. There were many other tests performed, with a range of test variables, and this additional information can be found in theses by Moralles, Hall, and Drimalas. The key findings shown next are grouped by convenience based on the specific parameter evaluated, such as effects of curing temperature, effects of SCMs, etc.
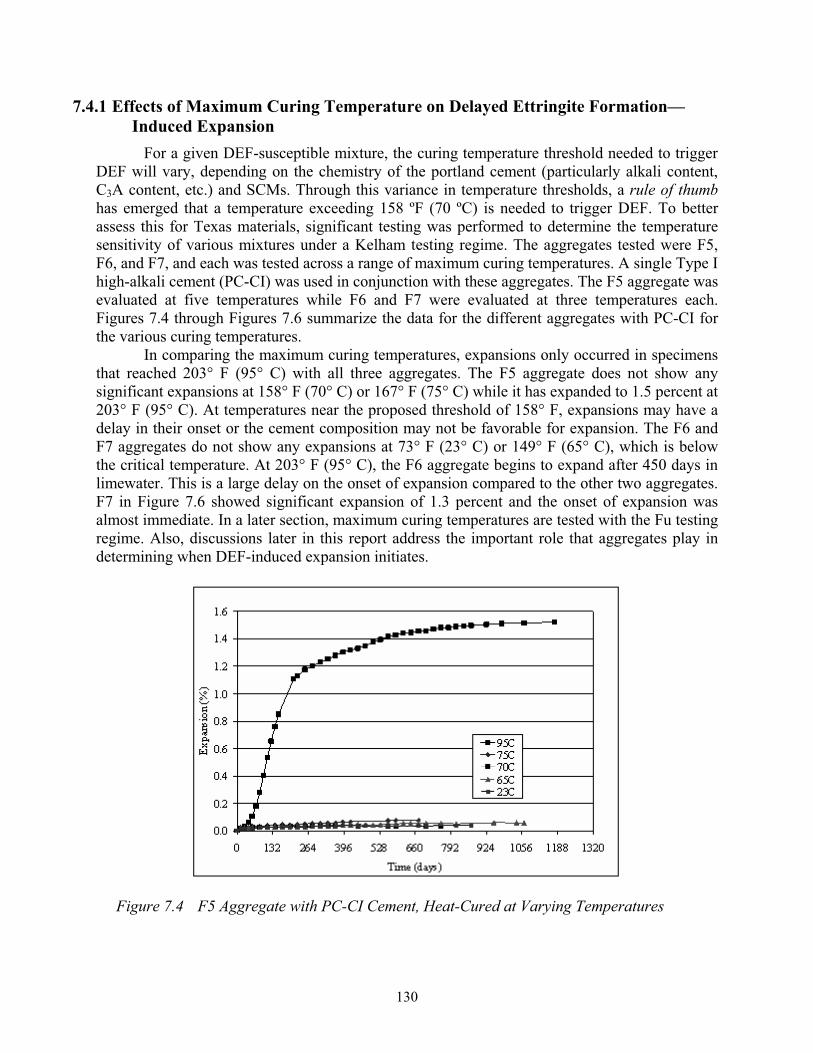
130
7.4.1 Effects of Maximum Curing Temperature on Delayed Ettringite Formation—Induced Expansion
For a given DEF-susceptible mixture, the curing temperature threshold needed to trigger DEF will vary, depending on the chemistry of the portland cement (particularly alkali content, C3A content, etc.) and SCMs. Through this variance in temperature thresholds, a rule of thumbhas emerged that a temperature exceeding 158 ºF (70 ºC) is needed to trigger DEF. To better assess this for Texas materials, significant testing was performed to determine the temperature sensitivity of various mixtures under a Kelham testing regime. The aggregates tested were F5, F6, and F7, and each was tested across a range of maximum curing temperatures. A single Type I high-alkali cement (PC-CI) was used in conjunction with these aggregates. The F5 aggregate was evaluated at five temperatures while F6 and F7 were evaluated at three temperatures each. Figures 7.4 through Figures 7.6 summarize the data for the different aggregates with PC-CI for the various curing temperatures.
In comparing the maximum curing temperatures, expansions only occurred in specimens that reached 203° F (95° C) with all three aggregates. The F5 aggregate does not show any significant expansions at 158° F (70° C) or 167° F (75° C) while it has expanded to 1.5 percent at 203° F (95° C). At temperatures near the proposed threshold of 158° F, expansions may have a delay in their onset or the cement composition may not be favorable for expansion. The F6 and F7 aggregates do not show any expansions at 73° F (23° C) or 149° F (65° C), which is below the critical temperature. At 203° F (95° C), the F6 aggregate begins to expand after 450 days in limewater. This is a large delay on the onset of expansion compared to the other two aggregates. F7 in Figure 7.6 showed significant expansion of 1.3 percent and the onset of expansion was almost immediate. In a later section, maximum curing temperatures are tested with the Fu testing regime. Also, discussions later in this report address the important role that aggregates play in determining when DEF-induced expansion initiates.
Figure 7.4 F5 Aggregate with PC-CI Cement, Heat-Cured at Varying Temperatures
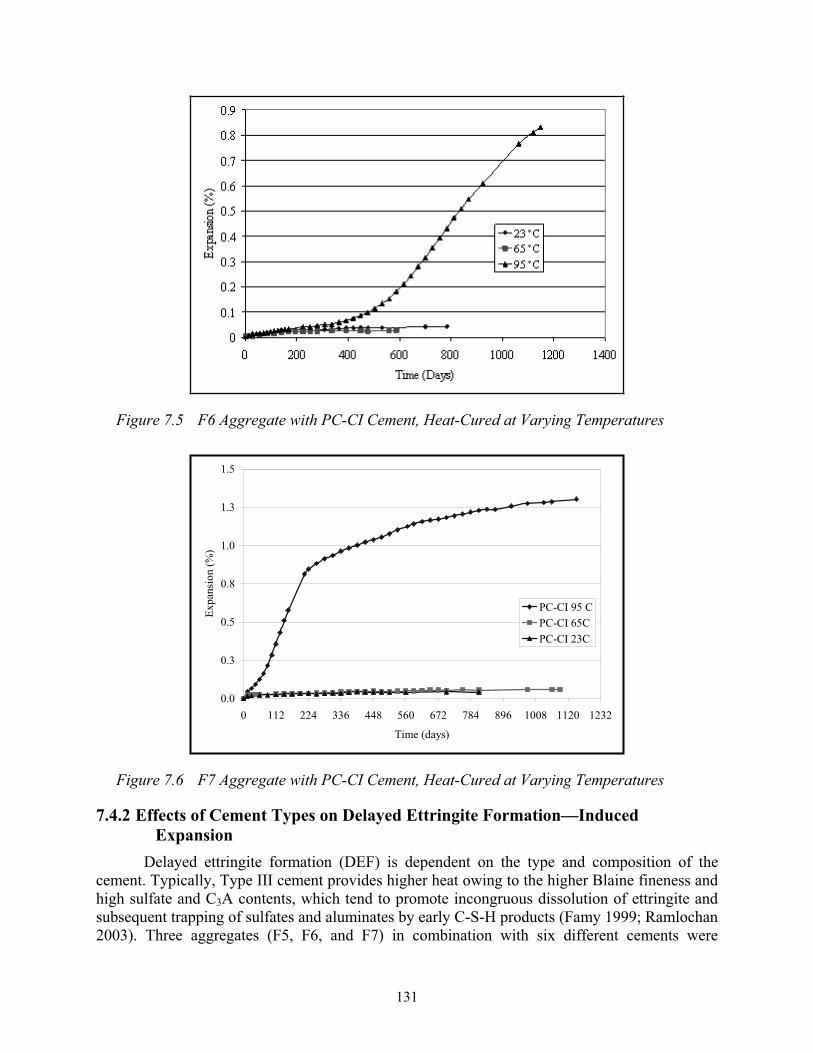
131
Figure 7.5 F6 Aggregate with PC-CI Cement, Heat-Cured at Varying Temperatures
0.0
0.3
0.5
0.8
1.0
1.3
1.5
0 112 224 336 448 560 672 784 896 1008 1120 1232
Time (days)
Expa
nsio
n (%
)
PC-CI 95 CPC-CI 65CPC-CI 23C
Figure 7.6 F7 Aggregate with PC-CI Cement, Heat-Cured at Varying Temperatures
7.4.2 Effects of Cement Types on Delayed Ettringite Formation—Induced Expansion
Delayed ettringite formation (DEF) is dependent on the type and composition of the cement. Typically, Type III cement provides higher heat owing to the higher Blaine fineness and high sulfate and C3A contents, which tend to promote incongruous dissolution of ettringite and subsequent trapping of sulfates and aluminates by early C-S-H products (Famy 1999; Ramlochan 2003). Three aggregates (F5, F6, and F7) in combination with six different cements were
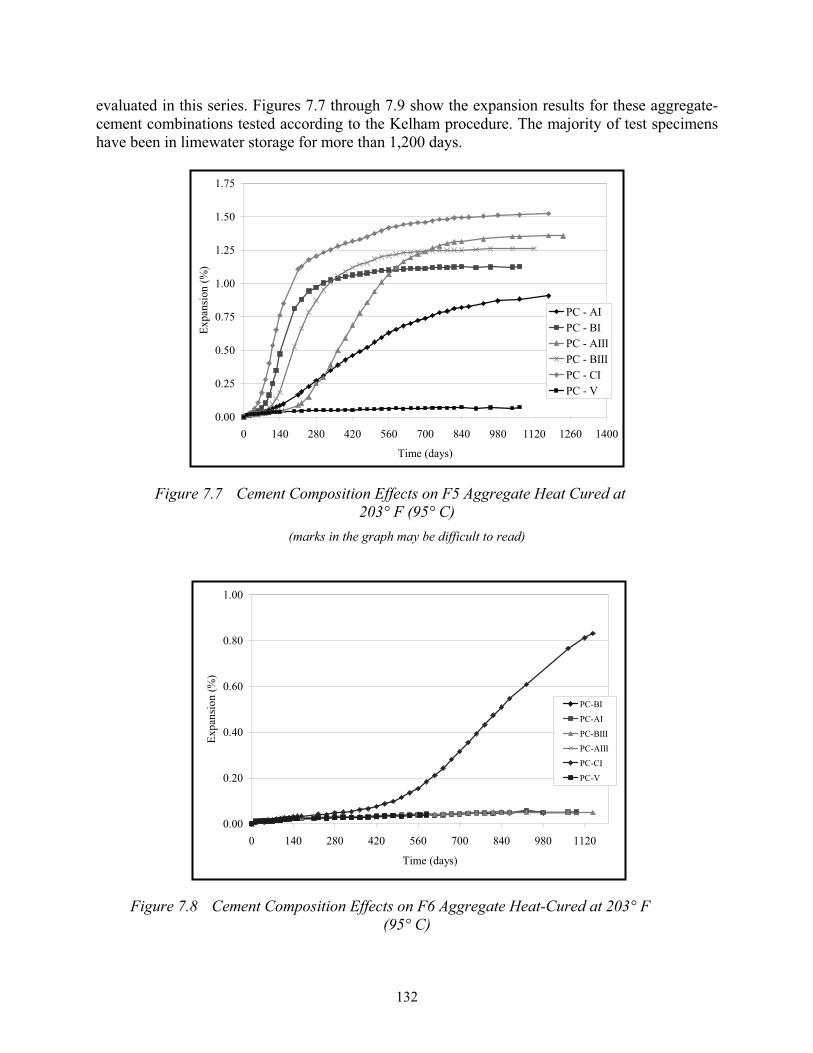
132
evaluated in this series. Figures 7.7 through 7.9 show the expansion results for these aggregate-cement combinations tested according to the Kelham procedure. The majority of test specimens have been in limewater storage for more than 1,200 days.
0.00
0.25
0.50
0.75
1.00
1.25
1.50
1.75
0 140 280 420 560 700 840 980 1120 1260 1400
Time (days)
Expa
nsio
n (%
)
PC - AIPC - BIPC - AIIIPC - BIIIPC - CIPC - V
Figure 7.7 Cement Composition Effects on F5 Aggregate Heat Cured at203° F (95° C)
(marks in the graph may be difficult to read)
0.00
0.20
0.40
0.60
0.80
1.00
0 140 280 420 560 700 840 980 1120
Time (days)
Expa
nsio
n (%
)
PC-BI
PC-AI
PC-BIII
PC-AIII
PC-CI
PC-V
Figure 7.8 Cement Composition Effects on F6 Aggregate Heat-Cured at 203° F(95° C)
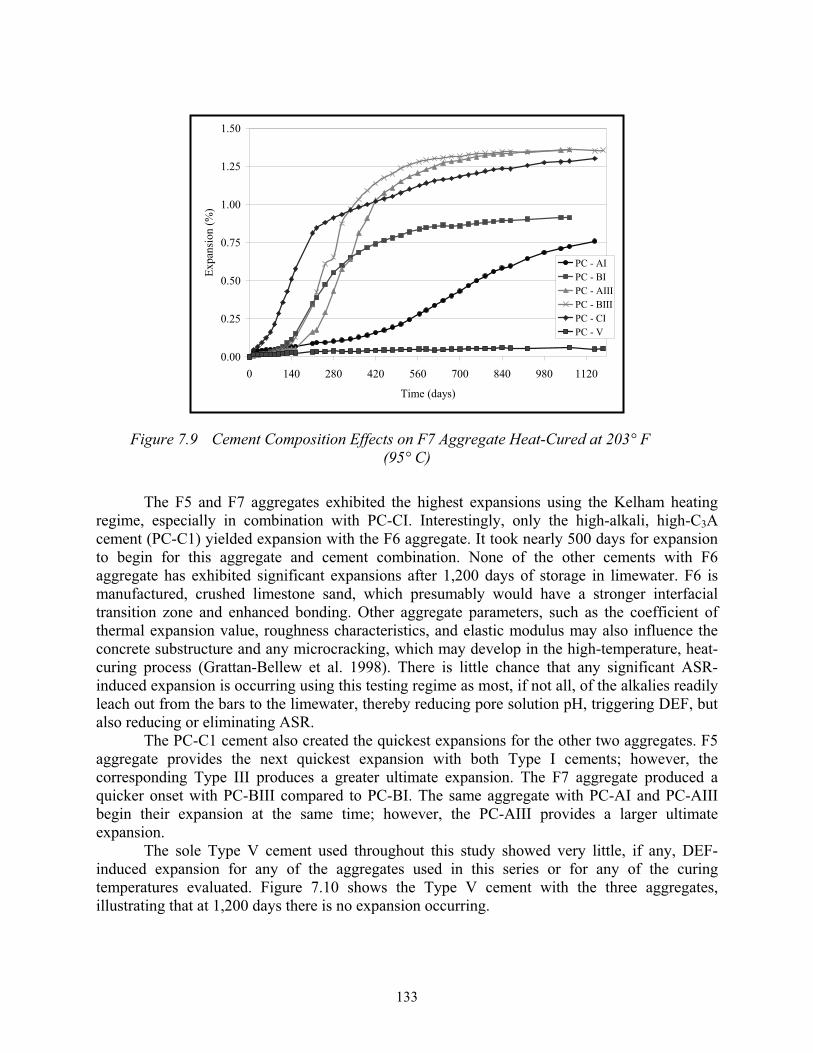
133
0.00
0.25
0.50
0.75
1.00
1.25
1.50
0 140 280 420 560 700 840 980 1120
Time (days)
Expa
nsio
n (%
)
PC - AIPC - BIPC - AIIIPC - BIIIPC - CIPC - V
Figure 7.9 Cement Composition Effects on F7 Aggregate Heat-Cured at 203° F(95° C)
The F5 and F7 aggregates exhibited the highest expansions using the Kelham heating regime, especially in combination with PC-CI. Interestingly, only the high-alkali, high-C3Acement (PC-C1) yielded expansion with the F6 aggregate. It took nearly 500 days for expansion to begin for this aggregate and cement combination. None of the other cements with F6 aggregate has exhibited significant expansions after 1,200 days of storage in limewater. F6 is manufactured, crushed limestone sand, which presumably would have a stronger interfacial transition zone and enhanced bonding. Other aggregate parameters, such as the coefficient of thermal expansion value, roughness characteristics, and elastic modulus may also influence the concrete substructure and any microcracking, which may develop in the high-temperature, heat-curing process (Grattan-Bellew et al. 1998). There is little chance that any significant ASR-induced expansion is occurring using this testing regime as most, if not all, of the alkalies readily leach out from the bars to the limewater, thereby reducing pore solution pH, triggering DEF, but also reducing or eliminating ASR.
The PC-C1 cement also created the quickest expansions for the other two aggregates. F5 aggregate provides the next quickest expansion with both Type I cements; however, the corresponding Type III produces a greater ultimate expansion. The F7 aggregate produced a quicker onset with PC-BIII compared to PC-BI. The same aggregate with PC-AI and PC-AIII begin their expansion at the same time; however, the PC-AIII provides a larger ultimate expansion.
The sole Type V cement used throughout this study showed very little, if any, DEF-induced expansion for any of the aggregates used in this series or for any of the curing temperatures evaluated. Figure 7.10 shows the Type V cement with the three aggregates, illustrating that at 1,200 days there is no expansion occurring.
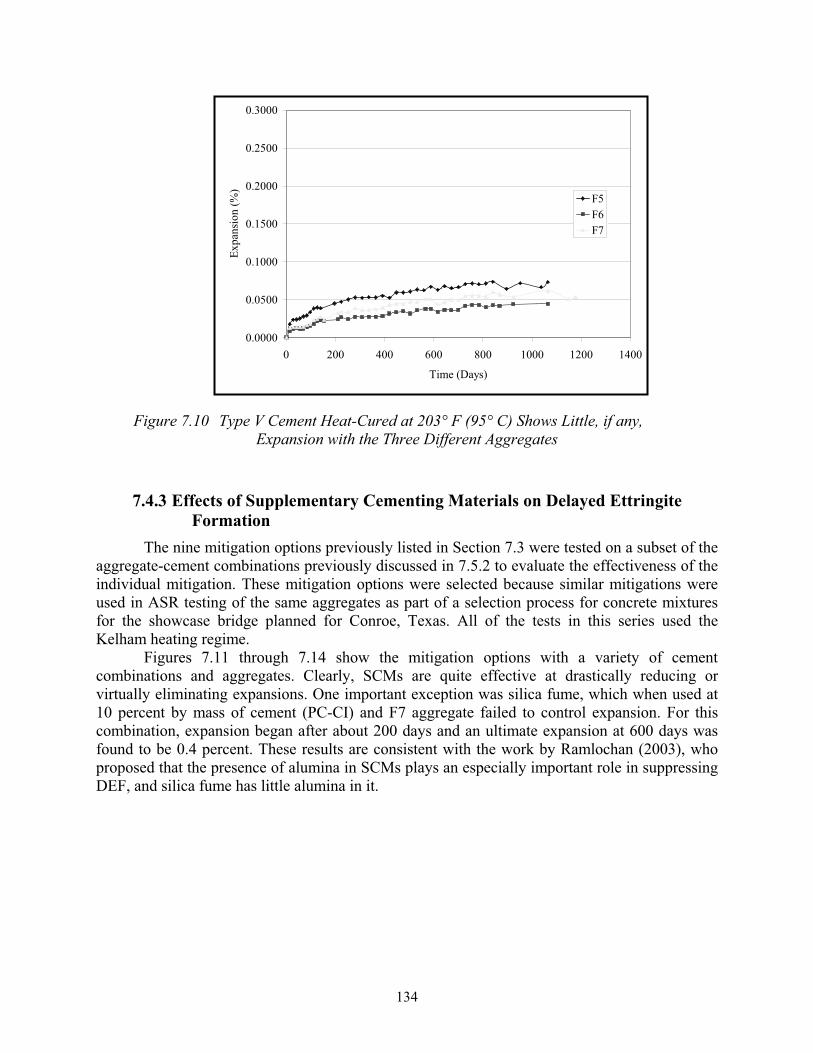
134
0.0000
0.0500
0.1000
0.1500
0.2000
0.2500
0.3000
0 200 400 600 800 1000 1200 1400
Time (Days)
Expa
nsio
n (%
)
F5F6F7
Figure 7.10 Type V Cement Heat-Cured at 203° F (95° C) Shows Little, if any, Expansion with the Three Different Aggregates
7.4.3 Effects of Supplementary Cementing Materials on Delayed Ettringite Formation
The nine mitigation options previously listed in Section 7.3 were tested on a subset of the aggregate-cement combinations previously discussed in 7.5.2 to evaluate the effectiveness of the individual mitigation. These mitigation options were selected because similar mitigations were used in ASR testing of the same aggregates as part of a selection process for concrete mixtures for the showcase bridge planned for Conroe, Texas. All of the tests in this series used the Kelham heating regime.
Figures 7.11 through 7.14 show the mitigation options with a variety of cement combinations and aggregates. Clearly, SCMs are quite effective at drastically reducing or virtually eliminating expansions. One important exception was silica fume, which when used at 10 percent by mass of cement (PC-CI) and F7 aggregate failed to control expansion. For this combination, expansion began after about 200 days and an ultimate expansion at 600 days was found to be 0.4 percent. These results are consistent with the work by Ramlochan (2003), who proposed that the presence of alumina in SCMs plays an especially important role in suppressing DEF, and silica fume has little alumina in it.
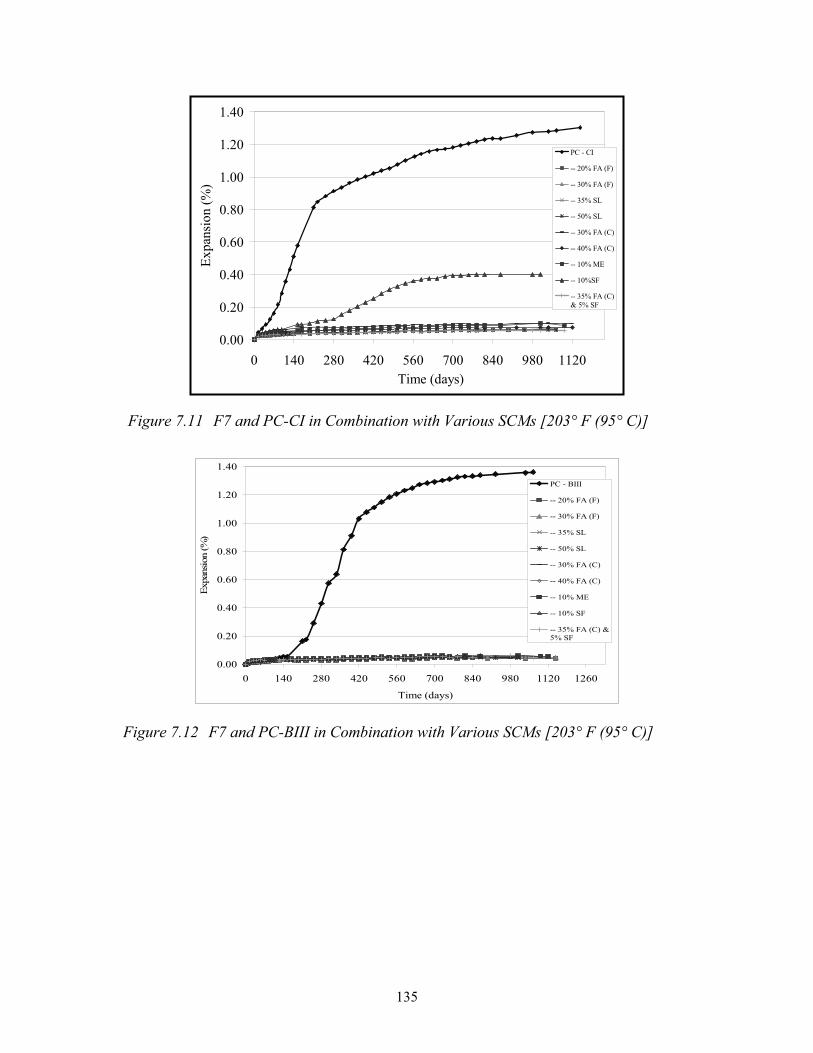
135
0.00
0.20
0.40
0.60
0.80
1.00
1.20
1.40
0 140 280 420 560 700 840 980 1120 Time (days)
Expa
nsio
n (%
)
PC - CI
-- 20% FA (F)
-- 30% FA (F)
-- 35% SL
-- 50% SL
-- 30% FA (C)
-- 40% FA (C)
-- 10% ME
-- 10%SF
-- 35% FA (C)& 5% SF
Figure 7.11 F7 and PC-CI in Combination with Various SCMs [203° F (95° C)]
0.00
0.20
0.40
0.60
0.80
1.00
1.20
1.40
0 140 280 420 560 700 840 980 1120 1260
Time (days)
Expa
nsio
n (%
)
PC - BIII
-- 20% FA (F)
-- 30% FA (F)
-- 35% SL
-- 50% SL
-- 30% FA (C)
-- 40% FA (C)
-- 10% ME
-- 10% SF
-- 35% FA (C) &5% SF
Figure 7.12 F7 and PC-BIII in Combination with Various SCMs [203° F (95° C)]
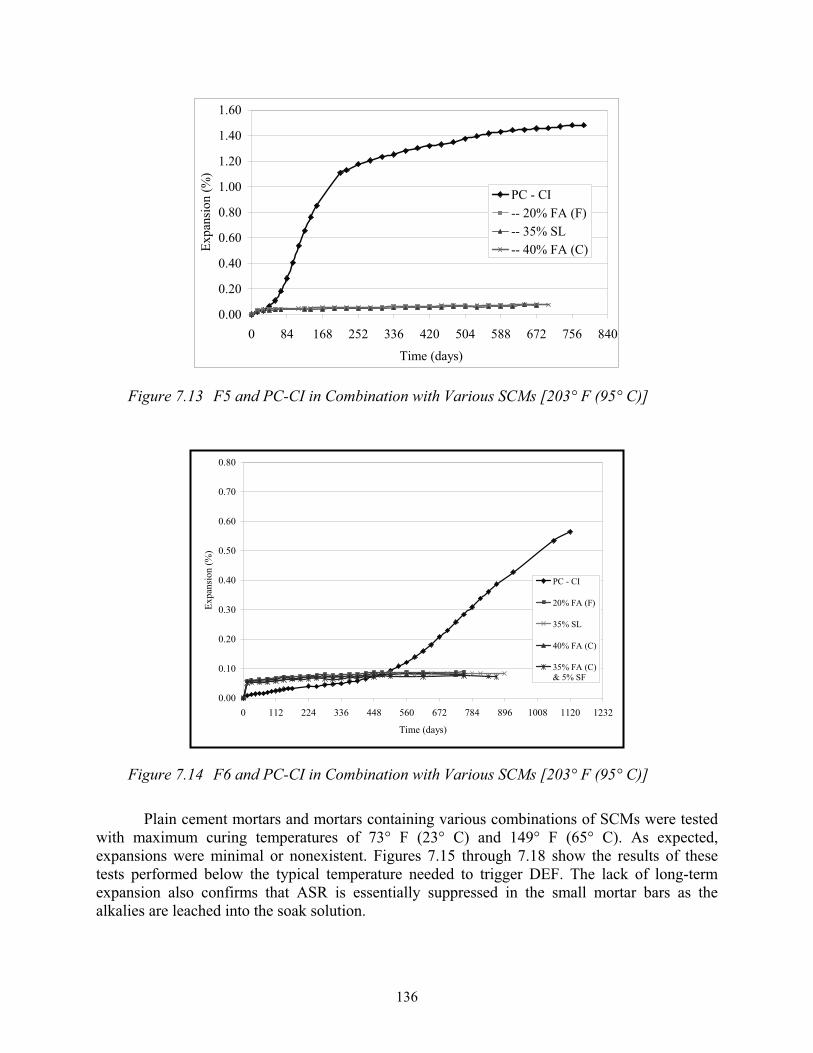
136
0.00
0.20
0.40
0.60
0.80
1.00
1.20
1.40
1.60
0 84 168 252 336 420 504 588 672 756 840
Time (days)
Expa
nsio
n (%
)PC - CI-- 20% FA (F)-- 35% SL-- 40% FA (C)
Figure 7.13 F5 and PC-CI in Combination with Various SCMs [203° F (95° C)]
0.00
0.10
0.20
0.30
0.40
0.50
0.60
0.70
0.80
0 112 224 336 448 560 672 784 896 1008 1120 1232
Time (days)
Expa
nsio
n (%
)
PC - CI
20% FA (F)
35% SL
40% FA (C)
35% FA (C)& 5% SF
Figure 7.14 F6 and PC-CI in Combination with Various SCMs [203° F (95° C)]
Plain cement mortars and mortars containing various combinations of SCMs were tested with maximum curing temperatures of 73° F (23° C) and 149° F (65° C). As expected, expansions were minimal or nonexistent. Figures 7.15 through 7.18 show the results of these tests performed below the typical temperature needed to trigger DEF. The lack of long-term expansion also confirms that ASR is essentially suppressed in the small mortar bars as the alkalies are leached into the soak solution.
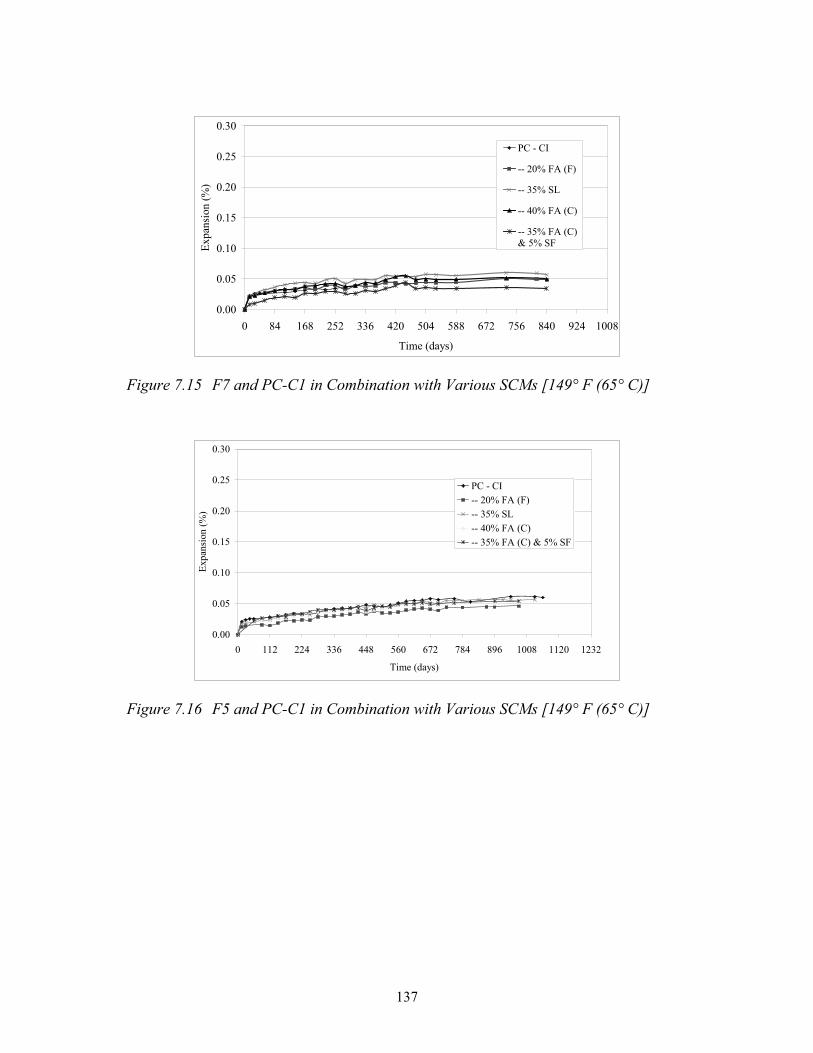
137
0.00
0.05
0.10
0.15
0.20
0.25
0.30
0 84 168 252 336 420 504 588 672 756 840 924 1008
Time (days)
Expa
nsio
n (%
)
PC - CI
-- 20% FA (F)
-- 35% SL
-- 40% FA (C)
-- 35% FA (C)& 5% SF
Figure 7.15 F7 and PC-C1 in Combination with Various SCMs [149° F (65° C)]
0.00
0.05
0.10
0.15
0.20
0.25
0.30
0 112 224 336 448 560 672 784 896 1008 1120 1232
Time (days)
Expa
nsio
n (%
)
PC - CI-- 20% FA (F)-- 35% SL-- 40% FA (C)-- 35% FA (C) & 5% SF
Figure 7.16 F5 and PC-C1 in Combination with Various SCMs [149° F (65° C)]
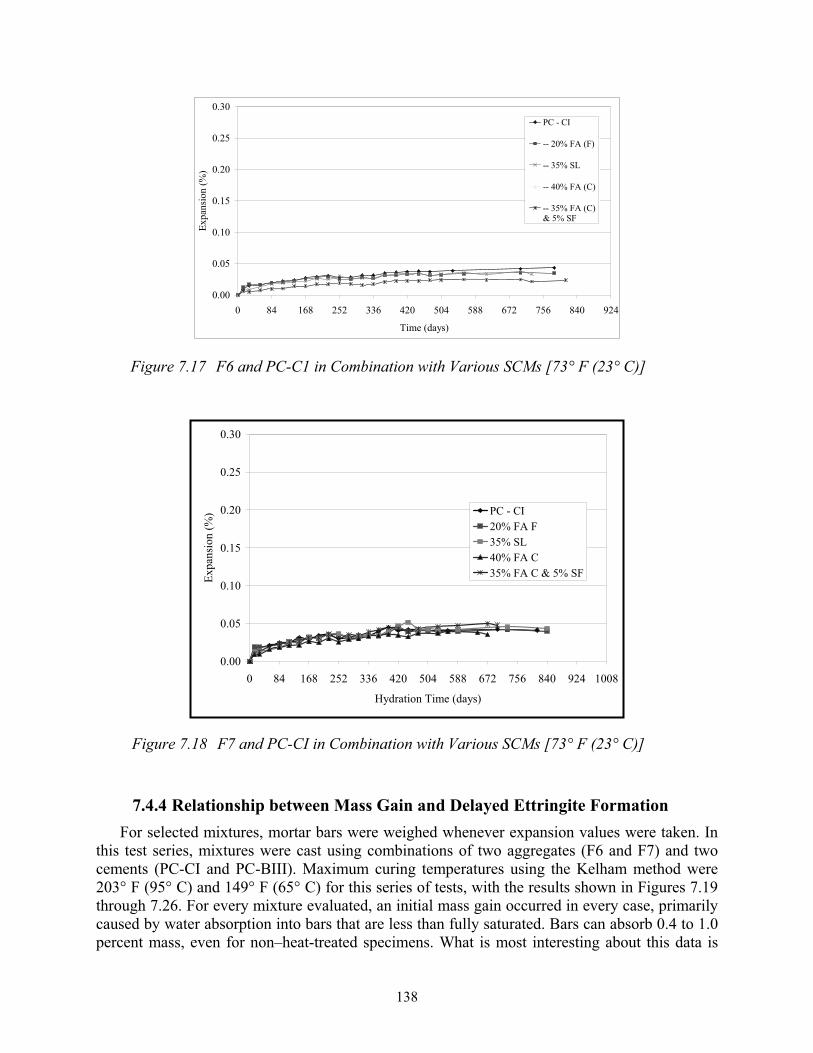
138
0.00
0.05
0.10
0.15
0.20
0.25
0.30
0 84 168 252 336 420 504 588 672 756 840 924
Time (days)
Expa
nsio
n (%
)
PC - CI
-- 20% FA (F)
-- 35% SL
-- 40% FA (C)
-- 35% FA (C)& 5% SF
Figure 7.17 F6 and PC-C1 in Combination with Various SCMs [73° F (23° C)]
0.00
0.05
0.10
0.15
0.20
0.25
0.30
0 84 168 252 336 420 504 588 672 756 840 924 1008
Hydration Time (days)
Expa
nsio
n (%
) PC - CI20% FA F35% SL40% FA C35% FA C & 5% SF
Figure 7.18 F7 and PC-CI in Combination with Various SCMs [73° F (23° C)]
7.4.4 Relationship between Mass Gain and Delayed Ettringite Formation For selected mixtures, mortar bars were weighed whenever expansion values were taken. In
this test series, mixtures were cast using combinations of two aggregates (F6 and F7) and two cements (PC-CI and PC-BIII). Maximum curing temperatures using the Kelham method were 203° F (95° C) and 149° F (65° C) for this series of tests, with the results shown in Figures 7.19 through 7.26. For every mixture evaluated, an initial mass gain occurred in every case, primarily caused by water absorption into bars that are less than fully saturated. Bars can absorb 0.4 to 1.0 percent mass, even for non–heat-treated specimens. What is most interesting about this data is
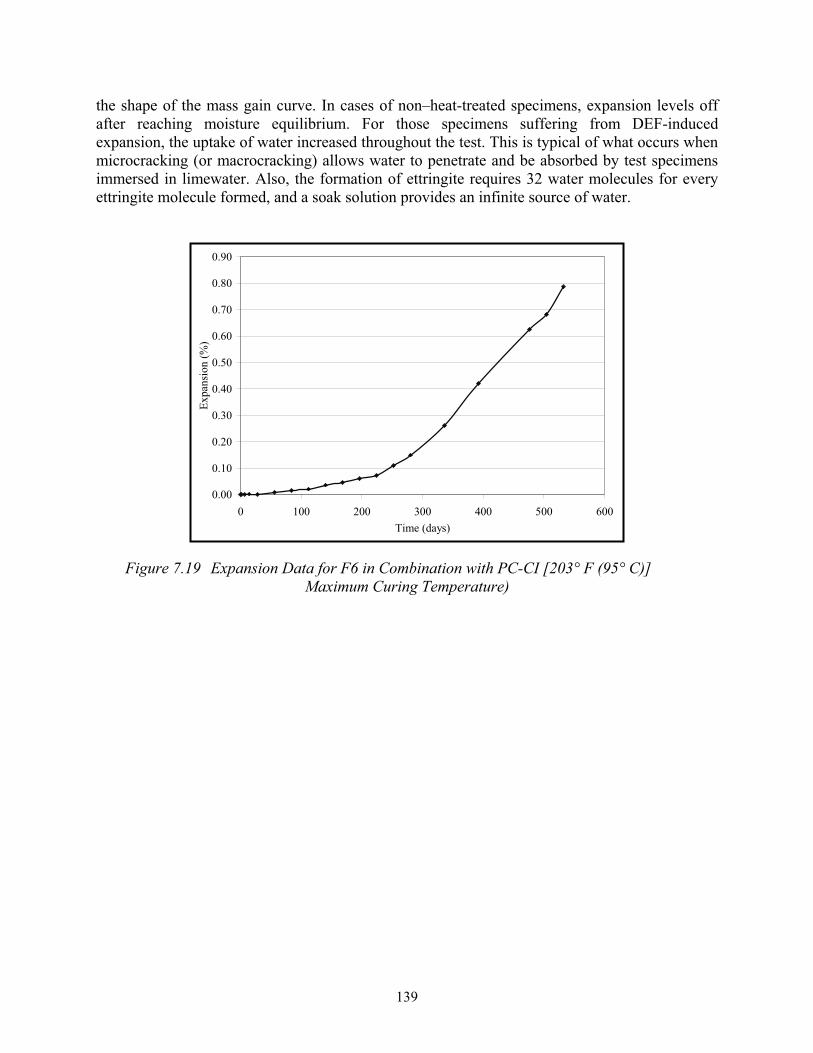
139
the shape of the mass gain curve. In cases of non–heat-treated specimens, expansion levels off after reaching moisture equilibrium. For those specimens suffering from DEF-induced expansion, the uptake of water increased throughout the test. This is typical of what occurs when microcracking (or macrocracking) allows water to penetrate and be absorbed by test specimens immersed in limewater. Also, the formation of ettringite requires 32 water molecules for every ettringite molecule formed, and a soak solution provides an infinite source of water.
0.00
0.10
0.20
0.30
0.40
0.50
0.60
0.70
0.80
0.90
0 100 200 300 400 500 600Time (days)
Expa
nsio
n (%
)
Figure 7.19 Expansion Data for F6 in Combination with PC-CI [203° F (95° C)] Maximum Curing Temperature)
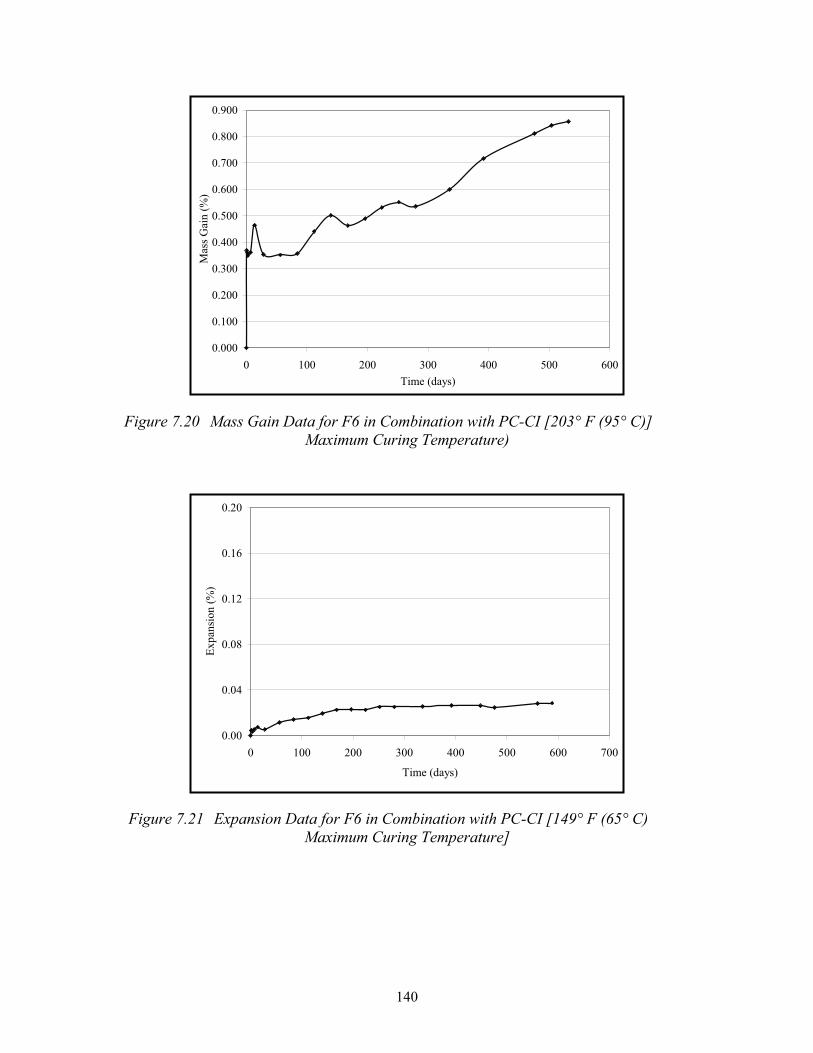
140
0.000
0.100
0.200
0.300
0.400
0.500
0.600
0.700
0.800
0.900
0 100 200 300 400 500 600Time (days)
Mas
s Gai
n (%
)
Figure 7.20 Mass Gain Data for F6 in Combination with PC-CI [203° F (95° C)] Maximum Curing Temperature)
0.00
0.04
0.08
0.12
0.16
0.20
0 100 200 300 400 500 600 700
Time (days)
Expa
nsio
n (%
)
Figure 7.21 Expansion Data for F6 in Combination with PC-CI [149° F (65° C) Maximum Curing Temperature]
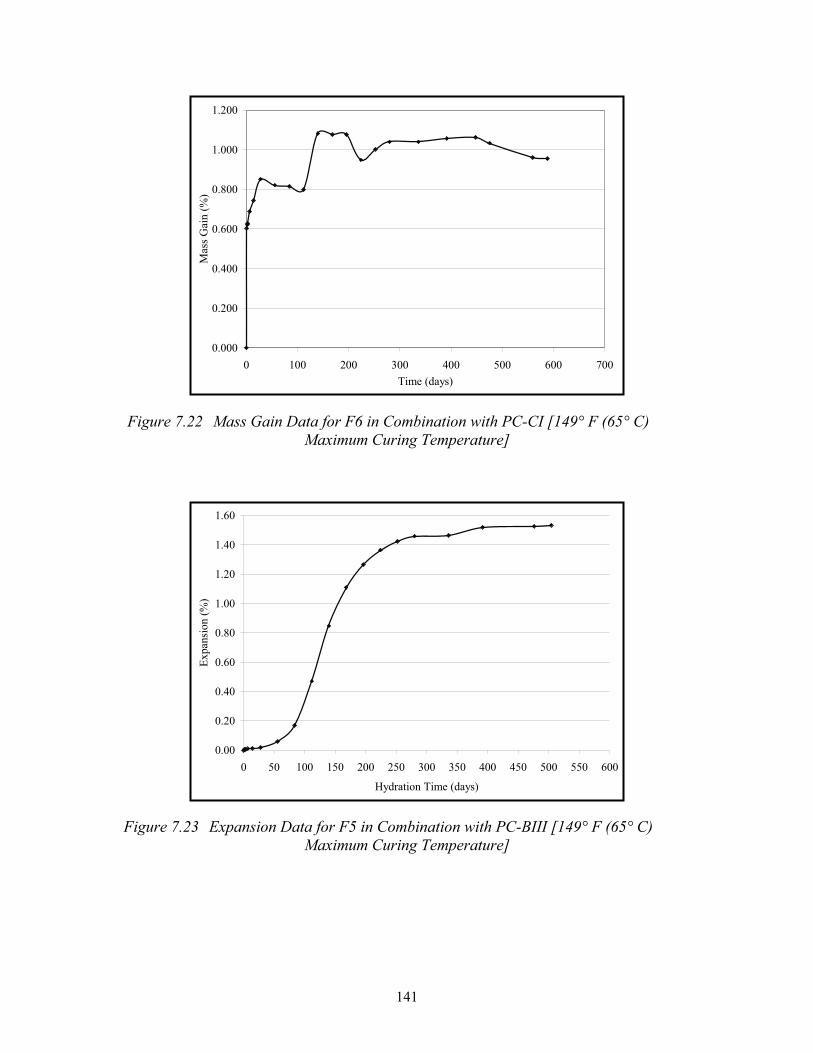
141
0.000
0.200
0.400
0.600
0.800
1.000
1.200
0 100 200 300 400 500 600 700Time (days)
Mas
s Gai
n (%
)
Figure 7.22 Mass Gain Data for F6 in Combination with PC-CI [149° F (65° C) Maximum Curing Temperature]
0.00
0.20
0.40
0.60
0.80
1.00
1.20
1.40
1.60
0 50 100 150 200 250 300 350 400 450 500 550 600
Hydration Time (days)
Expa
nsio
n (%
)
Figure 7.23 Expansion Data for F5 in Combination with PC-BIII [149° F (65° C)Maximum Curing Temperature]
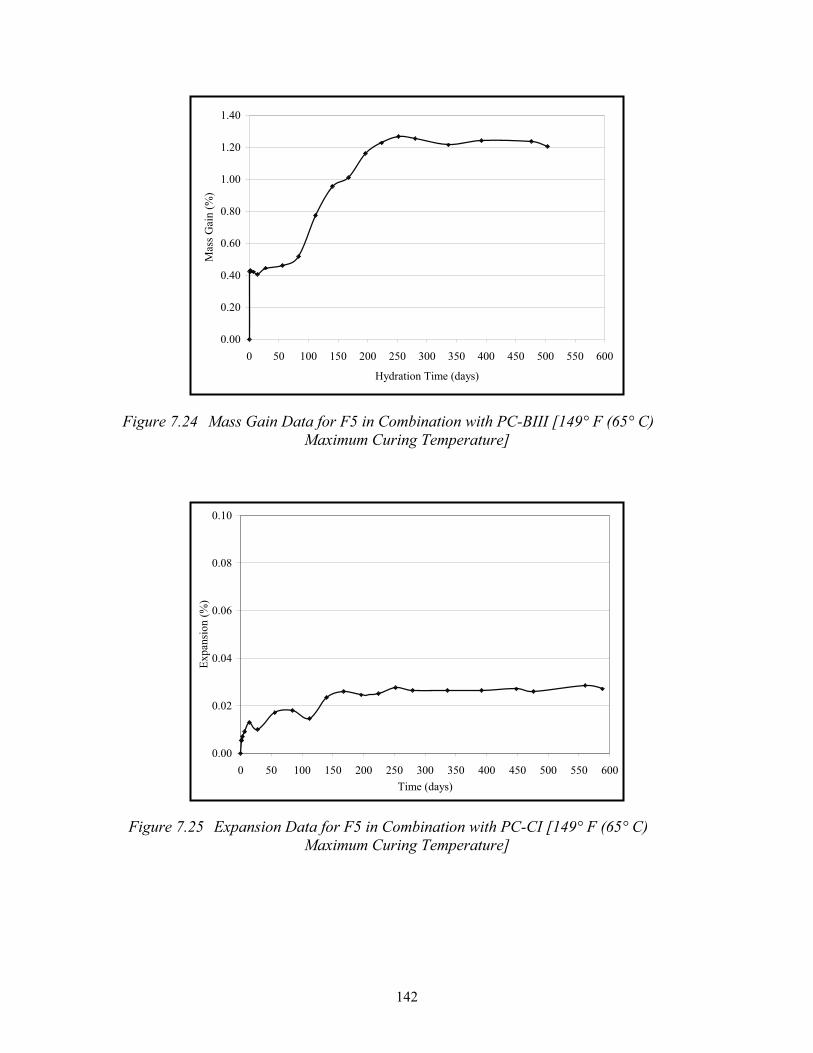
142
0.00
0.20
0.40
0.60
0.80
1.00
1.20
1.40
0 50 100 150 200 250 300 350 400 450 500 550 600
Hydration Time (days)
Mas
s Gai
n (%
)
Figure 7.24 Mass Gain Data for F5 in Combination with PC-BIII [149° F (65° C)Maximum Curing Temperature]
0.00
0.02
0.04
0.06
0.08
0.10
0 50 100 150 200 250 300 350 400 450 500 550 600Time (days)
Expa
nsio
n (%
)
Figure 7.25 Expansion Data for F5 in Combination with PC-CI [149° F (65° C) Maximum Curing Temperature]
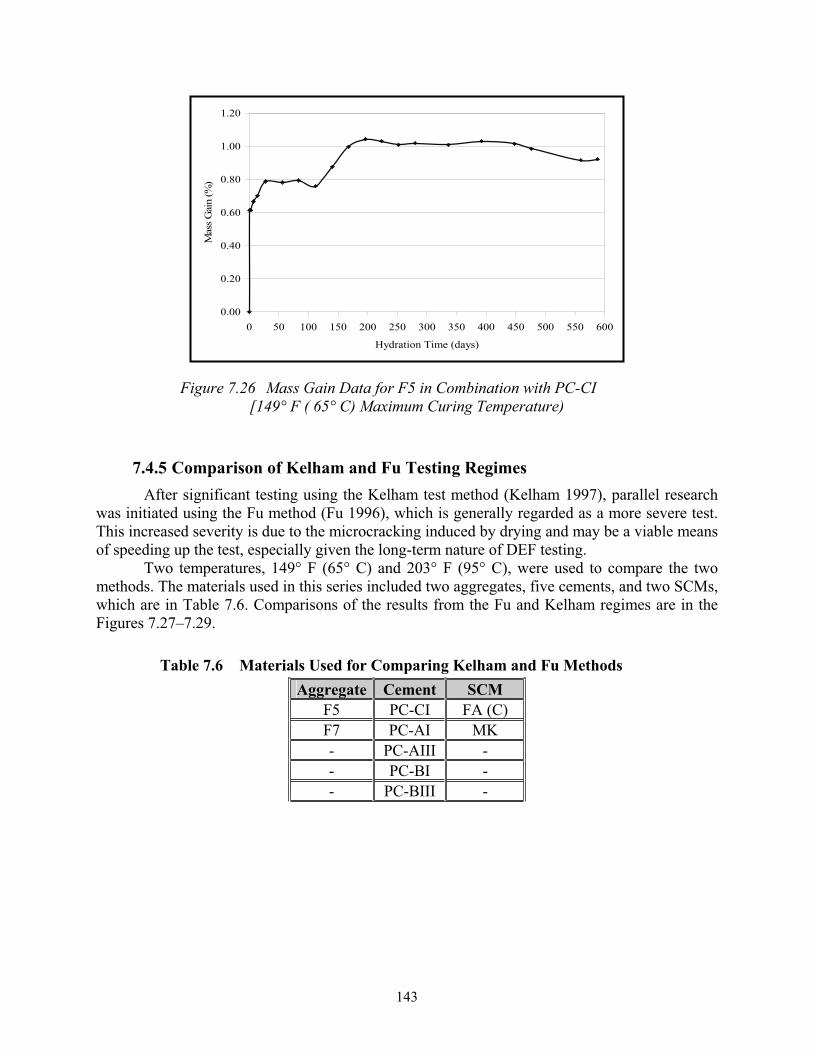
143
0.00
0.20
0.40
0.60
0.80
1.00
1.20
0 50 100 150 200 250 300 350 400 450 500 550 600
Hydration Time (days)
Mas
s Gai
n (%
)
Figure 7.26 Mass Gain Data for F5 in Combination with PC-CI [149° F ( 65° C) Maximum Curing Temperature)
7.4.5 Comparison of Kelham and Fu Testing Regimes After significant testing using the Kelham test method (Kelham 1997), parallel research
was initiated using the Fu method (Fu 1996), which is generally regarded as a more severe test. This increased severity is due to the microcracking induced by drying and may be a viable means of speeding up the test, especially given the long-term nature of DEF testing.
Two temperatures, 149° F (65° C) and 203° F (95° C), were used to compare the two methods. The materials used in this series included two aggregates, five cements, and two SCMs, which are in Table 7.6. Comparisons of the results from the Fu and Kelham regimes are in the Figures 7.27–7.29.
Table 7.6 Materials Used for Comparing Kelham and Fu Methods Aggregate Cement SCM
F5 PC-CI FA (C) F7 PC-AI MK - PC-AIII - - PC-BI - - PC-BIII -
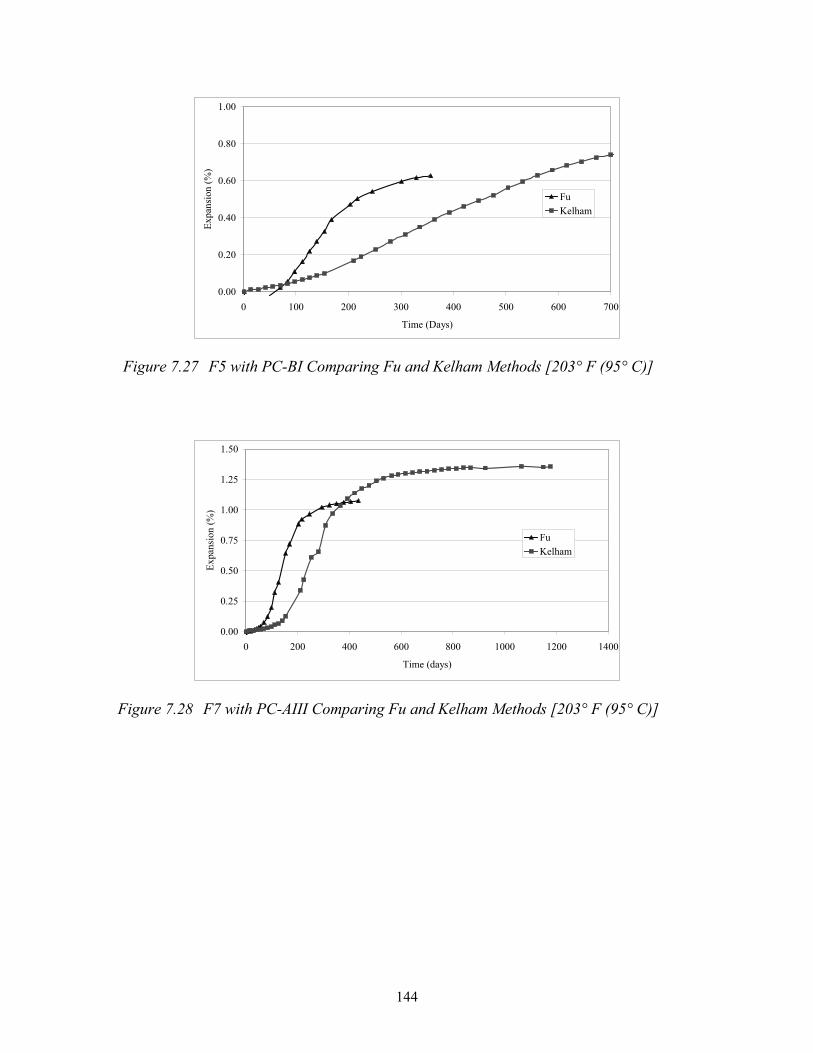
144
0.00
0.20
0.40
0.60
0.80
1.00
0 100 200 300 400 500 600 700
Time (Days)
Expa
nsio
n (%
)FuKelham
Figure 7.27 F5 with PC-BI Comparing Fu and Kelham Methods [203° F (95° C)]
0.00
0.25
0.50
0.75
1.00
1.25
1.50
0 200 400 600 800 1000 1200 1400
Time (days)
Expa
nsio
n (%
)
FuKelham
Figure 7.28 F7 with PC-AIII Comparing Fu and Kelham Methods [203° F (95° C)]
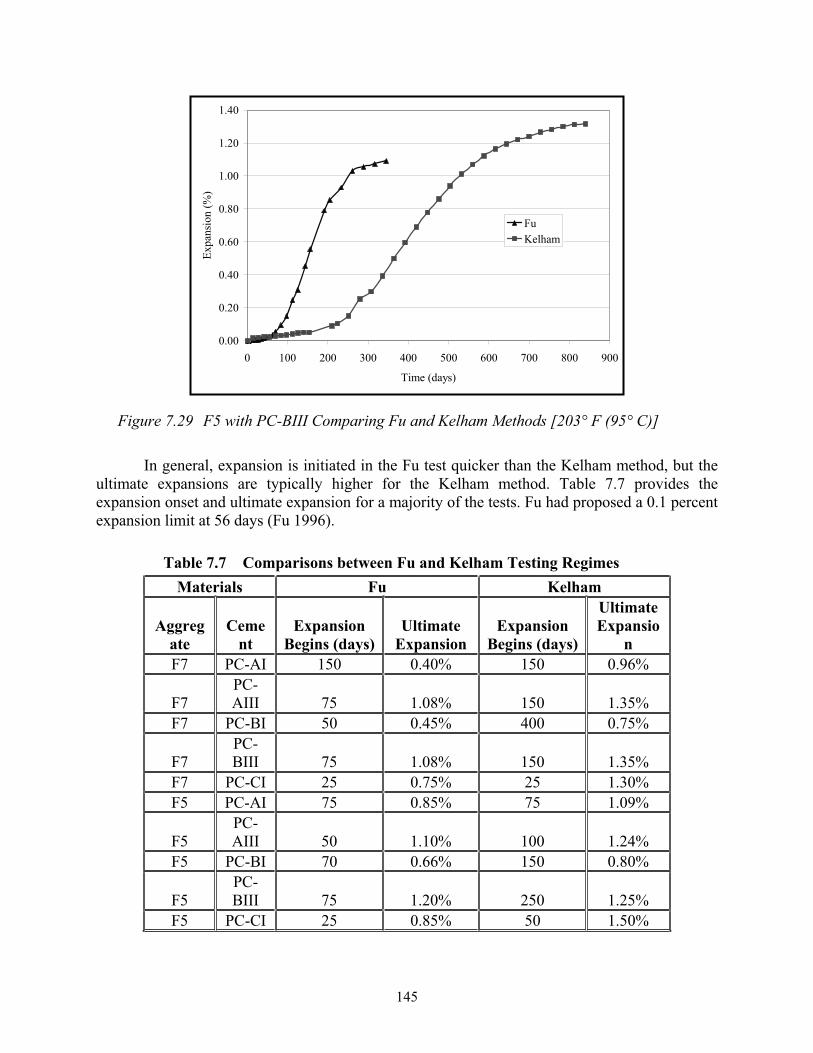
145
0.00
0.20
0.40
0.60
0.80
1.00
1.20
1.40
0 100 200 300 400 500 600 700 800 900
Time (days)
Expa
nsio
n (%
)FuKelham
Figure 7.29 F5 with PC-BIII Comparing Fu and Kelham Methods [203° F (95° C)]
In general, expansion is initiated in the Fu test quicker than the Kelham method, but the ultimate expansions are typically higher for the Kelham method. Table 7.7 provides the expansion onset and ultimate expansion for a majority of the tests. Fu had proposed a 0.1 percent expansion limit at 56 days (Fu 1996).
Table 7.7 Comparisons between Fu and Kelham Testing Regimes Materials Fu Kelham
Aggregate
Cement
ExpansionBegins (days)
Ultimate Expansion
ExpansionBegins (days)
Ultimate Expansio
nF7 PC-AI 150 0.40% 150 0.96%
F7PC-AIII 75 1.08% 150 1.35%
F7 PC-BI 50 0.45% 400 0.75%
F7PC-BIII 75 1.08% 150 1.35%
F7 PC-CI 25 0.75% 25 1.30% F5 PC-AI 75 0.85% 75 1.09%
F5PC-AIII 50 1.10% 100 1.24%
F5 PC-BI 70 0.66% 150 0.80%
F5PC-BIII 75 1.20% 250 1.25%
F5 PC-CI 25 0.85% 50 1.50%
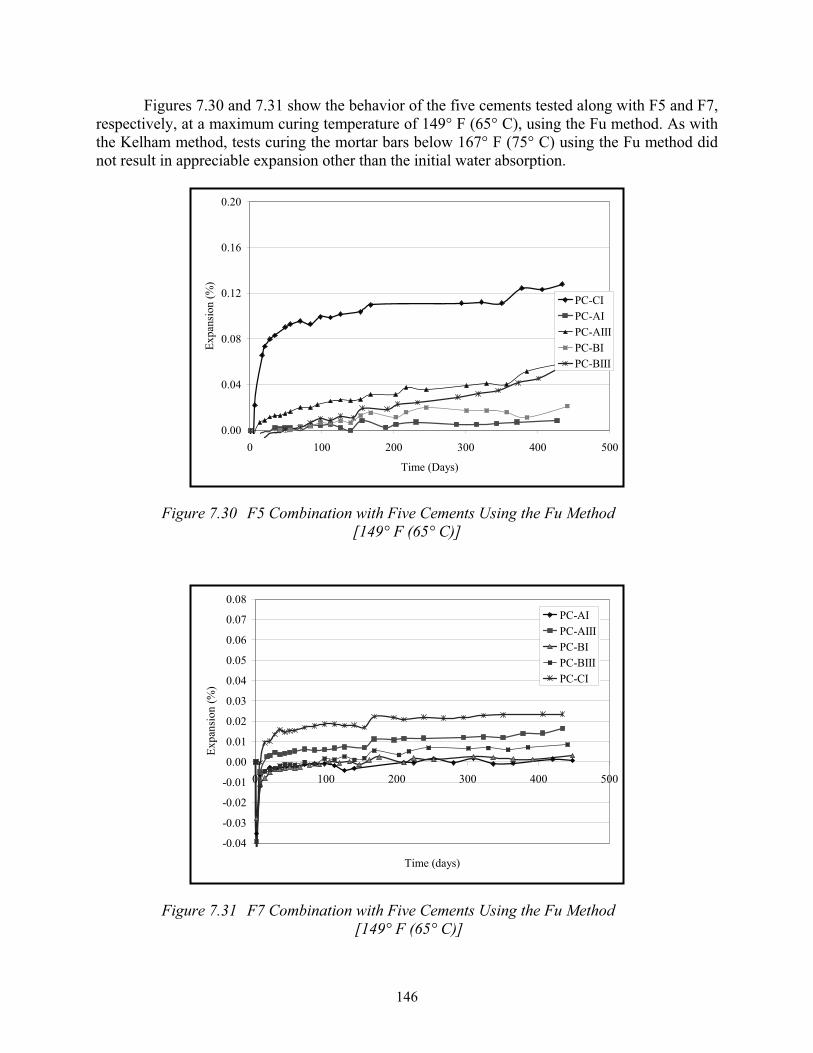
146
Figures 7.30 and 7.31 show the behavior of the five cements tested along with F5 and F7, respectively, at a maximum curing temperature of 149° F (65° C), using the Fu method. As with the Kelham method, tests curing the mortar bars below 167° F (75° C) using the Fu method did not result in appreciable expansion other than the initial water absorption.
0.00
0.04
0.08
0.12
0.16
0.20
0 100 200 300 400 500
Time (Days)
Expa
nsio
n (%
)
PC-CIPC-AIPC-AIIIPC-BIPC-BIII
Figure 7.30 F5 Combination with Five Cements Using the Fu Method[149° F (65° C)]
-0.04
-0.03
-0.02
-0.01
0.00
0.01
0.02
0.03
0.04
0.05
0.06
0.07
0.08
0 100 200 300 400 500
Time (days)
Expa
nsio
n (%
)
PC-AIPC-AIIIPC-BIPC-BIIIPC-CI
Figure 7.31 F7 Combination with Five Cements Using the Fu Method [149° F (65° C)]
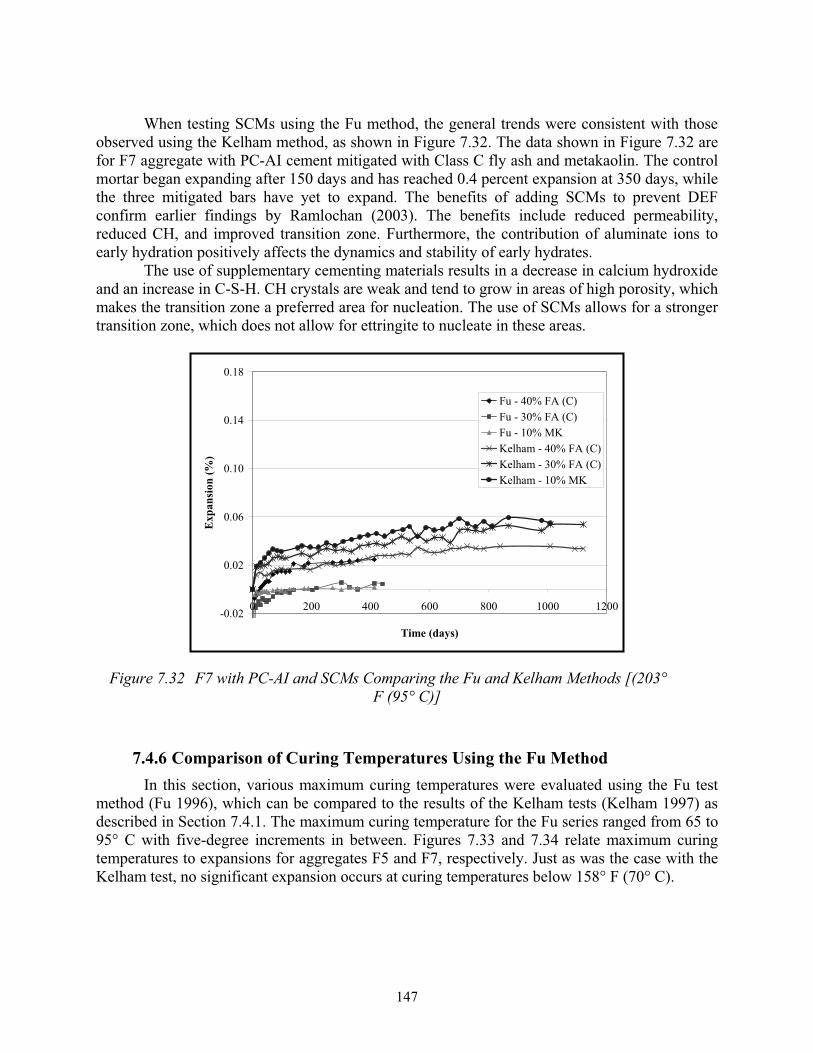
147
When testing SCMs using the Fu method, the general trends were consistent with those observed using the Kelham method, as shown in Figure 7.32. The data shown in Figure 7.32 are for F7 aggregate with PC-AI cement mitigated with Class C fly ash and metakaolin. The control mortar began expanding after 150 days and has reached 0.4 percent expansion at 350 days, while the three mitigated bars have yet to expand. The benefits of adding SCMs to prevent DEF confirm earlier findings by Ramlochan (2003). The benefits include reduced permeability, reduced CH, and improved transition zone. Furthermore, the contribution of aluminate ions to early hydration positively affects the dynamics and stability of early hydrates.
The use of supplementary cementing materials results in a decrease in calcium hydroxide and an increase in C-S-H. CH crystals are weak and tend to grow in areas of high porosity, which makes the transition zone a preferred area for nucleation. The use of SCMs allows for a stronger transition zone, which does not allow for ettringite to nucleate in these areas.
-0.02
0.02
0.06
0.10
0.14
0.18
0 200 400 600 800 1000 1200
Time (days)
Exp
ansi
on (%
)
Fu - 40% FA (C)Fu - 30% FA (C)Fu - 10% MKKelham - 40% FA (C)Kelham - 30% FA (C)Kelham - 10% MK
Figure 7.32 F7 with PC-AI and SCMs Comparing the Fu and Kelham Methods [(203° F (95° C)]
7.4.6 Comparison of Curing Temperatures Using the Fu Method In this section, various maximum curing temperatures were evaluated using the Fu test
method (Fu 1996), which can be compared to the results of the Kelham tests (Kelham 1997) as described in Section 7.4.1. The maximum curing temperature for the Fu series ranged from 65 to 95° C with five-degree increments in between. Figures 7.33 and 7.34 relate maximum curing temperatures to expansions for aggregates F5 and F7, respectively. Just as was the case with the Kelham test, no significant expansion occurs at curing temperatures below 158° F (70° C).
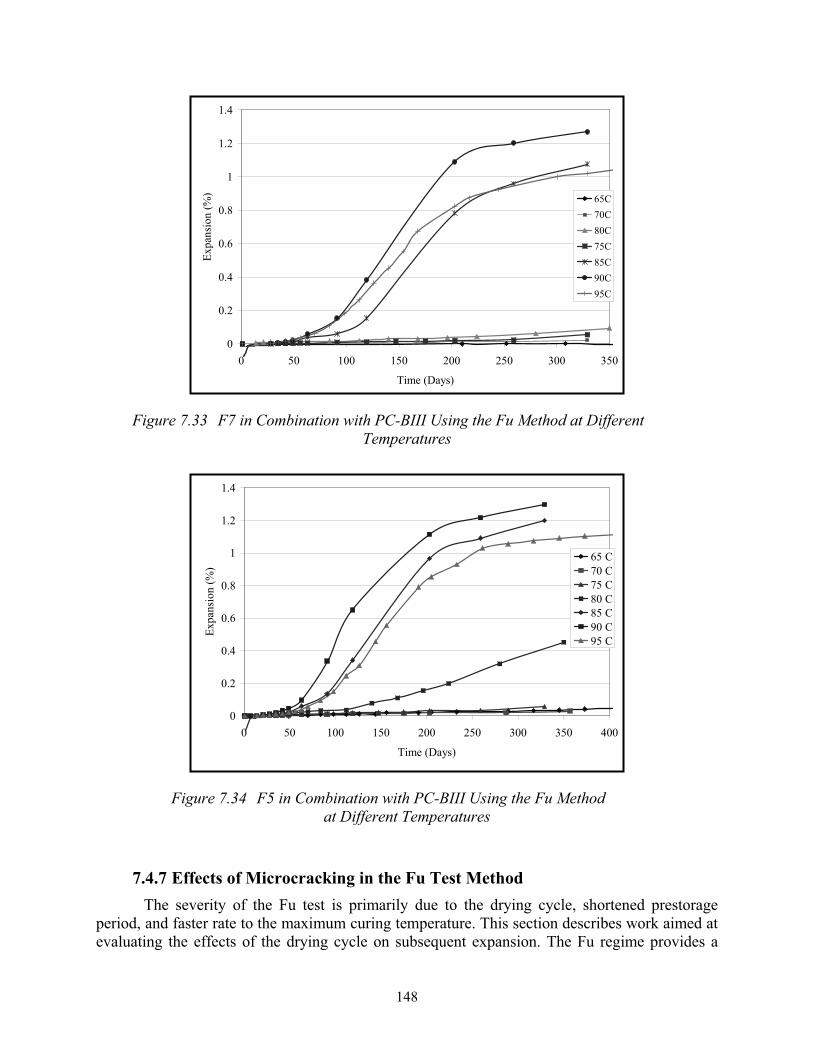
148
0
0.2
0.4
0.6
0.8
1
1.2
1.4
0 50 100 150 200 250 300 350
Time (Days)
Expa
nsio
n (%
) 65C70C80C75C85C90C95C
Figure 7.33 F7 in Combination with PC-BIII Using the Fu Method at Different Temperatures
0
0.2
0.4
0.6
0.8
1
1.2
1.4
0 50 100 150 200 250 300 350 400
Time (Days)
Expa
nsio
n (%
)
65 C70 C75 C80 C85 C90 C95 C
Figure 7.34 F5 in Combination with PC-BIII Using the Fu Method at Different Temperatures
7.4.7 Effects of Microcracking in the Fu Test Method The severity of the Fu test is primarily due to the drying cycle, shortened prestorage
period, and faster rate to the maximum curing temperature. This section describes work aimed at evaluating the effects of the drying cycle on subsequent expansion. The Fu regime provides a
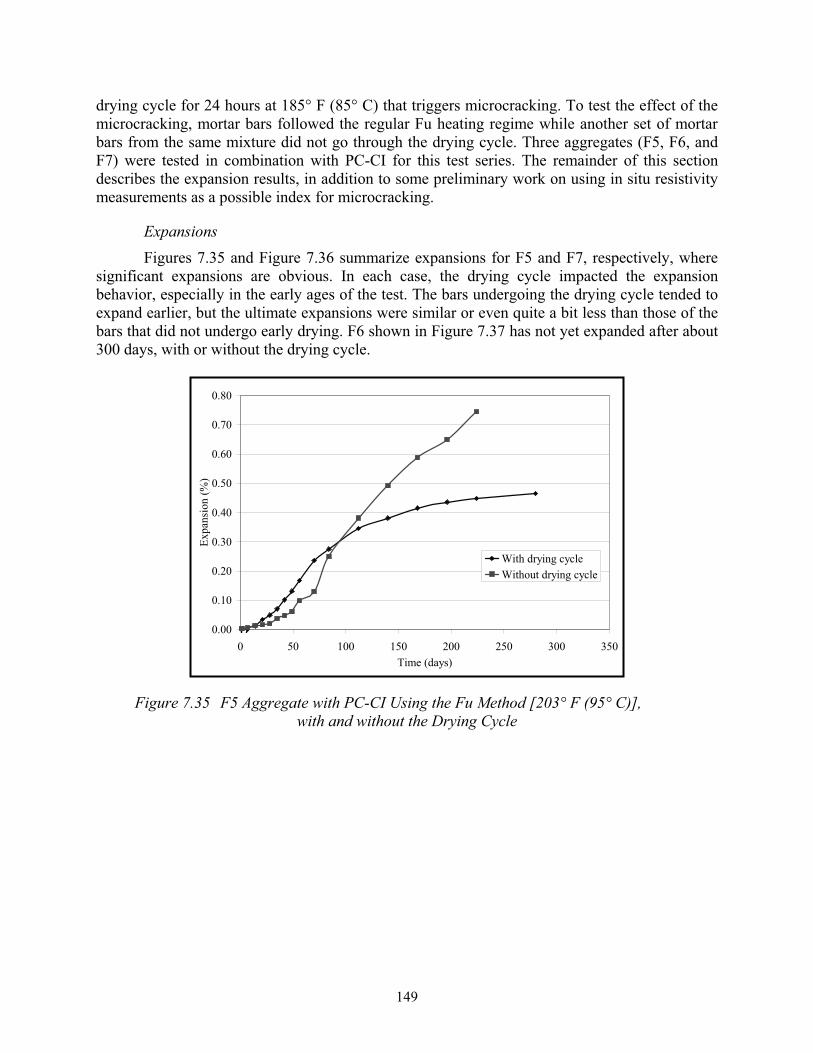
149
drying cycle for 24 hours at 185° F (85° C) that triggers microcracking. To test the effect of the microcracking, mortar bars followed the regular Fu heating regime while another set of mortar bars from the same mixture did not go through the drying cycle. Three aggregates (F5, F6, and F7) were tested in combination with PC-CI for this test series. The remainder of this section describes the expansion results, in addition to some preliminary work on using in situ resistivity measurements as a possible index for microcracking.
ExpansionsFigures 7.35 and Figure 7.36 summarize expansions for F5 and F7, respectively, where
significant expansions are obvious. In each case, the drying cycle impacted the expansion behavior, especially in the early ages of the test. The bars undergoing the drying cycle tended to expand earlier, but the ultimate expansions were similar or even quite a bit less than those of the bars that did not undergo early drying. F6 shown in Figure 7.37 has not yet expanded after about 300 days, with or without the drying cycle.
0.00
0.10
0.20
0.30
0.40
0.50
0.60
0.70
0.80
0 50 100 150 200 250 300 350Time (days)
Expa
nsio
n (%
)
With drying cycleWithout drying cycle
Figure 7.35 F5 Aggregate with PC-CI Using the Fu Method [203° F (95° C)], with and without the Drying Cycle
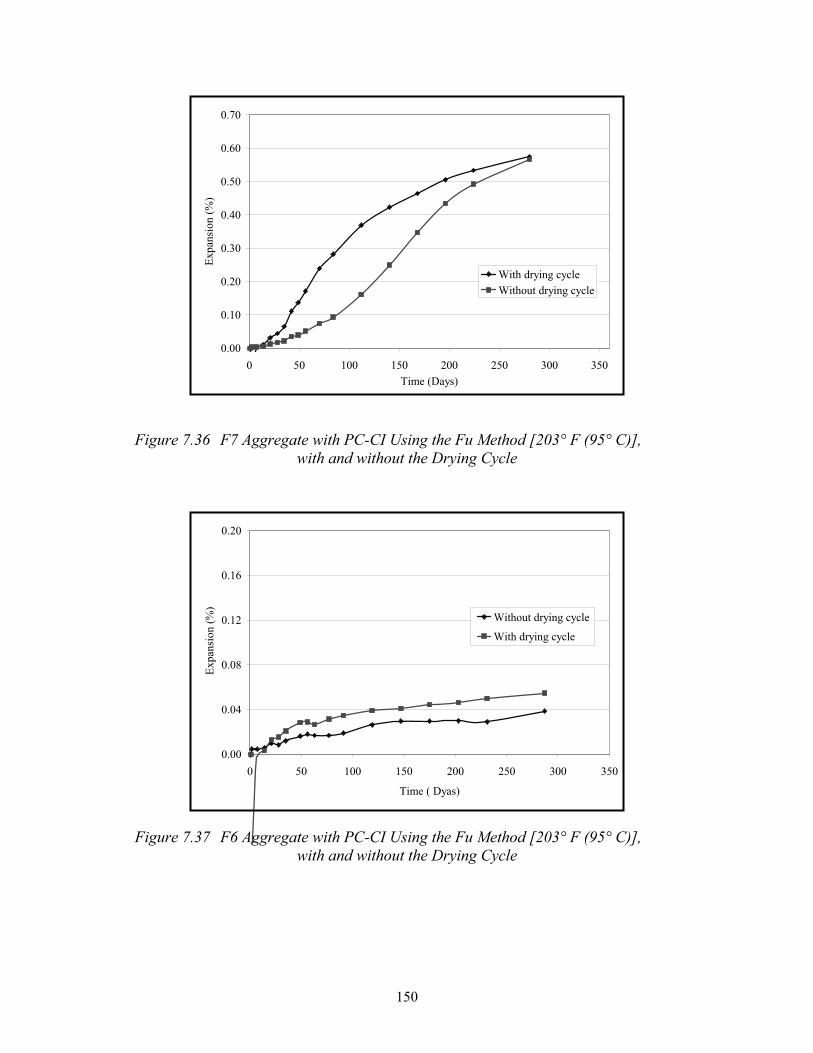
150
0.00
0.10
0.20
0.30
0.40
0.50
0.60
0.70
0 50 100 150 200 250 300 350Time (Days)
Expa
nsio
n (%
)
With drying cycleWithout drying cycle
Figure 7.36 F7 Aggregate with PC-CI Using the Fu Method [203° F (95° C)], with and without the Drying Cycle
0.00
0.04
0.08
0.12
0.16
0.20
0 50 100 150 200 250 300 350
Time ( Dyas)
Exp
ansi
on (%
)
Without drying cycle
With drying cycle
Figure 7.37 F6 Aggregate with PC-CI Using the Fu Method [203° F (95° C)], with and without the Drying Cycle
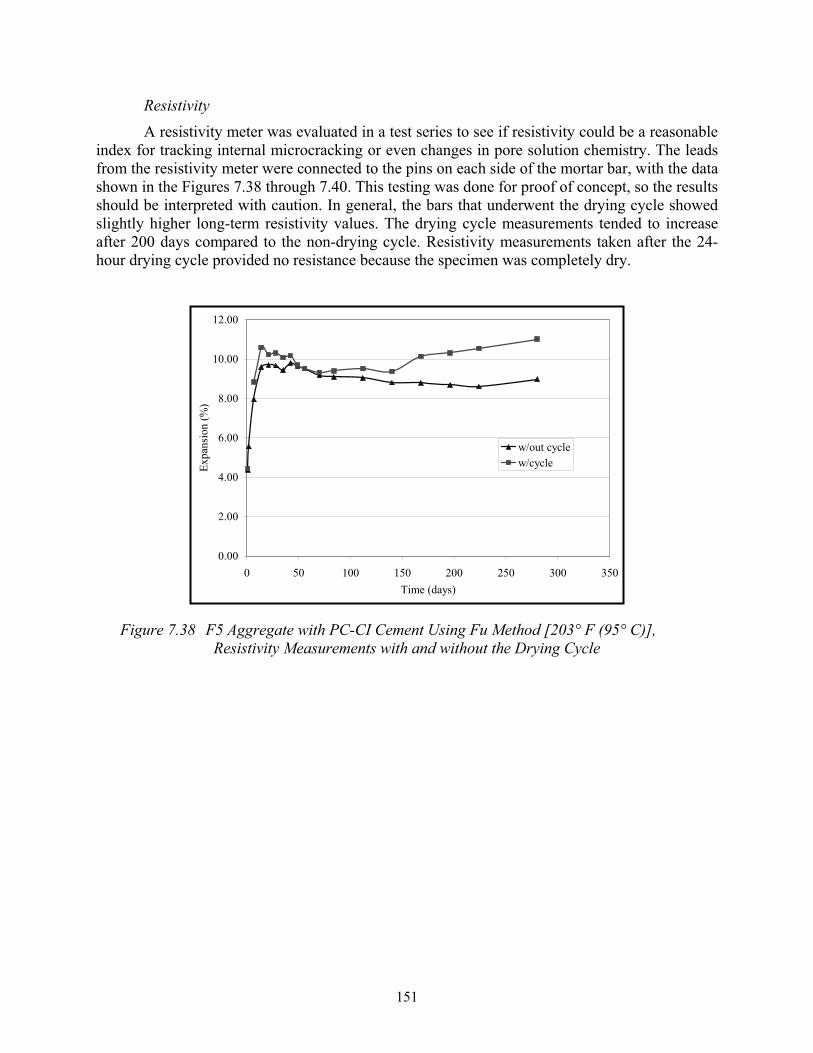
151
ResistivityA resistivity meter was evaluated in a test series to see if resistivity could be a reasonable
index for tracking internal microcracking or even changes in pore solution chemistry. The leads from the resistivity meter were connected to the pins on each side of the mortar bar, with the data shown in the Figures 7.38 through 7.40. This testing was done for proof of concept, so the results should be interpreted with caution. In general, the bars that underwent the drying cycle showed slightly higher long-term resistivity values. The drying cycle measurements tended to increase after 200 days compared to the non-drying cycle. Resistivity measurements taken after the 24-hour drying cycle provided no resistance because the specimen was completely dry.
0.00
2.00
4.00
6.00
8.00
10.00
12.00
0 50 100 150 200 250 300 350Time (days)
Expa
nsio
n (%
)
w/out cyclew/cycle
Figure 7.38 F5 Aggregate with PC-CI Cement Using Fu Method [203° F (95° C)], Resistivity Measurements with and without the Drying Cycle
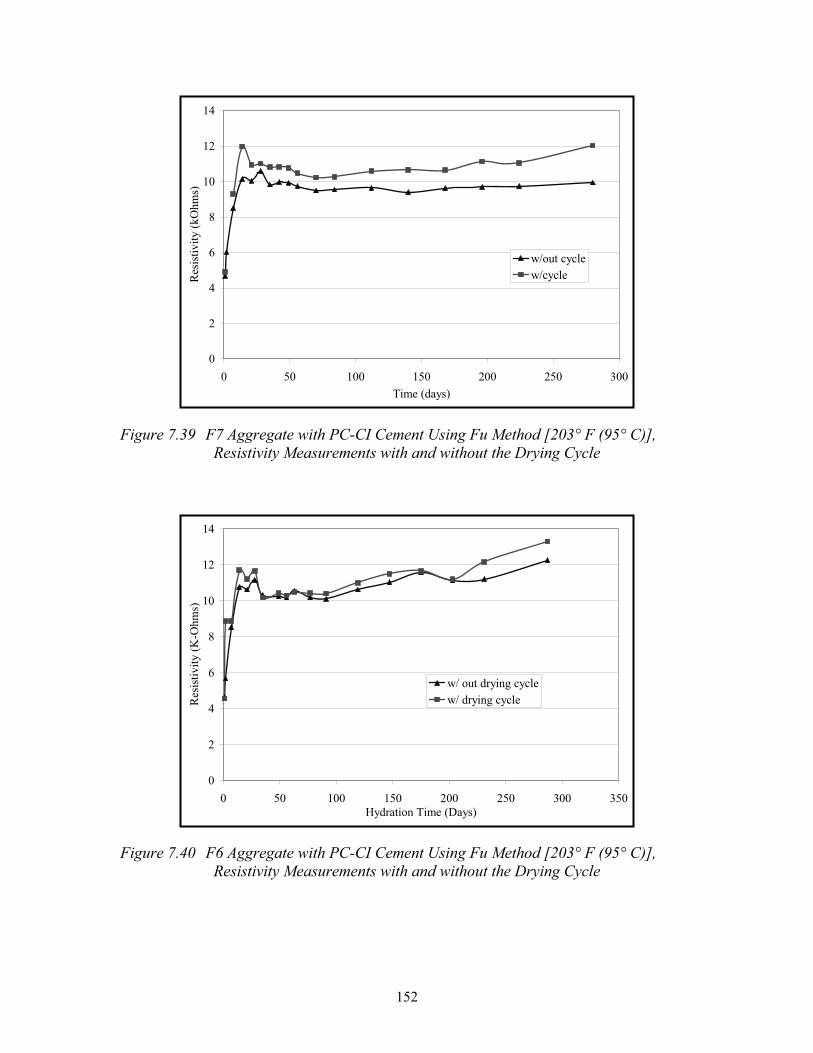
152
0
2
4
6
8
10
12
14
0 50 100 150 200 250 300Time (days)
Res
istiv
ity (k
Ohm
s)
w/out cyclew/cycle
Figure 7.39 F7 Aggregate with PC-CI Cement Using Fu Method [203° F (95° C)], Resistivity Measurements with and without the Drying Cycle
0
2
4
6
8
10
12
14
0 50 100 150 200 250 300 350Hydration Time (Days)
Res
istiv
ity (K
-Ohm
s)
w/ out drying cyclew/ drying cycle
Figure 7.40 F6 Aggregate with PC-CI Cement Using Fu Method [203° F (95° C)], Resistivity Measurements with and without the Drying Cycle
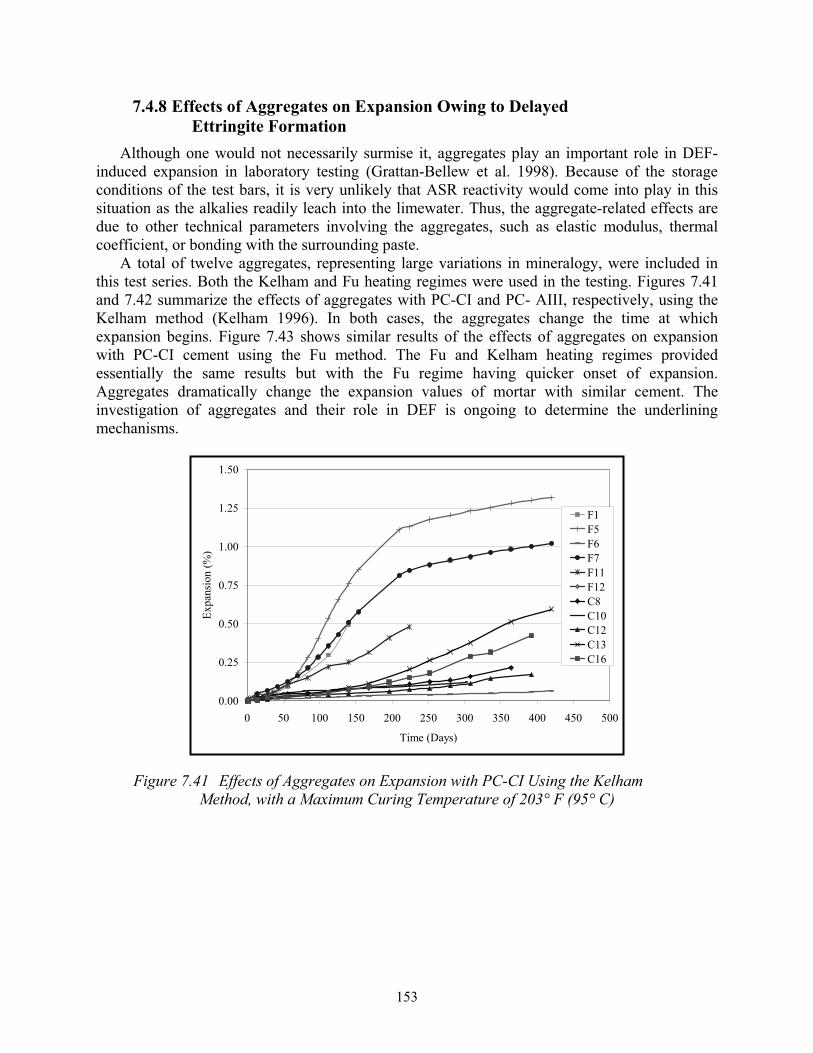
153
7.4.8 Effects of Aggregates on Expansion Owing to Delayed Ettringite Formation
Although one would not necessarily surmise it, aggregates play an important role in DEF-induced expansion in laboratory testing (Grattan-Bellew et al. 1998). Because of the storage conditions of the test bars, it is very unlikely that ASR reactivity would come into play in this situation as the alkalies readily leach into the limewater. Thus, the aggregate-related effects are due to other technical parameters involving the aggregates, such as elastic modulus, thermal coefficient, or bonding with the surrounding paste.
A total of twelve aggregates, representing large variations in mineralogy, were included in this test series. Both the Kelham and Fu heating regimes were used in the testing. Figures 7.41 and 7.42 summarize the effects of aggregates with PC-CI and PC- AIII, respectively, using the Kelham method (Kelham 1996). In both cases, the aggregates change the time at which expansion begins. Figure 7.43 shows similar results of the effects of aggregates on expansion with PC-CI cement using the Fu method. The Fu and Kelham heating regimes provided essentially the same results but with the Fu regime having quicker onset of expansion. Aggregates dramatically change the expansion values of mortar with similar cement. The investigation of aggregates and their role in DEF is ongoing to determine the underlining mechanisms.
0.00
0.25
0.50
0.75
1.00
1.25
1.50
0 50 100 150 200 250 300 350 400 450 500
Time (Days)
Expa
nsio
n (%
)
F1F5F6F7F11F12C8C10C12C13C16
Figure 7.41 Effects of Aggregates on Expansion with PC-CI Using the Kelham Method, with a Maximum Curing Temperature of 203° F (95° C)
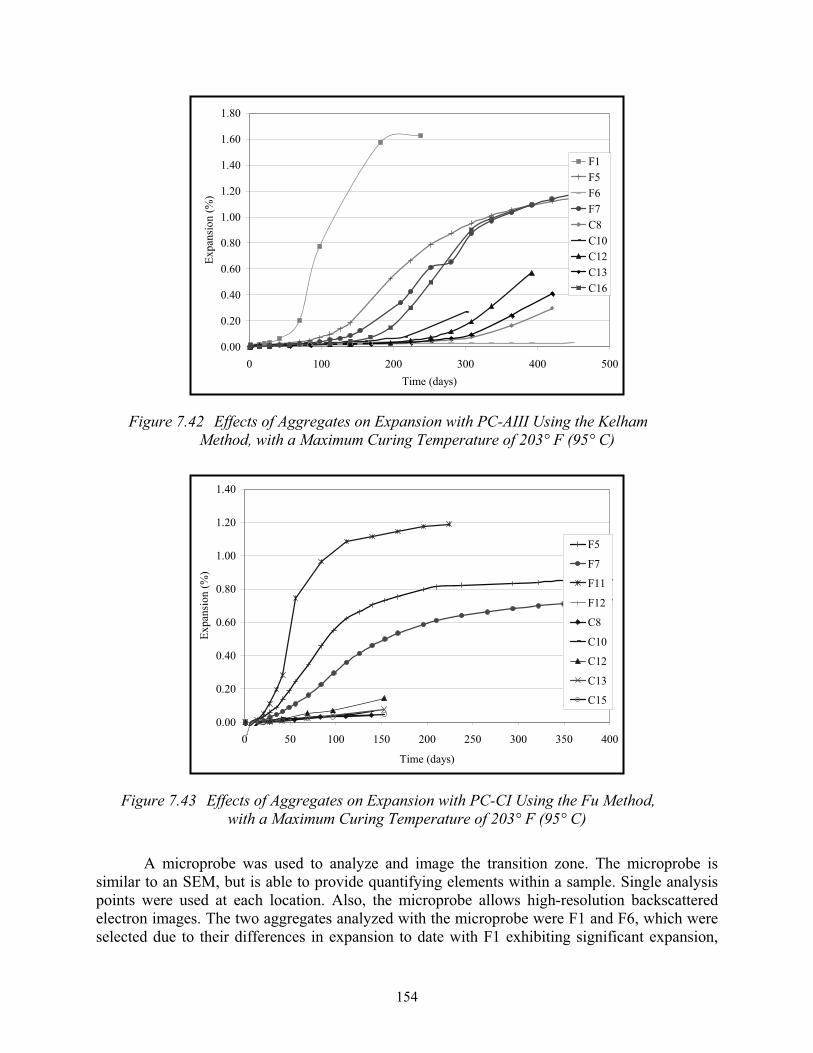
154
0.00
0.20
0.40
0.60
0.80
1.00
1.20
1.40
1.60
1.80
0 100 200 300 400 500Time (days)
Expa
nsio
n (%
)
F1F5F6F7C8C10C12C13C16
Figure 7.42 Effects of Aggregates on Expansion with PC-AIII Using the Kelham Method, with a Maximum Curing Temperature of 203° F (95° C)
0.00
0.20
0.40
0.60
0.80
1.00
1.20
1.40
0 50 100 150 200 250 300 350 400
Time (days)
Expa
nsio
n (%
)
F5
F7
F11
F12
C8
C10
C12
C13
C15
Figure 7.43 Effects of Aggregates on Expansion with PC-CI Using the Fu Method, with a Maximum Curing Temperature of 203° F (95° C)
A microprobe was used to analyze and image the transition zone. The microprobe is similar to an SEM, but is able to provide quantifying elements within a sample. Single analysis points were used at each location. Also, the microprobe allows high-resolution backscattered electron images. The two aggregates analyzed with the microprobe were F1 and F6, which were selected due to their differences in expansion to date with F1 exhibiting significant expansion,
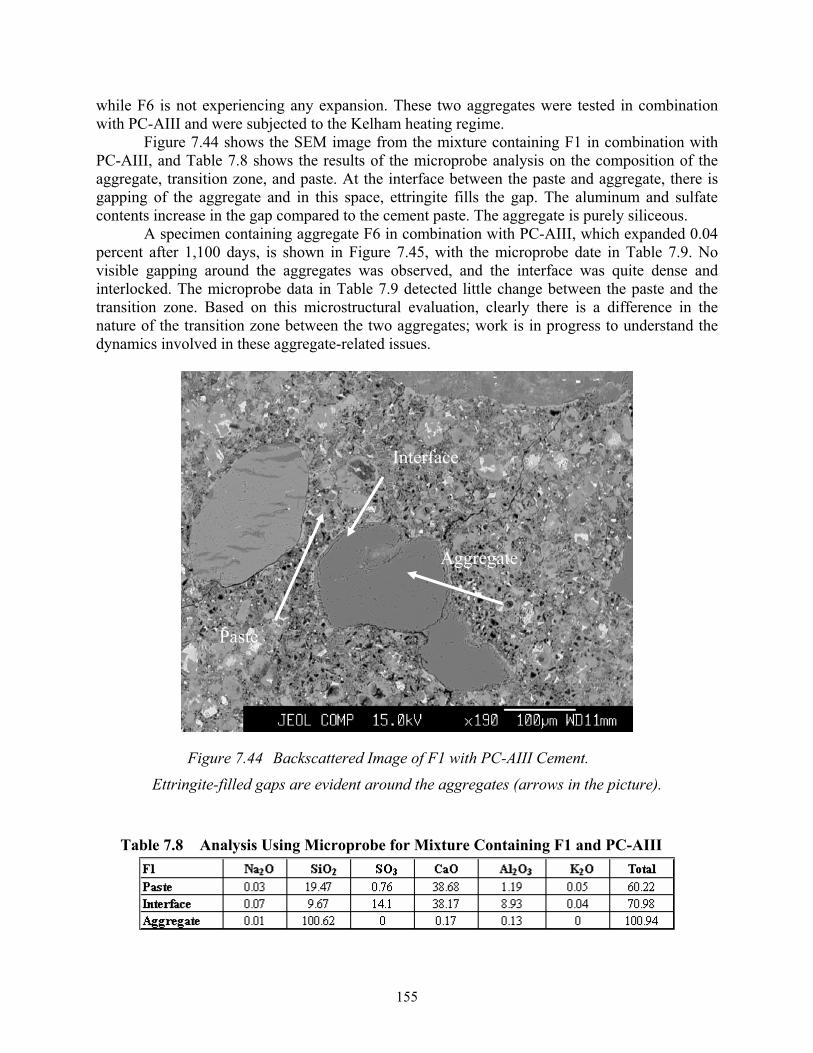
155
while F6 is not experiencing any expansion. These two aggregates were tested in combination with PC-AIII and were subjected to the Kelham heating regime.
Figure 7.44 shows the SEM image from the mixture containing F1 in combination with PC-AIII, and Table 7.8 shows the results of the microprobe analysis on the composition of the aggregate, transition zone, and paste. At the interface between the paste and aggregate, there is gapping of the aggregate and in this space, ettringite fills the gap. The aluminum and sulfate contents increase in the gap compared to the cement paste. The aggregate is purely siliceous.
A specimen containing aggregate F6 in combination with PC-AIII, which expanded 0.04 percent after 1,100 days, is shown in Figure 7.45, with the microprobe date in Table 7.9. No visible gapping around the aggregates was observed, and the interface was quite dense and interlocked. The microprobe data in Table 7.9 detected little change between the paste and the transition zone. Based on this microstructural evaluation, clearly there is a difference in the nature of the transition zone between the two aggregates; work is in progress to understand the dynamics involved in these aggregate-related issues.
Figure 7.44 Backscattered Image of F1 with PC-AIII Cement. Ettringite-filled gaps are evident around the aggregates (arrows in the picture).
Table 7.8 Analysis Using Microprobe for Mixture Containing F1 and PC-AIII
Aggregate
Interface
Paste
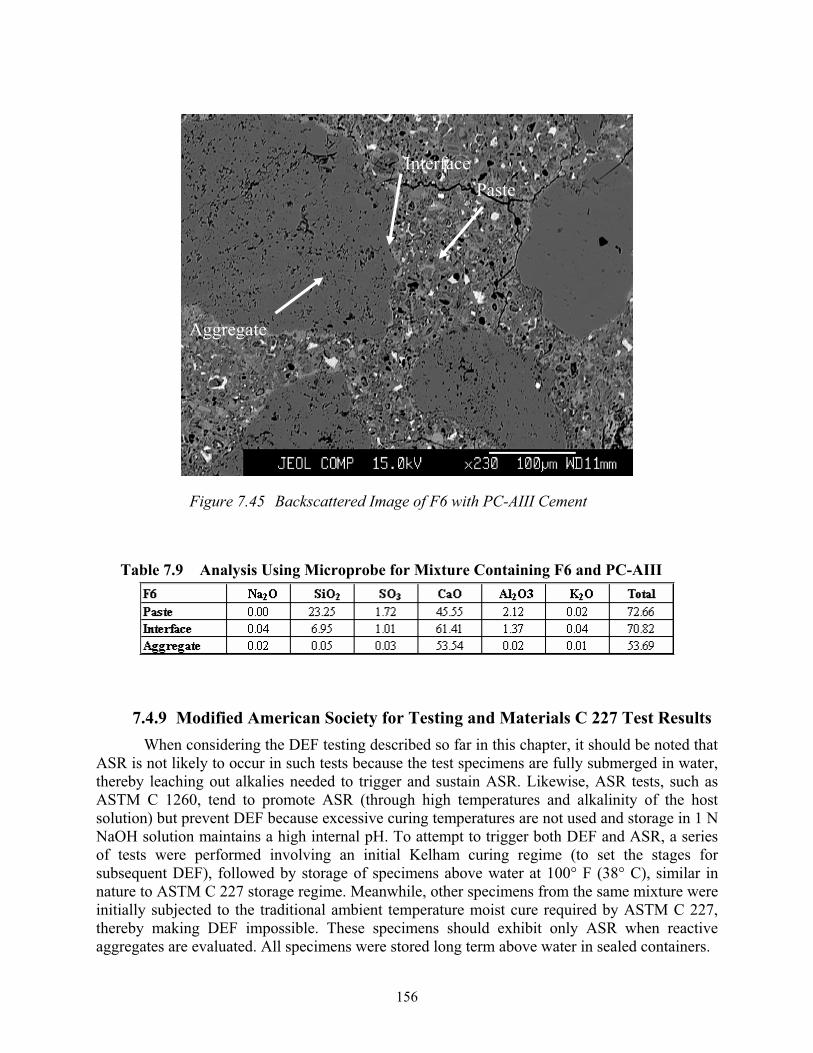
156
Figure 7.45 Backscattered Image of F6 with PC-AIII Cement
Table 7.9 Analysis Using Microprobe for Mixture Containing F6 and PC-AIII
7.4.9 Modified American Society for Testing and Materials C 227 Test Results When considering the DEF testing described so far in this chapter, it should be noted that
ASR is not likely to occur in such tests because the test specimens are fully submerged in water, thereby leaching out alkalies needed to trigger and sustain ASR. Likewise, ASR tests, such as ASTM C 1260, tend to promote ASR (through high temperatures and alkalinity of the host solution) but prevent DEF because excessive curing temperatures are not used and storage in 1 N NaOH solution maintains a high internal pH. To attempt to trigger both DEF and ASR, a series of tests were performed involving an initial Kelham curing regime (to set the stages for subsequent DEF), followed by storage of specimens above water at 100° F (38° C), similar in nature to ASTM C 227 storage regime. Meanwhile, other specimens from the same mixture were initially subjected to the traditional ambient temperature moist cure required by ASTM C 227, thereby making DEF impossible. These specimens should exhibit only ASR when reactive aggregates are evaluated. All specimens were stored long term above water in sealed containers.
Paste
Aggregate
Interface
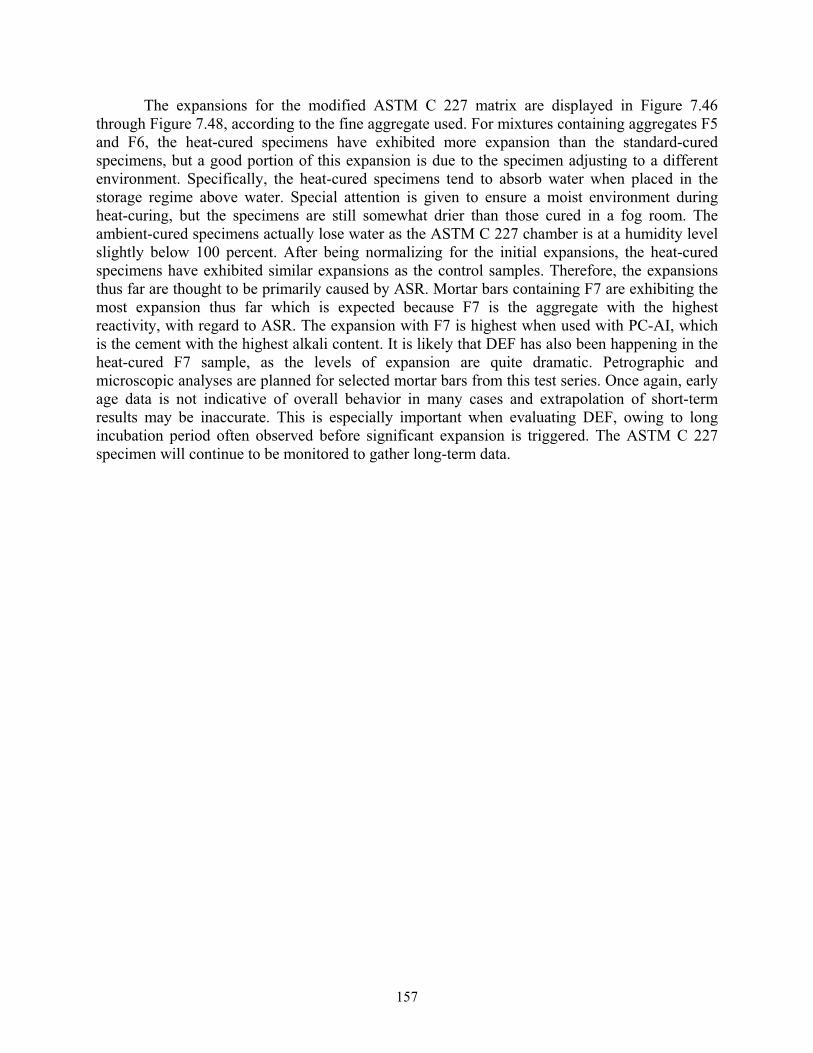
157
The expansions for the modified ASTM C 227 matrix are displayed in Figure 7.46 through Figure 7.48, according to the fine aggregate used. For mixtures containing aggregates F5 and F6, the heat-cured specimens have exhibited more expansion than the standard-cured specimens, but a good portion of this expansion is due to the specimen adjusting to a different environment. Specifically, the heat-cured specimens tend to absorb water when placed in the storage regime above water. Special attention is given to ensure a moist environment during heat-curing, but the specimens are still somewhat drier than those cured in a fog room. The ambient-cured specimens actually lose water as the ASTM C 227 chamber is at a humidity level slightly below 100 percent. After being normalizing for the initial expansions, the heat-cured specimens have exhibited similar expansions as the control samples. Therefore, the expansions thus far are thought to be primarily caused by ASR. Mortar bars containing F7 are exhibiting the most expansion thus far which is expected because F7 is the aggregate with the highest reactivity, with regard to ASR. The expansion with F7 is highest when used with PC-AI, which is the cement with the highest alkali content. It is likely that DEF has also been happening in the heat-cured F7 sample, as the levels of expansion are quite dramatic. Petrographic and microscopic analyses are planned for selected mortar bars from this test series. Once again, early age data is not indicative of overall behavior in many cases and extrapolation of short-term results may be inaccurate. This is especially important when evaluating DEF, owing to long incubation period often observed before significant expansion is triggered. The ASTM C 227 specimen will continue to be monitored to gather long-term data.
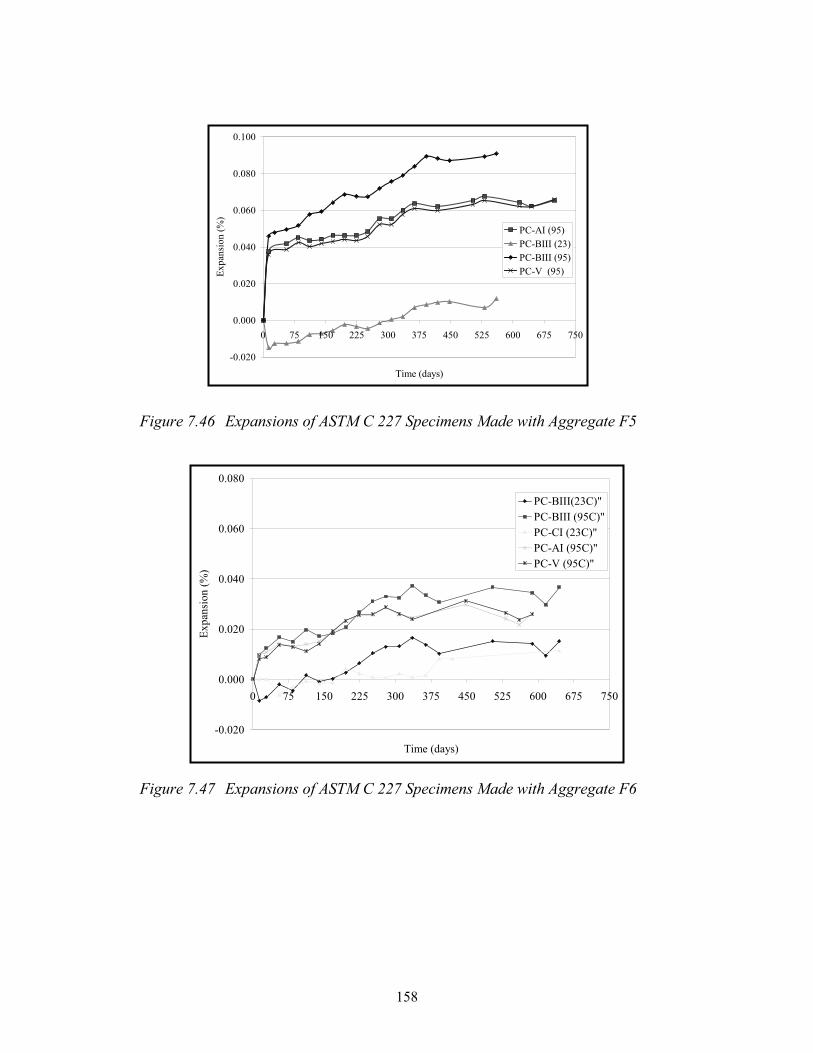
158
Figure 7.46 Expansions of ASTM C 227 Specimens Made with Aggregate F5
-0.020
0.000
0.020
0.040
0.060
0.080
0 75 150 225 300 375 450 525 600 675 750
Time (days)
Expa
nsio
n (%
)
PC-BIII(23C)"PC-BIII (95C)"PC-CI (23C)"PC-AI (95C)"PC-V (95C)"
Figure 7.47 Expansions of ASTM C 227 Specimens Made with Aggregate F6
-0.020
0.000
0.020
0.040
0.060
0.080
0.100
0 75 150 225 300 375 450 525 600 675 750
Time (days)
Expa
nsio
n (%
)PC-AI (95)PC-BIII (23)PC-BIII (95)PC-V (95)
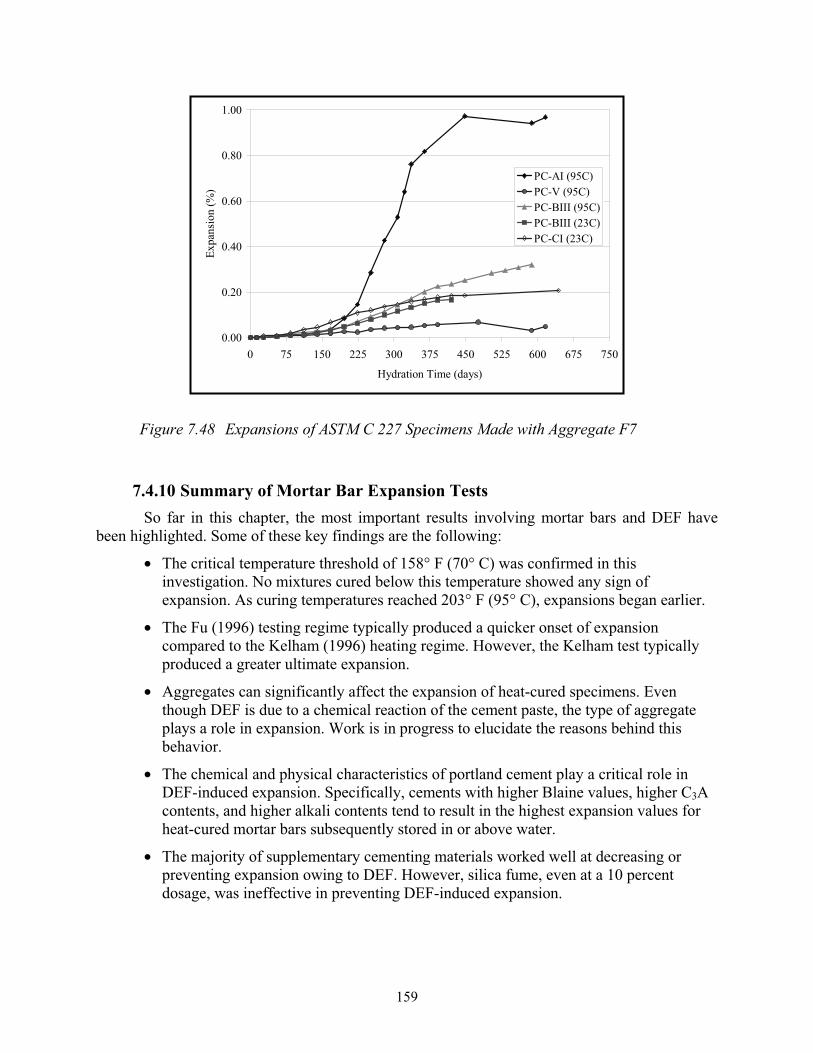
159
Figure 7.48 Expansions of ASTM C 227 Specimens Made with Aggregate F7
7.4.10 Summary of Mortar Bar Expansion Tests So far in this chapter, the most important results involving mortar bars and DEF have
been highlighted. Some of these key findings are the following:
• The critical temperature threshold of 158° F (70° C) was confirmed in this investigation. No mixtures cured below this temperature showed any sign of expansion. As curing temperatures reached 203° F (95° C), expansions began earlier.
• The Fu (1996) testing regime typically produced a quicker onset of expansion compared to the Kelham (1996) heating regime. However, the Kelham test typically produced a greater ultimate expansion.
• Aggregates can significantly affect the expansion of heat-cured specimens. Even though DEF is due to a chemical reaction of the cement paste, the type of aggregate plays a role in expansion. Work is in progress to elucidate the reasons behind this behavior.
• The chemical and physical characteristics of portland cement play a critical role in DEF-induced expansion. Specifically, cements with higher Blaine values, higher C3Acontents, and higher alkali contents tend to result in the highest expansion values for heat-cured mortar bars subsequently stored in or above water.
• The majority of supplementary cementing materials worked well at decreasing or preventing expansion owing to DEF. However, silica fume, even at a 10 percent dosage, was ineffective in preventing DEF-induced expansion.
0.00
0.20
0.40
0.60
0.80
1.00
0 75 150 225 300 375 450 525 600 675 750
Hydration Time (days)
Expa
nsio
n (%
)
PC-AI (95C)PC-V (95C)PC-BIII (95C)PC-BIII (23C)PC-CI (23C)
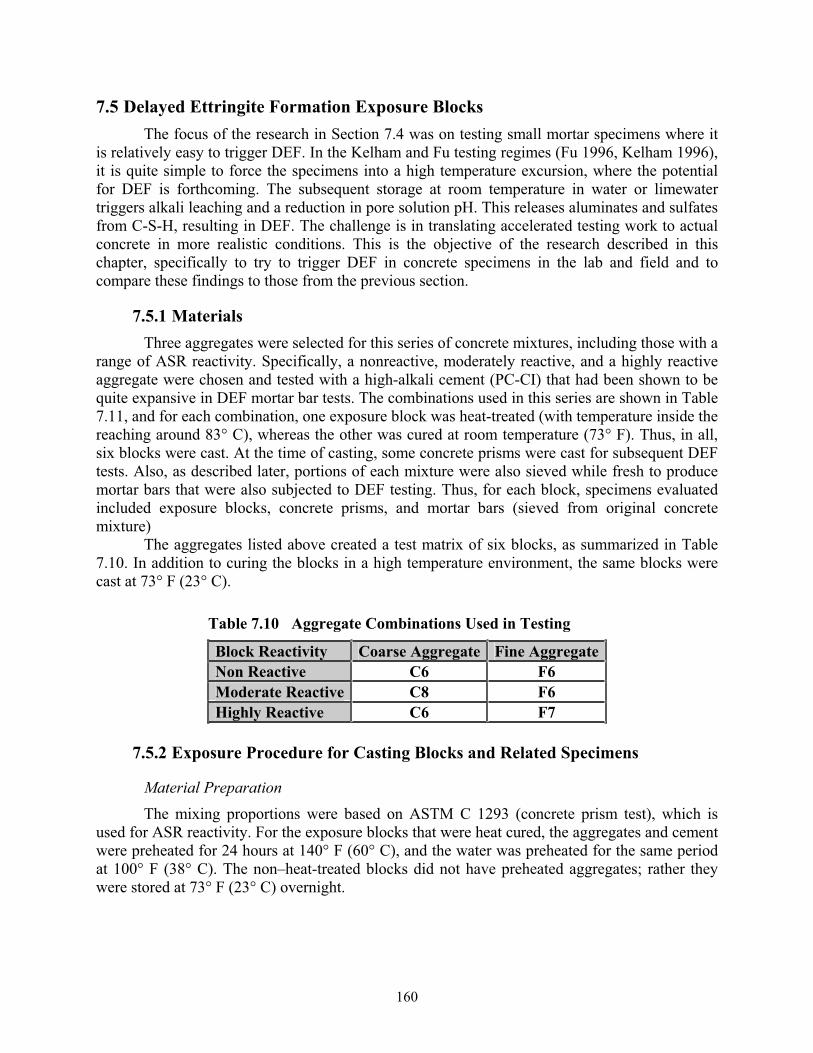
160
7.5 Delayed Ettringite Formation Exposure Blocks The focus of the research in Section 7.4 was on testing small mortar specimens where it
is relatively easy to trigger DEF. In the Kelham and Fu testing regimes (Fu 1996, Kelham 1996), it is quite simple to force the specimens into a high temperature excursion, where the potential for DEF is forthcoming. The subsequent storage at room temperature in water or limewater triggers alkali leaching and a reduction in pore solution pH. This releases aluminates and sulfates from C-S-H, resulting in DEF. The challenge is in translating accelerated testing work to actual concrete in more realistic conditions. This is the objective of the research described in this chapter, specifically to try to trigger DEF in concrete specimens in the lab and field and to compare these findings to those from the previous section.
7.5.1 MaterialsThree aggregates were selected for this series of concrete mixtures, including those with a
range of ASR reactivity. Specifically, a nonreactive, moderately reactive, and a highly reactive aggregate were chosen and tested with a high-alkali cement (PC-CI) that had been shown to be quite expansive in DEF mortar bar tests. The combinations used in this series are shown in Table 7.11, and for each combination, one exposure block was heat-treated (with temperature inside the reaching around 83° C), whereas the other was cured at room temperature (73° F). Thus, in all, six blocks were cast. At the time of casting, some concrete prisms were cast for subsequent DEF tests. Also, as described later, portions of each mixture were also sieved while fresh to produce mortar bars that were also subjected to DEF testing. Thus, for each block, specimens evaluated included exposure blocks, concrete prisms, and mortar bars (sieved from original concrete mixture)
The aggregates listed above created a test matrix of six blocks, as summarized in Table 7.10. In addition to curing the blocks in a high temperature environment, the same blocks were cast at 73° F (23° C).
Table 7.10 Aggregate Combinations Used in Testing
7.5.2 Exposure Procedure for Casting Blocks and Related Specimens
Material Preparation The mixing proportions were based on ASTM C 1293 (concrete prism test), which is
used for ASR reactivity. For the exposure blocks that were heat cured, the aggregates and cement were preheated for 24 hours at 140° F (60° C), and the water was preheated for the same period at 100° F (38° C). The non–heat-treated blocks did not have preheated aggregates; rather they were stored at 73° F (23° C) overnight.
Block Reactivity Coarse Aggregate Fine Aggregate Non Reactive C6 F6 Moderate Reactive C8 F6 Highly Reactive C6 F7
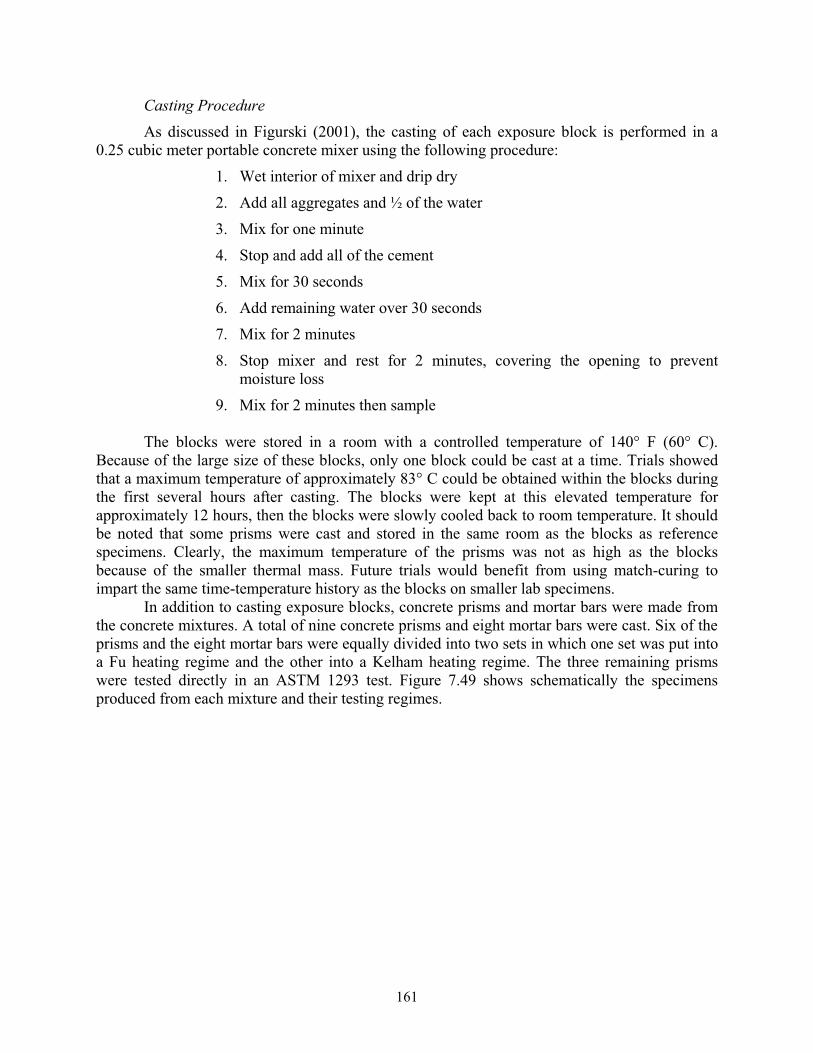
161
Casting Procedure As discussed in Figurski (2001), the casting of each exposure block is performed in a
0.25 cubic meter portable concrete mixer using the following procedure: 1. Wet interior of mixer and drip dry 2. Add all aggregates and ½ of the water 3. Mix for one minute 4. Stop and add all of the cement 5. Mix for 30 seconds 6. Add remaining water over 30 seconds 7. Mix for 2 minutes 8. Stop mixer and rest for 2 minutes, covering the opening to prevent
moisture loss 9. Mix for 2 minutes then sample
The blocks were stored in a room with a controlled temperature of 140° F (60° C). Because of the large size of these blocks, only one block could be cast at a time. Trials showed that a maximum temperature of approximately 83° C could be obtained within the blocks during the first several hours after casting. The blocks were kept at this elevated temperature for approximately 12 hours, then the blocks were slowly cooled back to room temperature. It should be noted that some prisms were cast and stored in the same room as the blocks as reference specimens. Clearly, the maximum temperature of the prisms was not as high as the blocks because of the smaller thermal mass. Future trials would benefit from using match-curing to impart the same time-temperature history as the blocks on smaller lab specimens.
In addition to casting exposure blocks, concrete prisms and mortar bars were made from the concrete mixtures. A total of nine concrete prisms and eight mortar bars were cast. Six of the prisms and the eight mortar bars were equally divided into two sets in which one set was put into a Fu heating regime and the other into a Kelham heating regime. The three remaining prisms were tested directly in an ASTM 1293 test. Figure 7.49 shows schematically the specimens produced from each mixture and their testing regimes.
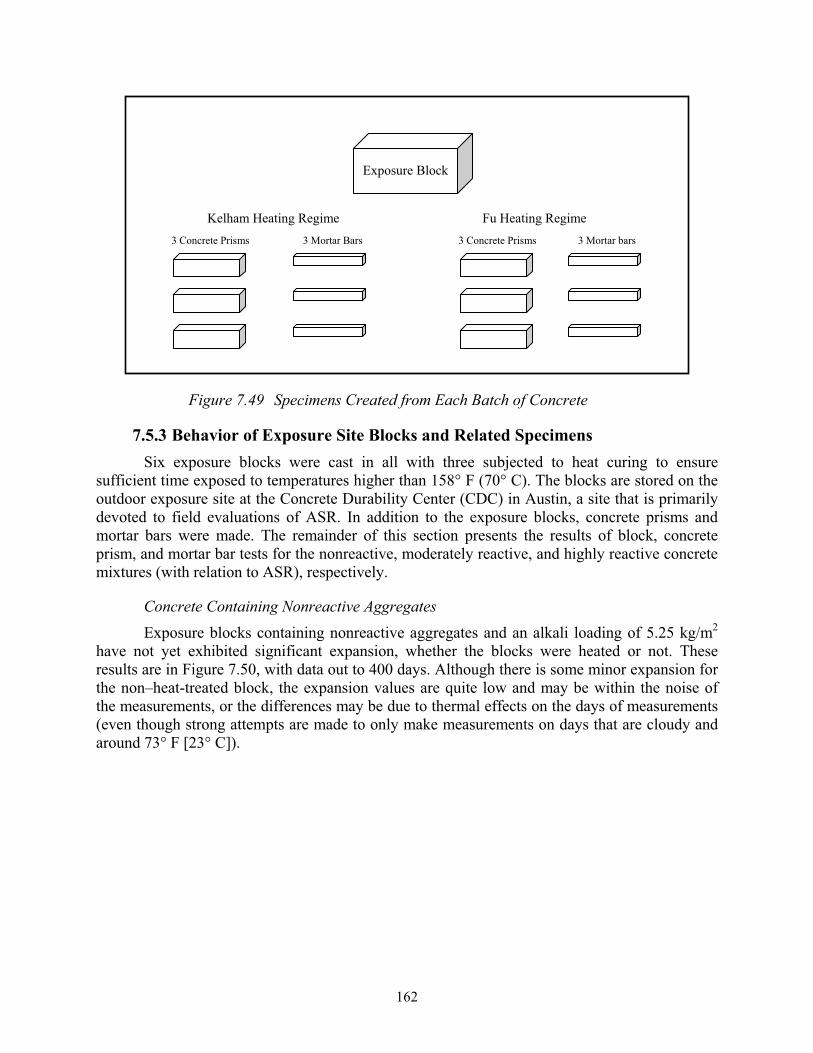
162
Figure 7.49 Specimens Created from Each Batch of Concrete
7.5.3 Behavior of Exposure Site Blocks and Related Specimens Six exposure blocks were cast in all with three subjected to heat curing to ensure
sufficient time exposed to temperatures higher than 158° F (70° C). The blocks are stored on the outdoor exposure site at the Concrete Durability Center (CDC) in Austin, a site that is primarily devoted to field evaluations of ASR. In addition to the exposure blocks, concrete prisms and mortar bars were made. The remainder of this section presents the results of block, concrete prism, and mortar bar tests for the nonreactive, moderately reactive, and highly reactive concrete mixtures (with relation to ASR), respectively.
Concrete Containing Nonreactive Aggregates Exposure blocks containing nonreactive aggregates and an alkali loading of 5.25 kg/m2
have not yet exhibited significant expansion, whether the blocks were heated or not. These results are in Figure 7.50, with data out to 400 days. Although there is some minor expansion for the non–heat-treated block, the expansion values are quite low and may be within the noise of the measurements, or the differences may be due to thermal effects on the days of measurements (even though strong attempts are made to only make measurements on days that are cloudy and around 73° F [23° C]).
Exposure Block
Kelham Heating Regime Fu Heating Regime 3 Concrete Prisms 3 Mortar bars 3 Concrete Prisms 3 Mortar Bars
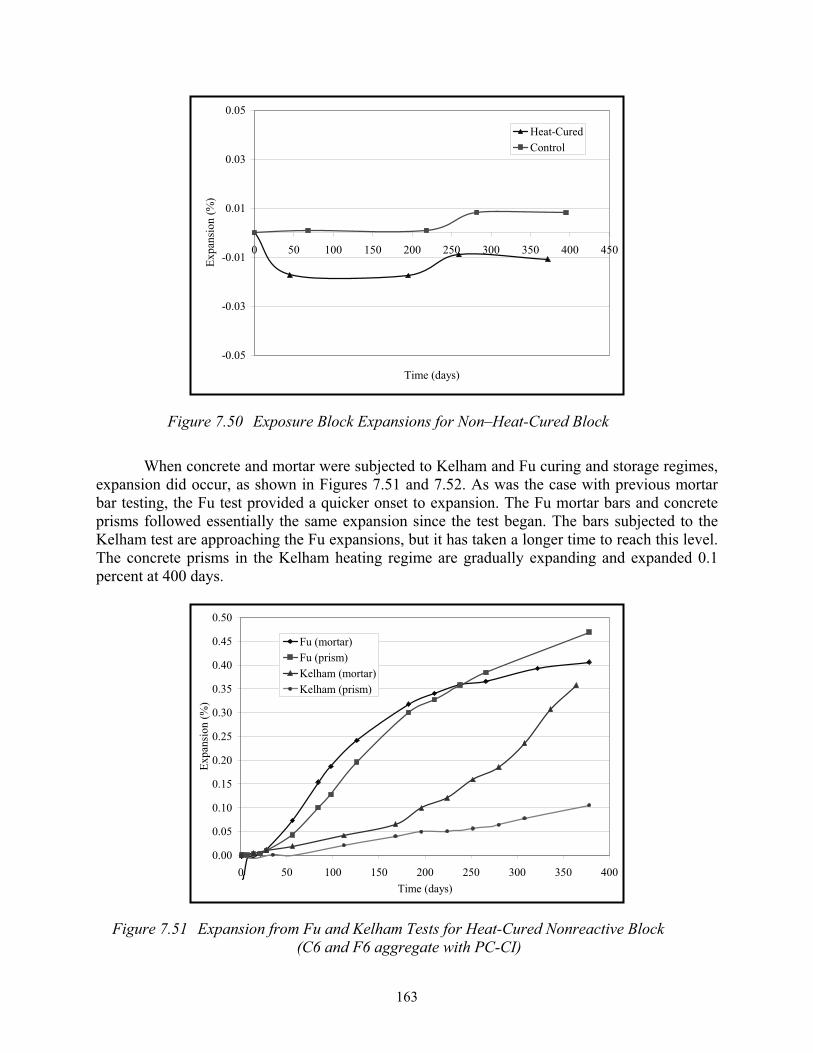
163
-0.05
-0.03
-0.01
0.01
0.03
0.05
0 50 100 150 200 250 300 350 400 450
Time (days)
Expa
nsio
n (%
)
Heat-CuredControl
Figure 7.50 Exposure Block Expansions for Non–Heat-Cured Block
When concrete and mortar were subjected to Kelham and Fu curing and storage regimes, expansion did occur, as shown in Figures 7.51 and 7.52. As was the case with previous mortar bar testing, the Fu test provided a quicker onset to expansion. The Fu mortar bars and concrete prisms followed essentially the same expansion since the test began. The bars subjected to the Kelham test are approaching the Fu expansions, but it has taken a longer time to reach this level. The concrete prisms in the Kelham heating regime are gradually expanding and expanded 0.1 percent at 400 days.
0.00
0.05
0.10
0.15
0.20
0.25
0.30
0.35
0.40
0.45
0.50
0 50 100 150 200 250 300 350 400Time (days)
Expa
nsio
n (%
)
Fu (mortar)Fu (prism)Kelham (mortar)Kelham (prism)
Figure 7.51 Expansion from Fu and Kelham Tests for Heat-Cured Nonreactive Block (C6 and F6 aggregate with PC-CI)
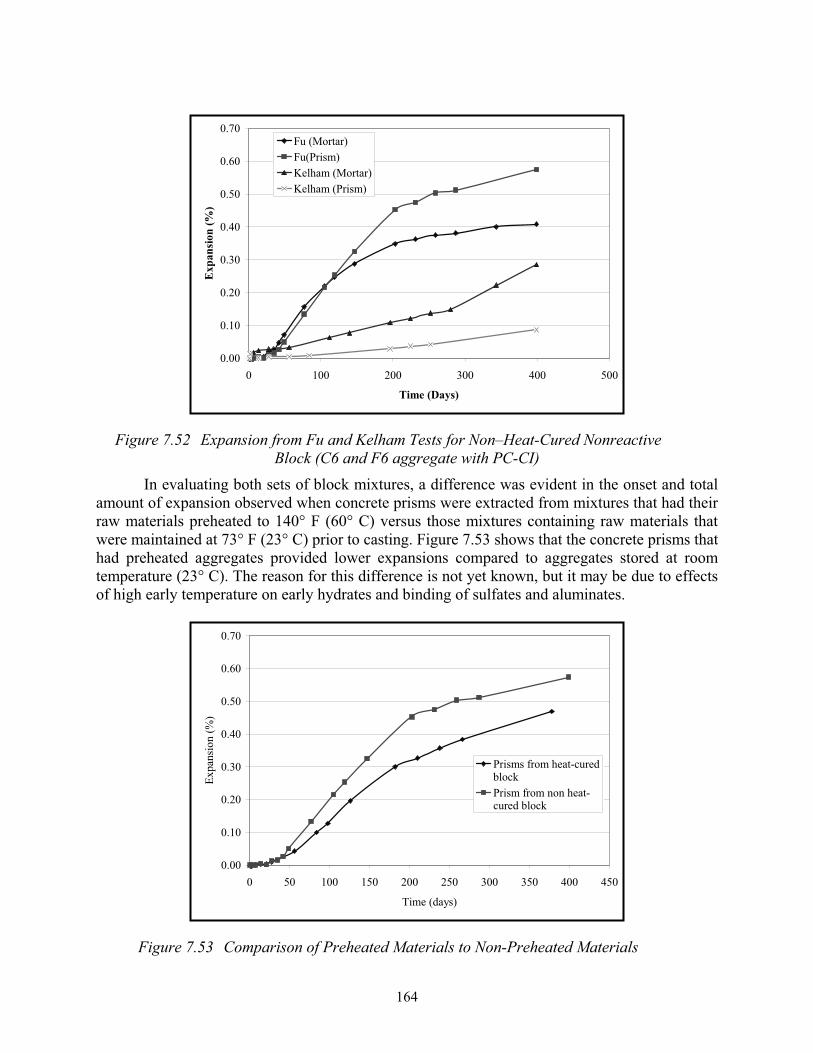
164
0.00
0.10
0.20
0.30
0.40
0.50
0.60
0.70
0 100 200 300 400 500
Time (Days)
Exp
ansi
on (%
)
Fu (Mortar)Fu(Prism)Kelham (Mortar)Kelham (Prism)
Figure 7.52 Expansion from Fu and Kelham Tests for Non–Heat-Cured Nonreactive Block (C6 and F6 aggregate with PC-CI)
In evaluating both sets of block mixtures, a difference was evident in the onset and total amount of expansion observed when concrete prisms were extracted from mixtures that had their raw materials preheated to 140° F (60° C) versus those mixtures containing raw materials that were maintained at 73° F (23° C) prior to casting. Figure 7.53 shows that the concrete prisms that had preheated aggregates provided lower expansions compared to aggregates stored at room temperature (23° C). The reason for this difference is not yet known, but it may be due to effects of high early temperature on early hydrates and binding of sulfates and aluminates.
0.00
0.10
0.20
0.30
0.40
0.50
0.60
0.70
0 50 100 150 200 250 300 350 400 450
Time (days)
Expa
nsio
n (%
)
Prisms from heat-curedblockPrism from non heat-cured block
Figure 7.53 Comparison of Preheated Materials to Non-Preheated Materials
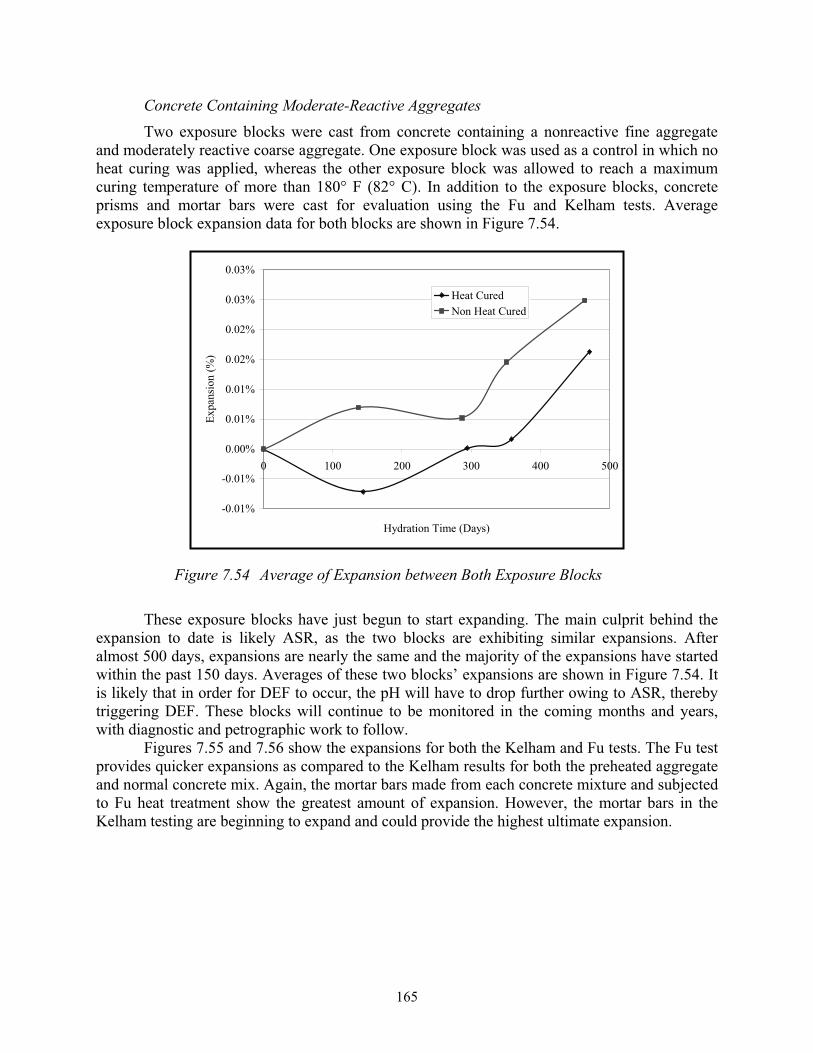
165
Concrete Containing Moderate-Reactive Aggregates Two exposure blocks were cast from concrete containing a nonreactive fine aggregate
and moderately reactive coarse aggregate. One exposure block was used as a control in which no heat curing was applied, whereas the other exposure block was allowed to reach a maximum curing temperature of more than 180° F (82° C). In addition to the exposure blocks, concrete prisms and mortar bars were cast for evaluation using the Fu and Kelham tests. Average exposure block expansion data for both blocks are shown in Figure 7.54.
-0.01%
-0.01%
0.00%
0.01%
0.01%
0.02%
0.02%
0.03%
0.03%
0 100 200 300 400 500
Hydration Time (Days)
Expa
nsio
n (%
)
Heat CuredNon Heat Cured
Figure 7.54 Average of Expansion between Both Exposure Blocks
These exposure blocks have just begun to start expanding. The main culprit behind the expansion to date is likely ASR, as the two blocks are exhibiting similar expansions. After almost 500 days, expansions are nearly the same and the majority of the expansions have started within the past 150 days. Averages of these two blocks’ expansions are shown in Figure 7.54. It is likely that in order for DEF to occur, the pH will have to drop further owing to ASR, thereby triggering DEF. These blocks will continue to be monitored in the coming months and years, with diagnostic and petrographic work to follow.
Figures 7.55 and 7.56 show the expansions for both the Kelham and Fu tests. The Fu test provides quicker expansions as compared to the Kelham results for both the preheated aggregate and normal concrete mix. Again, the mortar bars made from each concrete mixture and subjected to Fu heat treatment show the greatest amount of expansion. However, the mortar bars in the Kelham testing are beginning to expand and could provide the highest ultimate expansion.
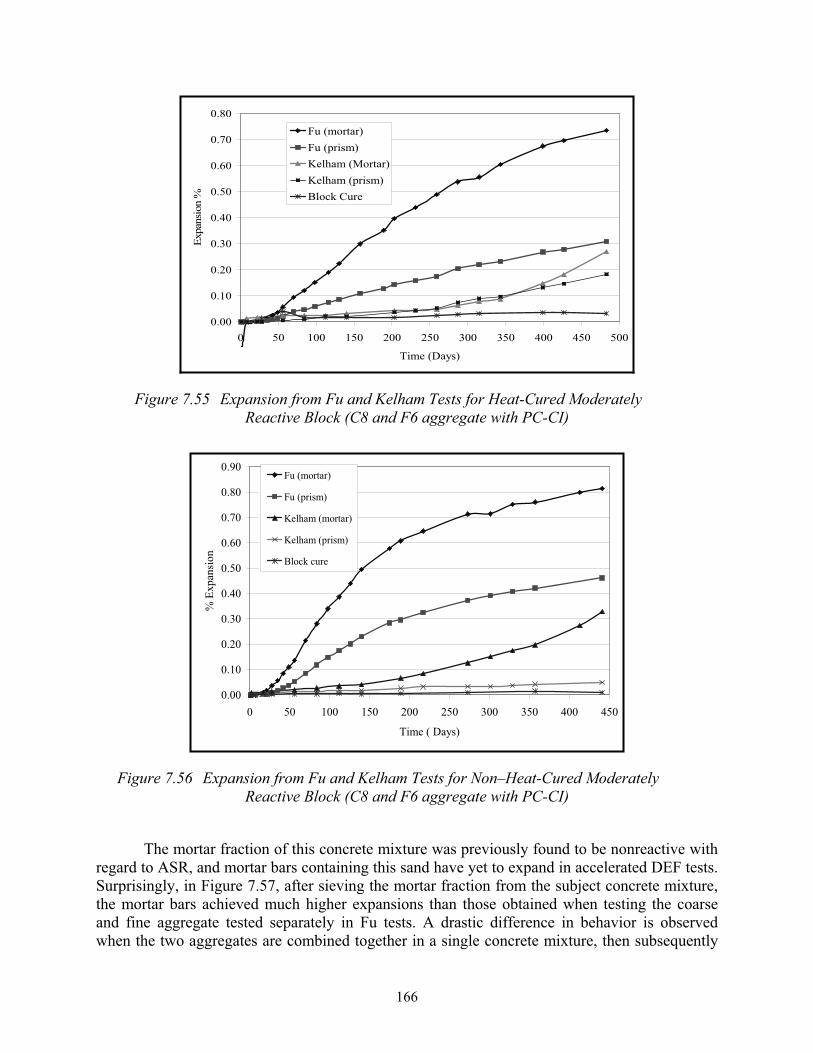
166
0.00
0.10
0.20
0.30
0.40
0.50
0.60
0.70
0.80
0 50 100 150 200 250 300 350 400 450 500
Time (Days)
Expa
nsio
n %
Fu (mortar)Fu (prism)Kelham (Mortar)Kelham (prism)Block Cure
Figure 7.55 Expansion from Fu and Kelham Tests for Heat-Cured Moderately Reactive Block (C8 and F6 aggregate with PC-CI)
0.00
0.10
0.20
0.30
0.40
0.50
0.60
0.70
0.80
0.90
0 50 100 150 200 250 300 350 400 450
Time ( Days)
% E
xpan
sion
Fu (mortar)
Fu (prism)
Kelham (mortar)
Kelham (prism)
Block cure
Figure 7.56 Expansion from Fu and Kelham Tests for Non–Heat-Cured Moderately Reactive Block (C8 and F6 aggregate with PC-CI)
The mortar fraction of this concrete mixture was previously found to be nonreactive with regard to ASR, and mortar bars containing this sand have yet to expand in accelerated DEF tests. Surprisingly, in Figure 7.57, after sieving the mortar fraction from the subject concrete mixture, the mortar bars achieved much higher expansions than those obtained when testing the coarse and fine aggregate tested separately in Fu tests. A drastic difference in behavior is observed when the two aggregates are combined together in a single concrete mixture, then subsequently
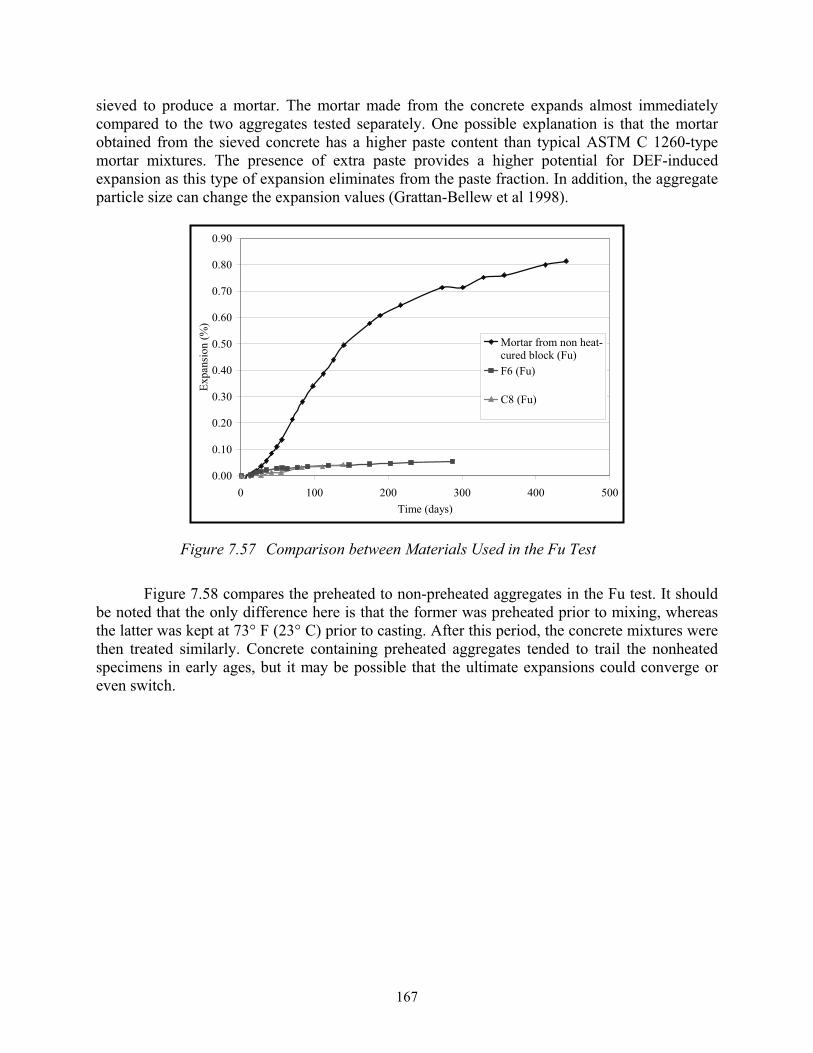
167
sieved to produce a mortar. The mortar made from the concrete expands almost immediately compared to the two aggregates tested separately. One possible explanation is that the mortar obtained from the sieved concrete has a higher paste content than typical ASTM C 1260-type mortar mixtures. The presence of extra paste provides a higher potential for DEF-induced expansion as this type of expansion eliminates from the paste fraction. In addition, the aggregate particle size can change the expansion values (Grattan-Bellew et al 1998).
0.00
0.10
0.20
0.30
0.40
0.50
0.60
0.70
0.80
0.90
0 100 200 300 400 500Time (days)
Expa
nsio
n (%
)
Mortar from non heat-cured block (Fu)F6 (Fu)
C8 (Fu)
Figure 7.57 Comparison between Materials Used in the Fu Test
Figure 7.58 compares the preheated to non-preheated aggregates in the Fu test. It should be noted that the only difference here is that the former was preheated prior to mixing, whereas the latter was kept at 73° F (23° C) prior to casting. After this period, the concrete mixtures were then treated similarly. Concrete containing preheated aggregates tended to trail the nonheated specimens in early ages, but it may be possible that the ultimate expansions could converge or even switch.
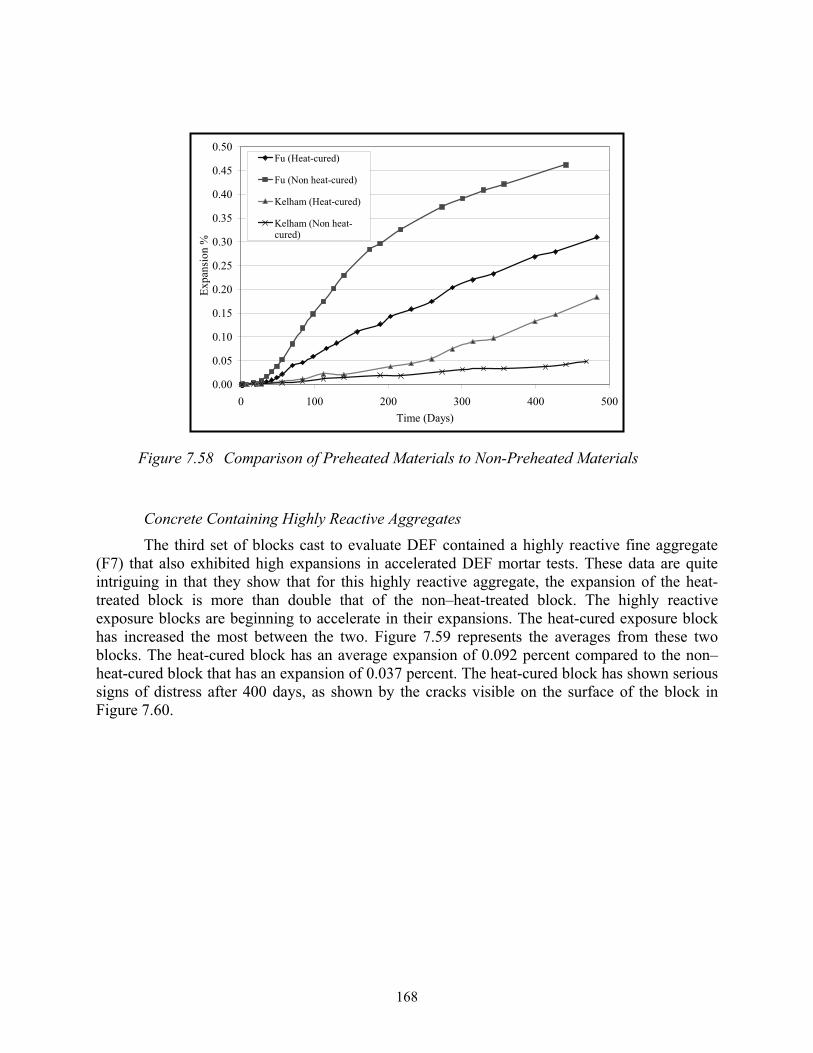
168
0.00
0.05
0.10
0.15
0.20
0.25
0.30
0.35
0.40
0.45
0.50
0 100 200 300 400 500Time (Days)
Expa
nsio
n %
Fu (Heat-cured)
Fu (Non heat-cured)
Kelham (Heat-cured)
Kelham (Non heat-cured)
Figure 7.58 Comparison of Preheated Materials to Non-Preheated Materials
Concrete Containing Highly Reactive Aggregates The third set of blocks cast to evaluate DEF contained a highly reactive fine aggregate
(F7) that also exhibited high expansions in accelerated DEF mortar tests. These data are quite intriguing in that they show that for this highly reactive aggregate, the expansion of the heat-treated block is more than double that of the non–heat-treated block. The highly reactive exposure blocks are beginning to accelerate in their expansions. The heat-cured exposure block has increased the most between the two. Figure 7.59 represents the averages from these two blocks. The heat-cured block has an average expansion of 0.092 percent compared to the non–heat-cured block that has an expansion of 0.037 percent. The heat-cured block has shown serious signs of distress after 400 days, as shown by the cracks visible on the surface of the block in Figure 7.60.
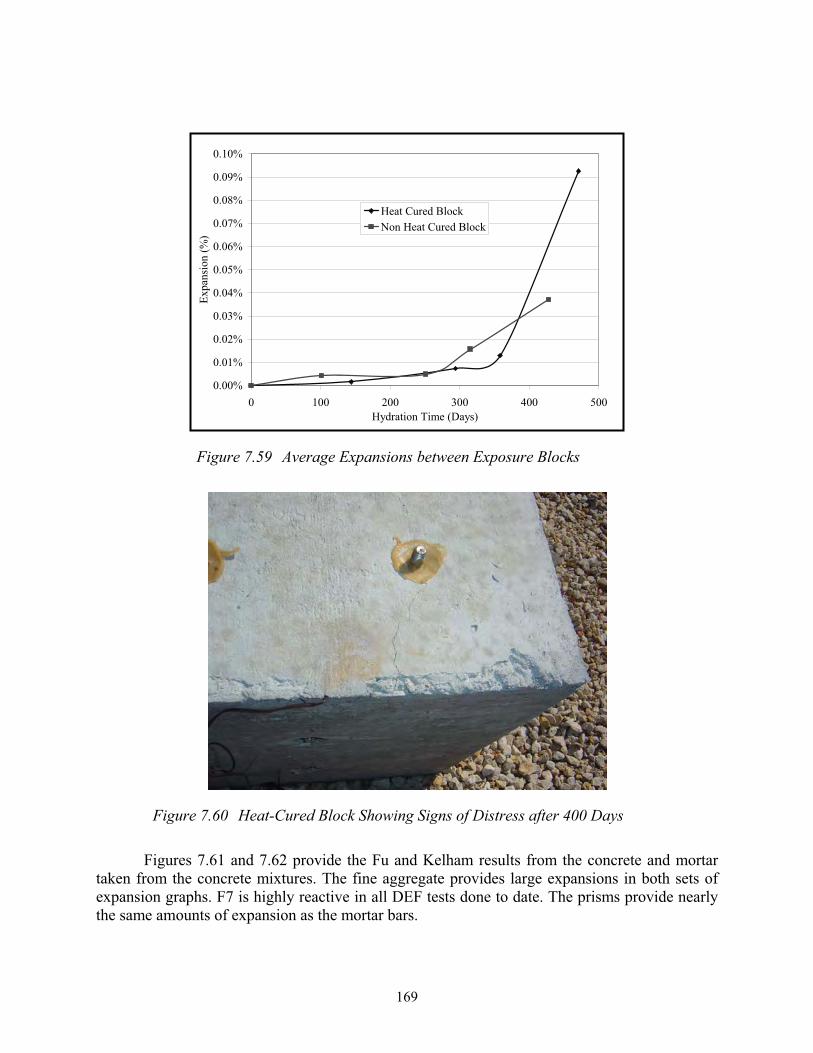
169
0.00%
0.01%
0.02%
0.03%
0.04%
0.05%
0.06%
0.07%
0.08%
0.09%
0.10%
0 100 200 300 400 500Hydration Time (Days)
Expa
nsio
n (%
)Heat Cured BlockNon Heat Cured Block
Figure 7.59 Average Expansions between Exposure Blocks
Figure 7.60 Heat-Cured Block Showing Signs of Distress after 400 Days
Figures 7.61 and 7.62 provide the Fu and Kelham results from the concrete and mortar taken from the concrete mixtures. The fine aggregate provides large expansions in both sets of expansion graphs. F7 is highly reactive in all DEF tests done to date. The prisms provide nearly the same amounts of expansion as the mortar bars.
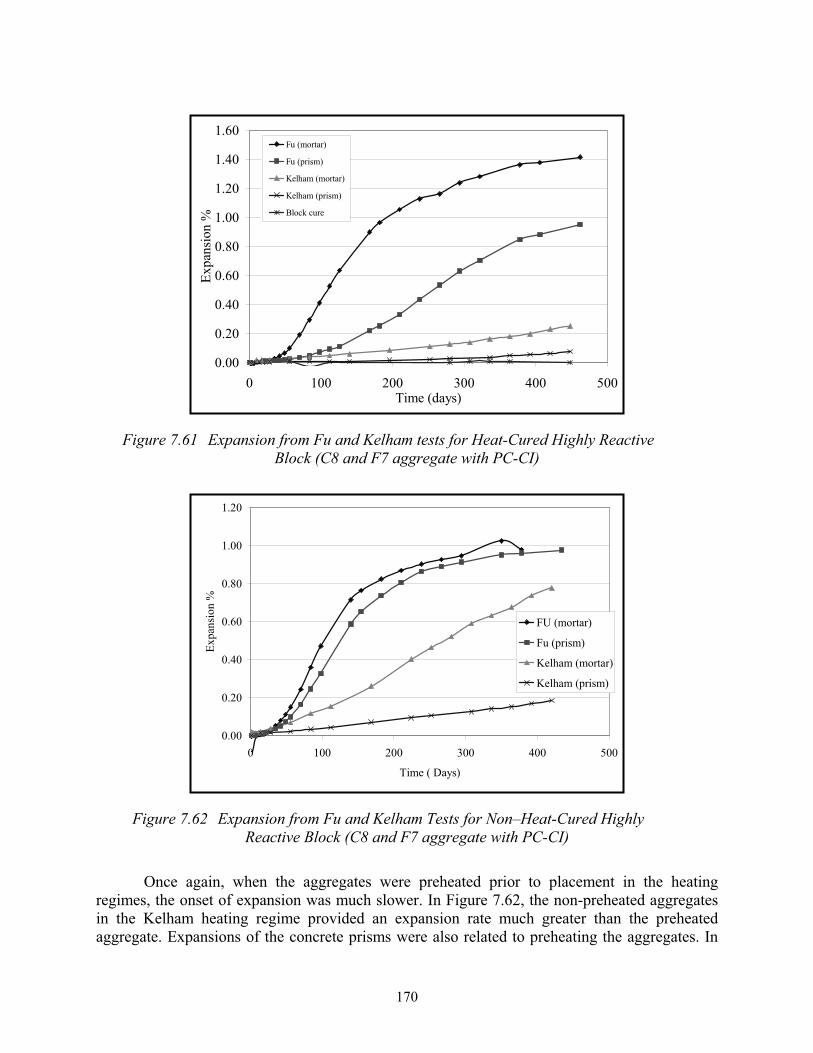
170
0.00
0.20
0.40
0.60
0.80
1.00
1.20
1.40
1.60
0 100 200 300 400 500Time (days)
Expa
nsio
n %
Fu (mortar)
Fu (prism)
Kelham (mortar)
Kelham (prism)
Block cure
Figure 7.61 Expansion from Fu and Kelham tests for Heat-Cured Highly Reactive Block (C8 and F7 aggregate with PC-CI)
0.00
0.20
0.40
0.60
0.80
1.00
1.20
0 100 200 300 400 500
Time ( Days)
Expa
nsio
n %
FU (mortar)
Fu (prism)
Kelham (mortar)
Kelham (prism)
Figure 7.62 Expansion from Fu and Kelham Tests for Non–Heat-Cured Highly Reactive Block (C8 and F7 aggregate with PC-CI)
Once again, when the aggregates were preheated prior to placement in the heating regimes, the onset of expansion was much slower. In Figure 7.62, the non-preheated aggregates in the Kelham heating regime provided an expansion rate much greater than the preheated aggregate. Expansions of the concrete prisms were also related to preheating the aggregates. In
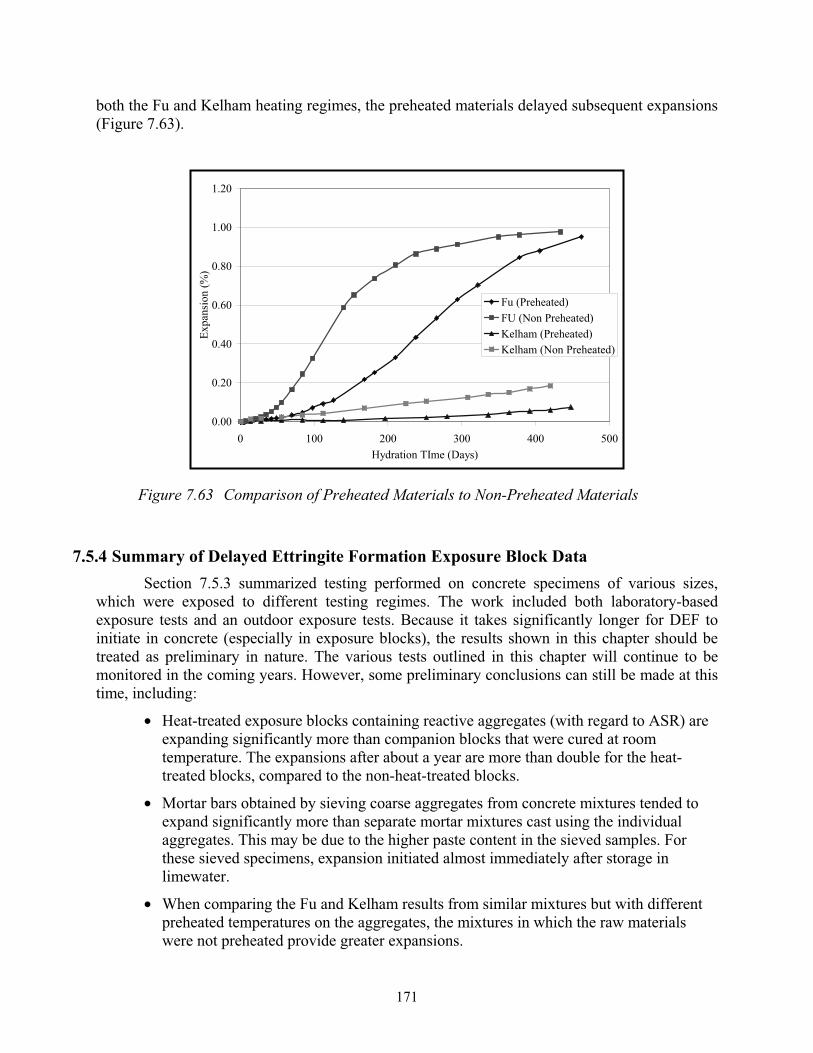
171
both the Fu and Kelham heating regimes, the preheated materials delayed subsequent expansions (Figure 7.63).
0.00
0.20
0.40
0.60
0.80
1.00
1.20
0 100 200 300 400 500Hydration TIme (Days)
Expa
nsio
n (%
)
Fu (Preheated)FU (Non Preheated)Kelham (Preheated)Kelham (Non Preheated)
Figure 7.63 Comparison of Preheated Materials to Non-Preheated Materials
7.5.4 Summary of Delayed Ettringite Formation Exposure Block Data Section 7.5.3 summarized testing performed on concrete specimens of various sizes,
which were exposed to different testing regimes. The work included both laboratory-based exposure tests and an outdoor exposure tests. Because it takes significantly longer for DEF to initiate in concrete (especially in exposure blocks), the results shown in this chapter should be treated as preliminary in nature. The various tests outlined in this chapter will continue to be monitored in the coming years. However, some preliminary conclusions can still be made at this time, including:
• Heat-treated exposure blocks containing reactive aggregates (with regard to ASR) are expanding significantly more than companion blocks that were cured at room temperature. The expansions after about a year are more than double for the heat-treated blocks, compared to the non-heat-treated blocks.
• Mortar bars obtained by sieving coarse aggregates from concrete mixtures tended to expand significantly more than separate mortar mixtures cast using the individual aggregates. This may be due to the higher paste content in the sieved samples. For these sieved specimens, expansion initiated almost immediately after storage in limewater.
• When comparing the Fu and Kelham results from similar mixtures but with different preheated temperatures on the aggregates, the mixtures in which the raw materials were not preheated provide greater expansions.
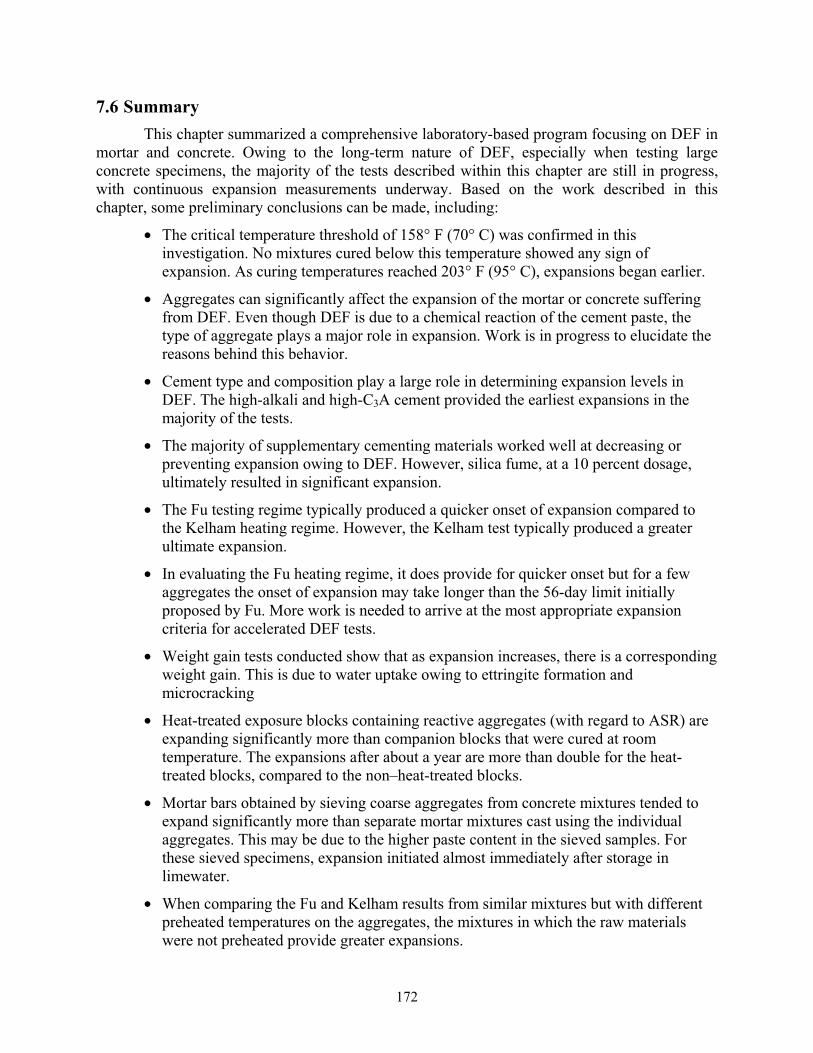
172
7.6 SummaryThis chapter summarized a comprehensive laboratory-based program focusing on DEF in
mortar and concrete. Owing to the long-term nature of DEF, especially when testing large concrete specimens, the majority of the tests described within this chapter are still in progress, with continuous expansion measurements underway. Based on the work described in this chapter, some preliminary conclusions can be made, including:
• The critical temperature threshold of 158° F (70° C) was confirmed in this investigation. No mixtures cured below this temperature showed any sign of expansion. As curing temperatures reached 203° F (95° C), expansions began earlier.
• Aggregates can significantly affect the expansion of the mortar or concrete suffering from DEF. Even though DEF is due to a chemical reaction of the cement paste, the type of aggregate plays a major role in expansion. Work is in progress to elucidate the reasons behind this behavior.
• Cement type and composition play a large role in determining expansion levels in DEF. The high-alkali and high-C3A cement provided the earliest expansions in the majority of the tests.
• The majority of supplementary cementing materials worked well at decreasing or preventing expansion owing to DEF. However, silica fume, at a 10 percent dosage, ultimately resulted in significant expansion.
• The Fu testing regime typically produced a quicker onset of expansion compared to the Kelham heating regime. However, the Kelham test typically produced a greater ultimate expansion.
• In evaluating the Fu heating regime, it does provide for quicker onset but for a few aggregates the onset of expansion may take longer than the 56-day limit initially proposed by Fu. More work is needed to arrive at the most appropriate expansion criteria for accelerated DEF tests.
• Weight gain tests conducted show that as expansion increases, there is a corresponding weight gain. This is due to water uptake owing to ettringite formation and microcracking
• Heat-treated exposure blocks containing reactive aggregates (with regard to ASR) are expanding significantly more than companion blocks that were cured at room temperature. The expansions after about a year are more than double for the heat-treated blocks, compared to the non–heat-treated blocks.
• Mortar bars obtained by sieving coarse aggregates from concrete mixtures tended to expand significantly more than separate mortar mixtures cast using the individual aggregates. This may be due to the higher paste content in the sieved samples. For these sieved specimens, expansion initiated almost immediately after storage in limewater.
• When comparing the Fu and Kelham results from similar mixtures but with different preheated temperatures on the aggregates, the mixtures in which the raw materials were not preheated provide greater expansions.
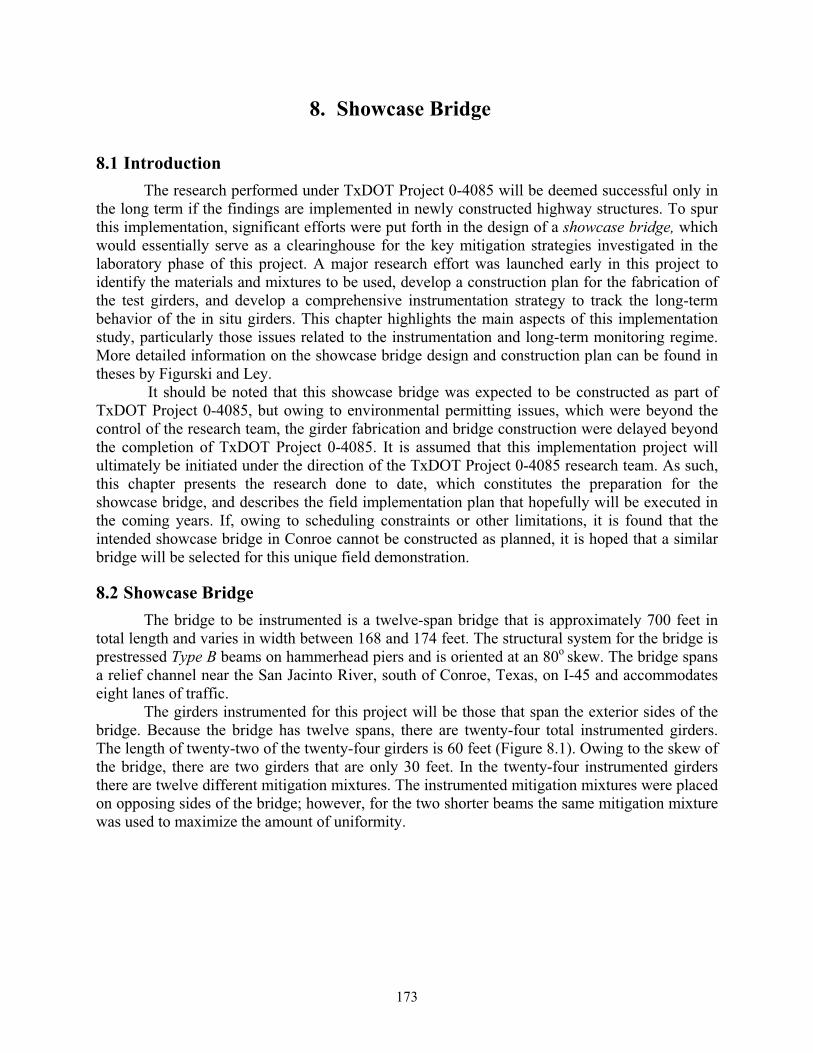
173
8. Showcase Bridge
8.1 IntroductionThe research performed under TxDOT Project 0-4085 will be deemed successful only in
the long term if the findings are implemented in newly constructed highway structures. To spur this implementation, significant efforts were put forth in the design of a showcase bridge, which would essentially serve as a clearinghouse for the key mitigation strategies investigated in the laboratory phase of this project. A major research effort was launched early in this project to identify the materials and mixtures to be used, develop a construction plan for the fabrication of the test girders, and develop a comprehensive instrumentation strategy to track the long-term behavior of the in situ girders. This chapter highlights the main aspects of this implementation study, particularly those issues related to the instrumentation and long-term monitoring regime. More detailed information on the showcase bridge design and construction plan can be found in theses by Figurski and Ley.
It should be noted that this showcase bridge was expected to be constructed as part of TxDOT Project 0-4085, but owing to environmental permitting issues, which were beyond the control of the research team, the girder fabrication and bridge construction were delayed beyond the completion of TxDOT Project 0-4085. It is assumed that this implementation project will ultimately be initiated under the direction of the TxDOT Project 0-4085 research team. As such, this chapter presents the research done to date, which constitutes the preparation for the showcase bridge, and describes the field implementation plan that hopefully will be executed in the coming years. If, owing to scheduling constraints or other limitations, it is found that the intended showcase bridge in Conroe cannot be constructed as planned, it is hoped that a similar bridge will be selected for this unique field demonstration.
8.2 Showcase Bridge The bridge to be instrumented is a twelve-span bridge that is approximately 700 feet in
total length and varies in width between 168 and 174 feet. The structural system for the bridge is prestressed Type B beams on hammerhead piers and is oriented at an 80o skew. The bridge spans a relief channel near the San Jacinto River, south of Conroe, Texas, on I-45 and accommodates eight lanes of traffic.
The girders instrumented for this project will be those that span the exterior sides of the bridge. Because the bridge has twelve spans, there are twenty-four total instrumented girders. The length of twenty-two of the twenty-four girders is 60 feet (Figure 8.1). Owing to the skew of the bridge, there are two girders that are only 30 feet. In the twenty-four instrumented girders there are twelve different mitigation mixtures. The instrumented mitigation mixtures were placed on opposing sides of the bridge; however, for the two shorter beams the same mitigation mixture was used to maximize the amount of uniformity.
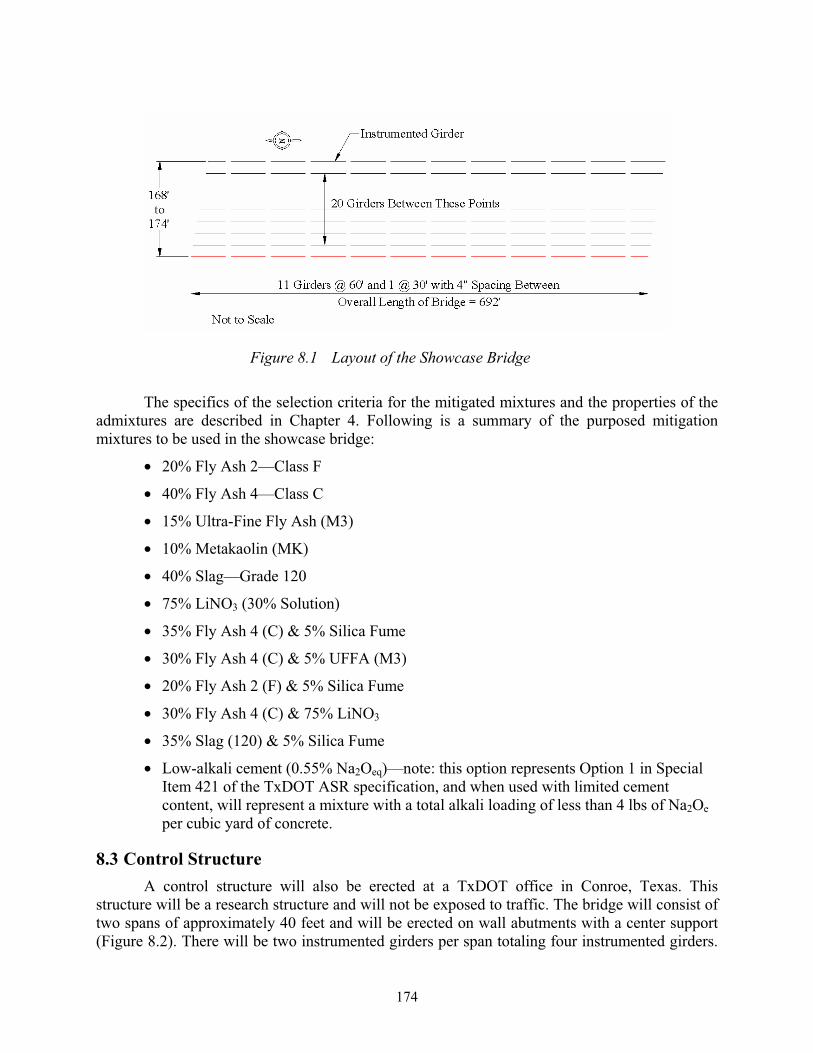
174
Figure 8.1 Layout of the Showcase Bridge
The specifics of the selection criteria for the mitigated mixtures and the properties of the admixtures are described in Chapter 4. Following is a summary of the purposed mitigation mixtures to be used in the showcase bridge:
• 20% Fly Ash 2—Class F
• 40% Fly Ash 4—Class C
• 15% Ultra-Fine Fly Ash (M3)
• 10% Metakaolin (MK)
• 40% Slag—Grade 120
• 75% LiNO3 (30% Solution)
• 35% Fly Ash 4 (C) & 5% Silica Fume
• 30% Fly Ash 4 (C) & 5% UFFA (M3)
• 20% Fly Ash 2 (F) & 5% Silica Fume
• 30% Fly Ash 4 (C) & 75% LiNO3
• 35% Slag (120) & 5% Silica Fume
• Low-alkali cement (0.55% Na2Oeq)—note: this option represents Option 1 in Special Item 421 of the TxDOT ASR specification, and when used with limited cement content, will represent a mixture with a total alkali loading of less than 4 lbs of Na2Oeper cubic yard of concrete.
8.3 Control Structure A control structure will also be erected at a TxDOT office in Conroe, Texas. This
structure will be a research structure and will not be exposed to traffic. The bridge will consist of two spans of approximately 40 feet and will be erected on wall abutments with a center support (Figure 8.2). There will be two instrumented girders per span totaling four instrumented girders.
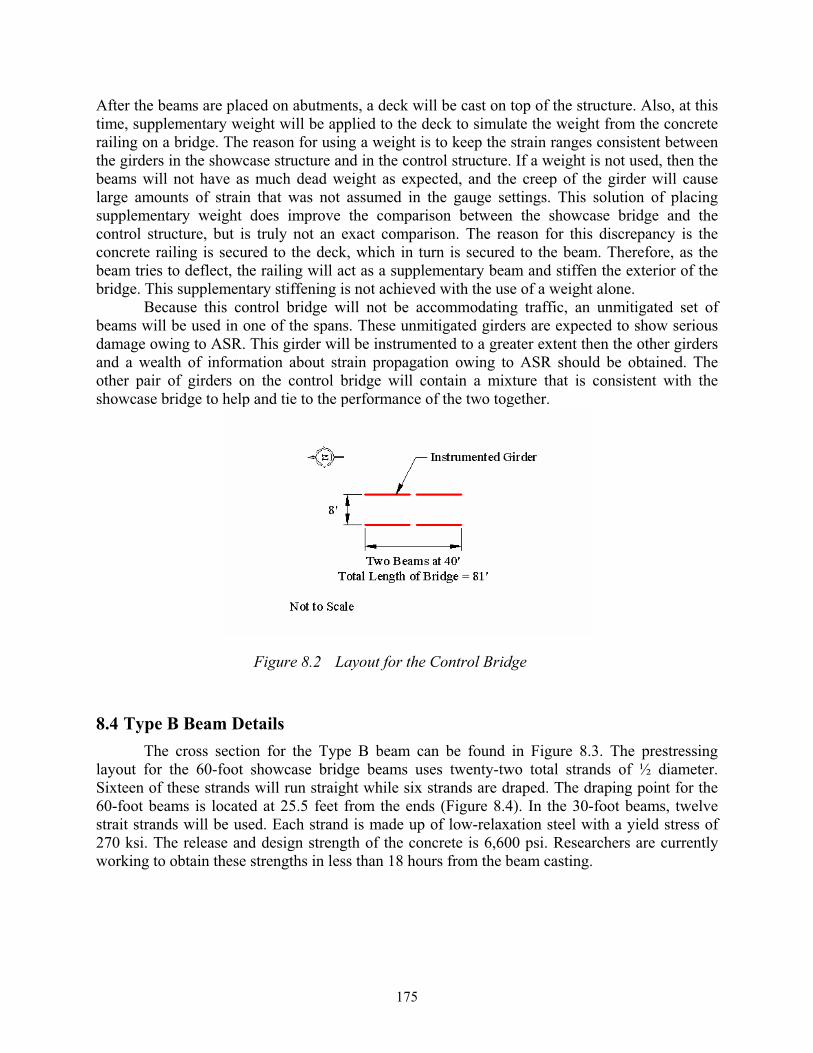
175
After the beams are placed on abutments, a deck will be cast on top of the structure. Also, at this time, supplementary weight will be applied to the deck to simulate the weight from the concrete railing on a bridge. The reason for using a weight is to keep the strain ranges consistent between the girders in the showcase structure and in the control structure. If a weight is not used, then the beams will not have as much dead weight as expected, and the creep of the girder will cause large amounts of strain that was not assumed in the gauge settings. This solution of placing supplementary weight does improve the comparison between the showcase bridge and the control structure, but is truly not an exact comparison. The reason for this discrepancy is the concrete railing is secured to the deck, which in turn is secured to the beam. Therefore, as the beam tries to deflect, the railing will act as a supplementary beam and stiffen the exterior of the bridge. This supplementary stiffening is not achieved with the use of a weight alone.
Because this control bridge will not be accommodating traffic, an unmitigated set of beams will be used in one of the spans. These unmitigated girders are expected to show serious damage owing to ASR. This girder will be instrumented to a greater extent then the other girders and a wealth of information about strain propagation owing to ASR should be obtained. The other pair of girders on the control bridge will contain a mixture that is consistent with the showcase bridge to help and tie to the performance of the two together.
Figure 8.2 Layout for the Control Bridge
8.4 Type B Beam Details The cross section for the Type B beam can be found in Figure 8.3. The prestressing
layout for the 60-foot showcase bridge beams uses twenty-two total strands of ½ diameter. Sixteen of these strands will run straight while six strands are draped. The draping point for the 60-foot beams is located at 25.5 feet from the ends (Figure 8.4). In the 30-foot beams, twelve strait strands will be used. Each strand is made up of low-relaxation steel with a yield stress of 270 ksi. The release and design strength of the concrete is 6,600 psi. Researchers are currently working to obtain these strengths in less than 18 hours from the beam casting.
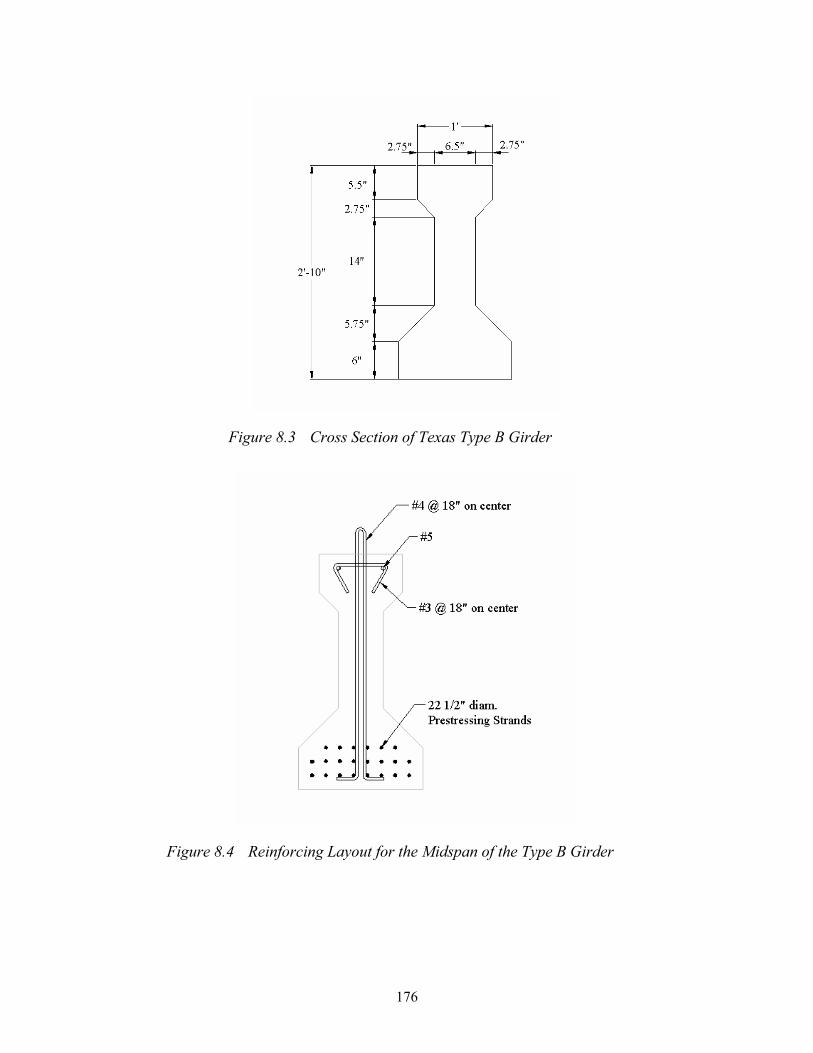
176
Figure 8.3 Cross Section of Texas Type B Girder
Figure 8.4 Reinforcing Layout for the Midspan of the Type B Girder
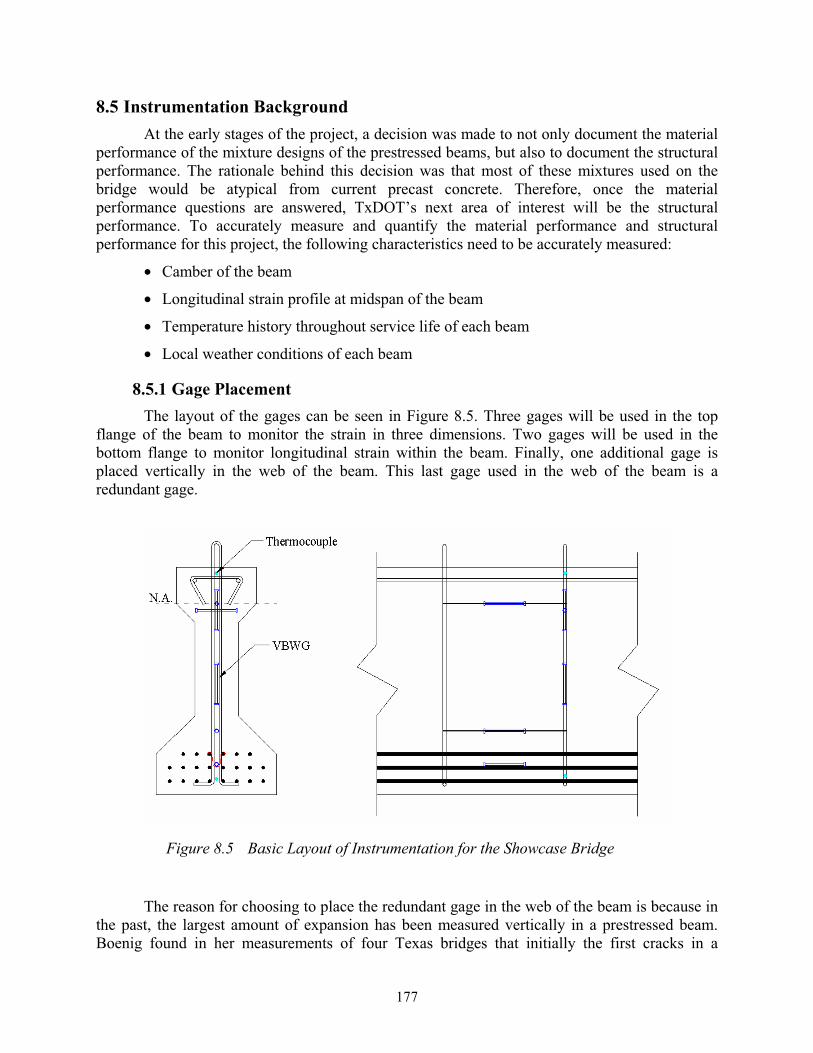
177
8.5 Instrumentation Background At the early stages of the project, a decision was made to not only document the material
performance of the mixture designs of the prestressed beams, but also to document the structural performance. The rationale behind this decision was that most of these mixtures used on the bridge would be atypical from current precast concrete. Therefore, once the material performance questions are answered, TxDOT’s next area of interest will be the structural performance. To accurately measure and quantify the material performance and structural performance for this project, the following characteristics need to be accurately measured:
• Camber of the beam
• Longitudinal strain profile at midspan of the beam
• Temperature history throughout service life of each beam
• Local weather conditions of each beam
8.5.1 Gage Placement The layout of the gages can be seen in Figure 8.5. Three gages will be used in the top
flange of the beam to monitor the strain in three dimensions. Two gages will be used in the bottom flange to monitor longitudinal strain within the beam. Finally, one additional gage is placed vertically in the web of the beam. This last gage used in the web of the beam is a redundant gage.
Figure 8.5 Basic Layout of Instrumentation for the Showcase Bridge
The reason for choosing to place the redundant gage in the web of the beam is because in the past, the largest amount of expansion has been measured vertically in a prestressed beam. Boenig found in her measurements of four Texas bridges that initially the first cracks in a
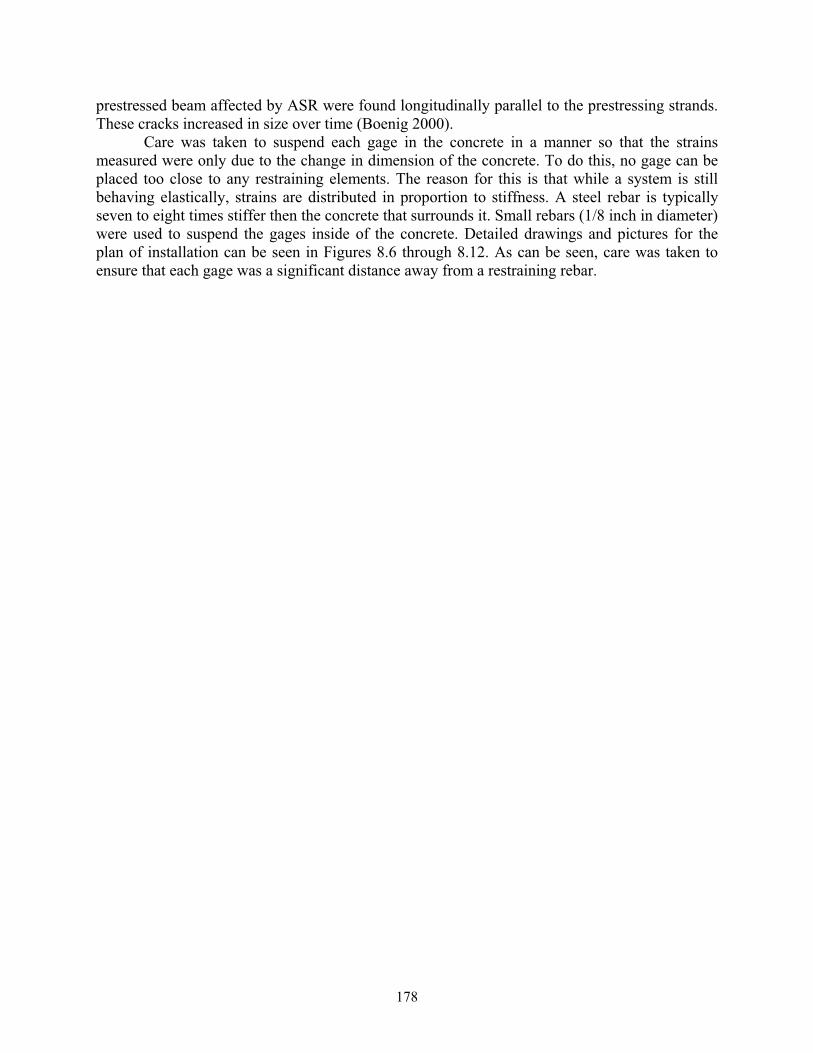
178
prestressed beam affected by ASR were found longitudinally parallel to the prestressing strands. These cracks increased in size over time (Boenig 2000).
Care was taken to suspend each gage in the concrete in a manner so that the strains measured were only due to the change in dimension of the concrete. To do this, no gage can be placed too close to any restraining elements. The reason for this is that while a system is still behaving elastically, strains are distributed in proportion to stiffness. A steel rebar is typically seven to eight times stiffer then the concrete that surrounds it. Small rebars (1/8 inch in diameter) were used to suspend the gages inside of the concrete. Detailed drawings and pictures for the plan of installation can be seen in Figures 8.6 through 8.12. As can be seen, care was taken to ensure that each gage was a significant distance away from a restraining rebar.
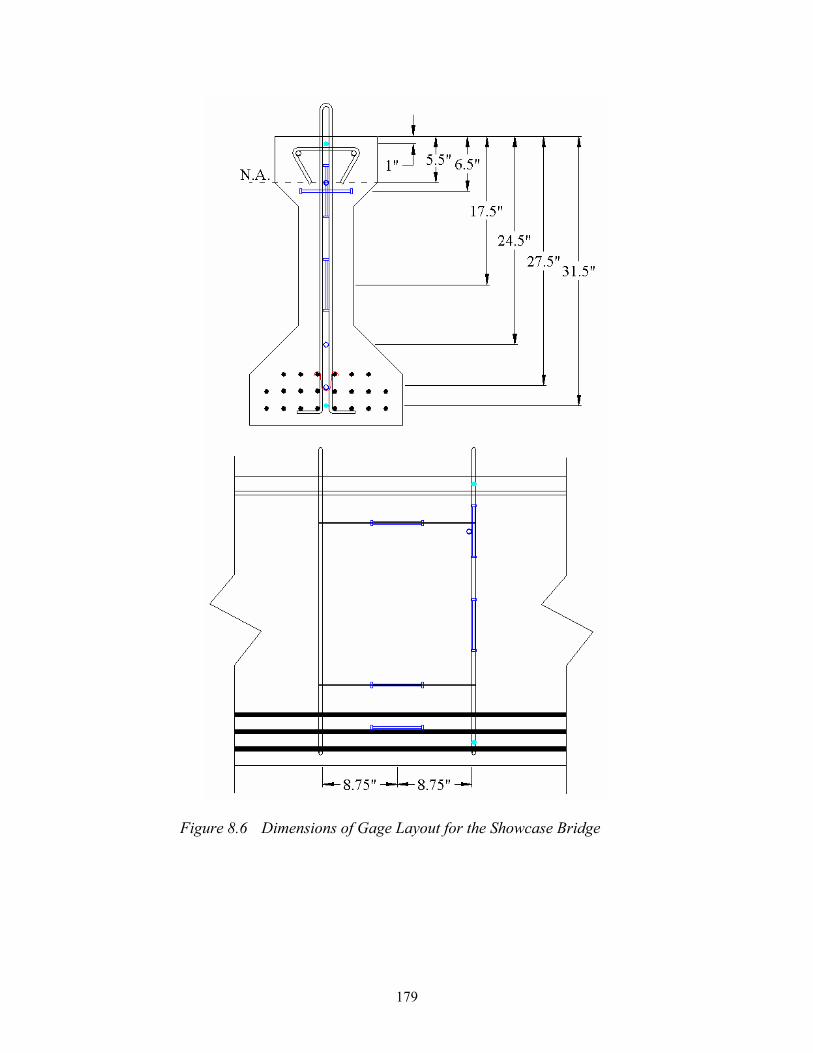
179
Figure 8.6 Dimensions of Gage Layout for the Showcase Bridge
180
Figure 8.7 Dimensions of Gage Layout for the Control Structure (Note: redundant gages are shown in violet and vibrating wire gages in red.)
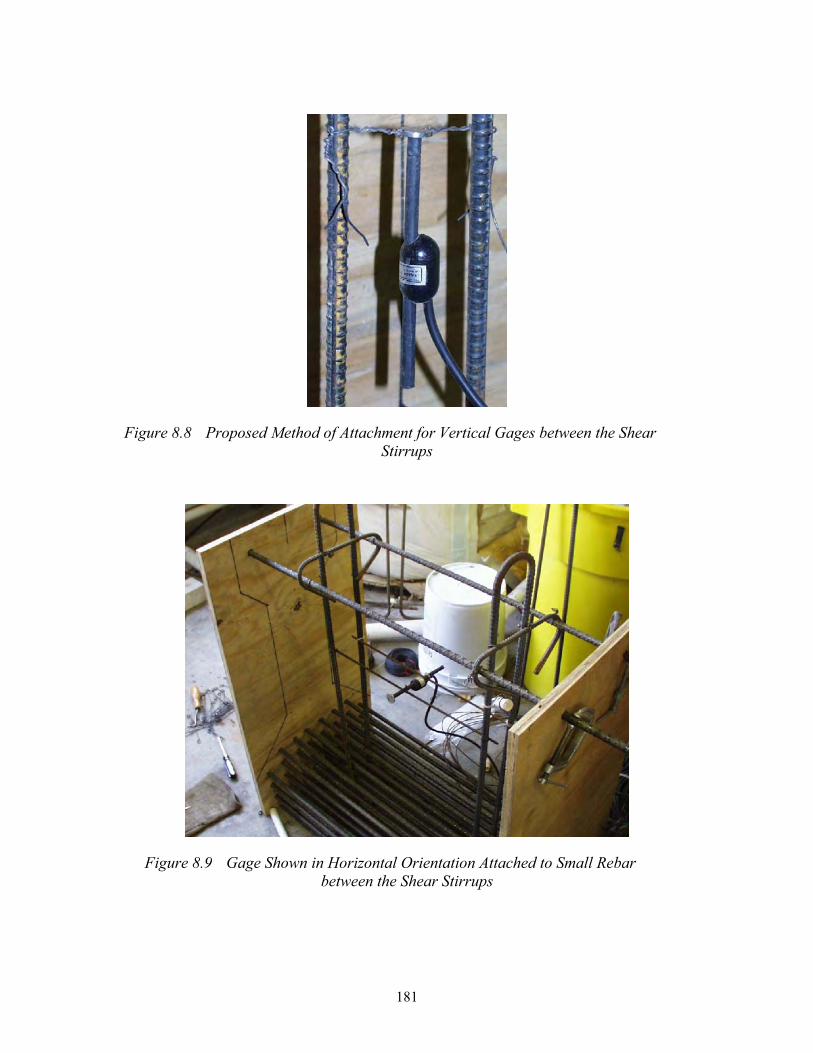
181
Figure 8.8 Proposed Method of Attachment for Vertical Gages between the Shear Stirrups
Figure 8.9 Gage Shown in Horizontal Orientation Attached to Small Rebarbetween the Shear Stirrups
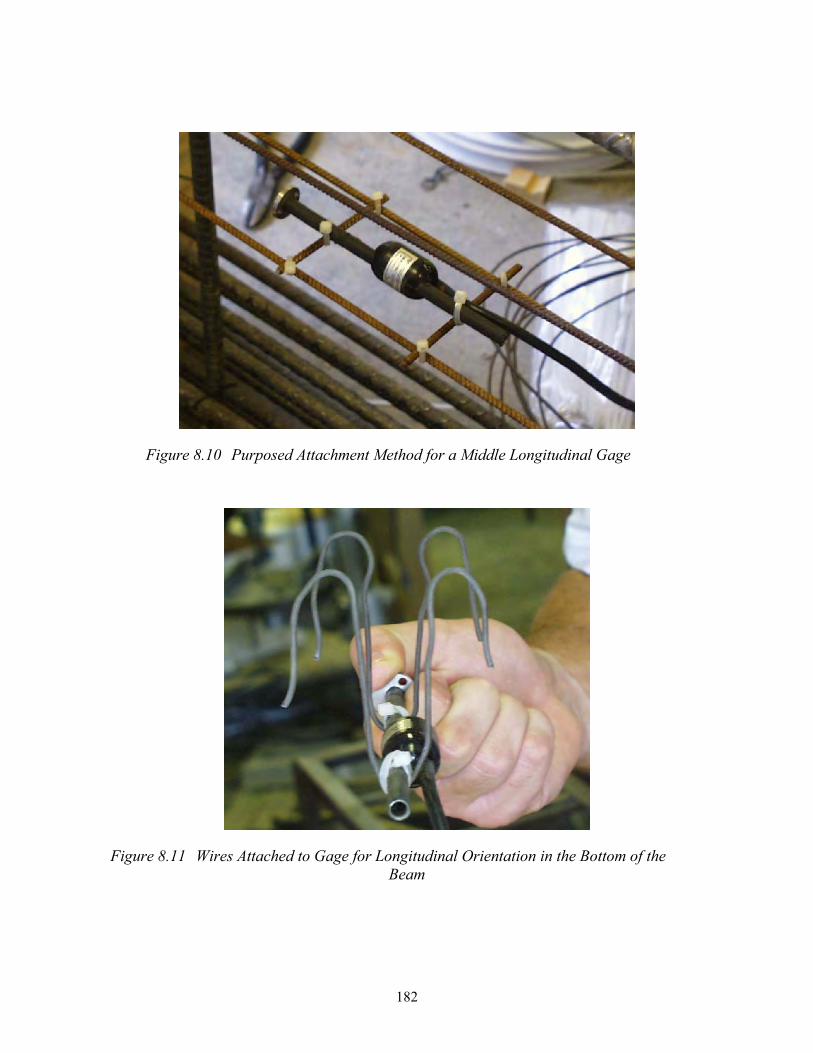
182
Figure 8.10 Purposed Attachment Method for a Middle Longitudinal Gage
Figure 8.11 Wires Attached to Gage for Longitudinal Orientation in the Bottom of the Beam
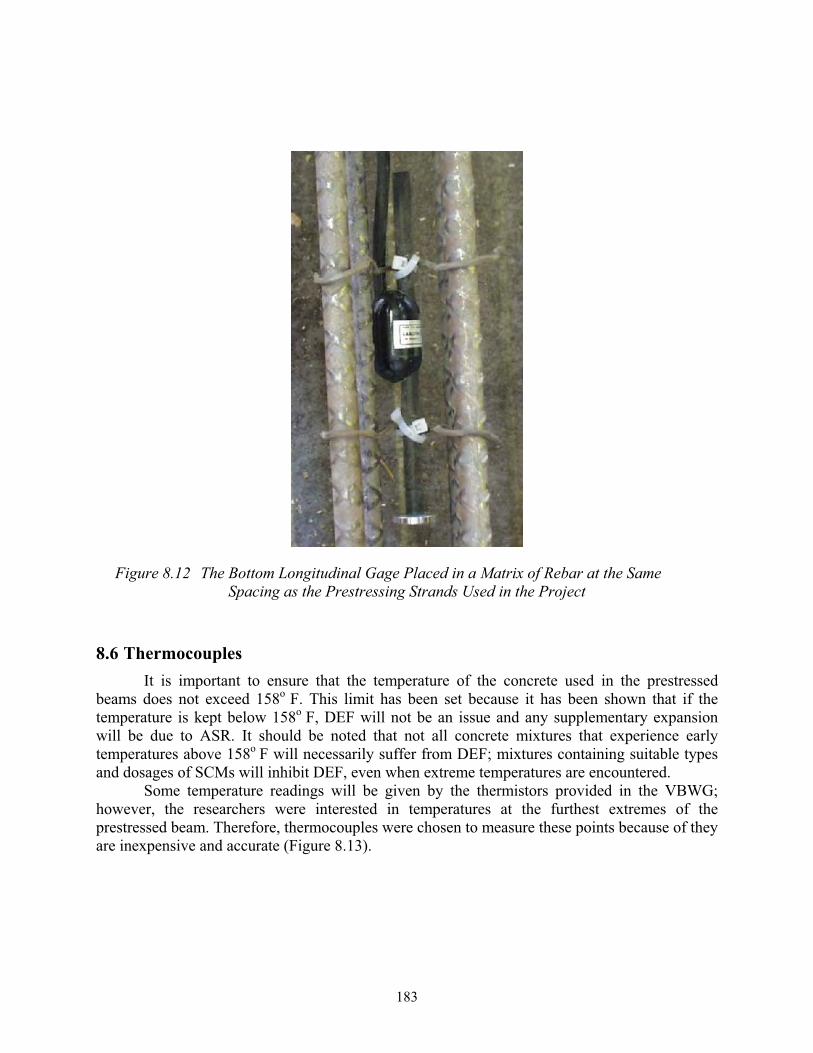
183
Figure 8.12 The Bottom Longitudinal Gage Placed in a Matrix of Rebar at the Same Spacing as the Prestressing Strands Used in the Project
8.6 ThermocouplesIt is important to ensure that the temperature of the concrete used in the prestressed
beams does not exceed 158o F. This limit has been set because it has been shown that if the temperature is kept below 158o F, DEF will not be an issue and any supplementary expansion will be due to ASR. It should be noted that not all concrete mixtures that experience early temperatures above 158o F will necessarily suffer from DEF; mixtures containing suitable types and dosages of SCMs will inhibit DEF, even when extreme temperatures are encountered.
Some temperature readings will be given by the thermistors provided in the VBWG; however, the researchers were interested in temperatures at the furthest extremes of the prestressed beam. Therefore, thermocouples were chosen to measure these points because of they are inexpensive and accurate (Figure 8.13).
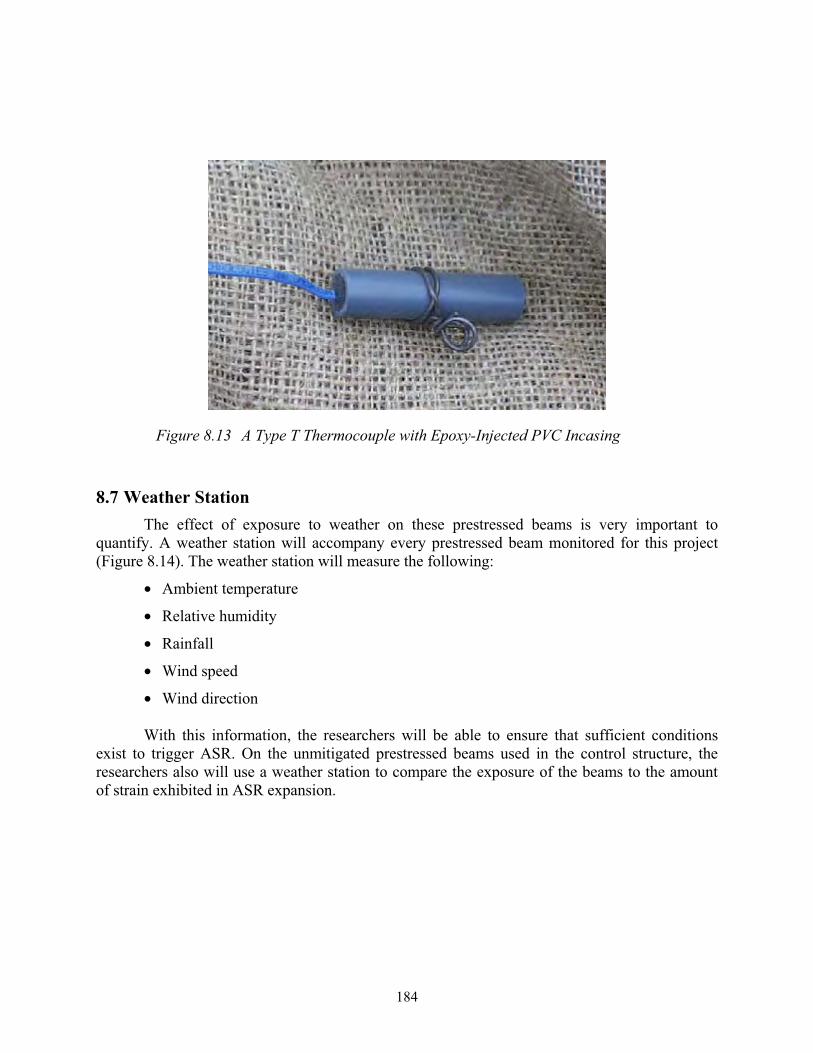
184
Figure 8.13 A Type T Thermocouple with Epoxy-Injected PVC Incasing
8.7 Weather Station The effect of exposure to weather on these prestressed beams is very important to
quantify. A weather station will accompany every prestressed beam monitored for this project (Figure 8.14). The weather station will measure the following:
• Ambient temperature
• Relative humidity
• Rainfall
• Wind speed
• Wind direction
With this information, the researchers will be able to ensure that sufficient conditions exist to trigger ASR. On the unmitigated prestressed beams used in the control structure, the researchers also will use a weather station to compare the exposure of the beams to the amount of strain exhibited in ASR expansion.
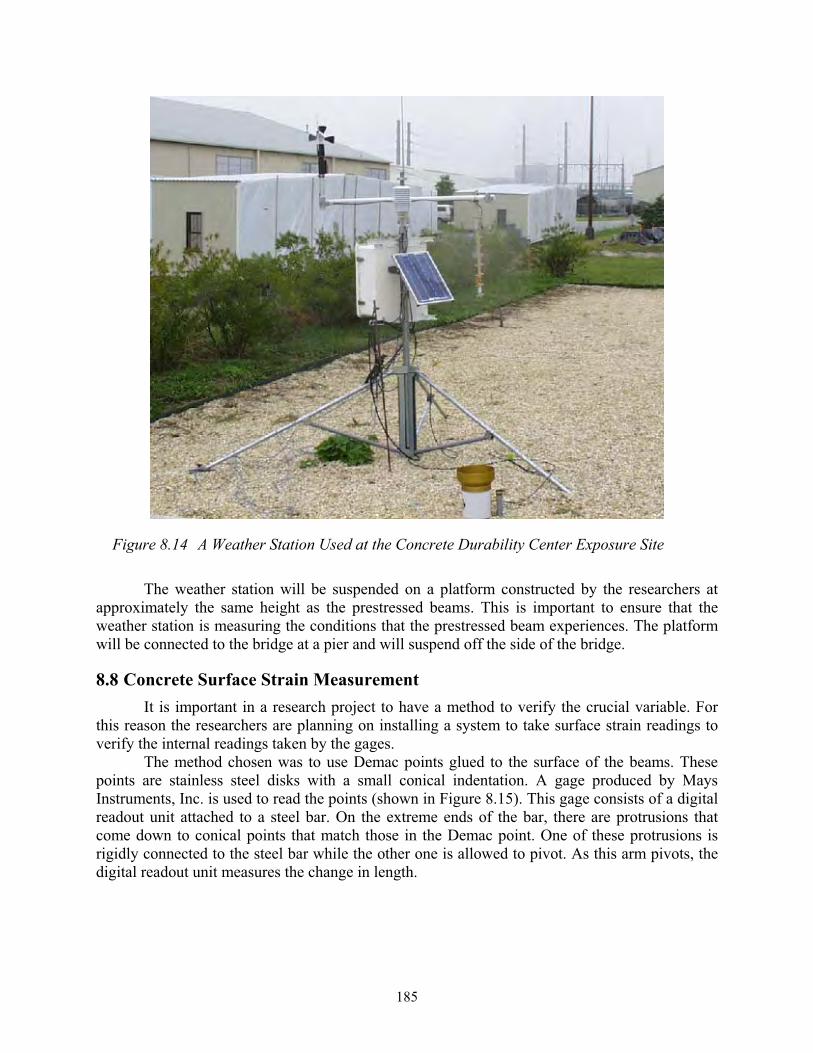
185
Figure 8.14 A Weather Station Used at the Concrete Durability Center Exposure Site
The weather station will be suspended on a platform constructed by the researchers at approximately the same height as the prestressed beams. This is important to ensure that the weather station is measuring the conditions that the prestressed beam experiences. The platform will be connected to the bridge at a pier and will suspend off the side of the bridge.
8.8 Concrete Surface Strain Measurement It is important in a research project to have a method to verify the crucial variable. For
this reason the researchers are planning on installing a system to take surface strain readings to verify the internal readings taken by the gages.
The method chosen was to use Demac points glued to the surface of the beams. These points are stainless steel disks with a small conical indentation. A gage produced by Mays Instruments, Inc. is used to read the points (shown in Figure 8.15). This gage consists of a digital readout unit attached to a steel bar. On the extreme ends of the bar, there are protrusions that come down to conical points that match those in the Demac point. One of these protrusions is rigidly connected to the steel bar while the other one is allowed to pivot. As this arm pivots, the digital readout unit measures the change in length.
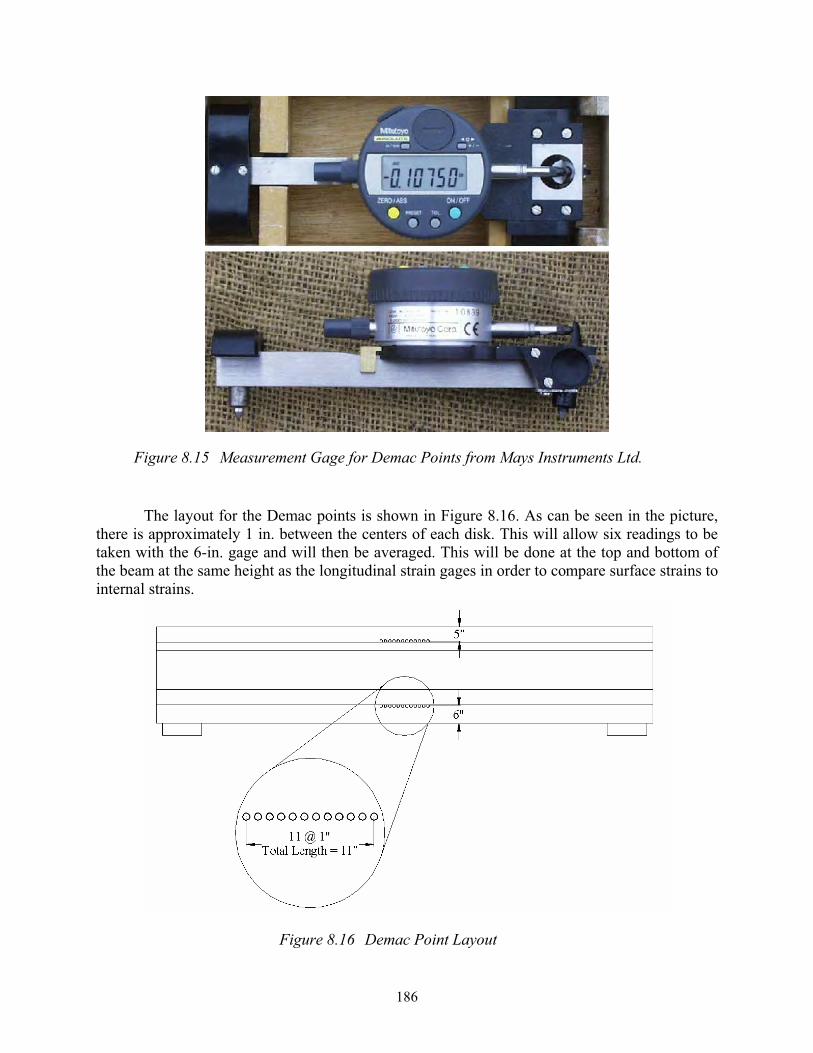
186
Figure 8.15 Measurement Gage for Demac Points from Mays Instruments Ltd.
The layout for the Demac points is shown in Figure 8.16. As can be seen in the picture, there is approximately 1 in. between the centers of each disk. This will allow six readings to be taken with the 6-in. gage and will then be averaged. This will be done at the top and bottom of the beam at the same height as the longitudinal strain gages in order to compare surface strains to internal strains.
Figure 8.16 Demac Point Layout
187
8.9 SummaryThis chapter summarized the overall plan for designing, constructing, and monitoring a
showcase bridge, featuring a wide range of mitigation strategies in a single, signature structure. A tremendous amount of effort and resources have been devoted to making this lofty goal a reality. It is hoped that the efforts will ultimately lead to full implementation of the plan. The TxDOT Project 0-4085 research team has procured all of the necessary instrumentation for such an endeavor, and if approval is granted in future years to initiate this field demonstration project, the team will be able to rapidly mobilize and execute the plan outlined in this chapter.

188
189
9. A Case Study in Premature Concrete Deterioration:The San Antonio Y
9.1 IntroductionThe vast majority of the research performed under TxDOT Project 0-4085 focused on
methods of preventing ASR and/or DEF in newly constructed concrete structures. Significant progress was made in understanding the underlying mechanisms, developing testing strategies to identify susceptible mixtures, and evaluating various options for preventing expansion and cracking.
Through this research, one issue that continued to arise was the relationship between DEF triggered in the laboratory and DEF in actual field structures. Specifically, the question that became critical was why it was so easy to trigger DEF in the laboratory, yet there are very few field instances of DEF. Most of the prior research performed or funded by TxDOT chose to group ASR and DEF together under the blanket term premature concrete deterioration, but little effort was put into identifying and isolating the specific causes of distress in field structures. Thus, as TxDOT Project 0-4085 progressed, gaps in understanding were identified that could only be addressed by moving from the lab to the field. For the most part, the research team had a firm grasp in relating laboratory testing to field performance with regard to ASR, both from participation in this project and several other ASR-related projects. The major need identified was to gain a better understanding of DEF-damaged structures, with the ultimate objective of tying this behavior to accelerated laboratory tests. The ultimate goal is to determine what mixtures might be susceptible to DEF and how to prevent damage from occurring. Ongoing research efforts are now underway at the Concrete Durability Center (CDC) to predict heat of hydration in mass concrete and precast elements (TxDOT Project 4563), with one key objective of preventing DEF by keeping concrete below the temperature threshold needed to trigger DEF. TxDOT Project 5218 is also being conducted at the CDC, which focuses on how to manage ASR- and/or DEF-affected structures, both from a materials and structures perspective. These related projects were all spurred by the findings presented in this chapter on the degradation of various bridge elements in the San Antonio Y. This chapter summarizes some of these key findings; more information can be found in the thesis by Williams (2005).
The TxDOT Project 0-4085 research team has been actively involved in evaluating the causes and extent of damage of various structural elements within the San Antonio Y. The research team has interacted extensively with TxDOT engineers and has benefited from the assistance of TxDOT personnel in obtaining more than fifty concrete cores from various structural elements. The overall findings of this investigation have been previously reported to TxDOT, and the key findings are presented herein. After briefly summarizing the findings to date under TxDOT 0-4085, this section presents an overview of some of the upcoming and ongoing research focusing on the San Antonio Y.
9.2 Background and Motivation for Research Dr. Folliard first interacted with Dr. Moon Won from TxDOT on the San Antonio Y in
mid-2003 and viewed scanning electron microscopy (SEM) specimens that were obtained from one of the most damaged columns in the structure, referred to as DD-6. Based on this early
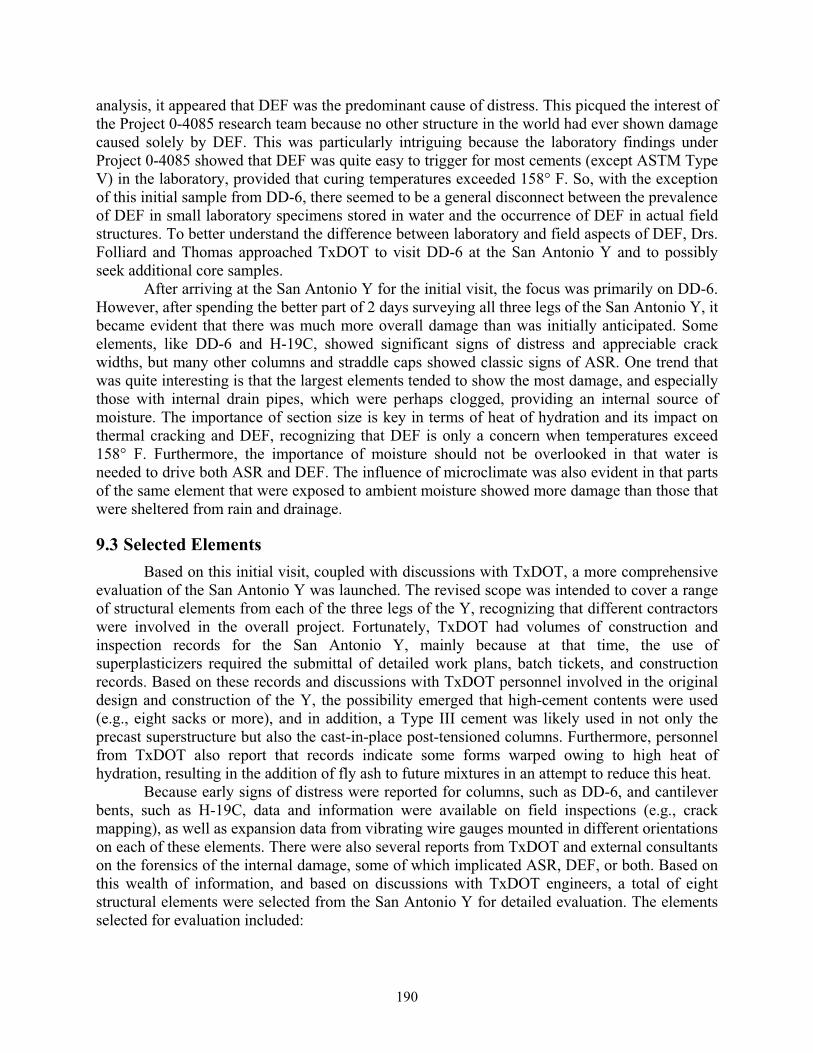
190
analysis, it appeared that DEF was the predominant cause of distress. This picqued the interest of the Project 0-4085 research team because no other structure in the world had ever shown damage caused solely by DEF. This was particularly intriguing because the laboratory findings under Project 0-4085 showed that DEF was quite easy to trigger for most cements (except ASTM Type V) in the laboratory, provided that curing temperatures exceeded 158° F. So, with the exception of this initial sample from DD-6, there seemed to be a general disconnect between the prevalence of DEF in small laboratory specimens stored in water and the occurrence of DEF in actual field structures. To better understand the difference between laboratory and field aspects of DEF, Drs. Folliard and Thomas approached TxDOT to visit DD-6 at the San Antonio Y and to possibly seek additional core samples.
After arriving at the San Antonio Y for the initial visit, the focus was primarily on DD-6. However, after spending the better part of 2 days surveying all three legs of the San Antonio Y, it became evident that there was much more overall damage than was initially anticipated. Some elements, like DD-6 and H-19C, showed significant signs of distress and appreciable crack widths, but many other columns and straddle caps showed classic signs of ASR. One trend that was quite interesting is that the largest elements tended to show the most damage, and especially those with internal drain pipes, which were perhaps clogged, providing an internal source of moisture. The importance of section size is key in terms of heat of hydration and its impact on thermal cracking and DEF, recognizing that DEF is only a concern when temperatures exceed 158° F. Furthermore, the importance of moisture should not be overlooked in that water is needed to drive both ASR and DEF. The influence of microclimate was also evident in that parts of the same element that were exposed to ambient moisture showed more damage than those that were sheltered from rain and drainage.
9.3 Selected Elements Based on this initial visit, coupled with discussions with TxDOT, a more comprehensive
evaluation of the San Antonio Y was launched. The revised scope was intended to cover a range of structural elements from each of the three legs of the Y, recognizing that different contractors were involved in the overall project. Fortunately, TxDOT had volumes of construction and inspection records for the San Antonio Y, mainly because at that time, the use of superplasticizers required the submittal of detailed work plans, batch tickets, and construction records. Based on these records and discussions with TxDOT personnel involved in the original design and construction of the Y, the possibility emerged that high-cement contents were used (e.g., eight sacks or more), and in addition, a Type III cement was likely used in not only the precast superstructure but also the cast-in-place post-tensioned columns. Furthermore, personnel from TxDOT also report that records indicate some forms warped owing to high heat of hydration, resulting in the addition of fly ash to future mixtures in an attempt to reduce this heat.
Because early signs of distress were reported for columns, such as DD-6, and cantilever bents, such as H-19C, data and information were available on field inspections (e.g., crack mapping), as well as expansion data from vibrating wire gauges mounted in different orientations on each of these elements. There were also several reports from TxDOT and external consultants on the forensics of the internal damage, some of which implicated ASR, DEF, or both. Based on this wealth of information, and based on discussions with TxDOT engineers, a total of eight structural elements were selected from the San Antonio Y for detailed evaluation. The elements selected for evaluation included:
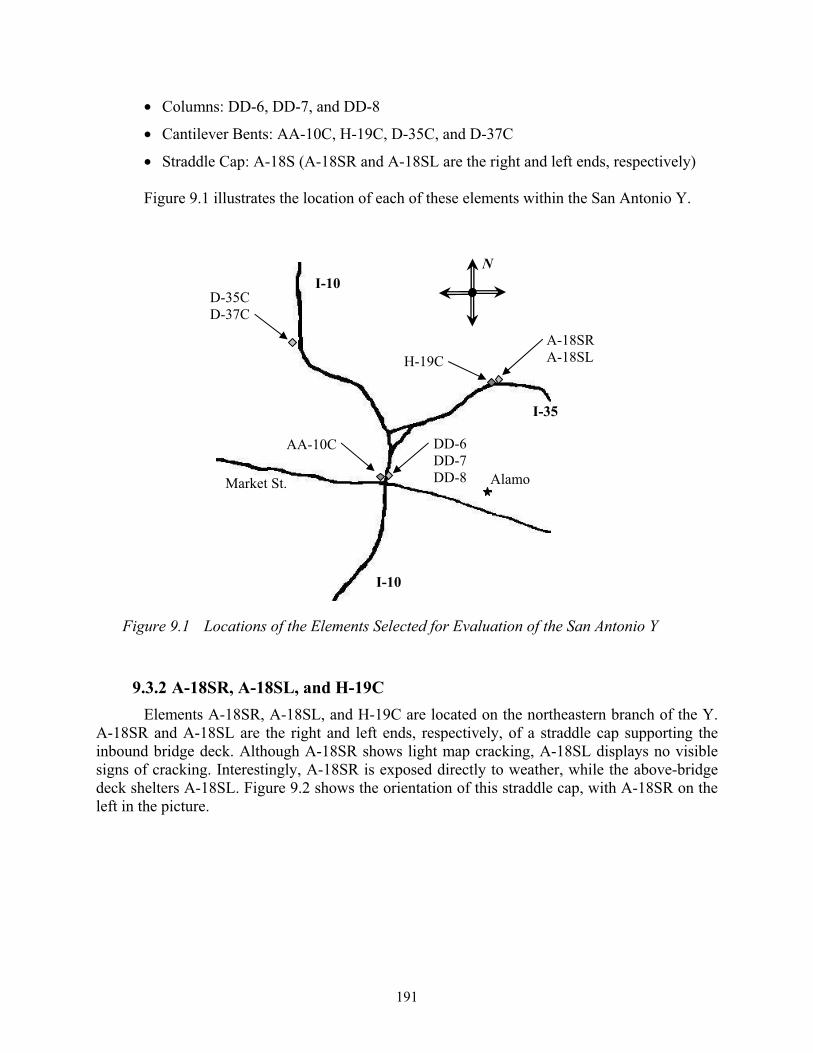
191
• Columns: DD-6, DD-7, and DD-8
• Cantilever Bents: AA-10C, H-19C, D-35C, and D-37C
• Straddle Cap: A-18S (A-18SR and A-18SL are the right and left ends, respectively)
Figure 9.1 illustrates the location of each of these elements within the San Antonio Y.
Figure 9.1 Locations of the Elements Selected for Evaluation of the San Antonio Y
9.3.2 A-18SR, A-18SL, and H-19C Elements A-18SR, A-18SL, and H-19C are located on the northeastern branch of the Y.
A-18SR and A-18SL are the right and left ends, respectively, of a straddle cap supporting the inbound bridge deck. Although A-18SR shows light map cracking, A-18SL displays no visible signs of cracking. Interestingly, A-18SR is exposed directly to weather, while the above-bridge deck shelters A-18SL. Figure 9.2 shows the orientation of this straddle cap, with A-18SR on the left in the picture.
N
Alamo
D-35CD-37C
DD-6DD-7DD-8
A-18SRA-18SLH-19C
AA-10C
Market St.
I-10
I-35
I-10
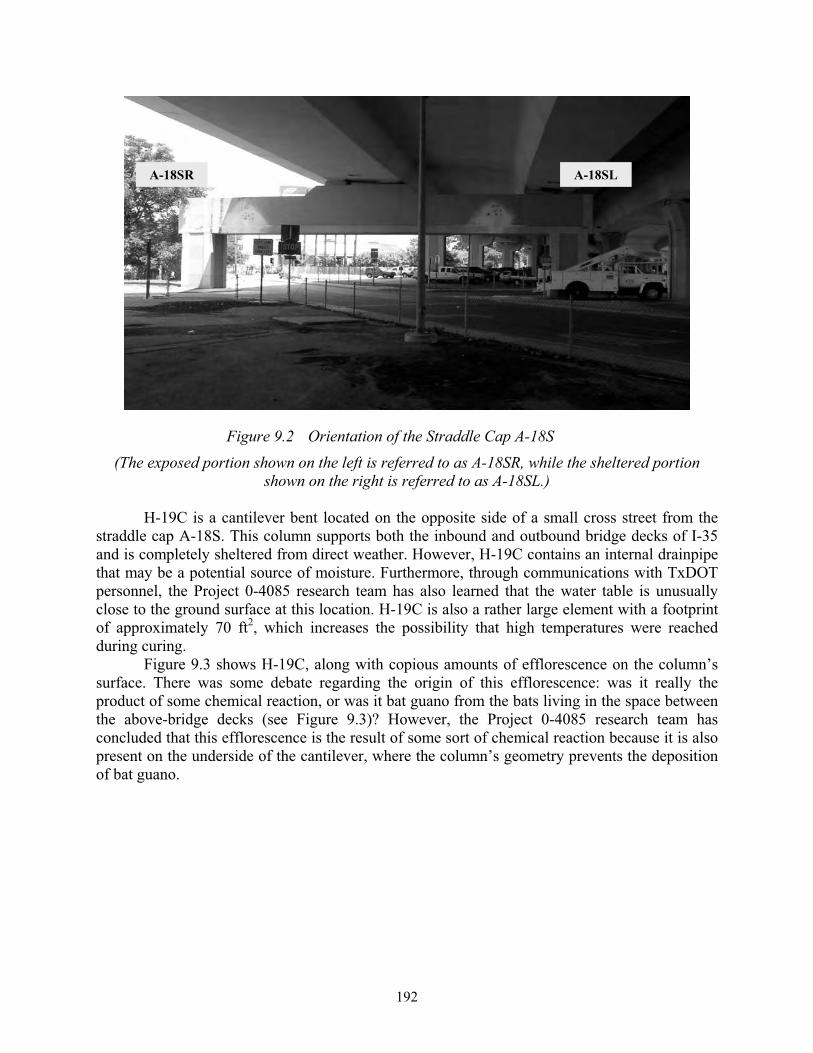
192
Figure 9.2 Orientation of the Straddle Cap A-18S (The exposed portion shown on the left is referred to as A-18SR, while the sheltered portion
shown on the right is referred to as A-18SL.)
H-19C is a cantilever bent located on the opposite side of a small cross street from the straddle cap A-18S. This column supports both the inbound and outbound bridge decks of I-35 and is completely sheltered from direct weather. However, H-19C contains an internal drainpipe that may be a potential source of moisture. Furthermore, through communications with TxDOT personnel, the Project 0-4085 research team has also learned that the water table is unusually close to the ground surface at this location. H-19C is also a rather large element with a footprint of approximately 70 ft2, which increases the possibility that high temperatures were reached during curing.
Figure 9.3 shows H-19C, along with copious amounts of efflorescence on the column’s surface. There was some debate regarding the origin of this efflorescence: was it really the product of some chemical reaction, or was it bat guano from the bats living in the space between the above-bridge decks (see Figure 9.3)? However, the Project 0-4085 research team has concluded that this efflorescence is the result of some sort of chemical reaction because it is also present on the underside of the cantilever, where the column’s geometry prevents the deposition of bat guano.
A-18SR A-18SL
193
Figure 9.3 Element H-19C with Copious Amounts of Efflorescence on Its Surface
Previous petrographic analysis of H-19C conducted by Erlin Hime Associates (EHA) under WJE in 1997 suggests that the concrete is a 6.5–7.5 sack mixture with a water-cement ratio of 0.35 (Patty 1997). The coarse aggregate component of the concrete is crushed limestone with traces of chert and the fine aggregate component is 60 percent manufactured limestone sand blended with 40 percent natural siliceous sand. In addition, EHA also concluded that the concrete in this column contains a Type I cement with approximately 1 percent air. EHA observed traces of ASR gel, but concluded that this gel was not associated with any distress mechanism in the concrete. They also reported that they did not observe any abnormal deposits of ettringite or any sign of DEF.
In contrast to these findings, an internal memo and batch tickets from TxDOT indicate that this column may contain Type III cement. This same memo states that the contractor used an identical mixture design for the super- and sub-structure throughout the construction. The batch tickets also indicate that the average concrete temperature at the time of casting (9:00 a.m.) was 81° F and that an eight-sack mixture was used.
9.4 DD-6, DD-7, DD-8, and AA-10C Elements DD-6, DD-7, DD-8, and AA-10C are located on the southern branch of the San
Antonio Y. DD-6, DD-7, and DD-8 are columns supporting the northbound bridge deck and AA-10C is a cantilever bent supporting the southbound bridge deck. Out of these four elements, DD-6 shows the most significant signs of deterioration. DD-7 is adjacent to DD-6, but shows less cracking and DD-8 is adjacent to DD-7, but showed no signs of visible cracking in August 2003. In addition to being the only column out of this set of three that is completely sheltered by the
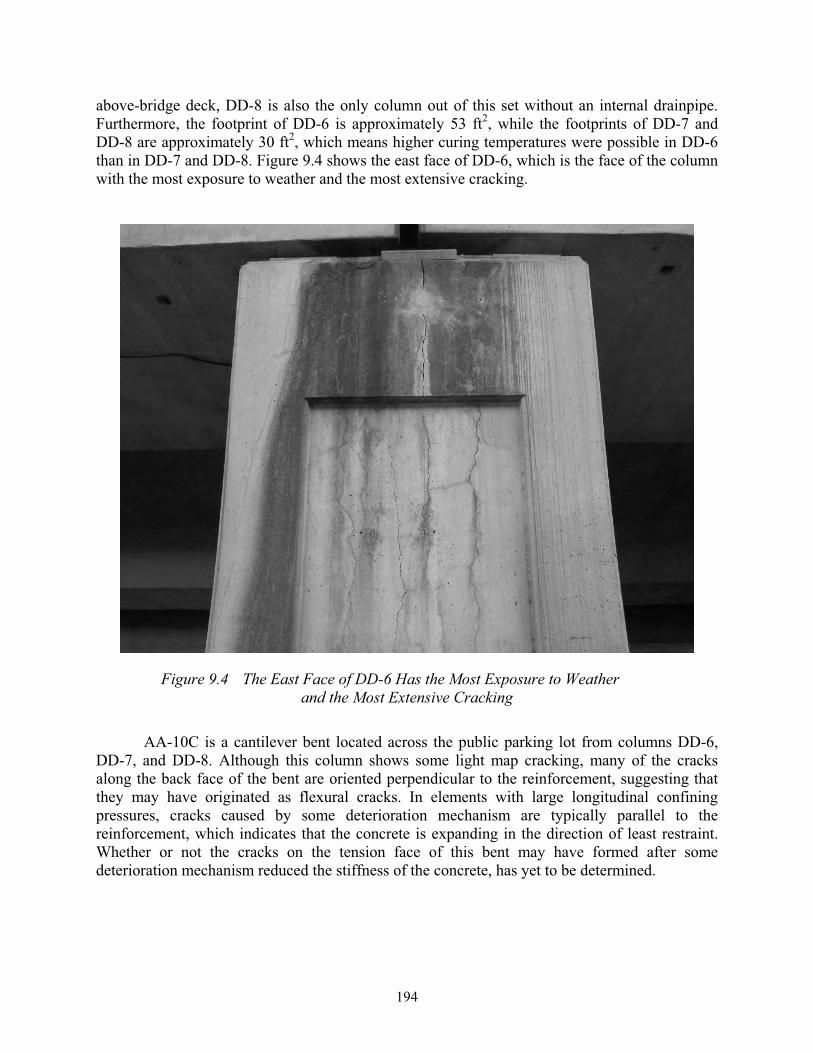
194
above-bridge deck, DD-8 is also the only column out of this set without an internal drainpipe. Furthermore, the footprint of DD-6 is approximately 53 ft2, while the footprints of DD-7 and DD-8 are approximately 30 ft2, which means higher curing temperatures were possible in DD-6 than in DD-7 and DD-8. Figure 9.4 shows the east face of DD-6, which is the face of the column with the most exposure to weather and the most extensive cracking.
Figure 9.4 The East Face of DD-6 Has the Most Exposure to Weatherand the Most Extensive Cracking
AA-10C is a cantilever bent located across the public parking lot from columns DD-6, DD-7, and DD-8. Although this column shows some light map cracking, many of the cracks along the back face of the bent are oriented perpendicular to the reinforcement, suggesting that they may have originated as flexural cracks. In elements with large longitudinal confining pressures, cracks caused by some deterioration mechanism are typically parallel to the reinforcement, which indicates that the concrete is expanding in the direction of least restraint. Whether or not the cracks on the tension face of this bent may have formed after some deterioration mechanism reduced the stiffness of the concrete, has yet to be determined.
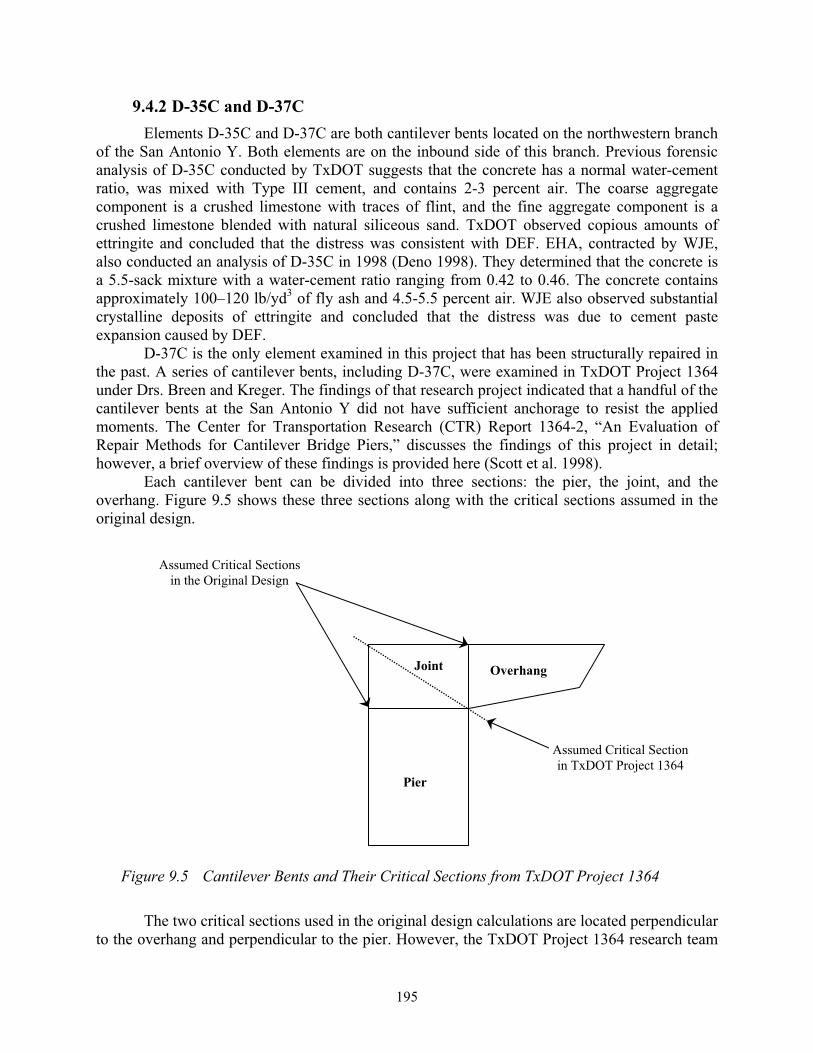
195
9.4.2 D-35C and D-37C Elements D-35C and D-37C are both cantilever bents located on the northwestern branch
of the San Antonio Y. Both elements are on the inbound side of this branch. Previous forensic analysis of D-35C conducted by TxDOT suggests that the concrete has a normal water-cement ratio, was mixed with Type III cement, and contains 2-3 percent air. The coarse aggregate component is a crushed limestone with traces of flint, and the fine aggregate component is a crushed limestone blended with natural siliceous sand. TxDOT observed copious amounts of ettringite and concluded that the distress was consistent with DEF. EHA, contracted by WJE, also conducted an analysis of D-35C in 1998 (Deno 1998). They determined that the concrete is a 5.5-sack mixture with a water-cement ratio ranging from 0.42 to 0.46. The concrete contains approximately 100–120 lb/yd3 of fly ash and 4.5-5.5 percent air. WJE also observed substantial crystalline deposits of ettringite and concluded that the distress was due to cement paste expansion caused by DEF.
D-37C is the only element examined in this project that has been structurally repaired in the past. A series of cantilever bents, including D-37C, were examined in TxDOT Project 1364 under Drs. Breen and Kreger. The findings of that research project indicated that a handful of the cantilever bents at the San Antonio Y did not have sufficient anchorage to resist the applied moments. The Center for Transportation Research (CTR) Report 1364-2, “An Evaluation of Repair Methods for Cantilever Bridge Piers,” discusses the findings of this project in detail; however, a brief overview of these findings is provided here (Scott et al. 1998).
Each cantilever bent can be divided into three sections: the pier, the joint, and the overhang. Figure 9.5 shows these three sections along with the critical sections assumed in the original design.
Figure 9.5 Cantilever Bents and Their Critical Sections from TxDOT Project 1364
The two critical sections used in the original design calculations are located perpendicular to the overhang and perpendicular to the pier. However, the TxDOT Project 1364 research team
Joint Overhang
Pier
Assumed Critical Sections in the Original Design
Assumed Critical Section in TxDOT Project 1364
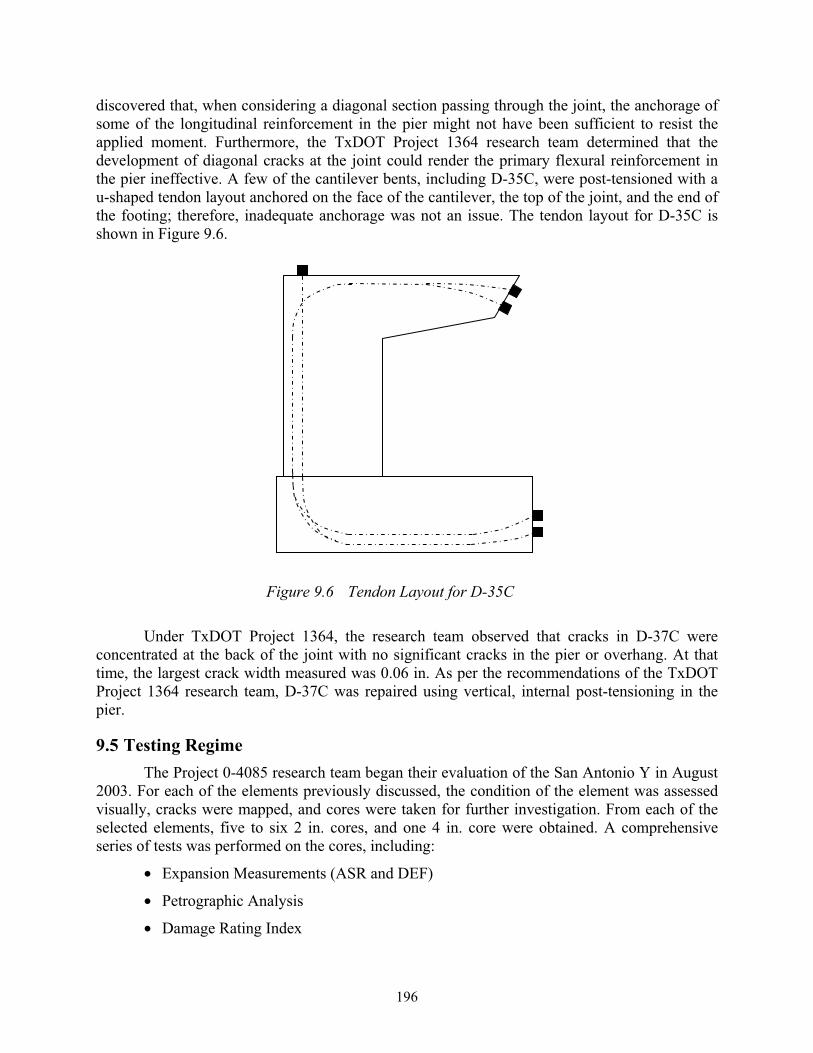
196
discovered that, when considering a diagonal section passing through the joint, the anchorage of some of the longitudinal reinforcement in the pier might not have been sufficient to resist the applied moment. Furthermore, the TxDOT Project 1364 research team determined that the development of diagonal cracks at the joint could render the primary flexural reinforcement in the pier ineffective. A few of the cantilever bents, including D-35C, were post-tensioned with a u-shaped tendon layout anchored on the face of the cantilever, the top of the joint, and the end of the footing; therefore, inadequate anchorage was not an issue. The tendon layout for D-35C is shown in Figure 9.6.
Figure 9.6 Tendon Layout for D-35C
Under TxDOT Project 1364, the research team observed that cracks in D-37C were concentrated at the back of the joint with no significant cracks in the pier or overhang. At that time, the largest crack width measured was 0.06 in. As per the recommendations of the TxDOT Project 1364 research team, D-37C was repaired using vertical, internal post-tensioning in the pier.
9.5 Testing Regime The Project 0-4085 research team began their evaluation of the San Antonio Y in August
2003. For each of the elements previously discussed, the condition of the element was assessed visually, cracks were mapped, and cores were taken for further investigation. From each of the selected elements, five to six 2 in. cores, and one 4 in. core were obtained. A comprehensive series of tests was performed on the cores, including:
• Expansion Measurements (ASR and DEF)
• Petrographic Analysis
• Damage Rating Index
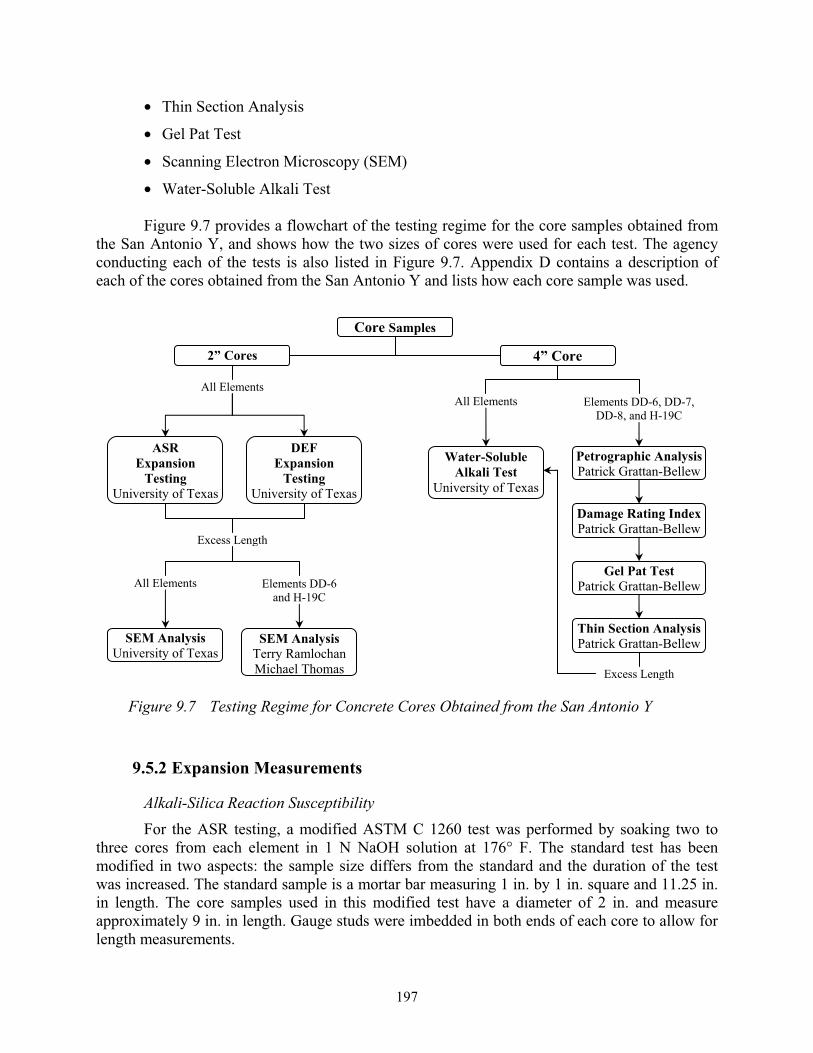
197
• Thin Section Analysis
• Gel Pat Test
• Scanning Electron Microscopy (SEM)
• Water-Soluble Alkali Test
Figure 9.7 provides a flowchart of the testing regime for the core samples obtained from the San Antonio Y, and shows how the two sizes of cores were used for each test. The agency conducting each of the tests is also listed in Figure 9.7. Appendix D contains a description of each of the cores obtained from the San Antonio Y and lists how each core sample was used.
Figure 9.7 Testing Regime for Concrete Cores Obtained from the San Antonio Y
9.5.2 Expansion Measurements
Alkali-Silica Reaction Susceptibility For the ASR testing, a modified ASTM C 1260 test was performed by soaking two to
three cores from each element in 1 N NaOH solution at 176° F. The standard test has been modified in two aspects: the sample size differs from the standard and the duration of the test was increased. The standard sample is a mortar bar measuring 1 in. by 1 in. square and 11.25 in. in length. The core samples used in this modified test have a diameter of 2 in. and measure approximately 9 in. in length. Gauge studs were imbedded in both ends of each core to allow for length measurements.
ASR Expansion
Testing University of Texas
2” Cores 4” Core
Core Samples
DEFExpansion
Testing University of Texas
Petrographic AnalysisPatrick Grattan-Bellew
Water-Soluble Alkali Test
University of Texas
Thin Section AnalysisPatrick Grattan-Bellew
Damage Rating IndexPatrick Grattan-Bellew
SEM Analysis University of Texas
SEM Analysis Terry Ramlochan Michael Thomas
Gel Pat Test Patrick Grattan-Bellew
Elements DD-6, DD-7, DD-8, and H-19C
All Elements
Elements DD-6 and H-19C
All Elements
All Elements
Excess Length
Excess Length
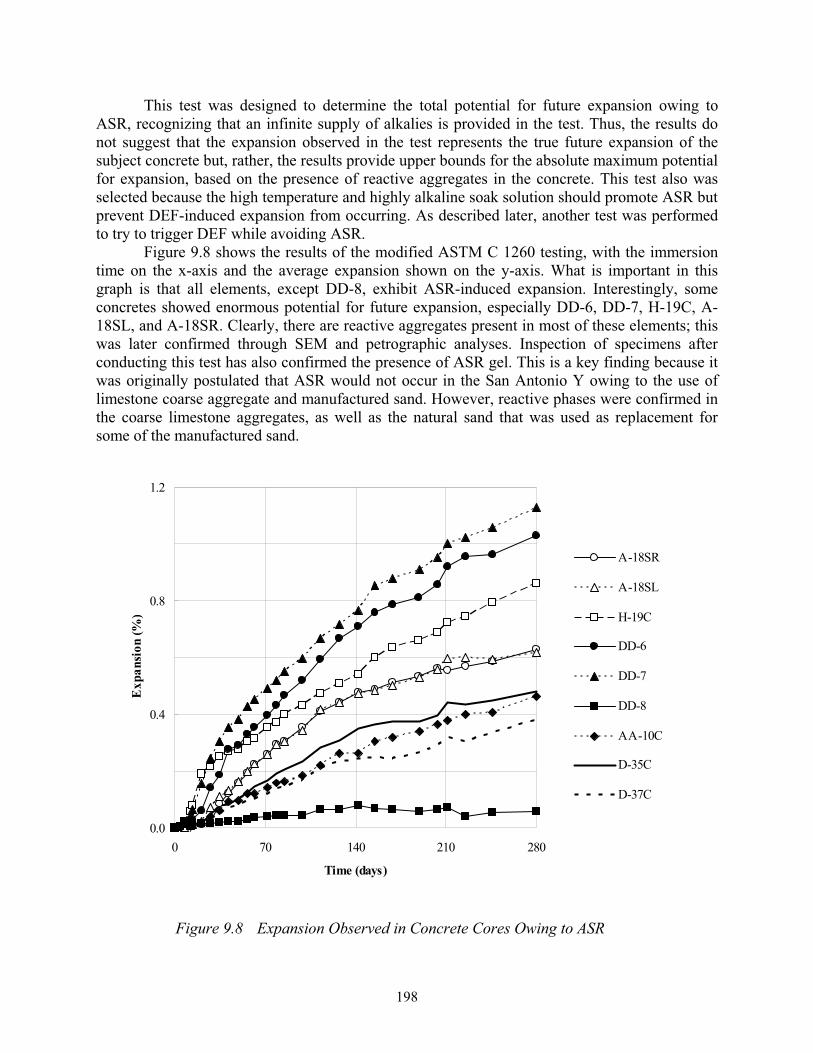
198
This test was designed to determine the total potential for future expansion owing to ASR, recognizing that an infinite supply of alkalies is provided in the test. Thus, the results do not suggest that the expansion observed in the test represents the true future expansion of the subject concrete but, rather, the results provide upper bounds for the absolute maximum potential for expansion, based on the presence of reactive aggregates in the concrete. This test also was selected because the high temperature and highly alkaline soak solution should promote ASR but prevent DEF-induced expansion from occurring. As described later, another test was performed to try to trigger DEF while avoiding ASR.
Figure 9.8 shows the results of the modified ASTM C 1260 testing, with the immersion time on the x-axis and the average expansion shown on the y-axis. What is important in this graph is that all elements, except DD-8, exhibit ASR-induced expansion. Interestingly, some concretes showed enormous potential for future expansion, especially DD-6, DD-7, H-19C, A-18SL, and A-18SR. Clearly, there are reactive aggregates present in most of these elements; this was later confirmed through SEM and petrographic analyses. Inspection of specimens after conducting this test has also confirmed the presence of ASR gel. This is a key finding because it was originally postulated that ASR would not occur in the San Antonio Y owing to the use of limestone coarse aggregate and manufactured sand. However, reactive phases were confirmed in the coarse limestone aggregates, as well as the natural sand that was used as replacement for some of the manufactured sand.
0.0
0.4
0.8
1.2
0 70 140 210 280
Time (days)
Exp
ansi
on (%
)
A-18SR
A-18SL
H-19C
DD-6
DD-7
DD-8
AA-10C
D-35C
D-37C
Figure 9.8 Expansion Observed in Concrete Cores Owing to ASR
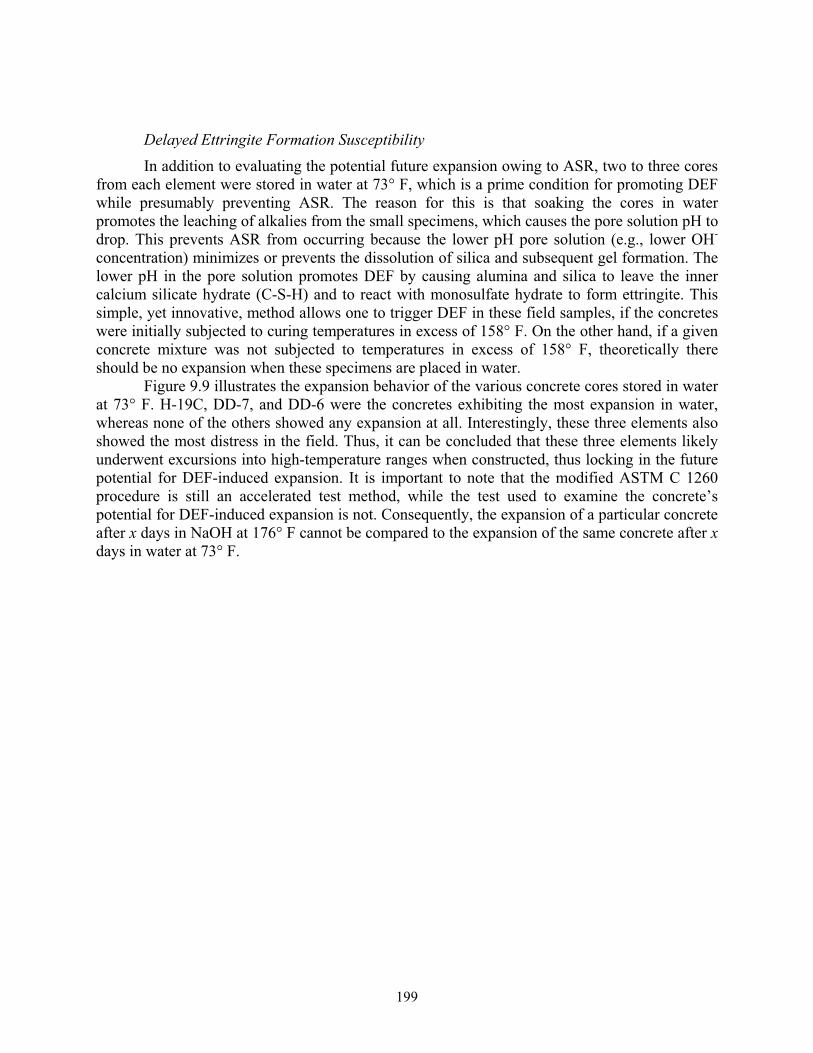
199
Delayed Ettringite Formation Susceptibility In addition to evaluating the potential future expansion owing to ASR, two to three cores
from each element were stored in water at 73° F, which is a prime condition for promoting DEF while presumably preventing ASR. The reason for this is that soaking the cores in water promotes the leaching of alkalies from the small specimens, which causes the pore solution pH to drop. This prevents ASR from occurring because the lower pH pore solution (e.g., lower OH-
concentration) minimizes or prevents the dissolution of silica and subsequent gel formation. The lower pH in the pore solution promotes DEF by causing alumina and silica to leave the inner calcium silicate hydrate (C-S-H) and to react with monosulfate hydrate to form ettringite. This simple, yet innovative, method allows one to trigger DEF in these field samples, if the concretes were initially subjected to curing temperatures in excess of 158° F. On the other hand, if a given concrete mixture was not subjected to temperatures in excess of 158° F, theoretically there should be no expansion when these specimens are placed in water.
Figure 9.9 illustrates the expansion behavior of the various concrete cores stored in water at 73° F. H-19C, DD-7, and DD-6 were the concretes exhibiting the most expansion in water, whereas none of the others showed any expansion at all. Interestingly, these three elements also showed the most distress in the field. Thus, it can be concluded that these three elements likely underwent excursions into high-temperature ranges when constructed, thus locking in the future potential for DEF-induced expansion. It is important to note that the modified ASTM C 1260 procedure is still an accelerated test method, while the test used to examine the concrete’s potential for DEF-induced expansion is not. Consequently, the expansion of a particular concrete after x days in NaOH at 176° F cannot be compared to the expansion of the same concrete after xdays in water at 73° F.
200
0.0
0.4
0.8
1.2
0 75 150 225
Time (days)
Exp
ansi
on (%
)
A-18SR
A-18SL
H-19C
DD-6
DD-7
DD-8
AA-10C
D-35C
D-37C
Figure 9.9 Expansion Observed in Concrete Cores Owing to DEF
In summary, the testing of cores in water or NaOH showed that just about all the concretes contain ASR reactive aggregates, and that three of the concretes showed the potential for DEF-induced expansion. These results essentially provide a look forward in time and represent the future potential for damage owing to either ASR or DEF. Next, the forensic evaluation of selected elements helps to paint the picture of what deterioration mechanisms have occurred to date in the field. The overall goal is to integrate the findings of both evaluations to ultimately determine what has happened so far, and what lies ahead.
9.5.3 Forensic Evaluation The initial forensic evaluation was limited to selected elements, specifically DD-6, DD-7,
DD-8, and H-19C. This scope was limited owing to the high cost of evaluating these specimens using advanced petrographic techniques, thin section analyses, and SEM methods. Specimens were evaluated at UT Austin, the University of Toronto (by Terry Ramlochan and Michael Thomas), and by Patrick Grattan-Bellew, an internationally recognized petrographer and expert in both ASR and DEF. A brief summary of the findings follows, with emphasis on Dr. Grattan-Bellew’s findings.
Dr. Grattan-Bellew concluded that all of the cores contained essentially the same aggregates. He found that the coarse aggregate component is limestone composed of micrite with varying amounts of fossil debris. Some coarse dolostone particles were also observed in the thin
201
section prepared from the core taken from column DD-7. The fine aggregate fraction is a mixture of limestone particles with finer-grained quartz particles. The thin sections from DD-6 and DD-7 also showed occasional particles of ASR reactive chert.
Dr. Grattan-Bellew has developed a method using petrographic analysis to quantify the amount of internal distress primarily caused by ASR, but potentially also caused by internal or external sulfate attack. This ranking scheme identifies and quantifies distress based on telltale signs of degradation, such as the presence of gel, cracking of aggregates, cracking of paste, debonding of aggregates, and presence of reaction rims. After analyzing a given specimen and adding up the points of damage, a total score is obtained, with a value higher than fifty deemed to be representative of extensive damage. The findings of Dr. Grattan-Bellew’s evaluation are summarized in Table 9.1.
Table 9.1 Damage Rating Indices for Selected Elements
StructuralElement
DamageRating Index
H-19C 183 DD-6 69 DD-7 109 DD-8 37
The results shown above indicate that H19-C, DD-6, and DD-7 have undergone significant internal damage in the field. Dr. Grattan-Bellew reported little evidence of ASR in DD-6 and DD-8, but evidence of both ASR and DEF in the cores taken from H-19C and DD-7. Based on his observations, he concluded that DEF was the key deterioration mechanism currently acting in these elements. That is, there was very little, if any, presence of ASR gel filling cracks in these specimens. Rather, the damage was mainly manifested in the presence of copious amounts of ettringite, gapping of aggregates, cracking through the aggregate, and cracking within the paste fraction.
The findings of Dr. Grattan-Bellew were confirmed through SEM analysis conducted at UT Austin. Figures 9.10 and 9.11 are SEM images of concrete taken from H-19C and DD-6, respectively. In these images, the contrast is a compositional contrast, meaning that the gray level of the features depends on the atomic number of the elements that comprise those features. Consequently, the limestone aggregates are a lighter gray than the siliceous aggregates and the siliceous phase within the limestone is readily visible. Void space and unfilled cracks appear black. Figures 9.10 and 9.11 show aggregate particles with gaps at the paste-aggregate interface partially or completely filled with ettringite. These images also show cracking in the paste and cracking in the aggregate.
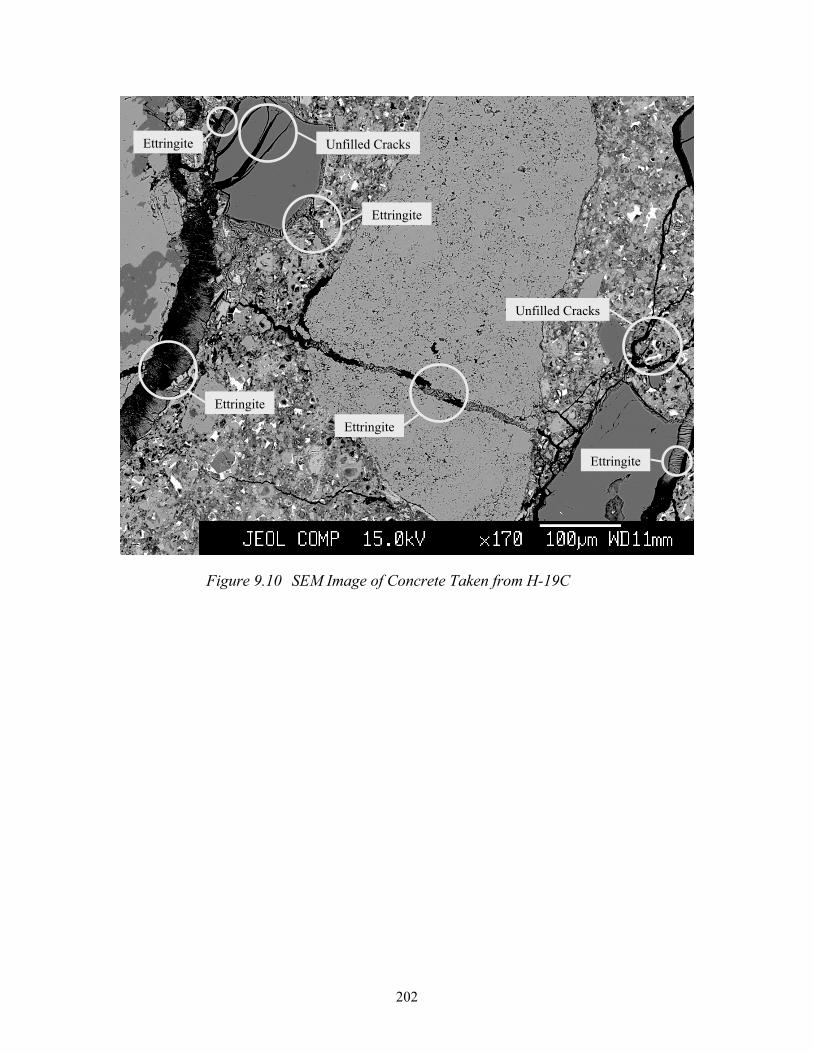
202
Figure 9.10 SEM Image of Concrete Taken from H-19C
Unfilled Cracks Ettringite
Ettringite
Ettringite
Ettringite
Ettringite
Unfilled Cracks
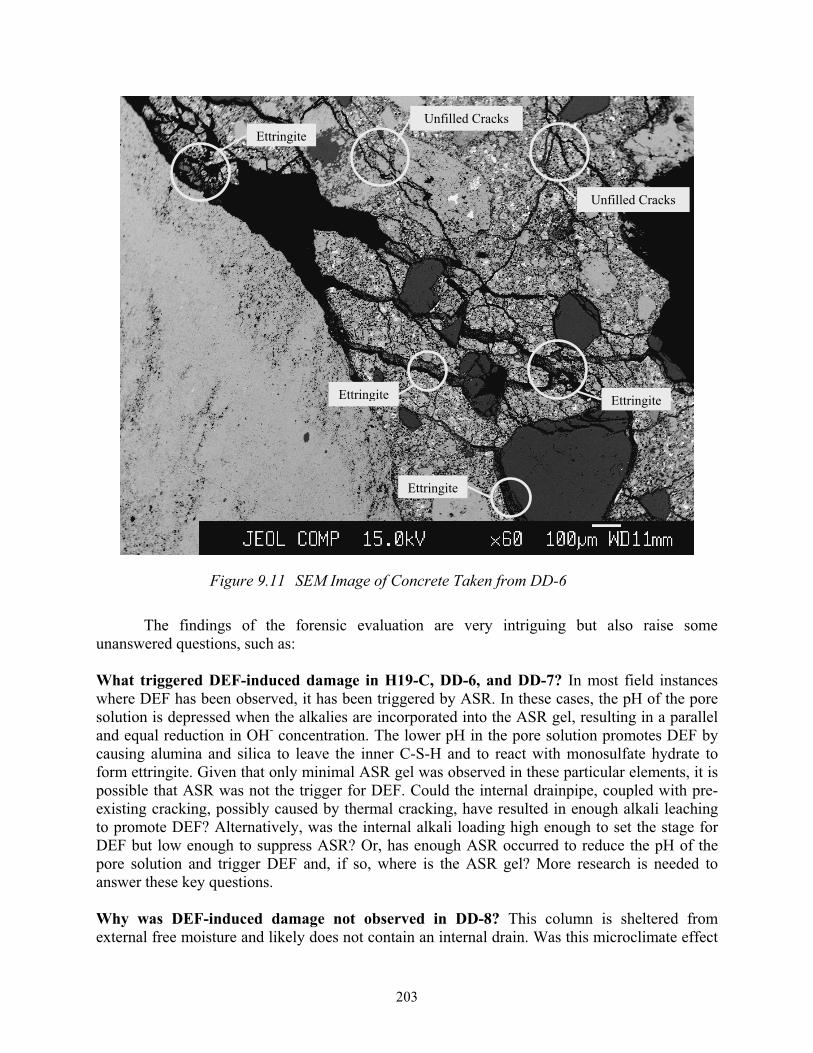
203
Figure 9.11 SEM Image of Concrete Taken from DD-6
The findings of the forensic evaluation are very intriguing but also raise some unanswered questions, such as:
What triggered DEF-induced damage in H19-C, DD-6, and DD-7? In most field instances where DEF has been observed, it has been triggered by ASR. In these cases, the pH of the pore solution is depressed when the alkalies are incorporated into the ASR gel, resulting in a parallel and equal reduction in OH- concentration. The lower pH in the pore solution promotes DEF by causing alumina and silica to leave the inner C-S-H and to react with monosulfate hydrate to form ettringite. Given that only minimal ASR gel was observed in these particular elements, it is possible that ASR was not the trigger for DEF. Could the internal drainpipe, coupled with pre-existing cracking, possibly caused by thermal cracking, have resulted in enough alkali leaching to promote DEF? Alternatively, was the internal alkali loading high enough to set the stage for DEF but low enough to suppress ASR? Or, has enough ASR occurred to reduce the pH of the pore solution and trigger DEF and, if so, where is the ASR gel? More research is needed to answer these key questions.
Why was DEF-induced damage not observed in DD-8? This column is sheltered from external free moisture and likely does not contain an internal drain. Was this microclimate effect
Ettringite Ettringite
Ettringite
Ettringite Unfilled Cracks
Unfilled Cracks
204
enough to suppress DEF, or was the critical temperature threshold never exceeded during early hydration? SEM work done at UT Austin shows that there is fly ash in this concrete. Perhaps that was enough to suppress DEF, as past work done under TxDOT 0-4085 has shown that the presence of sufficient dosages of fly ash can chemically suppress DEF, even when high temperatures are encountered.
What types of stresses are generated in structures suffering from DEF-induced distress?Past research has shown that a confinement pressure of about 750 psi is sufficient to restrain ASR-induced expansion. Given that DEF-induced expansions can be appreciably higher than ASR-induced expansions, what would be the required confining pressure to limit long-term damage? This is relevant when one considers jacketing or wrapping columns as a mitigation method for DEF. Clearly, work is needed to quantify the pressures generated by DEF and to determine requisite repair strategies to amply confine such pressures. Research to determine the structural implications of DEF is much needed and will be addressed in TxDOT Project 5218, “Extending Service Life of Large Unusual Structures Affected by Premature Concrete Deterioration.”
9.5.4 Water-Soluble Alkali Test The Project 0-4085 research team has developed the water-soluble alkali test in an
attempt to determine the current alkali loading of existing concrete structures. The current alkali loading may provide some insight into the type of deterioration mechanism, extent of deterioration, and the potential for future deterioration within a concrete structure. In the case of the San Antonio Y, expansion tests in NaOH and water indicate that three of the concretes have the potential for both ASR and DEF-induced expansion. However, ASR-induced expansion can be eliminated as a cause of future deterioration if the current alkali loading within the columns is too low to sustain ASR. Although much work remains to refine the water-soluble alkali test, the preliminary data indicate that the test provides a good estimate of the current alkali loading in existing concrete structures.
The water-soluble alkali test requires a concrete sample weighing approximately 4.4 lb. The concrete is crushed until the entire sample reaches 150 m. Then, the crushed concrete is sampled according to the procedures outlined in ASTM C-702, Standard Practice for Reducing Samples of Aggregate to Testing Size. The test itself is conducted by mixing three 10-gram samples of crushed concrete with 100 mL of deionized water. These mixtures are boiled for 10 minutes, to promote leaching of the alkalies, then allowed to sit for 24 hours. Prior to chemical analysis, each mixture is filtered to remove the crushed concrete and the solution volume is adjusted back to 100 mL by adding deionized water as necessary. The sodium and potassium concentrations in each of the solutions are measured using flame photometry. Then, the current alkali loading of the concrete is calculated from the average measured sodium and potassium concentrations as follows. Table 9.2 summarizes the notation and constants used in the calculations and Equations 9.1 through 9.7 show these calculations.
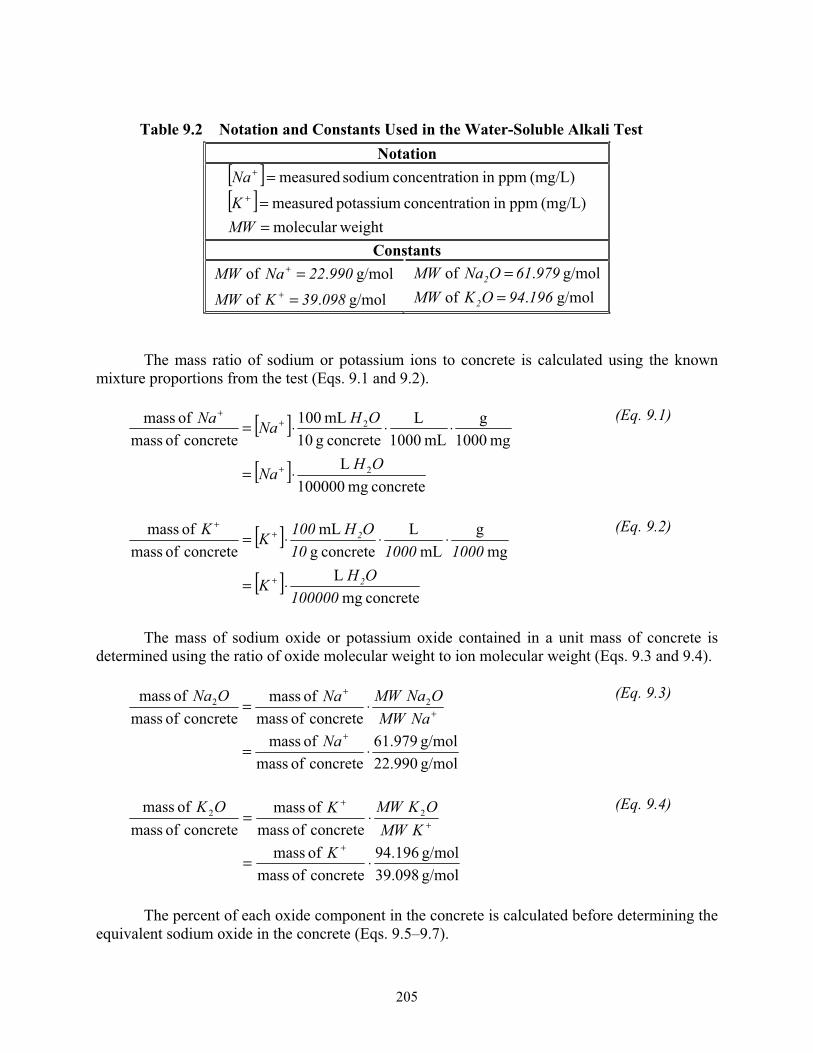
205
Table 9.2 Notation and Constants Used in the Water-Soluble Alkali Test Notation
[ ][ ]
weightmolecular(mg/L)ppminionconcentratpotassiummeasured
(mg/L)ppminionconcentratsodiummeasured
==
=+
+
MWKNa
Constants
g/mol.ofg/mol.of
09839KMW99022NaMW
==
+
+
g/mol.ofg/mol.of
19694OKMW97961ONaMW
2
2
==
The mass ratio of sodium or potassium ions to concrete is calculated using the known mixture proportions from the test (Eqs. 9.1 and 9.2).
[ ]
[ ]concretemg100000
Lmg1000
gmL1000
Lconcreteg10mL100
concreteofmassofmass
2
2
OHNa
OHNaNa
⋅=
⋅⋅⋅=
+
++ (Eq. 9.1)
[ ]
[ ]concretemg
Lmg
gmL
LconcretegmL
concreteofmassofmass
100000OHK
1000100010OH100KK
2
2
⋅=
⋅⋅⋅=
+
++ (Eq. 9.2)
The mass of sodium oxide or potassium oxide contained in a unit mass of concrete is determined using the ratio of oxide molecular weight to ion molecular weight (Eqs. 9.3 and 9.4).
g/mol2.9902g/mol979.61
concreteofmassofmassconcreteofmass
ofmassconcreteofmass
ofmass 22
⋅=
⋅=
+
+
+
NaNaMW
ONaMWNaONa (Eq. 9.3)
g/mol39.098g/mol94.196
concreteofmassofmassconcreteofmassofmass
concreteofmassofmass 22
⋅=
⋅=
+
+
+
KKMW
OKMWKOK (Eq. 9.4)
The percent of each oxide component in the concrete is calculated before determining the equivalent sodium oxide in the concrete (Eqs. 9.5–9.7).
206
=concreteofmass
ofmass% ONa100ONa 22
(Eq. 9.5)
=concreteofmass
ofmass% OK100OK 22
(Eq. 9.6)
OK06580ONaONa 22concreteeq2 %.% ⋅+=− (Eq. 9.7)
The alkali loading of the concrete is calculated by multiplying the equivalent percent of sodium oxide by an assumed concrete density of 145 lb/yd3.
Table 9.3 summarizes the data obtained from the water-soluble alkali test for two control samples and for the core samples obtained from the San Antonio Y. Samples C1 and C2 are both samples taken from concrete mixed under TxDOT Project 4563, "Prediction Model for Concrete Behavior." These two samples differ slightly from the cores because they contain natural river gravel and natural sand for the coarse and fine aggregate components. The actual alkali loading for both of these control samples is 3.24 lb/yd3, which exceeds the maximum measured value for C1 by 10 percent and the maximum measured value of C2 by 29 percent. The difference between the calculated and measured alkali loadings for sample C2 seems large, but Berube et al. suggest that up to 40 percent of the cement alkalies may be incorporated in cement hydrates and, therefore, not measured in this type of test (2002).
Table 9.3 Data from the Water-Soluble Alkali Test Estimated Alkali Loading
(lb/yd3)SampleMinimum Maximum
C1 2.5 2.9 C2 2.1 2.3
DD-6 2.2 2.4 DD-7 3.0 3.3 DD-8 6.3 6.8
AA-10C 3.6 4.6 H-19C 3.1 3.6
A-18SR 5.5 5.7 A-18SL 5.5 6.3 D-37C 5.3 5.3
Figure 9.12 provides a graphical representation of the current alkali loadings in each of the elements examined in the San Antonio Y. The estimated alkali loading is shown on the vertical axis and the sample name is given on the horizontal axis. The solid region of each bar in
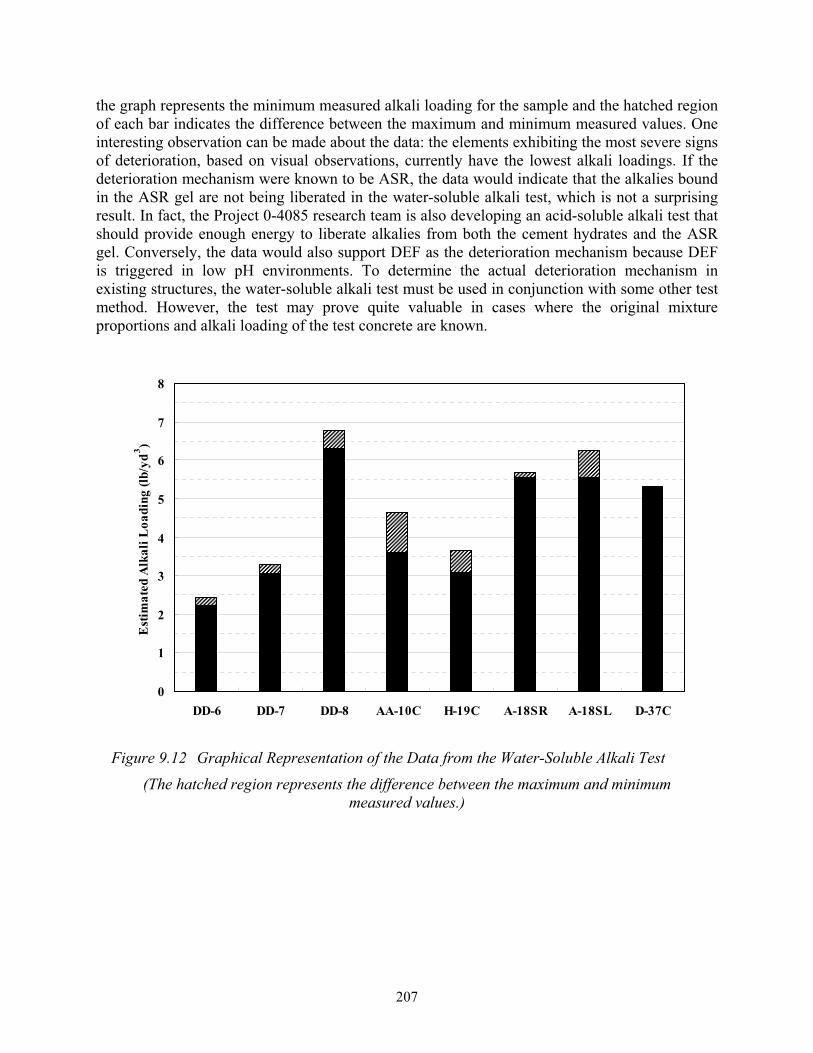
207
the graph represents the minimum measured alkali loading for the sample and the hatched region of each bar indicates the difference between the maximum and minimum measured values. One interesting observation can be made about the data: the elements exhibiting the most severe signs of deterioration, based on visual observations, currently have the lowest alkali loadings. If the deterioration mechanism were known to be ASR, the data would indicate that the alkalies bound in the ASR gel are not being liberated in the water-soluble alkali test, which is not a surprising result. In fact, the Project 0-4085 research team is also developing an acid-soluble alkali test that should provide enough energy to liberate alkalies from both the cement hydrates and the ASR gel. Conversely, the data would also support DEF as the deterioration mechanism because DEF is triggered in low pH environments. To determine the actual deterioration mechanism in existing structures, the water-soluble alkali test must be used in conjunction with some other test method. However, the test may prove quite valuable in cases where the original mixture proportions and alkali loading of the test concrete are known.
0
1
2
3
4
5
6
7
8
DD-6 DD-7 DD-8 AA-10C H-19C A-18SR A-18SL D-37C
Est
imat
ed A
lkal
i Loa
ding
(lb/
yd
3 ).
Figure 9.12 Graphical Representation of the Data from the Water-Soluble Alkali Test (The hatched region represents the difference between the maximum and minimum
measured values.)
208
9.6 SummaryThe Project 0-4085 research team began their evaluation of the San Antonio Y in August
2003. A total of eight structural elements were selected from the San Antonio Y for detailed evaluation. The elements selected for evaluation included:
• Columns: DD-6, DD-7, and DD-8
• Cantilever Bents: AA-10C, H-19C, D-35C, and D-37C
• Straddle Cap: A-18S (A-18SR and A-18SL are the right and left ends, respectively)
For each of these elements, the condition of the element was assessed visually, cracks were mapped, and cores were taken for further investigation. From each of the selected elements, five to six 2 in. cores and one 4 in. core were obtained. A comprehensive series of tests was performed on the cores, including:
• Expansion Measurements (ASR and DEF)
• Petrographic Analysis
• Damage Rating Index
• Thin Section Analysis
• Gel Pat Test
• Scanning Electron Microscopy (SEM)
• Water-Soluble Alkali Test
The expansion measurements showed that just about all the concretes contain ASR reactive aggregates, and that three of the concretes showed the potential for DEF-induced expansion. The initial forensic evaluation was limited to selected elements, specifically DD-6, DD-7, DD-8, and H-19C. Dr. Grattan-Bellew concluded that H19-C, DD-6, and DD-7 have undergone significant internal damage in the field. He reported little evidence of ASR in DD-6 and DD-8, but evidence of DEF and, to a lesser degree, ASR, in the cores taken from H-19C and DD-7. Based on his observations, he concluded that DEF was the key deterioration mechanism currently acting in these elements. The findings of Dr. Grattan-Bellew were confirmed through SEM analysis conducted at UT Austin. The findings of the forensic evaluation are very intriguing but also raise some unanswered questions that will be addressed under TxDOT Project 5218, "Extending Service Life of Large Unusual Structures Affected by Premature Concrete Deterioration."
The water-soluble alkali test is being developed at UT Austin in an attempt to determine the current alkali loading of existing concrete structures. Knowing the current alkali loading of existing structures may help in deciding whether to treat these structures to prevent future deterioration. The water-soluble alkali test indicates that the elements exhibiting the most severe signs of deterioration at the San Antonio Y, based on visual observations, currently have the lowest alkali loadings out of the eight elements examined under TxDOT Project 0-4085. The development and use of the water-soluble alkali test will continue under TxDOT Project 5218.
Perhaps the most significant contribution of the work described in this chapter is the documentation of field structures degraded primarily or solely by DEF. There is no other
209
documented case in literature where DEF has been confirmed to be the main player, without ASR triggering DEF-induced expansion. Furthermore, the work described in this chapter has resulted in an innovative, yet simple, testing regime by which one can diagnose the cause and extent of damage to a concrete structure, whether it is caused by ASR, DEF, or both, and to determine the future potential for expansion and cracking. It is anticipated that this testing protocol will be refined further under TxDOT 5218 and will ultimately be used to diagnose and monitor transportation structures throughout Texas that may be suffering from ASR and/or DEF.

210
211
10. Conclusions
10.1 ConclusionsThe research performed under TxDOT Project 0-4085 covered a range of issues related to
alkali-silica reaction (ASR), delayed ettringite formation (DEF), and combinations thereof. It included evaluations of laboratory test methods, mitigation options, and field performance evaluations. Significant progress was made in understanding the underlying mechanisms behind ASR and DEF, therefore obtaining a better understanding of preventing degradation. The results of key aspects of this study have already been adopted by TxDOT in the form of new and improved test methods and specifications, which should help to ensure durability for newly constructed transportation structures and pavements. This chapter briefly highlights some of the key conclusions of this study, with emphasis on the products of this research that have already been put into practice in Texas. It also identifies those areas of research or implementation that warrant further emphasis in the laboratory or field.
10.2 Alkali-Silica Reaction A major focus of this research project dealt with ASR, and significant progress was made
in better understanding the mechanisms of deterioration, methods of suppressing expansion, and methods of testing materials and mixtures. Following are some highlights of the work performed.
10.2.1 Test Methods for Alkali-Silica Reaction This study focused on a range of laboratory tests for assessing ASR, including ASTM C
1260, ASTM C 227, ASTM C 1293, and various modifications of these tests. Based on the collective experience gathered from this project, as well as ongoing research at the Concrete Durability Center (CDC), the following conclusions can be drawn:
The concrete prism test [American Society for Testing and Materials (ASTM) C 1293] generally is the most appropriate test method for predicting field performance. The test should be run for 1 year for testing aggregates and 2 years for testing supplementary cementing materials (SCMs) or lithium compounds, with an expansion limit of 0.04 percent.
One deficiency of ASTM C 1293 is that it is not well suited for determining the effects of cement alkalinity on expansion, most likely owing to leaching of alkalies during the course of the test. This downside of the test was highlighted when comparing concrete prism test data to exposure block data, where it can be seen that concrete containing a highly reactive aggregate (F1) and approximately 3.5 lbs/yd3 of Na2Oe expanded and cracked in exposure blocks, but showed essentially no expansion after 2 years of testing in ASTM C 1293.
The major drawback to ASTM C 1293 is its long duration (1 or 2 years). Efforts were made to accelerate this test by increasing the storage temperature from 100° F (38° C) to 140° F (60° C). However, it has been shown that expansions at the higher temperatures are significantly reduced owing to increased leaching, increased specimen drying, and potential changes in pore solution chemistry. In addition, the effects of nonreactive aggregates in this test were found to be dramatic in some cases. Specifically, some fine aggregates will yield vastly different expansions when tested under the two different temperature regimes, even though the aggregates meet the
212
requirements for nonreactive under ASTM C 1293. Significant work is in progress to elucidate the underlying mechanisms behind this confounding behavior.
The accelerated mortar bar test (AMBT) (ASTM C 1260), in most cases, is a reasonable indicator of aggregate reactivity or a reasonable means of assessing various mitigation measures. A 14-day expansion limit of 0.10 percent is recommended as it best relates to concrete prism data (1 year for aggregates, 2 years for SCMs).
One downside of ASTM C 1260 is that it tends to be overly severe when testing some aggregates, resulting in expansions exceeding the failure limit, even though these aggregates pass the concrete prism test and perform well in field applications. This trend has been well documented over the years and, as such, it is not recommended that the results of ASTM C 1260 be used by themselves to deem an aggregate as being reactive. If an aggregate fails this test, the results should be confirmed using the concrete prism test.
Several coarse aggregates in this study showed a trend opposite to that just discussed. Specifically, these aggregates passed ASTM C 1260, but failed ASTM C 1293, and showed expansion and cracking in exposure blocks. This behavior is not as documented in literature and actually more relevant and important for this TxDOT-funded project. The reason for this enhanced relevance and importance is that the new TxDOT specification for ASR allows an aggregate to be deemed nonreactive based solely on ASTM C 1260 results. Work is in progress at the CDC to better understand the mechanisms responsible for this behavior. One possibility is that the processing (crushing, grinding, washing) required to test coarse aggregates in ASTM C 1260 may, in effect, wash away the reactive phases or alter the aggregate textural characteristics, thereby producing a test material that will show reduced expansion characteristics. Work is underway, using the so-called Chinese mortar bar test, to determine if modifications to the ASTM C 1260 can be used to better identify reactive aggregates in a short-term testing regime.
When testing SCMs using AMBT, one should be aware that cement alkalinity may have a significant effect on observed expansions. Specifically, higher alkali cements tested in conjunction with some fly ash or slag sources tend to yield lower 14-day expansions than parallel tests using lower alkali cements. This may be due to alkali activation of the SCM in the first day or two of curing, thereby producing a denser pore structure that slows down the ingress of NaOH from the host solution.
The outdoor exposure site at CDC has proven to be perhaps the best indicator of field performance of aggregates, SCMs, and lithium compounds. Although it is not practical to propose exposure block testing as a standard test method, it has been shown that real concrete in real exposure conditions helps to shine light on available standard laboratory tests, and information gained from these blocks can ultimately be used to improve laboratory-based test methods.
10.2.2 Options for Preventing Alkali-Silica Reaction in New Concrete Various methods of preventing ASR in new concrete were evaluated in this project, and a
range of viable options have been identified that serve this purpose. Some of the key findings are as follows:
Each of the fly ashes studied and evaluated in this project were shown to be effective in controlling expansion owing to ASR, provided that sufficient dosages are used. Class F fly ashes, with less than about 20 percent CaO, tend to be more effective than higher CaO ashes, requiring less fly ash to suppress expansion. However, even fly ashes with CaO contents in excess of 25 percent were found to be effective in suppressing expansion, but higher dosages were needed, in
213
some cases up to 40 percent (by mass of total cement). To reduce the required fly ash dosage, ternary blends containing fly ash plus either silica fume or ultra-fine fly ash, are quite effective.
Other SCMs, such as slag and metakaolin, were also found to be quite effective in suppressing ASR, again provided that sufficient dosages are used. The required amount of any SCM (or SCMs for ternary blends) will depend on the aggregate reactivity, total alkali loading, and exposure conditions.
Reducing the alkali loading in plain concrete (without SCMs) can be an effective method of preventing ASR-induced expansion and cracking, but it has been shown that for highly reactive aggregates, even low-alkali loadings (e.g., 3.5 lbs/yd3) resulted in significant cracking in exposure blocks. This is a key issue because standard laboratory tests, such as ASTM C 1293, were not able to identify this mixture as being reactive, and mixtures with such low-alkali loadings meet the requirements of the current TxDOT ASR specification.
Lithium nitrate can be used to control expansion in new concrete, but it was found that some aggregates require more lithium nitrate than the typical 100 percent dosage (based on manufacturer’s recommended dosage of 0.55 gallons of 30-percent lithium nitrate solution per pound of Na2Oe in mixture). Thus, a major finding of this study, as well as related research at the CDC, is that it is not possible to prescriptively select the amount of lithium needed to control ASR. Rather, one should rely on 2-year concrete prism data for determining the dosage of lithium needed for a given reactive aggregate.
10.2.3 Specifications for Alkali-Silica Reaction Much of the work done under TxDOT Project 0-4085 was in support of the Special
Provision to Item 421, which was the first major effort to implement prescriptive and performance-based specifications for ASR. The bulk of the research showed that these specifications are both warranted and effective. Further, the findings of TxDOT Project 0-4085, coupled with ongoing research efforts within TxDOT, have helped to improve the initial Special Provision to Item 421 approach. As with any research, this project has also highlighted some aspects of the specifications that deserve further attention and improvement. Some of the main findings related to the previous and current TxDOT ASR specifications include the following:
The initial provisions under Special Provision to Item 421 assumed that all aggregates were reactive and therefore required mitigation measures. The newest ASR specification, based on the findings of TxDOT Project 0-4085 and parallel TxDOT efforts, now allow for laboratory testing to demonstrate that a given aggregate is not reactive, and if this is found to be the case, no mitigation measures are required. This has allowed a range of aggregates to be used successfully without having to resort to mitigation methods that are actually not warranted. However, as discussed earlier in this report, some aggregates that pass ASTM C 1260 and are thus deemed nonreactive may actually be reactive in concrete, and more work is needed to determine how many aggregates fall into to this classification. Research underway using the Chinese mortar bar test may prove to be quite useful in addressing this concern. Conversely, another option might be to perform ASTM C 1293 testing on all aggregate sources in the state to determine the sources for which the mortar bar test provides incorrect results. These aggregates could then ultimately be tested for specification compliance using different regimes (e.g., Chinese mortar bar test or ASTM C 1293), or they could be dealt with using strictly prescriptive guidance (that is, assume they are reactive in mitigation using SCMs, etc.).
The new ASR specification has been improved from a testing perspective by requiring that coarse and fine aggregates are tested separately, which is now in agreement with most
214
national and international specifications. Combining aggregates in an AMBT may result in unwanted side effects and may lead to issues related to pessimum effects, etc. This approach of testing fine and coarse aggregates separately also will provide a better long-term database for aggregates in our state and will help to isolate these results from data obtained testing combinations of various materials.
Some highly reactive aggregates were found to result in substantial cracking in exposure blocks, even though the total alkali loading met the TxDOT maximum alkali loading requirement for plain concrete of 4 pcy of alkalies. More work is needed to determine how many aggregates in the state respond at such low-alkali contents, and thought should be given to reducing the allowable alkali loading for such aggregates. Lowering the maximum allowable alkali loading for plain concrete in Texas would also help to spur the use of SCMs, which have other major benefits, such as reduced heat of hydration, better sulfate resistance, and enhanced sustainability.
10.2.4 Showcase Bridge A major thrust of this research project was aimed at taking the laboratory findings and
pushing them into the field. The showcase bridge planning was a major part of this effort. Although it did not come to fruition under this project, it is hoped that the experience and knowledge gained in the process will ultimately be applied to a comparable showcase structure in the coming years.
10.3 Delayed Ettringite Formation DEF is a less common, but potentially more damaging, cause of distress than ASR. There
have been far fewer documented cases of DEF than ASR, and prior to this project, there were no published cases where DEF was the sole culprit in causing deterioration in an actual field structure. Significant progress was made in understanding how best to evaluate the potential for DEF in laboratory testing regimes and identifying means of preventing DEF through optimizing materials, mixture proportions, and curing regimes. Some of the main findings related to DEF are highlighted below.
10.3.1 Test Methods for Delayed Ettringite Formation A comprehensive evaluation was performed within this project that focused on testing
methodologies for DEF. Most of the testing was performed using tests developed by either Kelham or Fu. These mortar tests were found to be effective in generating DEF through high-temperature curing regimes, followed by subsequent storage conditions that promoted alkali leaching and accelerated expansion. The tests tended to produce similar ultimate expansions, but the Fu test produced earlier expansions, most likely owing to microcracking caused by the early, severe drying cycles. Both tests were effective in evaluating critical temperature thresholds for triggering DEF and in identifying and evaluating methods of preventing expansion, even when excessive temperatures were encountered.
Concrete prisms were also tested as part of this study, and it was shown that DEF can be triggered in similar fashions, specifically exposing specimens to high early temperatures, then storing in conditions that either promote leaching or that trigger ASR, which then activated DEF as the pore solution pH dropped. More work is needed to refine and ultimately develop standardized DEF tests, but it is hoped that the extensive work performed under this project will serve as the basis for such tests.
215
The relative ease in which DEF can be triggered in small mortar or concrete prisms can be contrasted to the challenge in triggering DEF in larger exposure blocks. The blocks cast in this project were heat cured to set the stage for DEF, but only those blocks with reactive aggregates showed excessive expansion in the blocks. This highlights the synergy between ASR and DEF and explains why these two mechanisms often go hand in hand in field structures. It also reinforces how unique it is that certain elements in the San Antonio Y are showing severe symptoms of DEF, with little or no signs of ASR. The exposure blocks will continue to be monitored in future years to determine if the heat-treated blocks that did not contain reactive aggregates ultimately expand and crack.
10.3.2 Options for Preventing Delayed Ettringite Formation in New Concrete This project evaluated what parameters have the most profound impact on DEF-induced
expansion and what means are available for preventing such distress in new concrete. Some of the key findings are briefly summarized below.
Preventing internal concrete temperatures from exceeding 158° F (70° C) is effective in preventing DEF. No mixtures suffered from excessive expansion or cracking when temperatures were kept below this threshold value.
When mortar or concrete mixtures were subjected to temperatures in excess of 158° F (70° C), the incorporation of various SCMs was found to be effective in preventing subsequent DEF-induced expansion. Fly ash (Class F or Class C), slag, metakaolin, and ultra-fine fly ash, were all found to be effective when used in sufficient quantities. Silica fume, however, was not found to be effective in the dosages evaluated in this project.
10.3.3 Specifications for Delayed Ettringite Formation Prior to the initiation of this research project, there were no TxDOT specifications aimed
at preventing DEF in new concrete structures. However, the findings of this project were directly responsible for the implementation of new specifications intended to prevent DEF through prudent limits placed on internal concrete temperatures. Examples of these new specifications include:
• Temperature limits have been placed on precast girder fabrication, with a maximum temperature of plain concrete set at 150° F and SCM-containing concrete set at 170° F.
• Temperature limits were placed on mass concrete placements, with a maximum temperature limit of 160° F.
• Based on the findings of this project, it is expected that these newly implemented temperature limits will prevent DEF from occurring in newly constructed TxDOT structures.
10.4 Protocol for Evaluating Existing StructuresDriven initially by the desire to confirm the presence of DEF in field structures, the
research team developed an innovative method of determining the cause, extent, and future potential for deterioration in field structures. The research team showed that through prudent sampling, testing, and analyses, one can determine whether a structure is affected by ASR, DEF, or both. This approach, applied initially to the San Antonio Y in this project and since applied to
216
other structures under TxDOT Project 5218, combines the use of expansion testing (in water to confirm DEF and sodium hydroxide to confirm presence of reactive aggregates) with petrographic testing (and damage rating index) and other tests to arrive at a sound engineering assessment of the current state of a structure and the potential for further distress. It is hoped that this approach will ultimately become a standard protocol for evaluating transportation structures in Texas. This approach has been extended even further to involve the detailed monitoring of field structures using expansion tracking methods, internal humidity assessments, and crack monitoring techniques.
10.5 Economic Benefits of Project Deliverables It is difficult to put a dollar amount on the short- or long-term economic impact of the
research described in this report, but it is anticipated that the savings will be quite significant.The revised and improved test methods and specifications developed under this project
will help to ensure that newly constructed structures are free from ASR and/or DEF damage. Given that Texas has more than 49,000 bridges, the overall cost savings of producing long-lasting, durable structures are expected to be substantial.
The protocol for evaluating existing structures will help to efficiently determine which structures may be suffering from ASR and/or DEF and, just as important, this protocol can help to determine what the future potential for damage may be. This information can be used as part of a strategic plan to determine which structures are most prone to future deterioration and which ones may be candidates for remediation measures.
217
References
ASTM C 114-05, “Standard Test Methods for Chemical Analysis of Hydraulic Cement”, Annual Book of ASTM Standards V. 04.01 (Cement; Lime; Gypsum), American Society for Testing and Materials, West Conshohocken, Pennsylvania, 2005.
ASTM C 1260-05, "Standard Test Method for Potential Alkali Reactivity of Aggregates(Mortar-Bar Method)", Annual Book of ASTM Standards V. 04.02 (Concrete and Aggregates), American Society for Testing and Materials, West Conshohocken, Pennsylvania, 2005.
ASTM C 1567-04, " Standard Test Method for Determining the Potential Alkali-SilicaReactivity of Combinations of Cementitious Materials and Aggregate (Accelerated Mortar-Bar Method)", Annual Book of ASTM Standards V. 04.02 (Concrete and Aggregates), American Society for Testing and Materials, West Conshohocken, Pennsylvania, 2005.
ASTM C 1293-05, “Standard Test Method for Determination of Length Change of Concrete Due to Alkali-Silica Reaction,” Annual Book of ASTM Standards V. 04.02 (Concrete and Aggregates), American Society for Testing and Materials, West Conshohocken, Pennsylvania, 2005.
ASTM C 227-90, Potential Alkali Reactivity of Cement-Aggregate Combinations (Mortar-Bar Method), American Society for Testing and Materials, Philadelphia, PA. USA, pp. 129-133.
ASTM C 295-90, Petrographic Examination of Aggregates for Concrete, American Society for Testing and Materials, Philadelphia, PA. USA, pp. 176-183.
ASTM C 305-99, “Standard Practice for Mechanical Mixing of Hydraulic Cement Pastes and Mortars of Plastic Consistency,” Annual Book of ASTM Standards V. 4.01 (Cement; Lime; Gypsum), American Society for Testing and Materials, West Conshohocken, Pennsylvania, 2005.
ASTM C 33-93, Standard Specification for Concrete Aggregates, American Society for Testing and Materials, Philadelphia, PA. USA, pp. 10-16.
ASTM C 702-98, “Standard Practice for Reducing Samples of Aggregate to Testing Size”, Annual Book of ASTM Standards V. 04.02 (Concrete and Aggregates), American Society for Testing and Materials, West Conshohocken, Pennsylvania, 2005.
American Concrete Institute, ACI 221.1R-98, “State-of-the-Art Report on Alkali-Aggregate Reactivity.”
Barnes, P., and Bensted, J. Structure and Performance of Cements. 2nd ed. New York:
218
Taylor & Francis, Inc., 2002, pp.372-398.
Barringer, W. L., “Using Accelerated Test Methods to Specify Admixtures to Mitigate Alkali-Silica Reactivity.” Cement, Concrete, and Aggregates Vol. 21, No. 2 (Dec. 1999): 165–72.
Bauer, S., “Laboratory Investigations of Alkali-Silica Reaction Using the Concrete Prism Test and Its Modifications.” Thesis, The University of Texas at Austin, 2002. Austin, Texas.
Berube, M.A., Duchesne, J., Dorion, J.F., and Rivest, M., "Laboratoy Assessment of Alkali-Contribution by Aggregates to Concrete and Application to Concrete Structures Affected by Alkali-Silica Reactivity," Cement and Concrete Research, V. 32, No. 8, 2002, pp. 1215-1227.
Boenig, A. “Bridges with Premature Concrete Deterioration: Field Observations andLarge-Scale Testing,” Thesis, The University of Texas at Austin, 2000, Austin, Texas.
Canadian Standards Association, “A23.1-04: Concrete Materials and Methods ofConstruction,” Mississauga, Ontario, Canada L4W 5N6, 2004.
Canadian Standards Association, “A23.2-04: Methods of Test and Standard Practices forConcrete,” Mississauga, Ontario, Canada L4W 5N6, 2004.
Cornell, B. D., “Laboratory Investigations of Alkali-Silica Reaction Using the Concrete Prism Test and Its Modifications.” Thesis, The University of Texas at Austin, 2002. Austin, Texas.
De Grosbois, M. and Fontaine, E. “Evaluation of the Potential Alkali-Reactivity of Concrete Aggregates: Performance of Testing Methods and A Producer’s Point of View,” Proceedings of 11th International Conference of Alkali-Aggregate Reactivity in Concrete, Quebec City, QC, Canada, 2000, pp. 267-276.
Deno, D., "Studies of Concrete Cores from San Antonio Y Bridge Columns for Texas Department of Transportation," Technical Report Submitted to TxDOT, WJE 972984, Wiss, Janney, Elstner Associates, Inc., Irving, Texas, April 1998.
Drimalas, T., “Laboratory Testing and Investigations of Delayed Ettringite Formation.” Thesis, The University of Texas at Austin, 2004. Austin, Texas.
Duchesne, J. and Bérubé, M.A., “The Effectiveness of Supplementary Cementing Materials in Suppressing Expansion Due to ASR: Another Look at the Reaction Mechanisms. Part I: Concrete Expansion and Portlandite Depletion,” Cement and Concrete Research, V. 24, 1994, pp. 73-82.
Du-you, L., Fournier, B., Grattan-Belew, P.E., “A Comparative Study on Accelerated
219
Test Methods for Determining Alkali-Silica Reactivity of Concrete Aggregates,” Proceedings of the 12th International Conference on Alkali-Aggregate Reaction in Concrete, Beijing, China, V. 1, 2004, pp. 377-385.
Famy, C. “Expansion of Heat-Cured Mortars,” Dissertation, University of London, 1999,London, England.
Figurski, D., “Laboratory and Field Investigations of Alkali-Silica Reaction in Portland Cement Concrete,” Thesis, The University of Texas at Austin, 2001. Austin, Texas.
Folliard, K.J., Ideker, J.H., Thomas, Michael D.A., Fournier, B., “Assessing Aggregate Reactivity Using the Accelerated Concrete Prism Test,” Seventh CANMET/ACI International Conference on Recent Advances in Concrete Technology—Supplementary Papers, Las Vegas, NV, May, 2004, pp. 269-283.
Folliard, K.J., Thomas, M.D.A., and Kurtis, K., “Guidelines for the use of Lithium to Mitigate or Prevent ASR,” Federal Highway Administration, Publication Number FHWA-RD-03-047, 2003.
Fournier, B., and Malhorta, V. M., “Evaluation of Laboratory Test Methods for Alkali-Silica Reactivity.” Cement, Concrete, and Aggregates Vol. 21, No. 2 (Dec. 1999): 173–84.
Fournier, B., Chevrier, R., De Grosbois, M., Lisella, R., Folliard, K., Ideker, J., Shehata, M., Thomas, M. and Baxter, S. “The accelerated concrete prism test (60oC): variability of the test method and proposed expansion limits,” Proceedings of the 12th International Conference on Alkali-Aggregate Reaction in Concrete, Beijing, China, V. 1, 2004, pp. 314-323.
Fu, Y., “Delayed Ettringite Formation in Portland Cement Products,” Dissertation, University of Ottawa, 1996, Ottawa, Ontario.
Glasser, FP and Yilmaz, VT. Effect of Silica Fume Addition on the Durability of Alkali-Resistant Glass Fibre in Cement Matrices. Fly Ash, Silica Fume, Slag and Natural Pozzolans in Concrete. Fourth International Conference. 1992.
Grattan-Bellew, P.E. “Study of Expansivity of a Suite of Quartzites, Argillites and QuartzArenites.” Proceedings of the 4th International Conference on the Effect ofAlkalies in Cement and Concrete, Purdue, Indiana, 1978, pp. 113-140.
Grattan-Bellew, P.E. “Test Methods and Criteria for Evaluating the Potential Reactivity of Aggregates,” Proceedings of the 8th International Conference on Alkali-Aggregate Reaction in Concrete, Kyoto, Japan, 1989, pp. 279-294.
Hall, J.D., “Laboratory and Field Investigations of Alkali-Silica Reaction and its Interaction with Delayed Ettringite Formation,” Thesis, The University of Texas at Austin, 2003. Austin, Texas.
220
Ideker, J.H., Folliard, K.J., “Toward Accurate Test Methods to Assess Alkali-Silica Reaction in Concrete,” currently in review for submission to ACI Materials Journal.
Ideker, J.H., Folliard, K.J., Juenger, M.G., Thomas, M.D.A., “Laboratory and Field Testing Experience with ASR in Texas, USA,” Proceedings of the 12th International Conference on Alkali-Aggregate Reaction in Concrete, Beijing, China, V. 2, 2004, pp. 1062-1070.
Kelham, S., “Effects of Cement Composition and Hydration Temperature on Volume Stability of Mortar.” 10th International Congress on the Chemistry of Cement, Justnes, H., Ed., Gothenburg, Sweden, 1997, Paper 4iv060 (8 pp.).
Kelham, S., “The Effect of Cement Composition and Fineness on Expansion Associatedwith Delayed Ettringite Formation,” Cement and Concrete Composites, V. 18 1996, pp. 171-179.
Ley, M. “The Instrumentation of a Prestressed Bridge to Monitor Alkali-Silica Reaction.” Thesis, The University of Texas at Austin, 2002, Austin, Texas.
Magni, E. R., Rogers, C. A. and Grattan-Bellew, P. E. “The Influence of the Alkali- Silicate Reaction on Structures in the Vicinity of Sudbury, Ontario.” Proceedings of the 7th International Conference on Concrete Alkali-Aggregate Reactions, Grattan-Bellew, P. E., Ed., Noyes, New Jersey, 1987, pp. 17-22.
McCoy, W.J. and Caldwell A.G. (1951). “New Approach to Inhibiting Alkali Aggregate Expansion.” Journal of the American Concrete Institute. Vol 22. Pp. 693-706
McKeen, R. Gordon, Lenke, Lary R., Pallachulla, Kiran K., and Barringer, William L., “Mitigation of Alkali-Silica Reactivity in New Mexico.” Transportation Research Record Paper No. 00-1216 (2000): 9–16.
Mehta, P.K., Monteiro, J.M.P., Concrete Microstructre, Properties, and Materials, 2nd
ed., McGraw-Hill, New York, 1993.
Miralles, J. “High-Temperature Effects on Alkali-Silica Reaction and Delayed Ettringite Formation.” Thesis, The University of Texas at Austin, 2001, Austin, Texas.
Oberholster, R. E. and Davies, G. (1986). "An accelerated method for testing the potential reactivity of siliceous aggregates." Cement and Concrete Research, Vol. 16, pp 181-189.
Odler, I., “Interaction Between Gypsum and C-S-H Phase Formed in C3S Hydration.” 7th
International Congress on the Chemistry of Cement, Paris 4, (1980): 493–495.
Patty, Tom S., "Petrographic Studies of Concrete Pier Cores from San Antonio Y
221
Interchange Project for District 15 Texas Department of Transportation," Technical Report Submitted to TxDOT, WJE 970514, Wiss, Janney, Elstner Associates, Inc., Irving, Texas, 1997.
Pugh, J. “On the Ability of Accelerated Test Methods to Assess Potential for Alkali- Silica Reaction,” Thesis, The University of Texas at Austin, 2003, Austin, Texas.
Ramlochan, T., “The Effect of Pozzolans and Slag on the Expansion of Mortars andConcrete Cured at Elevated Temperature,” Dissertation, University of Toronto, 2003, Toronto, Canada.
Ranc, R. and Debray, L. “Reference Test Methods and a Performance Criterion for Concrete Structures.” Proceedings of the 9th International Conference on Alkali- Aggregate Reaction in Concrete, Concrete Society, London, V. 1, 1992, pp.110-116.
Richardson, I.G., Groves, G.W., “Models for the Composition and Structure of Calcium Silicate Hydrate (C-S-H) Gel in Hardened Tricalcium Silicate Pastes, Cement and Concrete Research, Vol. 22 (1992): pp 1001-1010.
Scott, S. E., Wood, B., and Kreger, M.E., "An Evaluation of Repair Methods forCantilever Bridge Piers," Technical Report CTR 1364-2, The University of Texas Center for Transportation Research, Austin, Texas,1998.
Shayan, A., “Where is AAR Heading after the 10th International Conference?” Cement and Concrete Composites 19 (1997): 441–449.
Shehata, E, Morphy, R, and Rizkalla, S. Fiber Reinforced Polymer Reinforcement for Concrete Structures. Fourth International Symposium on Fiber Reinforced Polymer Reinforcement for Reinforced Concrete Structures. ACI Report SP-188-15. 1999. pp 157-167.
Stark, David, “Alkali-Silica Reactions in Concrete.” Concrete and Concrete-Making Materials.1994.
Stark, D. “Alkali-Silica Reactions: Some Reconsiderations.” Cement, Concrete andAggregates, V. 2, No. 2, 1980, pp. 92-94.
Stark, D., Morgan, B., Okamoto, P. and Diamond, S.. “Eliminating or Minimizing alkali-silica reactivity.” SHRP-C-343, National Research Council, Washington D.C., 1993.
Stokes, D.S., Thomas, M.D.A. and Shashiprakash, S.G. “Development of a Lithium-Based Material for Decreasing ASR-Induced Expansion in Hardened Concrete.” Proceedings of the 11th International Conference on Alkali-Aggregate Reaction in Concrete, Berube, M.A., et al., Ed., CRIB, Quebec City, 2000b, pp. 1079-1087.
222
Taylor, HFW, and Famy C. Ettringite in Hydration of Portland Cement Concrete and its Occurrence in Mature Concretes. ACI Materials Journal, Volume 98, Issue 9. July 2001.
Thomas, M.D.A., “Delayed Ettringite Formation in Concrete. Recent Developments and Future Directions,” Report, University of Toronto, 1998.
Thomas, M.D.A., Shehata, M. H., and Shashiprakash, S. G., “The Use of Fly Ash in Concrete: Classification by Composition.” Cement, Concrete, and Aggregates Vol. 21, No. 2 (Dec. 1999a): 105–110.
Thomas, M.D.A., “The Use of Silica Fume to Control Expansion Due to Alkali-Aggregate Reactivity in Concrete.” University of Toronto (Jan. 23, 1996).
Thomas, M.D.A., and Innis, F. A., “Effect of Slag on Expansion Due to Alkali-Aggregate Reaction in Concrete.” ACI Materials Journal 95 (Dec. 1998): 716–24.
Touma, W.E., “Alkali-Silica Reaction in Portland Cement Concrete: Testing Methods and Mitigation Alternatives,” Dissertation, The University of Texas at Austin, 2000, Austin, Texas.
Touma, W.E., Fowler, D.F. and Carrasquillo, R.L., “Alkali-Silica Reaction in Portland Cement Concrete: Testing Methods and Mitigation Alternatives”. Report ICAR 301-1F, International Center for Aggregates Research, Austin, Texas, 2001.
Tremblay, C., Berube, M-A., Fournier, B., Thomas, M.D.A. and Stokes, D.B. “Performance of Lithium-Based Products Against ASR: Application to Canadian Reactive Aggregates, Reaction Mechanisms and Testing.” Proceedings of the 12th International Conference on Alkali-Aggregate Reaction in Concrete, Beijing, China, V.1, 2004, pp. 668-677.
TxDOT, “Special Provision 421–028.” 1995.
Williams, S. A., “Structures Affected by Premature Concrete Deterioration: Diagnosis and Assessment of Deterioration Mechanisms.” Thesis, The University of Texas at Austin, 2005. Austin, Texas.
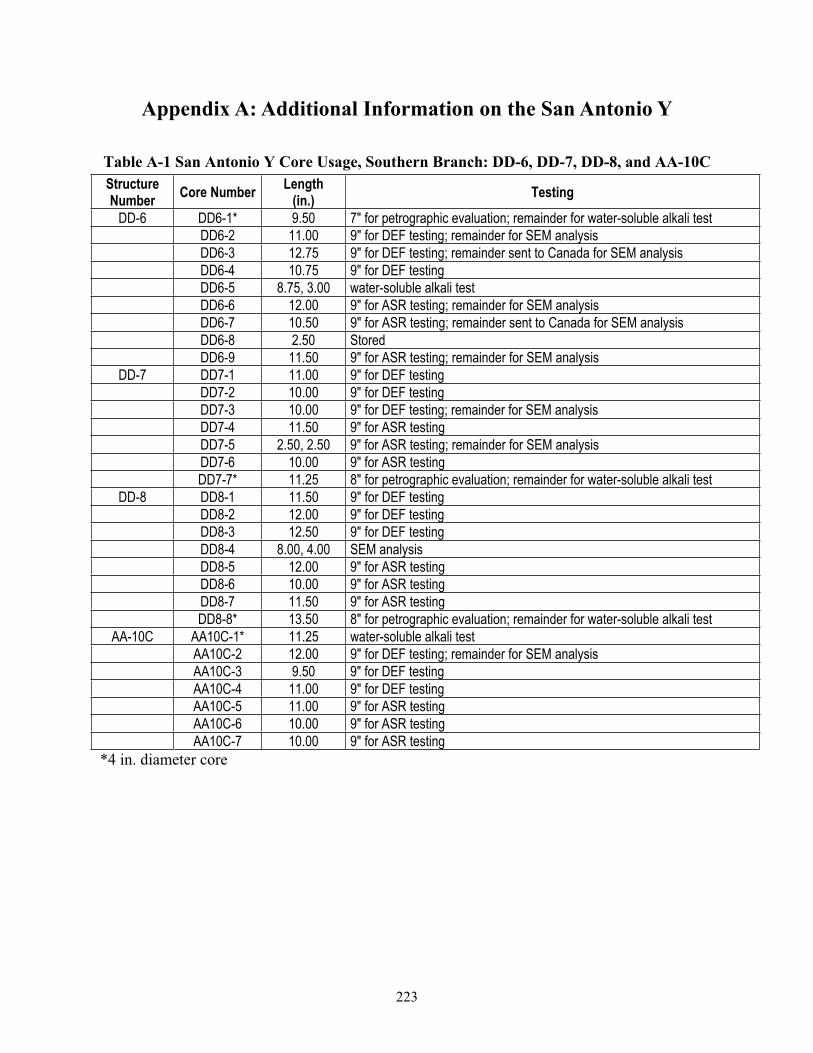
223
Appendix A: Additional Information on the San Antonio Y
Table A-1 San Antonio Y Core Usage, Southern Branch: DD-6, DD-7, DD-8, and AA-10C Structure Number Core Number Length
(in.) Testing
DD-6 DD6-1* 9.50 7" for petrographic evaluation; remainder for water-soluble alkali test DD6-2 11.00 9" for DEF testing; remainder for SEM analysis DD6-3 12.75 9" for DEF testing; remainder sent to Canada for SEM analysis DD6-4 10.75 9" for DEF testing DD6-5 8.75, 3.00 water-soluble alkali test DD6-6 12.00 9" for ASR testing; remainder for SEM analysis DD6-7 10.50 9" for ASR testing; remainder sent to Canada for SEM analysis DD6-8 2.50 Stored DD6-9 11.50 9" for ASR testing; remainder for SEM analysis
DD-7 DD7-1 11.00 9" for DEF testing DD7-2 10.00 9" for DEF testing DD7-3 10.00 9" for DEF testing; remainder for SEM analysis DD7-4 11.50 9" for ASR testing DD7-5 2.50, 2.50 9" for ASR testing; remainder for SEM analysis DD7-6 10.00 9" for ASR testing DD7-7* 11.25 8" for petrographic evaluation; remainder for water-soluble alkali test
DD-8 DD8-1 11.50 9" for DEF testing DD8-2 12.00 9" for DEF testing DD8-3 12.50 9" for DEF testing DD8-4 8.00, 4.00 SEM analysis DD8-5 12.00 9" for ASR testing DD8-6 10.00 9" for ASR testing DD8-7 11.50 9" for ASR testing DD8-8* 13.50 8" for petrographic evaluation; remainder for water-soluble alkali test
AA-10C AA10C-1* 11.25 water-soluble alkali test AA10C-2 12.00 9" for DEF testing; remainder for SEM analysis AA10C-3 9.50 9" for DEF testing AA10C-4 11.00 9" for DEF testing AA10C-5 11.00 9" for ASR testing AA10C-6 10.00 9" for ASR testing AA10C-7 10.00 9" for ASR testing
*4 in. diameter core
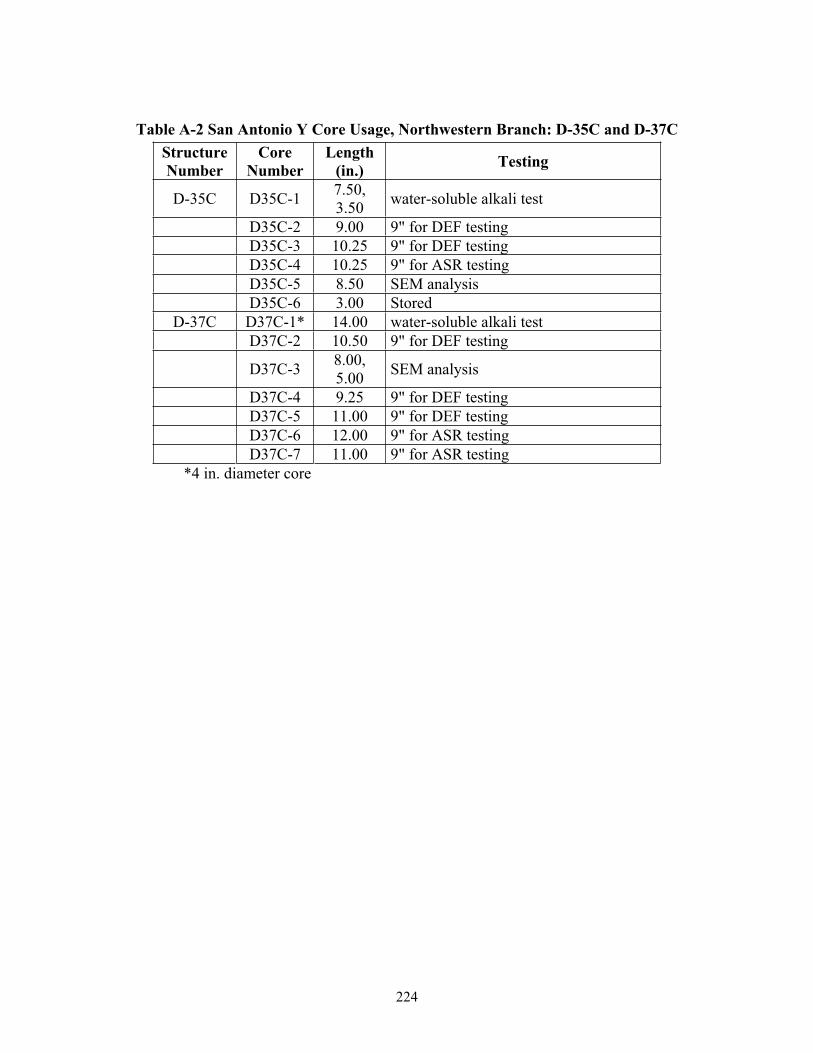
224
Table A-2 San Antonio Y Core Usage, Northwestern Branch: D-35C and D-37C StructureNumber
CoreNumber
Length (in.) Testing
D-35C D35C-1 7.50,3.50 water-soluble alkali test
D35C-2 9.00 9" for DEF testing D35C-3 10.25 9" for DEF testing D35C-4 10.25 9" for ASR testing D35C-5 8.50 SEM analysis D35C-6 3.00 Stored
D-37C D37C-1* 14.00 water-soluble alkali test D37C-2 10.50 9" for DEF testing
D37C-3 8.00,5.00 SEM analysis
D37C-4 9.25 9" for DEF testing D37C-5 11.00 9" for DEF testing D37C-6 12.00 9" for ASR testing D37C-7 11.00 9" for ASR testing
*4 in. diameter core
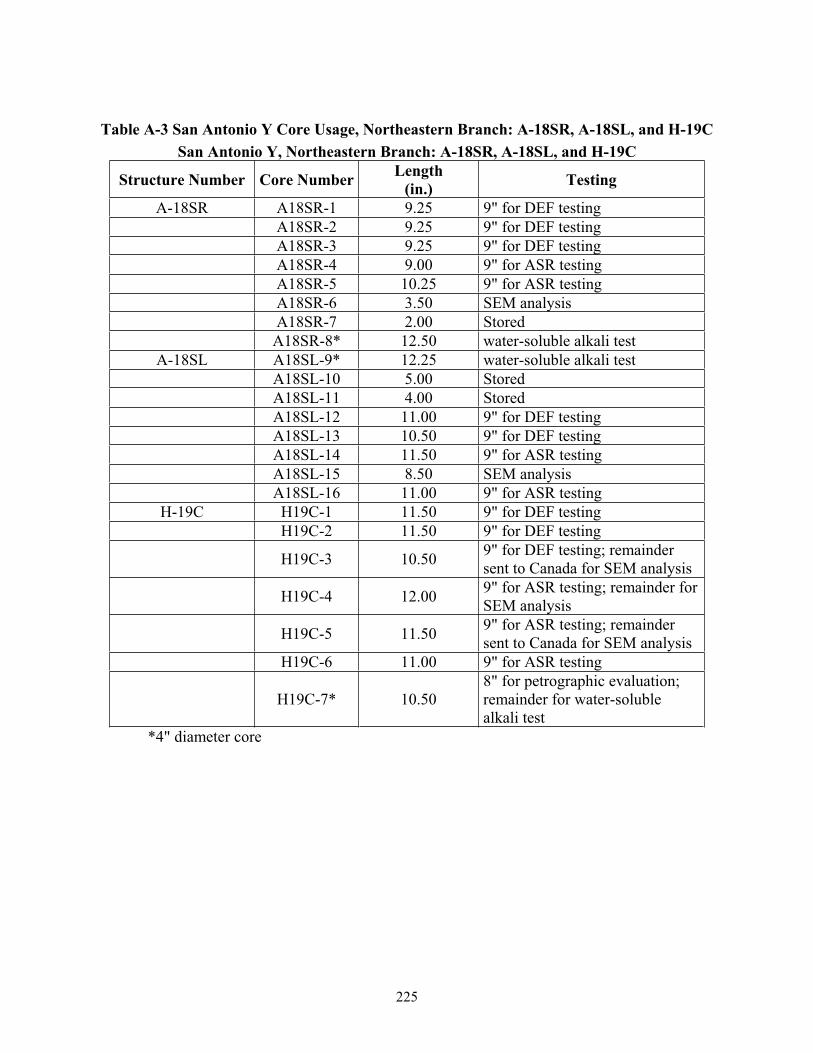
225
Table A-3 San Antonio Y Core Usage, Northeastern Branch: A-18SR, A-18SL, and H-19C San Antonio Y, Northeastern Branch: A-18SR, A-18SL, and H-19C
Structure Number Core Number Length (in.) Testing
A-18SR A18SR-1 9.25 9" for DEF testing A18SR-2 9.25 9" for DEF testing A18SR-3 9.25 9" for DEF testing A18SR-4 9.00 9" for ASR testing A18SR-5 10.25 9" for ASR testing A18SR-6 3.50 SEM analysis A18SR-7 2.00 Stored A18SR-8* 12.50 water-soluble alkali test
A-18SL A18SL-9* 12.25 water-soluble alkali test A18SL-10 5.00 Stored A18SL-11 4.00 Stored A18SL-12 11.00 9" for DEF testing A18SL-13 10.50 9" for DEF testing A18SL-14 11.50 9" for ASR testing A18SL-15 8.50 SEM analysis A18SL-16 11.00 9" for ASR testing
H-19C H19C-1 11.50 9" for DEF testing H19C-2 11.50 9" for DEF testing
H19C-3 10.50 9" for DEF testing; remainder sent to Canada for SEM analysis
H19C-4 12.00 9" for ASR testing; remainder for SEM analysis
H19C-5 11.50 9" for ASR testing; remainder sent to Canada for SEM analysis
H19C-6 11.00 9" for ASR testing
H19C-7* 10.50 8" for petrographic evaluation; remainder for water-soluble alkali test
*4" diameter core

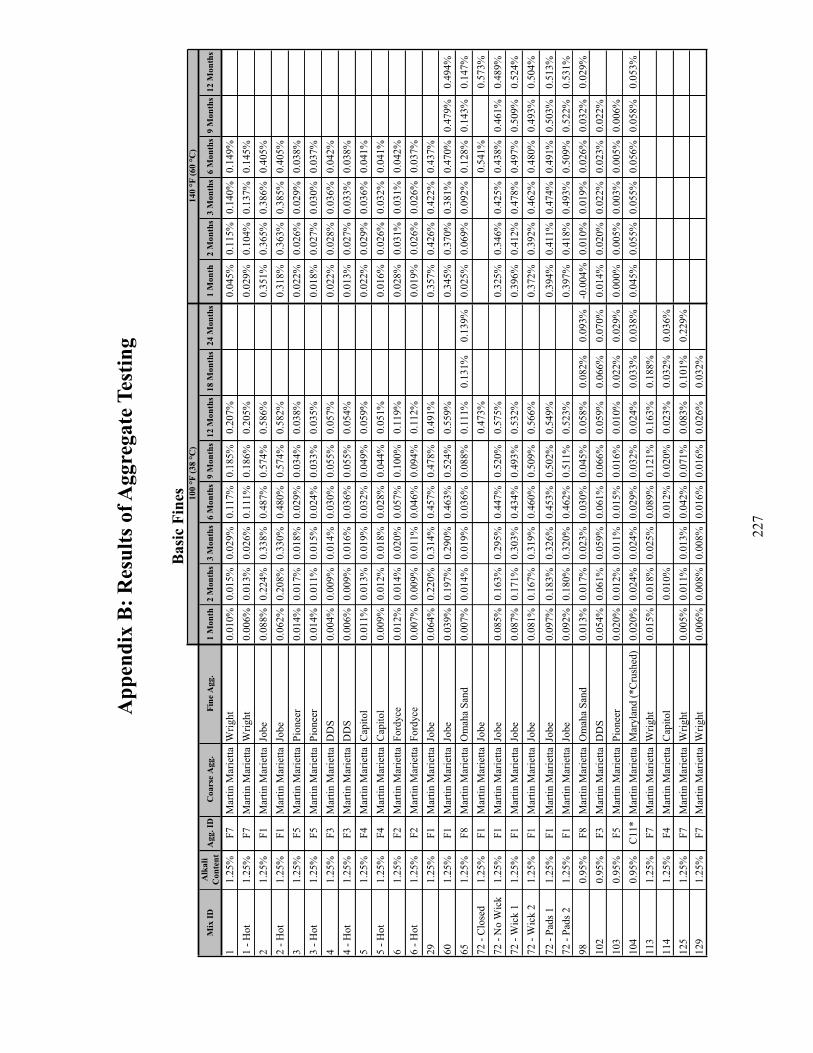
227
App
endi
x B
: Res
ults
of A
ggre
gate
Tes
ting
Bas
ic F
ines
Mix
IDA
lkal
i C
onte
ntA
gg. I
DC
oars
e A
gg.
Fine
Agg
.1
Mon
th2
Mon
ths
3 M
onth
s6
Mon
ths
9 M
onth
s12
Mon
ths
18 M
onth
s24
Mon
ths
1 M
onth
2 M
onth
s3
Mon
ths
6 M
onth
s9
Mon
ths
12 M
onth
s
11.
25%
F7M
artin
Mar
ietta
Wrig
ht0.
010%
0.01
5%0.
029%
0.11
7%0.
185%
0.20
7%0.
045%
0.11
5%0.
140%
0.14
9%1
- Hot
1.25
%F7
Mar
tin M
arie
ttaW
right
0.00
6%0.
013%
0.02
6%0.
111%
0.18
6%0.
205%
0.02
9%0.
104%
0.13
7%0.
145%
21.
25%
F1M
artin
Mar
ietta
Jobe
0.08
8%0.
224%
0.33
8%0.
487%
0.57
4%0.
586%
0.35
1%0.
365%
0.38
6%0.
405%
2 - H
ot1.
25%
F1M
artin
Mar
ietta
Jobe
0.06
2%0.
208%
0.33
0%0.
480%
0.57
4%0.
582%
0.31
8%0.
363%
0.38
5%0.
405%
31.
25%
F5M
artin
Mar
ietta
Pion
eer
0.01
4%0.
017%
0.01
8%0.
029%
0.03
4%0.
038%
0.02
2%0.
026%
0.02
9%0.
038%
3 - H
ot1.
25%
F5M
artin
Mar
ietta
Pion
eer
0.01
4%0.
011%
0.01
5%0.
024%
0.03
3%0.
035%
0.01
8%0.
027%
0.03
0%0.
037%
41.
25%
F3M
artin
Mar
ietta
DD
S0.
004%
0.00
9%0.
014%
0.03
0%0.
055%
0.05
7%0.
022%
0.02
8%0.
036%
0.04
2%4
- Hot
1.25
%F3
Mar
tin M
arie
ttaD
DS
0.00
6%0.
009%
0.01
6%0.
036%
0.05
5%0.
054%
0.01
3%0.
027%
0.03
3%0.
038%
51.
25%
F4M
artin
Mar
ietta
Cap
itol
0.01
1%0.
013%
0.01
9%0.
032%
0.04
9%0.
059%
0.02
2%0.
029%
0.03
6%0.
041%
5 - H
ot1.
25%
F4M
artin
Mar
ietta
Cap
itol
0.00
9%0.
012%
0.01
8%0.
028%
0.04
4%0.
051%
0.01
6%0.
026%
0.03
2%0.
041%
61.
25%
F2M
artin
Mar
ietta
Ford
yce
0.01
2%0.
014%
0.02
0%0.
057%
0.10
0%0.
119%
0.02
8%0.
031%
0.03
1%0.
042%
6 - H
ot1.
25%
F2M
artin
Mar
ietta
Ford
yce
0.00
7%0.
009%
0.01
1%0.
046%
0.09
4%0.
112%
0.01
9%0.
026%
0.02
6%0.
037%
291.
25%
F1M
artin
Mar
ietta
Jobe
0.06
4%0.
220%
0.31
4%0.
457%
0.47
8%0.
491%
0.35
7%0.
426%
0.42
2%0.
437%
601.
25%
F1M
artin
Mar
ietta
Jobe
0.03
9%0.
197%
0.29
0%0.
463%
0.52
4%0.
559%
0.34
5%0.
370%
0.38
1%0.
470%
0.47
9%0.
494%
651.
25%
F8M
artin
Mar
ietta
Om
aha
Sand
0.00
7%0.
014%
0.01
9%0.
036%
0.08
8%0.
111%
0.13
1%0.
139%
0.02
5%0.
069%
0.09
2%0.
128%
0.14
3%0.
147%
72 -
Clo
sed
1.25
%F1
Mar
tin M
arie
ttaJo
be0.
473%
0.54
1%0.
573%
72 -
No
Wic
k1.
25%
F1M
artin
Mar
ietta
Jobe
0.08
5%0.
163%
0.29
5%0.
447%
0.52
0%0.
575%
0.32
5%0.
346%
0.42
5%0.
438%
0.46
1%0.
489%
72 -
Wic
k 1
1.25
%F1
Mar
tin M
arie
ttaJo
be0.
087%
0.17
1%0.
303%
0.43
4%0.
493%
0.53
2%0.
396%
0.41
2%0.
478%
0.49
7%0.
509%
0.52
4%72
- W
ick
21.
25%
F1M
artin
Mar
ietta
Jobe
0.08
1%0.
167%
0.31
9%0.
460%
0.50
9%0.
566%
0.37
2%0.
392%
0.46
2%0.
480%
0.49
3%0.
504%
72 -
Pads
11.
25%
F1M
artin
Mar
ietta
Jobe
0.09
7%0.
183%
0.32
6%0.
453%
0.50
2%0.
549%
0.39
4%0.
411%
0.47
4%0.
491%
0.50
3%0.
513%
72 -
Pads
21.
25%
F1M
artin
Mar
ietta
Jobe
0.09
2%0.
180%
0.32
0%0.
462%
0.51
1%0.
523%
0.39
7%0.
418%
0.49
3%0.
509%
0.52
2%0.
531%
980.
95%
F8M
artin
Mar
ietta
Om
aha
Sand
0.01
3%0.
017%
0.02
3%0.
030%
0.04
5%0.
058%
0.08
2%0.
093%
-0.0
04%
0.01
0%0.
019%
0.02
6%0.
032%
0.02
9%10
20.
95%
F3M
artin
Mar
ietta
DD
S0.
054%
0.06
1%0.
059%
0.06
1%0.
066%
0.05
9%0.
066%
0.07
0%0.
014%
0.02
0%0.
022%
0.02
3%0.
022%
103
0.95
%F5
Mar
tin M
arie
ttaPi
onee
r0.
020%
0.01
2%0.
011%
0.01
5%0.
016%
0.01
0%0.
022%
0.02
9%0.
000%
0.00
5%0.
003%
0.00
5%0.
006%
104
0.95
%C
11*
Mar
tin M
arie
ttaM
aryl
and
(*C
rush
ed)
0.02
0%0.
024%
0.02
4%0.
029%
0.03
2%0.
024%
0.03
3%0.
038%
0.04
5%0.
055%
0.05
5%0.
056%
0.05
8%0.
053%
113
1.25
%F7
Mar
tin M
arie
ttaW
right
0.01
5%0.
018%
0.02
5%0.
089%
0.12
1%0.
163%
0.18
8%11
41.
25%
F4M
artin
Mar
ietta
Cap
itol
0.01
0%0.
012%
0.02
0%0.
023%
0.03
2%0.
036%
125
1.25
%F7
Mar
tin M
arie
ttaW
right
0.00
5%0.
011%
0.01
3%0.
042%
0.07
1%0.
083%
0.10
1%0.
229%
129
1.25
%F7
Mar
tin M
arie
ttaW
right
0.00
6%0.
008%
0.00
8%0.
016%
0.01
6%0.
026%
0.03
2%
100
°F (3
8 °C
)14
0 °F
(60
°C)
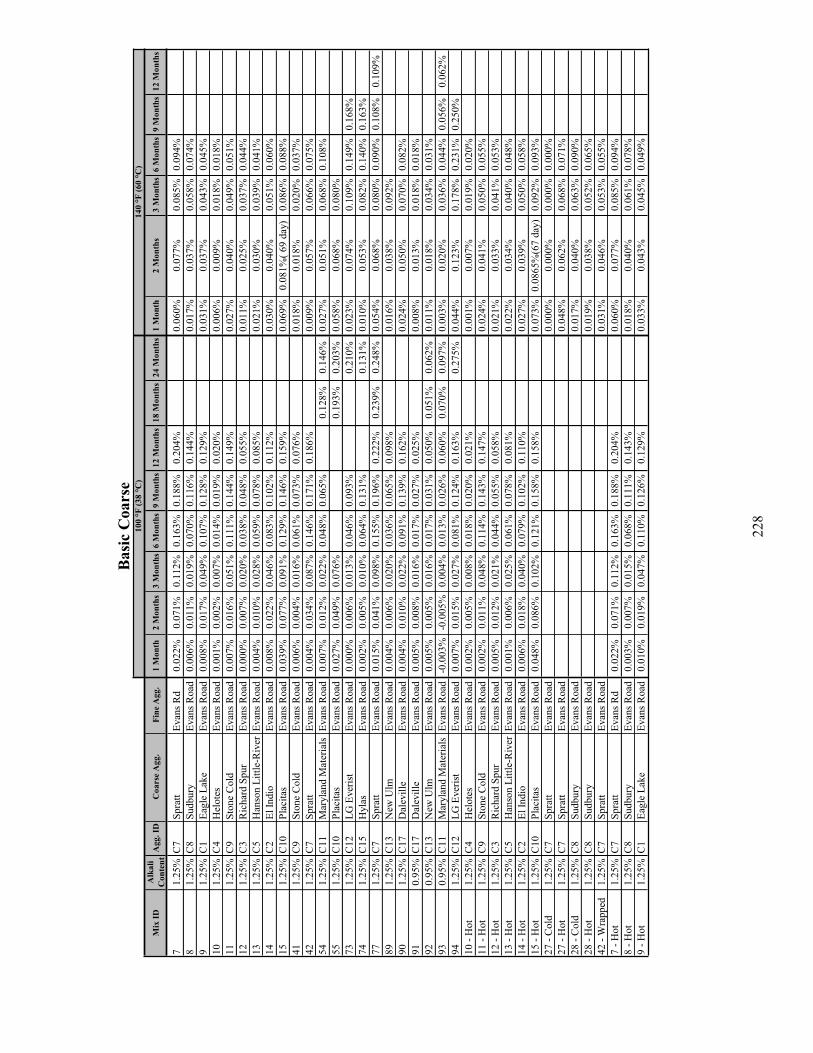
228
Bas
ic C
oars
e
Mix
IDA
lkal
i C
onte
ntA
gg. I
DC
oars
e A
gg.
Fine
Agg
.1
Mon
th2
Mon
ths
3 M
onth
s6
Mon
ths
9 M
onth
s12
Mon
ths
18 M
onth
s24
Mon
ths
1 M
onth
2 M
onth
s3
Mon
ths
6 M
onth
s9
Mon
ths
12 M
onth
s
71.
25%
C7
Spra
ttEv
ans R
d0.
022%
0.07
1%0.
112%
0.16
3%0.
188%
0.20
4%0.
060%
0.07
7%0.
085%
0.09
4%8
1.25
%C
8Su
dbur
yEv
ans R
oad
0.00
6%0.
011%
0.01
9%0.
070%
0.11
6%0.
144%
0.01
7%0.
037%
0.05
8%0.
074%
91.
25%
C1
Eagl
e La
keEv
ans R
oad
0.00
8%0.
017%
0.04
9%0.
107%
0.12
8%0.
129%
0.03
1%0.
037%
0.04
3%0.
045%
101.
25%
C4
Hel
otes
Evan
s Roa
d0.
001%
0.00
2%0.
007%
0.01
4%0.
019%
0.02
0%0.
006%
0.00
9%0.
018%
0.01
8%11
1.25
%C
9St
one
Col
dEv
ans R
oad
0.00
7%0.
016%
0.05
1%0.
111%
0.14
4%0.
149%
0.02
7%0.
040%
0.04
9%0.
051%
121.
25%
C3
Ric
hard
Spu
rEv
ans R
oad
0.00
0%0.
007%
0.02
0%0.
038%
0.04
8%0.
055%
0.01
1%0.
025%
0.03
7%0.
044%
131.
25%
C5
Han
son
Littl
e-R
iver
Evan
s Roa
d0.
004%
0.01
0%0.
028%
0.05
9%0.
078%
0.08
5%0.
021%
0.03
0%0.
039%
0.04
1%14
1.25
%C
2El
Indi
oEv
ans R
oad
0.00
8%0.
022%
0.04
6%0.
083%
0.10
2%0.
112%
0.03
0%0.
040%
0.05
1%0.
060%
151.
25%
C10
Plac
itas
Evan
s Roa
d0.
039%
0.07
7%0.
091%
0.12
9%0.
146%
0.15
9%0.
069%
0.08
1%( 6
9 da
y)0.
086%
0.08
8%41
1.25
%C
9St
one
Col
dEv
ans R
oad
0.00
6%0.
004%
0.01
6%0.
061%
0.07
3%0.
076%
0.01
8%0.
018%
0.02
0%0.
037%
421.
25%
C7
Spra
ttEv
ans R
oad
0.00
4%0.
034%
0.08
7%0.
146%
0.17
1%0.
186%
0.00
9%0.
057%
0.06
6%0.
075%
541.
25%
C11
Mar
ylan
d M
ater
ials
Evan
s Roa
d0.
007%
0.01
2%0.
022%
0.04
8%0.
065%
0.12
8%0.
146%
0.02
7%0.
051%
0.06
8%0.
108%
551.
25%
C10
Plac
itas
Evan
s Roa
d0.
027%
0.04
9%0.
076%
0.19
3%0.
203%
0.05
8%0.
068%
0.08
0%73
1.25
%C
12LG
Eve
rist
Evan
s Roa
d0.
000%
0.00
6%0.
013%
0.04
6%0.
093%
0.21
0%0.
023%
0.07
4%0.
109%
0.14
9%0.
168%
741.
25%
C15
Hyl
asEv
ans R
oad
0.00
2%0.
005%
0.01
0%0.
064%
0.13
1%0.
131%
0.01
0%0.
053%
0.08
2%0.
140%
0.16
3%77
1.25
%C
7Sp
ratt
Evan
s Roa
d0.
015%
0.04
1%0.
098%
0.15
5%0.
196%
0.22
2%0.
239%
0.24
8%0.
054%
0.06
8%0.
080%
0.09
0%0.
108%
0.10
9%89
1.25
%C
13N
ew U
lmEv
ans R
oad
0.00
4%0.
006%
0.02
0%0.
036%
0.06
5%0.
098%
0.01
6%0.
038%
0.09
2%90
1.25
%C
17D
alev
ille
Evan
s Roa
d0.
004%
0.01
0%0.
022%
0.09
1%0.
139%
0.16
2%0.
024%
0.05
0%0.
070%
0.08
2%91
0.95
%C
17D
alev
ille
Evan
s Roa
d0.
005%
0.00
8%0.
016%
0.01
7%0.
027%
0.02
5%0.
008%
0.01
3%0.
018%
0.01
8%92
0.95
%C
13N
ew U
lmEv
ans R
oad
0.00
5%0.
005%
0.01
6%0.
017%
0.03
1%0.
050%
0.05
1%0.
062%
0.01
1%0.
018%
0.03
4%0.
031%
930.
95%
C11
Mar
ylan
d M
ater
ials
Evan
s Roa
d-0
.003
%-0
.005
%0.
004%
0.01
3%0.
026%
0.06
0%0.
070%
0.09
7%0.
003%
0.02
0%0.
036%
0.04
4%0.
056%
0.06
2%94
1.25
%C
12LG
Eve
rist
Evan
s Roa
d0.
007%
0.01
5%0.
027%
0.08
1%0.
124%
0.16
3%0.
275%
0.04
4%0.
123%
0.17
8%0.
231%
0.25
0%10
- H
ot1.
25%
C4
Hel
otes
Evan
s Roa
d0.
002%
0.00
5%0.
008%
0.01
8%0.
020%
0.02
1%0.
001%
0.00
7%0.
019%
0.02
0%11
- H
ot1.
25%
C9
Ston
e C
old
Evan
s Roa
d0.
002%
0.01
1%0.
048%
0.11
4%0.
143%
0.14
7%0.
024%
0.04
1%0.
050%
0.05
5%12
- H
ot1.
25%
C3
Ric
hard
Spu
rEv
ans R
oad
0.00
5%0.
012%
0.02
1%0.
044%
0.05
5%0.
058%
0.02
1%0.
033%
0.04
1%0.
053%
13 -
Hot
1.25
%C
5H
anso
n Li
ttle-
Riv
erEv
ans R
oad
0.00
1%0.
006%
0.02
5%0.
061%
0.07
8%0.
081%
0.02
2%0.
034%
0.04
0%0.
048%
14 -
Hot
1.25
%C
2El
Indi
oEv
ans R
oad
0.00
6%0.
018%
0.04
0%0.
079%
0.10
2%0.
110%
0.02
7%0.
039%
0.05
0%0.
058%
15 -
Hot
1.25
%C
10Pl
acita
sEv
ans R
oad
0.04
8%0.
086%
0.10
2%0.
121%
0.15
8%0.
158%
0.07
3%0.
0865
%(6
7 da
y)0.
092%
0.09
3%27
- C
old
1.25
%C
7Sp
ratt
Evan
s Roa
d0.
000%
0.00
0%0.
000%
0.00
0%27
- H
ot1.
25%
C7
Spra
ttEv
ans R
oad
0.04
8%0.
062%
0.06
8%0.
071%
28 -
Col
d1.
25%
C8
Sudb
ury
Evan
s Roa
d0.
017%
0.04
0%0.
063%
0.09
0%28
- H
ot1.
25%
C8
Sudb
ury
Evan
s Roa
d0.
019%
0.03
8%0.
052%
0.06
5%42
- W
rapp
ed1.
25%
C7
Spra
ttEv
ans R
oad
0.03
1%0.
046%
0.05
3%0.
055%
7 - H
ot1.
25%
C7
Spra
ttEv
ans R
d0.
022%
0.07
1%0.
112%
0.16
3%0.
188%
0.20
4%0.
060%
0.07
7%0.
085%
0.09
4%8
- Hot
1.25
%C
8Su
dbur
yEv
ans R
oad
0.00
3%0.
007%
0.01
5%0.
068%
0.11
1%0.
143%
0.01
8%0.
040%
0.06
1%0.
078%
9 - H
ot1.
25%
C1
Eagl
e La
keEv
ans R
oad
0.01
0%0.
019%
0.04
7%0.
110%
0.12
6%0.
129%
0.03
3%0.
043%
0.04
5%0.
049%
140
°F (6
0 °C
)10
0 °F
(38
°C)
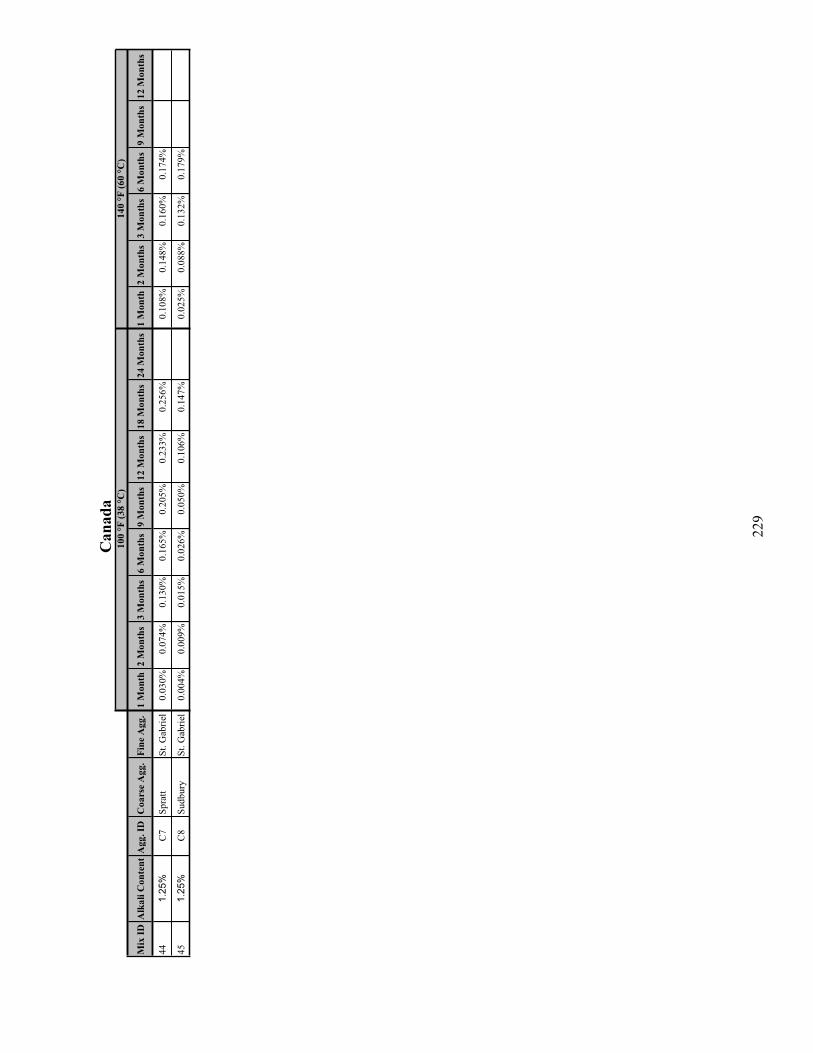
229
Can
ada
Mix
IDA
lkal
i Con
tent
Agg
. ID
Coa
rse
Agg
.Fi
ne A
gg.
1 M
onth
2 M
onth
s3
Mon
ths
6 M
onth
s9
Mon
ths
12 M
onth
s18
Mon
ths
24 M
onth
s1
Mon
th2
Mon
ths
3 M
onth
s6
Mon
ths
9 M
onth
s12
Mon
ths
441.
25%
C7
Spra
ttSt
. Gab
riel
0.03
0%0.
074%
0.13
0%0.
165%
0.20
5%0.
233%
0.25
6%0.
108%
0.14
8%0.
160%
0.17
4%
451.
25%
C8
Sudb
ury
St. G
abrie
l0.
004%
0.00
9%0.
015%
0.02
6%0.
050%
0.10
6%0.
147%
0.02
5%0.
088%
0.13
2%0.
179%
100
°F (3
8 °C
)14
0 °F
(60
°C)
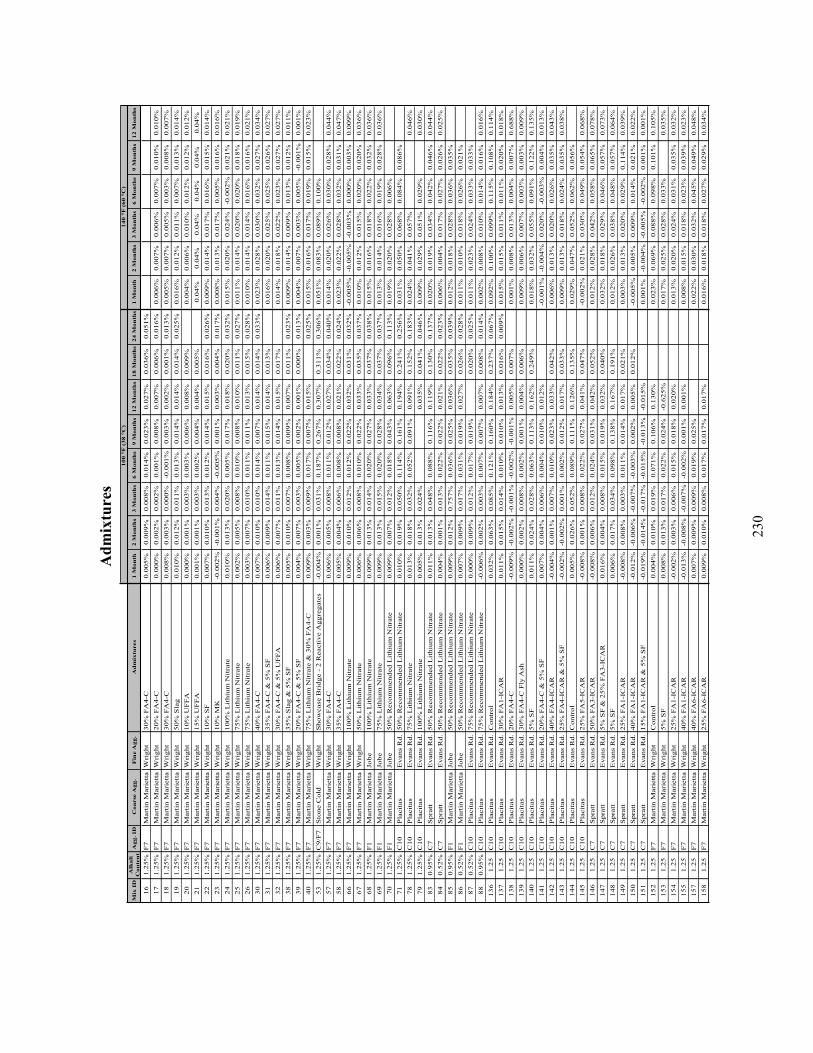
230
Mix
ID
Alk
ali
Con
ten
tA
gg. I
DC
oars
e A
gg.
Fin
e A
gg.
Ad
mix
ture
s1
Mon
th2
Mon
ths
3 M
onth
s6
Mon
ths
9 M
onth
s12
Mon
ths
18 M
onth
s24
Mon
ths
1 M
onth
2 M
onth
s3
Mon
ths
6 M
onth
s9
Mon
ths
12 M
onth
s
161.
25%
F7
Mar
tin
Mar
iett
aW
righ
t30
% F
A4-
C0.
005%
0.00
9%0.
008%
0.01
4%0.
023%
0.02
7%0.
036%
0.05
1%17
1.25
%F
7M
arti
n M
arie
tta
Wri
ght
20%
FA
4-C
0.00
0%0.
002%
0.00
2%0.
001%
0.00
8%0.
007%
0.00
6%0.
016%
0.00
6%0.
007%
0.00
6%0.
007%
0.01
0%0.
010%
181.
25%
F7
Mar
tin
Mar
iett
aW
righ
t30
% F
A4-
C0.
008%
0.00
3%0.
000%
-0.0
01%
0.00
3%0.
002%
0.00
1%0.
013%
0.00
5%0.
007%
0.00
5%0.
003%
0.00
8%0.
007%
191.
25%
F7
Mar
tin
Mar
iett
aW
righ
t50
% S
lag
0.01
0%0.
012%
0.01
1%0.
013%
0.01
4%0.
014%
0.01
4%0.
025%
0.01
6%0.
012%
0.01
1%0.
007%
0.01
3%0.
014%
201.
25%
F7
Mar
tin
Mar
iett
aW
righ
t10
% U
FF
A0.
000%
0.00
1%0.
003%
0.00
3%0.
006%
0.00
8%0.
009%
0.00
4%0.
006%
0.01
0%0.
012%
0.01
2%0.
012%
211.
25%
F7
Mar
tin
Mar
iett
aW
righ
t15
% U
FF
A0.
001%
0.00
1%0.
003%
0.00
2%0.
004%
0.00
4%0.
005%
0.04
%0.
04%
0.04
%0.
04%
0.04
%0.
04%
221.
25%
F7
Mar
tin
Mar
iett
aW
righ
t10
% S
F0.
007%
0.01
0%0.
013%
0.01
2%0.
014%
0.01
5%0.
016%
0.02
6%0.
009%
0.01
4%0.
017%
0.01
6%0.
015%
0.01
4%23
1.25
%F
7M
arti
n M
arie
tta
Wri
ght
10%
MK
-0.0
02%
-0.0
01%
0.00
4%-0
.005
%0.
001%
0.00
3%0.
004%
0.01
7%0.
008%
0.01
3%0.
017%
0.00
5%0.
016%
0.01
6%24
1.25
%F
7M
arti
n M
arie
tta
Wri
ght
100%
Lit
hium
Nit
rate
0.01
0%0.
013%
0.02
0%0.
005%
0.01
7%0.
018%
0.02
0%0.
032%
0.01
5%0.
020%
0.02
4%-0
.002
%0.
021%
0.02
1%25
1.25
%F
7M
arti
n M
arie
tta
Wri
ght
75%
Lit
hium
Nit
rate
0.00
2%0.
005%
0.00
8%0.
010%
0.00
8%0.
010%
0.01
1%0.
027%
0.01
1%0.
014%
0.02
0%0.
020%
0.01
8%0.
019%
261.
25%
F7
Mar
tin
Mar
iett
aW
righ
t75
% L
ithi
um N
itra
te0.
003%
0.00
7%0.
010%
0.01
1%0.
011%
0.01
3%0.
015%
0.02
8%0.
010%
0.01
4%0.
014%
0.01
6%0.
016%
0.02
1%30
1.25
%F
7M
arti
n M
arie
tta
Wri
ght
40%
FA
4-C
0.00
7%0.
010%
0.01
0%0.
014%
0.00
7%0.
014%
0.01
4%0.
033%
0.02
3%0.
028%
0.03
0%0.
032%
0.02
7%0.
034%
311.
25%
F7
Mar
tin
Mar
iett
aW
righ
t35
% F
A4-
C &
5%
SF
0.00
6%0.
009%
0.01
4%0.
011%
0.01
5%0.
014%
0.01
3%0.
016%
0.02
0%0.
025%
0.02
5%0.
026%
0.02
7%32
1.25
%F
7M
arti
n M
arie
tta
Wri
ght
30%
FA
4-C
& 5
% U
FF
A0.
006%
0.00
7%0.
011%
0.01
3%0.
014%
0.01
5%0.
017%
0.01
4%0.
018%
0.02
2%0.
023%
0.02
7%0.
027%
381.
25%
F7
Mar
tin
Mar
iett
aW
righ
t35
% S
lag
& 5
% S
F0.
005%
0.01
0%0.
007%
0.00
8%0.
009%
0.00
7%0.
011%
0.02
3%0.
009%
0.01
4%0.
009%
0.01
3%0.
012%
0.01
1%39
1.25
%F
7M
arti
n M
arie
tta
Wri
ght
20%
FA
4-C
& 5
% S
F0.
004%
0.00
7%0.
003%
0.00
5%0.
002%
0.00
1%0.
000%
0.01
3%0.
004%
0.00
7%0.
003%
0.00
5%-0
.001
%0.
001%
401.
25%
F7
Mar
tin
Mar
iett
aW
righ
t75
% L
ithi
um N
itra
te &
30%
FA
4-C
0.00
9%0.
003%
0.00
9%0.
017%
0.00
7%0.
015%
0.02
5%0.
015%
0.01
6%0.
017%
0.01
9%0.
015%
0.02
3%53
1.25
%C
9/F
7S
tone
Col
dW
righ
tS
how
case
Bri
dge
- 2
Rea
ctiv
e A
ggre
gate
s -0
.004
%0.
001%
0.03
1%0.
187%
0.26
7%0.
307%
0.31
1%0.
306%
0.05
1%0.
083%
0.08
9%0.
100%
571.
25%
F7
Mar
tin
Mar
iett
aW
righ
t30
% F
A4-
C0.
006%
0.00
5%0.
008%
0.01
1%0.
012%
0.02
7%0.
034%
0.04
0%0.
014%
0.02
0%0.
026%
0.03
0%0.
028%
0.04
4%58
1.25
%F
7M
arti
n M
arie
tta
Wri
ght
35%
FA
4-C
0.00
5%0.
004%
0.00
6%0.
008%
0.00
8%0.
021%
0.02
2%0.
024%
0.02
3%0.
022%
0.02
8%0.
032%
0.03
1%0.
047%
661.
25%
F7
Mar
tin
Mar
iett
aW
righ
t10
0% L
ithi
um N
itra
te0.
009%
0.01
0%0.
012%
0.01
2%0.
022%
0.03
2%0.
031%
0.03
2%-0
.005
%-0
.005
%-0
.003
%0.
000%
0.00
3%0.
009%
671.
25%
F7
Mar
tin
Mar
iett
aW
righ
t50
% L
ithi
um N
itra
te0.
006%
0.00
6%0.
008%
0.01
0%0.
022%
0.03
3%0.
035%
0.03
7%0.
010%
0.01
2%0.
015%
0.02
0%0.
020%
0.03
6%68
1.25
%F
1M
arti
n M
arie
tta
Jobe
100%
Lit
hium
Nit
rate
0.00
9%0.
013%
0.01
4%0.
020%
0.02
7%0.
033%
0.03
7%0.
038%
0.01
5%0.
016%
0.01
8%0.
022%
0.03
2%0.
036%
691.
25%
F1
Mar
tin
Mar
iett
aJo
be75
% L
ithi
um N
itra
te
0.00
9%0.
013%
0.01
5%0.
020%
0.02
8%0.
034%
0.03
7%0.
037%
0.01
3%0.
014%
0.01
6%0.
019%
0.02
8%0.
036%
701.
25%
F1
Mar
tin
Mar
iett
aJo
be50
% R
ecom
men
ded
Lit
hium
Nit
rate
0.00
9%0.
007%
0.01
2%0.
018%
0.04
3%0.
063%
0.09
6%0.
113%
0.01
9%0.
020%
0.02
8%0.
006%
711.
25%
C10
Pla
cita
sE
vans
Rd.
50%
Rec
omm
ende
d L
ithi
um N
itra
te0.
010%
0.01
9%0.
050%
0.11
4%0.
161%
0.19
4%0.
241%
0.25
6%0.
031%
0.05
0%0.
068%
0.08
4%0.
086%
781.
25%
C10
Pla
cita
sE
vans
Rd.
75%
Lit
hium
Nit
rate
0.01
3%0.
018%
0.03
2%0.
052%
0.09
1%0.
091%
0.15
2%0.
183%
0.02
4%0.
041%
0.05
7%0.
046%
791.
25%
C10
Pla
cita
sE
vans
Rd.
100%
Lit
hium
Nit
rate
0.00
5%0.
013%
0.02
4%0.
035%
0.04
1%0.
046%
0.00
9%0.
029%
0.05
1%0.
029%
0.03
0%83
0.95
%C
7S
prat
tE
vans
Rd.
50%
Rec
omm
ende
d L
ithi
um N
itra
te0.
011%
0.01
3%0.
048%
0.08
8%0.
116%
0.11
9%0.
130%
0.13
7%0.
020%
0.01
9%0.
034%
0.04
2%0.
046%
0.04
4%84
0.52
%C
7S
prat
tE
vans
Rd.
50%
Rec
omm
ende
d L
ithi
um N
itra
te0.
004%
0.00
1%0.
013%
0.02
2%0.
022%
0.02
1%0.
022%
0.02
3%0.
006%
0.00
4%0.
017%
0.02
7%0.
026%
0.02
5%85
0.95
%F
1M
arti
n M
arie
tta
Jobe
50%
Rec
omm
ende
d L
ithi
um N
itra
te0.
009%
0.01
2%0.
757%
0.03
6%0.
025%
0.03
6%0.
035%
0.03
9%0.
012%
0.01
8%0.
028%
0.03
6%0.
035%
860.
52%
F1
Mar
tin
Mar
iett
aJo
be50
% R
ecom
men
ded
Lit
hium
Nit
rate
0.00
7%0.
009%
0.01
7%0.
031%
0.01
9%0.
027%
0.02
6%0.
028%
0.01
1%0.
010%
0.01
8%0.
026%
0.02
1%87
0.52
%C
10P
laci
tas
Eva
ns R
d.75
% R
ecom
men
ded
Lit
hium
Nit
rate
0.00
0%0.
009%
0.01
2%0.
017%
0.01
9%0.
020%
0.02
5%0.
011%
0.02
3%0.
024%
0.03
3%0.
033%
880.
95%
C10
Pla
cita
sE
vans
Rd.
75%
Rec
omm
ende
d L
ithi
um N
itra
te-0
.006
%0.
002%
0.00
3%0.
007%
0.00
7%0.
007%
0.00
8%0.
014%
0.00
2%0.
008%
0.01
0%0.
014%
0.01
6%0.
016%
136
1.25
C10
Pla
cita
sE
vans
Rd.
Con
trol
0.03
2%0.
063%
0.08
5%0.
121%
0.16
0%0.
184%
0.23
7%0.
067%
0.09
2%0.
100%
0.09
9%0.
115%
0.10
8%0.
114%
137
1.25
C10
Pla
cita
sE
vans
Rd.
30%
FA
1-IC
AR
0.01
1%0.
015%
0.01
4%0.
010%
0.01
0%0.
013%
0.01
6%0.
009%
0.01
5%0.
015%
0.01
1%0.
011%
0.02
0%0.
018%
138
1.25
C10
Pla
cita
sE
vans
Rd.
20%
FA
4-C
-0.0
09%
-0.0
02%
-0.0
01%
-0.0
02%
-0.0
01%
0.00
5%0.
007%
0.00
1%0.
008%
0.01
3%0.
004%
0.00
7%0.
688%
139
1.25
C10
Pla
cita
sE
vans
Rd.
30%
FA
4-C
Fly
Ash
0.00
0%0.
002%
0.00
8%0.
002%
0.00
1%0.
004%
0.00
6%0.
009%
0.00
6%0.
007%
0.00
3%0.
003%
0.00
9%14
01.
25C
10P
laci
tas
Eva
ns R
d.5%
SF
0.01
1%0.
024%
0.02
8%0.
063%
0.11
3%0.
162%
0.24
9%0.
018%
0.03
2%0.
055%
0.09
1%0.
122%
0.13
5%14
11.
25C
10P
laci
tas
Eva
ns R
d.20
% F
A4-
C &
5%
SF
0.00
7%0.
004%
0.00
6%0.
004%
0.01
0%0.
012%
-0.0
01%
-0.0
04%
0.02
0%-0
.003
%0.
004%
0.01
3%14
21.
25C
10P
laci
tas
Eva
ns R
d.40
% F
A4-
ICA
R-0
.004
%0.
001%
0.00
7%0.
010%
0.02
3%0.
033%
0.04
2%0.
006%
0.01
3%0.
020%
0.02
6%0.
035%
0.04
3%14
31.
25C
10P
laci
tas
Eva
ns R
d.25
% F
A4-
ICA
R &
5%
SF
-0.0
02%
-0.0
02%
0.00
1%0.
002%
0.01
2%0.
017%
0.03
3%0.
009%
0.01
3%0.
018%
0.02
4%0.
035%
0.03
8%14
41.
25C
10P
laci
tas
Eva
ns R
d.C
ontr
ol0.
005%
0.02
6%0.
052%
0.08
9%0.
111%
0.12
6%0.
135%
0.02
9%0.
047%
0.05
2%0.
062%
0.05
6%14
51.
25C
10P
laci
tas
Eva
ns R
d.25
% F
A5-
ICA
R
-0.0
08%
0.00
1%0.
008%
0.02
2%0.
027%
0.04
1%0.
047%
-0.0
02%
0.02
1%0.
030%
0.04
9%0.
054%
0.06
8%14
61.
25C
7S
prat
tE
vans
Rd.
50%
FA
3-IC
AR
-0.0
08%
0.00
6%0.
012%
0.02
4%0.
031%
0.04
2%0.
052%
0.01
2%0.
028%
0.04
2%0.
058%
0.06
5%0.
078%
147
1.25
C7
Spr
att
Eva
ns R
d.5%
SF
& 2
5% F
A3-
ICA
R0.
016%
0.00
4%0.
008%
0.01
5%0.
019%
0.03
2%0.
040%
0.03
2%0.
018%
0.02
9%0.
046%
0.05
7%0.
073%
148
1.25
C7
Spr
att
Eva
ns R
d.5%
SF
0.00
6%0.
017%
0.03
4%0.
098%
0.13
8%0.
167%
0.19
1%0.
012%
0.02
6%0.
038%
0.04
8%0.
057%
0.06
4%14
91.
25C
7S
prat
tE
vans
Rd.
25%
FA
1-IC
AR
-0.0
08%
0.00
8%0.
003%
0.01
1%0.
014%
0.01
7%0.
021%
0.00
3%0.
013%
0.02
0%0.
029%
0.11
4%0.
039%
150
1.25
C7
Spr
att
Eva
ns R
d.40
% F
A1-
ICA
R-0
.012
%-0
.006
%-0
.007
%-0
.003
%0.
002%
0.00
5%0.
012%
-0.0
05%
0.00
5%0.
009%
0.01
4%0.
021%
0.02
2%15
11.
25C
7S
prat
tE
vans
Rd.
15%
FA
1-IC
AR
& 5
% S
F-0
.019
%-0
.014
%-0
.017
%-0
.015
%-0
.013
%-0
.015
%0.
001%
-0.0
04%
-0.0
05%
-0.0
02%
0.00
1%0.
001%
152
1.25
F7
Mar
tin
Mar
iett
aW
righ
tC
ontr
ol0.
004%
0.01
0%0.
019%
0.07
1%0.
106%
0.13
0%0.
023%
0.06
9%0.
088%
0.09
8%0.
101%
0.10
5%15
31.
25F
7M
arti
n M
arie
tta
Wri
ght
5% S
F0.
008%
0.01
3%0.
017%
0.02
2%0.
024%
-0.6
25%
0.01
7%0.
025%
0.02
8%0.
033%
0.03
5%15
41.
25F
7M
arti
n M
arie
tta
Wri
ght
25%
FA
1-IC
AR
-0.0
02%
0.00
3%0.
006%
0.01
5%0.
018%
0.02
0%0.
013%
0.02
0%0.
024%
0.03
1%0.
035%
0.03
2%15
51.
25F
7M
arti
n M
arie
tta
Wri
ght
40%
FA
1-IC
AR
-0.0
13%
-0.0
08%
-0.0
07%
-0.0
02%
0.00
1%0.
001%
0.00
8%0.
015%
0.01
8%0.
023%
0.03
9%0.
023%
157
1.25
F7
Mar
tin
Mar
iett
aW
righ
t40
% F
A6-
ICA
R0.
007%
0.00
9%0.
009%
0.01
9%0.
025%
0.02
2%0.
030%
0.03
2%0.
045%
0.04
9%0.
048%
158
1.25
F7
Mar
tin
Mar
iett
aW
righ
t25
% F
A6-
ICA
R0.
009%
0.01
0%0.
008%
0.01
7%0.
017%
0.01
7%0.
016%
0.01
8%0.
018%
0.02
7%0.
029%
0.03
4%
100
°F (
38 °
C)
140
°F (
60 °
C)
Adm
ixtu
res
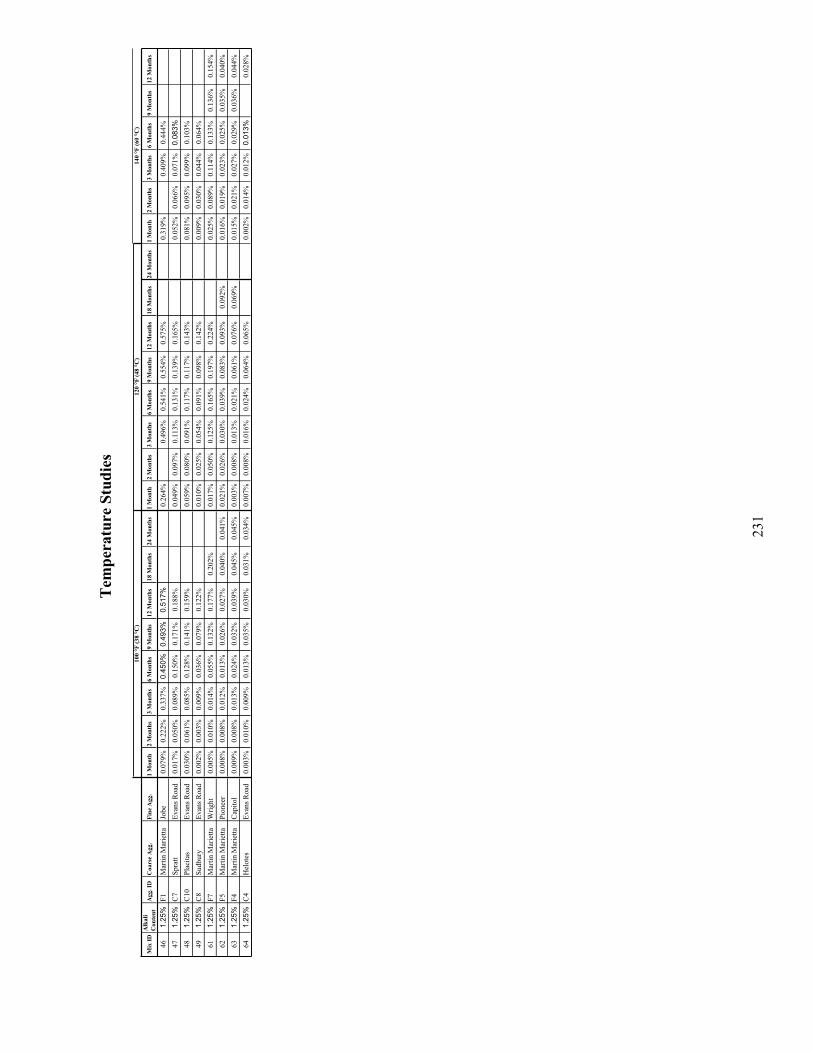
231
Tem
pera
ture
Stu
dies
Mix
IDA
lkal
i C
onte
ntA
gg. I
DC
oars
e A
gg.
Fine
Agg
.1
Mon
th2
Mon
ths
3 M
onth
s6
Mon
ths
9 M
onth
s12
Mon
ths
18 M
onth
s24
Mon
ths
1 M
onth
2 M
onth
s3
Mon
ths
6 M
onth
s9
Mon
ths
12 M
onth
s18
Mon
ths
24 M
onth
s1
Mon
th2
Mon
ths
3 M
onth
s6
Mon
ths
9 M
onth
s12
Mon
ths
461.
25%
F1M
artin
Mar
ietta
Jobe
0.07
9%0.
222%
0.33
7%0.
450%
0.49
3%0.
517%
0.26
4%0.
496%
0.54
1%0.
554%
0.57
5%0.
319%
0.40
9%0.
444%
471.
25%
C7
Spra
ttEv
ans R
oad
0.01
7%0.
050%
0.08
9%0.
150%
0.17
1%0.
188%
0.04
9%0.
097%
0.11
3%0.
131%
0.13
9%0.
165%
0.05
2%0.
066%
0.07
1%0.
083%
481.
25%
C10
Plac
itas
Evan
s Roa
d0.
030%
0.06
1%0.
085%
0.12
8%0.
141%
0.15
9%0.
059%
0.08
0%0.
091%
0.11
7%0.
117%
0.14
3%0.
081%
0.09
5%0.
099%
0.10
3%49
1.25
%C
8Su
dbur
yEv
ans R
oad
0.00
2%0.
003%
0.00
9%0.
036%
0.07
9%0.
122%
0.01
0%0.
025%
0.05
4%0.
091%
0.09
8%0.
142%
0.00
9%0.
030%
0.04
4%0.
064%
611.
25%
F7M
artin
Mar
ietta
Wrig
ht0.
005%
0.01
0%0.
014%
0.05
5%0.
132%
0.17
7%0.
202%
0.01
7%0.
050%
0.12
5%0.
165%
0.19
7%0.
224%
0.02
5%0.
089%
0.11
4%0.
133%
0.13
6%0.
154%
621.
25%
F5M
artin
Mar
ietta
Pion
eer
0.00
8%0.
008%
0.01
2%0.
013%
0.02
6%0.
027%
0.04
0%0.
041%
0.02
1%0.
026%
0.03
0%0.
039%
0.08
3%0.
093%
0.09
2%0.
016%
0.01
9%0.
023%
0.02
5%0.
035%
0.04
0%63
1.25
%F4
Mar
tin M
arie
ttaC
apito
l0.
009%
0.00
8%0.
013%
0.02
4%0.
032%
0.03
9%0.
045%
0.04
5%0.
003%
0.00
8%0.
013%
0.02
1%0.
061%
0.07
6%0.
069%
0.01
5%0.
021%
0.02
7%0.
029%
0.03
6%0.
044%
641.
25%
C4
Hel
otes
Evan
s Roa
d0.
003%
0.01
0%0.
009%
0.01
3%0.
035%
0.03
0%0.
031%
0.03
4%0.
007%
0.00
8%0.
016%
0.02
4%0.
064%
0.06
5%0.
002%
0.01
4%0.
012%
0.01
3%0.
028%
120
°F (4
8 °C
)14
0 °F
(60
°C)
100
°F (3
8 °C
)

233
Appendix C: Exposure Block Expansion Summary

234
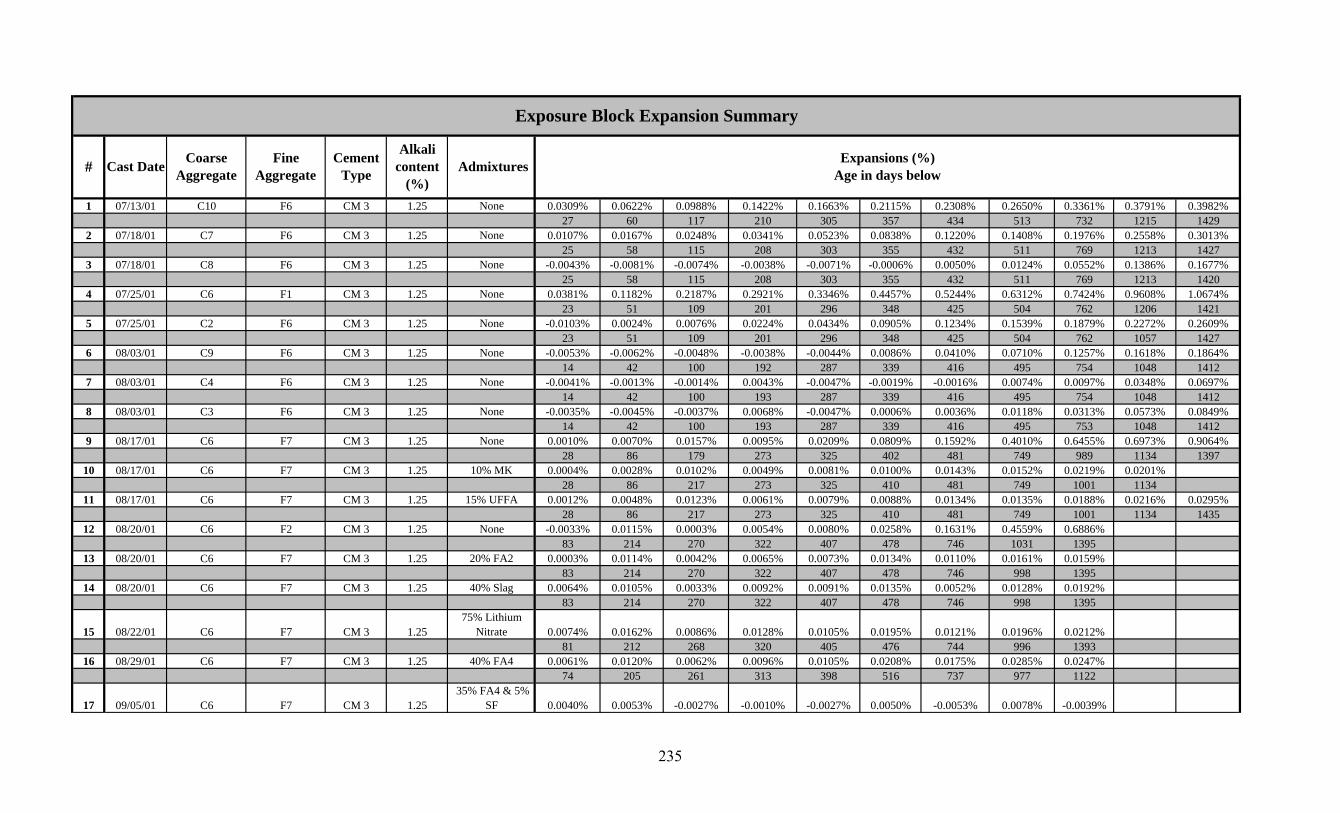
1 07/13/01 C10 F6 CM 3 1.25 None 0.0309% 0.0622% 0.0988% 0.1422% 0.1663% 0.2115% 0.2308% 0.2650% 0.3361% 0.3791% 0.3982%27 60 117 210 305 357 434 513 732 1215 1429
2 07/18/01 C7 F6 CM 3 1.25 None 0.0107% 0.0167% 0.0248% 0.0341% 0.0523% 0.0838% 0.1220% 0.1408% 0.1976% 0.2558% 0.3013%25 58 115 208 303 355 432 511 769 1213 1427
3 07/18/01 C8 F6 CM 3 1.25 None -0.0043% -0.0081% -0.0074% -0.0038% -0.0071% -0.0006% 0.0050% 0.0124% 0.0552% 0.1386% 0.1677%25 58 115 208 303 355 432 511 769 1213 1420
4 07/25/01 C6 F1 CM 3 1.25 None 0.0381% 0.1182% 0.2187% 0.2921% 0.3346% 0.4457% 0.5244% 0.6312% 0.7424% 0.9608% 1.0674%23 51 109 201 296 348 425 504 762 1206 1421
5 07/25/01 C2 F6 CM 3 1.25 None -0.0103% 0.0024% 0.0076% 0.0224% 0.0434% 0.0905% 0.1234% 0.1539% 0.1879% 0.2272% 0.2609%23 51 109 201 296 348 425 504 762 1057 1427
6 08/03/01 C9 F6 CM 3 1.25 None -0.0053% -0.0062% -0.0048% -0.0038% -0.0044% 0.0086% 0.0410% 0.0710% 0.1257% 0.1618% 0.1864%14 42 100 192 287 339 416 495 754 1048 1412
7 08/03/01 C4 F6 CM 3 1.25 None -0.0041% -0.0013% -0.0014% 0.0043% -0.0047% -0.0019% -0.0016% 0.0074% 0.0097% 0.0348% 0.0697%14 42 100 193 287 339 416 495 754 1048 1412
8 08/03/01 C3 F6 CM 3 1.25 None -0.0035% -0.0045% -0.0037% 0.0068% -0.0047% 0.0006% 0.0036% 0.0118% 0.0313% 0.0573% 0.0849%14 42 100 193 287 339 416 495 753 1048 1412
9 08/17/01 C6 F7 CM 3 1.25 None 0.0010% 0.0070% 0.0157% 0.0095% 0.0209% 0.0809% 0.1592% 0.4010% 0.6455% 0.6973% 0.9064%28 86 179 273 325 402 481 749 989 1134 1397
10 08/17/01 C6 F7 CM 3 1.25 10% MK 0.0004% 0.0028% 0.0102% 0.0049% 0.0081% 0.0100% 0.0143% 0.0152% 0.0219% 0.0201%28 86 217 273 325 410 481 749 1001 1134
11 08/17/01 C6 F7 CM 3 1.25 15% UFFA 0.0012% 0.0048% 0.0123% 0.0061% 0.0079% 0.0088% 0.0134% 0.0135% 0.0188% 0.0216% 0.0295%28 86 217 273 325 410 481 749 1001 1134 1435
12 08/20/01 C6 F2 CM 3 1.25 None -0.0033% 0.0115% 0.0003% 0.0054% 0.0080% 0.0258% 0.1631% 0.4559% 0.6886%83 214 270 322 407 478 746 1031 1395
13 08/20/01 C6 F7 CM 3 1.25 20% FA2 0.0003% 0.0114% 0.0042% 0.0065% 0.0073% 0.0134% 0.0110% 0.0161% 0.0159%83 214 270 322 407 478 746 998 1395
14 08/20/01 C6 F7 CM 3 1.25 40% Slag 0.0064% 0.0105% 0.0033% 0.0092% 0.0091% 0.0135% 0.0052% 0.0128% 0.0192%83 214 270 322 407 478 746 998 1395
15 08/22/01 C6 F7 CM 3 1.2575% Lithium
Nitrate 0.0074% 0.0162% 0.0086% 0.0128% 0.0105% 0.0195% 0.0121% 0.0196% 0.0212%81 212 268 320 405 476 744 996 1393
16 08/29/01 C6 F7 CM 3 1.25 40% FA4 0.0061% 0.0120% 0.0062% 0.0096% 0.0105% 0.0208% 0.0175% 0.0285% 0.0247%74 205 261 313 398 516 737 977 1122
17 09/05/01 C6 F7 CM 3 1.25 35% FA4 & 5%
SF 0.0040% 0.0053% -0.0027% -0.0010% -0.0027% 0.0050% -0.0053% 0.0078% -0.0039%
Exposure Block Expansion Summary
# Cast Date Coarse Aggregate
Fine Aggregate
Cement Type Admixtures Expansions (%)
Age in days below
Alkali content
(%)
235
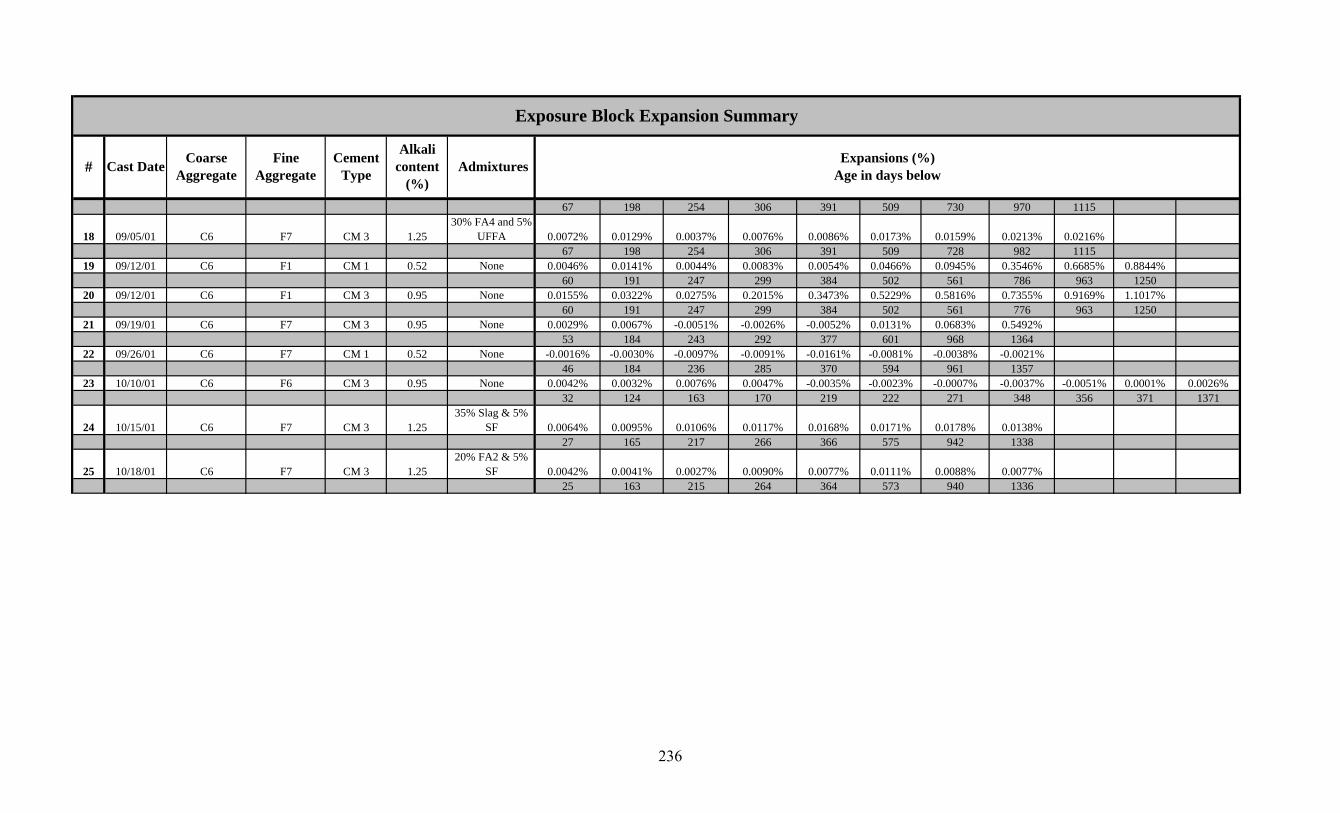
Exposure Block Expansion Summary
# Cast Date Coarse Aggregate
Fine Aggregate
Cement Type Admixtures Expansions (%)
Age in days below
Alkali content
(%)67 198 254 306 391 509 730 970 1115
18 09/05/01 C6 F7 CM 3 1.2530% FA4 and 5%
UFFA 0.0072% 0.0129% 0.0037% 0.0076% 0.0086% 0.0173% 0.0159% 0.0213% 0.0216%67 198 254 306 391 509 728 982 1115
19 09/12/01 C6 F1 CM 1 0.52 None 0.0046% 0.0141% 0.0044% 0.0083% 0.0054% 0.0466% 0.0945% 0.3546% 0.6685% 0.8844%60 191 247 299 384 502 561 786 963 1250
20 09/12/01 C6 F1 CM 3 0.95 None 0.0155% 0.0322% 0.0275% 0.2015% 0.3473% 0.5229% 0.5816% 0.7355% 0.9169% 1.1017%60 191 247 299 384 502 561 776 963 1250
21 09/19/01 C6 F7 CM 3 0.95 None 0.0029% 0.0067% -0.0051% -0.0026% -0.0052% 0.0131% 0.0683% 0.5492%53 184 243 292 377 601 968 1364
22 09/26/01 C6 F7 CM 1 0.52 None -0.0016% -0.0030% -0.0097% -0.0091% -0.0161% -0.0081% -0.0038% -0.0021%46 184 236 285 370 594 961 1357
23 10/10/01 C6 F6 CM 3 0.95 None 0.0042% 0.0032% 0.0076% 0.0047% -0.0035% -0.0023% -0.0007% -0.0037% -0.0051% 0.0001% 0.0026%32 124 163 170 219 222 271 348 356 371 1371
24 10/15/01 C6 F7 CM 3 1.2535% Slag & 5%
SF 0.0064% 0.0095% 0.0106% 0.0117% 0.0168% 0.0171% 0.0178% 0.0138%27 165 217 266 366 575 942 1338
25 10/18/01 C6 F7 CM 3 1.2520% FA2 & 5%
SF 0.0042% 0.0041% 0.0027% 0.0090% 0.0077% 0.0111% 0.0088% 0.0077%25 163 215 264 364 573 940 1336
236
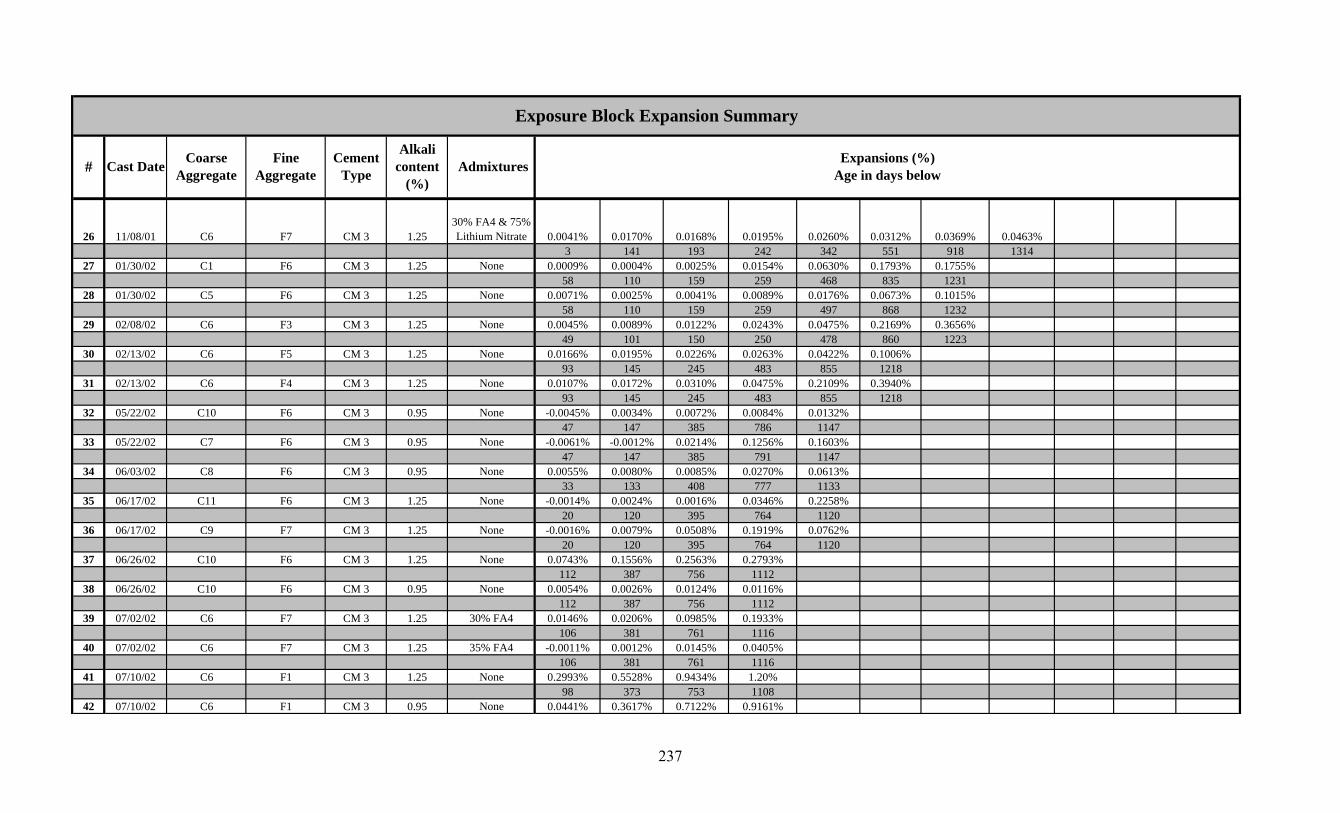
Exposure Block Expansion Summary
# Cast Date Coarse Aggregate
Fine Aggregate
Cement Type Admixtures Expansions (%)
Age in days below
Alkali content
(%)
26 11/08/01 C6 F7 CM 3 1.2530% FA4 & 75% Lithium Nitrate 0.0041% 0.0170% 0.0168% 0.0195% 0.0260% 0.0312% 0.0369% 0.0463%
3 141 193 242 342 551 918 131427 01/30/02 C1 F6 CM 3 1.25 None 0.0009% 0.0004% 0.0025% 0.0154% 0.0630% 0.1793% 0.1755%
58 110 159 259 468 835 123128 01/30/02 C5 F6 CM 3 1.25 None 0.0071% 0.0025% 0.0041% 0.0089% 0.0176% 0.0673% 0.1015%
58 110 159 259 497 868 123229 02/08/02 C6 F3 CM 3 1.25 None 0.0045% 0.0089% 0.0122% 0.0243% 0.0475% 0.2169% 0.3656%
49 101 150 250 478 860 122330 02/13/02 C6 F5 CM 3 1.25 None 0.0166% 0.0195% 0.0226% 0.0263% 0.0422% 0.1006%
93 145 245 483 855 121831 02/13/02 C6 F4 CM 3 1.25 None 0.0107% 0.0172% 0.0310% 0.0475% 0.2109% 0.3940%
93 145 245 483 855 121832 05/22/02 C10 F6 CM 3 0.95 None -0.0045% 0.0034% 0.0072% 0.0084% 0.0132%
47 147 385 786 114733 05/22/02 C7 F6 CM 3 0.95 None -0.0061% -0.0012% 0.0214% 0.1256% 0.1603%
47 147 385 791 114734 06/03/02 C8 F6 CM 3 0.95 None 0.0055% 0.0080% 0.0085% 0.0270% 0.0613%
33 133 408 777 113335 06/17/02 C11 F6 CM 3 1.25 None -0.0014% 0.0024% 0.0016% 0.0346% 0.2258%
20 120 395 764 112036 06/17/02 C9 F7 CM 3 1.25 None -0.0016% 0.0079% 0.0508% 0.1919% 0.0762%
20 120 395 764 112037 06/26/02 C10 F6 CM 3 1.25 None 0.0743% 0.1556% 0.2563% 0.2793%
112 387 756 111238 06/26/02 C10 F6 CM 3 0.95 None 0.0054% 0.0026% 0.0124% 0.0116%
112 387 756 111239 07/02/02 C6 F7 CM 3 1.25 30% FA4 0.0146% 0.0206% 0.0985% 0.1933%
106 381 761 111640 07/02/02 C6 F7 CM 3 1.25 35% FA4 -0.0011% 0.0012% 0.0145% 0.0405%
106 381 761 111641 07/10/02 C6 F1 CM 3 1.25 None 0.2993% 0.5528% 0.9434% 1.20%
98 373 753 110842 07/10/02 C6 F1 CM 3 0.95 None 0.0441% 0.3617% 0.7122% 0.9161%
237
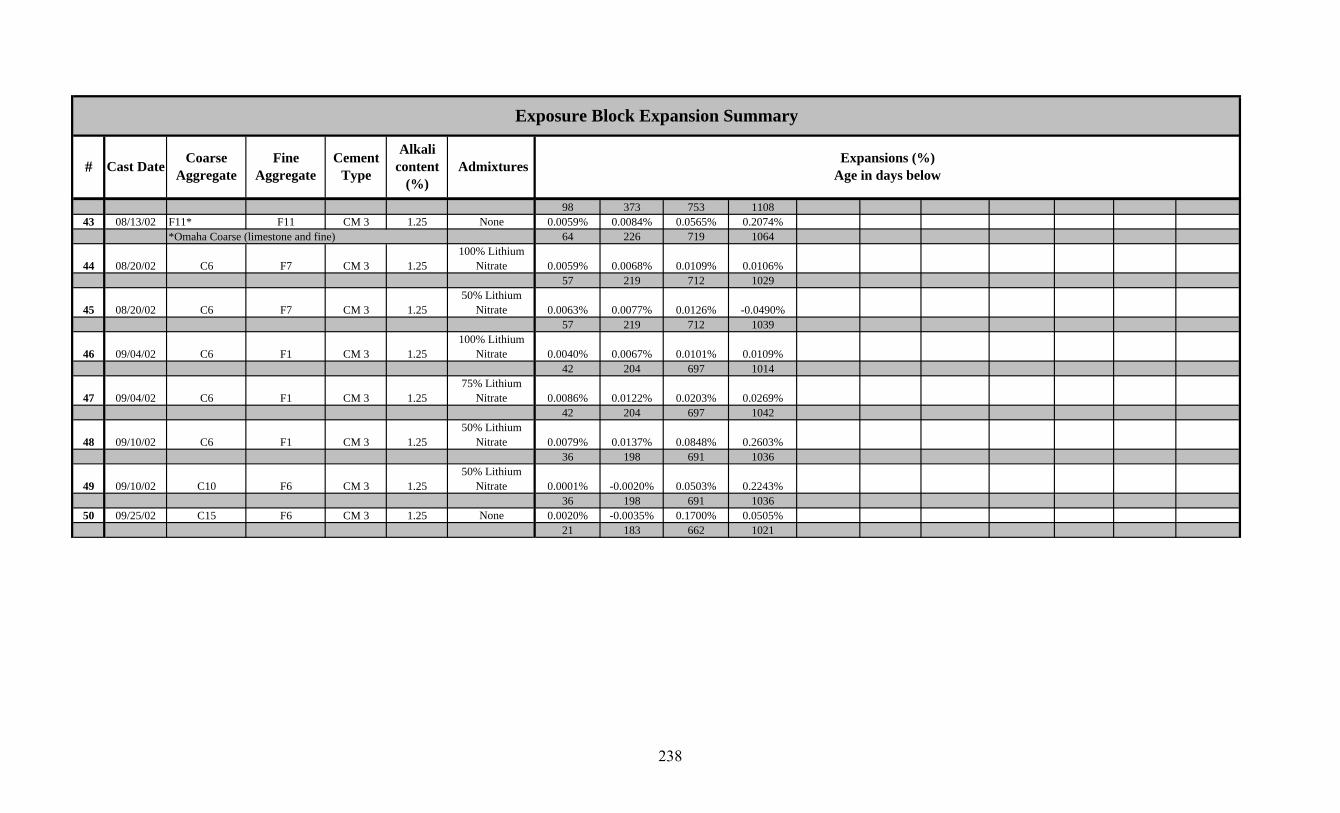
Exposure Block Expansion Summary
# Cast Date Coarse Aggregate
Fine Aggregate
Cement Type Admixtures Expansions (%)
Age in days below
Alkali content
(%)98 373 753 1108
43 08/13/02 F11* F11 CM 3 1.25 None 0.0059% 0.0084% 0.0565% 0.2074%64 226 719 1064
44 08/20/02 C6 F7 CM 3 1.25100% Lithium
Nitrate 0.0059% 0.0068% 0.0109% 0.0106%57 219 712 1029
45 08/20/02 C6 F7 CM 3 1.2550% Lithium
Nitrate 0.0063% 0.0077% 0.0126% -0.0490%57 219 712 1039
46 09/04/02 C6 F1 CM 3 1.25100% Lithium
Nitrate 0.0040% 0.0067% 0.0101% 0.0109%42 204 697 1014
47 09/04/02 C6 F1 CM 3 1.2575% Lithium
Nitrate 0.0086% 0.0122% 0.0203% 0.0269%42 204 697 1042
48 09/10/02 C6 F1 CM 3 1.2550% Lithium
Nitrate 0.0079% 0.0137% 0.0848% 0.2603%36 198 691 1036
49 09/10/02 C10 F6 CM 3 1.2550% Lithium
Nitrate 0.0001% -0.0020% 0.0503% 0.2243%36 198 691 1036
50 09/25/02 C15 F6 CM 3 1.25 None 0.0020% -0.0035% 0.1700% 0.0505%21 183 662 1021
*Omaha Coarse (limestone and fine)
238
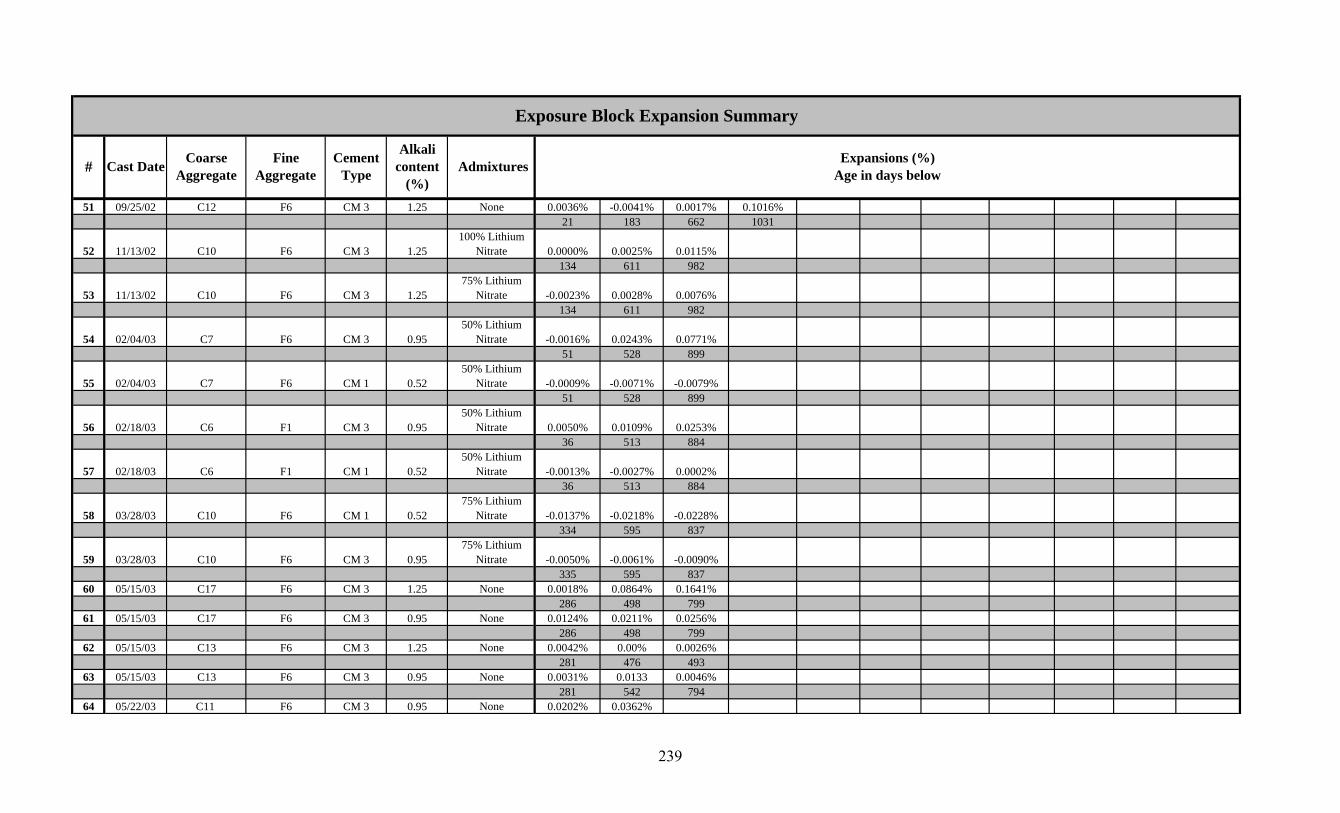
Exposure Block Expansion Summary
# Cast Date Coarse Aggregate
Fine Aggregate
Cement Type Admixtures Expansions (%)
Age in days below
Alkali content
(%)51 09/25/02 C12 F6 CM 3 1.25 None 0.0036% -0.0041% 0.0017% 0.1016%
21 183 662 1031
52 11/13/02 C10 F6 CM 3 1.25100% Lithium
Nitrate 0.0000% 0.0025% 0.0115%134 611 982
53 11/13/02 C10 F6 CM 3 1.2575% Lithium
Nitrate -0.0023% 0.0028% 0.0076%134 611 982
54 02/04/03 C7 F6 CM 3 0.9550% Lithium
Nitrate -0.0016% 0.0243% 0.0771%51 528 899
55 02/04/03 C7 F6 CM 1 0.5250% Lithium
Nitrate -0.0009% -0.0071% -0.0079%51 528 899
56 02/18/03 C6 F1 CM 3 0.9550% Lithium
Nitrate 0.0050% 0.0109% 0.0253%36 513 884
57 02/18/03 C6 F1 CM 1 0.5250% Lithium
Nitrate -0.0013% -0.0027% 0.0002%36 513 884
58 03/28/03 C10 F6 CM 1 0.5275% Lithium
Nitrate -0.0137% -0.0218% -0.0228%334 595 837
59 03/28/03 C10 F6 CM 3 0.9575% Lithium
Nitrate -0.0050% -0.0061% -0.0090%335 595 837
60 05/15/03 C17 F6 CM 3 1.25 None 0.0018% 0.0864% 0.1641%286 498 799
61 05/15/03 C17 F6 CM 3 0.95 None 0.0124% 0.0211% 0.0256%286 498 799
62 05/15/03 C13 F6 CM 3 1.25 None 0.0042% 0.00% 0.0026%281 476 493
63 05/15/03 C13 F6 CM 3 0.95 None 0.0031% 0.0133 0.0046%281 542 794
64 05/22/03 C11 F6 CM 3 0.95 None 0.0202% 0.0362%
239
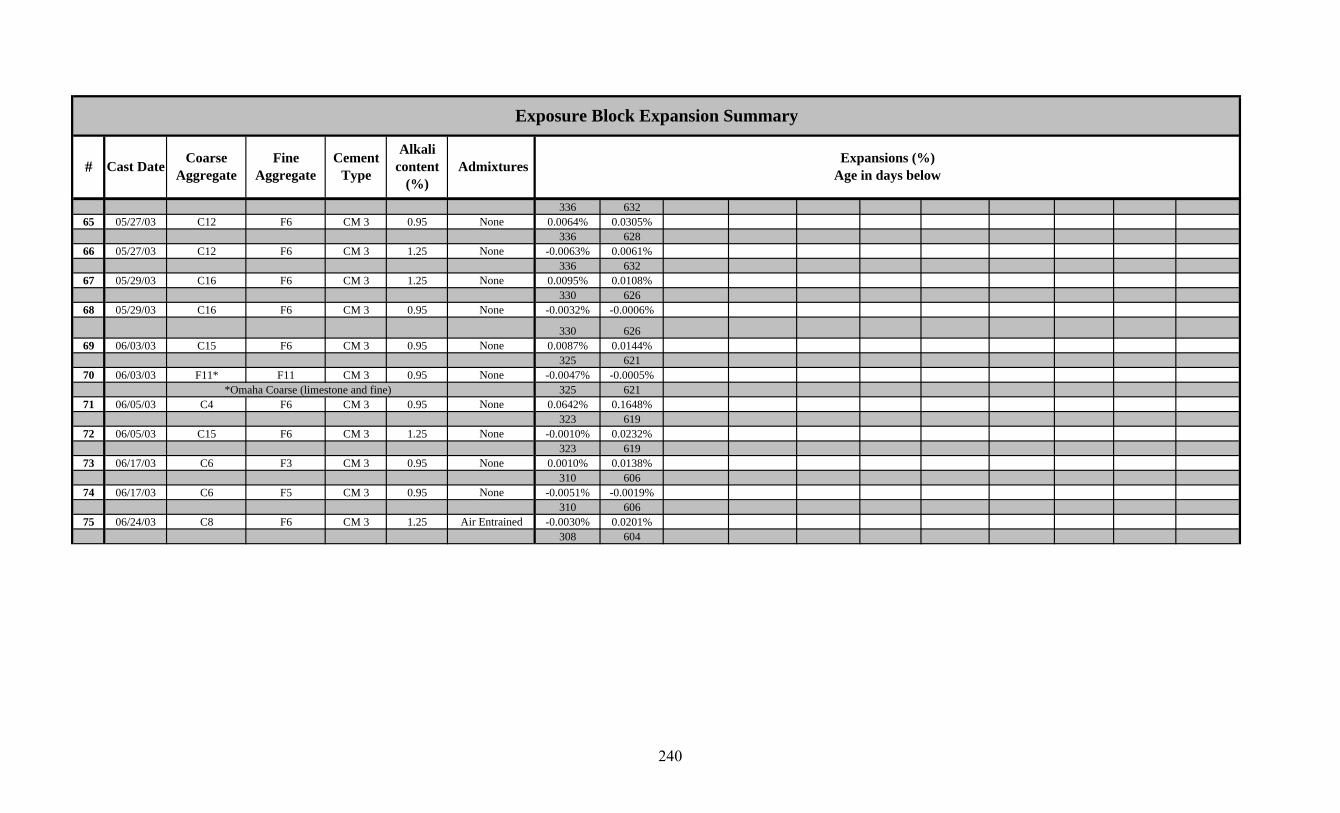
Exposure Block Expansion Summary
# Cast Date Coarse Aggregate
Fine Aggregate
Cement Type Admixtures Expansions (%)
Age in days below
Alkali content
(%)336 632
65 05/27/03 C12 F6 CM 3 0.95 None 0.0064% 0.0305%336 628
66 05/27/03 C12 F6 CM 3 1.25 None -0.0063% 0.0061%336 632
67 05/29/03 C16 F6 CM 3 1.25 None 0.0095% 0.0108%330 626
68 05/29/03 C16 F6 CM 3 0.95 None -0.0032% -0.0006%
330 62669 06/03/03 C15 F6 CM 3 0.95 None 0.0087% 0.0144%
325 62170 06/03/03 F11* F11 CM 3 0.95 None -0.0047% -0.0005%
325 62171 06/05/03 C4 F6 CM 3 0.95 None 0.0642% 0.1648%
323 61972 06/05/03 C15 F6 CM 3 1.25 None -0.0010% 0.0232%
323 61973 06/17/03 C6 F3 CM 3 0.95 None 0.0010% 0.0138%
310 60674 06/17/03 C6 F5 CM 3 0.95 None -0.0051% -0.0019%
310 60675 06/24/03 C8 F6 CM 3 1.25 Air Entrained -0.0030% 0.0201%
308 604
*Omaha Coarse (limestone and fine)
240
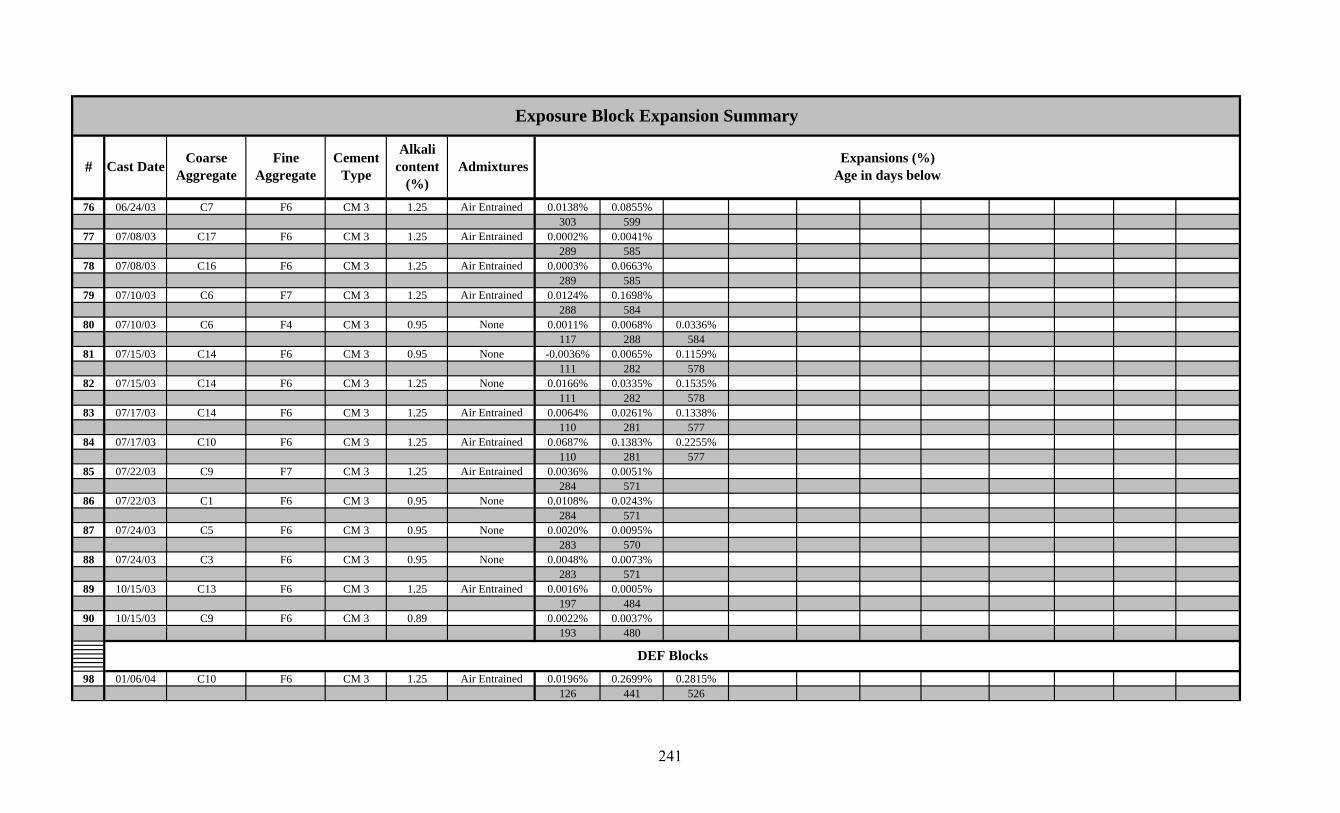
Exposure Block Expansion Summary
# Cast Date Coarse Aggregate
Fine Aggregate
Cement Type Admixtures Expansions (%)
Age in days below
Alkali content
(%)76 06/24/03 C7 F6 CM 3 1.25 Air Entrained 0.0138% 0.0855%
303 59977 07/08/03 C17 F6 CM 3 1.25 Air Entrained 0.0002% 0.0041%
289 58578 07/08/03 C16 F6 CM 3 1.25 Air Entrained 0.0003% 0.0663%
289 58579 07/10/03 C6 F7 CM 3 1.25 Air Entrained 0.0124% 0.1698%
288 58480 07/10/03 C6 F4 CM 3 0.95 None 0.0011% 0.0068% 0.0336%
117 288 58481 07/15/03 C14 F6 CM 3 0.95 None -0.0036% 0.0065% 0.1159%
111 282 57882 07/15/03 C14 F6 CM 3 1.25 None 0.0166% 0.0335% 0.1535%
111 282 57883 07/17/03 C14 F6 CM 3 1.25 Air Entrained 0.0064% 0.0261% 0.1338%
110 281 57784 07/17/03 C10 F6 CM 3 1.25 Air Entrained 0.0687% 0.1383% 0.2255%
110 281 57785 07/22/03 C9 F7 CM 3 1.25 Air Entrained 0.0036% 0.0051%
284 57186 07/22/03 C1 F6 CM 3 0.95 None 0.0108% 0.0243%
284 57187 07/24/03 C5 F6 CM 3 0.95 None 0.0020% 0.0095%
283 57088 07/24/03 C3 F6 CM 3 0.95 None 0.0048% 0.0073%
283 57189 10/15/03 C13 F6 CM 3 1.25 Air Entrained 0.0016% 0.0005%
197 48490 10/15/03 C9 F6 CM 3 0.89 0.0022% 0.0037%
193 480
98 01/06/04 C10 F6 CM 3 1.25 Air Entrained 0.0196% 0.2699% 0.2815%126 441 526
DEF Blocks
241
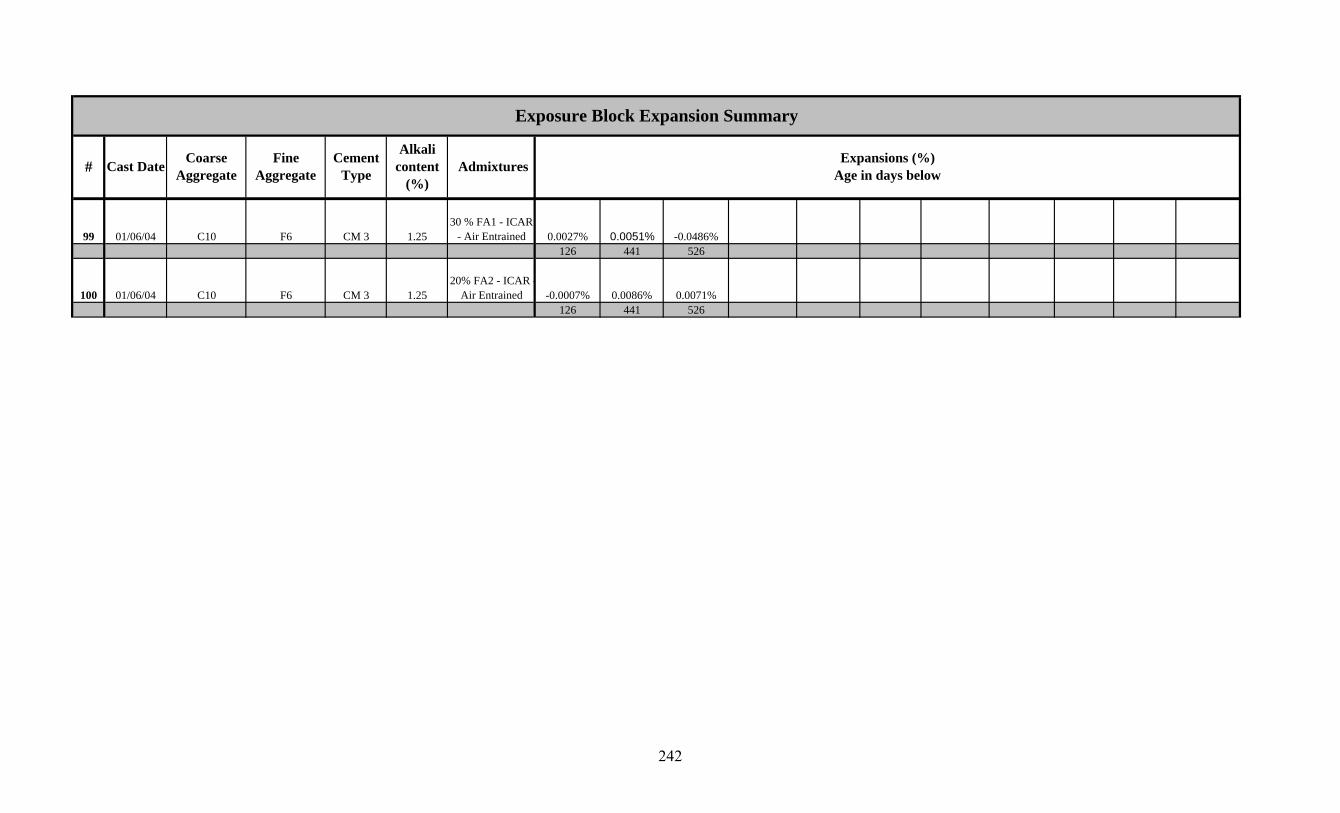
Exposure Block Expansion Summary
# Cast Date Coarse Aggregate
Fine Aggregate
Cement Type Admixtures Expansions (%)
Age in days below
Alkali content
(%)
99 01/06/04 C10 F6 CM 3 1.2530 % FA1 - ICAR
- Air Entrained 0.0027% 0.0051% -0.0486%126 441 526
100 01/06/04 C10 F6 CM 3 1.2520% FA2 - ICAR -
Air Entrained -0.0007% 0.0086% 0.0071%126 441 526
242
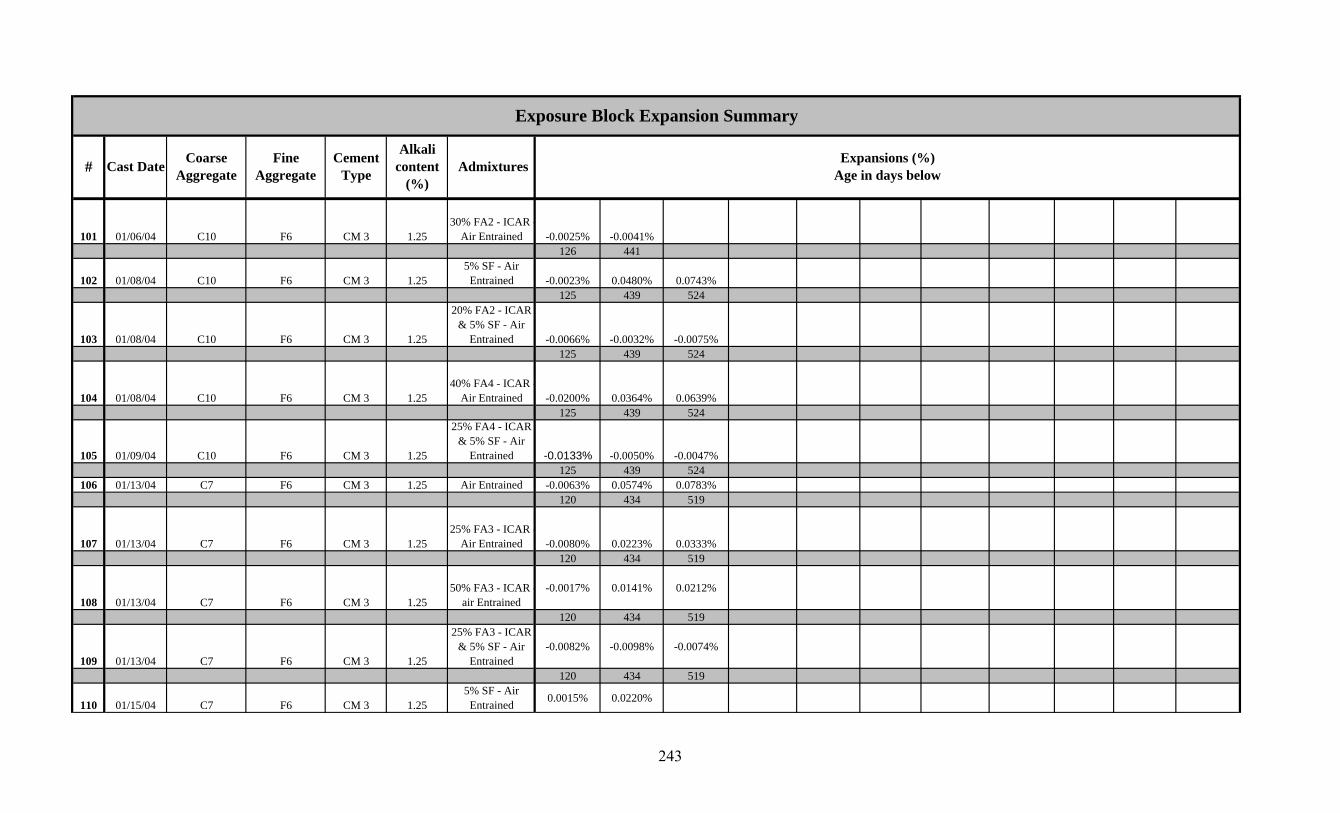
Exposure Block Expansion Summary
# Cast Date Coarse Aggregate
Fine Aggregate
Cement Type Admixtures Expansions (%)
Age in days below
Alkali content
(%)
101 01/06/04 C10 F6 CM 3 1.2530% FA2 - ICAR -
Air Entrained -0.0025% -0.0041%126 441
102 01/08/04 C10 F6 CM 3 1.255% SF - Air
Entrained -0.0023% 0.0480% 0.0743%125 439 524
103 01/08/04 C10 F6 CM 3 1.25
20% FA2 - ICAR & 5% SF - Air
Entrained -0.0066% -0.0032% -0.0075%125 439 524
104 01/08/04 C10 F6 CM 3 1.2540% FA4 - ICAR -
Air Entrained -0.0200% 0.0364% 0.0639%125 439 524
105 01/09/04 C10 F6 CM 3 1.25
25% FA4 - ICAR & 5% SF - Air
Entrained -0.0133% -0.0050% -0.0047%125 439 524
106 01/13/04 C7 F6 CM 3 1.25 Air Entrained -0.0063% 0.0574% 0.0783%120 434 519
107 01/13/04 C7 F6 CM 3 1.2525% FA3 - ICAR -
Air Entrained -0.0080% 0.0223% 0.0333%120 434 519
108 01/13/04 C7 F6 CM 3 1.2550% FA3 - ICAR -
air Entrained-0.0017% 0.0141% 0.0212%
120 434 519
109 01/13/04 C7 F6 CM 3 1.25
25% FA3 - ICAR & 5% SF - Air
Entrained-0.0082% -0.0098% -0.0074%
120 434 519
110 01/15/04 C7 F6 CM 3 1.255% SF - Air
Entrained 0.0015% 0.0220%
243
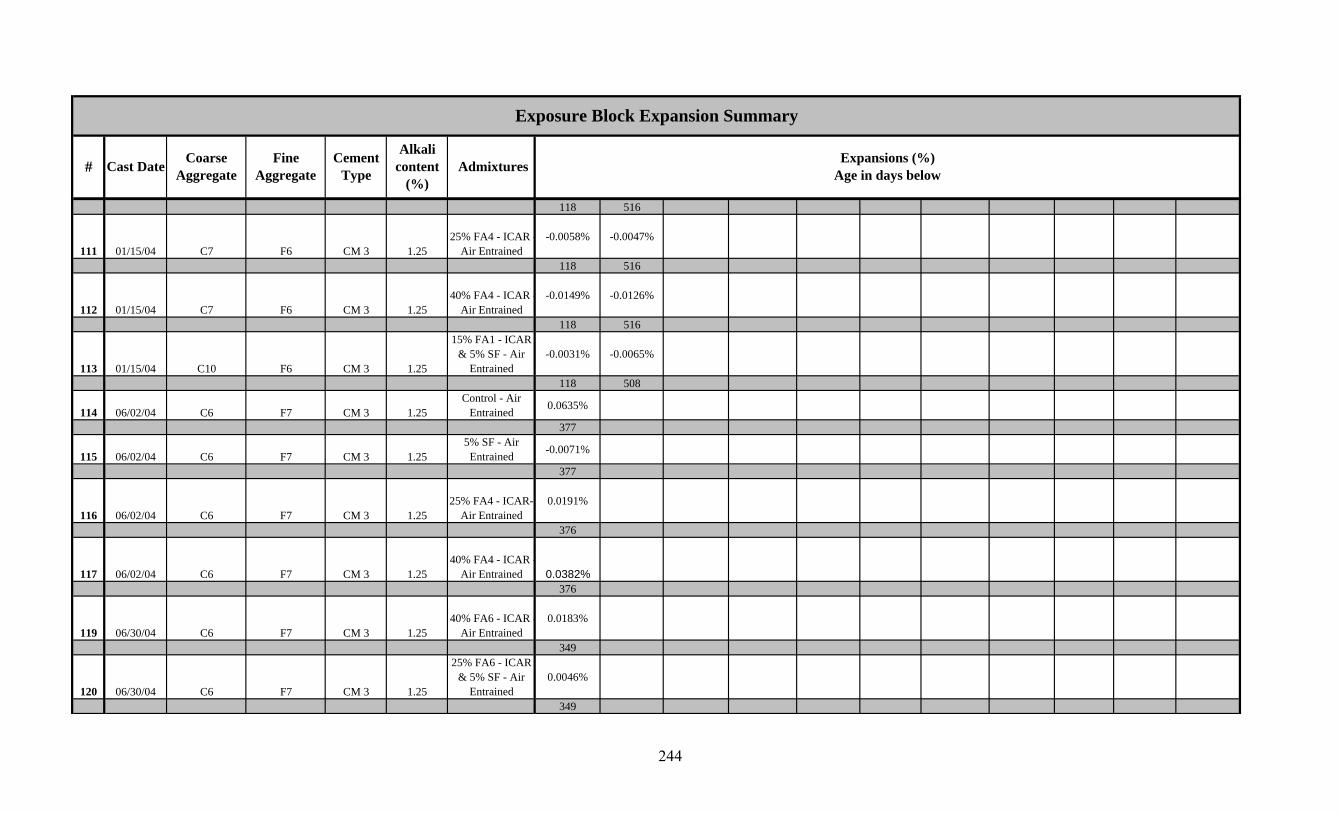
Exposure Block Expansion Summary
# Cast Date Coarse Aggregate
Fine Aggregate
Cement Type Admixtures Expansions (%)
Age in days below
Alkali content
(%)118 516
111 01/15/04 C7 F6 CM 3 1.2525% FA4 - ICAR -
Air Entrained-0.0058% -0.0047%
118 516
112 01/15/04 C7 F6 CM 3 1.2540% FA4 - ICAR -
Air Entrained-0.0149% -0.0126%
118 516
113 01/15/04 C10 F6 CM 3 1.25
15% FA1 - ICAR & 5% SF - Air
Entrained-0.0031% -0.0065%
118 508
114 06/02/04 C6 F7 CM 3 1.25Control - Air
Entrained 0.0635%
377
115 06/02/04 C6 F7 CM 3 1.255% SF - Air
Entrained -0.0071%
377
116 06/02/04 C6 F7 CM 3 1.2525% FA4 - ICAR-
Air Entrained0.0191%
376
117 06/02/04 C6 F7 CM 3 1.2540% FA4 - ICAR -
Air Entrained 0.0382%376
119 06/30/04 C6 F7 CM 3 1.2540% FA6 - ICAR -
Air Entrained0.0183%
349
120 06/30/04 C6 F7 CM 3 1.25
25% FA6 - ICAR & 5% SF - Air
Entrained0.0046%
349
244
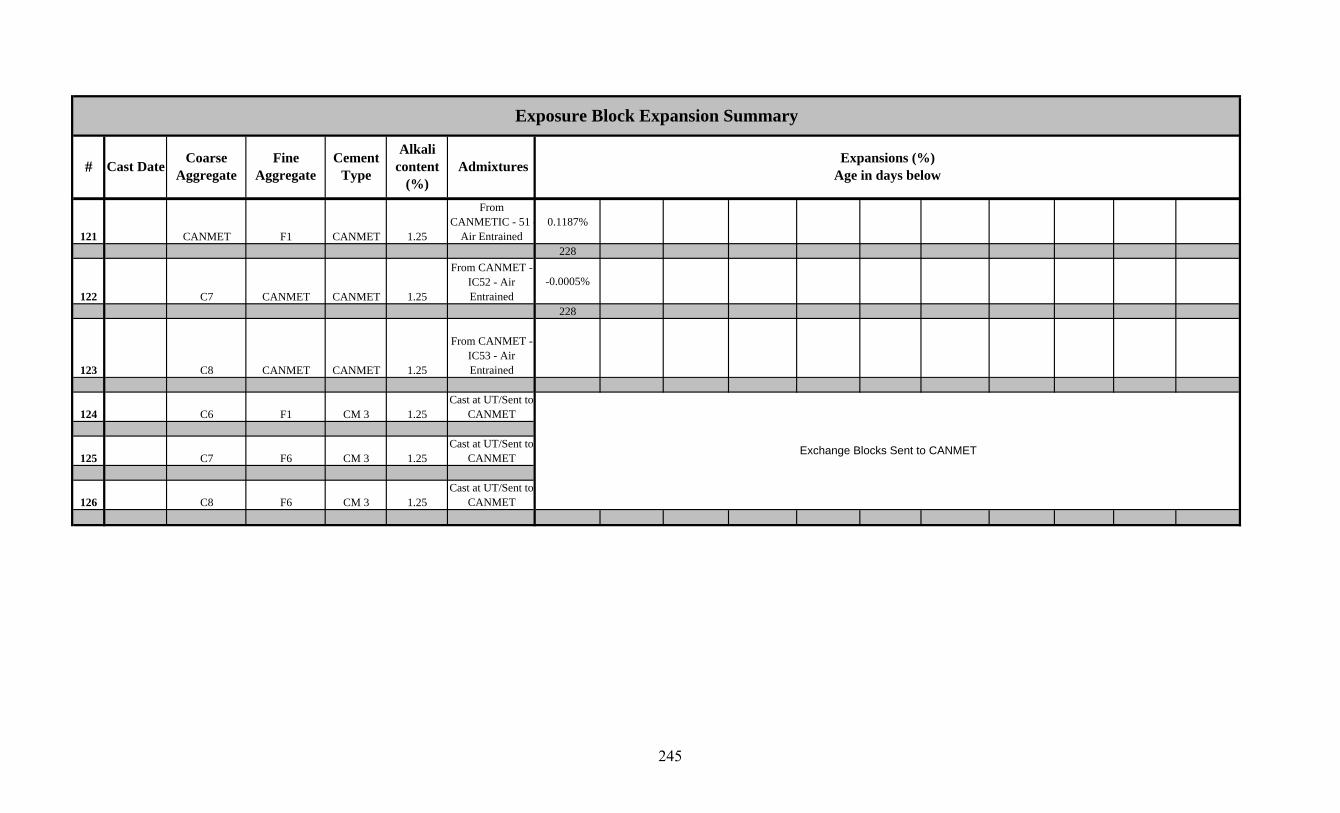
Exposure Block Expansion Summary
# Cast Date Coarse Aggregate
Fine Aggregate
Cement Type Admixtures Expansions (%)
Age in days below
Alkali content
(%)
121 CANMET F1 CANMET 1.25
From CANMETIC - 51 -
Air Entrained0.1187%
228
122 C7 CANMET CANMET 1.25
From CANMET - IC52 - Air Entrained
-0.0005%
228
123 C8 CANMET CANMET 1.25
From CANMET - IC53 - Air Entrained
124 C6 F1 CM 3 1.25Cast at UT/Sent to
CANMET
125 C7 F6 CM 3 1.25Cast at UT/Sent to
CANMET
126 C8 F6 CM 3 1.25Cast at UT/Sent to
CANMET
Exchange Blocks Sent to CANMET
245
Recommended