TECHNICAL NOTES for the Cardiac Surgery Report
January 2017
Pennsylvania Health Care Cost Containment Council Report Period: January 1, 2014 through March 31, 2016
225 Market Street, Suite 400, Harrisburg, PA 17101 Phone: (717) 232-6787
Fax: (717) 232-3821 www.phc4.org
Joe Martin, Executive Director

PHC4 Cardiac Surgery Report January 1, 2014 through March 31, 2016 Data Technical Notes
i
TABLE OF CONTENTS
Overview ............................................................................................................................................. 1
Data Collection and Verification ...................................................................................................... 2
Hospital and Cardiothoracic Surgeon Verification of Data ............................................................ 2
Study Population ............................................................................................................................... 4
Inclusion Criteria ........................................................................................................................... 4
Exclusion Criteria .......................................................................................................................... 4
Measures Reported ........................................................................................................................... 6
Number of Cases .......................................................................................................................... 6
Risk-Adjusted In-Hospital Mortality Rating.................................................................................... 6
Risk-Adjusted 30-Day Readmission Rating .................................................................................. 6
Case-Mix Adjusted Average Hospital Charge .............................................................................. 6
Calendar Year 2014 Average Medicare Fee-for-Service Payment .............................................. 7
Calendar Year 2014 Average Hospital Charge for Medicare Fee-for-Service Cases .................. 7
Risk-Adjustment Methodology ......................................................................................................... 8
Model Development ...................................................................................................................... 8
Calculating Statistical Ratings ..................................................................................................... 10
Determining Actual Values ................................................................................................... 10
Determining Expected Values .............................................................................................. 10
Determining Statistical Ratings ............................................................................................. 11
Assignment of Statistical Ratings ......................................................................................... 11
Case-Mix Adjustment Methodology............................................................................................... 13
Construction of Reference Database .......................................................................................... 13
Trim Methodology ....................................................................................................................... 14
Determining Actual Charges ....................................................................................................... 14
Determining Expected Charges .................................................................................................. 14
Determining Case-Mix Adjusted Charges ................................................................................... 14
Data Tables
Table 1. Statewide Utilization and Outcome Data ...................................................................... 15
Table 2. Exclusion Data.............................................................................................................. 17
Table 3. 30-Day Readmission Data ........................................................................................... 20
Table 4. In-Hospital Mortality Model ........................................................................................... 24
Table 5. 30-Day Readmission Model ......................................................................................... 25
Appendices
Appendix A. Clinically Complex Exclusion Definitions .............................................................. A-1
Appendix B. ICD-9-CM Definitions for Reasons for Readmission ............................................ A-3
Appendix C. Potential Code-Based Risk Factors ...................................................................... A-8
Appendix D. Example of Logistic Regression and Calculating Statistical Ratings .................... A-9
Appendix E. Example of Case-Mix Adjustment ....................................................................... A-10

PHC4 Cardiac Surgery Report January 1, 2014 through March 31, 2016 Data Technical Notes
1
OVERVIEW The Technical Notes serve as a technical supplement to the Pennsylvania Health Care Cost Containment Council’s (PHC4) report on coronary artery bypass graft (CABG) and valve surgery for discharges from January 1, 2014 through March 31, 2016. This document describes the methodology and development of the report and includes information on statewide results, cases excluded from the analysis and risk-adjustment models.
The analysis included adult patients age 30 or older who underwent a CABG procedure, a valve procedure or combined valve and CABG procedures in a Pennsylvania general acute care (GAC) hospital. Results are displayed for each of the following four procedure groups:
CABG without Valve
Total Valve (combines Valve without CABG and Valve with CABG procedure groups)
o Valve without CABG
o Valve with CABG
Risk-adjusted measures for hospitals and surgeons with at least 30 cases are reported for:
In-hospital mortality (January 1, 2014 through March 31, 2016 data)
30-day readmission with a principal diagnosis that indicated a heart-related condition, an infection or a complication. (To accommodate a transition in hospital coding requirements (from ICD-9-CM to ICD-10-CM) that became effective October 1, 2015, the readmission analysis was based on discharges from January 1, 2014 through August 31, 2015. September 2015 was used to identify 30-day readmissions for patients discharged in August 2015.)
Average hospital charge (case-mix adjusted) is reported for hospitals with at least 11 cases in a particular procedure group (January 1, 2014 through March 31, 2016 data).
Calendar year 2014 average Medicare payment is reported for hospitals with at least 11 cases in a particular procedure group. If the number of cases included in the payment analysis for either the Valve without CABG or the Valve with CABG procedure group is less than 11, payment data is only reported for the Total Valve procedure group. Calendar year 2014 is reported as this is the most recent Medicare payment data available.
Calendar year 2014 average hospital charge (case-mix adjusted) is reported for the cases in the 2014 average Medicare payment measure. Average charge for procedure groups with fewer than 11 cases is not reported.
The rigorous methodology described in this document was developed to account for the differences among individual patients that had the potential to influence the outcome of CABG and/or valve surgery.
Statewide utilization and outcome data are displayed in Data Table 1.
PHC4 Cardiac Surgery Report January 1, 2014 through March 31, 2016 Data Technical Notes
2
DATA COLLECTION AND VERIFICATION The data for the Cardiac Surgery Report, obtained from the inpatient UB-04 (Uniform Billing) form, was submitted electronically to PHC4 by Pennsylvania GAC hospitals that performed CABG and/or valve surgery primarily on adults. Federal hospitals were not included. The data included demographic information, hospital charges, and International Classification of Diseases, 9th Revision, Clinical Modification (ICD-9-CM) or International Classification of Diseases, 10th Revision, Clinical Modification (ICD-10-CM) and Procedure Coding System (ICD-10-PCS) diagnosis and procedure codes. Hospitals also submitted laboratory test results and supplemental clinical data such as ejection fraction and percent blockage in a coronary artery. Laboratory test results were submitted by hospitals to the Council for a select group of acute care inpatient records, including those used in the cardiac surgery analysis. Hospitals were required to submit the highest and/or lowest result(s) for a maximum of 29 laboratory tests as collected from patients during the initial period of their hospitalization. The requirements for submitting this data are specified elsewhere (refer to PHC4’s Laboratory Data Reporting Manual, accessible at www.phc4.org). In brief, for patients admitted prior to 6:00 p.m., only laboratory results collected on Day 1 of the admission were to be submitted. For patients admitted after 6:00 p.m., results were to be submitted for tests collected on the day of admission (Day 1) through the next calendar day (Day 2). Only results of laboratory tests drawn prior to the start date and time of anesthesia for the first CABG and/or valve surgery (and within the laboratory test collection timeframe) were used in the cardiac surgery analysis. Supplemental clinical data was submitted by hospitals to the Council for inpatient discharges of adult patients in which a CABG and/or valve surgery was performed. Hospitals were required to submit the following clinical data elements related to the first CABG and/or valve surgery of the admission: anesthesia start date and start time, American Society of Anesthesiologists (ASA) class, the ASA emergency indicator, ejection fraction and percent stenosis in the coronary arteries and their branches. The requirements for submitting this data are specified elsewhere (refer to PHC4’s Cardiac Surgery Supplemental Clinical Data Reporting Manual, accessible at www.phc4.org). Hospitals submitted data to the Council on a quarterly basis (within 90 days from the last day of each quarter). Upon receipt of the data, verification was performed to assure data were submitted in a readable format. Extensive quality assurance checks were completed and laboratory data and supplemental clinical data submissions were matched to inpatient records. Error reports for UB-04 data were then generated and returned to each hospital with an opportunity to correct any problems. Similarly, laboratory test results were evaluated each quarter and summary reports indicating data anomalies were sent to each hospital, again with an opportunity to make corrections.
Hospital and Cardiothoracic Surgeon Verification of Data Hospitals were asked to confirm the accuracy of discharge records, provide additional ICD-9-CM or ICD-10 diagnosis and procedure codes as appropriate and confirm that cases had the correct surgeon assignment. Surgeons were asked to perform a patient level review of the submitted records and then attest to the accuracy of the data and the surgeon assignment. Hospitals and/or surgeons had the opportunity to request special exclusions for cases in which the patient’s outcome was most directly associated with conditions unrelated to the CABG/valve surgical episode or the care received during that hospitalization that were not accounted for through risk adjustment. The medical records were reviewed to determine whether special requests for exclusion would be granted. In addition, because of their importance as risk factors, hospitals and surgeons had the opportunity to submit medical records for cases in which cardiogenic shock

PHC4 Cardiac Surgery Report January 1, 2014 through March 31, 2016 Data Technical Notes
3
and/or acute renal failure were present at the time of or immediately prior to the first CABG and/or valve surgery. These records were reviewed to verify that the criteria for preoperative cardiogenic shock and/or preoperative acute renal failure were met. The requirements for submitting cases for medical record review are specified elsewhere (refer to PHC4’s Guide for Review and Attestation of Cardiac Surgery Data, accessible at www.phc4.org). Hospitals were given an opportunity to verify the average Medicare payment reported for their facilities prior to the public release of the information.

PHC4 Cardiac Surgery Report January 1, 2014 through March 31, 2016 Data Technical Notes
4
STUDY POPULATION
Inclusion Criteria The study population included records for inpatients discharged from Pennsylvania GAC hospitals between January 1, 2014 and March 31, 2016 who underwent CABG and/or valve surgery as identified by the presence of an applicable ICD-9-CM or ICD-10-PCS procedure code(s) in either the principal or secondary procedure code positions of the discharge record. The codes that definite the population are available here: http://www.phc4.org/reports/cabg/16/data/CardiacSurgeryReport2014-2016StudyPopulationDefinition.xlsx. The population included subgroups of patients referred to as procedure groups. If a patient underwent multiple CABG/valve surgeries during the same admission, assignment to one of the first three procedure groups was based on the first CABG and/or valve surgery of the admission as shown below. Results are reported for each of these three procedure groups and for a fourth procedure group, which combined results for Valve without CABG and Valve with CABG.
1. CABG without Valve: patients who underwent at least one CABG procedure and no valve procedures on the same day.
2. Valve without CABG: patients who underwent at least one valve procedure and no CABG
procedures on the same day.
3. Valve with CABG: patients who underwent at least one valve procedure and one CABG procedure on the same day.
4. Total Valve: combined results for Valve without CABG and Valve with CABG.
Exclusion Criteria Cases meeting certain criteria were excluded from the outcome analyses. Standard exclusions were applied to the in-hospital mortality analysis and consisted of the following:
Patients less than 30 years of age
Patients who left against medical advice
Clinically complex cases1
Standard exclusions and exclusions particular to the measure of interest were applied to 30-day readmission and average hospital charge analyses. Additional exclusions for 30-day readmission analysis included:
Patients who died during the hospitalization in which the surgery was performed.
Cases with invalid data (social security number, date of birth or sex), which could not be linked to subsequent hospitalizations.
Out-of-state residents, because these patients could undergo a CABG and/or valve surgery in a Pennsylvania hospital, return to their state of residence and be readmitted to
1 Clinically complex cases included cases with one of the ICD-9-CM or ICD-10-CM/PCS codes in the following file
http://www.phc4.org/reports/cabg/16/data/CardiacSurgeryReport2014-2016ClinicallyComplexExclusions.xlsx. Additional exclusions included cases not in the study MS-DRGs (See Appendix A: MS-DRGs included in the study) and cases granted special request for exclusion.

PHC4 Cardiac Surgery Report January 1, 2014 through March 31, 2016 Data Technical Notes
5
a hospital in their home state. As such, readmission data would not be available for these patients.
Patients who were discharged in September 2015 were excluded. September 2015 was used to identify 30-day readmissions for patients discharged in August 2015 due to transition to ICD-10-CM.
Additional exclusions for average hospital charge included:
Patients with invalid or missing charges, including cases with charges that were less than $10,000.
Cases in tracheostomy Diagnostic Related Group (MS-DRG) 003 and Major Diagnostic Category (MDC) 5.
Cases in low volume MS-DRGs, including MS-DRG groups when a particular combination of timeframe/procedure group/PA region/MS-DRG group had fewer than 10 cases.
Charge outliers, which were determined using the “+/- 3.0 interquartile range” method (after accounting for differences in charges by timeframe, procedure group, PA region and MS-DRG group).
Data Table 2 displays exclusion data for each of these outcome measures.
PHC4 Cardiac Surgery Report January 1, 2014 through March 31, 2016 Data Technical Notes
6
To aid the reader in understanding the rating, the report displays Actual Percent and Expected Range along with the rating. Actual Percent is the percent (rate) of patients who died (In-Hospital Mortality) or who were readmitted (30-Day Readmission). Expected Range is the range (upper and lower limits) of the percent of patients one could reasonably expect to die (In-Hospital Mortality) or be readmitted (30-Day Readmission) after accounting for patient risk. See “Calculating Statistical Ratings” for detail of the method used to determine the rating.
MEASURES REPORTED
Number of Cases The number of cases (after standard exclusions were removed) is reported for hospitals and surgeons for each procedure group.
Risk-Adjusted In-Hospital Mortality Rating In-hospital mortality was identified in the patient discharge record as a discharge status of “20.” The rating identifies whether the hospital’s or surgeon’s observed mortality rate was significantly higher than, significantly lower than or not significantly different than expected based on patient risk factors. This measure is reported for each hospital and surgeon with 30 or more cases in a particular procedure group.
Risk-Adjusted 30-Day Readmission Rating A hospital readmission was defined as a rehospitalization to a Pennsylvania GAC hospital within 1 to 30 days of discharge from the hospitalization in which the CABG/valve surgery was performed. A readmission was counted only if the patient was readmitted with a principal diagnosis that indicated a heart-related condition, an infection or a complication. (Data Table 3 displays the number of readmissions for each category. Appendix B lists the diagnosis categories and ICD-9-CM codes included in the readmission analysis.) A hospitalization that resulted in more than one readmission within 30 days was counted only once even though it resulted in multiple readmissions. If, over the study period, a patient had multiple discharges for CABG/valve surgery, each discharge was independently investigated to determine whether it had a readmission within 30 days of that discharge. To accommodate a transition in hospital coding requirements (from ICD-9-CM to ICD-10-CM) that became effective October 1, 2015, the readmission analysis was based on discharges from January 1, 2014 through August 31, 2015. September 2015 was used to identify 30-day readmissions for patients discharged in August 2015. The rating identifies whether the hospital’s or surgeon’s observed readmission rate was significantly higher than, significantly lower than or not significantly different than expected based on patient risk factors. This measure is reported for each hospital and surgeon with 30 or more cases in a particular procedure group.
Case-Mix Adjusted Average Hospital Charge
The amount a hospital bills for a patient’s care is known as the charge. The charge includes the facility fee for the entire hospitalization during which the CABG/valve surgery was performed (not just the treatment associated with surgery). It does not include professional fees (e.g., physician fees) or other additional post-discharge costs, such as rehabilitation treatment, long-term care and/or home health care. The average charges reported were trimmed and case-mix adjusted. Average charges are reported for each hospital with 11 or more cases in a particular procedure group.

PHC4 Cardiac Surgery Report January 1, 2014 through March 31, 2016 Data Technical Notes
7
Calendar Year 2014 Average Medicare Fee-for-Service Payment The average Medicare payment is for Medicare fee-for-service (FFS) cases only (Pennsylvania residents) and is for calendar year 2014, as this was the most recent Medicare payment data available. The Medicare payment data for 2014 was provided to PHC4 by the Centers for Medicare and Medicaid Services (CMS) and then matched by PHC4 to the 2014 cardiac surgery cases which 1) met the study population criteria (after standard exclusions) and 2) Medicare FFS was the primary payer per the UB-04 data reported by hospitals to PHC4. The average Medicare payment was trimmed for outliers as appropriate. The average payment was calculated using the dollar amount that CMS provided for the Medicare Part A hospital insurance fund payment. Patient liabilities (e.g., coinsurance and deductible dollar amounts) were not included. Also not included were payments from Medicare Advantage plans (Medicare HMOs). The average payment was calculated by summing the Medicare FFS payment amounts for the cases in a particular procedure group and dividing the sum by the number of cases in that procedure group. Average Medicare payment (along with the number of cases included in the average payment) is reported for hospitals only. To meet current CMS privacy guidelines, average payments (and the number of cases included in the average payment) are only displayed for procedure groups with 11 or more cases. If the number of cases included in the payment analysis for either the Valve without CABG or the Valve with CABG procedure group is less than 11, the number of cases and average payment for both of these procedure groups is not reported. Hospitals were given an opportunity to verify the average Medicare payment reported for their facilities prior to the public release of the information.
Calendar Year 2014 Average Hospital Charge for Medicare Fee-for-Service Cases Case-mix adjusted average charge is reported for the Medicare cases included in the 2014 average Medicare payment. While the same cases included in the average Medicare payment were included in the charge analysis, the final case-mix adjusted average charge may include fewer cases as a result of exclusions specific to the charge analysis. Average charges are not reported when payment information is not reported for a particular procedure group or when there are fewer than 11 cases in the average charge analysis for a particular procedure group.

PHC4 Cardiac Surgery Report January 1, 2014 through March 31, 2016 Data Technical Notes
8
RISK-ADJUSTMENT METHODOLOGY In order to report fair comparisons among hospitals and surgeons, regression techniques were used to construct “risk models” for predicting the risk of mortality and readmission. Each model was a mathematical formula used to ultimately predict a patient’s probability of death or readmission based on relevant risk factors. Cases with these risk factors were given more “credit” in the calculation, leading to a higher predicted probability of mortality or readmission. A hospital’s or surgeon’s predicted rate was the average predicted probability across all its discharges in a particular procedure group. The ratings indicate whether the hospital’s or the surgeon’s mortality or readmission rates were within the expected range or higher or lower than the expected range, taking into account the risk factors that were included in the risk-adjustment models.
Model Development For modeling in-hospital mortality, the reference database included CABG/valve discharges from January 1, 2014 through March 31, 2016 (after exclusions). For 30-day readmission, the reference database included CABG/valve discharges from January 1, 2014 through August 31, 2015 (after exclusions). September 2015 was used to identify 30-day readmissions for patients discharged in August 2015 due to transition to ICD-10-CM. Identifying potential risk factors. The first step in building the models was to identify potential risk factors, that is, factors that potentially contributed to mortality and readmission. These factors were identified through their importance in past models, review of research literature and consideration of high-risk populations. Types of risk factors included assigned procedure group (i.e., CABG without Valve, Valve without CABG and Valve with CABG), patient demographics, socioeconomic factors, clinically derived data (supplemental clinical data, results of medical record reviews for preoperative cardiogenic shock and preoperative acute renal failure, and laboratory test results), and diagnoses and procedures identified by ICD-9-CM or ICD-10-CM/PCS codes (see Appendix C for code definitions). Using the reference database, potential risk factors were subject to univariate analysis to determine which, because of their potential to predict the event of interest, should be tested for inclusion in the model. Variables were constructed and analyzed as linear (continuous), categorical and binary as appropriate. For some factors multiple forms of variable construction were analyzed to determine which approach best fit the data (provided the highest model likelihood). For example,
Patient age was tested as a linear, linear spline with up to two knots or age square factor. The linear and linear spline with one knot approach yielded the best results for both the mortality model and the readmission model for this report.
Variables representing the percent blockage in a coronary artery were analyzed in all formats—linear, categorical and binary. Performance of the various variable constructions was compared and the form of the variable with the highest likelihood of predicting the event was selected for testing in the model.
When constructing categorical variables, data was partitioned into a maximum of five categories as appropriate:
For variables with continuous data (e.g., laboratory test results) one category represented “typical” results with additional categories representative of abnormal results generally associated with increased risk. (In the final model, all records in a specified abnormal category would receive the same amount of credit, regardless of the value within the category.) Records with missing values were combined with records in the typical category.
PHC4 Cardiac Surgery Report January 1, 2014 through March 31, 2016 Data Technical Notes
9
For ICD-9-CM or ICD-10-CM/PCS code-based categorical variables, one category represented the absence of the risk factor and additional categories represented the presence of diagnosis/procedure codes indicating increased risk for that particular condition (e.g., no diabetes, diabetes with complications and diabetes without complications).
Categorical and binary variables were selected for testing in the model based on the following criteria:
Minimum volume: For categorical variables, each category represented at least one percent of the total volume. For binary variables, cases with the risk factor were required to represent at least one percent of the total volume. Exceptions were made to this criterion when a variable had particular clinical relevance to the outcome.
Order of risk: For categorical variables, categories farther away from the “typical” category were required to have rates of increasing risk (e.g., when the typical category was defined as level A, categories B, C, D and E were required to have increasingly higher rates of risk). For binary variables, cases with the risk factor were required to have a higher rate of risk than cases without the risk factor.
Significance: Variables were required to have significance (p<0.10) and, for categorical variables, meet the Schwarz criterion. Exceptions were made to these criteria when a variable had particular clinical relevance to the outcome.
To avoid developing models that were “overfitted,” a statistical criterion called the Schwarz criterion was used. This application avoided the problem of overfitting by including a penalty value for each factor during: 1) the selection of variables to test and 2) as a variable was added to the model (see “Model selection” below). In this way, the best endpoint for the model build (the point in which no more factors should be added to the model) could be determined. However, as noted above, exceptions were made to the Schwarz criterion for factors identified in the research literature as having particular clinical relevance to the outcome.
Model selection. Using binary logistic regression, risk factors selected for testing were added to the model in the following order: 1) procedure group, patient demographics (gender, race/ethnicity, age) and socioeconomic factors (poverty rate, education and percent not speaking English very well), 2) supplemental clinical data, 3) record review results, 4) laboratory test results, then 5) ICD-9-CM or ICD-10-CM/PCS code-based variables. All factors within a risk factor type were evaluated before considering factors from the next type. Risk factors were considered statistically significant in a model if they met the p<0.10 significance criterion and the Schwartz criterion, and indicated an increase in the risk of the event (in-hospital mortality or 30-day readmission). However, risk factors were evaluated for relevance by considering both mathematical (statistical significance) and clinical perspectives (clinically important populations). Bootstrap validation. Once the model variables were chosen, the model was validated using the bootstrap technique to evaluate the stability of each factor in the prepared model. Using this technique, five hundred sample datasets were randomly generated from the reference database. Records were allowed to appear multiple times in the sample datasets if they were selected repeatedly. The prepared model was then fit to each sample dataset to determine the percent of sample models in which each factor maintained significance (p<0.10). Risk factors at or above a 70% cutoff and those with particular clinical relevance to the outcome (even if below the 70% cutoff) were retained in the final model. This same approach was used to eliminate any factor that did not have a consistently positive numeric value/coefficient (reflective of an increased risk) or a consistently negative coefficient (reflective of a decreased risk) in at least 70% of the sample models. (See the “Coefficients and Odds Ratios” section for a description of model coefficients.)

PHC4 Cardiac Surgery Report January 1, 2014 through March 31, 2016 Data Technical Notes
10
Measure of Model Adequacy. The c-statistic was used to measure model adequacy. The c-statistic, the measure of “goodness of fit” used to describe a logistic regression model, is a common measure for models with binary dependent variables. For binary outcomes, the c-statistic is defined as the area under the receiver operating characteristic (ROC) curve.
1 The c-
statistic ranges between 0.5 and 1.0, with higher values associated with better discrimination, and can be expressed as a percent ranging from 50% to 100%. In some respects, the c-statistic is similar to the R
2 (Coefficient of Determination) commonly used in linear regression. Both the c-
statistic and R2 approach 1.0 for models that perfectly discriminate. However, unlike R
2, the c-
statistic is not dependent on the frequency of the outcome. The c-statistics for the in-hospital mortality and 30-day readmission models are listed in Data Tables 4 and 5, respectively. Coefficients and Odds Ratios. Coefficients are mathematical values derived from the regression analysis that correspond to a given level of risk. They are used in the mathematical formula that calculates a patient’s overall predicted risk of the event (mortality or readmission). The odds ratios are used to interpret the impact of the risk factors on the probability of the event. For a binary variable, the odds ratio is the change in the odds for a patient with the risk factor compared to a patient without it. For example, in the in-hospital mortality model, the odds ratio for ASA Class 5 is 2.395, meaning that a patient with ASA Class 5 was more than twice as likely to die during the hospital admission than patients in ASA Class 1, 2, 3 or 4. The coefficients and odds ratios for each risk factor included in the mortality and readmission models are listed in Data Tables 4 and 5, respectively.
Calculating Statistical Ratings Separate analyses were performed to determine, for each hospital and surgeon, the actual percent of in-hospital mortality and the actual percent of 30-day readmission with a principal diagnosis that indicated a heart-related condition, an infection or a complication. For mortality and readmission, significance tests were conducted to determine whether the difference between a hospital’s or surgeon’s actual and expected values was too large to be attributed solely to chance. These results were displayed as ratings. Ratings were reported for hospitals and surgeons with 30 or more cases in a particular procedure group. Determining Actual Values
In-Hospital Mortality
Percent
This percent was determined by dividing the total number of hospitalizations in which the patient died by the number of hospitalizations in the mortality analysis for a particular procedure group.
30-Day Readmission Percent
This percent was determined by dividing the number of hospitalizations for which the patient was readmitted at least once (with a principal diagnosis that indicated a heart-related condition, an infection or a complication
2) to any
Pennsylvania GAC hospital within 1 to 30 days of discharge, by the total number of hospitalizations included in the readmission analysis for a particular procedure group.
Determining Expected Values
The final risk models estimated the relative effects (βn) that each of the risk factors had on the relevant outcome value for each hospitalization. The model equations took the following form:
1 Hanley, J. A., & McNeil, B. J. (1982). The meaning and use of the area under a receiver operating characteristic (ROC) curve. Radiology, 143(1), 29-36.
2 See Appendix B for definitions.

PHC4 Cardiac Surgery Report January 1, 2014 through March 31, 2016 Data Technical Notes
11
βX = β0 + β1x1 + β2x2 + β3x3 + . . . βnxn
where:
βn = the relevant model coefficient (β0 is the intercept) xn = the value of the risk factor for a hospitalization
These models were then used to calculate the predicted probability of death or readmission for each individual hospitalization (after exclusions). The risk factor values (X) were multiplied by the model coefficients (β) and summed to determine the value βX for each hospitalization. Using logistic regression modeling, the predicted value was calculated as:
βX
βX
e1
ep
where e 2.7182818285 The expected value for an individual hospital or surgeon was the average of these predicted values for all hospitalizations for particular hospital or surgeon. Determining Statistical Ratings Statistical evaluation was used to determine whether the difference between a hospital’s or surgeon’s observed and expected values was too large to be attributed solely to chance. Significance tests (using test statistics and p-values as described below) were performed to account for random variation. The test statistic was calculated using the following equations:
z = (Actual – Expected) / Standard Deviation
With standard deviation being calculated as follows:
Step 1: Compute the estimated variance of the event for each patient (VARPAT):
VARPAT = (p) (1-p)
Step 2: Calculate the Standard Deviation of Mortality
SUMVAR = sum of VARPAT across all cases
Standard Deviation of Mortality = square root of SUMVAR
A two-tailed p-value was calculated using the test statistic above as a normal z-score. Assignment of Statistical Ratings Differences between actual and expected values were considered to be statistically significant when p-values were <0.05. A statistical rating of higher than expected or lower than expected was assigned to each hospital or surgeon if the difference between what was observed and what was expected in a particular procedure group was statistically significant.
If the p-value was <0.05 and the test statistic was <0, then the conclusion was made that the difference between the expected and actual number of events was statistically significant and fewer than the expected number of events had occurred. The hospital or surgeon was assigned the symbol “” (as shown in the cardiac surgery report).

PHC4 Cardiac Surgery Report January 1, 2014 through March 31, 2016 Data Technical Notes
12
If the p-value was <0.05 and the test statistic was >0, then the conclusion was made that the difference between the expected and actual number of events was statistically significant and more than the expected number of events had occurred. The hospital or surgeon was assigned the symbol “” (as shown in the cardiac surgery report).
If the calculated p-value was greater than or equal to 0.05, then the conclusion was made that the difference between the expected and actual number of events was not statistically significant. In this case the hospital or surgeon was assigned the symbol “” (as shown in the cardiac surgery report).
See Appendix D for an example of logistic regression and calculation of statistical ratings.

PHC4 Cardiac Surgery Report January 1, 2014 through March 31, 2016 Data Technical Notes
13
CASE-MIX ADJUSTMENT METHODOLOGY Charges were adjusted to account for differences in charges across regions of Pennsylvania and hospital variation in the mix of cases across MS-DRG groups. Average charges were trimmed for outliers and case-mix adjusted for each of the three assigned procedure groups (i.e., CABG without Valve, Valve without CABG and Valve with CABG) separately. A case-mix adjusted charge is reported for hospitals only, for each procedure group in which the hospital had 11 or more cases in the analysis after all exclusions were satisfied.
Construction of Reference Database After standard exclusions and cases with invalid or missing charges, cases in tracheostomy MS-DRG (003) and MDC 5, and cases in low volume MS-DRGs were removed, the reference database was constructed by assigning each case to the appropriate timeframe/procedure group/PA region/MS-DRG group combination based on the hospital’s geographic location and the MS-DRG group assignment for the case. Then cases in timeframe/procedure group/PA region/MS-DRG group combinations with less than 10 cases were excluded. Then trimming was performed. Patients who underwent CABG without valve procedures were comprised of the following MS-DRG groups:
MS-DRG Group 1
MS-DRG 231 Coronary Bypass with PTCA with MCC
MS-DRG 232 Coronary Bypass with PTCA without MCC
MS-DRG Group 2
MS-DRG 233 Coronary Bypass with Cardiac Catheterization with MCC
MS-DRG 234 Coronary Bypass with Cardiac Catheterization without MCC
MS-DRG Group 3
MS-DRG 228 Other Cardiothoracic Procedures with MCC
MS-DRG 229 Other Cardiothoracic Procedures with CC
MS-DRG 230 Other Cardiothoracic Procedures without CC/MCC
MS-DRG Group 4
MS-DRG 235 Coronary Bypass without Cardiac Catheterization with MCC
MS-DRG 236 Coronary Bypass without Cardiac Catheterization without MCC
Patients who underwent valve procedures with or without CABG procedures were comprised of the following MS-DRG groups:
MS-DRG Group 5
MS-DRG 216 Cardiac Valve and Other Major Cardiothoracic Procedures with Cardiac Catheterization with MCC
MS-DRG 217 Cardiac Valve and Other Major Cardiothoracic Procedures with Cardiac Catheterization with CC
MS-DRG 218 Cardiac Valve and Other Major Cardiothoracic Procedures with Cardiac Catheterization without CC/MCC
MS-DRG Group 6
MS-DRG 219 Cardiac Valve and Other Major Cardiothoracic Procedures without Cardiac Catheterization with MCC
MS-DRG 220 Cardiac Valve and Other Major Cardiothoracic Procedures without Cardiac Catheterization with CC
MS-DRG 221 Cardiac Valve and Other Major Cardiothoracic Procedures without Cardiac Catheterization without CC/MCC
PHC4 Cardiac Surgery Report January 1, 2014 through March 31, 2016 Data Technical Notes
14
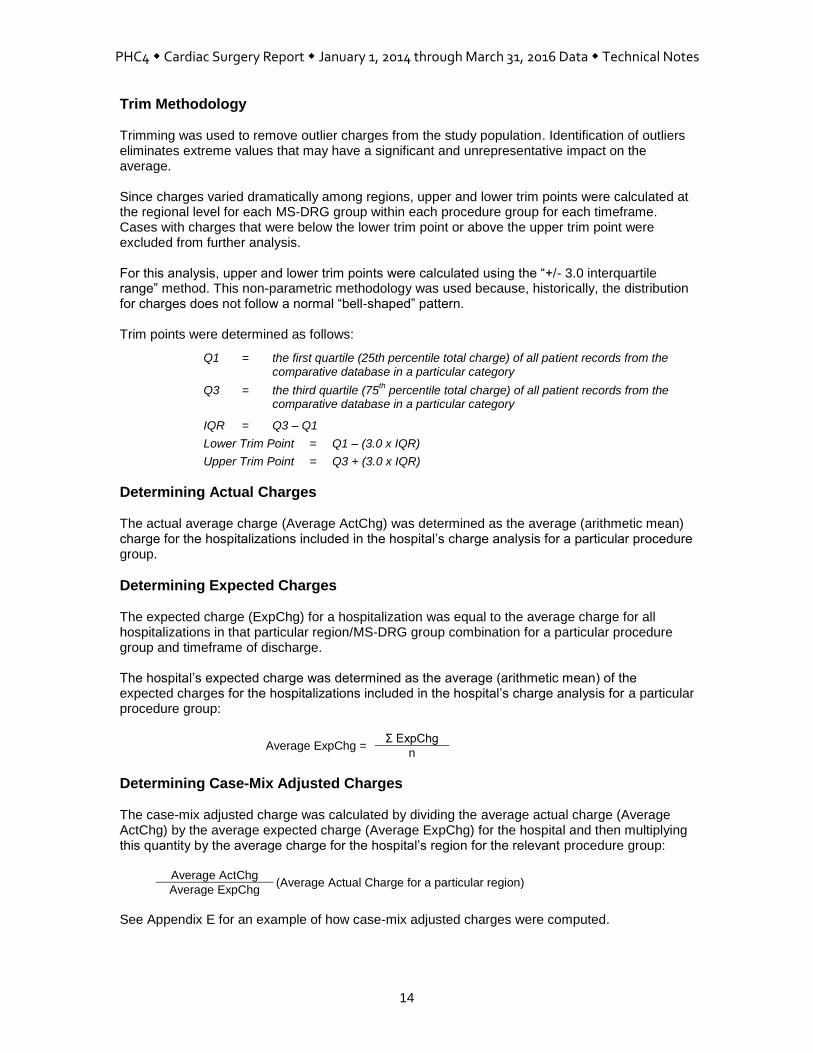
Trim Methodology Trimming was used to remove outlier charges from the study population. Identification of outliers eliminates extreme values that may have a significant and unrepresentative impact on the average. Since charges varied dramatically among regions, upper and lower trim points were calculated at the regional level for each MS-DRG group within each procedure group for each timeframe. Cases with charges that were below the lower trim point or above the upper trim point were excluded from further analysis. For this analysis, upper and lower trim points were calculated using the “+/- 3.0 interquartile range” method. This non-parametric methodology was used because, historically, the distribution for charges does not follow a normal “bell-shaped” pattern. Trim points were determined as follows:
Q1 = the first quartile (25th percentile total charge) of all patient records from the comparative database in a particular category
Q3 = the third quartile (75th
percentile total charge) of all patient records from the comparative database in a particular category
IQR = Q3 – Q1
Lower Trim Point = Q1 – (3.0 x IQR)
Upper Trim Point = Q3 + (3.0 x IQR)
Determining Actual Charges The actual average charge (Average ActChg) was determined as the average (arithmetic mean) charge for the hospitalizations included in the hospital’s charge analysis for a particular procedure group.
Determining Expected Charges The expected charge (ExpChg) for a hospitalization was equal to the average charge for all hospitalizations in that particular region/MS-DRG group combination for a particular procedure group and timeframe of discharge. The hospital’s expected charge was determined as the average (arithmetic mean) of the expected charges for the hospitalizations included in the hospital’s charge analysis for a particular procedure group:
Average ExpChg = Σ ExpChg
n
Determining Case-Mix Adjusted Charges The case-mix adjusted charge was calculated by dividing the average actual charge (Average ActChg) by the average expected charge (Average ExpChg) for the hospital and then multiplying this quantity by the average charge for the hospital’s region for the relevant procedure group:
Average ActChg (Average Actual Charge for a particular region)
Average ExpChg
See Appendix E for an example of how case-mix adjusted charges were computed.

PHC4 Cardiac Surgery Report January 1, 2014 through March 31, 2016 Data Technical Notes
DATA TABLES
15
TABLE 1. STATEWIDE UTILIZATION AND OUTCOME DATA
Table 1A. In-Hospital Mortality
Table 1B. 30-Day Readmission
January 1, 2014 to August 31, 2015 Data*
Cases 30-Day Readmission
# # %
Total cases 19,372 2,270 11.7%
CABG without Valve 11,024 1,126 10.2%
Total Valve 8,348 1,144 13.7%
Valve without CABG 5,523 733 13.3%
Valve with CABG 2,825 411 14.5%
Table 1C. Average Hospital Charge
January 1, 2014 to March 31, 2016 Data
# Cases Actual Average Charge
Total cases 28,295 $191,498
CABG without Valve 15,942 $168,627
Total Valve 12,353 $221,013
Valve without CABG 8,259 $207,548
Valve with CABG 4,094 $248,178
* The readmission analysis included discharges from January 1, 2014 through August 31, 2015. September 2015 data was used to identify 30-day readmissions for patients discharged in August 2015 due to transition to ICD10-CM.
January 1, 2014 to March 31, 2016 Data
Cases In-Hospital Mortality
# # %
Total cases 29,578 598 2.0%
CABG without Valve 16,641 254 1.5%
Total Valve 12,937 344 2.7%
Valve without CABG 8,618 155 1.8%
Valve with CABG 4,319 189 4.4%
PHC4 Cardiac Surgery Report January 1, 2014 through March 31, 2016 Data Technical Notes
DATA TABLES
16
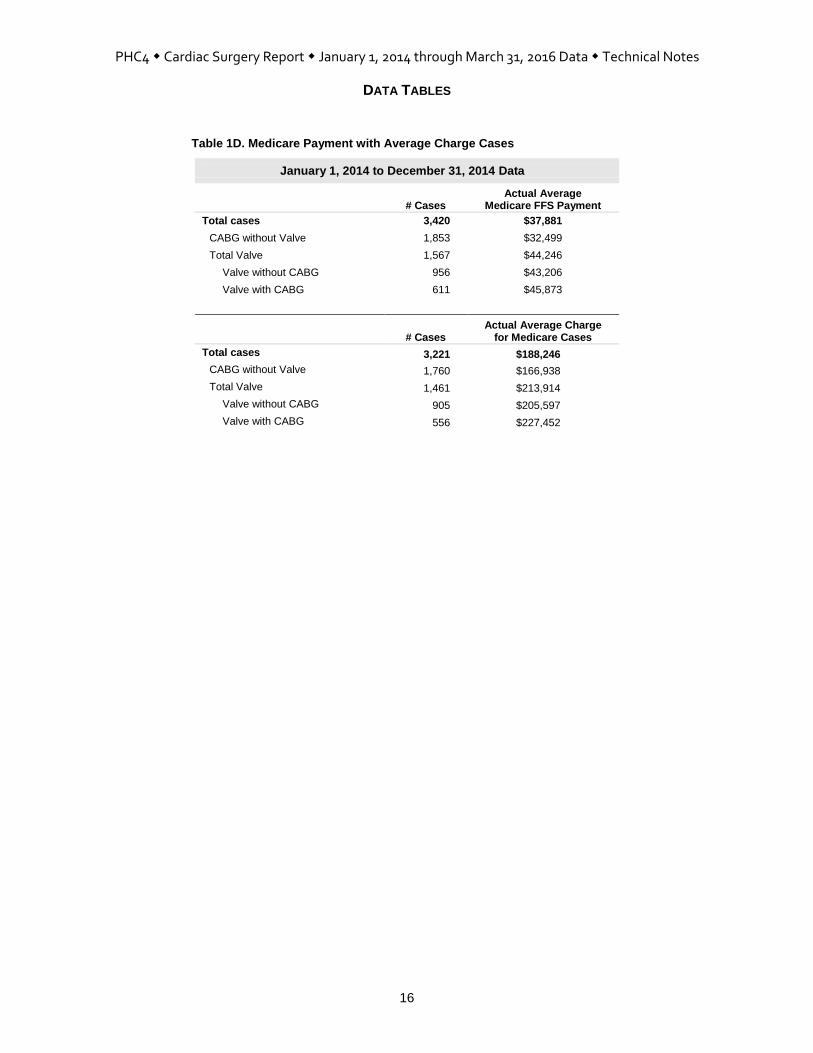
Table 1D. Medicare Payment with Average Charge Cases
January 1, 2014 to December 31, 2014 Data
# Cases Actual Average
Medicare FFS Payment
Total cases 3,420 $37,881
CABG without Valve 1,853 $32,499
Total Valve 1,567 $44,246
Valve without CABG 956 $43,206
Valve with CABG 611 $45,873
# Cases Actual Average Charge
for Medicare Cases
Total cases 3,221 $188,246
CABG without Valve 1,760 $166,938
Total Valve 1,461 $213,914
Valve without CABG 905 $205,597
Valve with CABG 556 $227,452
PHC4 Cardiac Surgery Report January 1, 2014 through March 31, 2016 Data Technical Notes
DATA TABLES
17
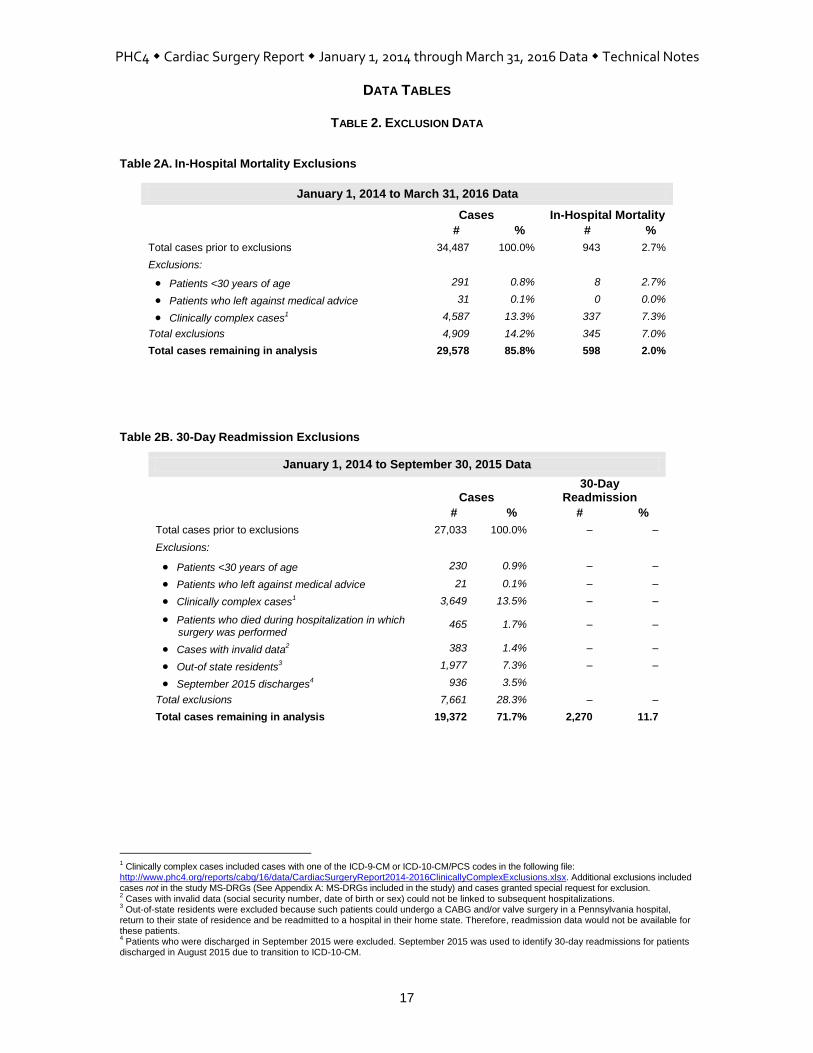
TABLE 2. EXCLUSION DATA
Table 2A. In-Hospital Mortality Exclusions
January 1, 2014 to March 31, 2016 Data
Cases In-Hospital Mortality
# % # %
Total cases prior to exclusions 34,487 100.0% 943 2.7%
Exclusions:
Patients <30 years of age 291 0.8% 8 2.7%
Patients who left against medical advice 31 0.1% 0 0.0%
Clinically complex cases1 4,587 13.3% 337 7.3%
Total exclusions 4,909 14.2% 345 7.0%
Total cases remaining in analysis 29,578 85.8% 598 2.0%
Table 2B. 30-Day Readmission Exclusions
January 1, 2014 to September 30, 2015 Data
Cases 30-Day
Readmission
# % # %
Total cases prior to exclusions 27,033 100.0% – –
Exclusions:
Patients <30 years of age 230 0.9% – –
Patients who left against medical advice
21 0.1% – –
Clinically complex cases1
3,649 13.5% – –
Patients who died during hospitalization in which surgery was performed
465 1.7% – –
Cases with invalid data2 383 1.4% – –
Out-of state residents3 1,977 7.3% – –
September 2015 discharges4 936 3.5%
Total exclusions 7,661 28.3% – –
Total cases remaining in analysis 19,372 71.7% 2,270 11.7
1 Clinically complex cases included cases with one of the ICD-9-CM or ICD-10-CM/PCS codes in the following file:
http://www.phc4.org/reports/cabg/16/data/CardiacSurgeryReport2014-2016ClinicallyComplexExclusions.xlsx. Additional exclusions included cases not in the study MS-DRGs (See Appendix A: MS-DRGs included in the study) and cases granted special request for exclusion. 2 Cases with invalid data (social security number, date of birth or sex) could not be linked to subsequent hospitalizations.
3 Out-of-state residents were excluded because such patients could undergo a CABG and/or valve surgery in a Pennsylvania hospital,
return to their state of residence and be readmitted to a hospital in their home state. Therefore, readmission data would not be available for these patients. 4 Patients who were discharged in September 2015 were excluded. September 2015 was used to identify 30-day readmissions for patients
discharged in August 2015 due to transition to ICD-10-CM.

PHC4 Cardiac Surgery Report January 1, 2014 through March 31, 2016 Data Technical Notes
DATA TABLES
18
TABLE 2. EXCLUSION DATA CONTINUED
Table 2C. Average Hospital Charge Exclusions
January 1, 2014 to March 31, 2016 Data
Cases Average Charge # %
Total cases after in-hospital mortality exclusions 29,578 100.0% $212,844
Additional exclusions:
Patients with invalid or missing charges1 0 0.0% -
Cases in tracheostomy MS-DRG2 521 1.8% $778,484
Cases in low volume MS-DRGs3 253 0.9% $548,042
Cases that were charge outliers4 509 1.7% $653,894
Total exclusions 1,283 4.3% -
Total cases remaining in analysis 28,295 95.7% $191,498
January 1, 2014 to December 31, 2014 Data
Cases Average Charge # %
Total cases after in-hospital mortality exclusions 13,225 100.0% $206,378
Additional exclusions:
Patients with invalid or missing charges1 0 0.0% -
Cases in tracheostomy MS-DRG2 221 1.7% $756,792
Cases in low volume MS-DRGs3 109 0.8% $602,278
Cases that were charge outliers4 218 1.6% $585,231
Total exclusions 548 4.1% -
Total cases remaining in analysis 12,677 95.9% $186,864
January 1, 2015 to March 31, 2016 Data
Cases Average Charge # %
Total cases after in-hospital mortality exclusions 16,353 100.0% $218,073
Additional exclusions:
Patients with invalid or missing charges1 0 0.0% -
Cases in tracheostomy MS-DRG2 300 1.8% $794,463
Cases in low volume MS-DRGs3 144 0.9% $506,989
Cases that were charge outliers4 291 1.8% $705,332
Total exclusions 735 4.5% -
Total cases remaining in analysis 15,618 95.5% $195,259
1 Invalid/missing charges included cases with charges that were less than $10,000.
2 Tracheostomy cases were assigned to MS-DRG 003 and MDC 5.
3 MS-DRGs with low volume, including MS-DRG groups when a particular combination of timeframe/procedure group/PA region/MS-DRG
group had fewer than 10 cases. 4 Charge outliers were determined using the “+/- 3.0 interquartile range” method—after accounting for differences in charges by
timeframe/procedure group/PA region/ MS-DRG group.

PHC4 Cardiac Surgery Report January 1, 2014 through March 31, 2016 Data Technical Notes
DATA TABLES
19
Table 2D. Average Charge Exclusions for Medicare Payment Cases
January, 2014 to December 31, 2014 Data
Cases
Actual Average Charge
for Medicare Cases
# %
Total cases included in 2014 Medicare payment study 3,420 100.0% $207,449
Additional exclusions:
Patients with invalid or missing charges1 0 0.0% –
Cases in tracheostomy MS-DRG2 63 1.8% $718,754
Cases in low volume MS-DRGs3 87 2.5% $322,583
Cases that were charge outliers4 49 1.4% $607,947
Total exclusions 199 5.8% –
Total cases remaining in analysis 3,221 94.2% $188,246
1 Invalid/missing charges included cases with charges that were less than $10,000. 2 Tracheostomy cases were assigned to MS-DRG 003 and MDC 5. 3 MS-DRGs with low volume, including MS-DRG groups when a particular combination of timeframe/procedure group/PA region/MS-DRG
group had fewer than 10 cases. 4
Charge outliers were determined using the “+/- 3.0 interquartile range” method—after accounting for differences in charges by timeframe/
procedure group/PA region/ MS-DRG group.

PHC4 Cardiac Surgery Report January 1, 2014 through March 31, 2016 Data Technical Notes
DATA TABLES
20
TABLE 3. 30-DAY READMISSION DATA N = 2,270
# %
CIRCULATORY SYSTEM 1,092 48.1
Cardiac Dysrhythmias 337 14.8
Heart Block 14 0.6
Paroxysmal Tachycardia 15 0.7
Atrial Fibrillation and Atrial Flutter 258 11.4
Ventricular Fibrillation and Ventricular Flutter 7 0.3
Premature Heart Beats 0 0.0
Other Cardiac Dysrhythmias 43 1.9
Heart Failure 387 17.0
Functional Disturbances Follow Cardiac Surgery (Postcardiotomy Syndrome) 33 1.5
Hypertension and Hypotension 31 1.4
Hypertension 2 0.1
Hypotension 29 1.3
Myocardial Infarction and Ischemia 57 2.5
Acute Myocardial Infarction, Initial Episode 47 2.1
Acute Myocardial Infarction, Unspecified or Subsequent Episode 0 0.0
Other Forms of Myocardial Ischemia 10 0.4
Angina Pectoris and Chest Pain 30 1.3
Atherosclerosis 33 1.5
Coronary Atherosclerosis 23 1.0
Other Atherosclerosis 10 0.4
Heart Aneurysm and Dissection 0 0.0
Endocarditis, Myocarditis and Pericarditis 51 2.2
Heart Valve Disease 4 0.2
Mitral Valve Disease 2 0.1
Aortic Valve Disease 2 0.1
Tricuspid Valve Disease 0 0.0
Pulmonary Valve Disease 0 0.0
Multiple Valve Disease 0 0.0
Other Endocardial Structure Disease 0 0.0
Cardiomyopathies 0 0.0
Other Aneurysm and Dissection 6 0.3
Aortic Aneurysm and Dissection 3 0.1
Other Arterial Aneurysm 3 0.1
Other Arterial Dissection 0 0.0
Arterial Embolism and Thrombosis 5 0.2
Abdominal and Thoracic Aorta 1 <0.1
PHC4 Cardiac Surgery Report January 1, 2014 through March 31, 2016 Data Technical Notes
DATA TABLES
21
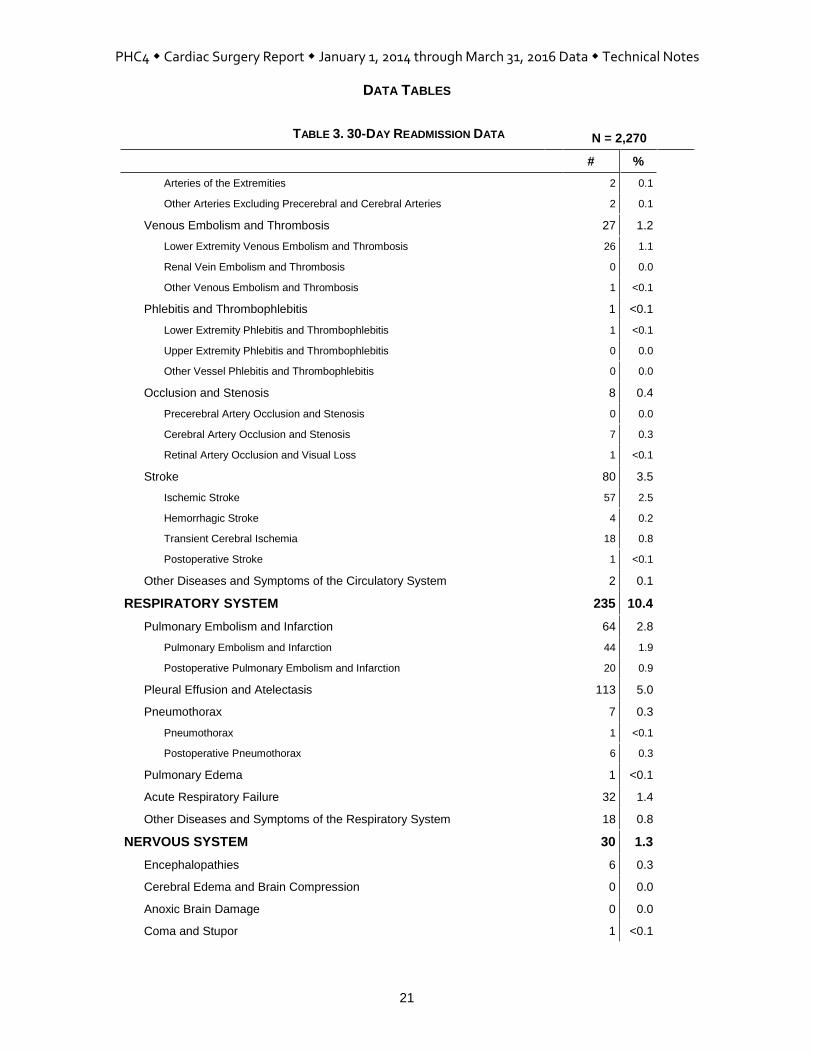
TABLE 3. 30-DAY READMISSION DATA N = 2,270
# %
Arteries of the Extremities 2 0.1
Other Arteries Excluding Precerebral and Cerebral Arteries 2 0.1
Venous Embolism and Thrombosis 27 1.2
Lower Extremity Venous Embolism and Thrombosis 26 1.1
Renal Vein Embolism and Thrombosis 0 0.0
Other Venous Embolism and Thrombosis 1 <0.1
Phlebitis and Thrombophlebitis 1 <0.1
Lower Extremity Phlebitis and Thrombophlebitis 1 <0.1
Upper Extremity Phlebitis and Thrombophlebitis 0 0.0
Other Vessel Phlebitis and Thrombophlebitis 0 0.0
Occlusion and Stenosis 8 0.4
Precerebral Artery Occlusion and Stenosis 0 0.0
Cerebral Artery Occlusion and Stenosis 7 0.3
Retinal Artery Occlusion and Visual Loss 1 <0.1
Stroke 80 3.5
Ischemic Stroke 57 2.5
Hemorrhagic Stroke 4 0.2
Transient Cerebral Ischemia 18 0.8
Postoperative Stroke 1 <0.1
Other Diseases and Symptoms of the Circulatory System 2 0.1
RESPIRATORY SYSTEM 235 10.4
Pulmonary Embolism and Infarction 64 2.8
Pulmonary Embolism and Infarction 44 1.9
Postoperative Pulmonary Embolism and Infarction 20 0.9
Pleural Effusion and Atelectasis 113 5.0
Pneumothorax 7 0.3
Pneumothorax 1 <0.1
Postoperative Pneumothorax 6 0.3
Pulmonary Edema 1 <0.1
Acute Respiratory Failure 32 1.4
Other Diseases and Symptoms of the Respiratory System 18 0.8
NERVOUS SYSTEM 30 1.3
Encephalopathies 6 0.3
Cerebral Edema and Brain Compression 0 0.0
Anoxic Brain Damage 0 0.0
Coma and Stupor 1 <0.1

PHC4 Cardiac Surgery Report January 1, 2014 through March 31, 2016 Data Technical Notes
DATA TABLES
22
TABLE 3. 30-DAY READMISSION DATA N = 2,270
# %
Postoperative Pain 6 0.3
Other Diseases and Symptoms of the Nervous System 17 0.7
DIGESTIVE SYSTEM 117 5.2
Ischemic Bowel and Vascular Insufficiency of the Intestine 7 0.3
Intestinal Obstruction and Ileus 9 0.4
Ulceration, Bleeding and Perforation of the Digestive System 77 3.4
Acute Liver Failure 3 0.1
Other Diseases and Symptoms of the Digestive System 21 0.9
URINARY SYSTEM 60 2.6
Acute Glomerulonephritis and Pyelonephritis 0 0.0
Nephrotic Syndrome 0 0.0
Acute Renal Failure 51 2.2
Other Diseases and Symptoms of the Urinary System 9 0.4
COMPLICATIONS OF SURGICAL AND MEDICAL CARE 212 9.3
Mechanical Complication of Cardiac Device, Implant and Graft 4 0.2
Mechanical Complication of Cardiac Pacemaker and AICD 1 <0.1
Mechanical Complication of Heart Valve Prosthesis 2 0.1
Mechanical Complication of Coronary Artery Bypass Graft 1 <0.1
Other and Unspecified Mechanical Complication 0 0.0
Other Complication of Internal Prosthetic Device, Implant and Graft 16 0.7
Other Complication of Heart Valve Prosthesis 5 0.2
Other Complication of Other Cardiac Device, Implant and Graft 11 0.5
Other Complication of Vascular Device, Implant and Graft 0 0.0
Shock 2 0.1
Postoperative Shock 0 0.0
Cardiogenic Shock 0 0.0
Other Shock 2 0.1
Hemorrhage and Hematoma Complicating a Procedure 20 0.9
Foreign Body Accidentally Left or Accidental Laceration During a Procedure 0 0.0
Dehiscence and Rupture of Operation Wound 42 1.9
Other Complications of Surgical and Medical Care 128 5.6
Nervous System Complication 2 0.1
Circulatory System Complication 64 2.8
Respiratory System Complication 49 2.2
Digestive System Complication 7 0.3
Urinary System Complication 2 0.1

PHC4 Cardiac Surgery Report January 1, 2014 through March 31, 2016 Data Technical Notes
DATA TABLES
23
TABLE 3. 30-DAY READMISSION DATA N = 2,270
# %
Other Complications 4 0.2
INFECTIONS 463 20.4
Postoperative Infections 162 7.1
Sepsis and Bacteremia 123 5.4
Pneumonia 86 3.8
Pneumonia 74 3.3
Aspiration Pneumonia 12 0.5
Empyema and Abscess of Lung 4 0.2
Infection due to Device, Implant and Graft 8 0.4
Cardiac Device, Implant and Graft 7 0.3
Vascular Device, Implant and Graft 1 <0.1
Other and Unspecified Infections due to Device, Implant and Graft 0 0.0
Urinary Tract Infection 34 1.5
Cellulitis 20 0.9
Osteomyelitis 0 0.0
Intestinal Infection due to Clostridium difficile 17 0.7
Other Infection Related Conditions and Symptoms 9 0.4
FLUID AND ELECTROLYTE IMBALANCE 26 1.1
Hyperosmolality and Hyposmolality 7 0.3
Acidosis and Alkalosis 0 0.0
Dehydration and Hypovolemia 8 0.4
Fluid Overload 7 0.3
Hyperpotassemia and Hypopotassemia 4 0.2
Other Electrolyte and Fluid Disorders 0 0.0
ANEMIA AND COAGULATION DEFECTS 35 1.5
Anemia 23 1.0
Acute Posthemorrhagic Anemia 11 0.5
Anemia 12 0.5
Coagulation Defects 12 0.5
Thrombocytopenia 0 0.0
Other Coagulation Defects 12 0.5

PHC4 Cardiac Surgery Report January 1, 2014 through March 31, 2016 Data Technical Notes
DATA TABLES
24
TABLE 4. IN-HOSPITAL MORTALITY MODEL
The c-statistic for the model is 0.81871.
Predictor Coefficient Odds Ratio1 p-value
Intercept -6.8555
Procedure Group Factor
Procedure Group <0.0001
Valve without CABG 0.5596 1.750
Valve with CABG 0.9592 2.610
Demographic Factors
Age (continuous) 0.0133 1.142 0.1987
Age – Number of Years >65 (continuous) 0.0275 1.147 0.0738
Race/Ethnicity 0.0906
Black non-Hispanic 0.0921 1.096
Other non-Hispanic 0.3782 1.460
Sex <0.0001
Female 0.3986 1.490
Clinically Derived Factors
American Society of Anesthesiologists (ASA) Class 5 0.8732 2.395 0.0023
ASA Emergency Indicator 0.6917 1.997 <0.0001
Ejection Fraction 0.0002
<20% 0.8074 2.242
20 to 39% 0.3008 1.351
Circumflex (and branches) – Number of Percentage Points >49% (continuous)
0.0026 1.026 0.2963
Left Anterior Descending (and branches) – Number of Percentage Points >49% (continuous)
0.0066 1.068 0.0172
Left Main Stenosis (continuous) 0.0068 1.070 <0.0001
Preoperative Acute Renal Failure 0.6633 1.941 0.0030
Preoperative Cardiogenic Shock 1.1874 3.279 <0.0001
Glucose ≥166 mg/dL 0.3631 1.438 0.0006
PT ≥13.1 sec / INR ≥1.11 (ratio) 2 0.2390 1.270 0.0347
Diagnosis or Procedure Code-Based Factors
Acute Myocardial Infarction (AMI) as Principal Diagnosis 0.2576 1.294 0.0249
Angioplasty and Stenting of Coronary Artery Prior to First CABG/Valve Surgery Date
1.2686 3.556 <0.0001
Chronic Kidney Disease <0.0001
CKD Stage 5 and ESRD 1.5092 4.523
CKD Stage 1 to 4 0.2722 1.313
Chronic Liver Disease 0.8066 2.240 <0.0001
Heart Failure 0.4787 1.614 <0.0001
Malnutrition 0.7713 2.163 <0.0001
Oxygen Therapy Dependence (long-term) 1.1808 3.257 <0.0001
Valve Procedure - Multiple, Same Day as First CABG/Valve
Surgery 0.5830 1.791 <0.0001
1 Odds ratios for “Age”, “Circumflex (& branches) – Number of Percentage Points >49% (continuous)”, “Left Anterior Descending (and
branches) – Number of Percentage Points >49% (continuous)” and “Left Main Stenosis (continuous)” are calculated at units of 10 and odds ratios for “Age – Number of Years > 65” is calculated at units of 5. Using ”Left Main Stenosis (continuous)” as an example, the odds for in-hospital mortality are about 7% higher for patients with 20% left main stenosis than for patients with 10% left main stenosis, when the other variables in the model are controlled. 2 The PT and INR analytes were combined to one factor. If a record had both test results, then the factor was based on the INR.
PHC4 Cardiac Surgery Report January 1, 2014 through March 31, 2016 Data Technical Notes
DATA TABLES
25
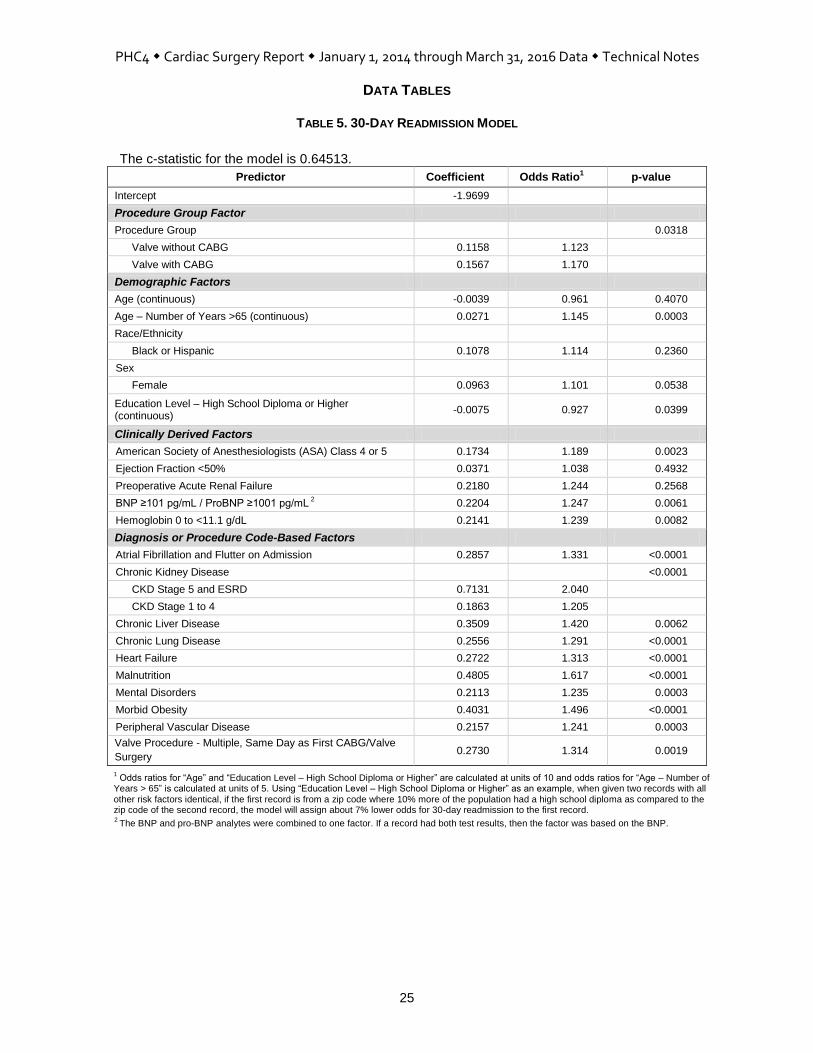
TABLE 5. 30-DAY READMISSION MODEL
The c-statistic for the model is 0.64513.
Predictor Coefficient Odds Ratio1 p-value
Intercept -1.9699
Procedure Group Factor
Procedure Group 0.0318
Valve without CABG 0.1158 1.123
Valve with CABG 0.1567 1.170
Demographic Factors
Age (continuous) -0.0039 0.961 0.4070
Age – Number of Years >65 (continuous) 0.0271 1.145 0.0003
Race/Ethnicity
Black or Hispanic 0.1078 1.114 0.2360
Sex
Female 0.0963 1.101 0.0538
Education Level – High School Diploma or Higher (continuous)
-0.0075 0.927 0.0399
Clinically Derived Factors
American Society of Anesthesiologists (ASA) Class 4 or 5 0.1734 1.189 0.0023
Ejection Fraction <50% 0.0371 1.038 0.4932
Preoperative Acute Renal Failure 0.2180 1.244 0.2568
BNP ≥101 pg/mL / ProBNP ≥1001 pg/mL 2 0.2204 1.247 0.0061
Hemoglobin 0 to <11.1 g/dL 0.2141 1.239 0.0082
Diagnosis or Procedure Code-Based Factors
Atrial Fibrillation and Flutter on Admission 0.2857 1.331 <0.0001
Chronic Kidney Disease <0.0001
CKD Stage 5 and ESRD 0.7131 2.040
CKD Stage 1 to 4 0.1863 1.205
Chronic Liver Disease 0.3509 1.420 0.0062
Chronic Lung Disease 0.2556 1.291 <0.0001
Heart Failure 0.2722 1.313 <0.0001
Malnutrition 0.4805 1.617 <0.0001
Mental Disorders 0.2113 1.235 0.0003
Morbid Obesity 0.4031 1.496 <0.0001
Peripheral Vascular Disease 0.2157 1.241 0.0003
Valve Procedure - Multiple, Same Day as First CABG/Valve
Surgery 0.2730 1.314 0.0019
1 Odds ratios for “Age” and “Education Level – High School Diploma or Higher” are calculated at units of 10 and odds ratios for “Age – Number of
Years > 65” is calculated at units of 5. Using “Education Level – High School Diploma or Higher” as an example, when given two records with all other risk factors identical, if the first record is from a zip code where 10% more of the population had a high school diploma as compared to the zip code of the second record, the model will assign about 7% lower odds for 30-day readmission to the first record. 2 The BNP and pro-BNP analytes were combined to one factor. If a record had both test results, then the factor was based on the BNP.

APPENDICES

PHC4 Cardiac Surgery Report January 1, 2014 through March 31, 2016 Data Technical Notes
APPENDIX A. CLINICALLY COMPLEX EXCLUSION DEFINITIONS
A-1
CLINICALLY COMPLEX EXCLUSIONS ICD-9-CM and ICD-10-CM/PCS Diagnosis and Procedure Codes
Diagnosis and procedure codes that define clinically complex exclusions are available at http://www.phc4.org/reports/cabg/16/data/CardiacSurgeryReport2014-2016ClinicallyComplexExclusions.xlsx. MS-DRG Criteria for Study Population Definition
MS-DRGs Not Excluded from the Study: CABG without Valve
MS-DRG 001 Heart Transplant or Implant of Heart Assist System with MCC
MS-DRG 002 Heart Transplant or Implant of Heart Assist System without MCC
MS-DRG 003 and MDC 5*
ECMO or Tracheostomy with Mechanical Ventilation >96 Hours or Principal Diagnosis Except Face, Mouth, Neck with Major O.R. Procedures
MS-DRG 215 Other Heart Assist System Implant
MS-DRG 216 Cardiac Valve and Other Major Cardiothoracic Procedures with Cardiac Catheterization with MCC
MS-DRG 217 Cardiac Valve and Other Major Cardiothoracic Procedures with Cardiac Catheterization with CC
MS-DRG 218 Cardiac Valve and Other Major Cardiothoracic Procedures with Cardiac Catheterization without CC/MCC
MS-DRG 219 Cardiac Valve and Other Major Cardiothoracic Procedures without Cardiac Catheterization with MCC
MS-DRG 220 Cardiac Valve and Other Major Cardiothoracic Procedures without Cardiac Catheterization with CC
MS-DRG 221 Cardiac Valve and Other Major Cardiothoracic Procedures without Cardiac Catheterization without CC/MCC
MS-DRG 222 Cardiac Defibrillator Implant with Cardiac Catheterization with Acute MI/Heart Failure/Shock with MCC
MS-DRG 223 Cardiac Defibrillator Implant with Cardiac Catheterization with Acute MI/Heart Failure/Shock without MCC
MS-DRG 224 Cardiac Defibrillator Implant with Cardiac Catheterization without Acute MI/Heart Failure/Shock with MCC
MS-DRG 225 Cardiac Defibrillator Implant with Cardiac Catheterization without Acute MI/Heart Failure/Shock without MCC
MS-DRG 226 Cardiac Defibrillator Implant without Cardiac Catheterization with MCC
MS-DRG 227 Cardiac Defibrillator Implant without Cardiac Catheterization without MCC
MS-DRG 228 Other Cardiothoracic Procedures with MCC
MS-DRG 229 Other Cardiothoracic Procedures with CC
MS-DRG 230 Other Cardiothoracic Procedures without CC/MCC
MS-DRG 231 Coronary Bypass with PTCA with MCC
MS-DRG 232 Coronary Bypass with PTCA without MCC
MS-DRG 233 Coronary Bypass with Cardiac Catheterization with MCC
MS-DRG 234 Coronary Bypass with Cardiac Catheterization without MCC
MS-DRG 235 Coronary Bypass without Cardiac Catheterization with MCC
MS-DRG 236 Coronary Bypass without Cardiac Catheterization without MCC
MS-DRGs Not Excluded from the Study: Valve without CABG
MS-DRG 001 Heart Transplant or Implant of Heart Assist System with MCC
MS-DRG 002 Heart Transplant or Implant of Heart Assist System without MCC
MS-DRG 003 and MDC 5*
ECMO or Tracheostomy with Mechanical Ventilation >96 Hours or Principal Diagnosis Except Face, Mouth, Neck with Major O.R. Procedures
MS-DRG 215 Other Heart Assist System Implant
MS-DRG 216 Cardiac Valve and Other Major Cardiothoracic Procedures with Cardiac Catheterization with MCC
MS-DRG 217 Cardiac Valve and Other Major Cardiothoracic Procedures with Cardiac Catheterization with CC
MS-DRG 218 Cardiac Valve and Other Major Cardiothoracic Procedures with Cardiac Catheterization without CC/MCC
MS-DRG 219 Cardiac Valve and Other Major Cardiothoracic Procedures without Cardiac Catheterization with MCC
MS-DRG 220 Cardiac Valve and Other Major Cardiothoracic Procedures without Cardiac Catheterization with CC
MS-DRG 221 Cardiac Valve and Other Major Cardiothoracic Procedures without Cardiac Catheterization without CC/MCC
MS-DRG 222 Cardiac Defibrillator Implant with Cardiac Catheterization with Acute MI/Heart Failure/Shock with MCC
MS-DRG 223 Cardiac Defibrillator Implant with Cardiac Catheterization with Acute MI/Heart Failure/Shock without MCC
PHC4 Cardiac Surgery Report January 1, 2014 through March 31, 2016 Data Technical Notes
APPENDIX A. CLINICALLY COMPLEX EXCLUSION DEFINITIONS (CONTINUED)
A-2
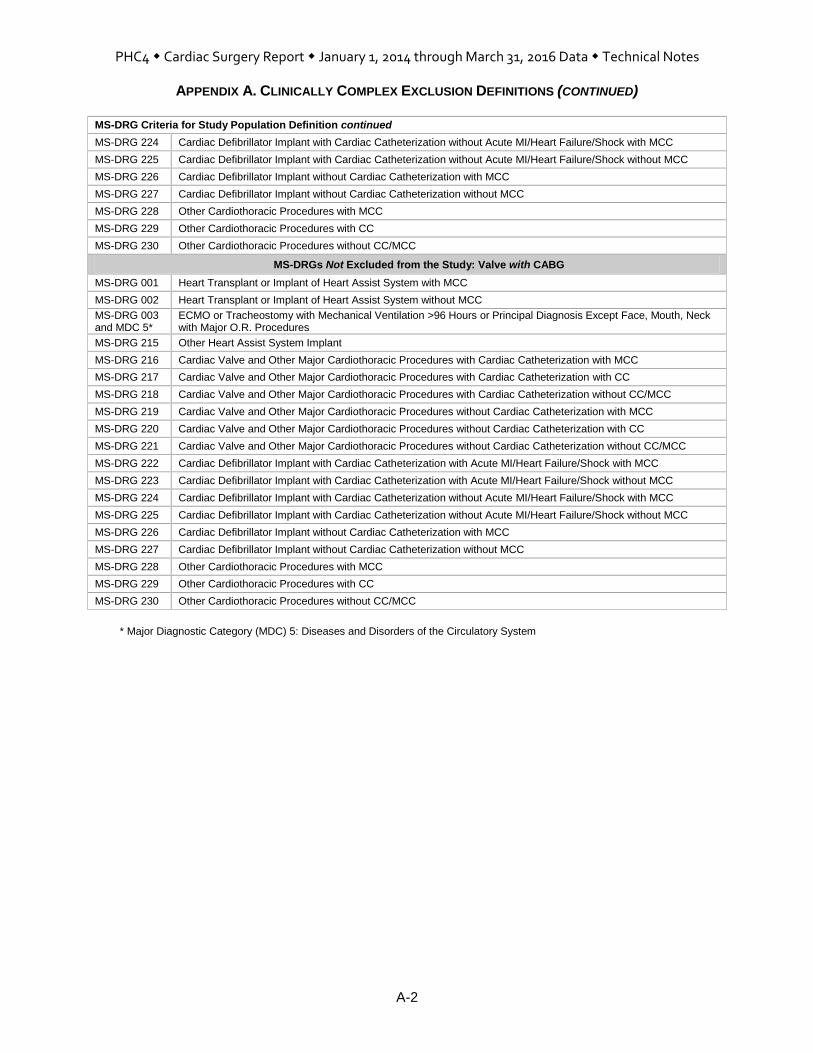
MS-DRG Criteria for Study Population Definition continued
MS-DRG 224 Cardiac Defibrillator Implant with Cardiac Catheterization without Acute MI/Heart Failure/Shock with MCC
MS-DRG 225 Cardiac Defibrillator Implant with Cardiac Catheterization without Acute MI/Heart Failure/Shock without MCC
MS-DRG 226 Cardiac Defibrillator Implant without Cardiac Catheterization with MCC
MS-DRG 227 Cardiac Defibrillator Implant without Cardiac Catheterization without MCC
MS-DRG 228 Other Cardiothoracic Procedures with MCC
MS-DRG 229 Other Cardiothoracic Procedures with CC
MS-DRG 230 Other Cardiothoracic Procedures without CC/MCC
MS-DRGs Not Excluded from the Study: Valve with CABG
MS-DRG 001 Heart Transplant or Implant of Heart Assist System with MCC
MS-DRG 002 Heart Transplant or Implant of Heart Assist System without MCC
MS-DRG 003 and MDC 5*
ECMO or Tracheostomy with Mechanical Ventilation >96 Hours or Principal Diagnosis Except Face, Mouth, Neck with Major O.R. Procedures
MS-DRG 215 Other Heart Assist System Implant
MS-DRG 216 Cardiac Valve and Other Major Cardiothoracic Procedures with Cardiac Catheterization with MCC
MS-DRG 217 Cardiac Valve and Other Major Cardiothoracic Procedures with Cardiac Catheterization with CC
MS-DRG 218 Cardiac Valve and Other Major Cardiothoracic Procedures with Cardiac Catheterization without CC/MCC
MS-DRG 219 Cardiac Valve and Other Major Cardiothoracic Procedures without Cardiac Catheterization with MCC
MS-DRG 220 Cardiac Valve and Other Major Cardiothoracic Procedures without Cardiac Catheterization with CC
MS-DRG 221 Cardiac Valve and Other Major Cardiothoracic Procedures without Cardiac Catheterization without CC/MCC
MS-DRG 222 Cardiac Defibrillator Implant with Cardiac Catheterization with Acute MI/Heart Failure/Shock with MCC
MS-DRG 223 Cardiac Defibrillator Implant with Cardiac Catheterization with Acute MI/Heart Failure/Shock without MCC
MS-DRG 224 Cardiac Defibrillator Implant with Cardiac Catheterization without Acute MI/Heart Failure/Shock with MCC
MS-DRG 225 Cardiac Defibrillator Implant with Cardiac Catheterization without Acute MI/Heart Failure/Shock without MCC
MS-DRG 226 Cardiac Defibrillator Implant without Cardiac Catheterization with MCC
MS-DRG 227 Cardiac Defibrillator Implant without Cardiac Catheterization without MCC
MS-DRG 228 Other Cardiothoracic Procedures with MCC
MS-DRG 229 Other Cardiothoracic Procedures with CC
MS-DRG 230 Other Cardiothoracic Procedures without CC/MCC
* Major Diagnostic Category (MDC) 5: Diseases and Disorders of the Circulatory System

PHC4 Cardiac Surgery Report January 1, 2014 through March 31, 2016 Data Technical Notes
APPENDIX B. ICD-9-CM DEFINITIONS FOR REASONS FOR READMISSION
A-3
A readmission was counted only if the patient was readmitted with a principal diagnosis (i.e., the reason for the readmission) that indicated a heart-related condition, an infection or a complication.
CIRCULATORY SYSTEM
Cardiac Dysrhythmias Heart Block
426.0, 426.10, 426.11, 426.12, 426.13, 426.2, 426.3, 426.4, 426.50, 426.51, 426.52, 426.53, 426.54, 426.6, 426.7, 426.81, 426.82, 426.89, 426.9
Paroxysmal Tachycardia
427.0, 427.1, 427.2
Atrial Fibrillation and Atrial Flutter
427.31, 427.32
Ventricular Fibrillation and Ventricular Flutter
427.41, 427.42, 427.5
Premature Heart Beats
427.60, 427.61, 427.69
Other Cardiac Dysrhythmias
427.81, 427.89, 427.9
Heart Failure 398.91, 402.01, 402.11, 402.91, 404.01, 404.03, 404.11, 404.13, 404.91, 404.93, 428.0, 428.1, 428.20, 428.21, 428.22, 428.23, 428.30, 428.31, 428.32, 428.33, 428.40, 428.41, 428.42, 428.43, 428.9
Functional Disturbances Follow Cardiac Surgery (Postcardiotomy Syndrome) 429.4
Hypertension and Hypotension Hypertension
401.0, 401.1, 401.9, 402.00, 402.10, 402.90, 405.01, 405.09, 405.11, 405.19, 405.91, 405.99, 997.91
Hypotension
458.0, 458.21, 458.29, 458.8, 458.9, 796.3
Myocardial Infarction and Ischemia Acute Myocardial Infarction, Initial Episode
410.01, 410.11, 410.21, 410.31, 410.41, 410.51, 410.61, 410.71, 410.81, 410.91
Acute Myocardial Infarction, Unspecified or Subsequent Episode
410.00, 410.02, 410.10, 410.12, 410.20, 410.22, 410.30, 410.32, 410.40, 410.42, 410.50, 410.52, 410.60, 410.62, 410.70, 410.72, 410.80, 410.82, 410.90, 410.92
Other Forms of Myocardial Ischemia
411.0, 411.81, 411.89, 429.79
Angina Pectoris and Chest Pain 411.1, 413.0, 413.1, 413.9, 786.50, 786.51, 786.59
Atherosclerosis Coronary Atherosclerosis
414.00, 414.01, 414.02, 414.03, 414.04, 414.05, 414.06, 414.07, 414.2, 414.3, 414.4
Other Atherosclerosis
429.2, 440.0, 440.1, 440.20, 440.21, 440.22, 440.23, 440.24, 440.29, 440.30, 440.31, 440.32, 440.8, 440.9
Heart Aneurysm and Dissection 414.10, 414.11, 414.12, 414.19
Endocarditis, Myocarditis and Pericarditis 112.81, 397.9, 398.0, 420.90, 420.91, 420.99, 421.0, 421.9, 422.90, 422.91, 422.92, 422.93, 422.99, 423.1, 423.2, 423.3, 423.8, 423.9, 424.90, 424.99, 429.0, 429.1
Heart Valve Disease Mitral Valve Disease
394.0, 394.1, 394.2, 394.9, 424.0
Aortic Valve Disease
395.0, 395.1, 395.2, 395.9, 424.1
Tricuspid Valve Disease
397.0, 424.2
Pulmonary Valve Disease
397.1, 424.3
PHC4 Cardiac Surgery Report January 1, 2014 through March 31, 2016 Data Technical Notes
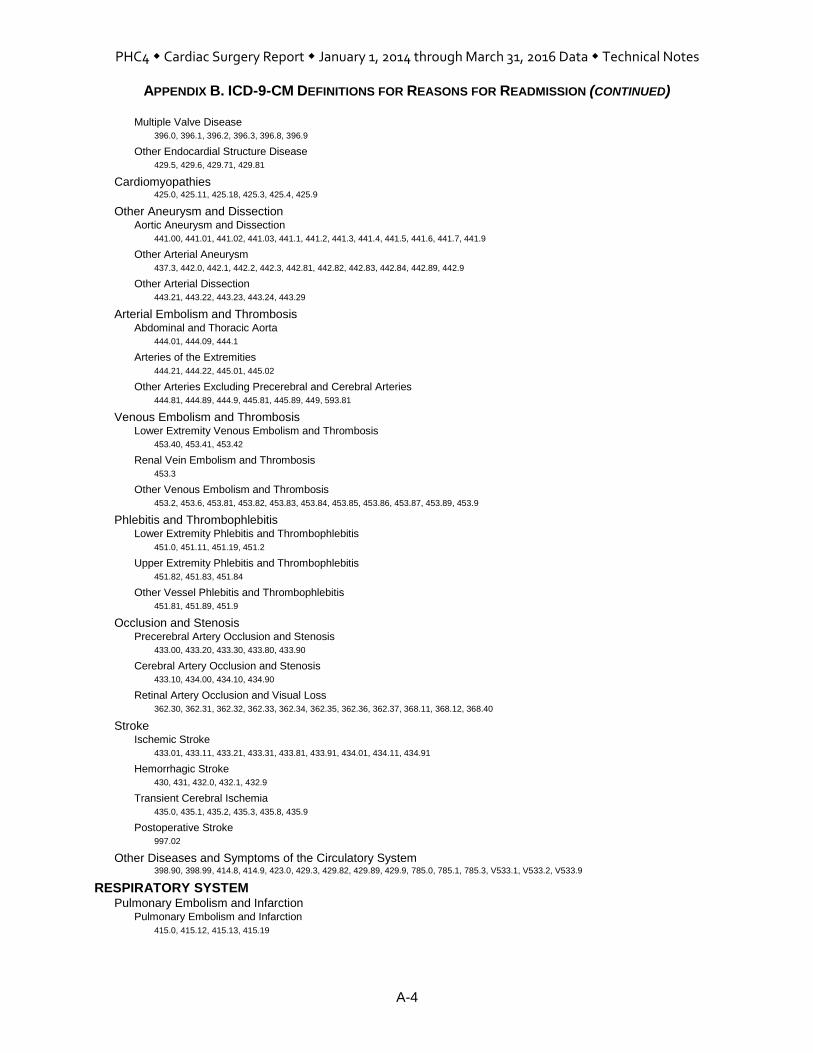
APPENDIX B. ICD-9-CM DEFINITIONS FOR REASONS FOR READMISSION (CONTINUED)
A-4
Multiple Valve Disease
396.0, 396.1, 396.2, 396.3, 396.8, 396.9
Other Endocardial Structure Disease
429.5, 429.6, 429.71, 429.81
Cardiomyopathies 425.0, 425.11, 425.18, 425.3, 425.4, 425.9
Other Aneurysm and Dissection Aortic Aneurysm and Dissection
441.00, 441.01, 441.02, 441.03, 441.1, 441.2, 441.3, 441.4, 441.5, 441.6, 441.7, 441.9
Other Arterial Aneurysm
437.3, 442.0, 442.1, 442.2, 442.3, 442.81, 442.82, 442.83, 442.84, 442.89, 442.9
Other Arterial Dissection
443.21, 443.22, 443.23, 443.24, 443.29
Arterial Embolism and Thrombosis Abdominal and Thoracic Aorta
444.01, 444.09, 444.1
Arteries of the Extremities
444.21, 444.22, 445.01, 445.02
Other Arteries Excluding Precerebral and Cerebral Arteries
444.81, 444.89, 444.9, 445.81, 445.89, 449, 593.81
Venous Embolism and Thrombosis Lower Extremity Venous Embolism and Thrombosis
453.40, 453.41, 453.42
Renal Vein Embolism and Thrombosis
453.3
Other Venous Embolism and Thrombosis
453.2, 453.6, 453.81, 453.82, 453.83, 453.84, 453.85, 453.86, 453.87, 453.89, 453.9
Phlebitis and Thrombophlebitis Lower Extremity Phlebitis and Thrombophlebitis
451.0, 451.11, 451.19, 451.2
Upper Extremity Phlebitis and Thrombophlebitis
451.82, 451.83, 451.84
Other Vessel Phlebitis and Thrombophlebitis
451.81, 451.89, 451.9
Occlusion and Stenosis Precerebral Artery Occlusion and Stenosis
433.00, 433.20, 433.30, 433.80, 433.90
Cerebral Artery Occlusion and Stenosis
433.10, 434.00, 434.10, 434.90
Retinal Artery Occlusion and Visual Loss
362.30, 362.31, 362.32, 362.33, 362.34, 362.35, 362.36, 362.37, 368.11, 368.12, 368.40
Stroke Ischemic Stroke
433.01, 433.11, 433.21, 433.31, 433.81, 433.91, 434.01, 434.11, 434.91
Hemorrhagic Stroke
430, 431, 432.0, 432.1, 432.9
Transient Cerebral Ischemia
435.0, 435.1, 435.2, 435.3, 435.8, 435.9
Postoperative Stroke
997.02
Other Diseases and Symptoms of the Circulatory System 398.90, 398.99, 414.8, 414.9, 423.0, 429.3, 429.82, 429.89, 429.9, 785.0, 785.1, 785.3, V533.1, V533.2, V533.9
RESPIRATORY SYSTEM Pulmonary Embolism and Infarction
Pulmonary Embolism and Infarction
415.0, 415.12, 415.13, 415.19
PHC4 Cardiac Surgery Report January 1, 2014 through March 31, 2016 Data Technical Notes
APPENDIX B. ICD-9-CM DEFINITIONS FOR REASONS FOR READMISSION (CONTINUED)
A-5
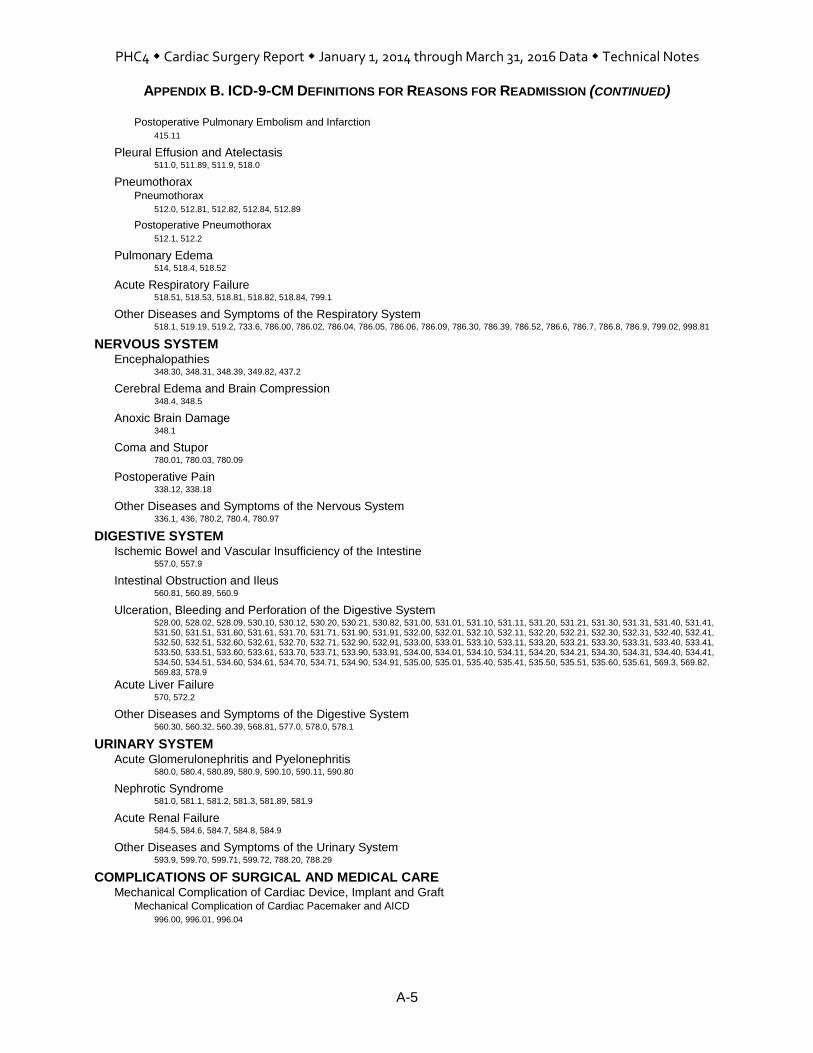
Postoperative Pulmonary Embolism and Infarction
415.11
Pleural Effusion and Atelectasis 511.0, 511.89, 511.9, 518.0
Pneumothorax Pneumothorax
512.0, 512.81, 512.82, 512.84, 512.89
Postoperative Pneumothorax
512.1, 512.2
Pulmonary Edema 514, 518.4, 518.52
Acute Respiratory Failure 518.51, 518.53, 518.81, 518.82, 518.84, 799.1
Other Diseases and Symptoms of the Respiratory System 518.1, 519.19, 519.2, 733.6, 786.00, 786.02, 786.04, 786.05, 786.06, 786.09, 786.30, 786.39, 786.52, 786.6, 786.7, 786.8, 786.9, 799.02, 998.81
NERVOUS SYSTEM Encephalopathies
348.30, 348.31, 348.39, 349.82, 437.2
Cerebral Edema and Brain Compression 348.4, 348.5
Anoxic Brain Damage 348.1
Coma and Stupor 780.01, 780.03, 780.09
Postoperative Pain 338.12, 338.18
Other Diseases and Symptoms of the Nervous System 336.1, 436, 780.2, 780.4, 780.97
DIGESTIVE SYSTEM Ischemic Bowel and Vascular Insufficiency of the Intestine
557.0, 557.9
Intestinal Obstruction and Ileus 560.81, 560.89, 560.9
Ulceration, Bleeding and Perforation of the Digestive System 528.00, 528.02, 528.09, 530.10, 530.12, 530.20, 530.21, 530.82, 531.00, 531.01, 531.10, 531.11, 531.20, 531.21, 531.30, 531.31, 531.40, 531.41, 531.50, 531.51, 531.60, 531.61, 531.70, 531.71, 531.90, 531.91, 532.00, 532.01, 532.10, 532.11, 532.20, 532.21, 532.30, 532.31, 532.40, 532.41, 532.50, 532.51, 532.60, 532.61, 532.70, 532.71, 532.90, 532.91, 533.00, 533.01, 533.10, 533.11, 533.20, 533.21, 533.30, 533.31, 533.40, 533.41, 533.50, 533.51, 533.60, 533.61, 533.70, 533.71, 533.90, 533.91, 534.00, 534.01, 534.10, 534.11, 534.20, 534.21, 534.30, 534.31, 534.40, 534.41, 534.50, 534.51, 534.60, 534.61, 534.70, 534.71, 534.90, 534.91, 535.00, 535.01, 535.40, 535.41, 535.50, 535.51, 535.60, 535.61, 569.3, 569.82, 569.83, 578.9
Acute Liver Failure 570, 572.2
Other Diseases and Symptoms of the Digestive System 560.30, 560.32, 560.39, 568.81, 577.0, 578.0, 578.1
URINARY SYSTEM Acute Glomerulonephritis and Pyelonephritis
580.0, 580.4, 580.89, 580.9, 590.10, 590.11, 590.80
Nephrotic Syndrome 581.0, 581.1, 581.2, 581.3, 581.89, 581.9
Acute Renal Failure 584.5, 584.6, 584.7, 584.8, 584.9
Other Diseases and Symptoms of the Urinary System 593.9, 599.70, 599.71, 599.72, 788.20, 788.29
COMPLICATIONS OF SURGICAL AND MEDICAL CARE Mechanical Complication of Cardiac Device, Implant and Graft
Mechanical Complication of Cardiac Pacemaker and AICD
996.00, 996.01, 996.04

PHC4 Cardiac Surgery Report January 1, 2014 through March 31, 2016 Data Technical Notes
APPENDIX B. ICD-9-CM DEFINITIONS FOR REASONS FOR READMISSION (CONTINUED)
A-6
Mechanical Complication of Heart Valve Prosthesis
996.02
Mechanical Complication of Coronary Artery Bypass Graft
996.03
Other and Unspecified Mechanical Complication
996.09, 996.1
Other Complication of Internal Prosthetic Device, Implant and Graft Other Complication of Heart Valve Prosthesis
996.71
Other Complication of Other Cardiac Device, Implant and Graft
996.72
Other Complication of Vascular Device, Implant and Graft
996.74
Shock Postoperative Shock
998.00, 998.01, 998.02, 998.09
Cardiogenic Shock
785.51
Other Shock
785.50, 785.59
Hemorrhage and Hematoma Complicating a Procedure 459.0, 998.11, 998.12, 998.13
Foreign Body Accidentally Left or Accidental Laceration During a Procedure 998.2, 998.4, 998.7
Dehiscence and Rupture of Operation Wound 998.31, 998.32, 998.6, 998.83
Other Complications of Surgical and Medical Care Nervous System Complication
997.00, 997.01, 997.09
Circulatory System Complication
997.1, 997.2, 997.71, 997.72, 997.79, 999.1, 999.2
Respiratory System Complication
519.00, 519.02, 519.09, 997.39
Digestive System Complication
536.40, 536.42, 536.49, 997.49
Urinary System Complication
997.5
Other Complications
998.89, 998.9, 999.60, 999.61, 999.62, 999.63, 999.69, 999.70, 999.71, 999.72, 999.73, 999.74, 999.75, 999.76, 999.77, 999.78, 999.79, 999.80, 999.82, 999.83, 999.84, 999.85, 999.88, 999.89
INFECTIONS Postoperative Infections
997.31, 998.51, 998.59, 999.31, 999.32, 999.33, 999.34, 999.39
Sepsis and Bacteremia 038.0, 038.10, 038.11, 038.12, 038.19, 038.2, 038.3, 038.40, 038.41, 038.42, 038.43, 038.44, 038.49, 038.8, 038.9, 785.52, 790.7, 995.90, 995.91, 995.92
Pneumonia Pneumonia
481, 482.0, 482.1, 482.2, 482.30, 482.31, 482.32, 482.39, 482.40, 482.41, 482.42, 482.49, 482.81, 482.82, 482.83, 482.84, 482.89, 482.9, 485, 486, 511.1
Aspiration Pneumonia
507.0, 997.32
Empyema and Abscess of Lung 510.0, 510.9, 513.0, 513.1
Infection due to Device, Implant and Graft Cardiac Device, Implant and Graft
996.61
Vascular Device, Implant and Graft
996.62

PHC4 Cardiac Surgery Report January 1, 2014 through March 31, 2016 Data Technical Notes
APPENDIX B. ICD-9-CM DEFINITIONS FOR REASONS FOR READMISSION (CONTINUED)
A-7
Other and Unspecified Infections due to Device, Implant and Graft
519.01, 536.41
Urinary Tract Infection 590.3, 590.9, 595.0, 599.0, 996.64
Cellulitis 681.00, 681.01, 681.02, 681.10, 681.11, 681.9, 682.0, 682.1, 682.2, 682.3, 682.4, 682.5, 682.6, 682.7, 682.8, 682.9
Osteomyelitis 730.03, 730.06, 730.07, 730.08, 730.09
Intestinal Infection due to Clostridium difficile 008.45
Other Infection Related Conditions and Symptoms 567.21, 567.29, 567.9, 590.2, 780.60, 780.61, 780.62, 780.66
FLUID AND ELECTROLYTE IMBALANCE Hyperosmolality and Hyposmolality
276.0, 276.1
Acidosis and Alkalosis 276.2, 276.3, 276.4
Dehydration and Hypovolemia 276.50, 276.51, 276.52
Fluid Overload 276.61, 276.69
Hyperpotassemia and Hypopotassemia 276.7, 276.8
Other Electrolyte and Fluid Disorders 276.9
ANEMIA AND COAGULATION DEFECTS Anemia
Acute Posthemorrhagic Anemia
285.1
Anemia
280.0, 285.9
Coagulation Defects Thrombocytopenia
287.41, 287.49, 287.5, 289.84, 446.6
Other Coagulation Defects
286.6, 286.9, 289.82, 790.92

PHC4 Cardiac Surgery Report January 1, 2014 through March 31, 2016 Data Technical Notes
APPENDIX C. POTENTIAL CODE-BASED RISK FACTORS
A-8
See complete definition of ICD-9-CM and ICD-10-CM/PCS codes at http://www.phc4.org/reports/cabg/16/data/CardiacSurgeryReport2014-2016RiskFactorsICD-9-ICD-10Dataset.xlsx.
POTENTIAL CODE-BASED RISK FACTORS
Acidosis and Alkalosis on Admission Heart Valve Disease
Acidosis on Admission Heart Valve Disease, Rheumatic
Acute Liver Failure on Admission History of CABG and Valve Surgery
Acute Myocardial Infarction (AMI) as Principal Diagnosis History of Cancer
Acute Respiratory Failure on Admission History of Coronary Artery Angioplasty and Stent
Alcohol-related Disorders History of Defibrillator and Pacemaker
Alkalosis on Admission History of Long-term Insulin Use
Anemia History of Long-term Steroid Use
Angina History of Long-term Use of Anticoagulants and Antiplatelets
Angina, Unstable History of Lower Extremity Amputation
Angioplasty and Stenting of Coronary Artery Prior to First CABG/Valve Surgery Date
History of Non-Compliance with Medical Treatment
Angioplasty and Stenting of Coronary Artery Same Day as First CABG/Valve Surgery
History of Stroke
Asthma History of Thrombosis and Embolism
Atrial Fibrillation and Flutter on Admission Hypercholesterolemia
Cancer Hypertension
Cardiac Adhesions Hypoxemia on Admission
Cardiac Arrest on Admission Immunity Disorders
Cardiomyopathy Intra-aortic Balloon Pump (IABP) Prior to First CABG/Valve Surgery Date
Cerebrovascular Disease Ischemic Heart Disease
Chronic Kidney Disease Lupus Erythematosus - Systemic
Chronic Liver Disease Malnutrition
Chronic Lung Disease Mechanical Circulatory Support Device Prior to First CABG/Valve Surgery Date
Chronic Pulmonary Hypertension Mental Disorders
Coagulopathy Myocardial Infarction, Old
Congenital Heart Anomalies Nicotine Dependence
Coronary Artery Disease of Native Vessels Non-Invasive Mechanical Ventilation (NIMV) Prior to First CABG/Valve Surgery Date
Crohn's Disease and Regional Enteritis Obesity
Dementia and Cerebral Degeneration Obstructive Sleep Apnea
Dental Extraction Prior to First CABG/Valve Surgery Date Osteoporosis
Destruction, Excision, and Occlusion of Left Atrial Appendage Same Day as First CABG/Valve Surgery
Oxygen Therapy Dependence (long-term)
Destruction of Other Heart Lesion (Maze) Same Day as First CABG/Valve Surgery
Percutaneous and Transapical Valve Procedures Prior to First CABG/Valve Surgery Date
Diabetes Percutaneous and Transapical Valve Procedures Same Day as First CABG/Valve Surgery
Drug-related Disorders Peripheral Vascular Disease
Electrolyte Imbalance on Admission Type of Valve Procedure - Annuloplasty, Same Day as First CABG/Valve Surgery
Encephalopathy on Admission Type of Valve Procedure - Aortic Valve, Same Day as First CABG/Valve Surgery
Environmental and Economic Factors Type of Valve Procedure - Mitral Valve, Same Day as First CABG/Valve Surgery
Extracorporeal Membrane Oxygenation (ECMO) Prior to First CABG/Valve Surgery Date
Type of Valve Procedure - Pulmonary Valve, Same Day as First CABG/Valve Surgery
Gastroparesis Type of Valve Procedure - Tricuspid Valve, Same Day as First CABG/Valve Surgery
Gout Valve Procedure - Multiple, Same Day as First CABG/Valve Surgery
Heart Failure Valve Procedure - Replacement Same Day as First CABG/Valve Surgery

PHC4 Cardiac Surgery Report January 1, 2014 through March 31, 2016 Data Technical Notes
APPENDIX D. EXAMPLE OF LOGISTIC REGRESSION AND CALCULATING STATISTICAL RATINGS
A-9
Total Cases:
Number of hospitalizations after exclusions.
Actual Deaths: Total number of deaths (death is a discharge status equal to 20).
Rate: Total number of deaths / Total number of cases.
Expected Deaths: Sum of each patient’s probability of death (PD).
Rate: Sum of each patient’s probability of death (PD) / Total number of cases.
To calculate a patient’s probability of death:
Step 1: Calculate βX:
βX = -6.8555 + 0.9592 (Valve with CABG) + 0.0133 (Age) +. . . + 1.1874 (Preoperative Cardiogenic Shock) + . . . + 0.8066 (Chronic Liver Disease) + coefficient (other variables in in-hospital mortality model) . . .
Step 2: Calculate the estimated probability of death (PD) using βX:
PD = eβX
/ (1 + eβX
) where e 2.7182818285
Test Statistic: z = (Actual Deaths – Expected Deaths) / Standard Deviation of Mortality
To compute Standard Deviation of Mortality:
Step 1: Compute the estimated variance of each patient’s probability of death (VARPAT):
VARPAT = (PD) (1-PD)
Step 2: Calculate the Standard Deviation of Mortality
SUMVAR = sum of VARPAT across all cases
Standard Deviation of Mortality = square root of SUMVAR
p-value: (two sided)
Calculated using test statistic as a normal z-score
Statistical Rating:
If p-value <0.05 and test statistic >0, then more deaths than expected (denoted as “”) If p-value <0.05 and test statistic <0, then fewer deaths than expected (denoted as “”) Otherwise, the number of deaths were within the expected range (denoted as “”)
Expected Range:
Lower limit = Expected Deaths – 1.960 (Standard Deviation of Mortality) Upper limit = Expected Deaths + 1.960 (Standard Deviation of Mortality)

PHC4 Cardiac Surgery Report January 1, 2014 through March 31, 2016 Data Technical Notes
APPENDIX E. EXAMPLE OF CASE-MIX ADJUSTMENT
A-10
Region 1: Southwestern PA Procedure Group: Valve without CABG
Total Cases: Number of hospitalizations for a hospital after exclusions (equal to n). Actual Charge: Average actual charges for a hospital (Average ActChg). Expected Charge: Average expected charges for a hospital (Average ExpChg). Step 1: Calculate each hospitalization’s expected charge (ExpChg):
ExpChg = the expected charge for a hospitalization, which is equal to the average charge for all hospitalizations (after exclusion) in the hospital’s same region and MS-DRG group within the procedure group and timeframe.
Region 1 - Southwestern PA, valve without CABG, DRG Group 5, Timeframe A
1: $281,363
or Region 1 - Southwestern PA, valve without CABG, DRG Group 6, Timeframe A
1: $198,818
or Region 1 - Southwestern PA, valve without CABG, DRG Group 5, Timeframe B
2: $233,750
or Region 1 - Southwestern PA, valve without CABG, DRG Group 6, Timeframe B
2: $193,021
Step 2: Calculate the average ExpChg for a hospital (expected charge):
Average ExpChg = Σ ExpChg
n
Case-Mix Adjusted Charge:
Average ActChg (Region 1 Average Actual Charge)
Average ExpChg
1 Timeframe A = Calendar year 2014
2 Timeframe B = Calendar year 2015 and Quarter 1, 2016

Recommended