Tax Rates and Tax Evasion: Evidence from “Missing Imports” in China
Raymond Fisman* Columbia Business School
Shang-Jin Wei**
IMF, Brookings Institution, Harvard University and NBER
First Draft: March 1, 2001 This Draft: November 30, 2001
Abstract
Tax evasion, by its very nature, is difficult to observe. In this paper, we examine tax evasion in China using a new technique: by comparing the values that China reports as imports from Hong Kong, with what Hong Kong reports as exports to China. Since our data are at a very disaggregated level of individual products, we can measure evasion relatively precisely. Matching up this ‘evasion gap’ with the tariff (and VAT tax) schedule at the product level, we examine the effect of tax rates on tax evasion. The result is striking: using data from 1998, we find that on average, a 1 percent increase in the tax rate is associated with a 3 percent increase in evasion. The result is similar when a first-difference specification is used with data from 1997 and 1998. This relationship is nonlinear: the evasion elasticity is larger at higher tax levels. Furthermore, the evasion gap is negatively correlated with tax rates on closely related products, suggesting that evasion takes place partly through misreporting of the type of imports, in addition to under-reporting the value of imports. This effect is even more pronounced when the evasion gap is measured using quantities rather than values. JEL Classification: H2, F1 Key Words: Tax evasion, Laffer curve, corruption _______________ * Assistant Professor, 614 Uris Hall, Graduate School of Business, Columbia University, New York, NY 10027, phone: (212) 854-9157; fax: (212) 316-9219; email:[email protected]. ** Advisor, International Monetary Fund; New Century Chair in International Economics, Brookings Institution; Research Fellow, Harvard University’s Center for International Development, and Faculty Research Fellow, NBER. 1775 Massachusetts Ave., Room 731, Washington, DC 20036, phone: 202/797-6023, fax: 202/797-6181, [email protected]. We thank Jerzy T. Rozanski, Zhi Wang, and Yi Wu for help with extracting the data, Bill Gale, Jim Hines, Nick Lardy, Sung Yung-Wing, and seminar participants at an NBER meeting, the World Bank, Harvard University, the University of Toronto, and the University of Southern California for helpful discussion and Hayden Smith for editorial assistance. All remaining errors that have evaded our attention are exclusively our responsibility.
2
1. Introduction
This paper studies the responsiveness of tax evasion to tax rates. Much of the
work in the theory and empirics of taxation has taken tax collection as given and often
costlessly executed. This simplification is unlikely to be realistic: even within the United
States, where tax collection is considered to be relatively efficient, about 17 percent of
income taxes are estimated as unpaid (Slemrod and Yitzhaki, 2000). One particularly
important issue, from both theoretical and policymaking perspectives, is understanding
the relationship between tax rates and tax evasion. A number of models have evolved to
incorporate tax evasion, but these models fail to provide a clear prediction regarding the
impact of tax rates on evasion. In the pioneering work of Allingham and Sandmo (1972),
the relationship between tax rates and evasion is positive, but this depends on particular
assumptions of risk aversion and the punishment for evasion. A broader review of the
literature reports that, more generally, theoretical predictions of the effect of tax rates on
evasion are highly sensitive to modeling assumptions (Slemrod and Yitzhaki, 2000).1
Furthermore, even if we believe that increased tax rates will encourage greater evasion,
there is still a need to assess the magnitude of this effect. Hence, empirically examining
the effect of tax rates on evasion would be very useful from the perspectives of both
theory and policy. This has proven to be a challenging task due to the difficulties in
measuring evasion, which by definition is not directly observed.
A number of indirect approaches have been used to infer the behavior of tax
evasion from measurable quantities such as currency demand or the discrepancies
between national income and product accounts (e.g., Gutmann, 1977, Feige, 1979, Tanzi,
1980). These approaches have been criticized by Slemrod and Yitzhaki in their survey
paper on the subject, since “[n]one of these approaches is likely to be reliable…as their
accuracy depends either on unverifiable assumptions or on how well the demand for
currency is estimated” (Slemrod and Yitzhaki, 2000). Furthermore, these approaches do
not naturally generate an estimate of the responsiveness of evasion to tax rates.
1 Some models even yield strong predictions that run counter to the conventional wisdom that higher tax rates increase evasion. For example, the model of Yitzhaki (1974) predicts that if the punishment for
3
As a more direct approach to examining tax evasion, researchers have used data
from the U.S. Taxpayer Compliance Measurement Program (TCMP) conducted by the
U.S. Internal Revenue Service. Based on intensive audits of a random sample of tax
returns, the data set gives information on reported taxable income and what auditors later
conclude to be true taxable income. Using these data, Clotfelter (1983) estimated that tax
evasion is positively associated with tax rates, with the elasticity ranging from 0.5 to 3.
Feinstein (1991), using a short panel of two years of TCMP data (1982 and 1985), found
that increasing the marginal tax rate has a negative effect on evasion, contradicting
Clotfelter’s conclusion. However, the main source of variation on tax rates in both of
these studies comes from differential marginal tax rates across income levels, so it is not
really possible to disentangle tax rate effects from income effects.
In this paper, we take a new approach in measuring the effect of tax rates on
evasion that is less likely to be contaminated by such problems. Specifically, we examine
evasion in China’s imports from Hong Kong, at a very disaggregated level (e.g., four-
door passenger car), by comparing Hong Kong’s reported exports and China’s reported
imports of the same products. In the absence of evasion (and measurement error), China
and Hong Kong-reported numbers should be the same. So far, the extent to which they
differ has generally been taken to be simple measurement error (see, for example,
Feenstra and Hanson, 2000). However, when we match these data up with product-
specific tax rates in China (tariff plus value-added tax rates), we find that this 'evasion
gap' is highly correlated with Chinese tax rates: much more value is 'lost' for products
with higher tax rates. Our methodology is related to that of Pritchett and Sethi (1994),
who find that tax revenues divided by imports increase at a rate less than the official tax
rate, in a sample of four developing countries. Note, however, that our analysis is at a
much higher level of disaggregation; furthermore, they are unable to disentangle illegal
tax evasion from legal tax avoidance (e.g., taking advantage of tax loopholes and special
exemption). Tax avoidance, as it is legal, is more readily observed than evasion.2
evasion is dependent on the value of taxes evaded (as is the case in China), tax rate increases will reduce evasion. 2 We note, finally, that there is a considerable literature on efforts by multinationals to reduce tax payments through methods such as transfer pricing and the allocation of profits across countries according to their tax rates (see, for example, Clausing, 1998; Bernard and Weiner, 1990). Once again, however, this literature examines tax avoidance rather than tax evasion.
4
Another novel feature of our study is that we are able to differentiate three
different aspects of tax evasion: under-reporting of unit value, under-reporting of taxable
quantities, and the mislabeling of higher-taxed products as lower-taxed products. We
find strong evidence of mislabeling and limited evidence of under-reporting of unit value;
on the other hand, once shifting reported imports from a higher- to a lower-taxed
category is controlled for, we do not find evidence of under-reporting of overall imported
quantities.3 In looking at the effects of changes in tax rates between 1997 and 1998 on
changes in evasion, we obtain similar results. Finally, when we use a flexible functional
form, we find that tax evasion occurs mostly at higher tax rates. The rest of the paper is
organized as follows: Section 2 describes the data on taxes and imports/exports. Section
3 provides the details of our empirical specification and the results. Finally, Section 4
concludes.
2. Data
The trade flow data in this paper are taken from the World Bank's World
Integrated Trade Solution (WITS) database, which in turn is derived from the United
Nations' Comtrade database. These data are collected by the United Nations Statistical
Division from individual countries' trade records, and include information on imports and
exports for each country, recorded according to the 6-digit Harmonized Commodity
Description and Coding System (HS). The United Nations allows individual countries to
have a classification system more detailed than the HS 6 digit levels. In the case of
China, an 8-digit classification (a refined version of the HS 6-digit classification) is
available. However, we choose to use the import data at the 6-digit level in order to be
compatible with Hong Kong-reported numbers. The current HS classification system
began in 1996, which is also the earliest year for which we have year-end data on tax
rates.
For every product that China imports from Hong Kong, we define Export_Value
as the value of exports reported by Hong Kong destined for China and Import_Value as
3 Of course, outright smuggling that evades both Hong Kong and China’s customs is not captured in our data set.
5
the value of imports reported by China arriving from Hong Kong. The original sample
contained 5113 products at the 6-digit classification level in 1998. However, there were
missing observations for 2820 classifications for either imports or exports.4 Of those
remaining, a further 250 did not have consistent tax rates at the 6-digit level, and were
also omitted, leaving a final sample of 2043. Some regressions involve fewer
observations due to missing observations on other regressors (details provided in Section
3).
Because of Hong Kong's proximity to China and its special status as a former
colony, it also does a considerable amount of indirect trade on behalf of other economies
(including Taiwan).5 Hong Kong reports (in the Comtrade database) separate data on
indirect as well as direct exports destined for China. China, on the other hand, only
reports what it considers to be direct imports from Hong Kong. Indirect imports (say
from the U.S. via Hong Kong) are aggregated, in principle, with direct imports from the
source country and are reported as part of the imports from that source country. Thus, in
theory, China-reported imports from Hong Kong should match up to Hong Kong-
reported direct exports to China. However, the data suggests that China cannot always
successfully separate indirect imports from direct imports. One likely source of
confusion is Taiwan’s indirect exports to China via Hong Kong. As the government of
Taiwan does not allow its firms to have direct trade with China, Taiwan’s exports to
China often label Hong Kong as the destination. Sometimes shipping labels are modified
while the goods are en route to Hong Kong or in a warehouse in Hong Kong. At other
times, an intermediary in Hong Kong is used to record the transaction as an import by
Hong Kong from Taiwan plus an export from Hong Kong to China. While the Hong
4 These were almost exclusively missing observations on both imports and exports; where observations were available for imports and not for exports, it is almost certainly the result of misclassified re-exports (see below). When all regressions were repeated, using all observations on exports and redefining Gap_Value = log(1+Export_Value) – log(1+Import_Value), the sample size increased by about 2 percent, and our results were virtually identical to those reported in Section 3 below. 5 Hong Kong's reliance on re-export trade has created the false impression that manufacturing activity is virtually nonexistent in Hong Kong itself. To counter this misconception, we refer to a recent study by the Chinese commercial law firm Johnson, Stokes, and Master (JSM), which described Hong Kong's manufactured exports as including, "a wide range of products including clothing, electronics, watches & clocks, jewelry, textiles and chemicals." Their complete report on Hong Kong may be downloaded from: http://www.hg.org/guide-hongkong.html. Note that if we limit our sample to the industry categories implied by JSM, the implied effect of the tax rate on evasion increases somewhat, and the fit of the regressions improves marginally.
6
Kong customs authorities may understand this as an indirect export to China, China
might misclassify at least a portion of such transactions as being direct imports from
Hong Kong. 6 It is important to note that, as the tariff and VAT rates are the same for a
given product whether it is a direct or indirect import from Hong Kong, there is no tax
advantage to mis-reporting between direct and indirect imports. We will return to this
issue later.
Comtrade contains data on both the value and quantity of imports/exports; we will
utilize both sets of data. In the case of quantities, we are also required to know the units
of measurement (e.g., weight, number; area); in most cases, these values match up
between the Chinese (import) and Hong Kong (export) data. Where they do not, it is
primarily because China reports the weight of imports, while Hong Kong reports the
number of units. These observations are not included in the quantity regressions. We
define Export_Qty to be the total quantity of exports from Hong Kong destined for China
as reported by Hong Kong and Import_Qty to be the total quantity of imports reported by
Chinese customs from Hong Kong into China.
Our basic definition of the evasion gap is given by:
Gap_Value = log(Export_Value) – log(Import_Value)
Thus defined, a larger gap is an indication of greater evasion. We similarly define the
gap in quantities reported as:
Gap_Qty = log(Export_Qty) – log(Import_Qty)
The data on Chinese tariffs and taxes were also taken from WITS, derived from
the UNCTAD TRAINS (Trade Analysis and Information System) database, which gives
tariff rates at the 8-digit HS level. Since our import/export data are at the 6-digit level,
we need some way of aggregating up the tariff rates to the 6-digit level. Fortunately,
there is relatively little variation in tax rates at the 6-digit level, so we are able to restrict
7
ourselves to the sample for which there are uniform rates at this level of aggregation.7 In
addition to tariffs, there is a value-added tax levied on most imports, which varies from
13 to 17 percent. Our measure of taxation, Tax1998, is the sum of tariff and VAT tax.8
The earliest year for which we have data on tariffs is 1996, and our data reflect
year-end tariff rates. Unfortunately, due to constantly shifting tariff rates in China
throughout the years 1992-97, the appropriate tax rate to be utilized is unclear for this
period (Lardy, 2000). In our benchmark regressions, we therefore report results
utilizing data from 1998, the most recent year for which data were available on both
imports and exports. As an extension, we also implement regressions using two years of
data (1997 and 1998). We will explain the construction of the 1997 tax rate later in the
paper.
Part of evasion may take place by mislabeling imported products from a higher-
taxed to a lower-taxed type. It is reasonable to assume that this type of mis-labeling is
easier for “similar” products. Operationally, two products are considered “similar” if
they are in the same 4-digit category. We define Avg(Tax_o) to be the average level of
Tax for all other products in a good’s 4-digit class, weighted by Export_Value. For a full
list of variables, definitions, and sources, see the Appendix.
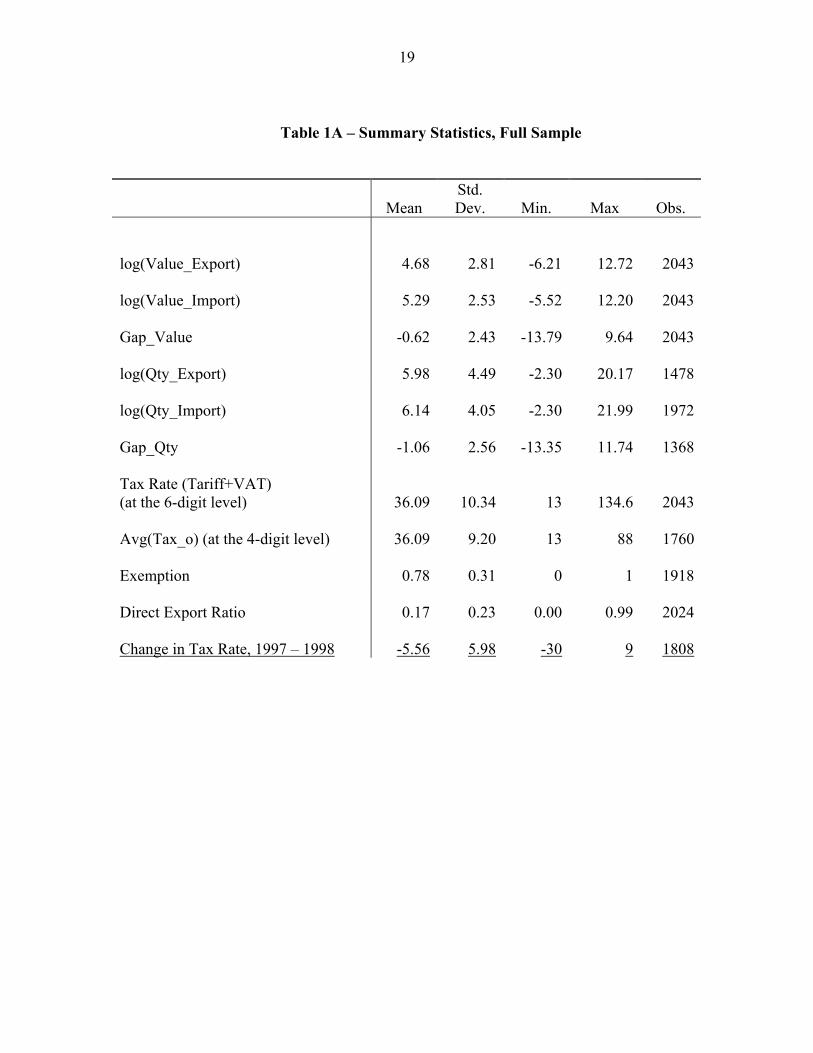
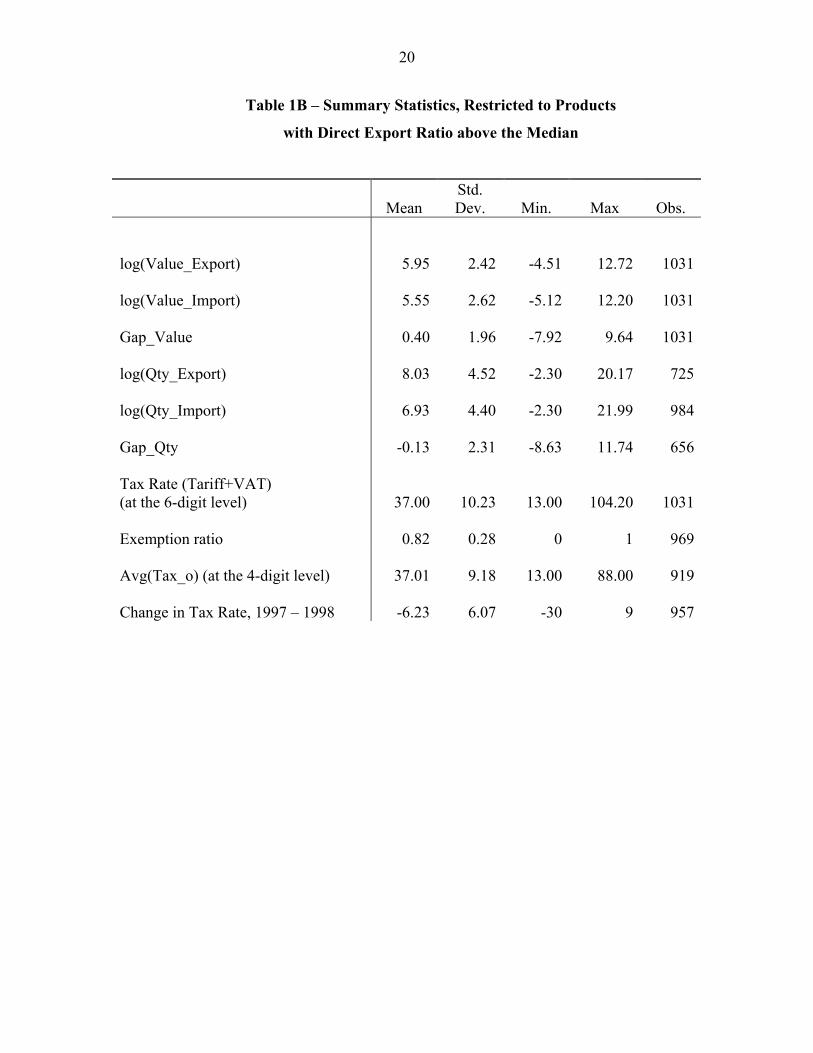
Summary statistics for our variables are contained in Table 1A. One point to note
is that the so-called evasion gap actually has a negative mean. This appears to be due to
Chinese customs misattributing some portion of indirect imports as direct imports. In
fact, when we exclude observations for which the ratio of direct to indirect exports (based
on Hong Kong’s reporting) is very low, the evasion gap quickly rises above zero (see
Table 1B). We will further discuss the complications that this may create later. Also note
6 We thank Professor SUNG Yung-Wing at the Chinese University in Hong Kong for a helpful discussion on this issue. 7 We may also utilize the full sample, by using the simple mean or median tariff rate for each 6-digit industry. However, since we do not know the composition of imports, this may add considerable noise to our tariff rate measurement. When we include products for which there is tariff variation at the 6-digit level, all results are weakened slightly (generally by a few percent), consistent with our measurement error interpretation. 8 We argue that the sum of tariffs and the VAT is the most appropriate measure: if an importer already under-reports the value of a particular product, she would also evade the associated VAT. If a car is smuggled into the country without paying the tariff, it is reasonably likely to be sold on the black market without paying the VAT. However, as a robustness check, we have also replicated the key regressions when we restrict the tax variable to include only the tariff rate at the customs, but not the VAT. The results are virtually identical to those reported in the main text.
8
that the evasion gap is higher when measured in values rather than quantities; this is
suggestive that some evasion takes the form of under-reporting of per unit values.
3. Empirical Analysis
Benchmark specification
We begin by defining the following: Exportk = Hong Kong reported direct
exports of good k to China (which we take as the true import of good k by China from
Hong Kong). Importk = Direct imports of good k by China from Hong Kong as reported
to Chinese Customs.
The prediction that we will be examining in the empirical test is that the
difference between reported exports and imports is increasing in the tax rate, due to
evasion. That is:
(1) log(Exportk ) - log(Importk )= α + β Taxk + εk
Tax-induced evasion implies that β>0. Unfortunately, because China cannot
always accurately separate indirect imports (e.g., U.S. exports to China passing through
Hong Kong) from genuine direct imports from Hong Kong, we do not observe Importk
directly.9 Instead, China’s recorded imports from Hong Kong, Import*k, contains part of
indirect imports misclassified as direct imports. In other words, we actually observe the
following:
(2) Import*k = Importk + Misclassified Indirect Importk .
It is crucial to note that the same tax rate is applicable to both direct and indirect
imports. Therefore, the magnitude of the misclassified indirect imports for a particular
9 There are two types of indirect exports passing through Hong Kong to China. The first one, "transshipments," goes straight from ships docked at Hong Kong to trucks destined for China. The second involves a stopover in Hong Kong before being sent to China. The latter is likely where China gets confused about the true exporter.
9
product should be uncorrelated with the tax rate for that product (since there is no tax
advantage from misclassification). Rather, it is plausibly proportional to the magnitude
of the import of that product (subject to some random error). We will assume that
(3) Misclassified Indirect Importk = θ ηk Importk
Where θ is a constant, and ηk is an independent and identical random variable, with
distributional assumptions to be made later. Thus,
(4) Import*k = Importk + Misclassified Indirect Importk
= (1+ θ ηk ) Importk
Combining these four equations, we obtain
(5) log(Exportk ) - log(Import*k )= α* + β Taxk + ek
or equivalently:
Gap_Valuek= α* + β Taxk + ek
where α* is a (new) constant, and ek a composite error term that is assumed to be iid and
normal with a mean of zero and a constant variance. To be more precise, if we denote the
mean of εk – log(1+ θ ηk ) by α0, then,
(6) α* ≡ α - α0
and
(7) ek ≡ εk - log(1+ θ ηk ) - α0 ∼ Normal( 0, σ2e )
10
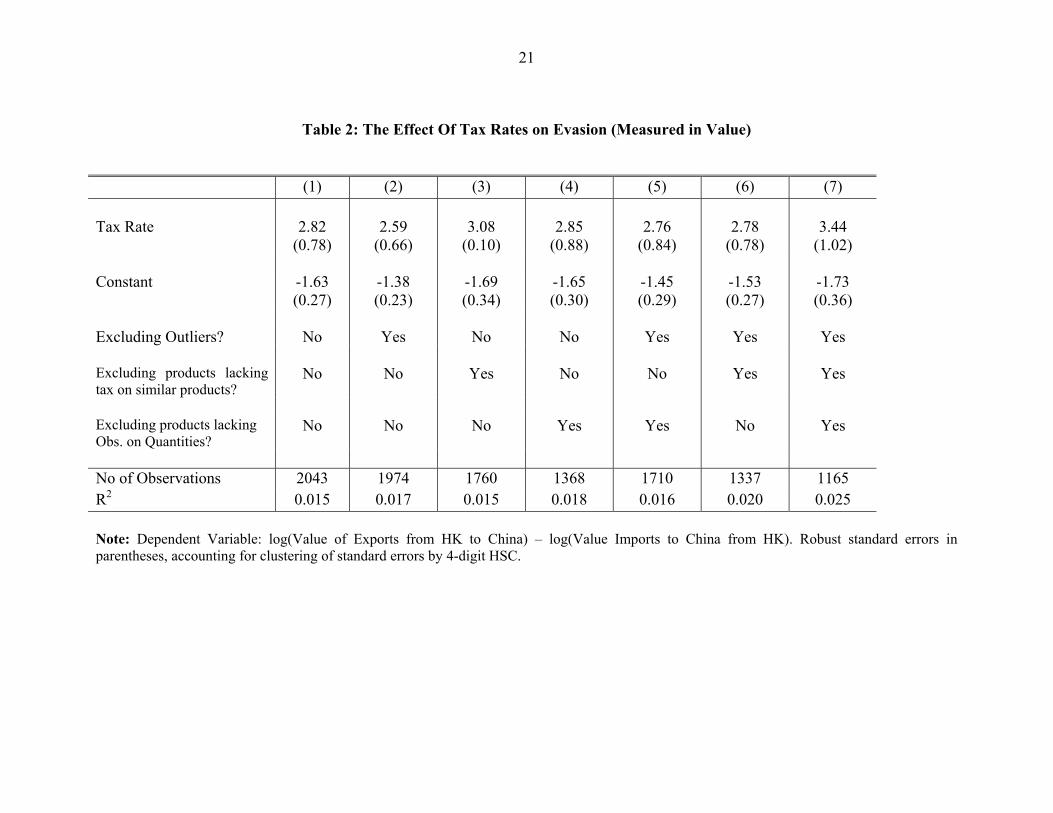
Equation (5) will be the benchmark for our regression specifications. The results
are reported in Table 2. In the first column, we have the basic estimate of the sensitivity
of evasion to tax rates, which is 2.82. That is, if the tax rate increases by one percentage
point, the gap between reported exports and imports increases by about three percent.
When observations with the highest and lowest one percent of values of Gap_Value are
excluded, the coefficient is virtually unchanged, as seen in the second column. In order
to make direct comparisons with other results reported in this paper, we also repeated this
basic specification, using the sample of industries with observations on Avg(Tax_o), and
also limiting the sample to industries with observations on quantities. Changing the
sample in this way has very little impact on the reported coefficient.
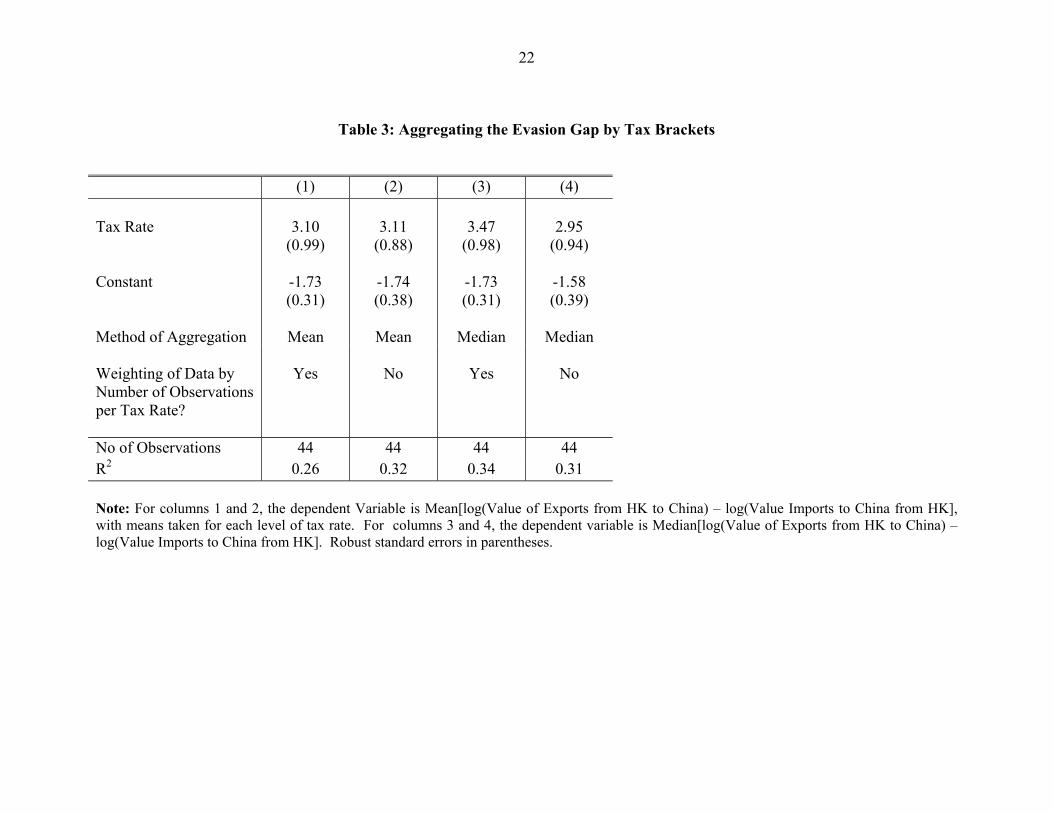
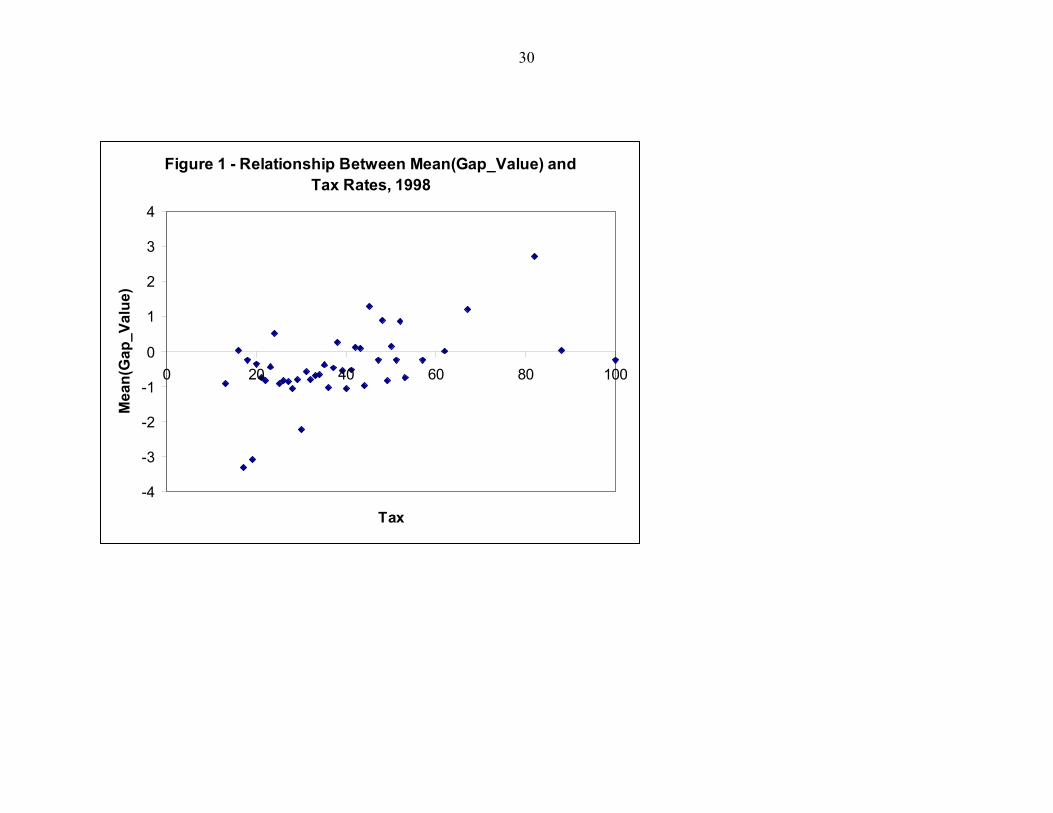
Unfortunately, because of the noise introduced by misclassified indirect imports,
the fit of the regressions might be considered fairly poor. A common method of dealing
with noisy data is aggregation. We follow this approach, using as the outcome variable
the mean value of Gap_Value for each tax rate. There are 44 different tax rates, thereby
yielding a total of 44 observations. The basic relationship between the mean value of
Gap_Value and tax rates is illustrated in Figure 1, and is suggestive of a positive
correlation. Results for the regression weighted by number of observations per tax rate,
as well as the unweighted regression, are listed in Table 3, columns 1 and 2. The
coefficient on Tax, 3.10, is similar to the baseline regressions from Table 2, and is
significant at the one percent level. Moreover, the R2 increases to 0.26. The unweighted
regression yields virtually identical results. Taking means is a linear operation, which
allows for the same interpretation of these coefficients as in Table 2. As an alternative
way to reduce the noise in the data, we also use the median of Gap_Value, for each tax
rate, as the outcome variable. This approach has the advantage of further limiting the
effect of outliers in the data (though the interpretation of the coefficient on Tax is not as
straightforward); the results, reported in columns 3 and 4 of Table 3, are the same as
those obtained from the mean regressions. Again, the point estimate on the tax rate is
approximately 3, and the goodness-of-fit as measured by the adjusted R-squared has
increased to 0.3.
So far, we have concentrated our discussion on the statistical properties of the
estimation. It may be useful at this point to also consider the economic implications of
11
the point estimation in terms of revenue collection. From (1), we can infer how reported
imports may be affected by an increase in the tax rate:
(8) (dImports/dTax) = (dExports/dTax) - β Imports Exports
So, the effect of a tax increase may reduce reported imports through two channels:
by reducing the true imports (i.e., Hong Kong’s exports, the first term in (8)); and by
reducing the fraction of true imports that is reported to Chinese Customs (-β, the second
term in equation (8)). While we do not have a direct estimate of the first term in
Equation (8), it is reasonable to assume that it is negative. Therefore, an estimate of β
equal to 3 percent implies that, for any product whose tax rate exceeds 33.3 percent, a
one-percentage point increase in the tax rate would lead to a more than one-percentage
point reduction in reported imports. The average tax rate on imports (tariff plus VAT) in
China is 36.1 percent (see Table 1). Therefore, one may infer that the average tax rate is
already on the wrong side of the Laffer curve: at the average rate, any increase in the tax
rate would actually produce a reduction in tax revenue.
Evasion by mis-labeling
In addition to underreporting of the value of imports, evasion can also take the
form of mis-labeling -- a higher-taxed good is reported as a lower-taxed variety. To
investigate the existence of this type of evasion, we add the average tax rate of similar
goods as a regressor. For a particular good k, its “similar products” are defined as all
other products in the same 4-digit category. 10 Define Avg(Tax_o) to be the average tax
rate for product k’s similar products, weighted by the value of their Hong Kong-reported
exports. We implement a regression of the following form:
(9) Gap_Valuek = α + β1*Taxk + β2*Avg(Tax_ok) + υk
10 We cannot look at the 5-digit level, because we have only a single observation in each 5-digit class for about 75 percent of the sample. We obtain very similar results to those reported in the main text if aggregation is at the 3-digit level.
12
If there is a significant component of mis-labeling of goods, we expect β2 < 0. In
other words, holding a product's own tax rate constant, the lower the tax rate on product
k’s similar varieties, the greater the incentive to mis-report the import of k as other
similar products.
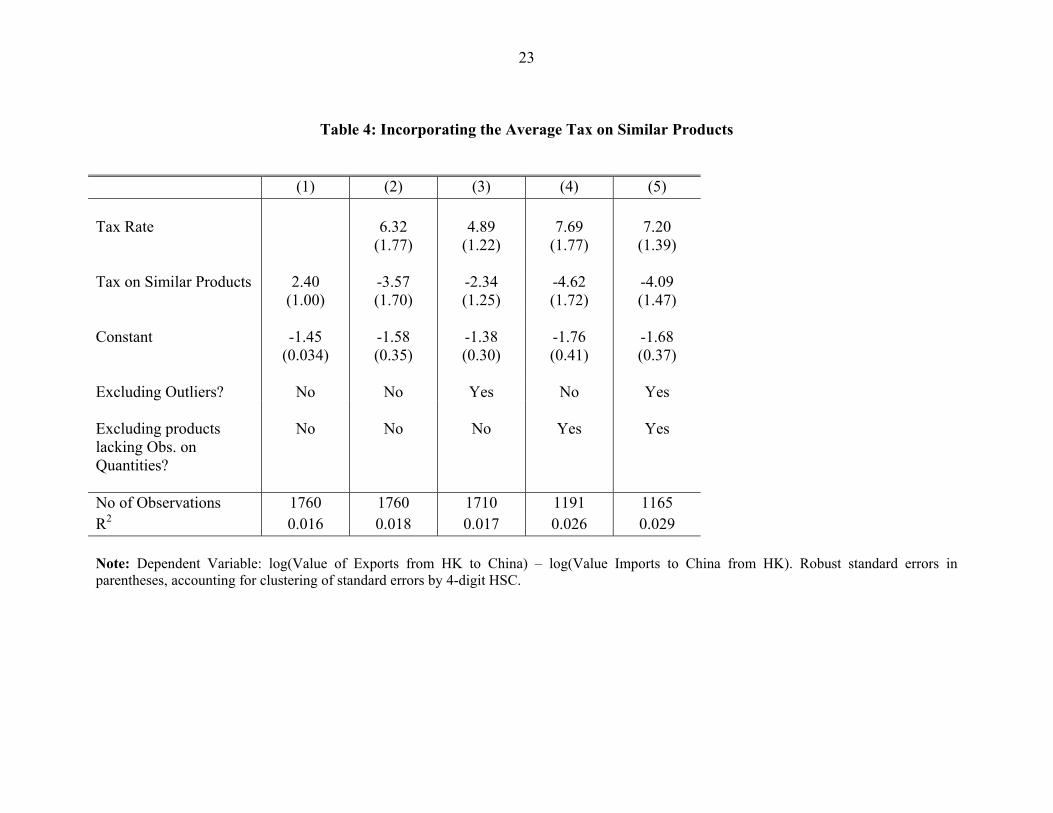
Table 4 reports results with Avg(Tax_o) included as a regressor. Consistent with
the mis-labeling interpretation, we find that the coefficient on Avg(Tax_o) is negative and
significant at the 5 percent level, taking on values between -2.3 and -4.6. Furthermore,
the inclusion of the average tax rate of similar goods as a regressor results in a substantial
increase in the coefficient on Tax, which takes on values of 4.9 to 7.7.
We have also run regressions that replace the average tax rate with the minimum
tax rate among all "similar" products. A possible rationale is that the tax-evader may
want to mis-label the import as the lowest-taxed "similar" product rather than any
"similar" product. However, using the minimum has a number of shortcomings: if only a
relatively small volume of the minimum-tax product is reported leaving Hong Kong, it
may be difficult to mis-label a large volume of imports as this product type.
Furthermore, it may not be the product in the 4-digit class that most readily lends itself to
mislabeling. In any case, empirically, this change in regressor has a very small impact on
the estimated coefficients (results not reported to save space). When both the minimum
and average tariff rates are included in the regressions, the coefficient on the minimum
tariff rate loses its significance, while the coefficient on average tariff rates is relatively
unaffected (results not reported to save space).
Quantity versus unit value
So far, we have not separated the under-reporting of unit values versus the under-
reporting of quantities; both will show up as a positive coefficient on Tax in the value
regressions. We now turn to regressions that use the gap in imported quantity as the
dependent variable. Specifically, we examine the following regressions:
(10) Gap_Qtyk = α + β1*Taxk + υk
(11) Gap_Qtyk = α + β1*Taxk + β2*Avg(Tax_ok) + υk
13
If the under-reporting of quantities is prevalent, we expect to find a positive
coefficient on Taxk in the quantity regression (10), β1 > 0. If there is mis-labeling of
imports from a higher-taxed category to a lower-taxed one, we expect to find β1 > 0 and
β2 < 0.
Results parallel to those of Table 2 and 4, using Gap_Qty as the dependent
variable, are listed in Table 5. Interestingly, when Avg(Tax_o) is excluded from the
regression, the coefficient on Tax is insignificantly different from zero. However, when
Avg(Tax_o) is included, we find that the coefficient on Tax becomes significant, positive,
and approximately equal to the coefficient on Avg(Tax_o) in absolute value. Thus, the
data suggest that under-reporting of the total value of imports and mis-labeling the type
of goods are prevalent, while under-reporting of the total quantities imported across all
tax brackets is not significant.
Tariff exemptions
Many of Hong Kong’s imports into China are exempt from import tariffs. These
exemptions presumably impact incentives for evasion, and could potentially be correlated
with tariff rates, since high tax rates may increase incentives for exemption seeking.11
More precisely, for products where exemptions are common, evasion may be less
sensitive to tax rates than for products where exemptions are rare, since exemptions
provide a legal means of avoiding tax payments.
We now describe how the fraction of imports that is exempt from taxation is
calculated for each of the 6-digit products. First, we obtained data at the 8-digit level on
the exemption status of imports from the Chinese Customs Statistics 1998. These data
also includ the value of China-reported imports from Hong Kong at the 8-digit level,
which were used to calculate a weighted average of the proportion of imports exempt
from tariffs for each 6-digit product, i.e.,
11 In fact, there is a very low correlation between Tax and Exemption.
14
∑∑
∈
∈=
688
6888
6
*
HSHSHS
HSHSHSHS
HS ueImport_Val
ExemptueImport_ValExemption
where Exempt is an indicator variable denoting whether a product is exempt from
import tariffs, HS6 denotes products at the 6-digit level of aggregation, and HS8 denotes
products at the 8-digit level of aggregation. Aggregating in this way is necessary in order
to match to the Hong Kong-reported export data.
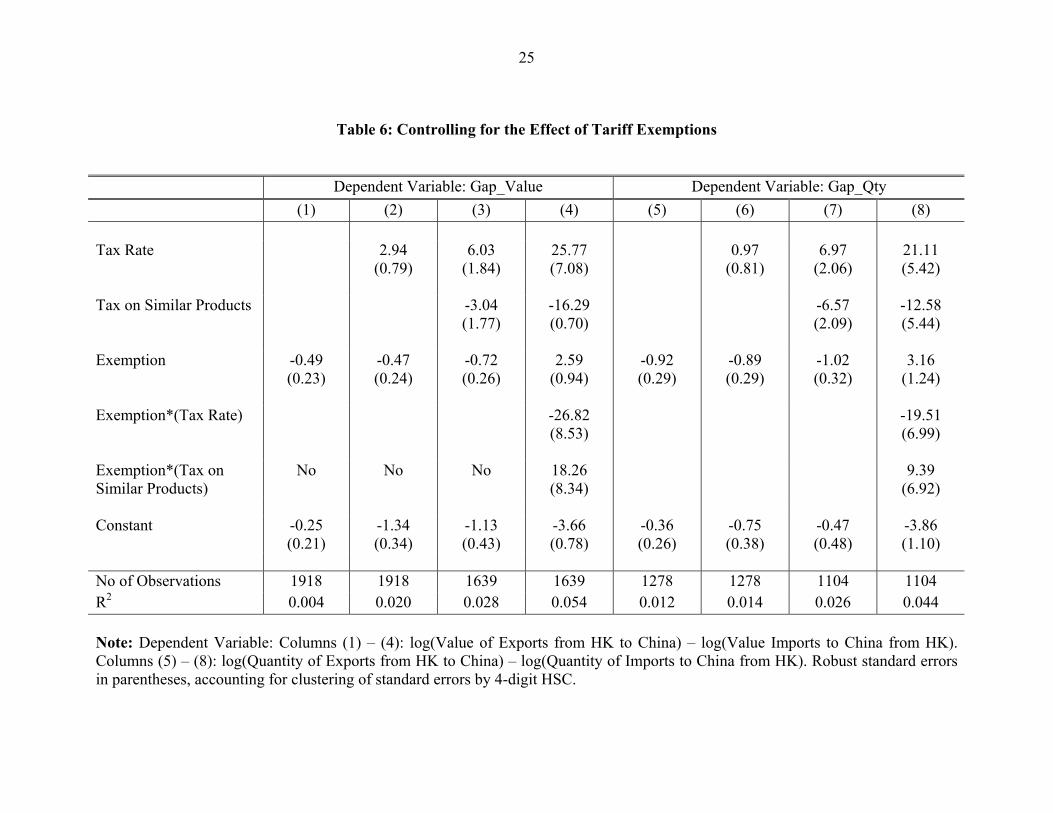
Table 6 shows the results of the following regression:
(12) Gap_Valuek = α + β1*Taxk + β2*Exemptionk + β3* Taxk*Exemptionk
+ β4*Avg(Tax_ok) + β5*Avg(Tax_ok)*Exemptionk + υk
Consistent with higher exemption rates lowering the incentives for evasion, the
coefficient on Exemption is consistently negative and significant (See columns (1) to (4)).
When interacted with Tax, the coefficient is negative, highly significant, and
approximately the same size as the coefficient on Tax. This implies that for a product
with complete exemption in 1998 (i.e., Exemption=1), there is no effect on evasion from
tax increases. By contrast, for industries with no exemptions, the implied elasticity is
about 26 percent.12 In looking at the effect of exemptions on incentives to re-label goods,
we find that the coefficient on Avg(Tax_o)*Exemption is positive, though not significant
at conventional levels (t-statistic of 1.4), implying less re-labeling for goods with high
exemption levels. In columns (5) to (8), we report the results of the same regressions,
using Gap_Qty as the outcome variable, and obtain qualitatively very similar results.
12 This figure seems unreasonably large; if we omit outliers of Gap_Value, the implied elasticity of evasion with respect to taxes drops to 16 percent, while the significance of all coefficients in this regression are more or less unchanged. Also, there may be concerns that, because most of the exemption ratios are relatively high (the 25th percentile of Exemption is 0.68), making inferences about the effects of evasion at Exemption = 0 is too far out of sample. However, when we run regressions comparable to those reported in Table 6, limiting the sample to observations with Exemption < 0.5, we obtain a coefficient on Tax of 22. This suggests that functional form is not driving our results on the interaction of Tax and Exemption.
15
First differences in tax rates
Our primary results suggest a strong effect of taxes on evasion, acting through
both under-pricing and product mis-labeling to lower-taxed categories. There may be
concerns, however, that certain features of different products that are not directly
measured and not included in the regressions may be driving the results. While we do
not have specific factors in mind that may bias our result, to be on the safe side, we now
use two years of data and adopt a first-difference specification that can net out time-
invariant and product-specific determinants of tax evasion. More precisely, we estimate
the following:
(12) DGap_Valuek = α + β1*DTaxk + β2*DAvg(Tax_ok) + υk
where a prefix D- denotes the change between 1997 and 1998.
Determining the appropriate tax rate for 1997 turns out to be a little challenging.
While there was virtually no change in the tariff structure during 1998, there was a fairly
large-scale tariff reform on October 1, 1997.13 Since our import data for 1997 was
cumulated for the year, we have to use the weighted average of tax rates that prevailed
before and after the tariff reform. However, the knowledge of a tariff reform in the near
future could affect the timing of the imports. We do not have a good way to correct for
this. Instead, we assume that the effective tax rate for 1997 is given by:
Tax1997 = 0.75*(Year-end tax rate for 1996) + 0.25*(Year-end tax rate for 1997)
We then define DTax = Tax1998 – Tax1997.
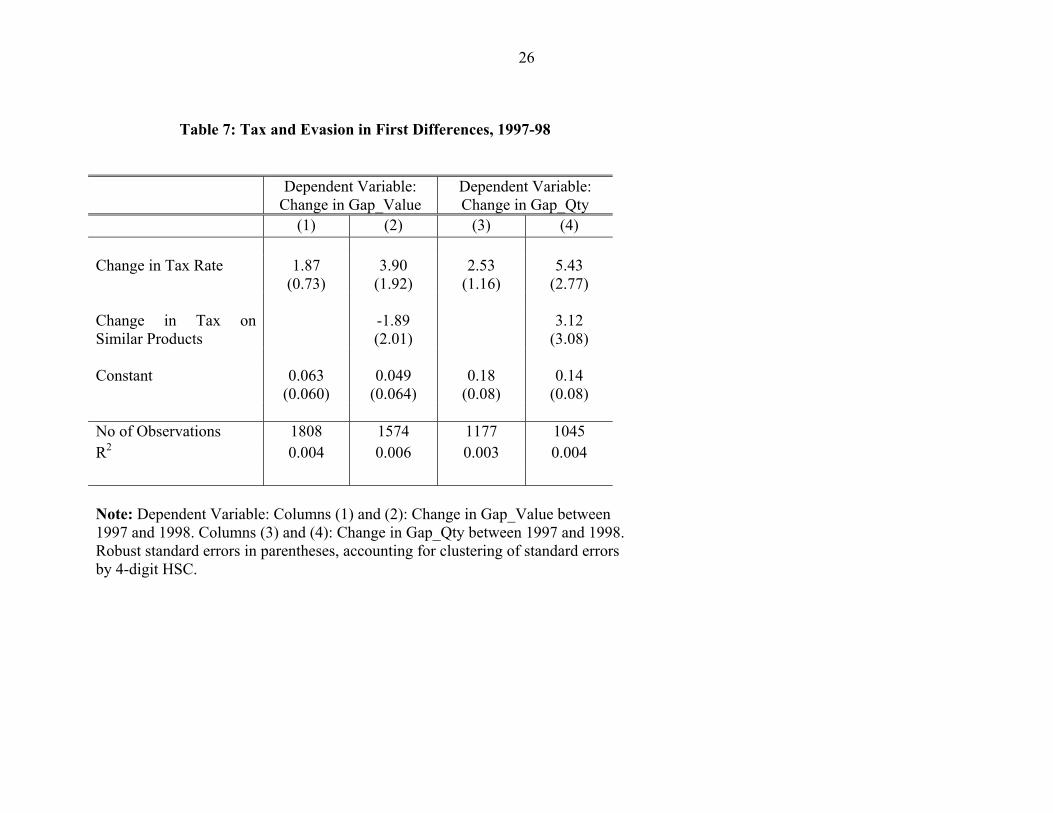
Table 7 shows the estimation results. We note that the R-squared values are very
low in these regressions; this is not surprising, as we have differenced out much of the
information in the data. In columns (1) and (2), with the change in Gap_Value as the
dependent variable, the coefficient on DTax is significant, though marginally smaller than
13 There was also a large-scale tax reform on April 1, 1996. Since we do not have tariff rates for year-end 1995, it is not possible to calculate average tax rates for 1996. We simply assume the average tax rate to be the year-end rate, and run a fixed-effects regression with three years of data. In this case, we obtain results that imply a slightly larger rate of evasion than that reported in the main text.
16
that obtained in our level regressions. The coefficient on Davg(Tax_o) is no longer
significant at conventional levels (t-statistic of approximately one), but is of the same
sign as in the level regressions. We obtain similar results with the change in Gap_Qty as
the dependent variable (see columns (3) and (4)).
Flexible functional form
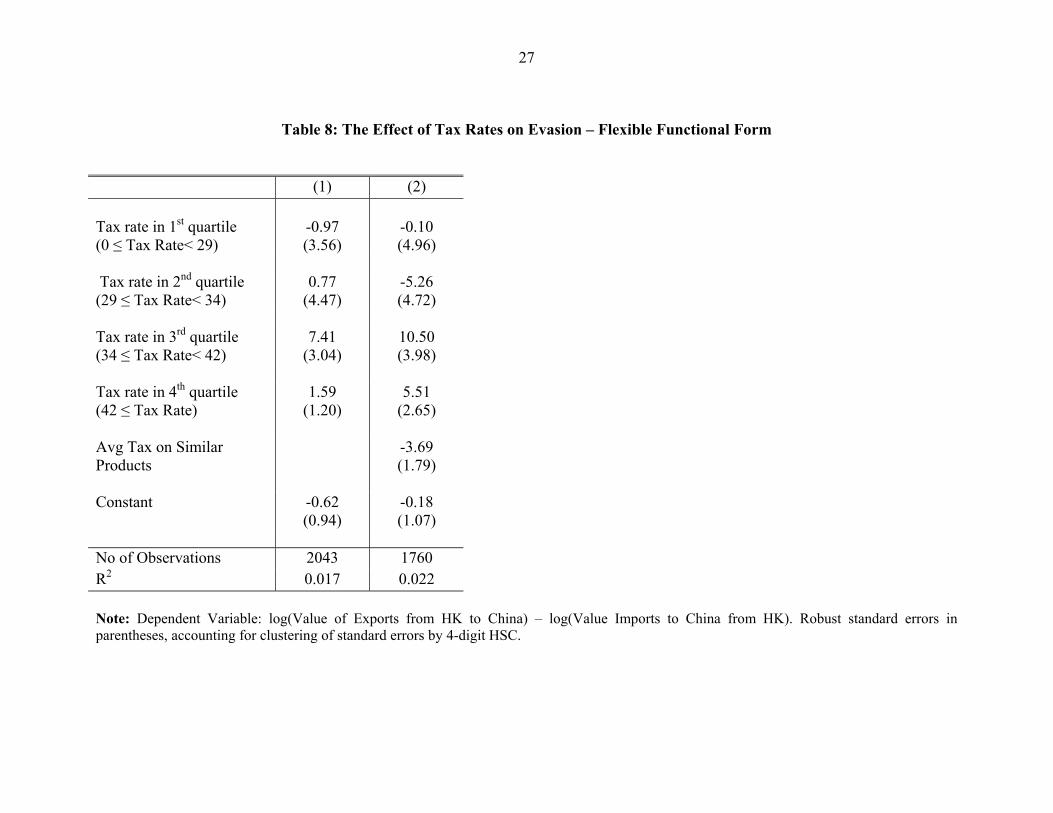
We now allow the marginal effect of a tax increase on evasion to differ across
different tax rates. Following, for example, Chamberlain (1997), we allow for the slope
to differ across quartiles, with knots at tax rates of 29, 34, and 42 percent. The results, in
Table 8, suggest that there is little effect on evasion at relatively low tax rates. However,
as tax rates rise above the median level of 34 percent, the extent of evasion rises
dramatically. The marginal effect then tapers off again at higher levels. As before, the
effect of tax rate increases is larger when we control for average tax levels by 4-digit HS.
This pattern of non-linearity is consistent with the existence of a fixed cost in
undertaking evasion activity. For example, if there is some fixity in the punishment for
evasion, there may be a threshold tax level above which evasion becomes worthwhile.14
Alternatively, it is also consistent with a probability of detection that is relatively
invariant to the tax rate, so that the benefit of evasion increases more rapidly than the cost
as tax rates increase.
Robustness to Alternative Specifications of Indirect exports
As noted in the data section of this paper, the Chinese customs-reported import
figures are likely to include part of the indirect imports that are mis-classified as direct
imports. We have argued that the amount of such mis-classified imports should not be
correlated with the tax rate on the product since the same tax rate is applied to both direct
and indirect imports. We can make a more direct assessment of this assumption by
restricting our sample to those products for which Hong Kong sends relatively few
indirect exports to China.
14 Unfortunately, the punishment code for customs evasion in China is sufficiently vague as to give relatively little guidance on this question. While the punishment includes the confiscation of the goods involved, it also may incorporate a fine of an unspecified amount. Furthermore, in recent years, some
17
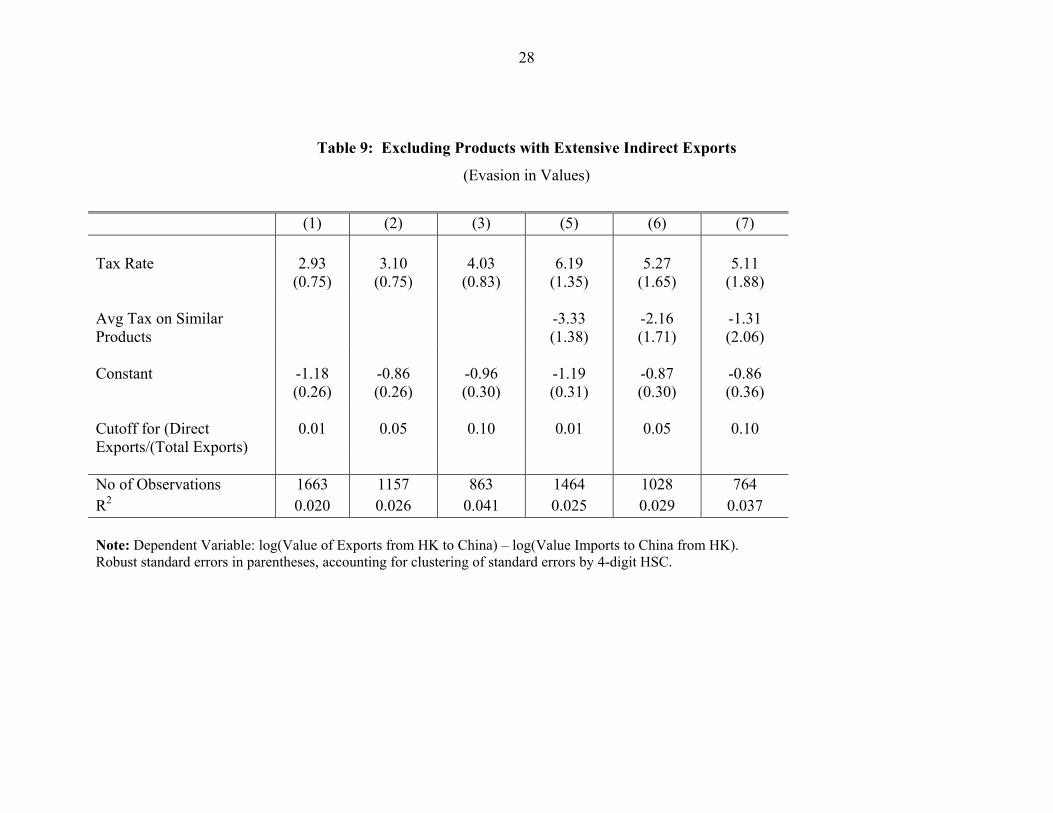
We repeated the basic regressions from Tables 2 and 3, excluding observations
with relatively low values of Direct Export Ratio = (Direct Export)/(Indirect Export +
Direct Export). We use cut-off values of 0.01, 0.05, and 0.1; the results using export
values are reported in Table 9. In the case of the simple binary regression, the coefficient
on Tax increases slightly with the cut-off. The qualitative inference, however, remains
the same. The results with Avg(Tax_o) included as a regressor are somewhat mixed,
possibly owing to the colinearity of Tax and Avg(Tax_o) once the sample size has been
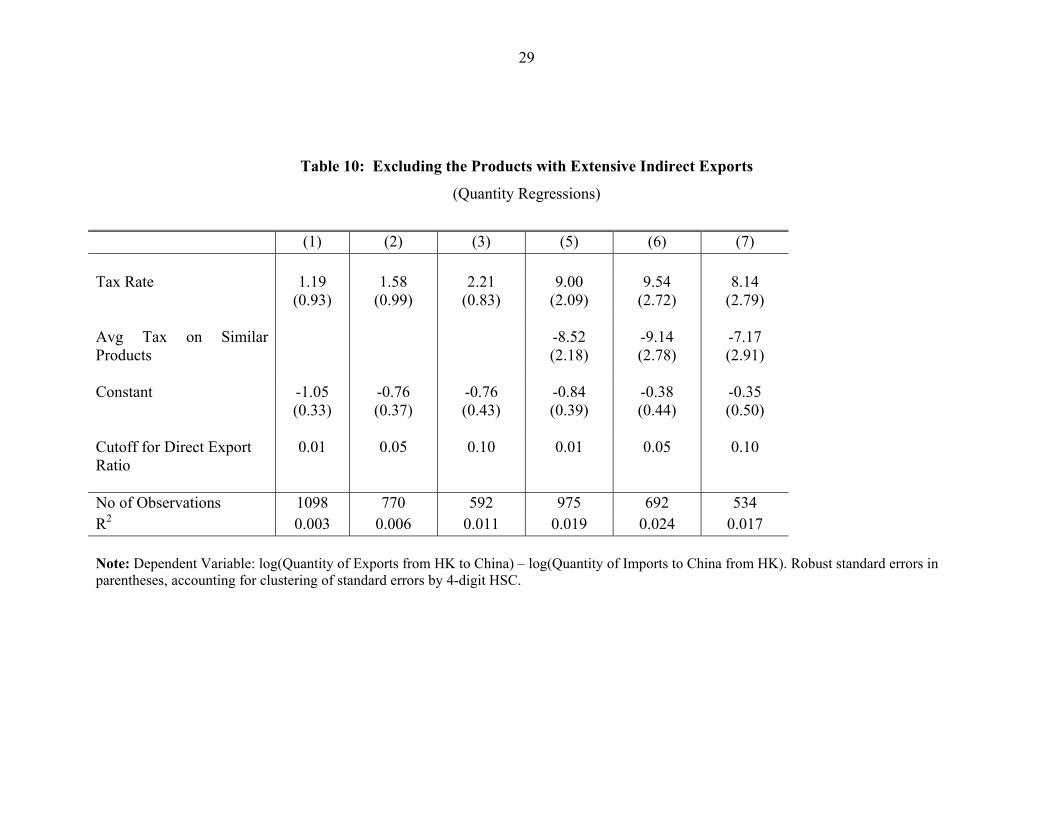
reduced. When we look at the results from the quantity regressions, the coefficients are
uniformly suggestive of a stronger effect of tax rates on evasion, when products with
relatively low ratios of direct exports are excluded (See Table 10).15
4. Conclusions
In this paper, we take a new approach in measuring the effect of tax rates on tax
evasion, by looking at the reporting gap in China’s imports from Hong Kong, as a
function of Chinese tax rates (tariff plus VAT rates). We find that this 'evasion gap' is
highly correlated with tax rates: much more value is 'lost' for products with higher tax
rates. The point estimates suggest that the Chinese average tax rate on its imports is
already on the wrong side of the Laffer curve: any increase in tax rate is likely to produce
a reduction rather than an increase in tax revenue.
By comparing the evasion gap in quantities and in values, we conclude that there
are widespread practices of under-reporting the unit values of imports, and mis-labeling
higher-taxed products as lower-taxed varieties.
As a broader contribution to the literature, we believe that our approach can be
applied to other countries as well. In addition to providing more information on the
behavioral response of tax evasion to tax rates, the generalized multiple-country study
could provide a more objective measure of the laxity of rule of law across countries – in
traders have been executed for tariff evasion, thereby highlighting the full extent of autonomy that the authorities have in determining punishments. 15 An alternative approach, since we are estimating a very reduced form of the evasion equation, is to simply include the value of indirect exports as a regressor. The results from this approach are virtually identical to those previously reported.
18
contrast to the subjective perception based measures of corruption and rule of law now
popular in empirical studies. We leave this, and other extensions, for future work.
19
Table 1A – Summary Statistics, Full Sample
Mean Std. Dev. Min. Max Obs.
log(Value_Export) 4.68 2.81 -6.21 12.72 2043 log(Value_Import) 5.29 2.53 -5.52 12.20 2043 Gap_Value -0.62 2.43 -13.79 9.64 2043 log(Qty_Export) 5.98 4.49 -2.30 20.17 1478 log(Qty_Import) 6.14 4.05 -2.30 21.99 1972 Gap_Qty -1.06 2.56 -13.35 11.74 1368 Tax Rate (Tariff+VAT) (at the 6-digit level) 36.09 10.34 13 134.6 2043 Avg(Tax_o) (at the 4-digit level) 36.09 9.20 13 88 1760 Exemption 0.78 0.31 0 1 1918 Direct Export Ratio 0.17 0.23 0.00 0.99 2024 Change in Tax Rate, 1997 – 1998 -5.56 5.98 -30 9 1808
20
Table 1B – Summary Statistics, Restricted to Products
with Direct Export Ratio above the Median
Mean Std. Dev. Min. Max Obs.
log(Value_Export) 5.95 2.42 -4.51 12.72 1031 log(Value_Import) 5.55 2.62 -5.12 12.20 1031 Gap_Value 0.40 1.96 -7.92 9.64 1031 log(Qty_Export) 8.03 4.52 -2.30 20.17 725 log(Qty_Import) 6.93 4.40 -2.30 21.99 984 Gap_Qty -0.13 2.31 -8.63 11.74 656 Tax Rate (Tariff+VAT) (at the 6-digit level) 37.00 10.23 13.00 104.20 1031 Exemption ratio 0.82 0.28 0 1 969 Avg(Tax_o) (at the 4-digit level) 37.01 9.18 13.00 88.00 919 Change in Tax Rate, 1997 – 1998 -6.23 6.07 -30 9 957
21
Table 2: The Effect Of Tax Rates on Evasion (Measured in Value)
(1) (2) (3) (4) (5) (6) (7) Tax Rate 2.82
(0.78) 2.59
(0.66) 3.08
(0.10) 2.85
(0.88) 2.76
(0.84) 2.78
(0.78) 3.44
(1.02) Constant -1.63
(0.27) -1.38 (0.23)
-1.69 (0.34)
-1.65 (0.30)
-1.45 (0.29)
-1.53 (0.27)
-1.73 (0.36)
Excluding Outliers? No Yes No No Yes Yes Yes Excluding products lacking tax on similar products?
No No Yes No No Yes Yes
Excluding products lacking Obs. on Quantities?
No No No Yes Yes No Yes
No of Observations 2043 1974 1760 1368 1710 1337 1165 R2 0.015 0.017 0.015 0.018 0.016 0.020 0.025 Note: Dependent Variable: log(Value of Exports from HK to China) – log(Value Imports to China from HK). Robust standard errors in parentheses, accounting for clustering of standard errors by 4-digit HSC.
22
Table 3: Aggregating the Evasion Gap by Tax Brackets
(1) (2) (3) (4) Tax Rate 3.10
(0.99) 3.11
(0.88) 3.47
(0.98) 2.95
(0.94) Constant -1.73
(0.31) -1.74 (0.38)
-1.73 (0.31)
-1.58 (0.39)
Method of Aggregation Mean Mean Median Median Weighting of Data by Number of Observations per Tax Rate?
Yes No Yes No
No of Observations 44 44 44 44 R2 0.26 0.32 0.34 0.31 Note: For columns 1 and 2, the dependent Variable is Mean[log(Value of Exports from HK to China) – log(Value Imports to China from HK], with means taken for each level of tax rate. For columns 3 and 4, the dependent variable is Median[log(Value of Exports from HK to China) – log(Value Imports to China from HK]. Robust standard errors in parentheses.
23
Table 4: Incorporating the Average Tax on Similar Products
(1) (2) (3) (4) (5) Tax Rate 6.32
(1.77) 4.89
(1.22) 7.69
(1.77) 7.20
(1.39) Tax on Similar Products 2.40
(1.00) -3.57 (1.70)
-2.34 (1.25)
-4.62 (1.72)
-4.09 (1.47)
Constant -1.45
(0.034) -1.58 (0.35)
-1.38 (0.30)
-1.76 (0.41)
-1.68 (0.37)
Excluding Outliers? No No Yes No Yes Excluding products lacking Obs. on Quantities?
No No No Yes Yes
No of Observations 1760 1760 1710 1191 1165 R2 0.016 0.018 0.017 0.026 0.029 Note: Dependent Variable: log(Value of Exports from HK to China) – log(Value Imports to China from HK). Robust standard errors in parentheses, accounting for clustering of standard errors by 4-digit HSC.

24
Table 5: Evasion in Physical Quantities
(1) (2) (3) (4) (5) (6) Tax Rate 0.92
(0.84) 0.82
(1.11) 0.76
(0.73) 7.59
(2.08) 8.11
(1.62) Tax on Similar Products 0.16
(1.14) -7.40 (2.07)
-8.13 (3.50)
Constant -1.39
(0.30) -1.37 (0.41)
-1.15 (0.26)
-1.01 (0.40)
-1.17 (0.41)
-0.89 (0.35)
Excluding products lacking Obs. on Avg(Tax_o)?
No Yes No Yes Yes Yes
Excluding Outliers? No No Yes No No Yes No of Observations 1368 1191 1317 1191 1191 1145 R2 0.002 0.001 0.002 0.000 0.011 0.017 Note: Dependent Variable: log(Quantity of Exports from HK to China) – log(Quantity of Imports to China from HK). Robust standard errors in parentheses, accounting for clustering of standard errors by 4-digit HSC.
25
Table 6: Controlling for the Effect of Tariff Exemptions
Dependent Variable: Gap_Value Dependent Variable: Gap_Qty (1) (2) (3) (4) (5) (6) (7) (8) Tax Rate 2.94
(0.79) 6.03
(1.84) 25.77 (7.08)
0.97 (0.81)
6.97 (2.06)
21.11 (5.42)
Tax on Similar Products -3.04
(1.77) -16.29 (0.70)
-6.57 (2.09)
-12.58 (5.44)
Exemption -0.49
(0.23) -0.47 (0.24)
-0.72 (0.26)
2.59 (0.94)
-0.92 (0.29)
-0.89 (0.29)
-1.02 (0.32)
3.16 (1.24)
Exemption*(Tax Rate) -26.82
(8.53) -19.51
(6.99) Exemption*(Tax on Similar Products)
No No No 18.26 (8.34)
9.39 (6.92)
Constant -0.25
(0.21) -1.34 (0.34)
-1.13 (0.43)
-3.66 (0.78)
-0.36 (0.26)
-0.75 (0.38)
-0.47 (0.48)
-3.86 (1.10)
No of Observations 1918 1918 1639 1639 1278 1278 1104 1104 R2 0.004 0.020 0.028 0.054 0.012 0.014 0.026 0.044 Note: Dependent Variable: Columns (1) – (4): log(Value of Exports from HK to China) – log(Value Imports to China from HK). Columns (5) – (8): log(Quantity of Exports from HK to China) – log(Quantity of Imports to China from HK). Robust standard errors in parentheses, accounting for clustering of standard errors by 4-digit HSC.
26
Table 7: Tax and Evasion in First Differences, 1997-98
Dependent Variable: Change in Gap_Value
Dependent Variable: Change in Gap_Qty
(1) (2) (3) (4) Change in Tax Rate 1.87
(0.73) 3.90
(1.92) 2.53
(1.16) 5.43
(2.77) Change in Tax on Similar Products
-1.89 (2.01)
3.12 (3.08)
Constant 0.063
(0.060) 0.049
(0.064) 0.18
(0.08) 0.14
(0.08) No of Observations 1808 1574 1177 1045 R2 0.004 0.006 0.003 0.004 Note: Dependent Variable: Columns (1) and (2): Change in Gap_Value between 1997 and 1998. Columns (3) and (4): Change in Gap_Qty between 1997 and 1998. Robust standard errors in parentheses, accounting for clustering of standard errors by 4-digit HSC.
27
Table 8: The Effect of Tax Rates on Evasion – Flexible Functional Form
(1) (2) Tax rate in 1st quartile (0 ≤ Tax Rate< 29)
-0.97 (3.56)
-0.10 (4.96)
Tax rate in 2nd quartile (29 ≤ Tax Rate< 34)
0.77 (4.47)
-5.26 (4.72)
Tax rate in 3rd quartile (34 ≤ Tax Rate< 42)
7.41 (3.04)
10.50 (3.98)
Tax rate in 4th quartile (42 ≤ Tax Rate)
1.59 (1.20)
5.51 (2.65)
Avg Tax on Similar Products
-3.69 (1.79)
Constant -0.62
(0.94) -0.18 (1.07)
No of Observations 2043 1760 R2 0.017 0.022 Note: Dependent Variable: log(Value of Exports from HK to China) – log(Value Imports to China from HK). Robust standard errors in parentheses, accounting for clustering of standard errors by 4-digit HSC.
28
Table 9: Excluding Products with Extensive Indirect Exports
(Evasion in Values)
(1) (2) (3) (5) (6) (7) Tax Rate 2.93
(0.75) 3.10
(0.75) 4.03
(0.83) 6.19
(1.35) 5.27
(1.65) 5.11
(1.88) Avg Tax on Similar Products
-3.33 (1.38)
-2.16 (1.71)
-1.31 (2.06)
Constant -1.18
(0.26) -0.86 (0.26)
-0.96 (0.30)
-1.19 (0.31)
-0.87 (0.30)
-0.86 (0.36)
Cutoff for (Direct Exports/(Total Exports)
0.01 0.05 0.10 0.01 0.05 0.10
No of Observations 1663 1157 863 1464 1028 764 R2 0.020 0.026 0.041 0.025 0.029 0.037 Note: Dependent Variable: log(Value of Exports from HK to China) – log(Value Imports to China from HK). Robust standard errors in parentheses, accounting for clustering of standard errors by 4-digit HSC.
29
Table 10: Excluding the Products with Extensive Indirect Exports
(Quantity Regressions)
(1) (2) (3) (5) (6) (7) Tax Rate 1.19
(0.93) 1.58
(0.99) 2.21
(0.83) 9.00
(2.09) 9.54
(2.72) 8.14
(2.79) Avg Tax on Similar Products
-8.52 (2.18)
-9.14 (2.78)
-7.17 (2.91)
Constant -1.05
(0.33) -0.76 (0.37)
-0.76 (0.43)
-0.84 (0.39)
-0.38 (0.44)
-0.35 (0.50)
Cutoff for Direct Export Ratio
0.01 0.05 0.10 0.01 0.05 0.10
No of Observations 1098 770 592 975 692 534 R2 0.003 0.006 0.011 0.019 0.024 0.017 Note: Dependent Variable: log(Quantity of Exports from HK to China) – log(Quantity of Imports to China from HK). Robust standard errors in parentheses, accounting for clustering of standard errors by 4-digit HSC.
30
Figure 1 - Relationship Between Mean(Gap_Value) and Tax Rates, 1998
-4
-3
-2
-1
0
1
2
3
4
0 20 40 60 80 100
Tax
Mea
n(G
ap_V
alue
)
31
References Allingham, Michael G. and Agnar Sandmo, "Income Tax Evasion: A Theoretical Analysis." Journal of Public Economics, Vol. 1, No. 3-4 (1972), pp. 323-338. Andreoni, James, Brian Erard, and Jonathan Feinstein, "Tax Compliance." Journal of Economic Literature, Vol. 36, No. 2 (June, 1998), pp. 818-860. Bernard, Jean-Thomas, and Robert Weiner, "Multinational Corporations, Transfer Prices, and Taxes: Evidence from the U.S. Petroleum Industry," in Taxation in the Global Economy (A. Razin and J. Slemrod, eds.), Chicago: University of Chicago Press, 1990: 123-154. Chamberlain, Gary, Econometrics, unpublished manuscript, 1997. Clausing, Kimberly, “The Impact of Transfer Pricing on Intrafirm Trade.” NBER Working Paper No. W6688, August 1998. Economic Information Agency, Chinese Customs Statistics 1998 (CCS), 2001. Clotfelter, Charles T, "Tax Evasion and Tax Rates: An Analysis of Individual Returns." Review of Economics and Statistics, Vol. 65, No. 3 (August, 1983), pp. 363-373. Feenstra, Robert, and Gordon Hanson, “Aggregation Bias in the Factor Content of Trade: Evidence from U.S. Manufacturing,” American Economic Review, Vol. 90, No. 2, (May 2000), pp. 155-60. Feige, Edgar L, "How Big is the Irregular Economy?" Challenge, Vol. 22, No. 5 (November-December, 1979), pp. 5-13. Feinstein, Jonathan, "An Econometric Analysis of Income Tax Evasion and its Detection." RAND Journal of Economics, Vol. 22, No. 1 (Spring, 1991), pp. 14-35. Gutmann, Peter M., "The Subterranean Economy." Financial Analysts Journal, Vol. 33, No. 6 (November-December, 1977), pp. 26-34. Slemrod, Joel and Shlomo Yitzhaki, " Tax Avoidance, Evasion, and Administration," NBER Working Paper No. W7473, January 2000. Tanzi, Vito, "The Underground Economy in the United States: Estimates and Implications," Banco Nazionale del Lavoro Quarterly Review, No. 135 (December, 1980), pp. 427-53. World Bank, World Integrated Trade Solution (WITS), 2000.
32
Yitzhaki, Shlomo, "A Note on ‘Income Tax Evasion: A Theoretical Analysis’," Journal of Public Economics, Vol. 3, No. 2 (May, 1974), pp. 201-202.
33
Appendix: Variable Definitions Import_Value: Value of imports from Hong Kong into China, as reported by the Chinese customs, for 1998, at the 6-digit HS level. Measured in U.S. dollars. Source: World Bank’s World Integrated Trade Solutions (WITS), derived from the United Nations’ Comtrade Database. Export_Value: Value of exports by Hong Kong destined for China, as reported by Hong Kong customs, for 1998, at the 6-digit HS level. Measured in U.S. dollars. Source: WITS Indirect Export_Value: Value of Indirect Exports from Hong Kong to China, originating from third-party countries. Reported by the Hong Kong customs, for 1998, at the 6-digit HS level. Measured in U.S. dollars. Source: WITS Gap_Value = log(Import_Value) – log(Export_Value) Import_Qty: Quantity of imports from Hong Kong into China, as reported by the Chinese customs, for 1998, at the 6-digit HS level. Measured in U.S. dollars. Source: WITS Export_Qty: Quantity of exports from Hong Kong destined for China, as reported by Hong Kong customs, for 1998, at the 6-digit HS level. Measured in U.S. dollars. Source: WITS Indirect Export_Quantity: Quantity of indirect exports, originating from third-party countries. Reported by the Hong Kong customs, for 1998, at the 6-digit HS level. Measured in U.S. dollars. Source: WITS Gap_Qty = log(Import_Qty) – log(Export_Qty) Tax: Total taxes rate levied on incoming goods by the Chinese Authorities, equal to the sum of tariffs and commercial taxes, for 1998. Source: WITS Dtax: Difference in the tax rates in 1998 and 1997. See the text for details. Exemption: At the 6-digit level, the proportion of goods exempt from import tariffs. Source: China Customs Statistics, purchased from the EIA CCS Information Service Center in Hong Kong. Avg(Tax_o): Average of the level of Tax for all other goods in a product's 4-digit HS class, weighted by Export_Value. Direct Export Ratio: Ratio of Direct Exports to Direct Exports + Indirect Exports
Recommended