AIRPLANE DESIGNPRELIMINARY SIZING OF AN AIRPLANE
“Pilots make it work,engineers make it possible”.
To a pilot
By
Tatiana Quercia
Aerospace EngineeringSapienza University of Rome
2012
1Tatiana Quercia – Airplane Design
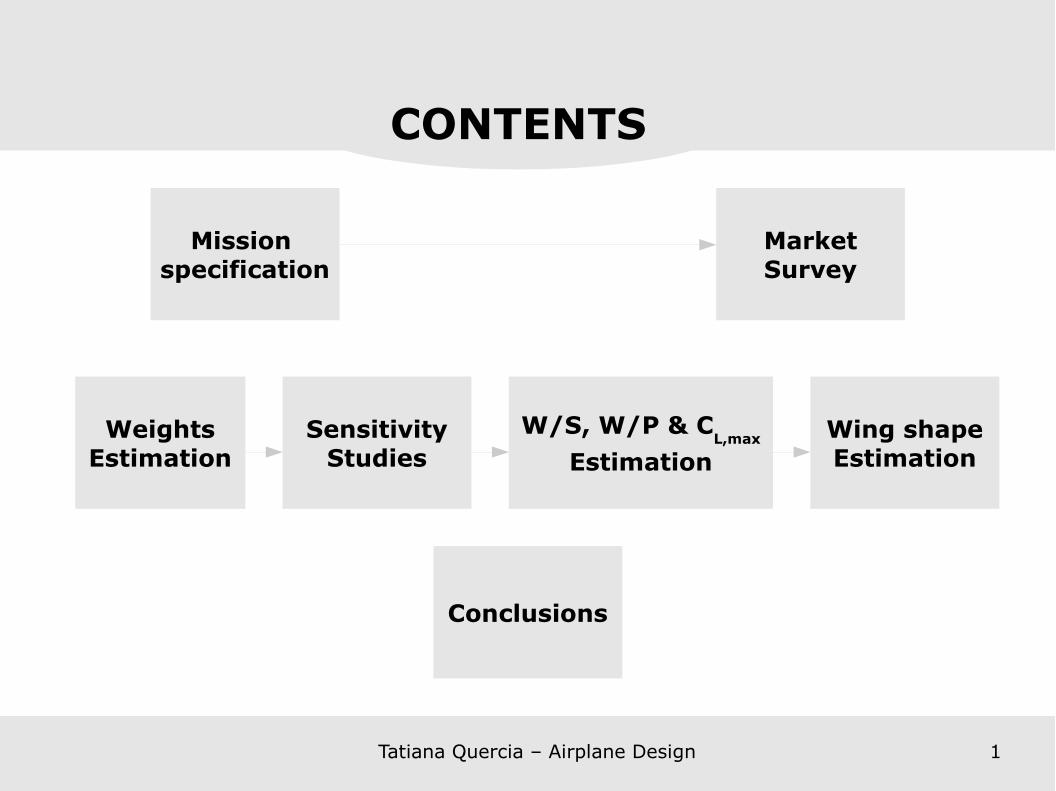
MarketSurvey
Mission specification
WeightsEstimation
SensitivityStudies
W/S, W/P & CL,max
EstimationWing shapeEstimation
Conclusions
CONTENTS
Tatiana Quercia – Airplane Design 2
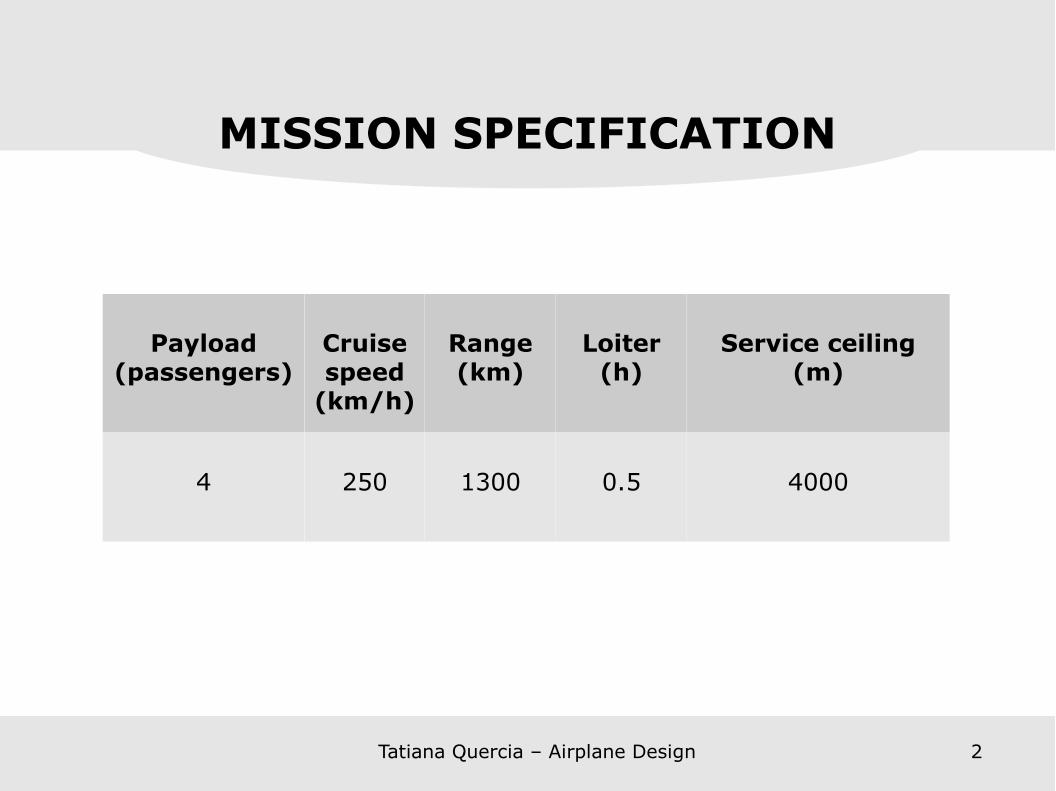
MISSION SPECIFICATION
Payload(passengers)
Cruise speed
(km/h)
Range(km)
Loiter(h)
Service ceiling(m)
4 250 1300 0.5 4000

Tatiana Quercia – Airplane Design 3
MARKET SURVEY
Airplane Seats(passengers
+ pilots)
Cruise speed
(km/h)
Range(km)
Service ceiling
(m)
Maximum Take-off Weight
(kg)Piper PA-32R-301
Saratoga II HP
4+2 307 1590 5029 1633
Cirrus SR203+1 289 1357 5335 1360
Cessna 182 Skylane 3+1 269 1505 5515 1406
Cessna 206 Stationair 4+2 263 1352 4785 1632

Tatiana Quercia – Airplane Design 4
MARKET SURVEY
CATEGORY
SINGLE ENGINE PROPELLER DRIVEN AIRPLANES
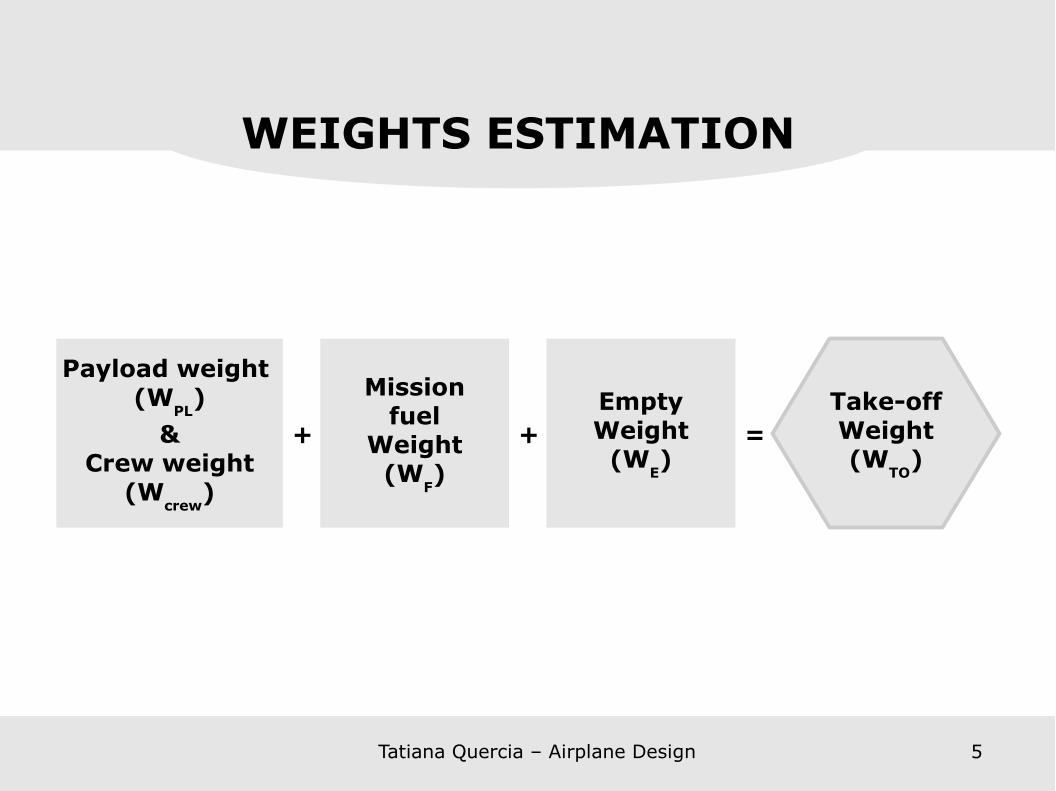
WEIGHTS ESTIMATION
Tatiana Quercia – Airplane Design 5
Payload weight (W
PL)
&Crew weight
(Wcrew
)
Missionfuel
Weight(W
F)
EmptyWeight
(WE)
+ + =Take-offWeight(W
TO)
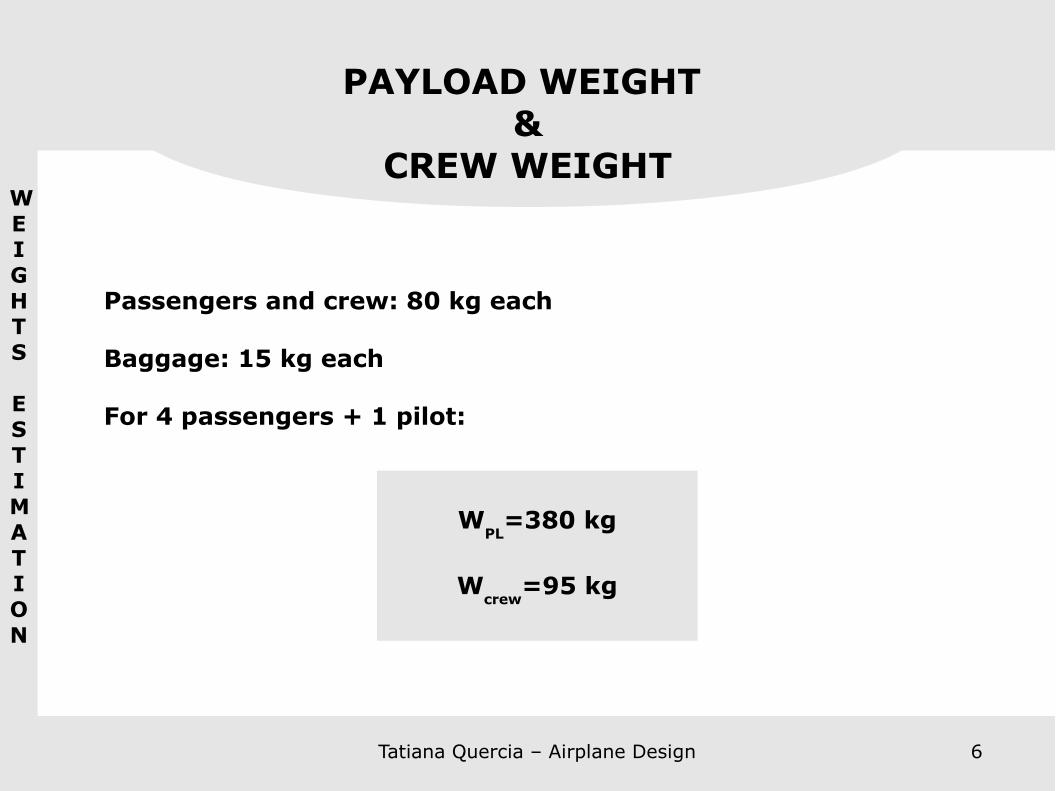
PAYLOAD WEIGHT &
CREW WEIGHT
Tatiana Quercia – Airplane Design 6
WEIGHTS
ESTIMATION
Passengers and crew: 80 kg each
Baggage: 15 kg each
For 4 passengers + 1 pilot:
WPL
=380 kg
Wcrew
=95 kg
MISSION FUEL WEIGHT
WEIGHTS
ESTIMATION
Tatiana Quercia – Airplane Design 7
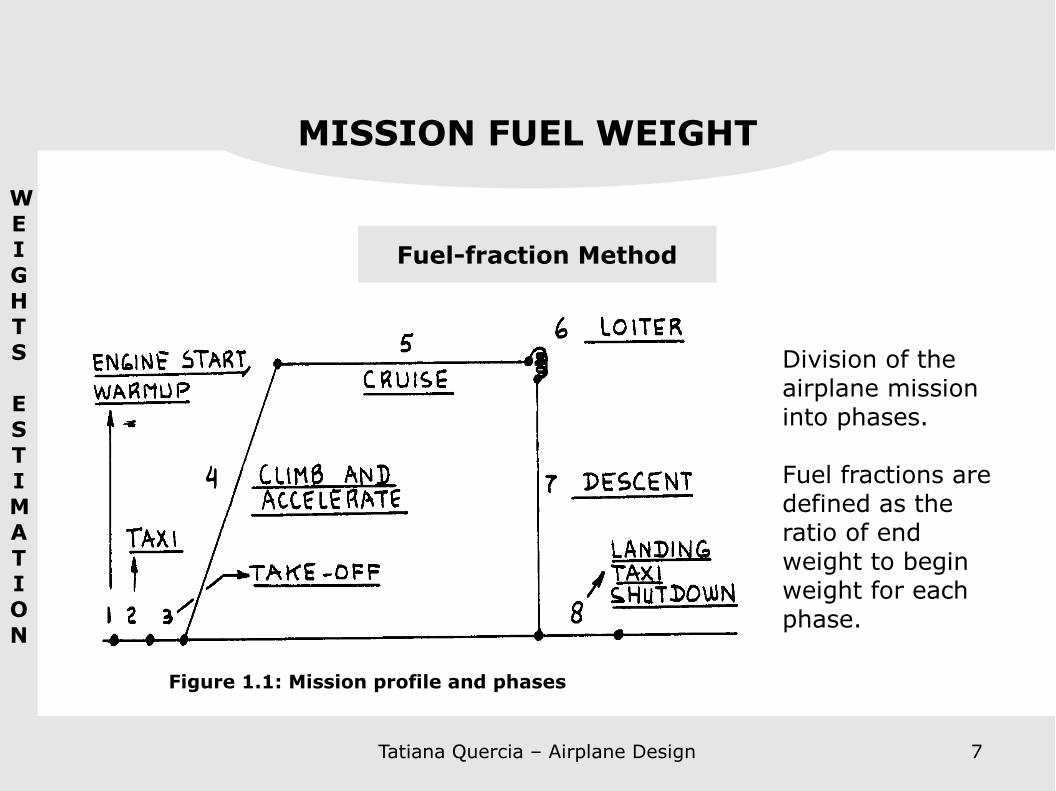
Fuel-fraction Method
Division of the airplane mission into phases.
Fuel fractions are defined as the ratio of end weight to begin weight for each phase.
Figure 1.1: Mission profile and phases
MISSION FUEL WEIGHT
WEIGHTS
ESTIMATION
Tatiana Quercia – Airplane Design 8
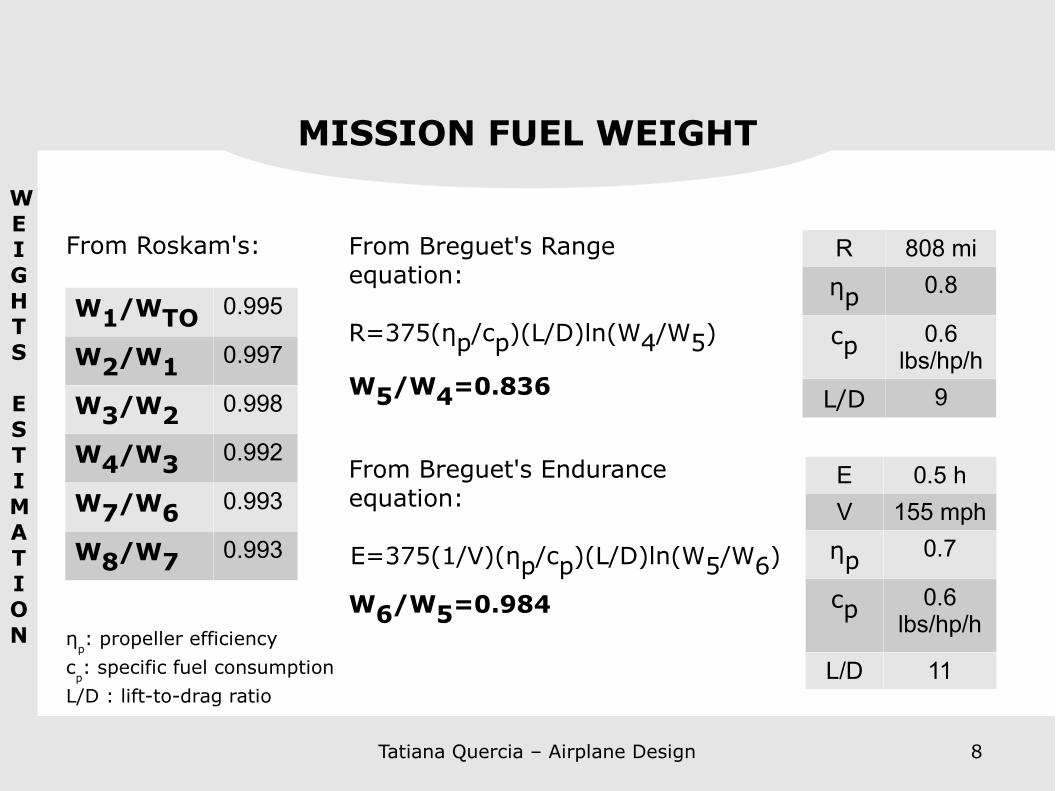
W1/WTO 0.995
W2/W1 0.997
W3/W2 0.998
W4/W3 0.992
W7/W6 0.993
W8/W7 0.993
From Roskam's: From Breguet's Range equation:
R=375(ηp/cp)(L/D)ln(W4/W5)
W5/W4=0.836
R 808 miηp 0.8
cp 0.6 lbs/hp/h
L/D 9
From Breguet's Endurance equation:
E=375(1/V)(ηp/cp)(L/D)ln(W5/W6)
W6/W5=0.984
E 0.5 hV 155 mphηp 0.7
cp 0.6 lbs/hp/h
L/D 11η
p: propeller efficiency
cp: specific fuel consumption
L/D : lift-to-drag ratio
WEIGHTS
ESTIMATION
Tatiana Quercia – Airplane Design 9
EMPTY WEIGHTMISSION FUEL WEIGHT
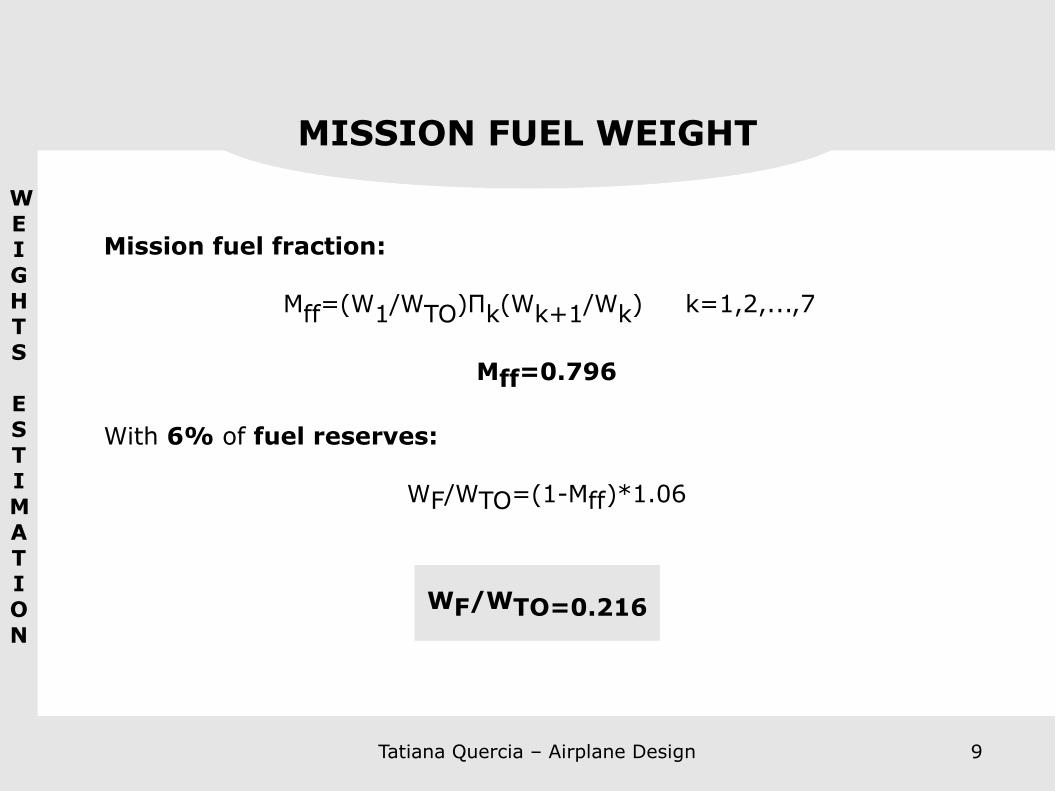
Mission fuel fraction:
Mff=(W1/WTO)Пk(Wk+1/Wk) k=1,2,...,7
Mff=0.796
With 6% of fuel reserves:
WF/WTO=(1-Mff)*1.06
WF/WTO=0.216
WEIGHTS
ESTIMATION
Tatiana Quercia – Airplane Design 10
EMPTY WEIGHT&
TAKE-OFF WEIGHT
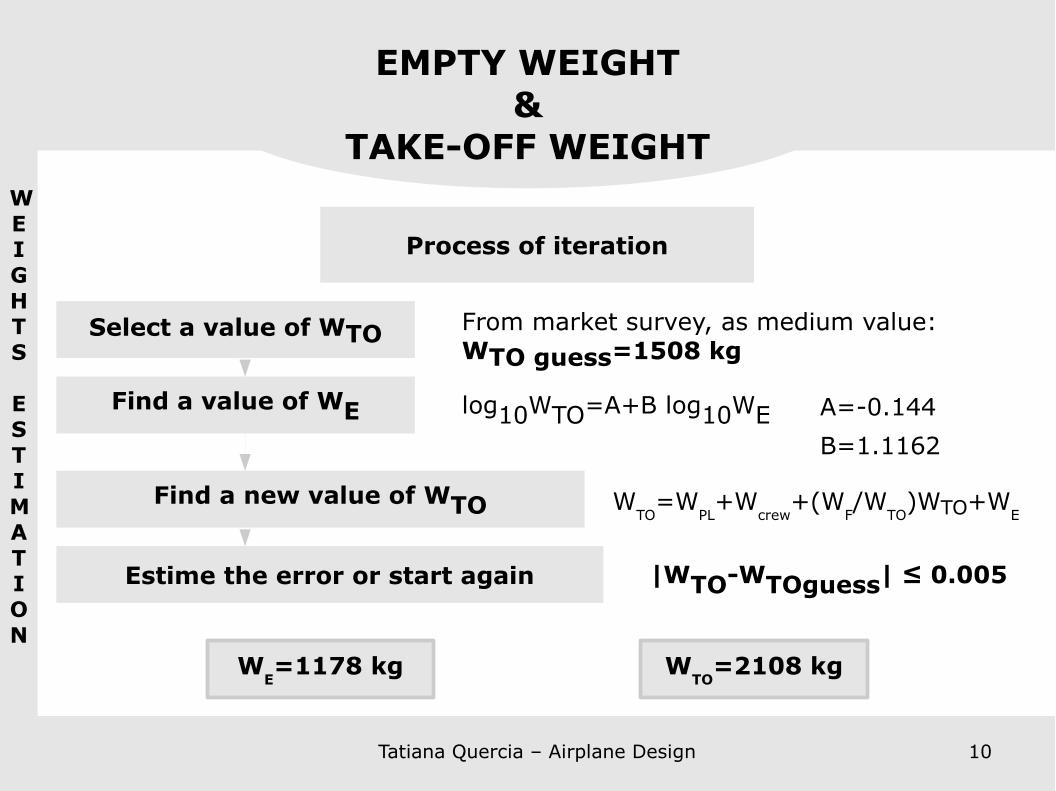
log10WTO=A+B log10WE
Process of iteration
Select a value of WTO
Find a new value of WTO
Find a value of WE
Estime the error or start again
From market survey, as medium value: WTO guess=1508 kg
A=-0.144B=1.1162
WTO
=WPL+W
crew+(W
F/W
TO)WTO+W
E
|WTO-WTOguess| ≤ 0.005
WTO
=2108 kgWE=1178 kg
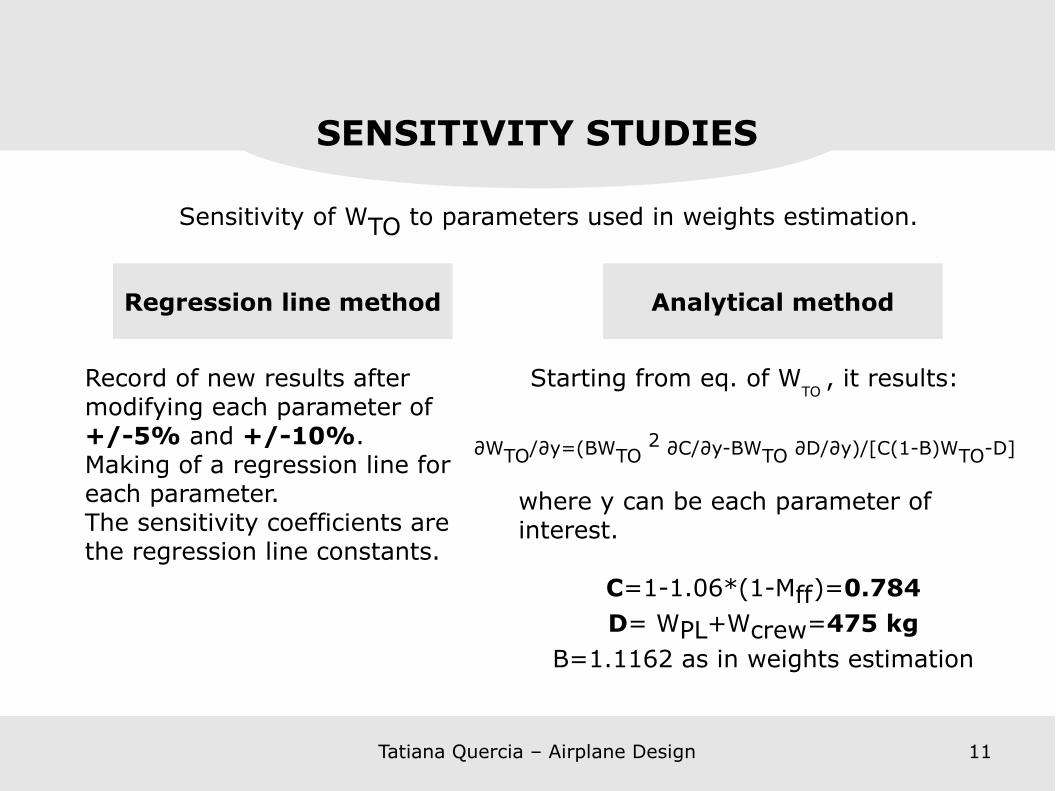
SENSITIVITY STUDIES
Regression line method
Record of new results after modifying each parameter of +/-5% and +/-10%.Making of a regression line for each parameter.The sensitivity coefficients are the regression line constants.
Sensitivity of WTO to parameters used in weights estimation.
Analytical method
Starting from eq. of WTO
, it results:
∂WTO/∂y=(BWTO 2 ∂C/∂y-BWTO ∂D/∂y)/[C(1-B)WTO-D]
where y can be each parameter of interest.
C=1-1.06*(1-Mff)=0.784D= WPL+Wcrew=475 kg
B=1.1162 as in weights estimation
Tatiana Quercia – Airplane Design 11

9,5 10 10,5 11 11,5 12 12,52085
2090
2095
2100
2105
2110
2115
2120
2125
f(x) = -9.27x + 2210.60
Figure 2.1: Regression line for lift-to-drag (L/D) in conditions of loiter
Lift-to-drag (L/D)
Max
imum
tak
e-of
f w
eigh
t (k
g)
Tatiana Quercia – Airplane Design 12
REGRESSION LINE METHODSENSITIVITY STUDIES
L/D|loiter
WTO (kg)
9,9 211910,45 2114
11 210811,55 210312,1 2099
Ex.
∂WTO/∂(L/D)|loiter=-9.27 kg
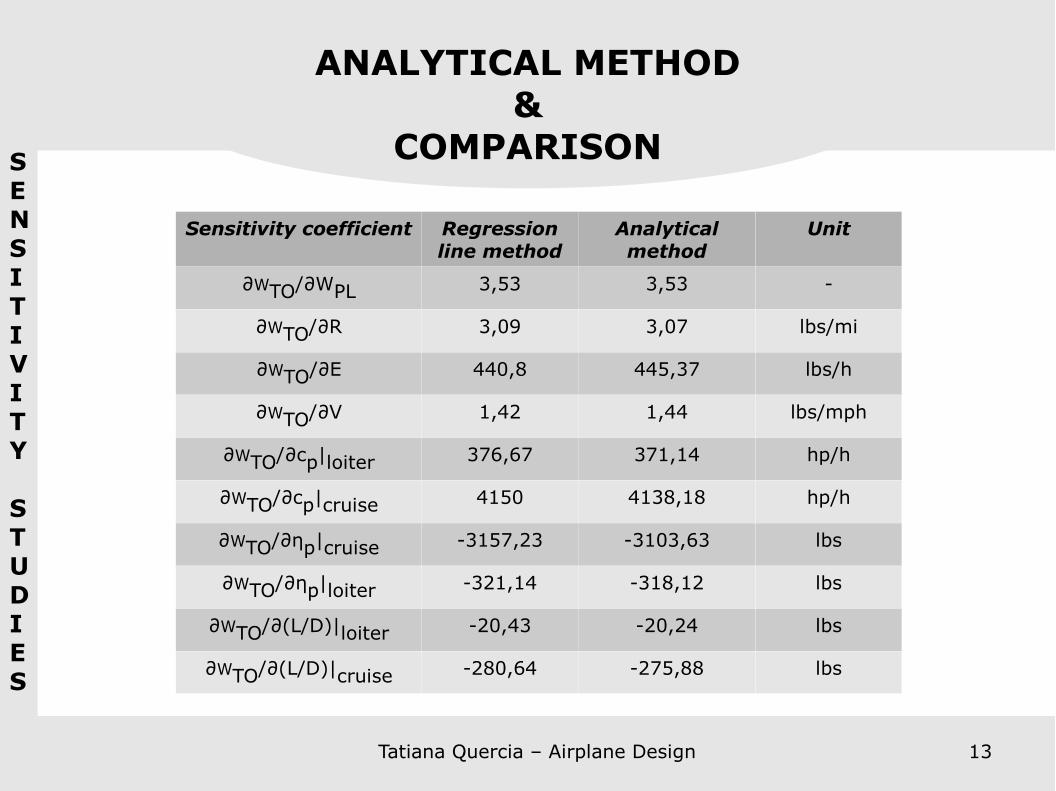
ANALYTICAL METHOD&
COMPARISONSENSITIVITY STUDIES
Tatiana Quercia – Airplane Design 13
Sensitivity coefficient Regression line method
Analytical method
Unit
∂WTO/∂WPL 3,53 3,53 -
∂WTO/∂R 3,09 3,07 lbs/mi
∂WTO/∂E 440,8 445,37 lbs/h
∂WTO/∂V 1,42 1,44 lbs/mph
∂WTO/∂cp|loiter 376,67 371,14 hp/h
∂WTO/∂cp|cruise 4150 4138,18 hp/h
∂WTO/∂ηp|cruise -3157,23 -3103,63 lbs
∂WTO/∂ηp|loiter -321,14 -318,12 lbs
∂WTO/∂(L/D)|loiter -20,43 -20,24 lbs
∂WTO/∂(L/D)|cruise -280,64 -275,88 lbs

Tatiana Quercia – Airplane Design 14
WING LOADING, TAKE-OFF POWER LOADING AND MAXIMUM
LIFT COEFFICIENT
FAR 23 REQUIREMENTS
Stallspeed
Take-offdistance Climb Landing
distanceCruisespeed
Sizing to
Assumption:
Take-off and land in any Cuban International Airport
Shortest field lenght: 1295 m; almost all at sea level.
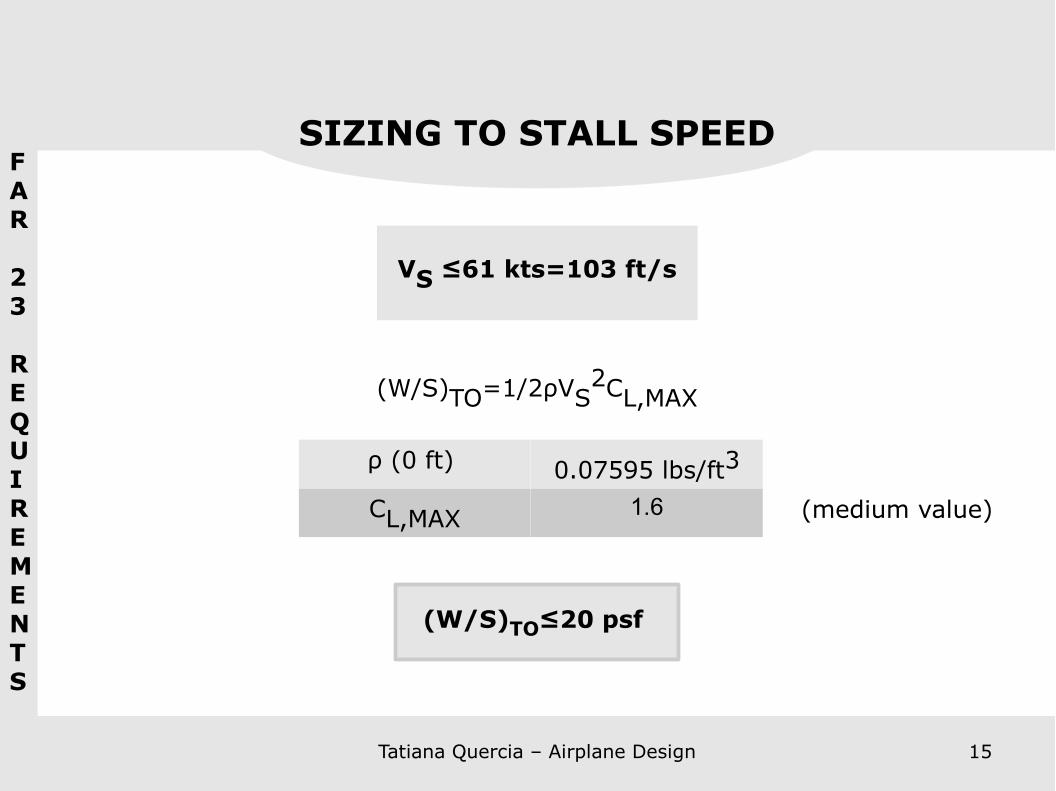
SIZING TO STALL SPEED
Tatiana Quercia – Airplane Design 15
FAR 23 REQUIREMENTS
VS ≤61 kts=103 ft/s
(W/S)TO=1/2ρVS2CL,MAX
ρ (0 ft) 0.07595 lbs/ft3
CL,MAX 1.6 (medium value)
(W/S)TO≤20 psf
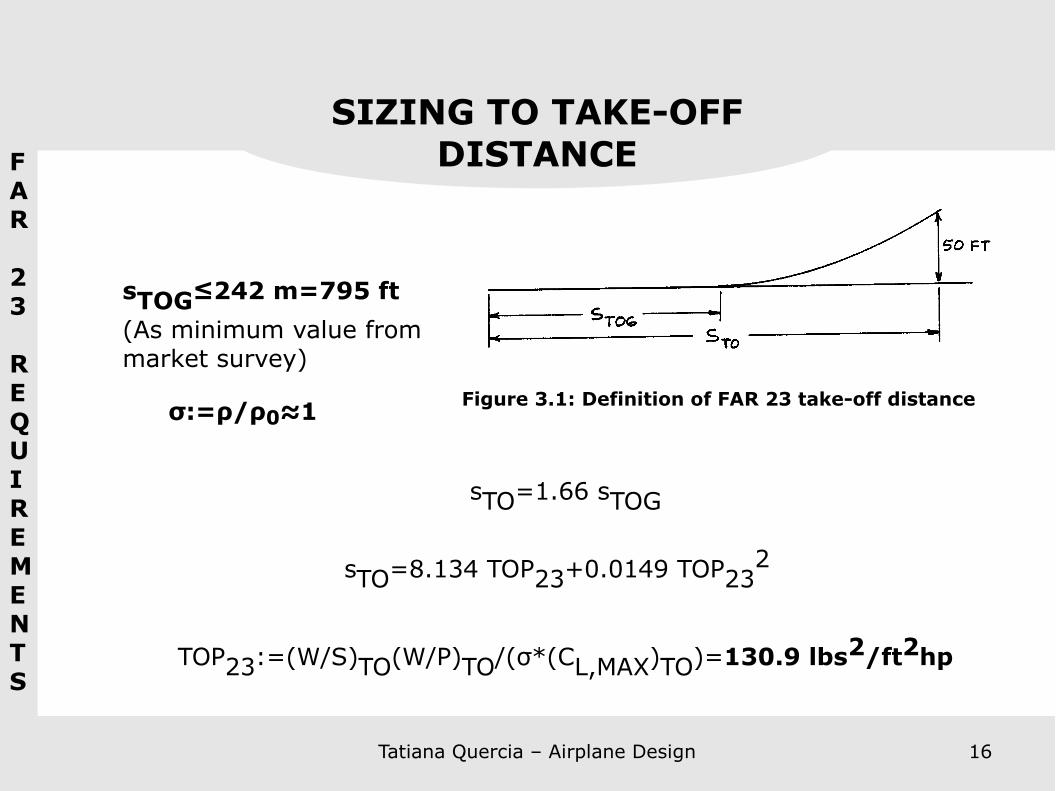
SIZING TO TAKE-OFFDISTANCE
Tatiana Quercia – Airplane Design 16
FAR 23 REQUIREMENTS
Figure 3.1: Definition of FAR 23 take-off distance
sTO=1.66 sTOG
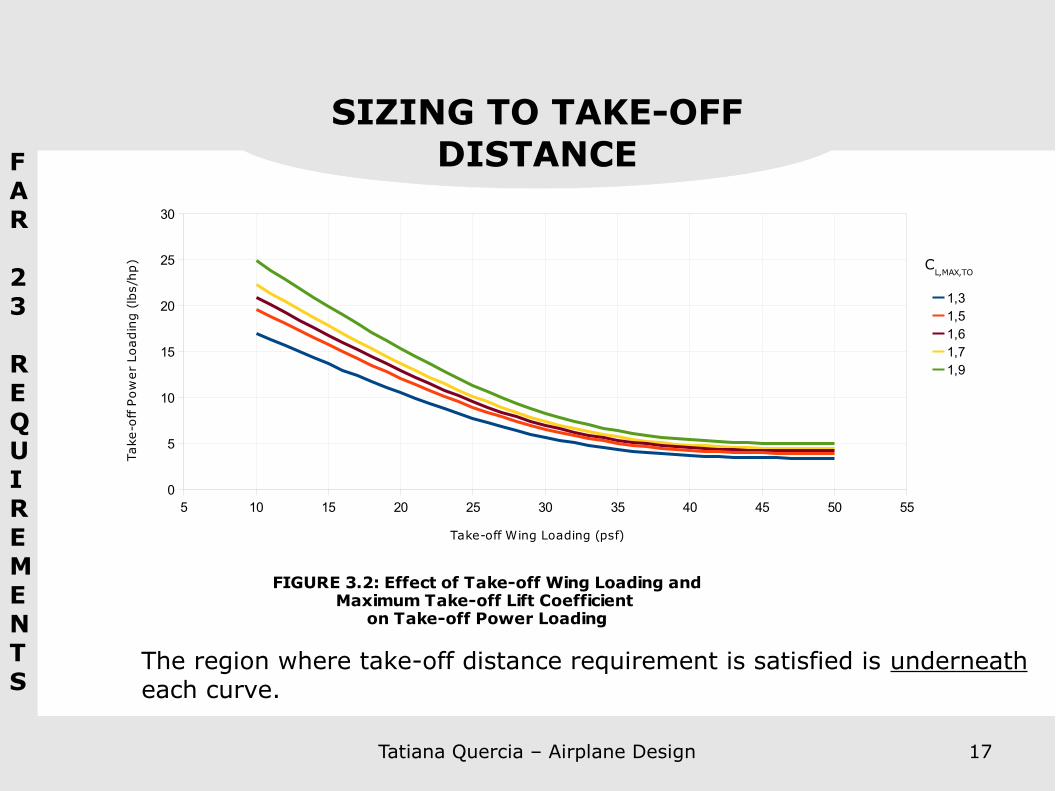
sTO=8.134 TOP23+0.0149 TOP232
TOP23:=(W/S)TO(W/P)TO/(σ*(CL,MAX)TO)=130.9 lbs2/ft2hp
sTOG≤242 m=795 ft(As minimum value from market survey)
σ:=ρ/ρ0≈1
5 10 15 20 25 30 35 40 45 50 550
5
10
15
20
25
30
FIGURE 3.2: Effect of Take-off Wing Loading andMaximum Take-off Lift Coefficient
on Take-off Power Loading
1,31,51,61,71,9
Take-off Wing Loading (psf)
Take
-off
Pow
er L
oadi
ng (
lbs/
hp) C
L,MAX,TO
Tatiana Quercia – Airplane Design 17
FAR 23 REQUIREMENTS
SIZING TO TAKE-OFFDISTANCE
The region where take-off distance requirement is satisfied is underneath each curve.
SIZING TO CLIMB
Tatiana Quercia – Airplane Design 18
FAR 23 REQUIREMENTS
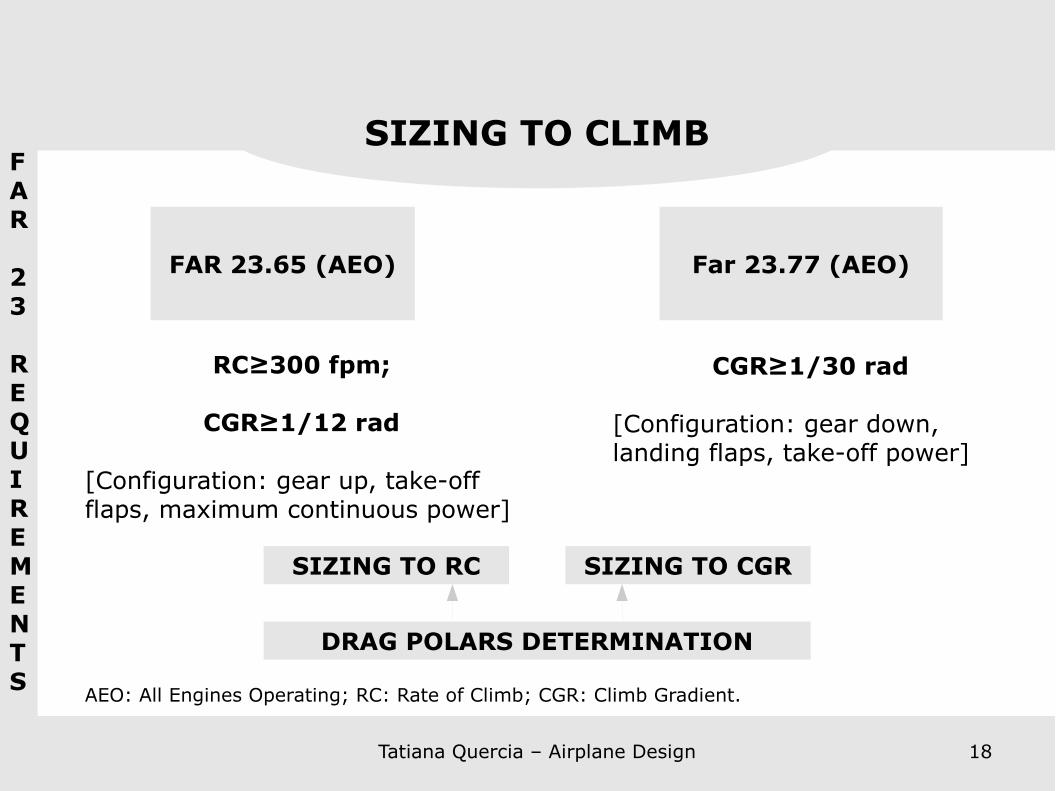
FAR 23.65 (AEO) Far 23.77 (AEO)
RC≥300 fpm;
CGR≥1/12 rad
[Configuration: gear up, take-off flaps, maximum continuous power]
CGR≥1/30 rad
[Configuration: gear down, landing flaps, take-off power]
SIZING TO RC SIZING TO CGR
AEO: All Engines Operating; RC: Rate of Climb; CGR: Climb Gradient.
DRAG POLARS DETERMINATION
DRAG POLARSDETERMINATION
Tatiana Quercia – Airplane Design 19
SIZING
TO CLIMB
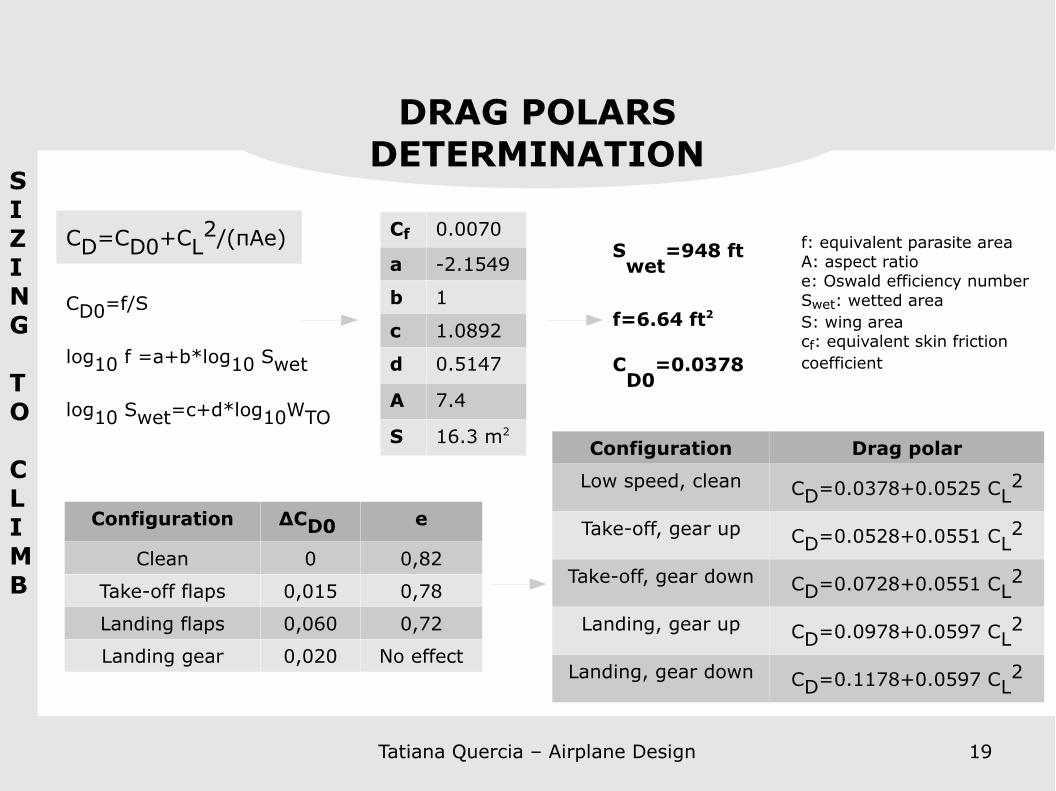
CD=CD0+CL2/(πAe)
CD0=f/S
log10 f =a+b*log10 Swet
log10 Swet=c+d*log10WTO
Configuration ΔCD0 e
Clean 0 0,82
Take-off flaps 0,015 0,78
Landing flaps 0,060 0,72
Landing gear 0,020 No effect
f: equivalent parasite areaA: aspect ratioe: Oswald efficiency numberSwet: wetted areaS: wing areacf: equivalent skin friction coefficient
Cf 0.0070
a -2.1549
b 1
c 1.0892
d 0.5147
A 7.4
S 16.3 m2
Swet
=948 ft
f=6.64 ft2
CD0
=0.0378
Configuration Drag polar
Low speed, clean CD=0.0378+0.0525 CL2
Take-off, gear up CD=0.0528+0.0551 CL2
Take-off, gear down CD=0.0728+0.0551 CL2
Landing, gear up CD=0.0978+0.0597 CL2
Landing, gear down CD=0.1178+0.0597 CL2
SIZING
TO CLIMB
Tatiana Quercia – Airplane Design 20
SIZING TO RATE OF CLIMB
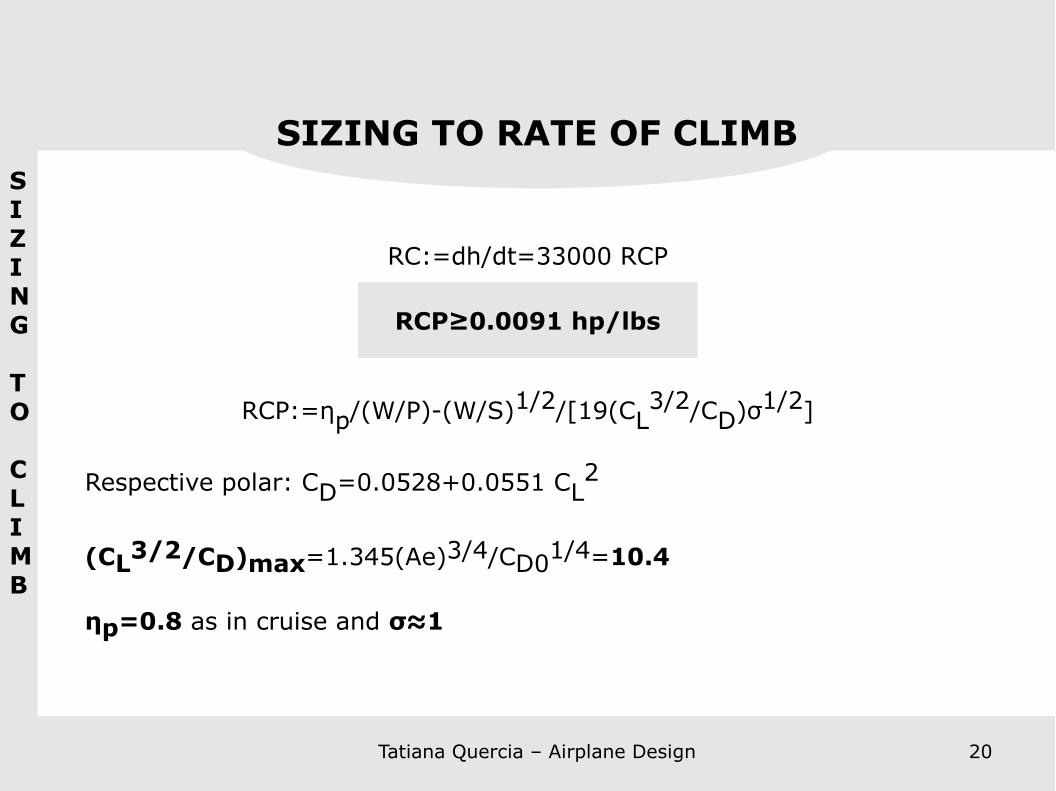
RC:=dh/dt=33000 RCP
RCP:=ηp/(W/P)-(W/S)1/2/[19(CL3/2/CD)σ1/2]
RCP≥0.0091 hp/lbs
Respective polar: CD=0.0528+0.0551 CL2
(CL3/2/CD)max=1.345(Ae)3/4/CD01/4=10.4
ηp=0.8 as in cruise and σ≈1
SIZING
TO CLIMB
Tatiana Quercia – Airplane Design 21
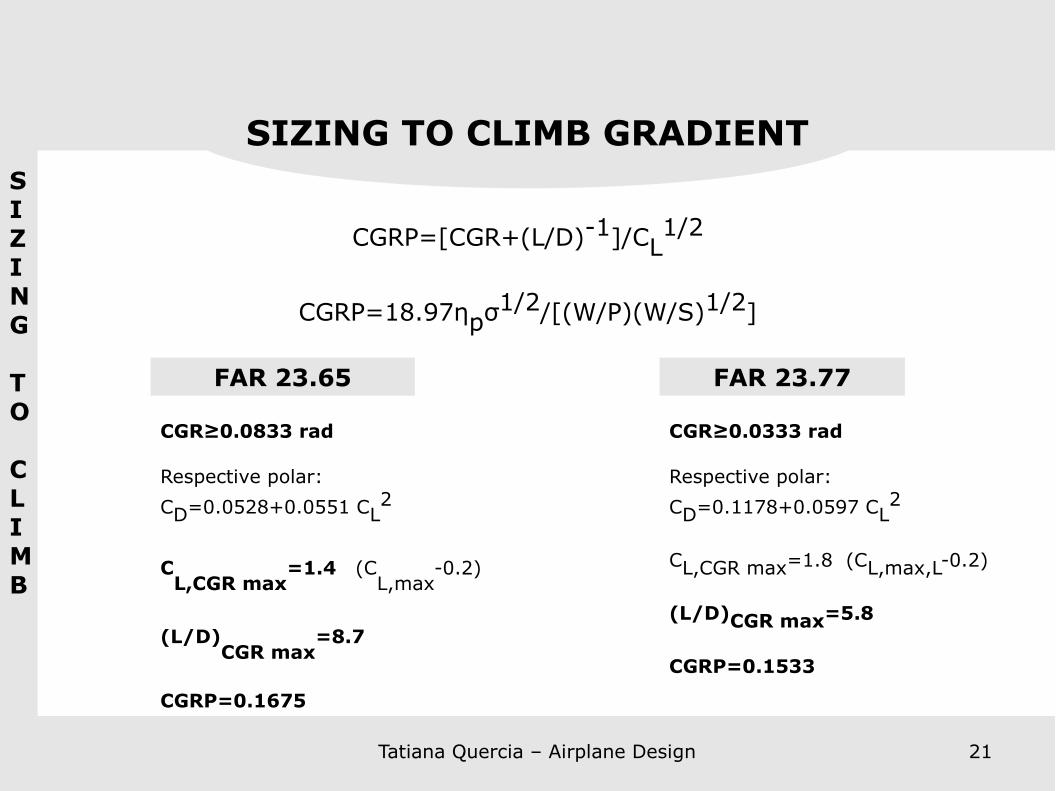
SIZING TO CLIMB GRADIENT
CGRP=[CGR+(L/D)-1]/CL1/2
CGRP=18.97ηpσ1/2/[(W/P)(W/S)1/2]
FAR 23.65 FAR 23.77
CGR≥0.0833 rad
Respective polar: CD=0.0528+0.0551 CL
2
C
L,CGR max=1.4 (C
L,max-0.2)
(L/D)CGR max
=8.7
CGRP=0.1675
CGR≥0.0333 rad
Respective polar:CD=0.1178+0.0597 CL
2
CL,CGR max=1.8 (CL,max,L-0.2)
(L/D)CGR max=5.8
CGRP=0.1533
15 20 25 30 35 40 45 50 550
5
10
15
20
25
30
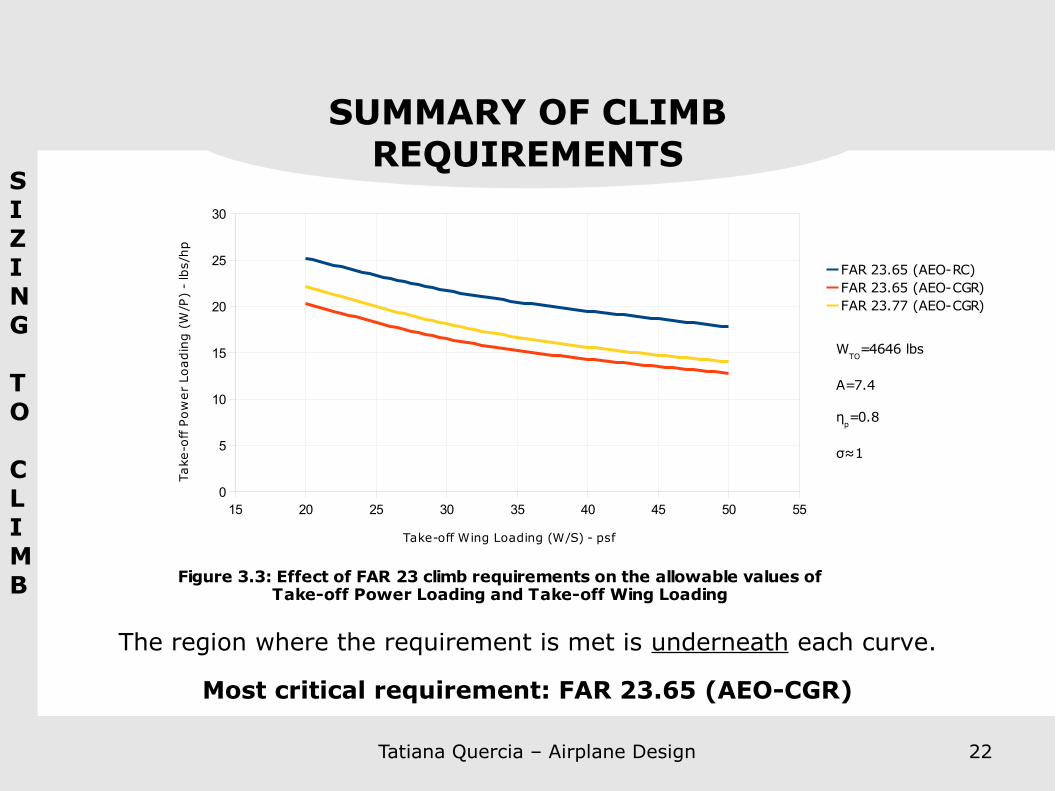
Figure 3.3: Effect of FAR 23 climb requirements on the allowable values ofTake-off Power Loading and Take-off Wing Loading
FAR 23.65 (AEO-RC)FAR 23.65 (AEO-CGR)FAR 23.77 (AEO-CGR)
Take-off Wing Loading (W/S) - psf
Take
-off
Pow
er L
oadi
ng (
W/P
) -
lbs/
hp
WTO
=4646 lbs
A=7.4
ηp=0.8
σ≈1
SUMMARY OF CLIMBREQUIREMENTS
SIZING
TO CLIMB
Tatiana Quercia – Airplane Design 22
The region where the requirement is met is underneath each curve.
Most critical requirement: FAR 23.65 (AEO-CGR)
SIZING TO LANDINGDISTANCE
Tatiana Quercia – Airplane Design 23
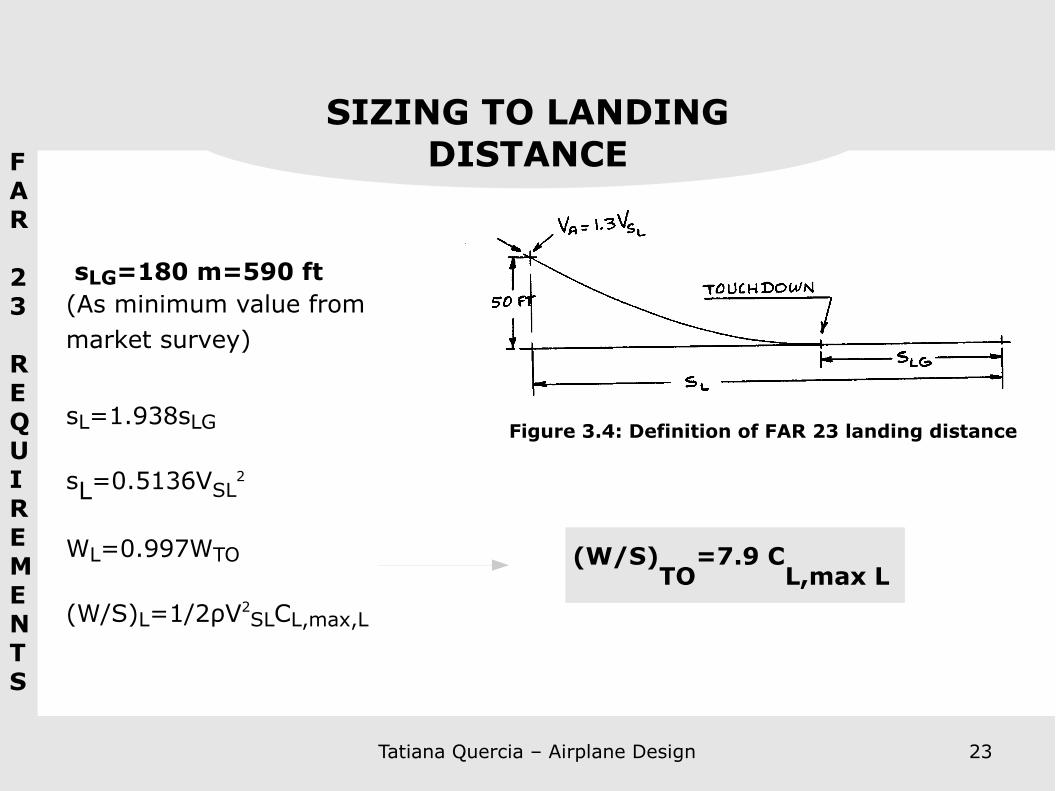
Figure 3.4: Definition of FAR 23 landing distance
sLG=180 m=590 ft(As minimum value from market survey)
sL=1.938sLG
sL=0.5136VSL2
WL=0.997WTO
(W/S)L=1/2ρV2SLCL,max,L
(W/S)TO
=7.9 CL,max L
FAR 23 REQUIREMENTS
12 13 14 15 16 17 180
1
2
3
4
5
6
7
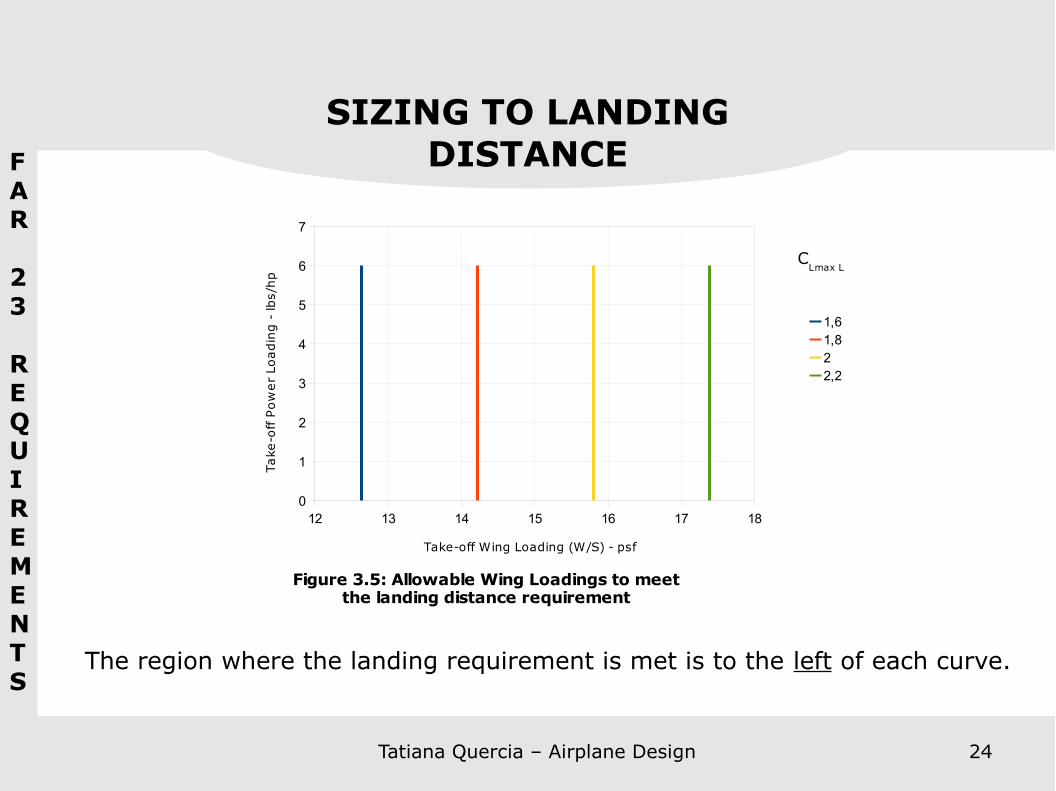
Figure 3.5: Allowable Wing Loadings to meetthe landing distance requirement
1,61,822,2
Take-off Wing Loading (W/S) - psf
Take
-off
Pow
er L
oadi
ng -
lbs/
hpC
Lmax L
SIZING TO LANDINGDISTANCEF
AR 23 REQUIREMENTS
The region where the landing requirement is met is to the left of each curve.
Tatiana Quercia – Airplane Design 24
SIZING TO LANDINGDISTANCE
FAR 23 REQUIREMENTS
SIZING TO LANDINGDISTANCESIZING TO CRUISE SPEED
Tatiana Quercia – Airplane Design
0 20 40 60 80 100 1200
10
20
30
40
50
60
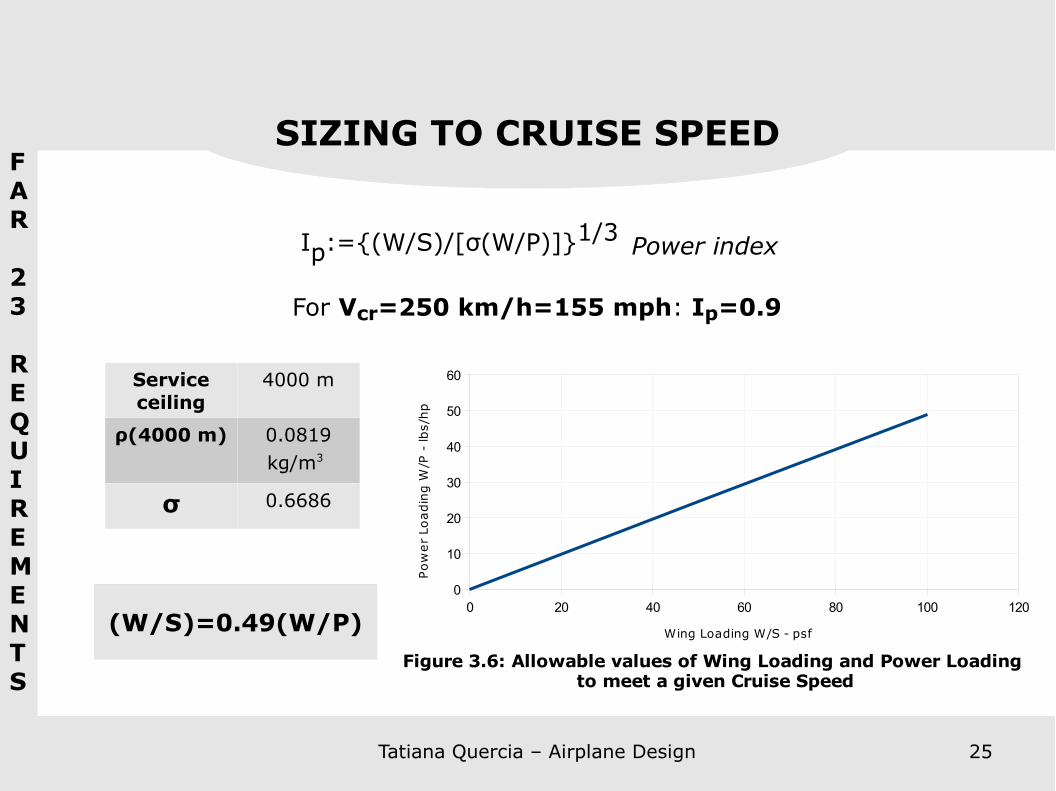
Figure 3.6: Allowable values of Wing Loading and Power Loading to meet a given Cruise Speed
Wing Loading W/S - psf
Pow
er
Load
ing
W/P
- lb
s/hp
Tatiana Quercia – Airplane Design 25
Ip:={(W/S)/[σ(W/P)]}1/3
For Vcr=250 km/h=155 mph: Ip=0.9
Service ceiling
4000 m
ρ(4000 m) 0.0819 kg/m3
σ 0.6686
(W/S)=0.49(W/P)
Power index

0 10 20 30 40 50 600
5
10
15
20
25
30
35
Figure 3.7: Combination of FAR 23 requirements
FAR 23.65 (AEO-CGR)CLmax L=1.6CLmax L=2.2CL, max,TO=1.3CL, max,TO=1.9cruise speedstall speed
Take-off Wing Loading (W/S) - psf
Take
-off
Pow
er L
oadi
ng (
W/P
) -
lbs/
hp
FAR 23 REQUIREMENTS
Tatiana Quercia – Airplane Design 26
SUMMARY OF FAR 23REQUIREMENTS
Best combination: node between cruise speed requirement (yellow) and maximum landing requirement (light blue)
(W/S)TO=17 psf
(W/P)TO=8.5 lbs/hp

WING SHAPE ESTIMATION
Tatiana Quercia – Airplane Design 27
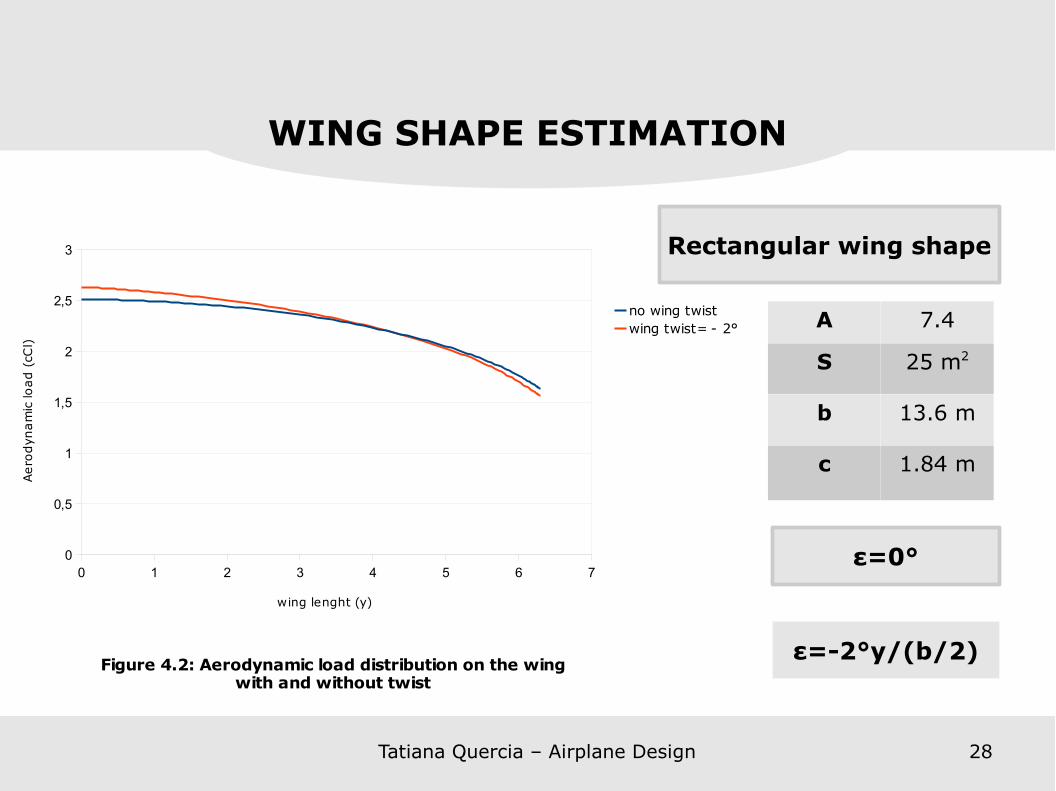
Schrenk's Method
Distribution on the wing of the aerodynamic load (cCl)
c: chord of the airfoil;Cl: lift coefficient of the airfoil;b: wingspan;y: variable standing for the length of the wing;cCl,a: additional aerodynamic load, it describes the effect of the wing plant only;cCl,a1: for CL=1;cCl,b:base aerodynamic load, it describes the effect of the wing twist;Clα=∂Cl/∂α=2π (α: angle of attack) as for the ideal airfoil;ε1(y) is the rotation due to wing twist;ε0 : rotation for zero lift;α0L: angle of attack at leading edge for zero lift.
cCl=cCl,a+cCl,b
cCl=cCl,a1CL+cCl,b
cCl,a1=(c+cell)/2
cell=4S[1-y2/(b/2)2]1/2/(πb)
cCl,b=1/2cClαε1(y)
ε1=α0L+ε0
α0L=- /∫0
b /2
cε0dy ∫0
b /2
cdy
0 1 2 3 4 5 6 70
0,5
1
1,5
2
2,5
3
Figure 4.2: Aerodynamic load distribution on the wingwith and without twist
no wing twistwing twist= - 2°
wing lenght (y)
Aero
dyna
mic
load
(cC
l)
WING SHAPE ESTIMATION
Tatiana Quercia – Airplane Design 28
Rectangular wing shape
ε=0°
ε=-2°y/(b/2)
A 7.4
S 25 m2
b 13.6 m
c 1.84 m

Tatiana Quercia – Airplane Design 29
CONCLUSIONS
WTO 2108 kg
WE 1178 kg
WF 455 kg
CL,max 1,6
CL,max TO 1,2
CL,max L 2,2
A 7,4(W/S)TO 17 psf
(W/P)TO 8,5 lbs/hp
S 25 m2
PTO 546 hp
Wing shape Rectangular without twist
Critical values in comparison to market survey are marked in bold.
Recommended