Targeting Your Voter Universe
Paid for by Democracy for America, www.democracyforamerica.com, and not authorized by any
candidate or candidate’s committee.
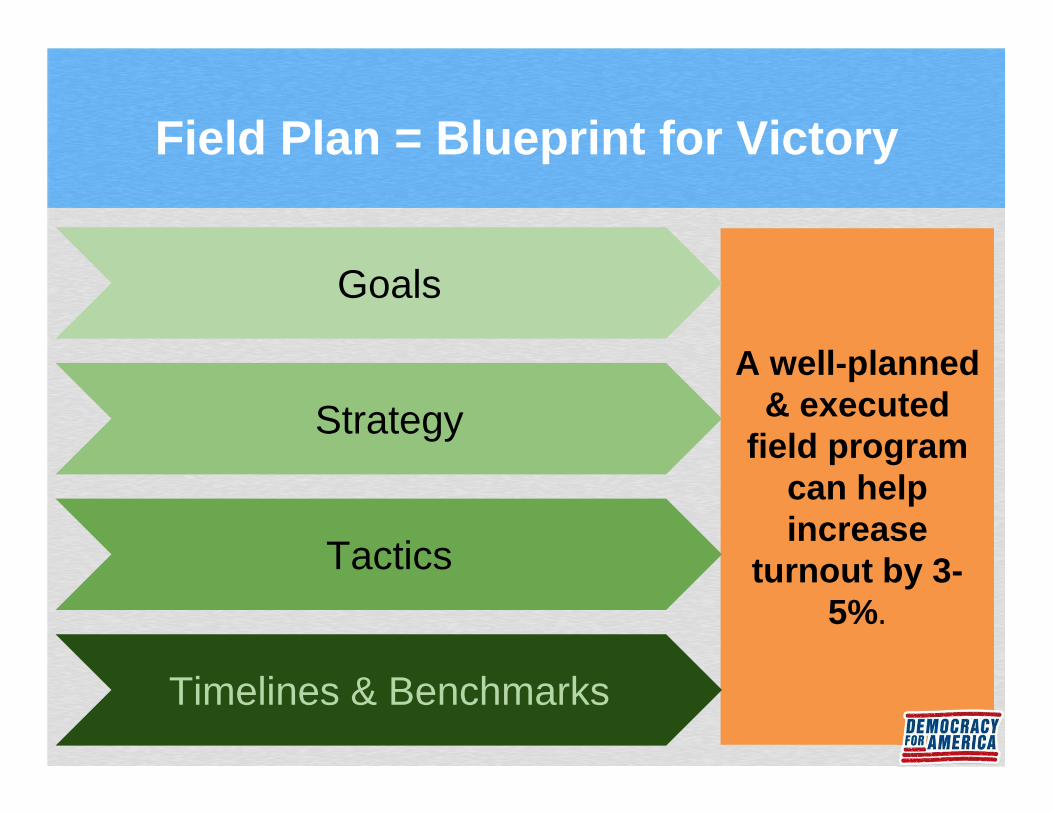
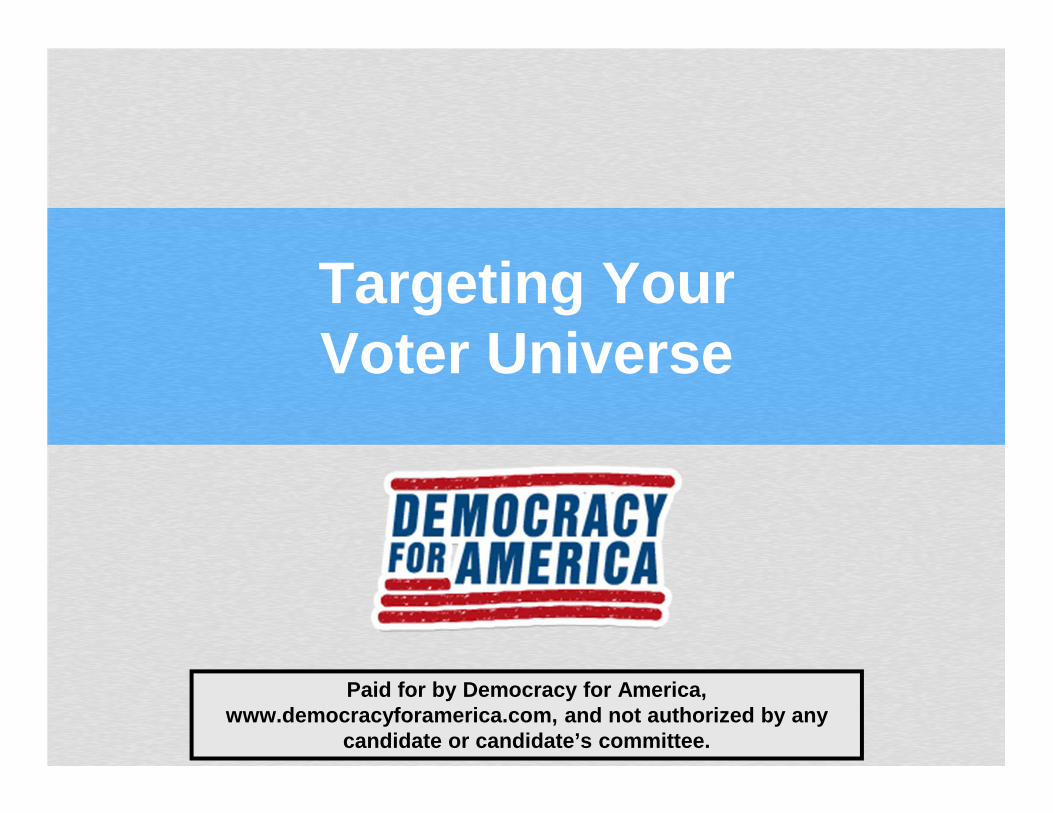
Field Plan = Blueprint for Victory
A well-planned & executed
field program can helpincrease
turnout by 3-5%.
Goals
Strategy
Tactics
Timelines & Benchmarks
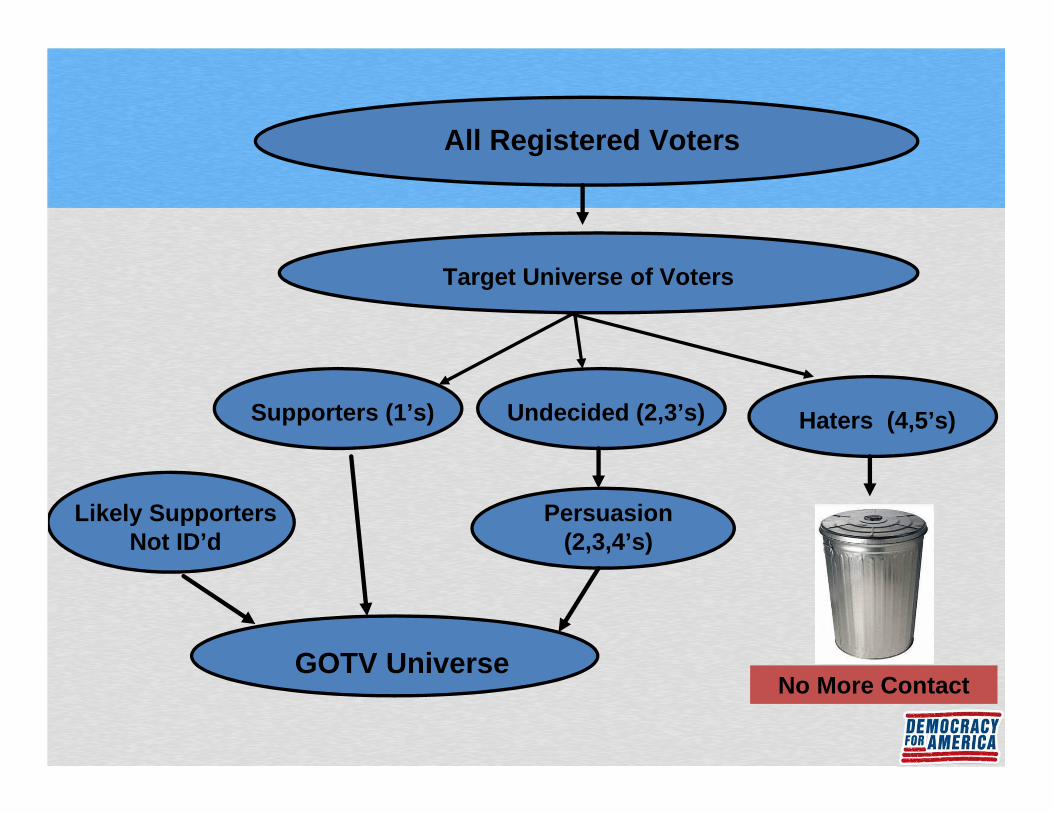
All Registered Voters
Target Universe of Voters
Supporters (1’s) Undecided (2,3’s) Haters (4,5’s)
Persuasion (2,3,4’s)
GOTV Universe
Likely Supporters Not ID’d
No More Contact
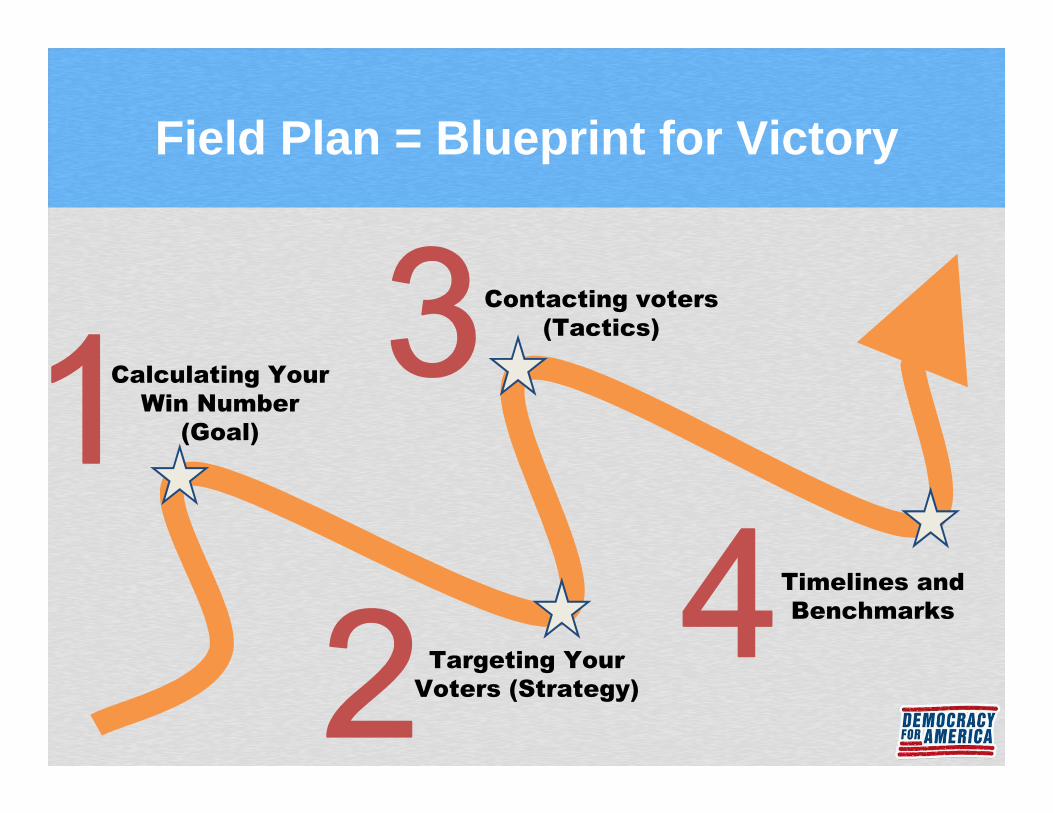
Field Plan = Blueprint for Victory
Calculating Your
Win Number
(Goal)
Targeting Your
Voters (Strategy)
Contacting voters
(Tactics)
Timelines and
Benchmarks
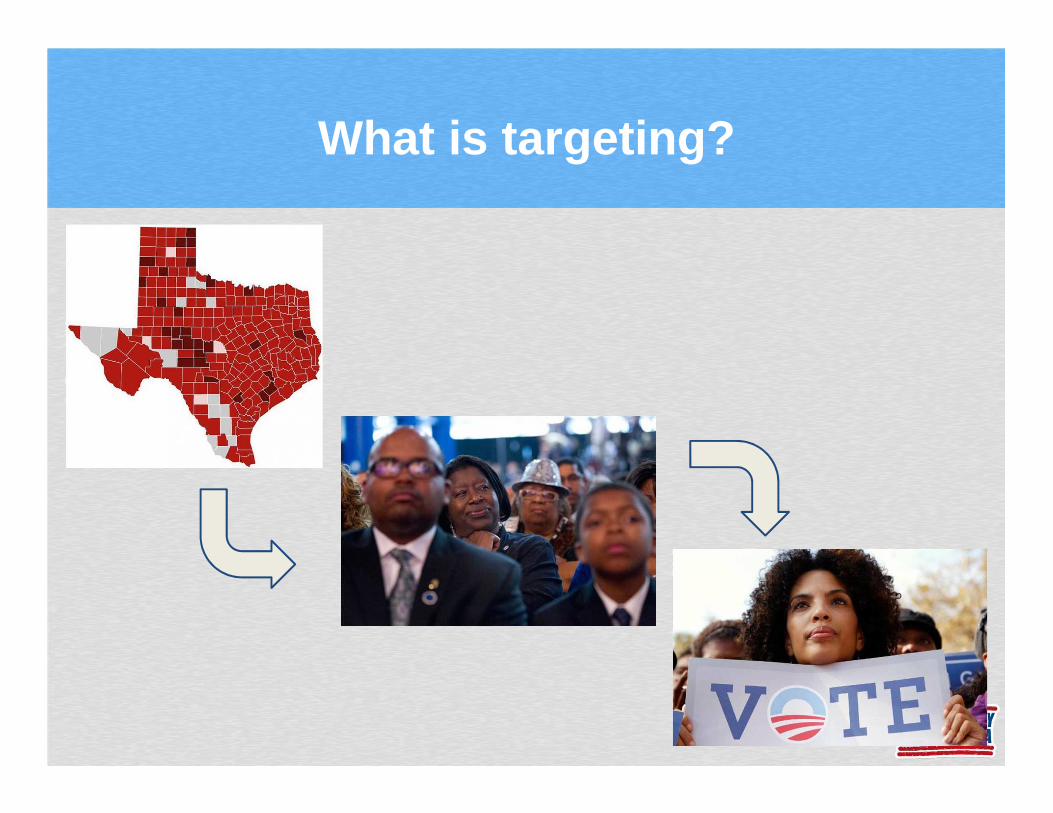
What is targeting?
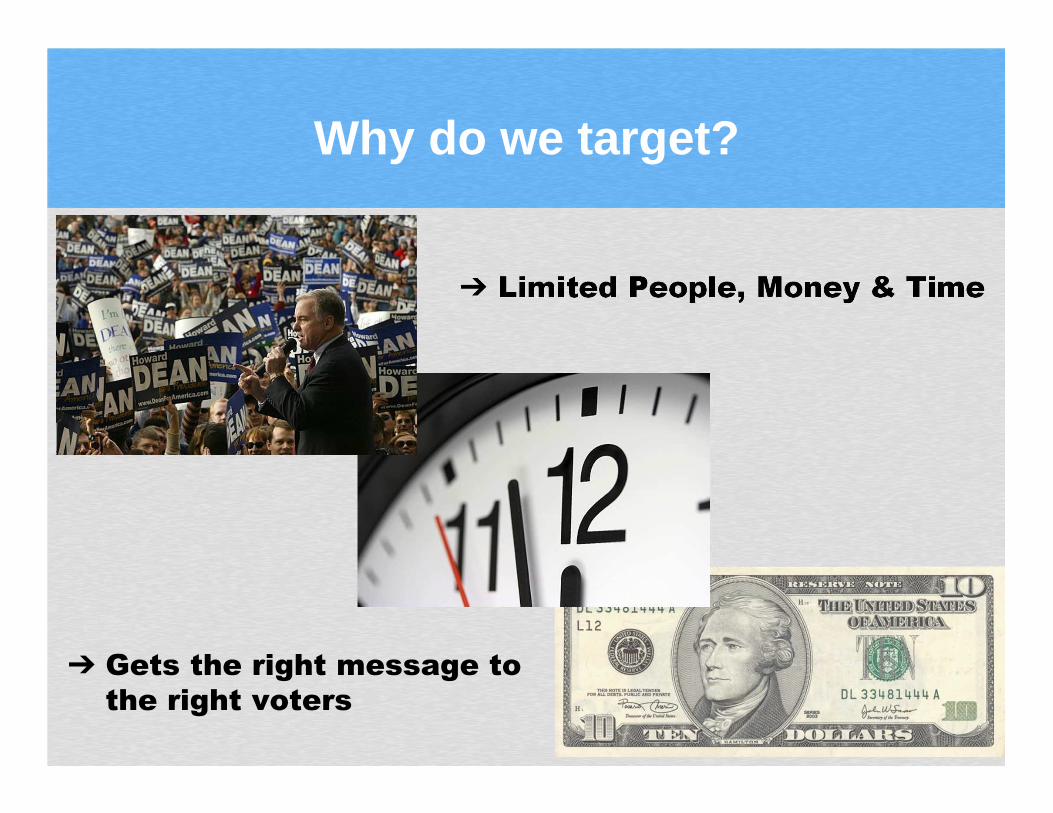
Why do we target?
➔ Limited People, Money & Time
➔ Gets the right message to
the right voters
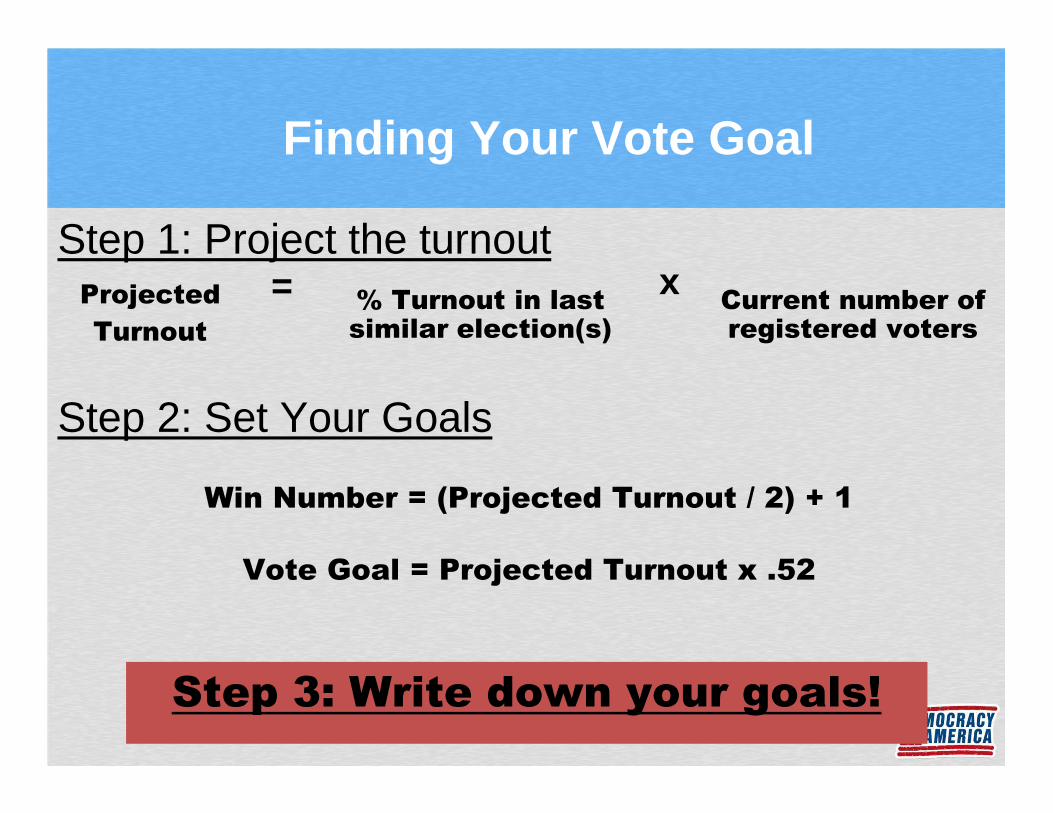
Finding Your Vote Goal
Win Number = (Projected Turnout / 2) + 1
Vote Goal = Projected Turnout x .52
Step 2: Set Your Goals
Step 1: Project the turnout% Turnout in last similar election(s)
Current number of registered voters
xProjected
Turnout
=
Step 3: Write down your goals!
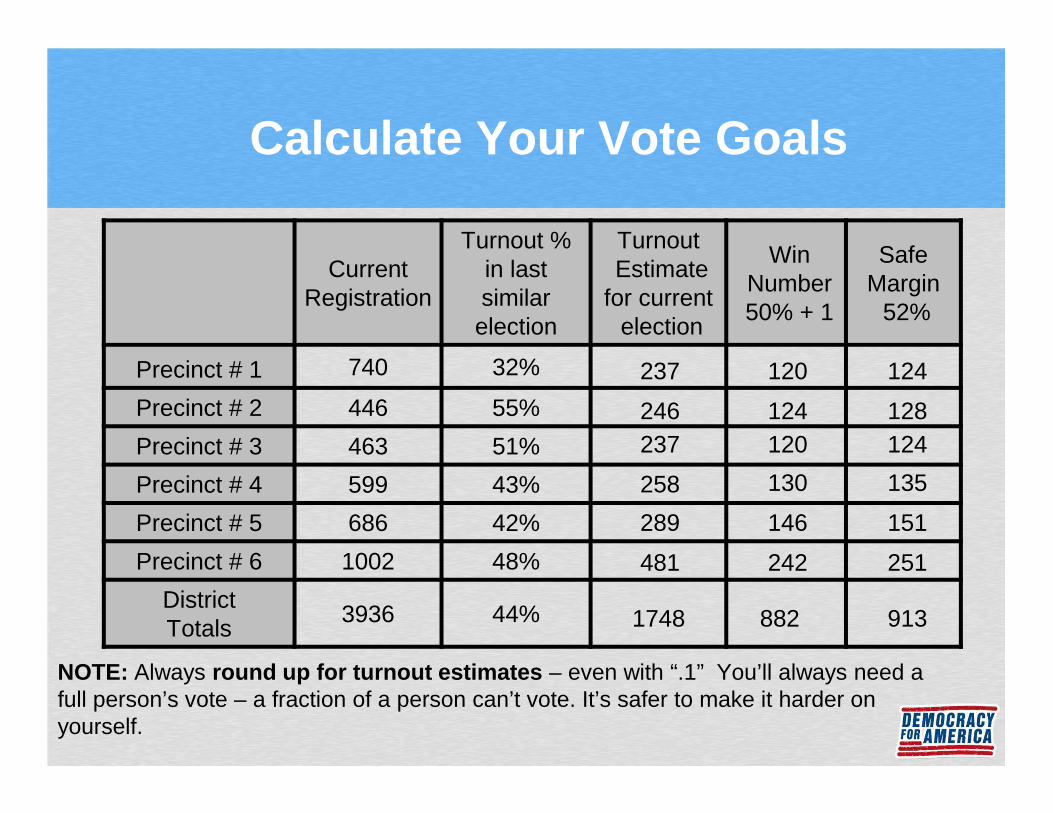
Calculate Your Vote Goals
Current Registration
Turnout % in last similar election
TurnoutEstimate
for currentelection
WinNumber 50% + 1
Safe Margin
52%
Precinct # 1 740 32%
Precinct # 2 446 55%
Precinct # 3 463 51%
Precinct # 4 599 43%
Precinct # 5 686 42%
Precinct # 6 1002 48%
DistrictTotals
3936 44%
237
246237
258
289
481
1748
120 124
124 128120 124
130 135
146 151
242 251
882 913
NOTE: Always round up for turnout estimates – even with “.1” You’ll always need a full person’s vote – a fraction of a person can’t vote. It’s safer to make it harder on yourself.
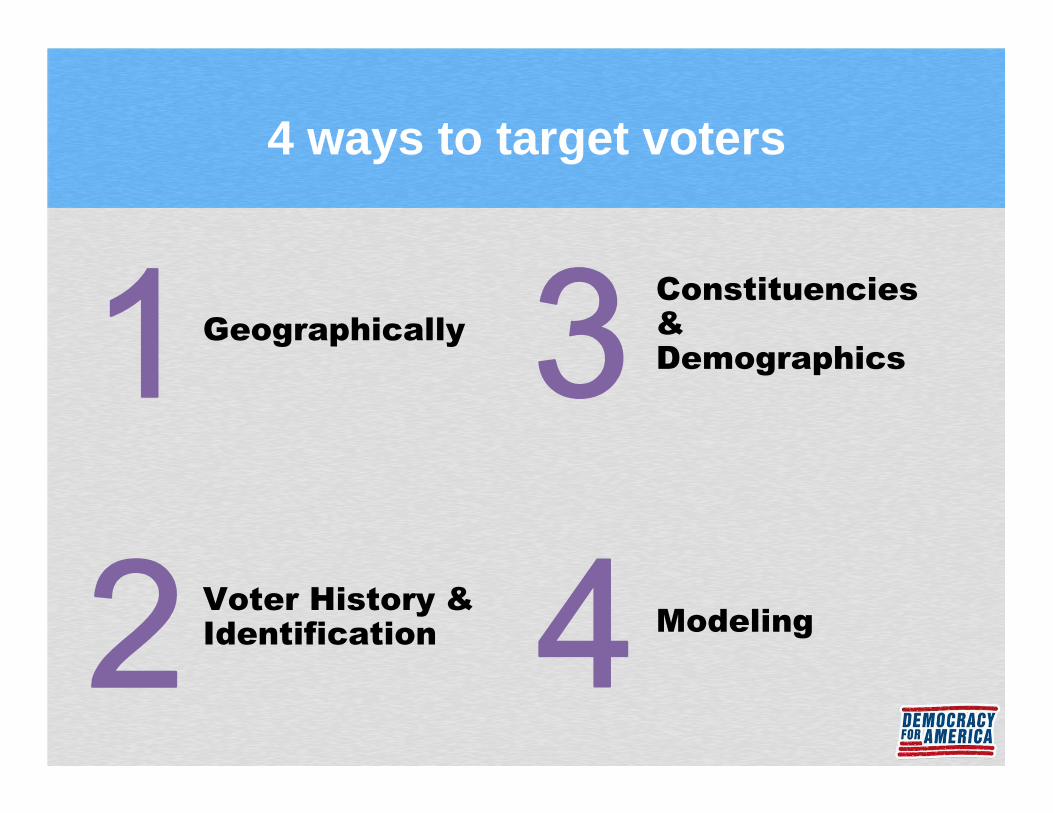
4 ways to target voters
Modeling
Constituencies & Demographics
Geographically
Voter History & Identification
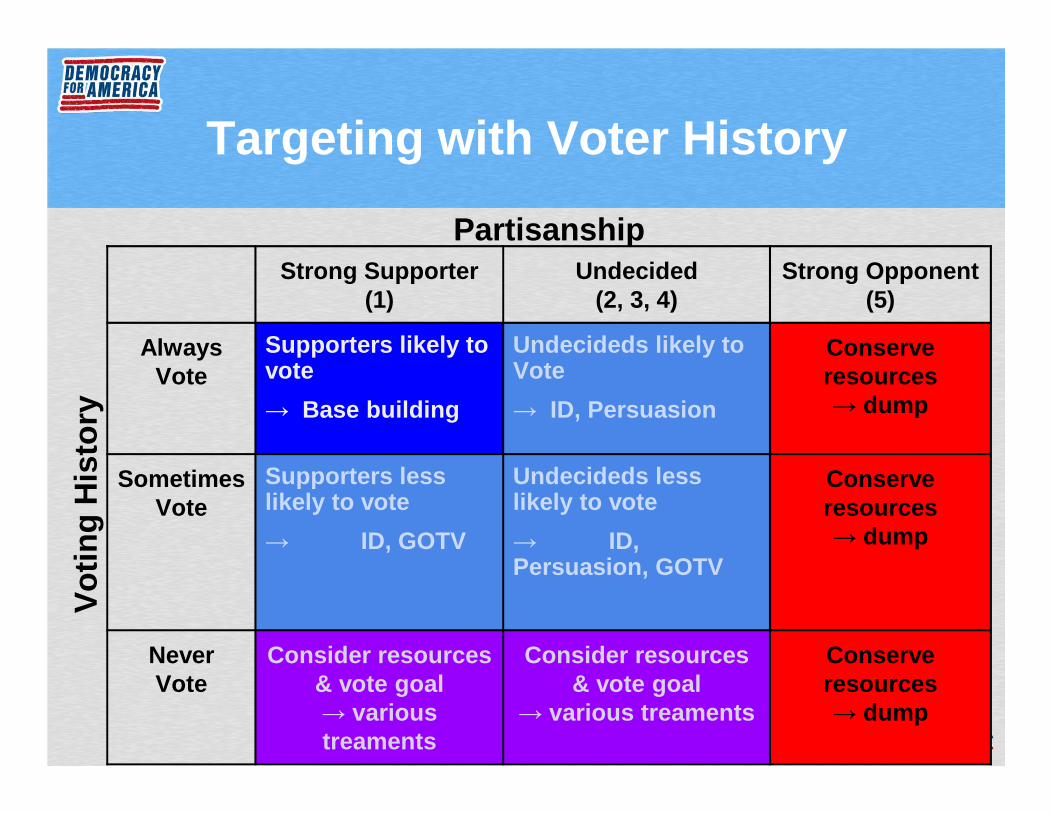
Targeting with Voter History
Strong Supporter (1)
Undecided (2, 3, 4)
Strong Opponent (5)
Always Vote
Supporters likely to vote
→ Base building
Undecideds likely to Vote
→ ID, Persuasion
Conserve resources → dump
Sometimes Vote
Supporters less likely to vote
→ ID, GOTV
Undecideds less likely to vote
→ ID, Persuasion, GOTV
Conserve resources → dump
Never Vote
Consider resources & vote goal → various treaments
Consider resources & vote goal
→ various treaments
Conserve resources → dump
Partisanship
Vot
ing
His
tory
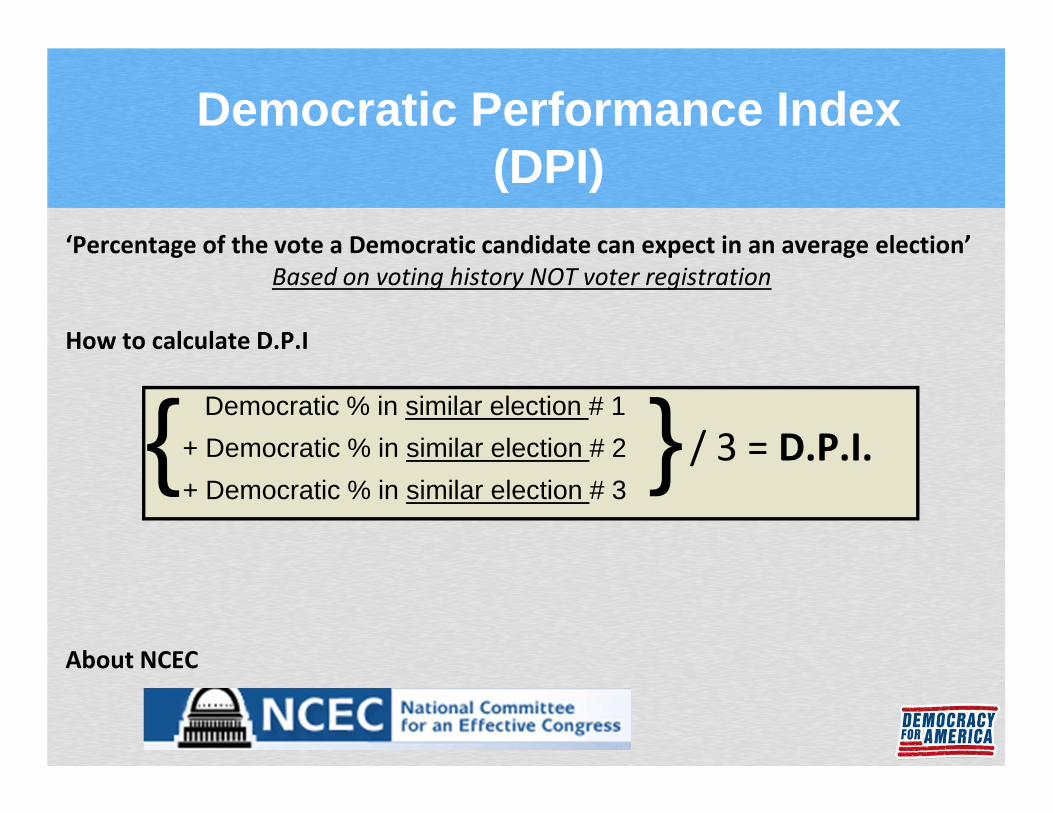
Democratic Performance Index (DPI)
‘Percentage of the vote a Democratic candidate can expect in an average election’
Based on voting history NOT voter registration
How to calculate D.P.I
About NCEC
Democratic % in similar election # 1
+ Democratic % in similar election # 2
+ Democratic % in similar election # 3
/ 3 = D.P.I.{ }

Calculate Your Dem & Persuasion Turnout
D.P.I. %Est.Dem.
Turnout
Vote Difference
Persuasion %
Persuadable Voters
Precinct # 1 69% 12%
Precinct # 2 21% 8%
Precinct # 3 36% 33%
Precinct # 4 43% 19%
Precinct # 5 38% 39%
Precinct # 6 48% 21%
DistrictTotals
43% 22%
163 +39 28
-77 19
-39 78
-25 49-42 112
-21 101
-165 382
51
85
110109
230
748
NOTE: You’ll want to round down for Est. Dem turnout and persuadable voters . Again, you want to make it harder on yourself.
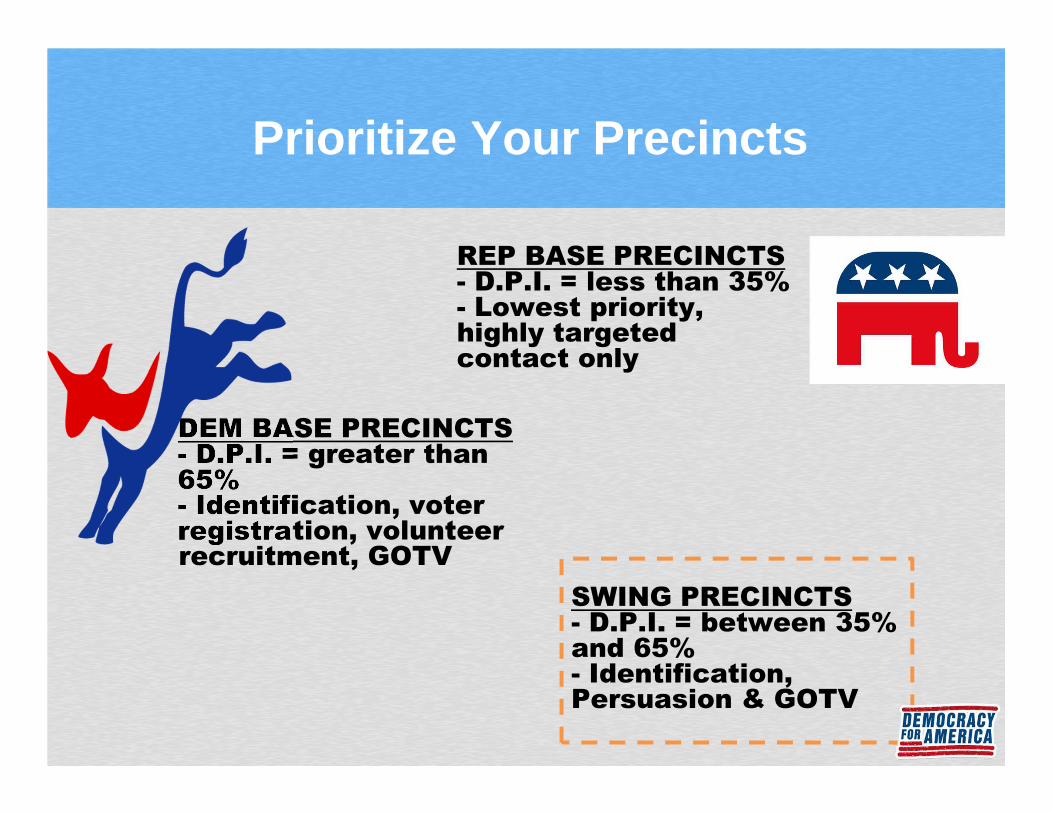
Prioritize Your Precincts
DEM BASE PRECINCTS- D.P.I. = greater than 65%- Identification, voter registration, volunteer recruitment, GOTV
REP BASE PRECINCTS- D.P.I. = less than 35%- Lowest priority, highly targeted contact only
SWING PRECINCTS - D.P.I. = between 35% and 65%- Identification, Persuasion & GOTV
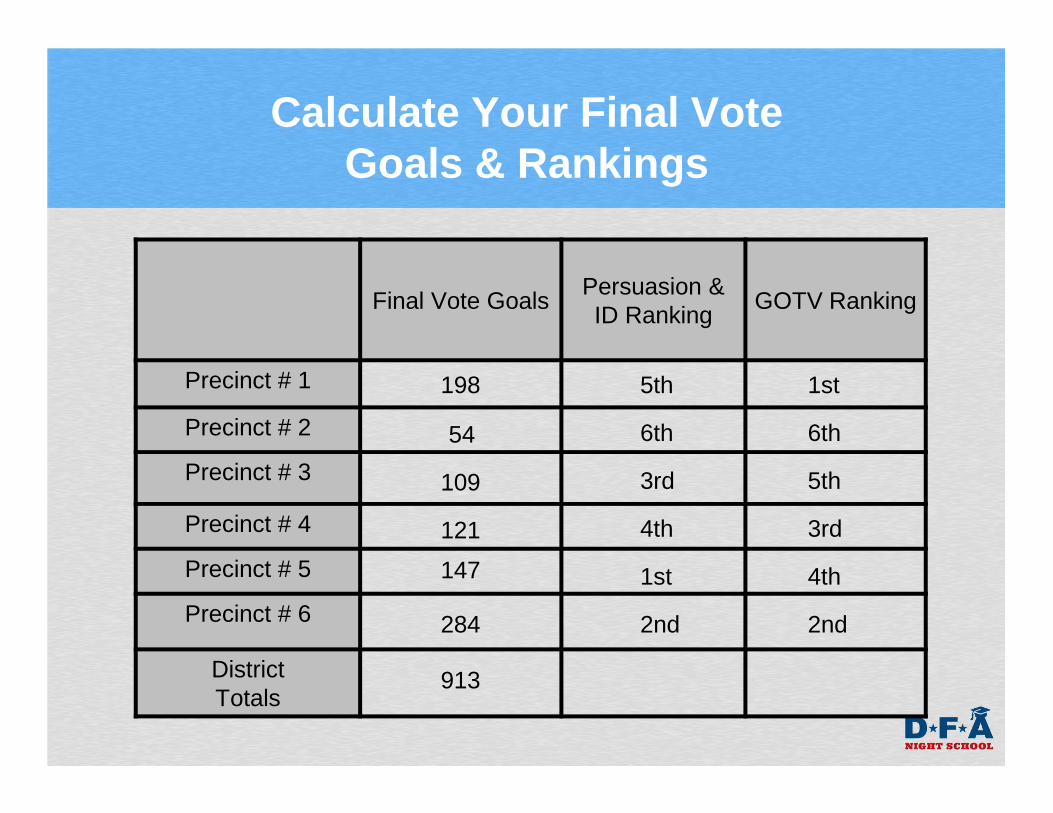
Calculate Your Final Vote Goals & Rankings
Final Vote GoalsPersuasion & ID Ranking
GOTV Ranking
Precinct # 1
Precinct # 2
Precinct # 3
Precinct # 4
Precinct # 5
Precinct # 6
DistrictTotals
198
54
109
121
147
284
913
2nd
1st
3rd
4th
5th
6th
1st
2nd
3rd
4th
5th
6th

Targeting by Constituency
➔ Look at your candidate and message
➔ Look at your identified supporters
➔ Meet with community leaders early
➔ Build bases of support➔ Seek endorsements➔ Target niche media

Recommended