Tanker supply until 2015Platts
Navigating Through Market Challengesby
[email protected] Research and Projects
Athens 26 October 2009
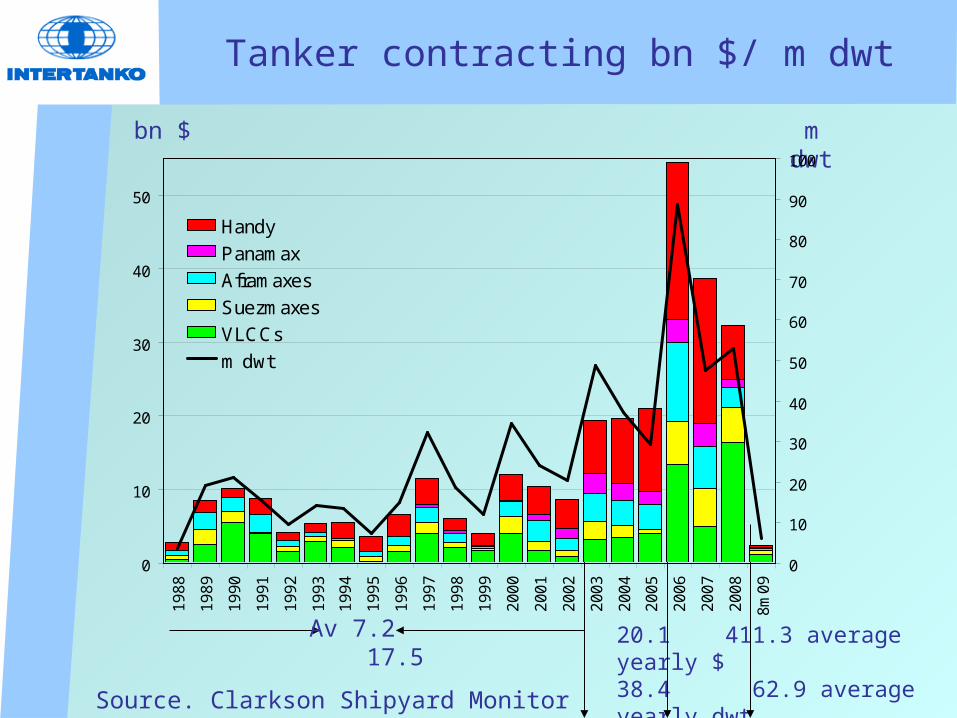
Tanker contracting bn $/ m dwt
bn $
Source. Clarkson Shipyard Monitor
m dwt
Av 7.2 17.5
20.1 411.3 average yearly $ 38.4 62.9 average yearly dwt
0
10
20
30
40
501
98
8
19
89
19
90
19
91
19
92
19
93
19
94
19
95
19
96
19
97
19
98
19
99
20
00
20
01
20
02
20
03
20
04
20
05
20
06
20
07
20
08
8m
09
0
10
20
30
40
50
60
70
80
90
100
Handy
Panamax
Aframaxes
Suezmaxes
VLCCs
m dwt
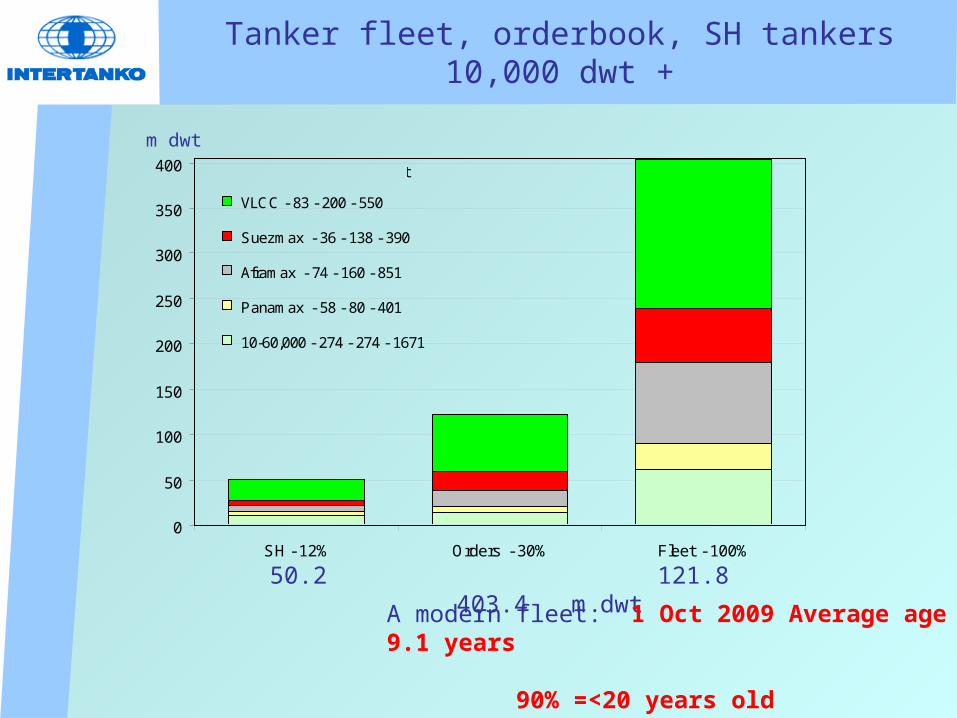
Tanker fleet, orderbook, SH tankers10,000 dwt +
50.2 121.8 403.4 m dwt
m dwt
A modern fleet: 1 Oct 2009 Average age 9.1 years 90% =<20 years old 79% =<15 years old 67% =<10 years old
0
50
100
150
200
250
300
350
400
SH - 12% Orders - 30% Fleet - 100%
VLCC - 83 - 200 - 550
Suezmax - 36 - 138 - 390
Aframax - 74 - 160 - 851
Panamax - 58 - 80 - 401
10-60,000 - 274 - 274 - 1671
14%
38%
36%
Segment - SH - Orders - fleet
20%24%
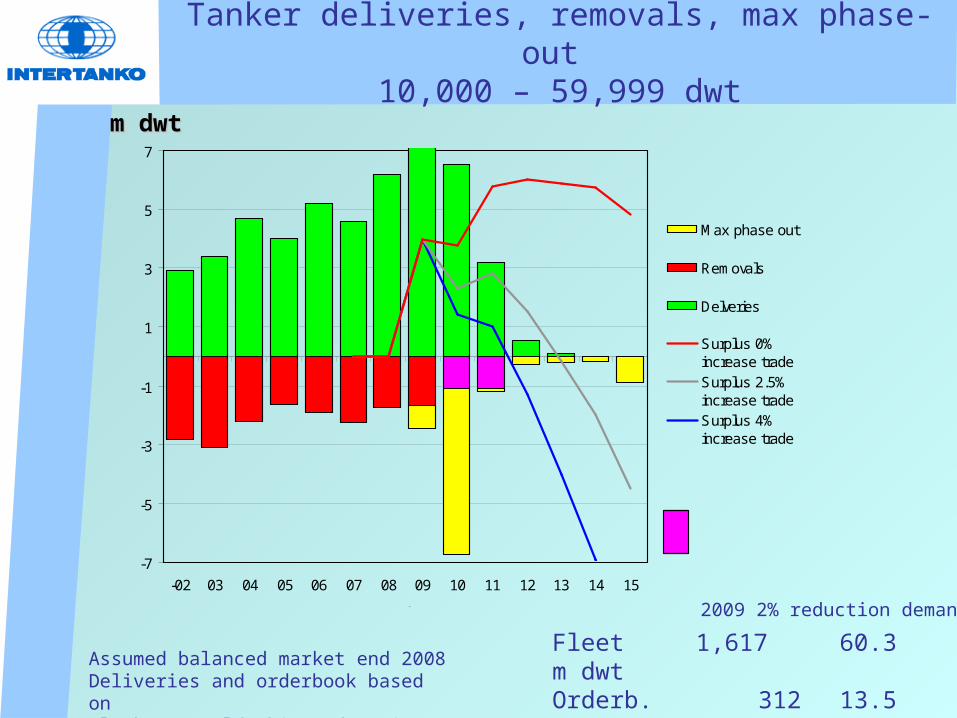
Tanker deliveries, removals, max phase-out 10,000 – 59,999 dwt
m dwtm dwt
Assumed balanced market end 2008Deliveries and orderbook based on Clarkson World Shipyard Monitor
Fleet 1,617 60.3 m dwtOrderb. 312 13.5 “ 22%Not DH 356 11.2 ” 20%
2009 2% reduction demand
-7
-5
-3
-1
1
3
5
7
-02 03 04 05 06 07 08 09 10 11 12 13 14 15
Max phase out
Removals
Delveries
Surplus 0%increase tradeSurplus 2.5%increase tradeSurplus 4%increase trade
year
Tonnage overhang
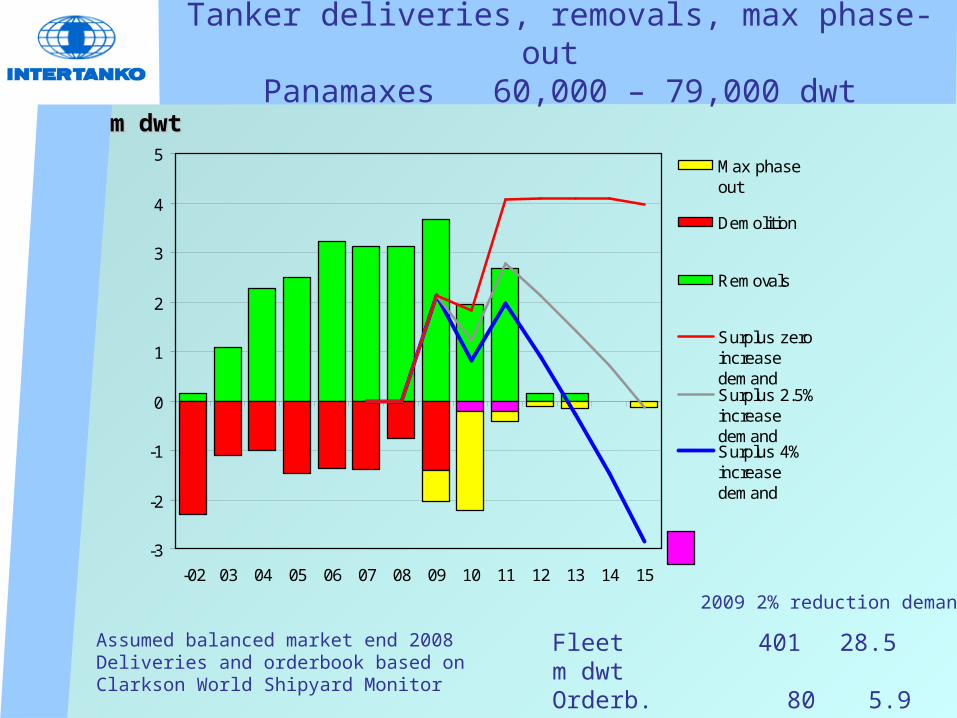
Tanker deliveries, removals, max phase-out Panamaxes 60,000 – 79,000 dwt
m dwtm dwt
Assumed balanced market end 2008Deliveries and orderbook based on Clarkson World Shipyard Monitor
Fleet 401 28.5 m dwtOrderb. 80 5.9 “ 21%Not DH 58 3.9 ” 14%
2009 2% reduction demand
-3
-2
-1
0
1
2
3
4
5
-02 03 04 05 06 07 08 09 10 11 12 13 14 15
Max phaseout
Demolition
Removals
Surplus zeroincreasedemandSurplus 2.5%increasedemandSurplus 4%increasedemand
Tonnage overhang
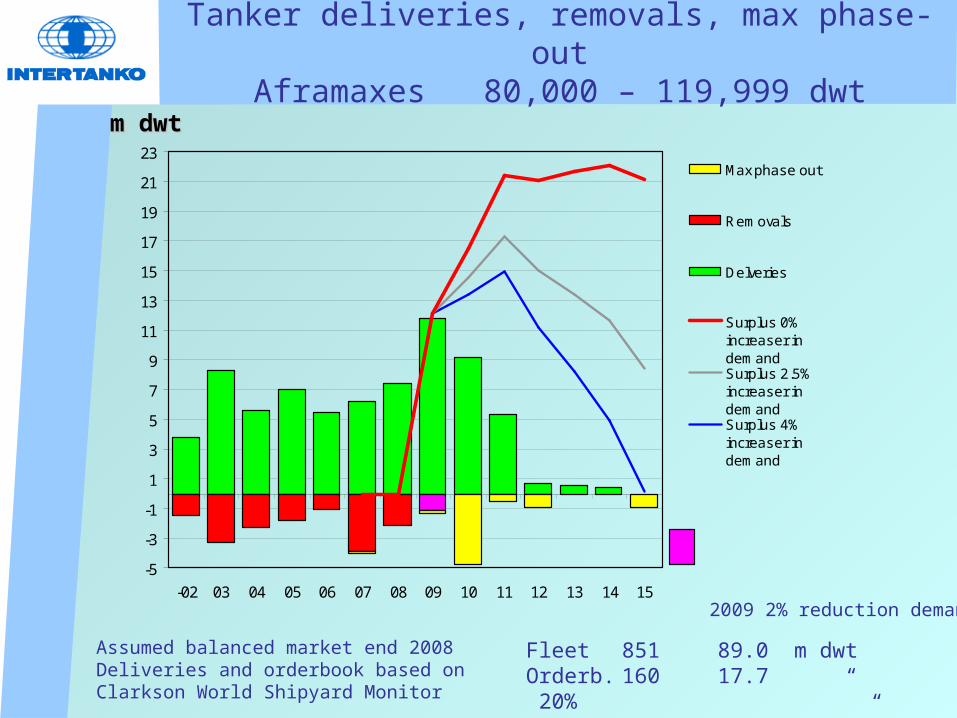
Tanker deliveries, removals, max phase-outAframaxes 80,000 – 119,999 dwt
m dwtm dwt
Assumed balanced market end 2008Deliveries and orderbook based on Clarkson World Shipyard Monitor
Fleet 851 89.0 m dwtOrderb. 160 17.7 “ 20%Not DH 74 7.1 ” 8%
2009 2% reduction demand
-5
-3
-1
1
3
5
7
9
11
13
15
17
19
21
23
-02 03 04 05 06 07 08 09 10 11 12 13 14 15
Max phase out
Removals
Delveries
Surplus 0%increaser indemandSurplus 2.5%increaser indemandSurplus 4%increaser indemand
year
Tonnage overhang
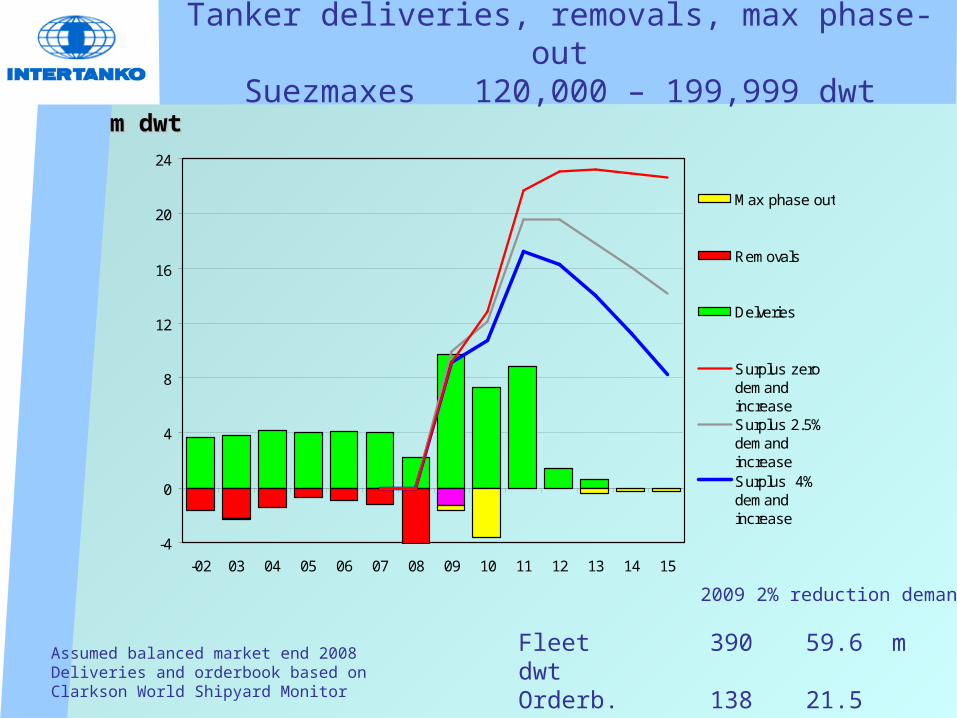
Tanker deliveries, removals, max phase-outSuezmaxes 120,000 – 199,999 dwt
m dwtm dwt
Assumed balanced market end 2008Deliveries and orderbook based on Clarkson World Shipyard Monitor
Fleet 390 59.6 m dwtOrderb. 138 21.5 “ 36%Not DH 36 5.1 ” 9%
2009 2% reduction demand
-4
0
4
8
12
16
20
24
-02 03 04 05 06 07 08 09 10 11 12 13 14 15
Max phase out
Removals
Delveries
Surplus zerodemandincreaseSurplus 2.5%demandincreaseSurplus 4%demandincrease
year
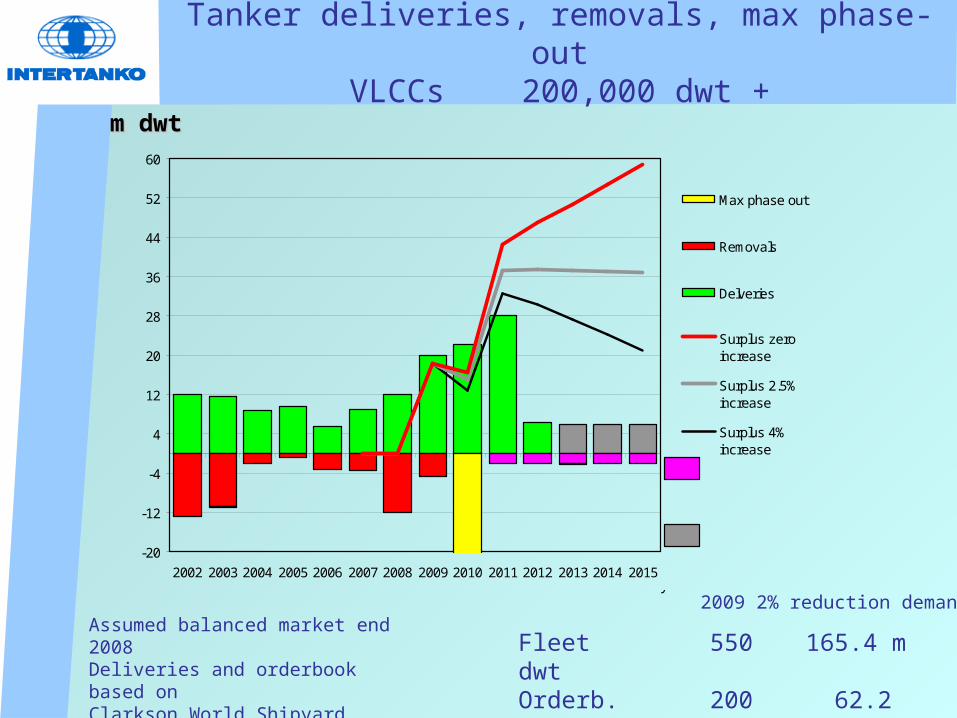
Tanker deliveries, removals, max phase-outVLCCs 200,000 dwt +
m dwtm dwt
Assumed balanced market end 2008Deliveries and orderbook based on Clarkson World Shipyard Monitor
Fleet 550 165.4 m dwtOrderb. 200 62.2 “ 38%Not DH 83 22.8 ” 14%
2009 2% reduction demand
-20
-12
-4
4
12
20
28
36
44
52
60
2002 2003 2004 2005 2006 2007 2008 2009 2010 2011 2012 2013 2014 2015
Max phase out
Removals
Delveries
Surplus zeroincrease
Surplus 2.5%increase
Surplus 4%increase
year
Assumed removal of DH tankers
Assumed deliveries of new orders
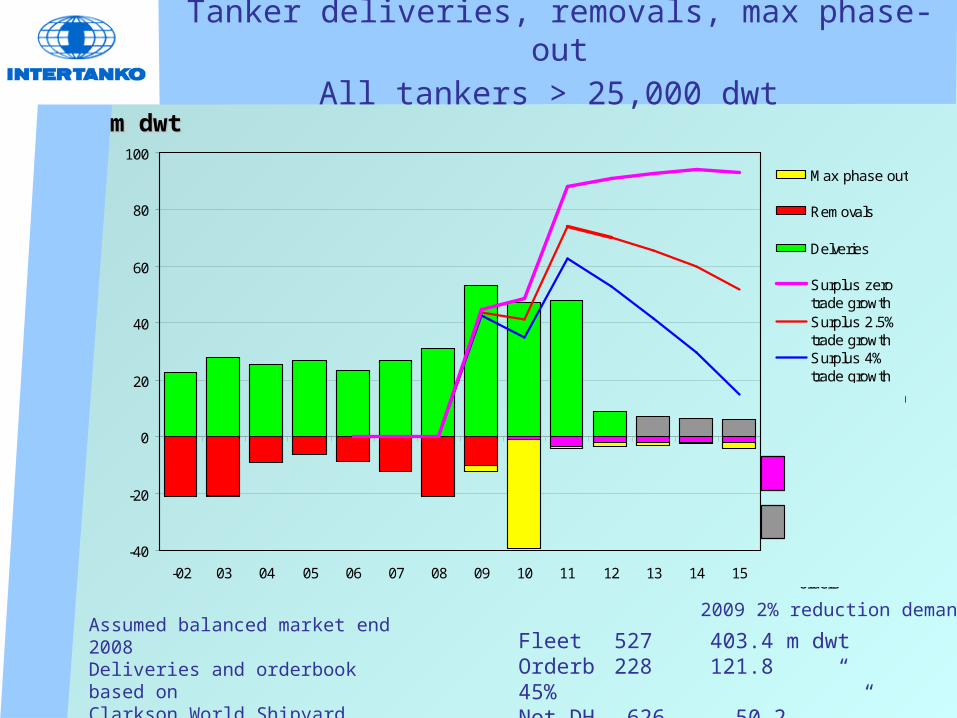
Tanker deliveries, removals, max phase-outAll tankers > 25,000 dwt
m dwtm dwt
Assumed balanced market end 2008Deliveries and orderbook based on Clarkson World Shipyard Monitor
Fleet 527 403.4 m dwtOrderb 228 121.8 “ 45%Not DH 626 50.2 ” 12%
2009 2% reduction demand
-40
-20
0
20
40
60
80
100
-02 03 04 05 06 07 08 09 10 11 12 13 14 15
Max phase out
Removals
Delveries
Surplus zerotrade growthSurplus 2.5%trade growthSurplus 4%trade growth
year
Assumed removals of DH tankers
Assumed deliveries of new orders
Minus 2% growth in 2009 and the above scenarios later
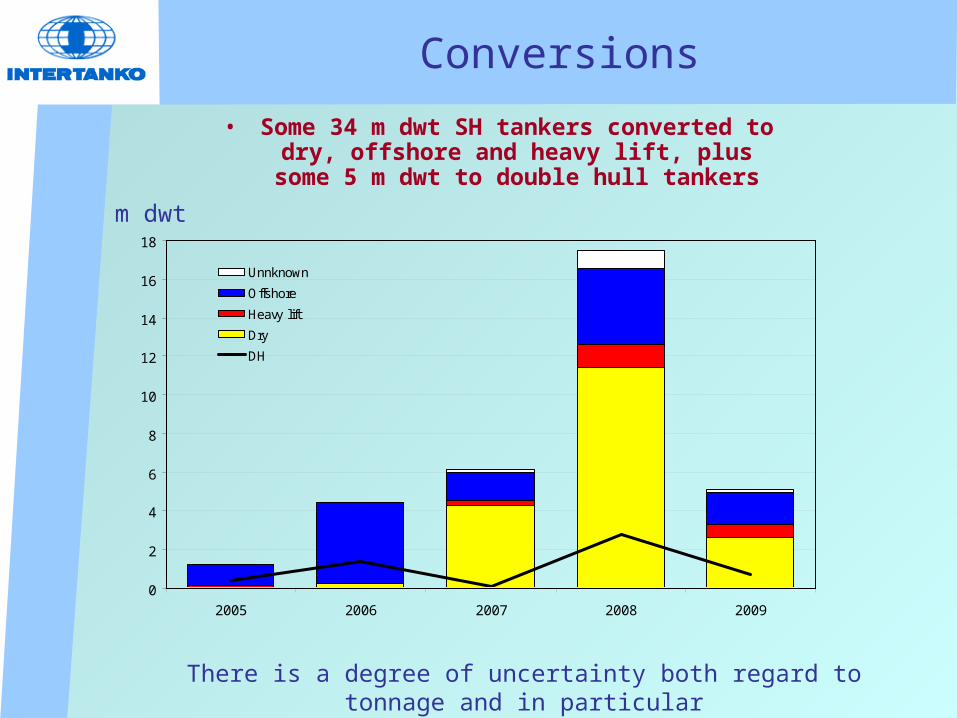
Conversions
• Some 34 m dwt SH tankers converted to dry, offshore and heavy lift, plus some 5
m dwt to double hull tankersm dwt
There is a degree of uncertainty both regard to tonnage and in particularthe timing of conversion
0
2
4
6
8
10
12
14
16
18
2005 2006 2007 2008 2009
Unnknown
Offshore
Heavy lift
Dry
DH
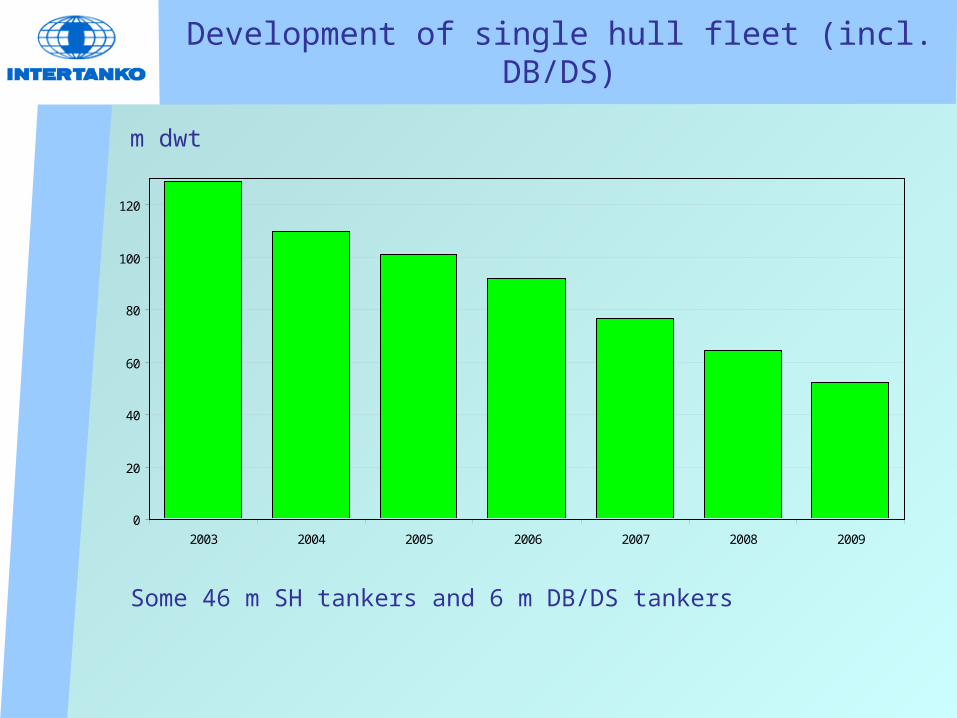
Development of single hull fleet (incl. DB/DS)
m dwt
0
20
40
60
80
100
120
2003 2004 2005 2006 2007 2008 2009
Some 46 m SH tankers and 6 m DB/DS tankers
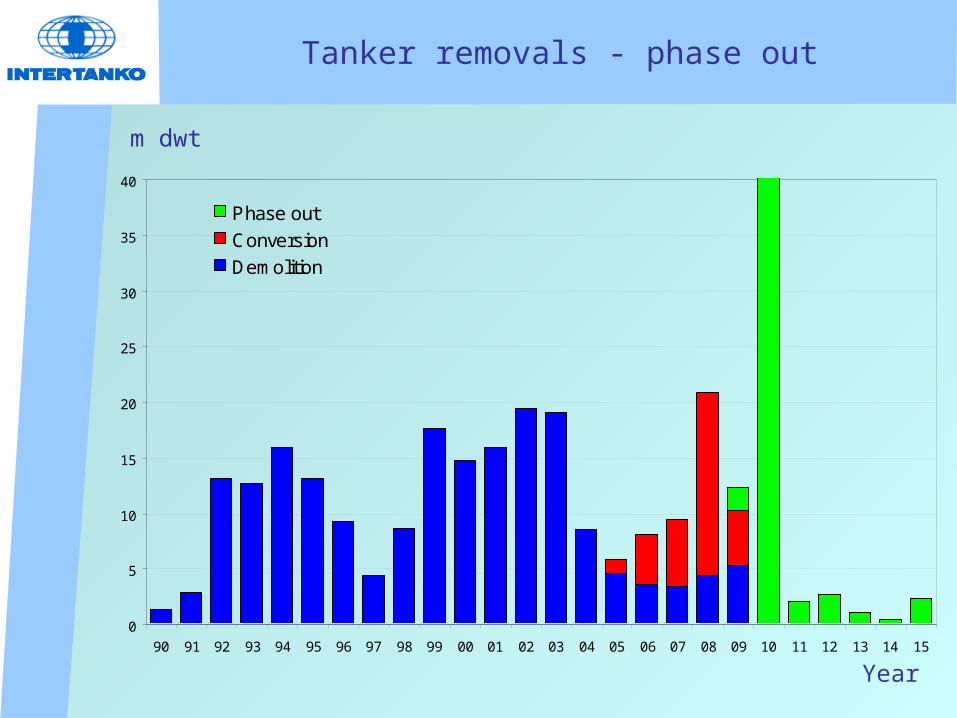
Tanker removals - phase out
m dwt
0
5
10
15
20
25
30
35
40
90 91 92 93 94 95 96 97 98 99 00 01 02 03 04 05 06 07 08 09 10 11 12 13 14 15
Phase out
Conversion
Demolition
Year
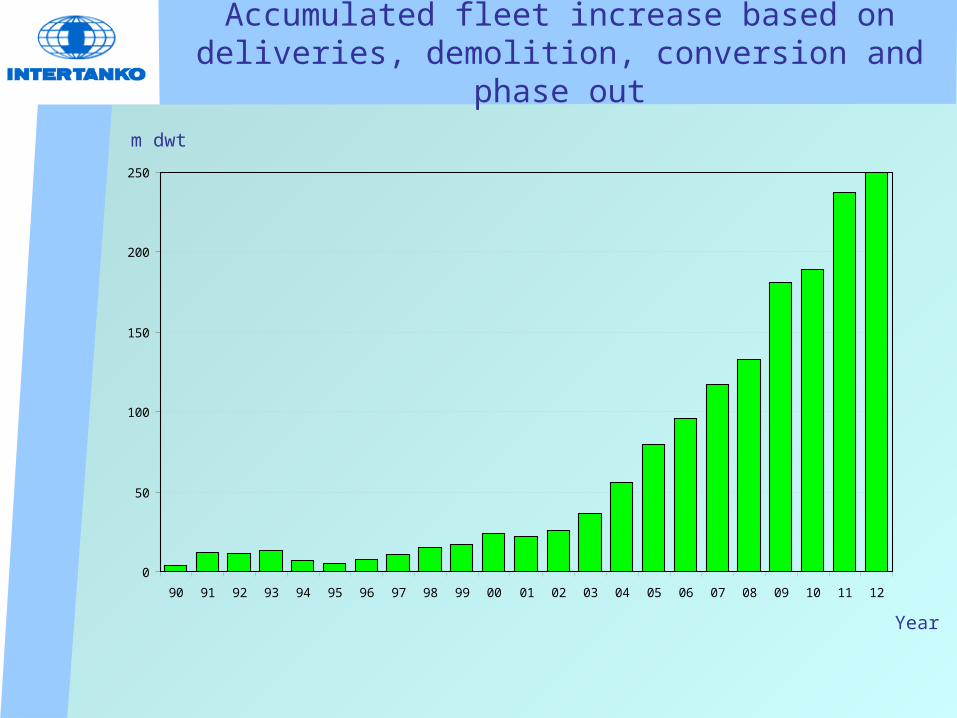
Accumulated fleet increase based on deliveries, demolition, conversion and phase out
m dwt
Year
0
50
100
150
200
250
90 91 92 93 94 95 96 97 98 99 00 01 02 03 04 05 06 07 08 09 10 11 12
With current orderbook:Accumulated fleet increase 1990 - 2002 (13 years) : 26 m dwtAccumulated fleet increase 2003 - 2012 (10 years) : 224 m dwt
Based on LR Fairplay database
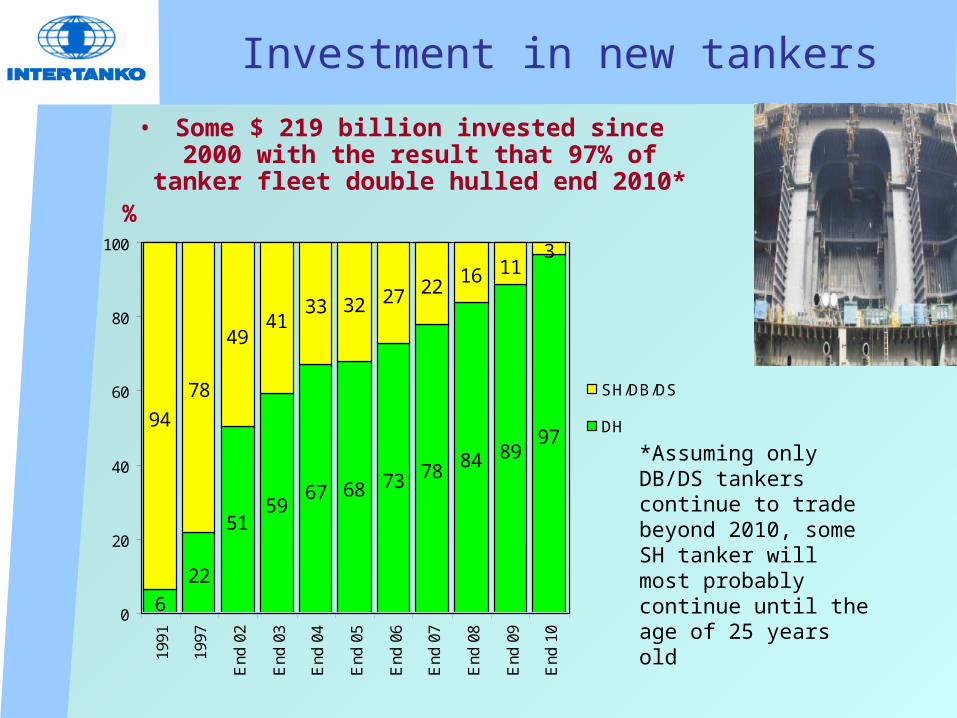
Investment in new tankers
• Some $ 219 billion invested since 2000 with the result that 97% of tanker fleet
double hulled end 2010*
*Assuming only DB/DS tankers continue to trade beyond 2010, some SH tanker will most probably continue until the age of 25 years old
%
6
22
5159
67 68 73 7884 89
9794
78
4941
33 32 27 2216 11
3
0
20
40
60
80
100
1991
1997
End
02
End
03
End
04
End
05
End
06
End
07
End
08
End
09
End
10
SH/DB/DS
DH
% dwt share:
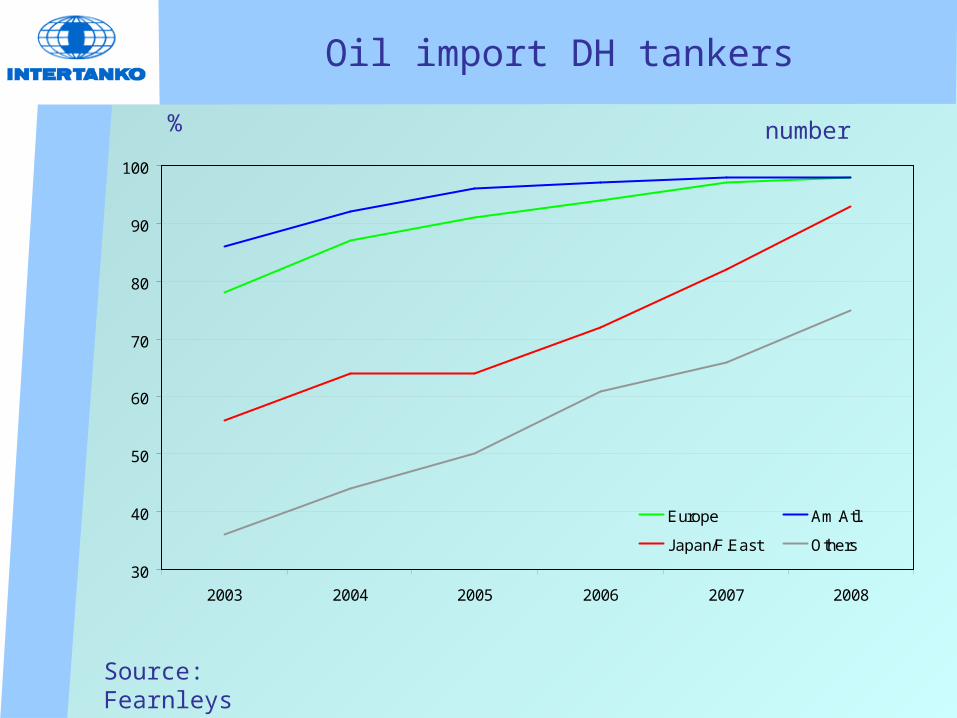
Oil import DH tankers
Source: Fearnleys
% number
30
40
50
60
70
80
90
100
2003 2004 2005 2006 2007 2008
Europe Am.Atl.
Japan/F.East Others
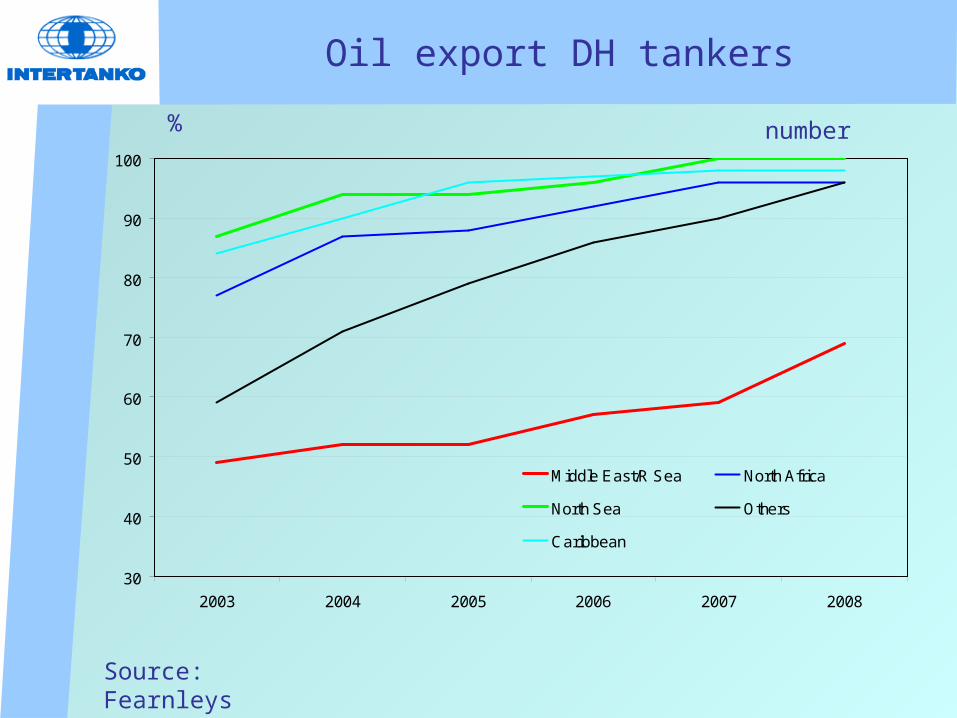
Oil export DH tankers
Source: Fearnleys
% number
30
40
50
60
70
80
90
100
2003 2004 2005 2006 2007 2008
Middle East/R Sea North Africa
North Sea Others
Caribbean
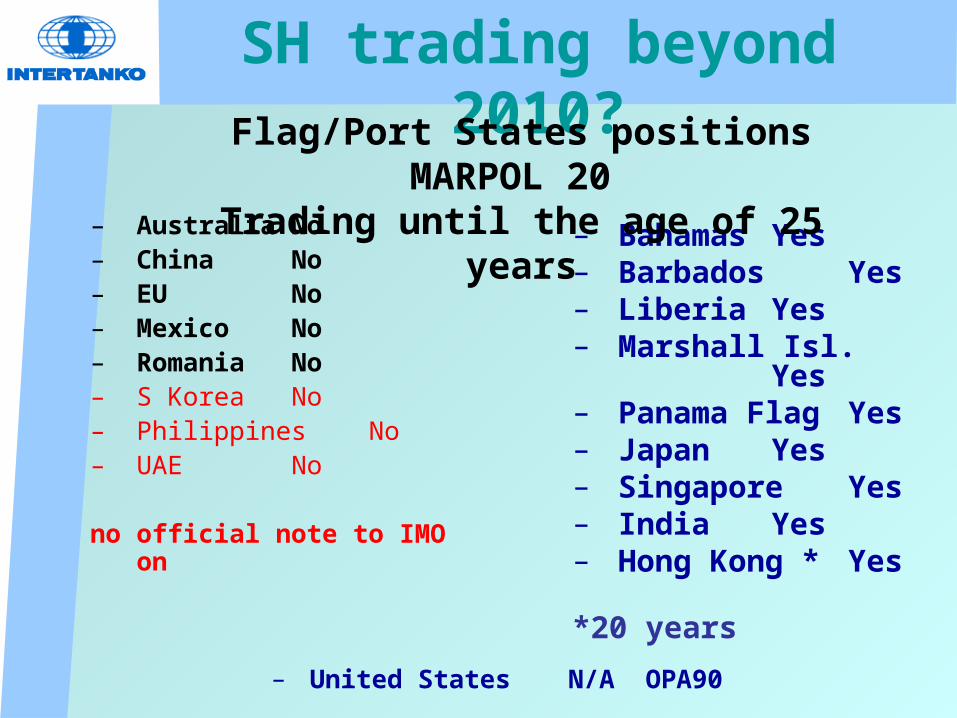
SH trading beyond 2010?
– Australia No– China No– EU No– Mexico No– Romania No– S Korea No– Philippines No– UAE No
no official note to IMO on
– Bahamas Yes– Barbados Yes– Liberia Yes– Marshall Isl. Yes– Panama Flag Yes– Japan Yes– Singapore Yes– India Yes– Hong Kong * Yes
*20 years
Flag/Port States positions MARPOL 20 Trading until the age of 25 years
– United States N/A OPA90
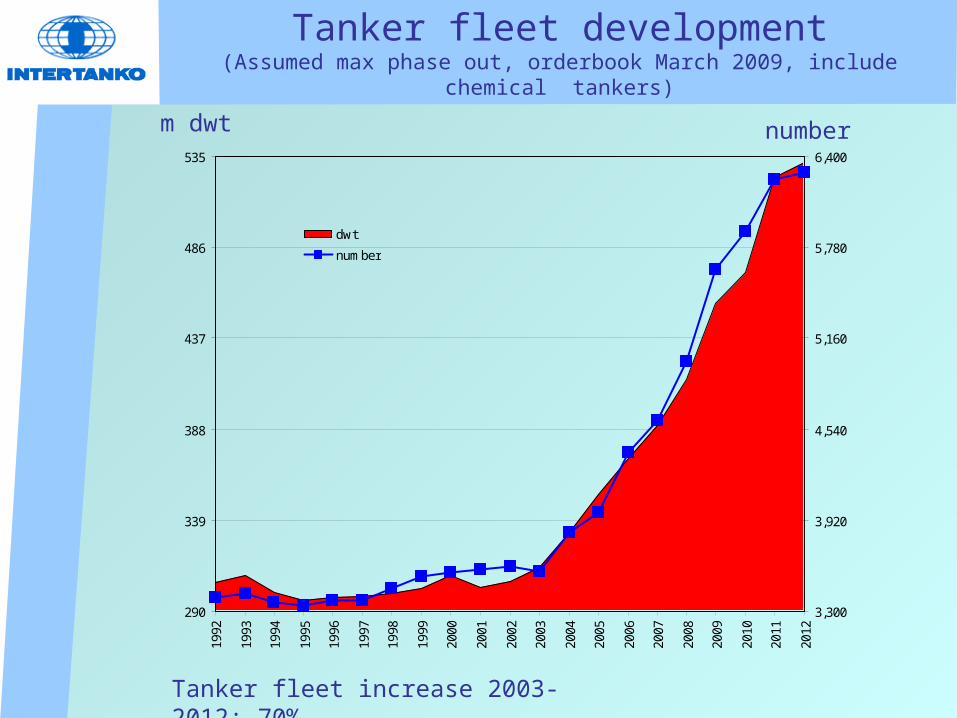
Tanker fleet development(Assumed max phase out, orderbook March 2009, include chemical tankers)
Tanker fleet increase 2003-2012: 70%
m dwt number
290
339
388
437
486
535
1992
1993
1994
1995
1996
1997
1998
1999
2000
2001
2002
2003
2004
2005
2006
2007
2008
2009
2010
2011
2012
3,300
3,920
4,540
5,160
5,780
6,400
dwt
number
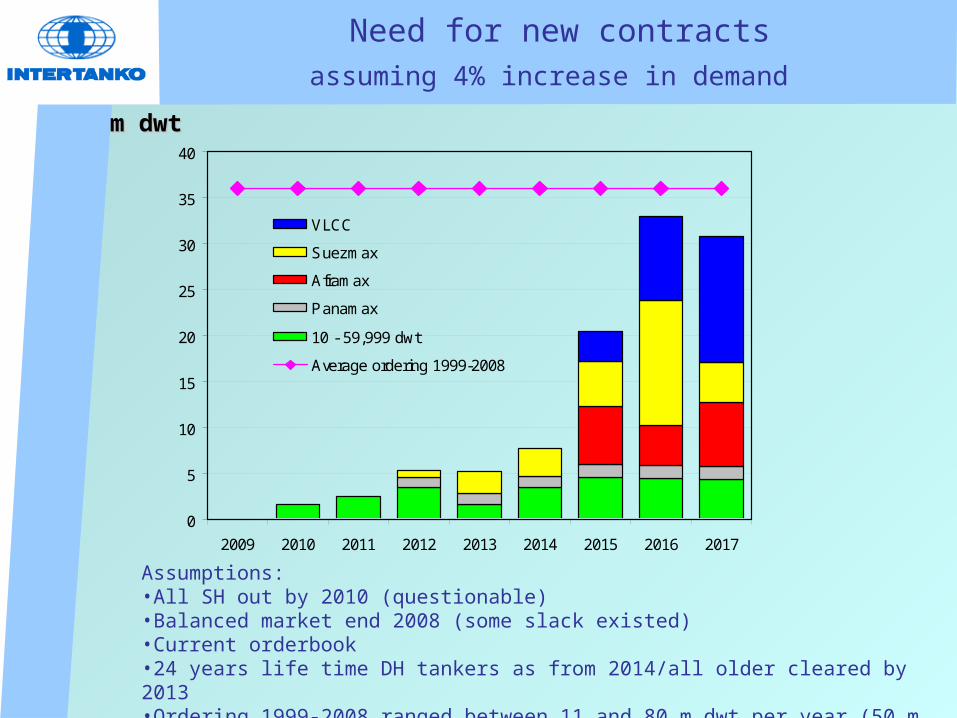
Need for new contractsassuming 4% increase in demand
m dwtm dwt
Assumptions:•All SH out by 2010 (questionable)•Balanced market end 2008 (some slack existed)•Current orderbook •24 years life time DH tankers as from 2014/all older cleared by 2013•Ordering 1999-2008 ranged between 11 and 80 m dwt per year (50 m dwt in 2008)
0
5
10
15
20
25
30
35
40
2009 2010 2011 2012 2013 2014 2015 2016 2017
VLCC
Suezmax
Aframax
Panamax
10 - 59,999 dwt
Average ordering 1999-2008
Need for new contractsassuming 4% increase in demand
Conclusion
Conclusion
• A tanker surplus is building up unless demand is strong
• No need for additional tanker orders over the next of years
Recommended