Study of Current and Former Vegetarians and Vegans
companion to the initial findings • december 2014
Photo: Jo-Anne McArthur/We Animals
Tables & Methodology
Team
: Kat
hryn
Ash
er, C
he G
reen
, Dr H
ans
Gut
brod
, Mirn
a Je
wel
l, D
r Gal
ina
Hal
e &
Dr
Broc
k Ba
stia
n •
Spon
sors
: Ani
mal
Wel
fare
Tru
st, V
egFu
nd, F
ARM
& S
teph
en
Kauf
man
, MD
• A
ckno
wle
dgem
ents
: Jac
k N
orris
, Nic
k C
oone
y &
Mat
t Bea
r
© H
uman
e R
esea
rch
Cou
ncil
2014

Methodology- Prior to data collection, the survey was piloted with 13 individuals.- The full study was fielded between May 7 and May 18, 2014 using an online survey. Invitations to the sample were provided by Harris
Interactive (see their website for information about their sampling procedures).- Invitations were sent to a U.S. representative sample aged 16 years and over (those 17 and over responded).- After data cleaning, 11,399 respondents participated in the study.- All questions were mandatory. Of the 1,387 current and former vegetarians/vegans who participated, 1,313 (95%) completed the survey.- The prevalences of current and former vegetarians/vegans are based on a snapshot in time, meaning that some of the current vegetarians/
vegans could one day abandon their diet. Likewise, some former vegetarians/vegans may re-adopt the diet in the future.- This study only explored dietary vegetarianism/veganism, as opposed to other aspects such as those to do with clothing, entertainment,
household products, etc. While in the survey the language related only to diet, in this report the terms vegetarianism and veganism have been used as a shorthand for dietary vegetarianism and veganism.
- The online survey included distinct branching for each of the four groups (former vegetarians, former vegans, current vegetarians, and current vegans). Specific wording was based on whether the respondent was answering about a vegetarian or vegan diet as well as whether this was currently being followed or had been adhered to in the past. Some items in the survey used reverse wording. All of these distinctive wording choices have been shorthanded in the report.
- On the following page the various paths available to respondents are displayed. Of note:- Respondents did not know the purpose of the survey or the surveying organization prior to answering the first food list, which was done
to help limit an under-reporting of animal product consumption.- If a respondent had in the past been both a former vegetarian and a former vegan, they were classified as the more recent of the two.- Individuals who moved from a vegan diet to a vegetarian diet were not counted as former vegans, but rather as current vegetarians.- A multi-step verification process was used to identify current and former vegetarians/vegans to ensure accurate classification.
- Former vegetarians/vegans were required to: 1) indicate using a food list that they were an omnivore, 2) self-identify as having formerly eaten a vegetarian or vegan diet, and 3) indicate using a food list that when they were a vegetarian/vegan they did not eat meat (or in the case of vegans any animal products).
- Current vegetarians/vegans were required to: 1) indicate using a food list that they did not eat meat (or in the case of vegans any animal products), and 2) self-identify with the label (i.e., as currently eating a vegetarian or vegan diet).
- Had only a two-step verification process been used for former vegetarians/vegans (i.e., the first food list and self-identification as a former vegetarian/vegan) and a one-step process for current vegetarians/vegans (i.e., the first food list), the prevalences would have been 21% and 4% respectively, as opposed to 10% and 2%.
Limitations- Self-reporting errors, particularly for lapsed vegetarians/vegans who had the heavier burden of memory recall.- Social desirability bias, especially for former vegetarians/vegans.- Nonresponse bias (i.e., those who declined the invitation to participate in the survey).- Respondent quality issues, including internal inconsistencies, incomplete surveys, etc.- Based on the confidence intervals for our sample and the U.S. population, our sample appears to be older, wealthier, more educated, less
racially diverse, and has greater representation from females and those from the Midwest and Northeast (see Table 2).

Which foods/beverages do you currently consume?• Fruit (apples, bananas, oranges, canned fruit, dried fruit, etc.)• Caffeinated drinks (coffee, tea, lattes, energy drinks, chocolate
drinks, etc.)• Vegetables (carrots, mushrooms, potatoes, onions, peas, etc.)• Turkey (turkey dinner, turkey sandwich, turkey gravy, turkey
burger, etc.)• Chicken (wings, nuggets, chicken noodle soup, chicken salad,
chicken sandwich, etc.)• Nuts (almonds, cashews, walnuts, peanut butter, pecans, etc.)• Fish, not including seafood (salmon, tuna, fish sticks, fish &
chips, haddock, etc.)• Seafood (lobster, shrimp, scallops, oyster, crab, etc.)• Sweets (cookies, cakes, pie, candies, squares, etc.)]• Pork (bacon, ham, pork chops, spare ribs, ham sandwich, etc.)• Beef (hamburger, steak, roast beef, meatloaf, in stew/lasagna/
spaghetti/pizza, etc.)• Other meats (duck, lamb, rabbit, deer, goat, etc.)• Soft drinks (cola, ginger ale, lemon-lime, root beer, etc.)• Eggs (scrambled/boiled, omelet, egg sandwich, quiche, in baked
goods/sauces, etc.)• Dairy (cheese including on pizza/pasta, milk/chocolate milk,
yogurt, ice cream, butter, etc.)• Beans (chickpeas, navy beans, black beans, in chili, tofu, etc.)• Alcohol (beer, wine, vodka, rum, gin, etc.)• None of the above
(n=11,429)
No: turkey, chicken, fish, seafood, pork, beef, other meats. Yes: eggs or dairy
(n=223)
No(n=56)
Yes: Current vegetarians
(n=167) Current vegetarians/vegans
(n=221)
No: turkey, chicken, fish, seafood, pork, beef, other meats, eggs, and dairy
(n=198)No
(n=144)
Do you currently eat a vegetarian diet (one with no meat, i.e., without beef, pork, chicken, turkey, fish/seafood, etc.)?
Yes: Current vegans
(n=54)
Do you currently eat a vegan diet (one with no animal products, i.e., without beef, pork, chicken/turkey, fish/seafood, dairy, eggs, etc.)?
One or more: turkey, chicken, fish, seafood, pork, beef, other meats
(n=11,008)
Have you ever eaten a vegetarian diet (one with no meat, i.e., without beef, pork, chicken, turkey, fish/seafood, etc.)?
Have you ever eaten a vegan diet (one with no animal products, i.e., without beef, pork, chicken/turkey, fish/seafood, dairy, eggs, etc.)?
Missing(n=17)
No(n=8,629)
Yes to both(n=873)
You indicated that in the past you have eaten both a vegan and a vegetarian diet. Which was the more recent of the two?
Yes(n=1,466)
Vegetarian(n=685)
Vegan(n=188)
Yes(n=23)
In the questions that follow, you will be asked about your experience when you ate a vegetarian diet. If you did so on more than one occasion, please answer only for the most recent time unless otherwise instructed. Which foods did you eat when you were consuming a vegetarian diet?[Same food list as above]
(n=2,151)
In the questions that follow, you will be asked about your experience when you ate a vegan diet. If you did so on more than one occasion, please answer only for the most recent time unless otherwise instructed. Which foods did you eat when you were consuming a vegetarian diet?[Same food list as above]
(n=211)
No: turkey, chicken, fish, seafood, pork, beef, other meats. Yes: eggs or dairy
Former vegetarians(n=1,037)
No: turkey, chicken, fish, seafood, pork, beef, other meats, eggs, and dairy
Former vegans(n=129)
Former vegetarians/vegans
(n=1,166)
No(n=1,102)
No(n=81)
Missing(n=8)
Missing(n=4)
Missing(n=1)
Respondent Paths
page 2Humane Research Council 2014

Table 1. Demographics for Current & Former Vegetarians/Vegans
Former vegetarians/vegans Current vegetarians/vegans Statistical significance(t-test)
Average age 48 years 42 years *** Former n=1,104Current n=211Former min=17 max=96Current min=18 max=80
Former vegetarians/vegans Current vegetarians/vegans Statistical significance(chi-squared test)
Age categories 12% 16–29 years43% 30–49 years27% 50–64 years17% 65+ years
16% 16–29 years60% 30–49 years17% 50–64 years7% 65+ years
*** Former n=1,104Current n=211
Gender 69% female 74% female Former n=1,101Current n=209(removed 5 “Other” – 3 former & 2 current)
Region of U.S. 20% Northeast23% Midwest29% South27% West
27% Northeast19% Midwest27% South27% West
Former n=1,103Current n=211(removed 1 “Not listed” under former)
Education 1% Less than high school9% High school28% Some college (including Associate degree)62% Bachelor’s degree or higher
1% Less than high school8% High school27% Some college (including Associate degree)64% Bachelor’s degree or higher
Former n=1,103Current n=211
Political orientation 21% Conservative41% Neutral39% Liberal
14% Conservative34% Neutral52% Liberal
**Former n=1,103Current n=211
Race/ethnicity 6% African American or Black6% Asian/Pacific Islander3% Hispanic, Latino, or Spanish origin80% White4% Other race/ethnicity (including two or more)
4% African American or Black7% Asian/Pacific Islander4% Hispanic, Latino, or Spanish origin80% White5% Other race/ethnicity (including two or more)
Former n=1,102Current n=211
Religion 47% Christian (Catholic, Protestant, etc.)5% Jewish3% Buddhist or Hindu5% Other religion (including two or more)40% Do not actively practice a religion
34% Christian (Catholic, Protestant, etc.)3% Jewish9% Buddhist or Hindu7% Other religion (including two or more)47% Do not actively practice a religion
***
Former n=1,102Current n=211
page 3Humane Research Council 2014
*p < .05 **p < .01 ***p < .001

page 4
Table 2. Demographics for Full Sample & U.S .Population
Demographics Full sample (n=11,399) U.S. Pop•Mean (%)
95% CI
# Mean (%) 95% CI
Average age – 51.2 50.9, 51.4 45.9 45.8, 45.9
Age categories
17 to 29 994 8.7 8.2, 9.2 14.6 14.6, 14.730 to 49 4,446 39.0 38.1, 39.9 34.4 34.4, 34.550 to 64 3,388 29.7 28.9, 30.6 33.9 33.9, 34.065+ 2,569 22.5 21.8, 23.3 17.0 17.0, 17.0
Gender**Male 4,803 42.1 41.2, 43.0 48.6 48.6, 48.6
Female 6,596 57.9 56.0, 58.8 51.4 51.4, 51.4
Region of U.S.
Midwest 2,887 25.3 24.5, 26.1 21.6 21.6, 21.7Northeast 2,459 21.6 20.8, 22.3 18.3 18.3, 18.3
South 3,593 31.5 30.7, 32.4 37.0 37.0, 37.0West 2,389 21.0 20.2, 21.7 23.1 23.0, 23.1Not Applicable 71 0.6 0.5, 0.8 – –
Race
African American or Black 828 7.3 2.9, 3.6 11.7 11.7, 11.8Asian 368 3.3 2.7, 3.4 5.0 5.0, 5.1Hispanic, Latino, or Spanish origin 366 3.2 2.9, 3.6 13.8 13.8, 13.9
White 9,449 83.7 83.0, 84.4 66.7 66.6, 66.7
Other race/ethnicity (including two or more)*** 277 2.5 2.2, 2.7 2.7 2.6, 2.8
Average Internet Usage (hours/week) 11,370 31.3 19.3, 43.3 – –
Education
Less than 12th grade, no diploma 154 1.4 1.1, 1.7 16.0 15.7, 16.2
High School Graduate or GED 1,536 13.5 12.9, 14.1 28.1 27.9, 28.3
Some college/vocational/Associate's Degree 3,847 33.8 33.0, 34.7 30.5 30.4, 30.7
Undergraduate/Post-graduate degree 5,837 51.3 50.4, 52.2 25.4 24.9, 25.9
Humane Research Council 2014

Note: The demographics for the entire sample are based on those reported from the data collection company and are subject to limitations.*American Community Survey, 2008-2012** If Gender = Other and not missing in the data collection company file, the gender becomes male or female as reported in the data collection company file*** Includes Middle Eastern, Native American/Native Hawaiian
page 5Humane Research Council 2014
Table 2. (cont’d)
Demographics Full sample (n=11,399) U.S. Pop•Mean (%)
95% CI
# Mean (%) 95% CI
Household Income
Less than $10,000 488 4.3 3.9, 4.7 30.9 30.7, 31.2$10,000 to $19,99 863 7.6 7.1, 8.1 16.0 15.9, 16.2$20,000 to $29,99 1,065 9.4 16.5, 17.8 13.2 13.0, 13.3$30,000 to $39,99 1,190 10.5 8.8, 9.9 10.4 10.3, 10.5$40,000 to $49,99 1,024 9.0 9.9, 11.0 7.7 7.8, 7.8$50,000 to $59,99 1,043 9.2 8.5, 9.5 5.6 5.5, 5.7$60,000 to $69,99 859 7.6 8.6, 9.7 4.1 4.0, 4.2$70,000 to $79,99 842 7.4 7.1, 8.0 2.8 2.8, 2.9$80,000 to $89,99 566 5.0 6.9, 7.9 2.0 2.0, 2.1$90,000 to $99,99 543 4.8 4.6, 5.4 1.4 1.3, 1.4$100,000 or more 1,950 17.2 4.4, 5.2 5.9 5.8, 6.0Prefer not to answer 939 8.3 7.8, 8.8 – –

Table 3. Transitions
Former vegetarians/vegans
Current vegetarians/vegans
Statistical significance(t-test)
Average age at first adoption of a vegetarian/vegan diet 34 years 25 years *** Former n=1,124Current n=212Former min=0 max=86Current min=0 max=75
Former vegetarians/vegans
Current vegetarians/vegans
Statistical significance(chi-squared test)
Transitioned to a vegetarian/vegan diet over a matter of days/weeks
65% 53% *** Former n=1,124Current n=212Former “Don’t Know”=240Current “Don’t Know”=25
page 6Humane Research Council 2014
*p < .05 **p < .01 ***p < .001
*p < .05 **p < .01 ***p < .001
Table 4. Adherence
Former vegetarians/vegans
Current vegetarians/vegans
Statistical significance(chi-squared test)
Up to 3 months 34% 5%
***Former n=1,124Current n=212Former “Don’t Know”=92Current “Don’t Know”=6
4–11 months 19% 8%
1–2 years 18% 7%
3–5 years 9% 12%
6–10 years 6% 8%
More than 10 years 6% 58%
Don’t know 8% 3%

Table 5. Significant Others
Former vegetarians/vegans (n=1,118) Former vegetarians/vegans
Not living with a significant other when they stopped eating a vegetarian/vegan diet 51%
Living with a significant other when they stopped eating a vegetarian/vegan diet 49%
Living with a non-vegetarian/vegan significant other when they stopped eating a vegetarian/vegan diet 33%
Living with a vegetarian/vegan significant other when they stopped eating a vegetarian/vegan diet 16%
Table 6. Motivations for Eating a Vegetarian/Vegan Diet
Former vegetarians/vegans (n=1,161)
Current vegetarians/vegans (n=219)
Statistical significance(chi-squared test)
*Health 58% 69% **
*Taste preferences 31% 52% ***
*Animal protection 27% 68% ***
*Feelings of disgust about meat/animal products 27% 63% ***
*Concern for the environment 22% 59% ***
Cost 16% 21%
Social influence (From friends, family, significant other, etc.) 15% 11%
*Social justice or world hunger 12% 29% ***
*Religious/spiritual beliefs 10% 22% ***
Wanting to follow a food trend 8% 7%
page 7Humane Research Council 2014
*p < .05 **p < .01 ***p < .001

*p < .05 **p < .01 ***p < .001
Table 7. Vitamin B12 (Testing)
Frequency of B12 checks using laboratory tests Former vegetarians/vegans
Current vegetarians/vegans
Statistical significance(chi-squared test)
Never 76% 42%
***Former n=1126Current n=212Former “Don’t Know”=57Current “Don’t Know”=19
Less than 1 time per year 6% 18%
Yearly 9% 23%
Multiple times per year or more frequently 4% 8%
Don’t know 5% 9%
Table 8. Vitamin B12 (Food Consumption)
Former vegetarians/vegans (n=1116)
Current vegetarians/vegans (n=211)
26% of former vegetarians/vegans and 16% of current vegetarians/vegans indicated that none of the B12 foods were a regular part of their diet.
All respondents were asked to indicate which items in a list of foods were a regular part of their diet. The purpose of the question was to gauge whether they had a regular source of B12, defined as one of the following: fortified meat alternatives, fortified non-dairy milk, fortified breakfast cereals, multivitamin, fortified nutritional yeast, and B12 supplement. The list also included a number of “distractor foods” (grapefruit, quinoa, coconut oil, pistachios, lentils, and vitamin D supplement) to help mask the purpose of the question. Note: current and former vegetarians may have also gotten B12 from eggs/dairy.
26% 16%
Humane Research Council 2014 page 8

Table 9. Difficulties with Vegetarian/Vegan Diet
Category Item Former vegetarians/vegans(agree/strongly agree)
Current vegetarians/vegans(agree/strongly agree)
Statistical significance(chi-squared test)
Greater difficulty for former vegetarians/vegans
Inconvenience
I found (find) it complicated to prepare vegetarian/vegan meals
22% 11% *** ✓ Former n=1,151Current n=218
I found (find) it time consuming to prepare vegetarian/vegan meals
29% 18% *** ✓ Former n=1,151Current n=218
I had (have) trouble finding restaurants where I could (can) eat/food I could (can) grab on the go
39% 48% *Former n=1,151Current n=218
I did not (do not) have easy access to a health food store or a grocery store with a health food section
23% 10% *** ✓ Former n=1,151Current n=218
I had (have) to prepare both vegetarian/vegan and non-vegetarian/vegan meals
30% 22% * ✓ Former n=1,151Current n=218
I had (have) to rely on someone else to do the grocery shopping
10% 7% ✓ Former n=1,151Current n=218
I have found (found) my vegetarian/vegan diet difficult during a time of transition (changing residences, traveling, starting a new job, etc.)
28% 18% ** ✓ Former n=1,151Current n=218
Taste
I craved/was tempted (crave/am tempted) by beef or pork
35% 7% *** ✓ Former n=1,147Current n=218
I craved/was tempted (crave/am tempted) by poultry (chicken, turkey, etc.)
37% 9% *** ✓ Former n=1,147Current n=218
I craved/was tempted (crave/am tempted) by fish/seafood
33% 8% *** ✓ Former n=1,147Current n=218
I was (am) bored with my food options 38% 12% *** ✓ Former n=1,147Current n=218
I was (am) a picky eater 26% 34% * Former n=1,147Current n=218
I found (find) insufficient comfort/pleasure in vegetarian/vegan foods
24% 6% *** ✓ Former n=1,147Current n=218
I felt (feel) deprived at restaurants or parties 32% 20% *** ✓ Former n=1,147Current n=218
page 9Humane Research Council 2014

Table 9 (cont’d)
Category Item Former vegetarians/vegans(agree/strongly agree)
Current vegetarians/vegans(agree/strongly agree)
Statistical significance(chi-squared test)
Greater difficulty for former vegetarians/vegans
Social
I felt (feel) the important people in my life were (are) unsupportive of my vegetarian/vegan diet
23% 11% *** ✓ Former n=1,142Current n=216
I had (have) insufficient interaction with other vegetarians/vegans
49% 25% *** ✓ Former n=1,142Current n=216
I was not (am not) actively involved in a vegetarian/vegan group or organization (potluck, online community, etc.)
84% 71% *** ✓Former n=1,142Current n=216
I found (find) it problematic to eat around non-vegetarians/vegans
21% 15% * ✓ Former n=1,142Current n=216
I disliked (dislike) that my vegetarian/vegan diet made (makes) me stick out from the crowd
63% 41% *** ✓ Former n=1,142Current n=216
I did not (do not) regularly share vegetarian/vegan meals with the person(s) I lived (live) with
31% 22% * ✓ Former n=1,015Current n=166(removed N/A)
Motivations
I started (have started) to doubt the animal protection benefits of a vegetarian/vegan diet
17% 8% * ✓ Former n=309Vegetarians/Vegans n=145(removed N/A)
I started (have started) to doubt the environmental benefits of a vegetarian/vegan diet
14% 7% ✓ Former n=258Current n=125(removed N/A)
I started (have started) to doubt the cost benefits of a vegetarian/vegan diet
29% 15% ✓ Former n=182Current n=46(removed N/A)
I started (have started) to doubt the health benefits of a vegetarian/vegan diet
21% 6% *** ✓ Former n=662Current n=148(removed N/A)
I started (have started) to doubt the religious/spiritual benefits of a vegetarian/vegan diet
13% 9% ✓ Former n=113Current n=47(removed N/A)
page 10Humane Research Council 2014

Table 9 (cont’d)
Category Item Former vegetarians/vegans(agree/strongly agree)
Current vegetarians/vegans(agree/strongly agree)
Statistical significance(chi-squared test)
Greater difficulty for former vegetarians/vegans
Motivations (cont’d)
I started (have started) to experience less pressure from others (friends, family, significant other, etc.) to eat a vegetarian/vegan diet
27% 35%Former n=175Current n=23(removed N/A)
I started (have started) to doubt the social justice/world hunger benefits of a vegetarian/vegan diet
18% 16% ✓ Former n=132Current n=61(removed N/A)
I started (have started) to have less appreciation for the taste of vegetarian/vegan foods
15% 7% * ✓ Former n=357Current n=113(removed N/A)
I started (have started) to lose interest in following the vegetarian/vegan food trend
56% 29% ✓ Former n=89Current n=14(removed N/A)
I started (have started) to feel less disgusted by meat/animal products
8% 25% *** Former n=305Current n=132(removed N/A)
Health
I was (am) taking too many vitamins/supplements
9% 8% ✓ Former n=1,134Current n=213
I was (am) not confident I was (am) getting the right nutrients
25% 9% *** ✓ Former n=1,134Current n=213
I was (am) on a low fat or raw diet 16% 15% ✓ Former n=1,134Current n=213
I was (am) concerned about the impact my vegetarian/vegan diet was having on my health
23% 10% *** ✓ Former n=1,134Current n=213
I was (am) frequently fatigued or light-headed 17% 13% ✓ Former n=1,134Current n=213
I always felt (feel) hungry 27% 10% *** ✓ Former n=1,134Current n=213
I frequently visited (visit) a health care professional for diet-related issues
6% 8% Former n=1,134Current n=213
I had (have) concerns about vegetarian/vegan nutrition for my children and/or during my/my partner’s pregnancy
17% 17%Former n=805Current n=144
page 11Humane Research Council 2014

Table 12. Current Vegetarians/Vegans’ Past Diet Change
Previous switch from a vegetarian/vegan diet to one with meat and then back to a vegetarian/vegan diet (n=211)
16% (all ages) 12% (16–29 years)14% (30–49 years)28% (50–64 years)7% (65+ years)
Table 9 (cont’d)
Category Item Former vegetarians/vegans(agree/strongly agree)
Current vegetarians/vegans(agree/strongly agree)
Statistical significance(chi-squared test)
Greater difficulty for former vegetarians/vegans
Other
I found (find) it costs too much to eat a vegetarian/vegan diet
26% 12% *** ✓ Former n=1,131Current n=212
I did not (do not) see vegetarianism/veganism as part of my identity
58% 11% *** ✓ Former n=1,131Current n=212
I began (have begun) to feel it is too difficult to be “pure” with my vegetarian/vegan diet
43% 11% *** ✓ Former n=1,131Current n=212
I was (am) unclear about the definition of a vegetarian/vegan diet
14% 3% *** ✓ Former n=1,131Current n=212
page 12Humane Research Council 2014
*p < .05 **p < .01 ***p < .001
Table 10. Former Vegetarians/Vegans’ Past Diet
Number of times former vegetarians/vegans switched from a vegetarian/vegan diet to one that includes meat
1 53%
n=1,113“Don’t Know”=190
2 17%
3 6%
4 2%
5 or more 6%
Don’t know 17%
Table 11. Former Vegetarians/Vegans’ Past Diet Change (Age Breakdowns)
Switched from a vegetarian/vegan diet to one that includes meat more than once
30% (all ages) 30% (16–29 years)32% (30–49 years)32% (50–64 years)21% (65+ years)
n=1,113“Don’t Know”=190
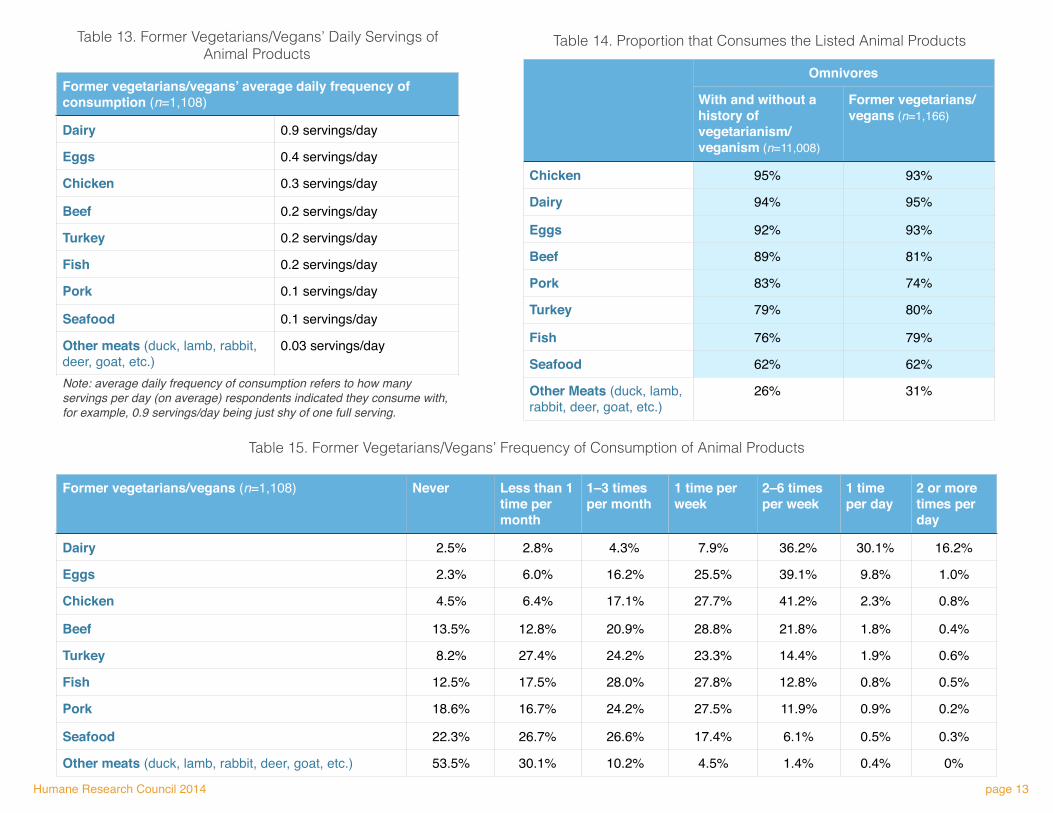
Note: average daily frequency of consumption refers to how many servings per day (on average) respondents indicated they consume with, for example, 0.9 servings/day being just shy of one full serving.
Table 13. Former Vegetarians/Vegans’ Daily Servings of Animal Products
Former vegetarians/vegans’ average daily frequency of consumption (n=1,108)
Dairy 0.9 servings/day
Eggs 0.4 servings/day
Chicken 0.3 servings/day
Beef 0.2 servings/day
Turkey 0.2 servings/day
Fish 0.2 servings/day
Pork 0.1 servings/day
Seafood 0.1 servings/day
Other meats (duck, lamb, rabbit, deer, goat, etc.)
0.03 servings/day
Table 15. Former Vegetarians/Vegans’ Frequency of Consumption of Animal Products
Former vegetarians/vegans (n=1,108) Never Less than 1 time per month
1–3 times per month
1 time per week
2–6 times per week
1 time per day
2 or more times per day
Dairy 2.5% 2.8% 4.3% 7.9% 36.2% 30.1% 16.2%
Eggs 2.3% 6.0% 16.2% 25.5% 39.1% 9.8% 1.0%
Chicken 4.5% 6.4% 17.1% 27.7% 41.2% 2.3% 0.8%
Beef 13.5% 12.8% 20.9% 28.8% 21.8% 1.8% 0.4%
Turkey 8.2% 27.4% 24.2% 23.3% 14.4% 1.9% 0.6%
Fish 12.5% 17.5% 28.0% 27.8% 12.8% 0.8% 0.5%
Pork 18.6% 16.7% 24.2% 27.5% 11.9% 0.9% 0.2%
Seafood 22.3% 26.7% 26.6% 17.4% 6.1% 0.5% 0.3%
Other meats (duck, lamb, rabbit, deer, goat, etc.) 53.5% 30.1% 10.2% 4.5% 1.4% 0.4% 0%
page 13Humane Research Council 2014
Table 14. Proportion that Consumes the Listed Animal Products
Omnivores
With and without a history of vegetarianism/veganism (n=11,008)
Former vegetarians/vegans (n=1,166)
Chicken 95% 93%
Dairy 94% 95%
Eggs 92% 93%
Beef 89% 81%
Pork 83% 74%
Turkey 79% 80%
Fish 76% 79%
Seafood 62% 62%
Other Meats (duck, lamb, rabbit, deer, goat, etc.)
26% 31%
Recommended