


1ANNUAL REPORT 2014
2 Group Structure
3 Corporate Profile
4 Group Executive Chairman’s Statement
7 Executive Directors
9 Non-Executive Directors
10 Senior Management
15 Corporate Information
16 Corporate Governance
24 Directors’ Report & Audited Financial Statements
81 Statistics of shareholdings
83 Notice of Annual General Meeting
87 Proxy Form
Table Of CONTeNTS
2ANNUAL REPORT 2014
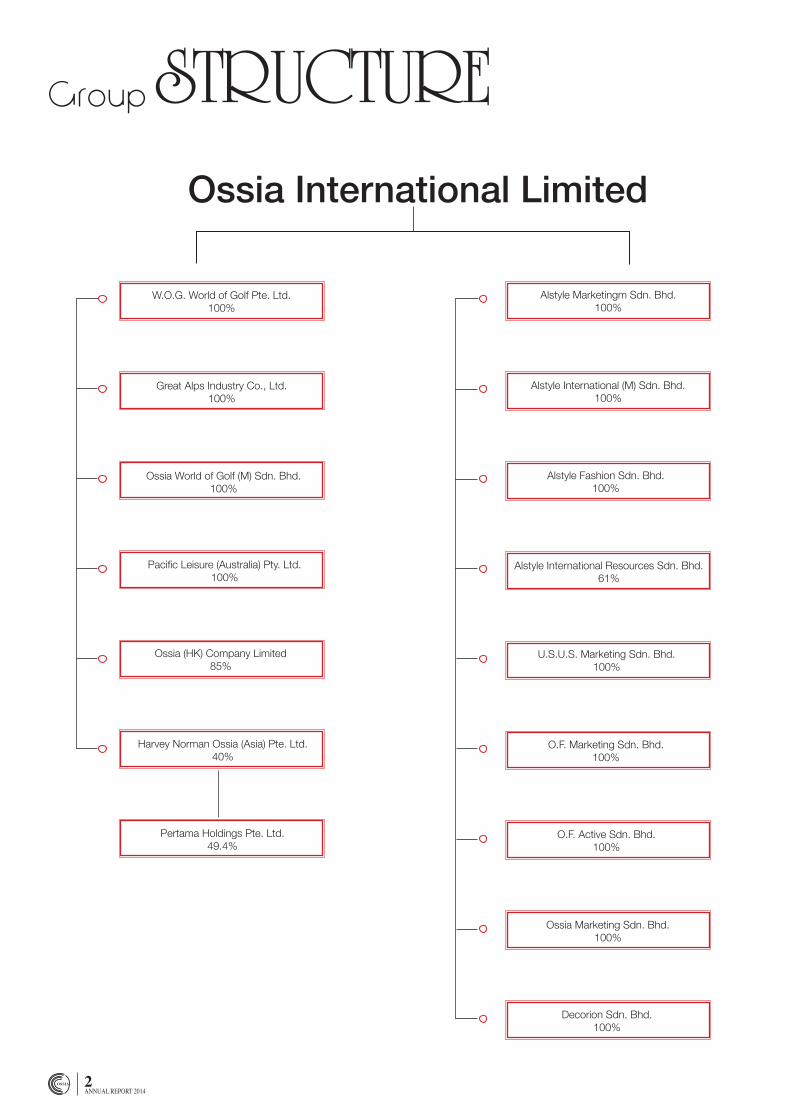
Group STRUCTUReOssia International Limited
Alstyle Marketingm Sdn. Bhd.100%
Alstyle International (M) Sdn. Bhd.100%
Alstyle Fashion Sdn. Bhd.100%
Alstyle International Resources Sdn. Bhd.61%
U.S.U.S. Marketing Sdn. Bhd.100%
O.F. Marketing Sdn. Bhd.100%
Ossia Marketing Sdn. Bhd.100%
O.F. Active Sdn. Bhd.100%
Decorion Sdn. Bhd.100%
W.O.G. World of Golf Pte. Ltd.100%
Great Alps Industry Co., Ltd.100%
Ossia World of Golf (M) Sdn. Bhd.100%
Pacific Leisure (Australia) Pty. Ltd.100%
Ossia (HK) Company Limited85%
Harvey Norman Ossia (Asia) Pte. Ltd.40%
Pertama Holdings Pte. Ltd.49.4%
3ANNUAL REPORT 2014
CorporatePROfIleOVERVIEW
Established in 1982, Ossia has grown from a footwear manufacturer to a leading regional distributor and retailer of lifestyle products in fashion apparel,
bags, footwear, sporting goods and golf in the Asia Pacific region. Listed on the main board of Singapore Exchange Securities Trading Limited (SGX-ST)
on 20 November 1996, Ossia has gained strong presence in 4 key regional markets namely Singapore, Malaysia, Taiwan and Hong Kong.
The Group has subsidiaries in these 4 regional markets with a distribution network of more than 1,400 channels/outlets, spanning 50 cities across the
Asia Pacific region. We have more than 40 specialty stores, more than 101 shop-in-shop, 4 franchise stores and 8 consignment counters in fashion
apparel, bags, footwear and golf products.
The Group also holds an effective 19.8% stake in Pertama Holdings Pte. Ltd., a leading retailer of consumer electronics and home furnishings under
Harvey Norman brand of retail stores in Singapore and Malaysia.
Today, the Group has exclusive distribution, licensee and franchise rights of over 40 well-known international brands as follows:
Fashion apparels: Affliction, Springfield, Elle, Elle Petite, 7 For All Mankind, Okaidi & Obaibi, Promod.
Bags : Tumi, Hedgren, Elle Active, Acegene, MLB, Arnold Palmer, Kangol, Benetton, Sisley, Paul Frank.
Footwear : Camper, Elle, Keds, Sperry Top Sider, Montrail, Thorlos.
Sport : Columbia, Prince, Fischer, AND 1, Spank, K-Swiss, Slazenger, Elle Active, Elle Sports, Mountain Hardwear.
Golf : Bridgestone, Tourstage, Precept, Paradiso, Newing, Reygrande, PRGR, Kasco, Head, SeeMore, Rife,
Hi-Tec, Callaway, LoudMouth, Advanz Golf, Fidra, Druh, Alberto Golf.
4ANNUAL REPORT 2014
STaTeMeNTGroup Executive Chairman’s
Dear Shareholders,
On behalf of the Board of Directors, I am pleased to present the Annual Report of the
Group for the financial year ended 31 March 2014 (“FY2014”).
Below are some highlights on the performance of the Group for the financial year ended
31 March 2014.
Financial Review
The Group’s revenue decreased by 26.4% to $55.4 million during 12-month period from
1 Apr 2013 to 31 Mar 2014 (‘12M2014”) as compared to last corresponding 15-month
period from 1 Jan 2012 to 31 Mar 2013 (‘15M2013”). The decline in revenue was mainly
contributed by one of the Group’s subsidiaries which had ceased operation since Sept
2012 and weakened retail sales.
The gross profit margin reduced from 52.0% to 50.6%. The gross margin was lower as
compared to the 15M2013 due to higher promotional discounts and markdowns given
on the past season merchandise.
Other operating income remained fairly constant.
Distribution costs decreased by 27.0% to $9.0 million as compared to 15M2013. The
decrease in distribution costs was mainly due to the change in financial year end and
therefore the inclusion of 3 months’ distribution costs from Jan 2013 to Mar 2013 in last
corresponding period.
Administrative expenses recorded for the current 12M 2014 period was comparable to
the corresponding period 15M2013. This was because the current period administration
expenses included the followings: namely the impairment loss of property, plant and
equipment, write off of property, plant and equipment, penalties paid to principal and
landlord totaling to $2.7 million.
The Group’s share of results of the associated company reduced from a profit of $1.3
million to a loss of $0.8 million due to poorer results of the associated company.
Net loss attributable to owners of the Company was $9.1 million in 12M2014 as
compared to $$4.6 million in 15M2013.
Balance Sheet Review
The Group / Company’s inventories reduced by $2.9 million and $2.4 million respectively
as compared to 31 March 2013. The reduction in inventories was mainly due to better
control over the purchases of inventory and allowance for stock absolescences.
The Company’s trade and other receivable reduced by $3.6 million as compared to 31
March 2013 was mainly due to improved collections.
The Group’s investment in associated company increased mainly due to share of
associated company’s revaluation reserve.
The Group / Company’s trade and other payables decreased due to repayment during
the financial year.
The Group / Company’s bill payables decreased due to repayment of bill payables and
decrease in purchases during the financial year.
5ANNUAL REPORT 2014
The Group’s borrowings increased by $4.9 million mainly due to an increase in draw-
down of banking facilities to meet working capital requirements.
The Group’s revaluation reserve increased by $2.8 million due to an increase in its
share of associated company’s revaluation reserve.
Moving Forward
The retail climate conditions remain sluggish and competition intensified. The Group
will continue to focus on its core business, improve operational efficiency and cost
management to stay competitive.
Note of Appreciation
I would like to express my sincere appreciation to my fellow Directors, management
team and all employees for their dedication and commitment to the group and to our
valued customers and business associates for their invaluable support.
Mr Goh Ching Wah, George
Group Executive Chairman

7ANNUAL REPORT 2014
Executive
MR GOH CHING WAH, GEORGEGroup Executive Chairman
He (Age: 55) was appointed as Director on 1 September 1990 and
re-designated as GROUP EXECUTIVE CHAIRMAN on 7 July 2009.
He is the Group Executive Chairman of our related company, Internet
Technology Group Limited (ITG) and an Executive Director of our related
company, VGO Corporation Limited (VGO). Mr George Goh and his
brothers (Messrs Goh Ching Huat, Steven and Goh Ching Lai, Joe) are
experienced entrepreneurs who had co-founded the Group, the ITG
Group and VGO Group. He is also the Deputy Chairperson and a Non-
Executive Director of Pertama Holdings Pte. Ltd. trading under the name
of “Harvey Norman”, which retails electrical, computer, furniture and
household products. George, together with his two brothers, was the
winner of the 1994 Rotary-ASME Entrepreneur Award. George and his
two brothers have 32 years of experience in distribution and retailing of
lifestyle products in footwear, fashion apparel, sporting goods, golf, bags
and accessories under the Group and also retailing sporting goods under
World of Sports, Mizuno, Columbia and Outdoors.
Mr. George Goh is responsible for overall Group direction, strategic
planning and business development. He is a member of the Nominating
Committee for the Group.
MR GOH CHING HUAT, STEVEN
Chief Executive Officer / Executive Director
He (Age: 49) was appointed as Director on 1 September 1990 and re-
designated as EXECUTIVE DIRECTOR on 1 July 2006. He is the Chief
Executive Officer / Group Executive Chairman of our related company,
VGO and an Executive Director of our related company, ITG. Steven,
together with his two brothers, was the winner of the 1994 Rotary-ASME
Entrepreneur Award. Steven and his two brothers have 32 years of
experience in distribution and retailing of lifestyle products in footwear,
fashion apparel, sporting goods, golf, bags and accessories under the
Group and also retailing sporting goods under World of Sports, Mizuno,
Columbia and Outdoors.
Mr. Steven Goh is jointly responsible for overall management of the Group
and businesses.
DIReCTORS


9ANNUAL REPORT 2014
MR GOH CHING LAI, JOENon-Independent / Non-Executive Director
He (Age: 54) was appointed as Director on 1 September 1990 and re-
designated as NON-EXECUTIVE DIRECTOR on 1 May 2009. He is also
the Non-Executive Director of our related companies, VGO and ITG. Goh
brothers were the winner of the 1994 Rotary-ASME Entrepreneur Award.
Their business interests range from distribution, retailing and technology
investments to property development in the Asia Pacific region. He is a
Non-Executive Director of Pertama Holdings Pte. Ltd., trading under the
name of “Harvey Norman”, which retails electrical, computer, furniture
and household products. Mr. Joe Goh and his two brothers have 32 years
of experience in distribution and retailing of lifestyle products in footwear,
fashion apparel, sporting goods, golf, bags and accessories. Besides
being a member of the Nominating Committee for the Group, he is also
a member of the Audit, Remuneration and Nominating Committees of
Pertama Holdings Pte. Ltd. .
MR WONG KING KHENGIndependent / Non-Executive Director
He (Age: 61) was appointed on 28 October 1996 as an INDEPENDENT /
NON-EXECUTIVE DIRECTOR. Mr Wong is presently the Managing Partner
of KK Wong and Associates, a public accounting firm in Singapore which
he founded in 2000. In addition, he is also the Managing Director of Soh
& Wong Management Consultants Pte Ltd which provides consulting
services for regional tax planning, merger and acquisition, strategic business
plans and advices on initial public offering services including restructuring,
feasibility studies, recruitment, profit forecasts and financial restructuring.
He was the founder and Managing Partner of Soh, Wong & Partners, a
public accounting firm, from 1989 to 2000. Prior to that, he was an audit
manager in an international accounting firm which gave him extensive
exposure in the fields of auditing, tax planning, management consulting and
public listing consulting. He is a Chartered Accountant with the Institute of
Singapore Chartered Accountants. Besides being the Chairman of the Audit
Committee, member of the Remuneration Committee and the Nominating
Committee for the Group, Mr Wong also holds directorships in Tiong Woon
Corporation Holding Limited, ITG and VGO.
MR ANTHONY CLIFFORD BROWNIndependent / Non-Executive Director
He (Age: 74) was appointed on 25 May 2002 as an INDEPENDENT /
NON-EXECUTIVE DIRECTOR. Mr Brown was formerly the Vice President
and General Manager of Prince Sports Group of United States of America
for the Asia Pacific region. In this capacity, he was responsible for sales
and marketing of Prince sports products throughout Asia Pacific.
Previously he was the General Manager and then the Managing Director
of LEGO Australia Pty Ltd. Mr Brown was the winner of United Kingdom
State Scholarship and holds a Bachelor of Science degree in Economics
from the London School of Economics (London University). Besides
being a member of the Audit Committee, Remuneration Committee
and Chairman of the Nominating Committee for the Group, Mr Brown
is also the Independent Director and member of the Audit Committees,
Remuneration Committees and Nominating Committees for ITG and
VGO.
MS MAE HENG SU-LINGIndependent / Non-Executive Director
She (Age: 43) was appointed on 27 April 2010 as an INDEPENDENT/
NON-EXECUTIVE DIRECTOR. Ms Mae is a member of the Audit
Committee, Nominating Committee and Chairman of the Remuneration
Committee for the Group. Ms Mae has over 18 years of experience in an
audit, corporate finance and business advisory environment with Ernst &
Young Singapore. She graduated with a Bachelor of Accountancy from
Nanyang Technological University, Singapore in 1991 and is a Chartered
Accountant with the Institute of Singapore Chartered Accountants. She is
an independent non-executive director of Asiatravel.com holding Ltd and
Apex Healthcare Berhad and holds directorships in her family-owned
investment holding companies.
Non-Executive DIReCTORS

10ANNUAL REPORT 2014
MS TAN SEOH LAYChief Operating Officer
Ms Tan is the Chief Operating Officer of Ossia International Limited
(“Ossia”). She joined the Company as General Manager in January
1997 and subsequently transferred to VGO Corporation Limited, an
affiliated company of Ossia in October 2002 and was promoted to Chief
Operating Officer to manage both the retail and wholesale divisions. On
1 March 2010, she was transferred back to Ossia International Limited
as the Chief Operating Officer. Prior to that, Ms Tan was the Group Sale
and Marketing Manager of Sportech where she successfully negotiated
with The Walt Disney and S. League for licensing projects in its kids’
swimwear and sportswear divisions. She was previously the Assistant
Membership Manager of Automobile Association of Singapore and a
Market Researcher with Rothmans of Pall Mall.
Ms Tan possesses more than 22 years of business development and
marketing experiences in senior management capacity.
Ms Tan holds a Master of Business Administration from the Birmingham
University, United Kingdom and is a Graduate Member of Chartered
Institute of Marketing (UK), Institute of Administrative Management (UK)
and an associate member of Marketing Institute of Singapore (MIS).
DR CHRISTINA LIANG-BOGUSEZWICZSenior General Manager
Dr Liang-Bogusezwicz is the Senior General Manager for Luxury,
Lifestyle and Fashion Division for both Singapore and Malaysia. Dr
Christina Liang-Boguszewicz has more than 18 years of professional
experience in luxury, lifestyle and corporate environment. She
holds a vast of portfolios from celebrity coaching, management
consultancy, client-investor relations, human resource to public relations
management.
Dr Liang-Bogusezwicz is responsible for the over-all growth, strategic
development and implementation, operations, branding, marketing
and merchandising for the entire luxury, lifestyle and fashion division for
Singapore and Malaysia
Dr Liang-Bogusezwicz holds a Doctorate of Business Administration in
Management
(SINGAPORE)Head Quarter
Senior MaNaGeMeNT
MS SOH LEA CHEN
Senior General Manager
Ms Soh joined the group as Senior General Manager in June 2012. She
oversees the overall retail and wholesale operations, branding, marketing
and merchandising in the Golf division in Singapore. She graduated with
a Bachelor of Business in Accountancy from Royal Melbourne Institute of
Technology University in 2002. Ms Soh had held management positions
in the fashion, beauty and spa industries in the last 13 years.
MS TAM HUEY CHYUN, TAMMYCorporate Finance Manager
Ms Tam is the Corporate Finance Manager of the Group. She oversees
the overall accounting functions, tax, treasury, SGX financial reporting,
and management reporting and corporate finance of our Group. Prior
to joining us, Ms Tam has spent the last 15 years in various Singapore
listed companies. She holds a Bachelor of Commerce in Accounting
and Finance from Murdoch University, Western Australia and currently
a Chartered Accountant with the Institute of Singapore Chartered
Accountants.
MS LEOW SIEW PHAIkCorporate Internal Auditor
Ms Leow is the Corporate Internal Auditor of Ossia International Limited.
She is responsible for conducting the internal audit of the Group and
assessing the risk management reports of the Group. Prior to joining our
Group, she was the department head of internal audit division and risk
management division in a listed company in Malaysia. She is a fellow
member of The Association of Chartered Certified Accountants (ACCA),
a member of Malaysia Institute of Accountants (MIA) and a professional
member of The Institute Of Internal Auditors Malaysia (CMIIA).
11ANNUAL REPORT 2014
MS LIM SOOk kIANGExecutive Director
Ms Lim is the Executive Director of Alstyle International (M) Sdn Bhd. She
is responsible for the product development, merchandising, marketing
and distribution of apparels and accessories. She joined us as a General
Manager in 1994 and was promoted to Executive Director in 1996. She
has over 26 years of experience in retailing, merchandising, sourcing
and business development in various departmental stores and specialty
stores. Prior to joining us, she was a Group Merchandising Manager in
R.S.H. Sports (M) Sdn Bhd. She holds a Bachelor of Arts from Universiti
Kebangsaan Malaysia.
MR SAW SWEE LEONG
Executive Director
Mr Saw is the Executive Director of Ossia World of Golf (M) Sdn Bhd.
He is responsible for the distribution of sporting goods, golf equipment,
footwear and accessories in Malaysia. He joined the Group in 1994. Swee
Leong has over 25 years of experience in marketing and distribution of
sporting goods. Prior to joining us, he was the Manager and Company
Director of Sunrise Sports Sdn Bhd. Swee Leong was formerly the
National Badminton Champion and represented Malaysia in all the
International Tournaments including the Thomas Cup. He was a member
of the Malaysian Thomas Team that emerged runners-up in 1977.
MR LENG kOk CHEN Financial Controller
Mr Leng is the Financial Controller of Alstyle International (M) Sdn Bhd. He
is in charge of the financial, office administration, human resource, IT and
warehouse of the company. He joined the Group in 2003. Prior to joining
us, he has acquired many years of experience in several organisations in
the retail industry such as Parkson Corporation Sdn Bhd, Apcot (M) Sdn
Bhd etc. He is a member of the Malaysia Institute of Accountants.
MR WONG kIN SHING
Managing Director
Mr Wong is the Managing Director of Ossia (HK) Company Limited. He
is responsible for the marketing and distribution of sporting goods, golf
equipment, footwear and accessories in Hong Kong and Macau. He
joined the Group in 1994. Simon has more than 26 years of experience
in marketing and distribution of lifestyle sporting goods, footwear, golf
equipment, apparel and accessories. Prior to joining us, he was the
General Manager of Sovereign Sports Ltd.
(HONG KONG)
(MALAYSIA)
(TAIWAN)
MS POLLY kAN
Finance and Administration Manager
Ms. Polly Kan is the Finance and Administration Manager of Ossia (HK)
Company Limited. She is responsible for the company accounting,
finance and administration matters with which she has acquired many
years relevant experience. She joined the Group in 1996. She holds a
Master of Business Administration from the University of Manchester in
the United Kingdom. She is an associate member of the Hong Kong
Institute of Certified Public Accountants as well as a fellow member of the
Association of Chartered Certified Accountants.
MR HSU CHIH TUNG
Managing Director
Mr Hsu is the Managing Director of Great Alps Industry Co., Ltd. He is
brother-in-law of non-executive Director, Goh Ching Lai. He is responsible
for the product development, brand management, marketing and
distribution of bags and accessories in Taiwan. He joined us as a Brand
Manager in 1996 and was promoted to Managing Director in 2001. Prior
to joining us, he was a Product Developer of E.S. Original. Alan graduated
from Ta-Ming Junior College of Commerce in 1990 with a Diploma in
Business Administration.
MS WU WAN CHUN
Finance Manager
Ms Wu joined Great Alps Industry Co., Ltd. as Finance Manager in 2013.
She graduated with Bachelor degree of Business Administration from
National Chengchi University in Taiwan. She has over 11 years relevant
experience in retail industry . Prior to joining us, she was an Assistant
Finance Controller in a Hong Kong listed company.


15ANNUAL REPORT 2014
BOARD OF DIRECTORS
Goh Ching Wah (Chairman)
Goh Ching Huat
Goh Ching Lai
Wong King Kheng
Anthony Clifford Brown
Heng Su-Ling, Mae
AUDIT COMMITTEE
Wong King Kheng (Chairman)
Anthony Clifford Brown
Heng Su-Ling, Mae
NOMINATING COMMITTEE
Anthony Clifford Brown (Chairman)
Wong King Kheng
Heng Su-Ling, Mae
Goh Ching Wah
Goh Ching Lai
REMUNERATION COMMITTEE
Heng Su-Ling, Mae (Chairman)
Anthony Clifford Brown
Wong King Kheng
COMPANY SECRETARIES
Lotus Isabella Lim Mei Hua, FCIS
Lee Bee Fong, ACIS
REGISTERED OFFICE
No. 10 Changi South Lane
#07-01
Singapore 486162
Tel: 6543 1133
Fax: 6543 5801
SHARE REGISTRAR
Tricor Barbinder Share
Registration Services
(A division of Tricor Singapore Pte. Ltd)
80 Robinson Road #02-00
Singapore 068898
AUDITORS
Ernst & Young
One raffles Quay
North Tower, Level 18
Singapore 048583
PARTNER-IN-CHARGE
Terry Wee Hiang Bing
Appointed since financial year ended
31 March 2014
BANkERS
Bank of China Limited
CIMB Bank Berhad
DBS Bank Limited
Malayan Banking Berhad
RHB Bank Berhad
Standard & Chartered Bank
United Overseas Bank Limited
UBS AG
Corporate INfORMaTION
16ANNUAL REPORT 2014
The Board of Directors (the “Board”) of Ossia International Limited (the “Company”) is committed to maintaining a high standard of corporate
governance. Good corporate governance establishes and maintains an ethical environment and enhances the interests of all shareholders. This report
describes the Company’s corporate governance processes and structures with specific reference made to the principles and guidelines of the Code
of Corporate Governance 2012 (the ‘Code”).
Board of Directors
Principle 1 : Board’s Conduct of Affairs
The Company is headed by an effective Board to lead and control its operations and affairs for the success of the Company.
The primary function of the Board is to protect and enhance long-term value and returns for its shareholders. Apart from its statutory responsibilities,
the Board sets the overall strategy of the Company and its subsidiaries (the “Group”) as well as review various matters including major funding and
investments proposal, material acquisitions and disposal of assets, key operational initiatives and financial controls, the release of the Group’s quarterly
and full year results and interested persons transaction of a material nature.
The Board conducts scheduled meetings on a quarterly basis to coincide with the announcement of the Group’s quarterly results. Ad-hoc Board
meetings are convened as and when they are deemed necessary in between scheduled meetings. When a physical Board meeting is not possible,
timely communication with members of the Board can be achieved through electronic means.
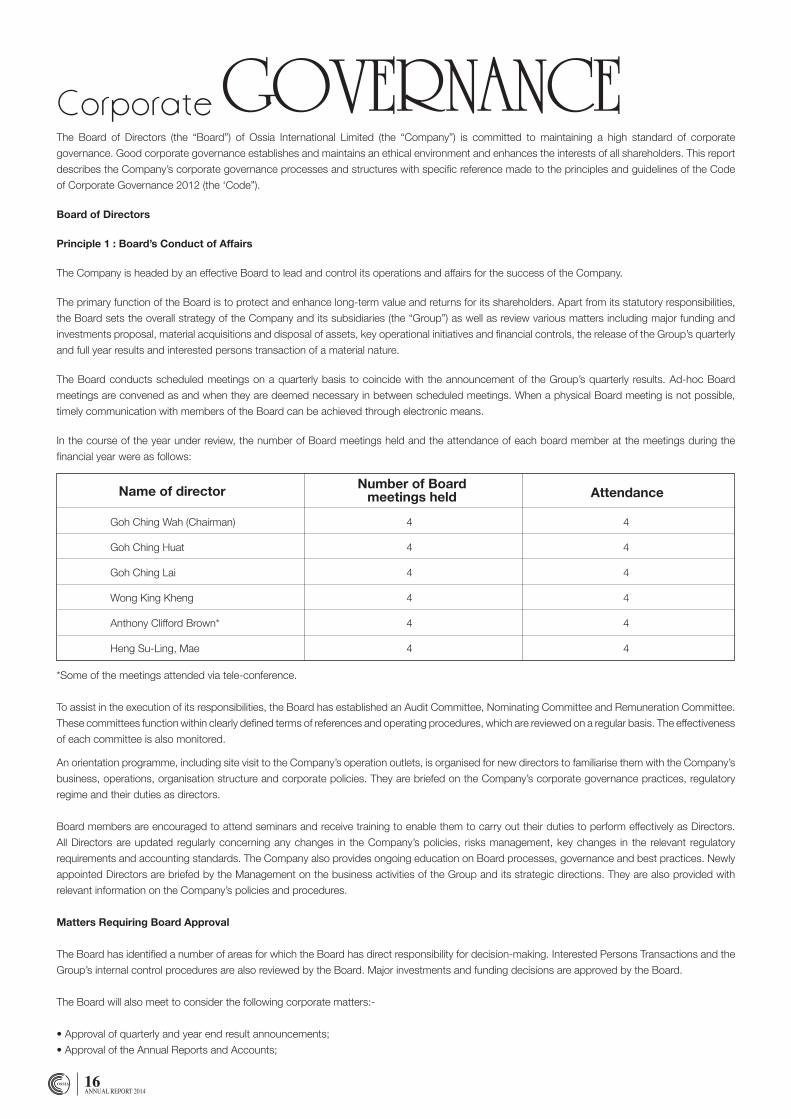
In the course of the year under review, the number of Board meetings held and the attendance of each board member at the meetings during the
financial year were as follows:
*Some of the meetings attended via tele-conference.
To assist in the execution of its responsibilities, the Board has established an Audit Committee, Nominating Committee and Remuneration Committee.
These committees function within clearly defined terms of references and operating procedures, which are reviewed on a regular basis. The effectiveness
of each committee is also monitored.
An orientation programme, including site visit to the Company’s operation outlets, is organised for new directors to familiarise them with the Company’s
business, operations, organisation structure and corporate policies. They are briefed on the Company’s corporate governance practices, regulatory
regime and their duties as directors.
Board members are encouraged to attend seminars and receive training to enable them to carry out their duties to perform effectively as Directors.
All Directors are updated regularly concerning any changes in the Company’s policies, risks management, key changes in the relevant regulatory
requirements and accounting standards. The Company also provides ongoing education on Board processes, governance and best practices. Newly
appointed Directors are briefed by the Management on the business activities of the Group and its strategic directions. They are also provided with
relevant information on the Company’s policies and procedures.
Matters Requiring Board Approval
The Board has identified a number of areas for which the Board has direct responsibility for decision-making. Interested Persons Transactions and the
Group’s internal control procedures are also reviewed by the Board. Major investments and funding decisions are approved by the Board.
The Board will also meet to consider the following corporate matters:-
• Approval of quarterly and year end result announcements;
• Approval of the Annual Reports and Accounts;
Name of director Number of Board meetings held Attendance
Goh Ching Wah (Chairman)
Goh Ching Huat
Goh Ching Lai
Wong King Kheng
Anthony Clifford Brown*
Heng Su-Ling, Mae
4
4
4
4
4
4
4
4
4
4
4
4
Corporate GOVeRNaNCe
17ANNUAL REPORT 2014
• Convening of Shareholder’s Meetings
• Approval of Corporate Strategies; and
• Material Acquisitions and disposal of assets
Principle 2 : Board Composition and Guidance
The Board consists of six directors of whom two are executive, three are independent directors and one is non-executive and non-independent.
The criteria for independence is based on the definition as stated in the Code. The Board considers an “independent” director as one who has no
relationship with the Company, its related companies or its officers that could interfere, or be reasonably perceived to interfere, with the exercise of the
director’s independent judgment of the conduct of the Group’s affairs.
Based on its composition, the Board is able to exercise objective judgment on corporate affairs. The composition of the Board is reviewed annually
by the Nominating Committee to ensure that the Board has an appropriate mix of expertise, experience and independence needed to discharge its
duties effectively.
Mr Wong King Kheng and Mr Anthony Clifford Brown have both served as Independent Directors for more than 9 years. The Board has carried out a
rigorous review of their independence status. The Board’s view is that Mr Wong King Kheng and Mr Anthony Clifford Brown continue to demonstrate
the ability to exercise strong independent judgement in their deliberations and to act in the best interests of the Company, and that their length of
service has not affected their independence from management. Mr Wong King Kheng and Mr Anthony Clifford Brown continues to express views,
debate issues and objectively and actively scrutinize and challenge management. After taking into account all these factors and having weighted the
need for Board refreshment against tenure for relative benefit, the Nominating Committee and the Board has reviewed and determined that Mr Wong
King Kheng and Mr Anthony Clifford Brown continue as Independent Directors, notwithstanding that their service has been for more than nine years.
The Board comprises an appropriate mix of businessman and professional with core competencies and diversity of experience, all of whom as a group,
provides the Board with the necessary experience and expertise to direct and lead the Group. The diversity of the Directors’ experience allows for the
useful exchange of ideas and views. The Board is satisfied that no individual member of the Board dominates the Board’s decision making and that
there is sufficient accountability and capacity for independent decision-making. Taking into account the scope and nature of operations of the Group,
the Board considers its current size to be adequate for effective decision making.
Principle 3 : Group Executive Chairman and Chief Executive Officer (“CEO”)
The Chairman and CEO are two separate individuals who are brothers and who are both executive directors of the Company.
The Group Executive Chairman (“GEC”) is Mr Goh Ching Wah, who bears the primary responsibility for Board proceedings. Together with the
assistance of Company Secretaries, he schedules Board meetings as and when required and exercise control over the quality, quantity and timeliness
of information flow between the Board and the Management. He is also responsible for overall Group direction, strategic planning and business
development.
Mr Goh Ching Huat, being Executive Director and CEO is the most senior executive in the Group. He is responsible for the day-to-day running of the
Group and supervises the business operations with the Management. He is jointly responsible for overall management of the Group and businesses.
All major decisions made by GEC and CEO are reviewed by the Audit Committee. Their performance and appointment to the Board are being reviewed
periodically by the Nominating Committee and their remuneration package is being reviewed periodically by the Remuneration Committee. Both the
Nominating Committee and the Remuneration Committee comprise a majority of/wholly of independent directors of the Company. As such, the Board
believes that there are adequate safeguards in place against an uneven concentration of power and authority on a single individual.
Nominating Committee (“NC”)
Principle 4 : Board Membership
The Nominating Committee was established on 25 May 2002. The NC is chaired by Mr Anthony Clifford Brown and its members are Mr Wong King
Kheng, Ms Heng Su-Ling, Mae, Mr Goh Ching Lai and Mr Goh Ching Wah. With the exception of Mr Goh Ching Lai, and Mr Goh Ching Wah, the other
three directors are Independent Directors.
The primary function of the NC is to determine the criteria for identifying candidates and reviewing nominations for the appointment of directors to
the Board and also to decide how the Board’s performance may be evaluated and propose objective performance criteria for the Board’s approval.
When a vacancy arises under any circumstance, or where it is considered that the Board would benefit from the services of a new director with
particular skills, the NC, in consultation with the Board, determines the selection criteria and identifies candidates with the appropriate expertise and
experience for the position. The NC then nominates the most suitable candidate who is only then appointed to the Board.
18ANNUAL REPORT 2014
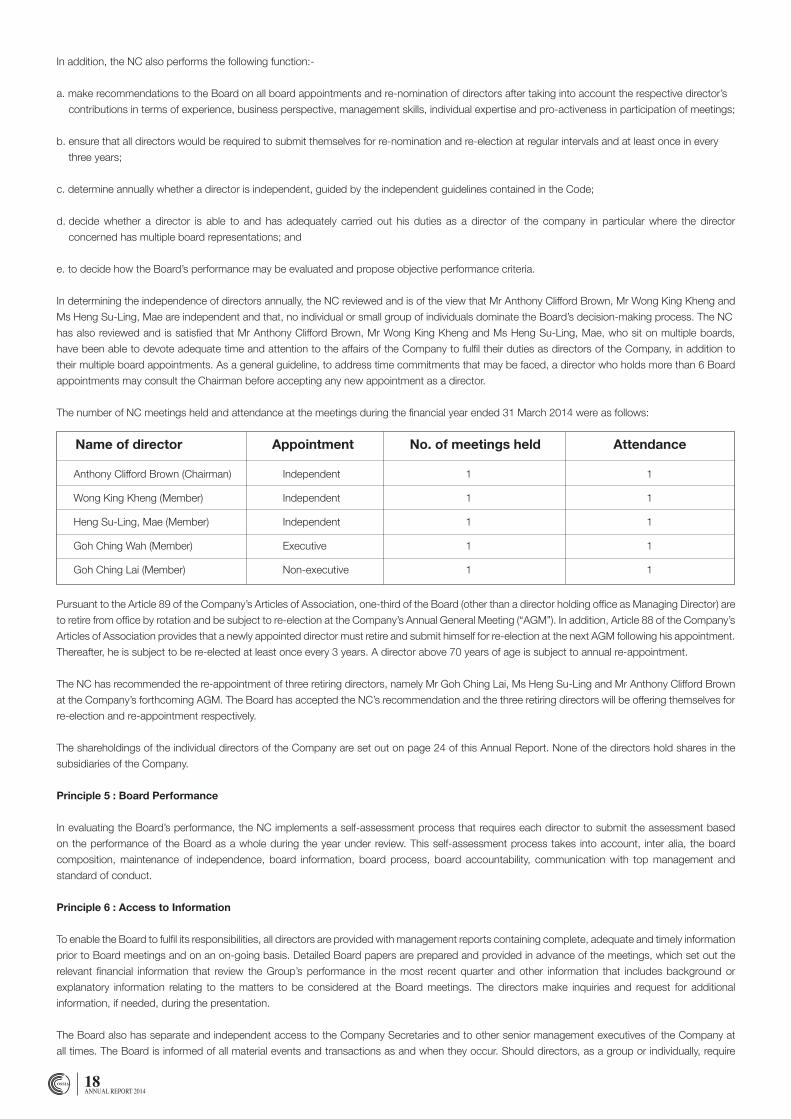
Name of director AttendanceNo. of meetings heldAppointment
Anthony Clifford Brown (Chairman)
Wong King Kheng (Member)
Heng Su-Ling, Mae (Member)
Goh Ching Wah (Member)
Goh Ching Lai (Member)
Independent
Independent
Independent
Executive
Non-executive
1
1
1
1
1
1
1
1
1
1
In addition, the NC also performs the following function:-
a. make recommendations to the Board on all board appointments and re-nomination of directors after taking into account the respective director’s
contributions in terms of experience, business perspective, management skills, individual expertise and pro-activeness in participation of meetings;
b. ensure that all directors would be required to submit themselves for re-nomination and re-election at regular intervals and at least once in every
three years;
c. determine annually whether a director is independent, guided by the independent guidelines contained in the Code;
d. decide whether a director is able to and has adequately carried out his duties as a director of the company in particular where the director
concerned has multiple board representations; and
e. to decide how the Board’s performance may be evaluated and propose objective performance criteria.
In determining the independence of directors annually, the NC reviewed and is of the view that Mr Anthony Clifford Brown, Mr Wong King Kheng and
Ms Heng Su-Ling, Mae are independent and that, no individual or small group of individuals dominate the Board’s decision-making process. The NC
has also reviewed and is satisfied that Mr Anthony Clifford Brown, Mr Wong King Kheng and Ms Heng Su-Ling, Mae, who sit on multiple boards,
have been able to devote adequate time and attention to the affairs of the Company to fulfil their duties as directors of the Company, in addition to
their multiple board appointments. As a general guideline, to address time commitments that may be faced, a director who holds more than 6 Board
appointments may consult the Chairman before accepting any new appointment as a director.
The number of NC meetings held and attendance at the meetings during the financial year ended 31 March 2014 were as follows:
Pursuant to the Article 89 of the Company’s Articles of Association, one-third of the Board (other than a director holding office as Managing Director) are
to retire from office by rotation and be subject to re-election at the Company’s Annual General Meeting (“AGM”). In addition, Article 88 of the Company’s
Articles of Association provides that a newly appointed director must retire and submit himself for re-election at the next AGM following his appointment.
Thereafter, he is subject to be re-elected at least once every 3 years. A director above 70 years of age is subject to annual re-appointment.
The NC has recommended the re-appointment of three retiring directors, namely Mr Goh Ching Lai, Ms Heng Su-Ling and Mr Anthony Clifford Brown
at the Company’s forthcoming AGM. The Board has accepted the NC’s recommendation and the three retiring directors will be offering themselves for
re-election and re-appointment respectively.
The shareholdings of the individual directors of the Company are set out on page 24 of this Annual Report. None of the directors hold shares in the
subsidiaries of the Company.
Principle 5 : Board Performance
In evaluating the Board’s performance, the NC implements a self-assessment process that requires each director to submit the assessment based
on the performance of the Board as a whole during the year under review. This self-assessment process takes into account, inter alia, the board
composition, maintenance of independence, board information, board process, board accountability, communication with top management and
standard of conduct.
Principle 6 : Access to Information
To enable the Board to fulfil its responsibilities, all directors are provided with management reports containing complete, adequate and timely information
prior to Board meetings and on an on-going basis. Detailed Board papers are prepared and provided in advance of the meetings, which set out the
relevant financial information that review the Group’s performance in the most recent quarter and other information that includes background or
explanatory information relating to the matters to be considered at the Board meetings. The directors make inquiries and request for additional
information, if needed, during the presentation.
The Board also has separate and independent access to the Company Secretaries and to other senior management executives of the Company at
all times. The Board is informed of all material events and transactions as and when they occur. Should directors, as a group or individually, require
19ANNUAL REPORT 2014
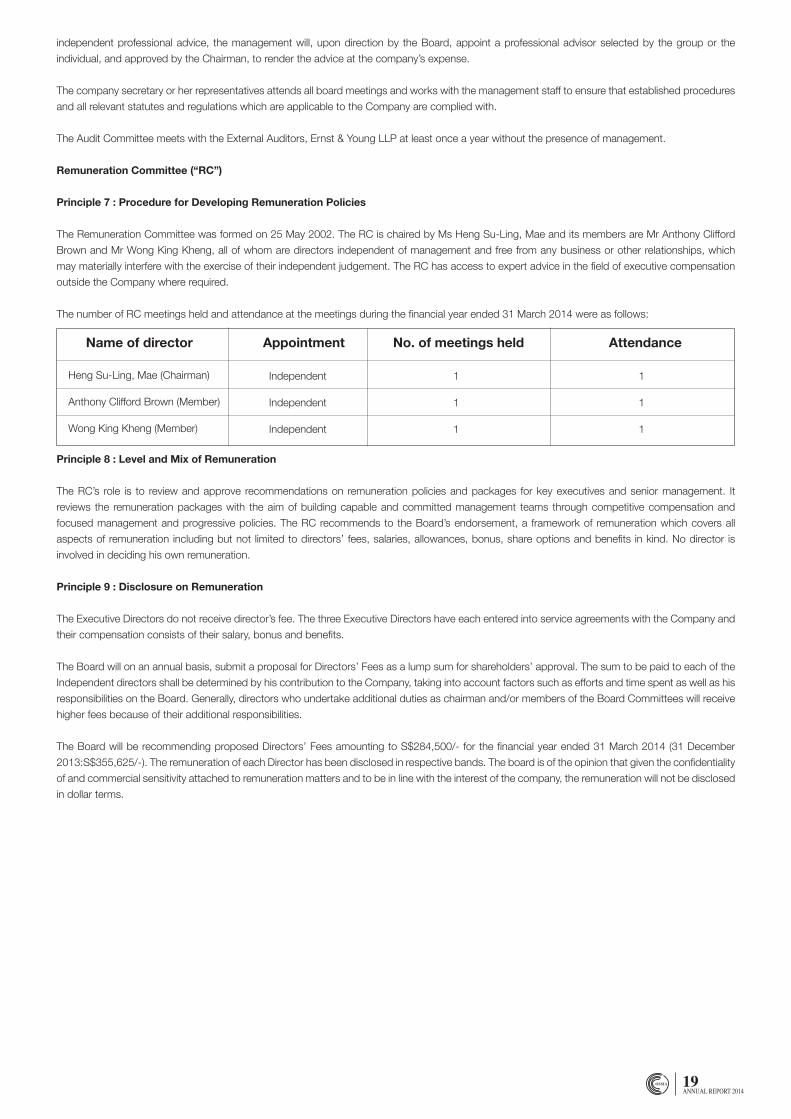
Name of director Appointment No. of meetings held Attendance
Heng Su-Ling, Mae (Chairman)
Anthony Clifford Brown (Member)
Wong King Kheng (Member)
Independent
Independent
Independent
1
1
1
1
1
1
independent professional advice, the management will, upon direction by the Board, appoint a professional advisor selected by the group or the
individual, and approved by the Chairman, to render the advice at the company’s expense.
The company secretary or her representatives attends all board meetings and works with the management staff to ensure that established procedures
and all relevant statutes and regulations which are applicable to the Company are complied with.
The Audit Committee meets with the External Auditors, Ernst & Young LLP at least once a year without the presence of management.
Remuneration Committee (“RC”)
Principle 7 : Procedure for Developing Remuneration Policies
The Remuneration Committee was formed on 25 May 2002. The RC is chaired by Ms Heng Su-Ling, Mae and its members are Mr Anthony Clifford
Brown and Mr Wong King Kheng, all of whom are directors independent of management and free from any business or other relationships, which
may materially interfere with the exercise of their independent judgement. The RC has access to expert advice in the field of executive compensation
outside the Company where required.
The number of RC meetings held and attendance at the meetings during the financial year ended 31 March 2014 were as follows:
Principle 8 : Level and Mix of Remuneration
The RC’s role is to review and approve recommendations on remuneration policies and packages for key executives and senior management. It
reviews the remuneration packages with the aim of building capable and committed management teams through competitive compensation and
focused management and progressive policies. The RC recommends to the Board’s endorsement, a framework of remuneration which covers all
aspects of remuneration including but not limited to directors’ fees, salaries, allowances, bonus, share options and benefits in kind. No director is
involved in deciding his own remuneration.
Principle 9 : Disclosure on Remuneration
The Executive Directors do not receive director’s fee. The three Executive Directors have each entered into service agreements with the Company and
their compensation consists of their salary, bonus and benefits.
The Board will on an annual basis, submit a proposal for Directors’ Fees as a lump sum for shareholders’ approval. The sum to be paid to each of the
Independent directors shall be determined by his contribution to the Company, taking into account factors such as efforts and time spent as well as his
responsibilities on the Board. Generally, directors who undertake additional duties as chairman and/or members of the Board Committees will receive
higher fees because of their additional responsibilities.
The Board will be recommending proposed Directors’ Fees amounting to S$284,500/- for the financial year ended 31 March 2014 (31 December
2013:S$355,625/- ). The remuneration of each Director has been disclosed in respective bands. The board is of the opinion that given the confidentiality
of and commercial sensitivity attached to remuneration matters and to be in line with the interest of the company, the remuneration will not be disclosed
in dollar terms.
20ANNUAL REPORT 2014
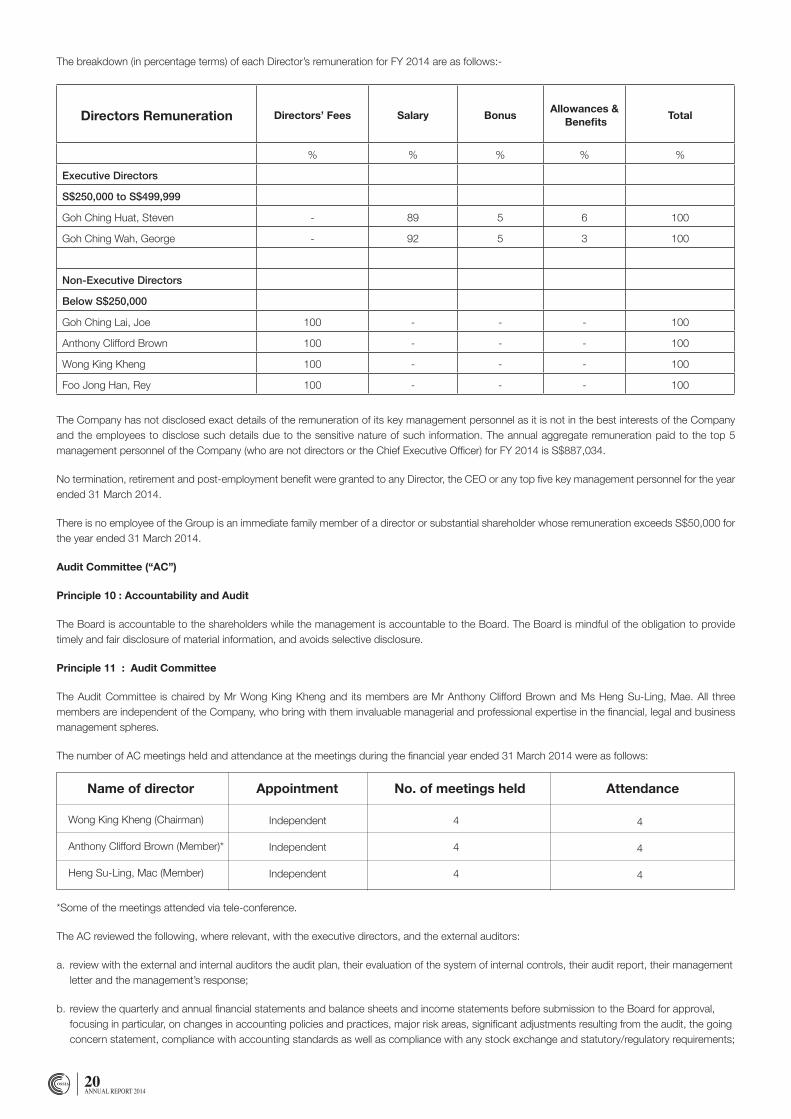
The breakdown (in percentage terms) of each Director’s remuneration for FY 2014 are as follows:-
The Company has not disclosed exact details of the remuneration of its key management personnel as it is not in the best interests of the Company and the employees to disclose such details due to the sensitive nature of such information. The annual aggregate remuneration paid to the top 5 management personnel of the Company (who are not directors or the Chief Executive Officer) for FY 2014 is S$887,034.
No termination, retirement and post-employment benefit were granted to any Director, the CEO or any top five key management personnel for the year ended 31 March 2014.
There is no employee of the Group is an immediate family member of a director or substantial shareholder whose remuneration exceeds S$50,000 for the year ended 31 March 2014.
Audit Committee (“AC”)
Principle 10 : Accountability and Audit
The Board is accountable to the shareholders while the management is accountable to the Board. The Board is mindful of the obligation to provide timely and fair disclosure of material information, and avoids selective disclosure.
Principle 11 : Audit Committee
The Audit Committee is chaired by Mr Wong King Kheng and its members are Mr Anthony Clifford Brown and Ms Heng Su-Ling, Mae. All three members are independent of the Company, who bring with them invaluable managerial and professional expertise in the financial, legal and business management spheres.
The number of AC meetings held and attendance at the meetings during the financial year ended 31 March 2014 were as follows:
*Some of the meetings attended via tele-conference.
The AC reviewed the following, where relevant, with the executive directors, and the external auditors:
a. review with the external and internal auditors the audit plan, their evaluation of the system of internal controls, their audit report, their management letter and the management’s response;
b. review the quarterly and annual financial statements and balance sheets and income statements before submission to the Board for approval, focusing in particular, on changes in accounting policies and practices, major risk areas, significant adjustments resulting from the audit, the going concern statement, compliance with accounting standards as well as compliance with any stock exchange and statutory/regulatory requirements;
Name of director Appointment No. of meetings held Attendance
Wong King Kheng (Chairman)
Anthony Clifford Brown (Member)*
Heng Su-Ling, Mac (Member)
Independent
Independent
Independent
4
4
4
4
4
4
Directors Remuneration Directors’ Fees Salary BonusAllowances &
BenefitsTotal
% % % % %
Executive Directors
S$250,000 to S$499,999
Goh Ching Huat, Steven - 89 5 6 100
Goh Ching Wah, George - 92 5 3 100
Non-Executive Directors
Below S$250,000
Goh Ching Lai, Joe 100 - - - 100
Anthony Clifford Brown 100 - - - 100
Wong King Kheng 100 - - - 100
Foo Jong Han, Rey 100 - - - 100
21ANNUAL REPORT 2014
c. review the internal control and procedures and ensure co-ordination between the external auditors and the management, review the assistance given by management to the auditors and discuss problems and concerns, if any, arising from the interim and final audits, and any matters which the auditors may wish to discuss (in the absence of management where necessary);
d. review and discuss with the external auditors any suspected fraud or irregularity, or suspected infringement of any relevant laws, rules or regulations, which has or is likely to have a material impact on the Group’s operating results or financial position, and the management’s response;
e. review the independence of the external auditors and recommend to the Board the appointment or re-appointment of the external auditors, the audit fee, and matters relating to the resignation or dismissal of the auditors;
f. review interested person transactions (as defined in Chapter 9 of the Listing Manual of the SGX-ST) to ensure that they are on normal commercial terms and not prejudicial to the interests of the Company or its shareholders;
g. undertake such other reviews and projects, in particular matters pertaining to acquisitions and realisations, etc., as may be requested by the Board and will report to the Board its findings from time to time on matters arising and requiring the attention of the Audit Committee; and
h. generally undertake such other functions and duties as may be required by statute or the Listing Manual, and by such amendments made thereto from time to time.
Pursuant to Rule 1207 (6)(b) and (6)(c), the Audit Committee undertook the review of the independence and objectivity of the auditors as well as reviewing the non-audit services provided by the incumbent auditors, and the aggregate amount of audit fees paid to them. During the current financial year, there was no non-audit related work carried out by the incumbent auditors, hence there was no fee paid in this respect. The Audit Committee is satisfied that neither their independence nor their objectivity is put at risk, and that they are still able to meet the audit requirements and statutory obligations of the Company. Accordingly, the Audit Committee has recommended the re-appointment of the auditors at the forthcoming Annual General Meeting (“AGM’) of the Company. In recommending the re-appointment of the auditors, the Audit Committee considered and reviewed a variety of factors including adequacy of resources, experience of supervisory and professional staff to be assigned to the audit, and size and complexity of the Group, its businesses and operations.
Pursuant to Rule 1207 (6)(a), the fees payable to auditors is set out in Note 8 on page 51 of this Annual Report.
The AC has nominated Ernst & Young LLP (“EY”) for re-appointment as external auditors of the Company at the forthcoming Annual General Meeting. The AC noted there were no non-audit services rendered in FY2014 and FY2013 and there were no non-audit fees payable to the Company’s external auditors in FY2014 and FY 2013. The Company is in compliance with Rules 712, 715 and 716 of the Listing Manual of the SGX-ST .
Principle 12 : Internal Controls
The Board acknowledges that it is responsible for the overall internal control framework, but recognises that no cost effective internal control system will preclude all errors and irregularities, as a system is designed to manage rather than to eliminate the risk of failure to achieve business objectives, and can provide only reasonable but not absolute assurance against material misstatement or loss. The Group’s internal controls and systems are designed to provide reasonable assurance to the integrity and reliability of the financial information and to safeguard and maintain accountability of its assets.
The Audit Committee through the assistance of internal and external auditors, reviews and reports to the Board on the adequacy of the Company’s system of controls including the maintenance of proper accounting records, the reliability of financial information, compliance with appropriate legislation, regulation and best practice, and the identification and management of business risks.
Pursuant to Rule 1207 (10), the Board is satisfied that the Company’s framework of internal controls is adequate to provide reasonable assurance of the integrity, effectiveness and efficiency of the Company in safeguarding its assets and Shareholders’ investments. Such framework serves to provide reasonable assurance against material misstatement or loss.
Based on the internal and external audit findings, the Board with the concurrence of the Audit Committee is of the opinion that the Group’s internal controls addressing financial, operational and compliance risks are adequate in meeting the needs of the Group and provide assurance in safeguarding the Group’s assets. The internal controls ensure the Group’s maintenance of proper accounting records, compliance with applicable regulations and best practices and timely identification and containment of financial, operational and compliance risks.
Principle 13 : Internal Audit
To comply with the Code, the Company has established an internal audit function. The internal auditor’s primary line of reporting is to the Chairman of the AC. The AC reviews the activities of the internal auditor on a regular basis, including overseeing and monitoring of the implementation of improvements required on internal control weaknesses identified.
During the financial year ended 31 March 2014, the Company’s internal auditors conducted annual review of the effectiveness of the Company’s material internal controls, including financial, operational and compliance controls. The Company’s external auditors considered internal control relevant to the Company’s preparation and fair presentation of the financial statements in order to design audit procedures that are appropriate in the circumstances, but not for the purpose of expressing an opinion on the effectiveness of the Company’s internal control. Any material non-compliance and recommendation for improvement were reported to the AC. The AC, on behalf of the Board, also reviewed the effectiveness of the Group’s system of internal controls in the light of key business and financial risks affecting the operations. Based on the reports submitted by the external and internal auditors and the various controls put in place by the management, the AC is satisfied that there are adequate internal controls to meet the needs of the Group in its current business environment.
22ANNUAL REPORT 2014
Communication With Shareholders
Principle 14 : Communication with Shareholders
The Company communicates pertinent information to its shareholders on a regular and timely basis through:
• the Company’s annual reports that are prepared and issued to all shareholders. The Board makes every effort to ensure that the annual report includes all relevant information about the Group and other disclosures required by the Companies Act and the Singapore Financial Reporting Standards;
• quarterly financial statements containing a summary of the financial information and affairs of the Group for the period. These are issued via SGXNET onto the SGX website;
• notices of and explanatory memoranda for AGMs and extraordinary general meetings; and
• disclosure to the SGX-ST and press releases on major development of the Group.
The Board takes note that there should be separate resolution at general meetings on each substantially separate issue and supports the Code’s principle as regards “bundling” of resolutions. The Board will provide reasons and material implications where resolutions are interlinked.
Principle 15 : Greater Shareholder Participation
A copy of the Notice of Annual General Meeting (“AGM”) and Annual Report are despatched to every shareholder of the Company at least 14 clear days before the meeting. The Notice is also advertised in the newspapers and made available on the SGX website. During the AGM, shareholders are given opportunities to speak and seek clarifications concerning the Company and its operations.
The Chairmen of the Executive, Audit, Remuneration and Nominating Committees are in attendance at the Company’s AGM to address the shareholders’ questions relating to the work of these Committees. The Company’s external auditors are also invited to attend the AGM and are available to assist the directors in addressing any relevant queries by the shareholders relating to the conduct of the audit and the preparation and content of their auditors’ report.
Dividend Policy
The Company’s dividend policy endeavours to balance dividend return to shareholders with the need for long-term sustainable growth whilst aiming for an efficient capital structure. The Company strives to provide shareholders on an annual basis with a consistent and sustainable ordinary dividend, with a variable special dividend based on cash position, working capital, expenditure plans, acquisition opportunities and market environment.
Any payouts are communicated to shareholders via announcement on SGX Net when the Company discloses its financial results.
Dealing in Securities
The Group has adopted an internal code which prohibits the directors and executives of the Company from dealings in the Company’s shares while in possession of unpublished price-sensitive information during the periods commencing two weeks prior to the announcement of the Group’s first three quarters results, or one month prior to the announcement of the full year results, and ending on the date of announcement of the relevant results. All Directors and executives of the Company and its subsidiaries are also expected to observe insider trading laws at all times even when dealing in securities within permitted trading period. They are also discouraged from dealing in the Company’s shares on short-term considerations.
Material Contracts
There were no material contracts entered into by the Company or any of its subsidiaries involving the interest of the CEO, any Director, or controlling shareholder.
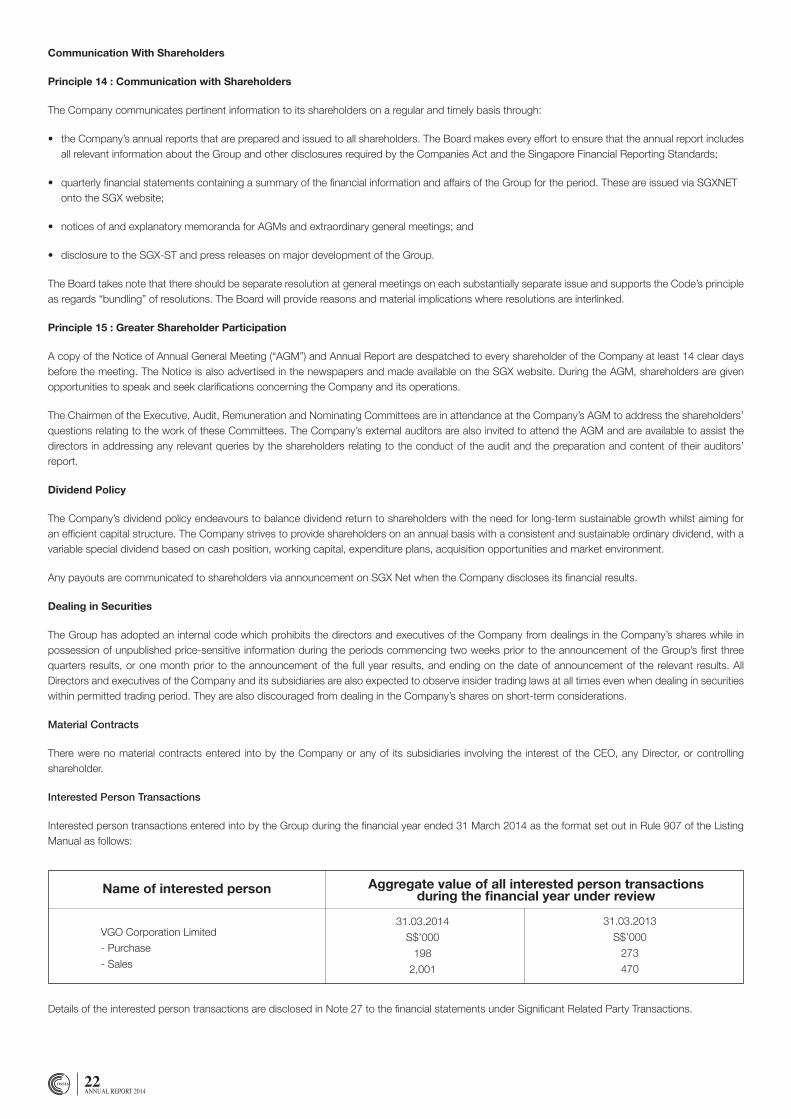
Interested Person Transactions
Interested person transactions entered into by the Group during the financial year ended 31 March 2014 as the format set out in Rule 907 of the Listing Manual as follows:
Name of interested person Aggregate value of all interested person transactions during the financial year under review
VGO Corporation Limited
- Purchase
- Sales
31.03.2013
S$’000
273
470
31.03.2014
S$’000
198
2,001
Details of the interested person transactions are disclosed in Note 27 to the financial statements under Significant Related Party Transactions.

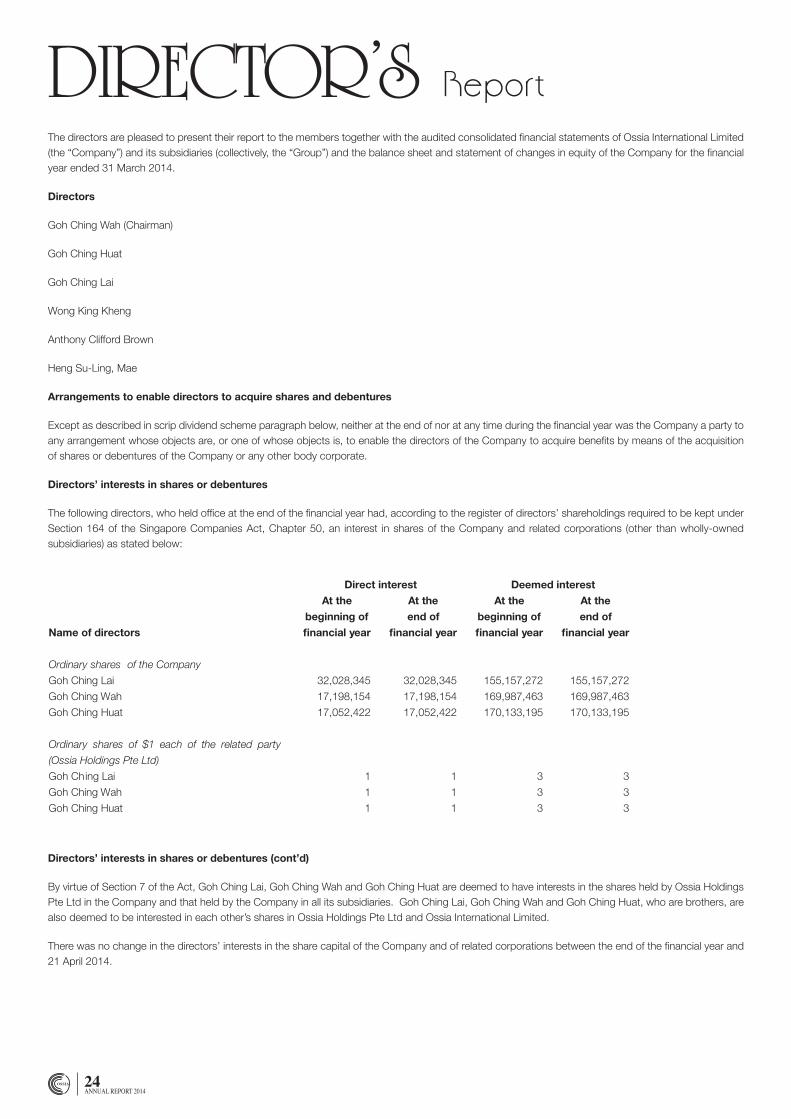
24ANNUAL REPORT 2014
ReportDIReCTOR’SThe directors are pleased to present their report to the members together with the audited consolidated financial statements of Ossia International Limited (the “Company”) and its subsidiaries (collectively, the “Group”) and the balance sheet and statement of changes in equity of the Company for the financial year ended 31 March 2014.
Directors
Goh Ching Wah (Chairman)
Goh Ching Huat
Goh Ching Lai
Wong King Kheng
Anthony Clifford Brown
Heng Su-Ling, Mae
Arrangements to enable directors to acquire shares and debentures
Except as described in scrip dividend scheme paragraph below, neither at the end of nor at any time during the financial year was the Company a party to any arrangement whose objects are, or one of whose objects is, to enable the directors of the Company to acquire benefits by means of the acquisition of shares or debentures of the Company or any other body corporate.
Directors’ interests in shares or debentures
The following directors, who held office at the end of the financial year had, according to the register of directors’ shareholdings required to be kept under Section 164 of the Singapore Companies Act, Chapter 50, an interest in shares of the Company and related corporations (other than wholly-owned subsidiaries) as stated below:
Directors’ interests in shares or debentures (cont’d)
By virtue of Section 7 of the Act, Goh Ching Lai, Goh Ching Wah and Goh Ching Huat are deemed to have interests in the shares held by Ossia Holdings Pte Ltd in the Company and that held by the Company in all its subsidiaries. Goh Ching Lai, Goh Ching Wah and Goh Ching Huat, who are brothers, are also deemed to be interested in each other’s shares in Ossia Holdings Pte Ltd and Ossia International Limited.
There was no change in the directors’ interests in the share capital of the Company and of related corporations between the end of the financial year and 21 April 2014.
Ossia International Limited and its Subsidiaries
Directors’ Report
- 1 -
The directors are pleased to present their report to the members together with the audited consolidated financial statements of Ossia InternationalLimited (the “Company”) and its subsidiaries ( collectively, the “Group”) and the balance sheet and statement of changes in equity of the Companyfor the financi al year ended 31 March 2014.
Directors
The directors of the Company in office at the date of this report are:
Goh Ching WahGoh Ching HuatGoh Ching LaiWong King KhengAnthony Clifford BrownHeng Su-Ling, Mae
Arrangements to enable directors to acquire shares and debentures
Except as described in scrip dividend scheme paragraph below, n either at the end of nor at any time during the financial year was the Company aparty to any arrangement whose objects are, or one of whose objects is, to enable the directors of the Company to acquire benefits by means o f theacquisition of shares or debentures of the Company or any other body corporate.
Directors’ interests in shares or debentures
The following directors, who held office a t the end of the financ ial year had, according to the register of directors’ shareholdings required to be keptunder Section 164 of the Singapore Companies Act , Chapter 50, an interest in shares of the Company and related corporations (other than wholly -owned subsidiaries) as st ated below:
Direct interest Deemed interest
Name of directors
At the
beginning of
financial year
At the
end of
financial year
At the
beginning of
financial year
At the
end of
financial year
Ordinary shares of the Company
Goh Ching Lai 32,028,345 32,028,345 155,157,272 155,157,272
Goh Ching Wah 17,198,154 17,198,154 169,987,463 169,987,463
Goh Ching Huat 17,052,422 17,052,422 170,133,195 170,133,195
Ordinary shares of $1 each of the related party
(Ossia Holdings Pte Ltd)
Goh Ching Lai 1 1 3 3
Goh Ching Wah 1 1 3 3
Goh Ching Huat 1 1 3 3
25ANNUAL REPORT 2014
Directors’ contractual benefits
Except as disclosed in the financial statements, since the end of the previous financial year, no director of the Company has received or become entitled to receive a benefit by reason of a contract made by the Company or a related corporation with the director, or with a firm of which the director is a member, or with a company in which the director has a substantial financial interest, except as disclosed in the financial statements.
Scrip dividend scheme
At an Extraordinary General Meeting of the Company held on 29 April 2004, the shareholders approved the Scrip Dividend Scheme (the “Scheme”). Under the Scheme, the directors are entitled to receive shares in lieu of cash in respect of the dividend declared. No shares were issued under the Scheme during the financial year.
Share options
There were no options granted during the financial year to subscribe for unissued shares in the Company or in any subsidiary.
No shares have been issued during the financial year by virtue of the exercise of options to take up unissued shares of the Company or any subsidiary.
There were no unissued shares under share options in the Company or in any subsidiary at the end of the financial year.
Audit Committee
The nature and extent of the functions performed by the Audit Committee pursuant to Section 201B(5) of the Act are described in the Report on Corporate Governance.

26ANNUAL REPORT 2014
Auditor
Ernst & Young LLP have expressed their willingness to accept reappointment as auditor.
On behalf of the board of directors:
Goh Ching Wah
Director
Goh Ching Huat
Director
Singapore
27 June 2014
27ANNUAL REPORT 2014
Statement by DIReCTORSWe, Goh Ching Wah and Goh Ching Huat, being two of the directors of Ossia International Limited, do hereby state that, in the opinion of the directors,
a. the accompanying balance sheets, consolidated statement of comprehensive income, statements of changes in equity, and consolidated cash flow statement together with notes thereto are drawn up so as to give a true and fair view of the state of affairs of the Group and of the Company as at 31 March 2014 and the results of the business, changes in equity and cash flows of the Group and the changes in equity of the Company for the year ended on that date; and
b. at the date of this statement, there are reasonable grounds to believe that the Company will be able to pay its debts as and when they fall due.
On behalf of the board of directors:
Goh Ching Wah
Director
Goh Ching Huat
Director
Singapore
27 June 2014
28ANNUAL REPORT 2014
ReportINDePeNDeNT aUDITOR’SFor the financial year ended 31 March 2014
Independent Auditor’s Report to the members of Ossia International Limited
Report on the financial statements
We have audited the accompanying financial statements of Ossia International Limited (the “Company”) and its subsidiaries (collectively, the “Group”) set out on pages 31 to 79, which comprise the balance sheets of the Group and the Company as at 31 March 2014, the statements of changes in equity of the Group and the Company, and the statement of comprehensive income and cash flow statement of the Group for the year then ended, and a summary of significant accounting policies and other explanatory information.
Management’s responsibility for the financial statements
Management is responsible for the preparation of financial statements that give a true and fair view in accordance with the provisions of the Singapore Companies Act, Chapter 50 (the “Act”) and Singapore Financial Reporting Standards, and for devising and maintaining a system of internal accounting controls sufficient to provide a reasonable assurance that assets are safeguarded against loss from unauthorised use or disposition; and transactions are properly authorised and that they are recorded as necessary to permit the preparation of true and fair profit and loss accounts and balance sheets and to maintain accountability of assets.
Auditor’s responsibility
Our responsibility is to express an opinion on these financial statements based on our audit. We conducted our audit in accordance with Singapore Standards on Auditing. Those standards require that we comply with ethical requirements and plan and perform the audit to obtain reasonable assurance about whether the financial statements are free from material misstatement.
An audit involves performing procedures to obtain audit evidence about the amounts and disclosures in the financial statements. The procedures selected depend on the auditor’s judgement, including the assessment of the risks of material misstatement of the financial statements, whether due to fraud or error. In making those risk assessments, the auditor considers internal control relevant to the entity’s preparation and fair presentation of the financial statements in order to design audit procedures that are appropriate in the circumstances, but not for the purpose of expressing an opinion on the effectiveness of the entity’s internal control. An audit also includes evaluating the appropriateness of accounting policies used and the reasonableness of accounting estimates made by management, as well as evaluating the overall presentation of the financial statements.
We believe that the audit evidence we have obtained is sufficient and appropriate to provide a basis for our audit opinion.
29ANNUAL REPORT 2014
For the financial year ended 31 March 2014
Independent Auditor’s Report to the members of Ossia International Limited
Opinion
In our opinion, the consolidated financial statements of the Group, and the balance sheet and statement of changes in equity of the Company are properly drawn up in accordance with the provisions of the Act and Singapore Financial Reporting Standards so as to give a true and fair view of the state of affairs of the Group and of the Company as at 31 March 2014 and of the results, changes in equity and cash flows of the Group and the changes in equity of the Company for the year ended on that date.
Report on other legal and regulatory requirements
In our opinion, the accounting and other records required by the Act to be kept by the Company and by those subsidiaries incorporated in Singapore of which we are the auditors have been properly kept in accordance with the provisions of the Act.
Ernst & Young LLP
Public Accountants and
Chartered Accountants
Singapore
27 June 2014

31ANNUAL REPORT 2014
Consolidated Statement of
COMPReHeNSIVe INCOMe
The accompanying accounting policies and explanatory notes form an integral part of the financial statements.
Ossia International Limited and its Subsidiaries
- 7 -
Consolidated Statement of Comprehensive Income for the financial year ended 31 March 2014
Note
1.4.2013to
31.3.2014
1.1.2012to
31.3.2013
$’000(Restated)
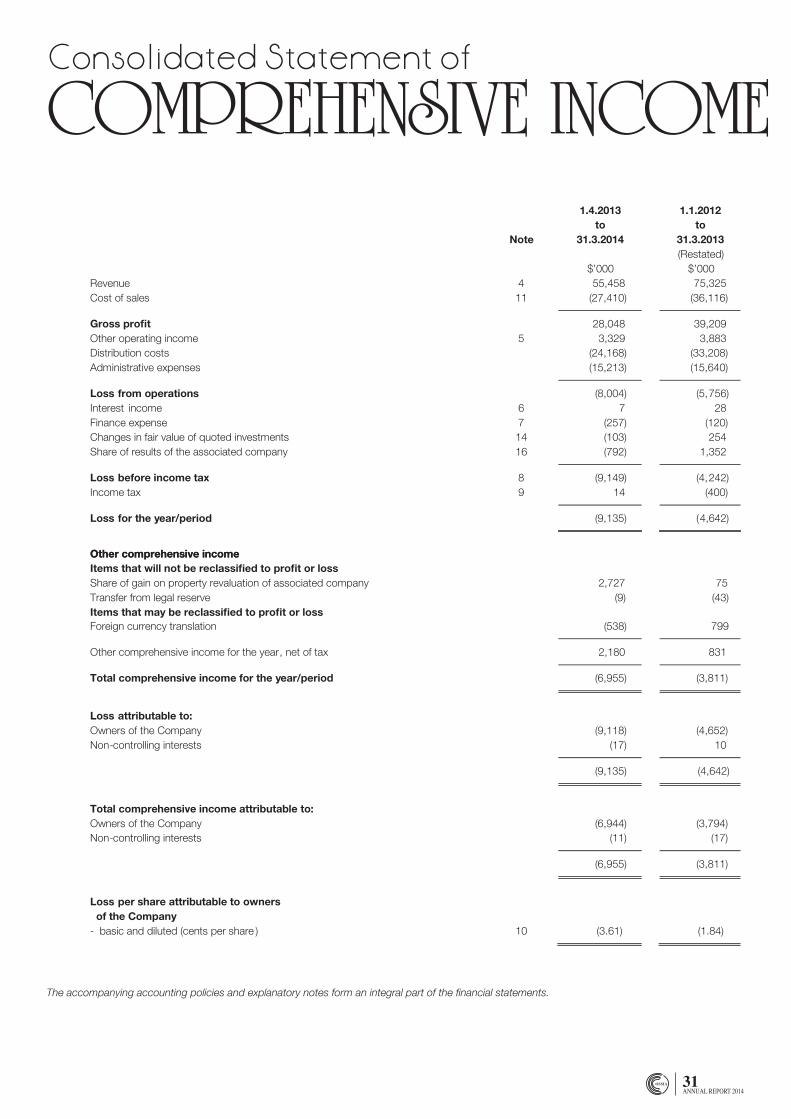
Revenue 4 55,458 75,325Cost of sales 11 (27,410) (36,116)
Gross profit 28,048 39,209Other operating income 5 3,329 3,883Distribution costs (24,168) (33,208)Administrative expenses (15,213) (15,640)
Loss from operations (8,004) (5,756)Interest income 6 7 28Finance expense 7 (257) (120)Changes in fair value of quoted investments 14 (103) 254Share of results of the associated company 16 (792) 1,352
Loss before income tax 8 (9,149) (4,242)Income tax 9 14 (400)
Loss for the year/period (9,135) (4,642)
Other comprehensive incomeOther comprehensive incomeItems that will not be reclassified to profit or loss
Items that may be reclassified to profit or loss
Share of gain on property revaluation of associated company 2,727 75Transfer from legal reserve (9) (43)
Foreign currency translation (538) 799
Other comprehensive income for the year, net of tax 2,180 831
Total comprehensive income for the year/period (6,955) (3,811)
Loss attributable to:Owners of the Company (9,118) (4,652)Non controlling interests (17) 10
(9,135) (4,642)
Total comprehensive income attributable to:Owners of the Company (6,944) (3,794)Non-controlling interests (11) (17)
(6,955) (3,811)
Loss per share attributable to ownersof the Company
- basic and diluted (cents per share ) 10 (3.61) (1.84)
The accompanying accounting policies and explanatory notes form an integral part of the financial statements.
-
$’000
Ossia International Limited and its Subsidiaries
- 7 -
Consolidated Statement of Comprehensive Income for the financial year ended 31 March 2014
Note
1.4.2013to
31.3.2014
1.1.2012to
31.3.2013
$’000(Restated)
Revenue 4 55,458 75,325Cost of sales 11 (27,410) (36,116)
Gross profit 28,048 39,209Other operating income 5 3,329 3,883Distribution costs (24,168) (33,208)Administrative expenses (15,213) (15,640)
Loss from operations (8,004) (5,756)Interest income 6 7 28Finance expense 7 (257) (120)Changes in fair value of quoted investments 14 (103) 254Share of results of the associated company 16 (792) 1,352
Loss before income tax 8 (9,149) (4,242)Income tax 9 14 (400)
Loss for the year/period (9,135) (4,642)
Other comprehensive incomeOther comprehensive incomeItems that will not be reclassified to profit or loss
Items that may be reclassified to profit or loss
Share of gain on property revaluation of associated company 2,727 75Transfer from legal reserve (9) (43)
Foreign currency translation (538) 799
Other comprehensive income for the year, net of tax 2,180 831
Total comprehensive income for the year/period (6,955) (3,811)
Loss attributable to:Owners of the Company (9,118) (4,652)Non controlling interests (17) 10
(9,135) (4,642)
Total comprehensive income attributable to:Owners of the Company (6,944) (3,794)Non-controlling interests (11) (17)
(6,955) (3,811)
Loss per share attributable to ownersof the Company
- basic and diluted (cents per share ) 10 (3.61) (1.84)
The accompanying accounting policies and explanatory notes form an integral part of the financial statements.
-
$’000
32ANNUAL REPORT 2014
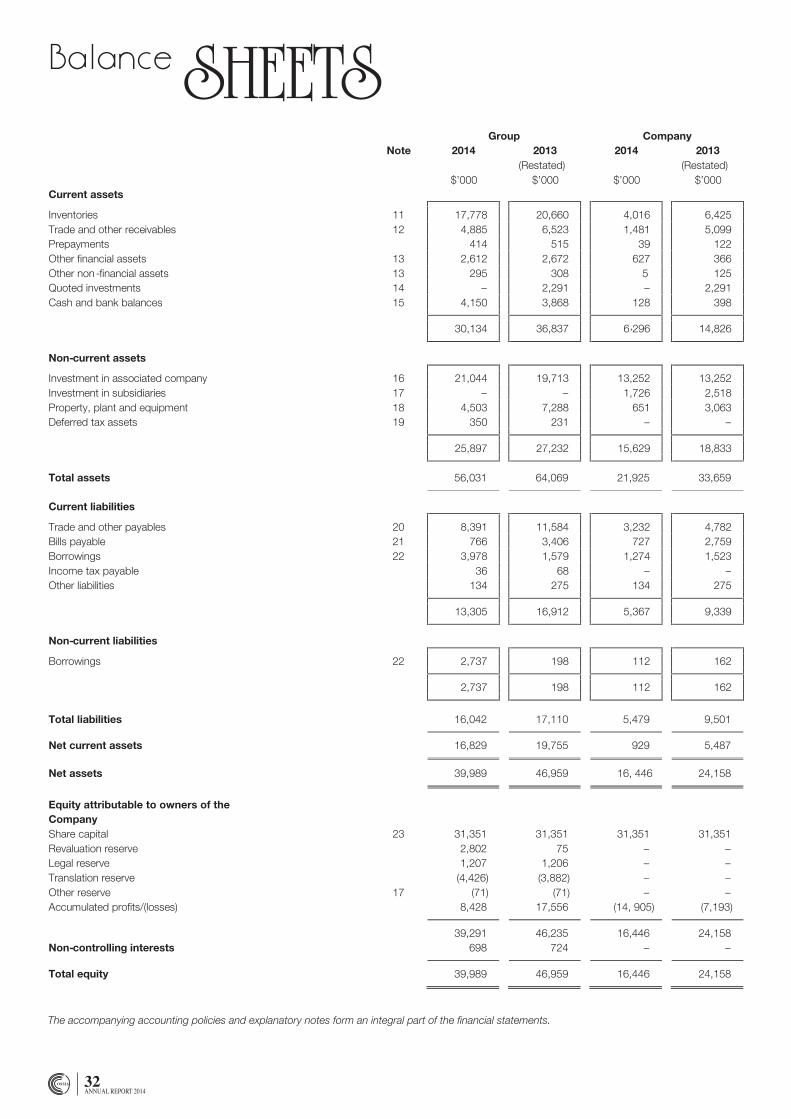
Balance SHeeTS
The accompanying accounting policies and explanatory notes form an integral part of the financial statements.
Ossia International Limited and its Subsidiaries
- 8 -
Balance Sheets as at 31 March 2014
Group CompanyNote 2014 2013 2014 2013
$’000$’000
$’000$’000
(Restated) (Restated)
Current assets
Inventories 11 17,778 20,660 4,016 6,425Trade and other receivables 12 4,885 6,523 1,481 5,099Prepayments 414 515 39 122Other financial assets 13 2,612 2,672 627 366Other non-financial assets 13 295 308 5 125Quoted investments 14 – 2,291 – 2,291Cash and bank balances 15 4,150 3,868 128 398
30,134 36,837 6,296 14,826
Non-current assets
Investment in associated company 16 21,044 19,713 13,252 13,252Investment in subsidiaries 17 – – 1,726 2,518Property, plant and equipment 18 4,503 7,288 651 3,063Deferred tax assets 19 350 231 – –
25,897 27,232 15,629 18,833
Total assets 56,031 64,069 21,925 33,659
Current liabilities
Trade and other payables 20 8,391 11,584 3,232 4,782Bills payable 21 766 3,406 727 2,759Borrowings 22 3,978 1,579 1,274 1,523Income tax payable 36 68 – –Other liabilities 134 275 134 275
13,305 16,912 5,367 9,339
Non-current liabilities
Borrowings 22 2,737 198 112 162
2,737 198 112 162
Total liabilities 16,042 17,110 5,479 9,501
Net current assets 16,829 19,755 929 5,487
Net assets 39,989 46,959 16, 446 24,158
CompanyShare capital 23 31,351 31,351 31,351 31,351Revaluation reserve 2,802 75 – –Legal reserve 1,207 1,206 – –Translation reserve (4,426) (3,882) – –Other reserve 17 (71) (71) – –Accumulated profits/(losses) 8,428 17,556 (14, 905) (7,193)
39,291 46,235 16,446 24,158Non-controlling interests 698 724 – –
Total equity 39,989 46,959 16,446 24,158
The accompanying accounting policies and explanatory notes form an integral part of the financial statements.
Equity attributable to owners of the
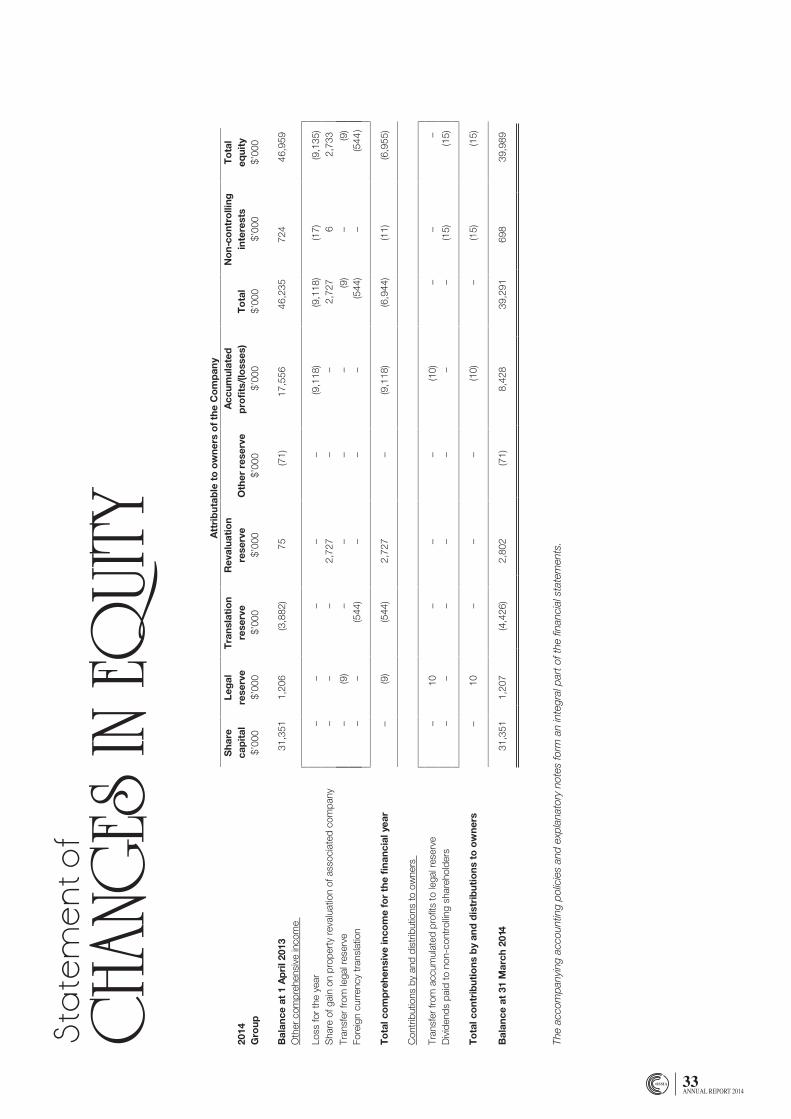
33ANNUAL REPORT 2014
Oss
ia In
tern
atio
nal L
imit
ed a
nd it
s S
ubsi
dia
ries
-9
-
Sta
tem
ents
of C
hang
es in
Eq
uity
fo
r th
efi
nanc
ialy
ear
end
ed31
Mar
ch 2
014
Att
rib
utab
le t
oo
wne
rso
f the
Co
mp
any
2014
Sha
reca
pit
alLe
gal
rese
rve
Tra
nsla
tio
nre
serv
eR
eval
uati
on
rese
rve
Oth
er r
eser
veA
ccum
ulat
edp
rofi
ts/(l
oss
es)
To
tal
No
n-co
ntro
lling
inte
rest
sT
ota
leq
uity
Gro
up$’
000
$’00
0$’
000
$’00
0$’
000
$’00
0$’
000
$’00
0$’
000
Bal
ance
at
1 A
pri
l 201
331
,351
1,20
6(3
,882
)75
(71)
17,5
5646
,235
724
46,9
59O
ther
com
preh
ensi
ve in
com
e
Loss
for t
he y
ear
––
––
–(9
,118
)(9
,118
)(1
7)(9
,135
)S
hare
of g
ain
on p
rope
rty
reva
luat
ion
of a
ssoc
iate
d co
mpa
ny–
––
2,72
7–
–2,
727
62,
733
Tran
sfer
from
lega
l res
erve
–(9
)–
––
–(9
)–
(9)
Fore
ign
curr
ency
tran
slat
ion
––
(544
)–
––
(544
)–
(544
)
To
tal c
om
pre
hens
ive
inco
me
for
the
fina
ncia
l yea
r–
(9)
(544
)2,
727
–(9
,118
)(6
,944
)(1
1)(6
,955
)
Con
trib
utio
ns b
y an
d di
strib
utio
ns to
ow
ners
Tran
sfer
from
acc
umul
ated
pro
fits
to le
gal r
eser
ve–
10–
––
(10)
––
–D
ivid
ends
pai
d to
non
-con
trol
ling
shar
ehol
ders
––
––
––
–(1
5)(1
5)
To
tal c
ont
rib
utio
ns b
y an
d d
istr
ibut
ions
to
ow
ners
–10
––
–(1
0)–
(15)
(15)
Bal
ance
at
31 M
arch
201
431
,351
1,20
7(4
,426
)2,
802
(71)
8,42
839
,291
698
39,9
89
The
acco
mpa
nyin
g ac
coun
ting
polic
ies
and
expl
anat
ory
note
s fo
rm a
n in
teg
ral p
art o
f the
fina
ncia
l sta
tem
ents
.
Sta
tem
ent
of
CHaN
GeS
IN e
QUI
TY
The
acco
mpa
nyin
g ac
coun
ting
polic
ies
and
expl
anat
ory
note
s fo
rm a
n in
tegr
al p
art o
f the
fina
ncia
l sta
tem
ents
.
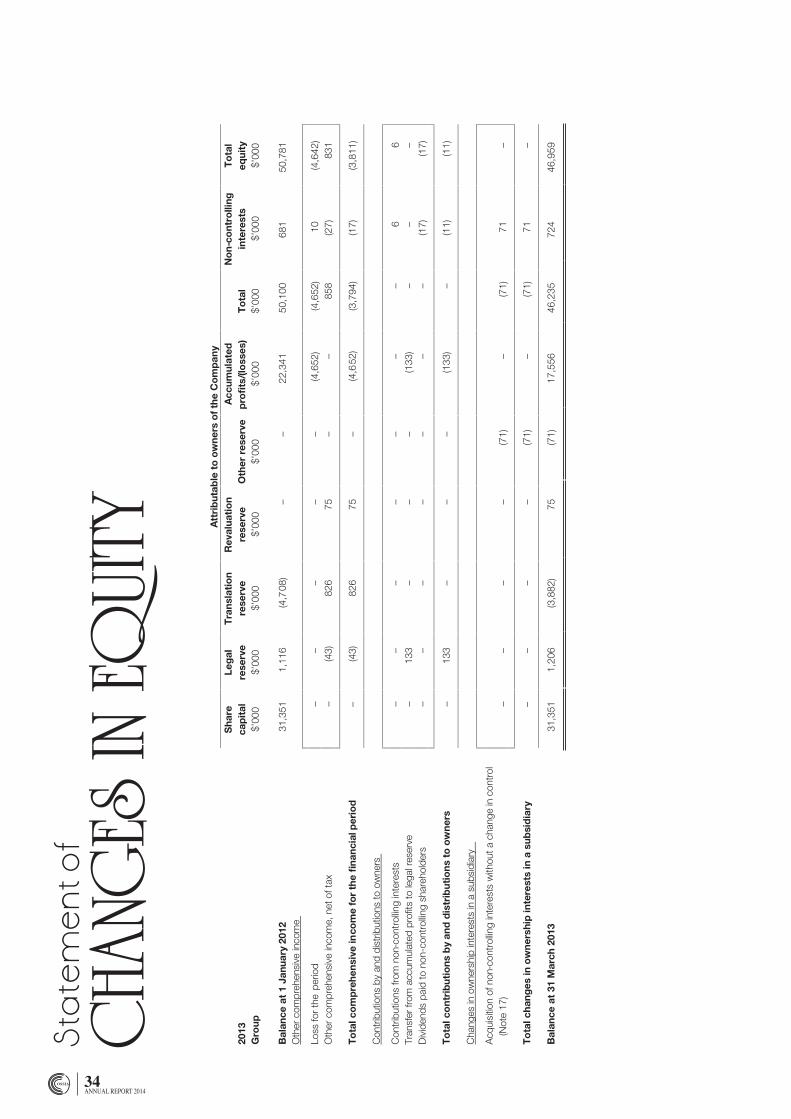
34ANNUAL REPORT 2014
Oss
ia In
tern
atio
nal L
imit
ed a
nd it
s S
ubsi
dia
ries
-10
-
Sta
tem
ents
of C
hang
es in
Eq
uity
fo
r th
efi
nanc
ialy
ear
end
ed31
Mar
ch 2
014
Att
rib
utab
le t
oo
wne
rso
f the
Co
mp
any
2013
Sha
reca
pit
alLe
gal
rese
rve
Tra
nsla
tio
nre
serv
eR
eval
uati
on
rese
rve
Oth
er r
eser
veA
ccum
ulat
edp
rofi
ts/(l
oss
es)
To
tal
No
n-co
ntro
lling
inte
rest
sT
ota
leq
uity
Gro
up$’
000
$’00
0$’
000
$’00
0$’
000
$’00
0$’
000
$’00
0$’
000
Bal
ance
at
1 Ja
nuar
y 20
1231
,351
1,11
6(4
,708
)–
–22
,341
50,1
0068
150
,781
Oth
er c
ompr
ehen
sive
inco
me
Loss
for t
hepe
riod
––
––
–(4
,652
)(4
,652
)10
(4,6
42)
Oth
er c
ompr
ehen
sive
inco
me,
net
of t
ax–
(43)
826
75–
–85
8(2
7)83
1
To
tal c
om
pre
hens
ive
inco
me
for
the
fina
ncia
lper
iod
–(4
3)82
675
–(4
,652
)(3
,794
)(1
7)(3
,811
)
Con
trib
utio
ns b
y an
d di
strib
utio
ns to
ow
ners
Con
trib
utio
ns fr
om n
on-c
ontr
ollin
g in
tere
sts
––
––
––
–6
6Tr
ansf
er fr
om a
ccum
ulat
ed p
rofit
s to
lega
l res
erve
–13
3–
––
(133
)–
––
Div
iden
ds p
aid
to n
on-c
ontr
ollin
g sh
areh
olde
rs–
––
––
––
(17)
(17)
To
tal c
ont
rib
utio
ns b
y an
d d
istr
ibut
ions
to
ow
ners
-s13
3–
––
(133
)–
(11)
(11)
Cha
nges
in o
wne
rshi
p in
tere
sts
in a
sub
sidi
ary
Acq
uisi
tion
of n
on-c
ontr
ollin
g in
tere
sts
with
out a
cha
nge
in c
ontr
ol(N
ote
17)
––
––
(71)
–(7
1)71
–
To
tal c
hang
es in
ow
ners
hip
inte
rest
s in
a s
ubsi
dia
ry–
––
–(7
1)–
(71)
71–
Bal
ance
at
31 M
arch
201
331
,351
1,20
6(3
,882
)75
(71)
17,5
5646
,235
724
46,9
59
–
Sta
tem
ent
of
CHaN
GeS
IN e
QUI
TY
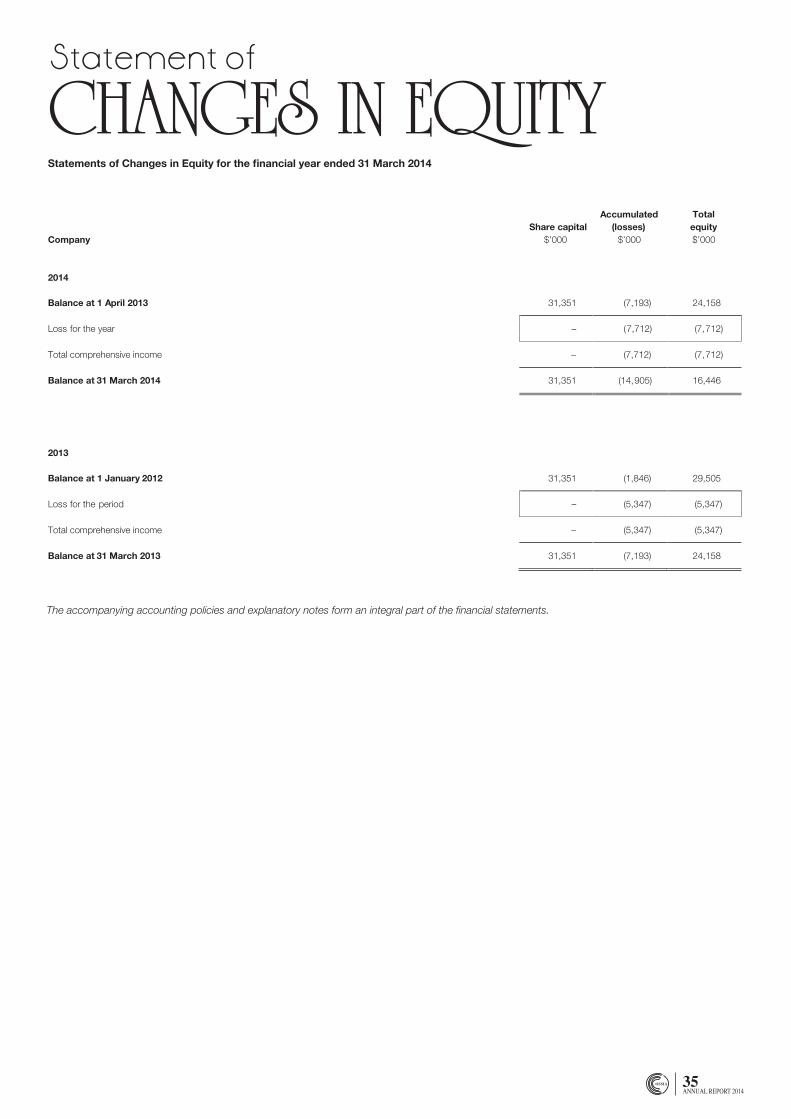
35ANNUAL REPORT 2014
Statements of Changes in Equity for the financial year ended 31 March 2014
The accompanying accounting policies and explanatory notes form an integral part of the financial statements.
Ossia International Limited and its Subsidiaries
- 11 -
Statements of Changes in Equity for the financial year ended 31 March 2014
Share capitalAccumulated
(losses)Totalequity
Company $’000 $’000 $’000
2014
Balance at 1 April 2013 31,351 (7,193) 24,158
Loss for the year – (7,712) (7,712)
Total comprehensive income – (7,712) (7,712)
Balance at 31 March 2014 31,351 (14,905) 16,446
2013
Balance at 1 January 2012 31,351 (1,846) 29,505
Loss for the period – (5,347) (5,347)
Total comprehensive income – (5,347) (5,347)
Balance at 31 March 2013 31,351 (7,193) 24,158
The accompanying accounting policies and explanatory notes form an integral part of the financial statements.
Statement of
CHaNGeS IN eQUITY

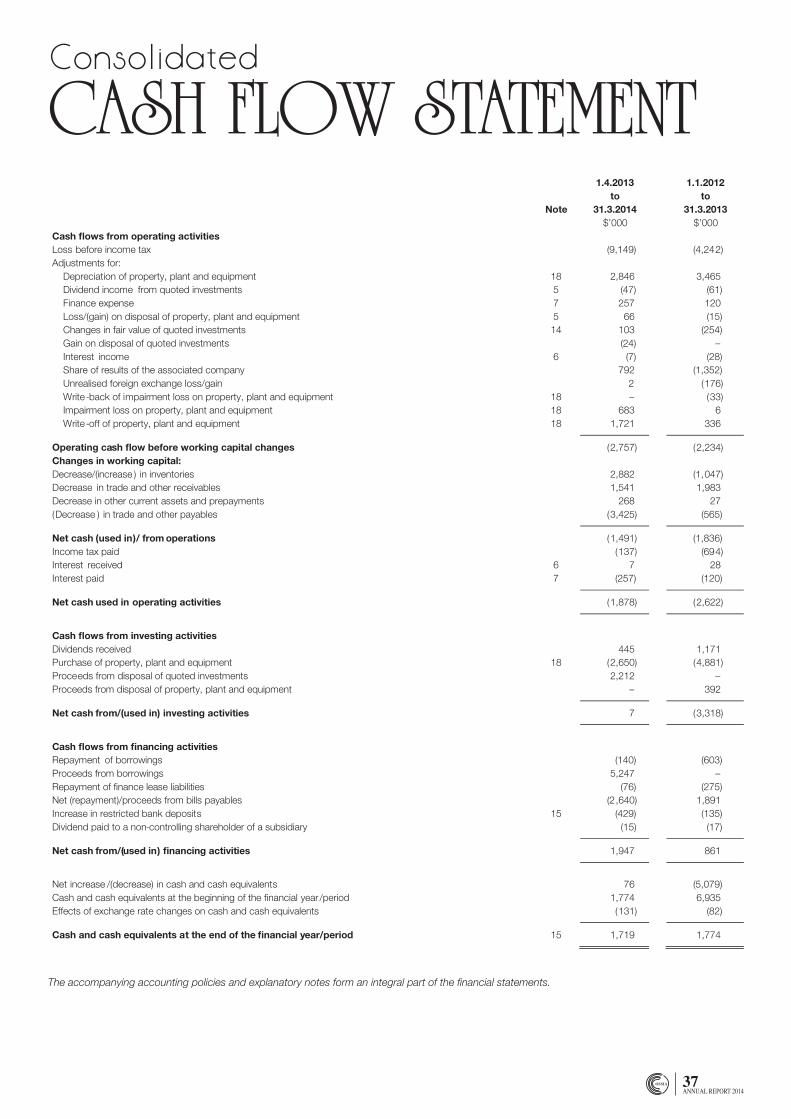
37ANNUAL REPORT 2014
Consolidated
C aSH flOW STaTeMeNT
The accompanying accounting policies and explanatory notes form an integral part of the financial statements.
Ossia International Limited and its Subsidiaries
- 12 -
Consolidated Cash Flow Statement for the financial year ended 31 March 2014
Note
1.4.2013to
31.3.2014
1.1.2012to
31.3.2013$’000 $’000
Cash flows from operating activitiesLoss before income tax (9,149) (4,242)Adjustments for:
Depreciation of property, plant and equipment 18 2,846 3,465Dividend income from quoted investments 5 (47) (61)Finance expense 7 257 120Loss/(gain) on disposal of property, plant and equipment 5 66 (15)Changes in fair value of quoted investments 14 103 (254)Gain on disposal of quoted investments (24) –Interest income 6 (7) (28)Share of results of the associated company 792 (1,352)Unrealised foreign exchange loss/gain 2 (176)Write-back of impairment loss on property, plant and equipment 18 – (33)Impairment loss on property, plant and equipment 18 683 6Write-off of property, plant and equipment 18 1,721 336
Operating cash flow before working capital changes (2,757) (2,234)Changes in working capital:Decrease/(increase ) in inventories 2,882 (1,047)Decrease in trade and other receivables 1,541 1,983Decrease in other current assets and prepayments 268 27(Decrease ) in trade and other payables (3,425) (565)
Net cash (used in)/ from operations (1,491) (1,836)Income tax paid (137) (694)Interest received 6 7 28Interest paid 7 (257) (120)
Net cash used in operating activities (1,878) (2,622)
Cash flows from investing activitiesDividends received 445 1,171Purchase of property, plant and equipment 18 (2,650) (4,881)Proceeds from disposal of quoted investments 2,212 –Proceeds from disposal of property, plant and equipment – 392
Net cash from/(used in) investing activities 7 (3,318)
Cash flows from financing activitiesRepayment of borrowings (140) (603)Proceeds from borrowings 5,247 –Repayment of finance lease liabilities (76) (275)Net (repayment)/proceeds from bills payables (2,640) 1,891Increase in restricted bank deposits 15 (429) (135)Dividend paid to a non-controlling shareholder of a subsidiary (15) (17)
Net cash from/(used in) financing activities 1,947 861
Net increase /(decrease) in cash and cash equivalents 76 (5,079)Cash and cash equivalents at the beginning of the financial year /period 1,774 6,935Effects of exchange rate changes on cash and cash equivalents (131) (82)
Cash and cash equivalents at the end of the financial year/period 15 1,719 1,774
The accompanying accounting policies and explanatory notes form an integral part of the financial statements.
38ANNUAL REPORT 2014
Notes to the Financial
STaTeMeNTS1. Corporate information
Ossia International Limited (the “Company”) is a limited liability company incorporated and domiciled in Singapore and is listed on the Singapore Exchange Securities Trading Limited (“SGX-ST”). In prior year, the Company changed its financial year end from 31 December to 31 March.
The registered office of the Company is located at 10 Changi South Lane #07-01 Ossia Building, Singapore 486162.
The principal activities of the Company are the marketing and distribution of sporting goods, golf equipment, footwear accessories and apparel, and investment holding. The principal activities of the subsidiaries are disclosed in Note 17 to the financial statements.
During the last financial period, the Company changed its financial year end from 31 December to 31 March. Accordingly, these financial statements cover the fifteen month period from 1 January 2012 to 31 March 2013.
The financial statements for the financial period ended 31 March 2014 covers the twelve month period from 1 April 2013 to 31 March 2014. The comparative figures for the prior period cover the fifteen period from 1 January 2012 to 31 March 2013. Thus, any comparison between the financial periods ended 31 March 2014 and 31 March 2013 is not meaningful.
2. Summary of significant accounting policies
2.1 Basis of preparation
The consolidated financial statements of the Group, and the balance sheet and statement of changes in equity of the Company have been prepared in accordance with Singapore Financial Reporting Standards (“FRS”).
The financial statements have been prepared on the historical cost basis except as disclosed in the accounting policies below.
The financial statements are presented in Singapore Dollars (“SGD” or “$”) and all values in the tables are rounded to the nearest thousand ($’000) as indicated.
2.2 Changes in accounting policies
The accounting policies adopted are consistent with those of the previous financial year except in the current financial year, the Group has adopted all the new and revised standards which are effective for annual periods beginning on or after 1 January 2013. The adoption of these standards did not have any effect on the financial performance or position of the Group and the Company.
2.3 Standard issued but not yet effective
The Group has not adopted the following standards that have been issued but not yet effective:
Description
Revised FRS 27 Separate Financial Statements
Revised FRS 28 Investments in Associates and Joint Ventures
FRS 110 Consolidated Financial Statements
FRS 111 Joint Arrangements
FRS 112 Disclosure of Interests in Other Entities
Amendments to FRS 32 Offsetting Financial Assets and Financial Liabilities
Effective for annual periods beginning on or after
1 January 2014
1 January 2014
1 January 2014
1 January 2014
1 January 2014
1 January 2014
39ANNUAL REPORT 2014
2. Summary of significant accounting policies (cont’d)
2.3 Standards issued but not yet effective (cont’d)
Except for FRS 111 and FRS 112, the directors expect that the adoption of the other standards above will have no material impact on the financial statements in the period of initial application. The nature of the impending changes in accounting policy on adoption of the FRS 111 and FRS 112 are described below.
FRS 111 Joint Arrangements and Revised FRS 28 Investments in Associates and Joint Ventures
FRS 111 Joint Arrangements and Revised FRS 28 Investments in Associates and Joint Ventures are effective for financial periods beginning on or after 1 January 2014.
FRS 111 classifies joint arrangements either as joint operations or joint ventures. Joint operation is a joint arrangement whereby the parties that have rights to the assets and obligations for the liabilities whereas joint venture is a joint arrangement whereby the parties that have joint control of the arrangement have rights to the net assets of the arrangement.
FRS 111 requires the determination of joint arrangement’s classification to be based on the parties’ rights and obligations under the arrangement, with the existence of a separate legal vehicle no longer being the key factor. FRS 111 disallows proportionate consolidation and requires joint ventures to be accounted for using the equity method. The revised FRS 28 was amended to describe the application of equity method to investments in joint ventures in addition to associates.
FRS 112 Disclosure of Interests in Other Entities
FRS 112 Disclosure of Interests in Other Entities is effective for financial periods beginning on or after 1 January 2014.
FRS 112 is a new and comprehensive standard on disclosure requirements for all forms of interests in other entities, including joint arrangements, associates, special purpose vehicles and other off balance sheet vehicles. FRS 112 requires an entity to disclose information that helps users of its financial statements to evaluate the nature and risks associated with its interests in other entities and the effects of those interests on its financial statements. As this is a disclosure standard, it will have no significant impact to the financial position and financial performance of the Group when implemented in 2014.
2.4 Basis of consolidation
Basis of consolidation from 1 January 2010
The consolidated financial statements comprise the financial statements of the Company and its subsidiaries as at the end of the reporting period. The financial statements of the subsidiaries used in the preparation of the consolidated financial statements are prepared for the same reporting date as the Company. Consistent accounting policies are applied to like transactions and events in similar circumstances.
All intra-group balances, income and expenses and unrealised gains and losses resulting from intra-group transactions and dividends are eliminated in full.
Subsidiaries are consolidated from the date of acquisition, being the date on which the Group obtains control, and continue to be consolidated until the date that such control ceases.
Losses within a subsidiary are attributed to the non-controlling interest even if that results in a deficit balance.
A change in the ownership interest of a subsidiary, without a loss of control, is accounted for as an equity transaction. If the Group loses control over a subsidiary, it:
– De-recognises the assets (including goodwill) and liabilities of the subsidiary at their carrying amounts at the date when controls is lost;
– De-recognises the carrying amount of any non-controlling interest;
– De-recognises the cumulative translation differences recorded in equity;
– Recognises the fair value of the consideration received;
– Recognises the fair value of any investment retained;
– Recognises any surplus or deficit in profit or loss;
– Re-classifies the Group’s share of components previously recognised in other comprehensive income to profit or loss or retained earnings, as appropriate.
40ANNUAL REPORT 2014
2. Summary of significant accounting policies (cont’d)
2.4 Basis of consolidation (cont’d)
Basis of consolidation prior to 1 January 2010
Certain of the above-mentioned requirements were applied on a prospective basis. The following differences, however, are carried forward in certain instances from the previous basis of consolidation:
– Acquisition of non-controlling interests, prior to 1 January 2010, were accounted for using the parent entity extension method, whereby, the difference between the consideration and the book value of the share of the net assets acquired were recognised in goodwill.
– Losses incurred by the Group were attributed to the non-controlling interest until the balance was reduced to nil. Any further losses were attributed to the Group, unless the non-controlling interest had a binding obligation to cover these. Losses prior to 1 January 2010 were not reallocated between non-controlling interest and the owners of the Company.
– Upon loss of control, the Group accounted for the investment retained at its proportionate share of net asset value at the date control was lost. The carrying value of such investments as at 1 January 2010 have not been restated.
2.5 Transactions with non-controlling interests
Non-controlling interests represent the equity in subsidiaries not attributable, directly or indirectly, to owners of the Company, and are presented separately in the consolidated statement of comprehensive income and within equity in the consolidated balance sheet, separately from equity attributable to owners of the Company.
Changes in the Company owner’s ownership interest in a subsidiary that do not result in a loss of control are accounted for as equity transactions. In such circumstances, the carrying amounts of the controlling and non-controlling interests are adjusted to reflect the changes in their relative interests in the subsidiary. Any difference between the amount by which the non-controlling interests is adjusted and the fair value of the consideration paid or received is recognised directly in equity and attributed to owners of the Company.
2.6 Foreign currency
The financial statements are presented in Singapore Dollars, which is also the Company’s functional currency. Each entity in the Group determines its own functional currency and items included in the financial statements of each entity are measured using that functional currency.
(a) Transactions and balances
Transactions in foreign currencies are measured in the respective functional currencies of the Company and its subsidiaries and are recorded on initial recognition in the functional currencies at exchange rates approximating those ruling at the transaction dates. Monetary assets and liabilities denominated in foreign currencies are translated at the rate of exchange ruling at the end of the reporting period. Non-monetary items that are measured in terms of historical cost in a foreign currency are translated using the exchange rates as at the dates of the initial transactions. Non-monetary items measured at fair value in a foreign currency are translated using the exchange rates at the date when the fair value was measured.
Exchange differences arising on the settlement of monetary items or on translating monetary items at the end of the reporting period are recognised in profit or loss except for exchange differences arising on monetary items that form part of the Group’s net investment in foreign operations, which are recognised initially in other comprehensive income and accumulated under foreign currency translation reserve in equity. The foreign currency translation reserve is reclassified from equity to profit or loss of the Group on disposal of the foreign operation.
(b) Consolidated financial statements
For consolidation purpose, the assets and liabilities of foreign operations are translated into SGD at the rate of exchange ruling at the end of the reporting period and their profit or loss are translated at the exchange rates prevailing at the date of the transactions. The exchange differences arising on the translation are recognised in other comprehensive income and accumulated under foreign currency translation reserve in equity. On disposal of a foreign operation, the component of other comprehensive income relating to that particular foreign operation is recognised in profit or loss.
In the case of a partial disposal without loss of control of a subsidiary that includes a foreign operation, the proportionate share of the cumulative amount of the exchange differences are re-attributed to non-controlling interest and are not recognised in profit or loss. For partial disposals of associates or jointly controlled entities that are foreign operations, the proportionate share of the accumulated exchange differences is reclassified to profit or loss.
41ANNUAL REPORT 2014
2. Summary of significant accounting policies (cont’d)
2.7 Property, plant and equipment
All items of property, plant and equipment are initially recorded at cost. Subsequent to recognition property, plant and equipment are measured at cost less accumulated depreciation and any accumulated impairment losses. The cost includes the cost of replacing part of the property, plant and equipment and borrowing costs that are directly attributable to the acquisition, construction or production of a qualifying property, plant and equipment. The accounting policy for borrowing costs is set out in Note 2.21. The cost of an item of property, plant and equipment is recognised as an asset if, and only if, it is probable that future economic benefits associated with the item will flow to the Group and the cost of the item can be measured reliably.
Depreciation is computed on a straight-line basis over the estimated useful lives of the assets as follows:
The carrying values of property, plant and equipment are reviewed for impairment when events or changes in circumstances indicate that the carrying value may not be recoverable.
The residual value, useful life and depreciation method are reviewed at each financial year-end, and adjusted prospectively, if appropriate.
An item of property, plant and equipment is derecognised upon disposal or when no future economic benefits are expected from its use or disposal. Any gain or loss arising on derecognition of the asset is included in profit or loss in the year the asset is derecognised.
2.8 Impairment of non-financial assets
The Group assesses at each reporting date whether there is an indication that an asset may be impaired. If any indication exists, or when an annual impairment testing for an asset is required, the Group makes an estimate of the asset’s recoverable amount.
An asset’s recoverable amount is the higher of an asset’s or cash-generating unit’s fair value less costs of disposal and its value in use and is determined for an individual asset, unless the asset does not generate cash inflows that are largely independent of those from other assets or group of assets. Where the carrying amount of an asset or cash-generating unit exceeds its recoverable amount, the asset is considered impaired and is written down to its recoverable amount. In assessing value in use, the estimated future cash flows expected to be generated by the asset are discounted to their present value using a pre-tax discount rate that reflects current market assessments of the time value of money and the risks specific to the asset. In determining fair value less costs of disposal, recent market transactions are taken into account, if available. If no such transactions can be identified, an appropriate valuation model is used. These calculations are corroborated by valuation multiples, quoted share prices for publicly traded subsidiaries or other available fair value indicators.
The Group bases its impairment calculation on budgets and forecast calculations which are prepared separately for each of the Group’s cash-generating units to which the individual assets are allocated. These budgets and forecast calculations are generally covering a period of three to five years. For longer periods, a long-term growth rate is calculated and applied to project future cash flows after the third or fifth year.
Impairment losses of continuing operations are recognised in profit or loss, except for assets that are previously revalued where the revaluation was taken to other comprehensive income. In this case, the impairment is also recognised in other comprehensive income up to the amount of any previous revaluation.
For assets excluding goodwill, an assessment is made at each reporting date as to whether there is any indication that previously recognised impairment losses may no longer exist or may have decreased. If such indication exists, the Group estimates the asset’s or cash-generating unit’s recoverable amount. A previously recognised impairment loss is reversed only if there has been a change in the estimates used to determine the asset’s recoverable amount since the last impairment loss was recognised. If that is the case, the carrying amount of the asset is increased to its recoverable amount. That increase cannot exceed the carrying amount that would have been determined, net of depreciation, had no impairment loss been recognised previously. Such reversal is recognised in profit or loss unless the asset is measured at revalued amount, in which case the reversal is treated as a revaluation increase.
Leasehold land, building and improvements - Over the remaining lease period of 69 years
Computer equipment - 3-5 years
Motor vehicles - 3-5 years
Furniture, fixtures, fittings and renovations - 2-10 years
Plant, machinery and office equipment - 3-10 years
42ANNUAL REPORT 2014
2. Summary of significant accounting policies (cont’d)
2.9 Subsidiaries
A subsidiary is an entity over which the Group has the power to govern the financial and operating policies so as to obtain benefits from its activities.
In the Company’s separate financial statements, investments in subsidiaries are accounted for at cost less impairment losses.
2.10 Associates
An associate is an entity, not being a subsidiary or a joint venture, in which the Group has significant influence. An associate is equity accounted for from the date the Group obtains significant influence until the date the Group ceases to have significant influence over the associate.
The Group’s investment in associate are accounted for using the equity method. Under the equity method, the investment in associate is carried in the balance sheet at cost plus post-acquisition changes in the Group’s share of net assets of the associate. Goodwill relating to an associate is included in the carrying amount of the investment. Any excess of the Group’s share of the net fair value of the associate’s identifiable assets, liabilities and contingent liabilities over the cost of the investment is included as income in the determination of the Group’s share of results of the associate in the period in which the investment is acquired.
The profit or loss reflects the share of the results of operations of the associate. Where there has been a change recognised in other comprehensive income by the associate, the Group recognises its share of such changes in other comprehensive income. Unrealised gains and losses resulting from transactions between the Group and the associate are eliminated to the extent of the interest in the associate.
The Group’s share of the profit or loss of its associate is shown on the face of profit or loss after tax and non-controlling interests in the subsidiaries of associate.
When the Group’s share of losses in an associate equals or exceeds its interest in the associate, the Group does not recognise further losses, unless it has incurred obligations or made payments on behalf of the associate.
After application of the equity method, the Group determines whether it is necessary to recognise an additional impairment loss on the Group’s investment in its associate. The Group determines at the end of each reporting period whether there is any objective evidence that the investment in the associate is impaired. If this is the case, the Group calculates the amount of impairment as the difference between the recoverable amount of the associate and its carrying value and recognises the amount in profit or loss.
The financial statements of the associate are prepared as of the same reporting date as the Company. Where necessary, adjustments are made to bring the accounting policies in line with those of the Group.
Upon loss of significant influence over the associate, the Group measures and recognises any retained investment at its fair value. Any difference between the carrying amount of the associate upon loss of significant influence and the fair value of the aggregate of the retained investment and proceeds from disposal is recognised in profit or loss.
2.11 Financial instruments
(a) Financial assets
Initial recognition and measurement
Financial assets are recognised when, and only when, the Group becomes a party to the contractual provisions of the financial instrument. The Group determines the classification of its financial assets at initial recognition.
When financial assets are recognised initially, they are measured at fair value, plus, in the case of financial assets not at fair value through profit or loss, directly attributable transaction costs.
Subsequent measurement
The subsequent measurement of financial assets depends on their classification as follows:
(i) Financial assets at fair value through profit or loss
Financial assets at fair value through profit or loss are financial assets classified as held for trading. Financial assets held for trading are acquired principally for the purpose of selling in the near term. The Group’s quoted investments are classified at fair value through profit or loss.
Subsequent to initial recognition, financial assets at fair value through profit or loss are measured at fair value. Any gains or losses arising from changes in fair value of the financial assets are recognised in profit or loss. Net gains or net losses on financial assets at fair value through profit or loss include exchange differences, interest and dividend income.
43ANNUAL REPORT 2014
2. Summary of significant accounting policies (cont’d)
2.11 Financial instruments (cont’d)
(ii) Loans and receivables
Financial assets with fixed or determinable payments that are not quoted in an active market are classified as loans and receivables. Subsequent to initial recognition, loans and receivables are measured at amortised cost using the effective interest method, less impairment. Gains and losses are recognised in profit or loss when the loans and receivables are derecognised or impaired, and through the amortisation process.
The Group classifies the following financial assets as loans and receivables:
• cash and cash equivalents;
• trade and other receivables, including amounts due from subsidiaries, and related parties and companies; and
• deposits (current and non-current), sundry debtors and amount due from the non-controlling shareholder of a subsidiary.
De-recognition
A financial asset is derecognised where the contractual right to receive cash flows from the asset has expired. On derecognition of a financial asset in its entirety, the difference between the carrying amount and the sum of the consideration received and any cumulative gain or loss that had been recognised in other comprehensive income is recognised in profit or loss.
Regular way purchase or sale of a financial asset
All regular way purchases and sales of financial assets are recognised or derecognised on the trade date, i.e., the date that the Group commits to purchase or sell the asset. Regular way purchases or sales are purchases or sales of financial assets that require delivery of assets within the period generally established by regulation or convention in the marketplace concerned.
(b) Financial liabilities
Initial recognition and measurement
Financial liabilities are recognised when, and only when, the Group becomes a party to the contractual provisions of the financial instrument. The Group determines the classification of its financial liabilities at initial recognition.
Financial liabilities are recognised initially at fair value, plus, in the case of financial liabilities other than derivatives, directly attributable transaction costs.
Subsequent measurement
Subsequent to initial recognition, all financial liabilities are measured at amortised cost using the effective interest method, except for derivatives, which are measured at fair value. Gains and losses are recognised in profit or loss when the liabilities are derecognised,
and through the amortisation process.
De-recognition
A financial liability is derecognised when the obligation under the liability is extinguished. When an existing financial liability is replaced by another from the same lender on substantially different terms, or the terms of an existing liability are substantially modified, such an exchange or modification is treated as a derecognition of the original liability and the recognition of a new liability, and the difference
in the respective carrying amounts is recognised in the profit or loss.
(c) Offsetting of financial instruments
Financial assets and financial liabilities are offset and the net amount is presented in the balance sheets, when and only when, there is a currently enforceable legal right to set off the recognised amounts and there is an intention to settle on a net basis, or to realise the
assets and settle the liabilities simultaneously.
44ANNUAL REPORT 2014
2. Summary of significant accounting policies (cont’d)
2.12 Impairment of financial assets
The Group assesses at each reporting date whether there is any objective evidence that a financial asset is impaired.
Financial assets carried at amortised cost
For financial assets carried at amortised cost, the Group first assesses whether objective evidence of impairment exists individually for financial assets that are individually significant, or collectively for financial assets that are not individually significant. If the Group determines that no objective evidence of impairment exists for an individually assessed financial asset, whether significant or not, it includes the asset in a group of financial assets with similar credit risk characteristics and collectively assesses them for impairment. Assets that are individually assessed for impairment and for which an impairment loss is, or continues to be recognised are not included in a collective assessment of impairment.
If there is objective evidence that an impairment loss on financial assets carried at amortised cost has incurred, the amount of the loss is measured as the difference between the asset’s carrying amount and the present value of estimated future cash flows discounted at the financial asset’s original effective interest rate. The carrying amount of the asset is reduced through the use of an allowance account. The impairment loss is recognised in profit or loss.
When the asset becomes uncollectible, the carrying amount of impaired financial asset is reduced directly or if an amount was charged to the allowance account, the amounts charged to the allowance account are written off against the carrying value of the financial asset.
To determine whether there is objective evidence that an impairment loss on financial assets has incurred, the Group considers factors such as the probability of insolvency or significant financial difficulties of the debtor and default or significant delay in payments.
If in a subsequent period, the amount of the impairment loss decreases and the decrease can be related objectively to an event occurring after the impairment was recognised, the previously recognised impairment loss is reversed to the extent that the carrying amount of the asset does not exceed its amortised cost at the reversal date. The amount of reversal is recognised in profit or loss.
2.13 Cash and cash equivalents
Cash and cash equivalents comprise cash on hand and at bank, fixed deposits, and short term, highly liquid investments that are readily convertible to known amounts of cash and which are subject to an insignificant risk of changes in value. These also include bank overdrafts that form an integral part of the Group’s cash management.
Cash and short-term deposits carried in the balance sheets are classified and accounted for as loans and receivables under FRS 39. The accounting policy for this category of financial assets is stated in Note 2.11(a).
2.14 Inventories
Inventories are stated at the lower of cost and net realisable value. Cost is determined on a weighted average basis and includes all costs incurred in bringing the inventories to their present location and condition.
Where necessary, allowance is provided for defective, obsolete and slow-moving items to adjust the carrying value of inventories to the lower of cost and net realisable value.
Net realisable value is the estimated selling price in the ordinary course of business, less estimated costs of completion and the estimated costs necessary to make the sale.
2.15 Trade and other receivables
Trade and other receivables are classified and accounted for as loans and receivables under FRS 39. The accounting policy for this category of financial assets is stated in Note 2.11(a).
An allowance is made for uncollectible amounts when there is objective evidence that the Group will not be able to collect the debt. Bad debts are written off when identified. Further details on the accounting policy for impairment of financial assets are stated in Note 2.11(a).
45ANNUAL REPORT 2014
2. Summary of significant accounting policies (cont’d)
2.16 Provisions
Provisions are recognised when the Group has a present obligation (legal or constructive) as a result of a past event, it is probable that an outflow of resources embodying economic benefits will be required to settle the obligation and the amount of the obligation can be estimated reliably.
Provisions are reviewed at each balance sheet date and adjusted to reflect the current best estimate. If it is no longer probable that an outflow of economic resources will be required to settle the obligation, the provision is reversed. If the effect of the time value of money is material, provisions are discounted using a current pre tax rate that reflects, where appropriate, the risks specific to the liability. When discounting is used, the increase in the provision due to the passage of time is recognised as a finance cost.
2.17 Financial guarantee
A financial guarantee contract is a contract that requires the issuer to make specified payments to reimburse the holder for a loss it incurs because a specified debtor fails to make payment when due.
Financial guarantees are recognised initially as a liability at fair value, adjusted for transaction costs that are directly attributable to the issuance of the guarantee. Subsequent to initial recognition, financial guarantees are recognised as income in profit or loss over the period of the guarantee. If it is probable that the liability will be higher than the amount initially recognised less amortisation, the liability is recorded at the higher amount with the difference charged to profit or loss.
2.18 Employee benefits
Defined contribution plan
The Group participates in the national pension schemes as defined by the laws of the countries in which it has operations. In particular, the Singapore companies in the Group make contributions to the Central Provident Fund scheme in Singapore, a defined contribution pension scheme. Contributions to defined contribution pension schemes are recognised as an expense in the period in which the related service is performed.
Employee leave entitlement
Employee entitlements to annual leave are recognised as a liability when they are accrued to employees. The estimated liability for leave is recognised for services rendered by employees up to the end of the reporting period.
2.19 Leases
The determination of whether an arrangement is, or contains a lease is based on the substance of the arrangement at inception date: whether fulfilment of the arrangement is dependent on the use of a specific asset or assets or the arrangement conveys a right to use the asset, even if that right is not explicitly specified in an arrangement.
As lessee
Finance leases, which transfer to the Group substantially all the risks and rewards incidental to ownership of the leased item, are capitalised at the inception of the lease at the fair value of the leased asset or, if lower, at the present value of the minimum lease payments. Any initial direct costs are also added to the amount capitalised. Lease payments are apportioned between the finance charges and reduction of the lease liability so as to achieve a constant rate of interest on the remaining balance of the liability. Finance charges are charged to profit or loss. Contingent rents, if any, are charged as expenses in the periods in which they are incurred.
Capitalised leased assets are depreciated over the shorter of the estimated useful life of the asset and the lease term, if there is no reasonable certainty that the Group will obtain ownership by the end of the lease term.
Operating lease payments are recognised as an expense in profit or loss on a straight-line basis over the lease term. The aggregate benefit of incentives provided by the lessor is recognised as a reduction of rental expense over the lease term on a straight-line basis.
As lessor
Leases where the Group retains substantially all the risks and rewards of ownership of the asset are classified as operating leases. Initial direct costs incurred in negotiating an operating lease are added to the carrying amount of the leased asset and recognised over the lease term on the same bases as rental income. The accounting policy for rental income is set out in Note 2.22.

46ANNUAL REPORT 2014
2. Summary of significant accounting policies (cont’d)
2.20 Interest bearing loans and borrowings
All loans and borrowings are initially recognised at fair value of the consideration received less directly attributable transaction costs. After initial recognition, interest-bearing loans and borrowings are subsequently measured at amortised cost using the effective interest rate method. Gains and losses are recognised in profit or loss when the liabilities are derecognised, and through the amortisation process. The accounting policy for this category of financial liabilities is stated in Note 2.11(b).
2.21 Borrowing costs
Borrowing costs consist of interest and other costs incurred in connection with the borrowing of funds, and are expensed in the period they are incurred.
2.22 Revenue
Revenue is recognised to the extent that it is probable that the economic benefits will flow to the Group and the revenue can be reliably measured, regardless of when the payment is made. Revenue is measured at the fair value of consideration received or receivable, taking into account contractually defined terms of payment and excluding taxes or duty. The Group assesses its revenue arrangements to determine if it is acting as principal or agent. The following specific recognition criteria must also be met before revenue is recognised:
(a) Sale of goods
Revenue from sale of goods is recognised upon the transfer of significant risk and rewards of ownership of the goods to the customer, which generally coincides with delivery and acceptance of the goods sold. Revenue is not recognised to the extent where there are significant uncertainties regarding recovery of the consideration due, associated costs or the possible return of goods.
(b) Rental income
Rental income is recognised on a straight-line basis over the lease terms. The aggregate costs of incentives provided to lessees are recognised as a reduction of rental income over the lease term on a straight-line basis.
(c) Dividend income
Dividend income is recognised when the Group’s right to receive payment is established.
(d) Interest income
Interest income is recognised using effective interest method.
(e) Membership fee income
Membership fee is recognised as income when a new customer signs up to be a member or when an existing member renews the
membership.
2.23 Taxes
(a) Current income tax
Current income tax assets and liabilities for the current and prior periods are measured at the amount expected to be recovered from or paid to the taxation authorities. The tax rates and tax laws used to compute the amount are those that are enacted or substantively enacted at the end of the reporting period, in the countries where the Group operates and generates taxable income.
Current income taxes are recognised in profit or loss except to the extent that the tax relates to items recognised outside profit or loss, either in other comprehensive income or directly in equity. Management periodically evaluates positions taken in the tax returns with respect to situations in which applicable tax regulations are subject to interpretation and establishes provisions where appropriate.
47ANNUAL REPORT 2014
2. Summary of significant accounting policies (cont’d)
2.23 Taxes (cont’d)
(b) Deferred tax
Deferred tax is provided using the liability method on temporary differences at the end of the reporting period between the tax bases of assets and liabilities and their carrying amounts for financial reporting purposes.
Deferred tax liabilities are recognised for all temporary differences, except:
• where the deferred tax liability arises from the initial recognition of goodwill or of an asset or liability in a transaction that is not a business combination and, at the time of the transaction, affects neither the accounting profit nor taxable profit or loss; and
• in respect of taxable temporary differences associated with investments in subsidiaries, associates and interests in joint ventures, where the timing of the reversal of the temporary differences can be controlled and it is probable that the temporary differences will not reverse in the foreseeable future.
Deferred tax assets are recognised for all deductible temporary differences, carry forward of unused tax credits and unused tax losses, to the extent that it is probable that taxable profit will be available against which the deductible temporary differences, and the carry forward of unused tax credits and unused tax losses can be utilised except:
• where the deferred tax asset relating to the deductible temporary difference arises from the initial recognition of an asset or liability in a transaction that is not a business combination and, at the time of the transaction, affects neither the accounting profit nor taxable profit or loss; and
• in respect of deductible temporary differences associated with investments in subsidiaries, associates and interests in joint ventures, deferred tax assets are recognised only to the extent that it is probable that the temporary differences will reverse in the foreseeable future and taxable profit will be available against which the temporary differences can be utilised.
The carrying amount of deferred tax assets is reviewed at the end of each reporting period and reduced to the extent that it is no longer probable that sufficient taxable profit will be available to allow all or part of the deferred tax assets to be utilised. Unrecognised deferred tax assets are reassessed at the end of each reporting period and are recognised to the extent that it has become probable that future taxable profit will allow the deferred tax assets to be recovered.
Deferred tax assets and liabilities are measured at the tax rates that are expected to apply in the year when the asset is realised or the liability is settled, based on tax rates (and tax laws) that have been enacted or substantively enacted at the end of each reporting period.
Deferred tax relating to items recognised outside profit or loss is recognised outside profit or loss. Deferred tax items are recognised in correlation to the underlying transaction either in other comprehensive income or directly in equity and deferred tax arising from a business combination is adjusted against goodwill on acquisition.
Deferred tax assets and deferred tax liabilities are offset, if a legally enforceable right exists to set off current income tax assets against current income tax liabilities and the deferred taxes relate to the same taxable entity and the same taxation authority.
Tax benefits acquired as part of a business combination, but not satisfying the criteria for separate recognition at that date, would be recognised subsequently if new information about facts and circumstances changed. The adjustment would either be treated as a reduction to goodwill (as long as it does not exceed goodwill) if it incurred during the measurement period or in profit or loss.
(c) Sales tax
Revenues, expenses and assets are recognised net of the amount of sales tax except:
• Where the sales tax incurred in a purchase of assets or services is not recoverable from the taxation authority, in which case the sales tax is recognised as part of the cost of acquisition of the asset or as part of the expense item as applicable; and
• Receivables and payables that are stated with the amount of sales tax included.
The net amount of sales tax recoverable from, or payable to, the taxation authority is included as part of receivables or payables in the balance sheet.
2.24 Share capital
Proceeds from issuance of ordinary shares are recognised as share capital in equity. Incremental costs directly attributable to the issuance of ordinary shares are deducted against share capital.
48ANNUAL REPORT 2014
2. Summary of significant accounting policies (cont’d)
2.25 Segment reporting
For management purposes, the Group is organised into operating segments based on their geographical locations which are independently managed by the respective segment managers responsible for the performance of the respective segments under their charge. The segment managers report directly to the management of the Company who regularly review the segment results in order to allocate resources to the segments and to assess the segment performance. Additional disclosures on each of these segments are shown in Note 31, including the factors used to identify the reportable segments and the measurement basis of segment information.
2.26 Contingencies
A contingent liability is:
(a) a possible obligation that arises from past events and whose existence will be confirmed only by the occurrence or non-occurrence of one or more uncertain future events not wholly within the control of the Group; or
(b) a present obligation that arises from past events but is not recognised because:
(i) It is not probable that an outflow of resources embodying economic benefits will be required to settle the obligation; or
(ii) The amount of the obligation cannot be measured with sufficient reliability.
A contingent asset is a possible asset that arises from past events and whose existence will be confirmed only by the occurrence or non-occurrence of one or more uncertain future events not wholly within the control of the Group.
Contingent liabilities and assets are not recognised on the balance sheet of the Group, except for contingent liabilities assumed in a business combination that are present obligations and which the fair values can be reliably determined.
2.27 Related parties
A related party is defined as follows:
(a) A person or a close member of that person’s family is related to the Group and Company if that person:
(i) Has control or joint control over the Company;
(ii) Has significant influence over the Company; or
(iii) Is a member of the key management personnel of the Group or Company or of a parent of the Company.
(b) An entity is related to the Group and the Company if any of the following conditions applies:
(i) The entity and the Company are members of the same group (which means that each parent, subsidiary and fellow subsidiary is related to the others).
(ii) One entity is an associate or joint venture of the other entity (or an associate or joint venture of a member of a group of which the other entity is a member).
(iii) Both entities are joint ventures of the same third party.
(iv) One entity is a joint venture of a third entity and the other entity is an associate of the third entity.
(v) The entity is a post-employment benefit plan for the benefit of employees of either the Company or an entity related to the Company. If the Company is itself such a plan, the sponsoring employers are also related to the Company.
(vi) The entity is controlled or jointly controlled by a person identified in (a).
(vii) A person identified in (a) (i) has significant influence over the entity or is a member of the key management personnel of the entity (or of a parent of the entity).
3. Significant accounting judgements and estimates
The preparation of the Group’s consolidated financial statements requires management to make judgements, estimates and assumptions that affect the reported amounts of revenues, expenses, assets and liabilities, and the disclosure of contingent liabilities at the end of each reporting period. However, uncertainty about these assumptions and estimates could result in outcomes that could require a material adjustment to the carrying amount of the asset or liability affected in the future periods.
49ANNUAL REPORT 2014
3. Significant accounting judgements and estimates (cont’d)
3.1 Key sources of estimation uncertainty
The key assumptions concerning the future and other key sources of estimation uncertainty at the end of the reporting period are discussed below. The Group based its assumptions and estimates on parameters available when the financial statements was prepared. Existing circumstances and assumptions about future developments, however, may change due to market changes or circumstances arising beyond the control of the Group. Such changes are reflected in the assumptions when they occur.
(i) Income taxes
The Group has exposure to income taxes in numerous jurisdictions. Significant judgement is involved in determining the group-wide provision for income taxes. There are certain transactions and computations for which the ultimate tax determination is uncertain during the ordinary course of business. The Group recognises liabilities for expected tax issues based on estimates of whether additional taxes will be due. Where the final tax outcome of these matters is different from the amounts that were initially recognised, such differences will impact the income tax and deferred tax provisions in the period in which such determination was made. The carrying amount of the Group’s income tax payable at 31 March 2014 was $36,000 (2013:$68,000). The carrying amount of deferred tax assets and liabilities are disclosed in Note 19.
(ii) Useful lives of property, plant and equipment
The cost of property, plant and equipment are depreciated on a straight-line basis over their estimated useful lives. Management estimates the useful lives of these property, plant and equipment as disclosed in Note 2.7. The carrying amount of the Group’s and the Company’s property, plant and equipment at 31 March 2014 was $4,503,000 (2013: $7,288,000) and $651,000 (2013: $3,063,000), respectively. Changes in the expected level of usage could impact the economic useful lives and the residual values of these assets, therefore future depreciation charges could be revised.
(iii) Impairment of non-financial assets
The Group assesses at each balance sheet date whether there are any indicators of impairment for all non-financial assets.
Determining whether the carrying values of property, plant and equipment and investment in associated companies on impaired requires the Group to estimate the future cash flows expected from the asset or CGU and appropriate discount rate in order to calculate the present value of the future cash flows. the carrying amount of property, plant and equipment and investment in subsidiaries and associated companies at balance sheet date are disclosed in Notes 18, 17 and 16 respectively.
(iv) Impairment of loans and receivables
The Group assesses at end of each reporting period whether there is any objective evidence that a financial asset is impaired. To determine whether there is objective evidence of impairment, the Group considers factors such as the probability of insolvency or significant financial difficulties of the debtor and default or significant delay in payments.
Where there is objective evidence of impairment, the amount and timing of future cash flows are estimated based on historical loss experience for assets with similar credit risk characteristics. The carrying amount of the Group’s and the Company’s trade and other receivables at 31 March 2014 was $4,885,000 (2013: $6,523,000) and $1,481,000 (2013: $5,099,000), respectively.
(v) Allowance for inventory obsolescence
Allowance for inventory obsolescence is estimated based on the best available facts and circumstances, including but not limited to, the physical condition of the inventories, their market selling prices, and estimated costs to be incurred for their sales. The allowances are re-evaluated and adjusted as additional information received affects the amount estimated. The carrying amount of the Group’s and the Company’s inventories at 31 March 2014 was $17,778,000 (2013: $20,660,000) and $4,016,000 (2013: $6,425,000), respectively.
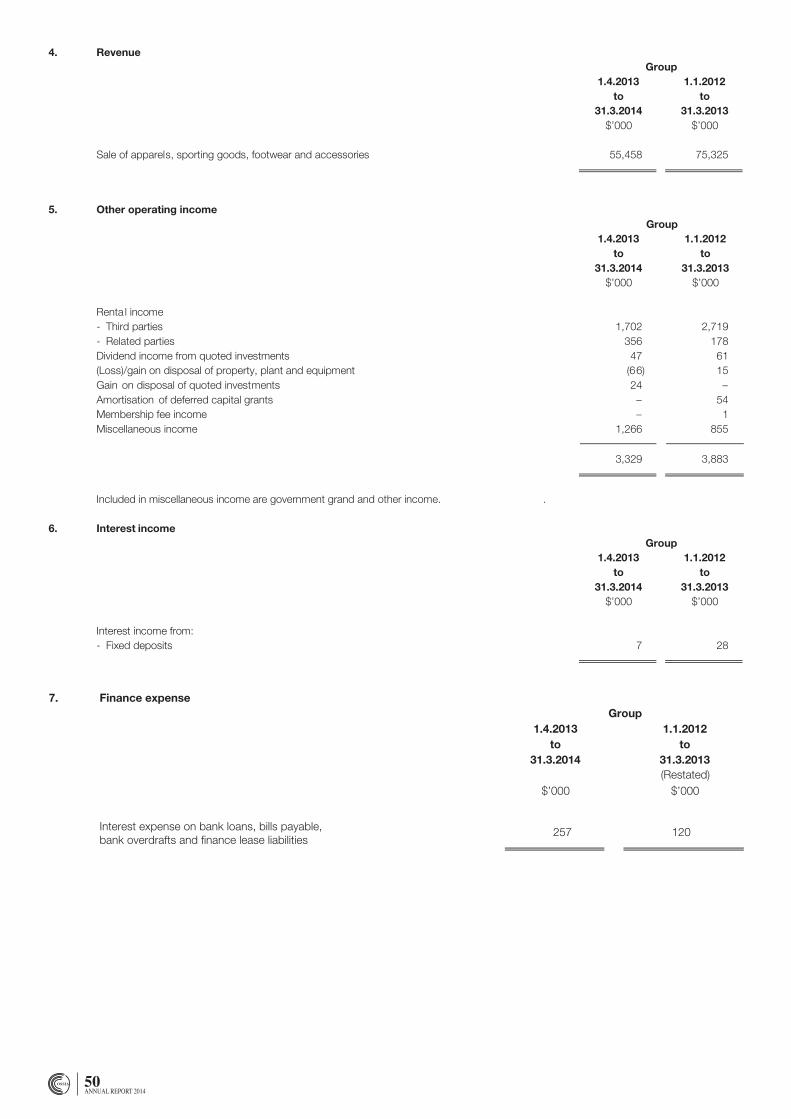
50ANNUAL REPORT 2014
Ossia International Limited and its Subsidiaries
Notes to the Financial Statements – 31 March 2014
- 33 -
4. RevenueGroup
1.4.2013to
31.3.2014
1.1.2012to
31.3.2013$’000 $’000
Sale of apparels, sporting goods, footwear and accessories 55,458 75,325
5. Other operating incomeGroup
1.4.2013to
31.3.2014
1.1.2012to
31.3.2013$’000 $’000
Renta l income- Third parties 1,702 2,719- Related parties 356 178Dividend income from quoted investments 47 61(Loss)/gain on disposal of property, plant and equipment (66) 15Gain on disposal of quoted investments 24 –Amortisation of deferred capital grants – 54Membership fee income – 1Miscellaneous income 1,266 855
3,329 3,883
Included in miscellaneous income are government grand and other income.
6. Interest incomeGroup
1.4.2013to
31.3.2014
1.1.2012to
31.3.2013$’000 $’000
Interest income from:- Fixed deposits 7 28
Ossia International Limited and its Subsidiaries
Notes to the Financial Statements – 31 March 2014
- 34 -
7. Finance expenseGroup
1.4.2013to
31.3.2014
1.1.2012to
31.3.2013$’000
$’000
Interest expense on bank loans, bills payable,bank overdrafts and finance lease liabilities
257 120
8. Loss before income tax
The following items have been included in arriving at loss before income tax:
Group1.4.2013
to31.3.2014
1.1.2012to
31.3.2013$’000 $’000
Auditor’s remuneration- Auditors of the Company 78 96- Other auditors 45 74Non-audit fee- Auditors of the Company 19 –- Other auditors 22Depreciation of property, plant and equipment (Note 18) 2,846 3,465Net foreign exchange loss/(gain) 153 (247)Allowance for/doubtful debts 43 11Rental expense:- Operating lease rentals 11,865 15,987- Contingent lease rentals 733 1,078Staff costs:- Wages and salaries 12,500 16,049- Contribution to defined contribution plans 1,137 1,364- Other related costs 1,194 1,491Write-back of impairment loss on property, plant and
equipment (Note 18) – (33)Write-off of property, plant and equipment (Note 18) 1,721 336Impairment loss on property, plant and equipment (Note 18) 683 6Inventories recognised as an expense in cost of sales
(Note 11) 27,410 36,116Foreign exchange loss/(gain) 151 (247)
–
(Restated)
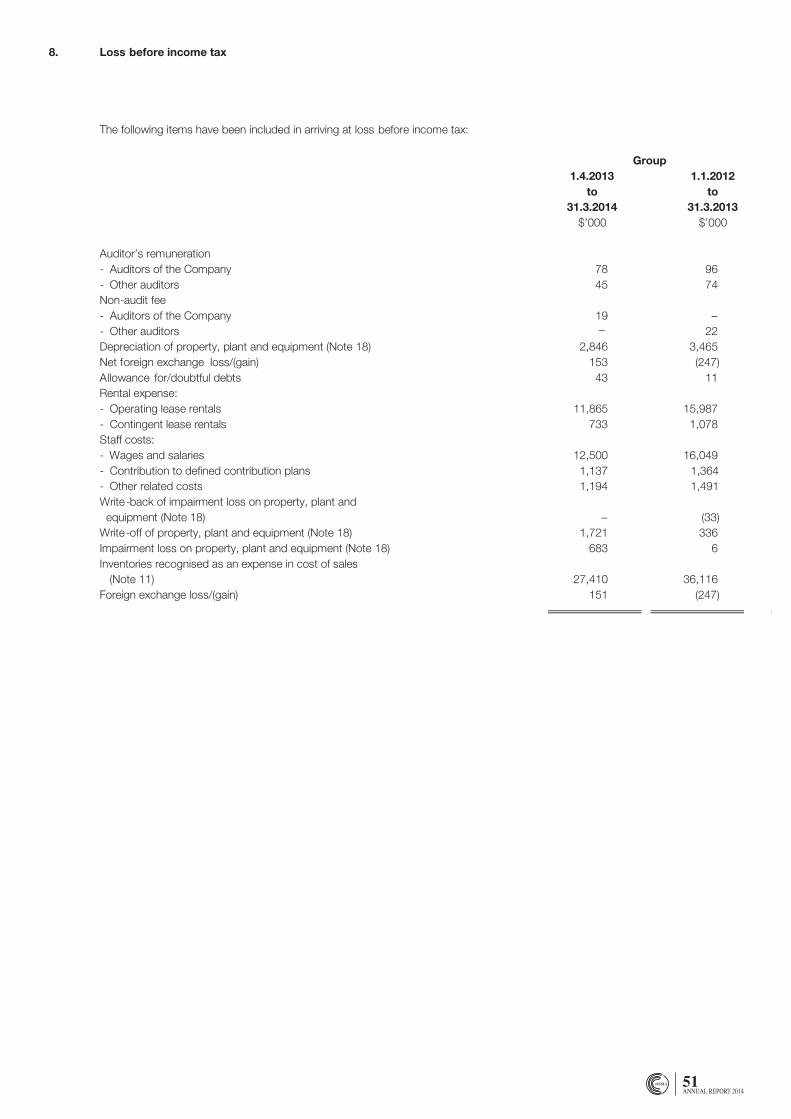
51ANNUAL REPORT 2014
Ossia International Limited and its Subsidiaries
Notes to the Financial Statements – 31 March 2014
- 34 -
7. Finance expenseGroup
1.4.2013to
31.3.2014
1.1.2012to
31.3.2013$’000
$’000
Interest expense on bank loans, bills payable,bank overdrafts and finance lease liabilities
257 120
8. Loss before income tax
The following items have been included in arriving at loss before income tax:
Group1.4.2013
to31.3.2014
1.1.2012to
31.3.2013$’000 $’000
Auditor’s remuneration- Auditors of the Company 78 96- Other auditors 45 74Non-audit fee- Auditors of the Company 19 –- Other auditors 22Depreciation of property, plant and equipment (Note 18) 2,846 3,465Net foreign exchange loss/(gain) 153 (247)Allowance for/doubtful debts 43 11Rental expense:- Operating lease rentals 11,865 15,987- Contingent lease rentals 733 1,078Staff costs:- Wages and salaries 12,500 16,049- Contribution to defined contribution plans 1,137 1,364- Other related costs 1,194 1,491Write-back of impairment loss on property, plant and
equipment (Note 18) – (33)Write-off of property, plant and equipment (Note 18) 1,721 336Impairment loss on property, plant and equipment (Note 18) 683 6Inventories recognised as an expense in cost of sales
(Note 11) 27,410 36,116Foreign exchange loss/(gain) 151 (247)
–
(Restated)
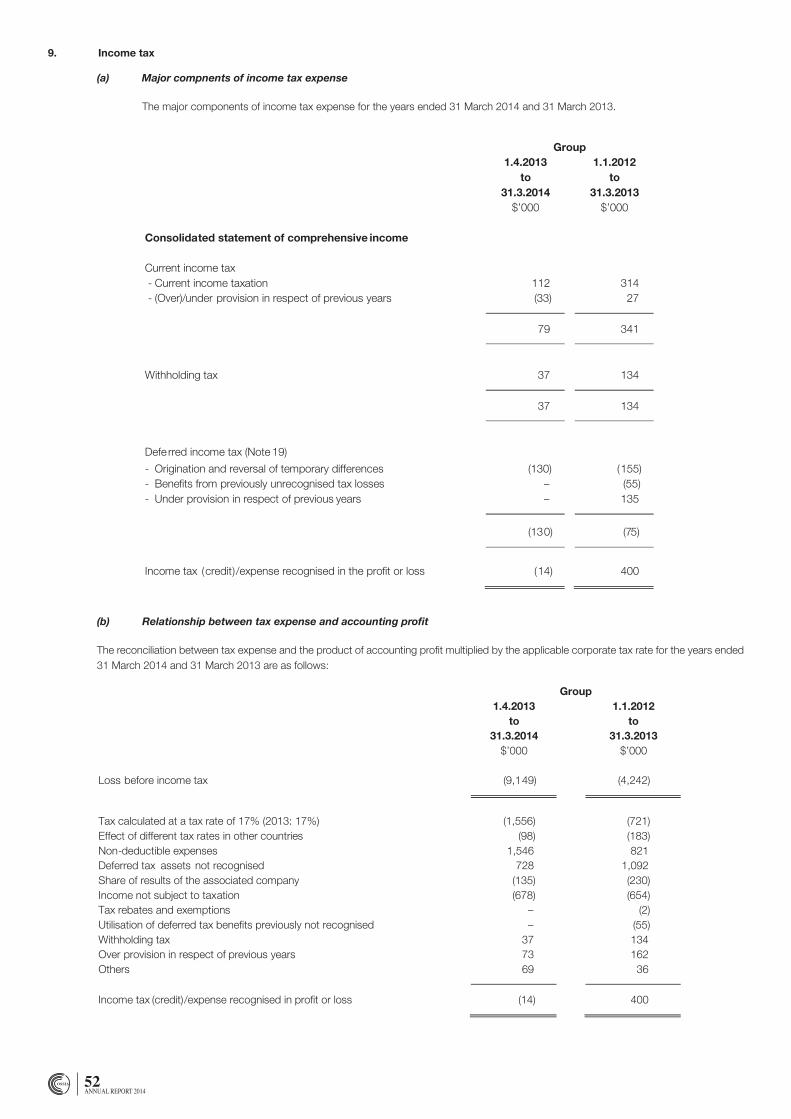
52ANNUAL REPORT 2014
(b) Relationship between tax expense and accounting profit
The reconciliation between tax expense and the product of accounting profit multiplied by the applicable corporate tax rate for the years ended 31 March 2014 and 31 March 2013 are as follows:
Ossia International Limited and its Subsidiaries
Notes to the Financial Statements – 31 March 2014
- 36 -
9. Income tax (cont’d)
(b) Relationship between tax expense and accounting profit
The reconciliation between tax expense and the product of acco unting profit multiplied by the applicable corporate tax rate forthe years ended 31 March 2014 and 31 March 2013 are as follows:
Group1.4.2013
to31.3.2014
1.1.2012to
31.3.2013$’000 $’000
Loss before income tax (9,149) (4,242)
Tax calculated at a tax rate of 17% (2013: 17%) (1,556) (721)Effect of different tax rates in other countries (98) (183)Non-deductible expenses 1,546 821Deferred tax assets not recognised 728 1,092Share of results of the associated company (135) (230)Income not subject to taxation (678) (654)Tax rebates and exemptions – (2)Utilisation of deferred tax benefits previously not recognised – (55)Withholding tax 37 134Over provision in respect of previous years 73 162Others 69 36
Income tax (credit)/expense recognised in profit or loss (14) 400
Ossia International Limited and its Subsidiaries
Notes to the Financial Statements – 31 March 2014
- 35 -
9. Income tax
(a) Major component s of income tax expense
The major components of income tax expense for the year s ended 31 March 2014 and 31 March 2013 are:
Group1.4.2013
to31.3.2014
1.1.2012to
31.3.2013$’000 $’000
Consolidated statement of comprehensive income
Current income tax- Current income taxation 112 314- (Over)/under provision in respect of previous years (33) 27
79 341
Withholding tax 37 134
37 134
Defe rred income tax (Note 19)
- Origination and reversal of temporary differences (130) (155)- Benefits from previously unrecognised tax losses – (55)- Under provision in respect of previous years – 135
(130) (75)
Income tax (credit)/expense recognised in the profit or loss (14) 400
9. Income tax
(a) Major compnents of income tax expense
The major components of income tax expense for the years ended 31 March 2014 and 31 March 2013.
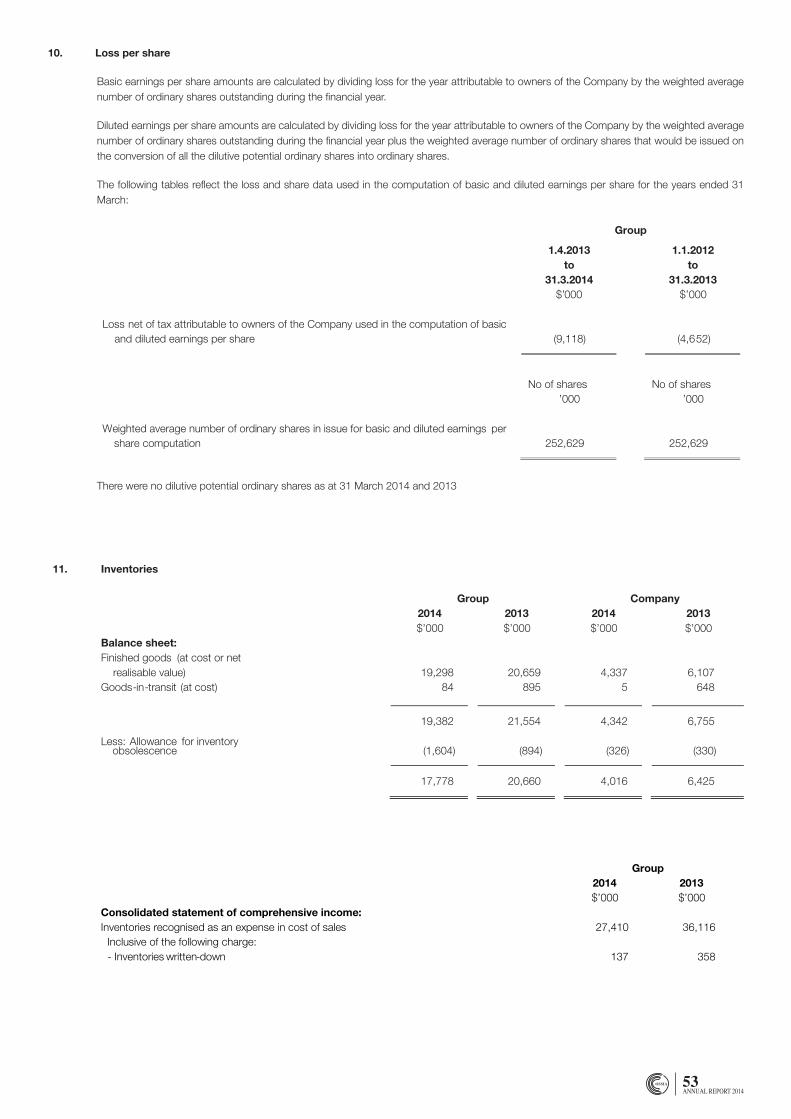
53ANNUAL REPORT 2014
Ossia International Limited and its Subsidiaries
Notes to the Financial Statements – 31 March 2014
- 37 -
10. Loss per share
Basic earnings per share amounts are calculated by dividing loss for the year attributable to owners of the Company by the weightedaverage number of ordinary shares outstanding during the financial year.
Diluted earnings per share amounts are calculated by dividing loss for the year attributable to owners of the Company by the weightedaverage number of ordinary shares outstanding during the financial year plus the weighted average number of ordinary shares t hatwould be issued on the conversion of all the dilutive potential ordinary shares into ordinar y shares.
The following tables reflect the loss and share data used in the computation of basic and diluted earnings per share for the years ended31 March 2014:
Group1.4.2013
to31.3.2014
1.1.2012to
31.3.2013$’000 $’000
Loss net of tax attributable to owners of the Company used in the computation of basicand diluted earnings per share (9,118) (4,652)
No of shares No of shares’000 ’000
Weighted average number of ordi nary shares in issue for basic and diluted earnings pershare computation 252,629 252,629
There were no dilutive potential ordinary shares as at 31 March 2014.
11. Inventories
Group Company2014 2013 2014 2013$’000 $’000 $’000 $’000
Balance sheet:Finished goods (at cost or net
realisable value) 19,298 20,659 4,337 6,107Goods-in-transit (at cost) 84 895 5 648
19,382 21,554 4,342 6,755
Less: Allowance for inventoryobsolescence (1,604) (894) (326) (330)
17,778 20,660 4,016 6,425Ossia International Limited and its Subsidiaries
Notes to the Financial Statements – 31 March 2014
- 38 -
11. Inventories (cont’d)
Group2014 2013$’000 $’000
Consolidated statement of comprehensive income:Inventories recognised as an expense in cost of sales 27,410 36,116
Inclusive of the following charge:- Inventories written-down 137 358
12. Trade and other receivablesGroup Company
2014 2013 2014 2013$’000 $’000 $’000 $’000
Trade receivables from external parties (i) 4,872 5,996 310 538
Less: Allowance for doubtful trade debts (144) (117) – –
4,728 5,879 310 538Receivables from related parties (ii) 157 644 90 580Trade receivables from subsidiaries (iii) – – 674 3,735Non-trade receivables from subsidiaries – – 407 246
Trade and other receivables 4,885 6,523 1,481 5,099
(i) Trade receivables are non -interest bearing and are generally on 30 to 90 days’ terms. They are recognised at their originalinvoice amounts which represent their fair values on initial recog nition.
( ii) The balances due from related parties are unsecured, non-interest bearing and repayable in cash upon demand.
(iii ) The balances due from subsidia ries are unsecured and non interest bearing , except for an amount of $230,000 (2013:$537,000) which carries interest at 5.5% (2013: 5.5%) per annum Trade rec eivables are generally on 30 to 90 days’ terms,and non-trade receivables are repayable in cash upon demand.
(iii)
10. Loss per share
Basic earnings per share amounts are calculated by dividing loss for the year attributable to owners of the Company by the weighted average number of ordinary shares outstanding during the financial year.
Diluted earnings per share amounts are calculated by dividing loss for the year attributable to owners of the Company by the weighted average number of ordinary shares outstanding during the financial year plus the weighted average number of ordinary shares that would be issued on the conversion of all the dilutive potential ordinary shares into ordinary shares.
The following tables reflect the loss and share data used in the computation of basic and diluted earnings per share for the years ended 31 March:
There were no dilutive potential ordinary shares as at 31 March 2014 and 2013
Ossia International Limited and its Subsidiaries
Notes to the Financial Statements – 31 March 2014
- 37 -
10. Loss per share
Basic earnings per share amounts are calculated by dividing loss for the year attributable to owners of the Company by the weightedaverage number of ordinary shares outstanding during the financial year.
Diluted earnings per share amounts are calculated by dividing loss for the year attributable to owners of the Company by the weightedaverage number of ordinary shares outstanding during the financial year plus the weighted average number of ordinary shares t hatwould be issued on the conversion of all the dilutive potential ordinary shares into ordinar y shares.
The following tables reflect the loss and share data used in the computation of basic and diluted earnings per share for the years ended31 March 2014:
Group1.4.2013
to31.3.2014
1.1.2012to
31.3.2013$’000 $’000
Loss net of tax attributable to owners of the Company used in the computation of basicand diluted earnings per share (9,118) (4,652)
No of shares No of shares’000 ’000
Weighted average number of ordi nary shares in issue for basic and diluted earnings pershare computation 252,629 252,629
There were no dilutive potential ordinary shares as at 31 March 2014.
11. Inventories
Group Company2014 2013 2014 2013$’000 $’000 $’000 $’000
Balance sheet:Finished goods (at cost or net
realisable value) 19,298 20,659 4,337 6,107Goods-in-transit (at cost) 84 895 5 648
19,382 21,554 4,342 6,755
Less: Allowance for inventoryobsolescence (1,604) (894) (326) (330)
17,778 20,660 4,016 6,425
Ossia International Limited and its Subsidiaries
Notes to the Financial Statements – 31 March 2014
- 38 -
11. Inventories (cont’d)
Group2014 2013$’000 $’000
Consolidated statement of comprehensive income:Inventories recognised as an expense in cost of sales 27,410 36,116
Inclusive of the following charge:- Inventories written-down 137 358
12. Trade and other receivablesGroup Company
2014 2013 2014 2013$’000 $’000 $’000 $’000
Trade receivables from external parties (i) 4,872 5,996 310 538
Less: Allowance for doubtful trade debts (144) (117) – –
4,728 5,879 310 538Receivables from related parties (ii) 157 644 90 580Trade receivables from subsidiaries (iii) – – 674 3,735Non-trade receivables from subsidiaries – – 407 246
Trade and other receivables 4,885 6,523 1,481 5,099
(i) Trade receivables are non -interest bearing and are generally on 30 to 90 days’ terms. They are recognised at their originalinvoice amounts which represent their fair values on initial recog nition.
( ii) The balances due from related parties are unsecured, non-interest bearing and repayable in cash upon demand.
(iii ) The balances due from subsidia ries are unsecured and non interest bearing , except for an amount of $230,000 (2013:$537,000) which carries interest at 5.5% (2013: 5.5%) per annum Trade rec eivables are generally on 30 to 90 days’ terms,and non-trade receivables are repayable in cash upon demand.
(iii)
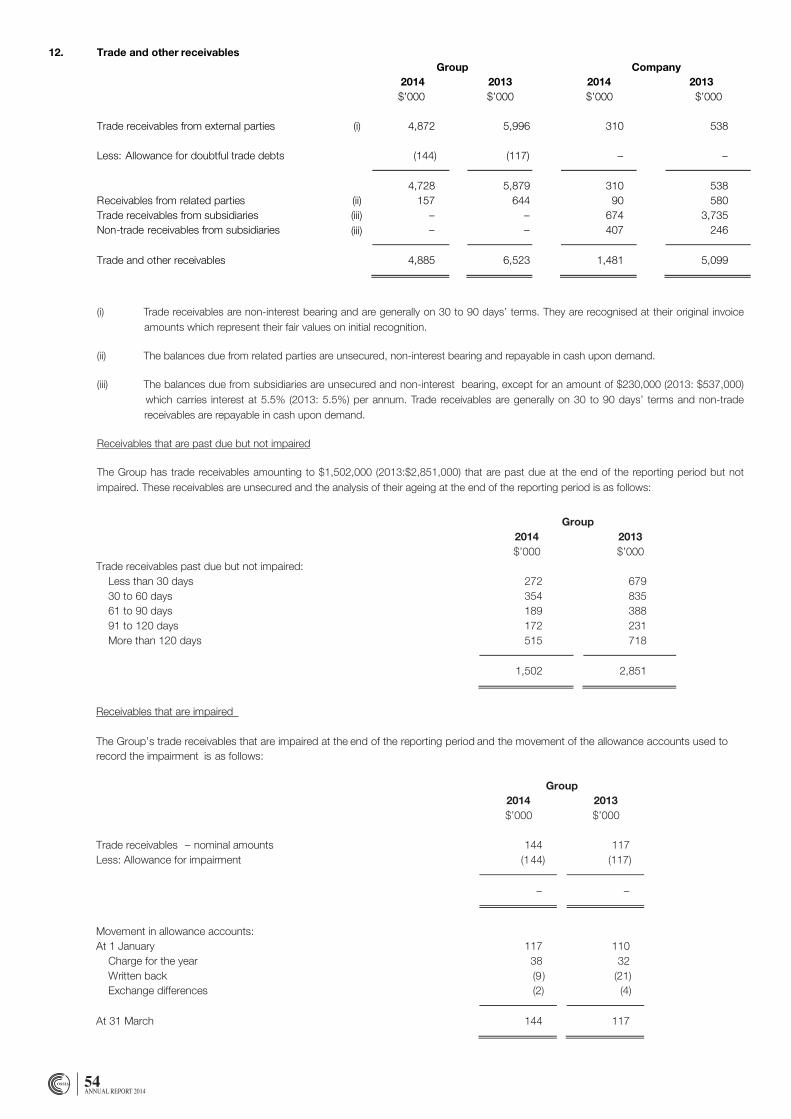
54ANNUAL REPORT 2014
Ossia International Limited and its Subsidiaries
Notes to the Financial Statements – 31 March 2014
- 38 -
11. Inventories (cont’d)
Group2014 2013$’000 $’000
Consolidated statement of comprehensive income:Inventories recognised as an expense in cost of sales 27,410 36,116
Inclusive of the following charge:- Inventories written-down 137 358
12. Trade and other receivablesGroup Company
2014 2013 2014 2013$’000 $’000 $’000 $’000
Trade receivables from external parties (i) 4,872 5,996 310 538
Less: Allowance for doubtful trade debts (144) (117) – –
4,728 5,879 310 538Receivables from related parties (ii) 157 644 90 580Trade receivables from subsidiaries (iii) – – 674 3,735Non-trade receivables from subsidiaries – – 407 246
Trade and other receivables 4,885 6,523 1,481 5,099
(i) Trade receivables are non -interest bearing and are generally on 30 to 90 days’ terms. They are recognised at their originalinvoice amounts which represent their fair values on initial recog nition.
( ii) The balances due from related parties are unsecured, non-interest bearing and repayable in cash upon demand.
(iii ) The balances due from subsidia ries are unsecured and non interest bearing , except for an amount of $230,000 (2013:$537,000) which carries interest at 5.5% (2013: 5.5%) per annum Trade rec eivables are generally on 30 to 90 days’ terms,and non-trade receivables are repayable in cash upon demand.
(iii)
Ossia International Limited and its Subsidiaries
Notes to the Financial Statements – 31 March 2014
- 39 -
12. Trade and other receivables (cont’d)
Receivables that are pas t due but not impaired
The Group has trade receivables amounting to $1, 502,000 (2013: $2,851,000) that are past due at the end of the reporting period butnot impaired. These receivables are unsecured and the analysis of their ag eing at the end of the reporting period is as follows:
Group2014 2013$’000 $’000
Trade receivables past due but not impaired:Less than 30 days 272 67930 to 60 days 354 83561 to 90 days 189 38891 to 120 days 172 231More than 120 days 515 718
1,502 2,851
Receivables that are impaired
The Group’s trade receivables that are impaired at the end of the reporting period and the movement of the allowance accounts used torecord the impairment is as follows:
Group2014 2013$’000 $’000
Trade receivables – nominal amounts 144 117Less: Allowance for impairment (144) (117)
– –
Movement in allowance accounts:At 1 January 117 110
Charge for the year 38 32Written back (9) (21)Exchange differences (2) (4)
At 31 March 144 117
Trade and other receivables denominated in foreign currencies at 31 March 2014 and 31 March 2013 are as follows:
(i) Trade receivables are non-interest bearing and are generally on 30 to 90 days’ terms. They are recognised at their original invoice amounts which represent their fair values on initial recognition.
(ii) The balances due from related parties are unsecured, non-interest bearing and repayable in cash upon demand.
(iii) The balances due from subsidiaries are unsecured and non-interest bearing, except for an amount of $230,000 (2013: $537,000) which carries interest at 5.5% (2013: 5.5%) per annum. Trade receivables are generally on 30 to 90 days’ terms and non-trade receivables are repayable in cash upon demand.
Receivables that are past due but not impaired
The Group has trade receivables amounting to $1,502,000 (2013:$2,851,000) that are past due at the end of the reporting period but not impaired. These receivables are unsecured and the analysis of their ageing at the end of the reporting period is as follows:
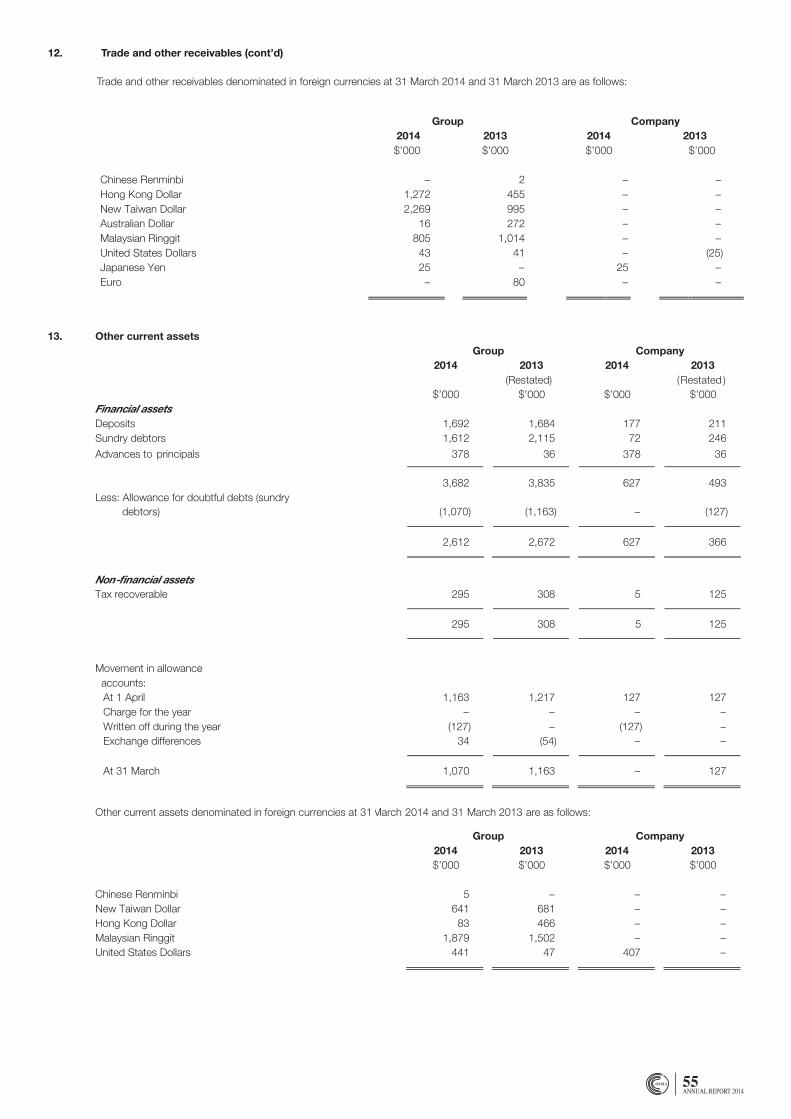
55ANNUAL REPORT 2014
12. Trade and other receivables (cont’d)
Trade and other receivables denominated in foreign currencies at 31 March 2014 and 31 March 2013 are as follows:
Ossia International Limited and its Subsidiaries
Notes to the Financial Statements – 31 March 2014
- 40 -
Group Company2014 2013 2014 2013$’000 $’000 $’000 $’000
Chinese Renminbi – 2 – –Hong Kong Dollar 1,272 455 – –New Taiwan Dollar 2,269 995 – –Australian Dollar 16 272 – –Malaysian Ringgit 805 1,014 – –United States Dollars 43 41 – (25)Japanese Yen 25 – 25 –Euro – 80 – –
13. Other current assetsGroup Company
2014 2013 2014 2013$’000 $’000 $’000 $’000
(Restated) (Restated )Financial assetsDeposits 1,692 1,684 177 211Sundry debtors 1,612 2,115 72 246
3,304 3,799 249 457Less: Allowance for doubtful debts (sundry (1,070) (1,163) – (127)
grwoighreonwrwrrerbg
grwoighreonwrwrrerbg
debtors)
2,612 2,672 627 366
Non-financial assets
Advances to principals 378 36 378 36
Tax recoverable 295 308 5 125
295 308 5 125
Movement in allowanceaccounts:At 1 April 1,163 1,217 127 127Charge for the year – – – –Written off during the year (127) – (127) –Exchange differences 34 (54) – –
At 31 March 1,070 1,163 – 127
Other current assets denominated in foreign currencies at 31 March 2014 and 31 March 2013 are as follows:
Group Company2014 2013 2014 2013$’000 $’000 $’000 $’000
Chinese Renminbi 5 – – –New Taiwan Dollar 641 681 – –Hong Kong Dollar 83 466 – –Malaysian Ringgit 1,879 1,502 – –United States Dollars 441 47 407 –
13. Other current assetsGroup Company
2014 2013 2014 2013
$’000 $’000 $’000 $’000(Restated) (Restated )
Financial assetsDeposits 1,692 1,684 177 211Sundry debtors 1,612 2,115 72 246
3,682 3,835 627 493Less: Allowance for doubtful debts (sundry
(1,070) (1,163) – (127)debtors)
2,612 2,672 627 366
Non-financial assets
Advances to principals 378 36 378 36
Tax recoverable 295 308 5 125
295 308 5 125
Movement in allowanceaccounts:At 1 April 1,163 1,217 127 127Charge for the year – – – –Written off during the year (127) – (127) –Exchange differences 34 (54) – –
At 31 March 1,070 1,163 – 127
Other current assets denominated in foreign currencies at 31 March 2014 and 31 March 2013 are as follows:
Group Company2014 2013 2014 2013$’000 $’000 $’000 $’000
Chinese Renminbi 5 – – –New Taiwan Dollar 641 681 – –Hong Kong Dollar 83 466 – –Malaysian Ringgit 1,879 1,502 – –United States Dollars 441 47 407 –
13. Other current assetsGroup Company
2014 2013 2014 2013
$’000 $’000 $’000 $’000(Restated) (Restated )
Financial assetsDeposits 1,692 1,684 177 211Sundry debtors 1,612 2,115 72 246
3,682 3,835 627 493Less: Allowance for doubtful debts (sundry
(1,070) (1,163) – (127)
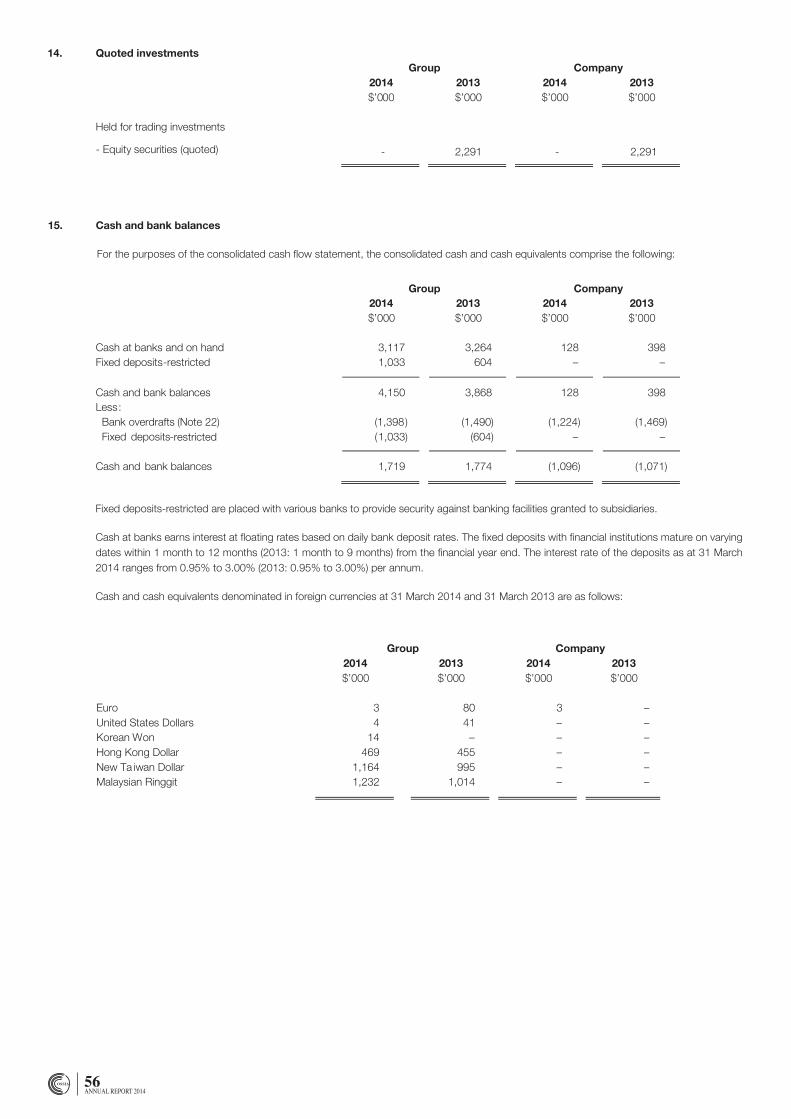
56ANNUAL REPORT 2014
Ossia International Limited and its Subsidiaries
Notes to the Financial Statements – 31 March 2014
- 42 -
14. Quoted investmentsGroup Company
2014 2013 2014 2013$’000 $’000 $’000 $’000
Held for trading investments
- Equity securities (quoted)
15. Cash and bank balances
For the purposes of the consolidated cash flow statement, the consolidated cash and cash equivalents comprise the following:
Group Company2014 2013 2014 2013$’000 $’000 $’000 $’000
Cash at banks and on hand 3,117 3,264 128 398Fixed deposits-restricted 1,033 604 – –
Cash and bank balances 4,150 3,868 128 398Less:
Bank overdrafts (Note 22) (1,398) (1,490) (1,224) (1,469)Fixed deposits (1,033) (604) – –
Cash and bank balances 1,719 1,774 (1,096) (1,071)
- 2,291 - 2,291
-restricted
Fixed deposits-restricted are placed with various banks to provide security against banking facilities granted to subsidiaries.
Cash at banks earns interest at floating rates based on daily bank deposit rates. The fixed deposits with financial institutions mature on varying dates within 1 month to 12 months (2013: 1 month to 9 months) from the financial year end. The interest rate of the deposits as at 31 March 2014 ranges from 0.95% to 3.00% (2013: 0.95% to 3.00%) per annum.
Cash and cash equivalents denominated in foreign currencies at 31 March 2014 and 31 March 2013 are as follows:
Ossia International Limited and its Subsidiaries
Notes to the Financial Statements – 31 March 2014
- 43 -
15. Cash and cash equivalents (cont’d)
Fixed deposits restricted are placed with various banks to provide security against banking facilities granted to subsidiaries.
Cash at banks earns interest at floating rates based on daily bank deposit rates. The fixed deposits with financial institutions mature onvarying dates within 1 month to 12 months (2013: 1 month to 9 months) from the financial year end. The interest rate of th e deposits asat 31 March 2014 ranges from 0. 95% to 3.00% (2013: 0.95% to 3.00%) per annum.
Cash and cash equivalents denominated in foreign cur rencies at 31 March 2014 and 31 March 2013 are as follows:
Group Company2014 2013 2014 2013$’000 $’000 $’000 $’000
Euro 3 80 3 –United States Dollars 4 41 – –Korean Won 14 – – –Hong Kong Dollar 469 455 – –New Ta iwan Dollar 1,164 995 – –Malaysian Ringgit 1,232 1,014 – –
16. Investment in associated companyGroup Company
2014 2013 2014 2013$’000 $’000 $’000 $’000
Unquoted shares, at cost 13,252 13,252 13,252 13,252Share of post acquisition reserves 7,792 6,461 – –
21,044 19,713 13,252 13,252
The share of post acquisition reserves is made up as follows:
Group1.4.2013
to31.3.2014
1.1.2012to
31.3.2013$’000 $’000
Revenue reserve 5,551 6,610Translation reserve (561) (224)Revaluation reserve 2,802 75
7,792 6,461
15. Cash and bank balances
For the purposes of the consolidated cash flow statement, the consolidated cash and cash equivalents comprise the following:
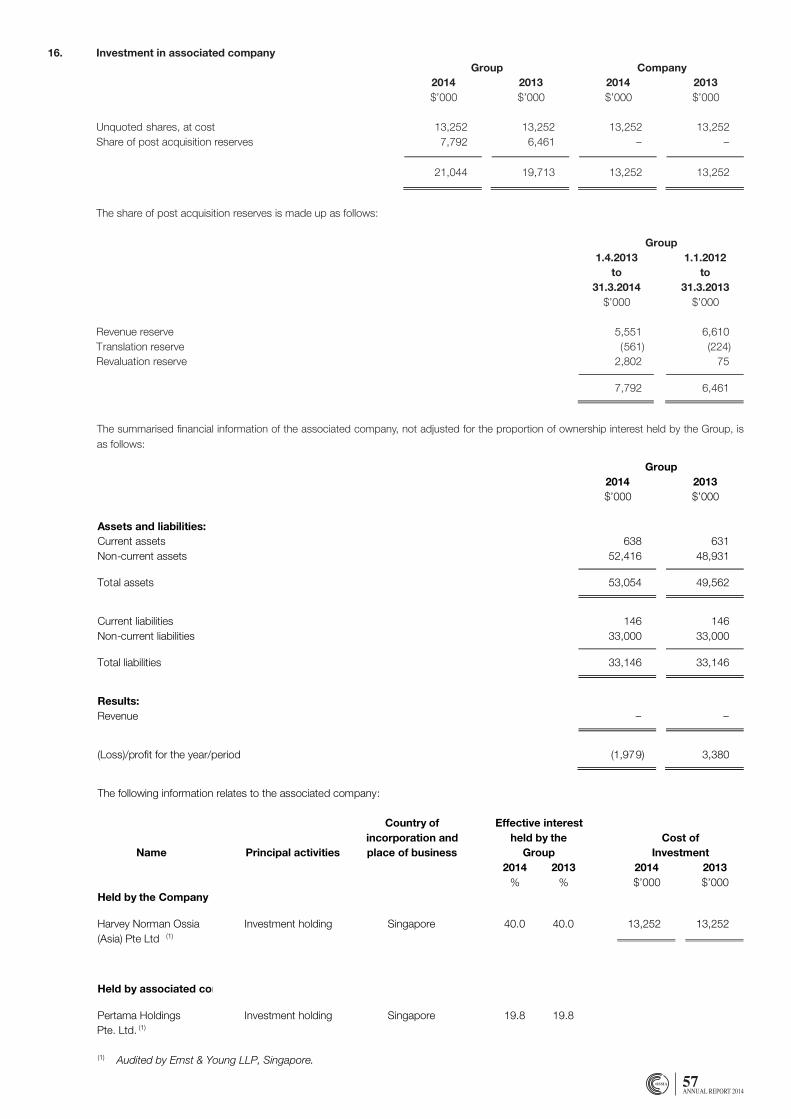
57ANNUAL REPORT 2014
Ossia International Limited and its Subsidiaries
Notes to the Financial Statements – 31 March 2014
- 44 -
16. Investment in associated company (cont’d)
The summarised financial information of the associated company , not adjusted for the proportion of ownership interest held by theGroup, is as follows:
Group2014 2013$’000 $’000
Assets and liabilities:Current assets 638 631Non-current assets 52,416 48,931
Total assets 53,054 49,562
Current liabilities 146 146Non-current liabilities 33,000 33,000
Total liabilities 33,146 33,146
Results:Revenue – –
(Loss)/profit for the year/period (1,979) 3,380
The following information relates to the associated company:
Name Principal activities
Country ofincorporation andplace of business
Effective interestheld by the
GroupCost of
Investment2014 2013 2014 2013
% % $’000 $’000Held by the Company
Harvey Norman Ossia(Asia) Pte Ltd (1)
Investment holding Singapore 40.0 40.0 13,252 13,252
Held by associated company
Pte. Ltd. (1)
Investment holding Singapore 19.8 19.8
(1) Audited by Ernst & Young LLP, Singapore.
Pertama Holdings
Ossia International Limited and its Subsidiaries
Notes to the Financial Statements – 31 March 2014
- 43 -
15. Cash and cash equivalents (cont’d)
Fixed deposits restricted are placed with various banks to provide security against banking facilities granted to subsidiaries.
Cash at banks earns interest at floating rates based on daily bank deposit rates. The fixed deposits with financial institutions mature onvarying dates within 1 month to 12 months (2013: 1 month to 9 months) from the financial year end. The interest rate of th e deposits asat 31 March 2014 ranges from 0. 95% to 3.00% (2013: 0.95% to 3.00%) per annum.
Cash and cash equivalents denominated in foreign cur rencies at 31 March 2014 and 31 March 2013 are as follows:
Group Company2014 2013 2014 2013$’000 $’000 $’000 $’000
Euro 3 80 3 –United States Dollars 4 41 – –Korean Won 14 – – –Hong Kong Dollar 469 455 – –New Ta iwan Dollar 1,164 995 – –Malaysian Ringgit 1,232 1,014 – –
16. Investment in associated companyGroup Company
2014 2013 2014 2013$’000 $’000 $’000 $’000
Unquoted shares, at cost 13,252 13,252 13,252 13,252Share of post acquisition reserves 7,792 6,461 – –
21,044 19,713 13,252 13,252
The share of post acquisition reserves is made up as follows:
Group1.4.2013
to31.3.2014
1.1.2012to
31.3.2013$’000 $’000
Revenue reserve 5,551 6,610Translation reserve (561) (224)Revaluation reserve 2,802 75
7,792 6,461
The summarised financial information of the associated company, not adjusted for the proportion of ownership interest held by the Group, is as follows:
Ossia International Limited and its Subsidiaries
Notes to the Financial Statements – 31 March 2014
- 44 -
16. Investment in associated company (cont’d)
The summarised financial information of the associated company , not adjusted for the proportion of ownership interest held by theGroup, is as follows:
Group2014 2013$’000 $’000
Assets and liabilities:Current assets 638 631Non-current assets 52,416 48,931
Total assets 53,054 49,562
Current liabilities 146 146Non-current liabilities 33,000 33,000
Total liabilities 33,146 33,146
Results:Revenue – –
(Loss)/profit for the year/period (1,979) 3,380
The following information relates to the associated company:
Name Principal activities
Country ofincorporation andplace of business
Effective interestheld by the
GroupCost of
Investment2014 2013 2014 2013
% % $’000 $’000Held by the Company
Harvey Norman Ossia(Asia) Pte Ltd (1)
Investment holding Singapore 40.0 40.0 13,252 13,252
Held by associated company
Pte. Ltd. (1)
Investment holding Singapore 19.8 19.8
(1) Audited by Ernst & Young LLP, Singapore.
Pertama Holdings
Ossia International Limited and its Subsidiaries
Notes to the Financial Statements – 31 March 2014
- 43 -
15. Cash and cash equivalents (cont’d)
Fixed deposits restricted are placed with various banks to provide security against banking facilities granted to subsidiaries.
Cash at banks earns interest at floating rates based on daily bank deposit rates. The fixed deposits with financial institutions mature onvarying dates within 1 month to 12 months (2013: 1 month to 9 months) from the financial year end. The interest rate of th e deposits asat 31 March 2014 ranges from 0. 95% to 3.00% (2013: 0.95% to 3.00%) per annum.
Cash and cash equivalents denominated in foreign cur rencies at 31 March 2014 and 31 March 2013 are as follows:
Group Company2014 2013 2014 2013$’000 $’000 $’000 $’000
Euro 3 80 3 –United States Dollars 4 41 – –Korean Won 14 – – –Hong Kong Dollar 469 455 – –New Ta iwan Dollar 1,164 995 – –Malaysian Ringgit 1,232 1,014 – –
16. Investment in associated companyGroup Company
2014 2013 2014 2013$’000 $’000 $’000 $’000
Unquoted shares, at cost 13,252 13,252 13,252 13,252Share of post acquisition reserves 7,792 6,461 – –
21,044 19,713 13,252 13,252
The share of post acquisition reserves is made up as follows:
Group1.4.2013
to31.3.2014
1.1.2012to
31.3.2013$’000 $’000
Revenue reserve 5,551 6,610Translation reserve (561) (224)Revaluation reserve 2,802 75
7,792 6,461
Ossia International Limited and its Subsidiaries
Notes to the Financial Statements – 31 March 2014
- 44 -
16. Investment in associated company (cont’d)
The summarised financial information of the associated company , not adjusted for the proportion of ownership interest held by theGroup, is as follows:
Group2014 2013$’000 $’000
Assets and liabilities:Current assets 638 631Non-current assets 52,416 48,931
Total assets 53,054 49,562
Current liabilities 146 146Non-current liabilities 33,000 33,000
Total liabilities 33,146 33,146
Results:Revenue – –
(Loss)/profit for the year/period (1,979) 3,380
The following information relates to the associated company:
Name Principal activities
Country ofincorporation andplace of business
Effective interestheld by the
GroupCost of
Investment2014 2013 2014 2013
% % $’000 $’000Held by the Company
Harvey Norman Ossia(Asia) Pte Ltd (1)
Investment holding Singapore 40.0 40.0 13,252 13,252
Held by associated company
Pte. Ltd. (1)
Investment holding Singapore 19.8 19.8
(1) Audited by Ernst & Young LLP, Singapore.
Pertama Holdings
Ossia International Limited and its Subsidiaries
Notes to the Financial Statements – 31 March 2014
- 44 -
16. Investment in associated company (cont’d)
The summarised financial information of the associated company , not adjusted for the proportion of ownership interest held by theGroup, is as follows:
Group2014 2013$’000 $’000
Assets and liabilities:Current assets 638 631Non-current assets 52,416 48,931
Total assets 53,054 49,562
Current liabilities 146 146Non-current liabilities 33,000 33,000
Total liabilities 33,146 33,146
Results:Revenue – –
(Loss)/profit for the year/period (1,979) 3,380
The following information relates to the associated company:
Name Principal activities
Country ofincorporation andplace of business
Effective interestheld by the
GroupCost of
Investment2014 2013 2014 2013
% % $’000 $’000Held by the Company
Harvey Norman Ossia(Asia) Pte Ltd (1)
Investment holding Singapore 40.0 40.0 13,252 13,252
Held by associated company
Pte. Ltd. (1)
Investment holding Singapore 19.8 19.8
(1) Audited by Ernst & Young LLP, Singapore.
Pertama Holdings
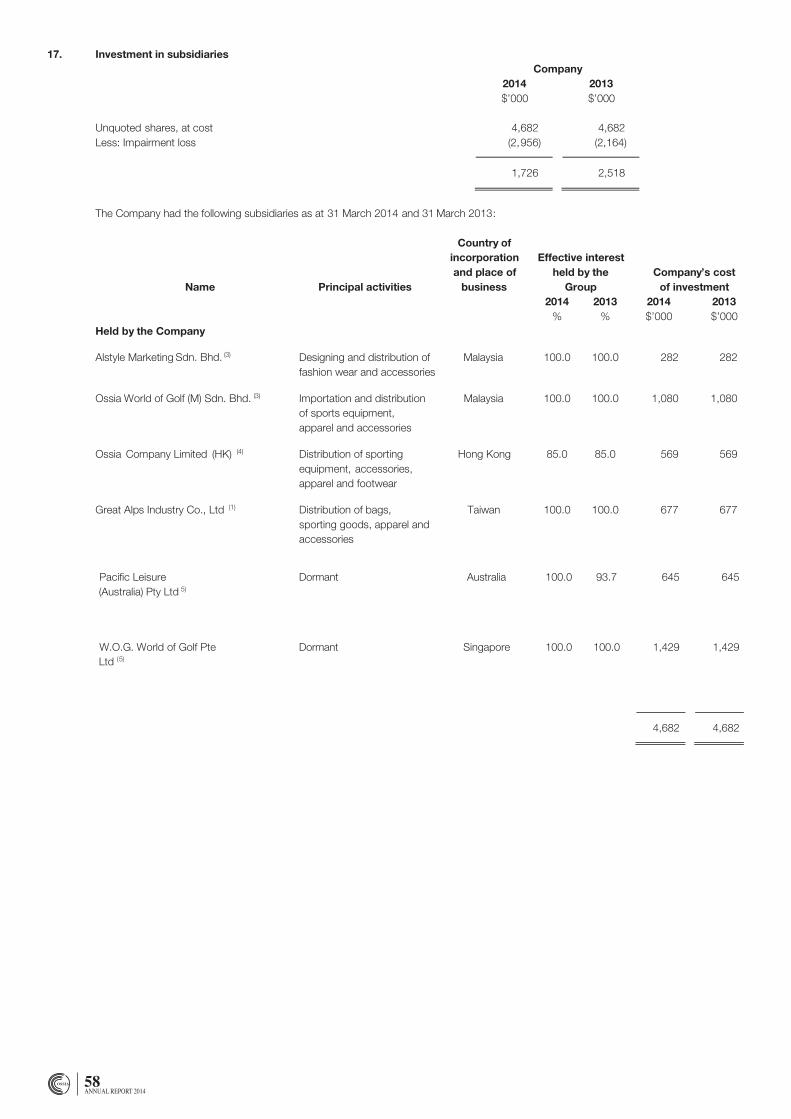
58ANNUAL REPORT 2014
Ossia International Limited and its Subsidiaries
Notes to the Financial Statements – 31 March 2014
- 45 -
17. Investment in subsidiaries (cont’d)
Name Principal activities
Country ofincorporationand place of
business
Effective interestheld by the
GroupCompany’s cost
of investment2014 2013 2014 2013
% % $’000 $’000
(Australia) Pty Ltd (5)
Dormant Australia 100.0 93.7 645 645
W.O.G. World of Golf PteLtd (5)
Dormant Singapore 100.0 100.0 1,429 1,429
4,682 4,682
Name Principal activities
Country ofincorporation andplace of business
Effective interest heldby the Group
2014 2013% %
Held by subsidiaries
Alstyle International (M) Sdn. Bhd.(3) Designing, marketing anddistribution of fashion wearand accessories
Malaysia 100.0 100.0
Alstyle Fashion Sdn. Bhd. (3) Marketing and distribution offashion and sports appareland accessories
Malaysia 100.0 100.0
Alstyle InternationalResources Sdn. Bhd.(3)
Wholesaler, retailer ofapparels and others
Malaysia 61.0 61.0
(2) Dormant Malaysia 100.0 100.0
(2) Dormant Malaysia 100.0 100.0
(2) Dormant Malaysia 100.0 100.0
(2) Dormant Malaysia 100.0 100.0
Pacific Leisure
Ossia Marketing Sdn. Bhd.
U.S.U.S. Marketing Sdn. Bhd.
O.F. Marketing Sdn. Bhd.
O.F. Active Sdn. Bhd.
Ossia International Limited and its Subsidiaries
Notes to the Financial Statements – 31 March 2014
- 45 -
17. Investment in subsidiariesCompany
2014 2013$’000 $’000
Unquoted shares, at cost 4,682 4,682Less: Impairment loss (2,956) (2,164)
1,726 2,518
The Company had the following subsidiaries as at 31 March 2014 and 31 March 2013:
Name Principal activities
Country ofincorporationand place of
business
Effective interestheld by the
GroupCompany’s cost
of investment2014 2013 2014 2013
% % $’000 $’000Held by the Company
Alstyle Marketing Sdn. Bhd. (3) Designing and distribution offashion wear and accessories
Malaysia 100.0 100.0 282 282
Ossia World of Golf (M) Sdn. Bhd. (3) Importation and distributionof sports equipment,apparel and accessories
Malaysia 100.0 100.0 1,080 1,080
Ossia Company Limited (HK) (4) Distribution of sportingequipment, accessories,apparel and footwear
Hong Kong 85.0 85.0 569 569
Great Alps Industry Co., Ltd (1) Distribution of bags,sporting goods, apparel andaccessories
Taiwan 100.0 100.0 677 677
Ossia International Limited and its Subsidiaries
Notes to the Financial Statements – 31 March 2014
- 45 -
17. Investment in subsidiaries (cont’d)
Name Principal activities
Country ofincorporationand place of
business
Effective interestheld by the
GroupCompany’s cost
of investment2014 2013 2014 2013
% % $’000 $’000
(Australia) Pty Ltd (5)
Dormant Australia 100.0 93.7 645 645
W.O.G. World of Golf PteLtd (5)
Dormant Singapore 100.0 100.0 1,429 1,429
4,682 4,682
Name Principal activities
Country ofincorporation andplace of business
Effective interest heldby the Group
2014 2013% %
Held by subsidiaries
Alstyle International (M) Sdn. Bhd.(3) Designing, marketing anddistribution of fashion wearand accessories
Malaysia 100.0 100.0
Alstyle Fashion Sdn. Bhd. (3) Marketing and distribution offashion and sports appareland accessories
Malaysia 100.0 100.0
Alstyle InternationalResources Sdn. Bhd.(3)
Wholesaler, retailer ofapparels and others
Malaysia 61.0 61.0
(2) Dormant Malaysia 100.0 100.0
(2) Dormant Malaysia 100.0 100.0
(2) Dormant Malaysia 100.0 100.0
(2) Dormant Malaysia 100.0 100.0
Pacific Leisure
Ossia Marketing Sdn. Bhd.
U.S.U.S. Marketing Sdn. Bhd.
O.F. Marketing Sdn. Bhd.
O.F. Active Sdn. Bhd.
Ossia International Limited and its Subsidiaries
Notes to the Financial Statements – 31 March 2014
- 45 -
17. Investment in subsidiariesCompany
2014 2013$’000 $’000
Unquoted shares, at cost 4,682 4,682Less: Impairment loss (2,956) (2,164)
1,726 2,518
The Company had the following subsidiaries as at 31 March 2014 and 31 March 2013:
Name Principal activities
Country ofincorporationand place of
business
Effective interestheld by the
GroupCompany’s cost
of investment2014 2013 2014 2013
% % $’000 $’000Held by the Company
Alstyle Marketing Sdn. Bhd. (3) Designing and distribution offashion wear and accessories
Malaysia 100.0 100.0 282 282
Ossia World of Golf (M) Sdn. Bhd. (3) Importation and distributionof sports equipment,apparel and accessories
Malaysia 100.0 100.0 1,080 1,080
Ossia Company Limited (HK) (4) Distribution of sportingequipment, accessories,apparel and footwear
Hong Kong 85.0 85.0 569 569
Great Alps Industry Co., Ltd (1) Distribution of bags,sporting goods, apparel andaccessories
Taiwan 100.0 100.0 677 677
Ossia International Limited and its Subsidiaries
Notes to the Financial Statements – 31 March 2014
- 45 -
17. Investment in subsidiaries (cont’d)
Name Principal activities
Country ofincorporationand place of
business
Effective interestheld by the
GroupCompany’s cost
of investment2014 2013 2014 2013
% % $’000 $’000
(Australia) Pty Ltd (5)
Dormant Australia 100.0 93.7 645 645
W.O.G. World of Golf PteLtd (5)
Dormant Singapore 100.0 100.0 1,429 1,429
4,682 4,682
Name Principal activities
Country ofincorporation andplace of business
Effective interest heldby the Group
2014 2013% %
Held by subsidiaries
Alstyle International (M) Sdn. Bhd.(3) Designing, marketing anddistribution of fashion wearand accessories
Malaysia 100.0 100.0
Alstyle Fashion Sdn. Bhd. (3) Marketing and distribution offashion and sports appareland accessories
Malaysia 100.0 100.0
Alstyle InternationalResources Sdn. Bhd.(3)
Wholesaler, retailer ofapparels and others
Malaysia 61.0 61.0
(2) Dormant Malaysia 100.0 100.0
(2) Dormant Malaysia 100.0 100.0
(2) Dormant Malaysia 100.0 100.0
(2) Dormant Malaysia 100.0 100.0
Pacific Leisure
Ossia Marketing Sdn. Bhd.
U.S.U.S. Marketing Sdn. Bhd.
O.F. Marketing Sdn. Bhd.
O.F. Active Sdn. Bhd.
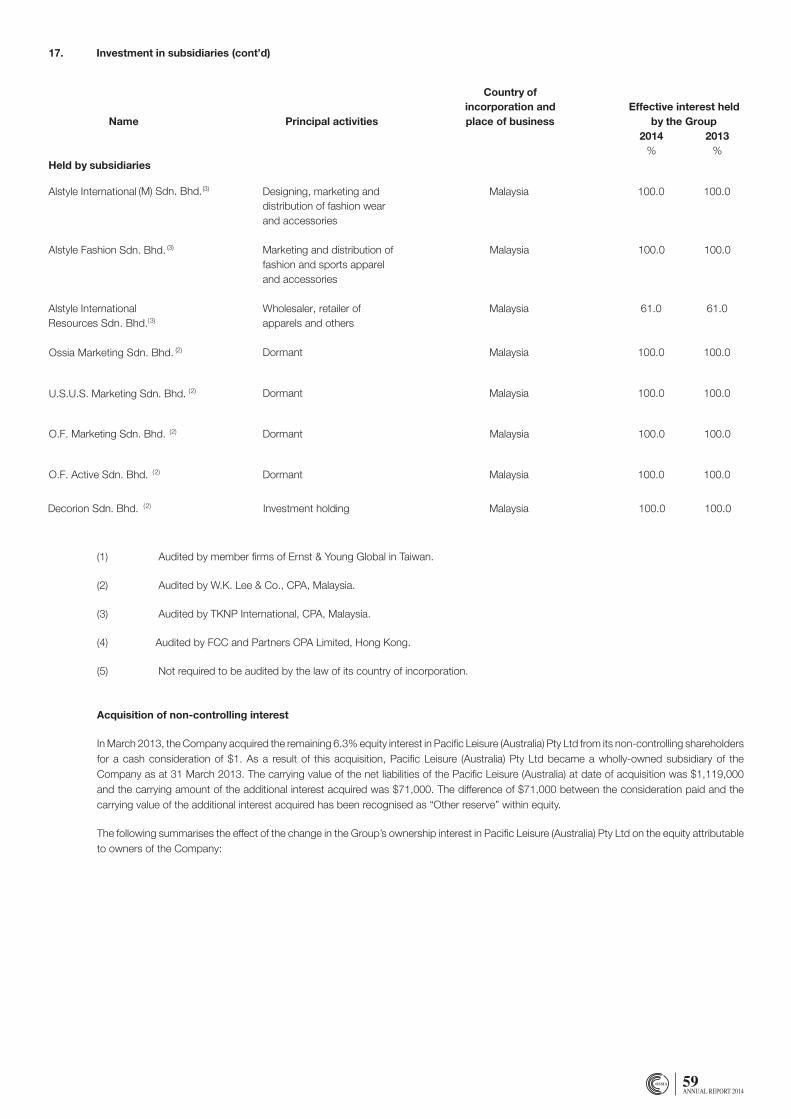
59ANNUAL REPORT 2014
Ossia International Limited and its Subsidiaries
Notes to the Financial Statements – 31 March 2014
- 45 -
17. Investment in subsidiaries (cont’d)
Name Principal activities
Country ofincorporationand place of
business
Effective interestheld by the
GroupCompany’s cost
of investment2014 2013 2014 2013
% % $’000 $’000
(Australia) Pty Ltd (5)
Dormant Australia 100.0 93.7 645 645
W.O.G. World of Golf PteLtd (5)
Dormant Singapore 100.0 100.0 1,429 1,429
4,682 4,682
Name Principal activities
Country ofincorporation andplace of business
Effective interest heldby the Group
2014 2013% %
Held by subsidiaries
Alstyle International (M) Sdn. Bhd.(3) Designing, marketing anddistribution of fashion wearand accessories
Malaysia 100.0 100.0
Alstyle Fashion Sdn. Bhd. (3) Marketing and distribution offashion and sports appareland accessories
Malaysia 100.0 100.0
Alstyle InternationalResources Sdn. Bhd.(3)
Wholesaler, retailer ofapparels and others
Malaysia 61.0 61.0
(2) Dormant Malaysia 100.0 100.0
(2) Dormant Malaysia 100.0 100.0
(2) Dormant Malaysia 100.0 100.0
(2) Dormant Malaysia 100.0 100.0
Pacific Leisure
Ossia Marketing Sdn. Bhd.
U.S.U.S. Marketing Sdn. Bhd.
O.F. Marketing Sdn. Bhd.
O.F. Active Sdn. Bhd.
(1) Audited by member firms of Ernst & Young Global in Taiwan.
(2) Audited by W.K. Lee & Co., CPA, Malaysia.
(3) Audited by TKNP International, CPA, Malaysia.
(4) Audited by FCC and Partners CPA Limited, Hong Kong.
(5) Not required to be audited by the law of its country of incorporation.
Acquisition of non-controlling interest
In March 2013, the Company acquired the remaining 6.3% equity interest in Pacific Leisure (Australia) Pty Ltd from its non-controlling shareholders for a cash consideration of $1. As a result of this acquisition, Pacific Leisure (Australia) Pty Ltd became a wholly-owned subsidiary of the Company as at 31 March 2013. The carrying value of the net liabilities of the Pacific Leisure (Australia) at date of acquisition was $1,119,000 and the carrying amount of the additional interest acquired was $71,000. The difference of $71,000 between the consideration paid and the carrying value of the additional interest acquired has been recognised as “Other reserve” within equity.
The following summarises the effect of the change in the Group’s ownership interest in Pacific Leisure (Australia) Pty Ltd on the equity attributable to owners of the Company:
Ossia International Limited and its Subsidiaries
Notes to the Financial Statements – 31 March 2014
- 46 -
17. Investment in subsidiaries (cont’d)
Name Principal activities
Country ofincorporation andplace of business
Effective interest heldby the Group
2014 2013% %
Decorion Sdn. Bhd. (2) Investment holding Malaysia 100.0 100.0
(1) Audited by members firms of Ernst & Young Global in Taiwan .(2) Audited by Ernst & Young LLP, Singapore.(3) Audited by W.K. Lee & Co., CPA, Malaysia.(4) Audited by TKNP International, CPA, Malaysia.(5) Audited by FCC and Partners CPA Limited, Hong Kong .(6) Not required to be audited by the law of its country of incorporation.
Acquisition of non -controlling interest
In March 2013, the Company acquired the remaining 6.3% equity interest in Pacific Leisure (Australia) Pty Ltd from i ts non-controllinginterests fo r a cash consideration of $1 . As a result of this acquisition, Pacific Leisure (Australia) Pty Ltd became a wholly -ownedsubsidiary of the Company as at 31 March 2013 . The carrying value of the net liabilities of the Pacific Leisure (Australia ) at date ofacquisition was $1,119,000 and the carrying amount of the additional interest acquired was $ 71,000. The difference of $ 71,000 betweenthe consideration and the varying value of the additional interest acquired has been recogn ised as “Premium paid on acquisition of non -controlling interests” within equity.
The following summarises the effect of the change in the Group’s ownership interest in Pacific Leisure (Australia) Pty Ltd on the equityattributable to owners of the Compa ny:
2013$’000
Consideration paid for acquisition of non-controlling interests #Decrease in equity attributable to non-controlling interests (71)
Decrease in equity attributable to owners of the Company (71)
# Amount less than thousan ds of dollars
Impairment of investment in subsidiaries
During the last financia l period, management performed an impairment assessment for the investments in certain subsidiaries and animpairment loss of $ 745,000 was recognised for the ye ar ended 31 March 2013 to write down the cost of investment to the recoverableamounts, determined using the value in use basis.
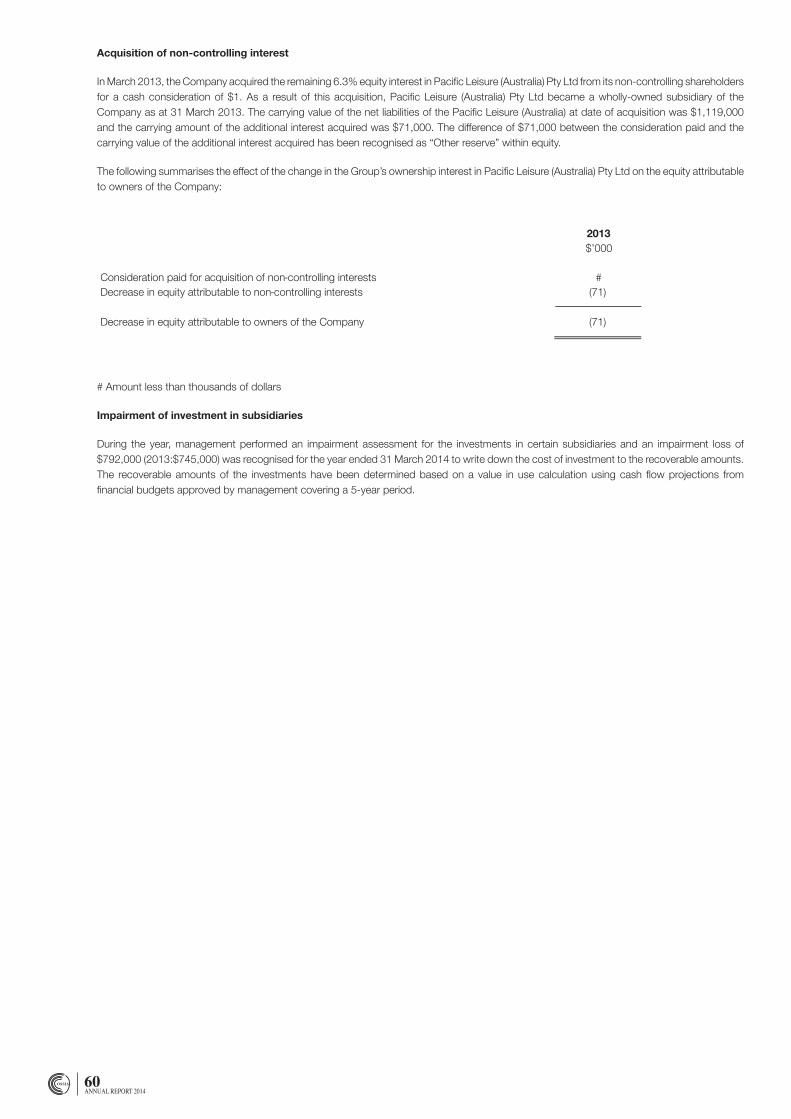
60ANNUAL REPORT 2014
Acquisition of non-controlling interest
In March 2013, the Company acquired the remaining 6.3% equity interest in Pacific Leisure (Australia) Pty Ltd from its non-controlling shareholders for a cash consideration of $1. As a result of this acquisition, Pacific Leisure (Australia) Pty Ltd became a wholly-owned subsidiary of the Company as at 31 March 2013. The carrying value of the net liabilities of the Pacific Leisure (Australia) at date of acquisition was $1,119,000 and the carrying amount of the additional interest acquired was $71,000. The difference of $71,000 between the consideration paid and the carrying value of the additional interest acquired has been recognised as “Other reserve” within equity.
The following summarises the effect of the change in the Group’s ownership interest in Pacific Leisure (Australia) Pty Ltd on the equity attributable to owners of the Company:
# Amount less than thousands of dollars
Impairment of investment in subsidiaries
During the year, management performed an impairment assessment for the investments in certain subsidiaries and an impairment loss of $792,000 (2013:$745,000) was recognised for the year ended 31 March 2014 to write down the cost of investment to the recoverable amounts. The recoverable amounts of the investments have been determined based on a value in use calculation using cash flow projections from financial budgets approved by management covering a 5-year period.
Ossia International Limited and its Subsidiaries
Notes to the Financial Statements – 31 March 2014
- 46 -
17. Investment in subsidiaries (cont’d)
Name Principal activities
Country ofincorporation andplace of business
Effective interest heldby the Group
2014 2013% %
Decorion Sdn. Bhd. (2) Investment holding Malaysia 100.0 100.0
(1) Audited by members firms of Ernst & Young Global in Taiwan .(2) Audited by Ernst & Young LLP, Singapore.(3) Audited by W.K. Lee & Co., CPA, Malaysia.(4) Audited by TKNP International, CPA, Malaysia.(5) Audited by FCC and Partners CPA Limited, Hong Kong .(6) Not required to be audited by the law of its country of incorporation.
Acquisition of non -controlling interest
In March 2013, the Company acquired the remaining 6.3% equity interest in Pacific Leisure (Australia) Pty Ltd from i ts non-controllinginterests fo r a cash consideration of $1 . As a result of this acquisition, Pacific Leisure (Australia) Pty Ltd became a wholly -ownedsubsidiary of the Company as at 31 March 2013 . The carrying value of the net liabilities of the Pacific Leisure (Australia ) at date ofacquisition was $1,119,000 and the carrying amount of the additional interest acquired was $ 71,000. The difference of $ 71,000 betweenthe consideration and the varying value of the additional interest acquired has been recogn ised as “Premium paid on acquisition of non -controlling interests” within equity.
The following summarises the effect of the change in the Group’s ownership interest in Pacific Leisure (Australia) Pty Ltd on the equityattributable to owners of the Compa ny:
2013$’000
Consideration paid for acquisition of non-controlling interests #Decrease in equity attributable to non-controlling interests (71)
Decrease in equity attributable to owners of the Company (71)
# Amount less than thousan ds of dollars
Impairment of investment in subsidiaries
During the last financia l period, management performed an impairment assessment for the investments in certain subsidiaries and animpairment loss of $ 745,000 was recognised for the ye ar ended 31 March 2013 to write down the cost of investment to the recoverableamounts, determined using the value in use basis.
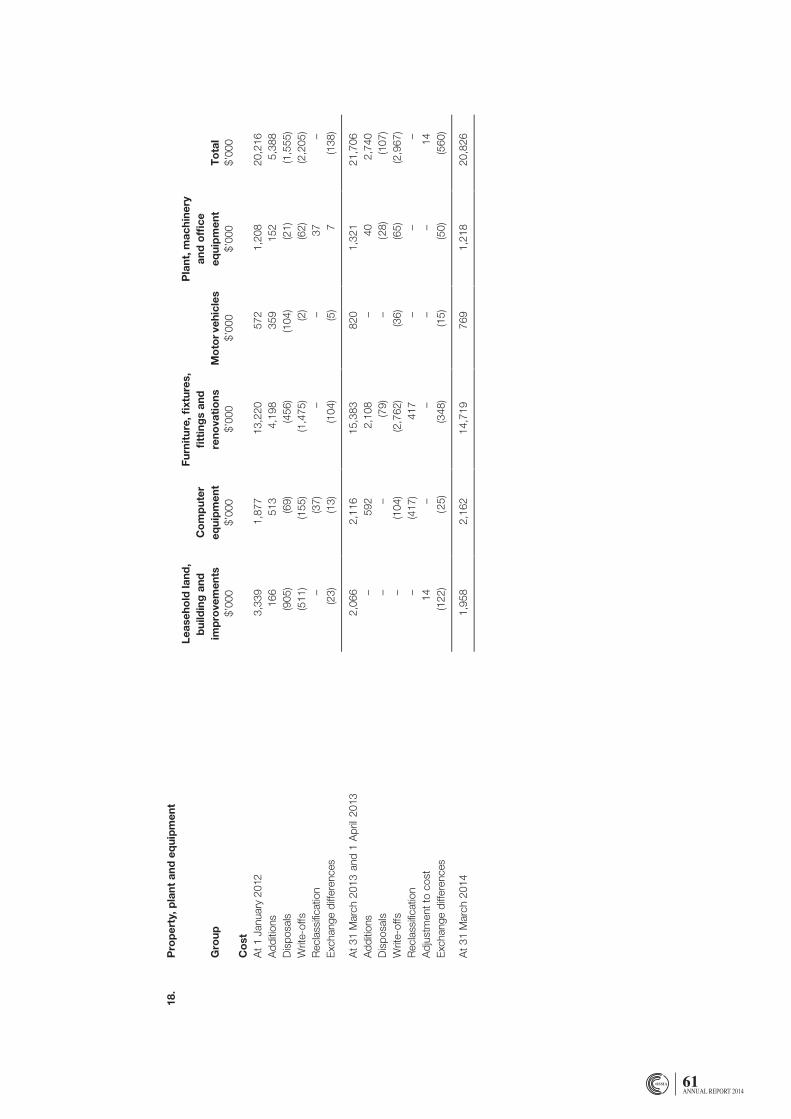
61ANNUAL REPORT 2014
Oss
ia In
tern
atio
nal L
imit
ed a
nd it
s S
ubsi
dia
ries
No
tes
to t
he F
inan
cial
Sta
tem
ents
–31
Mar
ch 2
014
-48
-
18.
Pro
per
ty, p
lant
and
eq
uip
men
t
Gro
up
Leas
eho
ld la
nd,
bui
ldin
g a
ndim
pro
vem
ents
Co
mp
uter
equi
pm
ent
Furn
itur
e, fi
xtur
es,
fitt
ing
s an
dre
nova
tio
nsM
oto
rveh
icle
s
Pla
nt, m
achi
nery
and
offi
ceeq
uip
men
tT
ota
l$’
000
$’00
0$’
000
$’00
0$’
000
$’00
0C
ost
At 1
Jan
uary
201
23,
339
1,87
713
,220
572
1,20
820
,216
Add
ition
s16
651
34,
198
359
152
5,38
8D
ispo
sals
(905
)(6
9)(4
56)
(104
)(2
1)(1
,555
)W
rite-
offs
(511
)(1
55)
(1,4
75)
(2)
(62)
(2,2
05)
Rec
lass
ifica
tion
–(3
7)–
–37
–E
xcha
nge
diffe
renc
es(2
3)(1
3)(1
04)
(5)
7(1
38)
At 3
1 M
arch
201
3an
d 1
Apr
il20
132,
066
2,11
615
,383
820
1,32
121
,706
Add
ition
s–
592
2,10
8–
402,
740
Dis
posa
ls–
–(7
9)–
(28)
(107
)W
rite-
offs
–(1
04)
(2,7
62)
(36)
(65)
(2,9
67)
Rec
lass
ifica
tion
–(4
17)
417
––
–A
djus
tmen
t to
cost
14–
––
–14
Exc
hang
e di
ffere
nces
(122
)(2
5)(3
48)
(15)
(50)
(560
)
At 3
1 M
arch
201
41,
958
2,16
214
,719
769
1,21
820
,826
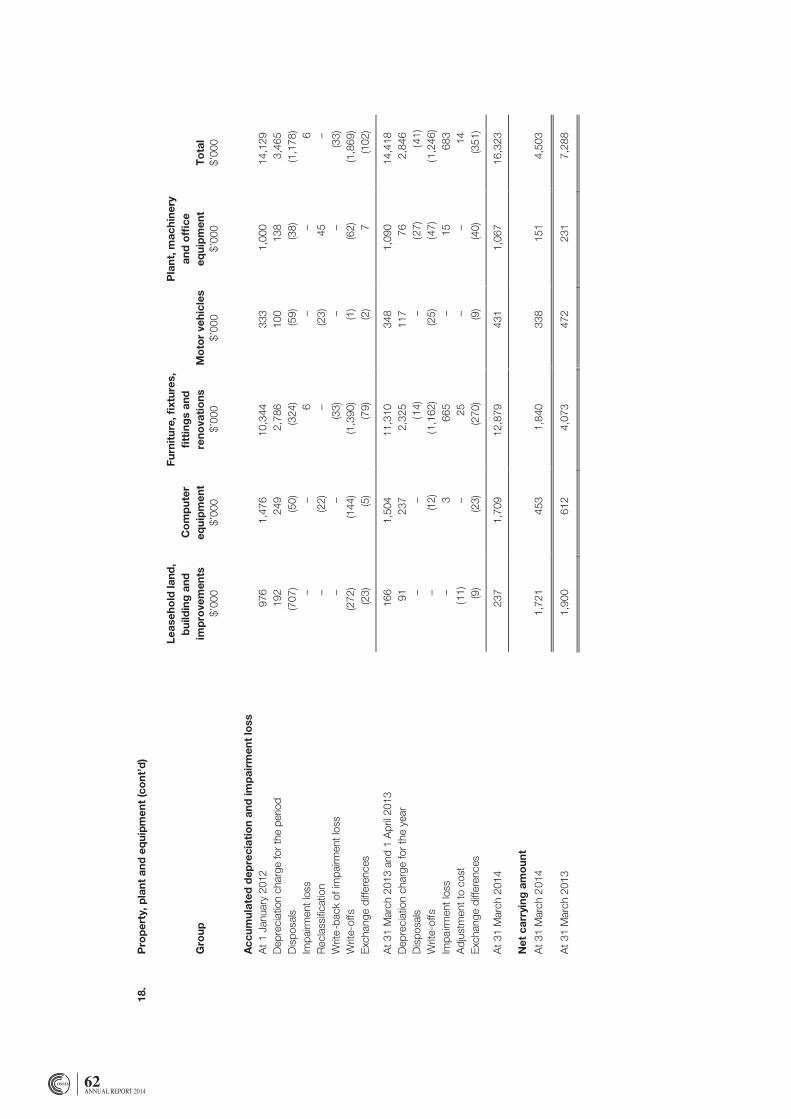
62ANNUAL REPORT 2014
Oss
ia In
tern
atio
nal L
imit
ed a
nd it
s S
ubsi
dia
ries
No
tes
to t
he F
inan
cial
Sta
tem
ents
–31
Mar
ch 2
014
-49
-
18.
Pro
per
ty, p
lant
and
eq
uip
men
t(c
ont
’d)
Gro
up
Leas
eho
ld la
nd,
bui
ldin
g a
ndim
pro
vem
ents
Co
mp
uter
equi
pm
ent
Furn
itur
e, fi
xtur
es,
fitt
ing
s an
dre
nova
tio
nsM
oto
r ve
hicl
es
Pla
nt,m
achi
nery
and
offi
ceeq
uip
men
tT
ota
l$’
000
$’00
0$’
000
$’00
0$’
000
$’00
0
Acc
umul
ated
dep
reci
atio
n an
d im
pai
rmen
t lo
ssA
t 1 J
anua
ry 2
012
976
1,47
610
,344
333
1,00
014
,129
Dep
reci
atio
n ch
arge
for t
hepe
riod
192
249
2,78
610
013
83,
465
Dis
posa
ls(7
07)
(50)
(324
)(5
9)(3
8)(1
,178
)Im
pairm
ent l
oss
––
6–
–6
Rec
lass
ifica
tion
–(2
2)–
(23)
45–
Writ
e-b
ack
of im
pairm
ent l
oss
––
(33)
––
(33)
Writ
e-of
fs(2
72)
(144
)(1
,390
)(1
)(6
2)(1
,869
)E
xcha
nge
diffe
renc
es(2
3)(5
)(7
9)(2
)7
(102
)
At 3
1M
arch
201
3 an
d 1
Apr
il 20
1316
61,
504
11,3
1034
81,
090
14,4
18D
epre
ciat
ion
char
ge fo
r the
yea
r91
237
2,32
511
776
2,84
6D
ispo
sals
––
(14)
–(2
7)(4
1)W
rite-
offs
–(1
2)(1
,162
)(2
5)(4
7)(1
,246
)Im
pairm
ent l
oss
–3
665
–15
683
Adj
ustm
ent t
o co
st(1
1)–
25–
–14
Exc
hang
e di
ffere
nces
(9)
(23)
(270
)(9
)(4
0)(3
51)
At 3
1 M
arch
201
423
71,
709
12,8
7943
11,
067
16,3
23
Net
car
ryin
g a
mo
unt
At 3
1 M
arch
201
41,
721
453
1,84
033
815
14,
503
At 3
1 M
arch
201
31,
900
612
4,07
347
223
17,
288
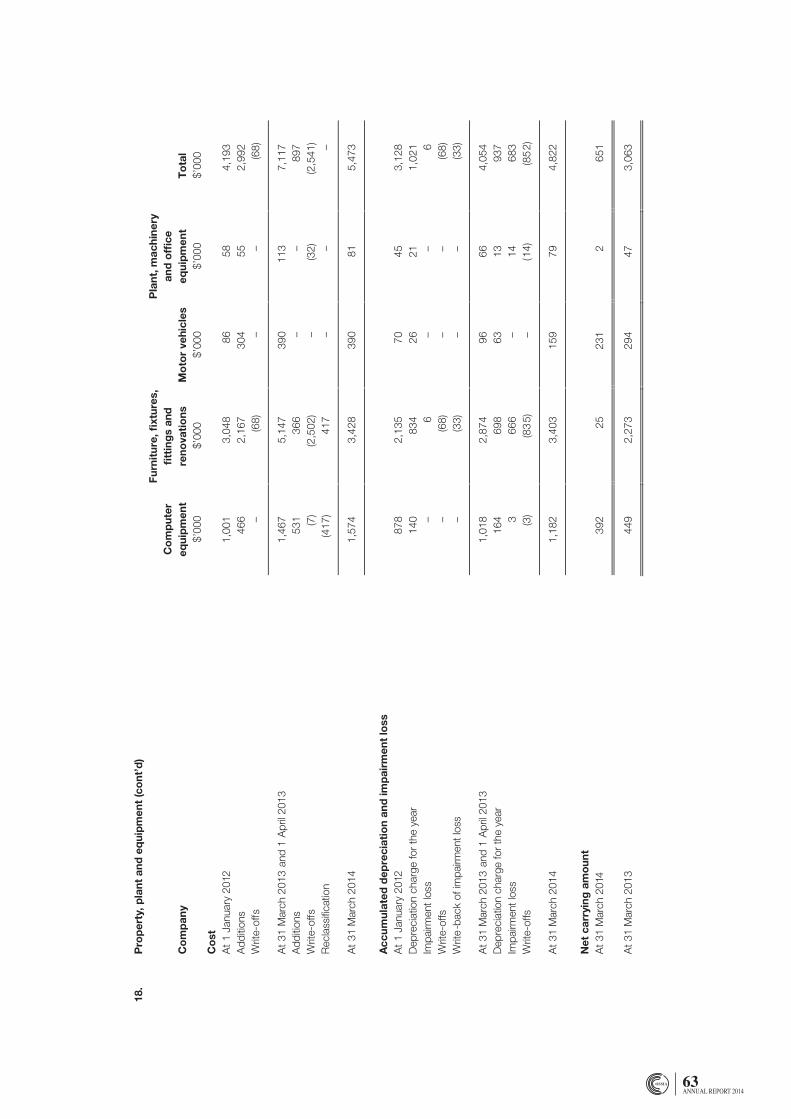
63ANNUAL REPORT 2014
Oss
ia In
tern
atio
nal L
imit
ed a
nd it
s S
ubsi
dia
ries
No
tes
to t
he F
inan
cial
Sta
tem
ents
–31
Mar
ch 2
014
-50
-
18.
Pro
per
ty, p
lant
and
eq
uip
men
t (c
ont
’d)
Co
mp
any
Co
mp
uter
equi
pm
ent
Furn
itur
e, fi
xtur
es,
fitt
ing
s an
dre
nova
tio
nsM
oto
r ve
hicl
es
Pla
nt, m
achi
ner
yan
d o
ffice
equi
pm
ent
To
tal
$’00
0$’
000
$’00
0$’
000
$’00
0C
ost
At 1
Jan
uary
201
21,
001
3,04
886
584,
193
Add
ition
s46
62,
167
304
552,
992
Writ
e-of
fs–
(68)
––
(68)
At 3
1M
arch
201
3an
d 1
Apr
il 20
131,
467
5,14
739
011
37,
117
Add
ition
s53
136
6–
–89
7W
rite-
offs
(7)
(2,5
02)
–(3
2)(2
,541
)R
ecla
ssifi
catio
n(4
17)
417
––
–
At
31 M
arch
201
41,
574
3,42
839
081
5,47
3
Acc
umul
ated
dep
reci
atio
n an
d im
pai
rmen
t lo
ssA
t 1 J
anua
ry 2
012
878
2,13
570
453,
128
Dep
reci
atio
n ch
arge
for t
he y
ear
140
834
2621
1,02
1Im
pairm
ent l
oss
–6
––
6W
rite-
offs
–(6
8)–
–(6
8)W
rite
-bac
k of
impa
irmen
t los
s–
(33)
––
(33)
At 3
1 M
arch
201
3an
d 1
Apr
il 20
131,
018
2,87
496
664,
054
Dep
reci
atio
n ch
arge
for t
he y
ear
164
698
6313
937
Impa
irmen
t los
s3
666
–14
683
Writ
e-of
fs(3
)(8
35)
–(1
4)(8
52)
At 3
1 M
arch
201
41,
182
3,40
315
979
4,82
2
Net
car
ryin
g a
mo
unt
At 3
1 M
arch
201
439
225
231
265
1
At 3
1 M
arch
201
344
92,
273
294
473,
063
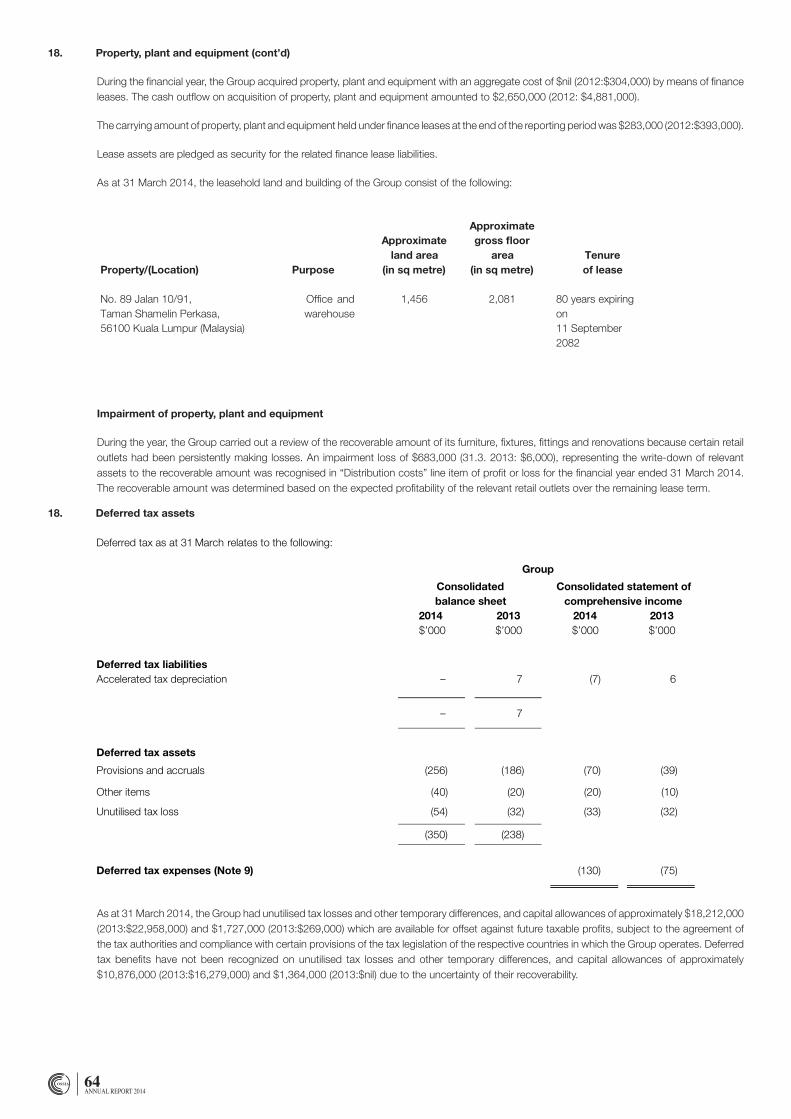
64ANNUAL REPORT 2014
18. Property, plant and equipment (cont’d)
During the financial year, the Group acquired property, plant and equipment with an aggregate cost of $nil (2012:$304,000) by means of finance leases. The cash outflow on acquisition of property, plant and equipment amounted to $2,650,000 (2012: $4,881,000).
The carrying amount of property, plant and equipment held under finance leases at the end of the reporting period was $283,000 (2012:$393,000).
Lease assets are pledged as security for the related finance lease liabilities.
As at 31 March 2014, the leasehold land and building of the Group consist of the following:
Impairment of property, plant and equipment
During the year, the Group carried out a review of the recoverable amount of its furniture, fixtures, fittings and renovations because certain retail outlets had been persistently making losses. An impairment loss of $683,000 (31.3. 2013: $6,000), representing the write-down of relevant assets to the recoverable amount was recognised in “Distribution costs” line item of profit or loss for the financial year ended 31 March 2014. The recoverable amount was determined based on the expected profitability of the relevant retail outlets over the remaining lease term.
18. Deferred tax assets
Deferred tax as at 31 March relates to the following:
As at 31 March 2014, the Group had unutilised tax losses and other temporary differences, and capital allowances of approximately $18,212,000 (2013:$22,958,000) and $1,727,000 (2013:$269,000) which are available for offset against future taxable profits, subject to the agreement of the tax authorities and compliance with certain provisions of the tax legislation of the respective countries in which the Group operates. Deferred tax benefits have not been recognized on unutilised tax losses and other temporary differences, and capital allowances of approximately $10,876,000 (2013:$16,279,000) and $1,364,000 (2013:$nil) due to the uncertainty of their recoverability.
Ossia International Limited and its Subsidiaries
Notes to the Financial Statements – 31 March 2014
- 50 -
18. Property, plant and equipment (cont’d)
Additions to property, plant and equipment of the Group for the financial year includes $______ (2013: $304,000)acquired under finance leases and $203,000 for which payments have y et to be settled as at 31 March 2014.
As at 31 March 2014, the Group ha s property, plant and equipment with a total ne t carrying amount of $283,000(2013: $393,000) which were acquired under finance lease .
Lease assets are pledged a s security for the related finance lease liabilities.
As at 31 March 2014, the leasehold land and building of the Group consist of the following:
Property/(Location) Purpose
Approximateland area
(in sq metre)
Approximategross floor
area(in sq metre)
Tenureof lease
No. 89 Jalan 10/91,Taman Shamelin Perkasa,56100 Kuala Lumpur (Malaysia)
Office andwarehouse
1,456 2,081 80 years expiringon11 September2082
Impairment of assets
During the current financial year, the Group recorded an impairment loss of $_____ (2013: $6,000), representingthe write-down of relevant assets to the recoverable amount , in “Distribution cost s” line item of profit or loss for thefinancial year ended 31 March 2013. The recoverable amount was determined based on the expected profitabilityof the relevant retail outlets over the remaining lease term.
Ossia International Limited and its Subsidiaries
Notes to the Financial Statements – 31 March 2014
- 52 -
19. Deferred tax assets
Deferred tax as at 31 March relates to the following:
Group
Consolidatedbalance sheet
Consolidated statement ofcomprehensive income
2014 2013 2014 2013$’000 $’000 $’000 $’000
Deferred tax liabilitiesAccelerated tax depreciation – 7 (7) 6
7
Deferred tax assets
Provisions and accruals (256) (186) (70) (39)
Other items (40) (20) (20) (10)
Unutilised tax loss (54) (32) (33) (32)
(350) (238)
Deferred tax expenses (Note 9) (130) (75)
A deferred tax l iability of approximately $Nil (2013: $Nil ) that could arise upo n the distribution of profits of a subsidiary compan y has not beenprovided for as at 31 March 2014 as the distribution of the profits is controlled and there is currently no intention for the profits to be remitted intoSingapore.
–
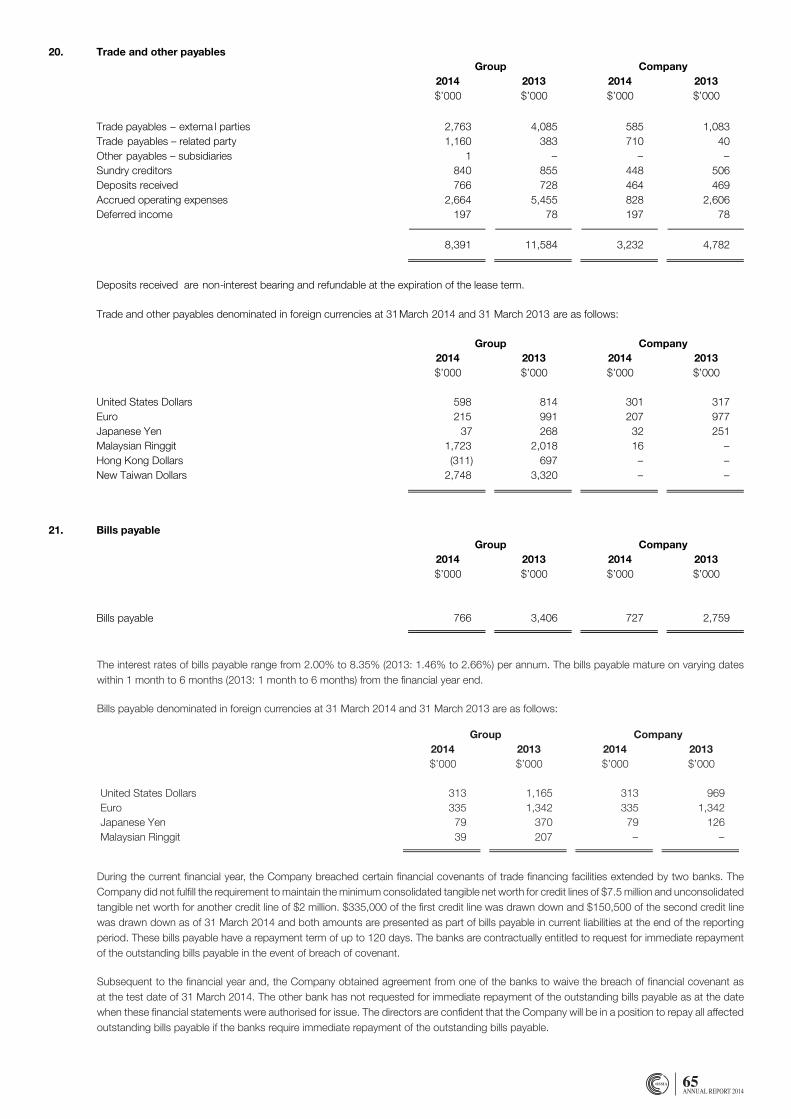
65ANNUAL REPORT 2014
Ossia International Limited and its Subsidiaries
Notes to the Financial Statements – 31 March 2014
- 53 -
20. Trade and other payablesGroup Company
2014 2013 2014 2013$’000 $’000 $’000 $’000
Trade payables – externa l parties 2,763 4,085 585 1,083Trade payables – related party 1,160 383 710 40Other payables – subsidiaries 1 – – –Sundry creditors 840 855 448 506Deposits received 766 728 464 469Accrued operating expenses 2,664 5,455 828 2,606Deferred income 197 78 197 78
8,391 11,584 3,232 4,782
Deposits received are non-interest bearing and refundable at the expiration of the lease term.
Trade and other payables denominated in foreign currencies at 31March 2014 and 31 March 2013 are as follows:
Group Company2014 2013 2014 2013$’000 $’000 $’000 $’000
United States Dollars 598 814 301 317Euro 215 991 207 977Japanese Yen 37 268 32 251Malaysian Ringgit 1,723 2,018 16 –Hong Kong Dollars (311) 697 – –New Taiwan Dollars 2,748 3,320 – –
21. Bills payableGroup Company
2014 2013 2014 2013$’000 $’000 $’000 $’000
Bills payable- secured 766 3,406 727 2,759
The interest rate s of bills payable range from 2.00% to 8.35% (2013: 1.46% to 2.66%) per annum . The bills payable mature on varying dateswithin 1 month to 6 months (2013: 1 month to 6 months) from financial year end.
During the current financial year, the Company breached certain financial covenants of trade financing facilities extended by two banks. The Company did not fulfill the requirement to maintain the minimum consolidated tangible net worth for credit lines of $7.5 million and unconsolidated tangible net worth for another credit line of $2 million. $335,000 of the first credit line was drawn down and $150,500 of the second credit line was drawn down as of 31 March 2014 and both amounts are presented as part of bills payable in current liabilities at the end of the reporting period. These bills payable have a repayment term of up to 120 days. The banks are contractually entitled to request for immediate repayment of the outstanding bills payable in the event of breach of covenant.
Subsequent to the financial year and, the Company obtained agreement from one of the banks to waive the breach of financial covenant as at the test date of 31 March 2014. The other bank has not requested for immediate repayment of the outstanding bills payable as at the date when these financial statements were authorised for issue. The directors are confident that the Company will be in a position to repay all affected outstanding bills payable if the banks require immediate repayment of the outstanding bills payable.
The interest rates of bills payable range from 2.00% to 8.35% (2013: 1.46% to 2.66%) per annum. The bills payable mature on varying dates within 1 month to 6 months (2013: 1 month to 6 months) from the financial year end.
Bills payable denominated in foreign currencies at 31 March 2014 and 31 March 2013 are as follows:
Ossia International Limited and its Subsidiaries
Notes to the Financial Statements – 31 March 2014
- 54 -
21. Bills payable (cont’d)
Bills payable denominated in foreign curren cies at 31 March 2014 and 31 March 2013 are as follows:
Group Company2014 2013 2014 2013$’000 $’000 $’000 $’000
United States Dollars 313 1,165 313 969Euro 335 1,342 335 1,342Japanese Yen 79 370 79 126Malaysian Ringgit 39 207 – –
During the current financial year, the Company has breached certain financial covenants of the banking facilities (Note 2 1) extended by twobanks. The Company did not meet the required minimum consolidated tangible networth and minimum tangible networth. Subsequent to year -end, representations of indulgences were given by the two banks to the Company that they will not declare an event of default under thebanking facilities e xtended to the Company, notwithstanding the breach in relation to the compliance with these covenants.
22. BorrowingsGroup Company
Maturity 2014 2013 2014 2013$’000 $’000 $’000 $’000
Current
Bank overdrafts (Note 15) On demand 1,398 1,490 1,224 1,469Bank loans- secured
2,512 – – –
Finance lease liabilities(Note 26(b)) 2013 68 89 50 54
3,978 1,579 1,274 1,523
Non-current
Bank loans2014 –2017 2,610 –
– –
Finance lease liabilities(Note 26(b))
2014 –2017 127 198 112 162
2,737 198 112 162
On demand
Ossia International Limited and its Subsidiaries
Notes to the Financial Statements – 31 March 2014
- 53 -
20. Trade and other payablesGroup Company
2014 2013 2014 2013$’000 $’000 $’000 $’000
Trade payables – externa l parties 2,763 4,085 585 1,083Trade payables – related party 1,160 383 710 40Other payables – subsidiaries 1 – – –Sundry creditors 840 855 448 506Deposits received 766 728 464 469Accrued operating expenses 2,664 5,455 828 2,606Deferred income 197 78 197 78
8,391 11,584 3,232 4,782
Deposits received are non-interest bearing and refundable at the expiration of the lease term.
Trade and other payables denominated in foreign currencies at 31March 2014 and 31 March 2013 are as follows:
Group Company2014 2013 2014 2013$’000 $’000 $’000 $’000
United States Dollars 598 814 301 317Euro 215 991 207 977Japanese Yen 37 268 32 251Malaysian Ringgit 1,723 2,018 16 –Hong Kong Dollars (311) 697 – –New Taiwan Dollars 2,748 3,320 – –
21. Bills payableGroup Company
2014 2013 2014 2013$’000 $’000 $’000 $’000
Bills payable- secured 766 3,406 727 2,759
The interest rate s of bills payable range from 2.00% to 8.35% (2013: 1.46% to 2.66%) per annum . The bills payable mature on varying dateswithin 1 month to 6 months (2013: 1 month to 6 months) from financial year end.
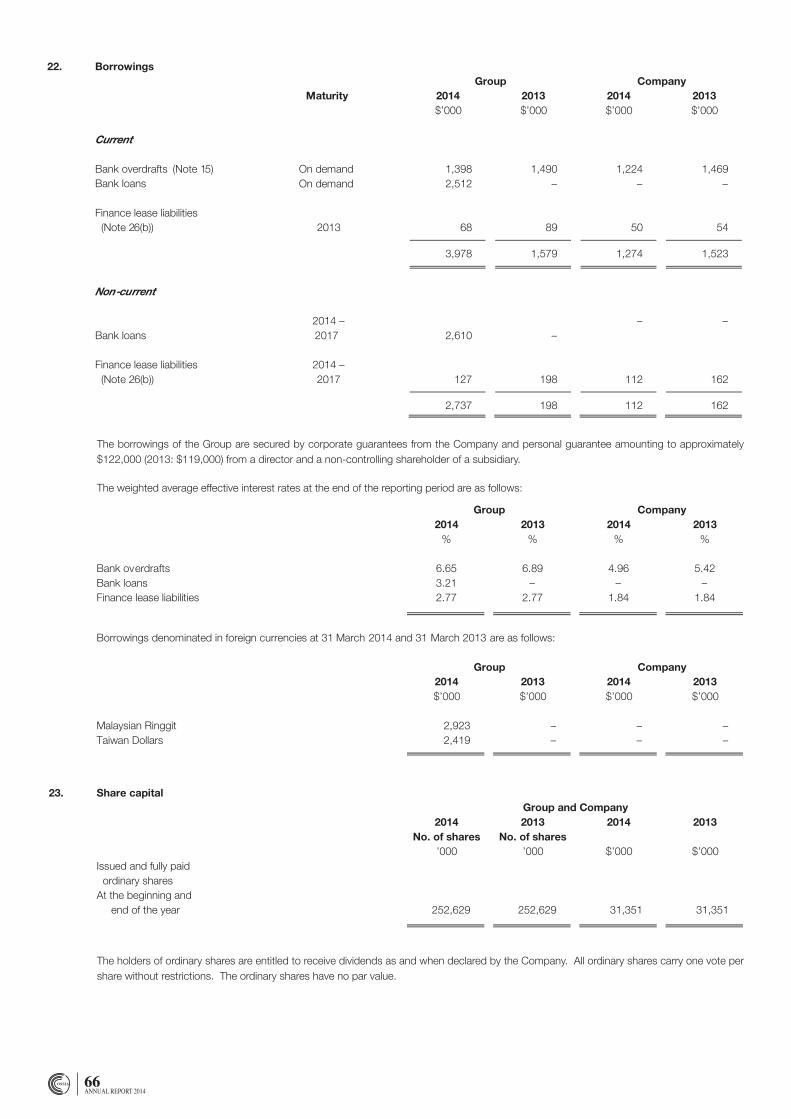
66ANNUAL REPORT 2014
The borrowings of the Group are secured by corporate guarantees from the Company and personal guarantee amounting to approximately $122,000 (2013: $119,000) from a director and a non-controlling shareholder of a subsidiary.
The weighted average effective interest rates at the end of the reporting period are as follows:
The holders of ordinary shares are entitled to receive dividends as and when declared by the Company. All ordinary shares carry one vote per share without restrictions. The ordinary shares have no par value.
Ossia International Limited and its Subsidiaries
Notes to the Financial Statements – 31 March 2014
- 54 -
21. Bills payable (cont’d)
Bills payable denominated in foreign curren cies at 31 March 2014 and 31 March 2013 are as follows:
Group Company2014 2013 2014 2013$’000 $’000 $’000 $’000
United States Dollars 313 1,165 313 969Euro 335 1,342 335 1,342Japanese Yen 79 370 79 126Malaysian Ringgit 39 207 – –
During the current financial year, the Company has breached certain financial covenants of the banking facilities (Note 2 1) extended by twobanks. The Company did not meet the required minimum consolidated tangible networth and minimum tangible networth. Subsequent to year -end, representations of indulgences were given by the two banks to the Company that they will not declare an event of default under thebanking facilities e xtended to the Company, notwithstanding the breach in relation to the compliance with these covenants.
22. BorrowingsGroup Company
Maturity 2014 2013 2014 2013$’000 $’000 $’000 $’000
Current
Bank overdrafts (Note 15) On demand 1,398 1,490 1,224 1,469Bank loans- secured
2,512 – – –
Finance lease liabilities(Note 26(b)) 2013 68 89 50 54
3,978 1,579 1,274 1,523
Non-current
Bank loans2014 –2017 2,610 –
– –
Finance lease liabilities(Note 26(b))
2014 –2017 127 198 112 162
2,737 198 112 162
On demand
Ossia International Limited and its Subsidiaries
Notes to the Financial Statements – 31 March 2014
- 55 -
22. Borrowings (cont’d)
The borrowings of the Group are secured by c orporate guarantees from the Company and personal guarantee amounting to approximately$122,000 (2013: $119,000) from a director and a non -controlling shareholder of a subsidiary.
The weighted average effective interest rates at the end of the reporting period are as follows:
Group Company2014 2013 2014 2013
% % % %
Bank overdrafts 6.65 6.89 4.96 5.42Bank loans 3.21 – – –Finance lease liabilities 2.77 2.77 1.84 1.84
Borrowings denominated in foreign currencies at 31 March 2014 and 31 March 2013 are as follows:
Group Company2014 2013 2014 2013$’000 $’000 $’000 $’000
Malaysian Ringgit 2,923 – – –Taiwan Dollars 2,419 – – –
23. Share capitalGroup and Company
2014 2013 2014 2013No. of shares No. of shares
’000 ’000 $’000 $’000Issued and fully paid
ordinary sharesAt the beginning and
end of the year 252,629 252,629 31,351 31,351
The holders of ordinary shares are entitled to receive dividends as and when declared by the Company . All ordinary shares carry one vote pershare without restrictions. The ordinary shares have no par value.
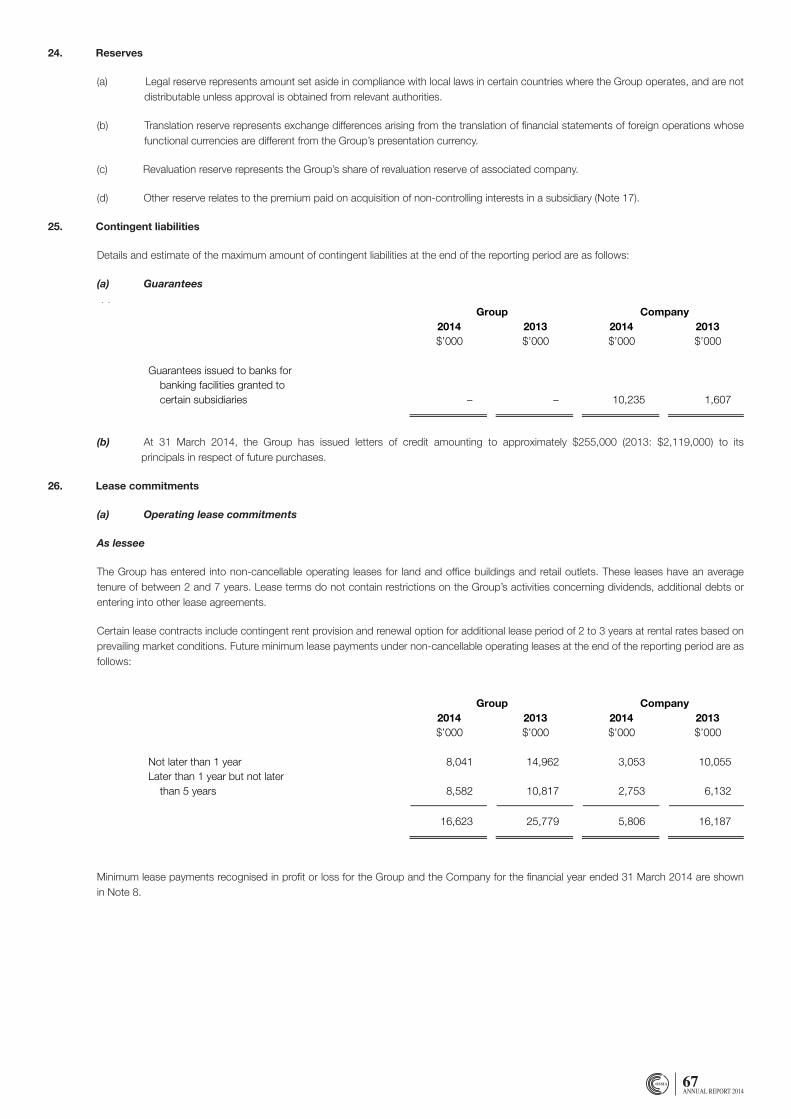
67ANNUAL REPORT 2014
Ossia International Limited and its Subsidiaries
Notes to the Financial Statements – 31 March 2014
- 56 -
24. Contingent liabilities
Details and estimate of the maximum amount of contingent liabilities at the end of the reporting period are as fo llows:
(a) GuaranteesGroup Company
2014 2013 2014 2013$’000 $’000 $’000 $’000
Guarantees issued to banks forbanking facilities granted tocertain subsidiaries – – 10,235 1,607
(b) At 31 March 2014, the Group has issued letters of credit amounting to approximately $255,000 (2013: $2,119,000) to its principals inrespect of for future purchases.
25. Lease commitments
(a) Operating lease commitments
As lessee
The Group has entered into non -cancellable operating lea ses for land and office buildings and retail outlets . These leases have anaverage tenure of between 2 and 7 years. Lease terms do not contain restrictions on the Group’s activities concerning dividends,additional debts or entering into other lease agreem ents.
Certain lease contracts include contingent rent provision and renewal option for additional lease period of 2 to 3 years at r ental ratesbased on prevailing market conditions . Future minimum lease payments under non -cancellable operating leases at the end of thereporting period are as follows:
Group Company2014 2013 2014 2013$’000 $’000 $’000 $’000
Not later than 1 year 8,041 14,962 3,053 10,055Later than 1 year but not later
than 5 years 8,582 10,817 2,753 6,132
16,623 25,779 5,806 16,187
Minimum lease payments recognised in profit or loss for the Group and the Company for the financial year ended 31 March 2014 areshown in Note 8.
24. Reserves
(a) Legal reserve represents amount set aside in compliance with local laws in certain countries where the Group operates, and are not distributable unless approval is obtained from relevant authorities.
(b) Translation reserve represents exchange differences arising from the translation of financial statements of foreign operations whose functional currencies are different from the Group’s presentation currency.
(c) Revaluation reserve represents the Group’s share of revaluation reserve of associated company.
(d) Other reserve relates to the premium paid on acquisition of non-controlling interests in a subsidiary (Note 17).
25. Contingent liabilities
Details and estimate of the maximum amount of contingent liabilities at the end of the reporting period are as follows:
(a) Guarantees
(b) At 31 March 2014, the Group has issued letters of credit amounting to approximately $255,000 (2013: $2,119,000) to its principals in respect of future purchases.
26. Lease commitments
(a) Operating lease commitments
As lessee
The Group has entered into non-cancellable operating leases for land and office buildings and retail outlets. These leases have an average tenure of between 2 and 7 years. Lease terms do not contain restrictions on the Group’s activities concerning dividends, additional debts or entering into other lease agreements.
Certain lease contracts include contingent rent provision and renewal option for additional lease period of 2 to 3 years at rental rates based on prevailing market conditions. Future minimum lease payments under non-cancellable operating leases at the end of the reporting period are as follows:
Minimum lease payments recognised in profit or loss for the Group and the Company for the financial year ended 31 March 2014 are shown in Note 8.
Ossia International Limited and its Subsidiaries
Notes to the Financial Statements – 31 March 2014
- 56 -
24. Contingent liabilities
Details and estimate of the maximum amount of contingent liabilities at the end of the reporting period are as fo llows:
(a) GuaranteesGroup Company
2014 2013 2014 2013$’000 $’000 $’000 $’000
Guarantees issued to banks forbanking facilities granted tocertain subsidiaries – – 10,235 1,607
(b) At 31 March 2014, the Group has issued letters of credit amounting to approximately $255,000 (2013: $2,119,000) to its principals inrespect of for future purchases.
25. Lease commitments
(a) Operating lease commitments
As lessee
The Group has entered into non -cancellable operating lea ses for land and office buildings and retail outlets . These leases have anaverage tenure of between 2 and 7 years. Lease terms do not contain restrictions on the Group’s activities concerning dividends,additional debts or entering into other lease agreem ents.
Certain lease contracts include contingent rent provision and renewal option for additional lease period of 2 to 3 years at r ental ratesbased on prevailing market conditions . Future minimum lease payments under non -cancellable operating leases at the end of thereporting period are as follows:
Group Company2014 2013 2014 2013$’000 $’000 $’000 $’000
Not later than 1 year 8,041 14,962 3,053 10,055Later than 1 year but not later
than 5 years 8,582 10,817 2,753 6,132
16,623 25,779 5,806 16,187
Minimum lease payments recognised in profit or loss for the Group and the Company for the financial year ended 31 March 2014 areshown in Note 8.
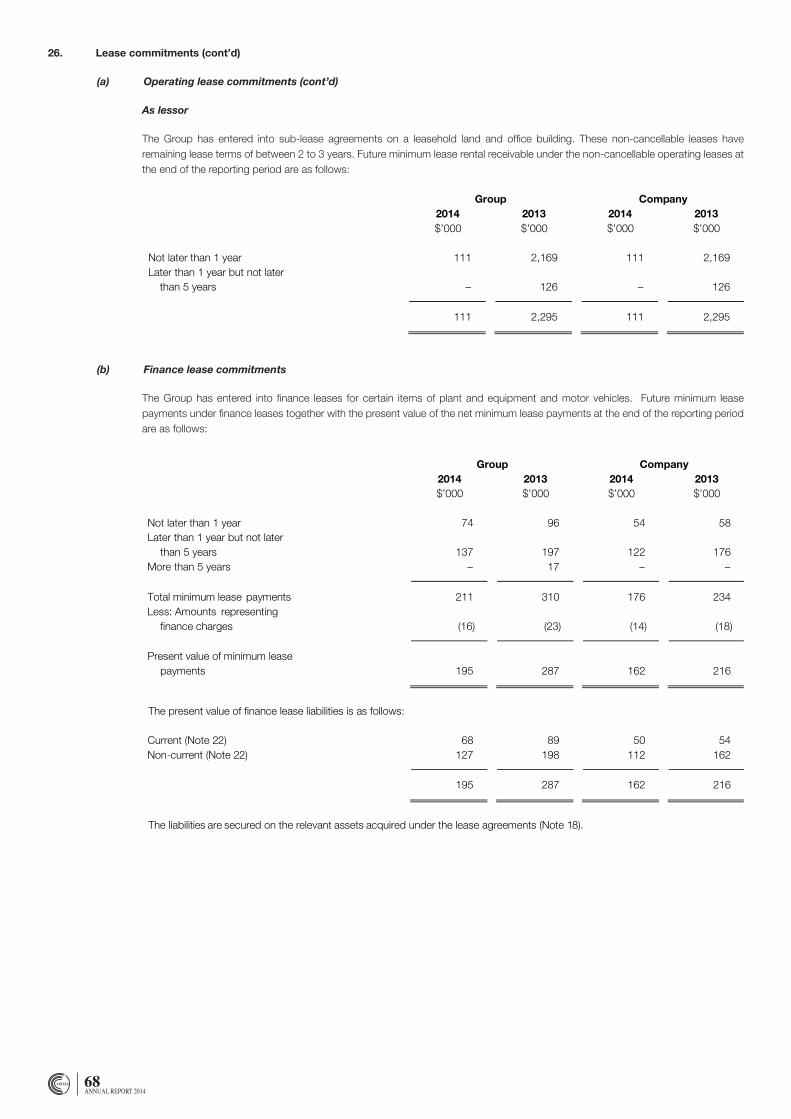
68ANNUAL REPORT 2014
Ossia International Limited and its Subsidiaries
Notes to the Financial Statements – 31 March 2014
- 56 -
25. Lease commitments (cont’d)
(a) Operating lease commitments (cont’d )
As lessor
The Group has entered into sub -lease agreem ents on a leased property. These non -cancellable leaseshave remaining lease terms of between 2 to 3 years . Future minimum lease rental receivable under thenon-cancellable operating leases at the end of the reporting period are as follows:
Group Company2014 2013 2014 2013$’000 $’000 $’000 $’000
Not later than 1 year 111 2,169 111 2,169Later than 1 year but not later
than 5 years – 126 – 126
111 2,295 111 2,295
(b) Finance lease commitment s
The Group has finance leases for certain items of plant and equipment and motor vehicles. Futureminimum lease payments under finance leases together with the present value of the net minimumlease payments at the end of the reporting period are as fol lows:
Group Company2014 2013 2014 2013$’000 $’000 $’000 $’000
Not later than 1 year 74 96 54 58Later than 1 year but not later
than 5 years 137 197 122 176More than 5 years – 17 – –
Total minimum lease payments 211 310 176 234Less: Amounts representing
finance charges (16) (23) (14) (18)
Present value of minimum leasepayments 195 287 162 216
The present value of finance lease liabilities is as follows:
Current (Note 22) 68 89 50 54Non-current (Note 22) 127 198 112 162
195 287 162 216
The liabilities are secured on the relevant assets acquired under the lease agreements (Note 18).
26. Lease commitments (cont’d)
(a) Operating lease commitments (cont’d)
As lessor
The Group has entered into sub-lease agreements on a leasehold land and office building. These non-cancellable leases have remaining lease terms of between 2 to 3 years. Future minimum lease rental receivable under the non-cancellable operating leases at the end of the reporting period are as follows:
(b) Finance lease commitments
The Group has entered into finance leases for certain items of plant and equipment and motor vehicles. Future minimum lease payments under finance leases together with the present value of the net minimum lease payments at the end of the reporting period are as follows:
Ossia International Limited and its Subsidiaries
Notes to the Financial Statements – 31 March 2014
- 56 -
25. Lease commitments (cont’d)
(a) Operating lease commitments (cont’d )
As lessor
The Group has entered into sub -lease agreem ents on a leased property. These non -cancellable leaseshave remaining lease terms of between 2 to 3 years . Future minimum lease rental receivable under thenon-cancellable operating leases at the end of the reporting period are as follows:
Group Company2014 2013 2014 2013$’000 $’000 $’000 $’000
Not later than 1 year 111 2,169 111 2,169Later than 1 year but not later
than 5 years – 126 – 126
111 2,295 111 2,295
(b) Finance lease commitment s
The Group has finance leases for certain items of plant and equipment and motor vehicles. Futureminimum lease payments under finance leases together with the present value of the net minimumlease payments at the end of the reporting period are as fol lows:
Group Company2014 2013 2014 2013$’000 $’000 $’000 $’000
Not later than 1 year 74 96 54 58Later than 1 year but not later
than 5 years 137 197 122 176More than 5 years – 17 – –
Total minimum lease payments 211 310 176 234Less: Amounts representing
finance charges (16) (23) (14) (18)
Present value of minimum leasepayments 195 287 162 216
The present value of finance lease liabilities is as follows:
Current (Note 22) 68 89 50 54Non-current (Note 22) 127 198 112 162
195 287 162 216
The liabilities are secured on the relevant assets acquired under the lease agreements (Note 18).
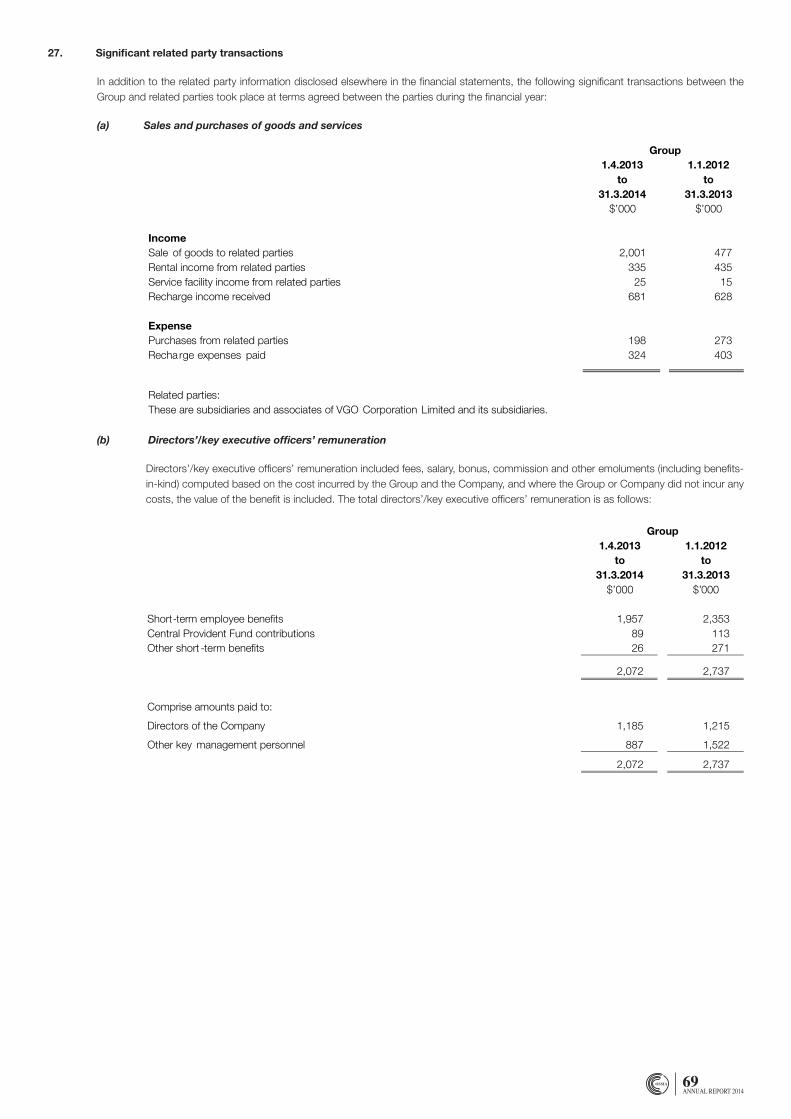
69ANNUAL REPORT 2014
Ossia International Limited and its Subsidiaries
Notes to the Financial Statements – 31 March 2014
- 58 -
26. Significant related party transactions
In addition to the related party information disclosed elsewhere in the financial statements, the following significant trans actions between theGroup and related parties took place at terms agreed between the parties during the financial year:
(a) Sales and purchases of goods and servicesGroup
1.4.2013to
31.3.2014
1.1.2012to
31.3.2013$’000 $’000
IncomeSale of goods to related parties 2,001 477Rental income from related parties 335 435Service facility income from related parties 25 15Recharge income received 681 628
ExpensePurchases from related parties 198 273Recharge expenses paid 324 403
Related parties:These are subsidiaries and associates of VGO Corporation Limited and its subsidiaries.
(b) Directors’/key executive officer s’ remuneration
Directors’/key executive officers’ remuneration included fees, salary, bonus, commission and other emoluments (including bene fits-in-kind) computed based on the cost incurred by the Group and the Company, and where the Group or Company di d not incur anycosts, the value of the benefit is included. The total directors’/key executive officers’ remuneration is as follows:
Group1.4.2013
to31.3.2014
1.1.2012to
31.3.2013$’000 $’000
Short-term employee benefits 1,957 2,353Central Provident Fund contributions 89 113Other short -term benefits 26 271
2,072 2,737
Comprise amounts paid to:
Directors of the Company 1,185 1,215
Other key management personnel 887 1,522
2,072 2,737
* Inclusive of Central Provident Fund contribution amountin g to $90,000 (2013: $49,000).
27. Significant related party transactions
In addition to the related party information disclosed elsewhere in the financial statements, the following significant transactions between the Group and related parties took place at terms agreed between the parties during the financial year:
(a) Sales and purchases of goods and services
(b) Directors’/key executive officers’ remuneration
Directors’/key executive officers’ remuneration included fees, salary, bonus, commission and other emoluments (including benefits-in-kind) computed based on the cost incurred by the Group and the Company, and where the Group or Company did not incur any costs, the value of the benefit is included. The total directors’/key executive officers’ remuneration is as follows:
Ossia International Limited and its Subsidiaries
Notes to the Financial Statements – 31 March 2014
- 58 -
26. Significant related party transactions
In addition to the related party information disclosed elsewhere in the financial statements, the following significant trans actions between theGroup and related parties took place at terms agreed between the parties during the financial year:
(a) Sales and purchases of goods and servicesGroup
1.4.2013to
31.3.2014
1.1.2012to
31.3.2013$’000 $’000
IncomeSale of goods to related parties 2,001 477Rental income from related parties 335 435Service facility income from related parties 25 15Recharge income received 681 628
ExpensePurchases from related parties 198 273Recharge expenses paid 324 403
Related parties:These are subsidiaries and associates of VGO Corporation Limited and its subsidiaries.
(b) Directors’/key executive officer s’ remuneration
Directors’/key executive officers’ remuneration included fees, salary, bonus, commission and other emoluments (including bene fits-in-kind) computed based on the cost incurred by the Group and the Company, and where the Group or Company di d not incur anycosts, the value of the benefit is included. The total directors’/key executive officers’ remuneration is as follows:
Group1.4.2013
to31.3.2014
1.1.2012to
31.3.2013$’000 $’000
Short-term employee benefits 1,957 2,353Central Provident Fund contributions 89 113Other short -term benefits 26 271
2,072 2,737
Comprise amounts paid to:
Directors of the Company 1,185 1,215
Other key management personnel 887 1,522
2,072 2,737
* Inclusive of Central Provident Fund contribution amountin g to $90,000 (2013: $49,000).
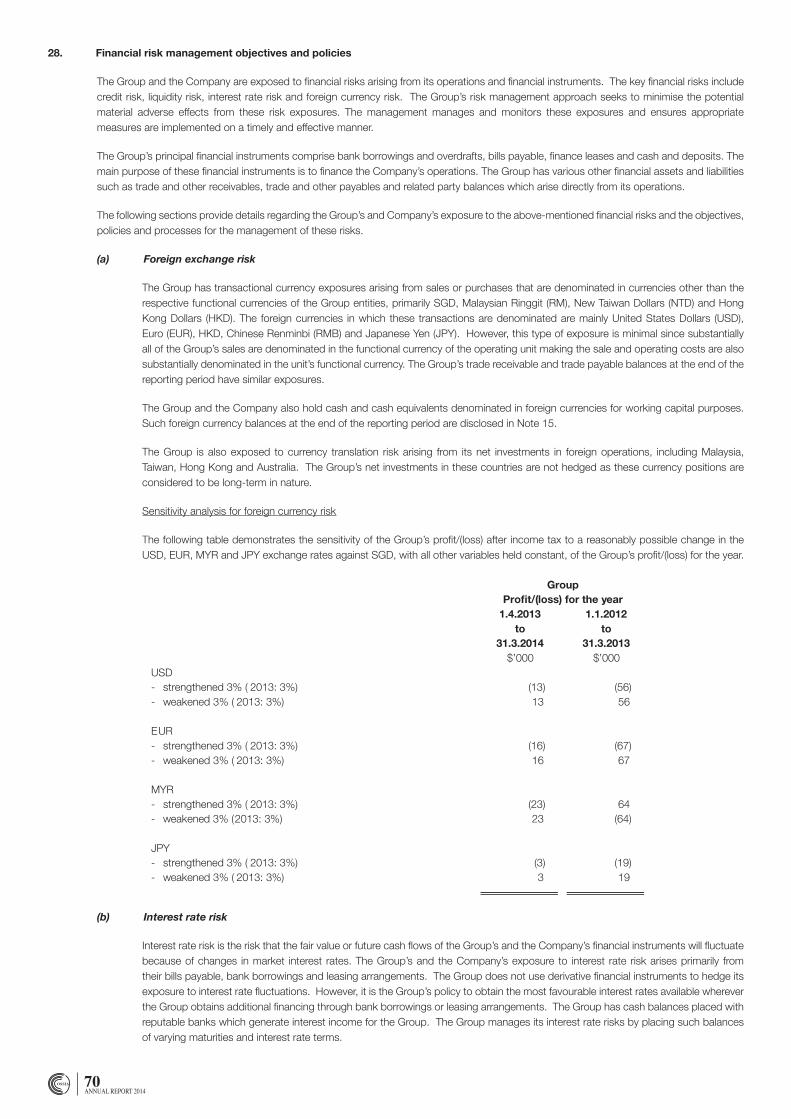
70ANNUAL REPORT 2014
28. Financial risk management objectives and policies
The Group and the Company are exposed to financial risks arising from its operations and financial instruments. The key financial risks include credit risk, liquidity risk, interest rate risk and foreign currency risk. The Group’s risk management approach seeks to minimise the potential material adverse effects from these risk exposures. The management manages and monitors these exposures and ensures appropriate measures are implemented on a timely and effective manner.
The Group’s principal financial instruments comprise bank borrowings and overdrafts, bills payable, finance leases and cash and deposits. The main purpose of these financial instruments is to finance the Company’s operations. The Group has various other financial assets and liabilities such as trade and other receivables, trade and other payables and related party balances which arise directly from its operations.
The following sections provide details regarding the Group’s and Company’s exposure to the above-mentioned financial risks and the objectives, policies and processes for the management of these risks.
(a) Foreign exchange risk
The Group has transactional currency exposures arising from sales or purchases that are denominated in currencies other than the respective functional currencies of the Group entities, primarily SGD, Malaysian Ringgit (RM), New Taiwan Dollars (NTD) and Hong Kong Dollars (HKD). The foreign currencies in which these transactions are denominated are mainly United States Dollars (USD), Euro (EUR), HKD, Chinese Renminbi (RMB) and Japanese Yen (JPY). However, this type of exposure is minimal since substantially all of the Group’s sales are denominated in the functional currency of the operating unit making the sale and operating costs are also substantially denominated in the unit’s functional currency. The Group’s trade receivable and trade payable balances at the end of the reporting period have similar exposures.
The Group and the Company also hold cash and cash equivalents denominated in foreign currencies for working capital purposes. Such foreign currency balances at the end of the reporting period are disclosed in Note 15.
The Group is also exposed to currency translation risk arising from its net investments in foreign operations, including Malaysia, Taiwan, Hong Kong and Australia. The Group’s net investments in these countries are not hedged as these currency positions are considered to be long-term in nature.
Sensitivity analysis for foreign currency risk
The following table demonstrates the sensitivity of the Group’s profit/(loss) after income tax to a reasonably possible change in the USD, EUR, MYR and JPY exchange rates against SGD, with all other variables held constant, of the Group’s profit/(loss) for the year.
(b) Interest rate risk
Interest rate risk is the risk that the fair value or future cash flows of the Group’s and the Company’s financial instruments will fluctuate because of changes in market interest rates. The Group’s and the Company’s exposure to interest rate risk arises primarily from their bills payable, bank borrowings and leasing arrangements. The Group does not use derivative financial instruments to hedge its exposure to interest rate fluctuations. However, it is the Group’s policy to obtain the most favourable interest rates available wherever the Group obtains additional financing through bank borrowings or leasing arrangements. The Group has cash balances placed with reputable banks which generate interest income for the Group. The Group manages its interest rate risks by placing such balances of varying maturities and interest rate terms.
Ossia International Limited and its Subsidiaries
Notes to the Financial Statements – 31 March 2014
- 60 -
27. Financial risk management objectives and policies (cont’d)
(a) Foreign exchange risk (cont’d)
Sensitivity analysis for foreign currency risk
The following table demonstrates the sensitivity of the Group’s profit/(loss) after i ncome tax to a reasonabl y possible change in theUSD, EUR, MYR and JPY exchange rate s against SGD, with all other variables held constant, of the Group’s profit /(loss) for the year .
GroupProfit/(loss) for the year
1.4.2013to
31.3.2014
1.1.2012to
31.3.2013$’000 $’000
USD- strengthened 3% ( 2013: 3%) (13) (56)- weakened 3% ( 2013: 3%) 13 56
EUR- strengthened 3% ( 2013: 3%) (16) (67)- weakened 3% ( 2013: 3%) 16 67
MYR- strengthened 3% ( 2013: 3%) (23) 64- weakene d 3% (2013: 3%) 23 (64)
JPY- strengthened 3% ( 2013: 3%) (3) (19)- weakened 3% ( 2013: 3%) 3 19
(b) Interest rate risk
Interest rate risk is the risk that the fair value or future cash flows of the Group’s and the Company’s financial instruments will fluctuatebecause of changes in market interest rates. The Group’s and the Company’s exposure to interest rate risk arises primarily fr om theirbills payable, bank borrowings and leasing arrangements. The Group does not use derivative fin ancial instruments to hedge itsexposure to interest rate fluctuations. However, it is the Group’s policy to obtain the most favourable interest rates avail able whereverthe Group obtains additional financing through bank borrowings or leasing arrangement s. The Group has cash balances placed withreputable banks which generate interest income for the Group. The Group manages its interest rate risks by placing such bala nces ofvarying maturities and interest rate terms.
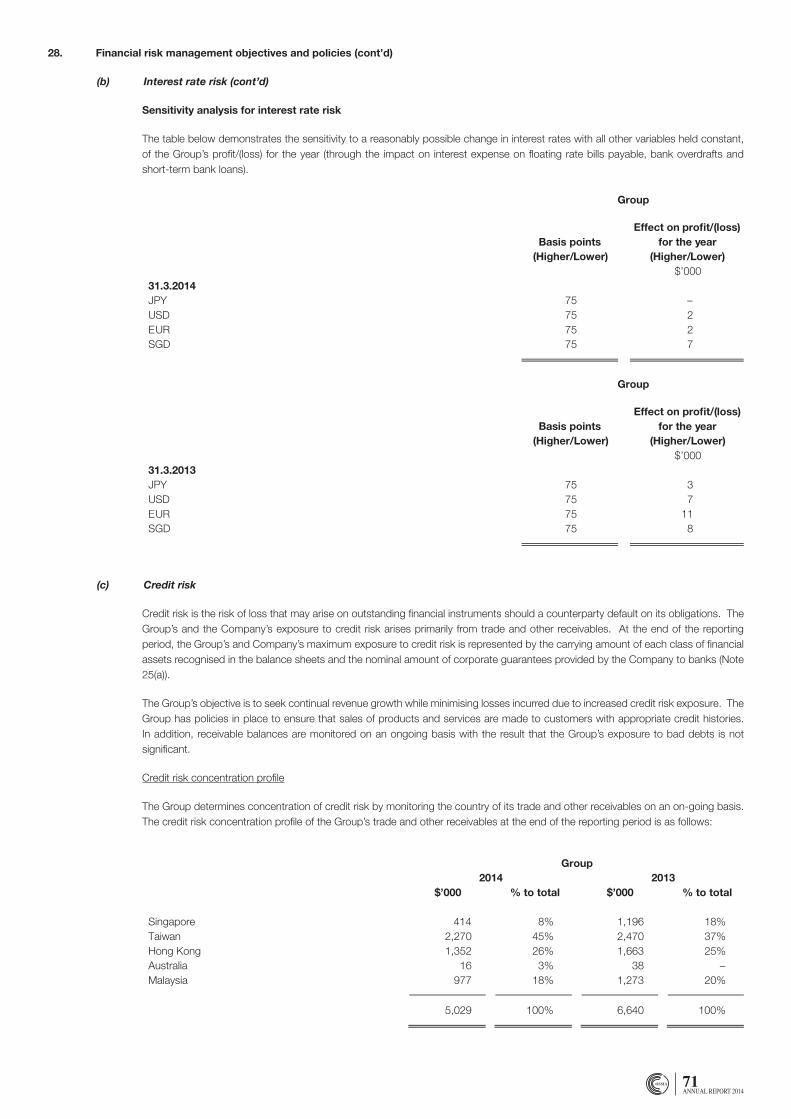
71ANNUAL REPORT 2014
28. Financial risk management objectives and policies (cont’d)
(b) Interest rate risk (cont’d)
Sensitivity analysis for interest rate risk
The table below demonstrates the sensitivity to a reasonably possible change in interest rates with all other variables held constant, of the Group’s profit/(loss) for the year (through the impact on interest expense on floating rate bills payable, bank overdrafts and short-term bank loans).
(c) Credit risk
Credit risk is the risk of loss that may arise on outstanding financial instruments should a counterparty default on its obligations. The Group’s and the Company’s exposure to credit risk arises primarily from trade and other receivables. At the end of the reporting period, the Group’s and Company’s maximum exposure to credit risk is represented by the carrying amount of each class of financial assets recognised in the balance sheets and the nominal amount of corporate guarantees provided by the Company to banks (Note 25(a)).
The Group’s objective is to seek continual revenue growth while minimising losses incurred due to increased credit risk exposure. The Group has policies in place to ensure that sales of products and services are made to customers with appropriate credit histories. In addition, receivable balances are monitored on an ongoing basis with the result that the Group’s exposure to bad debts is not significant.
Credit risk concentration profile
The Group determines concentration of credit risk by monitoring the country of its trade and other receivables on an on-going basis. The credit risk concentration profile of the Group’s trade and other receivables at the end of the reporting period is as follows:
Ossia International Limited and its Subsidiaries
Notes to the Financial Statements – 31 March 2014
- 61 -
27. Financial risk management objectives and policies (cont’d)
(b) Interest rate risk (cont’d)
Sensitivity analysis for interest rate risk
The table below demonstrates the sensitivity to a reasonably possible change in interest rates with all other variables held constant, ofthe Group’s profit/(loss) for the year (through the impact on interest expense on floating rate bills payable, bank overdrafts and short -term bank loans).
Group
Basis points(Higher/Lower)
Effect on profit/(loss)for the year
(Higher/Lower)$’000
31.3.2014JPY 75 –USD 75 2EUR 75 2SGD 75 7
Group
Basis points(Higher/Lower)
Effect on profit/(loss)for the year
(Higher/Lower)$’000
31.3.2013JPY 75 3USD 75 7EUR 75 11SGD 75 8
Ossia International Limited and its Subsidiaries
Notes to the Financial Statements – 31 March 2014
- 62 -
27. Financial risk management objectives and policies (cont’d)
(c) Credit risk
Credit risk is the risk of loss that may arise on outstanding financial instruments sho uld a default on its obligations. The Group’s andthe Company’s exposure to credit risk arises primarily from trade a nd other receivables. At the end of the reporting period , theGroup’s and Company’s maximum exposure to credit risk is represented by the carrying amount of each class of financial assetsrecognised in the balance sheet s and the nominal amount of corporate guarantees provided by the Company to banks (Note 2 5(a)) .
The Group’s objective is to seek continual revenue growth while minimising losses incurred due to increased credit risk expos ure. TheGroup has policies in place to ensure that sales of products and services are made to customers with appropriate credit histories. Inaddition, receivable balances are monitored on an ongoing basis with the result that the Group’s exposure to bad debts is not significant.
Credit risk concentration profile
The Gr oup determines concentration of credit risk by monitoring the country of its trade and other receivables on an on -going basis.The credit risk concentration profile of the Group’s trade and other receivables at the end of the reporting period is as follow s:
Group2014 2013
$’000 % to total $’000 % to total
Singapore 414 8% 1,196 18%Taiwan 2,270 45% 2,470 37%Hong Kong 1,352 26% 1,663 25%Australia 16 3% 38 –Malaysia 977 18% 1,273 20%
5,029 100% 6,640 100%
Ossia International Limited and its Subsidiaries
Notes to the Financial Statements – 31 March 2014
- 61 -
27. Financial risk management objectives and policies (cont’d)
(b) Interest rate risk (cont’d)
Sensitivity analysis for interest rate risk
The table below demonstrates the sensitivity to a reasonably possible change in interest rates with all other variables held constant, ofthe Group’s profit/(loss) for the year (through the impact on interest expense on floating rate bills payable, bank overdrafts and short -term bank loans).
Group
Basis points(Higher/Lower)
Effect on profit/(loss)for the year
(Higher/Lower)$’000
31.3.2014JPY 75 –USD 75 2EUR 75 2SGD 75 7
Group
Basis points(Higher/Lower)
Effect on profit/(loss)for the year
(Higher/Lower)$’000
31.3.2013JPY 75 3USD 75 7EUR 75 11SGD 75 8
Ossia International Limited and its Subsidiaries
Notes to the Financial Statements – 31 March 2014
- 62 -
27. Financial risk management objectives and policies (cont’d)
(c) Credit risk
Credit risk is the risk of loss that may arise on outstanding financial instruments sho uld a default on its obligations. The Group’s andthe Company’s exposure to credit risk arises primarily from trade a nd other receivables. At the end of the reporting period , theGroup’s and Company’s maximum exposure to credit risk is represented by the carrying amount of each class of financial assetsrecognised in the balance sheet s and the nominal amount of corporate guarantees provided by the Company to banks (Note 2 5(a)) .
The Group’s objective is to seek continual revenue growth while minimising losses incurred due to increased credit risk expos ure. TheGroup has policies in place to ensure that sales of products and services are made to customers with appropriate credit histories. Inaddition, receivable balances are monitored on an ongoing basis with the result that the Group’s exposure to bad debts is not significant.
Credit risk concentration profile
The Gr oup determines concentration of credit risk by monitoring the country of its trade and other receivables on an on -going basis.The credit risk concentration profile of the Group’s trade and other receivables at the end of the reporting period is as follow s:
Group2014 2013
$’000 % to total $’000 % to total
Singapore 414 8% 1,196 18%Taiwan 2,270 45% 2,470 37%Hong Kong 1,352 26% 1,663 25%Australia 16 3% 38 –Malaysia 977 18% 1,273 20%
5,029 100% 6,640 100%
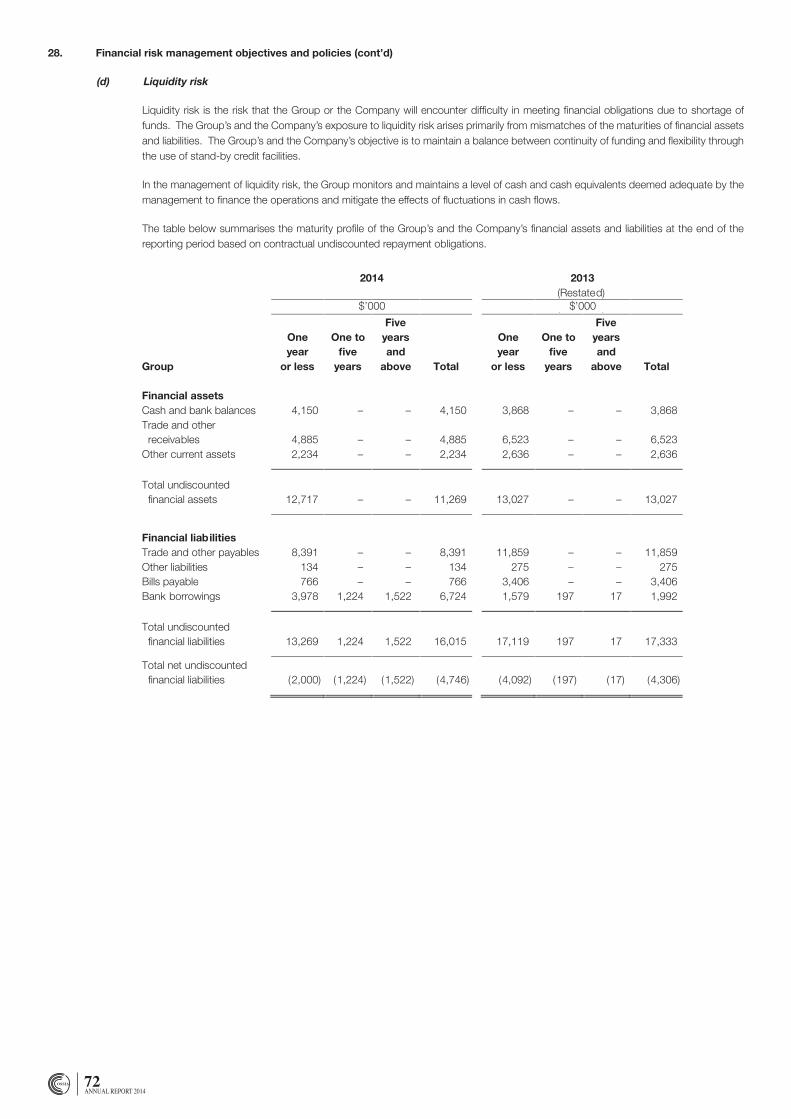
72ANNUAL REPORT 2014
28. Financial risk management objectives and policies (cont’d)
(d) Liquidity risk
Liquidity risk is the risk that the Group or the Company will encounter difficulty in meeting financial obligations due to shortage of funds. The Group’s and the Company’s exposure to liquidity risk arises primarily from mismatches of the maturities of financial assets and liabilities. The Group’s and the Company’s objective is to maintain a balance between continuity of funding and flexibility through the use of stand-by credit facilities.
In the management of liquidity risk, the Group monitors and maintains a level of cash and cash equivalents deemed adequate by the management to finance the operations and mitigate the effects of fluctuations in cash flows.
The table below summarises the maturity profile of the Group’s and the Company’s financial assets and liabilities at the end of the reporting period based on contractual undiscounted repayment obligations.
Ossia International Limited and its Subsidiaries
Notes to the Financial Statements – 31 March 2014
- 63 -
27. Financial risk management objectives and policies (cont’d)
(d) Liquidity risk
Liquidity risk is the risk that the Group or the Company will encounter difficulty in meeting financial obligations due to sh ortage offunds. The Group’s and the Company’s exposure to liquidity risk arises primarily from mismatches of the maturities of financial assetsand liabilities. The Group’s and the Company’s objective is to maintain a balance between continuity of funding and flexibil ity throughthe use of stand -by credit facilities.
In the management of liquidity risk, the Group monitors and maintains a level of cash and cash equivalents deemed adequate by themanagement to finance the operations and mitigate the effects of fluctuations in cash flows.
The table below summarises the maturity profile of the Group’s and the Company’s financial assets and liabilities at the end of thereporting period based on contractual undiscounted repayment obligations .
2014$’000
2013$’000
(Restated)
Group
Oneyear
or less
One tofive
years
Fiveyearsand
above Total
Oneyear
or less
One tofive
years
Fiveyearsand
above Total
Financial assetsCash and bank balances 4,150 – – 4,150 3,868 – – 3,868Trade and other
receivables 4,885 – – 4,885 6,523 – – 6,523Other current assets 2,234 – – 2,234 2,636 – – 2,636
Total undiscountedfinancial assets 12,717 – – 11,269 13,027 – – 13,027
Financial liabilitiesTrade and other payables 8,391 – – 8,391 11,859 – – 11,859Other liabilities 134 134 275 – – 275Bills payables 766 766 3,406 – – 3,406Bank borrowings 3,978 1,224 1,522 6,724 1,579 197 17 1,992
Total undiscountedfinancial liabilities 13,269 1,224 1,522 16,015 17,119 197 17 17,333
Total net undiscountedfinancial liabilities (2,000) (1,224) (1,522) (4,746) (4,092) (197) (17) (4,306)
– –– –
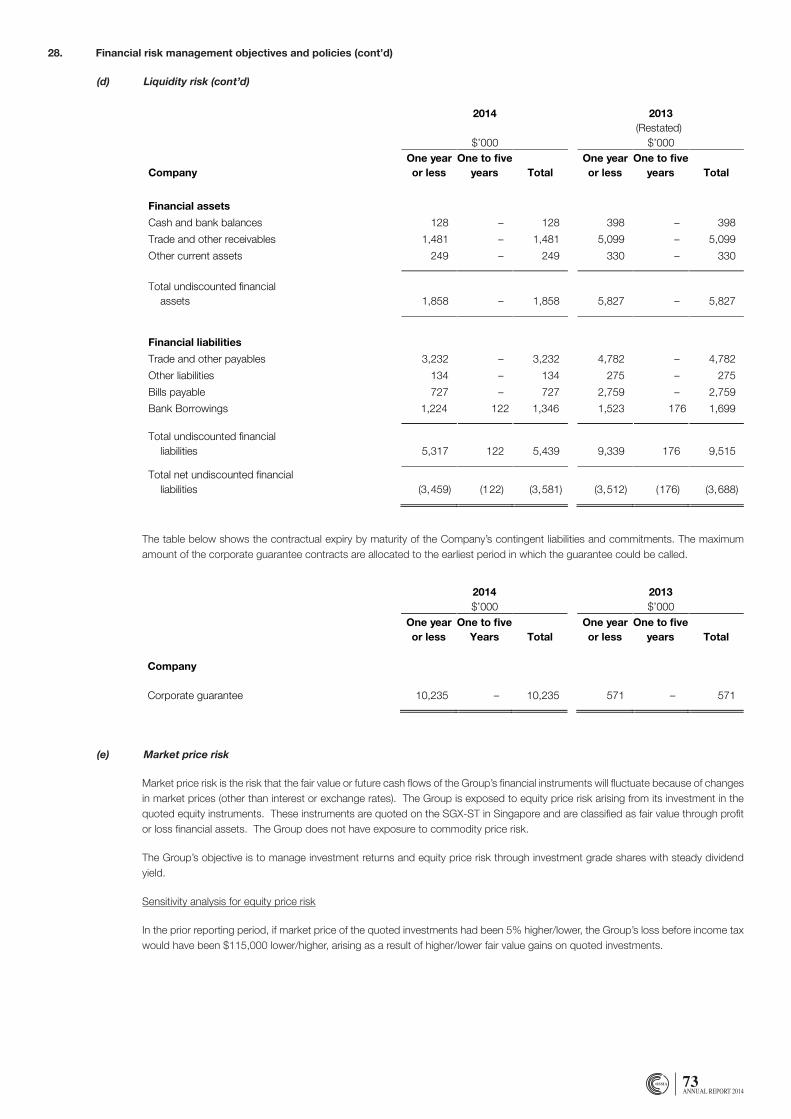
73ANNUAL REPORT 2014
Ossia International Limited and its Subsidiaries
Notes to the Financial Statements – 31 March 2014
- 64 -
27. Financial risk management objectives and policies (cont’d)
(d) Liquidity risk (cont’d)
2014 2013
$’000 $’000(Restated)
CompanyOne yearor less
One to fiveyears Total
One yearor less
One to fiveyears Total
Financial assets
Cash and bank balances 128 – 128 398 – 398
Trade and other receivables 1,481 – 1,481 5,099 – 5,099
Other current assets 249 – 249 330 – 330
Total undiscounted financialassets 1,858 – 1,858 5,827 – 5,827
Financial liabilities
Trade and other payables 3,232 – 3,232 4,782 – 4,782
Other liabilities 134 – 134 275 – 275
Bills payable 727 – 727 2,759 – 2,759
Total undiscounted financialliabilities 5,317 122 5,439 9,339 176 9,515
Total net undiscounted financialliabilities (3,459) (122) (3,581) (3,512) (176) (3,688)
The table below shows the contractual expiry by maturity of the Company’s contingent liabilities and commitments. The maximumamount of the corporate guarantee contracts are allocated to t he earliest period in which the guarantee could be called.
2014$’000
2013$’000
One yearor less
One to fiveYears Total
One yearor less
One to fiveyears Total
Company
Corporate guarantee 10,235 – 10,235 571 – 571
Bank Borrowings 1,224 122 1,346 1,523 176 1,699
28. Financial risk management objectives and policies (cont’d)
(d) Liquidity risk (cont’d)
The table below shows the contractual expiry by maturity of the Company’s contingent liabilities and commitments. The maximum amount of the corporate guarantee contracts are allocated to the earliest period in which the guarantee could be called.
(e) Market price risk
Market price risk is the risk that the fair value or future cash flows of the Group’s financial instruments will fluctuate because of changes in market prices (other than interest or exchange rates). The Group is exposed to equity price risk arising from its investment in the quoted equity instruments. These instruments are quoted on the SGX-ST in Singapore and are classified as fair value through profit or loss financial assets. The Group does not have exposure to commodity price risk.
The Group’s objective is to manage investment returns and equity price risk through investment grade shares with steady dividend yield.
Sensitivity analysis for equity price risk
In the prior reporting period, if market price of the quoted investments had been 5% higher/lower, the Group’s loss before income tax would have been $115,000 lower/higher, arising as a result of higher/lower fair value gains on quoted investments.
Ossia International Limited and its Subsidiaries
Notes to the Financial Statements – 31 March 2014
- 63 -
27. Financial risk management objectives and policies (cont’d)
(d) Liquidity risk
Liquidity risk is the risk that the Group or the Company will encounter difficulty in meeting financial obligations due to sh ortage offunds. The Group’s and the Company’s exposure to liquidity risk arises primarily from mismatches of the maturities of financial assetsand liabilities. The Group’s and the Company’s objective is to maintain a balance between continuity of funding and flexibil ity throughthe use of stand -by credit facilities.
In the management of liquidity risk, the Group monitors and maintains a level of cash and cash equivalents deemed adequate by themanagement to finance the operations and mitigate the effects of fluctuations in cash flows.
The table below summarises the maturity profile of the Group’s and the Company’s financial assets and liabilities at the end of thereporting period based on contractual undiscounted repayment obligations .
2014$’000
2013$’000
(Restated)
Group
Oneyear
or less
One tofive
years
Fiveyearsand
above Total
Oneyear
or less
One tofive
years
Fiveyearsand
above Total
Financial assetsCash and bank balances 4,150 – – 4,150 3,868 – – 3,868Trade and other
receivables 4,885 – – 4,885 6,523 – – 6,523Other current assets 2,234 – – 2,234 2,636 – – 2,636
Total undiscountedfinancial assets 12,717 – – 11,269 13,027 – – 13,027
Financial liabilitiesTrade and other payables 8,391 – – 8,391 11,859 – – 11,859Other liabilities 134 134 275 – – 275Bills payables 766 766 3,406 – – 3,406Bank borrowings 3,978 1,224 1,522 6,724 1,579 197 17 1,992
Total undiscountedfinancial liabilities 13,269 1,224 1,522 16,015 17,119 197 17 17,333
Total net undiscountedfinancial liabilities (2,000) (1,224) (1,522) (4,746) (4,092) (197) (17) (4,306)
– –– –
Ossia International Limited and its Subsidiaries
Notes to the Financial Statements – 31 March 2014
- 64 -
27. Financial risk management objectives and policies (cont’d)
(d) Liquidity risk (cont’d)
2014 2013
$’000 $’000(Restated)
CompanyOne yearor less
One to fiveyears Total
One yearor less
One to fiveyears Total
Financial assets
Cash and bank balances 128 – 128 398 – 398
Trade and other receivables 1,481 – 1,481 5,099 – 5,099
Other current assets 249 – 249 330 – 330
Total undiscounted financialassets 1,858 – 1,858 5,827 – 5,827
Financial liabilities
Trade and other payables 3,232 – 3,232 4,782 – 4,782
Other liabilities 134 – 134 275 – 275
Bills payable 727 – 727 2,759 – 2,759
Total undiscounted financialliabilities 5,317 122 5,439 9,339 176 9,515
Total net undiscounted financialliabilities (3,459) (122) (3,581) (3,512) (176) (3,688)
The table below shows the contractual expiry by maturity of the Company’s contingent liabilities and commitments. The maximumamount of the corporate guarantee contracts are allocated to t he earliest period in which the guarantee could be called.
2014$’000
2013$’000
One yearor less
One to fiveYears Total
One yearor less
One to fiveyears Total
Company
Corporate guarantee 10,235 – 10,235 571 – 571
Bank Borrowings 1,224 122 1,346 1,523 176 1,699
Ossia International Limited and its Subsidiaries
Notes to the Financial Statements – 31 March 2014
- 63 -
27. Financial risk management objectives and policies (cont’d)
(d) Liquidity risk
Liquidity risk is the risk that the Group or the Company will encounter difficulty in meeting financial obligations due to sh ortage offunds. The Group’s and the Company’s exposure to liquidity risk arises primarily from mismatches of the maturities of financial assetsand liabilities. The Group’s and the Company’s objective is to maintain a balance between continuity of funding and flexibil ity throughthe use of stand -by credit facilities.
In the management of liquidity risk, the Group monitors and maintains a level of cash and cash equivalents deemed adequate by themanagement to finance the operations and mitigate the effects of fluctuations in cash flows.
The table below summarises the maturity profile of the Group’s and the Company’s financial assets and liabilities at the end of thereporting period based on contractual undiscounted repayment obligations .
2014$’000
2013$’000
(Restated)
Group
Oneyear
or less
One tofive
years
Fiveyearsand
above Total
Oneyear
or less
One tofive
years
Fiveyearsand
above Total
Financial assetsCash and bank balances 4,150 – – 4,150 3,868 – – 3,868Trade and other
receivables 4,885 – – 4,885 6,523 – – 6,523Other current assets 2,234 – – 2,234 2,636 – – 2,636
Total undiscountedfinancial assets 12,717 – – 11,269 13,027 – – 13,027
Financial liabilitiesTrade and other payables 8,391 – – 8,391 11,859 – – 11,859Other liabilities 134 134 275 – – 275Bills payables 766 766 3,406 – – 3,406Bank borrowings 3,978 1,224 1,522 6,724 1,579 197 17 1,992
Total undiscountedfinancial liabilities 13,269 1,224 1,522 16,015 17,119 197 17 17,333
Total net undiscountedfinancial liabilities (2,000) (1,224) (1,522) (4,746) (4,092) (197) (17) (4,306)
– –– –
Ossia International Limited and its Subsidiaries
Notes to the Financial Statements – 31 March 2014
- 63 -
27. Financial risk management objectives and policies (cont’d)
(d) Liquidity risk
Liquidity risk is the risk that the Group or the Company will encounter difficulty in meeting financial obligations due to sh ortage offunds. The Group’s and the Company’s exposure to liquidity risk arises primarily from mismatches of the maturities of financial assetsand liabilities. The Group’s and the Company’s objective is to maintain a balance between continuity of funding and flexibil ity throughthe use of stand -by credit facilities.
In the management of liquidity risk, the Group monitors and maintains a level of cash and cash equivalents deemed adequate by themanagement to finance the operations and mitigate the effects of fluctuations in cash flows.
The table below summarises the maturity profile of the Group’s and the Company’s financial assets and liabilities at the end of thereporting period based on contractual undiscounted repayment obligations .
2014$’000
2013$’000
(Restated)
Group
Oneyear
or less
One tofive
years
Fiveyearsand
above Total
Oneyear
or less
One tofive
years
Fiveyearsand
above Total
Financial assetsCash and bank balances 4,150 – – 4,150 3,868 – – 3,868Trade and other
receivables 4,885 – – 4,885 6,523 – – 6,523Other current assets 2,234 – – 2,234 2,636 – – 2,636
Total undiscountedfinancial assets 12,717 – – 11,269 13,027 – – 13,027
Financial liabilitiesTrade and other payables 8,391 – – 8,391 11,859 – – 11,859Other liabilities 134 134 275 – – 275Bills payables 766 766 3,406 – – 3,406Bank borrowings 3,978 1,224 1,522 6,724 1,579 197 17 1,992
Total undiscountedfinancial liabilities 13,269 1,224 1,522 16,015 17,119 197 17 17,333
Total net undiscountedfinancial liabilities (2,000) (1,224) (1,522) (4,746) (4,092) (197) (17) (4,306)
– –– –
74ANNUAL REPORT 2014
29. Fair value of financial instruments
Fair value is defined as the amount at which the instrument could be exchanged in a current transaction between knowledgeable willing parties in an arm’s length transaction, other than in a forced or liquidation sale. Fair values are obtained from quoted market prices, discounted cash flow models and option pricing models as appropriate.
Financial instruments whose carrying amount reasonably approximates fair value
Management has determined that the carrying amounts of cash and cash equivalents, trade and other receivables, other current assets, trade and other payables, dividend payable, bills payable and borrowings at the end of the reporting period, based on their notional amounts, reasonably approximate their fair value either due to their short-term nature or that they are floating rate instruments that are re-priced to market interest rates on or near the end of the reporting period.
There are no significant differences between the fair values and the carrying amounts of deposits (non-current), finance lease liabilities and non-current borrowings.
Methods and assumptions used to determine fair values
The Group classifies fair value measurement using a fair value hierarchy that reflects the significance of the inputs used in making the measurements. The fair value hierarchy has the following levels:
• Level 1 – Quoted prices (unadjusted) in active markets for identical assets or liabilities,
• Level 2 – Inputs other than quoted prices included within Level 1 that are observable for the asset or liability, either directly (i.e., as prices) or indirectly (i.e., derived from prices), and
• Level 3 – Inputs for the asset or liability that are not based on observable market data (unobservable inputs).
The methods and assumptions used by management to determine fair values of financial instruments other than those whose carrying amounts reasonably approximate their fair values as mentioned earlier, are as follows:
Fair value is determined by reference to published market prices at the end of the reporting period without factoring in transaction costs. (Level 1)
Fair value is determined using discounted estimated cash flows. Where repayment terms are not fixed, future cash flows are projected based on management’s best estimates. The discount rates used are the current market incremental lending rates for similar types of lending, borrowing and leasing arrangements. (Level 2)
Ossia International Limited and its Subsidiaries
Notes to the Financial Statements – 31 March 2014
- 66 -
28. Fair value of financial instruments (cont’d)
Methods and assumptions used to determine fair values (cont’d)
The methods and assumptions used by management to determine fair values of financial instruments other than those whose carrying amountsreasonably approximate their fair values as mentioned earlier, are as follow s:
Financial assets and liabilities Methods and assumptions
- Quoted investments Fair value is determined by reference to published market prices atthe end of the reporting period without factoring in transaction costs.(Level 1)
- Obligations under financeleases
- Bank borrowings
Fair value is determined using discounted estimated cash flows.Where repayment terms are not fixed, future c ash flows areprojected based on management’s best estimates. The discountrates used are the current market incremental lending rates forsimilar types of lending, borrowing and leasing arrangements.(Level 2)
Categories of financial assets and fina ncial liabilities
Set out below are the carrying amounts of the Group’s and the Company’s financial assets and financial liabilities that are c arried on the balancesheets:
Group Company2014 2013 2014 2013
$’000 $’000 $’000 $’000Assets
Cash and bank balances 4,150 3,868 128 398Trade and other receivables 4,885 6,523 1,481 5,099Deposits (Note 13) 1,692 1,684 177 211Other current assets (Note 1 3) 1,990 2,151 450 282
Total loans and receivables 12,717 14,226 2,236 5,990
Assets at fair value through profit andloss (Note 14) – 2,291 – 2,291
LiabilitiesTrade and other payables 8,391 11,584 3,232 4,782Bills payable (Note 21) 766 3,406 727 2,759Borrowings (Note 22) 6,715 1,777 1,386 1,685
Total liabilities at amortised cost 15,872 16,767 5,345 9,226
(Restated) (Restated)
75ANNUAL REPORT 2014
28. Fair value of financial instruments (cont’d)
Categories of financial assets and financial liabilities
Set out below are the carrying amounts of the Group’s and the Company’s financial assets and financial liabilities that are carried on the balance sheets:
Ossia International Limited and its Subsidiaries
Notes to the Financial Statements – 31 March 2014
- 66 -
28. Fair value of financial instruments (cont’d)
Methods and assumptions used to determine fair values (cont’d)
The methods and assumptions used by management to determine fair values of financial instruments other than those whose carrying amountsreasonably approximate their fair values as mentioned earlier, are as follow s:
Financial assets and liabilities Methods and assumptions
- Quoted investments Fair value is determined by reference to published market prices atthe end of the reporting period without factoring in transaction costs.(Level 1)
- Obligations under financeleases
- Bank borrowings
Fair value is determined using discounted estimated cash flows.Where repayment terms are not fixed, future c ash flows areprojected based on management’s best estimates. The discountrates used are the current market incremental lending rates forsimilar types of lending, borrowing and leasing arrangements.(Level 2)
Categories of financial assets and fina ncial liabilities
Set out below are the carrying amounts of the Group’s and the Company’s financial assets and financial liabilities that are c arried on the balancesheets:
Group Company2014 2013 2014 2013
$’000 $’000 $’000 $’000Assets
Cash and bank balances 4,150 3,868 128 398Trade and other receivables 4,885 6,523 1,481 5,099Deposits (Note 13) 1,692 1,684 177 211Other current assets (Note 1 3) 1,990 2,151 450 282
Total loans and receivables 12,717 14,226 2,236 5,990
Assets at fair value through profit andloss (Note 14) – 2,291 – 2,291
LiabilitiesTrade and other payables 8,391 11,584 3,232 4,782Bills payable (Note 21) 766 3,406 727 2,759Borrowings (Note 22) 6,715 1,777 1,386 1,685
Total liabilities at amortised cost 15,872 16,767 5,345 9,226
(Restated) (Restated)
76ANNUAL REPORT 2014
30. Capital management
Capital includes debt and equity items as disclosed in the table below.
The primary objective of the Group’s capital management is to ensure that it maintains a strong credit rating and healthy capital ratios in order to support its business and maximise shareholder value.
The Group manages its capital structure and makes adjustments to it, in light of changes in economic conditions. To maintain or adjust the capital structure, the Group may adjust the dividend payment to shareholders, return capital to shareholders or issue new shares. No changes were made in the objectives, policies or processes during the years ended 31 March 2014 and 31 March 2013.
An overseas subsidiary in Taiwan appropriates 10% of its net profit after tax according to the subsidiary’s Articles of Incorporation as legal reserve. Such appropriations are proposed by the directors for approval by shareholders in the next financial year and given effect in the financial statements of that year. The legal reserve shall be appropriated each year until the accumulated reserve equals the paid-up capital of the subsidiary. This reserve can only be used to offset losses of the subsidiary. When the reserve has reached 50% of the share capital of the subsidiary, up to 50% of the legal reserve may be capitalised. The reserve is not available for dividend distribution. This internally imposed capital requirement has been complied with by the abovementioned subsidiary for the financial year ended 31 March 2014 and 31 March 2013.
The Group monitors capital using a gearing ratio, which is net debt divided by total capital plus net debt. The Group’s aim is to keep the gearing ratio below 30%. The Group includes within net debt, borrowings, trade and other payables, dividend and bills payables, less cash and bank balances. Capital includes equity attributable to the equity holders of the Company less the abovementioned legal reserve.
Ossia International Limited and its Subsidiaries
Notes to the Financial Statements – 31 March 2014
- 66 -
29. Capital management
Capital includes debt and equity items as disclosed in the table below.
The primary objective of the Group’s capital management is to ensure that it ma intains a strong credit rating andhealthy capital ratios in order to support its business and maximise shareholder value.
The Group manages its capital structure and makes adjustments to it, in light of changes in economic conditions.To maintain or adj ust the capital structure, the Group may adjust the dividend payment to shareholders, returncapital to shareholders or issue new shares. No changes were made in the objectives, policies or processesduring the years ended 31 March 2014 and 31 March 2013.
An overseas subsidiary in Taiwan appropriates 10% of its net profit after tax according to the subsidiary’s Articlesof Incorporation as legal reserve. Such appropriations are proposed by the directors for approval by shareholdersin the next financial y ear and given effect in the financial statements of that year. The legal reserve shall beappropriated each year until the accumulated reserve equals the paid -up capital of the subsidiary. This reservecan only be used to offset losses of the subsidiary. When the reserve has reached 50% of the share capital of thesubsidiary, up to 50% of the le gal reserve may be capitalised. The reserve is not available for dividend distribution .This internally imposed capital requirement has been complied with by the a bovementioned subsidiary for thefinancial year ended 31 March 2014 and 31 March 2013.
The Group monitors capital using a gearing ratio, which is net debt divided by total capital plus net debt. TheGroup’s aim is to kee p the gearing ratio below 30%. The Group includes within net debt, borrowings, trade andother payables, dividend and bills payables, less cash and bank balances. Capital includes equity attributable tothe equity holders of the Company less the abovementioned legal reserve.
Group2014 2013$’000 $’000
Trade and other payables (Note 2 0) 8,391 11,584Bills payable (Note 2 1) 766 3,406Borrowings (Note 2 2) 6,715 1,777Less: Cash and bank balances (Note 1 5) (4,150) (3,868)
Net debt 11,722 12,899
Equity attributable to equity holders of the Company 39,291 46,235Less: Legal reserve (1,207) (1,206)
Total capital 38,084 45,029
Capital and net debt 49,806 57,928
Gearing ratio 24% 22%
(Note 20)(Note 21)
(Note 22)(Note 15)
77ANNUAL REPORT 2014
Ossia International Limited and its Subsidiaries
Notes to the Financial Statements – 31 March 2014
- 68 -
30. Segment information
For management purposes, the Group is organised into operating segments based on their geographical location. The Group main ly importsand distributes apparel, sporting goods, footwear and accessories in each of the following locations and are independent from each other.
Management monitors the operating results of its business units separately for the purpose of making decisions about resource allocation andperformance assessment. Segment performance is evaluated based on operating profit or loss which in certain respects, as exp lained in thetable below, is measured differently from operating profit or loss in the consolidated financial statements.
Trans fer prices between operating segments are on terms agreed mutually between the parties.
31.3.2014Singapore and
MalaysiaHong Kongand China
Taiwan Adjustments andeliminations
TotalGroup
$’000 $’000 $’000 $’000 $’000Revenue:External customers 29,928 4,154 21,376 – 55,458
Segment (loss)/profit (7,640) (317) 203 (250) (8,004)Interest income 21 – 7 (21) 7Finance expense (227) – (48) 18 (257)Changes in fair value of quoted investments (103) – – – (103)Share of results of the associated company (792) – – – (792)
(Loss)/Profit before income tax (8,741) (317) 162 (253) (9,149)Income tax 77 (1) (62) – 14
(Loss)/Profit for the year (8,664) (318) 100 (253) (9,135)
Segment assets 21,472 4,195 12,938 (3,618) 34,987Investment in associated company 21,044 – – – 21,044
Consolidated total assets 56,031
Segment liabilities 6,116 589 4,060 (2,240) 8,525Borrowings and bills payable 5,062 – 2,419 – 7,481Taxation – – 36 – 36
Consolidated total liabilities 16,042
Other information:Additions to property, plant and equipment 1,797 4 939 – 2,740Depreciation of property, plant and equipment 1,783 88 975 – 2,846Impairment loss for property, plant and equipment 683 – – – 683Allowance for doubtful debts 26 11 5 – 42
(b)
(c)
(a)
31. Segment information
For management purposes, the Group is organised into operating segments based on their geographical location. The Group mainly imports and distributes apparel, sporting goods, footwear and accessories in each of the following locations and are independent from each other.
Management monitors the operating results of its business units separately for the purpose of making decisions about resource allocation and performance assessment. Segment performance is evaluated based on operating profit or loss which in certain respects, as explained in the table below, is measured differently from operating profit or loss in the consolidated financial statements.
Transfer prices between operating segments are on terms agreed mutually between the parties.
Ossia International Limited and its Subsidiaries
Notes to the Financial Statements – 31 March 2014
- 68 -
30. Segment information
For management purposes, the Group is organised into operating segments based on their geographical location. The Group main ly importsand distributes apparel, sporting goods, footwear and accessories in each of the following locations and are independent from each other.
Management monitors the operating results of its business units separately for the purpose of making decisions about resource allocation andperformance assessment. Segment performance is evaluated based on operating profit or loss which in certain respects, as exp lained in thetable below, is measured differently from operating profit or loss in the consolidated financial statements.
Trans fer prices between operating segments are on terms agreed mutually between the parties.
31.3.2014Singapore and
MalaysiaHong Kongand China
Taiwan Adjustments andeliminations
TotalGroup
$’000 $’000 $’000 $’000 $’000Revenue:External customers 29,928 4,154 21,376 – 55,458
Segment (loss)/profit (7,640) (317) 203 (250) (8,004)Interest income 21 – 7 (21) 7Finance expense (227) – (48) 18 (257)Changes in fair value of quoted investments (103) – – – (103)Share of results of the associated company (792) – – – (792)
(Loss)/Profit before income tax (8,741) (317) 162 (253) (9,149)Income tax 77 (1) (62) – 14
(Loss)/Profit for the year (8,664) (318) 100 (253) (9,135)
Segment assets 21,472 4,195 12,938 (3,618) 34,987Investment in associated company 21,044 – – – 21,044
Consolidated total assets 56,031
Segment liabilities 6,116 589 4,060 (2,240) 8,525Borrowings and bills payable 5,062 – 2,419 – 7,481Taxation – – 36 – 36
Consolidated total liabilities 16,042
Other information:Additions to property, plant and equipment 1,797 4 939 – 2,740Depreciation of property, plant and equipment 1,783 88 975 – 2,846Impairment loss for property, plant and equipment 683 – – – 683Allowance for doubtful debts 26 11 5 – 42
(b)
(c)
(a)
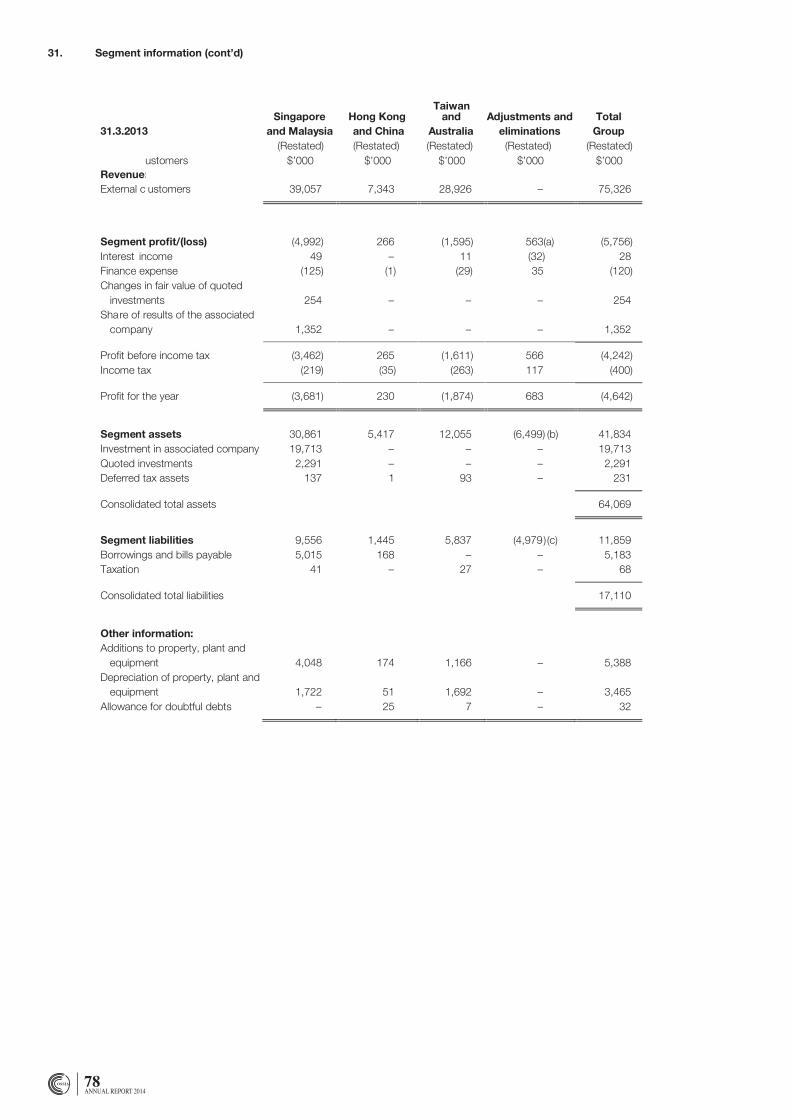
78ANNUAL REPORT 2014
31. Segment information (cont’d)
Ossia International Limited and its Subsidiaries
Notes to the Financial Statements – 31 March 2014
- 69 -
30. Segment information (cont’d)
31.3.2013Singapore
and MalaysiaHong Kongand China
Taiwanand
AustraliaAdjustments and
eliminationsTotal
Group(Restated)
Revenue:External c ustomers 39,057 7,343 28,926 – 75,326
Segment profit/(loss) (4,992) 266 (1,595) 563(a) (5,756)Interest income 49 – 11 (32) 28Finance expense (125) (1) (29) 35 (120)Changes in fair value of quoted
investments 254 – – – 254Share of results of the associated
company 1,352 – – – 1,352
Profit before income tax (3,462) 265 (1,611) 566 (4,242)Income tax (219) (35) (263) 117 (400)
Profit for the year (3,681) 230 (1,874) 683 (4,642)
Segment assets 30,861 5,417 12,055 (6,499) (b) 41,834Investment in associated company 19,713 – – – 19,713Quoted investments 2,291 – – – 2,291Deferred tax assets 137 1 93 – 231
Consolidated total assets 64,069
Segment liabilities 9,556 1,445 5,837 (4,979)(c) 11,859Borrowings and bills payable 5,015 168 – – 5,183Taxation 41 – 27 – 68
Consolidated total liabilities 17,110
Other information:Additions to property, plant and
equipment 4,048 174 1,166 – 5,388Depreciation of property, plant and
equipment 1,722 51 1,692 – 3,465Allowance for doubtful debts – 25 7 – 32
$’000 $’000 $’000 $’000 $’000(Restated) (Restated) (Restated) (Restated)
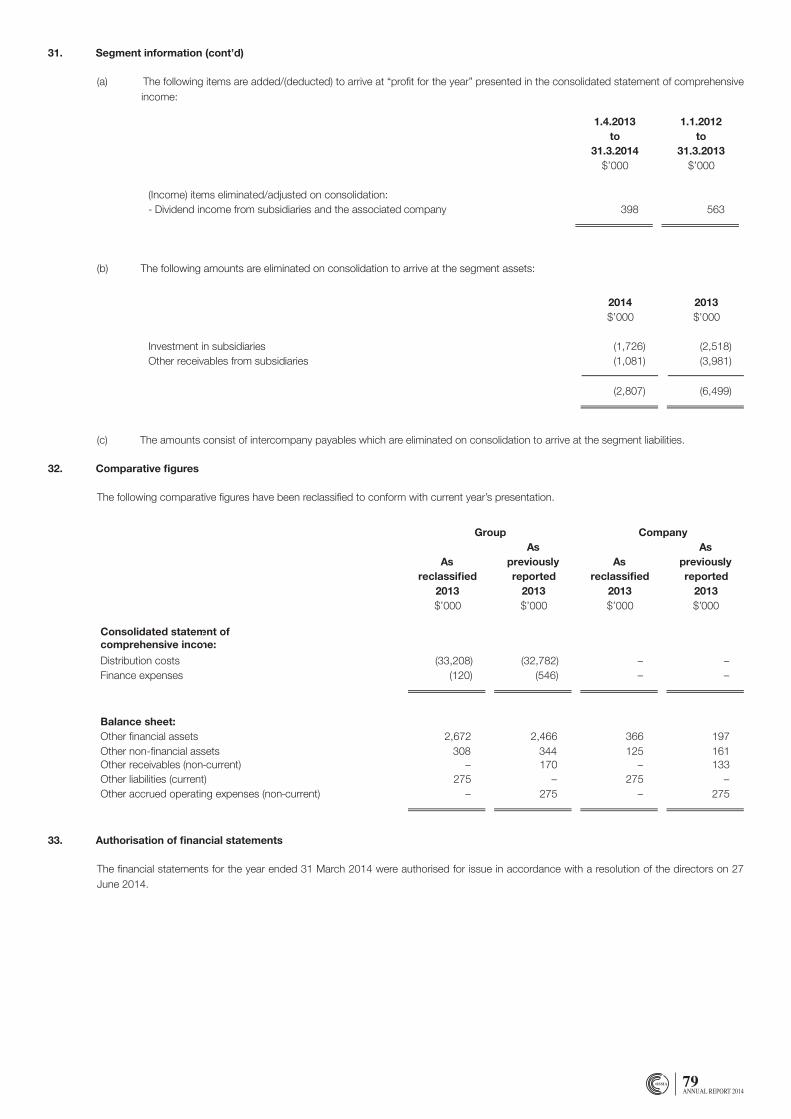
79ANNUAL REPORT 2014
Ossia International Limited and its Subsidiaries
Notes to the Financial Statements – 31 March 2014
- 70 -
30. Segment information (cont’d)
(a) The following i tems are added/(deducted) to arrive at “ profit for the year” presented in the consolidated statement of comprehensiveincome:
1.4.2013to
31.3.2014
1.1.2012to
31.3.2013$’000 $’000
(Income) items eliminated/adjusted on consolidation:- Dividend income from subsidiaries and the associated company 398 563
(b) The following amounts are eliminated on consolidation to arrive at the segment assets :
2014 2013$’000 $’000
Investment in subsidiaries (1,726) (2,518)Other receivables from subsidiaries (1,081) (3,981)
(2,807) (6,499)
(c) The amounts consist of intercompany payables which are eliminated on consolidation to arrive at the segment liabilities .
31. Comparative figures
The following comparative figures have been reclassified to conform with current year’s presentation.
Group Company
Asreclassified
Aspreviouslyreported
Asreclassified
Aspreviouslyreported
2013 2013 2013 2013$’000 $’000 $’000 $’000
Other financial assets 2,672 2,466 366 197
Other receivables (non-current) – 170 – 133Other liabilities (current) 275 – 275 –Other accrued operating expenses (non-current) – 275 – 275
Balance sheet:
Consolidated statement ofcomprehensive income:
Distribution costs (33,208) –Finance expenses (120) –
(32,782)(546)
––
Other non-financial assets 308 344 125 161
31. Segment information (cont’d)
(a) The following items are added/(deducted) to arrive at “profit for the year” presented in the consolidated statement of comprehensive income:
(b) The following amounts are eliminated on consolidation to arrive at the segment assets:
(c) The amounts consist of intercompany payables which are eliminated on consolidation to arrive at the segment liabilities.
32. Comparative figures
The following comparative figures have been reclassified to conform with current year’s presentation.
33. Authorisation of financial statements
The financial statements for the year ended 31 March 2014 were authorised for issue in accordance with a resolution of the directors on 27 June 2014.
Ossia International Limited and its Subsidiaries
Notes to the Financial Statements – 31 March 2014
- 70 -
30. Segment information (cont’d)
(a) The following i tems are added/(deducted) to arrive at “ profit for the year” presented in the consolidated statement of comprehensiveincome:
1.4.2013to
31.3.2014
1.1.2012to
31.3.2013$’000 $’000
(Income) items eliminated/adjusted on consolidation:- Dividend income from subsidiaries and the associated company 398 563
(b) The following amounts are eliminated on consolidation to arrive at the segment assets :
2014 2013$’000 $’000
Investment in subsidiaries (1,726) (2,518)Other receivables from subsidiaries (1,081) (3,981)
(2,807) (6,499)
(c) The amounts consist of intercompany payables which are eliminated on consolidation to arrive at the segment liabilities .
31. Comparative figures
The following comparative figures have been reclassified to conform with current year’s presentation.
Group Company
Asreclassified
Aspreviouslyreported
Asreclassified
Aspreviouslyreported
2013 2013 2013 2013$’000 $’000 $’000 $’000
Other financial assets 2,672 2,466 366 197
Other receivables (non-current) – 170 – 133Other liabilities (current) 275 – 275 –Other accrued operating expenses (non-current) – 275 – 275
Balance sheet:
Consolidated statement ofcomprehensive income:
Distribution costs (33,208) –Finance expenses (120) –
(32,782)(546)
––
Other non-financial assets 308 344 125 161

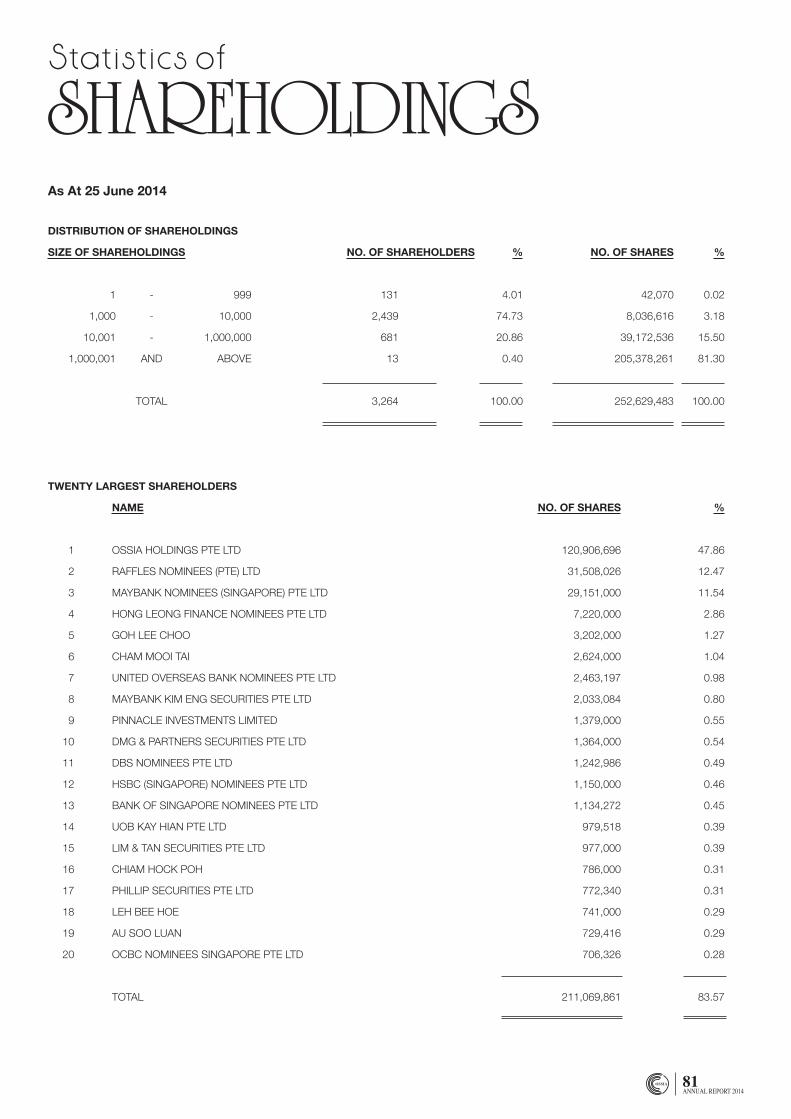
81ANNUAL REPORT 2014
Statistics of
SHaReHOlDINGSDISTRIBUTION OF SHAREHOLDINGS
SIZE OF SHAREHOLDINGS NO. OF SHAREHOLDERS % NO. OF SHARES %
1 - 999 131 4.01 42,070 0.02
1,000 - 10,000 2,439 74.73 8,036,616 3.18
10,001 - 1,000,000 681 20.86 39,172,536 15.50
1,000,001 AND ABOVE 13 0.40 205,378,261 81.30
TOTAL 3,264 100.00 252,629,483 100.00
TWENTY LARGEST SHAREHOLDERS
NAME NO. OF SHARES %
1 OSSIA HOLDINGS PTE LTD 120,906,696 47.86
2 RAFFLES NOMINEES (PTE) LTD 31,508,026 12.47
3 MAYBANK NOMINEES (SINGAPORE) PTE LTD 29,151,000 11.54
4 HONG LEONG FINANCE NOMINEES PTE LTD 7,220,000 2.86
5 GOH LEE CHOO 3,202,000 1.27
6 CHAM MOOI TAI 2,624,000 1.04
7 UNITED OVERSEAS BANK NOMINEES PTE LTD 2,463,197 0.98
8 MAYBANK KIM ENG SECURITIES PTE LTD 2,033,084 0.80
9 PINNACLE INVESTMENTS LIMITED 1,379,000 0.55
10 DMG & PARTNERS SECURITIES PTE LTD 1,364,000 0.54
11 DBS NOMINEES PTE LTD 1,242,986 0.49
12 HSBC (SINGAPORE) NOMINEES PTE LTD 1,150,000 0.46
13 BANK OF SINGAPORE NOMINEES PTE LTD 1,134,272 0.45
14 UOB KAY HIAN PTE LTD 979,518 0.39
15 LIM & TAN SECURITIES PTE LTD 977,000 0.39
16 CHIAM HOCK POH 786,000 0.31
17 PHILLIP SECURITIES PTE LTD 772,340 0.31
18 LEH BEE HOE 741,000 0.29
19 AU SOO LUAN 729,416 0.29
20 OCBC NOMINEES SINGAPORE PTE LTD 706,326 0.28
TOTAL 211,069,861 83.57
As At 25 June 2014
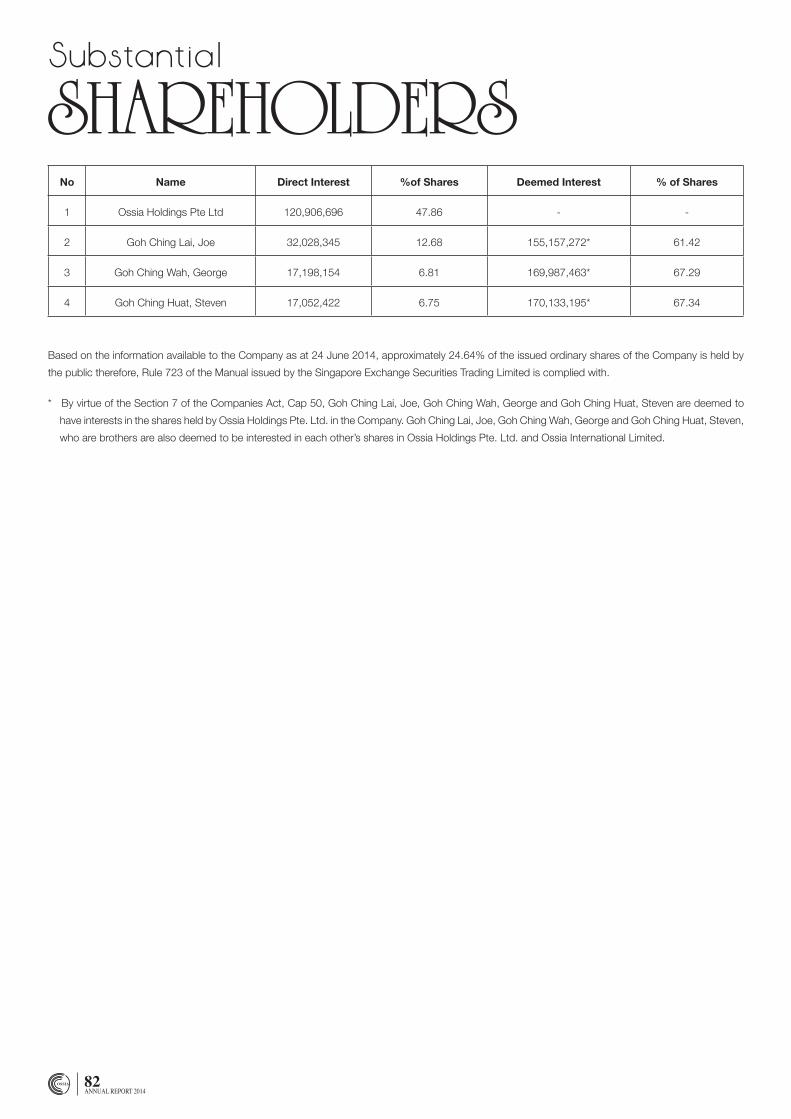
82ANNUAL REPORT 2014
Substantial
SHaReHOlDeRSNo Name Direct Interest %of Shares Deemed Interest % of Shares
1 Ossia Holdings Pte Ltd 120,906,696 47.86 - -
2 Goh Ching Lai, Joe 32,028,345 12.68 155,157,272* 61.42
3 Goh Ching Wah, George 17,198,154 6.81 169,987,463* 67.29
4 Goh Ching Huat, Steven 17,052,422 6.75 170,133,195* 67.34
Based on the information available to the Company as at 24 June 2014, approximately 24.64% of the issued ordinary shares of the Company is held by
the public therefore, Rule 723 of the Manual issued by the Singapore Exchange Securities Trading Limited is complied with.
* By virtue of the Section 7 of the Companies Act, Cap 50, Goh Ching Lai, Joe, Goh Ching Wah, George and Goh Ching Huat, Steven are deemed to
have interests in the shares held by Ossia Holdings Pte. Ltd. in the Company. Goh Ching Lai, Joe, Goh Ching Wah, George and Goh Ching Huat, Steven,
who are brothers are also deemed to be interested in each other’s shares in Ossia Holdings Pte. Ltd. and Ossia International Limited.
83ANNUAL REPORT 2014
Notice of Annual
GeNeRal MeeTINGNOTICE IS HEREBY GIVEN that the Twenty-Third Annual General Meeting of the Company will be held at the Conference Room, No. 10 Changi South
Lane, #07-01, Singapore 486162 on Friday, 25 July 2014 at 9.30 a.m. to transact the following business:-
AS ORDINARY BUSINESS
1. To receive and consider the Audited Financial Statements of the Company for the financial period ended 31 March 2014 and the Directors’ Report and
the Auditors Report thereon. (Resolution 1)
2. To re-elect Ms Heng Su-Ling, retiring by rotation, pursuant to Article 89 of the Company’s Articles of Association. (Resolution 2)
Ms Heng Su-Ling, if re-elected will remain as an Independent Director as well as a member of the Audit Committee and Nominating Committee; and
will be considered independent for the purpose of Rule 704(8) of the Listing Manual of the Singapore Exchange Securities Trading Limited.
3. To re-elect Mr Goh Ching Lai, retiring by rotation, pursuant to Article 89 of the Company’s Articles of Association. (Resolution 3)
4. To re-appoint Mr Anthony Clifford Brown, retiring pursuant to Section 153(6) of the Singapore Companies Act Cap. 50. (Resolution 4)
Mr Anthony Clifford Brown if re-appointed will remain as an Independent Director as well as the Chairman of Nominating Committee and a member of
the Audit Committee and Remuneration Committee; and will be considered independent for the purpose of Rule 704(8) of the Listing Manual of the
Singapore Exchange Securities Trading Limited.
5. To re-appoint Messrs Ernst & Young LLP as auditors of the Company and to authorise the Directors to fix their remuneration. (Resolution 5)
AS SPECIAL BUSINESS
To consider and, if thought fit, to pass the following ordinary resolutions with or without modifications:-
6. Approval of Non-Executive Directors’ fees
To approve the payment of Directors’ fees of S$284,500/- to Non-Executive Directors for the financial year ended 31 March 2014
(2013: S$355,625/-). (Resolution 6)
7. Authority to allot and issue shares
(a) “That, pursuant to Section 161 of the Companies Act, Chapter 50, and the listing rules of the Singapore Exchange Securities Trading Limited,
approval be and is hereby given to the Directors of the Company at any time to such persons and upon such terms and for such purposes as the
Directors may in their absolute discretion deem fit, to:
(i) issue shares in the capital of the Company whether by way of rights, bonus or otherwise;
(ii) make or grant offers, agreements or options that might or would require shares to be issued or other transferable rights to subscribe for or
purchase shares (collectively, “Instruments”) including but not limited to the creation and issue of warrants, debentures or other instruments
convertible into shares;
(iii) issue additional Instruments arising from adjustments made to the number of Instruments previously issued in the event of rights, bonus or
capitalisation issues; and
(b) (Notwithstanding the authority conferred by the shareholders may have ceased to be in force) issue shares in pursuance of any Instrument made
or granted by the Directors while the authority was in force,
provided always that
(i) the aggregate number of shares to be issued pursuant to this resolution (including shares to be issued in pursuance of Instruments made or
granted pursuant to this resolution) does not exceed 50% of the Company’s issued share capital, of which the aggregate number of shares
(including shares to be issued in pursuance of Instruments made or granted pursuant to this resolution) to be issued other than on a pro rata
basis to shareholders of the Company does not exceed 20% of the issued share capital of the Company, and for the purpose of this resolution,
the issued share capital shall be the Company’s issued share capital at the time this resolution is passed, after adjusting for;
84ANNUAL REPORT 2014
a) new shares arising from the conversion or exercise of convertible securities, or
b) new shares arising from exercising share options or vesting of share awards outstanding or subsisting at the time this resolution is passed provided
the options or awards were granted in compliance with Part VIII of Chapter 8 of the Listing Manual of the Singapore Exchange Securities Trading
Limited, and
c) any subsequent consolidation or subdivision of the Company’s shares, and
(ii) such authority shall, unless revoked or varied by the Company at a general meeting, continue in force until the conclusion of the next Annual
General Meeting or the date by which the next Annual General Meeting of the Company is required by law to be held, whichever is the earlier.”
(Resolution 7)
(Please see Explanatory Note 1)
8. To transact any other ordinary business which may be properly transacted at an Annual General Meeting.
BY ORDER OF THE BOARD
Lotus Isabella Lim Mei Hua
Company Secretary
Singapore, 10 July 2014
Explanatory Notes:-
1. The ordinary resolution in item no. 7 is to authorise the Directors of the Company from the date of the above Meeting until the next Annual General
Meeting to issue shares and convertible securities in the Company up to an amount not exceeding in aggregate 50 percent of the issued share capital
of the Company of which the total number of shares and convertible securities issued other than on a pro-rata basis to existing shareholders shall not
exceed 20 percent of the issued share capital of the Company at the time the resolution is passed, for such purposes as they consider would be in the
interests of the Company. This authority will, unless revoked or varied at a general meeting, expire at the next Annual General Meeting of the Company.


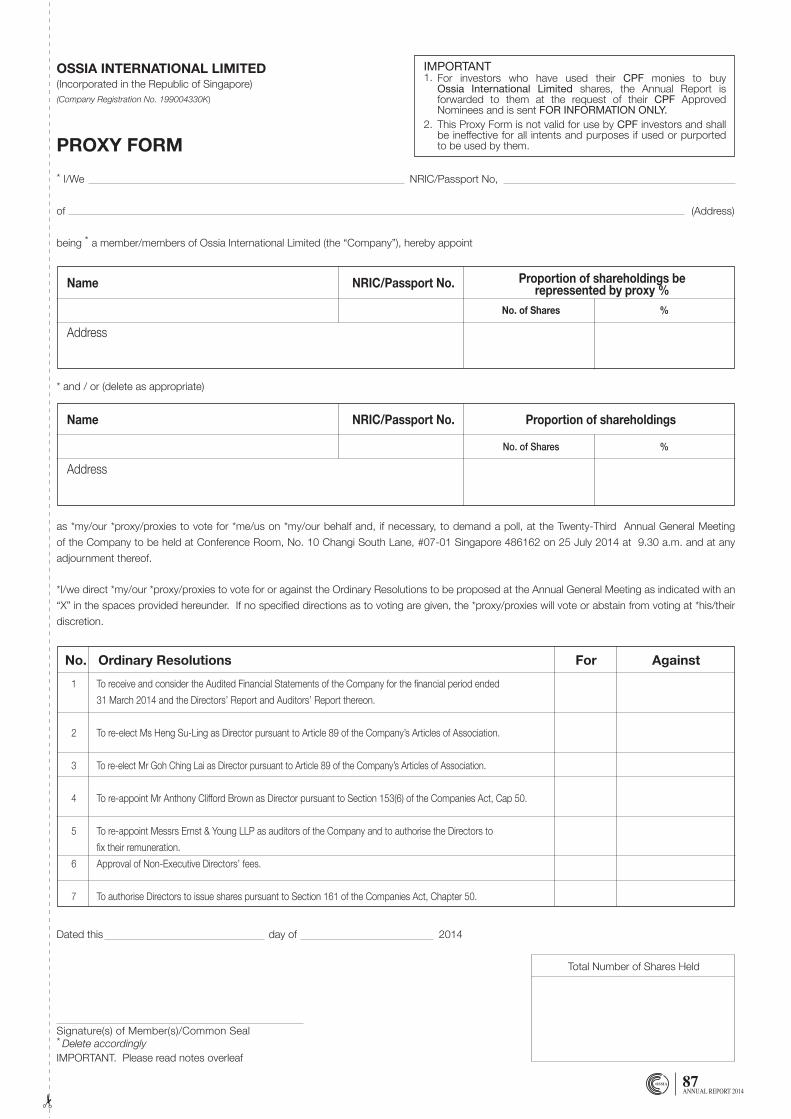
87ANNUAL REPORT 2014
as *my/our *proxy/proxies to vote for *me/us on *my/our behalf and, if necessary, to demand a poll, at the Twenty-Third Annual General Meeting
of the Company to be held at Conference Room, No. 10 Changi South Lane, #07-01 Singapore 486162 on 25 July 2014 at 9.30 a.m. and at any
adjournment thereof.
*I/we direct *my/our *proxy/proxies to vote for or against the Ordinary Resolutions to be proposed at the Annual General Meeting as indicated with an
“X” in the spaces provided hereunder. If no specified directions as to voting are given, the *proxy/proxies will vote or abstain from voting at *his/their
discretion.
OSSIA INTERNATIONAL LIMITED(Incorporated in the Republic of Singapore)(Company Registration No. 199004330K)
For investors who have used their CPF monies to buy Ossia International Limited shares, the Annual Report is forwarded to them at the request of their CPF Approved Nominees and is sent FOR INFORMATION ONLY.This Proxy Form is not valid for use by CPF investors and shall be ineffective for all intents and purposes if used or purported to be used by them.
IMPORTANT1.
2.
Proportion of shareholdings be repressented by proxy %
Proportion of shareholdings
Name
Name
Address
Address
No. of Shares
No. of Shares
%
%
NRIC/Passport No.
NRIC/Passport No.
Dated this day of 2014
1 To receive and consider the Audited Financial Statements of the Company for the financial period ended
31 March 2014 and the Directors’ Report and Auditors’ Report thereon.
2 To re-elect Ms Heng Su-Ling as Director pursuant to Article 89 of the Company’s Articles of Association.
3 To re-elect Mr Goh Ching Lai as Director pursuant to Article 89 of the Company’s Articles of Association.
4 To re-appoint Mr Anthony Clifford Brown as Director pursuant to Section 153(6) of the Companies Act, Cap 50.
5 To re-appoint Messrs Ernst & Young LLP as auditors of the Company and to authorise the Directors to
fix their remuneration.
6 Approval of Non-Executive Directors’ fees.
7 To authorise Directors to issue shares pursuant to Section 161 of the Companies Act, Chapter 50.
No. Ordinary Resolutions For Against
PROXY FORM
Total Number of Shares Held
* I/We NRIC/Passport No,
of (Address)
being * a member/members of Ossia International Limited (the “Company”), hereby appoint
IMPORTANT. Please read notes overleaf
Signature(s) of Member(s)/Common Seal* Delete accordingly
* and / or (delete as appropriate)
Notes:-
1. A member of the Company entitled to attend and vote at the Annual General Meeting is entitled to appoint not more than two proxies to attend and
vote in his stead. Such proxy need not be a member of the Company.
2. Where a member of the Company appoints two proxies, he shall specify the proportion of his shareholding (expressed as a percentage of the whole)
to be represented by each such proxy.
3. The instrument appointing a proxy or proxies must be under the hand of the appointor or his attorney duly authorised in writing. Where the instrument
appointing a proxy or proxies is executed by a corporation, it must be executed under its common seal or under the hand of its attorney or duly
authorised officer.
4. A corporation which is a member of the Company may authorise by resolution of its directors or other governing body such person as it thinks fit to
act as its representative at the Annual General Meeting, in accordance with its Articles of Association and Section 179 of the Companies Act, Chapter
50 of Singapore.
5. The instrument appointing proxy or proxies, together with the power of attorney or other authority (if any) under which it is signed, or notarially certified
copy thereof, must be deposited at the registered office of the Company at No. 10 Changi South Lane #07-01 Singapore 486162 not later than
48 hours before the time set for the Annual General Meeting.
6. A member should insert the total number of shares held. If the member has shares entered against his name in the Depository Register (as defined in
Section 130A of the Companies Act, Chapter 50 of Singapore), he should insert that number of shares. If the member has shares registered in his name
in the Register of Members of the Company, he should insert the number of shares. If the member has shares entered against his name in the
Depository Register and shares registered in his name in the Register of Members of the Company, he should insert the aggregate number of shares.
If no number is inserted, this form of proxy will be deemed to relate to all the shares held by the member of the Company.
7. The Company shall be entitled to reject the instrument appointing a proxy or proxies if it is incomplete, improperly completed or illegible or where the
true intentions of the appointor are not ascertainable from the instructions of the appointor specified in the instrument appointing a proxy or proxies. In
addition, in the case of members of the Company whose shares are entered against their names in the Depository Register, the Company may reject
any instrument appointing a proxy or proxies lodged if such members are not shown to have shares entered against their names in the Depository
Register 48 hours before the time appointed for holding the Annual General Meeting as certified by The Central Depository (Pte) Limited to the Company.
8. A Depositor shall not be regarded as a member of the Company entitled to attend the Annual General Meeting and to speak and vote thereat unless
his name appears on the Depository Register 48 hours before the time set for the Annual General Meeting.
OSSIA INTERNATIONAL LIMITED
10 Changi South Lane #07-01Singapore 486162
AFFIXSTAMP


90ANNUAL REPORT 2014 9

9

Great Alps Industry Co. Ltd11F,No. 32, See 3, Bade Road, Songshan District, TaipeiTel: (886-2) 2570 0918 Fax: (61-2) 2570 1911
Ossia International Limited10, Changi South Lane #07-01Singapore 486162 Tel: (65) 6543 5828 Fax: (65) 6543 5800
Ossia World Of Golf (M) Sdn BhdNo: 5 Jalan Suria Park 1, Suria Industrial Park Kawasan Perindustrian kg. Baru Balakong 43300 Balakong, Selangor Darul EhsanContact Nos: Tel: 603-8961 8299/ Fax: 603-8962 3112
Alstyle International Sdn BhdNo. 89, Jalan 10/91 Taman Shamelin Perkasa 56100 Kuala Lumpur Tel: (03) 9283 2089 Fax: (03) 9284 3053
SINGAPORE
MAlAySIA
Ossia (HK) Company LimitedUnit 2816-2818, 28/F., No. 1 Hung To Road, Kwun Tong, Kowloon, Hong KongTel: (852) 2811 4333 Fax: (852) 2565 0966
TAIWAN
HONG KONG
OfficesOssia

Recommended