Systemic Risk and Asymmetric Responses in the Financial Industry
German Lopez-Espinosa, Antonio Moreno, Antonio Rubia,
Laura Valderrama
WP/12/152

© 2012 International Monetary Fund WP/12/152
IMF Working Paper
Monetary and Capital Markets Department
Systemic Risk and Asymmetric Responses in the Financial Industry 1
Prepared by German Lopez-Espinosa, Antonio Moreno, Antonio Rubia, Laura Valderrama
Authorized for distribution by Dimitri G. Demekas
June 2012
This Working Paper should not be reported as representing the views of the IMF. The views expressed in this Working Paper are those of the author(s) and do not necessarily represent those of the IMF or IMF policy. Working Papers describe research in progress by the author(s) and are published to elicit comments and to further debate.
Abstract
To date, an operational measure of systemic risk capturing non-linear tail comovement between system-wide and individual bank returns has not yet been developed. This paper proposes an extension of the so-called CoVaR measure that captures the asymmetric response of the banking system to positive and negative shocks to the market-valued balance sheets of individual banks. For the median of our sample of U.S. banks, the relative impact on the system of a fall in individual market value is sevenfold that of an increase. Moreover, the downward bias in systemic risk from ignoring this asymmetric pattern increases with bank size. The conditional tail comovement between the banking system and a top decile bank which is losing market value is 5.4 larger than the unconditional tail comovement versus only 2.2 for banks in the bottom decile. The asymmetric model also produces much better estimates and fitting, and thus improves the capacity to monitor systemic risk. Our results suggest that ignoring asymmetries in tail interdependence may lead to a severe underestimation of systemic risk in a downward market. JEL Classification Numbers: C30; G01; G20 Keywords: Value at Risk; systemic risk; tail-risk dependence; downside risk.
Authors’ E-Mail Addresses: [email protected]; [email protected]; [email protected]; [email protected]
1 We thank Francis X. Diebold for comments and suggestions. Financial support from the Spanish Department of Economy (ECO2009-11151 and ECO2011-29751 projects) and Navarra Government (Jerónimo de Ayanz project) is gratefully acknowledged.

-2-
Contents Page
I. Introduction…………………………………………………………………………………3
II. Modeling Systemic Risk: CoVaR..…………………………………………………………5 III. Asymmetric CoVaR………………………………………………………………………...7
A. Estimation and Inference.............................................................................................10 IV. Data………………………………………………………………………………………...11 V. Downside Comovement in the U.S. Banking Industry..…………………………………..13
A. Main Empirical Results..…………………………………………………………….15 B. Discussion…………………………………………………………………………....19 C. Robustness Checks...………………………………………………………………...21
Bank holding companies and commercial banks……………………………….21 Nonlinear models……………………………………………………………….22 Returns of different representative portfolios and other considerations………..24
VI. Concluding Remarks...…………………………………………………………………….24
Figures 1. Comparison of median estimates from the symmetric and asymmetric CoVaR models.........27 2. Cross-sectional median estimates of the decile-based coefficients…………………………..28
Tables 1. Sample descriptives for the total and the filtered samples…………………………………...29 2. Descriptive statistics for economic and financial state variables…………………………….30 3. Median estimates for the symmetric and asymmetric CoVaR……………………………….31 4. Estimates across size-sorted deciles for the symmetric and asymmetric CoVaR……………32 5. Estimates across liabilities-sorted deciles for the symmetric and asymmetric CoVaR………33 6. Estimates across BHCs and CBs for the symmetric and asymmetric CoVaR……………….34
References………………………………………………………………………………………35

- 3 -
I. Introduction
After the collapse of Lehman Brothers in 2008, many of the largest �nancial institutions in the
U.S. were massively bailed out by the Federal government. The unusual market circumstances led
to an unprecedented public intervention fearing that shocks in the subprime mortgage market
could spread and take down the whole banking industry. Similar initiatives were later taken by
local authorities in many countries around the world, aiming to preserve the integrity of the
�nancial system even at a formidable cost to the public sector and the associated increase in
moral hazard. These events highlighted the sheer vulnerability of the global �nancial system to
shocks in large-scale banks and the magnitude of the shockwaves propagated through the �nancial
system into the real economy from the failure or impairment of large �nancial institutions. As a
direct consequence, a revamped international regulatory framework aimed at strengthening global
capital and liquidity rules has recently emerged to prevent future episodes of systemic contagion
and mitigate moral hazard concerns.
The need to quantify systemic risk and identify the economic drivers of systemic spillovers in the
�nancial industry has motivated a fast growing academic literature in this �eld; see, among
others, Goodhart and Segoviano (2009), Huang et al. (2009), Acharya et al. (2010), Zhou (2010),
Brownlees and Engle (2011), and Diebold and Yilmaz (2011) for recent studies. In this context,
Adrian and Brunnermeier (2011) have recently proposed a statistical approach to estimate
systemic risk contributions. The so-called CoVaR is a bilateral measure of downside risk that, in
the spirit of the well-known Value at Risk (VaR), determines the expected loss of the whole
�nancial sector conditional on the VaR of an individual �nancial institution. The marginal
contribution of a �rm to the system, termed �CoVaR, is the incremental value of CoVaR
conditional on the �rm being in distress with respect to the CoVaR conditional on the average or
normal state of the �rm. The �stressed�and �average�states of nature are quantitatively
represented by the � � 100 percent and 50 percent VaR levels of the �rm, respectively, with theprobability � taking usual values in downside risk analysis.
In this paper, we discuss the suitability of the general modeling strategy implemented in Adrian
and Brunnermeier (2011) and propose a direct extension which accounts for nonlinear tail
comovements between individual bank returns and �nancial system returns. Like most VaR
models, the CoVaR approach builds on semi-parametric assumptions that characterize the
dynamics of the time series of returns. Among others, the procedure requires the speci�cation of
the functional form that relates the conditional quantile of the whole �nancial system to the
returns of the individual �rm. The model proposed by Adrian and Brunnermeier (2011) assumes
that system returns depend linearly on individual returns, so changes in the latter would feed
proportionally into the former. This assumption is simple, convenient, and to a large extent
facilitates the estimation of the parameters involved and the generation of downside-risk
comovement estimates. On the other hand, this structure imposes certain limitations, as it

- 4 -
neglects nonlinear patterns in the propagation of volatility shocks and of perturbations to the risk
factors a¤ecting banks�exposures. Both patterns feature distinctively in downside-risk dynamics.
There are strong economic arguments that suggest that the �nancial system may respond
nonlinearly to shocks initiated in a single institution. A sizeable, positive shock in an individual
bank is unlikely to generate the same characteristic response (i.e., comovement with the system)
in absolute terms than a massive negative shock of the same magnitude, particularly if dealing
with large-scale �nancial institutions.2 The disruption to the banking system caused by the
failure of a �nancial institution may occur through direct exposures to the failing institution,
through the contraction of �nancial services provided by the weakening institution (clearing,
settlement, custodial or collateral management services), or from a shock to investor con�dence
that spreads out to sound institutions under adverse selection imperfections (Nier, 2011). Indeed,
an extreme idiosyncratic shock in the banking industry, will not only reduce the market value of
the stocks a¤ected, but may also spread uncertainty in the system rushing depositors and lending
counterparties to withdraw their holdings from performing institutions and across unrelated asset
classes, precipitating widespread insolvency. Historical experience suggests that a con�dence loss
in the soundness of the banking sector takes time to dissipate and may generate devastating
e¤ects on the real economy. Bernanke (1983) comes to the conclusion that bank runs were largely
responsible of the systemic collapse of the �nancial industry and the subsequent contagion to the
real sectors during the Great Depression. Another channel of contagion in a downward market is
through the �re-sales of assets initiated by the stricken institution to restore its capital adequacy,
causing valuation losses in �rms holding equivalent securities. This mechanism, induced by the
generalized collateral lending practices that are prevalent in the wholesale interbank market, can
exacerbate price volatility in a crisis situation, as discussed by Brunnermeier and Pedersen (2009).
The increased complexity and connectedness of �nancial institutions can generate �Black Swan�
e¤ects, morphing small perturbations in one part of the �nancial system into large negative shocks
on seemingly unrelated parts of the system. These arguments suggest that the �nancial system is
more sensitive to downside losses than upside gains. In such a case, the linear assumption involved
in Adrian and Brunnermeier (2011) would neglect a key aspect of downside risk modeling and
lead to underestimate the extent of systemic risk contribution of an individual bank.
We propose a simple extension of this procedure that encompasses the linear functional form as a
special case and which, more generally, allows us to capture asymmetric patterns in systemic
spillovers. We shall refer to this speci�cation as asymmetric CoVaR in the sequel. This approach
retains the tractability of the linear model, which ensures that parameters can readily be
2 In microprudential risk management, the reasons explaining this asymmetric pattern are mainly related to how
investors who own bank stocks and/or deposits perceive risk. Broadly speaking, stockholders care di¤erently about
large downside losses than they do about upside gains, showing greater sensitiveness to reductions in their level of
�nancial wealth. This behavior is consistent with loss aversion or decreasing absolute risk aversion preferences; see,
among others, the theoretical models in Gul (1991), Barberis et al. (2001), Berkelaar and Kouwenberg (2009), and
the empirical evidence in McQueen and Vorkink (2004), Ang et al. (2005) and Bali et al. (2009).

- 5 -
identi�ed by appropriate techniques, and produces �CoVaR estimates which are expected to be
more accurate. Furthermore, given the resultant estimates, the existence of nonlinear patterns
that motivate the asymmetric model can be addressed formally through a standard Wald test
statistic. In this paper, we analyze the suitability of the asymmetric CoVaR in a comprehensive
sample of U.S. banks over the period 1990-2010. We �nd strong statistical evidence suggesting
the existence of asymmetric patterns in the marginal contribution of these banks to the systemic
risk. Neglecting these nonlinearities gives rise to estimates that systematically underestimate the
marginal contribution to systemic risk. Remarkably, the magnitude of the bias is tied to the size
of the �rm, so that the bigger the company, the greater the underestimation bias. This result is
consistent with the too-big-to-fail hypothesis which stresses the need to maintain continuity of the
vital economic functions of a large �nancial institution whose disorderly failure would cause
signi�cant disruption to the wider �nancial system.3 Ignoring the existence of asymmetries would
thus lead to conservative estimates of risk contributions, more so in large �rms which are more
likely to be systemic. Accounting for asymmetries in a simple extension of the model would
remove that bias.
The remainder of the paper is organized as follows. Section 2 introduces the main features of the
CoVaR framework and discusses the symmetric model suggested by Adrian and Brunnermeier
(2011). Section 3 proposes a direct extension of this setting in which the functional form that
characterizes the conditional quantile of the banking system is allowed to depend nonlinearly on
positive and negative individual returns. Section 4 discusses the main features of the sample data
analyzed in this paper. Section 5 presents the main evidence related to the sample �tting of the
models and discusses the main implications, demonstrating the outperformance of the asymmetric
CoVaR model. Finally, Section 6 summarizes and concludes.
II. Modeling Systemic Risk: CoVaR
In this section, we brie�y describe the CoVaR methodology in Adrian and Brunnermeier (2011)
(AB henceforth). We start our discussion by �rstly introducing notation and relevant variables.
Let Xt;S and Xt;i; t = 1; :::; T; be the simple returns of the whole �nancial system and of the
individual institution, respectively. Since our focus is on the impact of the deleveraging process in
the �nancial system, it will be convenient to de�ne these returns as the growth rate of
market-valued total assets held by either the whole �nancial system or each individual institution.
Our main aim in Section 5 is to capture tail comovement originated by the propagation of distress
associated with a decline in the market value of the assets held by an individual institution, a
shock that we dub balance sheet contraction. However, the speci�c de�nition of return is not
essential for the CoVaR methodology, and the procedure described below applies naturally on the
3As of September 30, 2011, 37 bank holding companies with assets over $50 billion, held $4.14 trillion insured
deposits accounting for 61 percent of all insured deposits in the United States.

- 6 -
returns of other representative portfolios.
For a certain probability level � 2 (0; 1) ; the � � 100 percent VaR of a portfolio, denoted V aRP�;t;can be de�ned as the implicit value z that solves fminz2R : Pr (Xt;P � z) � �g ; where Xt;Pdenotes the returns of such portfolio. Typically, � is a small probability and z is a (negative)
value in the left tail of the distribution, so VaR can be seen as the � -quantile of the loss
probability distribution or, equivalently, the (1� �) percent con�dence interval of the maximumloss. Paralleling this de�nition, the CoVaR between the system and an individual institution, here
denoted CoV aRSjit (� ; ��) ; can generally be de�ned as the � -quantile of the conditional
distribution of Xt;S given the event Xt;i = V aRi��;t; i.e., the real value which implicitly solves
minz2R
Pr�Xt;S � zjXt;i = V aRi��;t
�� � (1)
with �� 2 (0; 1) denoting an arbitrary probability associated to the individual VaR level. For acertain small target probability � related to downside risk events (e.g., � = 0:01); and setting
�� = � ; the marginal contribution of the individual institution to the overall systemic risk, here
denoted �CoV aRSjit (�), is de�ned in AB as
�CoV aRSjit (�) = CoV aR
Sjit (� ; �)� CoV aRSjit (� ; 0:5) (2)
i.e., the vertical distance between the � -th conditional quantile function of Xt;S evaluated at
Xt;i = V aRi� ;t and that evaluated at Xt;i = V aR
i0:5;t: Under the restriction �
� = � ; the CoVaR
function is completely characterized by the shortfall probability � . Hence, we shall simply denote
CoV aRSjit (�) = CoV aR
Sjit (� ; �) for notational convenience.
Since the individual V aRi� ;t dynamics are unobservable, in practice the conditioning is made on
the sample estimates of this process. This stage is exogenous and any VaR methodology in the
vast literature devoted to this �eld would produce such estimates; see, for instance, McNeil et al.
(2005) for a review. The crucial point in this procedure is to specify the functional form of
CoV aRSjit (�) as a function of the individual bank�returns, i.e., to characterize the conditional
quantile of Xt;S as a function of Xt;i. Let t = (Z0t; Xt;i)0 be a set of relevant observable
information, with Zt denoting a vector of suitable variables. The conditional quantile function of
Xt;S given t, denoted QXt;S (� jt) ; can generally be represented asQXt;S (� jt) = f (Xt;i;Zt;� (�)) ; where f (�) is a measurable function and � (�) is a vector ofunknown parameters possibly depending on � . Like other features of the conditional distribution
of returns, conditional quantiles are not observable directly, so the functional form f (�) thatcharacterizes this process is formally unknown. Di¤erent econometric speci�cations, building on
di¤erent assumptions, may give rise to fairly di¤erent estimates, so it is important to assume a
sensible representation. AB assume a linear model characterized by
QXt;S (� jt) = Z0t�1�M (�) + �i (�)Xt;i (3)
where Zt�1 is a vector of variables containing predictors of the conditional mean and variance of
returns. In this model, the coe¢ cient �i (�) 6= 0 captures systemic spillovers and measures the

- 7 -
average response of the � -th quantile given the unconditional distribution of Xt;i after controlling
for other e¤ects.
Since (3) is linear, the unknown parameters � (�) =��0M (�) ; �i (�)
�0 can be estimatedconsistently in a linear quantile regression model under standard assumptions; see Koenker and
Bassett (1978) and Koenker (2005). Given the resultant estimates, the CoV aRSjit (�) function is
then predicted as\CoV aR
Sjit (�) = Z0t�1b�M (�) + b�i (�)]V aRi� ;t (4)
noting that the unknown parameters have been replaced with their consistent estimates and Xt;S
is evaluated at the (estimated) value at risk level, ]V aRi
� ;t. The di¤erent notation given to the
estimates involved emphasizes that CoVaR predictions build on previous forecasts of the
individual VaR process.4 Then, according to (2), the predicted value of �CoV aRSjit (�) is given by
� \CoV aRSjit (�) = \CoV aR
Sjit (�)� \CoV aR
Sjit (� ; 0:5)
= b�i (�) h]V aRi� ;t �]V aRi0:5;ti (5)
Some comments are in order. The representation that links Xt;S to Xt;i is not necessarily causal
and may be driven by common latent factors; see AB for a discussion. The lagged state variables
control for e¤ects that capture variations in tail-risk not directly related to the �nancial system
risk exposure, while contemporaneous comovements are captured through the �i (�) parameter.
Hence, this parameter critically determines the contribution of the individual bank to the systemic
risk, with � \CoV aRSjit (�) being proportional to this term. Note that two banks may have the
same individual downside risk, as measured by V aR�;t; and nevertheless cause a di¤erent impact
on the system. For the main aim of this paper, the most striking feature is that the conditional
quantile of the system depends linearly on the idiosyncratic returns Xt;i: This seems particularly
restrictive because the magnitude of comovements is most likely to be larger (in absolute terms)
in downside periods than in upside times, as discussed previously. In the econometric
speci�cation, b�i (�) captures an average response given the unconditional distribution of Xt;i:Hence, if comovements are larger when Xt;i is negative, then (3) would lead to conservative
estimates of the true systemic link, causing downward biased estimates of �CoV aRSjit (�).
III. Asymmetric CoVaR
We now propose a straightforward generalization of the previous model to accommodate
asymmetries that most likely characterize systemic interrelations. Our approach largely builds on
4Given ]V aRi
�;t, \CoV aRSjit (�) could be obtained from the quantile regression QXt;S (� jt) = Z
0t�1�M (�) + �i (�)
]V aRi
�;t. However, this model introduces measurement errors which may have a nontrivial impact and should be
taken care of properly in the estimation. The procedure suggested in AB circumvents this problem.

- 8 -
the AB setting and is a direct extension of this methodology. In the absence of systemic
interdependences, the system�s return fXt;Sg could generally be generated according to thefollowing linear factor structure,
Xt;S = �+M0t�1 + �t�t; �t � iid (0; 1) (6)
where Mt is a p-vector of conditioning variables that characterize a time-varying expected return,
�t is an independent term with innovations, and �t is the volatility process. In practice, Mt may
contain valuation and corporate ratios, bond yields, default premiums, and any other variable
that may capture the dynamics of the expected return. If = 0; returns will behave as a
martingale di¤erence.
De�ne the signed processes X�t;i = Xt;iI(Xt;i<0) and X
+t;i = Xt;iI(Xt;i�0); where I(�) is the indicator
function. A simple and convenient variation of (6) in which the distribution of Xt;S may be
a¤ected by systemic shocks in the individual asset is then given by
Xt;S = �+M0t�1 + �1;iX
�t;i + �2;iX
+t;i + �t�t (7)
with �t = �t (Xt;i) + �t;S such that
�t (Xt;i) = �0;i + �1;iX�t;i + �2;iX
+t;i (8)
and
�t;S = �S +N0t�1� (9)
where Nt denotes a vector of suitable predictors of the conditional volatility, and (�; 0; �1;i; �2;i)0 ;
(�0;i; �1;i; �2;i)0 ; and
��S ; �
0�0 are unknown parameter vectors characterizing the conditional meanand variance of Xt;S . Some features of this model are worth discussing in detail.
First, �1;i can be seen as a downside beta-type coe¢ cient that captures comovements of the
system portfolio with the individual portfolio when this is falling. Reciprocally, �2;i captures
upside comovements. Consequently, if (�1;i; �2;i)0 > 0; a sudden change in the individual asset will
translate nonlinearly into the system shifting the conditional mean of Xt;S in the same direction
as Xt;i, with �j;i capturing the average comovement with negative (j = 1) and positive (j = 2)
shocks, respectively. This functional form is reminiscent of the the semi-variance models used,
among others, by Hogan and Warren (1974), Bawa and Lindenberg (1977) and Harlow and Rao
(1989).5 These asset pricing models are theoretically founded in loss-aversion behaviors for which
utility increases from gains are not necessarily the same as the utility decreases from losses, as
discussed previously; see, for instance, Ang et al. (2005) and references therein for a recent survey
of this literature. From a more intuitive perspective, it perhaps su¢ ces to note that Xt;i is a
natural proxy of the information �ow on the individual bank, with X+t;i and X
�t;i being obviously
5Note that we can reverse the model and focus on the returns of the individual bank as a function of the sytem
in a more familiar representation closer to the CAPM and, particularly, the semi-variance models. Under this
representation, the CoVaR would measure the exposure of the individual bank to the system.

- 9 -
related to �good�and �bad�news. As shown in Andersen et al. (2007) and Beber and Brandt
(2010), the returns of �nancial assets exhibit asymmetric patterns when investors are confronted
with di¤erent types of news, particularly, at di¤erent phases of the business cycle. More
importantly, Longin and Solnik (2001) and Andersen et al. (2012) show that cross-asset
dependencies of returns show sizable asymmetries with correlations between negative returns
signi�cantly larger than those between positive returns. Also this asymmetry seems to increase
for extreme events. This empirical observation is particularly relevant given our focus on quantile
conditional distributions. Model (7) allows us to capture asymmetric patterns and predict tail
comovements.
Second, the asymmetric model also captures systemic comovements via volatility. The total
volatility of the system is decomposed into �t (Xt;i) ; a term which captures volatility spillovers
with the individual bank, and �t;S , an autonomous component driven by the market. The
volatility term �t (Xt;i) could be seen as an a¢ ne function of the volatility of Xt;i and, therefore,
can exhibit asymmetric patterns as a function of the sign of Xt;i, one of the most well-known and
documented features of �nancial volatility; see, for instance, Nelson (1991).6 The economic
reasons for asymmetries in volatility are not entirely clear. They were early related to leverage
e¤ects (Black 1976), but the measured e¤ect of stock price changes on volatility is too large to be
explained solely by �nancial leverage changes (Christie 1982). Asymmetries were also justi�ed in
terms of time-varying risk premiums (see, for instance, French et al. 1987), but this hypothesis
only enjoys partial success because it fails to explain why stock volatility typically increases after
the arrival of good news; see Bekaert and Wu (2000). Trade-induced e¤ects and loss-aversion
preferences may generally provide a more consistent explanation; see McQueen and Vorkik (2004)
and Berkelaar and Kouwenberg (2009) for a discussion.
The market-related component �t;S can be predicted by a suitable set of state variables. If Nt
contains at least one persistent predictor, �t;S could be seen as a long-term or permanent
component, with �t (Xt;i) capturing short-term deviations arising from systemic spillovers. Given
an observable proxy of market volatility, such as the implied volatility index, VIX, a simple
predictive model would state the a¢ ne function �t;S = �S + � VIXt�1; with �S > 0; � � 0: Notethat the behavior of implied volatility has been documented to exhibit the stylized features of
volatility, namely, persistence, clustering, and asymmetric patterns such that volatility is much
higher following negative market return shocks. This motivates this simple model, noting that
further parametric alternatives are plausible, yet at a cost of higher complexity.
Finally, it is interesting to note that, with certain independence of the economic arguments that
generally back up the existence of asymmetries, nonlinear patterns in the returns of the banking
industry may arise as consequence of regulatory capital requirements and market practices.
6The volatility equation can be reparameterized trivially as �t (Xt;i) = �0;i � �1;ijXt;ij � I(Xt;i<0) + �2;ijXt;ij �I(Xt;i�0): Absolute-valued returns sample at a high-frequency are an unbiased (but particularly noisy) proxy of the
latent volatility process, so �t (Xt;i) can be seen as a function of the volatility of the individual returns.

- 10 -
Under the standardized approach proposed by international standards setters on �nancial
regulation, banks must use external assessments from credit rating institutions on their exposures
to individual banks to determine the proper risk weights. These weights are determined according
to a nonlinear criterion. For instance, the risk weight on a claim held on a certain bank is 50
percent if its credit rating is BBB. One notch rating upgrade to A leaves the risk weight
unchanged at 50 percent, yet one notch rating downgrade to BB raises the risk weight of the
claim to 100 percent. Hence, negative individual shocks can trigger negative upgrades, forcing the
remaining banks to hold a larger capital bu¤er against claims on this individual bank, thereby
depressing the return of the system as a whole. This e¤ect is compounded by the asymmetric
behavior of provisioning that kicks in when repayment of a claim on a speci�c bank remains past
due for a speci�c period of time, amplifying the comovement in asset returns in bad times.
A. Estimation and Inference
In model (7)-(9), changes in Xt;i can lead to tail comovements with the system because they feed
into the conditional mean and/or the variance of Xt;S . To see this more explicitly, note that the
quantile function of Xt;S conditional on the set of observable information
t =�1;M0
t�1;N0t�1; X
�t;i; X
+t;i
�0can be characterized as
QXt;S (� jt) = � (�) +M0t�1 +N
0t�1� (�) + �
� (�)X�t;i + �
+ (�)X+t;i
= 0t� (�) (10)
where the vector of unknown parameters � (�) =�� (�) ; 0; �0 (�) ; �� (�) ; �+ (�)
�0 is de�nedimplicitly, noting that � (�) � �+ [�S + �0;i]F�1� (� jt) ; �� (�) � �1;i + �1;iF�1� (� jt) ;�+ (�) � �2;i + �2;iF�1� (� jt) ; and � (�) � �F�1� (� jt) ; with F�1� (� jt) denoting the conditional� -quantile of �t:
If �1;i > 0 and �1;i < 0; a negative shock in Xt;i will shift Xt;S downwards and, simultaneously,
increases the conditional volatility of the process, a most likely event in a scenario of �nancial
distress. Since F�1� (� jt) is expected to be negative for left-tail probabilities � ; the loss-relatedCoVaR parameter �� (�) is positive under these conditions. As a result, a shock leading to
negative values of Xt;i not only will increase the VaR of the individual bank, but may also feed
into the QXt;S (� jt) function leading the conditional VaR of the system to a greater level in
absolute terms.
Equation (10) acknowledges nonlinear patterns in QXt;S (� jt) as a function of Xt;i, but it is stilllinear in parameters. Hence, under standard regularity conditions, � (�) can be estimated
consistently by the linear quantile regression methodology proposed by Koenker and Bassett
(1978). In particular, the quantile-regression estimator of � (�) given t; denoted b� (�) ; is de�ned

- 11 -
as
arg minb2Rn
TXt=1
���Xt;S �0tb
�(11)
at a �xed � ; with �� (z) = z(� � I(z<0)) and n denoting the number of parameters to be estimated.De�ne the signed processes V aRi��;t = V aR
i� ;t � I(V aRi��;t<0) and V aR
i+�;t = V aR
i� ;t � I(V aRi�;t�0):
Then, given the estimates of (11), forecasts of the CoVaR process based on the asymmetric model
are generally generated according to
\CoV aRSjit (� ; ��) = b� (�) +M0
t�1b +N0t�1b� (�) + b�� (�)]V aRi���;t + b�+ (�)]V aRi+��;t (12)
given previous estimates of the signed VaR processes. Setting �� = � , and recalling (2) ; we then
can write
� \CoV aRt (�) = \CoV aRSjit (�)� \CoV aR
Sjit (� ; 0:5)
= b�� (�) h]V aRi��;t �]V aRi�0:5;ti+ b�+ (�) h]V aRi+�;t �]V aRi+0:5;ti (13)
which generalizes (5) in an obvious way.
Under fairly general conditions, the estimator b� (�) in (11) is consistent and asymptoticallynormal such that
pT�b� (�)� � (�)� d! N (0;V� ) as the sample size T diverges, with V�
denoting a �nite covariance matrix. The model analyzed in AB arises as a particular case in this
setting by considering the same state variables in the conditional mean and variance, Nt =Mt;
which only implies a trivial rearrangement of parameters in our speci�cation, and imposing the
restrictions �1;i = �2;i; �1;i = �2;i; and �0;i = 0 in the corresponding equations. Therefore, the
suitability of the asymmetric CoVaR model against a simpler symmetric speci�cation can directly
be addressed testing the restriction H0 : �� (�) = �+ (�) through the Wald test statistic
ThR0b� (�)i �R0V�R��1 hR0b� (�)i d! �2(1) (14)
where �2(1) denotes a Chi-squared distribution with one degree of freedom, and
R =(0; :::; 0;�1; 1)0 is a (n� 1) selection vector with non-zero entries in the last two rows,corresponding to the position of the �� (�) and � (�) parameters. The asymptotic covariance
matrix V� can be estimated consistently by di¤erent procedures, as surveyed in Koenker (2005);
see Section 5 for details in our empirical analysis.
IV. Data
Our dataset is obtained from di¤erent sources. We gathered quarterly balance sheet data of
individual banks in the U.S. �nancial industry over the period Q1 1990 through Q4 2010 from the
Federal Reserve Bank of Chicago Bank Regulatory Database. This includes accounting data from
the required regulatory forms �led for supervising purposes by regulated depository �nancial

- 12 -
institutions. More speci�cally, we collected data for the class of publicly traded institutions
focusing on Bank Holding Companies (BHC) and Commercial Banks (CB). The total sample
includes 32,204 panel-data observations grouped into 791 BCH and 65 CB. For any of these
companies, we collected data of di¤erent accounting items such as total assets, liabilities, equity,
and leverage ratio.
In order to implement the quantile regression methodology, we apply a selection �lter that
requires banks to be traded over at least 500 weeks on the stock market. This somewhat arbitrary
choice seeks to obtain a good compromise between the number of time-series observations that
ensure valid inference in the quantile-regression analysis and the total number of �rms included in
the �ltered sample that ensures a meaningful cross-sectional analysis. The resulting subsample is
composed of 340 BHC and 25 CB, totaling 21,786 panel-data observations. It should be noted
that, while the CoVaR methodology is implemented on each bank in the �ltered sample, we use
di¤erent criteria to de�ne the returns of the �nancial system as a whole, among which we
construct a single index composed of all the returns of all individual banks in the total sample. In
this approach, all the available information is used to de�ne the dependent variable in the
quantile-regression analysis; see Section 5 for further details.
Table 1 reports standard descriptive statistics of the main accounting indicators used in our
analysis, distinguishing between total and �ltered sample, and between BHC and CB. A most
distinctive feature of the banking industry is a high degree of leverage (high total assets to capital
ratios), which provides little room to soak losses and justi�es regulatory concerns. The high level
of dispersion in the total size of the banking institutions is also remarkable, since the sample
includes �rms with total assets (or liabilities) that range from a fairly small book value to over
USD 2 trillion. For instance, the book value of Bank of America�s total assets reached USD 2.2
trillion in 2010, representing over 15 percent of U.S. GDP. Clearly, BHC companies tend to be
larger than CB. Comparing the accounting variables in the total and the �ltered samples we
observe that the distribution of banks in the �ltered sample is shifted to the right with respect to
the distribution of the total sample. Firms that do not ful�ll the minimum length requirement are
essentially small and medium-size banks which are unlikely to represent a serious concern to the
system. Hence, the main interpretation of the qualitative evidence obtained from the analysis on
the performance of the asymmetric model in relation to its symmetric counterpart is not a¤ected
by the design of the sample. Logically, the estimates from both models re�ect features that are
related to the predominance of large �rms in the sample. We shall discuss this issue in greater
detail in Section 5.
Following AB, we use a range of economic and �nancial state variables that typically capture the
time-varying dynamics of expected returns and/or the conditional volatility. As shown in
Cenesizoglu and Timmerman (2008), these variables may be useful predictors of the tail dynamics
of the conditional distribution of returns. In particular, we use the return of the market portfolio
(proxied by the S&P500 index), di¤erent term structure measures capturing the level and slope of

- 13 -
the yield curve, and a measure of credit risk. Speci�cally, we include as state variables changes in
the U.S. Treasury bill secondary market 3-month rate, the yield spread between the U.S. Treasury
benchmark bond 10-year and the U.S. 3-month T-bill, and the credit spread between the 10-year
Moody�s seasoned Baa corporate bond and the 10-year U.S. Treasury bond. We also include the
CBOE index of implied volatility (VIX) to capture market equity risk as a predictor of market
volatility. The data is extracted from the Chicago Board Options Exchange, the Federal Reserve
Board�s H.15 Release, and Datastream. Table 2 reports descriptive statistics.
Finally, the period of analysis is long enough to include di¤erent cycles of economic activity.
Economic recessions are usually identi�ed exogenously after a period of two consecutive quarters
of negative GDP growth. Similarly, the total sample includes the greatest �nancial turmoil in the
U.S. since the Great Depression. Although the predictive variables in our analysis are strongly
tied to the economic cycle, we additionally control for potential structural-break e¤ects through
dummy variables related to bearish market conditions. Thus, we de�ne an Economic Recessions
dummy variable taking the value equal to one in the periods identi�ed as a macroeconomic
recessions by the NBER (July 1990- March 1991, March 2001- November 2001 and December
2007-June 2009) and zero otherwise. Similarly, we de�ne a Financial Recession indicator taking
the value equal to one from August 2007 through March 2009. This period matches the timing of
maximum disruption in money markets caused by �nancial uncertainty and counterparty credit
risk. In this period, the spread between the 3-month LIBOR and the 3-month OIS rates, widely
taken as a market indicator of counterparty risk premium, reached historical maximums and
remained well above the average pre-crisis level.7
V. Downside Comovement in the U.S. Banking Industry
For each bank in the sample, we construct a weekly return time-series, Xt;i; de�ned as the simple
growth rate of the market-valued total assets, At;i, held by the i-th bank. These series are
computed as the product of the leverage ratio (total assets to book equity) and the market value
of equity. Whereas market equity data are available at a weekly frequency, balance sheet data for
U.S. �nancial institutions are disclosed on a quarterly basis. To circumvent the sampling
frequency mismatch, we smoothed weekly the quarterly leverage ratio using cubic spline
interpolation, a well-known technique in applied �nance. It should be mentioned that the results
in the subsequent analysis reported below are not particularly sensitive to this consideration. We
also applied a constant leverage ratio approach (i.e., applying a constant weekly value equal to
that in the quarter) as in AB noting no qualitative di¤erence.8
7The average value of the LIBOR-OIS spread over August 2007 through March 2009 reached 981 basis points,
well above the pre-crisis average value of 104 basis points.8 In our view, using smoothing techniques may be preferable because it allows us to avoid seasonal e¤ects related
to the timing in which accounting information is updated.

- 14 -
Given these series, we adopt two di¤erent procedures to de�ne representative portfolios of the
banking system. First, given the observations in the total sample, we determine a single banking
industry index. The value of this portfolio is simply a value-weighted average of the
market-valued total assets held by all the banks in the sample at a certain time. Hence, the
returns of this portfolio, Xt;S ; are de�ned as Xt;S =PNtj=1 !t;jXt;j ; where following AB we set
!t;j = At�1;j=PNts=1At�1;s, with Nt denoting the number of banks at time t. Therefore, although
we shall compute CoVaR measures for a subset of N = 365 banks that ful�ll minimum length
requirements, all the available information is used to generate the returns of the system in this
approach. We shall refer to this procedure as the �single-index system�approach in the sequel.
Alternatively, and considering exclusively the �ltered sample constituted by N = 365 �rms, for
each one of these banks we construct a portfolio representative of the surrounding system. Thus,
for each �rm, we de�ne a bank-speci�c system portfolio with returns given by
Xt;S =PNj=1 !
�t;jXt;j ; where the weights are now computed according to !
�t;j = 0 if j = i and
!�t;j = At�1;j=PNs=1;j 6=sAt�1;s otherwise, i.e., a weighted average of all the individual returns in
the �ltered sample except that of the bank under analysis. This procedure ensures a small-sample
adjustment that prevents a mechanical correlation e¤ect (i.e., a spurious interdependence)
between the individual bank and the system when the total number of institutions N is not
particularly large and/or when a single institution has a signi�cant weight in relation to the rest
of the �nancial system. Because the bank under analysis is not included, the analysis of tail
comovements is more rigorous and necessarily rules out the possibility of spurious interrelations
stemming from the simultaneous presence of the same �rm in both portfolios. Note that,
although the bank is not explicitly related to the system under this approach, it may be implicitly
related if the bank�s balance is interconnected with the remaining banks�balances. This approach
has been implemented in López-Espinosa et al. (2012) to address systemic interrelations in the
global banking industry. We shall refer to this procedure as the �multiple-index system�approach
in the sequel.
Both the individual VaR and the CoVaR functions are estimated at the weekly frequency using a
vector of economic and �nancial variables as potential predictors. This vector, denoted Zt in the
sequel, includes a constant (Constant), the CBOE implicit volatility index (VIX), the return of the
S&P500 index (Market Return), changes in the U.S. Treasury bill secondary market 3-month rate
(�T-bill), yield spread between the U.S. Treasury benchmark bond 10-year and the U.S. 3-month
T-bill (Yield Slope), credit spread between the 10-year Moody�s seasoned Baa corporate bond and
the 10-year U.S. Treasury bond (Default Premium) and two dummy variables related to economic
recessions (NBER recessions) and the 2007-2009 �nancial recession (Financial Recession).

- 15 -
A. Main Empirical Results
In this section, we discuss the suitability of di¤erent speci�cations of the CoVaR equation at the
usual shortfall probabilities � 2 f0:01; 0:05g in downside risk modelling. The parameters thatcharacterize the symmetric CoVaR proposed by AB can generally be estimated from the linear
quantile regression model
Xt;S = Z0t�1 i (�) + �i (�)Xt;i + u�;t (15)
with i = 1; :::; N; t = 1; :::; Ti; and u�;t denoting an error term satisfying fairly general, standard
conditions. Note that the number of time-series observations available for each �rm in the �ltered
sample ranges from a minimum length of 500 weeks to a maximum of 1; 096 weeks in the period.9
The dependent variable, Xt;S ; is determined according to either the single-index or the
multiple-index system approach described previously. Similarly, the asymmetric CoVaR model
can be estimated from the linear quantile regression model
Xt;S = Z0t�1 i (�) + �
�i (�)X
�t;i + �
+i (�)X
+t;i + u�;t (16)
as discussed in Section 3.
To generate exogenous forecasts of the individual VaR process of each bank and compute
time-varying �CoVaR downside risk contributions, we estimate the linear quantile regression
model
Xt;i = Z0t�1�i (�) + "�;t (17)
at the � -th quantile, using the same set of predictive variables as in the CoVaR model. Quantile
regressions to model VaR dynamics have been used, among others, in Taylor (1999),
Chernozhukov and Umantsev (2001), and Cenesizoglu and Timmerman (2008). Given the
resulting estimates, e�i (�) ; the bank-speci�c VaR forecasts are simply determined by]V aR
i
� ;t = Z0t�1e�i (�). We then generate weekly � \CoV aR
Sjit (�) measures as a function of the
quantile-regression estimates of the symmetric and asymmetric CoVaR models and the individual
VaR forecasts, as discussed previously.
The asymptotic covariance matrix of the parameter estimates is inferred by combining
kernel-density estimation with a heteroscedasticity-consistent covariance matrix estimation; see
Koenker (2005). In particular, de�ne the outer-product matrix A�;T = � (1� �)PTt=1t
0t=T;
and let be D�;T = (ThT )�1PT
t=1K (bu�;t=hT )t0t, where K (�) is a kernel function, hT is abandwidth parameter, bu�;t denotes the estimated residuals from the quantile regression, and t
denotes the set of variables involved, e.g., t =�Z0t�1; X
�t;i; X
+t;i
�0in the more general case treated
here. Then, a consistent estimate of V� is given by the �sandwich-type�estimator D�1�;TA�;TD
�1�;T :
9The average number of time-series observations is 781. The distribution of the number of available observations
in our sample does not seem to be related to �rm-speci�c characteristics. For instance, the cross-sectional correlation
between available observations and average size over the period is 4.96 percent.

- 16 -
We implemented the Gaussian kernel in this approach and selected hT optimally according to
Silverman�s rule, i.e., hT = 0:9�min fb�u; IQRbug � T�1=5; where b�u and IQRbu denote the samplestandard deviation and the sample interquartile range of bu�;t.Table 3 shows the median of the parameter estimates of equations (15) and (16) across banks in
the �ltered sample, the median of the respective robust t-statistics for individual signi�cance, and
the median of the pseudo-R2 in the quantile regressions given the single- and multiple-indexsystem approaches. Table 3 also reports the sample rejection frequencies of several meaningful
test statistics at the 95 percent con�dence level involving the main CoVaR parameters. In
particular, we are interested in the null hypothesis that Xt;S is not a¤ected by Xt;i, which implies
H0;Ind : �i (�) = 0 in (15) and H0;Ind : ��i (�) = �
+i (�) = 0 in (16). These hypotheses can be tested
through Wald-type tests statistics asymptotically distributed as a �2(1) and �2(2), respectively.
Note that, given the estimates of the respective risk models, this is a formal test for the existence
of tail interdependence or interconnectedness. Focusing on the asymmetric CoVaR model (16), we
additionally address the individual signi�cance of the loss-related CoVaR coe¢ cient, namely
H0;Loss : ��i (�) = 0; and the suitability of the symmetric restriction that gives rise to (15) ;
namely H0;Sym : ��i (�) = �
+i (�) : These hypotheses can be tested through Wald-type test
statistics asymptotically distributed as �2(1).
The estimates from the di¤erent CoVaR models in Table 3 reveal several common features. First,
considering a single-index or a multiple-index approach to construct returns of the banking
system does not cause major di¤erences. Results are fairly robust to the de�nition of the system
and we reach similar conclusions. Second, among the di¤erent state variables used in our analysis,
the implicit volatility index is the most e¤ective predictor of the tail of the conditional
distribution. This result is not particularly striking, since downside risk dynamics on
high-frequency data are mainly driven by market volatility. As the � -th quantile decreases (i.e.,
as we focus on more extreme events), the in�uence of volatility becomes more important and
other lagged state variables lose predictive power. This is consistent with the widely agreed fact
that most extreme events are triggered by unpredictable, irregular events that feature market
volatility, and which are characterized in quantitative models through a jump process. Among the
remaining variables, the yield slope and the default premium tend to exhibit tail forecasting
ability as well. These variables are closely related to market uncertainty and the risk of a market
crash. The structural-break dummy related to the �nancial recession is strongly signi�cant,
showing that the banking business went through an adverse regime characterized by greater
volatility and market uncertainty. The NBER indicator of economic recessions does not seem to
add incremental information over the remaining variables.
Turning our attention to the CoVaR parameters, the estimates of the � (�) coe¢ cient in the
symmetric model are, as expected, mostly positive, revealing signi�cant tail-interrelations between
the system and the individual banks. Since there are little or no qualitative di¤erences between
the di¤erent de�nitions given to the banking system, for ease of exposition we discuss results for

- 17 -
the multiple-index system approach in what follows. The median of the � (�) estimates across
banks ranges from 0:086 (at � = 0:01) to 0:094 (at � = 0:05). The null hypothesis
H0;Ind : � (�) = 0; which excludes systemic interrelations, cannot be rejected at the usual 95
percent con�dence level for 43 percent (� = 0:01) and 57 percent (� = 0:05) of the banks in this
sample. Obviously, parameter estimates and sample rejection ratios re�ect unconditional
measures in this analysis. Attending to certain �rm-speci�c characteristics, particularly size, we
can observe meaningful conditional trends that shall be discussed in greater detail later on.
The analysis of the outcomes from the asymmetric CoVaR con�rms the existence of a more
sophisticated pattern characterizing tail-interdependences. The cross-sectional medians of the
�� (�) and �+ (�) estimates are positive and show clear evidence of asymmetric responses
characterizing the left tail of the conditional distribution of system�s returns. For instance, at
� = 0:01; the median of b�� (�) is 0:372; while the median of b�+ (�) takes on a much moreconservative value of 0:030. The estimates of the loss-related coe¢ cient �� (�) are sizeable and
highly signi�cant in most cases, whereas the estimates of �+ (�) tend to be relatively small and
not statistically signi�cant in many cases. Not surprisingly, therefore, the assumption
H0;Sym : �� (�) = �+ (�) that gives rise to the symmetric model considered in AB is largely
rejected for most of the �rms analyzed in our sample in favour of the asymmetric extension. In
particular, the (unconditional) rejection ratio of the symmetric restriction is around 70 percent
but we remark that there is strong evidence of size-related trends. Independently of the de�nition
of the system, the analysis on the sample rejection ratios of H0;Loss : �� (�) = 0 and
H0;Ind : �� (�) = �+ (�) = 0 reveal massive rejections. This shows strong evidence of
tail-interdependence and interconnectedness in the sample in which the existence of downside
comomevents, captured by the loss-related coe¢ cient �� (�), play a major role. In contrast, the
misspeci�ed symmetric CoVaR model shows a much more conservative picture which may lead to
misleading conclusions.
It is of particular relevance for policy considerations to characterize conditional patterns in the
cross-section analysis of the CoVaR estimates as a function of variables that proxy the systemic
importance of a �rm. International banking regulations have considered that the contribution to
systemic risk of an individual bank is re�ected in the size of its liabilities and the impact that its
failure may have on markets and the real economy.10 Also, the failure of a large �nancial
institution is more likely to generate shockwaves throughout the �nancial system and harm the
real economy. In the absence of further information, therefore, �rm�s size is the most natural
indicator of the systemic importance of a �rm. Conditioning on variables that proxy for this
magnitude allows us to explore the existence of systematic biases in the estimation of CoVaR
models which may be particularly relevant to address systemic importance. To this end, we proxy
10The BCBS Bank for International Settlements (2011) has developed an indicator-based measurement approach
to identify and measure the systemic importance of banks. There are �ve indicators, namely, bank size, intercon-
nectedness, substituitability, cross-border activity, and complexity. Size, measure by total exposures, account for 20
percent of the overall index.
- 18 -
the size of each individual bank using either the time-series median of its total assets over the
period or the corresponding median value of its liabilities.
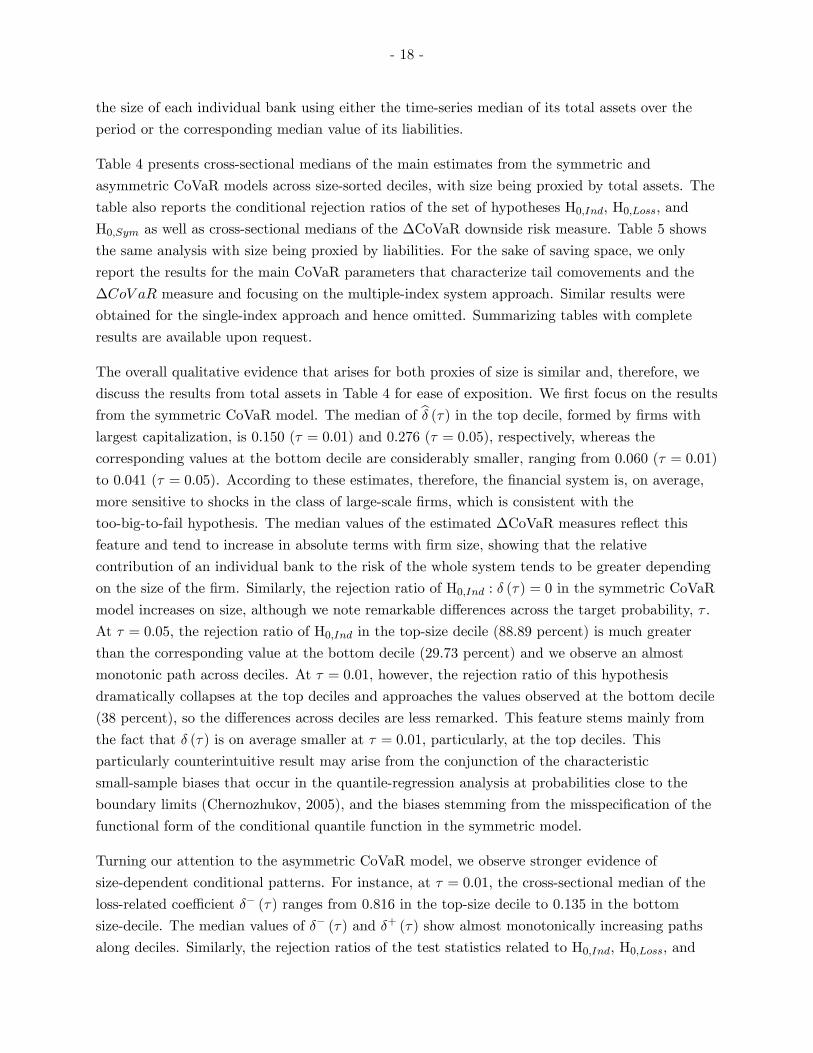
Table 4 presents cross-sectional medians of the main estimates from the symmetric and
asymmetric CoVaR models across size-sorted deciles, with size being proxied by total assets. The
table also reports the conditional rejection ratios of the set of hypotheses H0;Ind; H0;Loss; and
H0;Sym as well as cross-sectional medians of the �CoVaR downside risk measure. Table 5 shows
the same analysis with size being proxied by liabilities. For the sake of saving space, we only
report the results for the main CoVaR parameters that characterize tail comovements and the
�CoV aR measure and focusing on the multiple-index system approach. Similar results were
obtained for the single-index approach and hence omitted. Summarizing tables with complete
results are available upon request.
The overall qualitative evidence that arises for both proxies of size is similar and, therefore, we
discuss the results from total assets in Table 4 for ease of exposition. We �rst focus on the results
from the symmetric CoVaR model. The median of b� (�) in the top decile, formed by �rms withlargest capitalization, is 0:150 (� = 0:01) and 0:276 (� = 0:05); respectively, whereas the
corresponding values at the bottom decile are considerably smaller, ranging from 0:060 (� = 0:01)
to 0:041 (� = 0:05). According to these estimates, therefore, the �nancial system is, on average,
more sensitive to shocks in the class of large-scale �rms, which is consistent with the
too-big-to-fail hypothesis. The median values of the estimated �CoVaR measures re�ect this
feature and tend to increase in absolute terms with �rm size, showing that the relative
contribution of an individual bank to the risk of the whole system tends to be greater depending
on the size of the �rm. Similarly, the rejection ratio of H0;Ind : � (�) = 0 in the symmetric CoVaR
model increases on size, although we note remarkable di¤erences across the target probability, � .
At � = 0:05; the rejection ratio of H0;Ind in the top-size decile (88:89 percent) is much greater
than the corresponding value at the bottom decile (29:73 percent) and we observe an almost
monotonic path across deciles. At � = 0:01; however, the rejection ratio of this hypothesis
dramatically collapses at the top deciles and approaches the values observed at the bottom decile
(38 percent); so the di¤erences across deciles are less remarked. This feature stems mainly from
the fact that � (�) is on average smaller at � = 0:01; particularly, at the top deciles. This
particularly counterintuitive result may arise from the conjunction of the characteristic
small-sample biases that occur in the quantile-regression analysis at probabilities close to the
boundary limits (Chernozhukov, 2005), and the biases stemming from the misspeci�cation of the
functional form of the conditional quantile function in the symmetric model.
Turning our attention to the asymmetric CoVaR model, we observe stronger evidence of
size-dependent conditional patterns. For instance, at � = 0:01; the cross-sectional median of the
loss-related coe¢ cient �� (�) ranges from 0:816 in the top-size decile to 0:135 in the bottom
size-decile. The median values of �� (�) and �+ (�) show almost monotonically increasing paths
along deciles. Similarly, the rejection ratios of the test statistics related to H0;Ind; H0;Loss; and

- 19 -
H0;Sym show larger probabilities of rejections as size increases. In particular, a signi�cant link
between the system and an individual bank, characterized by an asymmetric response, is more
likely to be observed as the size of the �rm increases. This feature reveals the existence of
important systematic biases stemming from the misspeci�cation of the quantile function. In sharp
contrast to the estimates from the symmetric model, the estimates of �� (�) tend to be larger at
the 1 percentile than at the 5 percentile. This is consistent with most of the empirical �ndings in
the literature suggesting that the degree of correlation between �nancial assets and markets
become stronger in downside market movements; see, for instance, Longin and Solnik (2001).
Acknowledging the existence of asymmetric responses featuring the tail distribution leads to a
more clear and consistent picture of tail-interdependence.
Finally, as in the symmetric CoVaR model, the average estimates of �CoVaR downside risk
measure show an increasing pattern across deciles in absolute terms which is consistent with the
too-big-to-fail hypothesis. However, we observe sheer di¤erences between the average magnitude
of such estimates that tend to be magni�ed as size increases: the estimates from the symmetric
model are considerable smaller than those from the asymmetric generalization. According to the
statistical analysis, the asymmetric model outperforms its symmetric counterpart. Consequently,
it must be concluded that the symmetric model is prone to generate �CoVaR estimates that
largely underestimate, in absolute terms, the risk contribution of an individual bank to the
system as a whole.
B. Discussion
The analysis in the previous section reveals that the practical consequences of the misspeci�cation
involved in the symmetric CoVaR can be particularly severe. First, this model tends to generate
downward biased estimates of the empirical link that ties the tail of the conditional distribution of
the system to the returns of an individual bank. The estimates of � (�) re�ect, by construction, an
average response to positive and negative shocks alike. Consequently, the symmetric CoVaR
model is prone to underestimate the magnitude of tail-dependence in an adverse scenario
characterized by large negative returns. In contrast, the tail of the system is directly related to
individual losses in the asymmetric CoVaR model, yielding downside risk estimates of a higher
magnitude. To appraise the size of the parameter biases involved, note that, from the results
reported in Table 3, the average value of b�� (�) ranges from 0:372 (� = 0:01) to 0:337 (� = 0:05);
which is roughly 4 times bigger than the corresponding estimates of � (�) in the symmetric model.
Second, and as a direct consequence of these biases, the symmetric CoVaR model produces
conservative inference about the signi�cance of the parameters that capture conditional
comovements. Hence, statistical inference intended to formally detect systemic interrelations on
the estimates of the risk model is likely to lead to misleading conclusions. According to Table 3,
whereas the rejection ratio of H0;Ind is around 90 percent in the estimates of the asymmetric

- 20 -
CoVaR model, this magnitude dramatically collapses in the symmetric model showing values not
greater than 50 percent. In our view, the statistical evidence presented by the asymmetric
CoVaR, suggesting that most of the banks in the sample are interconnected, is more likely to be
close to the real picture. The sample analyzed in this paper is mostly formed by BHC. These
banks are closely intertwined �nancially through lending to and borrowing from their peers,
holding balance deposits with each other, and showing similar risk exposures. Of course, the
systemic importance of these banks is not expected to be the same as this may vary depending on
a number of factors, but the estimates of the econometric risk model should re�ect a high
proportion of interconnectedness in this sample. While the symmetric model o¤ers conservative
�gures, the formal test based on the estimates of the asymmetric model does acknowledges this.
Third, the symmetric CoVaR model produces estimates of the �CoVaR downside risk measure
which are biased downwards in absolute terms. Once more, this is the direct consequence of the
downward bias in the estimation of the main parameters that characterize the conditional
quantile function. For many banks in our sample, particularly those belonging to top size deciles,
the symmetric CoVaR model largely diminish the contribution of an individual bank to the total
risk of the system. For instance, the bank with the largest capitalization in our sample during the
period analyzed is Citigroup. In November 2008, this BHC received a massive stimulus package
from the U.S. Government Treasury including a $20 billion capital injection in the form of
preferred stocks. In November 2011, this �rm was included in the list of 29 systemically
important banks released by the Financial Stability Board (FSB) that would have to raise their
core Tier I capital ratios under the provisions of the Basel III regulatory framework. According to
the asymmetric CoVaR methodology, the median of the weekly �CoVaR estimates of Citigroup
at the 1 percentile over the sample period is �0:0565. In sharp contrast, the symmetric CoVaRmodel yields an extraordinarily conservative average estimate of �0:008 over the same period,dwar�ng by a factor of seven times its impact on the left tail asset return of the �nancial system.
In our view, the most adverse consequence of the misspeci�cation involved in the symmetric
CoVaR is that biases do not occur randomly, but are systemically related to a �rm�s
characteristics, such as size. According to our analysis, the downward-biased distortions caused
by the model misspeci�cation are more likely to occur and are more pronounced in large-scale
�rms. For instance, the cross-sectional median of the �� (�) =� (�) ratio for �rms in the
bottom-size at � = 0:01 is 1:31; showing mild biases for small companies; however, the median
value of this ratio for �rms belonging to the top-size decile is 5:08. Since the inferred dynamics of
the �CoVaR process are fundamentally driven by these parameters, the misspeci�cated
symmetric CoVaR model can lead to severely biased estimates of the systemic importance of a
�rm as measured by �CoVaR. Indeed, according to the estimates reported in Table 4, the
cross-sectional median of the average �CoVaR process in the asymmetric model at � = 0:01 is
just 1:26 times larger than that in the symmetric model for �rms in the bottom-size decile. In
contrast, the median of the asymmetric �CoVaR process is 4:98 times bigger than its symmetric
counterpart in banks in the top-size decile. It is not a coincidence that these ratios take values on

- 21 -
average similar to those of �� (�) =� (�) :
To provide a sense of the systematic biases implied by the symmetric model, Figure 1 presents the
individual estimates of the main parameters in the CoVaR models as well as the respective
average values of �CoVaR estimates. In particular, the �gure on the left-hand side confronts the
estimates b�i (�) and b��i (�) against the time-series median of size (in logs) of the total assets heldby an individual bank. Similarly, the �gure on the right-hand size shows the time-series median
(in absolute value) of the estimates of �CoVaR for each bank over the period against its log-size
value.
As size increases, both � (�) and �� (�) increase, as discussed previously, and so do the associated
values of the average �CoVaR estimates. This feature is largely consistent with the too-big-to-fail
hypothesis and motivates the concerns of regulators and supervisors over large-scale �rms.
However, the estimates of the asymmetric coe¢ cient �� (�) tend to dominate � (�) almost
uniformly as size becomes larger and, hence, the same pattern arises in the estimated �CoVaR
dynamics. The di¤erences may not be important for �rms with small capitalization, as shown in
Figure 1, but they tend to spread out sharply and rapidly as the size of the �rm increases. Note
that the rate of change in the CoVaR estimates is much greater under the asymmetric case,
showing that biases occur systematically, and that these are more relevant for large-scale banks.
In summary, the overall picture that emerges from this analysis suggests that imposing a
symmetric restriction in the CoVaR model can generally lead to potentially large biases in the
resulting estimates. These biases are systematic and are more likely to occur precisely in the class
of �nancial institutions with largest capitalization, i.e., �rms which are more likely to pose a
systemic threat to the �nancial system and the real economy.
C. Robustness Checks
In this section, we report the main outcomes from several analyses intended to check the
robustness and generality of the previous results. To save space, we discuss the main evidence
based on the multiple-index system approach, noting that complete results are available upon
request.
Bank holding companies and commercial banks
The sample analyzed in this paper is mainly composed of BHC, i.e., �nancial institutions that
own and/or control at least one U.S. bank. The group of CB, on the other hand, is much more
reduced, since the number of traditional banks which are large enough to be traded on the stock
market is considerably smaller. There are sharp di¤erences in terms of business pro�le,
regulation, and supervision between these two classes of �rms which are likely to a¤ect the

- 22 -
systemic importance of individual banks. In relative terms, CB typically exhibit smaller size than
BHC; see Table 1 for details. Furthermore, these banks are subject to the Glass-Steagall Act of
1933 and, hence, can only engage in traditional banking activities. On the other hand, BHC tend
to be larger companies which, by virtue of the Gramm-Leach-Bliley Act of 1999, can engage in a
number of authorized activities beyond traditional lending. These companies increasingly resorted
to diversi�cation activities before the onset of the �nancial crisis in order to o¤set declining
traditional bank-related pro�ts. Although the reduced cross-sectional number of observations of
CB in our sample calls for some caution to interpret results, it is of general interest to comment
the main di¤erences in the estimation of the CoVaR models for �rms grouped into BHC and CB,
respectively. The main results from this analysis are reported in Table 6.
Broadly speaking, we observe the same characteristic patterns discussed previously and which
generally advise for the use of the asymmetric CoVaR model. For both BHC and CB the
symmetric CoVaR model tends to be rejected in favor of its asymmetric generalization, although
the rejection ratio of H0;Sym is smaller in companies belonging to the CB group. This is
consistent with the �ndings that asymmetries are, on average, more likely to occur in large-scale
�rms. More interestingly and, as expected, there are meaningful di¤erences between the systemic
importance of BCH and CB according to the CoVaR estimates. First, the rejection ratio of H0;Indtesting interconnectedness is considerably smaller in the CB group, particularly, under the
asymmetric model. Not surprisingly, therefore, the average systemic importance of CB, as
measured by the cross-sectional median of the time-series medians of the estimates of �CoVaR, is
considerably smaller than that of BHC. Both the symmetric and the asymmetric models capture
this phenomenon, although once more the di¤erence is greater, in absolute terms, when using the
asymmetric CoVaR. We note that this evidence does not necessarily arise as a consequence of
having a smaller average size, but also from their di¤erent business model. For instance, BHC
used intensively whole-sale short-term funding to �nance their operations before the crisis,
whereas CB relied more heavily on traditional deposit funding. This feature makes these banks
more resilient to the propagation of shocks originated in �nancial markets and, reciprocally, the
banking system is less vulnerable to the failure of these banks.
Nonlinear models
We have proposed a direct nonlinear generalization of the symmetric model in AB. There are
both economic and econometric reasons that suggest that this simple extension may outperform
the restricted model, particularly, when the �rm involved is a large-scale bank. The empirical
�ndings discussed previously support the suitability of the asymmetric model. More generally, it
could be possible to extend this structure by allowing further nonlinear patterns as a function of a
number of regimes. For instance, the asymmetric model may be embedded into the class of

- 23 -
piecewise linear models for which we may consider a general speci�cation of the form
Xt;S = Z0t�1 i (�) +
k+1Xj=1
�i;j (�)Xt;i � I(Xt;i2Cj(T )) + u�;t (18)
where Cj (T ), j = 1; :::; k + 1; k � 1; denotes a collection of statistical classes de�ned as a functionof k threshold values T such that [k+1j=1Cj (T ) = R and Cl (T ) \ Cs (T ) = ? for all l 6= s:Intuitively, the real line is partitioned into k + 1 disjoint sets given k threshold values T such that
the tail-response of Xt;S , as measured by the �i;j (�) coe¢ cient, may vary along the distribution of
Xt;i: Our setting is embedded in this general structure, since we consider a threshold value set to
zero, and two classes with positive and negative values of Xt;i:
Several procedures in the existing literature may be used along these lines, however, at a cost of a
higher complexity. For instance, the class of threshold models proposed by Hansen (2000) may be
useful to determine endogenously di¤erent threshold values. A serious attempt to estimate these
models is beyond the scope of this paper, but it is interesting to analyze intuitively whether the
asymmetric speci�cation provides a fair enough representation relative to more complex models.
To this end, we estimated a piecewise linear CoVaR model with bank-speci�c threshold values
arbitrarily set to the empirical deciles of the unconditional distribution of Xt;i; i.e., we estimate
the quantile model Xt;S = Z0t�1 i (�) +P10j=1 �i;j (�)Xt;i � I(Xt;i2Cj(Ti)) + u�;t; where the �i;j (�)
coe¢ cient captures the link between the � -th conditional quantile of Xt;S and the j-th
unconditional decile of Xt;i:
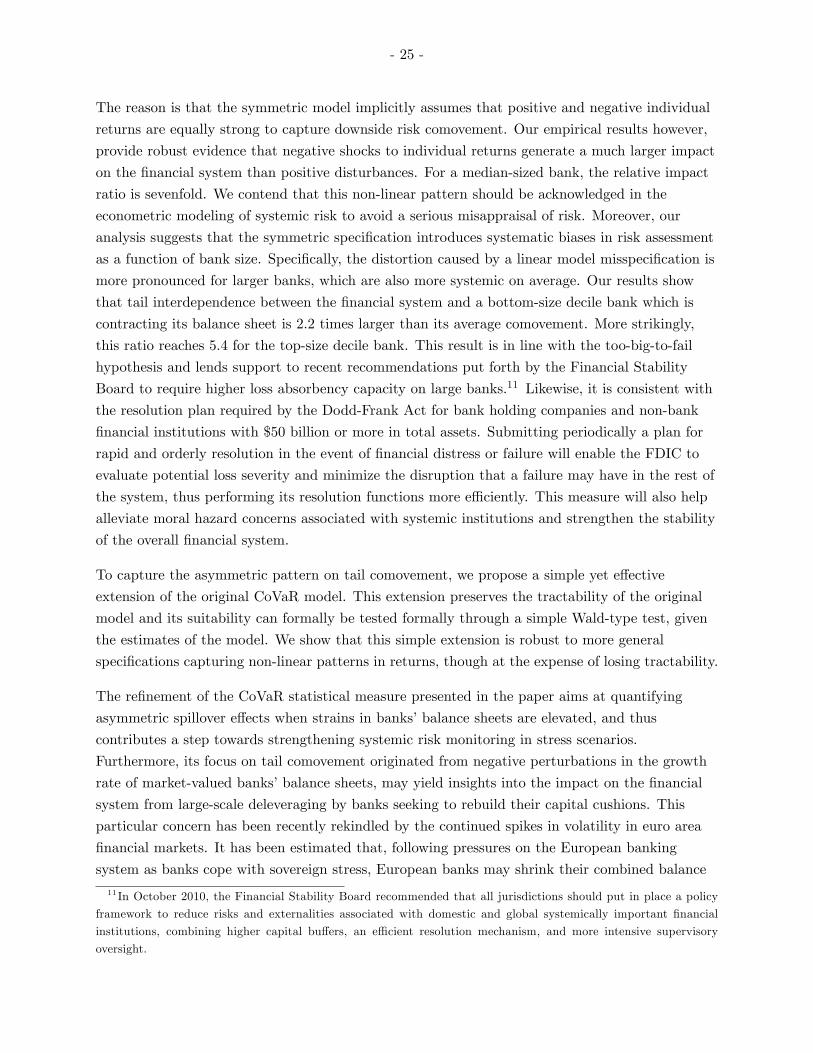
Figure 2 shows the cross-section median of the estimates of the decile-related CoVaR parameters
f�i;j (�)g in this model at � = 0:05: These are depicted in grey bars. To compare the magnitudeof these estimates with the previous estimates from the symmetric and asymmetric CoVaR
models, we superpose the unconditional medians of � (�) = 0:086 (blue dashed-dotted line);
��(�) = 0:372 (red dashed line); and �
+(�) = 0:048 (green dotted line). Those values have been
reported in Table 3. Our main aim is to determine if the asymmetric CoVaR model provides a
reasonable representation against further extensions. Figure 2 reveals that, on average, the most
important e¤ect for the modeling of downside tail comovements is to acknowledge the existence of
asymmetric responses. The empirical estimates related to deciles above the median,
corresponding to positive returns, hardly contribute to explain left-tail comovements and have a
small coe¢ cient associated to. In sharp contrast, observations of Xt;i below the median,
corresponding to negative returns, trigger large comovements. The average di¤erences across the
di¤erent negative deciles are far less important, and the asymmetric CoVaR model seems to make
a fair job in capturing the average comovement with the system. Therefore, although nonlinear
models are likely to introduce further re�nements at a cost of higher complexity, the asymmetric
model presents a good balance between explanatory power and model tractability.
Figure 2 makes clear the large downward bias that estimates from the (misspeci�ed) symmetric
model are generally exposed to. The average magnitude of � (�) pools the information related to

- 24 -
negative and positive shocks and, as a result, it substantially diminishes the importance of
negative shocks to explain left-tail downside comovements. While generalized nonlinear pattern
may provide further re�nements, it is clear that allowing for asymmetries provides �rst-order
gains in CoVaR modeling.
Returns of di¤erent representative portfolios and other considerations
We performed a number of additional checks to analyze the robustness of the results against the
de�nition given to the returns of the individual bank and the system portfolios. The qualitative
evidence is the same as that discussed previously and, therefore, we omit presenting summarizing
tables to save space, but note that these are available under request. First, we computed the
CoVaR models on the returns of a representative portfolio formed by equity. Considering stock
returns instead of balance-sheet related returns led to the same conclusions about the
performance of the asymmetric model and the patterns of systemic importance discussed
previously. Second, we used liabilities as a weighting variable to de�ne the returns of the system
instead of total assets. Liabilities may re�ect de-leveraging pressures more accurately than
market-valued total assets, as discussed in López-Espinosa et al. (2012). Again, using this
weighting scheme did not lead to signi�cant changes in relation to those discussed previously.
Finally, and as commented before, we used linear interpolation (rather than cubic splines) to
smooth weekly quarterly accounting data, with no major changes in the analysis.
VI. Concluding Remarks
In this paper, we have discussed the suitability of the CoVaR procedure recently proposed by
Adrian and Brunnermeier (2011). This valuable approach helps understand the drivers of
systemic risk in the banking industry. Implementing this procedure in practice requires specifying
the unobservable functional form that relates the dynamics of the conditional tail of system�s
returns to the returns of an individual bank. Adrian and Brunnermeier (2011) build on a model
that assumes a simple linear representation, such that returns are proportional.
We show that this approach may provide a reasonable approximation for small-sized banks.
However, in more general terms, and particularly for large-scale banks, the linear assumption
leads to a severe underestimation of the conditional comovement in a downward market and,
hence, their systemic importance may be perceived to be lower than their actual contribution to
systemic risk. Yet, how to measure and buttress e¤ectively the resilience of the �nancial system
to losses crystallizing in a stress scenario is the main concern of policy makers, regulatory
authorities, and �nancial markets alike. Witness the rally on U.S. equities and dollar on March
14, 2012 after the regulator announced favorable bank stress test results for the largest nineteen
U.S. bank holding companies.
- 25 -
The reason is that the symmetric model implicitly assumes that positive and negative individual
returns are equally strong to capture downside risk comovement. Our empirical results however,
provide robust evidence that negative shocks to individual returns generate a much larger impact
on the �nancial system than positive disturbances. For a median-sized bank, the relative impact
ratio is sevenfold. We contend that this non-linear pattern should be acknowledged in the
econometric modeling of systemic risk to avoid a serious misappraisal of risk. Moreover, our
analysis suggests that the symmetric speci�cation introduces systematic biases in risk assessment
as a function of bank size. Speci�cally, the distortion caused by a linear model misspeci�cation is
more pronounced for larger banks, which are also more systemic on average. Our results show
that tail interdependence between the �nancial system and a bottom-size decile bank which is
contracting its balance sheet is 2.2 times larger than its average comovement. More strikingly,
this ratio reaches 5.4 for the top-size decile bank. This result is in line with the too-big-to-fail
hypothesis and lends support to recent recommendations put forth by the Financial Stability
Board to require higher loss absorbency capacity on large banks.11 Likewise, it is consistent with
the resolution plan required by the Dodd-Frank Act for bank holding companies and non-bank
�nancial institutions with $50 billion or more in total assets. Submitting periodically a plan for
rapid and orderly resolution in the event of �nancial distress or failure will enable the FDIC to
evaluate potential loss severity and minimize the disruption that a failure may have in the rest of
the system, thus performing its resolution functions more e¢ ciently. This measure will also help
alleviate moral hazard concerns associated with systemic institutions and strengthen the stability
of the overall �nancial system.
To capture the asymmetric pattern on tail comovement, we propose a simple yet e¤ective
extension of the original CoVaR model. This extension preserves the tractability of the original
model and its suitability can formally be tested formally through a simple Wald-type test, given
the estimates of the model. We show that this simple extension is robust to more general
speci�cations capturing non-linear patterns in returns, though at the expense of losing tractability.
The re�nement of the CoVaR statistical measure presented in the paper aims at quantifying
asymmetric spillover e¤ects when strains in banks�balance sheets are elevated, and thus
contributes a step towards strengthening systemic risk monitoring in stress scenarios.
Furthermore, its focus on tail comovement originated from negative perturbations in the growth
rate of market-valued banks�balance sheets, may yield insights into the impact on the �nancial
system from large-scale deleveraging by banks seeking to rebuild their capital cushions. This
particular concern has been recently rekindled by the continued spikes in volatility in euro area
�nancial markets. It has been estimated that, following pressures on the European banking
system as banks cope with sovereign stress, European banks may shrink their combined balance
11 In October 2010, the Financial Stability Board recommended that all jurisdictions should put in place a policy
framework to reduce risks and externalities associated with domestic and global systemically important �nancial
institutions, combining higher capital bu¤ers, an e¢ cient resolution mechanism, and more intensive supervisory
oversight.
- 26 -
sheet signi�cantly with the potential of unleashing shockwaves to emerging economies hurting
their �nancial stability (IMF, 2012). The estimation of the impact on the real economy from
aggregate weakness of the �nancial sector, and the design of optimal macroprudential policies to
arrest systemic risk when tail interdependencies feed non-linearly into the �nancial system, are
left for future research.

- 27 -
Figure 1. Comparison of median estimates from the symmetric and asymmetric CoVaR models.
The �gure on the left shows the point estimates of b�� (�) (Asymmetric) and b� (�) (Symmetric) foreach bank. The �gure on the right shows the absolute-valued medians of the �CoVaR estimates.
8 10 12 14 16 18 200.2
0
0.2
0.4
0.6
0.8
1
1.2
Log Size
Estim
ated
CoV
aR c
oeffi
cient
s
Estimated CoVaR Coefficients, τ=0.05
8 10 12 14 16 18 200
0.01
0.02
0.03
0.04
0.05
0.06
0.07Estimated ∆CoVaR, τ=0.05
Log Size
Abso
lute
val
ued
tim
ese
ries
med
ian
∆C
oVaR
AsymmetricSymmetric
AsymmetricSymmetric

- 28 -
Figure 2. Cross-sectional median estimates of the decile-based coe¢ cients f�i;j (�)g from the
piecewise linear CoVaR (grey bars), median estimates of the symmetric CoVaR � (�) coe¢ cient
(blue dashed-dotted line), and median of the asymmetric CoVaR coe¢ cients �� (�) and �+ (�)
(red line and green dotted line, respectively) at � = 0:05.
1 2 3 4 5 6 7 8 9 100
0.05
0.1
0.15
0.2
0.25
0.3
0.35
0.4
0.45
0.5
Conditional Deciles
Cro
sss
ectio
nal M
edia
n E
stim
ated
Coe
ffici
ents
Median Estimated Coef f icients
Decilerelated estimatesSy mmetricLossrelated Asy mmetricGainrelated Asy mmetric

- 29 -
Table1:
Sampledescritives(samplemean,median,standarddeviation,99%and1%
percentiles)ofaccountingvariablesforthetotalsample,andthe�ltered
sampleafterexcluding�rmswithlessthan500observations.LeverageismeasuredastheratioTotalAssetstoEquity.BCHandCBstandsforbankholding
companiesandcommercialbanks,respectively.Accountingvariablesaredenominatedin$thousands.
TotalSample
FilteredSample
TotalAssets
Liabilities
Equity
MarketValue
Leverage
TotalAssets
Liabilities
Equity
MarketValue
Leverage
AllBanks
Mean
15,443,019
14,178,811
1,264,208
2,211,305
12.13
20,374,562
18,698,136
1,676,426
2,962,483
11.86
Median
1,114,213
1,018,717
96,350
146,790
11.74
1,610,327
1,475,962
131,441
220,165
11.62
St.Dev.
100,825,099
92,767,851
8,217,582
12,244,563
24.45
121,613,611
111,889,724
9,908,967
14,702,676
29.08
99%Perct.
260,159,000
238,823,000
20,780,000
41,743,444
23.76
366,574,000
343,674,000
28,757,074
58,506,420
22.06
1%Perct.
112,224
100,229
9,156
6,006
5.65
152,800
135,470
13,275
8,856
5.69
BHC
Mean
16,480,418
15,131,847
1,348,571
2,360,246
12.14
21,196,452
19,453,048
1,743,405
3,082,061
11.87
Median
1,231,930
1,128,742
104,957
162,026
11.77
1,688,911
1,550,991
138,469
232,312
11.63
St.Dev.
104,480,668
96,131,711
8,515,355
12,683,596
25.29
124,402,300
114,455,869
10,135,956
15,034,947
29.75
99%Perct.
269,013,000
249,459,509
21,563,000
43,657,467
23.59
396,045,000
367,511,000
30,358,000
61,366,280
22.02
1%Perct.
168,129
151,257
12,196
7,605
5.78
191,200
169,369
16,593
13,178
5.83
CB
Mean
1,723,666
1,575,149
148,517
241,595
12.02
3,128,126
2,857,181
270,945
453,285
11.81
Median
405,464
371,356
33,895
44,914
11.36
530,789
473,585
45,640
66,428
11.23
St.Dev.
6,187,887
5,645,432
546,061
1,012,994
6.48
9,099,863
8,300,549
804,542
1,498,117
3.91
99%Perct.
39,603,076
35,827,592
3,737,268
6,622,792
27.00
50,519,153
46,127,538
4,480,191
8,749,758
22.75
1%Perct.
37,532
32,573
2,588
1,649
4.33
29,355
23,745
2,061
1,530
4.22

- 30 -
Table2.
Descriptivestatisticsoftheeconomicand�nancialstatevariablesusedaspredictivevariablesintheCoVaR
andVaR
modelling.Thevariablesare
theimpliedvolatilityindex(VIX),theannualizedmarketreturnoftheS&P500,thechangeintheU.S.Treasurybillsecondarymarket3-monthrate(�T-bill),
theyieldspreadbetweentheU.S.Treasurybenchmarkbond10-yearandtheU.S.3-monthT-bill(YieldSlope),andthecreditspreadsbetweenthe10-year
Moody�sseasonedBaacorporatebondandthe10-yearU.S.Treasurybond(DefaultPremium).Thedescriptivestatisticsshow
thenumberofobservations(Obs),
mean,standarddeviation(St.Dev.),minimum,maximum,�rstquartile(Q1),median,thirdquartile(Q3),andthe�rst-orderautocorrelationparameter(�1).
Obs.
Mean
St.Dev.
Min.
Max.
Q1
Median
Q3
�1
VIX
1,096
20.554
8.318
9.700
80.060
14.560
19.255
24.295
0.939
MarketReturn(Annualized)
1,096
7.630
17.904
-13.852
13.827
-1.073
0.221
1.485
-0.116
�T-bill
1,096
-0.006
0.129
-1.530
1.420
-0.040
0.000
0.040
-0.193
YieldSlope
1,096
1.835
1.190
-0.625
3.920
0.775
1.792
2.842
0.991
DefaultPremium
1,096
2.271
0.827
1.112
6.402
1.687
2.050
2.654
0.986

- 31 -
Table3:
ThistableshowsthemedianofparameterestimatesacrossbanksofthequantileregressionmodelsXt;S=Z0 t�1 i(�)+� i(�)Xt;i+u�;t
(SymmetricCoVaR)andXt;S=Z0 t�1 i(�)+�� i(�)X� t;i+�+ i(�)X+ t;i+u�;t(AsymmetricCoVaR)atthe1%
and5%
quantiles,themedianoftherobust
t-statisticsforindividualsigni�cance(inparanthesis),andthemedianofthepseudo-R
2;withXt;Sdeterminedaccordingtothemultiple-orsingle-index
system
approach,andgiventhepredictivevariablesinTable2.Thebottompartofthetableshowsthesamplefrequencyofrejectionsatthe95%con�dence
leveloftheWaldtestsforH0;Ind:�(�)=0andH0;Ind:��(�)=�+(�)=0;inthesymmetricandasymmetricmodels,respectively,andthoseof
H0;Loss:��(�)=0andH0;Sym:��(�)=�+(�)intheasymmetricCoVaR
model.
Multiple-indexSystem
Single-indexSystem
S ymmetricCoVaR
AsymmetricCoVaR
SymmetricCoVaR
AsymmetricCoVaR
1%5%
1%5%
1%5%
1%
5%
Constant
0.028(3.90)
0.020(3.16)
0.023(2.82)
0.014(2.50)
0.028(3.64)
0.020(3.16)
0.023(2.76)
0.014(2.50)
VIX
-0.026(-6.26)
-0.002(-6.57)
-0.002(-5.79)
-0.002(-5.82)
-0.003(-6.16)
-0.002(-6.54)
-0.002(-5.65)
-0.002(-5.78)
MarketReturn
0.007(0.11)
0.141(2.44)
-0.006(-0.06)
0.114(1.99)
0.007(0.10)
0.140(2.47)
-0.008(-0.08)
0.113(2.06)
�T-Bill
-0.003(-0.28)
0.015(1.37)
0.002(0.21)
0.014(1.27)
-0.004(-0.27)
0.014(1.36)
0.003(0.20)
0.014(1.29)
YieldSlope
0.002(1.04)
0.002(1.74)
0.003(1.15)
0.003(1.78)
0.002(1.02)
0.003(1.70)
0.002(1.12)
0.003(1.79)
DefaultPremium
-0.018(-3.86)
-0.010(-2.28)
-0.014(-3.03)
-0.008(-1.85)
-0.018(-3.89)
-0.010(-2.30)
-0.014(-2.79)
-0.008(-1.83)
NBERRecessions
0.017(1.38)
0.011(1.62)
0.017(1.58)
0.009(1.36)
0.017(1.36)
0.011(1.60)
0.017(1.51)
0.009(1.38)
FinancialRecession
-0.014(-2.32)
-0.029(-5.68)
-0.013(-1.66)
-0.025(-4.66)
-0.015(-2.22)
-0.030(-5.53)
-0.013(-1.61)
-0.025(-4.64)
Xt;i
0.086(1.34)
0.0941(2.35)
--
0.089(1.33)
0.094(2.40)
--
X� t;i
--
0.372(5.64)
0.337(6.98)
--
0.374(5.58)
0.341(7.17)
X+ t;i
--
0.048(0.55)
0.030(0.56)
--
0.050(0.49)
0.031(0.72)
Pseudo-R2
43.42%
28.95%
46.15%
30.57%
43.52%
29.02%
46.25%
30.70%
FrequencyofrejectionsWaldTest
Freq.Rej.H0;Ind
42.47%
57.53%
88.49%
90.68%
42.74%
58.63%
87.67%
87.95%
Freq.Rej.H0;Loss
--
82.47%
88.49%
--
81.10%
90.41%
Freq.Rej.H0;Sym
--
66.19%
73.42%
--
61.10%
74.79%

- 32 -
Table4:
Thistableshowsthemedianofparameterestimatesacrosssize-sorteddecilesfrom
thequantileregressionmodels
Xt;S=Z0 t�1 i(�)+� i(�)Xt;i+u�;t(SymmetricCoVaR)andXt;S=Z0 t�1 i(�)+�� i(�)X� t;i+�+ i(�)X+ t;i+u�;t(AsymmetricCoVaR)atthe1%
and
5%quantiles,withXt;Sdeterminedaccordingtothemultiple-indexsystem
approach.Thetablealsoreportsthesamplefrequencyofrejectionsatthe95%
con�denceleveloftheWaldtestsforH0;Ind:�(�)=0andH0;Ind:��(�)=�+(�)=0;inthesymmetricandasymmetricmodels,respectively,and
H0;Loss:��(�)=0andH0;Sym:��(�)=�+(�)intheasymmetricCoVaR
model.Finally,R2denotesthemedianofthepseudo-R
2inthesemodels,
and�CoVaRdenotesthecross-sectionalmedianoftheweeklymediansofthe�CoVaRestimatesovertheperiodatthecorrespondingquantiles.
1 %Quantile
S ize-sortedDeciles
SymmetricCoVaR
AsymmetricCoVaR
�(�)
H0;Ind
R2
�CoVaR
��(�)�+(�)
H0;Ind
H0;Loss
H0;Sym
R2
�CoVaR
Top
0.150
38.88%
39.80%
-0.013
0.816
0.095
100%
100%
80.56%
45.61%
-0.071
9thdecile
0.129
38.89%
40.50%
-0.012
0.595
0.066
88.89%
91.67%
61.11%
42.26%
-0.050
5thdecile
0.125
50.00%
48.48%
-0.013
0.409
0.057
86.84%
86.84%
73.68%
49.70%
-0.042
2nddecile
0.071
43.24%
48.72%
-0.007
0.164
0.018
83.78%
62.16%
67.57%
48.85%
-0.017
Bottom
0.060
37.84%
28.63%
-0.007
0.135
0.002
78.38%
70.27%
64.86%
30.92%
-0.023
Totalsample
0.086
42.47%
43.42%
-0.011
0.372
0.048
88.49%
82.47%
66.19%
46.15%
-0.043
5%Quantile
S ize-sortedDeciles
SymmetricCoVaR
AsymmetricCoVaR
Top
0.276
88.89%
29.66%
-0.015
0.726
0.075
100%
100%
97.22%
36.94%
-0.039
9thdecile
0.181
64.86%
27.29%
-0.011
0.574
0.051
100%
100%
97.30%
31.08%
-0.033
5thdecile
0.114
67.57%
29.02%
-0.008
0.352
0.030
100%
97.30%
86.49%
30.68%
-0.022
2nddecile
0.044
32.43%
29.39%
-0.003
0.165
0.005
70.27%
64.86%
64.86%
29.51%
-0.010
Bottom
0.041
29.73%
17.02%
-0.003
0.126
0.012
67.57%
62.16%
56.76%
17.21%
-0.008
Totalsample
0.094
57.53%
28.95%
-0.006
0.337
0.030
90.68%
88.49%
73.42%
30.57%
-0.020

- 33 -
Table5:
Thistableshowsthemedianofparameterestimatesacrossliabilities-sorteddecilesfrom
thequantileregressionmodels
Xt;S=Z0 t�1 i(�)+� i(�)Xt;i+u�;t(SymmetricCoVaR)andXt;S=Z0 t�1 i(�)+�� i(�)X� t;i+�+ i(�)X+ t;i+u�;t(AsymmetricCoVaR)atthe1%
and
5%quantiles,withXt;Sdeterminedaccordingtothemultiple-indexsystem
approach.Thetablealsoreportsthesamplefrequencyofrejectionsatthe95%
con�denceleveloftheWaldtestsforH0;Ind:�(�)=0andH0;Ind:��(�)=�+(�)=0;inthesymmetricandasymmetricmodels,respectively,and
H0;Loss:��(�)=0andH0;Sym:��(�)=�+(�)intheasymmetricCoVaR
model.Finally,R2denotesthemedianofthepseudo-R
2inthesemodels,
and�CoVaRdenotesthecross-sectionalmedianoftheweeklymediansofthe�CoVaRestimatesovertheperiodatthecorrespondingquantiles.
1 %Quantile
Liabilities-sortedDeciles
SymmetricCoVaR
AsymmetricCoVaR
�(�)
H0;Ind
R2
�CoVaR
��(�)�+(�)
H0;Ind
H0;Loss
H0;Sym
R2
�CoVaR
Top
0.136
35.14%
38.38%
-0.012
0.827
0.088
100%
100%
81.08%
45.19%
-0.071
9thdecile
0.150
40.28%
40.54%
-0.014
0.622
0.069
94.59%
94.59%
72.97%
41.79%
-0.056
5thdecile
0.073
32.43%
43.35%
-0.010
0.353
0.028
86.49%
83.78%
62.16%
44.39%
-0.037
2nddecile
0.063
50.00%
49.05%
-0.007
0.190
0.011
80.00%
65.00%
62.50%
49.91%
-0.019
Bottom
0.067
41.18%
28.88%
-0.008
0.183
0.019
79.41%
67.65%
61.76%
31.55%
-0.024
Totalsample
0.086
42.47%
43.42%
-0.011
0.372
0.048
88.49%
82.47%
66.19%
46.15%
-0.043
5%Quantile
Liabilities-sortedDeciles
SymmetricCoVaR
AsymmetricCoVaR
Top
0.255
89.19%
28.48%
-0.015
0.721
0.062
100%
100%
97.30%
35.25%
-0.038
9thdecile
0.180
72.97%
27.22%
-0.011
0.552
0.067
100%
100%
94.59%
30.05%
-0.033
5thdecile
0.085
62.16%
28.83%
-0.005
0.245
0.029
97.30%
91.89%
70.27%
30.40%
-0.016
2nddecile
0.044
43.24%
29.90%
-0.003
0.163
0.017
72.97%
67.57%
64.86%
30.46%
-0.011
Bottom
0.039
32.43%
17.83%
-0.002
0.172
0.017
70.27%
67.57%
43.24%
18.26%
-0.008
Totalsample
0.094
57.53%
28.95%
-0.006
0.337
0.030
90.68%
88.49%
73.42%
30.57%
-0.020

- 34 -
Table6:
ThistableshowsthemedianofparameterestimatesacrossBHCorCBofthequantileregressionmodelsXt;S=Z0 t�1 i(�)+� i(�)Xt;i+u�;t
(SymmetricCoVaR)andXt;S=Z0 t�1 i(�)+�� i(�)X� t;i+�+ i(�)X+ t;i+u�;t(AsymmetricCoVaR)atthe1%
and5%
quantiles,themedianoftherobust
t-statisticsforindividualsigni�cance(inparanthesis),andthemedianofthepseudo-R
2;withXt;Sdeterminedaccordingtothemultiple-indexsyngle
approach.Thebottompartofthetableshowsthesamplefrequencyofrejectionsatthe95%con�denceleveloftheWaldtestsforH0;Ind:�(�)=0and
H0;Ind:��(�)=�+(�)=0;inthesymmetricandasymmetricmodels,respectively,andH0;Loss:��(�)=0andH0;Asym:��(�)=�+(�)inthe
asymmetricCoVaR
model.�CoVaR
denotesthecross-sectionmedianoftheweeklymediansofthisriskmeasueovertheperiodatthecorrespondingquantiles.
BankHoldingCompanies(BHC)
CommercialBanks(CB)
S ymmetricCoVaR
AsymmetricCoVaR
SymmetricCoVaR
AsymmetricCoVaR
1%5%
1%5%
1%5%
1%
5%
Constant
0.028(3.90)
0.020(3.16)
0.023(2.82)
0.014(2.50)
0.033(4.65)
0.015(1.77)
0.027(3.30)
0.012(1.34)
VIX
-0.003(-6.26)
-0.002(-6.57)
-0.002(-5.79)
-0.002(-5.82)
-0.003(-6.84)
-0.002(-6.17)
-0.003(-5.49)
-0.002(-5.39)
MarketReturn
0.007(0.11)
0.141(2.44)
-0.006(-0.06)
0.111(1.99)
-0.063(-0.06)
0.095(1.39)
-0.010(-0.04)
0.085(1.16)
�T-Bill
-0.003(-0.29)
0.014(1.37)
0.003(0.21)
0.015(1.27)
0.002(0.14)
0.014(0.93)
0.004(0.29)
0.012(0.94)
YieldSlope
0.002(1.04)
0.003(1.74)
0.003(1.15)
0.003(1.78)
0.004(1.66)
0.003(1.57)
0.004(1.78)
0.003(1.84)
DefaultPremium
-0.018(-3.86)
-0.010(-2.29)
-0.014(-3.03)
-0.008(-1.85)
-0.016(-3.41)
-0.005(-0.98)
-0.016(-3.54)
-0.005(-1.24)
NBERRecessions
0.018(1.38)
0.011(1.62)
0.017(1.58)
0.009(1.36)
0.019(1.44)
0.011(1.31)
0.025(2.04)
0.012(1.57)
FinancialRecession
-0.015(-2.32)
-0.030(-5.68)
-0.013(-1.66)
-0.025(-4.66)
-0.011(-1.57)
-0.025(-5.02)
-0.017(-2.85)
-0.022(-4.14)
Xt;i
0.086(1.34)
0.094(2.35)
--
0.061(1.55)
0.053(1.60)
--
X� t;i
--
0.373(5.64)
0.337(6.98)
--
0.212(4.20)
0.162(3.76)
X+ t;i
--
0.048(0.55)
0.030(0.56)
--
0.016(0.40)
0.029(0.71)
Pseudo-R2
43.42%
28.95%
46.14%
30.57%
39.14%
25.58%
39.54%
26.87%
�CoVaR
-0.010
-0.006
-0.037
-0.020
-0.008
-0.003
-0.025
-0.013
FrequencyofrejectionsWaldTest
Freq.Rej.H0;Ind
42.61%
58.26%
89.28%
91.88%
40.00%
45.00%
73.68%
70.00%
Freq.Rej.H0;Loss
--
83.48%
89.86%
--
65.00%
65.00%
Freq.Rej.H0;Sym
--
62.32%
74.78%
--
57.89%
50.00%

- 35 -
References
Acharya, V.V., Pedersen, L.H., Philippon, T. and Richardson, M. (2010). �Measuring systemic
risk�. Federal Reserve Bank of Cleveland, Working Paper 10-02.
Adrian, T. and Brunnermeier, M. (2011): �CoVaR�, Princeton University, Working Paper.
Andersen, T. G., Bollerslev, T., Diebold, F. X. and Vega, C. (2007) �Real-time price discovery in
stock, bond and foreign exchange markets�, Journal of International Economics, 73,
251-277.
Andersen, T. G., Bollerslev, T., Christo¤ersen, P., and Diebold, F. X. (2012) �Financial Risk
Measurement for Financial Risk Management�, in Handbook of the Economics and Finance,
Vol. 2A, ed. by George Constantinides, Milton Harris, and Rene M. Stulz (Amsterdam:
Elsevier Science B.V.), forthcoming.
Ang, A., Chen, J. and Xing, Y. (2006): �Downside Risk�. Review of Financial Studies, 19,
1191-1239.
Bank for International Settlements, (2011). �Global systemically important banks: Assessment
methodology and the additional loss absorbency requirement�.
Bali, T.G., Demirtas, K.O., and Levy, H. (2009) �Is there an intertemporal relation between
downside risk and expected returns?�. Journal of Financial and Quantitative Analysis,
44(4), 883�909.
Barberis, N., Huang, M., and Santos, T., (2001). �Prospect theory and asset prices�. Quarterly
Journal of Economics, 116, 1�53.
Bawa, V., and Lindenberg, E. (1977). �Capital market equilibrium in a mean-lower partial
moment framework�. Journal of Financial Economics, 5, 189�200.
Beber, A., and Brandt M.W. (2010). �When it cannot get better or worse: The asymmetric
impact of good and bad news on bond returns in expansions and recessions�, Review of
Finance, 14, 119-155.
Bekaert, G., and Wu, G. (2000), �Asymmetric volatility and risk in equity markets�. Review of
Financial Studies, 13(1), 1-42.
Berkelaar, A., and Kouwenberg, R. (2009). �From boom �til bust: How loss aversion a¤ects asset
prices�. Journal of Banking and Finance 33, 1005-1013.
Bernanke, B.S. (1983). �Nonmonetary e¤ects of the �nancial crisis in the propagation of the

- 36 -
Great Depression�. American Economic Reviews 73(3), 257�76.
Black, F. (1976). �Studies of stock market volatility changes�. 1976 Proceedings of the American
Statistical Association, Business and Economic Statistics Section, 177-181.
Brownlees, C. T. and Engle, R.F. (2011). �Volatility, correlation and tails for systemic risk
measurement�. New York University, Working Paper.
Brunnermeier, M., and Pedersen, L. (2009), �Market liquidity and funding liquidity�, Review of
Financial Studies 22(6), 2201-2238.
Cenesizoglu, T. and Timmerman, A. (2008). �Is the distribution of stocks returns predictable?�
University of California San Diego Working Paper.
Chernozhukov, V. (2005), �Extremal quantile regression�. The Annals of Statistics, 33(2),
806-839.
Chernozhukov, V. and Umantsev, L. (2001). �Conditional Value-at-Risk: Aspects of modeling
and estimation.�Empirical Economics, 26(1), 271-292.
Christie, A.A. (1982). �The stochastic behavior of common stock variances: Value, leverage and
interest rate e¤ects�. Journal of Financial Economics, 10, 407-432.
Diebold, F.X., and Yilmaz, K. (2011). �On the network topology of variance decompositions:
Measuring the connectedness of �nancial �rms�, University of Pennsylvania Working Paper.
French, K.R., Schwert, G.W., and Stambaugh, R. (1987). �Expected stock return and volatility�.
Journal of Financial Economics, 19, 3-29.
Goodhart, C. and Segoviano, M. (2009). �Banking stability measures,�International Monetary
Fund Working Paper 09/4.
Gul, F. (1991). �A theory of disappointment aversion�. Econometrica, 59(3), 667-689.
Hansen, B. (2000) �Sample splitting and threshold estimation�. Econometrica, 68, 575-603.
Harlow, V., and Rao, R. (1989). �Asset pricing in a generalized mean-lower partial moment
framework: Theory and evidence�. Journal of Financial and Quantitative Analysis, 24,
285�311.
Hogan, W., and Warren, J. (1974). �Toward the development of an equilibrium capital-market
model based on semivariance�. Journal of Financial and Quantitative Analysis, 9,1�11.
Huang, X., Zhou, H. and Zhu, H. (2009). �A framework for assessing the systemic risk of major
�nancial institutions�. Journal of Banking and Finance, 33, 2036-2049.

- 37 -
International Monetary Fund (2012). Global Financial Stability Report, World Economic and
Financial Surveys (Washington: International Monetary Fund.
Koenker, R. (2005). Quantile Regression. Econometric Society Monograph Series, Cambridge
University Press: Cambridge.
Koenker, R. and Bassett, G. (1978). �Regression Quantiles.�Econometrica, 46(1), 33-50.
López-Espinosa, G., Moreno, A., Rubia, A., and Valderrama, L. (2012). �Short-term wholesale
funding and systemic risk: A global CoVaR approach�. Journal of Banking and Finance,
10.1016/j.jbank�n.2012.04.020.
Longin, F., and Solnik, B. (2001). �Extreme correlation of international equity markets�.
Journal of Finance, 56, 649-676.
McNeil, A.J., Frey, R. and Embrechts, P. (2005). Quantitative Risk Management: Concepts,
Techniques, and Tools. Princeton University Press: Princeton.
McQueen, G., and Vorkink, K. (2004). �Whence GARCH? A preference-based explanation for
conditional volatility�. Review of Financial Studies, 17(4), 914-949.
Nelson, D.B. (1991). �Conditional heteroskedasticity in asset returns: A new approach�.
Econometrica, 59(2), 347-370.
Nier, E. (2011). �Macroprudential policy�Taxonomy and challenges�, National Institute
Economic Review 216, April.
Taylor, J.W. (1999). �A Quantile regression approach to estimating the distribution of
multiperiod returns.�Journal of Derivatives, 7(1), 64-78.
Zhou, C. (2010). �Are banks too big to fail? Measuring systemic importance of �nancial
institutions�. International Journal of Central Banking, 6 (4), 205-250.
Recommended


![12 Feb 2014 draft [Macroprudential Regulation.docx] Systemic … · 2013. 6. 10. · Schwarcz_Paper 2 decreasing its availability.3 Many regulatory responses to systemic risk, like](https://img.pdfslide.us/doc/110x75/60da607d3a7316237a6d2afb/12-feb-2014-draft-macroprudential-systemic-2013-6-10-schwarczpaper-2-decreasing.jpg)