SYNTHESIS AND CHARACTERIZATION OF MULTI-HOLLOW OPAQUE POLYMER PIGMENTS
A THESIS SUBMITTED TO THE GRADUATE SCHOOL OF NATURAL AND APPLIED SCIENCES
OF MIDDLE EAST TECHNICAL UNIVERSITY
BY
SERDAR ASMAOĞLU
IN PARTIAL FULFILLMENT OF THE REQUIREMENTS FOR
THE DEGREE OF MASTER OF SCIENCE IN
CHEMICAL ENGINEERING
JULY 2012

Approval of the thesis:
SYNTHESIS AND CHARACTERIZATION OF MULTI-HOLLOW OPAQUE
POLYMER PIGMENTS submitted by SERDAR ASMAOĞLU in partial fulfillment of the requirements for the degree of Master of Science in Chemical Engineering Department, Middle East Technical University by, Prof. Dr. Canan Özgen ______________ Dean, Graduate School of Natural and Applied Sciences Prof. Dr. Deniz Üner ______________ Head of Department, Chemical Engineering Prof. Dr. Güngör Gündüz ______________ Supervisor, Chemical Engineering Dept., METU Assist. Prof. Dr. Bora Maviş ______________ Co-supervisor, Mechanical Engineering Dept., HU Examining Committee Members: Prof. Dr. Hayrettin Yücel ______________ Chemical Engineering Dept., METU Prof. Dr. Güngör Gündüz ______________ Chemical Engineering Dept., METU Assoc. Prof. Dr. Halil Kalıpçılar ______________ Chemical Engineering Dept., METU Assoc. Prof. Dr. Burcu Akata Kur ______________ Micro and Nanotechnology Dept., METU Dr. Cevdet Öztin ______________ Chemical Engineering Dept., METU
Date: 27.07.2012

iii
I hereby declare that all information in this document has been obtained and presented in accordance with academic rules and ethical conduct. I also declare that, as required by these rules and conduct, I have fully cited and referenced all material and results that are not original to this work.
Name, Last name : SERDAR ASMAOĞLU
Signature :

iv
ABSTRACT
SYNTHESIS AND CHARATERIZATION OF MULTI-HOLLOW OPAQUE
POLYMER PIGMETS
Asmaoğlu, Serdar
M.Sc., Department of Chemical Engineering
Supervisor : Prof. Dr. Güngör Gündüz
Co-Supervisor : Assist. Prof. Dr. Bora Maviş
July 2012, 115 pages
In the present work, a new generation opaque polymer pigment with
multihollow structure was synthesized by suspension polymerization of
“Water-in-Oil-in-Water” (W/O/W) emulsion system. Oil phase was methyl
methacrylate and ethylene glycol dimethacrylate monomer mixture at 1:1
weight ratio. The dimension and distribution of hollows inside polymer
particles are dependent on the size of water droplets which are encapsulated
in micelles. For Water-in-Oil (W/O) assembly, a hydrophobic surfactant and
hydrophilic co-surfactant (Span 80-Tween 80) combination with a
hydrophilic/lipophilic balance (HLB) value between 5-8 was used. The effects
of surfactant and co-surfactant composition on the stability of the W/O
emulsion and also on the size of water droplets were studied. In addition,
the effect of the ultrasonication on the average size of water droplets was
investigated.
v
The hollow size distribution which may possibly give the maximum scattering
efficiency was predicted by a mathematical model based on the Mie
scattering. The optimum size distribution for W/O emulsion was obtained at
the monomer/surfactant/water ratio of 75.5/9.4/15.1 after ultrasonication for
30 seconds at 80 W power.
The W/O/W emulsion was prepared by dispersing the W/O emulsion in
aqueous solution of hydrophilic Triton X-405. The influence of surfactant
concentration and mechanical mixing on monomer droplets was investigated
by size measurement and optical microscopy. After stabilizing with 1 %w/w
polyvinylpyrrolidone (PVP) solution, the W/O/W emulsion was polymerized at
55 °C for 20 h. The surface morphology of synthesized polymer pigments
was analyzed by scanning electron microscopy (SEM) and the inner hollow
structure was confirmed by transmission electron microscopy (TEM). The
analysis indicated that multihollow opaque polymer pigments were
successfully synthesized.
The opacity, the L*a*b* color, and the gloss properties of polymer pigments
were examined by spectrophotometer and glossmeter. The opacity values
were assessed by contrast ratio measurements, and the synthesized polymer
pigments provided up to 97.3 % opacity (50 %v/v solid content). In addition,
the pigments exhibited low gloss values, and yielded matt films.
Keywords: water-in-oil emulsion, water-in-oil-in-water emulsion, emulsion
stability, multihollow polymer, opaque polymer pigment, polymethyl
methacrylate.

vi
ÖZ
ÇOK BOŞLUKLU OPAK POLİMER PİGMENTLERİN ELDESİ VE
ÖZELLİKLERİNİN BELİRLENMESİ
Asmaoğlu, Serdar
Yüksek Lisans, Kimya Mühendisliği Bölümü
Tez Yöneticisi : Prof. Dr. Güngör Gündüz
Ortak Tez Yöneticisi : Yrd. Doç. Dr. Bora Maviş
Temmuz 2012, 115 sayfa
Bu çalışmada, “Su-içinde-Yağ-içinde-Su” (S/Y/S) emülsiyonunun süspansiyon
polimerleştirilmesi ile çok boşluklu yapıda yeni nesil opak polimer pigmentler
elde edilmiştir. Yağ fazı ağırlıkça 1:1 oranında metilmetakrilat ve etilen glikol
dimetakrilat monomerlerinden oluşmaktadır. Polimerlerin içerisindeki
boşlukların boyut ve dağılımları miseller tarafından sarılmış olan su
damlacıklarının boyutlarına bağlıdır. Bu çalışmada, hidrofobik ve yardımcı
hidrofilik yüzey aktif madde (Span 80-Tween 80) karışımı hidrofilik/lipofilik
denge (HLB) değeri 5 ve 8 arasında değiştirilerek kullanılmıştır. Yüzey aktif
madde karışımının “Yağ-içinde-Su” (Y/S) emülsiyon kararlılığı ve su damlacığı
boyutu üzerindeki etkisi incelenmiştir. Ultrosonikasyon değişkenlerinin su
damlacığı ortalama boyutu üzerindeki etkileri araştırılmıştır.

vii
Olası en yüksek saçılım verimini sağlabilecek boşluk boyutlarının dağılımı Mie
saçılımının matematiksel modellemesi yapılarak belirlenmiştir. En uygun W/O
emülsiyonu damlacık boyutu dağılımı, monomer, yüzey aktif madde ve su
oranı 75.5/9.4/15.1 olacak şekilde 80 W güç ve 30 saniye süreyle ultrasonic
karıştırmayle elde edilmiştir.
S/Y/S emülsiyonu, Y/S emülsiyonun sulu hidrofilik Triton X-405 çözeltisinin
içerisinde dağıtılmasıyla hazırlanmıştır. Yüzey aktif madde derişimi ve
mekanik karıştırma değişkenlerinin monomer damlacığı üzerindeki etkileri
boyut ölçümleri ve optic mikroskop gözlemleriyle incelenmiştir. W/O/W
emülsiyonu % 1’lik polivinilpirolidon çözeltisiyle kararlılaştırılmasının ardından
55 °C sıcaklıkta 20 saat süreyle polimerleştirilmiştir. Elde edilen polimer
pigmentlerin yüzey özellikleri taramalı electron mikroskobu ile incelenmiş
(SEM) ve içlerindeki boşluk yapıları geçirimli electron mikroskobu (TEM) ile
doğrulanmıştır. Yapılan analizler çok boşluklu opaK polimer pigmentlerin
başarıyla elde edildiğini göstermiştir. Polimer pigmentlerinin opaklık, L*a*b*
renk ve parlaklık özellikleri spektrofotometre ve glosmetre ile incelenmiştir.
Opasite değerleri kontrastlık oranı ölçümleriyle belirlenmiş ve elde edilen
polimer pigmentler % 97.3’e kadar (katı üzerinden hacimce % 50 oranında)
opaklık sağlamışlardır. Ayrıca pigmentler düşük parlaklık değeri göstermiş ve
mat film oluşturmuşlardır.
Anahtar sözcükler: yağ-içinde-su emülsiyonu, su-içinde-yağ-içinde-su
emülsiyonu, emülsiyon kararlılığı, çok boşluklu polimer, opak polimer
pigment, polimetil metakrilat

viii
To my endless love Özlem

ix
ACKNOWLEDGEMENTS
I owe my deepest gratitude to my supervisor Prof. Dr. Güngör Gündüz for his
expertise and support throughout my studies. I also want to thank him for
giving me the chance to work under his supervision. He guided and helped
me with his deepest knowledge at all points of this study. He inspired me in
a number of ways including not only my thesis work, but also my future
career as a chemical engineer.
I would like to offer my sincere thanks to my co-supervisor Assist. Prof. Dr.
Bora Maviş for his invaluable guidance, endless helps, great ideas and
encouragement throughout my thesis.
I would like to express my sincere thanks to Prof. Dr. Üner Çolak for his
invaluable advice, support, understanding, and kindly attitude in every
aspect.
Thanks are not enough to my laboratory friends Gülden Eroğlu, Nagehan
Keskin, Anisa Çoniku, İdil Öğretim, and Yasemin Sönmez for their
collaborative, motivating and friendly manner. Special thanks go to Ekin
Karakaya for her understanding, encouragement and friendship. I would like
to thank Sevinç Sevim Kahya for helping me get through the difficult times,
listen me every time that a need and being a special friend for me. I also
wish to express my thanks to İrem Vural and Korhan Sezgiker for their
supports and friendship.

x
My deepest gratitude is to my parents Hüseyin Asmaoğlu and Nacife
Asmaoğlu, my brothers Serhat Asmaoğlu, Mücahit Enes Asmaoğlu, and my
sister Tuğçe Asmaoğlu for their very special care, understanding, and for
their faith in me. At every step of my life, they were just beside me with their
endless love, patience, and encouragement.
I owe my loving thanks to Özlem Erkan, who is the most precious one for my
life. I am grateful for her biggest support all the way not only through my
master studies but also through my life. The words are not enough to
express my appreciation to her for all her sacrifices, persistent confidence in
me and deepest love.
I would like to thank to Mesut Eren from Betek Paint and Chemical Inc., for
supplying me paint materials necessary in my thesis.
The supports received from The Scientific and Technical Research Council of
Turkey (TÜBİTAK) (Project Number: 110T768) and Middle East Technical
University (METU) (Scientific Research Projects: BAP-03-04-2011-001) are
gratefully acknowledged.

xi
TABLE OF CONTENTS
ABSTRACT ............................................................................................ iv
ÖZ. ...................................................................................................... vi
ACKNOWLEDGEMENTS .......................................................................... ix
TABLE OF CONTENTS ............................................................................ xi
LIST OF TABLES................................................................................... xv
LIST OF FIGURES ................................................................................ xvi
LIST OF SYMBOLS AND ABBREVIATIONS ............................................. xix
CHAPTERS
1. INTRODUCTION ............................................................................... 1
2. LITERATURE REVIEW ....................................................................... 6
2.1 Opaque Polymer Pigments ......................................................... 6
2.2 Light Scattering....................................................................... 10
2.3 Emulsions ............................................................................... 14
2.3.1 Water-in-Oil (W/O) Emulsion ............................................. 15
2.3.2 Stability of W/O Emulsion .................................................. 17
2.3.2 Water-in-Oil-in-Water (W/O/W) Emulsion ........................... 31
2.3.3 Stability of Water-in-Oil-in-Water (W/O/W) Emulsion .......... 33
2.4 Polymerization of W/O/W Emulsion .......................................... 36
3. EXPERIMENTAL .............................................................................. 39
3.1 Materials ............................................................................... 39

xii
3.1.1 Monomers ........................................................................ 39
3.1.2 Surfactants ....................................................................... 41
3.1.4 Stabilizer .......................................................................... 44
3.1.5 Initiator ............................................................................ 45
3.1.6 Thickener ......................................................................... 45
3.2 Procedure ............................................................................... 46
3.2.1 Preparation of Water-in-Oil Emulsion .................................. 46
3.2.2 Preparation of Water-in-Oil-in-Water Emulsion .................... 51
3.2.3 Stabilization of Water-in-Oil-in-Water Emulsion ................... 52
3.2.4 Polymerization .................................................................. 53
3.2.5 Film Application ................................................................ 54
3.3 Characterization Methods ........................................................ 55
3.3.1 Dynamic Light Scattering (DLS) Size Measurement ............. 55
3.3.2 Scanning Electron Microscopy (SEM) .................................. 56
3.3.3 Transmission Emission Microscopy (TEM) ........................... 56
3.3.4 Fourier Transform Infrared (FTIR) Spectroscopy ................. 56
3.3.5 Viscosity Measurement ...................................................... 56
3.3.6 Optical Microscopy ............................................................ 57
3.3.7 Opacity Measurement ....................................................... 57
3.3.8 Color Measurement ........................................................... 57
3.3.8 Gloss Measurement ........................................................... 58
4. RESULTS AND DISCUSSION ............................................................... 59
4.1 Preliminary Studies on Surfactant Selection .............................. 59
xiii
4.2 Effect of Hydrophilic-Lipophilic Balance (HLB) Value on Emulsion
Stability ................................................................................. 62
4.3 Phase Stability Diagram for W/O Emulsion ................................ 66
4.3.1 Effect of Surfactant ........................................................... 66
4.4 Effect of Ultrasonication Parameters on W/O Emulsion Droplet
Size ....................................................................................... 72
4.4.1 Effect of Ultrasonication Power .......................................... 73
4.4.2 Effect of Time of Ultrasonication ........................................ 74
4.5 Mathematical Modeling of Scattering Efficiency ......................... 75
4.6 W/O Emulsion Preparation with Required Droplet Size ............... 78
4.7 Effect of Hydrophilic Surfactant Concentration on W/O/W
Emulsion Droplet Size............................................................. 79
4.8 Effect of Mixing Parameters on W/O/W Emulsion Droplet Size ... 82
4.8.1 Effect of Mechanical Mixing Speed ..................................... 82
4.8.2 Effect of Time of Mechanical Mixing ................................... 85
4.9 Opaque Polymer Pigments ....................................................... 85
4.9.1 Preliminary Study on Initiator ............................................ 86
4.9.2 FTIR Spectrum of Polymer Pigment .................................... 88
4.10 Morphology of Opaque Polymer Pigments ............................... 88
4.10.1 Effect of the Inner Water Phase Ratio .............................. 89
4.10.2 Effect of Surfactants Used in W/O Emulsion ...................... 93
4.10.3 Effect of Thickener .......................................................... 94
4.11 Opacity Measurements .......................................................... 96
4.12 Effect of the Amount of Pigment on Paint Opacity ................... 97
4.13 Gloss Measurements .............................................................. 98

xiv
4.14 L*a*b Color Measurement ..................................................... 98
5. CONCLUSIONS .............................................................................. 101
6. RECOMMENDATIONS .................................................................... 103
REFERENCES ......................................................................................... 104
APPENDIX ............................................................................................. 115
A. MATLAB CODES FOR SCATTERING EFFICIENCY CALCULATOR .......... 115

xv
LIST OF TABLES
TABLES
Table 2.1 Refractive index and density of some white pigments. ............ 7
Table 2.2 Ranges of HLB and corresponding emulsion and application
[14, 77] . ........................................................................... 27
Table 2.3 HLB group numbers [14]. ................................................... 28
Table 3.1 Properties of MMA used in this study. .................................. 40
Table 3.2 Properties of EGDMA used in this study. .............................. 41
Table 3.3 Properties of Span 80 used in this study. ............................. 42
Table 3.4 Properties of Tween 80 used in this study. ........................... 43
Table 3.5 Properties of Triton X-405 used in this study. ....................... 44
Table 3.6 Surfactant ratios at given HLB values. .................................. 47
Table 3.7 Composition of prepared W/O emulsions.............................. 50
Table 3.8 Film formulation. ................................................................ 54
Table 4.1 Preliminary experiments on surfactant selection. .................. 60
Table 4.2 Calculated solubility parameters of monomers and lipophilic
surfactants. ........................................................................ 62
Table 4.3 Compositions of opaque pigments. ...................................... 89
Table 4.4 Opacity measurement results of polymer pigments ............... 96
Table 4.5 Gloss values of opaque polymer pigments. ........................... 98
Table 4.6 The color properties of opaque polymer pigments compared to
TiO2. .................................................................................. 99

xvi
LIST OF FIGURES
FIGURES
Figure 1.1 Single hollow opaque pigment ............................................... 2
Figure 1.2 Illustration of multihollow polymer pigment and the mechanism
of the improvement of hiding efficiency. ................................ 3
Figure 2.1 Steps of osmotic swelling method. ......................................... 9
Figure 2.2 Steps of non-solvent encapsulation method. ........................ 10
Figure 2.3 Schematic representation of membrane emulsification methods
[58]. .................................................................................. 17
Figure 2.4 Instability mechanisms........................................................ 19
Figure 2.5 Micelle (a) and reverse micelle (b). ...................................... 25
Figure 2.6 Complex formation of Span 80 an Tween 40 surfactants at the
water-oil interface [19]. ...................................................... 30
Figure 2.7 Effects of HLB number on particle size and PDI [17]. ............ 31
Figure 2.8 Two-step procedure of W/O/W emulsification....................... 32
Figure 2.9 Possible destabilization mechanisms for W/O/W emulsion. .... 35
Figure 2.10 Hollow polymer particles produced in the study of Lee et al.
[108]. ................................................................................ 37
Figure 2.11 Optical microscope images of multihollow PMMA microcapsules
(a) 10 %w/w EGDMA and (b) 50 %w/w EGDMA [109]. ........ 38
Figure 3.1 Structural formula of MMA. ................................................. 40
Figure 3.2 Structural formula of EGDMA. .............................................. 41
Figure 3.3 Structural formula of Span 80.............................................. 42
Figure 3.4 Structural formula of Tween 80. .......................................... 43
Figure 3.5 Chemical structure of Triton X-405. ..................................... 44

xvii
Figure 3.6 Chemical structure of PVP. .................................................. 45
Figure 3.7 Chemical structure of AIBN. ................................................ 45
Figure 3.8 General flow diagram of experimental procedure. ................. 46
Figure 3.9 Flow diagram of W/O emulsion preparation step. ................. 48
Figure 3.10 Experimental setup of W/O emulsion preparation step. ......... 48
Figure 3.11 Flow diagram and illustration of W/O/W emulsion preparation
step. .................................................................................. 52
Figure 3.12 Flow diagram and illustration of W/O/W emulsion stabilization
step. .................................................................................. 53
Figure 3.13 Experimental setup for polymerization reaction. ................... 54
Figure 4.1 Influence of surfactant mixture HLB value on the size of water
droplet. .............................................................................. 63
Figure 4.2 Change of (a) r3 and (b) 1/r2 with time. ............................... 64
Figure 4.3 Change of viscosity with HLB value. ..................................... 65
Figure 4.4 Phase diagram for monomer/surfactant/water system. ......... 67
Figure 4.5 Phase diagram for monomer/surfactant/water system. ......... 69
Figure 4.6 Size distribution of Span 80-Tween 80 surfactant mixture in
MMA:EGDMA (1:1) (a) before, and (b) after filtration. .......... 70
Figure 4.7 Images of W/O emulsions with various amount of water. ...... 71
Figure 4.8 Images of W/O emulsion with w/m of 0.05, at t: 0 and t: 24
hours after ultrasonication. ................................................. 72
Figure 4.9 Effect of ultrasonication power on W/O emulsion droplet size. 73
Figure 4.10 Effect of time of ultrasonication on W/O emulsion droplet size.
......................................................................................... 74
Figure 4.11 Temperature rise due to the ultrasonication. ........................ 75
Figure 4.12 The calculated scattering efficiency profiles of hollows with
different diameters and at varying incident radiations. .......... 76
Figure 4.13 Relative spectral power distribution of D65 [123]. ................ 78

xviii
Figure 4.14 Droplet size distribuiton of W/O emulsion (M/S/W:
75.5/9.4/15.1), 80 W, 30 seconds. ...................................... 79
Figure 4.15 The effect of surfactant concentration on W/O/W emulsion
droplet size. (wow: droplet size of the W/O/W emulsion,
suspwow: the size of suspended and stabilized droplets of
W/O/W emulsion) ............................................................... 80
Figure 4.16 Optical microscopy images for (a) 2 %w/w, (b) 3.5 %w/w, and
(c) 5 %w/w Triton X-405, (x400). ....................................... 81
Figure 4.17 Effect of mixing speed on W/O/W emulsion monomer droplet
size.................................................................................... 83
Figure 4.18 Optical microscopy image of W/O/W emulsions mixed at (a)
1000 rpm, (b) 1250 rpm, and (c) 1500 rpm. (x400). ............. 84
Figure 4.19 Effect of mixing time on W/O/W emulsion droplet size. ......... 85
Figure 4.20 SEM micrographs of polymer particles, (a1, a2); with BPO, and
(b) with AIBN. .................................................................... 87
Figure 4.21 FTIR spectrum of the synthesized polymer pigment. ............. 88
Figure 4.23 SEM micrographs of (a) OP1, (b) OP2, and (c) OP3. ............. 90
Figure 4.23 An OP2 particle. .............................................................. 91
Figure 4.24 TEM micrographs of (a) OP1 (w/m:0.1), (b) OP2 (w/m:0.2),
and (c) OP3 (w/m:0.3). ...................................................... 92
Figure 4.25 TEM micrographs of (a) OP4 (s/m:0.125) and (b) OP5
(s/m:0.175). ...................................................................... 93
Figure 4.26 Effect of PS concentration on MMA:EGDMA (1:1) mixture. .... 94
Figure 4.27 TEM micrographs of (a) OP6 (0.25 %w/w), (b) OP7 (0.5
%w/w), (c) OP8 (1 %w/w), and (d) OP9 (1.5 %w/w). ......... 95
xix
LIST OF SYMBOLS AND ABBREVIATIONS
AIBN Azobisisobutyronitrile
DLS Dynamic Light Scattering
EGDMA Ethylene Glycol Dimethacrylate
HLB Hydrophilic Lipophilic Balance
METU Middle East Technical University
M/S/W Monomer/Surfactant/Water weight ratio
OP Opaque Polymer
rpm Revolution Per Minute
PDI Polydispersity Index
PS Polystyrene
PMMA Polymetyl Methacrylate
PVP Polyvinylpyroldinone
SEM Scanning Electron Microscopy
s/m Weight ratio of Surfactant to Monomer
Span 80 Sorbitan Monooleate
TEM Transmission Electron Microscopy
TiO2 Titanium Dioxide
Tween 80 Polyoxyethylene (20) sorbitan monooleate
UNAM Bilkent University National Nanotechnology Research Center

xx
W Watt
w/m Weight ratio of Water to Monomer
W/O Water-in-Oil Emulsion
W/O/W Water-in-Oil-in-Water Emulsion
Solubility Parameter

1
CHAPTER 1
INTRODUCTION
Pigments are used as colorants and fillers in many materials such as paints,
cosmetics, and polymers. Most of the white pigments used in paint industry
are inorganic substances like titanium dioxide, calcite, zinc sulfide, and zinc
oxide. The physico-chemical incompatibility between inorganic pigments and
organic resins cause severe paint defects and results in phase separation,
agglomeration, and settling. The high density difference between organic
vehicle and inorganic pigments is another source of such defects. In paint
industry pigments are mainly of inorganic nature whereas organic pigments
are used at very low percentages (1-3 %) as coloring agents.
Recently, opaque polymer pigments have received significant attention with
their lower density and high compatibility with organic paint resins, and so
become better options to traditional white pigments. Opaque polymers have
hollow structure with thin polymeric shell and a single void inside (Figure
1.1). They provide white appearance and opacity because of scattering of
light randomly at all angles. When an incident beam of electromagnetic
radiation within the visible region interacts with a particle having diameter
close to the wavelength of radiations, that particle scatters radiations non-
selectively. The mathematical explanation of light scattering from small
particles for a real case was first described by Gustav Mie [1-3] and after

2
him, Bohren and Huffman [4] revised the Mie scattering for spherical
particles.
The Mie scattering efficiency is dependent on the shape and size of particle,
the refractive index difference between medium and particle, the wavelength
of light, and the number of particles which act as scattering centers [4, 5]. In
contrast to traditional pigments, the scattering centers in opaque polymer
pigments are the voids instead of the particles itself.
Commercialized polymer pigments are mainly produced by osmotic swelling.
In this method, carboxylic acid group containing low molecular weight
oligomers are encapsulated by shell polymers. With alkali addition acid
groups neutralize and polyelectrolytes form. The increased inner osmotic
pressure due to electrolytes leads to the absorption of water which in turn
causes swelling [6, 7].
Figure 1.1 Single hollow opaque pigment
The purpose of this study is to produce a new generation opaque polymer
pigment with multihollow structure. The increase in the number of hollows

3
inside polymer particle can enhance the scattering efficiency and thus may
impart higher opacity and hiding power. The illustration of the intended
structure to be made is given in Figure 1.2.
Figure 1.2 Illustration of multihollow polymer pigment and the mechanism of the improvement of hiding efficiency.
In this work, multihollow structured polymer particles were produced by
suspension polymerization of “Water-in-Oil-in-Water (W/O/W) emulsion”
system. “Oil” means “monomer” throughout the text. The W/O/W emulsions
are generated by dispersion of “Water-in-Oil” (W/O) emulsions in continuous
water phase which contain hydrophilic surfactant. In W/O emulsions, water
droplets are dispersed in monomer phase inside the spherical micelles by
using a hydrophobic surfactant. High speed mixing and ultrasonication are
needed to make W/O emulsions. The size of hollows inside particles are
theoretically equivalent to the size of water droplets formed in W/O
emulsification step. W/O/W emulsions are mainly used in controlled drug
delivery systems, food industry, and cosmetics [8-10].

4
Emulsion stability is a key factor for producing multihollow structured
particles by W/O/W emulsion polymerization. Nature of monomer phase,
diameter of water droplets, type and structure of surfactants, viscosity of
monomer, and density difference between water and monomer directly
affect the stability [11-14]. Creaming, sedimentation, flocculation,
coalescence, phase inversion and Oswald ripening are the mechanisms of
emulsion destabilization. Sedimentation occurs when the monomer density is
lower than water density and creaming occurs in reverse [15]. Coalescence
and flocculation are caused by droplet aggregation and migration [15, 16].
Phase inversion is the change of W/O emulsion to O/W emulsion, and vice
versa, with the change of temperature of the medium, or with the increase
of dispersed phase volume, here water, beyond a critical value [15]. Small
droplets have higher “Laplace Pressure” due to high curvature. The Oswald
ripening is the fusion of smaller droplets into bigger droplets because of their
Laplace pressures difference [15, 17]. It is stated in many studies that using
a co-surfactant in W/O emulsion enhanced the stability [16-19]. The required
ratio of surfactants can be predicted from “Hydrophilic-Lipophilic Balance”
(HLB) value. The HLB value is a scale which relates the percentage of
hydrophilic to lipophilic groups in the surfactant(s) [20, 21].
In this current work, W/O emulsions were prepared by using Span 80-Tween
80 surfactant mixtures through utrasonication. The effect of HLB number and
sonication parameters on emulsion stability and size were investigated. The
stable region for W/O emulsion was determined on a ternary phase diagram.
The size of water droplet needed to achieve maximum scattering efficiency
was predicted by a mathematical model of the Mie scattering by using the
Bohren and Huffman’s formulation. The effect of mechanical mixing and
hydrophilic surfactant concentration on the sizes of W/O/W emulsion droplets

5
were examined, and the obtained emulsions were visually observed by
optical microscopy. The W/O/W emulsions were then polymerized after
stabilizing them in aqueous polyvinylpyrrolidone (PVP) aqueous solution. The
morphological structure of the synthesized opaque polymer pigments were
studied by using scanning electron microscopy (SEM) and transmission
electron microscopy (TEM). The opacity, the gloss, and the color properties
of polymer pigments on styrene-acrylic water based clear resin were
investigated.

6
CHAPTER 2
LITERATURE REVIEW
In this chapter, opaque polymer pigments, their synthesis methods and the
light scattering phenomena which are responsible for white appearance and
opacity are briefly described. Steps used to produce multihollow structured
polymer particles; water-in-oil and water-in-oil-in-water emulsions, their
preparation procedures, instability causing phenomena and proposed
methods for enhancing the emulsion stability were discussed.
2.1 Opaque Polymer Pigments
Opaque pigments are used mainly in plastic, fabric and paints to provide
opacity, white appearance, and hiding power. Hiding power is related to the
ability of a pigmented coating to obscure a background of contrasting color.
The phenomena of white appearance in opaque pigment is different from
color pigments. While color pigments provide color by frequency-selective
absorption, opaque pigments generate white appearance by scattering the
incident light [22-24]. Incident electromagnetic radiation within the range of
visible spectrum is scattered when it interacts with a small particle. If the
diameter of that particle is close to the wavelength of visible spectrum,
scattering generates opacity and white appearance.

7
The widely used commercial white pigments in paint industry are titanium
dioxide (TiO2), zinc sulfide (ZnS), zinc oxide (ZnO), barium sulfate (BaSO4),
and calcite (CaCO3). The mostly preferred one is TiO2 in crystalline form of
rutile due to its higher refractive index [25]. Although TiO2 has higher opacity
performance, it has poor UV-radiation stability and it easily degrades [25].
These white pigments are inorganic substances and have relatively higher
densities compared to polymers. The refractive indices and densities of some
white pigments are given in Table 2.1.
Table 2.1 Refractive index and density of some white pigments.
White Pigments Density (g/cm3) Refractive Index
Titanium dioxide (Rutile) (TiO2) 4.23 2.70
Zinc oxide (ZnO) 5.60 2.00
Zinc sulfide (ZnS) 4.09 2.40
Barium sulfate (BaSO4) 4.50 1.64
Calcite (CaCO3) 2.71 1.49-1.66
Incompatible nature of inorganic opaque pigments results in weaker
interaction between them and the organic resins and polymers they are
embedded in. This situation causes inorganic pigments to have a tendency of
agglomeration among themselves and thereby phase separate from the
organic medium. In addition, higher densities of inorganic pigments cause
them to sediment due to gravitational effect.

8
In order to increase compatibility of inorganic pigments and overcome
dispersion problems some methods were proposed in literature. One is
reducing the size of pigments where decreased dimensions reduce the
surface tension, prevent flocculation and provide higher dispersibility. In
addition, according to Stokes-Einstein equation, sedimentation rate of
pigments decrease dramatically with reduction in size. However, decreasing
the size has unfavorable effect on scattering efficiency where white
appearance shifts to blue color according to Rayleigh scattering and with
even further reduction pigments become transparent. The optimum size of
commercial TiO2 is in between 0.25 and 0.45 µm [23]. Another method is
modifying the surfaces of inorganic pigments by encapsulating them with
polymers in a core shell structure [26-28]. Encapsulation yields compatibility
with resin however it is not a solution to high density problem.
The most promising alternative to inorganic pigments is polymeric pigments
which have a spherical structure with polymeric shell and a single hollow
inside in it [7, 29]. With the refractive index difference created by air-
polymer interface and a diameter near the visible spectrum wavelength,
hollow acts as scattering center [7]. This scattering is responsible for opacity
and white appearance. Void structured spherical polymer particles were first
produced by Kowalski and Vogel and patented in 1984 [30, 31]. After that,
studies focused on optimizing these particles to use them as opacifying agent
and it was first commercialized by Rohm & Haas Company. Opaque polymer
pigments have lower density, perfect compatibility and strong interaction
with resin molecules. However, their scattering efficiencies are not as high as
that of TiO2 because of relatively lower refractive index difference in
polymer-air interface than in TiO2-polymer interface. Hence, opaque polymer

9
pigments have been used together with TiO2 in order to reduce TiO2 content
in paint.
There are various methods for the production of single hollow polymeric
pigments. The two methods commonly used are (i) osmotic swelling and (ii)
non-solvent encapsulation. In osmotic swelling method a low molecular
weight carboxylic acid group containing core polymer is synthesized inside
micelles with Oil-in-Water (O/W) emulsion polymerization. After addition of
monomer and polymerization, the core is encapsulated with shell polymer.
With alkali addition, the carboxyl groups of core are neutralized and thus
formed polyelectrolytes increase the osmotic pressure inside shell polymer.
Due to osmotic pressure core absorbs water and swells the shell [6].
Commercialized opaque polymer pigments are produced by osmotic swelling
method. Steps of this method are illustrated in Figure 2.1.
Figure 2.1 Steps of osmotic swelling method.
Khan et al. [32] synthesized single hollow polymer particles by using osmotic
swelling method with butyl acrylate-methacrylic acid as core monomers and

10
styrene-acrylonitrile as shell monomers. Core polymer was neutralized with
ammonia. It was shown that up to 15 % w/w of TiO2 can be replaced with
polymeric pigment without any loss of opacity performance.
In non-solvent encapsulation method low molecular weight polymers are
swollen with a hydrocarbon. Shell monomer should be soluble in that
hydrocarbon however its polymer should be incompatible with it. After
swelling of micelle with non-solvent, shell monomer is added and
polymerized. With polymerization, phase separation occurs and shell polymer
moves to hydrocarbon micelle interface. After stabilization of structure with
crosslinking and removal of non-solvent, single hollow polymer particle is
obtained [33]. Steps of this method are illustrated in Figure 2.2.
Figure 2.2 Steps of non-solvent encapsulation method.
2.2 Light Scattering
An electromagnetic radiation is combination of oscillating electric and
magnetic fields which are perpendicular to each other. When an incident
radiation interacts with a particle, electrons of that particle are perturbed

11
periodically by electric field of incident radiation with a same frequency. The
oscillating disturbance of electrons causes an induced dipole moment and
which results molecule to emit its own electromagnetic radiation. The
emitted radiation by molecule of particle is at identical frequency of incident
radiation and this process named as elastic scattering. Due to the
contribution of incident and emitted radiations, travelling light slow down and
its direction is bended [34, 35]. Opacity and white appearance of pigments
are a consequence of scattering phenomena.
When the electromagnetic radiations of visible spectrum interact with opaque
pigment, which has a diameter near the visible radiations wavelength, they
are scattered around non-selectively. Opacity is a result of that light
scattering and white appearance caused by the interference of scattered
radiations. The driving effect on light scattering is the refractive index
difference between medium and pigment. Refractive index can be thought as
the degree of light-matter interaction.
Mathematical expression of light scattering was described by Gustav Mie in
the beginning of 20th century for small spherical particles. He treated the
interaction of gold colloids with light in point of scattering, absorption,
polarization and color phenomena. It was the first solution on a real case [1,
3].
Bohren and Huffman [4] modified the solution of Mie scattering for spherical
particles having diameter near visible spectrum wavelength. Their
formulation is given in below.

12
(2.1)
where; σext is extinction cross section, σscat scattering cross section, and σabs
is absorption cross section. x is the size parameter, a is the radius of
scattering center, and λ is wavelength of incident radiation in vacuum. In
addition;
(2.2)
ext n n2n 1
scat n n2n 1
ext scat abs
1/3medmax
2= (2n 1)Re(a b )
k
2= (2n 1)( a b )
k
2 n ax ka , n x 4x 2
' '2
n n 1 n n
n ' '2 (1) (1)
n n 1 n n
' '
1 n n n n
n ' '(1) (1)
1 n n n n
m j (mx) xj (x) j (x) mxj (mx)a
m j (mx) xh (x) h (x) mxj (mx)
j (mx) xj (x) j (x) mxj (mx)b
j (mx) xh (x) h (x) mxj (mx)
'
n n 1 n
'
n n 1 n
'(1) (1) (1)
n n 1 n
n n 0.5 n n 0.5
n n 0.5 n n 0.5
mxj (mx) mxj (mx) nj (mx)
xj (x) xj (x) nj (x)
xh (x) xh (x) nh (x)
j (mx) J (mx), y (mx) Y (mx)2mx 2mx
j (x) J (x), y (x) Y (x)2x 2x

13
0 0
0 0
2 2
1 1
2 2
1 1
(1)
n n
j (mx) sin mx/mx, y (mx) cos mx/mx
j (x) sin x/x, y (x) cos x/x
j (mx) sin mx/(mx) - cos mx/mx, y (mx) cos mx/(mx) - sin mx/mx
j (x) sin x/(x) - cos x/x, y (x) cos x/(x) - sin x/x
h (x) j (x) i
n
y (x)
where; an and bn are the scattering coefficients. m is the complex refractive
index of the particle relative to that of medium. µ and µ1 are permeability of
particle and medium, respectively. jn() and hn are spherical Bessel and
spherical Henkel functions of order n, respectively. hn(1) is the derivative term
and hn(1)=jn()+iyn(). Jn() and Yn() are Bessel functions. Scattering efficiencies
were described as the ratio of scattering coefficients to a2 [36]. The solution
of Mie is valid for single, perfect spherical and optically isotropic particles [1,
4].
Further researches were done by several workers and with the increase of
the ability of computers better mathematical definitions were derived for
both spherical and non-spherical particles. Matzler [36] wrote computer
programs in order to calculate scattering coefficients and efficiency in
MATLAB based on numerical computation.
Scattering efficiency, as a result opacity mainly depends on the shape and
size of particle, refractive index difference between medium and particle,
wavelength of light, and the number of particles which are acting as
scattering centers [4, 5].

14
2.3 Emulsions
Emulsion is a dispersion of liquid droplets (dispersed phase) inside another
liquid phase (continuous phase). These two liquids are immiscible in fact,
however with the presence of a third component, which is named as
emulsifier or surface active agent, it becomes possible to produce stable
dispersions. Emulsions have great importance both scientifically and
commercially. Some of the industrial applications of emulsions can be listed
as; detergents and cleaners, such as soap and dry cleaners; cosmetics and
personal care products, such as lotions, creams and hair-sprays; textile dying
and at the production steps of fibers; metal processing; production and
recycling of paper; ore flotation in mining; foods, such as mayonnaise,
chocolate, margarines and their packaging; pharmaceuticals and also
especially paints and pigments [8-10, 13, 37-41].
Emulsions can be classified according to the size of dispersed droplets. These
are; (i) macroemulsions, (ii) microemulsions, and (iii) nanoemulsions.
Macroemulsions are milky white-opaque emulsions with droplet diameter
higher than 400 nm. They can be observed by optical microscopy if the
refractive indices of liquids are different. The phase having higher refractive
index, appear brighter under microscope [11, 12]. Microemulsion is the class
in which the emulsions have droplet size smaller than 100 nm. With this size
microemulsions are transparent dispersions. The third class of emulsions is
miniemulsion (nanoemulsion) which has droplet size between macroemulsion
and microemulsion (100-400 nm). These emulsions have appearance of
white-blue color [11, 12, 17, 42-44]. Macroemulsions and miniemulsions are
thermodynamically unstable but can be kinetically stable which means that
under a certain condition of pressure and temperature their stability is
dependent on time. Unlike macroemulsions and miniemulsions,

15
microemulsions are thermodynamically stable and this stability is
independent of time [45]. On the other hand, the total surface area of
dispersed droplets are much higher in microemulsions, hence the amount of
required surfactant molecules is much higher.
Emulsions can be also classified according to the nature of dispersed and
continuous phase such as; (i) Water-in-Oil (W/O) emulsion, (ii) Oil-in-Water
(O/W), multiple Water-in-Oil-in-Water (W/O/W) emulsion, and Oil-in-Water-
in-Oil (O/W/O) emulsion [15]. The type of emulsion also depends on the
nature of surfactant whether it is hydrophilic or lipophilic, mass fraction of
phases and the preparation method [11].
In this study, W/O and W/O/W emulsions were prepared since they facilitate
production of multihollow opaque polymer pigments. Therefore, in this
section it is dwelled on these emulsions.
2.3.1 Water-in-Oil (W/O) Emulsion
In W/O emulsion, water is the inner phase and oil is the continuous (outer)
phase. “Oil” term is given for any organic liquid which is water immiscible. In
this study, oil phase was the monomer mixture. W/O emulsions are prepared
by using surface active agents which are more oil soluble and on the
contrary O/W emulsions are prepared by water soluble ones. This principle is
known as Bancroft rule [46, 47]. In conventional method, as first step,
surfactant oil solution is prepared. Then, water is added to oil phase and
dispersed with an appropriate mixing method like mechanical mixing or
ultrasonic homogenization. There are some other methods reported in

16
literature, such as (i) Low-energy emulsification, (ii) High internal phase
emulsification (HIPE), (iii) Microchannel emulsification.
Low-energy emulsification method consists of; “Phase inversion temperature
(PIT)” and “Catastrophic inversion” methods. In phase inversion temperature
method, at an appropriate temperature, the hydrophilic-lipophilic nature of
surfactant system changes and this effect results O/W emulsion to turn W/O
emulsion [13, 17, 48, 49]. Catastrophic inversion method implies the
excessive increase of the volume fraction of dispersed phase. Inside a
surfactant-monomer system, water is gradually added. After a critical volume
fraction is reached, O/W emulsion turns to W/O emulsion [14, 50, 51].
In high internal phase emulsification (HIPE), the volume fraction of dispersed
phase is much more than W/O emulsions which are produced by the
previously given methods (higher than 0.74). With this amount of water the
shape of droplets are deformed and separated from each other with a film of
continuous phase. HIPE method is widely used for the production of open
cellular polymer foams [52-55].
Another emulsification method is membrane emulsification. In this method,
dispersed phase is passed through a membrane material. The droplets are
formed at the interface of the porous membrane and the continuous phase.
Schematic representation of method is given in Figure 2.3. Size and
distribution of droplets in W/O emulsions are controlled by the pore size of
the membranes. For this purpose metallic, ceramic, glass or polymeric
membranes and microchannel devices have been used in literature [56-59].

17
Figure 2.3 Schematic representation of membrane emulsification methods [58].
2.3.2 Stability of W/O Emulsion
Stability is a fundamental parameter for an emulsion and can be described as
the ability to resist breakdown of the dispersed phase droplets or phase
separation. Stability of an emulsion is mainly dependent on; (i) nature of
surface active agents, (ii) existence of a steric or electric barrier, (iii) viscosity
of the dispersed phase, (iv) viscosity of the continuous phase, (v) size
distribution of droplets, (vi) dispersed phase volume fraction, (vii)
temperature [11, 12], and finally (viii) the density difference of phases [13,
14].
Size of droplets in an emulsion directly affects the stability. In
thermodynamics, free energy of formation of emulsion is defined by the
equation below.
config.
mG A - T S (2.3)
18
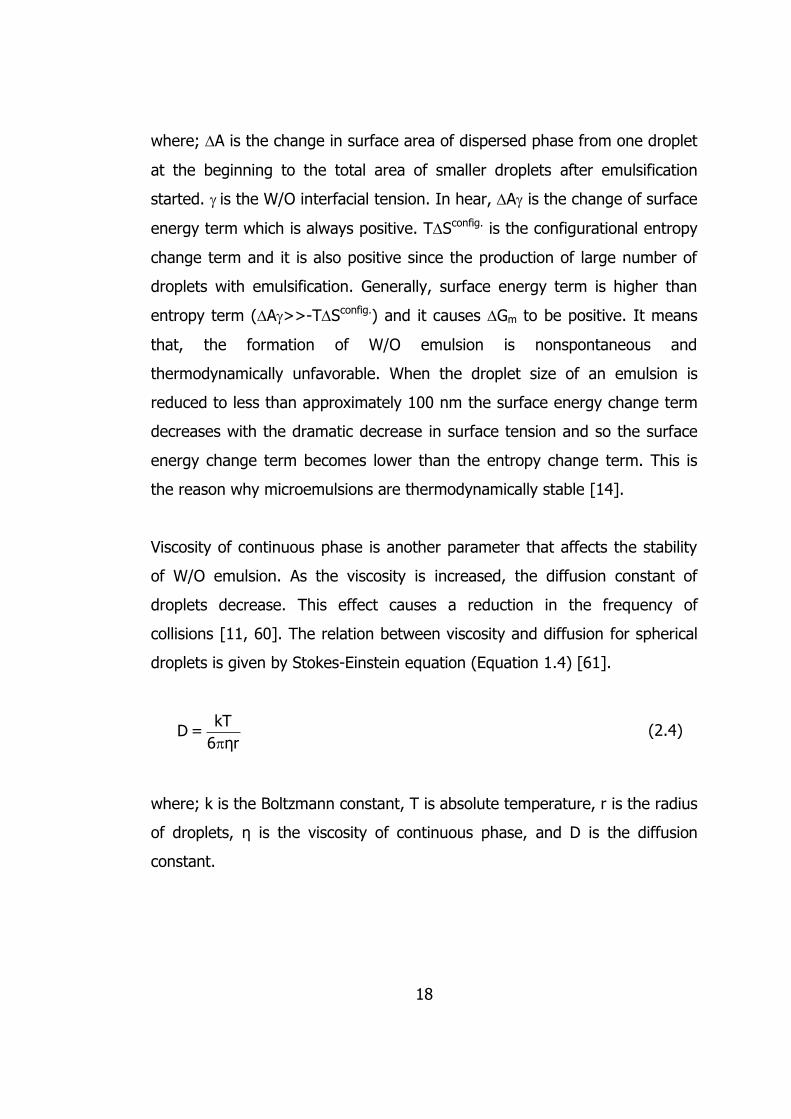
where; A is the change in surface area of dispersed phase from one droplet
at the beginning to the total area of smaller droplets after emulsification
started. is the W/O interfacial tension. In hear, A is the change of surface
energy term which is always positive. TSconfig. is the configurational entropy
change term and it is also positive since the production of large number of
droplets with emulsification. Generally, surface energy term is higher than
entropy term (A>>-TSconfig.) and it causes Gm to be positive. It means
that, the formation of W/O emulsion is nonspontaneous and
thermodynamically unfavorable. When the droplet size of an emulsion is
reduced to less than approximately 100 nm the surface energy change term
decreases with the dramatic decrease in surface tension and so the surface
energy change term becomes lower than the entropy change term. This is
the reason why microemulsions are thermodynamically stable [14].
Viscosity of continuous phase is another parameter that affects the stability
of W/O emulsion. As the viscosity is increased, the diffusion constant of
droplets decrease. This effect causes a reduction in the frequency of
collisions [11, 60]. The relation between viscosity and diffusion for spherical
droplets is given by Stokes-Einstein equation (Equation 1.4) [61].
kTD =
6 ηr (2.4)
where; k is the Boltzmann constant, T is absolute temperature, r is the radius
of droplets, ƞ is the viscosity of continuous phase, and D is the diffusion
constant.

19
In literature, several emulsion breakdown processes have been described.
These are; (i) sedimentation or creaming, (ii) Ostwald ripening, (iii)
coalescence, (iv) flocculation, and (v) phase inversion. The illustration of
instability mechanisms are given in Figure 2.4.
Figure 2.4 Instability mechanisms.
(i) Sedimentation or Creaming
Sedimentation or creaming occurs when the densities of dispersed droplets
and the continuous phase are different. The driving force for sedimentation
and creaming is the gravity. When the density of water is higher than oil

20
phase (in W/O emulsion) then sedimentation occurs and droplets settle
down. Creaming occurs in reverse conditions and water droplets migrate to
the top of continuous phase. In literature, rate of sedimentation or creaming
is defined by Stokes equation (Equation 2.3) [13, 62, 63].
2
0
2Δρgrv =
9η (2.3)
where; Δρ is the density difference of water and continuous phase, r is the
water droplet radius, g is acceleration due to gravity, and ƞ is the viscosity of
continuous phase. According to the Stokes equation size of droplet is more
important than the other parameters. Rate of sedimentation (or creaming)
can be reduced by decreasing size and density difference or increasing the
viscosity of continuous phase.
(ii) Ostwald Ripening
Smaller droplets have higher solubility than larger droplets due to their
curvature effect and Laplace pressures. Due to this effect, smaller droplets
tend to fuse with larger droplets (molecules of smaller droplets diffuse to
larger droplets) and size distribution of droplets shifts to larger ones.
Pressure for spherical droplets was first defined by Laplace [64] and Young
[65, 66]. Young-Laplace equation for spherical droplets is given in Equation
2.4.
2ΔP =
r
(2.4)

21
where; ΔP is Laplace pressure, is the surface tension, and r is the radius of
sphere. According to this equation, pressure difference of droplets is higher if
their size difference among them is high. Ostwald ripening occurs in the
emulsions which have high polydispersity in size. In addition, Ostwald
ripening rate was defined by Lifshitz-Slezov and Wagner (LSW) theory which
is given in Equation 2.5 [67, 68].
3( ) m
8C V Ddr
dt 9ρRT
(2.5)
where; ω is the frequency of rupture per unit surface of the film, r is the
droplet radius after time t, D is the diffusion coefficient of dispersed phase to
continuous phase, C(∞) is the bulk solubility, R is the gas constant, Vm is the
molar volume of dispersed phase, is the density of dispersed phase, and T
is the temperature.
(iii) Coalescence
When two emulsion droplets come too close to each other the liquid film
between droplets may thin and be disrupted due to the strong van der Waals
attraction. In this case, these two droplets fuse and one bigger droplet is
formed. Deryaguin and Scherbaker introduced a concept for film stability as
disjoining pressure ( ) [69].
Waals Elect Steric= + + (2.6)

22
Where the three contributions are: Van der Waals; Waals , electrostatic
repulsion; Elect , and steric repulsion;
Steric . In order to prevent coalescence
electrostatic and steric repulsion of film should be higher than van der Waals
attraction [13, 14].
In literature, rate of coalescence for an emulsion was expressed by Davies
and Rideal [70] based on Smoluchowski theory [11, 71].
dV 4 VkT -E/kT= edt 3 η
(2.7)
where; V is the mean volume of droplet, V is volume fraction of dispersed
phase, k is the Boltzmann constant, T is temperature, ƞ is viscosity, E is the
energy barrier term which includes the effect of electrostatic and steric
repulsion effect. As shown in equation; temperature, volume fraction,
viscosity and the surfactant directly affect the coalescence instability of W/O
emulsion.
(iv) Flocculation
Flocculation occurs when dispersed droplets aggregate due to lack of
sufficient repulsive forces. Flocculation ends up with two possible results, one
is the phase separation and the other is creaming or sedimentation [12, 13].

23
(v) Phase Inversion
Phase inversion is the change of W/O emulsion to O/W emulsion and vice
versa. There are two mechanisms for phase inversion mentioned in
literature. (i) Transitional phase inversion results due to change in conditions
such as temperature which affects the solubility of surfactant chains. When
the conditions change, the hydrophilic-lipophilic nature of surfactant may
also be changed, and more oil soluble surfactant may become more water
soluble. The other mechanism is (ii) Catastrophic phase inversion. When the
volume fraction of dispersed phase exceeds a critical value, dispersed phase
may be inverted to continuous phase.
In literature there are several studies, proposing methods to evaluate the
stability of a W/O emulsions and investigating effects of parameters on that
stability.
Porras et al. investigated the stability properties of surfactant/decane/water
emulsions which were prepared by various combinations of span-tween
surfactants. Emulsion droplet size was measured by dynamic light scattering
and stability analyzed by back light scattering data variations where stable
emulsions did not give back scattering data. Stable nanoemulsions against
phase separation were obtained with span-tween combination and ratio of
Span 80-Tween 80 (51:49), and Span 20-Tween 80 (62:38). On the
contrary, Span 20-Tween 20 (60:40) surfactant systems resulted in quick
phase separation. It is shown that obtained nanoemulsions had long term
stability for weeks however droplet size was increased with time. It was
concluded that dominant mechanisms for size increase are Ostwald ripening
and coalescence [16].

24
Peng et al. [17] prepared polyoxyethylene 2-laury ether (C12E2, HLB:6.0) and
polyoxyethylene 4-lauryl ether (C12E4, HLB: 9.7)/isohexadecane/water
nanoemulsions by low-energy emulsification method (phase inversion
temperature) at mixing temperature of 70 °C. Size of droplets and
polydispersity index were measured by dynamic light scattering. Stability was
analyzed by looking into change in droplet size with time and polydispersity
index. Unstable emulsions had higher polydispersity variation with time. The
most stable emulsions were obtained with C12E2:C12E4 ratio of 6:4. In
addition, the effect of water concentration on size and stability was
investigated. As the amount of water was increased from 10% to 50%, size
and the instability of emulsion increased due to the decrease in interfacial
film. It was shown that increase in size caused to the increase in Ostwald
ripening rate.
Ghannam et al. [72] investigated stability based on the separated amount of
water from the emulsion with time. Water-in-diesel fuel emulsions were
prepared by using nonionic Triton X-100 (iso-octylphenoxypolyethoxy
ethanol) surfactant and high speed mixing method at 15000 rpm for 2
minutes. W/O emulsion with the water content of 10% had 4 weeks, and
20% had 10 days stability without water separation. However, as the
amounts exceeded 20%, stability was limited to 5 hours. Increase in water
concentration caused an increase in the percentage of water separation.
Surfactants
Surface active agents are amphiphilic molecules that consist of both
hydrophilic (polar) and lipophilic (non-polar) groups. The lipophilic portion,

25
which is attached with hydrophilic part, is generally a straight or branched
hydrocarbon. When surfactant molecules are dissolved in a solvent, after a
certain concentration is exceeded molecules tend to aggregate and form
oriented structure. That structure is called as “micelle” and minimum
required concentration to form micelle is called as “critical micelle
concentration”. In case when the solvent is water the hydrophilic head of
surfactant interact with water via hydrogen or dipole interaction and due to
their insoluble nature and van der Waals attraction between each other
lipophilic tails aggregate and repelled from aqueous phase in order to
minimize free energy. In case when the solvent is oil, reverse micelle formed
with repelled hydrophilic head and attracted lipophilic portion. Depending on
the structure of lipophilic tail different micelle structures can be formed
(Spherical, wormlike and large lamellar). The structure of spherical micelle
and reverse micelles are given in Figure 2.5.
Figure 2.5 Micelle (a) and reverse micelle (b).
Surfactants can be classified according to the nature of hydrophilic portion
as; (i) nonionic, (ii) anionic, (or cationic), and (iii) amphoteric surfactants.
Anionic surfactants contain negatively charged hydrophilic groups such as;
(a) (b)

26
carboxyl, sulfonate, phosphate or sulfate. In cationic surfactants, hydrophilic
group is a cation such as; amine oxides and quaternary ammonium halides.
Amphoteric surfactants contain both negatively and positively charged
groups. Nonionic surfactants do not have any charged groups. They provide
the required solubility with their content of highly polar groups such as
polyoxyethylene [11, 73].
The main role of surfactant is to reduce the interfacial free energy by
reducing the surface tension of water/oil boundary. Adsorption of surfactant
molecules at the interface of two immiscible liquids lower the surface tension
and make one phase dispersible in the other phase. Higher the amount of
adsorbed surfactant causes a larger the reduction in surface tension. The
degree of surfactant adsorption depends on the structure of surfactant
molecules and the nature of liquid phases [11, 14, 74]. Foyeke et al. [75]
investigated the interfacial properties of lipophilic nonionic surfactants of
Span 20, Span 80, Span 83, and Span 85 in mineral oil/water emulsion
system. The results showed that increase of bulk concentration of
surfactants reduced the interfacial tension.
The amount of surfactant directly influences the dispersed droplet size and
W/O emulsion stability. In the literature, most studies concluded that
increasing the amount of surfactant reduces the droplet size and increase the
emulsion stability [17, 18, 76].
Hydrophilic-Lipophilic Balance (HLB) concept
Surfactant selection is significant in order to produce desired type of
emulsion whether it is W/O or O/W. According to Bancroft rule it is needed to

27
use lipophilic surfactant (more oil soluble) for W/O emulsification and
hydrophilic (more water soluble) for O/W. Griffin et al. [20] proposed a semi-
empirical scale for the selection of appropriate surfactant called “Hydrophilic-
Lipophilic Balance (HLB)” number. HLB number is the scale which relates the
percentage of hydrophilic to lipophilic groups in the surfactant structure. The
required HLB range for particular applications and emulsion types are given
in Table 2.2.
Table 2.2 Ranges of HLB and corresponding emulsion and application
[14, 77] .
HLB Range Application
1.5-3 Anti-foaming agents
3-6 Water-in-Oil (W/O) Emulsion
7-9 Wetting Agent
8-18 Oil-in-Water (O/W) Emulsion
13-15 Detergent
15-18 Solubilizer
The HLB values in Table 2.2 are not certain and may change according to the
nature of oil, viscosity, and oil/water ratio [11, 49]. Kloet et al. [78] showed
that an O/W emulsion formed with kerosene/water ratio of 50:50 and Span
80/Tween surfactant mixture HLB value of 13.9. On the other hand, when
kerosene/water ratio was changed to 20:80 with same HLB value this time
formed emulsion was W/O. Despite few exceptions HLB value concept is a
successful method for surfactant prediction.

28
Davies et al. [70] devised a method for calculation of the HLB value of
particular surfactants based on the contribution of structural groups. Formula
for HLB calculation and the group numbers of used in formula is given in
Equation 2.8 and Table 2.3.
HLB = 7+ (Hydrophilic group numbers) - (Lipophilic group numbers) (2.8)
Table 2.3 HLB group numbers [14].
Surfactant type/group Group number
Hydrophilic
-COONa 19.1
-COO- 21.2
-SO4Na+ 38.7
N (tertiary amine) 9.4
Ester (sorbitan ring) 6.8
-O- 1.3
CH- (sorbitan ring) 0.5
Lipophilic
(-CH-),(-CH2-), CH
3 0.475
Derived
-CH2- -CH
2-O 0.33
-CH2-CH
2--CH
2-O- -0.15
HLB number of surfactants has significant effect of both emulsion stability
and dispersed droplet size. Al-Sabagh [79] examined the effect of HLB
number on the asphalt emulsions by using different surfactants with various

29
HLB numbers. Stability of emulsions was defined by batch settling time (time
required to 50% of aqueous phase separation) and coalescence rate. The
maximum stability of W/O emulsion was obtained at HLB values of 4-5, and
O/W emulsion at HLB values of 10-13 with 8% of surfactant concentration.
For W/O emulsions, as HLB increased from the value of 4.7 to 6.7, stability
decreased and coalescence rate increased.
In literature, many studies concluded that using surfactant mixtures can yield
higher emulsion stability performance. Boyd et al. [19] stated that there is a
synergetic effect between span 80 and tween 40 surfactant when used as a
blend. The lipophilic hydrocarbon chains of Tween 40 which is located in oil
phase penetrate with the hydrocarbon chains of Span 80, so that they
interact strongly. The illustration of this complex formation is given in Figure
2.6 in the next page.
Song et al. [18] investigated the stability of W/O emulsion by using the
change of turbidity ratio data with time. It was stated that the slope of
turbidity change with time has direct relation with polydispersity index and
higher slope yields less stability. Stability investigation with turbidity was
confirmed by percentage phase separation. As surfactant system of Span 80-
Tween 80 mixture, and as oil phase diesel was used. Experiments showed
that surfactant mixtures had higher stability than only Span 80. The most
stable emulsion was obtained with surfactant mixture at HLB value of 6.
Minimum phase separation occurred with the amount of 2.5 % w/w
surfactant and 10 % w/w water.

30
Figure 2.6 Complex formation of Span 80 an Tween 40 surfactants at the water-oil interface [19].
One other effect of HLB value on surfactant blend is the size and
polydispersity index (PDI) of dispersed droplets. Peng et al. [17] investigated
the change of size and PDI with HLB value. The influence of HLB number of
polyoxyethylene 2-laury ether (C12E2, HLB: 6.0) and polyoxyethylene 4-lauryl
ether (C12E4, HLB: 9.7) ratios of isohexadecane/water emulsions is shown in
Figure 2.7.

31
Figure 2.7 Effects of HLB number on particle size and PDI [17].
As shown in Figure 2.7, increase of HLB number up to 7 had a reducing
effect on both size and PDI.
2.3.2 Water-in-Oil-in-Water (W/O/W) Emulsion
Water-in-Oil-in-Water (W/O/W) emulsions are multiple emulsions that
combine both W/O and O/W emulsions. W/O/W emulsions are the dispersion
of oil globules, which contain relatively smaller water droplets, inside in an
aqueous continuous phase. There are two main methods reported in
literature for W/O/W emulsification. First is the (i) two-step procedure and
the other is (ii) one-step procedure. In both one and two-step processes of

32
W/O/W emulsification, nonionic surfactants of Spans and Tweens were
widely used [80-82].
In two-step procedure, firstly W/O emulsion is prepared with a low HLB value
surfactant(s) by high energy mixing or homogenization and then this
emulsion is dispersed in an aqueous phase containing high HLB value
surfactant but this time with relatively low energy mixing [83-85].
Dispersions of two-step procedure are given in Figure 2.8.
Figure 2.8 Two-step procedure of W/O/W emulsification.
Galam et al. prepared W/O/W emulsions first dispersing water inside oily
phase containing dissolved lipophilic Span 80 surfactant by homogenizer at a
speed of 35000 rpm. Then the prepared primary W/O emulsion was poured
slowly into aqueous phase containing Tween 80, at low speed of mixing.

33
One-step W/O/W emulsification method base on the phase inversion
phenomena which is a consequence of changing the surfactant affinity by
temperature increase. Morais et al. [86] prepared W/O/W emulsions with
one-step emulsification process. Oil phase containing lipophilic Span 80,
hydrophilic PEG40 hydrogenated castor oil surfactants (HLB value of 9.3 in
the mixture) and aqueous phase were heated separately to 85°C. After that,
continuous aqueous phase was slowly added to oil phase with mechanical
stirring at 400 rpm. In literature, one-step emulsification is generally not
preferred because of poor reproducibility and limited instability [49, 86, 87].
2.3.3 Stability of Water-in-Oil-in-Water (W/O/W) Emulsion
W/O/W double emulsions are less stable than single W/O or O/W emulsions
due to the existence of nested phases and increased interfaces. Stability of
W/O/W emulsion depends on numerous parameters such as; surfactant type
and concentration, HLB number, nature of oil, preparation method and
conditions, viscosity, and the phase volume ratios [81, 86, 88-94].
Schmidts et al. [95] prepared double emulsions by using Span 80 as
lipophilic surfactant and different type of hydrophilic surfactants with various
HLB values. The influence of HLB number and hydrophilic surfactant nature
on stability of W/O/W emulsion was investigated. It is shown that not only
the HLB value but also the chemical structure of surfactant influences the
stability of W/O/W emulsions. Jiao et al. [82] investigated the effect of
lipophilic and hydrophilic surfactant concentration on oil and external water
phase, respectively. Stability was enhanced with increased amount of
surfactants up to 20% for lipophilic Span 83 and 0.1% Tween 80. However,

34
further increase of concentration had destructive effect on shape of droplets
and stability.
There are several pathways described in literature for double emulsion
breakdown. One of the possible mechanisms is the coalescence of primary
emulsion droplets in case of the lack of the sufficient repulsive forces
provided by interfacial film. In this case, dispersed primary droplets combine
and bigger droplets are generated. Like internal droplets, oil droplets may
also fuse through coalescence [95, 96].
The other destabilization mechanisms are related to the migration of internal
aqueous phase to external aqueous phase or vice versa. Osmotic pressure
gradient between internal and external phases is the driving effect which
results in phase transportation. When osmotic pressure is higher in internal
phase than in external phase, water droplets migrate through continuous
aqueous phase and result to empty oil droplets. In reverse case, when
osmotic pressure is lower in internal phase, water passes through inner
droplets and causes to swell droplets. Extreme swelling ends up with burst
and release of internal phase [49, 96].
Laplace pressure effect is the other reason for W/O/W emulsion destruction.
As a consequence of curvature effect smaller droplets have higher pressures
than larger ones and the continuous aqueous phase. If the interfacial film
strength is not sufficient and size difference in inner droplets is large, smaller
droplets tent to join to form bigger ones and number of inner droplets
decrease. A second possibility is the loss of internal phase due to the Laplace
pressure gradient between inner droplets and external aqueous phase.
Pressure difference causes the water from the inner droplets to diffuse to

35
outer phase. Water transportation from inner to outer phase turns the
double W/O/W emulsion to regular O/W emulsion [49, 96]. Some possible
destabilization mechanisms for W/O/W emulsion are given in Figure 2.9.
Figure 2.9 Possible destabilization mechanisms for W/O/W emulsion.
Several approaches have been proposed in literature to overcome W/O/W
emulsion instability. Studies have been mainly focused on modifying the
nature of phases by increasing viscosity in order to prevent water diffusion,
enhancement of the stability of primary or double emulsion interface, and
regulating osmotic pressure of inner water phase by using additives to
balance Laplace pressure effect [89].

36
The influence of electrolytes such as NaCl, MgSO4 and other additives such
as sugars and proteins was investigated in several studies due to osmotic
pressure effect on emulsion stability [97-100]. Increase in osmotic active
agent concentration increased the osmotic pressure of internal droplets and
have provided enhanced stability. However, with further increase in
concentration, osmotic pressure effect became dominant and emulsion was
destabilized by swelling droplets [82]. Another alternative to improve
emulsion stability is using amphiphilic polymeric surfactants. Coverage of
droplet interface by polymeric surfactants enhances the stability due to their
strong steric stabilization capacities. In addition they provide elasticity to
interfacial film and prevent droplet coalescence [101-103]. Another way to
increase stability is increasing external phase viscosity by using thickeners
[97, 104-106].
2.4 Polymerization of W/O/W Emulsion
Polymerization of W/O/W emulsions is widely used to produce hollow
structured particles. These particles have numerous application areas such
as; drug delivery systems [8], foods [9], cosmetics [10], and microcapsules
[107]. In literature, polymerization was preformed usually by free radical
polymerization method. Lee et al. [108] produced multihollow structured
poly(methyl methacrylate) microcapsules with suspension polymerization by
using thermal initiator. Instead of hydrophilic surfactant W/O/W emulsion
was formed with hydrophilic polyvinyl alcohol polymer. SEM micrographs of
produced multihollow polymer particles are given in Figure 2.10.

37
Figure 2.10 Hollow polymer particles produced in the study of Lee et al. [108].
Kim et al. [106] studied the influence of thickener on the hollow structure.
Urethane acrylate (UA) was used as thickener and dissolved in monomer
phase in order to increase oil viscosity. They concluded that as the UA
concentration was increased, number of hollows obtained after
polymerization increased. Higher viscosity enhanced W/O/W emulsion
stability and avoided water move from inner to outer phase.
Studies showed that degree of crosslinking has a considerable effect on
stability during polymerization. Kim et al. [109] produced ethylene glycol
dimethacrylate crosslinked multihollow polymethyl methacrylate polymer
particles. It was reported that as the degree of crosslinking was increased
the ability of water (and water soluble ingredients) entrapment increased
due to the quick formation of polymer network in initial stage. In Figure 2.11,
optical microscope images of hollow particles with different crosslinker
concentrations are given.

38
Figure 2.11 Optical microscope images of multihollow PMMA microcapsules (a) 10 %w/w EGDMA and (b) 50 %w/w EGDMA [109].

39
CHAPTER 3
EXPERIMENTAL
In this chapter, the materials used in experiments are described.
Furthermore, the steps of the procedure for producing of opaque polymer
pigment are explained in detail. The characterization methods used are also
given.
3.1 Materials
Methyl methacrylate (MMA)
Ethylene glycol dimethacrylate (EGDMA)
Sorbitan monooleate (Span 80)
Polyoxyethylene (20) sorbitan monooleate (Tween 80)
Polyoxyethylene (40) isooctylphenyl ether (Triton X-405)
Polyvinylpyrrolidone (PVP)
2,2’azobisisobutyronitrile (AIBN)
Poylstyrene (PS)
3.1.1 Monomers
Methyl methacrylate (MMA) was used as the main monomer for synthesizing
the polymer backbone. MMA was selected because of better optical
properties of poly(methyl methacrylate) (PMMA). High light transmittance,

40
high light deterioration resistance, high Abbe number (lower wavelength
dependence of refractive index) and lower birefringence (uniformity of
refractive index due to the isotropic structure) can be listed as optical
characteristics of PMMA [110, 111]. Besides these properties, PMMA has high
chemical resistance and weathering corrosion resistance [112, 113]. Due to
these characteristics PMMA is widely used in optical devices and coatings.
MMA is a colorless and transparent liquid with sharp distinctive odor.
Properties and structural formula of MMA (Merck) are given in Table 3.1 and
Figure 3.1, respectively.
Table 3.1 Properties of MMA used in this study.
Chemical formula CH2=C(CH3)COOCH3
Molecular weight (g/mole) 100.12
Density (g/cm3) (25 °C) 0.94
Refractive index 1.4118
Viscosity (20 °C) 0.6 mPa.s
Figure 3.1 Structural formula of MMA.

41
Ethylene glycol dimethacrylate (EGDMA) was used as crosslinking agent for
the synthesis of polymer particles. EGDMA is widely used as the crosslinker
of PMMA. EGDMA (Merck) is a transparent liquid. Properties and structural
formula of EGDMA used in this study are given in Table 3.2 and Figure 3.2,
respectively.
Table 3.2 Properties of EGDMA used in this study.
Chemical formula CH2=C(CH3)COOCH2CH2OCOC(CH3)=CH2
Molecular weight (g/mole) 198.22
Density (g/cm3) (25 °C) 1.051
Refractive index 1.454
Viscosity (25 °C) 3.45
Figure 3.2 Structural formula of EGDMA.
3.1.2 Surfactants
Surfactants were used to form micelles in the emulsion preparation steps.
Sorbitan monooleate (Span 80) was used as primary surfactant in
preparation of “Water-in-Oil” (W/O) emulsion. Span 80, fatty acid ester of

42
sorbitan, is a brown viscous liquid. Span 80 is a monomer soluble surfactant
with hydrophobic character and it has “Hydrophilic-Lipophilic Balance Value”
(HLB) of 4.3. Properties and structural formula of Span 80 (Sigma Aldrich)
are given in Table 3.3 and Figure 3.3, respectively.
Table 3.3 Properties of Span 80 used in this study.
Chemical formula C24H44O6
Molecular weight (g/mole) 428.61
Density (g/cm3) (25 °C) 0.994
Refractive index 1.48
Viscosity (25 °C) 1200-2000 mPa.s
Figure 3.3 Structural formula of Span 80.
Polyoxyethylene (20) sorbitan monooleate (Tween 80) was used as
cosurfactant for preparation of W/O emulsion with Span 80. Tween 80 is a
polyethylene sorbitol ester and a nonionic surfactant like Span 80. Tween 80

43
is a hydrophilic surfactant with a HLB value of 15. It is a viscous liquid with a
color of clear yellow. Properties and structural formula of Tween 80 (Sigma
Aldrich) used in this study are given in Table 3.4 and Figure 3.4, respectively.
Table 3.4 Properties of Tween 80 used in this study.
Chemical formula C64H124O26
Molecular weight (g/mole) 1310
Density (g/cm3) (25 °C) 1.07
Refractive index 1.473
Viscosity (25 °C) 400-620 mPa.s
Figure 3.4 Structural formula of Tween 80.
With regard to its similar chemical structure, Tween 80 is often used in
combination with Span 80. Span 80 and Tween 80 are widely used in food,
cosmetics and pharmaceutical applications.
One of the other surfactant used in this study is Polyoxyethylene (40)
isooctylphenyl ether (Triton X-405). It is used in the preparation step of
“Water-in-Oil-in-Water” (W/O/W) emulsion. Triton X-405 is obtained by the

44
reaction of octylphenol with ethylene oxide. It is a nonionic hydrophilic
surfactant with an HLB value of 17.6. Properties and structural formula of
Triton X-405 (Sigma Aldrich - 70% in H2O) are given in Table 3.5 and Figure
3.5, respectively.
Table 3.5 Properties of Triton X-405 used in this study.
Chemical formula C33H60O10.5
Molecular weight (g/mole) 624
Density (g/cm3) (25 °C) 1.096
Refractive index 1.49
Viscosity (25 °C) 490 mPa.s
Figure 3.5 Chemical structure of Triton X-405.
3.1.4 Stabilizer
Polyvinylpyrrolidone (PVP) is used in study as stabilizer for “Water-in-Oil-in-
Water” (W/O/W) emulsion. The molecular weight of PVP was 1300000.
Chemical structure of PVP is given in Figure 3.6.

45
Figure 3.6 Chemical structure of PVP.
3.1.5 Initiator
In this study, 2,2’azobisisobutyronitrile (AIBN) was used as free radical
thermal initiator for polymerization reactions. AIBN is in the form of
crystalline powder with white color. Initiation temperature range of AIBN is
50-70 °C. Chemical structure of AIBN is given in Figure 3.7.
Figure 3.7 Chemical structure of AIBN.
3.1.6 Thickener
In this study, 10% w/w MMA solution of polystyrene (PS) was used as
thickener to increase the viscosity of monomer solution.

46
3.2 Procedure
In this study, experiments of opaque polymer synthesis were carried out in
four main steps; these are (i) preparation of W/O emulsion, (ii) preparation
of W/O/W emulsion, (iii) stabilization of W/O/W emulsion, (iv) polymerization
of W/O/W emulsion. Synthesized pigments were then mixed with a water
based resin. Detailed descriptions of these steps are given below. In every
step of experiments various characterization methods were performed.
General flow diagram of procedure is shown in Figure 3.8.
Figure 3.8 General flow diagram of experimental procedure.
3.2.1 Preparation of Water-in-Oil Emulsion
W/O/W double emulsions were prepared in two-step procedure. First one
was the preparation of W/O emulsion. The aim was forming very fine water
droplets, which were encapsulated by micelles, inside the monomer phase.
After polymerization and drying, these water droplets would form the hollows
of opaque pigment. The flow diagram and experimental setup of first step
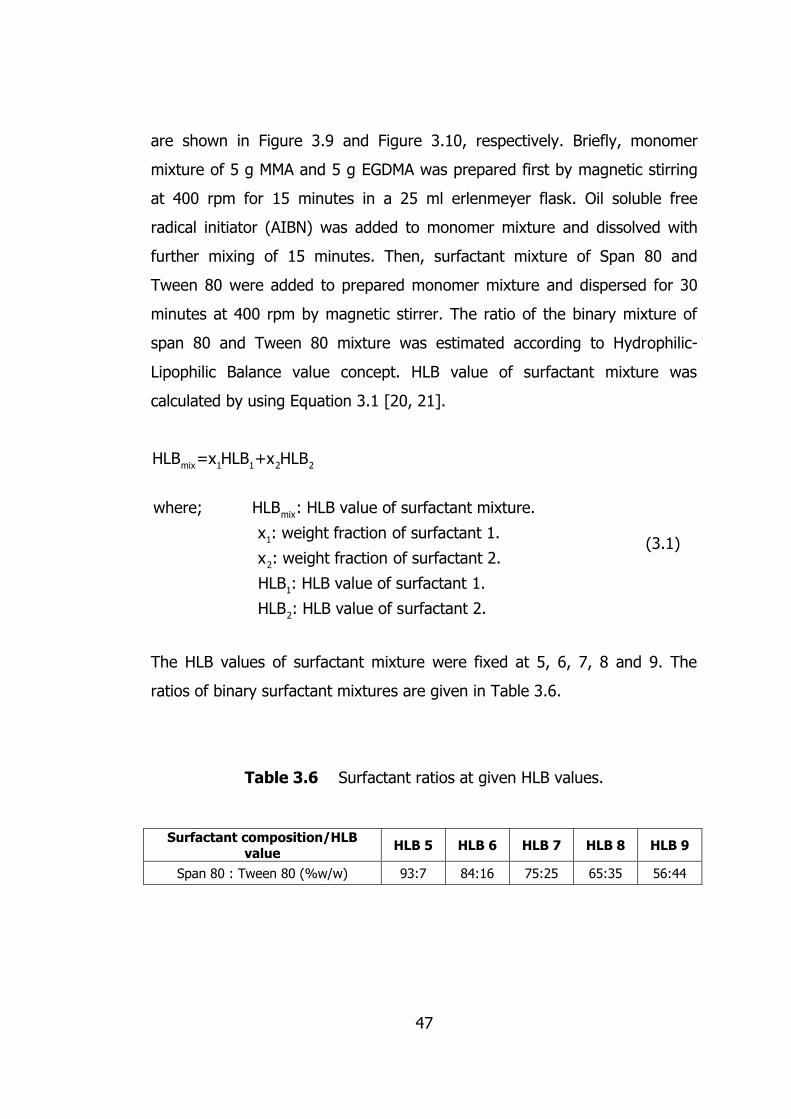
47
are shown in Figure 3.9 and Figure 3.10, respectively. Briefly, monomer
mixture of 5 g MMA and 5 g EGDMA was prepared first by magnetic stirring
at 400 rpm for 15 minutes in a 25 ml erlenmeyer flask. Oil soluble free
radical initiator (AIBN) was added to monomer mixture and dissolved with
further mixing of 15 minutes. Then, surfactant mixture of Span 80 and
Tween 80 were added to prepared monomer mixture and dispersed for 30
minutes at 400 rpm by magnetic stirrer. The ratio of the binary mixture of
span 80 and Tween 80 mixture was estimated according to Hydrophilic-
Lipophilic Balance value concept. HLB value of surfactant mixture was
calculated by using Equation 3.1 [20, 21].
mix 1 1 2 2
mix
1
2
HLB =x HLB +x HLB
where; HLB : HLB value of surfactant mixture.
x : weight fraction of surfactant 1.
x : weight fraction of surfactant 2.
1
2
HLB : HLB value of surfactant 1.
HLB : HLB value of surfactant 2.
(3.1)
The HLB values of surfactant mixture were fixed at 5, 6, 7, 8 and 9. The
ratios of binary surfactant mixtures are given in Table 3.6.
Table 3.6 Surfactant ratios at given HLB values.
Surfactant composition/HLB value
HLB 5 HLB 6 HLB 7 HLB 8 HLB 9
Span 80 : Tween 80 (%w/w) 93:7 84:16 75:25 65:35 56:44

48
Figure 3.9 Flow diagram of W/O emulsion preparation step.
Figure 3.10 Experimental setup of W/O emulsion preparation step.

49
After preparation of monomer phase, distilled deionized water was added to
mixture drop by drop by using a syringe. The amount of surfactant mixture
and water used in experiments was varied to investigate the stability and
size characteristics of W/O emulsions. For this aim, ternary phase diagrams
were prepared to visualize the stable region for monomer, surfactant and
water (M/S/W) composition. Phase diagrams were generated by preparing
W/O emulsions with different ratios of M/S/W. The compositions of W/O
emulsions are given in Table 3.7.
After addition of water to monomer phase, the mixture was ultrasonically
(US) homogenized (Bandalin Sonopuls HD 2200, with maximum power of
200 W). In order to investigate the effect of US mixing parameters on water
droplet size of W/O emulsions, sonication was done with various power and
time. During sonication, energy input into the mixture caused the
temperature of medium to increase dramatically. Temperature increase has
negative effects on W/O emulsions such as monomer loss due to evaporation
and degradation of thermal initiator before polymerization step. For these
reasons, sonication of mixtures was done with cold water bath to avoid
sudden temperature increase. After sonication, milky white appeared W/O
emulsions were obtained.

50
Table 3.7 Composition of prepared W/O emulsions.
MMA
(g)
EGDMA
(g)
S80
(g)
T80
(g)
Water
(g)
% ratio of
s/w* w/m**
HLB
s m w
5.0 5.0 0.82 0.43 4.0 8.2 65.6 26.2 0.125 0.40 8
5.0 5.0 0.82 0.43 3.5 8.5 67.8 23.7 0.125 0.35 8
5.0 5.0 0.82 0.43 3.0 8.8 70.1 21.1 0.126 0.30 8
5.0 5.0 0.82 0.43 2.5 9.1 72.7 18.2 0.125 0.25 8
5.0 5.0 0.82 0.43 2.0 9.4 75.5 15.1 0.125 0.20 8
5.0 5.0 0.82 0.43 1.5 9.8 78.4 11.8 0.125 0.15 8
5.0 5.0 0.82 0.43 1.0 10.2 81.6 8.2 0.125 0.10 8
5.0 5.0 0.82 0.43 0.5 10.6 85.1 4.3 0.125 0.05 8
5.0 5.0 0.98 0.52 2.0 11.1 74.0 14.9 0.150 0.20 8
5.0 5.0 0.82 0.43 2.0 9.4 75.5 15.1 0.125 0.20 8
5.0 5.0 0.65 0.35 2.0 7.7 76.9 15.4 0.100 0.20 8
5.0 5.0 0.98 0.52 2.5 10.7 71.4 17.9 0.150 0.25 8
5.0 5.0 0.82 0.43 2.5 9.1 72.7 18.2 0.125 0.25 8
5.0 5.0 0.65 0.35 2.5 7.4 74.1 18.5 0.100 0.25 8
5.0 5.0 2.09 1.11 2.2 21.0 65.0 14.0 0.32 0.22 5
5.0 5.0 2.09 1.11 2.2 21.0 65.0 14.0 0.32 0.22 6
5.0 5.0 2.09 1.11 2.2 21.0 65.0 14.0 0.32 0.22 7
5.0 5.0 2.09 1.11 2.2 21.0 65.0 14.0 0.32 0.22 8
5.0 5.0 2.09 1.11 2.2 21.0 65.0 14.0 0.32 0,22 9
*s/w: Surfactant to monomer ratio.
**w/m: Water to monomer ratio.

51
3.2.2 Preparation of Water-in-Oil-in-Water Emulsion
Prepared W/O emulsion in first step was then used to generate Water-in-Oil-
in-Water emulsion. Aqueous solution of Triton-X 405 was used as continuous
phase of W/O/W emulsion. In a beaker, 60 g of Triton X-405 solution with a
concentration of 5 % w/w (of total solution) was prepared by magnetic
stirring at 400 rpm for 2 hours and at ambient temperature. W/O emulsion
(13.25 g) was slowly added to Triton-X 405 solution with mechanical mixing.
In order to avoid foaming of solution, W/O emulsion was added while mixing
at 600 rpm and the speed was gradually increased up to 1250 rpm in 1
minute. After addition of W/O emulsion, mixing was continued to be stirred
for further 4 minutes more. The effect of the concentration of Triton X-405
solution, mixing speed and time were examined. Flow diagram of this step
and illustration of W/O/W emulsion are given in Figure 3.11.
The aim in this step was forming monomer droplets which were containing
smaller water droplets inside it. Surfactant was used to generate spherical
micelles and monomer droplets were encapsulated by these micelles. After
W/O/W emulsions were prepared, samples were taken and investigated
under optical microscope to prove generation of multiple emulsions. The
appearance of W/O/W emulsions was milky white.
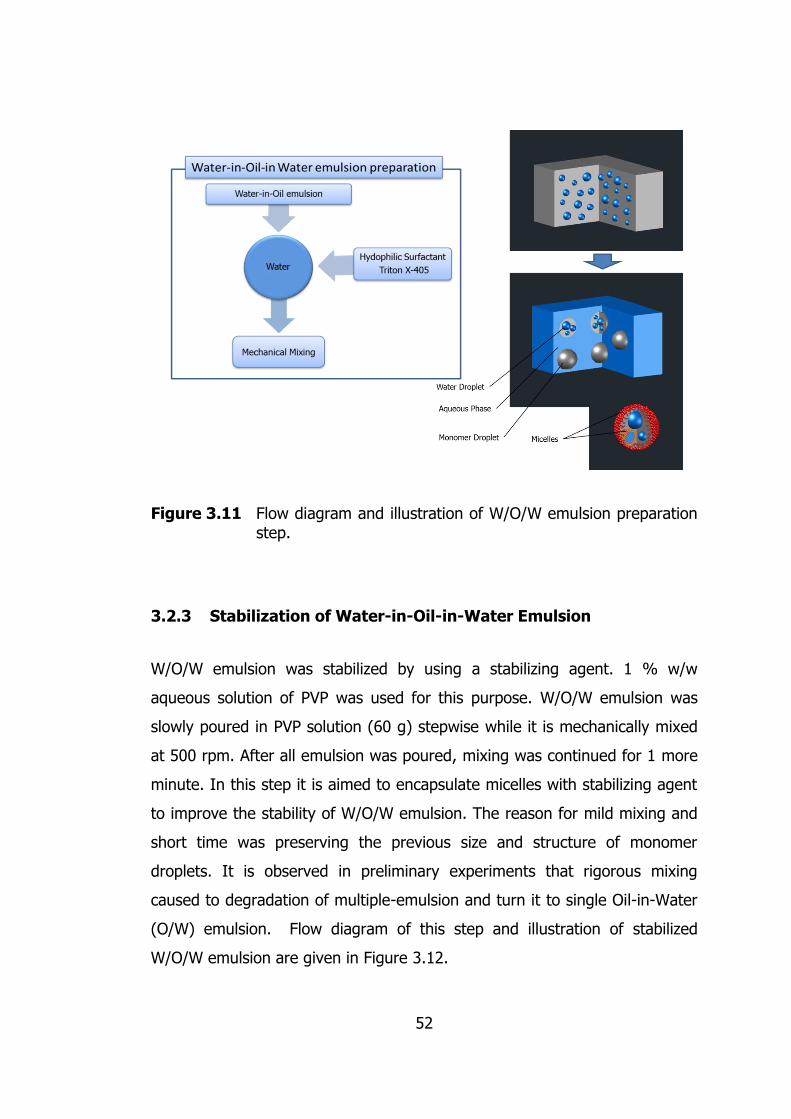
52
Figure 3.11 Flow diagram and illustration of W/O/W emulsion preparation step.
3.2.3 Stabilization of Water-in-Oil-in-Water Emulsion
W/O/W emulsion was stabilized by using a stabilizing agent. 1 % w/w
aqueous solution of PVP was used for this purpose. W/O/W emulsion was
slowly poured in PVP solution (60 g) stepwise while it is mechanically mixed
at 500 rpm. After all emulsion was poured, mixing was continued for 1 more
minute. In this step it is aimed to encapsulate micelles with stabilizing agent
to improve the stability of W/O/W emulsion. The reason for mild mixing and
short time was preserving the previous size and structure of monomer
droplets. It is observed in preliminary experiments that rigorous mixing
caused to degradation of multiple-emulsion and turn it to single Oil-in-Water
(O/W) emulsion. Flow diagram of this step and illustration of stabilized
W/O/W emulsion are given in Figure 3.12.

53
Figure 3.12 Flow diagram and illustration of W/O/W emulsion stabilization step.
3.2.4 Polymerization
After the stabilization process, the emulsion was transferred into four necked
glass reactor equipped with a condenser and temperature controller.
Nitrogen was used as inert gas during polymerization. After the system was
deoxygenated, the reaction was carried out at 55 °C for 20 hours. The
reaction medium was mixed at 250 rpm during the entire process.
Experimental setup of polymerization is shown in Figure 3.13.

54
Figure 3.13 Experimental setup for polymerization reaction.
3.2.5 Film Application
Produced opaque polymer pigments were mixed with a water based styrene
acrylic resin (Betapol SA-5017B, Betek Paint and Chemical Inc.) having 50
%w/w solid content in order to investigate paint properties such as opacity
and gloss. Films were applied with wet thickness of 150 µm by Apex four
sided applicator. The recipe used for preparing films is given in Table 3.8. All
films were dried at ambient temperature for 24 hours before measurements.
Table 3.8 Film formulation.
Component (% w/w)
Opaque Polymer Pigment 7.7
Water 69.2
Styrene-Acrylic Resin (50 %w/w solid) 15.4
Hydroxyethyl cellulose (% 2) 7.7

55
3.3 Characterization Methods
In this study, various characterization methods were used which are DLS
(Dynamic Light Scattering) size measurement, SEM (Scanning Electron
Microscopy), TEM (Transmission Electron Microscopy), FTIR (Fourier
Transform Infrared) spectroscopy, viscosity measurement, optical microscopy
opacity and gloss measurements. Details of these methods and instruments
are described below.
3.3.1 Dynamic Light Scattering (DLS) Size Measurement
The size of W/O and W/O/W emulsion samples were measured by Malvern
Zetasizer Nano ZS (Model no: ZEN3500, λ=633 nm lazer) instrument which is
located in Nuclear Application Laboratory in Chemical Engineering
Department (METU). DLS instrument measures the Brownian motion of
droplets and interpreting size from velocity of these droplets. Brownian
motion is due to the random collision of particles inside a liquid and one of
the features of this motion is the slower motion of large particle and faster
motion of smaller particles.
In such emulsion systems, droplets with higher volume may be formed in
very few numbers even it does not give any peak at number average
distribution. This effect causes misunderstanding in average size
characteristics. To avoid this effect DLS device gives average size as z-
average diameter which is intensity based. Emulsion samples were rested for
15 minutes and kept inside ultrasonic bath for 5 minutes in order to allow
emulsions to come to steady state and for removal of undesired air bubbles.
Measurements were carried out by using quartz cells as sample holder.

56
3.3.2 Scanning Electron Microscopy (SEM)
Size and morphology of opaque polymer pigments were characterized by
Scanning Electron Microscopy (SEM) which is located in National
Nanotechnology Research Laboratory (UNAM-Bilkent University) (Model: FEI
Quanta 200 FEG). SEM samples were prepared by two methods. In first one,
polymer suspension was washed and centrifuged two times. As washing
solution (1:1) water and ethanol mixture was used. After washing and
separation of samples, they were vacuum dried at 70 °C and under 0.4 bar
pressure. SEM sample specimens were coated with gold/palladium before
analysis.
3.3.3 Transmission Emission Microscopy (TEM)
Hollow structure of opaque polymer particles was investigated by using
Transmission Electron Microscopy (TEM) operated at 120 kV (Model: FEI
Tecnai G2 Spirit) which is located in METU Central Laboratory.
3.3.4 Fourier Transform Infrared (FTIR) Spectroscopy
Molecular structure of opaque polymer particles were analyzed by using
Fourier Transform Infrared (FTIR) spectroscopy (Model no: Shimadzu IR
Prestige-21).
3.3.5 Viscosity Measurement
Viscosity measurements were done by using vibrational viscometer (Model
no: AND SV-10, constant frequency of 30 Hz) which has two gold plate

57
sensors. In principle, vibrational viscometers relate viscosity with the
damping force exerted on vibrating sensors by liquid medium. Measurements
were done at constant temperature of 19 °C.
3.3.6 Optical Microscopy
Visual observation of emulsions was done by optical microscopy (Model:
Prior, maximum magnification of 1000X). Image of emulsions was taken by
using a digital camera.
3.3.7 Opacity Measurement
Opacity measurements were done by color spectrophotometer (Model no: X-
rite Color İ5, spectral range: 360-750 nm, light source: CEI standard
illuminant D65) which is located in Nuclear Application Laboratory of
Chemical Engineering Department (METU). Opacity of polymer pigments was
defined as contrast ratio value which is the ratio of lightness against black
and white background, respectively.
3.3.8 Color Measurement
The color properties of produced opaque polymer pigments were examined
by L*a*b value and measured by using color spectrophotometer (Model no:
X-rite Color İ5, spectral range: 360-750 nm, light source: CEI standard
illuminant D65). The “L” value indicates the lightness of sample where the
value is 0 at pure white and 100 at black color. On the other hand “a” value
is the measure of color from red to green (+ means shift to red and – means

58
shift to green) and “b” from yellow to blue (+ means shift to yellow and –
means shift to blue).
3.3.8 Gloss Measurement
Gloss values of films were measured by using glossmeter at angles of 20°,
60°, and 85° (Model: Rhopoint, Novo-Gloss). Gloss value of paint can be
described as the angle dependent measure of the relative ratio of diffused
reflection to specular reflection from the surface. Angle of 20°, 60°, and 85°
are used to define high gloss, medium gloss and matt paints, respectively.
Where a value lower than 10 indicates matt surface and higher than 70
indicates high gloss.
59
CHAPTER 4
RESULTS AND DISCUSSION
4.1 Preliminary Studies on Surfactant Selection
In order to prepare stable and submicron sized water-in-oil (W/O) emulsion,
it is essential to select appropriate surface active agent(s). For this purpose,
first non-ionic surfactants Span 80 (sorbitan monooleate, HLB=4.3) and Span
83 (sorbitan sesquioleate, HLB=3.7) both with lipophilic character were
separately used, and the stability of prepared W/O emulsions was examined
visually and by size measurement. The surfactants were first dissolved in
monomer(s) of methyl methacrylate (MMA) and/or ethylene glycol
dimethacrylate (EGDMA), and water is then added to the solution.
Preliminary experiments showed that Span 80-only and Span 83-only were
not adequate to obtain homogeneous emulsions. After ultrasonic
emulsification, very quick sedimentation and following phase separation was
observed.
To create synergetic effect and to increase the interfacial film strength, the
surfactant mixtures of Span 80-AOT (dioctyl sodium sulfosuccinate,
HLB=32), Span 80-Brij 97 (polyoxyethylene 10 oleoyl ether, HLB=12) , Span
80-SDBS (Sodium dodecylbenzenesulfonate, HLB=11.7), Span 80-SLS
(Sodium Lauryl Sulfate, HLB=40), Span 83-Tween 80 (Polyoxyethylene (20)
sorbitan monooleate, HLB=15), and Span 80-Tween 80 were prepared and
used for W/O emulsification. SDBS, AOT and SLS are anionic, and Brij 97 and
Tween 80 are non-ionic hydrophilic surfactants. The surfactant, monomer,

60
and water weight ratio, The HLB number of surfactant mixtures, and the
observed emulsion stability properties are given in Table 4.1.
Table 4.1 Preliminary experiments on surfactant selection.
Surfactant system
Monomer system
HLB
Ratio of emulsion
components Stability
observation S M W
Span80 MMA:EGDMA(1:1) 4.3 6.2 73.7 20.1 Phase separation
Span80 MMA:EGDMA(1:1) 4.3 9.6 80.0 10.4 sedimentation
Span80 MMA 4.3 10.0 80.0 10.0 Sedimentation
Span83 MMA:EGDMA(1:1) 3.7 10.0 80.0 10.0 Sedimentation
Span83 MMA:EGDMA(1:1) 3.7 6.9 80 13.1 Phase separation
Span80-AOT MMA:EGDMA(1:1) 7 10.0 80.0 10.0 Phase separation
Span80-AOT MMA:EGDMA(1:1) 7 9.6 76.9 13.5 Phase separation
Span80-Brij97 MMA 7 10.0 80.0 10.0 Sedimentation
Span80-Brij97 MMA 7 9.8 78.4 11.8 Sedimentation
Span80-SDBS MMA 5 10.0 80.0 10.0 Sedimentation
Span80-SDBS MMA 5 9.7 77.4 12.9 Sedimentation
Span80-SLS MMA:EGDMA(1:1) 7 11.8 78.4 9.8 Sedimentation
Span80-SLS MMA:EGDMA(1:1) 9 15.1 75.5 9.4 Sedimentation
Span83-Tween80 MMA:EGDMA(1:1) 8 10.0 80.0 10.0 Sedimentation
Span83-Tween80 MMA:EGDMA(1:1) 8 10.0 76.0 14.0 Phase separation
Span80-Tween80 MMA:EGDMA(1:1) 8 10.0 80.0 10.0 Stable
Span80-Tween80 MMA:EGDMA(1:1) 8 9.8 78.4 11.8 Stable
The emulsions which were homogenous and did not undergo phase
separation or sedimentation for a few hours were assumed to be stable. The
only successful surfactant mixture for preparation of W/O emulsion was Span
80-Tween 80 system. The reason was their similar chemical structures which
enhanced the interaction of surfactant molecules. The lipophilic portion of

61
Tween 80 can easy interact with hydrocarbon tail of Span 80, and forms
stronger interfacial film.
One of the factors affecting the surfactant efficiency is the adsorption ability
of surfactant molecules at the monomer-water interface. In case of lipophilic
surfactants, this is directly related to the solubility of surfactants in monomer
phase. The solubilities of Span 80 and Span 83 in monomer mixture of MMA
and EGDMA can be compared by their Hildebrand solubility () parameters.
The lower the difference in the value of means the higher the miscibility.
The solubility parameters were calculated by the formula below introduced
by Hildebrand and Scot [114].
(4.1)
where; Hvap (J mole-1) is the enthalpy of vaporization, R (J mol-1 K-1) is the
gas constant, T (K) is the temperature, and Vm (m3 mole-1) is the molar
volume. The Hvap values were estimated by the Hildebrand equation given
by [114, 115].
(4.2)
where; Tb (K) is boiling temperature. The calculated values are given in
Table 4.2.
vap
m
H RT
V
vap b bH 12.340 99.2(T ) 0.084(T )

62
Table 4.2 Calculated solubility parameters of monomers and lipophilic
surfactants.
Compound Solubility
parameter () (MMA-2)
MMA 20.9 -
EGDMA 19.8 1.1
Span 80 18.2 2.7
Span 83 14.2 6.7
As seen in Table 4.2 MMA and EGDMA have very close solubility parameters
which provide that they are compatible and miscible with each other. On the
other hand, the value of Span 80 is lower than that of Span 83. It simply
means that it is more compatible with monomers than Span 83.
4.2 Effect of Hydrophilic-Lipophilic Balance (HLB) Value on
Emulsion Stability
In order to understand the effect of surfactant mixture on W/O emulsion
stability and on water droplet size, a set of experiments were performed at
different Span 80/Tween 80 ratios. This ratio was arranged in a way to keep
the HLB values equal to 5, 6, 7, 8, and 9. The monomer/surfactant/water
(M/S/W) weight ratio was kept constant at 66/20/14 which actually give
percentage values and total up 100. The emulsification was performed by
ultrasonication at 60 W for 6 min.
The size of water droplets was measured at time intervals of 0, 6, 12, 18 and
24 h, and the change in the size of water droplets with time was taken as a
criterion for the stability of W/O emulsions. The results of size measurements
were given in Figure 4.1. The increase in the HLB value caused a decrease in

63
the diameter of droplets. This must be due to lower stability achieved at high
hydrophilic (i.e. high HLB) values. It is seen that emulsions prepared with
surfactant mixture with HLB value of 5 and 6 had higher size difference in
time.
Figure 4.1 Influence of surfactant mixture HLB value on the size of water droplet.
Furthermore, it is possible to relate the change of size in time to stability.
The Ostwald ripening and the coalescence grow the droplet size in time and
sedimentation of big droplets results in size reduction in the remaining upper
portion of emulsion. According to the Lifshitz-Slezov and Wagner (LSW)
theory there is a linear relationship between r3 (i.e. droplet volume) and time
when the dominating breakdown mechanism is Ostwald ripening. If the
relation between 1/r2 and time also follows a linear behavior then the
prominent instability is coalescence. A plot of 1/r2 and r3 versus time is given
in Figure 4.2a and b. A linear behavior can be assured by R2 values which
are given below the symbols in both figures. It is seen that the R2 values are
quite low to assure linearity. So it can be said that neither Ostwald ripening
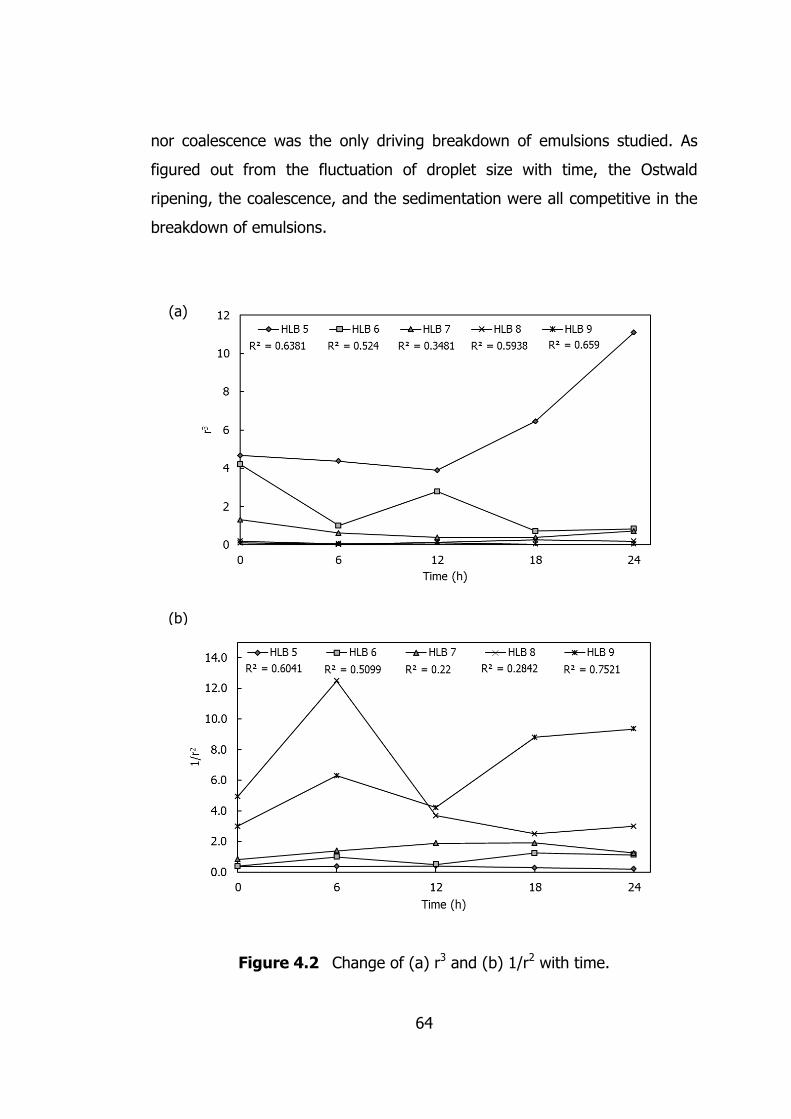
64
nor coalescence was the only driving breakdown of emulsions studied. As
figured out from the fluctuation of droplet size with time, the Ostwald
ripening, the coalescence, and the sedimentation were all competitive in the
breakdown of emulsions.
Figure 4.2 Change of (a) r3 and (b) 1/r2 with time.
(a)
(b)

65
Higher droplet sizes favored the sedimentation as expected. In the case
when HLB=5, an increasing trend in size in time was observed which may be
caused by higher coalescence or Ostwald ripening rate. On the other hand
when HLB=6 the size of droplets reduced in time which may be caused by
high sedimentation rate of large droplets. When the HLB value was
increased, it was observed that size fluctuation reduced dramatically. It can
be concluded that both droplet growth and sedimentation rate decreased
and relatively more stable emulsions were obtained.
According to the Stokes-Einstein equation the size reduction and viscosity
increase depress sedimentation rate. In this study, the increase of the HLB
value not only decreased the size but also slightly increased the oil phase
viscosity since Tween 80 has higher viscosity than Span 80. The variation of
viscosity with HLB value is given in Figure 4.3.
Figure 4.3 Change of viscosity with HLB value.

66
In fact, a good emulsion is expected to have long term stability; however, it
is out of the scope of this study and a few hours of stability was sufficient to
proceed further in this research. The W/O emulsions prepared were soon
used for the preparation of multiple water-in-oil-in-water (W/O/W) emulsion
system. The W/O/W emulsions were continuously stirred during entire
polymerization process which avoids sedimentation. On the other hand,
viscosity increase due to polymerization prevents destabilization.
The surfactant mixtures with HLB value of 8 and 9 both yielded better
stability and smaller droplet, however for the proceeding experiments the
surfactant mixture with a HLB value of 8 was used. The reason was the
increase of hydrophilic character with the increase of HLB value, and thus to
get closer to the destability edge due to phase inversion of W/O.
4.3 Phase Stability Diagram for W/O Emulsion
4.3.1 Effect of Surfactant
The amount of the emulsion components; monomer, surfactant, and water
have significant influence on stability and size. In these set of experiments,
emulsions were prepared with various ratio of monomer, surfactant, and
water (M/S/W), and the stability region of compositions were investigated.
For this purpose ternary phase diagram was prepared to visualize stable
region. In this chart every point represents a ternary ratio of M/S/W. W/O
emulsions were prepared with Span 80 and Span 80-Tween 80 (HLB 8)
surfactant(s), and homogenized by ultrasonic mixing. Phase diagram for W/O
emulsions for MMA:EGDMA (1:1) monomer mixture is given in Figure 4.4.

67
Figure 4.4 Phase diagram for monomer/surfactant/water system.
It is seen from Figure 4.4 that the stability region is very small (open
triangles) when Span 80 was used as the only surfactant; but a larger
stability region was obtained with Span 80-Tween 80 mixture (open circles).
Therefore it is much advantageous to work with Span 80-Tween 80 mixture.
In order to reduce the droplet size it is necessary to increase the amount of
surfactant molecules for compensating the increased surface area of
droplets. However, it was observed that when surfactant concentration
exceeded 20 %w/w, the emulsions lost their homogeneity and a gel formed.
This was a puzzling problem and had to be clarified.
It is highly possible that the surfactant mixture had a limited solubility in
monomer mixture and the excess surfactant molecules could result in

68
agglomeration. The solubility of surfactant is dependent on the chemical
potential, i.e. the chemical composition of monomer mixture. The chemical
potential of monomer mixture can be influenced at large extent by
introducing methacrylic acid which is highly hydrophilic because of its acidic
group. The W/O emulsions were prepared with a monomer composition of
MMA:MAA:EGDMA (8:1:1) to investigate if the size of micelles could be
further decreased by increasing the amount of surfactant. MAA has similar
optical properties with MMA and copolymerizes with the monomers.
The ternary stability diagram in this case is given by Figure 4.5. It is seen
from the comparison of Figure 4.4 and 4.5 that the stability region could be
further enlarged by the use of MAA. So the modification of monomer mixture
can help to consume more surfactant molecules and improve the stability
region.
MAA seemed to be a promising chemical to increase the solubility of
surfactant and a potential agent to decrease the size of droplets. However
the highly ionic character of carboxylic group of MAA may entirely change
the pathway of the scope of the research. So the experiments with MMA
were taken as the evidence that agglomeration is caused by the excess
surfactant molecules. The next step was therefore focused on the decrease
of agglomeration of surfactant molecules by physical means.

69
Figure 4.5 Phase diagram for monomer/surfactant/water system.
The particle size of the monomers and surfactant mixture was measured by
particle size analyzer and it is shown by second distribution on the right hand
side in Figure 4.6. The average particle size is around 1000 nm, and it is
clear that such large particles can reveal due to agglomeration.
In order to breakdown agglomeration the surfactant and monomer mixture
was filtered out by using a syringe filter made of inert polyvinylidenfluoride
(PVDF). The pore size the filter was 450 nm. The particle size of the filtrate
was analyzed and the first distribution on the left hand side of Figure 4.6 was
obtained. The agglomeration was totally removed and a well dispersed
mixture was obtained. In addition, turbid appearance of the monomer and
surfactant mixture became quite clear.

70
Figure 4.6 Size distribution of Span 80-Tween 80 surfactant mixture in MMA:EGDMA (1:1) (a) before, and (b) after filtration.
The filter was first dried out at 85°C for 2 days and then used in filtration. It
was dried out again after filtration at same conditions, and the weight
difference was calculated. It was found out that the weight increased by 0.05
%w/w. This can be either due to some surfactants adsorbed or polymer
formed from the adsorbed monomers. This weight is actually insignificant
and it can be said that all organic contents passed into filtrate.
4.3.2 Effect of Water Content
The amount of water is another parameter that affects emulsion stability.
High water concentrations destabilized the W/O emulsions due to
(a)
(b)

71
catastrophic phase inversion which occurs when the amount of water far
exceeds the amount of monomer. For instance, when water concentration
exceeded 30 %w/w, the viscosity of W/O emulsion with a surfactant to water
weight ratio of 0.125, increased drastically and turned into a viscous phase.
On the other hand, the number of water droplets dispersed in monomer
mixture might be increased as the concentration of water increased. This is a
desired situation since the higher number of droplets raises the possibility of
the existence of multiple droplets inside the W/O/W emulsion. The increased
opacity of emulsions with increased amount of water was an evidence for
this effect. The increased number of number of droplets is naturally expected
to increase light scattering. The emulsions which were prepared with
increased water to monomer (w/m) ratios (Figure 4.7). The visual
appearances of the emulsions (0.05 w/m) after 24 hours of ultrasonication
are given in Figure 4.8.
w/m: 0.05 w/m: 0.10 w/m: 1.5 w/m: 0.2 w/m: 0.25
Figure 4.7 Images of W/O emulsions with various amount of water.

72
t: 0 h t: 24 h
Figure 4.8 Images of W/O emulsion with w/m of 0.05, at t: 0 and t: 24 hours after ultrasonication.
4.4 Effect of Ultrasonication Parameters on W/O Emulsion Droplet
Size
The droplet size is the key factor that determines the diameter of voids
inside the hollow polymer particles. Actually water droplets turn into voids at
the final step. In order to produce submicron size fine droplets it is necessary
to apply sufficiently high force onto monomer-surfactant-water mixture. In
literature, it was reported that very fine droplets could be obtained within
very short times by ultrasonication [116-118]. The same method was also
used in this research.
When an ultrasonic wave which has a frequency higher than 20 kHz, is
imposed on a liquid medium it creates alternating positive and negative
pressures in that liquid. The positive and negative pressures cause the liquid
molecules to compress and stretch, respectively. When the negative pressure
generated by ultrasonic wave is large enough to alter the molecular
interactions of liquid, local break down of liquid occurs and voids are

73
generated. These voids are referred as cavitation bubbles. The formation and
collapse of those bubbles due to pressure fluctuations generates high energy
waves and results a mechanical mixing effect [116, 119, 120].
4.4.1 Effect of Ultrasonication Power
In Figure 4.9, the effect of ultrasonication power on the W/O emulsion
droplet size is given. All emulsions were prepared with the same
monomer/surfactant/water ratio of 75.5/9.4/15.1, and ultrasonicated for 30
seconds at various mixing powers. It is seen from Figure 4.9 that minimum
droplet diameter was achieved at 80 W. Further increase of power increased
the size of water droplets. At high powers droplets may gain high kinetic
energies, and droplets may hit each other with high velocities. At such
powerful collisions the steric repulsion of interfacial films may be overcome
and droplets may coalescence yielding larger size droplets.
Figure 4.9 Effect of ultrasonication power on W/O emulsion droplet size.

74
4.4.2 Effect of Time of Ultrasonication
The effect of the time of ultrasonication on W/O emulsion droplet size is
shown in Figure 4.10. The emulsions were mixed at 80 W and various mixing
time. The ratio of monomer/surfactant/water was taken to be 75.5/9.4/15.1.
A similar trend was also observed for the ultrasonication time studies. Small
droplets formed at short times, and they coalesced with each other and
yielded large size particles at elongated ultrasonication. The oscillating
behavior may be interpreted as the evidence of competition of droplet
fragmentation and coalescence.
Figure 4.10 Effect of time of ultrasonication on W/O emulsion droplet size.
The energy load during ultrasonication caused to considerably increase in the
temperature of emulsion. In order to avoid undesired loss of monomer mass
and phase inversion, all the ultrasonic emulsifications were performed in cold
water bath.

75
Figure 4.11 Temperature rise due to the ultrasonication.
The temperature rise during ultrasonication at 80 W was illustrated in Figure
4.11. There is almost a linear dependence of the increase of temperature on
the time (or total energy) of ultrasonication.
4.5 Mathematical Modeling of Scattering Efficiency
Opacity of a pigment is directly dependent to its scattering ability. In this
study, the proper hollow size to achieve better opacity performance was
investigated by a mathematical model of Mie scattering efficiency. The
extinction efficiencies of hollows for the range of visible incident radiations
were calculated by using the formulation of Bohren and Huffman [4]. An
efficiency calculation program was written in MATLAB for this aim. The codes
are given in Appendix A.

76
Bohren and Huffman’s scattering efficiency solution is valid for isotropic and
spherical single particles where multiple scattering effects are not
considered. The calculations were done by assuming that the medium in this
study contains voids embedded in polymer matrix. The required complex
refractive index of polymer particle was taken as 1.49+0.01i which is the
value for poly(methyl methacrylate) and it is also very close to that of
poly(ethylene glycol dimethacrylare) [121]. The refractive index of void was
taken as 1.0+0.01i. The coefficient of imaginary part was taken as 0.01
which is commonly used value for all weakly absorbing media [122]. The
scattering efficiencies for various radiations and hollows having diameter in
the range of 50 to 4000 nm are visualized in Figure 4.12.
Figure 4.12 The calculated scattering efficiency profiles of hollows with different diameters and at varying incident radiations.

77
It seen from Figure 4.12 that scattering efficiency has a decreasing and
oscillating behavior as the diameters of hollows increase. On the other hand,
as the wavelength of radiation increases the peaks get wider. The scattering
efficiency is measured in terms of the amplitudes of peaks. It is seen that the
second peak (the starting point is the very right hand side) has the highest
amplitude and thus highest scattering efficiency. The first peak comes next,
and other peaks starting with the third peak have slightly decreasing
scattering efficiencies.
Another observation that can be noticed is that the radiations at different
wavelengths have highest efficiency responses at different void sizes. The
radiations of visible spectrum with smaller wavelengths are more effectively
scattered by relatively smaller voids. Similarly, as the wavelength of radiation
increase, the size required for maximum scattering efficiency also increase.
This can be easily noticed from the shift of peaks with hollow diameter.
In Figure 4.13, the relative spectral power distribution of illuminant D65 is
shown, which is the equivalent of daylight [123]. As seen from the graph,
the radiations with wavelengths approximately between 430 and 650 nm
have higher spectral power. On the other hand, the human eye lens has
maximum transparency at wavelengths from 550 to 650 nm which makes
eye more sensitive in this region of radiations [124, 125]. For these reasons,
it is beneficial to form hollows which are more effectively scatter the
radiations at wavelength of 550 to 600 nm. According to simulation, these
hollows should have sizes near 450 and 1050 nm (see Figure 4.12).
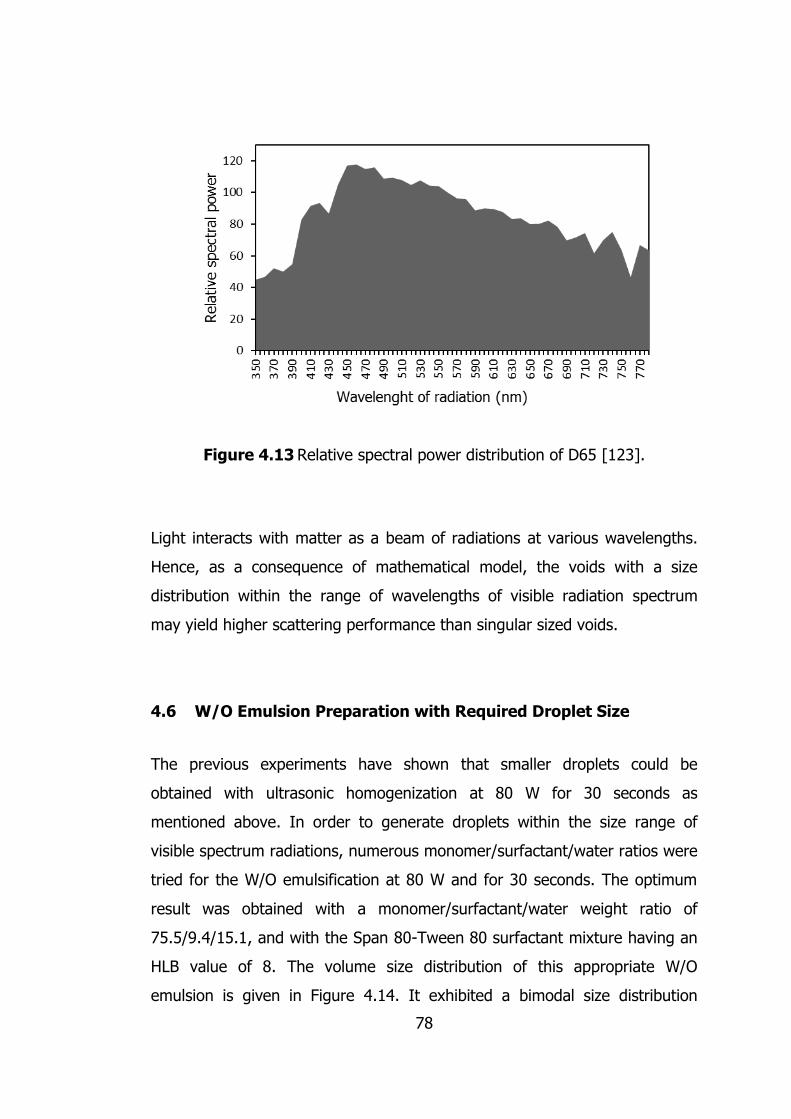
78
Figure 4.13 Relative spectral power distribution of D65 [123].
Light interacts with matter as a beam of radiations at various wavelengths.
Hence, as a consequence of mathematical model, the voids with a size
distribution within the range of wavelengths of visible radiation spectrum
may yield higher scattering performance than singular sized voids.
4.6 W/O Emulsion Preparation with Required Droplet Size
The previous experiments have shown that smaller droplets could be
obtained with ultrasonic homogenization at 80 W for 30 seconds as
mentioned above. In order to generate droplets within the size range of
visible spectrum radiations, numerous monomer/surfactant/water ratios were
tried for the W/O emulsification at 80 W and for 30 seconds. The optimum
result was obtained with a monomer/surfactant/water weight ratio of
75.5/9.4/15.1, and with the Span 80-Tween 80 surfactant mixture having an
HLB value of 8. The volume size distribution of this appropriate W/O
emulsion is given in Figure 4.14. It exhibited a bimodal size distribution

79
which was also observed for all other W/O emulsions with varying
compositions.
4.7 Effect of Hydrophilic Surfactant Concentration on W/O/W
Emulsion Droplet Size
The prepared W/O emulsions were slowly poured into an aqueous solution of
hydrophilic Triton X-405 under mechanical mixing at 1000 rpm for 4 minutes.
At this step, the monomer phase containing water droplets was encapsulated
by micelles and hereby the spherical monomer droplets with multiple water
droplets were obtained. In order to investigate the effect of surfactant
concentration on monomer droplet size, the W/O/W emulsions were
prepared at the surfactant concentrations of 2, 3.5 and 5 % w/w. As seen
from Figure 4.15, the increased surfactant concentration reduced the size of
droplets.
Figure 4.14 Droplet size distribuiton of W/O emulsion (M/S/W: 75.5/9.4/15.1), 80 W, 30 seconds.

80
Figure 4.15 The effect of surfactant concentration on W/O/W emulsion droplet size. (wow: droplet size of the W/O/W emulsion, suspwow: the size of suspended and stabilized droplets of W/O/W emulsion)
The prepared multiple emulsions were also observed by optical microscopy
and their images are given in Figure 4.16. The images clearly show that the
successful preparation of the multiple emulsions with multiple water droplets
was accomplished. Nevertheless, there were few W/O/W droplets containing
single water droplet inside (see “1”). There are also a few regular oil-in-
water (O/W) droplets (see “2”).
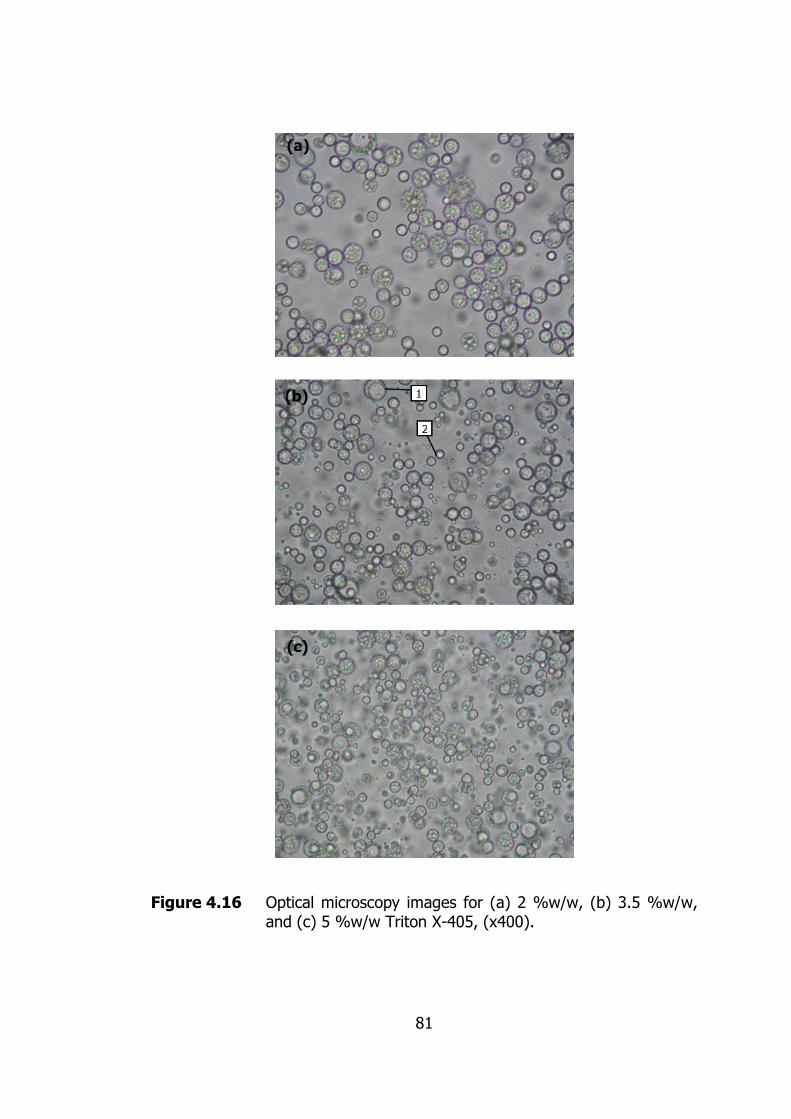
81
Figure 4.16 Optical microscopy images for (a) 2 %w/w, (b) 3.5 %w/w, and (c) 5 %w/w Triton X-405, (x400).

82
The W/O/W emulsions were then stabilized by an aqueous solution of 1
%w/w polyvinylpyrrolidone. Similar to the previous step, the W/O/W
emulsions were slowly poured into the solution under mechanical mixing at
500 rpm, and the mixture was stirred for 1 more minute. The mixing has to
done at low rpm not to break down the existing morphology of droplets. The
comparison of both curves in Figure 4.15 shows that there is not significant
size change during stabilization when mixed at 500 rpm for 1 minute. The
stabilization was done without significantly disturbing the W/O/W emulsion
structure. All the proceeding experiments were also carried by using the
aqueous solution of 5 %w/w Triton X-405.
4.8 Effect of Mixing Parameters on W/O/W Emulsion Droplet Size
Since the opaque polymer pigment particle was obtained by suspension
polymerization of W/O/W emulsion, its size was equivalent to the W/O/W
emulsion monomer droplets. Hence, adjusting of multiple emulsion droplet
size is essential where it should be small enough not to cause problems
during film applications and large enough to encapsulate multiple smaller
water droplets inside. In this set of experiments the effects of mechanical
mixing parameters were examined.
4.8.1 Effect of Mechanical Mixing Speed
Figure 4.17 shows the effect of mixing speed on the W/O/W emulsion
droplet size. The emulsions were mixed for 4 minutes. As expected, the
increase of the mixing speed reduced the diameter.

83
Figure 4.17 Effect of mixing speed on W/O/W emulsion monomer droplet size.
It can be observed that the reduced size of monomer droplets caused a
decrease in the number of multiple droplets as expected. It can also be
observed that the same behavior prevails for O/W emulsions. The minimum
monomer droplet size having multiple water droplets were obtained in Figure
4.18b where the mixing was carried at 1250 rpm. Hence the proceeding
experiments were performed at 1250 rpm.
Ultrasonication method was also attempted for use in the preparation of
multiple emulsions. However, multiple emulsions could never be obtained
even at the very low power of 10 W; only O/W emulsion formed always.

84
Figure 4.18 Optical microscopy image of W/O/W emulsions mixed at (a) 1000 rpm, (b) 1250 rpm, and (c) 1500 rpm. (x400).

85
4.8.2 Effect of Time of Mechanical Mixing
The other investigated mixing parameter was the time. The W/O/W emulsion
was slowly added to 5 %w/w Triton X-405 solution at 1250 rpm and the
samples were taken with time intervals of 2, 4, 6, 8, and 10 minutes. The
size measurement results (Figure 4.19) showed that as mixing time increase
it is possible to obtain smaller droplets. For the aim of not to lose multiple
emulsion structure due to excessive size deduction, the mixing was
performed for 4 minutes.
Figure 4.19 Effect of mixing time on W/O/W emulsion droplet size.
4.9 Opaque Polymer Pigments
The polymer particles were produced by free radical polymerization of the
W/O/W multiemulsion. The polymerization reaction temperature was kept as
low as possible in order to avoid phase inversion of surfactants. The other

86
concern was the vapor pressure of W/O/W emulsion inner water phase
where increased pressure might result to migrate or blast water droplets. For
these reasons, reactions were performed at 55 °C for 20 hours.
4.9.1 Preliminary Study on Initiator
The stabilized W/O/W emulsions were polymerized by using both benzoyl
peroxide (BPO) and 2,2’azobisisobutyronitrile (AIBN). The temperature of
polymerization was kept at 65°C when BPO was used as initiator and at 55°C
when AIBN was used [126]; in both cases polymerization was carried for 20
hours. The scanning electron microscope (SEM) micrographs of polymer
particles are given in Figure 4.20.

87
Figure 4.20 SEM micrographs of polymer particles, (a1, a2); with BPO, and (b) with AIBN.
The morphology of particles obtained was extensively affected by the type of
initiator used. The ones obtained using BPO had loose and porous surface
morphology; and some particles had holes as seen from Figure 4.20a1 and
a2. The particles obtained by using AIBN as initiator did not have such
defects as seen from Figure 4.20b. Therefore all polymerization experiments
were conducted by using AIBN.
(a1) (a2)
(b)

88
4.9.2 FTIR Spectrum of Polymer Pigment
The Fourier Transform Infrared (FTIR) spectrum of polymer produced is
given in Figure 4.21. The sharp intense peak at 1728 cm-1 is due to
stretching of carbonyl group (C=O) of ester. The peak at 1141 corresponds
to stretching vibration of C-O (ester bond). The peaks ranging from 970 to
700 cm-1 are caused by the bending of C-H. In addition, C-H stretching of
aromatic groups appears in range of 2850-3100 cm-1. These peaks may
belong to additives, i.e. surfactants and PVP.
Figure 4.21 FTIR spectrum of the synthesized polymer pigment.
4.10 Morphology of Opaque Polymer Pigments
In this section, the morphology of produced opaque polymer pigments and
the effects of parameters on hollow structure were investigated. The
compositions of the opaque pigments examined are given in Table 4.3.

89
Table 4.3 Compositions of opaque pigments.
s/m w/m Thickener
(% w/w)
OP1 0.125 0.1 -
OP2 0.125 0.2 -
OP3 0.125 0.3 -
OP4 0.075 0.2 -
OP5 0.175 0.2 -
OP6 0.125 0.2 0.25
OP7 0.125 0.2 0.5
OP8 0.125 0.2 1.0
OP9 0.125 0.2 1.5
s/m: Weight ratio of Span 80-Tween 80 (HLB 8) to monomer phase MMA:EGDMA (1:1).
w/m: Weight ratio of water to monomer phase MMA:EGDMA (1:1).
Thickener (% w/w): Percent weight ratio of thickener (Polystyrene) in monomer phase.
4.10.1 Effect of the Inner Water Phase Ratio
The amount of water has significant effect on the stability of both W/O and
W/O/W emulsions; it in turn affects the hollow structure of polymer particle.
Voids (i.e. water droplets) can be captured inside the emulsions only if
stability can be persistently accomplished. The previous stability results
showed that high amount of water destabilized the W/O emulsion. On the
other hand, the number of hollows increases with the increase of
water/monomer ratio. In order to investigate the effect of water on hollow
polymer structure, the W/O/W emulsions prepared at different water
(encapsulated)/monomer ratios.

90
The surface morphology of particles was investigated by SEM analysis
(Figure 4.22). As observed from the micrographs, all the polymer particles
have spherical structure with polydispersed size.
Figure 4.23 SEM micrographs of (a) OP1, (b) OP2, and (c) OP3.
The particles have a rough surface which is possibly the consequence of the
high degree of crosslinking. The excessive crosslinking increases the porosity
of polymer network systems. The very small particles formed may have
either single hollow or no hollow as mentioned previously (see Figure 4.18).
(a) (b)
(c)

91
The multihollow structure of polymer pigment is clearly seen in the SEM
micrograph of an OP2 particle (Figure 4.23). It is seen that larger voids also
formed which might be caused by the coalescence or Ostwald ripening of the
water droplets at early stages of polymerization.
Figure 4.23 An OP2 particle.
In order to confirm the existence of voids inside the particles and examine
the influence of water on hollow structure the TEM analysis of polymer
particles were performed. In fact, the micron size particles are not
appropriate samples for TEM analysis where relatively high thickness
prevents the transmission of electrons. However, the presence of voids inside
the particle lowers the wall thickness and makes possible to observe voids by
contrast difference. The TEM micrographs of OP1, OP2, and OP3 are given in
Figure 4.24. The lighter spherical zones in these micrographs represent the
hollows.

92
Figure 4.24 TEM micrographs of (a) OP1 (w/m:0.1), (b) OP2 (w/m:0.2), and (c) OP3 (w/m:0.3).
The TEM micrographs indicate that the number of voids per particle
increased with the increase of the amount of water. This can be clearly seen
from the comparison of OP2 (w/m:0.2) with OP1 (w/m:0.1). The number of
the multihollows in OP1 is higher than the ones in OP2. In fact OP1 is
dominated by single hollows while each particle in OP2 contains several
hollows. On the other hand, further increase in the amount of water lowered
the number of hollows as seen from in OP3 (w/m:0.3) case. The reason
(a) (b)
(c)

93
might be the decreased W/O/W emulsion stability due to the excess amount
of water which creates voids.
4.10.2 Effect of Surfactants Used in W/O Emulsion
The TEM micrographs of OP4 and OP5 are given in Figure 4.25, where, OP4
and OP5 had the surfactant (Span 80-Tween 80) mixture to monomer phase
(MMA:EGDMA (1:1)) weight ratio of 0.075 and 0.175, respectively.
Figure 4.25 TEM micrographs of (a) OP4 (s/m:0.125) and (b) OP5 (s/m:0.175).
OP5 has larger number of multihollows than OP4. The reason is thought to
be the increased interfacial film strength of the W/O emulsion with higher
amount of surfactant molecules which provided higher stability.
(a) (b)

94
4.10.3 Effect of Thickener
In this study, a thickening agent was also used to enhance the W/O/W
emulsion stability by increasing the viscosity of monomer phase. The
increase of viscosity is expected to lower the Ostwald ripening. In order to
increase viscosity, the solution of polystyrene (PS) in methyl methacrylate
(10 %w/w) was prepared and added to monomer phase. PS dissolved more
easily in methyl methacrylate than polymethyl metacrylate. The viscosity
change of solution with the amount of PS in monomer mixture is shown in
Figure 4.26.
Figure 4.26 Effect of PS concentration on MMA:EGDMA (1:1) mixture.
The TEM micrographs of the synthesized polymer pigments OP6, OP7, OP8,
and OP9 having PS are given in Figure 4.27. The TEM micrographs of PS
containing specimens were not very clear. As observed from the TEM
micrographs, the multihollow structured particles were also obtained when

95
the PS content was low (OP6 and OP7). The high amounts of PS adversely
affected the morphology as seen from Figure 4.27c and d.
Figure 4.27 TEM micrographs of (a) OP6 (0.25 %w/w), (b) OP7 (0.5 %w/w), (c) OP8 (1 %w/w), and (d) OP9 (1.5 %w/w).
(a) (b)
(c) (d)

96
4.11 Opacity Measurements
The opacity, the white appearance, and the hiding power depend on the
scattering ability of hollow polymer particles. The voids act as scattering
centers and deviate the direction of incident visible radiations. The opacity of
the polymer pigments dependent both on the size of voids and on the
number of hollows inside the particles.
The opacity measurements of synthesized polymer pigments are given in
Table 4.4, where the opacity of TiO2 is given in the last column. The results
show that the particles OP2, OP5, and OP6 which have high number of
multihollows have highest opacities.
The existence of multiple voids inside a particle increase the number of
polymer-air interface and create multiple scatterings which physically result
in higher diffraction.
Table 4.4 Opacity measurement results of polymer pigments
OP1 OP2 0P3 OP4 OP5 OP6 OP7 OP8 OP9 TiO2
Opacity 87.6 93.9 90.8 78.9 97.3 96.1 91.9 87.0 82.3 100
Another property which influences the extent of opacity is the surface
morphology of particles. Opacity increases as the surface roughness
increases, because roughness generates different angle of reflections and
increases diffraction.

97
4.12 Effect of the Amount of Pigment on Paint Opacity
A commercial paint contains about 1/3 resin and 2/3 pigment in volume
excluding solvent. In order to determine the effect of hollow polymers
synthesized on the opacity of a paint the hollow pigments were added into
water based styrene-acrylic resin. It was supplied by BETEK. The change of
opacity with the amount of added hollow pigment was given in Figure 4.28.
The opacity increases with the amount of loaded pigment. For comparison
the opacity change with TiO2 is also given in Figure 4.28. At 50 % loading the
opacity of polymer pigment and TiO2 become almost equal. In the industry
unless high gloss is needed relatively cheaper pigments with relatively low
gloss such as calcite and extenders like barite (BaSO4) are used in paints. So
the multihollow polymer pigments can be a good substitute for such low
gloss pigments and extenders.
Figure 4.28 Effect of pigment concentration on paint opacity.

98
4.13 Gloss Measurements
The results of the specular gloss measurements at incident angles of 20°,
60°, and 85° are given in Table 4.5. The very low gloss values actually are
due to the very high opacity of pigments synthesized.
Table 4.5 Gloss values of opaque polymer pigments.
20° 60° 85°
OP1 1.9 2.9 1.6
OP2 1.9 2.7 3.0
OP3 1.8 2.7 1.5
OP4 1.8 3.0 2.3
OP5 1.9 2.6 2.5
OP6 1.8 2.6 1.9
OP7 1.9 2.8 1.6
OP8 1.8 2.6 0.8
OP9 1.9 2.9 1.2
St-Ac Resin 137.7 133.2 110.9
St-Ac Resin: Styrene-Acrylic resin, without pigment addition.
4.14 L*a*b Color Measurement
In Table 4.6 and Figure 4.29 the color deviations of synthesized opaque
polymer pigments are given when TiO2 is taken as the reference. As seen
from Table 4.6 the opaque pigments OP2 and OP5 (which have low dL*
values) have more close lightness and less total color difference (dE*) to
TiO2 than the others. The shift of color to blue might be caused by the

99
existence of polymer particles having diameters lower than 100 nm. Below
this diameter, particles make more Rayleigh scattering which inversely
changes with the fourth power of wavelength of radiation. That is, blue
component of visible light undergoes more scattering and starts to dominate
the overall spectrum, and the color shifts to the blue side.
Table 4.6 The color properties of opaque polymer pigments compared to
TiO2.
dL* da* db* dE*
OP1 -18.93 0.86 -1.92 19.05
OP2 -9.49 0.53 -2.22 9.76
OP3 -15.17 0.82 -1.91 15.31
OP4 -19.00 1.27 0.46 19.05
OP5 -8.38 0.44 -1.78 8.58
OP6 -11.26 0.30 -2.47 11.53
OP7 -15.79 0.75 -1.38 15.87
OP8 -20.27 1.06 -0.09 20.30
OP9 -28.96 1.25 0.48 28.99

100
Figure 4.29 Illustration of the color properties of opaque pigments
compared to TiO2.

101
CHAPTER 5
CONCLUSIONS
1. The mixture of "Span 80-Tween 80" surfactants provided better
emulsion stability than "Span 80-only" for W/O emulsion.
2. The surfactant mixture with the HLB values of 8 and 9 yielded better
stability, and lowered the water droplet size.
3. By using ultrasonication submicron sized water droplets were obtained
at 80 W power and in 30 seconds.
4. The optimum diameters of voids for high scattering efficiency were
predicted by a mathematical model using the Mie scattering. Voids
having a size distribution ranging within the wavelength of visible
spectrum radiations are more effective than singular sized voids for
light scattering.
5. Monomer/surfactant/water (M/S/W) weight ratio had significant effect
on both W/O emulsion stability and on water droplet size. W/O
emulsion having water droplet diameters close to wavelength of visible
radiations was obtained with the M/S/W ratio of 75.5/9.4/15.1.
6. The W/O/W emulsion was prepared by the dispersion of the W/O
emulsion in aqueous solution of hydrophilic surfactant Triton X-405.
The increase of surfactant concentration, mechanical mixing speed,

102
and time had reducing effect on the monomer droplet size of the
W/O/W double emulsion. The optimum size for the monomer droplet
which then formed polymer particles, was obtained at 1250 rpm
mixing for 4 minutes. Droplets were both large enough to include
multiple water droplets.
7. The W/O/W emulsion was stabilized by using the 1 %w/w PVP
solution, and polymerized at 55°C for 20 hours to obtain opaque
polymer particles successfully.
8. High degree of crosslinking due to EGDMA resulted in porous structure
and rough surface.
9. Multihollow structured opaque polymer particles were successfully
produced after carrying out a series of optimization experiments for
the amount of water and surfactants.
10. The increase of the viscosity of monomer phase due to the use of a
thickener (in this study, PS) slightly enhanced the double emulsion
stability. However, further increase in viscosity had destructive effect
on voids and particle sphericity.
11. The produced polymer pigments provided 97.3 % opacity at 50% v/v
without any other additive.
12. The polymer pigment particles had very low gloss (very high opacity).

103
CHAPTER 6
RECOMMENDATIONS
1. The stability of W/O emulsion can be investigated by different
surfactant system.
2. The effect of void size on scattering efficiency can be studied
experimentally by producing narrow size distributed hollows.
3. Opaque polymer particles can be colored by encapsulation of color
pigments inside the voids.

104
REFERENCES
1. Mie, G., Beiträge zur Optik trüber Medien, speziell kolloidaler Metallösungen. Annalen der Physik, 1908. 330(3): p. 377-445.
2. Mishchenko, M.I., Gustav Mie and the fundamental concept of electromagnetic scattering by particles: A perspective. JOURNAL OF QUANTITATIVE SPECTROSCOPY & RADIATIVE TRANSFER, 2009. 110(14-16 SI): p. 1210-1222.
3. Helmuth, H., Gustav Mie and the scattering and absorption of light by particles: Historic developments and basics. Journal of Quantitative Spectroscopy and Radiative Transfer, 2009. 110(11): p. 787-799.
4. Bohren, C.F. and D.R. Huffman, Absorption and Scattering by a Sphere, in Absorption and Scattering of Light by Small Particles2007, Wiley-VCH Verlag GmbH. p. 82-129.
5. Hulst, H.C.v.d., Light scattering by small particles. New York (John Wiley and Sons), London (Chapman and Hall), 1957. Pp. xiii, 470; 103 Figs.; 46 Tables. 96s. Quarterly Journal of the Royal Meteorological Society, 1958. 84(360): p. 198-199.
6. Deng, W., et al., Morphological evolution of multistage polymer particles in the alkali post-treatment. European Polymer Journal, 2010. 46(6): p. 1210-1215.
7. McDonald, C.J. and M.J. Devon, Hollow latex particles: synthesis and applications. Advances in Colloid and Interface Science, 2002. 99(3): p. 181-213.
8. Masahiro, N., Places of emulsions in drug delivery. Advanced Drug Delivery Reviews, 2000. 45(1): p. 1-4.
9. Axel, B. and G. Nissim, Recent Developments in Double Emulsions for Food Applications, in Food Emulsions2003, CRC Press.
10. Vasudevan, T.V. and M.S. Naser, Some Aspects of Stability of Multiple Emulsions in Personal Cleansing Systems. Journal of Colloid and Interface Science, 2002. 256(1): p. 208-215.
11. Schwuger, M.J., Surfactants and Interfacial Phenomena. Von M. J. Rosen. John Wiley & Sons, New York 1978. 1. Aufl., XIV, 304 S., geb. $ 30.45. Angewandte Chemie, 1979. 91(5): p. 451-451.

105
12. Somasundaran, P., et al., Emulsions and Their Behavior, in Surfactants in Personal Care Products and Decorative Cosmetics, Third Edition2006, CRC Press. p. 149-175.
13. Tadros, T.F., Emulsion Science and Technology: A General Introduction, in Emulsion Science and Technology2009, Wiley-VCH Verlag GmbH & Co. KGaA. p. 1-56.
14. Engberts, J.B.F.N., Applied Surfactants. Principles and Applications. By Tharwat F. Tadros. Angewandte Chemie International Edition, 2005. 44(37): p. 5922-5922.
15. Tadros, T.F., ed. Emulsion Science and Technology. 2009, WILEY-VCH Verlag GmbH & Co. KGaA: Weinheim.
16. Porras, M., et al., Properties of water-in-oil (W/O) nano-emulsions prepared by a low-energy emulsification method. Colloids and Surfaces A: Physicochemical and Engineering Aspects, 2008. 324(1-3): p. 181-188.
17. Peng, L.-C., et al., Optimization of water-in-oil nanoemulsions by mixed surfactants. Colloids and Surfaces A: Physicochemical and Engineering Aspects, 2010. 370(1-3): p. 136-142.
18. Song, M.-G., et al., Rapid Evaluation of Water-in-Oil (w/o) Emulsion Stability by Turbidity Ratio Measurements. Journal of Colloid and Interface Science, 2000. 230(1): p. 213-215.
19. Boyd, J., C. Parkinson, and P. Sherman, Factors affecting emulsion stability, and the HLB concept. Journal of Colloid and Interface Science, 1972. 41(2): p. 359-370.
20. Griffin, W., Classification of Surface-Active Agents by 'HLB'. Journal of theSociety of Cosmetic Chemists, 1949. 1: p. 311-326.
21. WC, G., Calculation of HLB Values of Non-Ionic Surfactants. Journal of theSociety of Cosmetic Chemists, 1954. 5: p. 259.
22. Paint and Coating Testing Manual, (Gradner-Sward Handbook, 14th Edition) edited by Dr. Joseph V. Koleske. 1995: p. 156-178.
23. Auger, J.-C., V. Martinez, and B. Stout, Theoretical study of the scattering efficiency of rutile titanium dioxide pigments as a function of their spatial dispersion. Journal of Coatings Technology and Research, 2009. 6(1): p. 89-97.
106
24. Thiele, E.S. and R.H. French, Light-Scattering Properties of Representative, Morphological Rutile Titania Particles Studied Using a Finite-Element Method. Journal of the American Ceramic Society, 1998. 81(3): p. 469-479.
25. Gündüz, G., Boya bilgisi2002, Ankara: TMMOB Kimya mühendisleri Odası.
26. Rong, Y., et al., Encapsulation of titanium dioxide particles by polystyrene via radical polymerization. Colloids and Surfaces A: Physicochemical and Engineering Aspects, 2005. 253(1-3): p. 193-197.
27. Erdem, B., et al., Encapsulation of inorganic particles via miniemulsion polymerization. II. Preparation and characterization of styrene miniemulsion droplets containing TiO2 particles. Journal of Polymer Science Part A: Polymer Chemistry, 2000. 38(24): p. 4431-4440.
28. Peng, B., et al., Preparation of PS/TiO2/UF multilayer core–shell hybrid microspheres with high stability. Journal of Colloid and Interface Science, 2009. 329(1): p. 62-66.
29. Itou, N., et al., Cross-linked hollow polymer particles by emulsion polymerization. Colloids and Surfaces A: Physicochemical and Engineering Aspects, 1999. 153(1-3): p. 311-316.
30. Kowalski A., V.M., Polymeric pigment particles. US Patent 4427836, 1984.
31. Kowalski A., V.M., Core sheath polymer particles production useful as opacifying agent US Patent 446925, 1984.
32. Khan, A.K., B.C. Ray, and S.K. Dolui, Preparation of core-shell emulsion polymer and optimization of shell composition with respect to opacity of paint film. Progress in Organic Coatings, 2008. 62(1): p. 65-70.
33. McDonald, C.J., et al., Emulsion Polymerization of Voided Particles by Encapsulation of a Nonsolvent. Macromolecules, 2000. 33(5): p. 1593-1605.
34. Hahn, D.W., Light Scattering Theory. Department of Mechanical and Aerospace Engineering, University of Florida, 2009.
35. Skoog, D.A., F.J. Holler, and S.R. Crouch, Principles of instrumental analysis2007, Australia: Brooks/Cole : Thomson Learning.

107
36. Matzler, C., MATLAB functions for Mie scattering absorption. Universitas Bernensis, Research report no. 2002-08, 2002.
37. Myers, D., An Overview of Surfactant Science and Technology, in Surfactant Science and Technology2005, John Wiley & Sons, Inc. p. 1-28.
38. Nakashima, T., M. Shimizu, and M. Kukizaki, Particle control of emulsion by membrane emulsification and its applications. Advanced Drug Delivery Reviews, 2000. 45(1): p. 47-56.
39. Kei, W., et al., Bicontinuous Microemulsion Type Cleansing Containing Silicone Oil. II : Characterization of the Solution and Its Application to Cleansing Agent. Journal of Oleo Science, 2004. 53(11): p. 547-555.
40. Smulders, E., et al., Laundry Detergents, in Ullmann's Encyclopedia of Industrial Chemistry2000, Wiley-VCH Verlag GmbH & Co. KGaA.
41. Walsh, D., Microemulsions.Background, New Concepts, Applications, Perspectives. Herausgegeben von Cosima Stubenrauch. Angewandte Chemie, 2009. 121(25): p. 4542-4542.
42. Peter A. Lovell, M.S.E.-A., ed. Emulsion Polymerization and Emulsion Polymers. 1997, John Wiley & Sons Ltd: England.
43. Porras, M., et al., Studies of formation of W/O nano-emulsions. Colloids and Surfaces A: Physicochemical and Engineering Aspects, 2004. 249(1-3): p. 115-118.
44. Wang, L., et al., Design and optimization of a new self-nanoemulsifying drug delivery system. Journal of Colloid and Interface Science, 2009. 330(2): p. 443-448.
45. Fanun, M., Microemulsions : properties and applications2009, Boca Raton: CRC Press.
46. Ruckenstein, E., Microemulsions, Macroemulsions, and the Bancroft Rule. Langmuir, 1996. 12(26): p. 6351-6353.
47. Bancroft, W.D., The Theory of Emulsification, V. The Journal of Physical Chemistry, 1912. 17(6): p. 501-519.
48. Arai, H. and K. Shinoda, The effect of mixing of oils and of nonionic surfactants on the phase inversion temperatures of emulsions. Journal of Colloid and Interface Science, 1967. 25(3): p. 396-400.
49. Myers, D., Emulsions, in Surfactant Science and Technology2005, John Wiley & Sons, Inc. p. 280-322.

108
50. Zatz, J.L., Encyclopedia of emulsion technology. Volume 3. Edited by Paul Becher. Marcel Dekker: New York. 1987. xi + 437 pp. ISBN 0-8247-1878-X. $115.00. Journal of Pharmaceutical Sciences, 1989. 78(7): p. 607-607.
51. Sajjadi, S., Nanoemulsion Formation by Phase Inversion Emulsification: On the Nature of Inversion. Langmuir, 2006. 22(13): p. 5597-5603.
52. Kunieda, H., et al., The formation of gel-emulsions in a water/nonionic surfactant/oil system. Colloids and Surfaces, 1987. 24(2–3): p. 225-237.
53. Williams, J.M. and D.A. Wrobleski, Spatial distribution of the phases in water-in-oil emulsions. Open and closed microcellular foams from cross-linked polystyrene. Langmuir, 1988. 4(3): p. 656-662.
54. Williams, J.M., High internal phase water-in-oil emulsions: influence of surfactants and cosurfactants on emulsion stability and foam quality. Langmuir, 1991. 7(7): p. 1370-1377.
55. Chan Ik Park, W.-G.C., Seong Jae Lee, Emulsion stability of cosmetic creams on water-in-oil high internal phase emulsions. Korea-Australia Rheology Journal, 2003. 15(3): p. 125-130.
56. Nakashima, T. and M. Shimizu, Preparation of Monodispersed O/W Emulsion by Porous Glass Membrane. KAGAKU KOGAKU RONBUNSHU, 1993. 19(6): p. 984-990.
57. Kawakatsu, T., et al., The effect of the hydrophobicity of microchannels and components in water and oil phases on droplet formation in microchannel water-in-oil emulsification. Colloids and Surfaces A: Physicochemical and Engineering Aspects, 2001. 179(1): p. 29-37.
58. Vladisavljević, G.T. and R.A. Williams, Recent developments in manufacturing emulsions and particulate products using membranes. Advances in Colloid and Interface Science, 2005. 113(1): p. 1-20.
59. Sugiura, S., M. Nakajima, and M. Seki, Preparation of monodispersed emulsion with large droplets using microchannel emulsification. Journal of the American Oil Chemists' Society, 2002. 79(5): p. 515-519.
60. Cappelezzo, M., et al., Stokes-Einstein relation for pure simple fluids. Journal of Chemical Physics, 2007. 126(22): p. 224516.
109
61. Einstein, A., Über die von der molekularkinetischen Theorie der Wärme geforderte Bewegung von in ruhenden Flüssigkeiten suspendierten Teilchen. Annalen der Physik, 1905. 322(8): p. 549-560.
62. Stokes, G.G., Mathematical and Physical Papers. 1904. 3.
63. Frising, T., C. Noïk, and C. Dalmazzone, The Liquid/Liquid Sedimentation Process: From Droplet Coalescence to Technologically Enhanced Water/Oil Emulsion Gravity Separators: A Review. Journal of Dispersion Science and Technology, 2006. 27(7): p. 1035-1057.
64. Laplace, P.S., ed. Mécanique céleste. Vol. 10. 1806.
65. Young, T., An Essay on the Cohesion of Fluids. Philosophical Transactions of the Royal Society of London, 1805. 95(ArticleType: research-article / Full publication date: 1805 /): p. 65-87.
66. Pellicer, J., V. García-Morales, and M.J. Hernández, On the demonstration of the Young-Laplace equation in introductory physics courses. Physics Education, 2000. 35(2): p. 126.
67. Binks, B.P., Chapter 1 Emulsions - Recent Advances in Understanding, in Modern Aspects of Emulsion Science1998, The Royal Society of Chemistry. p. 1-55.
68. C., W., Z. Electrochem. 35: p. 581.
69. Deryaguin, B.V.S., R.L., Kolloidn Zhurnal, 1961. 23: p. 33.
70. Saupe, A., Interfacial Phenomena. Von J. T. Davies und E. K. Rideal. Academic Press, New York-London 1963. Angewandte Chemie, 1965. 77(6): p. 276-276.
71. Smoluchowski, M.v., Phys. Chem., 1917: p. 92:129.
72. Ghannam, M.T. and M.Y.E. Selim, Stability Behavior of Water-in-Diesel Fuel Emulsion. Petroleum Science and Technology, 2009. 27(4): p. 396-411.
73. Myers, D., The Organic Chemistry of Surfactants, in Surfactant Science and Technology2005, John Wiley & Sons, Inc. p. 29-79.
74. Peltonen, L., J. Hirvonen, and J. Yliruusi, The Behavior of Sorbitan Surfactants at the Water–Oil Interface: Straight-Chained Hydrocarbons from Pentane to Dodecane as an Oil Phase. Journal of Colloid and Interface Science, 2001. 240(1): p. 272-276.

110
75. Opawale, F.O. and D.J. Burgess, Influence of Interfacial Properties of Lipophilic Surfactants on Water-in-Oil Emulsion Stability. Journal of Colloid and Interface Science, 1998. 197(1): p. 142-150.
76. Ghannam, M.T., Water-in-Crude Oil Emulsion Stability Investigation. Petroleum Science and Technology, 2005. 23(5-6): p. 649-667.
77. Chern, C.-S., Interfacial Phenomena, in Principles and Applications of Emulsion Polymerization2008, John Wiley & Sons, Inc. p. 23-52.
78. Vander Kloet, J. and L. Schramm, The effect of shear and oil/water ratio on the required hydrophile-lipophile balance for emulsification. Journal of Surfactants and Detergents, 2002. 5(1): p. 19-24.
79. Al-Sabagh, A.M., The relevance HLB of surfactants on the stability of asphalt emulsion. Colloids and Surfaces A: Physicochemical and Engineering Aspects, 2002. 204(1-3): p. 73-83.
80. Márquez, A., G. Palazolo, and J. Wagner, Water in oil (w/o) and double (w/o/w) emulsions prepared with spans: microstructure, stability, and rheology. Colloid & Polymer Science, 2007. 285(10): p. 1119-1128.
81. Wangqi, H. and D.P. Kyriakos, W1/O/W2 and O1/W/O2 globules stabilized with Span 80 and Tween 80. Colloids Surf A Physicochem Eng Asp, 1997. 125(2-3): p. 181-187.
82. Jiao, J. and D.J. Burgess, Rheology and stability of water-in-oil-in-water multiple emulsions containing Span 83 and Tween 80. AAPS pharmSci, 2003. 5(1): p. E7.
83. Matsumoto, S., Formation and Stability of Water-in-Oil-in-Water Emulsions, in Macro- and Microemulsions1985, American Chemical Society. p. 415-436.
84. Qi, X., L. Wang, and J. Zhu, Water-in-oil-in-water double emulsions: An excellent delivery system for improving the oral bioavailability of pidotimod in rats. Journal of Pharmaceutical Sciences, 2011. 100(6): p. 2203-2211.
85. Florence, A.T. and D. Whitehill, The formulation and stability of multiple emulsions. International Journal of Pharmaceutics, 1982. 11(4): p. 277-308.
86. Morais, J.M., P.A. Rocha-Filho, and D.J. Burgess, Influence of Phase Inversion on the Formation and Stability of One-Step Multiple Emulsions. Langmuir, 2009. 25(14): p. 7954-7961.

111
87. Moulai-Mostefa, N. and A. Boumenir, Formulation of a Stable Multiple Emulsion via a One-Step Process Using Surface Properties of the Mixed Emulsifiers. Journal of Dispersion Science and Technology, 2010. 32(1): p. 102-108.
88. Ma, G., et al., Multi-scale structures in emulsion and microsphere complex systems. China Particuology, 2005. 3(6): p. 296-303.
89. Garti, N., Double emulsions — scope, limitations and new achievements. Colloids and Surfaces A: Physicochemical and Engineering Aspects, 1997. 123–124(0): p. 233-246.
90. Magdassi, S., M. Frenkel, and N. Garti, Correlation Between Nature of Emulsifier and Multiple Emulsion Stability. Drug Development and Industrial Pharmacy, 1985. 11(4): p. 791-798.
91. Geiger, S., et al., Kinetics of swelling–breakdown of a W/O/W multiple emulsion: possible mechanisms for the lipophilic surfactant effect. Journal of Controlled Release, 1998. 52(1–2): p. 99-107.
92. Garti, N., Progress in Stabilization and Transport Phenomena of Double Emulsions in Food Applications. LWT - Food Science and Technology, 1997. 30(3): p. 222-235.
93. Ohwaki, T., et al., Improvement of the stability of water-in-oil-in-water multiple emulsions by the addition of surfactants in the internal aqueous phase of the emulsions. International Journal of Pharmaceutics, 1993. 93(1–3): p. 61-74.
94. Schmidts, T., et al., Multiple W/O/W emulsions—Using the required HLB for emulsifier evaluation. Colloids and Surfaces A: Physicochemical and Engineering Aspects, 2010. 372(1–3): p. 48-54.
95. Schmidts, T., et al., Influence of hydrophilic surfactants on the properties of multiple W/O/W emulsions. Journal of Colloid and Interface Science, 2009. 338(1): p. 184-192.
96. Jiao, J. and D.J. Burgess, Multiple Emulsion Stability: Pressure Balance and Interfacial Film Strength, in Multiple Emulsions2007, John Wiley & Sons, Inc. p. 1-27.
97. Schmidts, T., et al., Development of multiple W/O/W emulsions as dermal carrier system for oligonucleotides: Effect of additives on emulsion stability. International Journal of Pharmaceutics, 2010. 398(1–2): p. 107-113.

112
98. Aronson, M.P. and M.F. Petko, Highly Concentrated Water-in-Oil Emulsions: Influence of Electrolyte on Their Properties and Stability. Journal of Colloid and Interface Science, 1993. 159(1): p. 134-149.
99. Koroleva, M.Y. and E.V. Yurtov, Effect of Ionic Strength of Dispersed Phase on Ostwald Ripening in Water-in-Oil Emulsions. Colloid Journal, 2003. 65(1): p. 40-43.
100. Hino, T., Y. Kawashima, and S. Shimabayashi, Basic study for stabilization of w/o/w emulsion and its application to transcatheter arterial embolization therapy. Advanced Drug Delivery Reviews, 2000. 45(1): p. 27-45.
101. Lutz, R. and A. Aserin, Multiple Emulsions Stabilized by Biopolymers, in Multiple Emulsions2007, John Wiley & Sons, Inc. p. 85-120.
102. Dragana D. Vasiljevic, J.V.P., Marıja M. Primorac, Gordana M. Vuleta, Rhelogical and droplet size analysis of W/O/W multiple emulsions containing low concentrations of polymeric emulsifier Journal of the Serbian Chemical Society, 2009. 74(7): p. 801-816.
103. Ortega-Vinuesa, J.L., A. Martı n-Rodrı guez, and R. Hidalgo-Álvarez, Colloidal Stability of Polymer Colloids with Different Interfacial Properties: Mechanisms. Journal of Colloid and Interface Science, 1996. 184(1): p. 259-267.
104. Benichou, A., A. Aserin, and N. Garti, W/O/W double emulsions stabilized with WPI–polysaccharide complexes. Colloids and Surfaces A: Physicochemical and Engineering Aspects, 2007. 294(1–3): p. 20-32.
105. ElShafei, G.M.S., et al., Environmentally friendly pesticides: Essential oil-based w/o/w multiple emulsions for anti-fungal formulations. Industrial Crops and Products, 2010. 31(1): p. 99-106.
106. Kim, B.-S., J.-W. Kim, and K.-D. Suh, Poly(methyl methacrylate) multihollow particles by water in oil in water emulsion polymerization. Journal of Applied Polymer Science, 2000. 76(1): p. 38-44.
107. Lee, J.-E., et al., Polymer/Ag composite microspheres produced by water-in-oil-in-water emulsion polymerization and their application for a preservative. Colloid & Polymer Science, 2004. 282(3): p. 295-299.
108. Lee, E., et al., Multihollow structured poly(methyl methacrylate)/silver nanocomposite microspheres prepared by suspension polymerization in the presence of dual dispersion agents. Colloid & Polymer Science, 2008. 286(12): p. 1379-1385.

113
109. Kim, J.-W., et al., Multihollow polymer microcapsules by water-in-oil-in-water emulsion polymerization: morphological study and entrapment characteristics. Colloid & Polymer Science, 2003. 281(2): p. 157-163.
110. Bäumer, S., Handbook of Plastic Optics (2nd Edition), John Wiley & Sons. p. 134-139.
111. Raymond B. Seymour, C.E.C., ed. Structure-Property Relationships in Polymers. 1984, Plenum Press: New York and London. 47-55.
112. Mark HF, B.N., Overberger CG, Menges G, Kroschwitz JI, Encyclopedia of Polymer Science and Engineering. 1985. 1: p. 234.
113. HR, K., ed. Handbook of polymer synthesis. Vol. Part A. 1992, Marcel Dekker: New York. 223.
114. Hildebrand J. H., S.R.L., Solubility of Nonelectrolytes. 3 ed1950, New York: Reinhold.
115. CRC handbook of solubility parameters and other cohesion paramaters1983.
116. Mahdi Jafari, S., Y. He, and B. Bhandari, Nano-Emulsion Production by Sonication and Microfluidization—A Comparison. International Journal of Food Properties, 2006. 9(3): p. 475-485.
117. Abismail, B., et al., Emulsification by ultrasound: drop size distribution and stability. Ultrasonics Sonochemistry, 1999. 6(1-2): p. 75-83.
118. Jafari, S.M., Y. He, and B. Bhandari, Production of sub-micron emulsions by ultrasound and microfluidization techniques. Journal of Food Engineering, 2007. 82(4): p. 478-488.
119. Lin, C.-Y. and L.-W. Chen, Emulsification characteristics of three- and two-phase emulsions prepared by the ultrasonic emulsification method. Fuel Processing Technology, 2006. 87(4): p. 309-317.
120. Santos, H.M., C. Lodeiro, and J.-L. Capelo-Martínez, The Power of Ultrasound, in Ultrasound in Chemistry2009, Wiley-VCH Verlag GmbH & Co. KGaA. p. 1-16.
121. Brandrup J., I., Grulke, ed. Polymer Handbook, Fourth Eddition. 1999, John Wiley & Sons, Inc.: New York. 571-582.
122. Bass, M. and O.S.o. America, Handbook of optics2001: McGraw-Hill.

114
123. Illımination, I.C.o. Selected Calorimetric Tables, Relative spectral power distribution of CIE Standard Illuminant D65, Last visited on 08/07/2012.
124. Malacara, D., ed. Color Vision and Calorimetry, Theory and Applications. 2002, SPIE-The International Society for Optical Engineering: Washington. 131-147.
125. Tilley, R.J.D., Colour and optical properties of materials: an exploration of the relationship between light, the optical properties of materials and colour2000: John Wiley & Sons. 1-22.
126. Saçak, M., Polimer Kimyası, 2000, Ankara: Gazi Kitapevi.
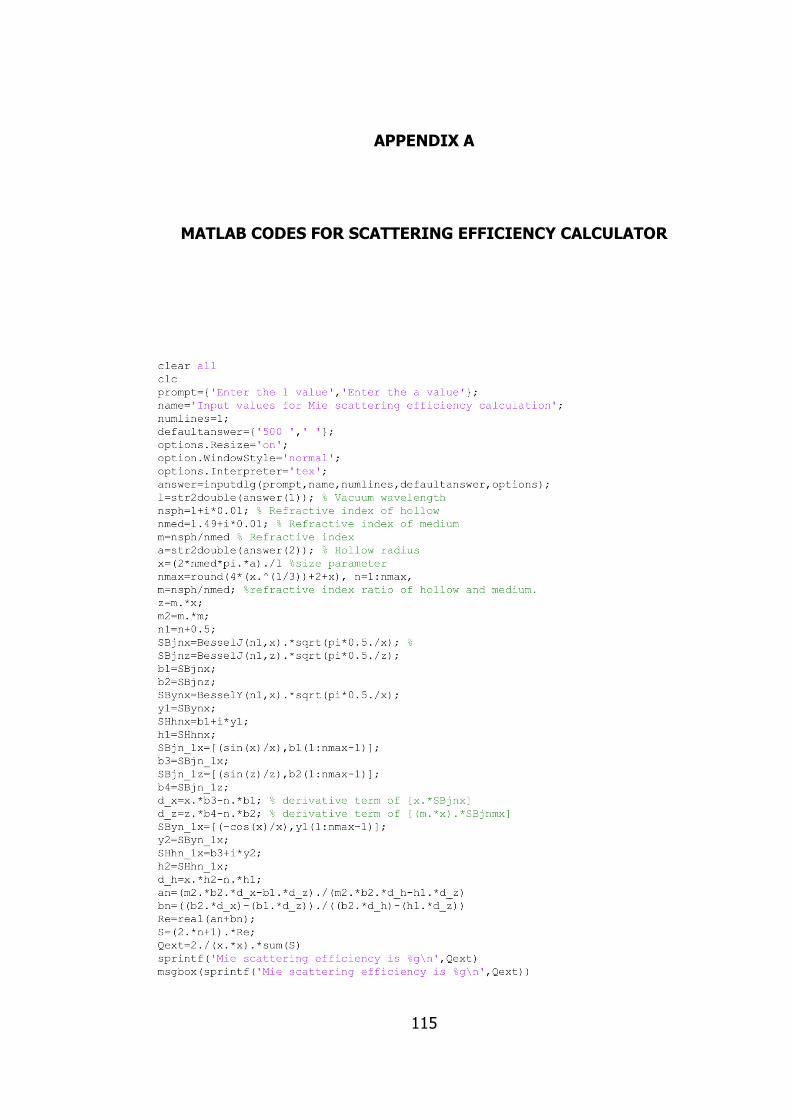
115
APPENDIX A
MATLAB CODES FOR SCATTERING EFFICIENCY CALCULATOR
Recommended