Syngas to Bio-ethanol
Fermentation
University of Groningen
2018 Chemical Engineering Bachelor Design Project
Supervisors
Prof. ir. Jos Winkelman
Ir. Wersse Leusman
Kenny Zuur
By:
Remco Bos S2325926
Patrick Bosch S2599953
Caelan Randolph S2954222
Jeff B. W. Wijaya S2935341
Date of submission: July 3rd, 2018
1
Executive Summary
Minimizing waste and environmental impact of industrial installations is a relevant concern in
2018, and a modern engineer is more so than ever asked to solve environmental challenges
pertaining to future and legacy technology. An area with large waste streams, and great
potential for innovation is the steel industry, which produces large volumes of toxic and
greenhouse gasses like carbon monoxide and carbon dioxide. Typically, said gasses are burned,
but steel furnace exhaust gasses have a very low heating value, being ten times less productive
than natural gas1 2. A possible alternative to burning said gas is to convert it into a useful
product. As early as the 1990s, publications arose discussing the conversion of synthetic gas
(syngas) using the wood-ljungdahl pathway, a metabolic pathway used by anaerobic microbes
to convert carbon monoxide and carbon dioxide to products like acetic acid and ethanol, among
other less prominent products3. One of the first microbes studied in this fermentation process
was Closterium ljungdahlii (C.ljungdahlii)3. Despite the early discovery of the wood-Ljungdahl
pathway and the possibilities C.ljungdahlii offered in syngas conversion, very few
implementations of syngas bio-fermentation processes exist, and none at significant industrial
scale. In order to assess the potential of syngas bio-fermentation in conjunction with steel gas
waste streams, this paper examines the economic viability of said process by designing a syngas
bio-fermentation plant using exhaust gasses of a TATA steel plant in southern Holland. This
paper begins by introducing C.ljungdahlii, the microbe of choice, and the pathway used in the
bioreactor. Next, reactor choice and design occur, followed by a syngas pretreatment design,
then product purification design. The design process involves both theoretical design
calculations, and process simulation using Aspen Plus. Lastly, the cost and turnover of said
installation is examined to determine whether such a project is viable. Cost analysis was
achieved using Aspen Plus Economic Analyzer, and process costing theory from Chemical
Engineering Design by Towler and Sinnot53. Our findings estimate a near $8.64 billion-dollar
project investment cost, with a $1.8 billion-dollar turnover on ethanol sales from the plant
annually, the plants primary product. The process is found to be extremely energy intensive,
with the plant under steady state operation estimated to consume nearly 5.93GW. Due to the
large energy demands of product purification and syngas pretreatment, the project was found
to be un-economical. This approach does however offer valuable information for future
designs, as expensive aspects of syngas fermentation are highlighted, such as the syngas
pretreatment, which is responsible for 85% of the initial $8.64 billion-dollar investment. With
this in mind, future investigations should focus on minimizing syngas pretreatment and
implementing energy saving measures to create a less energy intensive and laborious process,
which may make syngas bio-fermentation profitable.
2
Contents
Chapter I - INTRODUCTION ................................................................................................... 6
Background ............................................................................................................................ 7
Steel-mill off-gases ............................................................................................................. 7
Ethanol supply and demand ................................................................................................ 8
Chemical vs. biological catalysis........................................................................................ 9
Wood-Ljungdahl pathway (WLP) based biocatalytic mechanism ................................... 11
Design Parameters ................................................................................................................ 13
Objectives ......................................................................................................................... 13
Steel-mill off-gas stream specification ............................................................................. 13
Biocatalyst specifications ................................................................................................. 14
Chapter II - PROCESS DESIGN ............................................................................................. 16
Reactor Design ..................................................................................................................... 17
Reactor criteria and design ............................................................................................... 17
Clostridium ljungdahlii ..................................................................................................... 17
Previous applications ........................................................................................................ 18
Reactor Choice ..................................................................................................................... 18
Process Upscale and Optimization ....................................................................................... 21
Syngas Optimization......................................................................................................... 27
Auxiliary Calculations ...................................................................................................... 34
Syngas processing ................................................................................................................ 36
Carbon based solids .......................................................................................................... 36
Tar removal....................................................................................................................... 37
Hydrogen sulfide removal ................................................................................................ 38
NO and SO2 removal ....................................................................................................... 39
Nitrogen removal .............................................................................................................. 40
Syngas process modeling ..................................................................................................... 41
Raw gas feed ..................................................................................................................... 41
Cyclone ............................................................................................................................. 42
3
Compressors ..................................................................................................................... 43
Heat exchangers ................................................................................................................ 43
Tar reformer ...................................................................................................................... 43
Fixed bed reactors ............................................................................................................. 44
CSTR ................................................................................................................................ 45
Results .............................................................................................................................. 45
Reactor Model ...................................................................................................................... 46
Growth/acidogenesis reactor (R1) .................................................................................... 46
Production/solventogenesis reactor (R2) .......................................................................... 49
Product Work-up .................................................................................................................. 54
Extractive distillation ........................................................................................................ 54
Product work-up feed ....................................................................................................... 55
Process design................................................................................................................... 56
Feed preparation ............................................................................................................... 57
Feed pre-heating ............................................................................................................... 62
Chapter III - CONTROL AND INSTRUMENTATION ......................................................... 64
Syngas processing ................................................................................................................ 65
Pressure control ................................................................................................................ 65
Temperature control ......................................................................................................... 66
Fixed bed reactor control systems .................................................................................... 67
pH control ......................................................................................................................... 68
Continuous stirred tank reactors ....................................................................................... 69
Storage tanks..................................................................................................................... 70
Demister............................................................................................................................ 70
Growth/acidogenesis reactor (R1) ........................................................................................ 70
Acid – Base Control ......................................................................................................... 71
Nutrient and Water Control .............................................................................................. 73
Syngas Out and Product Recovery Control ...................................................................... 74
Liquid Out and Cooling Control ....................................................................................... 75
Reactor Control................................................................................................................. 76
Production/Solventogenesis Reactor (R2) ........................................................................... 77
pH control system ............................................................................................................. 78
Foaming control system.................................................................................................... 79
Primary metabolite steady-state concentration control system ........................................ 80
Gas inlet control system and pressure loss safety measures ............................................. 81
4
Gas inlet composition control system ............................................................................... 82
Reactor pressure control system and safety measures. ..................................................... 82
Reactor temperature control system ................................................................................. 83
Reactor liquid level control system .................................................................................. 84
Cell recycle control system............................................................................................... 85
Cell filtration module control system ............................................................................... 85
Flasher pressure and liquid storage pressure control system ............................................ 86
Product Work-up .................................................................................................................. 87
After HAZOP ................................................................................................................... 88
Chapter IV - EQUIPMENT SPECIFICATION ....................................................................... 90
Syngas Cleanup .................................................................................................................... 91
Tar reformer ...................................................................................................................... 91
Fixed bed reactor .............................................................................................................. 91
CSTR ................................................................................................................................ 91
Pumps ............................................................................................................................... 91
Tanks ................................................................................................................................ 92
Nitrogen Membrane filters ............................................................................................... 92
Heat exchangers ................................................................................................................ 92
Material of Construction (MoC) ....................................................................................... 92
Growth/acidogenesis reactor (R1) ........................................................................................ 94
Heat Exchanger................................................................................................................. 96
Tanks ................................................................................................................................ 97
Vessels .............................................................................................................................. 97
Flashers ............................................................................................................................. 97
Pumps ............................................................................................................................... 98
Filtration ........................................................................................................................... 99
Production/solventogenesis reactor (R2) ............................................................................. 99
Vessel(s) ........................................................................................................................... 99
Tank(s) ............................................................................................................................ 101
Pump(s) ........................................................................................................................... 102
Heat exchanger(s) ........................................................................................................... 107
Filter(s) ........................................................................................................................... 107
Product Work-up ................................................................................................................ 108
Distillation columns ........................................................................................................ 108
Heating/cooling equipment............................................................................................. 111
5
Pumps ............................................................................................................................. 112
Tanks .............................................................................................................................. 112
Chapter V - COST ANALYSIS AND CONCLUSION ........................................................ 114
Equipment Cost .................................................................................................................. 115
Syngas processing........................................................................................................... 115
Growth/acidogenesis reactor (R1) .................................................................................. 116
Production/solventogenesis reactor (R2) ........................................................................ 116
Product Work-up ............................................................................................................ 118
Capital Fixed Investment Costs.......................................................................................... 119
Annual product value ......................................................................................................... 119
Conclusion .......................................................................................................................... 120
Bibliography .......................................................................................................................... 121

6
Chapter I - INTRODUCTION
7
Background
Steel-mill off-gases
In the steel industry, unlike typical industries, carbon is mainly used in the reduction process
of iron oxides to form metallic iron, and not as a fuel source. This reduction follows the
reactions which are shown in Equation 1 and Equation 24.
Equation 14 2Fe2O3(s) + 3C(s) → 4Fe(s) + 3CO2(g)
Equation 24 Fe2O3(s) + 3CO(g) → 2Fe(s) + 3CO2(g)
While alternative energy sources to replace carbon-based fuels are relatively easy to come by
nowadays, such as by utilizing wind and solar energy, they are still unable to replace the
functionality of the carbons being used in steel production. This implies that, regardless of the
green energy movement, steel-mill waste gas is an unavoidable residue of industrial
production, within the steel industry specifically.
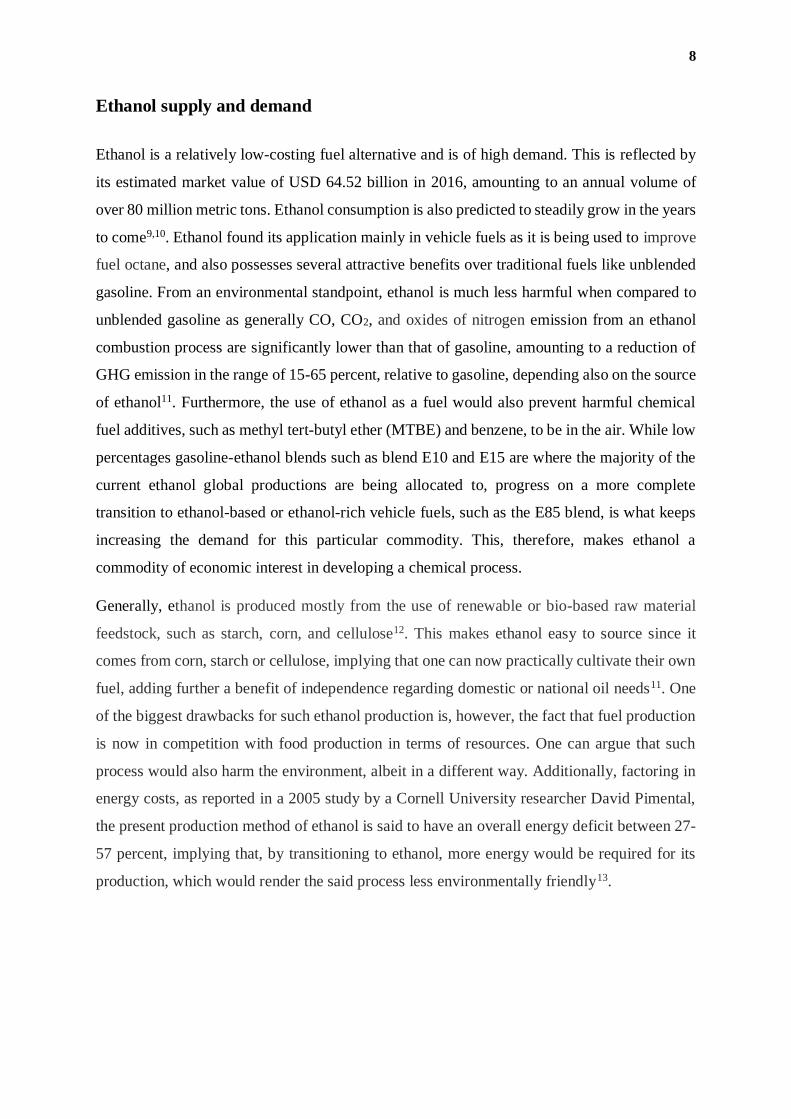
These off-gases from the production of iron and steel, while they can vary in terms of their
exact composition, would generally contain significant amounts of carbon monoxide (CO) and
carbon dioxide (CO2), as shown in Table 15. In producing one metric ton of steel, an average
of 1.8 metric tons of off-gases are emitted6. This results in the global iron and steel industry
alone contributing approximately 5-7 percent to the worldwide CO2 emission, which is one of
the greenhouse gas (GHG)7. Since the reduction of GHG emissions is a pressing issue and has
been identified as one of the most important challenges for current societies, new technologies
to achieve large reductions in GHG emissions are of necessary. This is because up to now,
most of the off-gases from steel-mills were either flared or used to create process heat and
electrical energy somewhere else within the plant8.
Source CO (%) CO2 (%) H2 (%) N2 (%) Other (%)
Basic O2 furnace 50-70 10-20 1-2 15-30 -
Blast furnace 20-35 20-30 2-4 50-60 -
Coke oven gas 5-10 3-5 55 10 25 (CH4)
Table 1. Typical off-gases composition from steel production5
8
Ethanol supply and demand
Ethanol is a relatively low-costing fuel alternative and is of high demand. This is reflected by
its estimated market value of USD 64.52 billion in 2016, amounting to an annual volume of
over 80 million metric tons. Ethanol consumption is also predicted to steadily grow in the years
to come9,10. Ethanol found its application mainly in vehicle fuels as it is being used to improve
fuel octane, and also possesses several attractive benefits over traditional fuels like unblended
gasoline. From an environmental standpoint, ethanol is much less harmful when compared to
unblended gasoline as generally CO, CO2, and oxides of nitrogen emission from an ethanol
combustion process are significantly lower than that of gasoline, amounting to a reduction of
GHG emission in the range of 15-65 percent, relative to gasoline, depending also on the source
of ethanol11. Furthermore, the use of ethanol as a fuel would also prevent harmful chemical
fuel additives, such as methyl tert-butyl ether (MTBE) and benzene, to be in the air. While low
percentages gasoline-ethanol blends such as blend E10 and E15 are where the majority of the
current ethanol global productions are being allocated to, progress on a more complete
transition to ethanol-based or ethanol-rich vehicle fuels, such as the E85 blend, is what keeps
increasing the demand for this particular commodity. This, therefore, makes ethanol a
commodity of economic interest in developing a chemical process.
Generally, ethanol is produced mostly from the use of renewable or bio-based raw material
feedstock, such as starch, corn, and cellulose12. This makes ethanol easy to source since it
comes from corn, starch or cellulose, implying that one can now practically cultivate their own
fuel, adding further a benefit of independence regarding domestic or national oil needs11. One
of the biggest drawbacks for such ethanol production is, however, the fact that fuel production
is now in competition with food production in terms of resources. One can argue that such
process would also harm the environment, albeit in a different way. Additionally, factoring in
energy costs, as reported in a 2005 study by a Cornell University researcher David Pimental,
the present production method of ethanol is said to have an overall energy deficit between 27-
57 percent, implying that, by transitioning to ethanol, more energy would be required for its
production, which would render the said process less environmentally friendly13.
9
Chemical vs. biological catalysis
As it follows from the previously stated points, it would, therefore, be highly beneficial to
devise a process, able to convert the previously mentioned steel production off-gases into
ethanol. Not only would it enable the recovery of carbon lost in the steel’s waste gas stream, it
will also be converted into a commodity of economic significance and environmental benefit.
One example of such a process could be the metal-catalyzed conversion of CO and H2 to
hydrocarbons via the well-known Fischer–Tropsch (FT) process. Invented by Franz Fischer
and Hans Tropsch in 1925, the chemically catalytic process has been used to perform the
conversion of gases into hydrocarbons since the 1930s at an industrial scale14. FT process work
by passing a stream of gas through beds of metal catalysts, consisting of mainly transition
metals, such as iron, cobalt, and ruthenium, which at high enough temperatures and pressures,
will convert the CO and H2 components of the gas stream into a mixture of liquid
hydrocarbons15. This mixture of hydrocarbons will then require further processing depending
on the specific target chemical at the end of the process15.
FT processes, however, have a number of disadvantages. The catalyst bed used to convert the
gases in FT processes are generally highly sensitive, even to trace amounts of common gas
contaminants such as sulfur species15. This, therefore, implies that in order for FT to be
economically feasible, a very clean gas stream is one of the requirement for the prevention of
the poisoning of catalyst bed consisting of numerous expensive and rare-earth metals.
Furthermore, this is also what makes FT unsuited for the conversion of industrial off-gases,
such as in the case of steel-mill. Additionally, the FT process is also known to require a specific
CO: H2 ratio in order for it to work optimally14. This further constrains the usability of said
process, as it would be unlikely for the specific ratio requirement to be met by the composition
of industrial off-gases.
Unlike the FT process, its biocatalytic counterpart, the fermentation of CO and CO2 rich off-
gases, often require less gas conditioning and offer more flexibility in terms of the gas
composition it can handle. While the exact amount of gas pre-treatment required for
fermentation-based process is also highly dependent on the nature of the contaminants and the
tolerance of the specific biocatalyst being used, due to the sheer number of biocatalysts one
can choose from, relative to FT, a biocatalytic pathway would still offer a higher tolerance15.
Furthermore, fermentative conversion of CO and CO2 rich gases also possess an additional
selectivity benefit if compared to the FT process. While complex, biological processes tend to
10
be highly tunable to be highly specific regarding the product composition being formed. This
is especially the case, as selective and highly efficient gene editing tools, such as CRISPR/Cas9
are extensively available for microbes16. Additionally, a biocatalytic process in general works
at very mild conditions, often at atmospheric pressure and very close to room temperature,
instead of requiring high operating pressure and temperature for the reactions to be carried out.
Lastly, biocatalytic pathways also provide the added benefit of being generally more
environmentally friendly, as it utilizes microbes rather than exotic rare-earth metals as the
catalyst for the process.
Fermentation-based processes, however, are not without limitation. By production capability
alone, the volumetric production rates of hydrocarbons in FT process are generally very high,
which enables centralized large-scale production plants15. Biological processes on the other
hand, while also highly dependent on design optimization and the specific biocatalyst being
used, tend to exhibit low production rates relative to that of FT process. In this sense, a
biological process simply would not be able to compete with a chemically catalytic process
like FT. Furthermore, despite the required gas conditioning resulting in additional cost in the
commercialization of the FT process, a biocatalytic process would often still cost more in its
commercial adaptation, owing to the so-called early adopters’ tax, as the said process is still
early-in-development. And finally, in terms of background knowledge, chemically catalytic
processes are generally much better understood and well-documented than its biocatalytic
analog, owing to the generally much simpler nature of standalone or even a series of chemical
reactions if being compared to a full metabolic pathway. An implication of this is that the
development of a biocatalytic process would involve significantly more trial and error element
due to the lack of fundamental understandings, which can therefore significantly complicate
scale-up and optimization of said process.
11
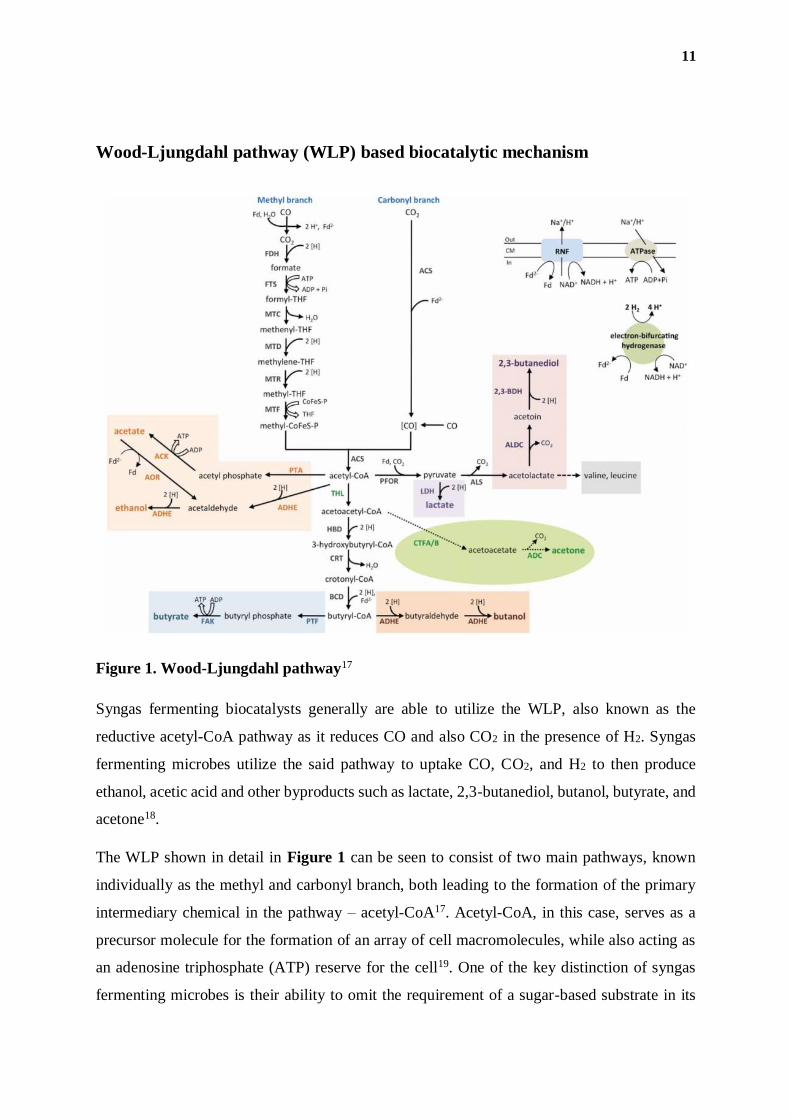
Wood-Ljungdahl pathway (WLP) based biocatalytic mechanism
Figure 1. Wood-Ljungdahl pathway17
Syngas fermenting biocatalysts generally are able to utilize the WLP, also known as the
reductive acetyl-CoA pathway as it reduces CO and also CO2 in the presence of H2. Syngas
fermenting microbes utilize the said pathway to uptake CO, CO2, and H2 to then produce
ethanol, acetic acid and other byproducts such as lactate, 2,3-butanediol, butanol, butyrate, and
acetone18.
The WLP shown in detail in Figure 1 can be seen to consist of two main pathways, known
individually as the methyl and carbonyl branch, both leading to the formation of the primary
intermediary chemical in the pathway – acetyl-CoA17. Acetyl-CoA, in this case, serves as a
precursor molecule for the formation of an array of cell macromolecules, while also acting as
an adenosine triphosphate (ATP) reserve for the cell19. One of the key distinction of syngas
fermenting microbes is their ability to omit the requirement of a sugar-based substrate in its
12
entirety. In other words, WLP can operate independent of the glycolytic pathway, either as a
primary or auxiliary metabolic pathway. In the presence of sugary substrates, WLP serves as
an auxiliary pathway to further increase the carbon utilization efficiency of sugar substrates by
converting CO2 released by the glycolytic pathway to additional Acetyl-CoA. If only CO is
present to the microbes as the substrate, 2 molecules of CO enter the pathway simultaneously,
one entering the carbonyl branch, while the other enters the methyl branch and will be oxidized
to CO2 before being converted into a methyl group in subsequent reactions. If only CO2 is
present to the microbes as substrate, 2 molecules of CO2 will also enter the pathway
simultaneously, one molecule will be stepwise reduced to a methyl group via the methyl
branch, skipping the aforementioned step where CO undergoes oxidation to CO2, while the
other enters in the carbonyl branch, with CO2 being reduced to CO.
Overall, in the WLP, CO or CO2 is reduced to a methyl group through a series of reductive
reactions in the presence of several hydro folate-dependent enzymes and at the expense of an
ATP through the methyl branch, while carbonyl group is being prepared through the carbonyl
branch with the aid of carbon monoxide dehydrogenase complex (CODH)17,18. The resulting
methyl and carbonyl groups will then be combined by the enzyme acetyl-CoA synthase (ACS),
together with Coenzyme A to produce acetyl-CoA17. Acetyl-CoA can then be further reduced
to a variety of metabolites in the subsequent stages in the pathway19.
Additionally, as reduced ferredoxin (Fd2-) is an integral aspect of both the methyl and carbonyl
branch, the microbes would, therefore, require electron sources for the reduction17. In the
absence of H2 gas, CO will also act as an electron source on top of its role as a substrate through
its oxidation to CO2 which directly simultaneously form Fd2-. In the presence of H2, however,
the microbes will then use H2 as an electron source with the aid of an electron bifurcating
hydrogenase in converting 2 H2 molecules to obtain Fd2- and a reduced nicotinamide adenine
dinucleotide (NADH)17.
In relation to the reasoning discussed in previous sections, focusing specifically on ethanol and
acetate production, which also often are the primary metabolites of these syngas fermenting
microbes, to produce acetate, acetyl-CoA will then be converted by the enzymes
phosphotransacetylase (PTA) and acetate kinase (ACK) to form acetate, resulting in the release
of one ATP molecule, therefore balancing the ATP consumed in the methyl branch17. As for
the production of ethanol, the previously formed reduced NADH from the reduction of
ferredoxin which must be consumed in one of the subsequent reactions would then be
13
consumed in the production of ethanol. Similarly, the same NADH can also be consumed
through the formation of other products, such as butanol, 2,3-butanediol, or back through the
reductive pathway along the methyl branch17.
Design Parameters
Objectives
Based on the previous elaboration, this thesis, therefore, aims to report an attempt in designing
a biocatalytic process for steel mill waste gas recovery, utilizing fermentative methods in
producing ethanol of at least 99% purity as a primary product.
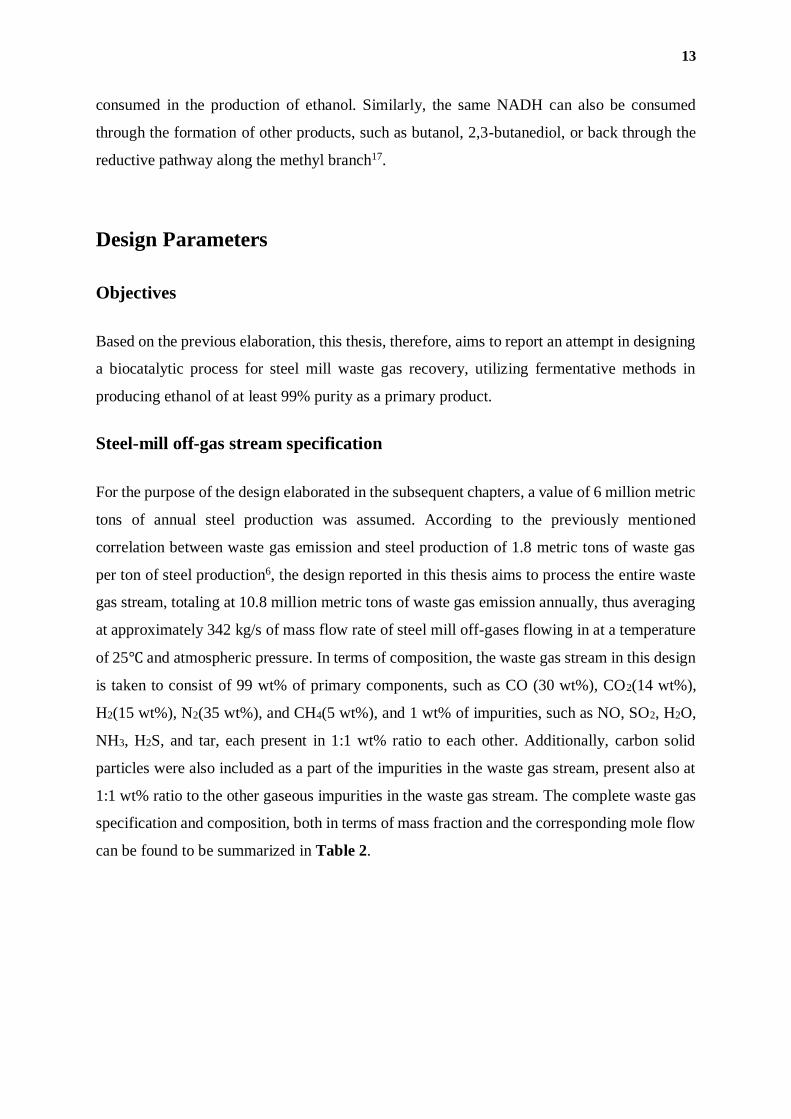
Steel-mill off-gas stream specification
For the purpose of the design elaborated in the subsequent chapters, a value of 6 million metric
tons of annual steel production was assumed. According to the previously mentioned
correlation between waste gas emission and steel production of 1.8 metric tons of waste gas
per ton of steel production6, the design reported in this thesis aims to process the entire waste
gas stream, totaling at 10.8 million metric tons of waste gas emission annually, thus averaging
at approximately 342 kg/s of mass flow rate of steel mill off-gases flowing in at a temperature
of 25℃ and atmospheric pressure. In terms of composition, the waste gas stream in this design
is taken to consist of 99 wt% of primary components, such as CO (30 wt%), CO2(14 wt%),
H2(15 wt%), N2(35 wt%), and CH4(5 wt%), and 1 wt% of impurities, such as NO, SO2, H2O,
NH3, H2S, and tar, each present in 1:1 wt% ratio to each other. Additionally, carbon solid
particles were also included as a part of the impurities in the waste gas stream, present also at
1:1 wt% ratio to the other gaseous impurities in the waste gas stream. The complete waste gas
specification and composition, both in terms of mass fraction and the corresponding mole flow
can be found to be summarized in Table 2.
14
Temperature: 25℃
Pressure: 1 bar
Component Mass fraction Flow (mol/s)
CO 3.0E-01 3665.4
CO2 1.4E-01 1088.7
H2 1.5E-01 25465.2
N2 3.5E-01 4275.8
CH4 5.0E-02 1066.6
NO 1.7E-03 19.0
SO2 1.7E-03 8.9
H2O 1.7E-03 31.7
NH3 1.7E-03 33.5
H2S 1.7E-03 16.7
Tar 1.7E-03 4.4E-06
Carbon (s) 1.7E-03 4.4E-06
Table 2. Steel mill waste gas specification and composition
Biocatalyst specifications
For the purpose of the design which will be described in the subsequent chapters, the process
uses Clostridium ljungdahlii, a rod shape, gram-positive anaerobic bacteria, as the microbe of
choice in the biocatalytic process. One of the main consideration in choosing the said
biocatalyst is that C. ljungdahlii, discovered in 1987, has been known to be one of the very first
microbes found to exhibit the previously explained WLP, which is required in achieving the
objective of the design reported in this thesis. C. ljungdahlii is therefore known as the paradigm
in similar biocatalytic syngas conversion process, thus have been extensively documented and
studied throughout the years. Furthermore, C. ljungdahlii has also been known to form primary
metabolites, being mostly acetate and ethanol, from CO, CO2, and H2.
In this design, however, the specific strand of the aforementioned microbes will intentionally
be left unspecified. This choice is made mainly due to the large variety of strands one can
choose from, particularly for the said microbe. The design, therefore, assumes that the specific
strand of the C. ljungdahlii used in the design have undergone genetic tuning procedure, such
that it works optimally within the process conditions of this study. In an attempt to further
streamline the process design, more specifically the work-up processes, the aforementioned
15
genetic optimization also assumed to include the suppression of the pathways leading to the
formation of metabolites other than ethanol and acetate. This, therefore, implies that the process
reported in this thesis is tailored for a biocatalytic process producing exclusively ethanol and
acetate. As a consequence of this assumption, the overall biochemical reactions which take
place throughout the process, via the reductive acetyl-CoA pathway, can be summarized by
stoichiometric reaction equations shown in Equation 3 - Equation 6, along with their
corresponding standard reaction enthalpy (298K, 1 bar), with the reactant of reference being
either CO or CO2.
Equation 318 6CO + 3H2O →CH3CH2OH + 4CO2 ΔH= -217.9 kJ/mol
Equation 418 2CO2 + 6H2 → CH3CH2OH + 3H2O ΔH= -97.3 kJ/mol
Equation 518 4CO + 2H2O → CH3COOH + 2CO2 ΔH= -154.9 kJ/mol
Equation 618 2CO2 + 4H2 → CH3COOH + 2H2O ΔH= -75.3 kJ/mol
Additionally, due to the scarcity of information regarding the exact kinetic relation for the
specific microbe at specific design conditions, the reported design would assume an unknown
reaction kinetics to be significantly faster relative to the mass transfer rate of the reactants from
the gas to the liquid phase. This, therefore, implies that the productivity of the process reported
in this thesis would only be mass transfer limited within the design conditions of the reported
process. Furthermore, due to limited availability of comparable data points on similar process
productivity, the design also assumes a productivity value that is independent of the product
and reactant concentration and their equilibrium relationship.

16
Chapter II - PROCESS DESIGN
17
Reactor Design
Process design is this system revolves around the method chosen to ferment syngas to ethanol.
A different approach comes with different system stipulations, making reactor choice and
design the most influential aspects of the process. Reactor design will therefore be treated first,
after which the syngas requirements and product streams will become clear, allowing the
syngas cleanup and product purification designs to follow.
Reactor criteria and design
Microbial bio-reactors all face challenges typically not encountered in conventional chemical
process design. Microbes in such processes are analogues to catalysts, expect very fragile
catalysts, that are living, growing, dying, and simultaneously very susceptible to changes in
pressure and temperature. As touched upon in the introduction, microbial catalysts do present
significant advantages too, such as their ability to achieve fairly complex chemistry at low
temperatures and pressure, and their ability to grow, something every chemical engineer wishes
their expensive catalysts could do with simple nutrition. Microbial bio-reactors must take into
account the sensitivities of microbes to pressure and temperature change, and their very finite
life cycles, considerations that will affect the chemical process design.
Discussed in literature are two methods for producing ethanol via syngas fermentation, batch
and continuous processes. Both choices account for the life cycle of microbes. The batch
reactor process starts and ends with the life-cycle of the microbes, and a continuous process
introduces new cell culture, and purges old cell medium to maintain a healthy cell body. Due
to the continuous syngas stream utilized in this plant, a continuous process system was sought.
Clostridium ljungdahlii
To cater to C.ljungdahlii, one needs to understand the conditions preferred by the microbe and
its reaction kinetics. Primarily, C.ljungdahlii is mesophilic, and primarily produces ethanol and
acetate20 21. C.ljungdahlii growth and reaction kinetics are strongly affected by pH, with a pH
of near 6 promoting growth and acidogenesis, and a lower pH of 4.5 promoting
solventogenesis, but discouraging growth1 22. Acidogenesis and solventogenesis describe the
kinetic pathway promoted at each pH, where acidogenesis describes acetic acid production,
and solventogenesis ethanol. Under both acidogenesis and solventogenesis, acetic acid and
ethanol are both produced, but one is produced in excess. For C.ljungdahlii, Acetic acid is
18
produced at a ratio of 13:1 in a growth promoting pH near 6, and ethanol is promoted at a ratio
of 5.5:1 in the solventogenesis promoting pH 4.5 region.22 Use of C.ljungdahlii means both
conditions will need to be met in order to both grow the microbes, and promote ethanol
production, the target product.
Previous applications
C.ljungdahlii among other syngas fermenting microbes are not novel, and publications on the
subject date back to the early 1990s 23. Wide spread application of such processes are to date
limited, and no commercial applications exist on a comparable scale to this design. Focus was
therefore applied to many well documented lab-scale reactors, which unlike commercial
examples, published extensive data on the lab-reactor workings and parameters. With
consideration of the aforementioned stipulations imposed by C.ljungdahlii, our process
requirements, and desired process product, a lab-scale reactor designed at Cornell University
in 2013 was chosen as the primary basis for our process design.
Reactor Choice
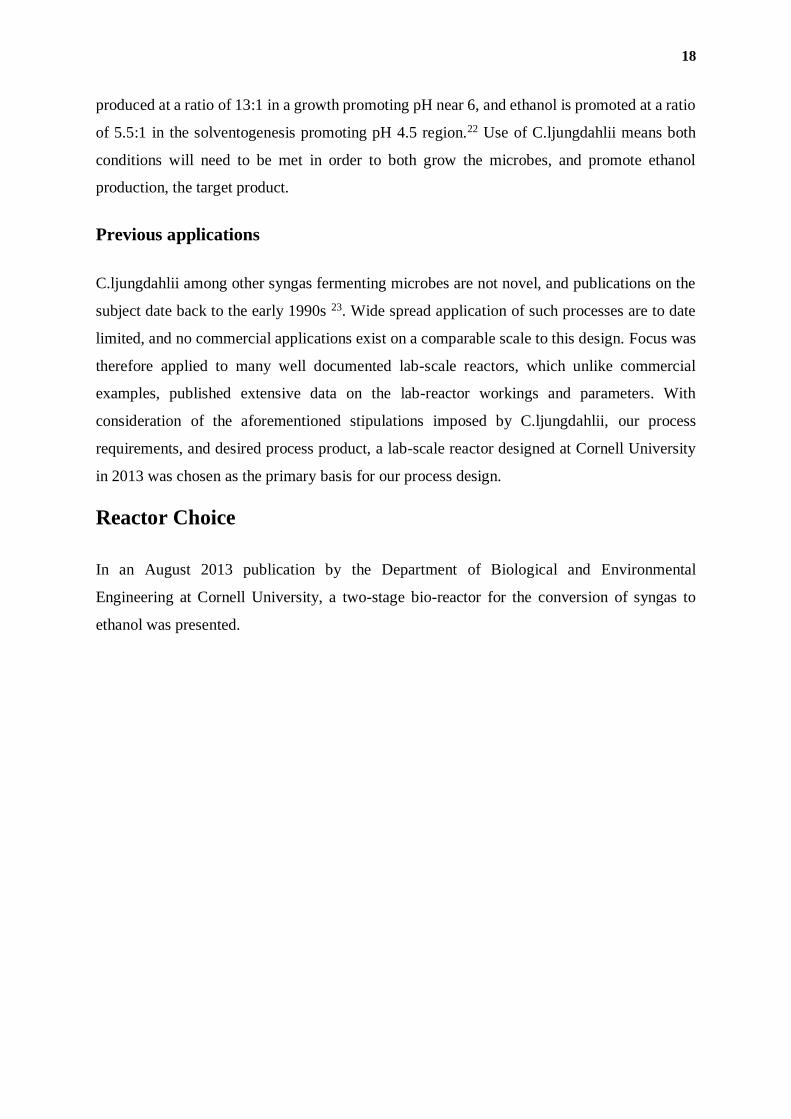
In an August 2013 publication by the Department of Biological and Environmental
Engineering at Cornell University, a two-stage bio-reactor for the conversion of syngas to
ethanol was presented.
19
Figure 2: Setup of two-stage continuous fermentation with cell and gas recycle. Solid
lines: flow of liquid media; dotted lines: flow of substrate and exhaust gases.
Abbreviations: 1–7 pumps; Ag, agitation; BP, bypass; E, effluent reservoir; Ex, exhaust;
FT, foam trap; G1, G2, gas recycle loops; HF, hollow fiber module for cell recycle; M,
media reservoir; Per, permeate; Ret, retentate22.
The reactor shown in Figure 2 overcomes all the aforementioned challenges in a few key steps.
Primarily, it utilizes two reactors, each held at a different pH, to promote growth, then
production. The systems not only fosters acidogenesis, then solventogenesis, but also filters
cells, purging and recycling a fraction of the filtered cells to maintain homogeneity within the
system. Their design consists of a 1L CSTR for growth, and a 4L bubble column for production.
Cornell’s system operated both stages at 1bar, and used a syngas inlet of 60vol.% CO, 35vol.%
H2, 5vol.% CO2. The principle of the reactor is that cell medium, which includes cell
inoculation media and nutrients for growth is introduces from M, the Medium reservoir into
Stage 1, the growth stage. The growth stage pH is controlled by action of acid or base pumps,
and cells grow whilst producing acetate and some ethanol. Syngas is bubbled though the bottom
of the CSTR, and dissolves into the liquid media. Once dissolved, the microbes can access the
gas for ethanol or acetate production. Stage 1 medium is pumped into stage 2, where the pH is
again controlled by acid or base pumps, and ethanol production is promoted. Finally, a hollow
membrane filters cells from the stage 2 liquid medium, and cell free product is pumped to a
reservoir22.
20
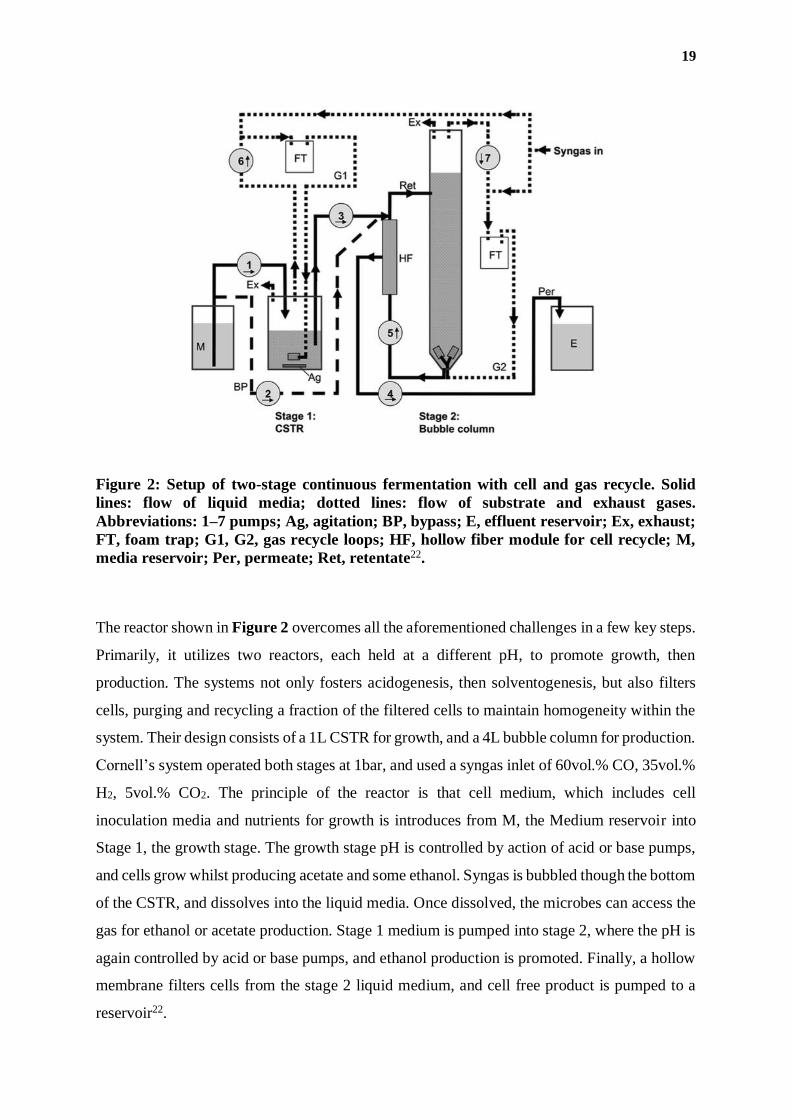
Detailed information regarding their gas inlet concentration, absorption, and production of
acetate and ethanol in each stage was provided, alongside detailed growth rate information,
nutrient supply, and microbe productivity.
To compare the applicability of Cornell’s lab scale plant to the target syngas feed, and whether
the lab scale plant lends itself well to upscale, some initial estimates were made. Primarily, one
may estimate the scale of a syngas fermentation plant needed to process the utilized syngas
feed in this process. Using Table 3, it was found that the mol flow per unit volume used on this
scale was 1.28 𝑚𝑚𝑜𝑙
𝐿∗𝑚𝑖𝑛, or 0.0213
𝑚𝑜𝑙
𝑚3𝑠. Mentioned in the introduction is the need to convert a
342.23 𝑘𝑔
𝑠 syngas flow. With information provided on the contents of said gas flow, the molar
flow rates of various components was derived.
Compounds Rates [mmol/(L·min)]
Stage 1 Stage 2 Total
CO in 0.607 0.808 0.768
CO out 0.33 0.11 0.154
CO consumption 0.277 0.698 0.614
H2 in 0.354 0.471 0.448
H2 out 0.182 0.085 0.105
H2 consumption 0.172 0.386 0.343
CO2 in 0.051 0.067 0.064
CO2 out 0.085 0.371 0.314
CO2 production 0.034 0.303 0.25
Ethanol production 0.007 0.136 0.11
Acetic acid production 0.094 0.025 0.039
Table 3: Syngas inflow, outflow, and consumption, and Ethanol and Acetic acid
production, per stage of lab-scale plant.
21
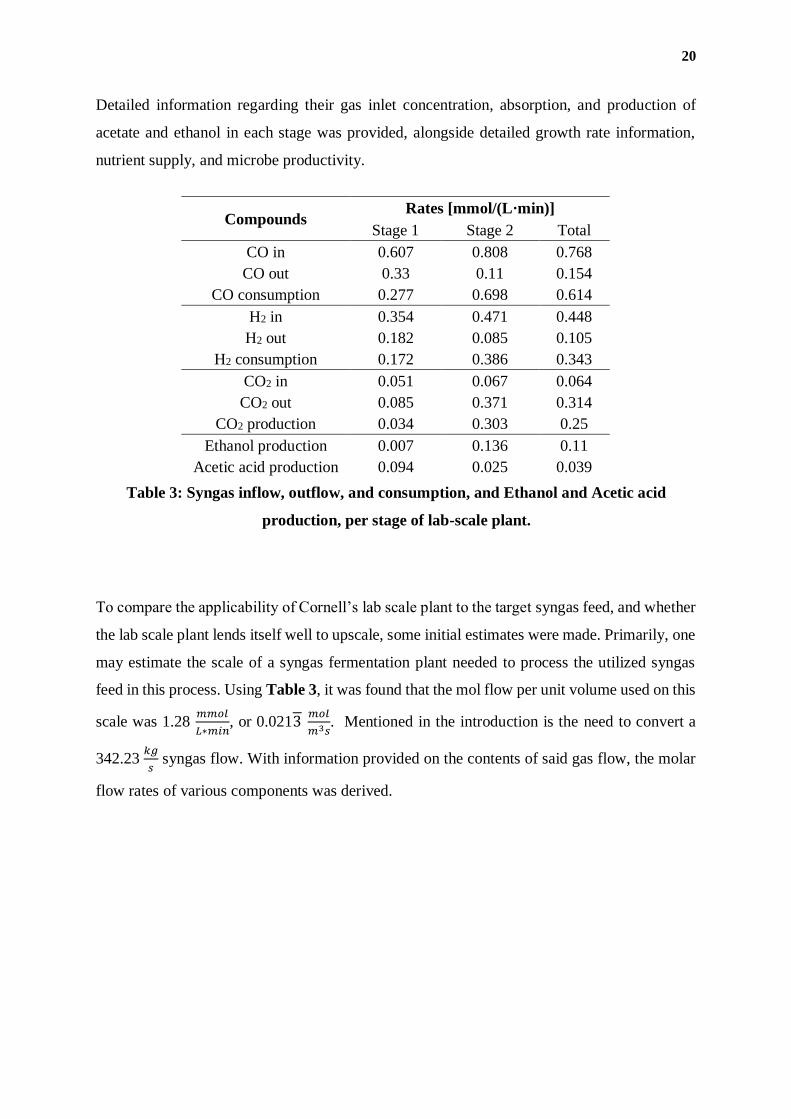
Component Fraction 𝒌𝒈
𝒔
𝒌𝒈
𝒎𝒐𝒍
𝒎𝒐𝒍
𝒔
H2 0.15 51.3 2.02 E-3 25413
N2 0.35 119.8 2.80 E-2 4276
CO 0.30 102.7 2.80 E-2 3666
CO2 0.14 47.9 4.40 E-2 1089
CH4 0.05 17.1 1.60 E-2 1067
Impurities 0.01 3.4 Total 35510
Table 4: Derivation of molar inflow of syngas excluding impurities.
With an established molar inflow of 35510 𝑚𝑜𝑙
𝑠, and a known mol flow per unit volume of
0.0213 𝑚𝑜𝑙
𝑚3𝑠 for Cornell’s reactor setup, an estimated net volume of 1.7 million m3 was reached.
Note, since the gas composition used in this system is poorer in terms of CO and CO2 than
Cornell’s feed, this value would in reality be bigger. Nonetheless, this “upscale” still provides
useful information. Using height to diameter ratios appropriate for bubble columns, the height
of our new setup would rival that of the Eiffel tower. With that, the main challenge to working
with microbes is insinuated, their relatively low productivity in ambient conditions. Cornell’s
lab scale reactor reached a productivity of 0.374 𝑔
𝐿 ℎ of ethanol. This is fairly high when
compared to other cited productivities, but higher productivities in different systems have been
achieved. The problem encountered here is however not intrinsic to Cornell’s system, so
searching for an alternative process would yield similarly large equipment.
In order to achieve a workable design, it became clear that the productivity per unit volume of
the system would need to be increased. In doing so, one needs to be mindful of the scientific
viability of the upscale, and therefore every assumption and upscaling factor should be
supported by experimental evidence or scientific theory to ensure an upscale with a footing in
the scientific realm.
Process Upscale and Optimization
As shown in Reactor Choice, a lot of ground must be covered in order to bring the productivity
and viability of this system into realization. To not limit the design process, and since the aim
of this evaluation is to determine if the process in mind is viable, no economic restrictions were
22
set in the design phase, and rather an economic evaluation after the fact will determine whether
the derived system would be economically effective.
Primarily, focus was applied on the limiting factor in product formation by establishing
whether the process was mass solvent transfer limited, microbe transfer limited, or kinetically
limited. If the microbes were kinetically limited, or mass transfer limited through their cell
membranes (microbe transfer limited), the viability of this system would be hampered, as less
can be done to increase the production speed of the microbes, or mass transfer through their
cell membranes than can be done to increase the mass transfer rate of the syngas into the liquid
medium.
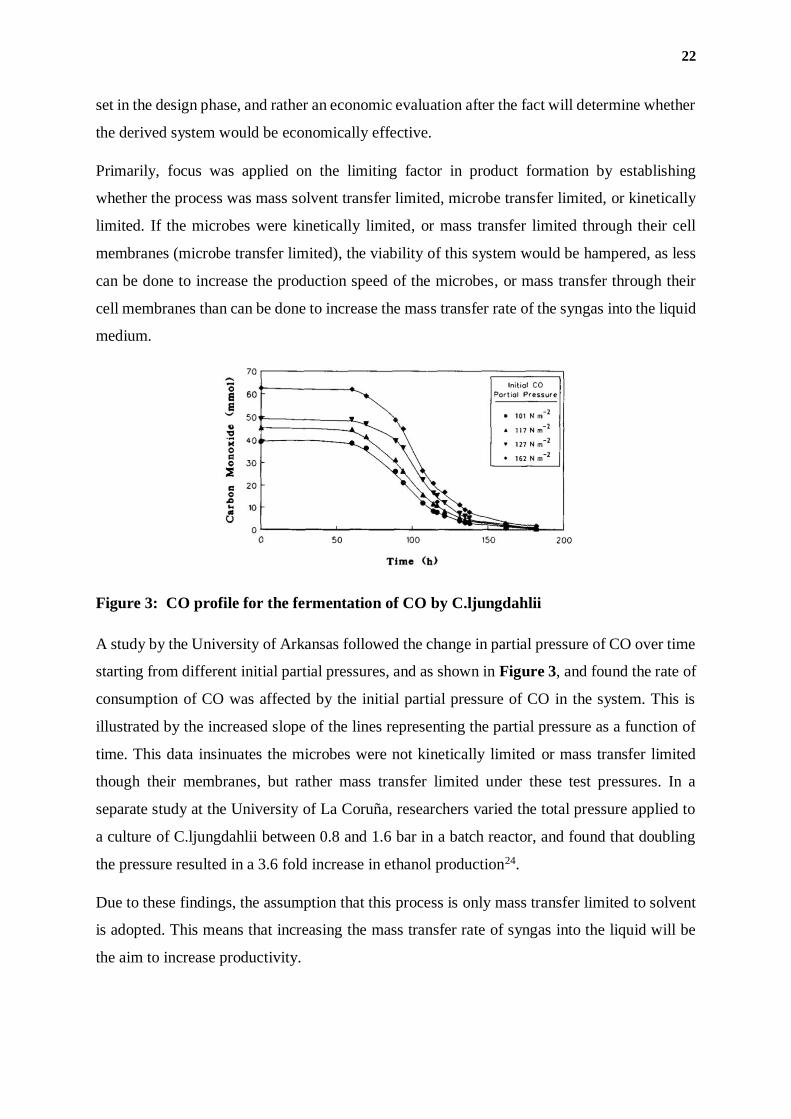
Figure 3: CO profile for the fermentation of CO by C.ljungdahlii
A study by the University of Arkansas followed the change in partial pressure of CO over time
starting from different initial partial pressures, and as shown in Figure 3, and found the rate of
consumption of CO was affected by the initial partial pressure of CO in the system. This is
illustrated by the increased slope of the lines representing the partial pressure as a function of
time. This data insinuates the microbes were not kinetically limited or mass transfer limited
though their membranes, but rather mass transfer limited under these test pressures. In a
separate study at the University of La Coruña, researchers varied the total pressure applied to
a culture of C.ljungdahlii between 0.8 and 1.6 bar in a batch reactor, and found that doubling
the pressure resulted in a 3.6 fold increase in ethanol production24.
Due to these findings, the assumption that this process is only mass transfer limited to solvent
is adopted. This means that increasing the mass transfer rate of syngas into the liquid will be
the aim to increase productivity.
23
To summarize, there were three possible limiting factors considered for microbe productivity,
namely mass transfer to the solvent, mass transfer to the microbe though its cells wall, and then
the rate of production within the microbe. Next, consultation of data from two different sources
both suggested that an increase in pressure resulted in an increase in production, or increased
consumption of CO. This means that under the test conditions of these experiments, the
limitation of the microbe’s productivity was not the cell wall mass transfer rate, nor the
production speed of the microbes itself.
Because mass transfer to the solvent can be hugely increased by increasing system pressure,
eventually, a mass transfer limitation would be found in the cell wall mass transfer rate of the
microbes, or the production rate of the microbes. However, for the purpose of upscale, because
the system pressure will not be increased to unreasonably high pressures, and because no
consulted literature discussed kinetic limitations or mass transfer limitation in the cell wall of
C.ljungdahlii, the possibility of cell wall mass transfer limitations or production rate limitations
will not be considered for this upscale.
This decision translates into a more practical assumption, that if the microbes can consume
dissolved gasses faster than they can be dissolved, that the steady state bulk concentration of
consumed gasses in the liquid is 0.
The molar flux into a liquid is given by JA. The equation for JA is shown below.
𝐽𝐴 = (𝑐𝐴𝐺 −
𝑐𝐴𝐿𝑚
1𝑘𝑔
+1
𝑘𝐿 ∗ 𝑚
) (𝐄𝐪𝐮𝐚𝐭𝐢𝐨𝐧 𝟕), 𝐴𝑏𝑠 = 𝐽𝐴 ∗ 𝐴 (𝐄𝐪𝐮𝐚𝐭𝐢𝐨𝐧 𝟖)
Equation 7: Mol flux
Equation 8: Absorption
24
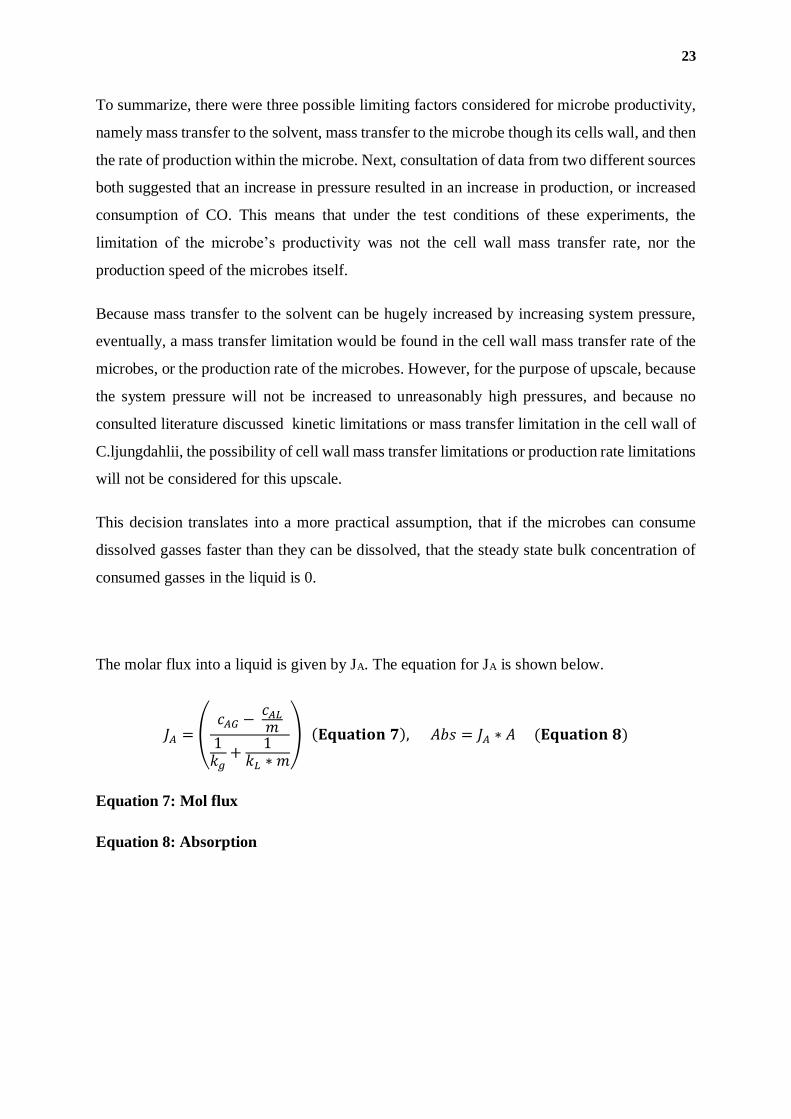
Figure 4: Visual illustration of syngas absorption and product production by
C.ljungdahlii
The assumptions that the reaction is not kinetically nor cell wall limited implies the microbes
will convert all gasses diffused into the liquid at a greater rate than they can be diffused, which
means the bulk concentration of gas in the liquid is assumed to be zero.
This allows one to simplify Equation 7.
𝐽𝐴 = 𝐶𝐴𝐺 (1
𝑘𝑔+
1
𝑘𝐿 ∗ 𝑚)
−1
(𝐄𝐪𝐮𝐚𝐭𝐢𝐨𝐧 𝟗)
Equation 9: Simplified mol flux equation assuming CAL bulk is zero.
Assuming the mass transfer coefficients of the gas and liquid are constant (kg and kL), and the
partition coefficient m is also constant, JA becomes proportional to CAG.
𝑐𝐴𝐺 =𝑃
𝑅𝑇 (𝐄𝐪𝐮𝐚𝐭𝐢𝐨𝐧 𝟏𝟎), 𝑐𝐴𝐺 = 𝑓(𝑃), 𝑐𝐴𝐺~ 𝑃
Equation 10: CAG (concentration of A in gas) as per Ideal Gas Law
With JA proportional to CAG, and CAG proportional to P (pressure), molar absorption (Equation
8) is proportional to P assuming constant contact area.
25
𝐴𝑏𝑠 = 𝐽𝐴 ∗ 𝐴 = ((𝑃
𝑅𝑇) (
1
𝑘𝑔+
1
𝑘𝐿 ∗ 𝑚)
−1
) ∗ 𝐴 (𝐄𝐪𝐮𝐚𝐭𝐢𝐨𝐧 𝟏𝟏)
Equation 11: Modified absorption equation from Equation 9 and Equation 10.
The problem with assuming constant contact area is that the area of a given gas is proportional
to the size of the rising bubbles in the reactors or amount of bubbles rising in the reactor. As
the system pressure increases, the gas is compressed, and a molar flow of gas at high pressure
would have a smaller volume compared to said mol flow in a low-pressure system.
𝜙𝑉 =𝑚3
𝑠=
𝜙𝑚𝑜𝑙 𝑀𝑤
𝜌 (𝐄𝐪𝐮𝐚𝐭𝐢𝐨𝐧 𝟏𝟐) , 𝐷𝐴:
𝑚𝑜𝑙
𝑠∗
𝑘𝑔
𝑚𝑜𝑙∗
𝑚3
𝑘𝑔
𝜌 =𝑘𝑔
𝑚3=
𝑛 𝑀𝑤
𝑉=
𝑃 𝑀𝑤
𝑅𝑇 (𝐄𝐪𝐮𝐚𝐭𝐢𝐨𝐧 𝟏𝟑), 𝐼𝑑𝑒𝑎𝑙 𝐺𝑎𝑠 𝑙𝑎𝑤
(𝐄𝐪𝐮𝐚𝐭𝐢𝐨𝐧 𝟏𝟐) + (𝐄𝐪𝐮𝐚𝐭𝐢𝐨𝐧 𝟏𝟑) = 𝜙𝑉 =𝜙𝑚𝑜𝑙 𝑀𝑤 𝑅𝑇
𝑃 𝑀𝑤=
𝜙𝑚𝑜𝑙 𝑅𝑇
𝑃(𝐄𝐪𝐮𝐚𝐭𝐢𝐨𝐧 𝟏𝟒)
Equation 12: Volumetric flow in terms of mol flow and density
Equation 13: Density (ρ) derivation as per ideal gas law
Equation 14: Equation for volumetric flow in terms or mol flow and pressure and
temperature. Note: Mw = Molecular weight.
As shown in Equation 14, volumetric flow is a function of mol flow, pressure, and
temperature. Since the system temperature will be kept constant, 𝜙𝑉 ~ 𝜙𝑚𝑜𝑙 , 𝜙𝑉 ~ 1
𝑃,
meaning 𝜙𝑉 can be kept constant assuming molar flow is scaled with pressure.
26
This can be shown to be the case when looking specifically at the formula that determines the
volume of bubbles from a sparger.
𝑉𝐵 =2𝜋𝑅𝜎
𝑔∆𝜌 (𝐄𝐪𝐮𝐚𝐭𝐢𝐨𝐧 𝟏𝟓)
𝑉𝐵 = Volume of bubble (mL V cm3)
𝑅 = orifice radius (cm)
𝜎 = surface tension (dynes/cm)
𝑔 = gravitational constant (cm/s2)
∆𝜌 = density of liquid – density of gas within bubble
Equation 15: Volume of bubble in column from sparger formula25
As shown in Equation 15, the volume of a bubble is proportional to the size of the orifice of
the sparger, and inversely proportional to the pressure difference between the bubble and
exterior liquid. The other variables are considered constant. In order to maintain a gas flow,
the pressure within the bubble will need to be increased to an extent that allows the gas to
flow though the sparger and create a bubble. Because of this, a change in system pressure, or
liquid pressure in the reactor, will need to be reflected in a change in pressure of the exiting
bubbles from the sparger. This translates to constant bubble size when using a sparger, since
the orifice radius R is constant. What will change upon pressure increase is then the number
of bubbles that exits the sparger. This is because to increase the pressure within the bubbles
exiting the sparger, the inlet gas must be compressed, and this compression reduces the
volume of incoming gas. Therefore, the notion that a constant volume flow when increasing
pressure must be accompanied by a proportional mol flow increase is supported through
Equation 15.
If the system is scaled as such, then the volume of all bubbles, and the volume of individual
bubbles should remain constant, which allows for a constant contact area in Equation 11.
Following these guidelines, molar flux, and therefore absorption into the liquid is proportional
to pressure so long as molar inflow per reactor is scaled with pressure.
27
Syngas Optimization
With a viable upscale method in place, attention can be drawn to the syngas composition. In
order to determine absorption data, empirical data will not be sourced to derive JA, and estimate
the contact area in the lab-scale plant. Instead, using the absorption rate and efficiencies
divulged in the literature summary of Cornell’s plant, the absorption rates of the gasses in this
system’s syngas will be estimated, after application of correction factors to account for the
different concentrations and partial pressures between the two syngas inlets.
Component Vol % (lit) Vol % (design)
H2 35.00 71.57
N2 - 12.04
CO 60.00 10.32
CO2 5.00 3.07
CH4 - 3.00
Table 5: Comparison of Cornell plant syngas feed vs design feed. (Not including
impurities)
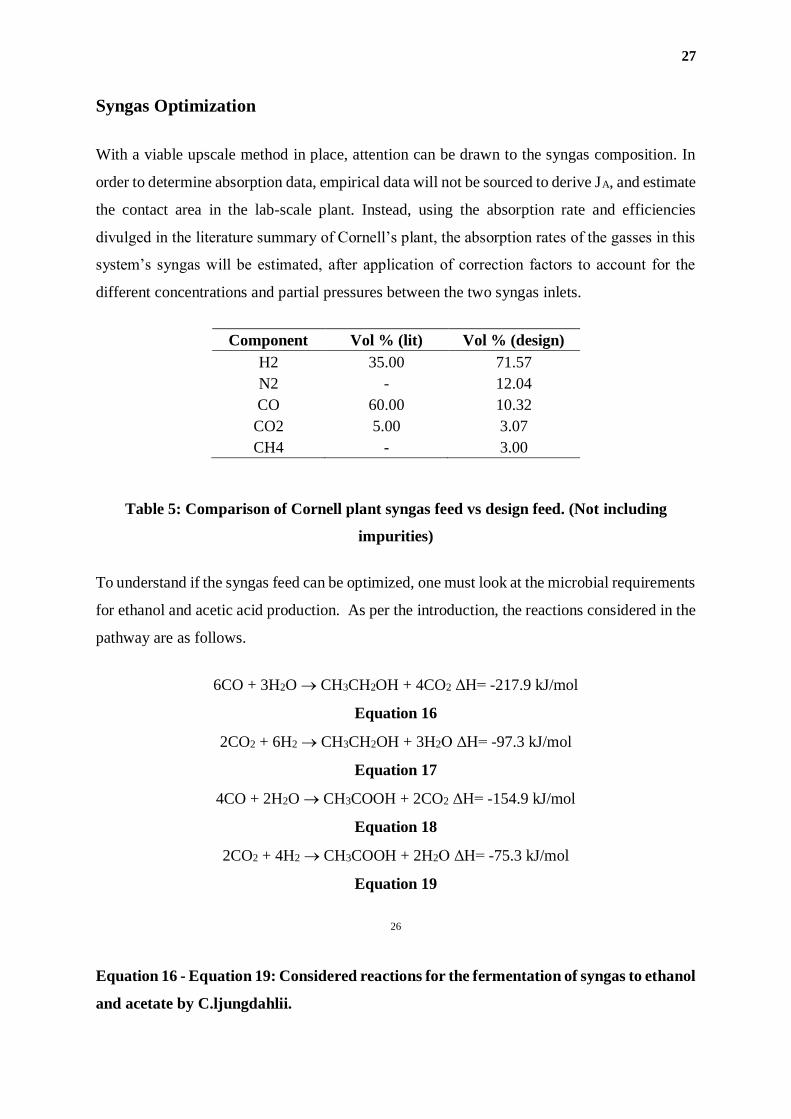
To understand if the syngas feed can be optimized, one must look at the microbial requirements
for ethanol and acetic acid production. As per the introduction, the reactions considered in the
pathway are as follows.
6CO + 3H2O → CH3CH2OH + 4CO2 ΔH= -217.9 kJ/mol
Equation 16
2CO2 + 6H2 → CH3CH2OH + 3H2O ΔH= -97.3 kJ/mol
Equation 17
4CO + 2H2O → CH3COOH + 2CO2 ΔH= -154.9 kJ/mol
Equation 18
2CO2 + 4H2 → CH3COOH + 2H2O ΔH= -75.3 kJ/mol
Equation 19
26
Equation 16 - Equation 19: Considered reactions for the fermentation of syngas to ethanol
and acetate by C.ljungdahlii.
28
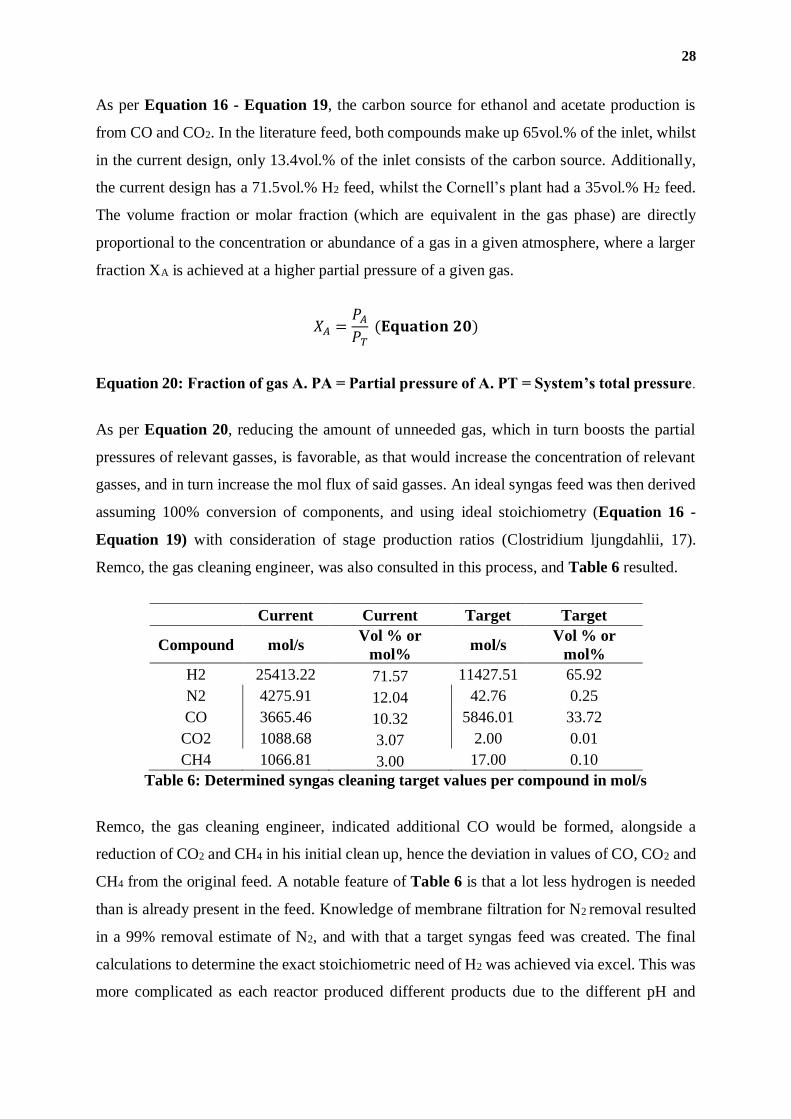
As per Equation 16 - Equation 19, the carbon source for ethanol and acetate production is
from CO and CO2. In the literature feed, both compounds make up 65vol.% of the inlet, whilst
in the current design, only 13.4vol.% of the inlet consists of the carbon source. Additionally,
the current design has a 71.5vol.% H2 feed, whilst the Cornell’s plant had a 35vol.% H2 feed.
The volume fraction or molar fraction (which are equivalent in the gas phase) are directly
proportional to the concentration or abundance of a gas in a given atmosphere, where a larger
fraction XA is achieved at a higher partial pressure of a given gas.
𝑋𝐴 =𝑃𝐴
𝑃𝑇 (𝐄𝐪𝐮𝐚𝐭𝐢𝐨𝐧 𝟐𝟎)
Equation 20: Fraction of gas A. PA = Partial pressure of A. PT = System’s total pressure.
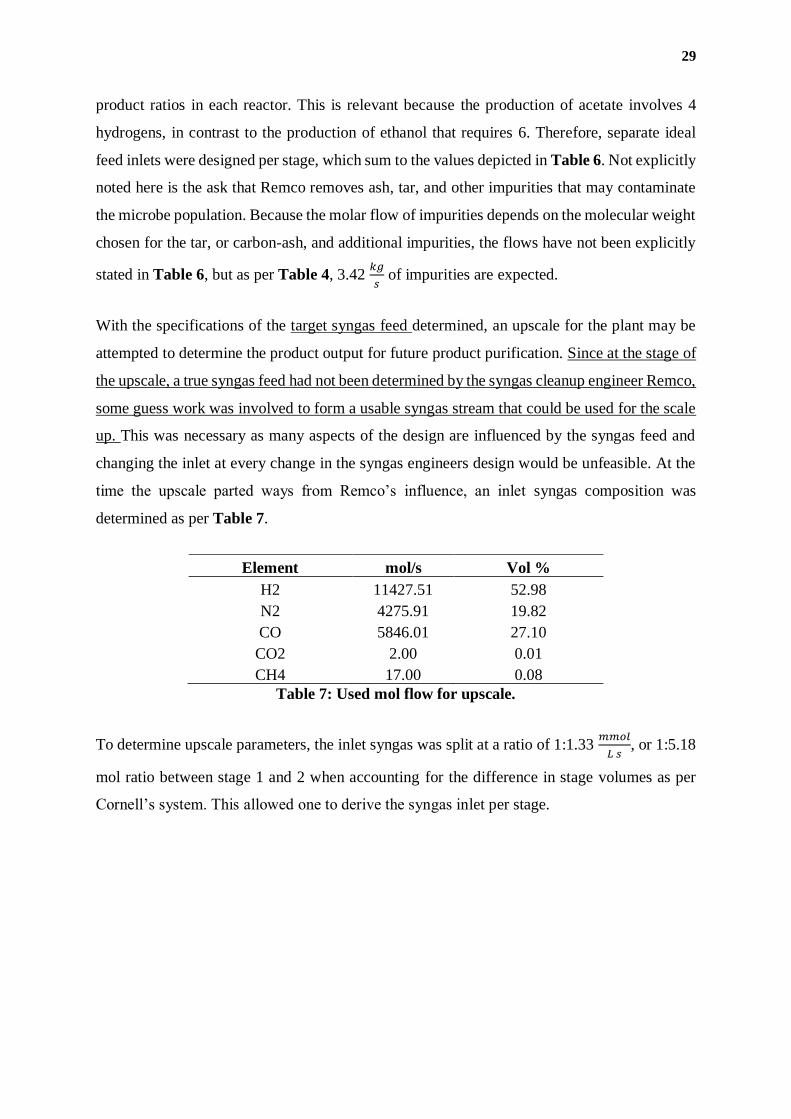
As per Equation 20, reducing the amount of unneeded gas, which in turn boosts the partial
pressures of relevant gasses, is favorable, as that would increase the concentration of relevant
gasses, and in turn increase the mol flux of said gasses. An ideal syngas feed was then derived
assuming 100% conversion of components, and using ideal stoichiometry (Equation 16 -
Equation 19) with consideration of stage production ratios (Clostridium ljungdahlii, 17).
Remco, the gas cleaning engineer, was also consulted in this process, and Table 6 resulted.
Current Current Target Target
Compound mol/s Vol % or
mol% mol/s
Vol % or
mol%
H2 25413.22 71.57 11427.51 65.92
N2 4275.91 12.04 42.76 0.25
CO 3665.46 10.32 5846.01 33.72
CO2 1088.68 3.07 2.00 0.01
CH4 1066.81 3.00 17.00 0.10
Table 6: Determined syngas cleaning target values per compound in mol/s
Remco, the gas cleaning engineer, indicated additional CO would be formed, alongside a
reduction of CO2 and CH4 in his initial clean up, hence the deviation in values of CO, CO2 and
CH4 from the original feed. A notable feature of Table 6 is that a lot less hydrogen is needed
than is already present in the feed. Knowledge of membrane filtration for N2 removal resulted
in a 99% removal estimate of N2, and with that a target syngas feed was created. The final
calculations to determine the exact stoichiometric need of H2 was achieved via excel. This was
more complicated as each reactor produced different products due to the different pH and
29
product ratios in each reactor. This is relevant because the production of acetate involves 4
hydrogens, in contrast to the production of ethanol that requires 6. Therefore, separate ideal
feed inlets were designed per stage, which sum to the values depicted in Table 6. Not explicitly
noted here is the ask that Remco removes ash, tar, and other impurities that may contaminate
the microbe population. Because the molar flow of impurities depends on the molecular weight
chosen for the tar, or carbon-ash, and additional impurities, the flows have not been explicitly
stated in Table 6, but as per Table 4, 3.42 𝑘𝑔
𝑠 of impurities are expected.
With the specifications of the target syngas feed determined, an upscale for the plant may be
attempted to determine the product output for future product purification. Since at the stage of
the upscale, a true syngas feed had not been determined by the syngas cleanup engineer Remco,
some guess work was involved to form a usable syngas stream that could be used for the scale
up. This was necessary as many aspects of the design are influenced by the syngas feed and
changing the inlet at every change in the syngas engineers design would be unfeasible. At the
time the upscale parted ways from Remco’s influence, an inlet syngas composition was
determined as per Table 7.
Element mol/s Vol %
H2 11427.51 52.98
N2 4275.91 19.82
CO 5846.01 27.10
CO2 2.00 0.01
CH4 17.00 0.08
Table 7: Used mol flow for upscale.
To determine upscale parameters, the inlet syngas was split at a ratio of 1:1.33 𝑚𝑚𝑜𝑙
𝐿 𝑠, or 1:5.18
mol ratio between stage 1 and 2 when accounting for the difference in stage volumes as per
Cornell’s system. This allowed one to derive the syngas inlet per stage.
30
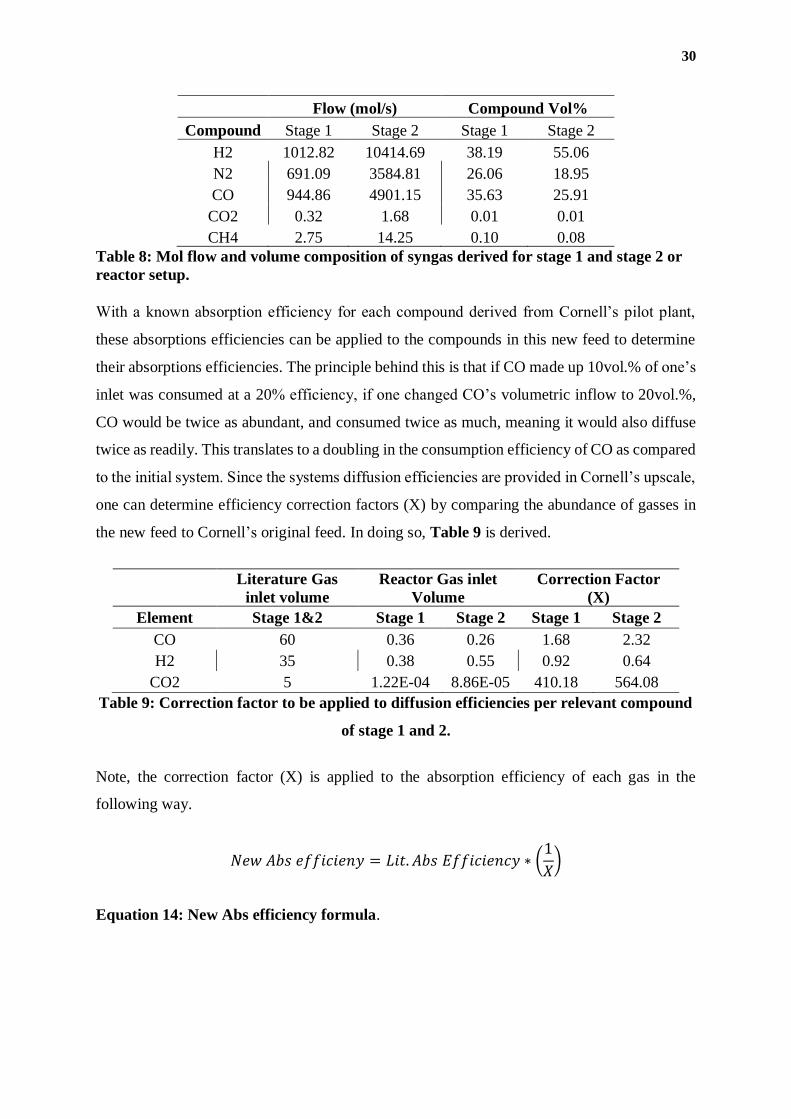
Flow (mol/s) Compound Vol%
Compound Stage 1 Stage 2 Stage 1 Stage 2
H2 1012.82 10414.69 38.19 55.06
N2 691.09 3584.81 26.06 18.95
CO 944.86 4901.15 35.63 25.91
CO2 0.32 1.68 0.01 0.01
CH4 2.75 14.25 0.10 0.08
Table 8: Mol flow and volume composition of syngas derived for stage 1 and stage 2 or
reactor setup.
With a known absorption efficiency for each compound derived from Cornell’s pilot plant,
these absorptions efficiencies can be applied to the compounds in this new feed to determine
their absorptions efficiencies. The principle behind this is that if CO made up 10vol.% of one’s
inlet was consumed at a 20% efficiency, if one changed CO’s volumetric inflow to 20vol.%,
CO would be twice as abundant, and consumed twice as much, meaning it would also diffuse
twice as readily. This translates to a doubling in the consumption efficiency of CO as compared
to the initial system. Since the systems diffusion efficiencies are provided in Cornell’s upscale,
one can determine efficiency correction factors (X) by comparing the abundance of gasses in
the new feed to Cornell’s original feed. In doing so, Table 9 is derived.
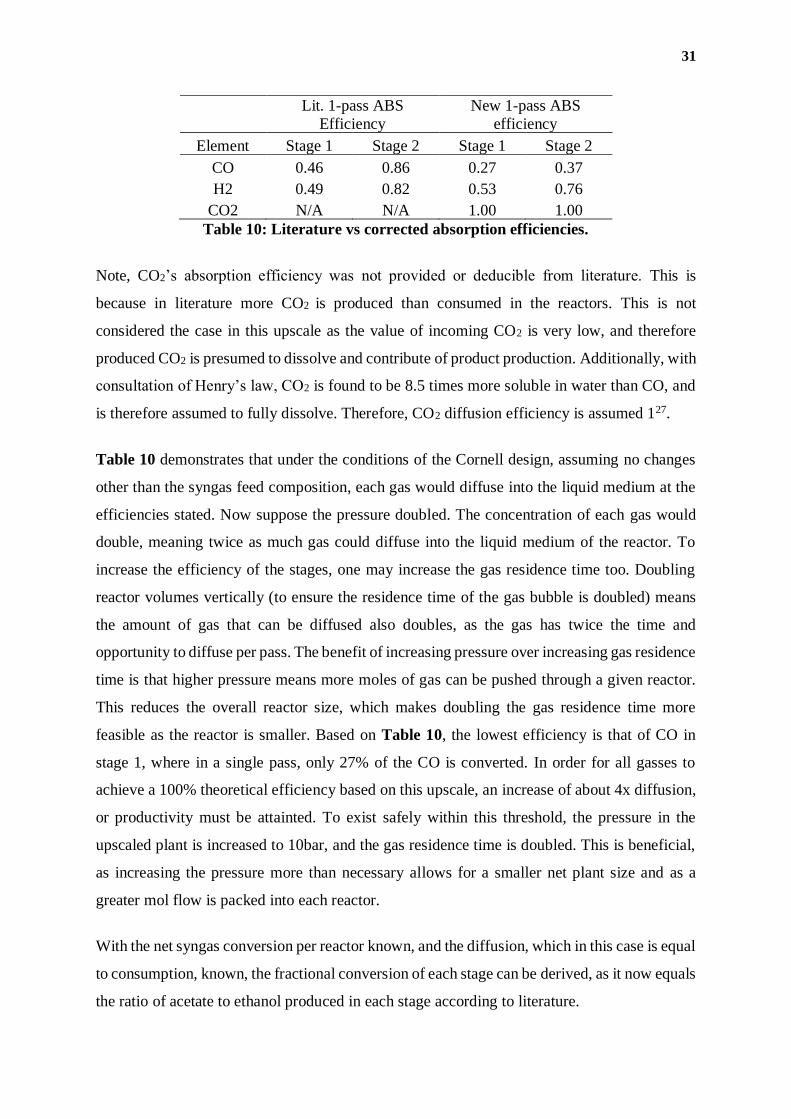
Literature Gas
inlet volume
Reactor Gas inlet
Volume
Correction Factor
(X)
Element Stage 1&2 Stage 1 Stage 2 Stage 1 Stage 2
CO 60 0.36 0.26 1.68 2.32
H2 35 0.38 0.55 0.92 0.64
CO2 5 1.22E-04 8.86E-05 410.18 564.08
Table 9: Correction factor to be applied to diffusion efficiencies per relevant compound
of stage 1 and 2.
Note, the correction factor (X) is applied to the absorption efficiency of each gas in the
following way.
𝑁𝑒𝑤 𝐴𝑏𝑠 𝑒𝑓𝑓𝑖𝑐𝑖𝑒𝑛𝑦 = 𝐿𝑖𝑡. 𝐴𝑏𝑠 𝐸𝑓𝑓𝑖𝑐𝑖𝑒𝑛𝑐𝑦 ∗ (1
𝑋)
Equation 14: New Abs efficiency formula.
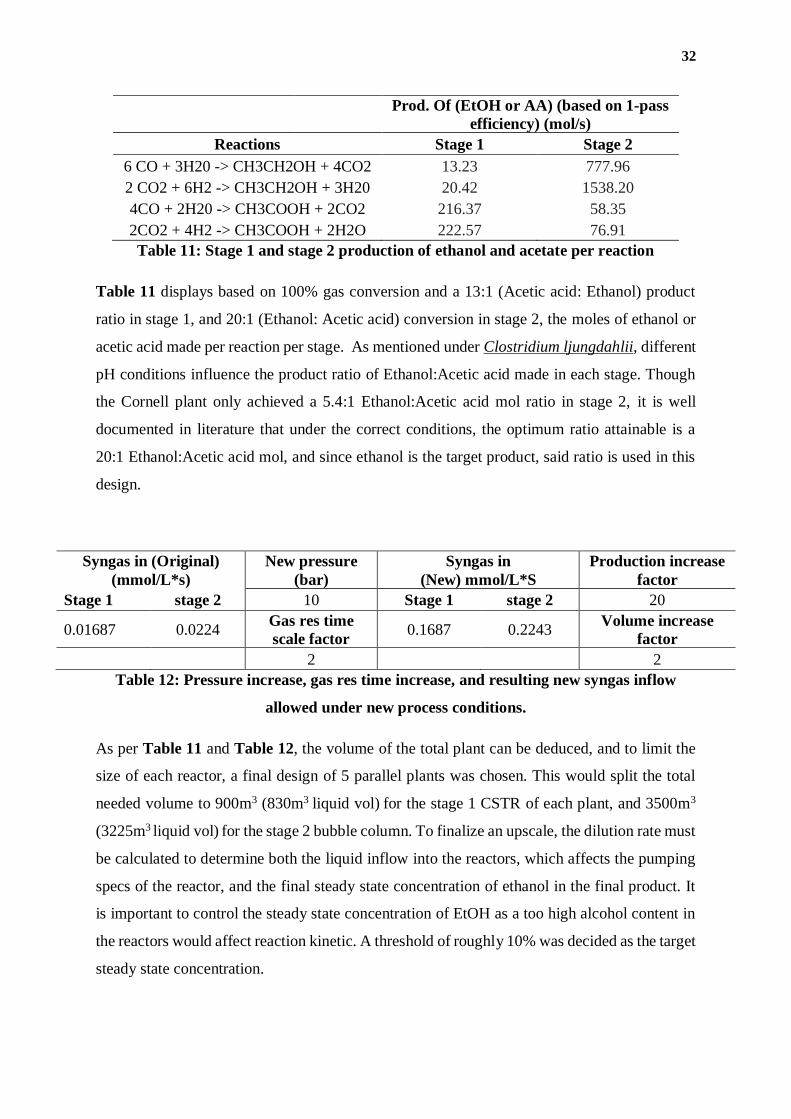
31
Lit. 1-pass ABS
Efficiency
New 1-pass ABS
efficiency
Element Stage 1 Stage 2 Stage 1 Stage 2
CO 0.46 0.86 0.27 0.37
H2 0.49 0.82 0.53 0.76
CO2 N/A N/A 1.00 1.00
Table 10: Literature vs corrected absorption efficiencies.
Note, CO2’s absorption efficiency was not provided or deducible from literature. This is
because in literature more CO2 is produced than consumed in the reactors. This is not
considered the case in this upscale as the value of incoming CO2 is very low, and therefore
produced CO2 is presumed to dissolve and contribute of product production. Additionally, with
consultation of Henry’s law, CO2 is found to be 8.5 times more soluble in water than CO, and
is therefore assumed to fully dissolve. Therefore, CO2 diffusion efficiency is assumed 127.
Table 10 demonstrates that under the conditions of the Cornell design, assuming no changes
other than the syngas feed composition, each gas would diffuse into the liquid medium at the
efficiencies stated. Now suppose the pressure doubled. The concentration of each gas would
double, meaning twice as much gas could diffuse into the liquid medium of the reactor. To
increase the efficiency of the stages, one may increase the gas residence time too. Doubling
reactor volumes vertically (to ensure the residence time of the gas bubble is doubled) means
the amount of gas that can be diffused also doubles, as the gas has twice the time and
opportunity to diffuse per pass. The benefit of increasing pressure over increasing gas residence
time is that higher pressure means more moles of gas can be pushed through a given reactor.
This reduces the overall reactor size, which makes doubling the gas residence time more
feasible as the reactor is smaller. Based on Table 10, the lowest efficiency is that of CO in
stage 1, where in a single pass, only 27% of the CO is converted. In order for all gasses to
achieve a 100% theoretical efficiency based on this upscale, an increase of about 4x diffusion,
or productivity must be attainted. To exist safely within this threshold, the pressure in the
upscaled plant is increased to 10bar, and the gas residence time is doubled. This is beneficial,
as increasing the pressure more than necessary allows for a smaller net plant size and as a
greater mol flow is packed into each reactor.
With the net syngas conversion per reactor known, and the diffusion, which in this case is equal
to consumption, known, the fractional conversion of each stage can be derived, as it now equals
the ratio of acetate to ethanol produced in each stage according to literature.
32
Prod. Of (EtOH or AA) (based on 1-pass
efficiency) (mol/s)
Reactions Stage 1 Stage 2
6 CO + 3H20 -> CH3CH2OH + 4CO2 13.23 777.96
2 CO2 + 6H2 -> CH3CH2OH + 3H20 20.42 1538.20
4CO + 2H20 -> CH3COOH + 2CO2 216.37 58.35
2CO2 + 4H2 -> CH3COOH + 2H2O 222.57 76.91
Table 11: Stage 1 and stage 2 production of ethanol and acetate per reaction
Table 11 displays based on 100% gas conversion and a 13:1 (Acetic acid: Ethanol) product
ratio in stage 1, and 20:1 (Ethanol: Acetic acid) conversion in stage 2, the moles of ethanol or
acetic acid made per reaction per stage. As mentioned under Clostridium ljungdahlii, different
pH conditions influence the product ratio of Ethanol:Acetic acid made in each stage. Though
the Cornell plant only achieved a 5.4:1 Ethanol:Acetic acid mol ratio in stage 2, it is well
documented in literature that under the correct conditions, the optimum ratio attainable is a
20:1 Ethanol:Acetic acid mol, and since ethanol is the target product, said ratio is used in this
design.
Syngas in (Original)
(mmol/L*s)
New pressure
(bar)
Syngas in
(New) mmol/L*S
Production increase
factor
Stage 1 stage 2 10 Stage 1 stage 2 20
0.01687 0.0224 Gas res time
scale factor 0.1687 0.2243
Volume increase
factor
2 2
Table 12: Pressure increase, gas res time increase, and resulting new syngas inflow
allowed under new process conditions.
As per Table 11 and Table 12, the volume of the total plant can be deduced, and to limit the
size of each reactor, a final design of 5 parallel plants was chosen. This would split the total
needed volume to 900m3 (830m3 liquid vol) for the stage 1 CSTR of each plant, and 3500m3
(3225m3 liquid vol) for the stage 2 bubble column. To finalize an upscale, the dilution rate must
be calculated to determine both the liquid inflow into the reactors, which affects the pumping
specs of the reactor, and the final steady state concentration of ethanol in the final product. It
is important to control the steady state concentration of EtOH as a too high alcohol content in
the reactors would affect reaction kinetic. A threshold of roughly 10% was decided as the target
steady state concentration.
33
As per the excel calculator that approximates this system, a volumetric inflow of 977 𝑚3
ℎ was
derived. This gives a liquid residence time of 1h and 3.3h in stage 1 and 2 respectively. This is
very fast compared to the residence time of 25h and 100h in the Cornell’s plant, but this is
believed not to influence the production of the system, but rather the degree of cell recycling.
This is because the only effect of a shorter residence time is that in a cells life time, it will need
to pass though the growth reactor, then production reactor more times than it would had the
residence time been greater. This increased cycling is not expected to have adverse effects on
the microbes, as cells would cycle though both conditions naturally, and no literature
encountered discussed adverse effects of such cycling. Additionally, single stage continuous
processes exist where the pH in the reactor is altered from high to low pH to temporality
encourage growth, then ethanol production, insinuating the microbes are capable of
withstanding pH cycling. The theoretical upscale via excel is completed with a final prediction
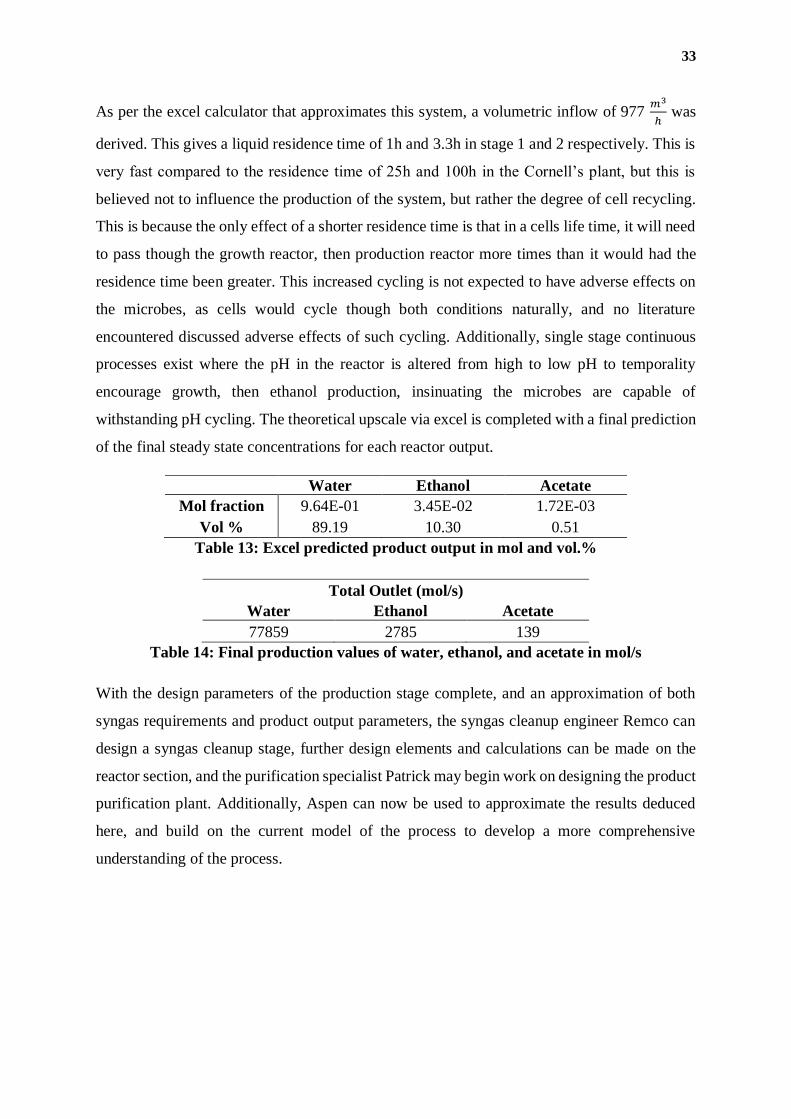
of the final steady state concentrations for each reactor output.
Water Ethanol Acetate
Mol fraction 9.64E-01 3.45E-02 1.72E-03
Vol % 89.19 10.30 0.51
Table 13: Excel predicted product output in mol and vol.%
Total Outlet (mol/s)
Water Ethanol Acetate
77859 2785 139
Table 14: Final production values of water, ethanol, and acetate in mol/s
With the design parameters of the production stage complete, and an approximation of both
syngas requirements and product output parameters, the syngas cleanup engineer Remco can
design a syngas cleanup stage, further design elements and calculations can be made on the
reactor section, and the purification specialist Patrick may begin work on designing the product
purification plant. Additionally, Aspen can now be used to approximate the results deduced
here, and build on the current model of the process to develop a more comprehensive
understanding of the process.
34
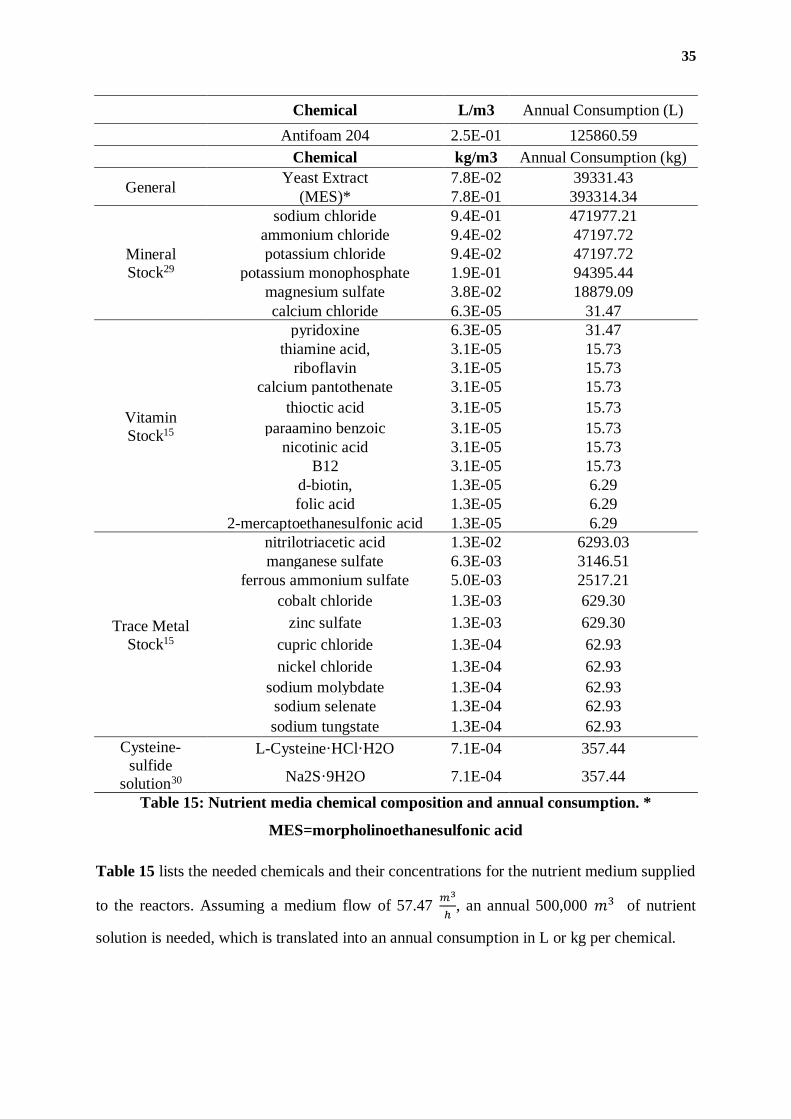
Auxiliary Calculations
Though an approximation has been made to reflect the reactors production and needs,
calculations must be made to approximate the steady state needs of auxiliary flows into the
reactor. Cell cultures once acquired can be maintained at healthy populations by growing more
cell culture with the use of nutrients, and the only required flows left to be deduced is the steady
state nutrient flow into the reactor to sustain the microbes. According to literature, a nutrient
stock is added to the growth reactor at a 1:16 volume ratio as compared to the water inlet22.
The nutrient stock consists of a pH buffer, a mineral stock, vitamin stock, trace metal stock,
and an antifoam agent, antifoam 20428. During steady state operation, the nutrient stock
contains the chemicals listed in Table 15 at the indicated concentrations, and the nutrient
medium flow accounts for 57.5 𝑚3
ℎ of the 977
𝑚3
ℎ water inflow.
35
Chemical L/m3 Annual Consumption (L)
Antifoam 204 2.5E-01 125860.59 Chemical kg/m3 Annual Consumption (kg)
General Yeast Extract 7.8E-02 39331.43
(MES)* 7.8E-01 393314.34
Mineral
Stock29
sodium chloride 9.4E-01 471977.21
ammonium chloride 9.4E-02 47197.72
potassium chloride 9.4E-02 47197.72
potassium monophosphate 1.9E-01 94395.44
magnesium sulfate 3.8E-02 18879.09
calcium chloride 6.3E-05 31.47
Vitamin
Stock15
pyridoxine 6.3E-05 31.47
thiamine acid, 3.1E-05 15.73
riboflavin 3.1E-05 15.73
calcium pantothenate 3.1E-05 15.73
thioctic acid 3.1E-05 15.73
paraamino benzoic 3.1E-05 15.73
nicotinic acid 3.1E-05 15.73
B12 3.1E-05 15.73
d-biotin, 1.3E-05 6.29
folic acid 1.3E-05 6.29
2-mercaptoethanesulfonic acid 1.3E-05 6.29
Trace Metal
Stock15
nitrilotriacetic acid 1.3E-02 6293.03
manganese sulfate 6.3E-03 3146.51
ferrous ammonium sulfate 5.0E-03 2517.21
cobalt chloride 1.3E-03 629.30
zinc sulfate 1.3E-03 629.30
cupric chloride 1.3E-04 62.93
nickel chloride 1.3E-04 62.93
sodium molybdate 1.3E-04 62.93
sodium selenate 1.3E-04 62.93
sodium tungstate 1.3E-04 62.93
Cysteine-
sulfide
solution30
L-Cysteine·HCl·H2O 7.1E-04 357.44
Na2S·9H2O 7.1E-04 357.44
Table 15: Nutrient media chemical composition and annual consumption. *
MES=morpholinoethanesulfonic acid
Table 15 lists the needed chemicals and their concentrations for the nutrient medium supplied
to the reactors. Assuming a medium flow of 57.47 𝑚3
ℎ, an annual 500,000 𝑚3 of nutrient
solution is needed, which is translated into an annual consumption in L or kg per chemical.
36
Control systems such as anti-foam systems, acid, and base control systems, are the only know
additional auxiliary streams for the growth and production reactors. It is known that both acid
and base streams use 2M KOH or HCl streams, but as such systems do not supply continuous
streams to the reactor, but rather act on demand, their inflows are not calculated. Antifoam 204
is available for emergency foam control, but is already in the nutrient feed, and is typically not
needed. Its stream is therefore not calculated either22.
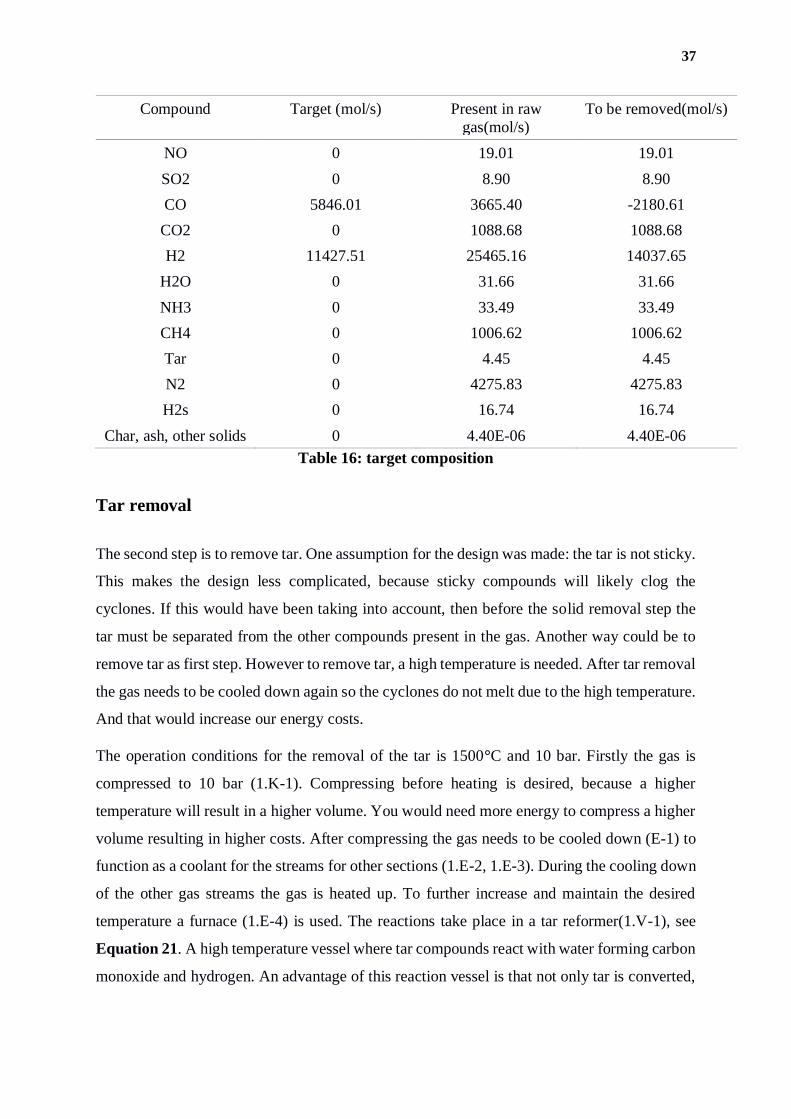
Syngas processing
The waste gas from the steel mill cannot be used directly for fermentation. To have the highest
possible conversion, efficiency and productivity for the production of ethanol the gas must be
processed. Therefore a gas processing section is designed for removal of the impurities. Next
to removal of impurities the gas must also have a composition close to the ideal stoichiometric
order for fermentation. This will improve conversion, efficiency and productivity. The ideal
composition for fermentation can be seen in Table 16. This shows that all impurities and more
than half of hydrogen must be removed, while 2180.61 mol/s of CO should be formed. To
accomplish this several specialized sections are designed, each responsible for removing
different impurities.
Carbon based solids
The first section is chosen to be responsible for carbon based solid removal. Removal of solids
is a logical first step, because solids may clog equipment. This will definitely give problems
later on. The solids are removed by cyclones (S-1). This equipment type is chosen , because it
is easy to maintain. There are no moving parts present, hence little change of failure. A cyclone
can also operate fine with the initial conditions (20°C and 1 bar). The conditions do not have
to be changed for the separation to occur. This is another reason why solid removal is done
first.
37
Compound Target (mol/s) Present in raw
gas(mol/s)
To be removed(mol/s)
NO 0 19.01 19.01
SO2 0 8.90 8.90
CO 5846.01 3665.40 -2180.61
CO2 0 1088.68 1088.68
H2 11427.51 25465.16 14037.65
H2O 0 31.66 31.66
NH3 0 33.49 33.49
CH4 0 1006.62 1006.62
Tar 0 4.45 4.45
N2 0 4275.83 4275.83
H2s 0 16.74 16.74
Char, ash, other solids 0 4.40E-06 4.40E-06
Table 16: target composition
Tar removal
The second step is to remove tar. One assumption for the design was made: the tar is not sticky.
This makes the design less complicated, because sticky compounds will likely clog the
cyclones. If this would have been taking into account, then before the solid removal step the
tar must be separated from the other compounds present in the gas. Another way could be to
remove tar as first step. However to remove tar, a high temperature is needed. After tar removal
the gas needs to be cooled down again so the cyclones do not melt due to the high temperature.
And that would increase our energy costs.
The operation conditions for the removal of the tar is 1500°C and 10 bar. Firstly the gas is
compressed to 10 bar (1.K-1). Compressing before heating is desired, because a higher
temperature will result in a higher volume. You would need more energy to compress a higher
volume resulting in higher costs. After compressing the gas needs to be cooled down (E-1) to
function as a coolant for the streams for other sections (1.E-2, 1.E-3). During the cooling down
of the other gas streams the gas is heated up. To further increase and maintain the desired
temperature a furnace (1.E-4) is used. The reactions take place in a tar reformer(1.V-1), see
Equation 21. A high temperature vessel where tar compounds react with water forming carbon
monoxide and hydrogen. An advantage of this reaction vessel is that not only tar is converted,
38
but methane undergoes a similar reaction.31 At high temperature ammonia becomes unstable
and decomposes to nitrogen and hydrogen.32
• 𝐶10𝐻8 + 10 𝐻2𝑂 → 10 𝐶𝑂 + 14 𝐻2
• 𝐶𝐻4 + 𝐻2𝑂 → 𝐶𝑂 + 3 𝐻2
• 𝐶𝑂 + 𝐻2𝑂 → 𝐶𝑂2 + 𝐻2
• 𝐶𝐻4 + 𝐶𝑂2 → 2 𝐶𝑂 + 2 𝐻2
• 2 𝑁𝐻3 → 3 𝐻2 + 𝑁2
Equation 21: Tar, methane and ammonia conversion
Hydrogen sulfide removal
After the gas is purified from tars, methane and ammonia the gas leaving the reactor must be
cooled down. This is done by a heat exchanger (E-3) which was mentioned in the previous
section. The raw gas feed cools down the hot gas from the reactor until it reaches 650-760°C.32
The removal of hydrogen sulfide takes place in a fixed bed reactor(1.V-2a/b) at approximately
10 bar. The real pressure may be lower due to pressure drop in the pipelines, however pressure
does not have a big effect on reaction efficiency. The bed consists of zinc titanate (zinc titanium
oxide). Zinc titanates are able to decrease the H2S concentration to less than 10 ppm. The TiOx
group protects the Zn ions from reduction by H2 and CO. This allows Zinc titanates to work at
higher temperatures than ZnO.32
The fixed bed reactor operates in three stages. The first stage is the absorption of H2S see
Equation 22. This will convert ZnO to ZnS. When there is no more ZnO left, then H2S cannot
be absorbed anymore. The feed gas will then go to the second reactor. Meanwhile the first
reactor is in the regeneration stage. The first reactor is closed off from the feed gas while
oxygen is provided for regenerating ZnS back to ZnO, see Equation 22. After all ZnO is
regenerated the reactor will be in stage 3. The reactor will then be flushed with nitrogen to
remove all the oxygen from the reactor. Oxygen is not a desirable compound to have in the gas
stream, because Clostridium Ljungdahli is not very resistant to oxygen. In addition to oxygen
SO2 will also be purged. To safely dispose the purged gas mixture SO2 has to be neutralized.
The purged gas will go to a vessel (1.V-5) where sulfuric acid is formed from SO2, O2 and
39
cooling water from a later step. Simultaneously the mixture is neutralized with a 1M NaOH
solution(1.T-2, 1.P-3a/b).
• 𝑍𝑛𝑂 + 𝐻2𝑆 → 𝑍𝑛𝑆 + 𝐻2𝑂
• 2 𝑍𝑛𝑆 + 3 𝑂2 → 2 𝑍𝑛𝑂 + 2 𝑆𝑂2
Equation 22: Hydrogen sulfide absorption and zinc oxide regeneration
NO and SO2 removal
The removal of NO and SO2 takes place in a CSTR (1.V-3). The operating conditions are 35-
50°C and 1 bar.33 The gas outlet from the fixed bed reactors is cooled down in a heat exchanger
(1.E-2) by the gas after compression. SO2 and NO2 are by themselves not soluble in water. To
remove these compounds a conversion must take place to make them soluble. Dissolving NO
and SO2 is possible by absorption in a KMnO4 and NaOH solution. KMnO4 will react with SO2
forming SOx ions, while NaOH will react with NO forming NOx ions. These are not the only
products, some side products will also be formed, see Equation 23.33
• 𝑁𝑂 + 𝑀𝑛𝑂4− + 2 𝑂𝐻− → 𝑁𝑂2− + 𝑀𝑛𝑂4
2− + 𝐻2𝑂
• 𝑁𝑂2− + 2 𝑀𝑛𝑂4− + 2 𝑂𝐻− → 𝑁𝑂3
− + 2 𝑀𝑛𝑂42− + 𝐻2𝑂
• 3 𝑁𝑂2− + 2 𝑀𝑛𝑂4
− + 𝐻2𝑂 → 3 𝑁𝑂3− + 2 𝑀𝑛𝑂2 + 2 𝑂𝐻−
• 𝑁𝑂 + 𝑀𝑛𝑂4− → 𝑁𝑂3
− + 𝑀𝑛𝑂2
• 𝑆𝑂2 + 𝐻2𝑂 → 2 𝐻+ + 𝑆𝑂32−
• 𝐻+ + 𝑂𝐻− → 𝐻2𝑂
• 2 𝑀𝑛𝑂4− + 𝑆𝑂3
2− + 2 𝑂𝐻− → 2 𝑀𝑛𝑂42− + 𝑆𝑂4
2− + 𝐻2𝑂
Equation 23: NO and SO2 conversion and side reactions
A disadvantage of this technique is that recycling the whole waste stream is not an option due
to the conversion of NO and SO2 to NO3- and SO4
2-. The high concentration of OH- and MnO4-
coming in reduces the regeneration of NO2 and SO2. Regeneration is possible by reducing the
inlet flow of OH- and MnO4-. This shifts the equilibrium more to the left, regenerating OH- and
MnO4-. If the concentration of OH- and MnO4
- becomes too low, then the fraction of solution
must be purged, while more OH- and MnO4- are pumped in the reactor.
40
Nitrogen removal
The final step in the process is the removal of nitrogen. This removal is done by nitrogen
membrane filters. There are three requirements for successful removal of nitrogen by
membrane filters. The first is the inlet pressure. There needs to be a specific inlet pressure to
push the gas through the membrane filter. The next requirement is the inlet temperature. The
membrane filter is not tolerable to all temperatures, due to the membrane material. The last
requirement is that no water droplets must be present in the gas. Water droplets may block the
membrane and cause failure.
First the gas is compressed to the desired inlet pressure of 10 bar (1.K-2). Compression will
increase the temperature of the gas significantly. A logical next step is cooling the gas in a heat
exchanger with water (1.E-5). The cooling water leaving the heat exchanger is used in the SO2
neutralization step, mentioned in the “Hydrogen sulfide removal” section. The heat exchanger
may form water condensate in the gas. Water droplet may also be already present in the gas
from the CSTR. Finally the water droplet are removed by a demister (1.S-2). The gas will go
through the filter, while the water droplet are blocked and dropped down. Now the gas is ready
to pass through the membrane filters and remove nitrogen. A fraction of the removed nitrogen
is stored in a vessel (1.V-4) at 20 bar. The stored nitrogen is used when the plant shuts down
when there is no more nitrogen inflow. To maintain this pressure a small compressor
compresses a fraction of the nitrogen coming in. This storage will supply the plant’s nitrogen
needs, e.g. flushing the fixed bed reactors.
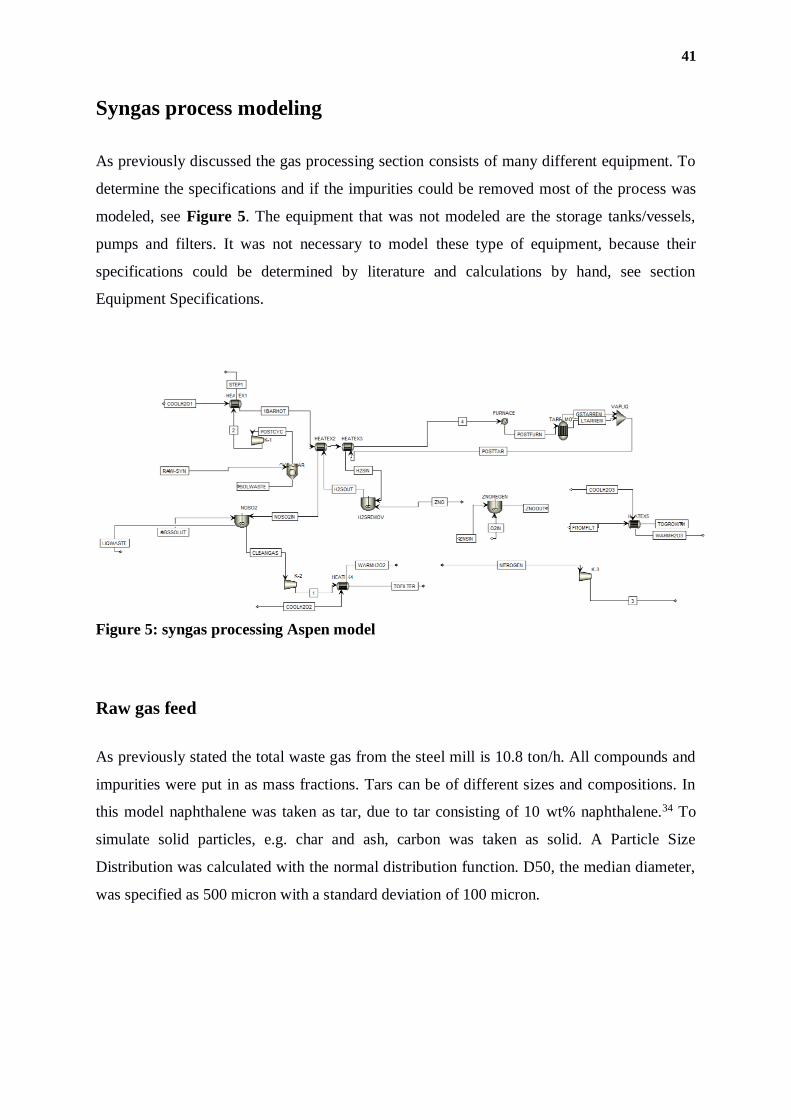
41
Syngas process modeling
As previously discussed the gas processing section consists of many different equipment. To
determine the specifications and if the impurities could be removed most of the process was
modeled, see Figure 5. The equipment that was not modeled are the storage tanks/vessels,
pumps and filters. It was not necessary to model these type of equipment, because their
specifications could be determined by literature and calculations by hand, see section
Equipment Specifications.
Raw gas feed
As previously stated the total waste gas from the steel mill is 10.8 ton/h. All compounds and
impurities were put in as mass fractions. Tars can be of different sizes and compositions. In
this model naphthalene was taken as tar, due to tar consisting of 10 wt% naphthalene.34 To
simulate solid particles, e.g. char and ash, carbon was taken as solid. A Particle Size
Distribution was calculated with the normal distribution function. D50, the median diameter,
was specified as 500 micron with a standard deviation of 100 micron.
Figure 5: syngas processing Aspen model
42
Cyclone
The cyclone was modeled using the Leith-Licht calculation method with type Stairmand-HT.
The Leith-Licht calculation method describes particle motion in the entry and the collection
regions using an equation of particle motion. It makes several assumptions for simplifying the
equations of particle motion
• Gas path lines are taken as circles in the vortex.
• The angular velocities are everywhere equal giving rise to a radial slip.
• The radial slip gives rise to a radial drag force, acting towards the axis.
• The radial acceleration of a particle is negligible, thus making the drag force equal to
the mass of the particle times its centripetal acceleration.
The radial migration velocity of a particle is described by the following equation.
𝑑𝑅
𝑑𝑡=
𝑑𝑝2𝜌𝑝
18𝜇 𝑢𝑡2
2 𝑅22𝑛
𝑅2𝑛+1
Where the particle of diameter 𝑑𝑝 and density 𝜌𝜌 in question is at radius R after spending time
t within the cyclone.35
According to the simulation the amount of solid in the gas stream had no influence on the
efficiency. Choosing the Stairmand-HT type the efficiency remains constant at 99.5%. If the
number of cyclones simulated in parallel is decreased, then the inlet gas velocity would exceed
the correlation velocity limit resulting in an error. This is a logical error, because a parallel
setup will spread the gas flow over more cyclones resulting in a lower flow rate and inlet
velocity per cyclone. It was found that the simulation worked perfectly by specifying 500
Figure 6: Solid carbon mass fraction plot
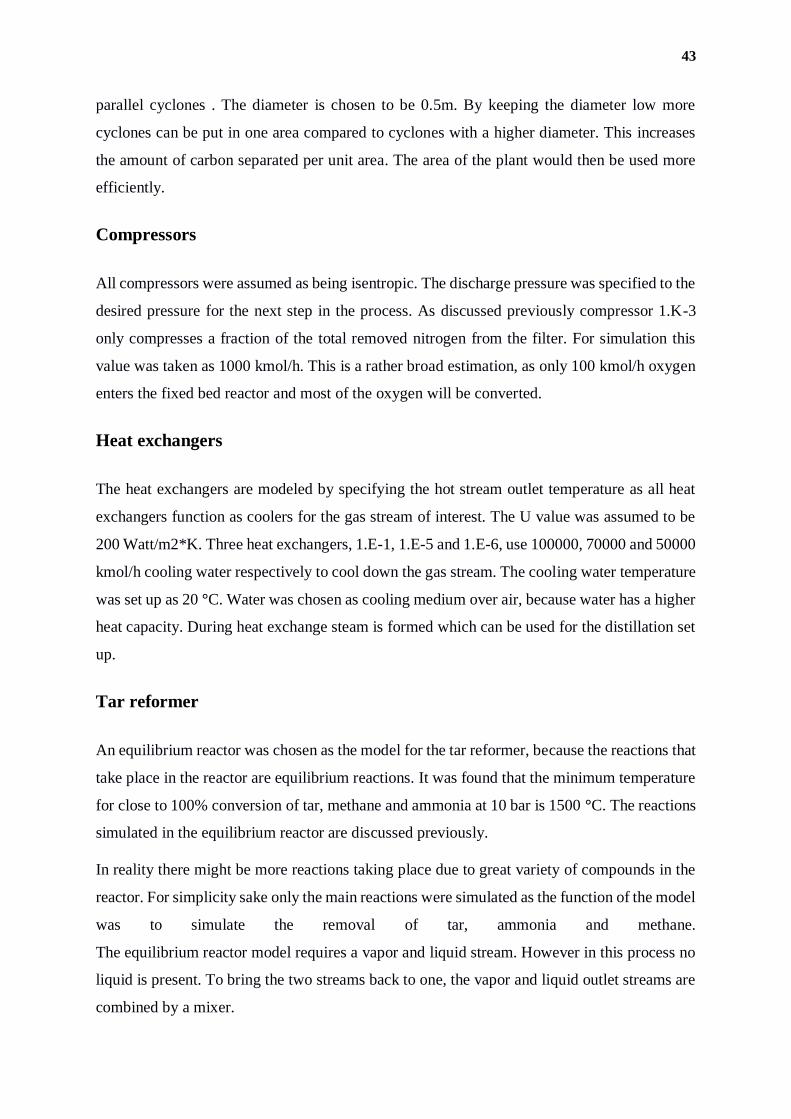
43
parallel cyclones . The diameter is chosen to be 0.5m. By keeping the diameter low more
cyclones can be put in one area compared to cyclones with a higher diameter. This increases
the amount of carbon separated per unit area. The area of the plant would then be used more
efficiently.
Compressors
All compressors were assumed as being isentropic. The discharge pressure was specified to the
desired pressure for the next step in the process. As discussed previously compressor 1.K-3
only compresses a fraction of the total removed nitrogen from the filter. For simulation this
value was taken as 1000 kmol/h. This is a rather broad estimation, as only 100 kmol/h oxygen
enters the fixed bed reactor and most of the oxygen will be converted.
Heat exchangers
The heat exchangers are modeled by specifying the hot stream outlet temperature as all heat
exchangers function as coolers for the gas stream of interest. The U value was assumed to be
200 Watt/m2*K. Three heat exchangers, 1.E-1, 1.E-5 and 1.E-6, use 100000, 70000 and 50000
kmol/h cooling water respectively to cool down the gas stream. The cooling water temperature
was set up as 20 °C. Water was chosen as cooling medium over air, because water has a higher
heat capacity. During heat exchange steam is formed which can be used for the distillation set
up.
Tar reformer
An equilibrium reactor was chosen as the model for the tar reformer, because the reactions that
take place in the reactor are equilibrium reactions. It was found that the minimum temperature
for close to 100% conversion of tar, methane and ammonia at 10 bar is 1500 °C. The reactions
simulated in the equilibrium reactor are discussed previously.
In reality there might be more reactions taking place due to great variety of compounds in the
reactor. For simplicity sake only the main reactions were simulated as the function of the model
was to simulate the removal of tar, ammonia and methane.
The equilibrium reactor model requires a vapor and liquid stream. However in this process no
liquid is present. To bring the two streams back to one, the vapor and liquid outlet streams are
combined by a mixer.
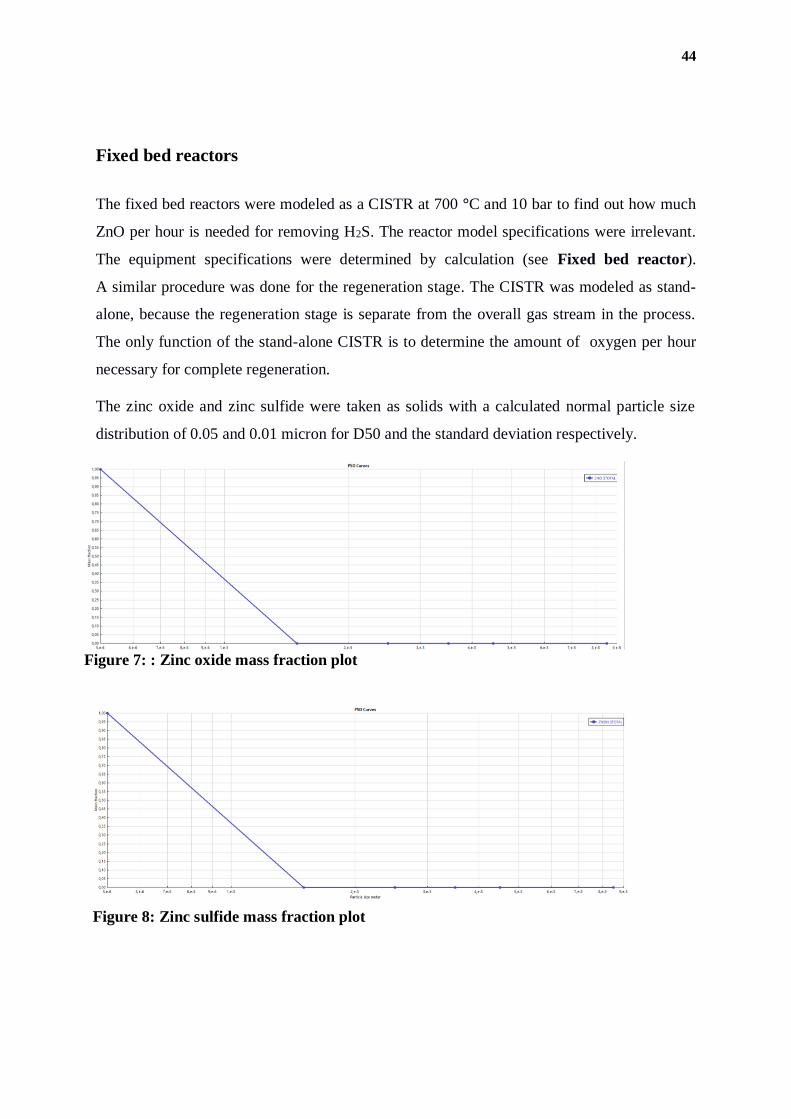
44
Fixed bed reactors
The fixed bed reactors were modeled as a CISTR at 700 °C and 10 bar to find out how much
ZnO per hour is needed for removing H2S. The reactor model specifications were irrelevant.
The equipment specifications were determined by calculation (see Fixed bed reactor).
A similar procedure was done for the regeneration stage. The CISTR was modeled as stand-
alone, because the regeneration stage is separate from the overall gas stream in the process.
The only function of the stand-alone CISTR is to determine the amount of oxygen per hour
necessary for complete regeneration.
The zinc oxide and zinc sulfide were taken as solids with a calculated normal particle size
distribution of 0.05 and 0.01 micron for D50 and the standard deviation respectively.
Figure 7: : Zinc oxide mass fraction plot
Figure 8: Zinc sulfide mass fraction plot
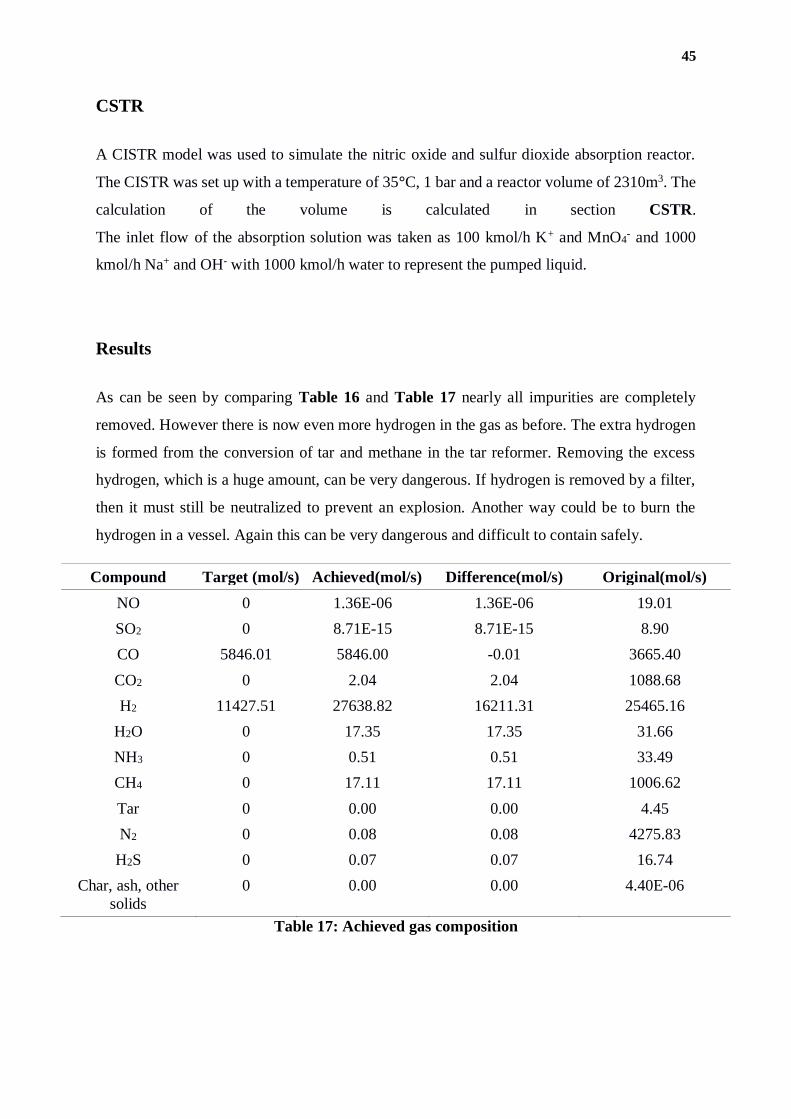
45
CSTR
A CISTR model was used to simulate the nitric oxide and sulfur dioxide absorption reactor.
The CISTR was set up with a temperature of 35°C, 1 bar and a reactor volume of 2310m3. The
calculation of the volume is calculated in section CSTR.
The inlet flow of the absorption solution was taken as 100 kmol/h K+ and MnO4- and 1000
kmol/h Na+ and OH- with 1000 kmol/h water to represent the pumped liquid.
Results
As can be seen by comparing Table 16 and Table 17 nearly all impurities are completely
removed. However there is now even more hydrogen in the gas as before. The extra hydrogen
is formed from the conversion of tar and methane in the tar reformer. Removing the excess
hydrogen, which is a huge amount, can be very dangerous. If hydrogen is removed by a filter,
then it must still be neutralized to prevent an explosion. Another way could be to burn the
hydrogen in a vessel. Again this can be very dangerous and difficult to contain safely.
Compound Target (mol/s) Achieved(mol/s) Difference(mol/s) Original(mol/s)
NO 0 1.36E-06 1.36E-06 19.01
SO2 0 8.71E-15 8.71E-15 8.90
CO 5846.01 5846.00 -0.01 3665.40
CO2 0 2.04 2.04 1088.68
H2 11427.51 27638.82 16211.31 25465.16
H2O 0 17.35 17.35 31.66
NH3 0 0.51 0.51 33.49
CH4 0 17.11 17.11 1006.62
Tar 0 0.00 0.00 4.45
N2 0 0.08 0.08 4275.83
H2S 0 0.07 0.07 16.74
Char, ash, other
solids
0 0.00 0.00 4.40E-06
Table 17: Achieved gas composition
46
Reactor Model
As previously explained, the reactor section of the process designed consisted of two primary
reactors, reminiscent of a two-stage continuous process of the pilot scale plant, of which the
design was scaled up from, and which procedure has been explained thoroughly in preceding
sections. In addition to the scale-up calculations showed to have been modeled in a Microsoft
Excel spreadsheet, the two reactors, consisted of a growth/acidogenesis reactor (R1) and a
production/solventogenesis reactor (R2), were also modeled in Aspen Plus V.8.6 to further
confirm the validity of the scale-up.
Through the upcoming sections, the modeling process and results for both R1 and R2 are
elaborated on. It should be noted that all simulations pertaining to both reactors performed
using the NRTL-RK method. Furthermore, since both reactors were modeled using the RStoic
block, a fractional conversion of a reference reactant is required for each of the reaction to
quantify the extent of reaction/conversion of the feed and also the reaction selectivity. The
fractional conversion, by definition, can be written as the expression shown in Equation 24.
The specific fractional conversion for each of the reactions in Equation 3 - Equation 6 for
each of the reactors will be calculated and elaborated further within their subsequent sections.
Equation 24
Growth/acidogenesis reactor (R1)
The first stage, in accordance to that of the pilot plant, aims to reach a product ratio of 13:1
acetate-to-ethanol ratio. As shown in Table 18, the fractional conversion values for each of the
reactions were calculated based on the amount of mole flow being converted and the total
amount of mole flow in the feed, both of which were obtained from the previously explained
absorption factor productivity scale-up, and the gas inflow splitting, respectively. The
fractional conversion was calculated for a given reference component, for each reaction, which
in this case is either CO or CO2 based. It should be noted that the fractional conversion can be
seen to reflect a selectivity ratio of 11.5:1 acetate-to-ethanol, and not 13:1, which is tied to the
inherent absorption factor of each of the gases in the process itself. In other words, to achieve
an outlet product ratio of 13:1 acetate-to-ethanol, a selectivity ratio of 11.5:1 is a requirement.
Fractional conversion of A=𝑚𝑜𝑙 𝑜𝑓 𝐴 𝑐𝑜𝑛𝑣𝑒𝑟𝑡𝑒𝑑 𝑏𝑦 𝑡ℎ𝑒 𝑟𝑒𝑎𝑐𝑡𝑖𝑜𝑛
𝑡𝑜𝑡𝑎𝑙 𝑚𝑜𝑙 𝑜𝑓 𝐴 𝑝𝑟𝑒𝑠𝑒𝑛𝑡 𝑖𝑛 𝑡ℎ𝑒 𝑓𝑒𝑒𝑑
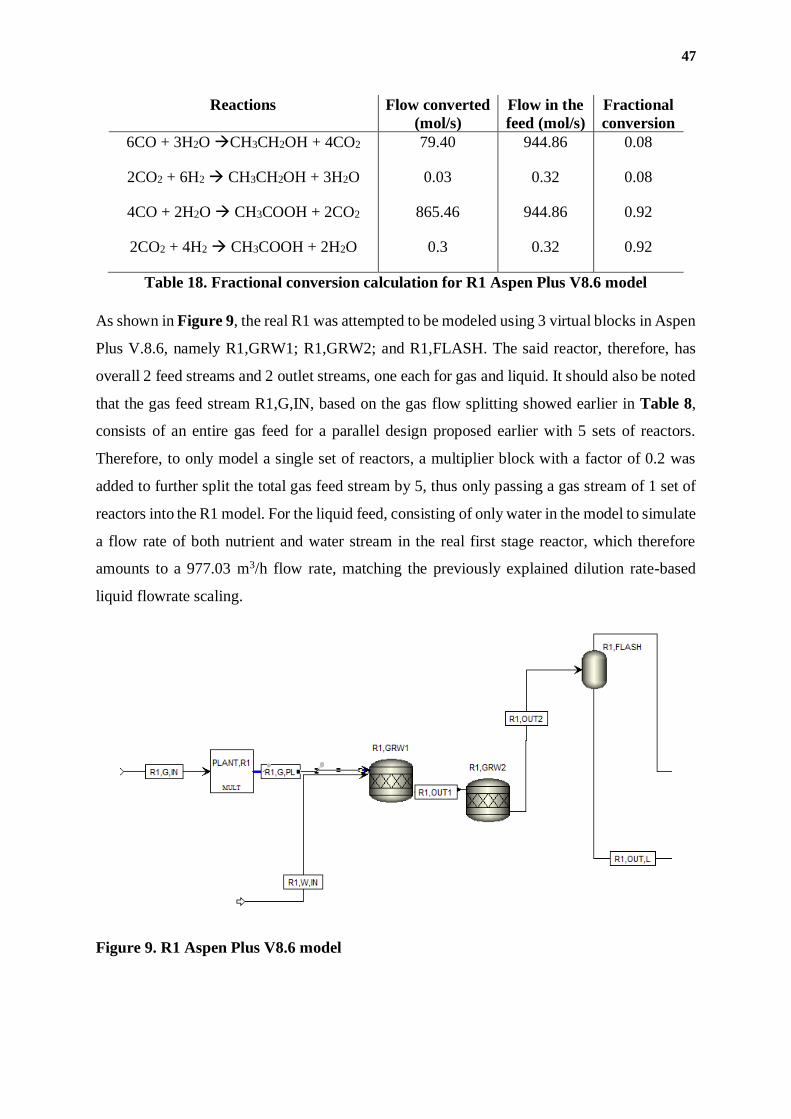
47
Reactions Flow converted
(mol/s)
Flow in the
feed (mol/s)
Fractional
conversion
6CO + 3H2O →CH3CH2OH + 4CO2 79.40 944.86 0.08
2CO2 + 6H2 → CH3CH2OH + 3H2O 0.03 0.32 0.08
4CO + 2H2O → CH3COOH + 2CO2 865.46 944.86 0.92
2CO2 + 4H2 → CH3COOH + 2H2O 0.3 0.32 0.92
Table 18. Fractional conversion calculation for R1 Aspen Plus V8.6 model
As shown in Figure 9, the real R1 was attempted to be modeled using 3 virtual blocks in Aspen
Plus V.8.6, namely R1,GRW1; R1,GRW2; and R1,FLASH. The said reactor, therefore, has
overall 2 feed streams and 2 outlet streams, one each for gas and liquid. It should also be noted
that the gas feed stream R1,G,IN, based on the gas flow splitting showed earlier in Table 8,
consists of an entire gas feed for a parallel design proposed earlier with 5 sets of reactors.
Therefore, to only model a single set of reactors, a multiplier block with a factor of 0.2 was
added to further split the total gas feed stream by 5, thus only passing a gas stream of 1 set of
reactors into the R1 model. For the liquid feed, consisting of only water in the model to simulate
a flow rate of both nutrient and water stream in the real first stage reactor, which therefore
amounts to a 977.03 m3/h flow rate, matching the previously explained dilution rate-based
liquid flowrate scaling.
Figure 9. R1 Aspen Plus V8.6 model
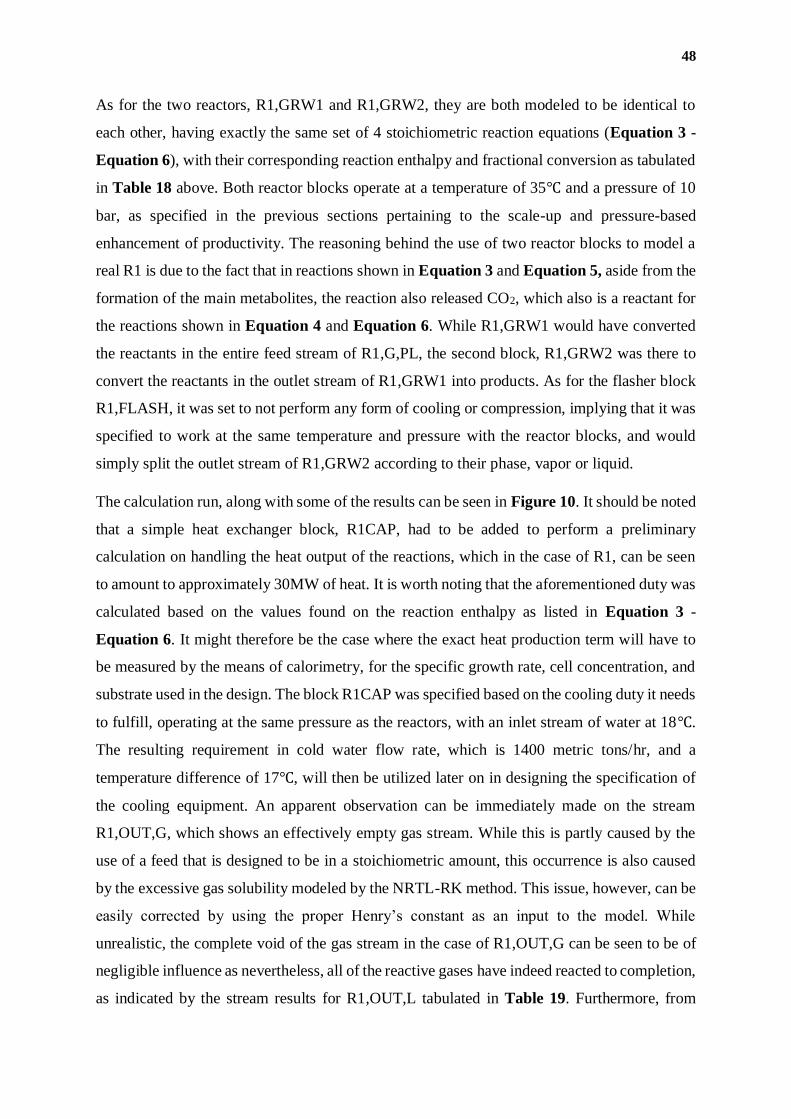
48
As for the two reactors, R1,GRW1 and R1,GRW2, they are both modeled to be identical to
each other, having exactly the same set of 4 stoichiometric reaction equations (Equation 3 -
Equation 6), with their corresponding reaction enthalpy and fractional conversion as tabulated
in Table 18 above. Both reactor blocks operate at a temperature of 35℃ and a pressure of 10
bar, as specified in the previous sections pertaining to the scale-up and pressure-based
enhancement of productivity. The reasoning behind the use of two reactor blocks to model a
real R1 is due to the fact that in reactions shown in Equation 3 and Equation 5, aside from the
formation of the main metabolites, the reaction also released CO2, which also is a reactant for
the reactions shown in Equation 4 and Equation 6. While R1,GRW1 would have converted
the reactants in the entire feed stream of R1,G,PL, the second block, R1,GRW2 was there to
convert the reactants in the outlet stream of R1,GRW1 into products. As for the flasher block
R1,FLASH, it was set to not perform any form of cooling or compression, implying that it was
specified to work at the same temperature and pressure with the reactor blocks, and would
simply split the outlet stream of R1,GRW2 according to their phase, vapor or liquid.
The calculation run, along with some of the results can be seen in Figure 10. It should be noted
that a simple heat exchanger block, R1CAP, had to be added to perform a preliminary
calculation on handling the heat output of the reactions, which in the case of R1, can be seen
to amount to approximately 30MW of heat. It is worth noting that the aforementioned duty was
calculated based on the values found on the reaction enthalpy as listed in Equation 3 -
Equation 6. It might therefore be the case where the exact heat production term will have to
be measured by the means of calorimetry, for the specific growth rate, cell concentration, and
substrate used in the design. The block R1CAP was specified based on the cooling duty it needs
to fulfill, operating at the same pressure as the reactors, with an inlet stream of water at 18℃.
The resulting requirement in cold water flow rate, which is 1400 metric tons/hr, and a
temperature difference of 17℃, will then be utilized later on in designing the specification of
the cooling equipment. An apparent observation can be immediately made on the stream
R1,OUT,G, which shows an effectively empty gas stream. While this is partly caused by the
use of a feed that is designed to be in a stoichiometric amount, this occurrence is also caused
by the excessive gas solubility modeled by the NRTL-RK method. This issue, however, can be
easily corrected by using the proper Henry’s constant as an input to the model. While
unrealistic, the complete void of the gas stream in the case of R1,OUT,G can be seen to be of
negligible influence as nevertheless, all of the reactive gases have indeed reacted to completion,
as indicated by the stream results for R1,OUT,L tabulated in Table 19. Furthermore, from
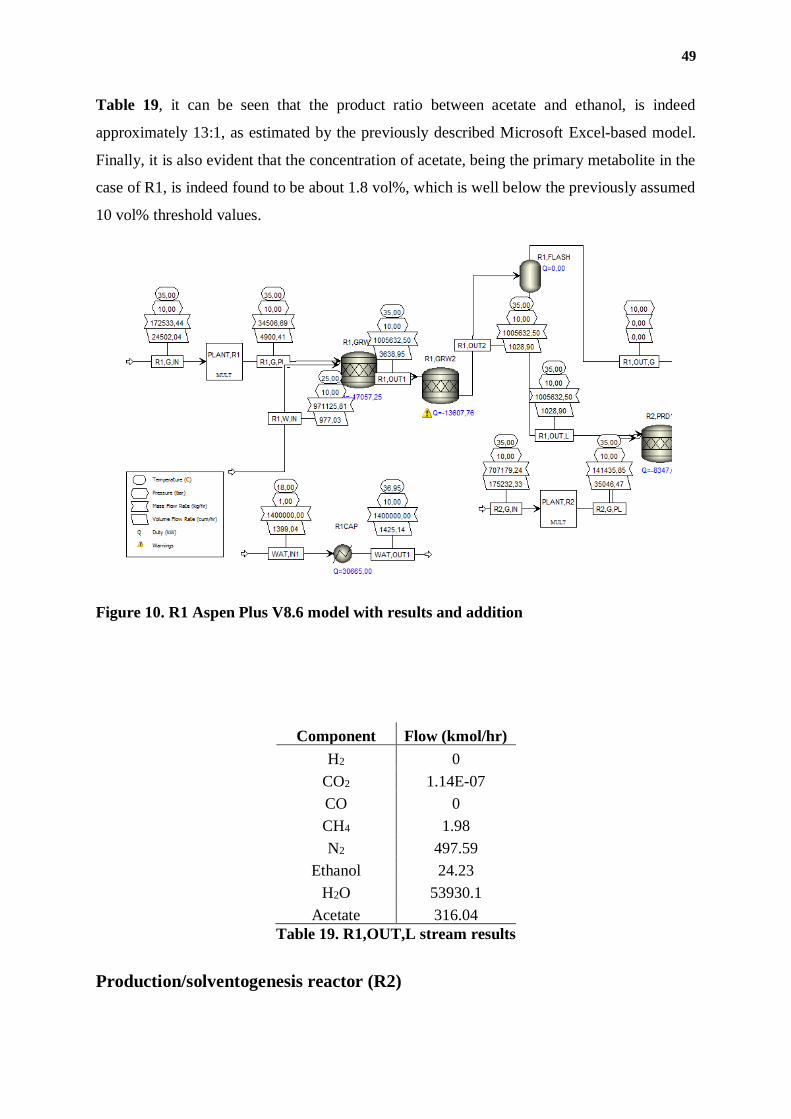
49
Table 19, it can be seen that the product ratio between acetate and ethanol, is indeed
approximately 13:1, as estimated by the previously described Microsoft Excel-based model.
Finally, it is also evident that the concentration of acetate, being the primary metabolite in the
case of R1, is indeed found to be about 1.8 vol%, which is well below the previously assumed
10 vol% threshold values.
Figure 10. R1 Aspen Plus V8.6 model with results and addition
Component Flow (kmol/hr)
H2 0
CO2 1.14E-07
CO 0
CH4 1.98
N2 497.59
Ethanol 24.23
H2O 53930.1
Acetate 316.04
Table 19. R1,OUT,L stream results
Production/solventogenesis reactor (R2)
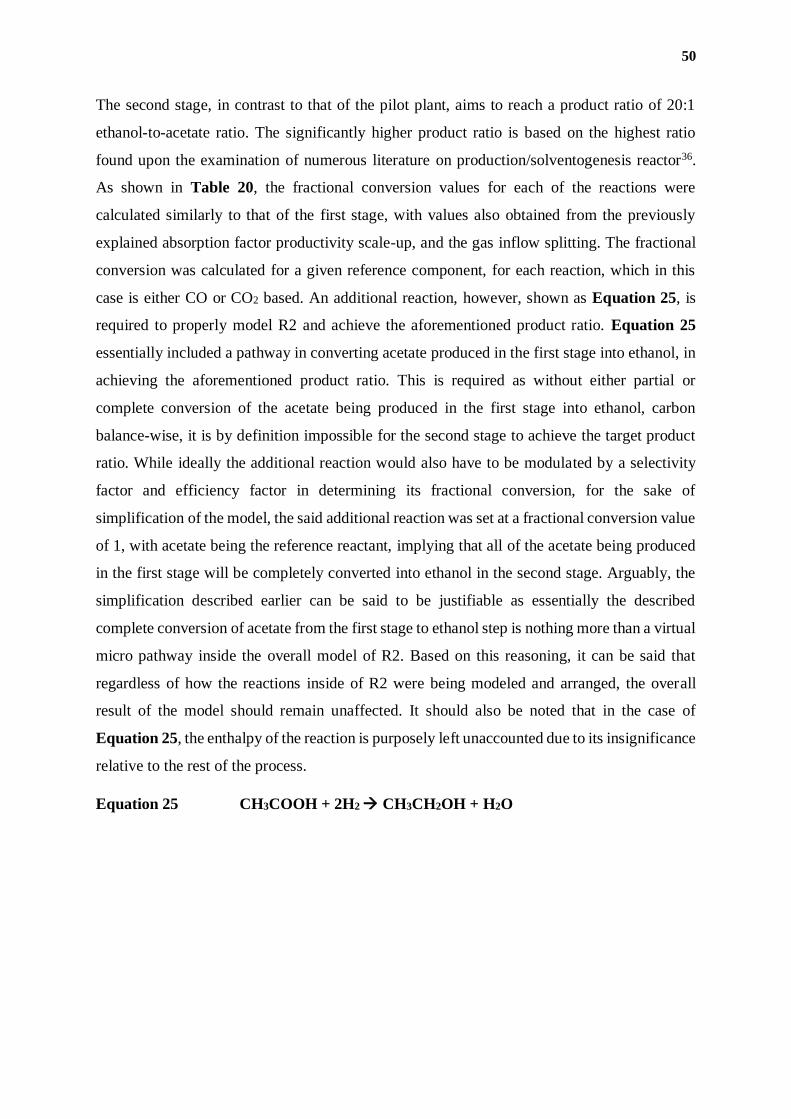
50
The second stage, in contrast to that of the pilot plant, aims to reach a product ratio of 20:1
ethanol-to-acetate ratio. The significantly higher product ratio is based on the highest ratio
found upon the examination of numerous literature on production/solventogenesis reactor36.
As shown in Table 20, the fractional conversion values for each of the reactions were
calculated similarly to that of the first stage, with values also obtained from the previously
explained absorption factor productivity scale-up, and the gas inflow splitting. The fractional
conversion was calculated for a given reference component, for each reaction, which in this
case is either CO or CO2 based. An additional reaction, however, shown as Equation 25, is
required to properly model R2 and achieve the aforementioned product ratio. Equation 25
essentially included a pathway in converting acetate produced in the first stage into ethanol, in
achieving the aforementioned product ratio. This is required as without either partial or
complete conversion of the acetate being produced in the first stage into ethanol, carbon
balance-wise, it is by definition impossible for the second stage to achieve the target product
ratio. While ideally the additional reaction would also have to be modulated by a selectivity
factor and efficiency factor in determining its fractional conversion, for the sake of
simplification of the model, the said additional reaction was set at a fractional conversion value
of 1, with acetate being the reference reactant, implying that all of the acetate being produced
in the first stage will be completely converted into ethanol in the second stage. Arguably, the
simplification described earlier can be said to be justifiable as essentially the described
complete conversion of acetate from the first stage to ethanol step is nothing more than a virtual
micro pathway inside the overall model of R2. Based on this reasoning, it can be said that
regardless of how the reactions inside of R2 were being modeled and arranged, the overall
result of the model should remain unaffected. It should also be noted that in the case of
Equation 25, the enthalpy of the reaction is purposely left unaccounted due to its insignificance
relative to the rest of the process.
Equation 25 CH3COOH + 2H2 → CH3CH2OH + H2O
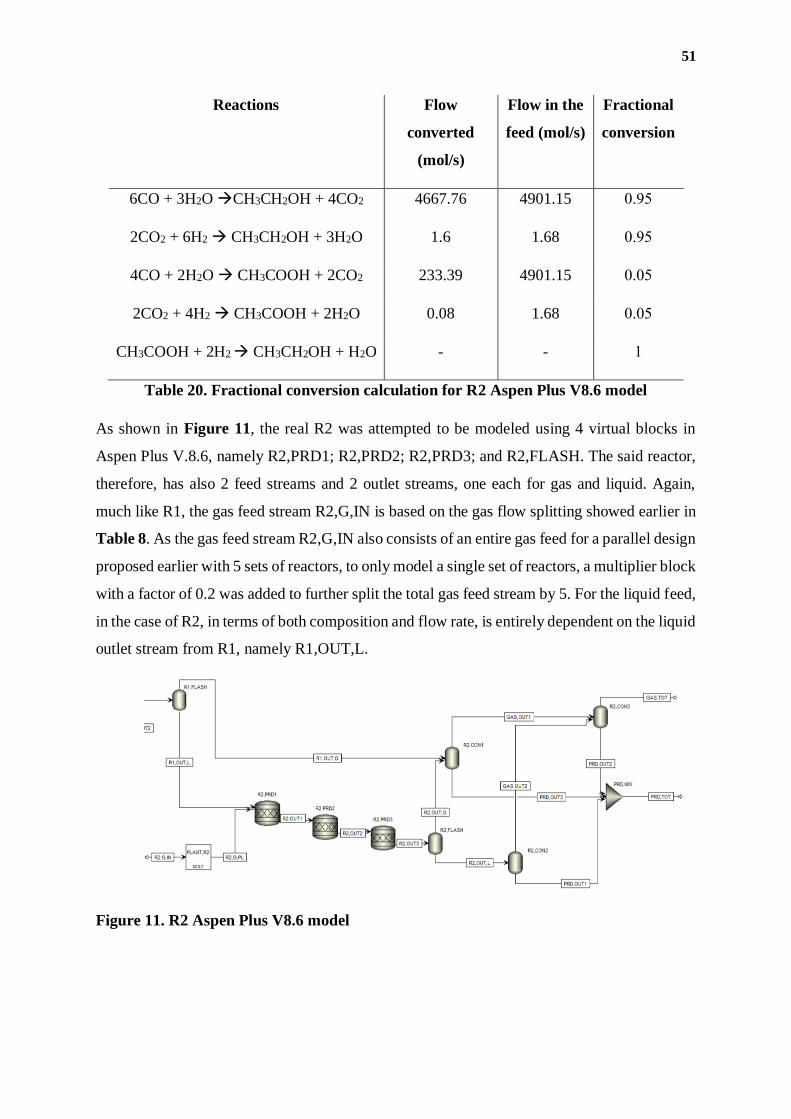
51
Reactions Flow
converted
(mol/s)
Flow in the
feed (mol/s)
Fractional
conversion
6CO + 3H2O →CH3CH2OH + 4CO2 4667.76 4901.15 0.95
2CO2 + 6H2 → CH3CH2OH + 3H2O 1.6 1.68 0.95
4CO + 2H2O → CH3COOH + 2CO2 233.39 4901.15 0.05
2CO2 + 4H2 → CH3COOH + 2H2O 0.08 1.68 0.05
CH3COOH + 2H2 → CH3CH2OH + H2O - - 1
Table 20. Fractional conversion calculation for R2 Aspen Plus V8.6 model
As shown in Figure 11, the real R2 was attempted to be modeled using 4 virtual blocks in
Aspen Plus V.8.6, namely R2,PRD1; R2,PRD2; R2,PRD3; and R2,FLASH. The said reactor,
therefore, has also 2 feed streams and 2 outlet streams, one each for gas and liquid. Again,
much like R1, the gas feed stream R2,G,IN is based on the gas flow splitting showed earlier in
Table 8. As the gas feed stream R2,G,IN also consists of an entire gas feed for a parallel design
proposed earlier with 5 sets of reactors, to only model a single set of reactors, a multiplier block
with a factor of 0.2 was added to further split the total gas feed stream by 5. For the liquid feed,
in the case of R2, in terms of both composition and flow rate, is entirely dependent on the liquid
outlet stream from R1, namely R1,OUT,L.
Figure 11. R2 Aspen Plus V8.6 model
52
For the three reactors blocks, the last two blocks, R2,PRD2 and R2,PRD3, much like the two
reactor blocks in R1, and also for the same reasoning, are both modeled to be identical to each
other, having exactly the same set of 4 stoichiometric reaction equations (Equation 3 -
Equation 6), along with their corresponding reaction enthalpy and fractional conversion shown
in Table 20. Both reactor blocks also operate at a temperature of 35℃ and a pressure of 10 bar.
As for the additional reactor block, R2,PRD1, it is modeled with only one stoichiometric
reaction equation, that is Equation 25, using a fractional conversion of 1 for the reasoning
explained earlier, simply to achieve the conversion of all acetate contained in the R1,OUT,L
stream into ethanol before the 2 following reactor blocks, R2,PRD2 and R2,PRD3, convert the
gases into the desired products. The flasher block R2,FLASH, also works in the same way as
it was in R1 since it was set to perform nothing but splitting the outlet stream of R2,PRD3
based on them being of liquid or vapor.
Additionally, a number of flasher blocks were also added to the model, namely the blocks
R2,CON1; R2,CON2; and R2,CON3. The flashers R2,CON1 and R2,CON2 are both mainly
serves to depressurize the fluid, gas in the case of R2,CON1, and liquid in the case of R2,CON2,
from 10 bar of operating pressure to atmospheric pressure of 1 bar. On top of that, the flasher
R2,CON1, which takes the gas outlet stream of both reactor models, R1,OUT,G and
R2,OUT,G, also act as a slight condenser as it was set to operate at a temperature of 20℃,
lower than the 35℃ temperature of the gas outlets. As for the flasher R2,CON3, it serves a
purpose mainly as a condenser since it was set to operate at 10℃, to now condense as many of
the primary products, which are ethanol and acetate, along with some water vapor, out of the
now atmospheric gas stream from R2,CON1.
The calculation run, along with some of the results can be seen in Figure 12. It should be noted
that, again, similar to that of R2, a simple heat exchanger block, R2CAP, had to be added to
perform a preliminary calculation on the handling of the heat output of the reactions, which in
the case of R2, amounted to approximately 400MW of heat. It is also worth noting that the
aforementioned duty was calculated based on the same values found on the reaction enthalpy
as listed in Equation 3 - Equation 6. Since R2 operates at a significantly different condition
with respect to R1, it only make sense for the exact heat production term to be re-measured by
the means of calorimetry, for the specific growth rate, cell concentration, and substrate used
pertaining to R2. Much like R1, the block R2CAP was specified based on the aforementioned
cooling duty it needs to fulfill, operating also at the same pressure as the reactors, with an inlet
stream of water at 18℃. The resulting requirement in cold water flow rate of 18000 metric
53
tons/hr and the temperature difference of 17℃ will then be utilized later on in the specification
of the cooling equipment for the reactor.
While the R2 model also suffers from the same issue as R1, which is caused by the excessive
gas solubility modeled by the NRTL-RK method, both the reactor gas outlet stream,
R2,OUT,G, and the total gas outlet stream GAS,TOT, can be seen to not be completely void
of material. The exact composition for both of the aforementioned gas streams can be found
tabulated in Table 21. It is important to note that by looking at the composition of the gas
streams, almost all of the primary products were able to be recovered into the liquid phase for
further processing. This then raises a point of concern on whether or not any of the condenser
blocks were worth adding at all, considering the very minute amount of product it will be able
to recover. The design kept the condenser blocks while keeping in mind that the very well
recovered products might have also been an effect of the same issue with using NRTL-RK
without properly changing the Henry’s constant. Furthermore, it can also be seen that almost
all of the reactive gases have indeed reacted to completion, with the exception of a small
amount (~1.58 mol% of the feed R2,G,PL) of excess H2 leftover. Lastly, it is worth mentioning
that since the design for the reactors specifically assumes an inflow composition relatively
early in the design process, the gas, unlike that of the processed gas from the syngas processing
section, is not completely void of N2.
As for the liquid streams, namely R2,OUT,L, and the total liquid outlet stream PRD,TOT, both
can be seen to also contain virtually none of the reactive gases left. Furthermore, from Table
21, it can be seen that the product ratio between ethanol and acetate, is indeed approximately
20:1, as estimated by the previously described Microsoft Excel-based model. Finally, it is also
evident that the concentration of ethanol, being the primary metabolite in the case of R2, is
indeed found to be about 12 vol%, which while higher, is still fairly close to the assumed 10
vol% threshold value. It is also worth noting that while in the present model, the concentration
of almost all of the components in the two liquid streams R2,OUT,L and PRD,TOT can be seen
to be practically identical, this could also be an implication of the uncorrected Henry’s constant
for the NRTL-RK method. Fixing the said parameter could potentially increase the quantity of
the products in the gaseous streams, implying that the effect of having a condenser might
prevail more relative to the current reported model.
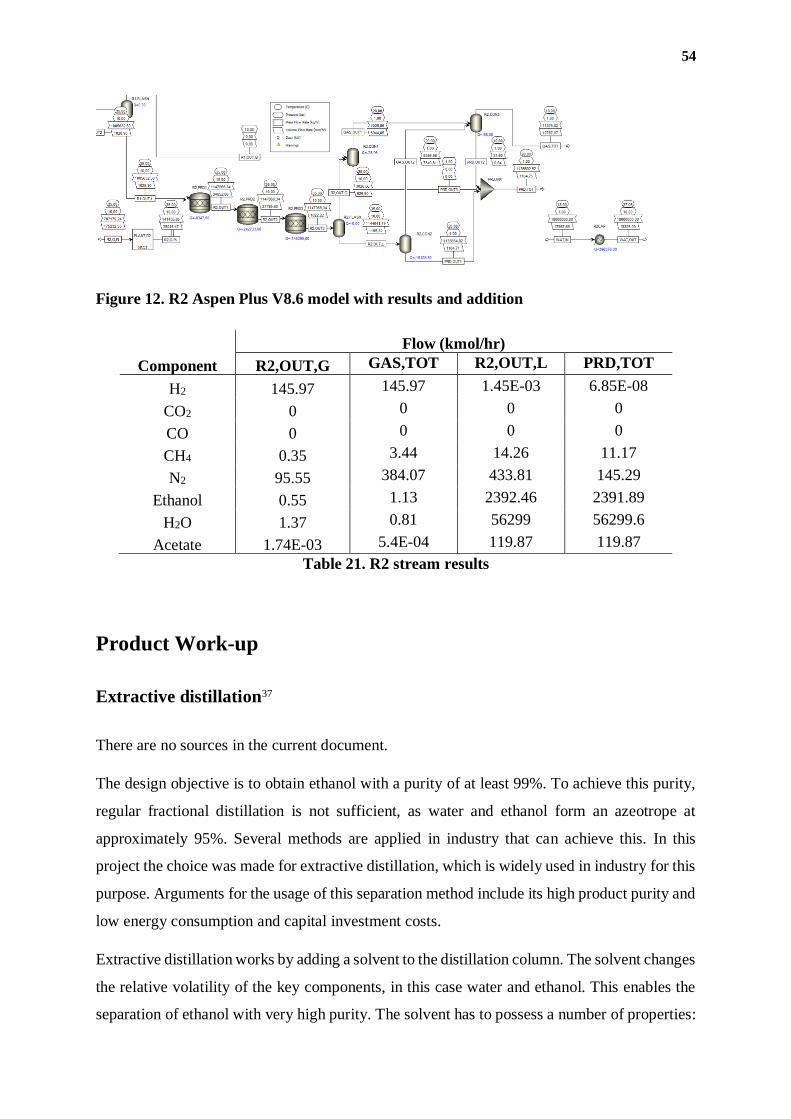
54
Figure 12. R2 Aspen Plus V8.6 model with results and addition
Component
Flow (kmol/hr)
R2,OUT,G GAS,TOT R2,OUT,L PRD,TOT
H2 145.97 145.97 1.45E-03 6.85E-08
CO2 0 0 0 0
CO 0 0 0 0
CH4 0.35 3.44 14.26 11.17
N2 95.55 384.07 433.81 145.29
Ethanol 0.55 1.13 2392.46 2391.89
H2O 1.37 0.81 56299 56299.6
Acetate 1.74E-03 5.4E-04 119.87 119.87
Table 21. R2 stream results
Product Work-up
Extractive distillation37
There are no sources in the current document.
The design objective is to obtain ethanol with a purity of at least 99%. To achieve this purity,
regular fractional distillation is not sufficient, as water and ethanol form an azeotrope at
approximately 95%. Several methods are applied in industry that can achieve this. In this
project the choice was made for extractive distillation, which is widely used in industry for this
purpose. Arguments for the usage of this separation method include its high product purity and
low energy consumption and capital investment costs.
Extractive distillation works by adding a solvent to the distillation column. The solvent changes
the relative volatility of the key components, in this case water and ethanol. This enables the
separation of ethanol with very high purity. The solvent has to possess a number of properties:
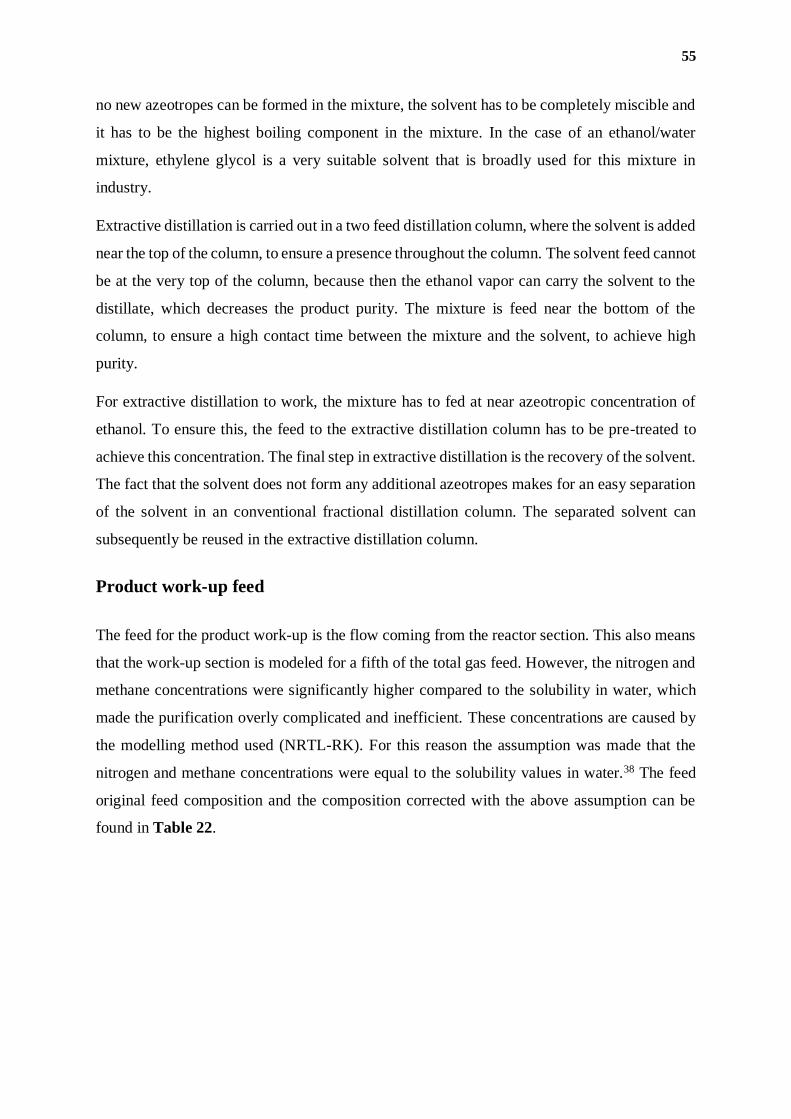
55
no new azeotropes can be formed in the mixture, the solvent has to be completely miscible and
it has to be the highest boiling component in the mixture. In the case of an ethanol/water
mixture, ethylene glycol is a very suitable solvent that is broadly used for this mixture in
industry.
Extractive distillation is carried out in a two feed distillation column, where the solvent is added
near the top of the column, to ensure a presence throughout the column. The solvent feed cannot
be at the very top of the column, because then the ethanol vapor can carry the solvent to the
distillate, which decreases the product purity. The mixture is feed near the bottom of the
column, to ensure a high contact time between the mixture and the solvent, to achieve high
purity.
For extractive distillation to work, the mixture has to fed at near azeotropic concentration of
ethanol. To ensure this, the feed to the extractive distillation column has to be pre-treated to
achieve this concentration. The final step in extractive distillation is the recovery of the solvent.
The fact that the solvent does not form any additional azeotropes makes for an easy separation
of the solvent in an conventional fractional distillation column. The separated solvent can
subsequently be reused in the extractive distillation column.
Product work-up feed
The feed for the product work-up is the flow coming from the reactor section. This also means
that the work-up section is modeled for a fifth of the total gas feed. However, the nitrogen and
methane concentrations were significantly higher compared to the solubility in water, which
made the purification overly complicated and inefficient. These concentrations are caused by
the modelling method used (NRTL-RK). For this reason the assumption was made that the
nitrogen and methane concentrations were equal to the solubility values in water.38 The feed
original feed composition and the composition corrected with the above assumption can be
found in Table 22.
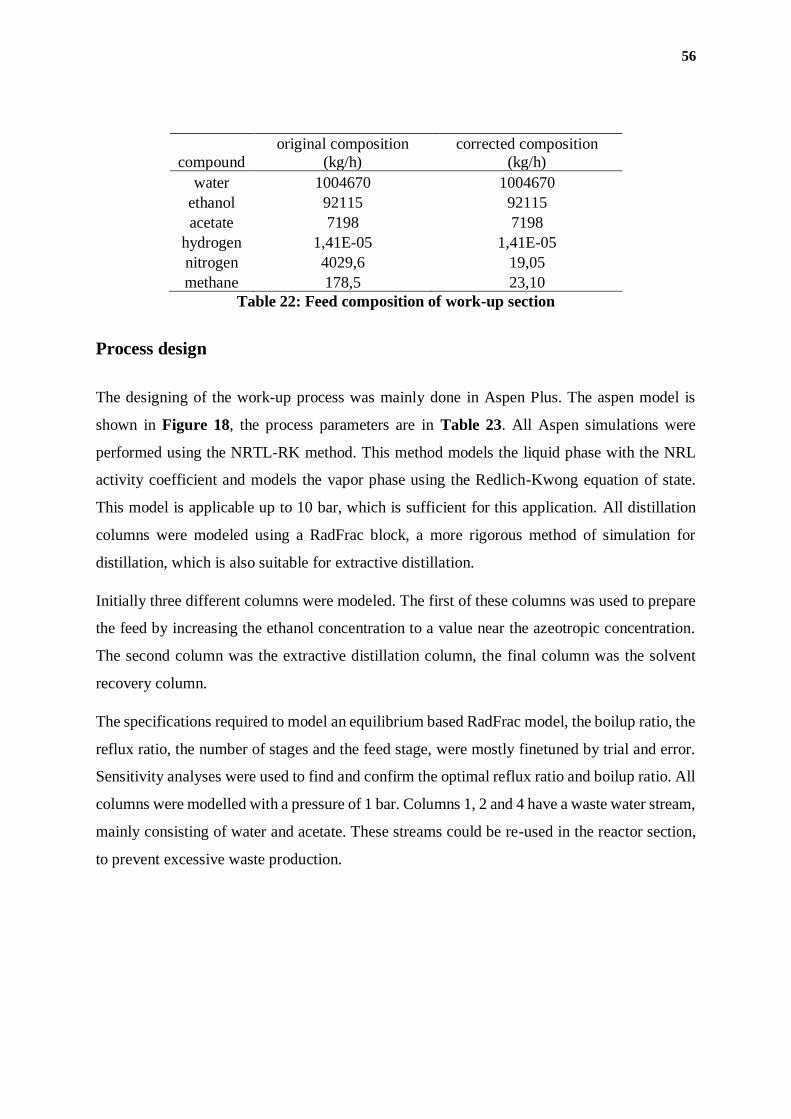
56
compound
original composition
(kg/h)
corrected composition
(kg/h)
water 1004670 1004670
ethanol 92115 92115
acetate 7198 7198
hydrogen 1,41E-05 1,41E-05
nitrogen 4029,6 19,05
methane 178,5 23,10
Table 22: Feed composition of work-up section
Process design
The designing of the work-up process was mainly done in Aspen Plus. The aspen model is
shown in Figure 18, the process parameters are in Table 23. All Aspen simulations were
performed using the NRTL-RK method. This method models the liquid phase with the NRL
activity coefficient and models the vapor phase using the Redlich-Kwong equation of state.
This model is applicable up to 10 bar, which is sufficient for this application. All distillation
columns were modeled using a RadFrac block, a more rigorous method of simulation for
distillation, which is also suitable for extractive distillation.
Initially three different columns were modeled. The first of these columns was used to prepare
the feed by increasing the ethanol concentration to a value near the azeotropic concentration.
The second column was the extractive distillation column, the final column was the solvent
recovery column.
The specifications required to model an equilibrium based RadFrac model, the boilup ratio, the
reflux ratio, the number of stages and the feed stage, were mostly finetuned by trial and error.
Sensitivity analyses were used to find and confirm the optimal reflux ratio and boilup ratio. All
columns were modelled with a pressure of 1 bar. Columns 1, 2 and 4 have a waste water stream,
mainly consisting of water and acetate. These streams could be re-used in the reactor section,
to prevent excessive waste production.
57
Feed preparation
It soon became clear that it was hard to make an efficient model for the preparation of the initial
feed using just one column. The reason for this was the large difference in the feed
concentration of ethanol compared to the concentration required for the extractive distillation.
To accommodate for this, the preparation of the feed was modelled by two columns in series.
Column 1 (4.C-1)
The first column was used mainly to decrease the flow rate of the mixture to the second column,
where the ethanol concentration was brought to near azeotropic conditions. This meant the
energy consumption of the first column could be kept low, the reflux ratio and the boilup ratio
were 1 and 0.5 respectively. The boilup ratio was found from the sensitivity analysis shown in
Figure 13, at a ratio of 0.5 the ethanol fraction in the distillate is high enough for the second
column, while keeping the loss of product in the bottoms as low as possible. The number of
plates was set at ten, with the feed coming in at stage 8. Column 1 reduced the water and acetate
content of the stream by approximately 85% and increased the ethanol weight fraction from
0.08 to 0.40. The model parameters were chosen to keep the ethanol lost in the bottoms.
To accommodate for the non-condensable gasses still present in the stream, mainly nitrogen
and methane, a vent was installed on the reflux drum, which vented 0.1% of the distillate to the
gas disposal system.
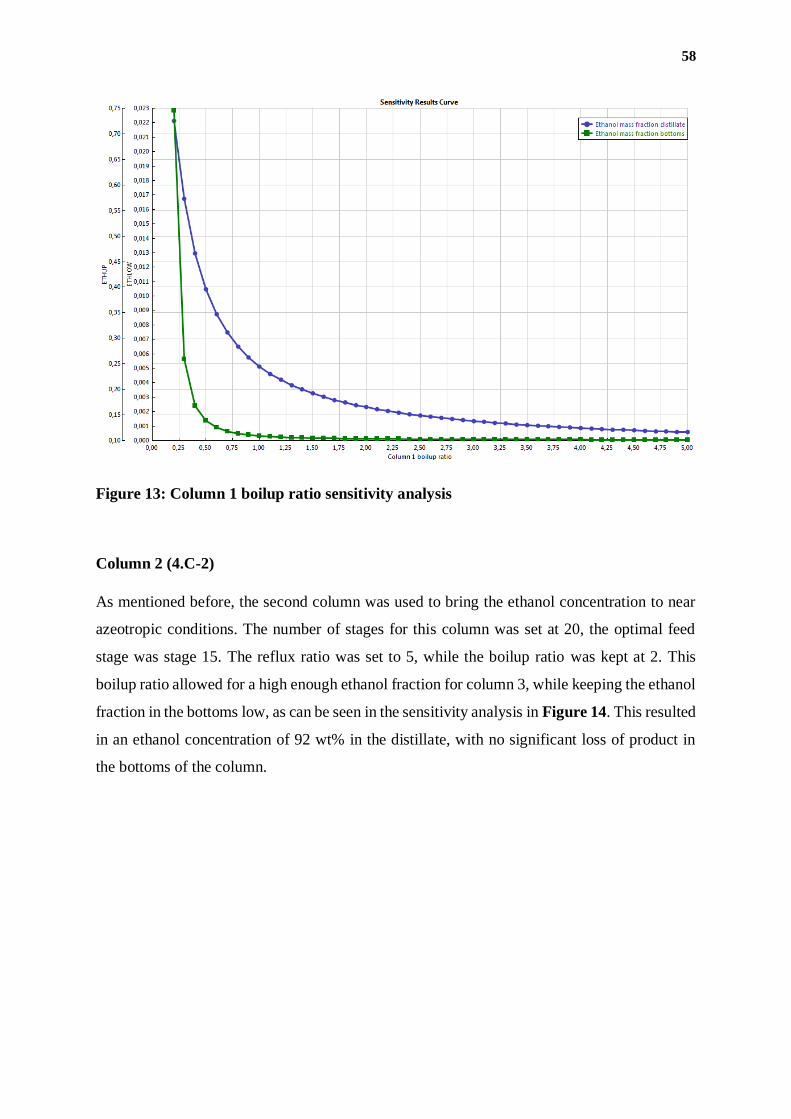
58
Figure 13: Column 1 boilup ratio sensitivity analysis
Column 2 (4.C-2)
As mentioned before, the second column was used to bring the ethanol concentration to near
azeotropic conditions. The number of stages for this column was set at 20, the optimal feed
stage was stage 15. The reflux ratio was set to 5, while the boilup ratio was kept at 2. This
boilup ratio allowed for a high enough ethanol fraction for column 3, while keeping the ethanol
fraction in the bottoms low, as can be seen in the sensitivity analysis in Figure 14. This resulted
in an ethanol concentration of 92 wt% in the distillate, with no significant loss of product in
the bottoms of the column.
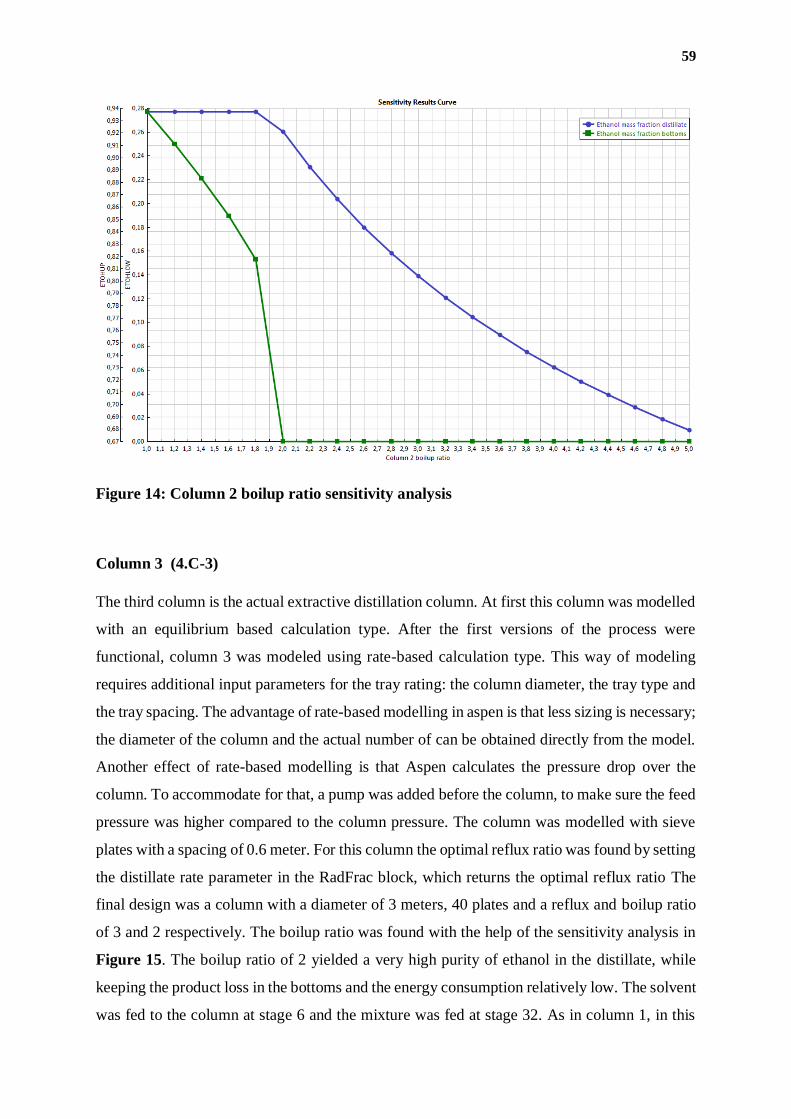
59
Figure 14: Column 2 boilup ratio sensitivity analysis
Column 3 (4.C-3)
The third column is the actual extractive distillation column. At first this column was modelled
with an equilibrium based calculation type. After the first versions of the process were
functional, column 3 was modeled using rate-based calculation type. This way of modeling
requires additional input parameters for the tray rating: the column diameter, the tray type and
the tray spacing. The advantage of rate-based modelling in aspen is that less sizing is necessary;
the diameter of the column and the actual number of can be obtained directly from the model.
Another effect of rate-based modelling is that Aspen calculates the pressure drop over the
column. To accommodate for that, a pump was added before the column, to make sure the feed
pressure was higher compared to the column pressure. The column was modelled with sieve
plates with a spacing of 0.6 meter. For this column the optimal reflux ratio was found by setting
the distillate rate parameter in the RadFrac block, which returns the optimal reflux ratio The
final design was a column with a diameter of 3 meters, 40 plates and a reflux and boilup ratio
of 3 and 2 respectively. The boilup ratio was found with the help of the sensitivity analysis in
Figure 15. The boilup ratio of 2 yielded a very high purity of ethanol in the distillate, while
keeping the product loss in the bottoms and the energy consumption relatively low. The solvent
was fed to the column at stage 6 and the mixture was fed at stage 32. As in column 1, in this
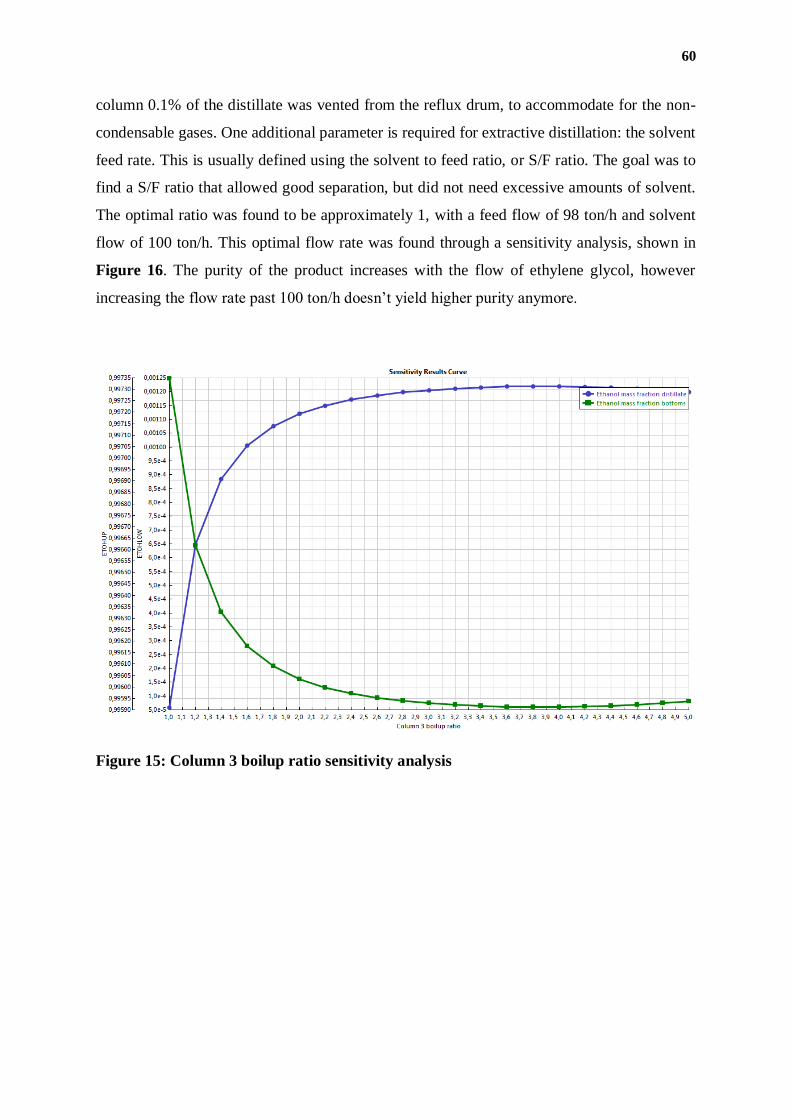
60
column 0.1% of the distillate was vented from the reflux drum, to accommodate for the non-
condensable gases. One additional parameter is required for extractive distillation: the solvent
feed rate. This is usually defined using the solvent to feed ratio, or S/F ratio. The goal was to
find a S/F ratio that allowed good separation, but did not need excessive amounts of solvent.
The optimal ratio was found to be approximately 1, with a feed flow of 98 ton/h and solvent
flow of 100 ton/h. This optimal flow rate was found through a sensitivity analysis, shown in
Figure 16. The purity of the product increases with the flow of ethylene glycol, however
increasing the flow rate past 100 ton/h doesn’t yield higher purity anymore.
Figure 15: Column 3 boilup ratio sensitivity analysis
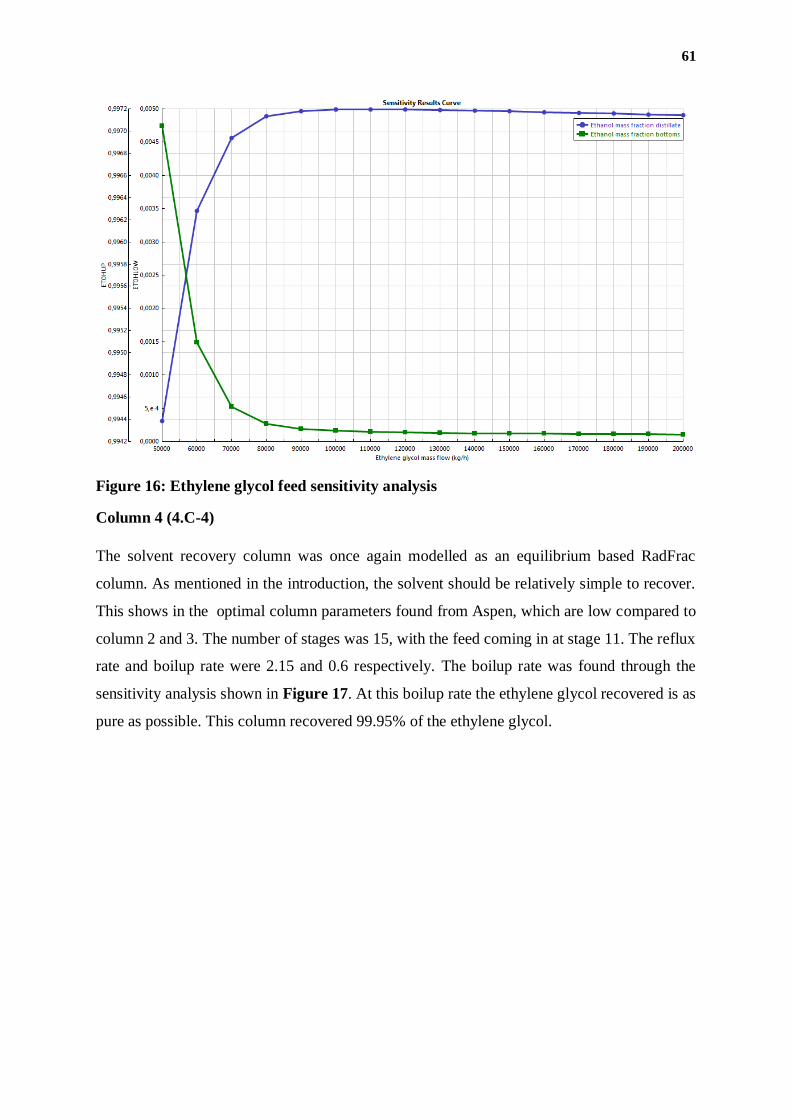
61
Figure 16: Ethylene glycol feed sensitivity analysis
Column 4 (4.C-4)
The solvent recovery column was once again modelled as an equilibrium based RadFrac
column. As mentioned in the introduction, the solvent should be relatively simple to recover.
This shows in the optimal column parameters found from Aspen, which are low compared to
column 2 and 3. The number of stages was 15, with the feed coming in at stage 11. The reflux
rate and boilup rate were 2.15 and 0.6 respectively. The boilup rate was found through the
sensitivity analysis shown in Figure 17. At this boilup rate the ethylene glycol recovered is as
pure as possible. This column recovered 99.95% of the ethylene glycol.
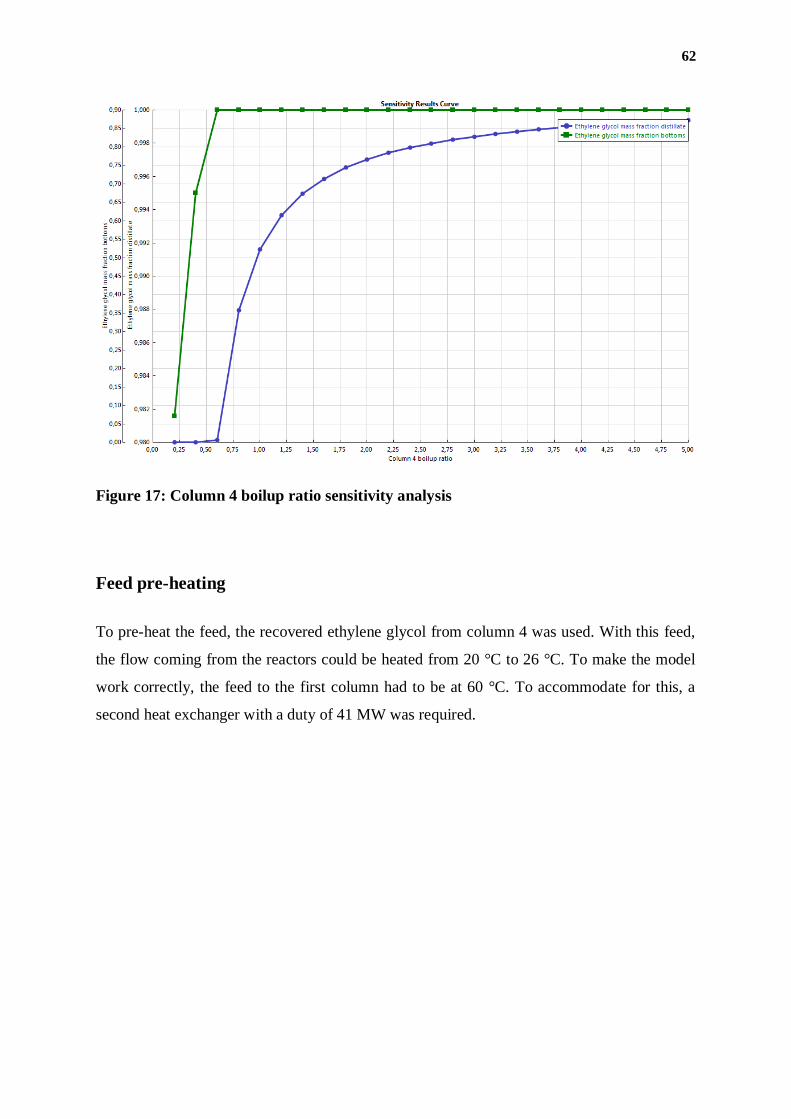
62
Figure 17: Column 4 boilup ratio sensitivity analysis
Feed pre-heating
To pre-heat the feed, the recovered ethylene glycol from column 4 was used. With this feed,
the flow coming from the reactors could be heated from 20 °C to 26 °C. To make the model
work correctly, the feed to the first column had to be at 60 °C. To accommodate for this, a
second heat exchanger with a duty of 41 MW was required.
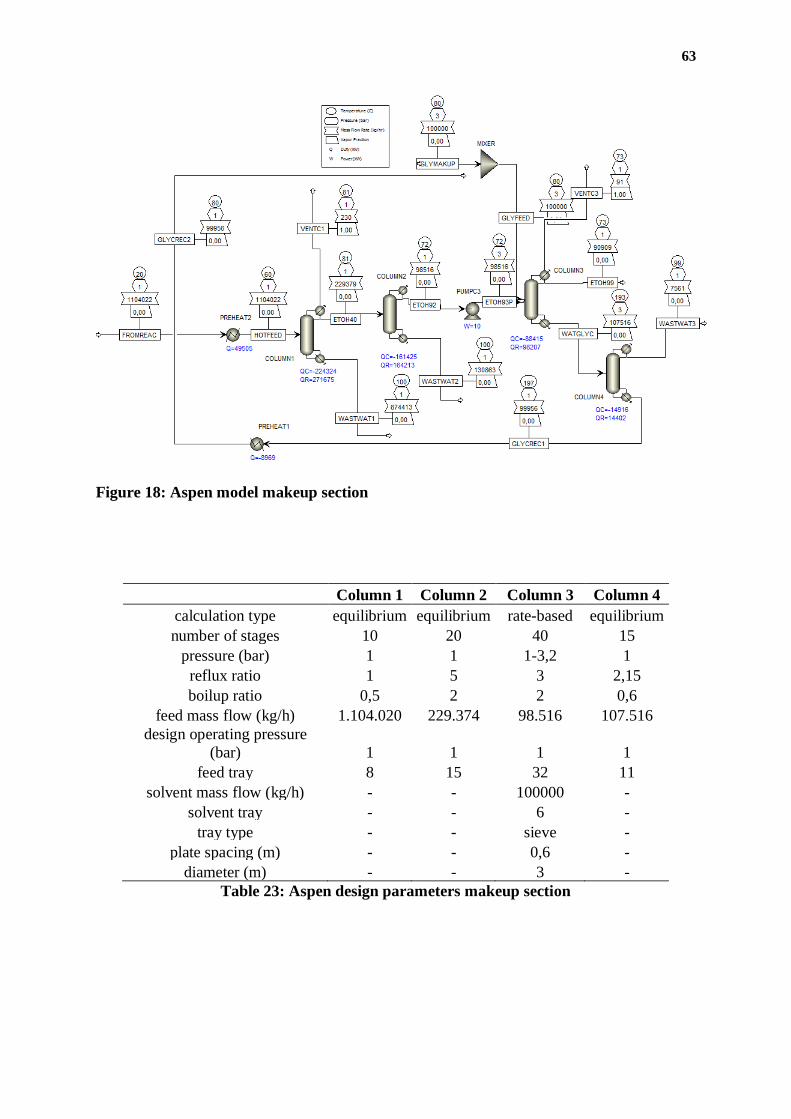
63
Figure 18: Aspen model makeup section
Column 1 Column 2 Column 3 Column 4
calculation type equilibrium equilibrium rate-based equilibrium
number of stages 10 20 40 15
pressure (bar) 1 1 1-3,2 1
reflux ratio 1 5 3 2,15
boilup ratio 0,5 2 2 0,6
feed mass flow (kg/h) 1.104.020 229.374 98.516 107.516
design operating pressure
(bar) 1 1 1 1
feed tray 8 15 32 11
solvent mass flow (kg/h) - - 100000 -
solvent tray - - 6 -
tray type - - sieve -
plate spacing (m) - - 0,6 -
diameter (m) - - 3 -
Table 23: Aspen design parameters makeup section

64
Chapter III - CONTROL AND
INSTRUMENTATION
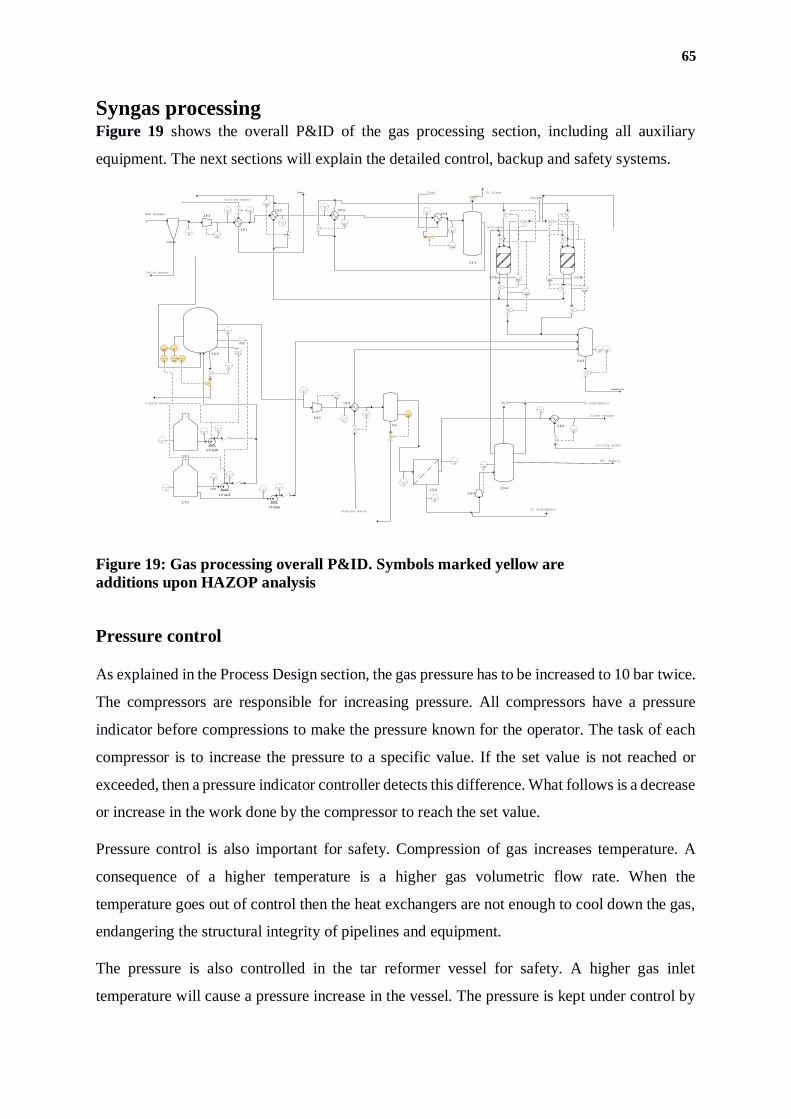
65
Syngas processing Figure 19 shows the overall P&ID of the gas processing section, including all auxiliary
equipment. The next sections will explain the detailed control, backup and safety systems.
1.E-2 1.E-3
1.V-1
1.V-2a 1.V-2b
1.V-3
S-2
1.S-1a
Raw syngas
Solid waste
1.S-4 1.V-4
N2 supply
1.T-1
1.T-2
1.P-2a/b
1.P-1a/b
TIC
TI
TI
TI
TIC
AIS1 AIS1
AIS2
AIS2
To flare
LT
LC
AIC2
LT
LAL LS
LI
LI
PI
PI
PI
To atmosphere
1.K-2
TIC
TAH
PIC
1.E-5
TI
TIC
1.E-4
Cooling water
PIPI
PIPI
Cooling water
TI
1.E-6
Cooling water
TI
TIC
Clean syngas
To atmosphere
1.K-3
PIC
LIC
Fuel
Oxygen
1.K-1
1.E-1
Steam
TIC
1.P-3a/b
PIPIP-346
1.V-5
Liquid waste
ASAT
PI
PICPI
Nitrogen
AIC1
Liquid waste
LAH
LS
Pressure control
As explained in the Process Design section, the gas pressure has to be increased to 10 bar twice.
The compressors are responsible for increasing pressure. All compressors have a pressure
indicator before compressions to make the pressure known for the operator. The task of each
compressor is to increase the pressure to a specific value. If the set value is not reached or
exceeded, then a pressure indicator controller detects this difference. What follows is a decrease
or increase in the work done by the compressor to reach the set value.
Pressure control is also important for safety. Compression of gas increases temperature. A
consequence of a higher temperature is a higher gas volumetric flow rate. When the
temperature goes out of control then the heat exchangers are not enough to cool down the gas,
endangering the structural integrity of pipelines and equipment.
The pressure is also controlled in the tar reformer vessel for safety. A higher gas inlet
temperature will cause a pressure increase in the vessel. The pressure is kept under control by
Figure 19: Gas processing overall P&ID. Symbols marked yellow are
additions upon HAZOP analysis
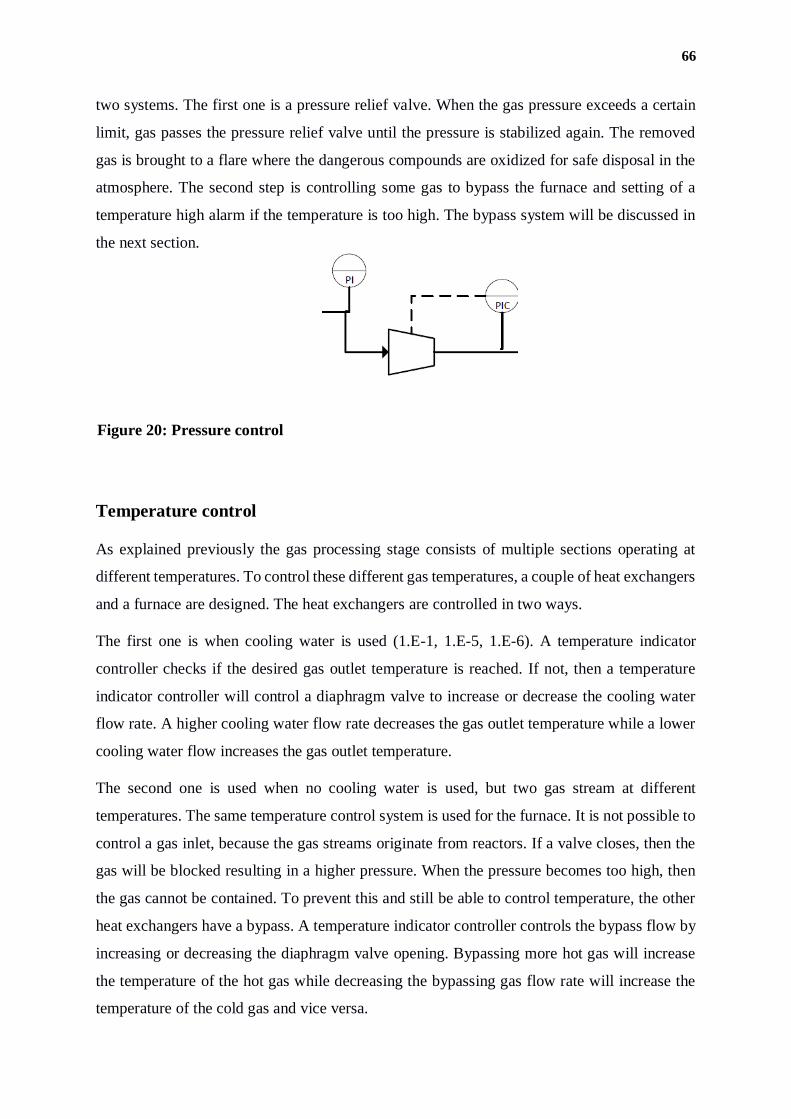
66
two systems. The first one is a pressure relief valve. When the gas pressure exceeds a certain
limit, gas passes the pressure relief valve until the pressure is stabilized again. The removed
gas is brought to a flare where the dangerous compounds are oxidized for safe disposal in the
atmosphere. The second step is controlling some gas to bypass the furnace and setting of a
temperature high alarm if the temperature is too high. The bypass system will be discussed in
the next section.
Temperature control
As explained previously the gas processing stage consists of multiple sections operating at
different temperatures. To control these different gas temperatures, a couple of heat exchangers
and a furnace are designed. The heat exchangers are controlled in two ways.
The first one is when cooling water is used (1.E-1, 1.E-5, 1.E-6). A temperature indicator
controller checks if the desired gas outlet temperature is reached. If not, then a temperature
indicator controller will control a diaphragm valve to increase or decrease the cooling water
flow rate. A higher cooling water flow rate decreases the gas outlet temperature while a lower
cooling water flow increases the gas outlet temperature.
The second one is used when no cooling water is used, but two gas stream at different
temperatures. The same temperature control system is used for the furnace. It is not possible to
control a gas inlet, because the gas streams originate from reactors. If a valve closes, then the
gas will be blocked resulting in a higher pressure. When the pressure becomes too high, then
the gas cannot be contained. To prevent this and still be able to control temperature, the other
heat exchangers have a bypass. A temperature indicator controller controls the bypass flow by
increasing or decreasing the diaphragm valve opening. Bypassing more hot gas will increase
the temperature of the hot gas while decreasing the bypassing gas flow rate will increase the
temperature of the cold gas and vice versa.
Figure 20: Pressure control
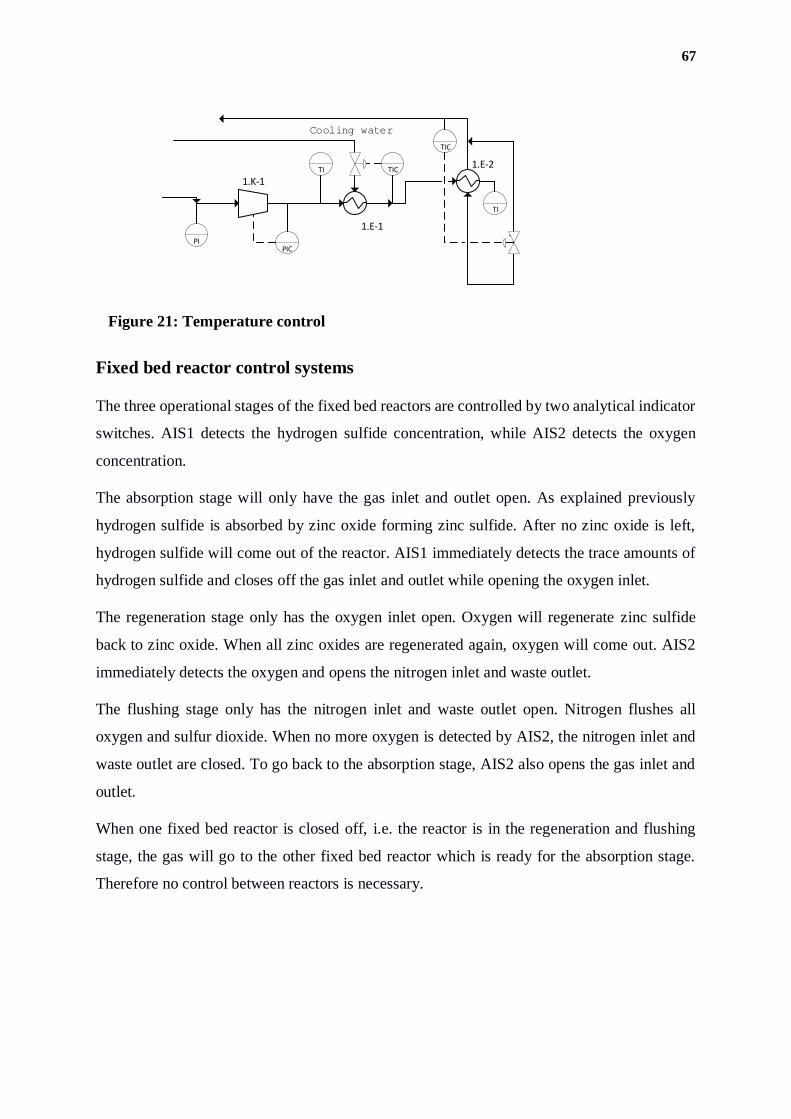
67
1.E-2
TIC
TI
TI
Cooling water
1.K-1
1.E-1
TIC
PICPI
Fixed bed reactor control systems
The three operational stages of the fixed bed reactors are controlled by two analytical indicator
switches. AIS1 detects the hydrogen sulfide concentration, while AIS2 detects the oxygen
concentration.
The absorption stage will only have the gas inlet and outlet open. As explained previously
hydrogen sulfide is absorbed by zinc oxide forming zinc sulfide. After no zinc oxide is left,
hydrogen sulfide will come out of the reactor. AIS1 immediately detects the trace amounts of
hydrogen sulfide and closes off the gas inlet and outlet while opening the oxygen inlet.
The regeneration stage only has the oxygen inlet open. Oxygen will regenerate zinc sulfide
back to zinc oxide. When all zinc oxides are regenerated again, oxygen will come out. AIS2
immediately detects the oxygen and opens the nitrogen inlet and waste outlet.
The flushing stage only has the nitrogen inlet and waste outlet open. Nitrogen flushes all
oxygen and sulfur dioxide. When no more oxygen is detected by AIS2, the nitrogen inlet and
waste outlet are closed. To go back to the absorption stage, AIS2 also opens the gas inlet and
outlet.
When one fixed bed reactor is closed off, i.e. the reactor is in the regeneration and flushing
stage, the gas will go to the other fixed bed reactor which is ready for the absorption stage.
Therefore no control between reactors is necessary.
Figure 21: Temperature control
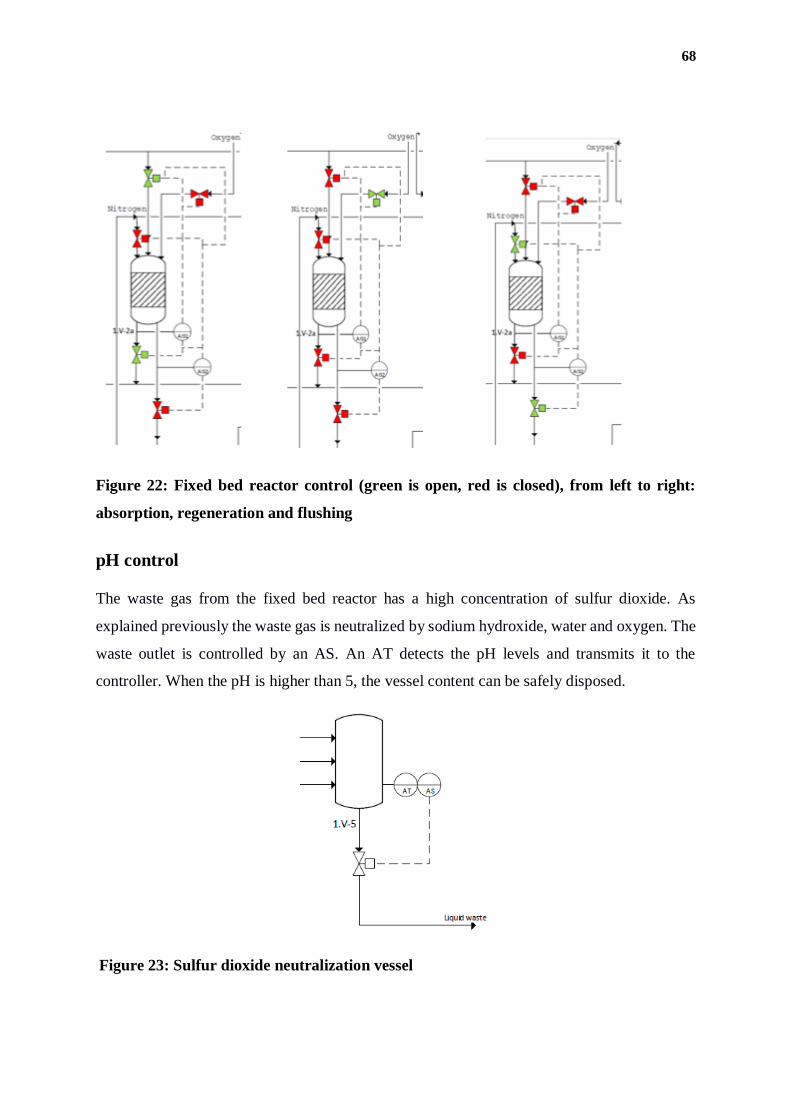
68
Figure 22: Fixed bed reactor control (green is open, red is closed), from left to right:
absorption, regeneration and flushing
pH control
The waste gas from the fixed bed reactor has a high concentration of sulfur dioxide. As
explained previously the waste gas is neutralized by sodium hydroxide, water and oxygen. The
waste outlet is controlled by an AS. An AT detects the pH levels and transmits it to the
controller. When the pH is higher than 5, the vessel content can be safely disposed.
Figure 23: Sulfur dioxide neutralization vessel
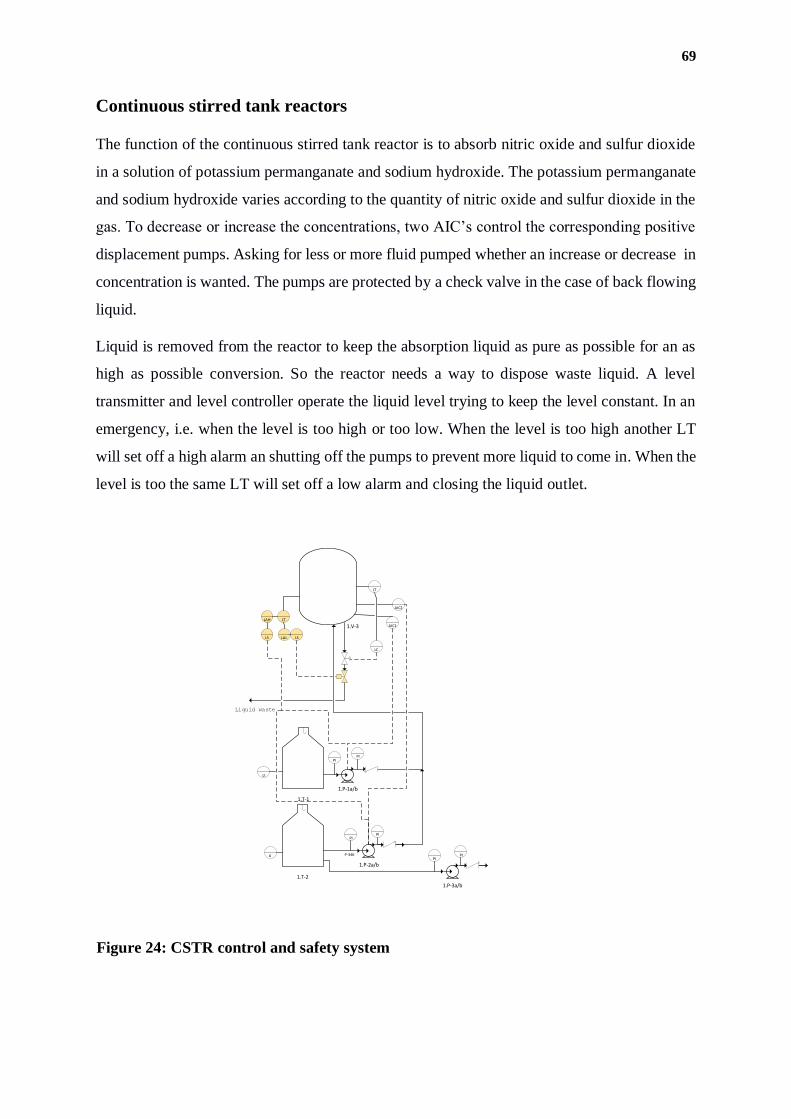
69
Continuous stirred tank reactors
The function of the continuous stirred tank reactor is to absorb nitric oxide and sulfur dioxide
in a solution of potassium permanganate and sodium hydroxide. The potassium permanganate
and sodium hydroxide varies according to the quantity of nitric oxide and sulfur dioxide in the
gas. To decrease or increase the concentrations, two AIC’s control the corresponding positive
displacement pumps. Asking for less or more fluid pumped whether an increase or decrease in
concentration is wanted. The pumps are protected by a check valve in the case of back flowing
liquid.
Liquid is removed from the reactor to keep the absorption liquid as pure as possible for an as
high as possible conversion. So the reactor needs a way to dispose waste liquid. A level
transmitter and level controller operate the liquid level trying to keep the level constant. In an
emergency, i.e. when the level is too high or too low. When the level is too high another LT
will set off a high alarm an shutting off the pumps to prevent more liquid to come in. When the
level is too the same LT will set off a low alarm and closing the liquid outlet.
1.V-3
1.T-1
1.T-2
1.P-2a/b
1.P-1a/b
LT
LC
AIC2
LT
LAL LS
LI
LI
PIPI
PIPI
1.P-3a/b
PIPIP-346
AIC1
Liquid waste
LAH
LS
Figure 24: CSTR control and safety system
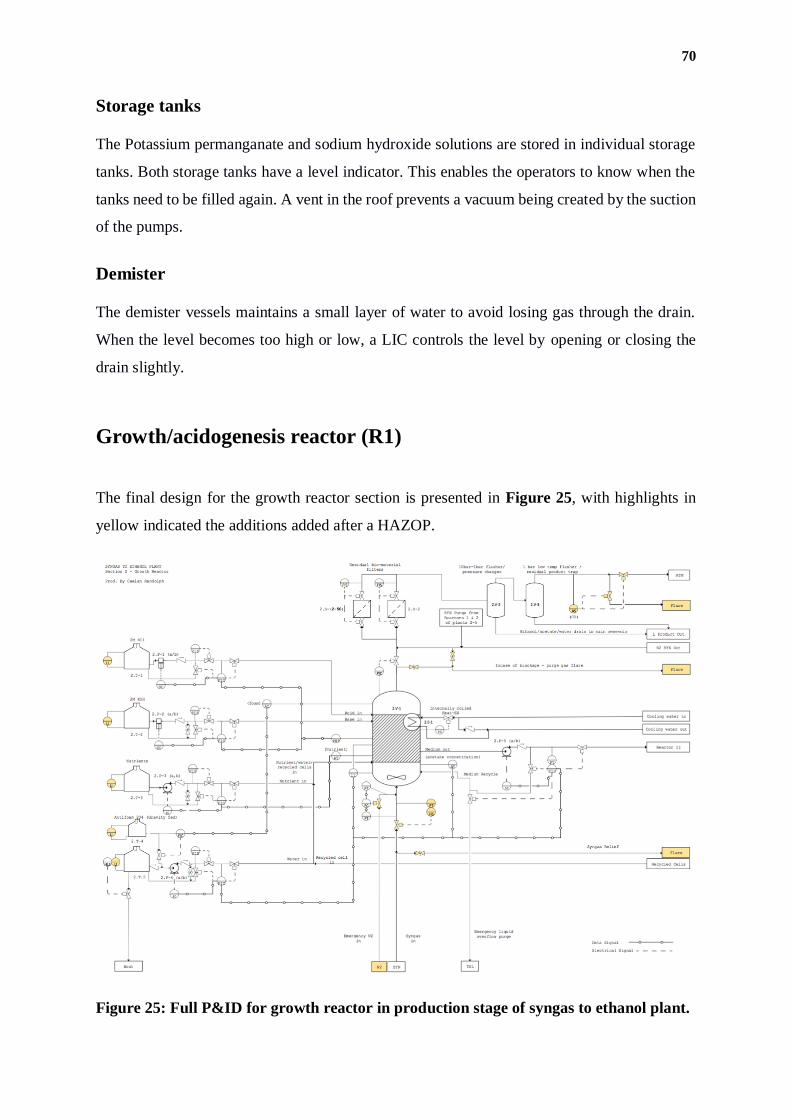
70
Storage tanks
The Potassium permanganate and sodium hydroxide solutions are stored in individual storage
tanks. Both storage tanks have a level indicator. This enables the operators to know when the
tanks need to be filled again. A vent in the roof prevents a vacuum being created by the suction
of the pumps.
Demister
The demister vessels maintains a small layer of water to avoid losing gas through the drain.
When the level becomes too high or low, a LIC controls the level by opening or closing the
drain slightly.
Growth/acidogenesis reactor (R1)
The final design for the growth reactor section is presented in Figure 25, with highlights in
yellow indicated the additions added after a HAZOP.
Figure 25: Full P&ID for growth reactor in production stage of syngas to ethanol plant.
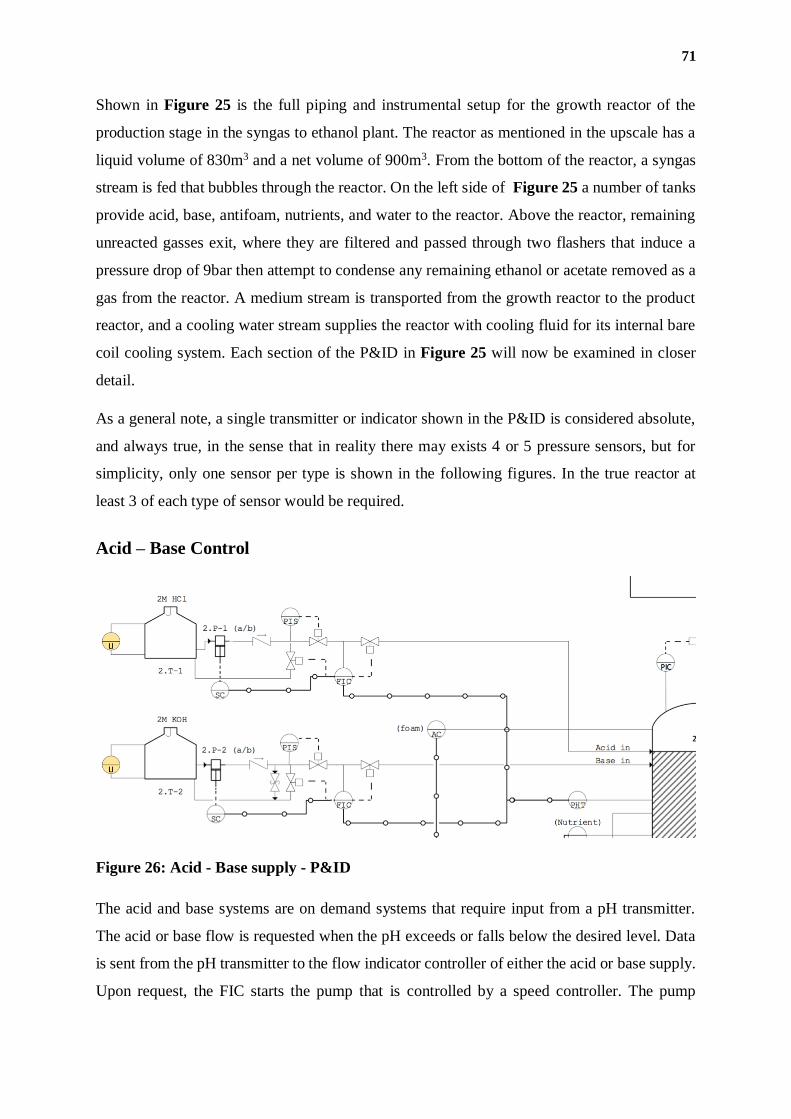
71
Shown in Figure 25 is the full piping and instrumental setup for the growth reactor of the
production stage in the syngas to ethanol plant. The reactor as mentioned in the upscale has a
liquid volume of 830m3 and a net volume of 900m3. From the bottom of the reactor, a syngas
stream is fed that bubbles through the reactor. On the left side of Figure 25 a number of tanks
provide acid, base, antifoam, nutrients, and water to the reactor. Above the reactor, remaining
unreacted gasses exit, where they are filtered and passed through two flashers that induce a
pressure drop of 9bar then attempt to condense any remaining ethanol or acetate removed as a
gas from the reactor. A medium stream is transported from the growth reactor to the product
reactor, and a cooling water stream supplies the reactor with cooling fluid for its internal bare
coil cooling system. Each section of the P&ID in Figure 25 will now be examined in closer
detail.
As a general note, a single transmitter or indicator shown in the P&ID is considered absolute,
and always true, in the sense that in reality there may exists 4 or 5 pressure sensors, but for
simplicity, only one sensor per type is shown in the following figures. In the true reactor at
least 3 of each type of sensor would be required.
Acid – Base Control
Figure 26: Acid - Base supply - P&ID
The acid and base systems are on demand systems that require input from a pH transmitter.
The acid or base flow is requested when the pH exceeds or falls below the desired level. Data
is sent from the pH transmitter to the flow indicator controller of either the acid or base supply.
Upon request, the FIC starts the pump that is controlled by a speed controller. The pump
72
increases the fluid pressure by 9 bar. This is needed as the pressure of the acid and base
reservoirs are atmospheric, and not increasing the pressure to 10 bar would induce backflow
from the 10 bar reactor. Once the fluid pressure has reached 10 bar, the PIS opens a valve that
allows media to flow towards the reactor. Finally, the FIC can modulate flow to the reactor by
feathering two valves to accurately control flow. A speed controller is not desired for flow
control here as the acid and base pumps are only made to turn on occasionally for short periods
of time, and therefore don’t need accurate speed control. Additionally, the pumps do not require
constant flow, and feathering a speed controller to increase pressure to 10 bar, and then when
the PIS opens the valve to the reactor, accurately control flow, would be very difficult to control
accurately with a speed controller. A speed controller is still used to control the speed of the
positive displacement pump, and therefore the rate of flow-recycling (using the relief valve)
and pressure increase ahead of the pump. As a safety precaution, a relief valve is placed on the
high-pressure side of the pump and opens at 10.5 bar to allow for fluid recycling. Lastly, LIs
are places in both acid and base tanks. The acid and base flows to not mix before entering the
reactor. Note, the idea of having two valves is that the pump activity doesn’t need to be as
frequently changed, but rather some liquid can be recycled back to the tanks, whilst some
transported to the reactor, and the throughput of the pump can remain constant. After HAZOP
a scenario where inflow supplies run out was considered, and therefore LI were incorporated.
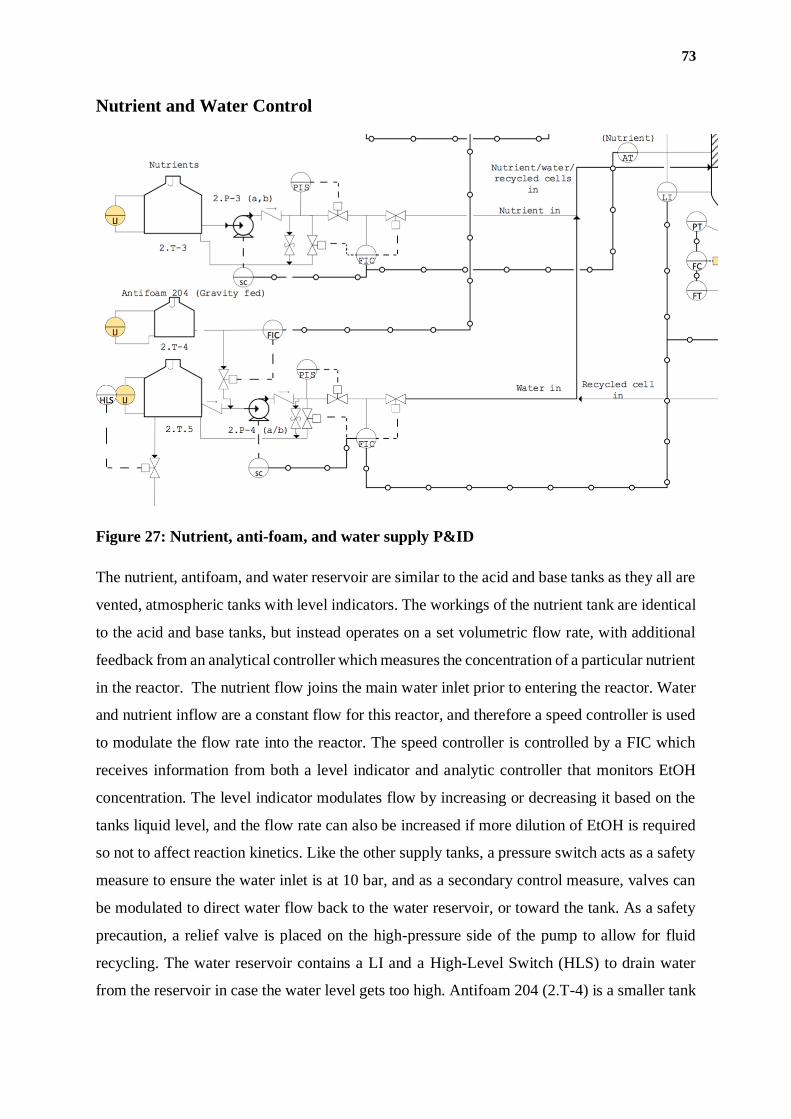
73
Nutrient and Water Control
Figure 27: Nutrient, anti-foam, and water supply P&ID
The nutrient, antifoam, and water reservoir are similar to the acid and base tanks as they all are
vented, atmospheric tanks with level indicators. The workings of the nutrient tank are identical
to the acid and base tanks, but instead operates on a set volumetric flow rate, with additional
feedback from an analytical controller which measures the concentration of a particular nutrient
in the reactor. The nutrient flow joins the main water inlet prior to entering the reactor. Water
and nutrient inflow are a constant flow for this reactor, and therefore a speed controller is used
to modulate the flow rate into the reactor. The speed controller is controlled by a FIC which
receives information from both a level indicator and analytic controller that monitors EtOH
concentration. The level indicator modulates flow by increasing or decreasing it based on the
tanks liquid level, and the flow rate can also be increased if more dilution of EtOH is required
so not to affect reaction kinetics. Like the other supply tanks, a pressure switch acts as a safety
measure to ensure the water inlet is at 10 bar, and as a secondary control measure, valves can
be modulated to direct water flow back to the water reservoir, or toward the tank. As a safety
precaution, a relief valve is placed on the high-pressure side of the pump to allow for fluid
recycling. The water reservoir contains a LI and a High-Level Switch (HLS) to drain water
from the reservoir in case the water level gets too high. Antifoam 204 (2.T-4) is a smaller tank
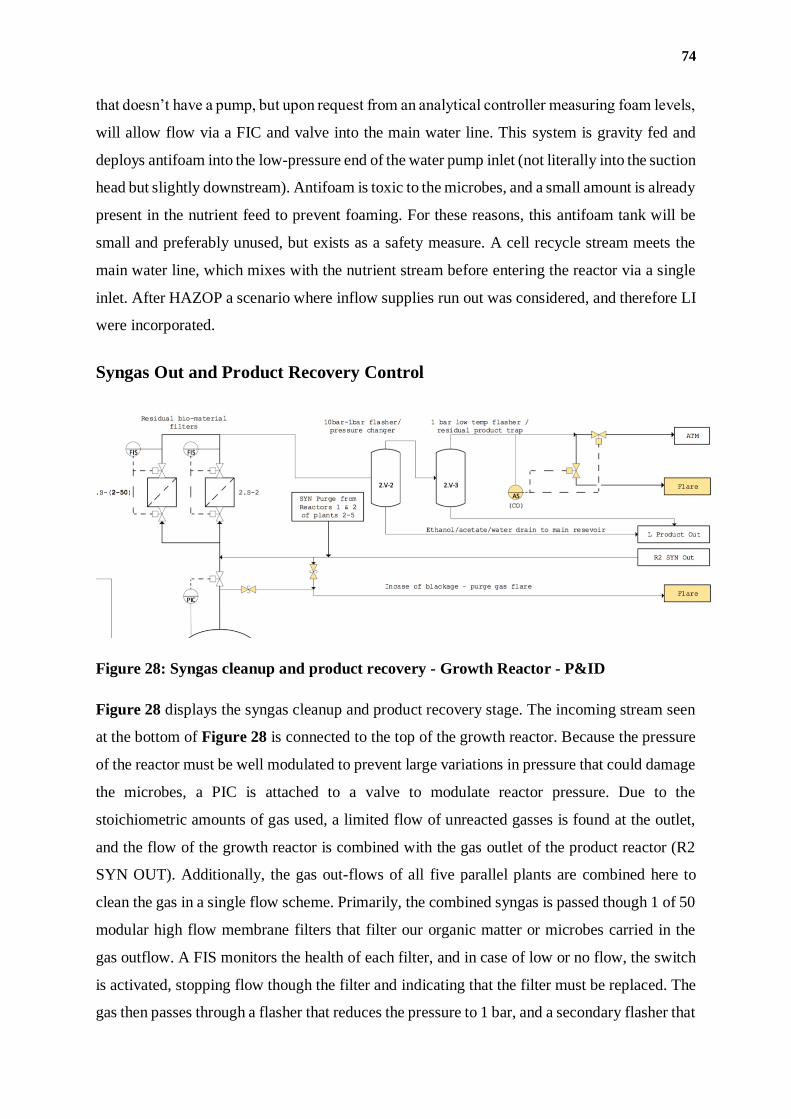
74
that doesn’t have a pump, but upon request from an analytical controller measuring foam levels,
will allow flow via a FIC and valve into the main water line. This system is gravity fed and
deploys antifoam into the low-pressure end of the water pump inlet (not literally into the suction
head but slightly downstream). Antifoam is toxic to the microbes, and a small amount is already
present in the nutrient feed to prevent foaming. For these reasons, this antifoam tank will be
small and preferably unused, but exists as a safety measure. A cell recycle stream meets the
main water line, which mixes with the nutrient stream before entering the reactor via a single
inlet. After HAZOP a scenario where inflow supplies run out was considered, and therefore LI
were incorporated.
Syngas Out and Product Recovery Control
Figure 28: Syngas cleanup and product recovery - Growth Reactor - P&ID
Figure 28 displays the syngas cleanup and product recovery stage. The incoming stream seen
at the bottom of Figure 28 is connected to the top of the growth reactor. Because the pressure
of the reactor must be well modulated to prevent large variations in pressure that could damage
the microbes, a PIC is attached to a valve to modulate reactor pressure. Due to the
stoichiometric amounts of gas used, a limited flow of unreacted gasses is found at the outlet,
and the flow of the growth reactor is combined with the gas outlet of the product reactor (R2
SYN OUT). Additionally, the gas out-flows of all five parallel plants are combined here to
clean the gas in a single flow scheme. Primarily, the combined syngas is passed though 1 of 50
modular high flow membrane filters that filter our organic matter or microbes carried in the
gas outflow. A FIS monitors the health of each filter, and in case of low or no flow, the switch
is activated, stopping flow though the filter and indicating that the filter must be replaced. The
gas then passes through a flasher that reduces the pressure to 1 bar, and a secondary flasher that
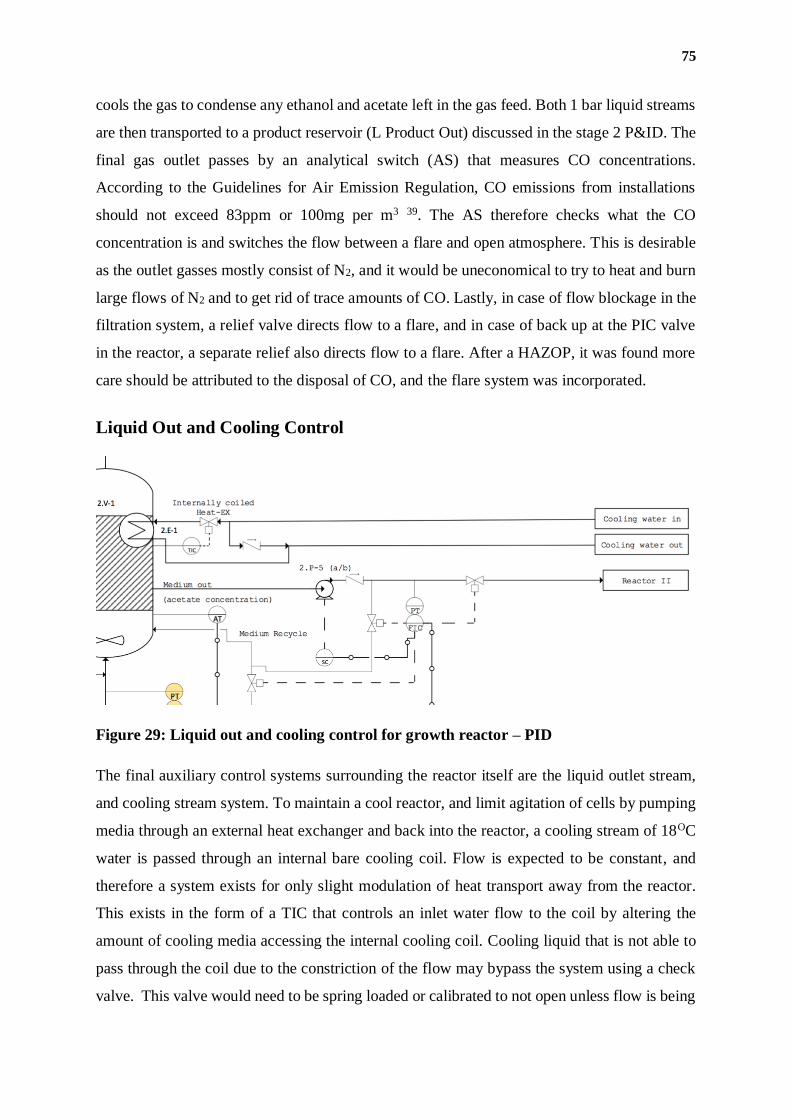
75
cools the gas to condense any ethanol and acetate left in the gas feed. Both 1 bar liquid streams
are then transported to a product reservoir (L Product Out) discussed in the stage 2 P&ID. The
final gas outlet passes by an analytical switch (AS) that measures CO concentrations.
According to the Guidelines for Air Emission Regulation, CO emissions from installations
should not exceed 83ppm or 100mg per m3 39. The AS therefore checks what the CO
concentration is and switches the flow between a flare and open atmosphere. This is desirable
as the outlet gasses mostly consist of N2, and it would be uneconomical to try to heat and burn
large flows of N2 and to get rid of trace amounts of CO. Lastly, in case of flow blockage in the
filtration system, a relief valve directs flow to a flare, and in case of back up at the PIC valve
in the reactor, a separate relief also directs flow to a flare. After a HAZOP, it was found more
care should be attributed to the disposal of CO, and the flare system was incorporated.
Liquid Out and Cooling Control
Figure 29: Liquid out and cooling control for growth reactor – PID
The final auxiliary control systems surrounding the reactor itself are the liquid outlet stream,
and cooling stream system. To maintain a cool reactor, and limit agitation of cells by pumping
media through an external heat exchanger and back into the reactor, a cooling stream of 18OC
water is passed through an internal bare cooling coil. Flow is expected to be constant, and
therefore a system exists for only slight modulation of heat transport away from the reactor.
This exists in the form of a TIC that controls an inlet water flow to the coil by altering the
amount of cooling media accessing the internal cooling coil. Cooling liquid that is not able to
pass through the coil due to the constriction of the flow may bypass the system using a check
valve. This valve would need to be spring loaded or calibrated to not open unless flow is being
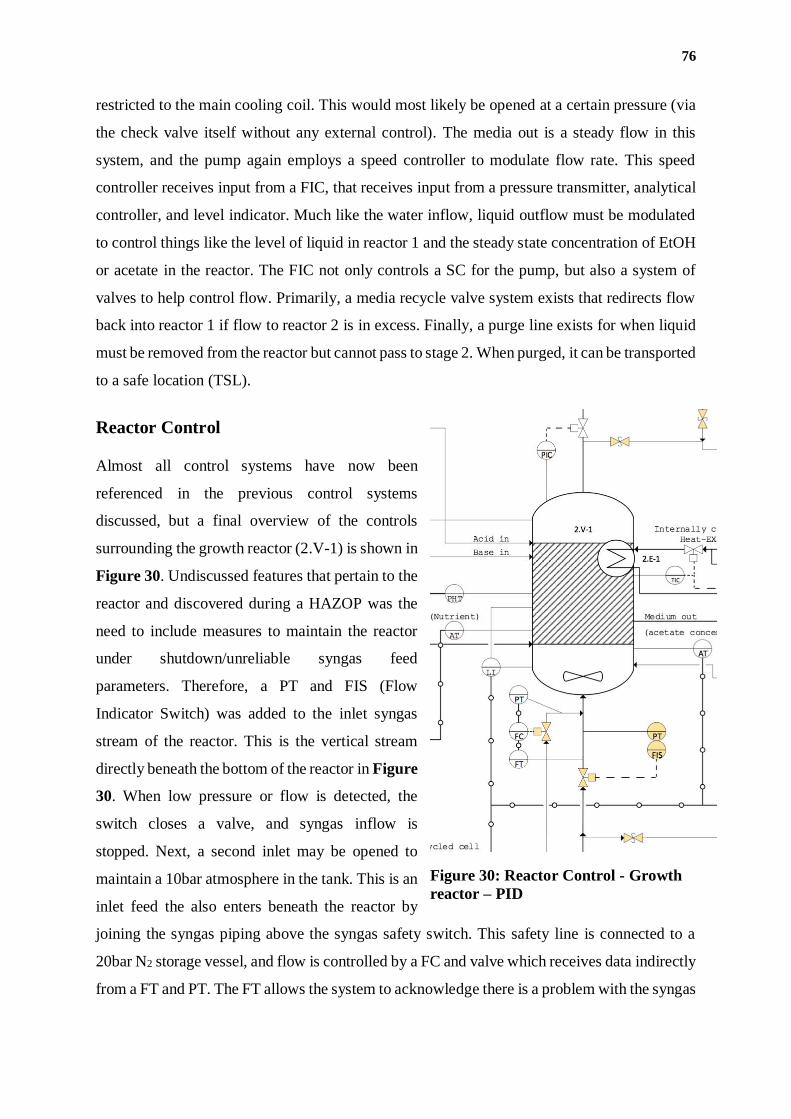
76
restricted to the main cooling coil. This would most likely be opened at a certain pressure (via
the check valve itself without any external control). The media out is a steady flow in this
system, and the pump again employs a speed controller to modulate flow rate. This speed
controller receives input from a FIC, that receives input from a pressure transmitter, analytical
controller, and level indicator. Much like the water inflow, liquid outflow must be modulated
to control things like the level of liquid in reactor 1 and the steady state concentration of EtOH
or acetate in the reactor. The FIC not only controls a SC for the pump, but also a system of
valves to help control flow. Primarily, a media recycle valve system exists that redirects flow
back into reactor 1 if flow to reactor 2 is in excess. Finally, a purge line exists for when liquid
must be removed from the reactor but cannot pass to stage 2. When purged, it can be transported
to a safe location (TSL).
Reactor Control
Almost all control systems have now been
referenced in the previous control systems
discussed, but a final overview of the controls
surrounding the growth reactor (2.V-1) is shown in
Figure 30. Undiscussed features that pertain to the
reactor and discovered during a HAZOP was the
need to include measures to maintain the reactor
under shutdown/unreliable syngas feed
parameters. Therefore, a PT and FIS (Flow
Indicator Switch) was added to the inlet syngas
stream of the reactor. This is the vertical stream
directly beneath the bottom of the reactor in Figure
30. When low pressure or flow is detected, the
switch closes a valve, and syngas inflow is
stopped. Next, a second inlet may be opened to
maintain a 10bar atmosphere in the tank. This is an
inlet feed the also enters beneath the reactor by
joining the syngas piping above the syngas safety switch. This safety line is connected to a
20bar N2 storage vessel, and flow is controlled by a FC and valve which receives data indirectly
from a FT and PT. The FT allows the system to acknowledge there is a problem with the syngas
Figure 30: Reactor Control - Growth
reactor – PID
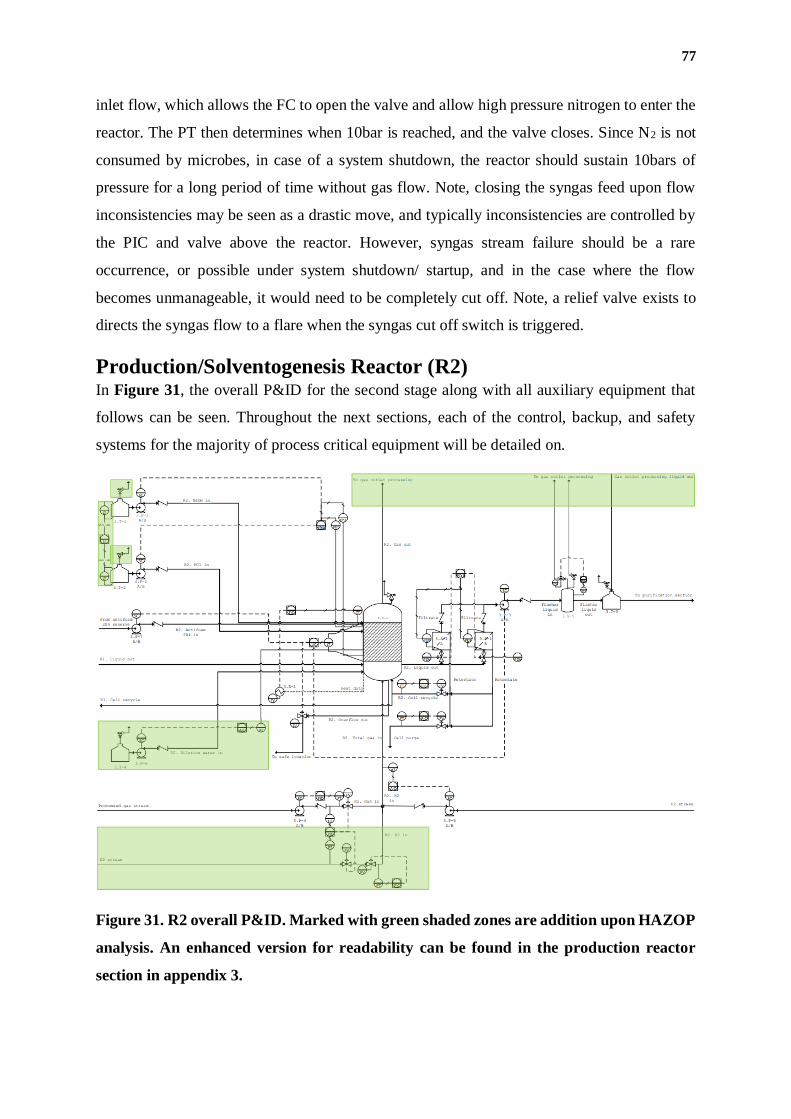
77
inlet flow, which allows the FC to open the valve and allow high pressure nitrogen to enter the
reactor. The PT then determines when 10bar is reached, and the valve closes. Since N2 is not
consumed by microbes, in case of a system shutdown, the reactor should sustain 10bars of
pressure for a long period of time without gas flow. Note, closing the syngas feed upon flow
inconsistencies may be seen as a drastic move, and typically inconsistencies are controlled by
the PIC and valve above the reactor. However, syngas stream failure should be a rare
occurrence, or possible under system shutdown/ startup, and in the case where the flow
becomes unmanageable, it would need to be completely cut off. Note, a relief valve exists to
directs the syngas flow to a flare when the syngas cut off switch is triggered.
Production/Solventogenesis Reactor (R2) In Figure 31, the overall P&ID for the second stage along with all auxiliary equipment that
follows can be seen. Throughout the next sections, each of the control, backup, and safety
systems for the majority of process critical equipment will be detailed on.
Figure 31. R2 overall P&ID. Marked with green shaded zones are addition upon HAZOP
analysis. An enhanced version for readability can be found in the production reactor
section in appendix 3.
78
pH control system
As previously explained, reactor pH is among one of the most important operating parameters
for the bioreactor as it governs the direction at which the equilibrium in the WLP proceeds, and
therefore what metabolites were produced in which stage. As R2 is a solventogenesis type of
reactor which produces primarily ethanol, the optimum pH to achieve the desired outcome is
between 4.4-4.8, slightly more acidic relative to that of R1. This operating pH can be seen as a
method of tipping the equilibrium between acetate and ethanol, as maintaining low pH would
promote the conversion of acetate into ethanol, as a way for the microbe to try and increase the
pH by reducing the amount of acetic acid present in the liquid (Le Chatelier’s principle).
The control of reactor pH in the case of R2 can be seen in Figure 32. The design reported in
this thesis proposes the use of two reservoirs, namely 3.T-1 and 3.T-2, containing a solution of
NaOH 2M and HCl 2M, respectively. Each of the acid and base reservoirs were also equipped
with a level transmitter (LT), connected to a level indicator (LI) with a level alarm high (LAH)
and low (LAL) as a precautionary measure to notify an operator if either of the reservoirs were
about to be empty, which will then be followed by a manual refilling of the said reservoir. This,
however, was not expected to occur with high frequency as, in addition to the relatively low
volumetric requirement of the acids and base solution by the process, the reservoirs are also
specified with a volume large enough to handle the pH requirement of R2. As a safety measure,
each of the reservoirs, while operating at an atmospheric pressure of 1 bar, were equipped with
a relief valve to prevent over-pressurization, leading to possibly stress cracking and loss of
containment.
The decision making pertaining to which solution should be added to the reactor and also the
quantity required to achieve the desired operating pH were handled by a pH indicating
controller (pHIC), receiving information from two pH transmitters (pHT) in the reactor,
controlling two speed controlled (SC) dosing pump on two separate lines, for acid and base
each, along with a check valve on each line to prevent backflow of reactor materials into the
acid and base reservoirs. The use of two pHTs were considered sufficient based on the fact that
R2 is a microbubble sparged bubble column, which due to the very well-defined bubble
circulation throughout the column behaves very much like a CISTR, thus implying that
quantities such as temperature, concentration, and pH, can be considered to be uniformly
distributed throughout the entire reactor.
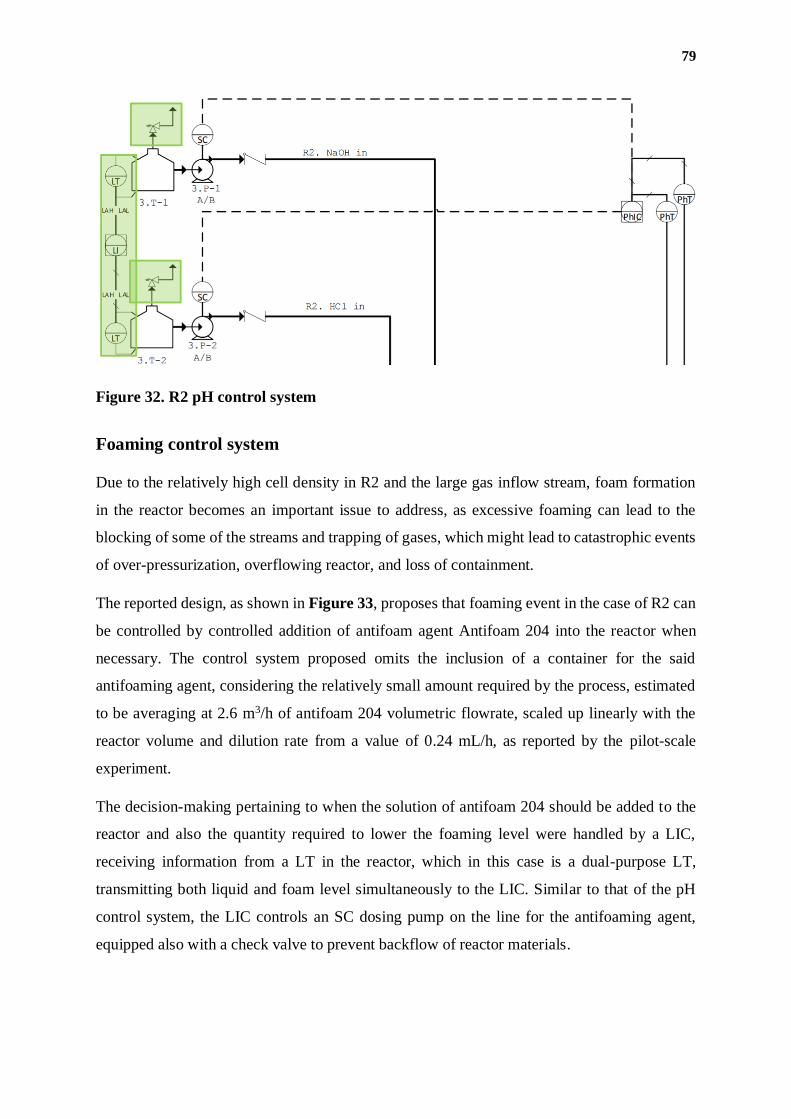
79
Figure 32. R2 pH control system
Foaming control system
Due to the relatively high cell density in R2 and the large gas inflow stream, foam formation
in the reactor becomes an important issue to address, as excessive foaming can lead to the
blocking of some of the streams and trapping of gases, which might lead to catastrophic events
of over-pressurization, overflowing reactor, and loss of containment.
The reported design, as shown in Figure 33, proposes that foaming event in the case of R2 can
be controlled by controlled addition of antifoam agent Antifoam 204 into the reactor when
necessary. The control system proposed omits the inclusion of a container for the said
antifoaming agent, considering the relatively small amount required by the process, estimated
to be averaging at 2.6 m3/h of antifoam 204 volumetric flowrate, scaled up linearly with the
reactor volume and dilution rate from a value of 0.24 mL/h, as reported by the pilot-scale
experiment.
The decision-making pertaining to when the solution of antifoam 204 should be added to the
reactor and also the quantity required to lower the foaming level were handled by a LIC,
receiving information from a LT in the reactor, which in this case is a dual-purpose LT,
transmitting both liquid and foam level simultaneously to the LIC. Similar to that of the pH
control system, the LIC controls an SC dosing pump on the line for the antifoaming agent,
equipped also with a check valve to prevent backflow of reactor materials.
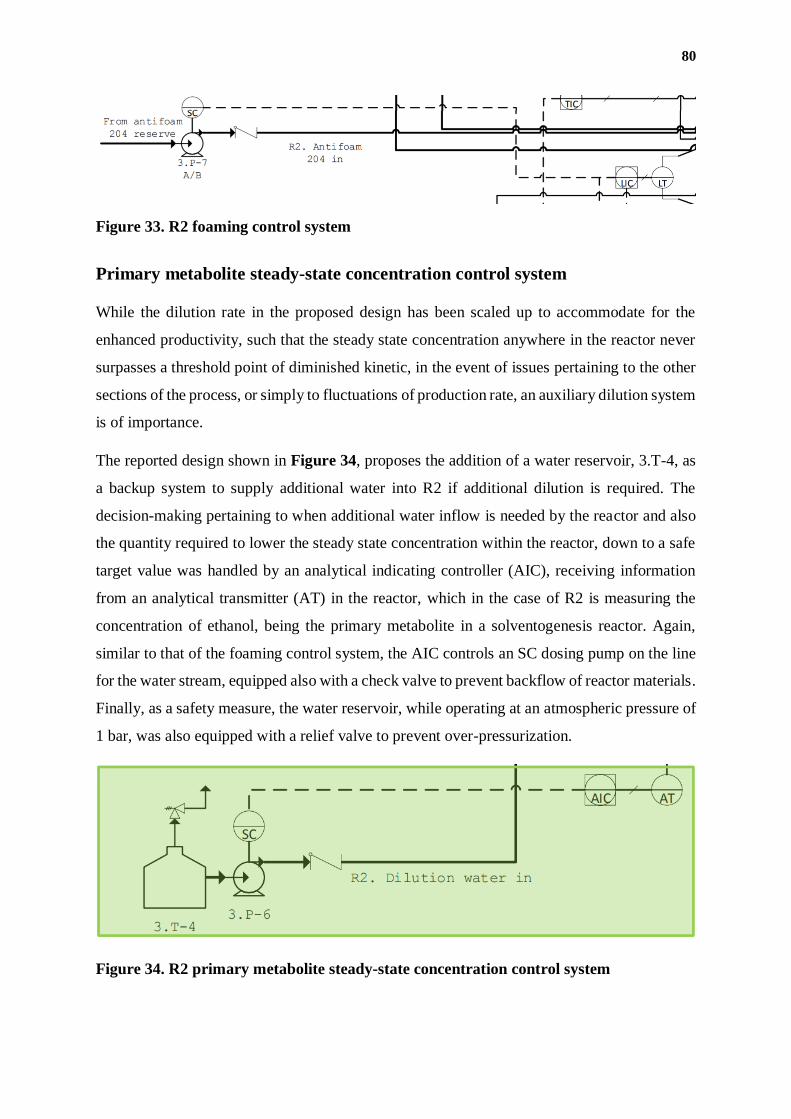
80
Figure 33. R2 foaming control system
Primary metabolite steady-state concentration control system
While the dilution rate in the proposed design has been scaled up to accommodate for the
enhanced productivity, such that the steady state concentration anywhere in the reactor never
surpasses a threshold point of diminished kinetic, in the event of issues pertaining to the other
sections of the process, or simply to fluctuations of production rate, an auxiliary dilution system
is of importance.
The reported design shown in Figure 34, proposes the addition of a water reservoir, 3.T-4, as
a backup system to supply additional water into R2 if additional dilution is required. The
decision-making pertaining to when additional water inflow is needed by the reactor and also
the quantity required to lower the steady state concentration within the reactor, down to a safe
target value was handled by an analytical indicating controller (AIC), receiving information
from an analytical transmitter (AT) in the reactor, which in the case of R2 is measuring the
concentration of ethanol, being the primary metabolite in a solventogenesis reactor. Again,
similar to that of the foaming control system, the AIC controls an SC dosing pump on the line
for the water stream, equipped also with a check valve to prevent backflow of reactor materials.
Finally, as a safety measure, the water reservoir, while operating at an atmospheric pressure of
1 bar, was also equipped with a relief valve to prevent over-pressurization.
Figure 34. R2 primary metabolite steady-state concentration control system
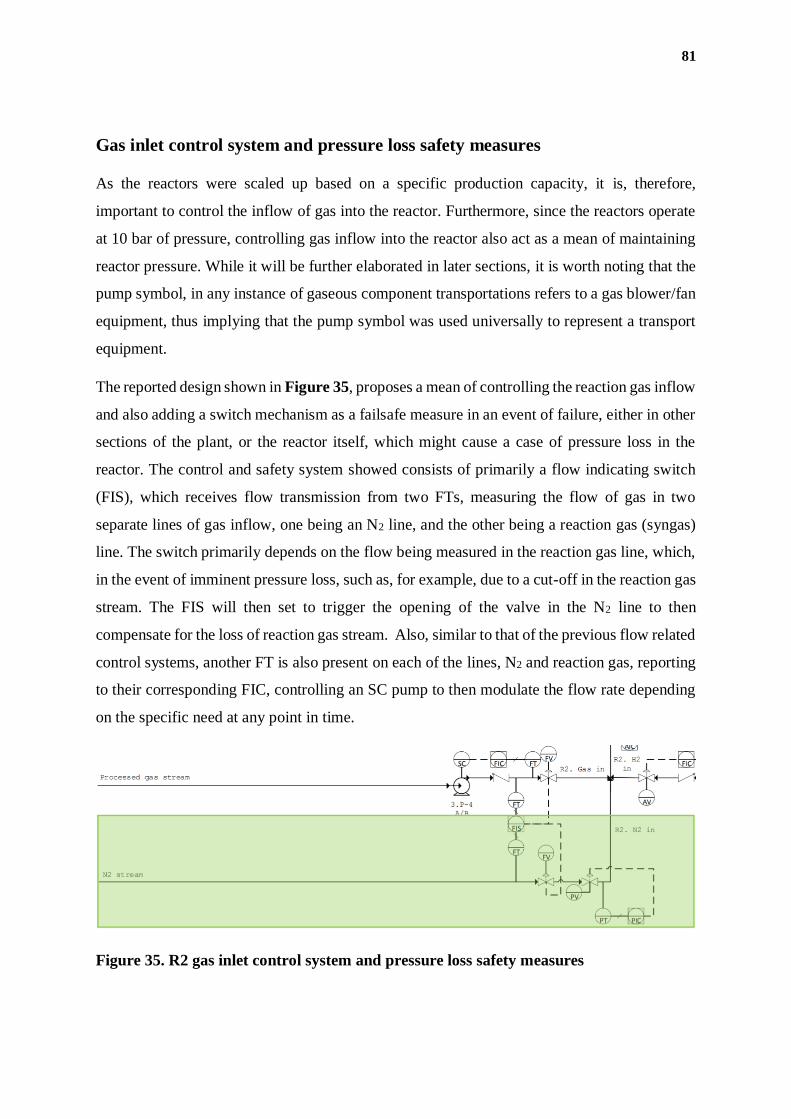
81
Gas inlet control system and pressure loss safety measures
As the reactors were scaled up based on a specific production capacity, it is, therefore,
important to control the inflow of gas into the reactor. Furthermore, since the reactors operate
at 10 bar of pressure, controlling gas inflow into the reactor also act as a mean of maintaining
reactor pressure. While it will be further elaborated in later sections, it is worth noting that the
pump symbol, in any instance of gaseous component transportations refers to a gas blower/fan
equipment, thus implying that the pump symbol was used universally to represent a transport
equipment.
The reported design shown in Figure 35, proposes a mean of controlling the reaction gas inflow
and also adding a switch mechanism as a failsafe measure in an event of failure, either in other
sections of the plant, or the reactor itself, which might cause a case of pressure loss in the
reactor. The control and safety system showed consists of primarily a flow indicating switch
(FIS), which receives flow transmission from two FTs, measuring the flow of gas in two
separate lines of gas inflow, one being an N2 line, and the other being a reaction gas (syngas)
line. The switch primarily depends on the flow being measured in the reaction gas line, which,
in the event of imminent pressure loss, such as, for example, due to a cut-off in the reaction gas
stream. The FIS will then set to trigger the opening of the valve in the N2 line to then
compensate for the loss of reaction gas stream. Also, similar to that of the previous flow related
control systems, another FT is also present on each of the lines, N2 and reaction gas, reporting
to their corresponding FIC, controlling an SC pump to then modulate the flow rate depending
on the specific need at any point in time.
Figure 35. R2 gas inlet control system and pressure loss safety measures
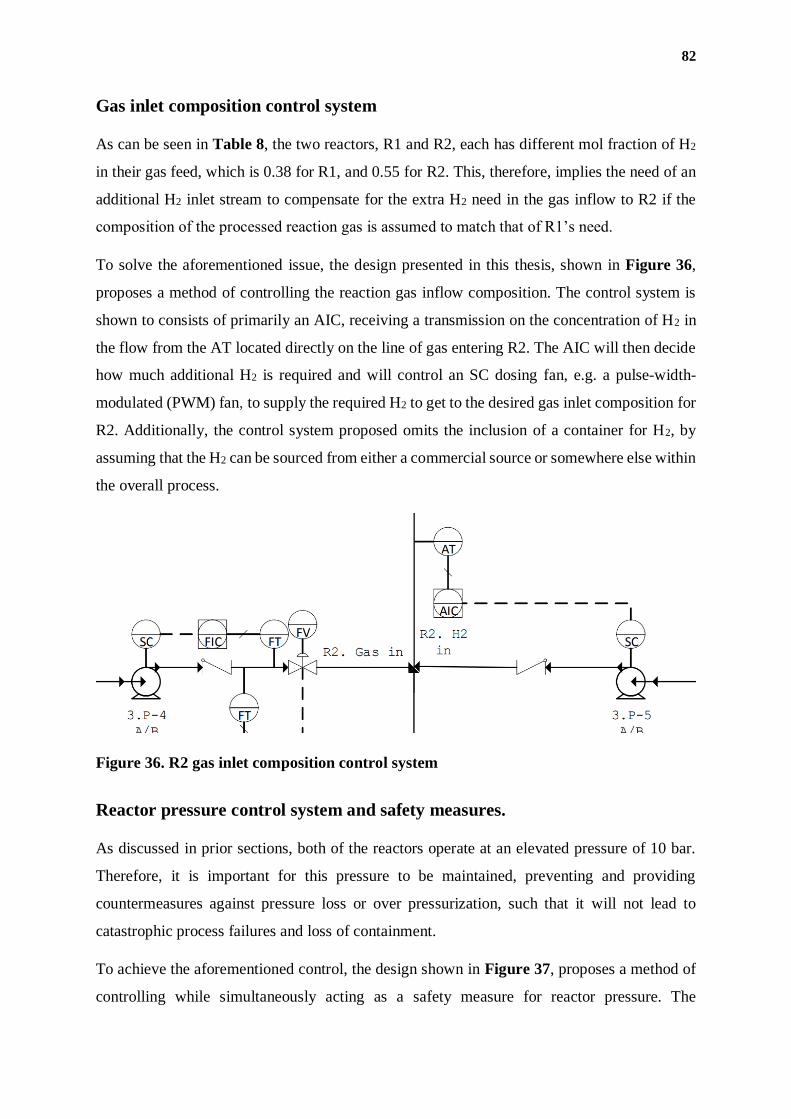
82
Gas inlet composition control system
As can be seen in Table 8, the two reactors, R1 and R2, each has different mol fraction of H2
in their gas feed, which is 0.38 for R1, and 0.55 for R2. This, therefore, implies the need of an
additional H2 inlet stream to compensate for the extra H2 need in the gas inflow to R2 if the
composition of the processed reaction gas is assumed to match that of R1’s need.
To solve the aforementioned issue, the design presented in this thesis, shown in Figure 36,
proposes a method of controlling the reaction gas inflow composition. The control system is
shown to consists of primarily an AIC, receiving a transmission on the concentration of H2 in
the flow from the AT located directly on the line of gas entering R2. The AIC will then decide
how much additional H2 is required and will control an SC dosing fan, e.g. a pulse-width-
modulated (PWM) fan, to supply the required H2 to get to the desired gas inlet composition for
R2. Additionally, the control system proposed omits the inclusion of a container for H2, by
assuming that the H2 can be sourced from either a commercial source or somewhere else within
the overall process.
Figure 36. R2 gas inlet composition control system
Reactor pressure control system and safety measures.
As discussed in prior sections, both of the reactors operate at an elevated pressure of 10 bar.
Therefore, it is important for this pressure to be maintained, preventing and providing
countermeasures against pressure loss or over pressurization, such that it will not lead to
catastrophic process failures and loss of containment.
To achieve the aforementioned control, the design shown in Figure 37, proposes a method of
controlling while simultaneously acting as a safety measure for reactor pressure. The
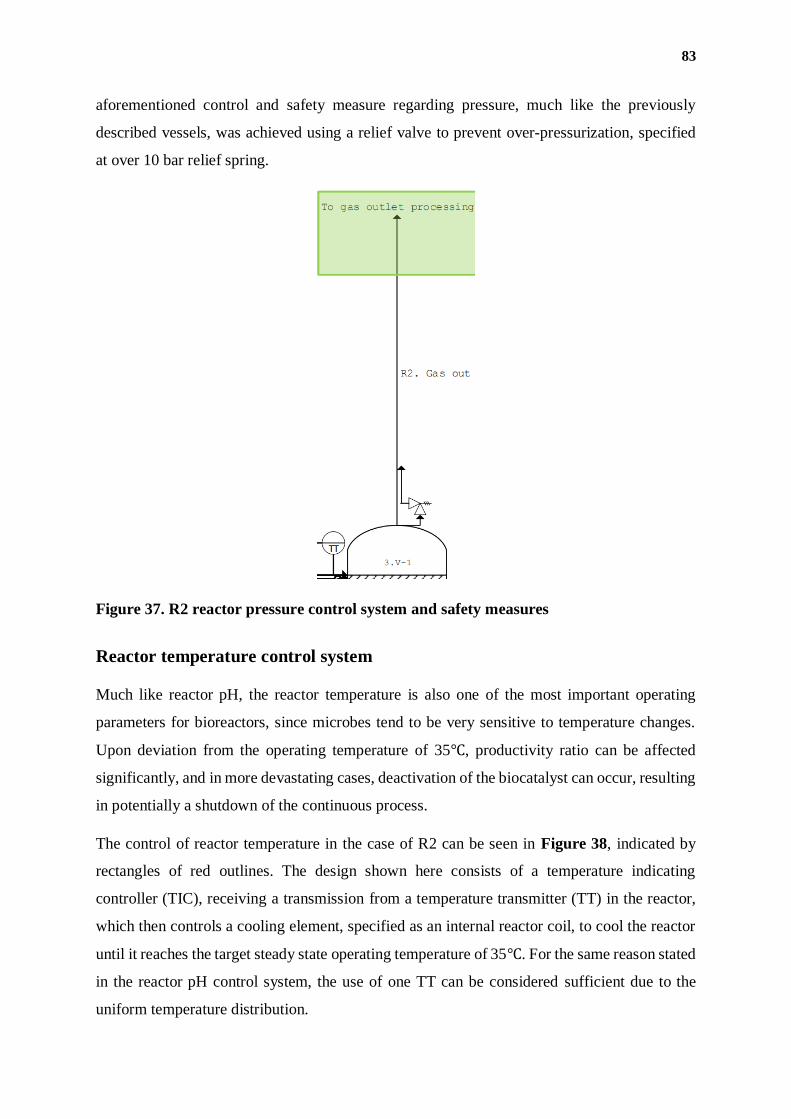
83
aforementioned control and safety measure regarding pressure, much like the previously
described vessels, was achieved using a relief valve to prevent over-pressurization, specified
at over 10 bar relief spring.
Figure 37. R2 reactor pressure control system and safety measures
Reactor temperature control system
Much like reactor pH, the reactor temperature is also one of the most important operating
parameters for bioreactors, since microbes tend to be very sensitive to temperature changes.
Upon deviation from the operating temperature of 35℃, productivity ratio can be affected
significantly, and in more devastating cases, deactivation of the biocatalyst can occur, resulting
in potentially a shutdown of the continuous process.
The control of reactor temperature in the case of R2 can be seen in Figure 38, indicated by
rectangles of red outlines. The design shown here consists of a temperature indicating
controller (TIC), receiving a transmission from a temperature transmitter (TT) in the reactor,
which then controls a cooling element, specified as an internal reactor coil, to cool the reactor
until it reaches the target steady state operating temperature of 35℃. For the same reason stated
in the reactor pH control system, the use of one TT can be considered sufficient due to the
uniform temperature distribution.
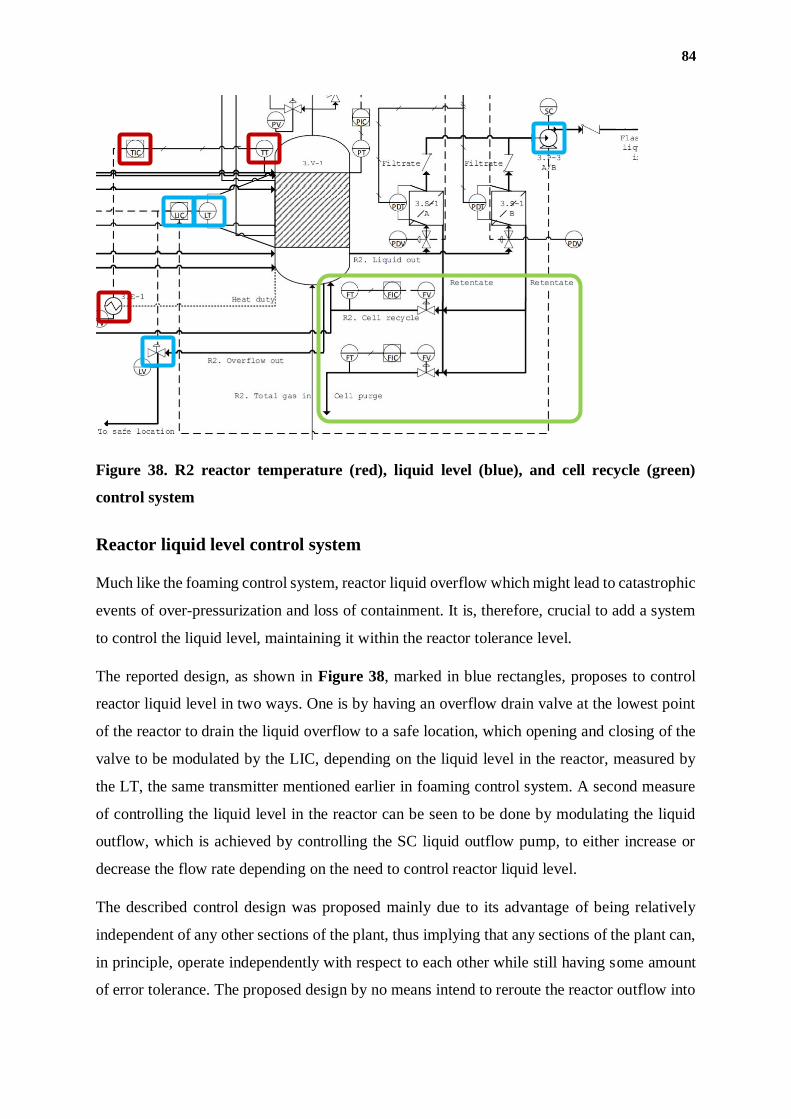
84
Figure 38. R2 reactor temperature (red), liquid level (blue), and cell recycle (green)
control system
Reactor liquid level control system
Much like the foaming control system, reactor liquid overflow which might lead to catastrophic
events of over-pressurization and loss of containment. It is, therefore, crucial to add a system
to control the liquid level, maintaining it within the reactor tolerance level.
The reported design, as shown in Figure 38, marked in blue rectangles, proposes to control
reactor liquid level in two ways. One is by having an overflow drain valve at the lowest point
of the reactor to drain the liquid overflow to a safe location, which opening and closing of the
valve to be modulated by the LIC, depending on the liquid level in the reactor, measured by
the LT, the same transmitter mentioned earlier in foaming control system. A second measure
of controlling the liquid level in the reactor can be seen to be done by modulating the liquid
outflow, which is achieved by controlling the SC liquid outflow pump, to either increase or
decrease the flow rate depending on the need to control reactor liquid level.
The described control design was proposed mainly due to its advantage of being relatively
independent of any other sections of the plant, thus implying that any sections of the plant can,
in principle, operate independently with respect to each other while still having some amount
of error tolerance. The proposed design by no means intend to reroute the reactor outflow into
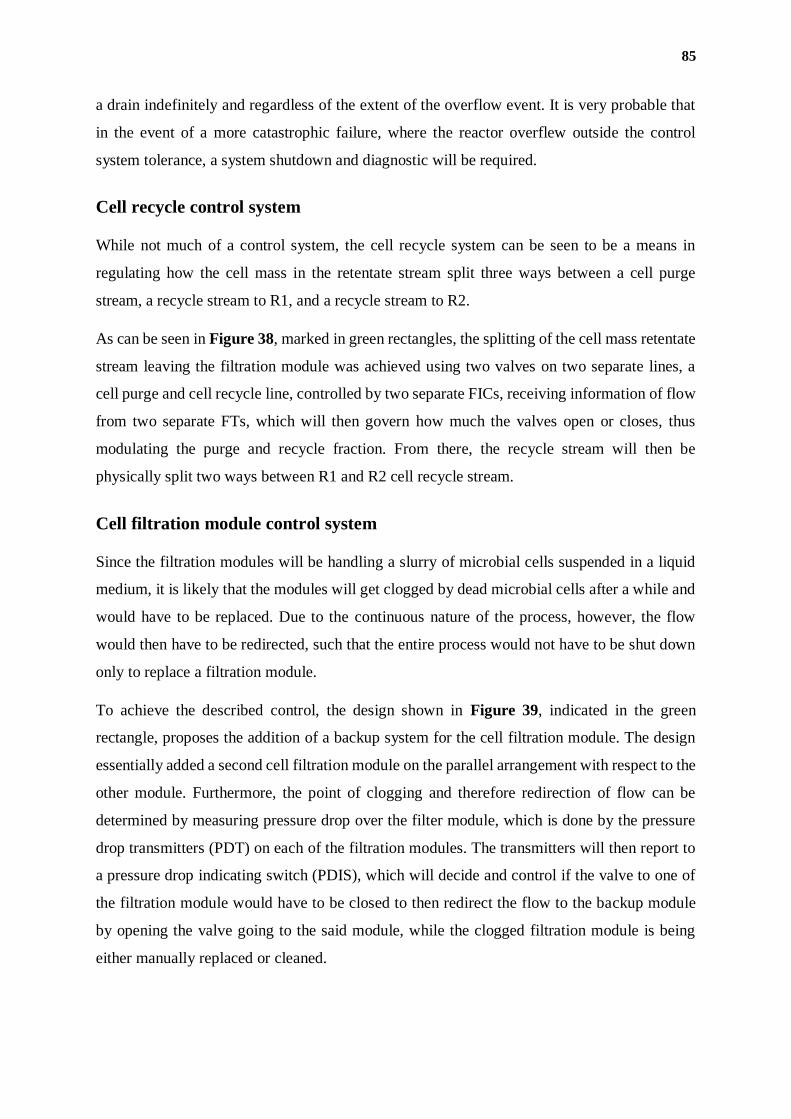
85
a drain indefinitely and regardless of the extent of the overflow event. It is very probable that
in the event of a more catastrophic failure, where the reactor overflew outside the control
system tolerance, a system shutdown and diagnostic will be required.
Cell recycle control system
While not much of a control system, the cell recycle system can be seen to be a means in
regulating how the cell mass in the retentate stream split three ways between a cell purge
stream, a recycle stream to R1, and a recycle stream to R2.
As can be seen in Figure 38, marked in green rectangles, the splitting of the cell mass retentate
stream leaving the filtration module was achieved using two valves on two separate lines, a
cell purge and cell recycle line, controlled by two separate FICs, receiving information of flow
from two separate FTs, which will then govern how much the valves open or closes, thus
modulating the purge and recycle fraction. From there, the recycle stream will then be
physically split two ways between R1 and R2 cell recycle stream.
Cell filtration module control system
Since the filtration modules will be handling a slurry of microbial cells suspended in a liquid
medium, it is likely that the modules will get clogged by dead microbial cells after a while and
would have to be replaced. Due to the continuous nature of the process, however, the flow
would then have to be redirected, such that the entire process would not have to be shut down
only to replace a filtration module.
To achieve the described control, the design shown in Figure 39, indicated in the green
rectangle, proposes the addition of a backup system for the cell filtration module. The design
essentially added a second cell filtration module on the parallel arrangement with respect to the
other module. Furthermore, the point of clogging and therefore redirection of flow can be
determined by measuring pressure drop over the filter module, which is done by the pressure
drop transmitters (PDT) on each of the filtration modules. The transmitters will then report to
a pressure drop indicating switch (PDIS), which will decide and control if the valve to one of
the filtration module would have to be closed to then redirect the flow to the backup module
by opening the valve going to the said module, while the clogged filtration module is being
either manually replaced or cleaned.
86
Figure 39. R2 cell filtration module (green), flasher pressure (blue), and liquid storage
pressure (red) control system
Flasher pressure and liquid storage pressure control system
As the flasher aims to depressurize the liquid outlet of the reactors from 10 bar to an
atmospheric pressure of 1 bar, mainly to reduce the number of dissolved gases in the liquid and
to also lower storage cost by eliminating the need of a pressure storage vessel, due to the
relatively large pressure drop, it is important for the flasher to be able to vent the gas slowly,
to avoid liquid bursts out of the flasher through the venting stream.
To achieve the described control, the design shown in Figure 39, marked in blue rectangles,
proposes the use of a PIC, receiving vessel pressure information from the PT, which will then
modulate the opening of the venting valve to slowly allow the flasher to eventually equilibrate
at 1 bar of pressure. Additionally, as a safety measure, much like any of the previously
described vessels, a relief valve to prevent over-pressurization, was also added. Similarly for
the liquid storage vessel, marked in the red rectangle in Figure 39, operating at an atmospheric
pressure of 1 bar, a safety measure in the form of a relief valve to prevent over-pressurization,
was also added.
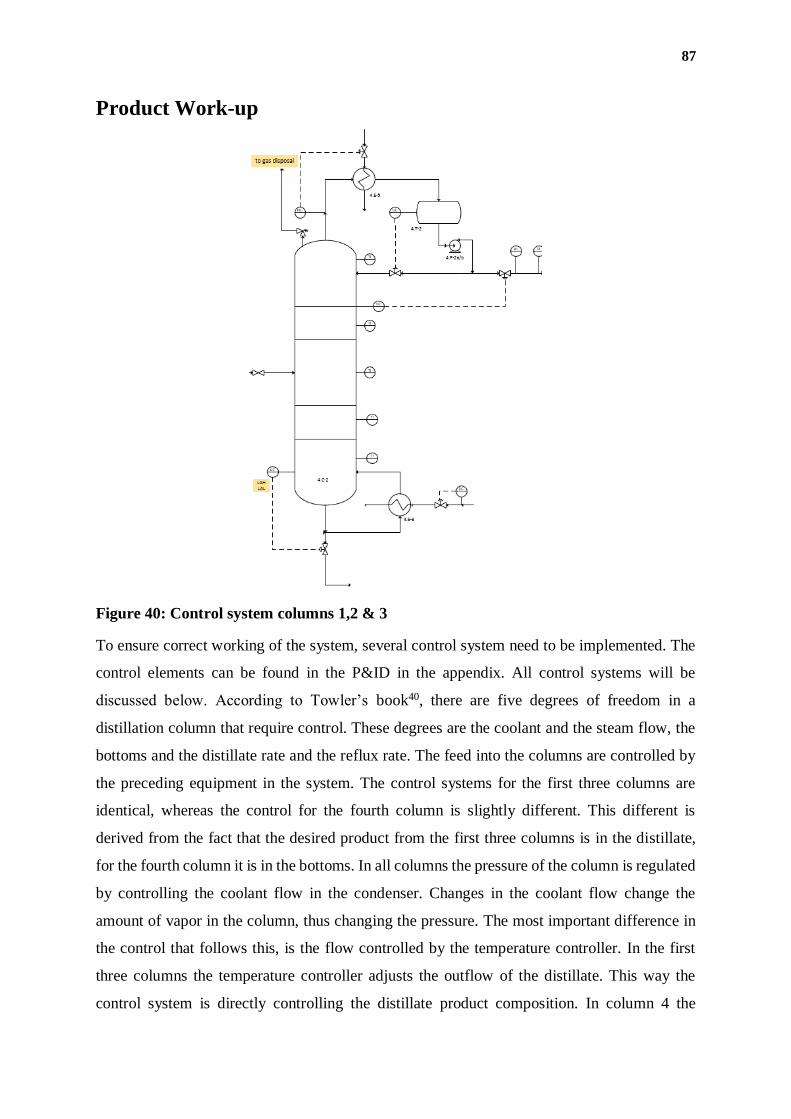
87
Product Work-up
Figure 40: Control system columns 1,2 & 3
To ensure correct working of the system, several control system need to be implemented. The
control elements can be found in the P&ID in the appendix. All control systems will be
discussed below. According to Towler’s book40, there are five degrees of freedom in a
distillation column that require control. These degrees are the coolant and the steam flow, the
bottoms and the distillate rate and the reflux rate. The feed into the columns are controlled by
the preceding equipment in the system. The control systems for the first three columns are
identical, whereas the control for the fourth column is slightly different. This different is
derived from the fact that the desired product from the first three columns is in the distillate,
for the fourth column it is in the bottoms. In all columns the pressure of the column is regulated
by controlling the coolant flow in the condenser. Changes in the coolant flow change the
amount of vapor in the column, thus changing the pressure. The most important difference in
the control that follows this, is the flow controlled by the temperature controller. In the first
three columns the temperature controller adjusts the outflow of the distillate. This way the
control system is directly controlling the distillate product composition. In column 4 the
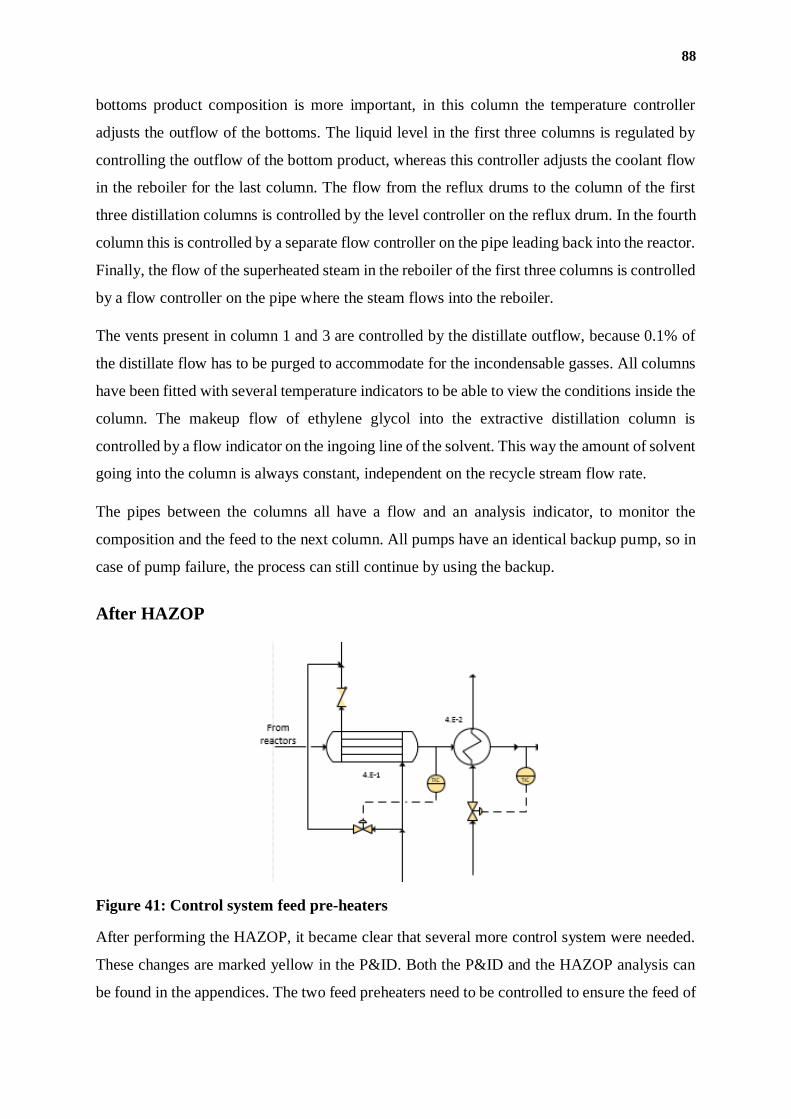
88
bottoms product composition is more important, in this column the temperature controller
adjusts the outflow of the bottoms. The liquid level in the first three columns is regulated by
controlling the outflow of the bottom product, whereas this controller adjusts the coolant flow
in the reboiler for the last column. The flow from the reflux drums to the column of the first
three distillation columns is controlled by the level controller on the reflux drum. In the fourth
column this is controlled by a separate flow controller on the pipe leading back into the reactor.
Finally, the flow of the superheated steam in the reboiler of the first three columns is controlled
by a flow controller on the pipe where the steam flows into the reboiler.
The vents present in column 1 and 3 are controlled by the distillate outflow, because 0.1% of
the distillate flow has to be purged to accommodate for the incondensable gasses. All columns
have been fitted with several temperature indicators to be able to view the conditions inside the
column. The makeup flow of ethylene glycol into the extractive distillation column is
controlled by a flow indicator on the ingoing line of the solvent. This way the amount of solvent
going into the column is always constant, independent on the recycle stream flow rate.
The pipes between the columns all have a flow and an analysis indicator, to monitor the
composition and the feed to the next column. All pumps have an identical backup pump, so in
case of pump failure, the process can still continue by using the backup.
After HAZOP
Figure 41: Control system feed pre-heaters
After performing the HAZOP, it became clear that several more control system were needed.
These changes are marked yellow in the P&ID. Both the P&ID and the HAZOP analysis can
be found in the appendices. The two feed preheaters need to be controlled to ensure the feed of
89
the work-up section is at the correct temperature. For the first heat exchanger direct flow control
of the flows is not an option, because the flowrate is controlled elsewhere in the system. For
this reason a bypass is installed, this will ensure correct temperatures. The second feed
preheater is controlled by adjusting the flow rate of the steam. The tank containing the ethylene
glycol is fitted with a level indicator with a low level alarm, to ensure there is always enough
solvent in the system. If the amount of solvent would be too low, the purity of the product could
decrease. The level indicator controllers of all columns have been fitted with a high and low
alarm, to prevent the column from drying out or a change in product purity in case of failure
elsewhere in the system. All columns are also fitted with a pressure relief valve to the gas
disposal system to ensure no excessive pressure buildup in case of a failure in the system. To
ensure no harmful gases are vented to the atmosphere, all gases coming from the vents on the
reflux drums will go to the gas disposal system.
90
Chapter IV - EQUIPMENT
SPECIFICATION
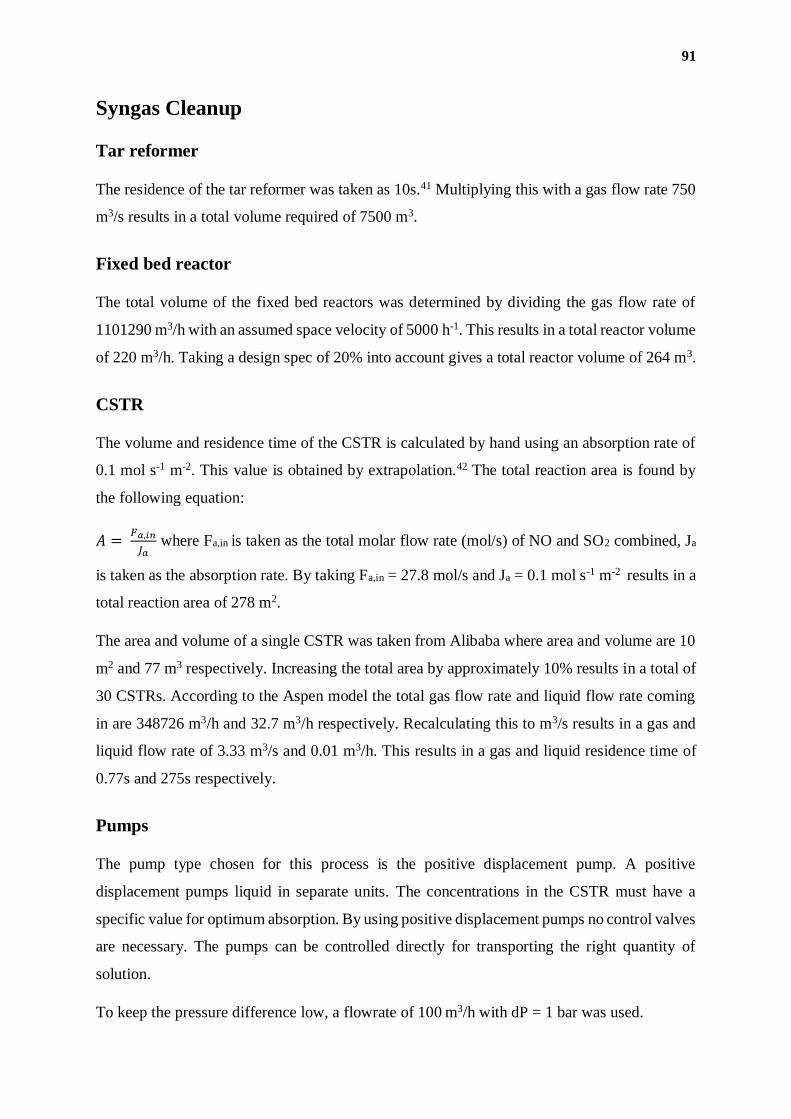
91
Syngas Cleanup
Tar reformer
The residence of the tar reformer was taken as 10s.41 Multiplying this with a gas flow rate 750
m3/s results in a total volume required of 7500 m3.
Fixed bed reactor
The total volume of the fixed bed reactors was determined by dividing the gas flow rate of
1101290 m3/h with an assumed space velocity of 5000 h-1. This results in a total reactor volume
of 220 m3/h. Taking a design spec of 20% into account gives a total reactor volume of 264 m3.
CSTR
The volume and residence time of the CSTR is calculated by hand using an absorption rate of
0.1 mol s-1 m-2. This value is obtained by extrapolation.42 The total reaction area is found by
the following equation:
𝐴 = 𝐹𝑎,𝑖𝑛
𝐽𝑎 where Fa,in is taken as the total molar flow rate (mol/s) of NO and SO2 combined, Ja
is taken as the absorption rate. By taking Fa,in = 27.8 mol/s and Ja = 0.1 mol s-1 m-2 results in a
total reaction area of 278 m2.
The area and volume of a single CSTR was taken from Alibaba where area and volume are 10
m2 and 77 m3 respectively. Increasing the total area by approximately 10% results in a total of
30 CSTRs. According to the Aspen model the total gas flow rate and liquid flow rate coming
in are 348726 m3/h and 32.7 m3/h respectively. Recalculating this to m3/s results in a gas and
liquid flow rate of 3.33 m3/s and 0.01 m3/h. This results in a gas and liquid residence time of
0.77s and 275s respectively.
Pumps
The pump type chosen for this process is the positive displacement pump. A positive
displacement pumps liquid in separate units. The concentrations in the CSTR must have a
specific value for optimum absorption. By using positive displacement pumps no control valves
are necessary. The pumps can be controlled directly for transporting the right quantity of
solution.
To keep the pressure difference low, a flowrate of 100 m3/h with dP = 1 bar was used.
92
The pumps transport 60 m3/h with a pressure of 10 barg.43 Three different pump systems are
made to transport 500 m3/h each. This results in 15 pumps, excluding 6 spare pumps.
Tanks
The volume of the tank was determined by assuming a capacity for a day. Multiplying that with
500 m3/h of flow from each tank results in a volume of 12000m3.
Nitrogen Membrane filters
One filter system requires a feed air of 868 Nm3/h and an inlet pressure of 10 barg.44 According
to Aspen the feed gas flow rate is 343202 m3/h. Dividing that with 868 / 10 = 86.8 m3/h results
in a total of approximately 4000 filter systems.
Heat exchangers
The total exchange area was obtained from the Aspen model.
Material of Construction (MoC)
For all equipment that is not in contact with corrosive material 316L or SS316 is used. To
improve the strength of the heat exchanger tubes, 316LW is chosen as material. 316LW is the
welded version of 316L. The tubes need to be strong due to a pressure difference of 9 bar. To
contain a temperature of 1500°C in the tar reformer insulation material is necessary. The same
holds for the furnace. For both ceramic foam (Al 2 O 3 ) is used. The equipment that is in
contact with the corrosive sodium hydroxide is made from Monel, except for the sodium
hydroxide pumps which are made from Carpenter 20. Monel and Carpenter 20 are both nickel
alloys. The nickel alloys are highly resistant to corrosive materials.
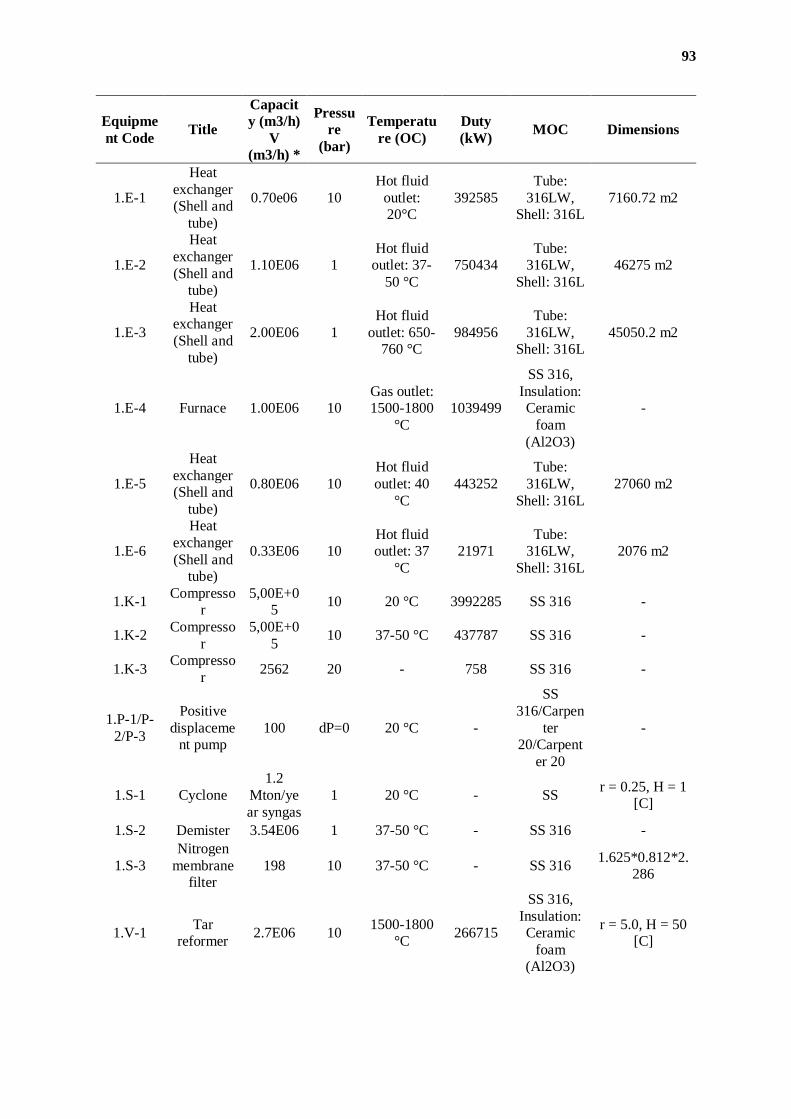
93
Equipme
nt Code Title
Capacit
y (m3/h)
V
(m3/h) *
Pressu
re
(bar)
Temperatu
re (OC)
Duty
(kW) MOC Dimensions
1.E-1
Heat
exchanger
(Shell and
tube)
0.70e06 10
Hot fluid
outlet:
20°C
392585
Tube:
316LW,
Shell: 316L
7160.72 m2
1.E-2
Heat
exchanger
(Shell and
tube)
1.10E06 1
Hot fluid
outlet: 37-
50 °C
750434
Tube:
316LW,
Shell: 316L
46275 m2
1.E-3
Heat
exchanger
(Shell and
tube)
2.00E06 1
Hot fluid
outlet: 650-760 °C
984956
Tube:
316LW, Shell: 316L
45050.2 m2
1.E-4 Furnace 1.00E06 10
Gas outlet:
1500-1800
°C
1039499
SS 316,
Insulation:
Ceramic
foam
(Al2O3)
-
1.E-5
Heat
exchanger
(Shell and
tube)
0.80E06 10
Hot fluid
outlet: 40
°C
443252
Tube:
316LW,
Shell: 316L
27060 m2
1.E-6
Heat
exchanger
(Shell and
tube)
0.33E06 10
Hot fluid
outlet: 37
°C
21971
Tube:
316LW,
Shell: 316L
2076 m2
1.K-1 Compresso
r
5,00E+0
5 10 20 °C 3992285 SS 316 -
1.K-2 Compresso
r
5,00E+0
5 10 37-50 °C 437787 SS 316 -
1.K-3 Compresso
r 2562 20 - 758 SS 316 -
1.P-1/P-
2/P-3
Positive
displaceme
nt pump
100 dP=0 20 °C -
SS
316/Carpen
ter
20/Carpent
er 20
-
1.S-1 Cyclone
1.2
Mton/ye
ar syngas
1 20 °C - SS r = 0.25, H = 1
[C]
1.S-2 Demister 3.54E06 1 37-50 °C - SS 316 -
1.S-3
Nitrogen
membrane
filter
198 10 37-50 °C - SS 316 1.625*0.812*2.
286
1.V-1 Tar
reformer 2.7E06 10
1500-1800
°C 266715
SS 316,
Insulation:
Ceramic
foam
(Al2O3)
r = 5.0, H = 50
[C]
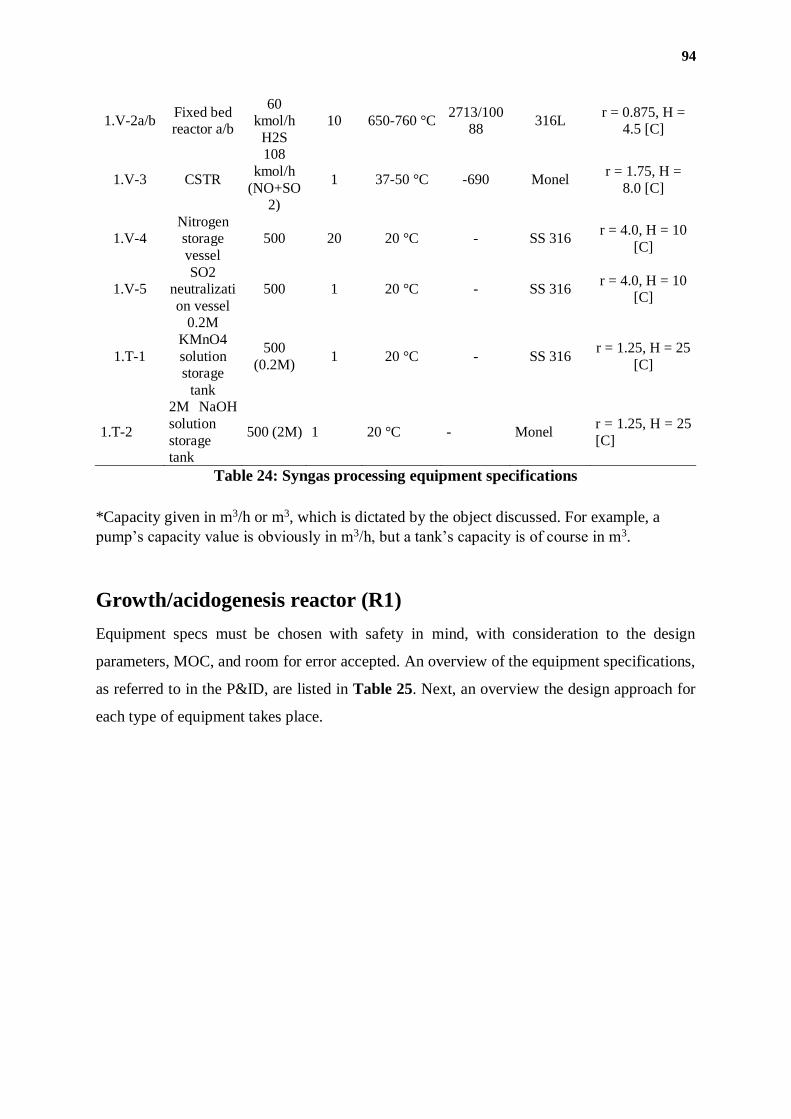
94
1.V-2a/b Fixed bed
reactor a/b
60
kmol/h
H2S
10 650-760 °C 2713/100
88 316L
r = 0.875, H =
4.5 [C]
1.V-3 CSTR
108
kmol/h
(NO+SO
2)
1 37-50 °C -690 Monel r = 1.75, H =
8.0 [C]
1.V-4
Nitrogen
storage
vessel
500 20 20 °C - SS 316 r = 4.0, H = 10
[C]
1.V-5
SO2
neutralizati
on vessel
500 1 20 °C - SS 316 r = 4.0, H = 10
[C]
1.T-1
0.2M
KMnO4
solution storage
tank
500
(0.2M) 1 20 °C - SS 316
r = 1.25, H = 25
[C]
1.T-2
2M NaOH
solution
storage
tank
500 (2M) 1 20 °C - Monel r = 1.25, H = 25
[C]
Table 24: Syngas processing equipment specifications
*Capacity given in m3/h or m3, which is dictated by the object discussed. For example, a
pump’s capacity value is obviously in m3/h, but a tank’s capacity is of course in m3.
Growth/acidogenesis reactor (R1)
Equipment specs must be chosen with safety in mind, with consideration to the design
parameters, MOC, and room for error accepted. An overview of the equipment specifications,
as referred to in the P&ID, are listed in Table 25. Next, an overview the design approach for
each type of equipment takes place.
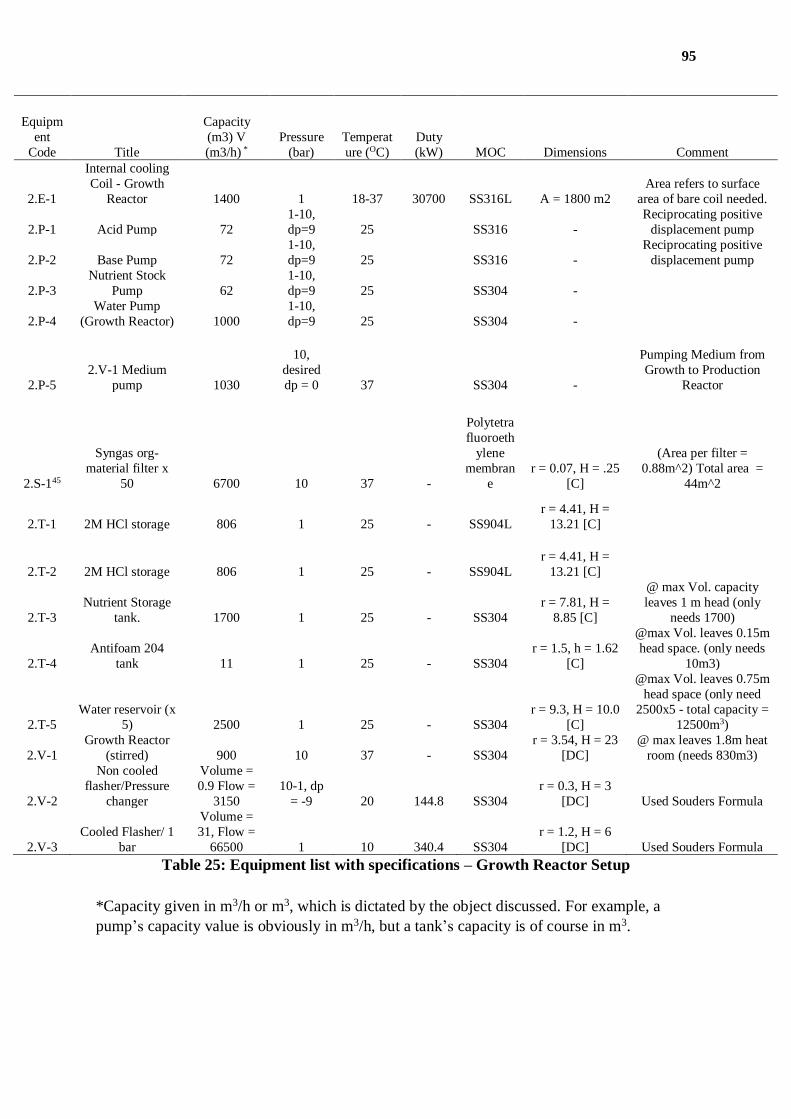
95
Equipm
ent
Code Title
Capacity
(m3) V
(m3/h) *
Pressure
(bar)
Temperat
ure (OC)
Duty
(kW) MOC Dimensions Comment
2.E-1
Internal cooling
Coil - Growth
Reactor 1400 1 18-37 30700 SS316L A = 1800 m2
Area refers to surface
area of bare coil needed.
2.P-1 Acid Pump 72
1-10,
dp=9 25 SS316 -
Reciprocating positive
displacement pump
2.P-2 Base Pump 72
1-10,
dp=9 25 SS316 -
Reciprocating positive
displacement pump
2.P-3
Nutrient Stock
Pump 62
1-10,
dp=9 25 SS304 -
2.P-4
Water Pump
(Growth Reactor) 1000
1-10,
dp=9 25 SS304 -
2.P-5
2.V-1 Medium
pump 1030
10,
desired
dp = 0 37 SS304 -
Pumping Medium from
Growth to Production
Reactor
2.S-145
Syngas org-
material filter x
50 6700 10 37 -
Polytetra
fluoroeth
ylene
membran
e
r = 0.07, H = .25
[C]
(Area per filter =
0.88m^2) Total area =
44m^2
2.T-1 2M HCl storage 806 1 25 - SS904L
r = 4.41, H =
13.21 [C]
2.T-2 2M HCl storage 806 1 25 - SS904L
r = 4.41, H =
13.21 [C]
2.T-3
Nutrient Storage
tank. 1700 1 25 - SS304
r = 7.81, H =
8.85 [C]
@ max Vol. capacity
leaves 1 m head (only
needs 1700)
2.T-4
Antifoam 204
tank 11 1 25 - SS304
r = 1.5, h = 1.62
[C]
@max Vol. leaves 0.15m
head space. (only needs
10m3)
2.T-5
Water reservoir (x
5) 2500 1 25 - SS304
r = 9.3, H = 10.0
[C]
@max Vol. leaves 0.75m
head space (only need
2500x5 - total capacity =
12500m3)
2.V-1
Growth Reactor
(stirred) 900 10 37 - SS304
r = 3.54, H = 23
[DC]
@ max leaves 1.8m heat
room (needs 830m3)
2.V-2
Non cooled
flasher/Pressure
changer
Volume =
0.9 Flow =
3150
10-1, dp
= -9 20 144.8 SS304
r = 0.3, H = 3
[DC] Used Souders Formula
2.V-3
Cooled Flasher/ 1
bar
Volume =
31, Flow =
66500 1 10 340.4 SS304
r = 1.2, H = 6
[DC] Used Souders Formula
Table 25: Equipment list with specifications – Growth Reactor Setup
*Capacity given in m3/h or m3, which is dictated by the object discussed. For example, a
pump’s capacity value is obviously in m3/h, but a tank’s capacity is of course in m3.
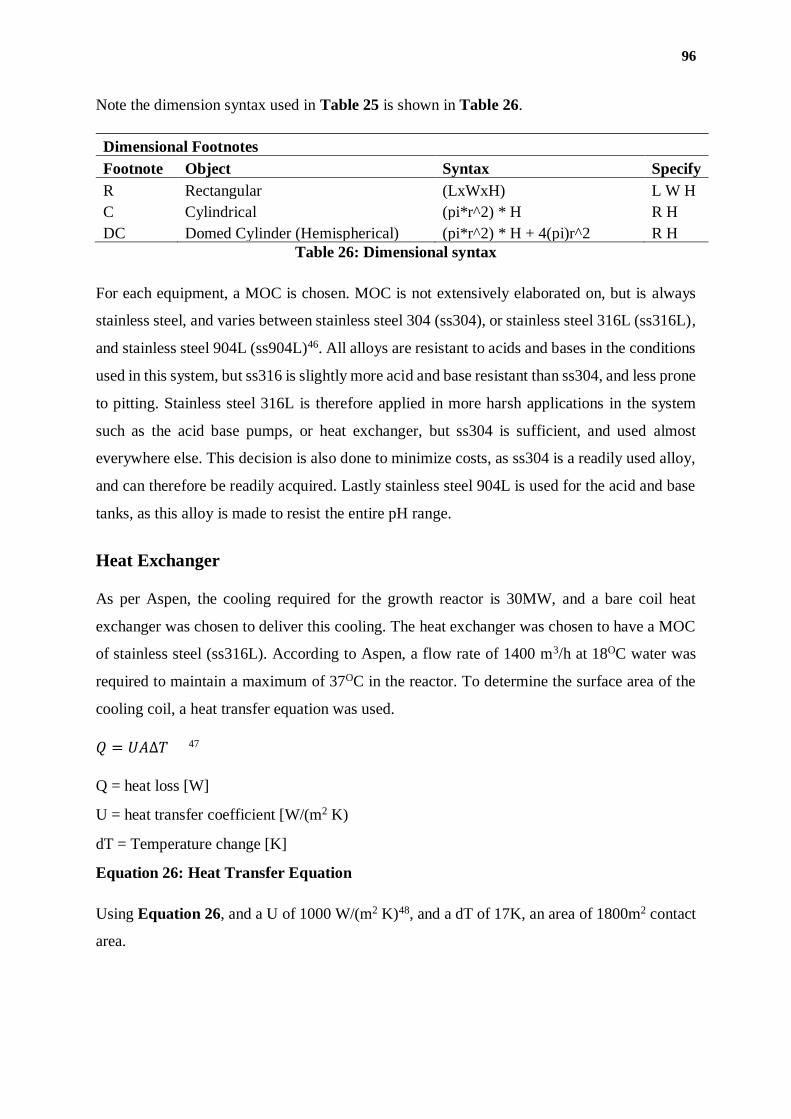
96
Note the dimension syntax used in Table 25 is shown in Table 26.
Dimensional Footnotes
Footnote Object Syntax Specify
R Rectangular (LxWxH) L W H
C Cylindrical (pi*r^2) * H R H
DC Domed Cylinder (Hemispherical) (pi*r^2) * H + 4(pi)r^2 R H
Table 26: Dimensional syntax
For each equipment, a MOC is chosen. MOC is not extensively elaborated on, but is always
stainless steel, and varies between stainless steel 304 (ss304), or stainless steel 316L (ss316L),
and stainless steel 904L (ss904L)46. All alloys are resistant to acids and bases in the conditions
used in this system, but ss316 is slightly more acid and base resistant than ss304, and less prone
to pitting. Stainless steel 316L is therefore applied in more harsh applications in the system
such as the acid base pumps, or heat exchanger, but ss304 is sufficient, and used almost
everywhere else. This decision is also done to minimize costs, as ss304 is a readily used alloy,
and can therefore be readily acquired. Lastly stainless steel 904L is used for the acid and base
tanks, as this alloy is made to resist the entire pH range.
Heat Exchanger
As per Aspen, the cooling required for the growth reactor is 30MW, and a bare coil heat
exchanger was chosen to deliver this cooling. The heat exchanger was chosen to have a MOC
of stainless steel (ss316L). According to Aspen, a flow rate of 1400 m3/h at 18OC water was
required to maintain a maximum of 37OC in the reactor. To determine the surface area of the
cooling coil, a heat transfer equation was used.
𝑄 = 𝑈𝐴∆𝑇 47
Q = heat loss [W]
U = heat transfer coefficient [W/(m2 K)
dT = Temperature change [K]
Equation 26: Heat Transfer Equation
Using Equation 26, and a U of 1000 W/(m2 K)48, and a dT of 17K, an area of 1800m2 contact
area.
97
Tanks
Design of tanks was fairly straight forward. The tanks were sized to provide the system with
one day of supply in the case nutrient flow, and 12h in the case of water flow. The design
pressure and temperature is 1 bar and 25OC. These tanks are constructed of ss304, apart from
the acid and base tanks, that were made of ss904L. The acid and base tanks were sized to
provide a significant pH change to the reactor system and provide base and acid to both reactor
1 and 2, though this is not shown in PID. To supply a large excess of acid or base, the acid and
base tanks were sized to account for 5% of the large reactor volume. For economical purposes,
two sets of acid and base tanks are constructed to supply all reactors, and therefore each supply
accounts for 25% of the large reactor 2 volume, or 1612m3. Since both the growth tank and
production tank have their own acid and base supply, the total 1612m3 of acid and base
specified is split between the reactors. The acid and base tanks in the growth reactor section
therefore total 806.0 m3 each. Their design pressure and temperature is 1 bar and 25OC, and
they’re made of ss316L to provide extra protection against the acidic and basic environment.
The nutrient and water tanks are sized a 1:2 height:diameter ratio, to keep a wide base and
shorter height. An additional 1 m of head space is also accounted for, and the nutrient tank
came to a volume of 1700m3 with a radius of 7.81m and height of 8.85m. The acid and base
tanks were designed similarly, and have a radius of 4.41m, and height of 13.21m.
Vessels
The only vessel that is not a flasher in the growth reactor setup is the main reactor. This reactor
is sized similarly to a bubble column, at a 3:1 height:diameter ratio. This is because syngas is
bubbled through the column, so gas residence time should be optimized and similar CSTRs
that use gas feeds have said ratio. This resulted in a reactor radius of 3.54m, and height of 23m.
This also accounted for a 1.8 m head space. The design pressure and temperature of the reactor
was 10bar and 37OC. The MOC used is ss304.
Flashers
Two flashers exist in the current setup, one of which induces a pressure change on the gas flow
of 9 bar without cooling, and the second of which cools the outlet syngas to condense any
remaining ethanol or acetate. Both flashers are made of stainless steel 304, and as per aspen
accept 3150m3/h (2.V-2, 20OC, 10bar-1bar) and 66500 m3/h (2.V-3, 10OC, 1bar). Using Aspen,
the duty per flasher was calculated at 144.8kW and 340.4 kW resp. To determine the size of
98
the flashers, Sounders-Brown theory was used. Sounders-Brown theory states that for a flasher
to achieve reasonable separation, the internal velocity must be within a bound. If one
determines the internal velocity of a flasher, and the volumetric inflow is known, one can solve
for the cross-sectional of said flasher. Sounders-Brown equation provides empirical derived
velocity values k, that are a function of the internal flasher velocity V, and are empirically
determined for different types of flashers and flasher heights.
𝑉 = (𝑘)√𝜌𝐿 − 𝜌𝑣
𝜌𝑣
V = maximum allowable vapor velocity (m/s)
𝜌𝐿 = liquid density
𝜌𝑣 = vapor density
k = empirically determined allowable velocity
Equation 27: Sounders-Brown Equation49
Using an empirically derived k value of 1.3 for flash distillation, and densities provided for the
syngas stream from Aspen, the sizing of the flashers resulted in two cylindrical tanks, with a
radius of 0.3m and height of 3m for flasher 1 (2.V-2, 20OC, 10bar-1bar), and radius of 1.2m
and height of 6m for flasher 2 (2.V-3, 10OC, 1bar).
Pumps
The water and nutrient pumps as well as the media pump after reactor 1 was designed to supply
a steady state flow as determined via the flow calculator in excel. Most pumps use a MOC of
ss304, but the acid and base pumps use ss316, and a design temperature of 25OC for supply
pumps and 37OC for reactor media pump. All supply pumps are rated for a 100m pressure head,
though under running conditions only need a 90m head. The acid and base pumps were
designed to deliver near 10% of the reactor 1 volume within 1 hour, a volume that would
significantly change pH. This resulted in a flow need of near 72m3/h. The nutrient volumetric
flow needs a steady state 58m3/h, and is rated for 62m3/h. Finally, the water inlet needs 920
m3/h capacity, but is rated for 1000 m3/h.
99
Filtration
The filters used for syngas cleaning are 3nm high-flow membrane filters with
polytetrafluoroethylene membranes. The membrane filters are rated to remove bacteria, and
should work to remove organic matter taken out of the reactor by the out-flowing syngas. The
filters are sold by Emflon45, and each have a surface area of 0.88m2. According to calculations
based on rated flow speeds through the membrane filter, 47 filters are needed, so 50 filters will
be used in reality. This totals a surface area of 44m2 of membrane.
Production/solventogenesis reactor (R2)
In the following sections, crucial specification pertaining to the major equipment used in the
solventogenesis reactor section can be found listed, along with brief explanations on important
reasoning behind some the decision. For the specific nomenclature of the equipment, please
refer to Figure 31.
Vessel(s)
A few important point of consideration regarding the specification of vessels, especially
pressure vessels, include its operating pressure, temperature, and pH. The said vessel
specification simply have to met all of the aforementioned requirements. Regarding pressure,
another crucial point of consideration is the geometry of a vessel. Generally, vessels with more
welded joints and edges will be much more prone to stress cracking regardless of its materials
of construction (MoC). This is owing to the so-called tip effect, which concentrates and amplify
stress on a pointy end, thus leading to premature failure. To circumvent the issue with stress
cracking, often additional material would need to be used on the said pointy ends, thus
increasing the overall cost of the material needed to build the vessel. Alternatively, one can
consider a vessel geometry with as little pointy end as possible, implying a sphere being the
most ideal geometry. Sphere however, raises another point of discussion, since it is a shape
bearing the highest surface area-to-volume ratio, which economically, is a quantity one would
like to minimize in the case of building vessels. A compromise would then be, for example, a
cylindrical vessel with domed hemispherical heads, which would be able to better handle
pressure, relative to that of prismatic or flat headed cylindrical vessels. In the case of 3.V-1,
however, as it is a bubble column, an additional important point of consideration is its height-
to-diameter ratio when determining the dimensions of the said vessel. For instance, in the case
of 3.V-1, a relatively high ratio of 6 was chosen to provide a reasonable bubble rise time,
100
whereas in the case of 3.V-2, a very much lower ratio of 1.5 was used to further minimize
material cost of the vessel.
As for a vessel’s MoC, it is important to simultaneously consider a material that is compatible
with the content and process occurring within the vessel, while also keeping in mind cost
consideration and the material’s physical property. For most cases, where mild conditions were
to be involved, stainless steel, especially SS304 alloy, is one of the most commonly used MoC,
owing to its wide range of compatibility and relatively cheap price. Following this section, the
specifications for the two vessels, 3.V-1 and 3.V-2, can be found.
3.V-1
Type : Reaction pressure vessel
Function : Microbe catalyzed fermentation reaction
MoC : Stainless steel (SS304)
Operating P : 10 bar
Operating T : 35°C
Operating pH : 4.4-4.8
Geometry : Cylindrical vessel, hemispherical heads, vertical
Reaction volume : 3500 m3
Dimensions : 54.32m x 9.05m (H x D)
3.V-2
Type : Pressure vessel
Function : Liquid outlet stream pressure relief flasher from 10 bar to 1 bar
(atmospheric)
MoC : Stainless steel (SS304)
Operating P : 10 bar
Operating T : 35°C
Operating pH : 4.4-4.8
Geometry : Cylindrical vessel, hemispherical heads, vertical
Operational volume : 500 m3
Dimensions : 11.27m x 7.51m (H x D)
101
Tank(s)
Much like pressure vessels, a tank or storage tank is essentially an atmospheric vessel.
Therefore, similar points should also be considered pertaining to the design specification of
storage vessels/tanks. Since pressure, in the case of atmospheric storage vessels, are less of an
issue, flat-headed cylindrical geometry can be used as it results in the least amount of surface
area possible in the case of cylindrical vessels. For the same reason mentioned earlier for
pressure vessels, a height-to-diameter ratio of 1.5 was also used in sizing all of the storage
vessels.
Regarding its MoC, much like the pressure vessels, the same applies for storage tanks. A
material that is compatible with the content and function of the vessel has to be considered,
while also keeping in mind the cost of the material and its physical property. For instance, in
the case of 3.T-1 and 3.T-2, where high concentration acid and base, respectively, have to be
contained, a special alloy of stainless steel, SS904L was chosen, as the said alloy was
specifically designed to withstand such harsh condition. Following this section, the
specifications for the storage tanks can be found.
3.T-1
Type : Storage vessel
Function : Containment of aqueous NaOH 2M solution
MoC : Stainless steel (SS304)
Operating P : 1 bar (atmospheric)
Operating T : 25°C (room temperature)
Operating pH : 14
Geometry : Cylindrical vessel, flat heads, vertical
Storage volume : 806.0 m3
Dimensions : 13.21m x 8.81m (H x D)
3.T-2
Type : Storage vessel
Function : Containment of aqueous HCl 2M solution
MoC : Stainless steel (SS304)
Operating P : 1 bar (atmospheric)
Operating T : 25°C (room temperature)
102
Operating pH : 0.3
Geometry : Cylindrical vessel, flat heads, vertical
Storage volume : 806.0 m3
Dimensions : 13.21m x 8.81m (H x D)
3.T-3
Type : Storage vessel
Function : Containment of liquid outlet stream
MoC : Stainless steel (SS304)
Operating P : 1 bar (atmospheric)
Operating T : 35°C
Operating pH : 4.4-4.8
Geometry : Cylindrical vessel, flat heads, vertical
Storage volume : 3500 m3
Dimensions : 21.55m x 14.37m (H x D)
3.T-4
Type : Storage vessel
Function : Containment of water
MoC : Stainless steel (SS304)
Operating P : 1 bar (atmospheric)
Operating T : 25°C
Operating pH : 7
Geometry : Cylindrical vessel, flat heads, vertical
Storage volume : 806.0 m3
Dimensions : 13.21m x 8.81m (H x D)
Pump(s)
A few important point of consideration regarding the specification of pumps, include its
operating flow rate, pressure differential, and temperature. Pumps that suitably met the
specified requirements therefore have to be picked. The flow rate and pressure differential
specification of a pump is simply determined by the process and the function the said pump
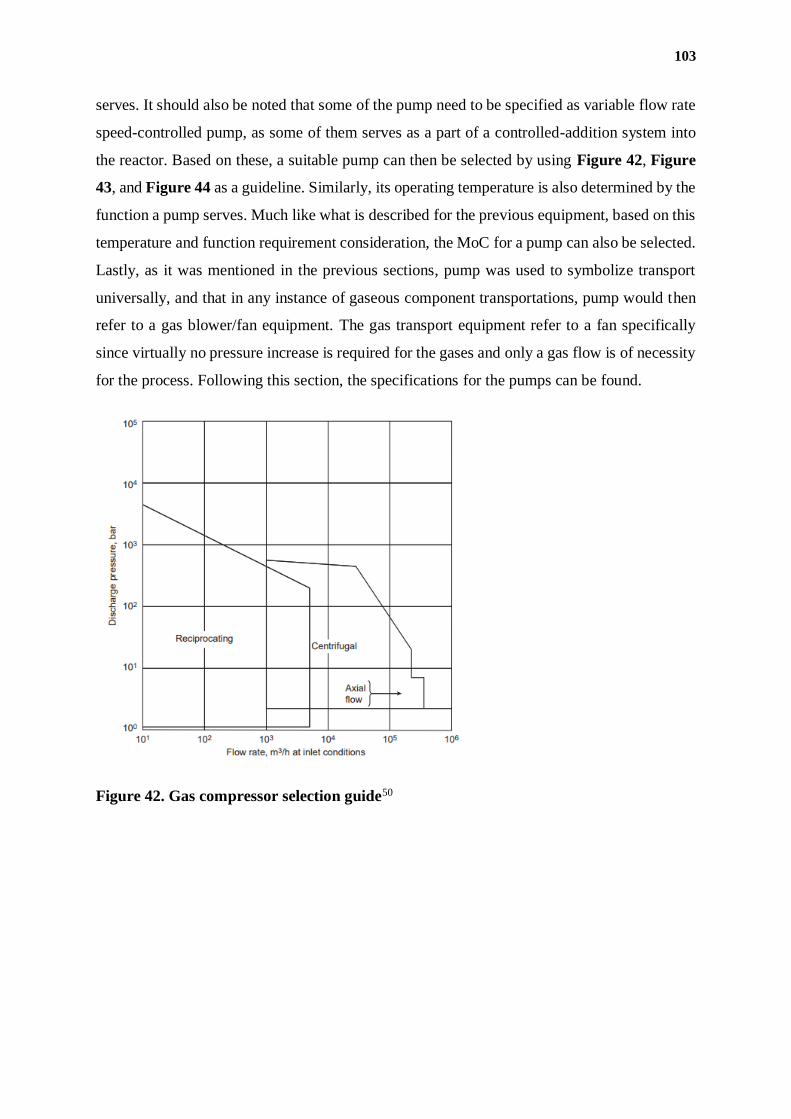
103
serves. It should also be noted that some of the pump need to be specified as variable flow rate
speed-controlled pump, as some of them serves as a part of a controlled-addition system into
the reactor. Based on these, a suitable pump can then be selected by using Figure 42, Figure
43, and Figure 44 as a guideline. Similarly, its operating temperature is also determined by the
function a pump serves. Much like what is described for the previous equipment, based on this
temperature and function requirement consideration, the MoC for a pump can also be selected.
Lastly, as it was mentioned in the previous sections, pump was used to symbolize transport
universally, and that in any instance of gaseous component transportations, pump would then
refer to a gas blower/fan equipment. The gas transport equipment refer to a fan specifically
since virtually no pressure increase is required for the gases and only a gas flow is of necessity
for the process. Following this section, the specifications for the pumps can be found.
Figure 42. Gas compressor selection guide50
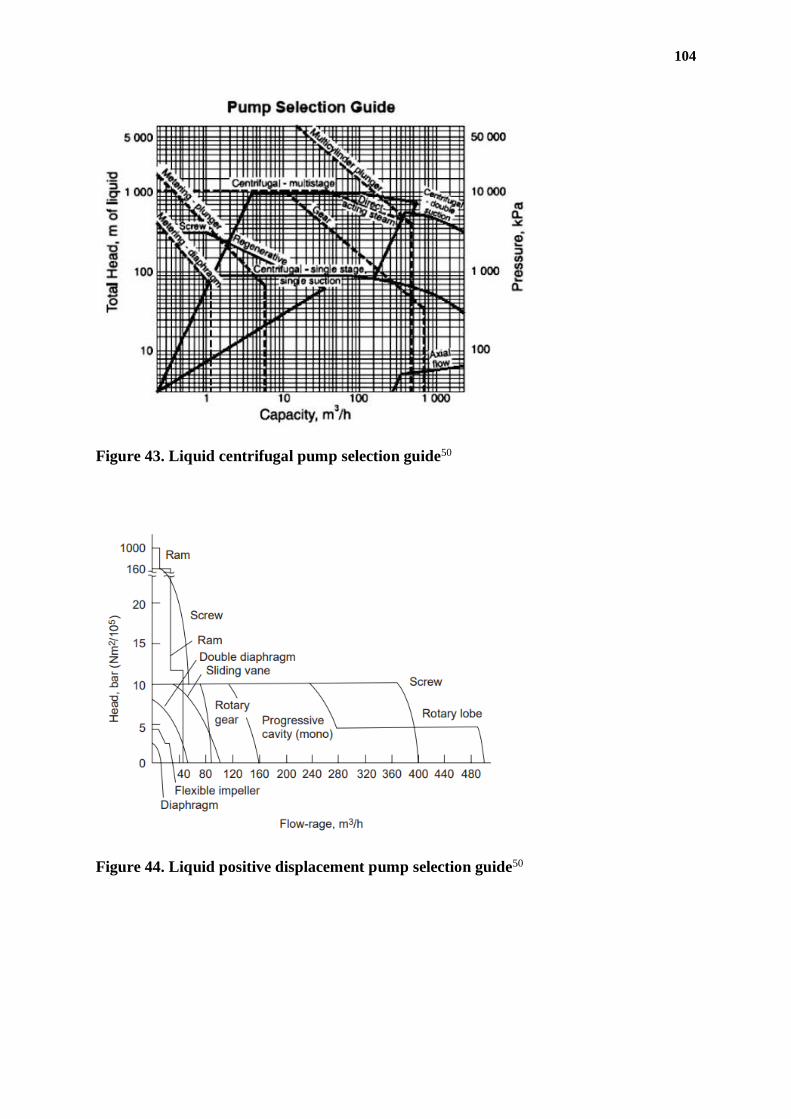
104
Figure 43. Liquid centrifugal pump selection guide50
Figure 44. Liquid positive displacement pump selection guide50
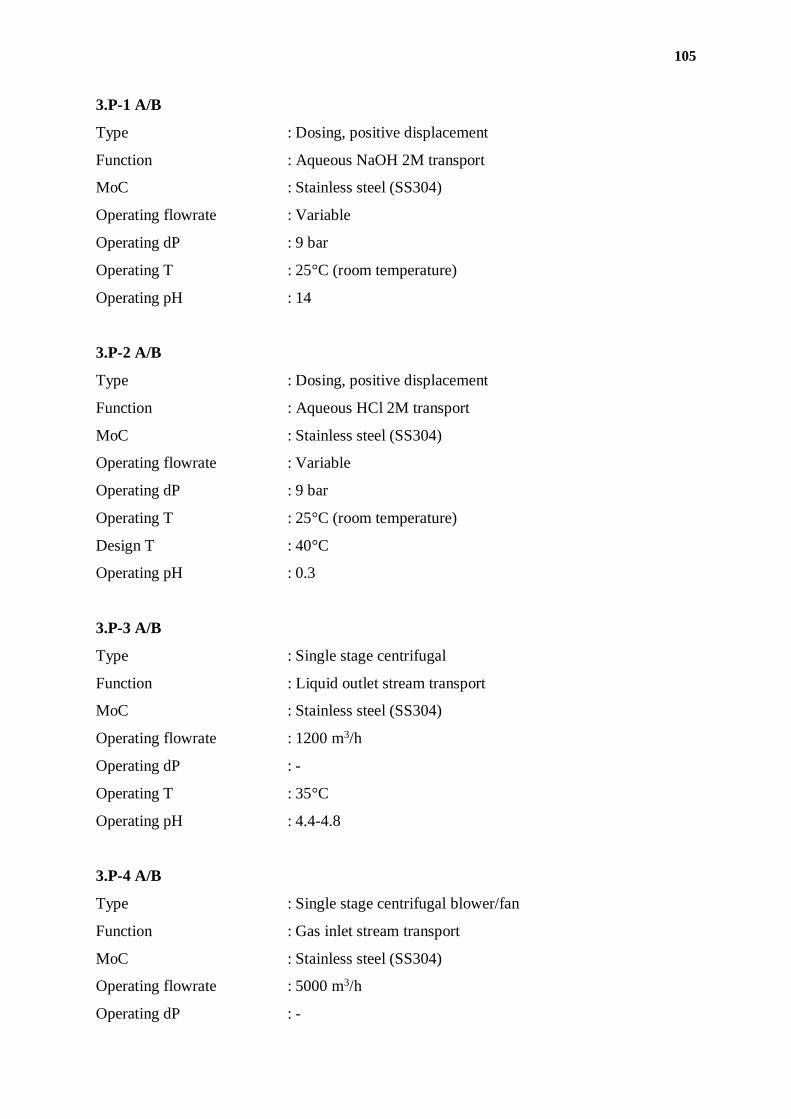
105
3.P-1 A/B
Type : Dosing, positive displacement
Function : Aqueous NaOH 2M transport
MoC : Stainless steel (SS304)
Operating flowrate : Variable
Operating dP : 9 bar
Operating T : 25°C (room temperature)
Operating pH : 14
3.P-2 A/B
Type : Dosing, positive displacement
Function : Aqueous HCl 2M transport
MoC : Stainless steel (SS304)
Operating flowrate : Variable
Operating dP : 9 bar
Operating T : 25°C (room temperature)
Design T : 40°C
Operating pH : 0.3
3.P-3 A/B
Type : Single stage centrifugal
Function : Liquid outlet stream transport
MoC : Stainless steel (SS304)
Operating flowrate : 1200 m3/h
Operating dP : -
Operating T : 35°C
Operating pH : 4.4-4.8
3.P-4 A/B
Type : Single stage centrifugal blower/fan
Function : Gas inlet stream transport
MoC : Stainless steel (SS304)
Operating flowrate : 5000 m3/h
Operating dP : -
106
Operating T : 35°C
Operating pH : -
3.P-5 A/B
Type : Dosing, e.g. PWM fan, reciprocating positive displacement
fan/blower
Function : Gaseous H2 transport to inlet stream
MoC : Stainless steel (SS304)
Operating flowrate : 17500 m3/h
Operating dP : -
Operating T : 35°C
3.P-6 A/B
Type : Dosing, positive displacement
Function : Water transport
MoC : Stainless steel (SS304)
Operating flowrate : Variable
Operating dP : 9 bar
Operating T : 25°C (room temperature)
Operating pH : 7
3.P-7 A/B
Type : Dosing, positive displacement
Function : Antifoam 204 transport
MoC : Stainless steel (SS304)
Operating flowrate : Variable
Operating dP : 9 bar
Operating T : 25°C (room temperature)
Operating pH : -
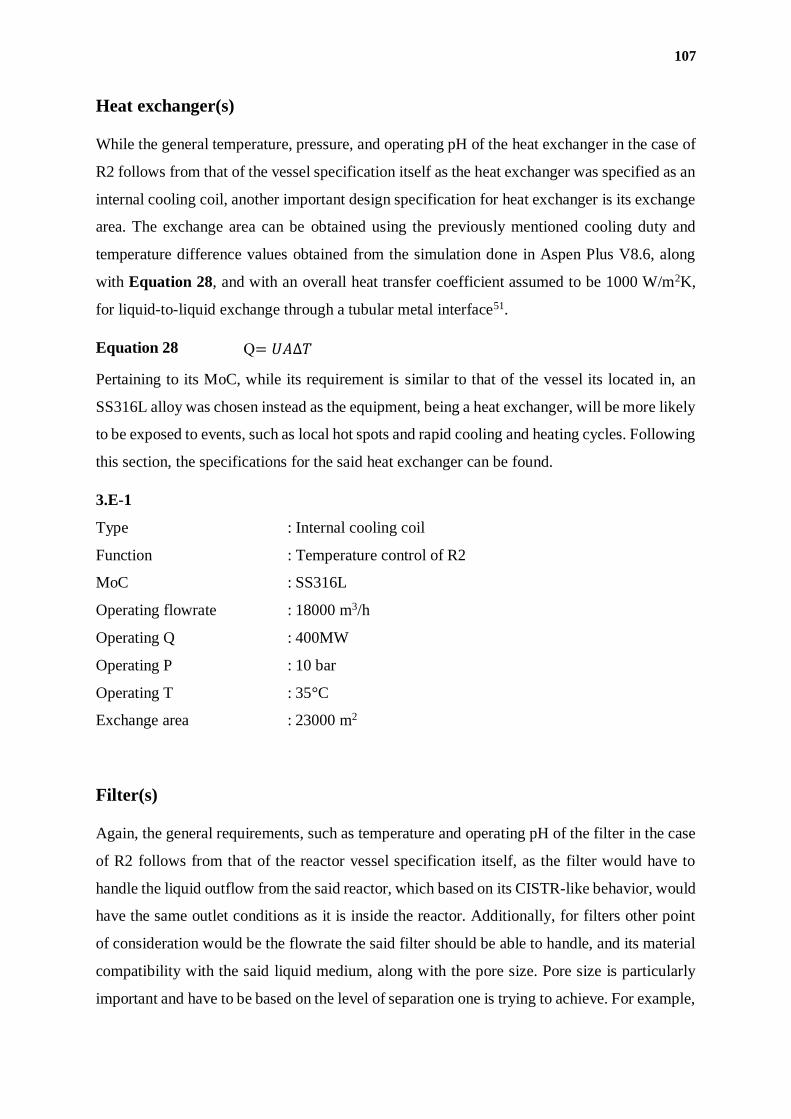
107
Heat exchanger(s)
While the general temperature, pressure, and operating pH of the heat exchanger in the case of
R2 follows from that of the vessel specification itself as the heat exchanger was specified as an
internal cooling coil, another important design specification for heat exchanger is its exchange
area. The exchange area can be obtained using the previously mentioned cooling duty and
temperature difference values obtained from the simulation done in Aspen Plus V8.6, along
with Equation 28, and with an overall heat transfer coefficient assumed to be 1000 W/m2K,
for liquid-to-liquid exchange through a tubular metal interface51.
Equation 28
Pertaining to its MoC, while its requirement is similar to that of the vessel its located in, an
SS316L alloy was chosen instead as the equipment, being a heat exchanger, will be more likely
to be exposed to events, such as local hot spots and rapid cooling and heating cycles. Following
this section, the specifications for the said heat exchanger can be found.
3.E-1
Type : Internal cooling coil
Function : Temperature control of R2
MoC : SS316L
Operating flowrate : 18000 m3/h
Operating Q : 400MW
Operating P : 10 bar
Operating T : 35°C
Exchange area : 23000 m2
Filter(s)
Again, the general requirements, such as temperature and operating pH of the filter in the case
of R2 follows from that of the reactor vessel specification itself, as the filter would have to
handle the liquid outflow from the said reactor, which based on its CISTR-like behavior, would
have the same outlet conditions as it is inside the reactor. Additionally, for filters other point
of consideration would be the flowrate the said filter should be able to handle, and its material
compatibility with the said liquid medium, along with the pore size. Pore size is particularly
important and have to be based on the level of separation one is trying to achieve. For example,
Q= 𝑈𝐴∆𝑇
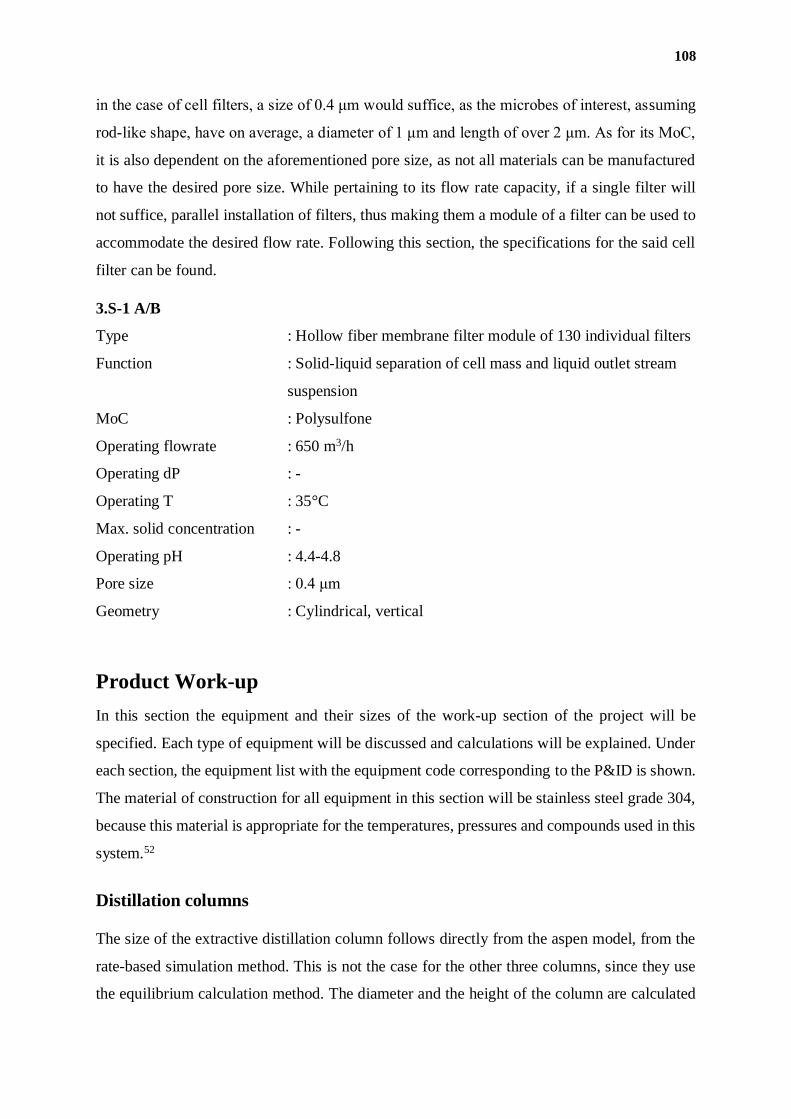
108
in the case of cell filters, a size of 0.4 μm would suffice, as the microbes of interest, assuming
rod-like shape, have on average, a diameter of 1 μm and length of over 2 μm. As for its MoC,
it is also dependent on the aforementioned pore size, as not all materials can be manufactured
to have the desired pore size. While pertaining to its flow rate capacity, if a single filter will
not suffice, parallel installation of filters, thus making them a module of a filter can be used to
accommodate the desired flow rate. Following this section, the specifications for the said cell
filter can be found.
3.S-1 A/B
Type : Hollow fiber membrane filter module of 130 individual filters
Function : Solid-liquid separation of cell mass and liquid outlet stream
suspension
MoC : Polysulfone
Operating flowrate : 650 m3/h
Operating dP : -
Operating T : 35°C
Max. solid concentration : -
Operating pH : 4.4-4.8
Pore size : 0.4 μm
Geometry : Cylindrical, vertical
Product Work-up
In this section the equipment and their sizes of the work-up section of the project will be
specified. Each type of equipment will be discussed and calculations will be explained. Under
each section, the equipment list with the equipment code corresponding to the P&ID is shown.
The material of construction for all equipment in this section will be stainless steel grade 304,
because this material is appropriate for the temperatures, pressures and compounds used in this
system.52
Distillation columns
The size of the extractive distillation column follows directly from the aspen model, from the
rate-based simulation method. This is not the case for the other three columns, since they use
the equilibrium calculation method. The diameter and the height of the column are calculated
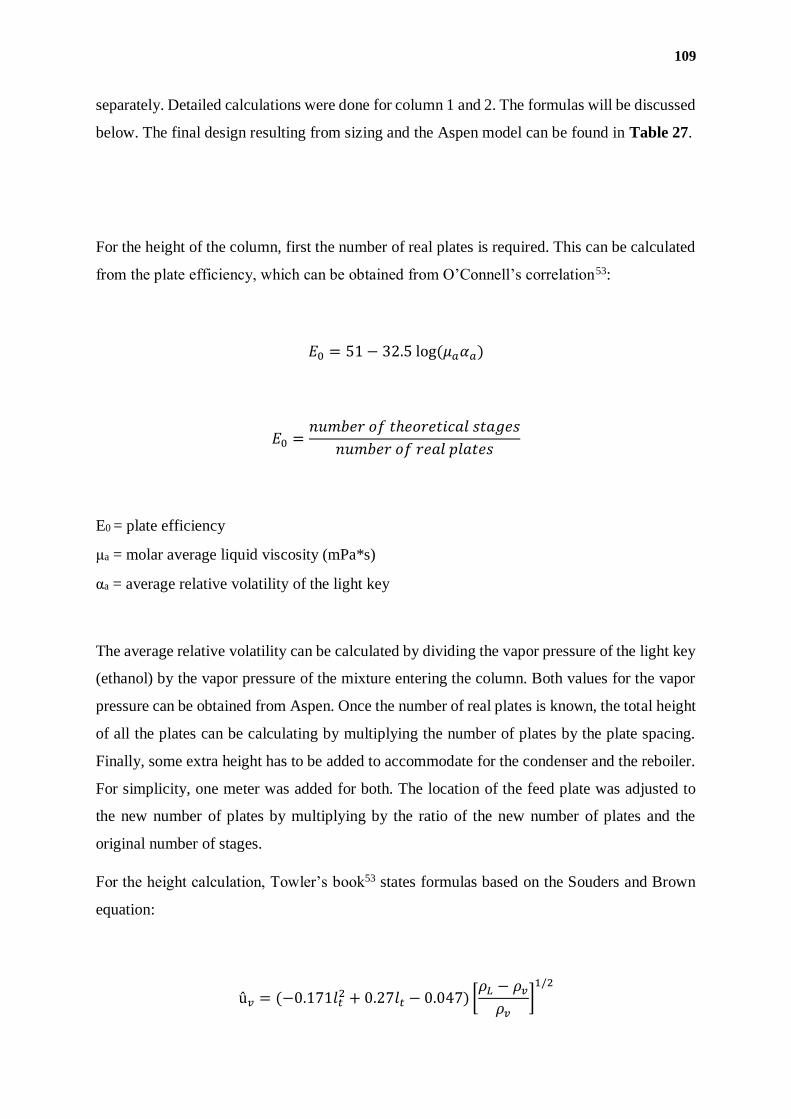
109
separately. Detailed calculations were done for column 1 and 2. The formulas will be discussed
below. The final design resulting from sizing and the Aspen model can be found in Table 27.
For the height of the column, first the number of real plates is required. This can be calculated
from the plate efficiency, which can be obtained from O’Connell’s correlation53:
𝐸0 = 51 − 32.5 log(𝜇𝑎𝛼𝑎)
𝐸0 =𝑛𝑢𝑚𝑏𝑒𝑟 𝑜𝑓 𝑡ℎ𝑒𝑜𝑟𝑒𝑡𝑖𝑐𝑎𝑙 𝑠𝑡𝑎𝑔𝑒𝑠
𝑛𝑢𝑚𝑏𝑒𝑟 𝑜𝑓 𝑟𝑒𝑎𝑙 𝑝𝑙𝑎𝑡𝑒𝑠
E0 = plate efficiency
μa = molar average liquid viscosity (mPa*s)
αa = average relative volatility of the light key
The average relative volatility can be calculated by dividing the vapor pressure of the light key
(ethanol) by the vapor pressure of the mixture entering the column. Both values for the vapor
pressure can be obtained from Aspen. Once the number of real plates is known, the total height
of all the plates can be calculating by multiplying the number of plates by the plate spacing.
Finally, some extra height has to be added to accommodate for the condenser and the reboiler.
For simplicity, one meter was added for both. The location of the feed plate was adjusted to
the new number of plates by multiplying by the ratio of the new number of plates and the
original number of stages.
For the height calculation, Towler’s book53 states formulas based on the Souders and Brown
equation:
û𝑣 = (−0.171𝑙𝑡2 + 0.27𝑙𝑡 − 0.047) [
𝜌𝐿 − 𝜌𝑣
𝜌𝑣]
1/2
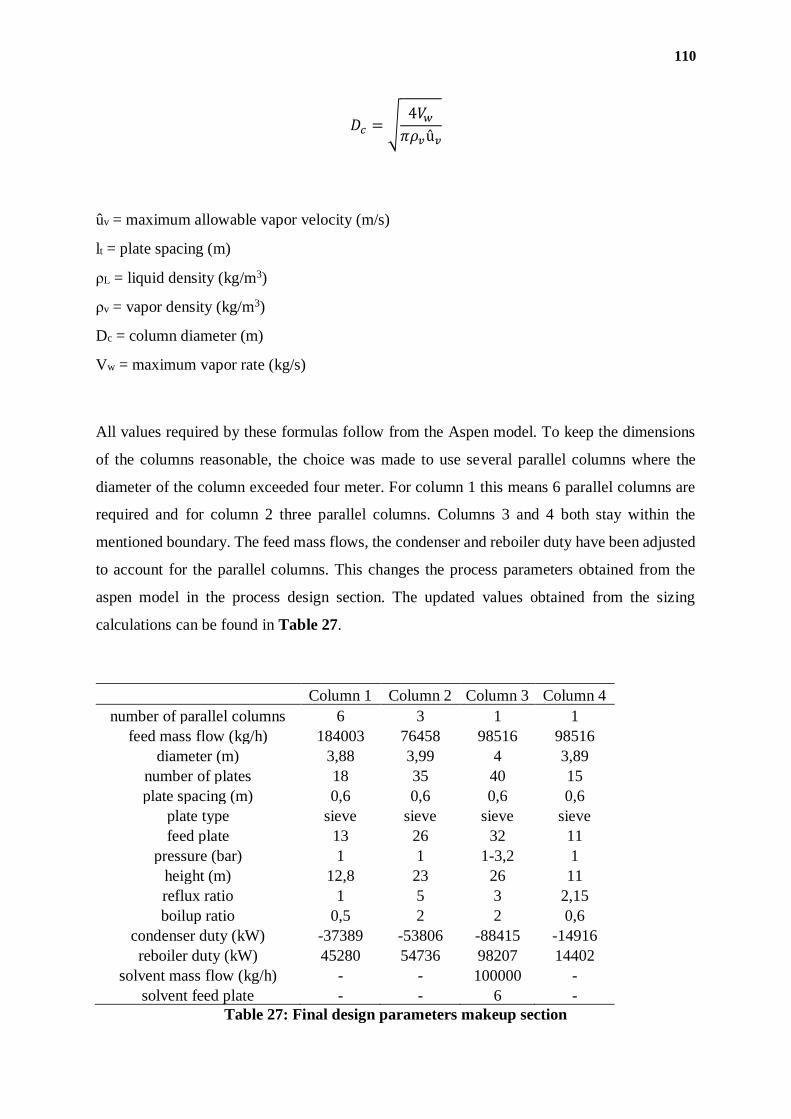
110
𝐷𝑐 = √4𝑉𝑤
𝜋𝜌𝑣û𝑣
ûv = maximum allowable vapor velocity (m/s)
lt = plate spacing (m)
ρL = liquid density (kg/m3)
ρv = vapor density (kg/m3)
Dc = column diameter (m)
Vw = maximum vapor rate (kg/s)
All values required by these formulas follow from the Aspen model. To keep the dimensions
of the columns reasonable, the choice was made to use several parallel columns where the
diameter of the column exceeded four meter. For column 1 this means 6 parallel columns are
required and for column 2 three parallel columns. Columns 3 and 4 both stay within the
mentioned boundary. The feed mass flows, the condenser and reboiler duty have been adjusted
to account for the parallel columns. This changes the process parameters obtained from the
aspen model in the process design section. The updated values obtained from the sizing
calculations can be found in Table 27.
Column 1 Column 2 Column 3 Column 4
number of parallel columns 6 3 1 1
feed mass flow (kg/h) 184003 76458 98516 98516
diameter (m) 3,88 3,99 4 3,89
number of plates 18 35 40 15
plate spacing (m) 0,6 0,6 0,6 0,6
plate type sieve sieve sieve sieve
feed plate 13 26 32 11
pressure (bar) 1 1 1-3,2 1
height (m) 12,8 23 26 11
reflux ratio 1 5 3 2,15
boilup ratio 0,5 2 2 0,6
condenser duty (kW) -37389 -53806 -88415 -14916
reboiler duty (kW) 45280 54736 98207 14402
solvent mass flow (kg/h) - - 100000 -
solvent feed plate - - 6 -
Table 27: Final design parameters makeup section
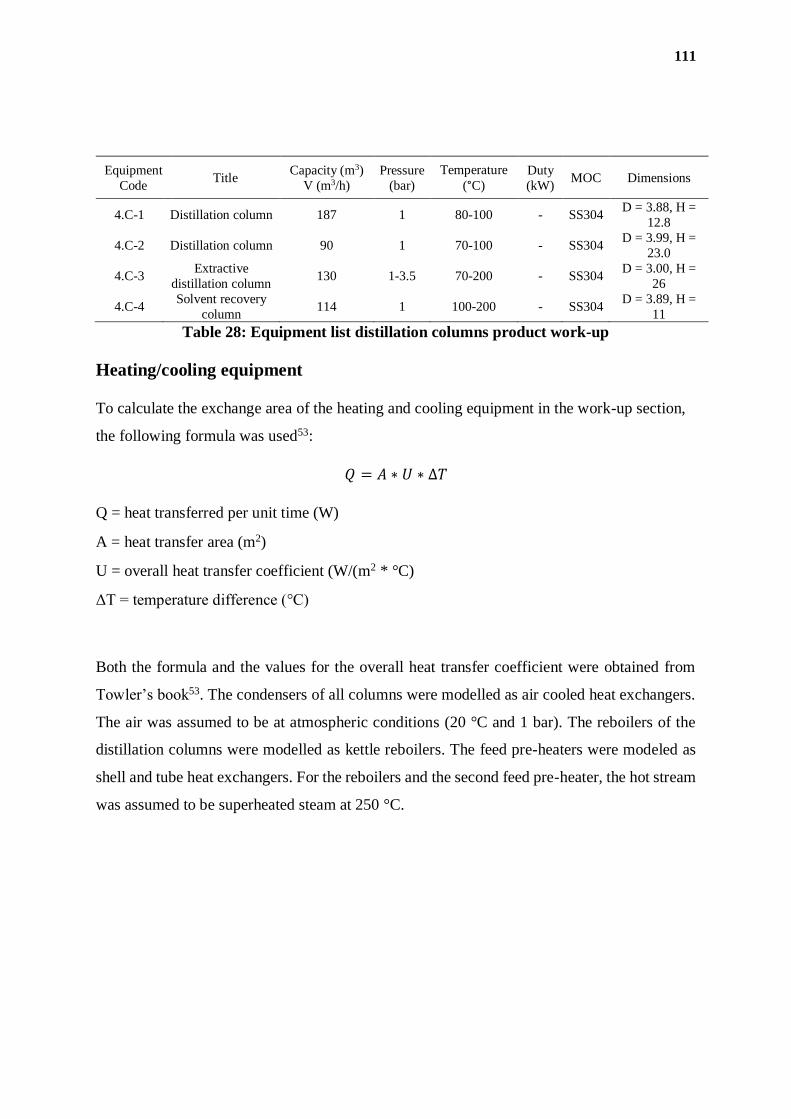
111
Equipment
Code Title
Capacity (m3)
V (m3/h)
Pressure
(bar)
Temperature
(°C)
Duty
(kW) MOC Dimensions
4.C-1 Distillation column 187 1 80-100 - SS304 D = 3.88, H =
12.8
4.C-2 Distillation column 90 1 70-100 - SS304 D = 3.99, H =
23.0
4.C-3 Extractive
distillation column 130 1-3.5 70-200 - SS304
D = 3.00, H =
26
4.C-4 Solvent recovery
column 114 1 100-200 - SS304
D = 3.89, H =
11
Table 28: Equipment list distillation columns product work-up
Heating/cooling equipment
To calculate the exchange area of the heating and cooling equipment in the work-up section,
the following formula was used53:
𝑄 = 𝐴 ∗ 𝑈 ∗ ∆𝑇
Q = heat transferred per unit time (W)
A = heat transfer area (m2)
U = overall heat transfer coefficient (W/(m2 * °C)
ΔT = temperature difference (°C)
Both the formula and the values for the overall heat transfer coefficient were obtained from
Towler’s book53. The condensers of all columns were modelled as air cooled heat exchangers.
The air was assumed to be at atmospheric conditions (20 °C and 1 bar). The reboilers of the
distillation columns were modelled as kettle reboilers. The feed pre-heaters were modeled as
shell and tube heat exchangers. For the reboilers and the second feed pre-heater, the hot stream
was assumed to be superheated steam at 250 °C.
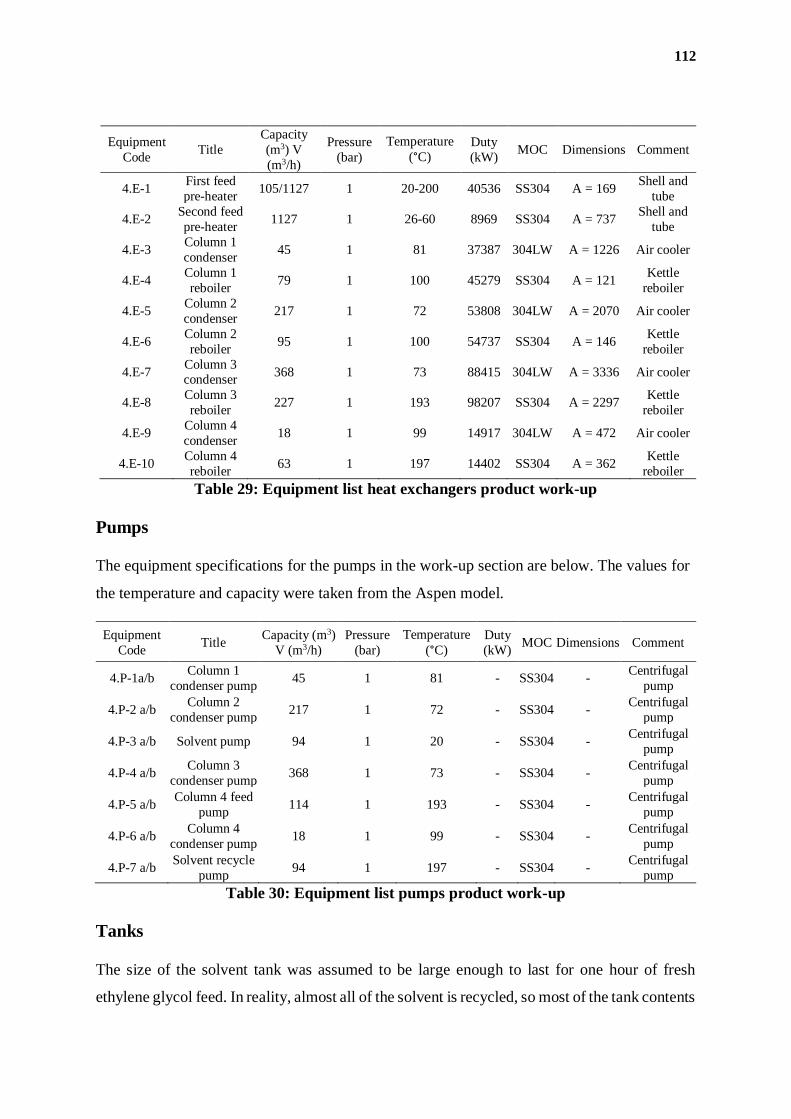
112
Equipment
Code Title
Capacity
(m3) V
(m3/h)
Pressure
(bar)
Temperature
(°C) Duty
(kW) MOC Dimensions Comment
4.E-1 First feed
pre-heater 105/1127 1 20-200 40536 SS304 A = 169
Shell and
tube
4.E-2 Second feed
pre-heater 1127 1 26-60 8969 SS304 A = 737
Shell and
tube
4.E-3 Column 1
condenser 45 1 81 37387 304LW A = 1226 Air cooler
4.E-4 Column 1
reboiler 79 1 100 45279 SS304 A = 121
Kettle
reboiler
4.E-5 Column 2
condenser 217 1 72 53808 304LW A = 2070 Air cooler
4.E-6 Column 2
reboiler 95 1 100 54737 SS304 A = 146
Kettle
reboiler
4.E-7 Column 3 condenser
368 1 73 88415 304LW A = 3336 Air cooler
4.E-8 Column 3
reboiler 227 1 193 98207 SS304 A = 2297
Kettle
reboiler
4.E-9 Column 4
condenser 18 1 99 14917 304LW A = 472 Air cooler
4.E-10 Column 4
reboiler 63 1 197 14402 SS304 A = 362
Kettle
reboiler
Table 29: Equipment list heat exchangers product work-up
Pumps
The equipment specifications for the pumps in the work-up section are below. The values for
the temperature and capacity were taken from the Aspen model.
Equipment
Code Title
Capacity (m3)
V (m3/h)
Pressure
(bar)
Temperature
(°C)
Duty
(kW) MOC Dimensions Comment
4.P-1a/b Column 1
condenser pump 45 1 81 - SS304 -
Centrifugal
pump
4.P-2 a/b Column 2
condenser pump 217 1 72 - SS304 -
Centrifugal
pump
4.P-3 a/b Solvent pump 94 1 20 - SS304 - Centrifugal
pump
4.P-4 a/b Column 3
condenser pump 368 1 73 - SS304 -
Centrifugal
pump
4.P-5 a/b Column 4 feed
pump 114 1 193 - SS304 -
Centrifugal
pump
4.P-6 a/b Column 4
condenser pump 18 1 99 - SS304 -
Centrifugal
pump
4.P-7 a/b Solvent recycle
pump 94 1 197 - SS304 -
Centrifugal
pump
Table 30: Equipment list pumps product work-up
Tanks
The size of the solvent tank was assumed to be large enough to last for one hour of fresh
ethylene glycol feed. In reality, almost all of the solvent is recycled, so most of the tank contents
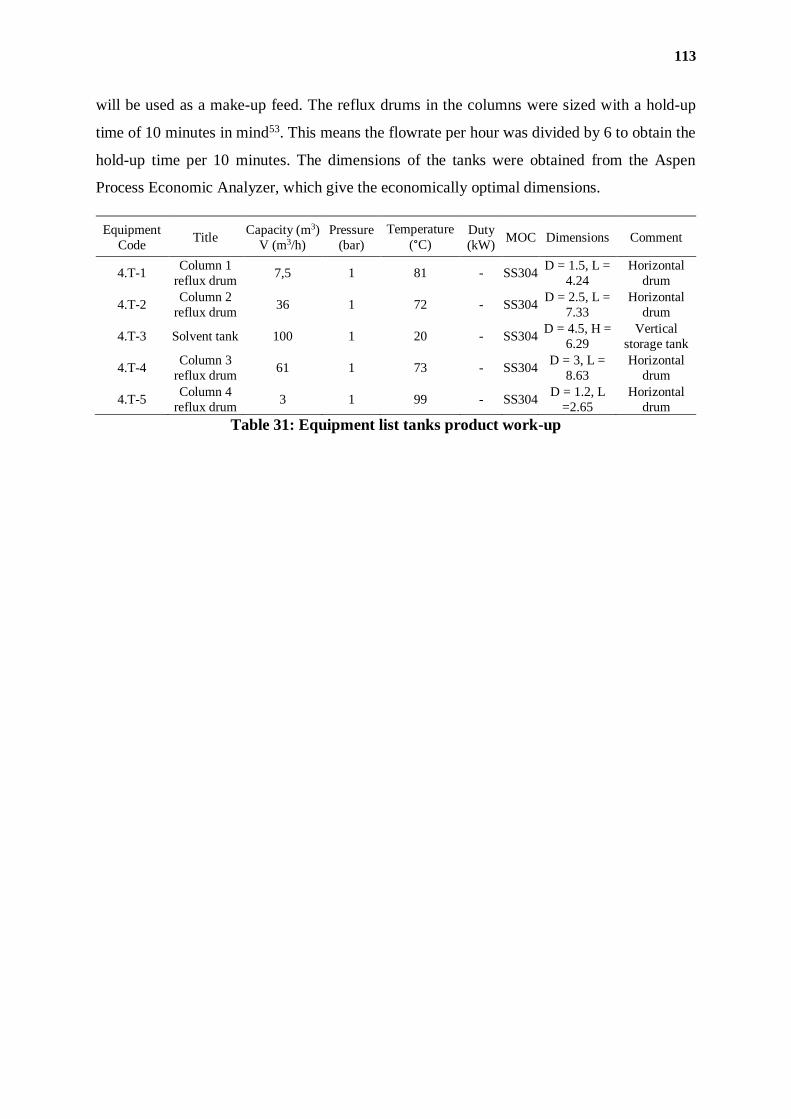
113
will be used as a make-up feed. The reflux drums in the columns were sized with a hold-up
time of 10 minutes in mind53. This means the flowrate per hour was divided by 6 to obtain the
hold-up time per 10 minutes. The dimensions of the tanks were obtained from the Aspen
Process Economic Analyzer, which give the economically optimal dimensions.
Equipment
Code Title
Capacity (m3)
V (m3/h)
Pressure
(bar)
Temperature
(°C) Duty
(kW) MOC Dimensions Comment
4.T-1 Column 1
reflux drum 7,5 1 81 - SS304
D = 1.5, L =
4.24
Horizontal
drum
4.T-2 Column 2
reflux drum 36 1 72 - SS304
D = 2.5, L =
7.33
Horizontal
drum
4.T-3 Solvent tank 100 1 20 - SS304 D = 4.5, H =
6.29
Vertical
storage tank
4.T-4 Column 3
reflux drum 61 1 73 - SS304
D = 3, L =
8.63
Horizontal
drum
4.T-5 Column 4
reflux drum 3 1 99 - SS304
D = 1.2, L
=2.65
Horizontal
drum
Table 31: Equipment list tanks product work-up
114
Chapter V - COST ANALYSIS AND
CONCLUSION
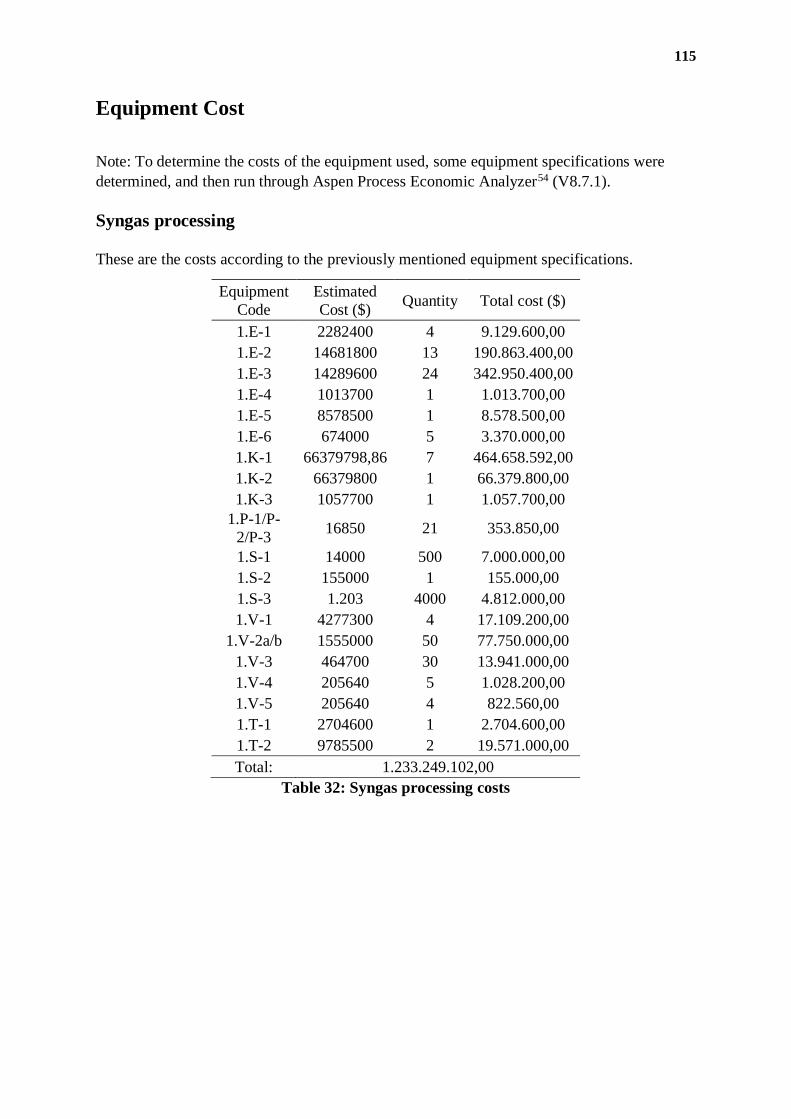
115
Equipment Cost
Note: To determine the costs of the equipment used, some equipment specifications were
determined, and then run through Aspen Process Economic Analyzer54 (V8.7.1).
Syngas processing
These are the costs according to the previously mentioned equipment specifications.
Equipment
Code
Estimated
Cost ($) Quantity Total cost ($)
1.E-1 2282400 4 9.129.600,00
1.E-2 14681800 13 190.863.400,00
1.E-3 14289600 24 342.950.400,00
1.E-4 1013700 1 1.013.700,00
1.E-5 8578500 1 8.578.500,00
1.E-6 674000 5 3.370.000,00
1.K-1 66379798,86 7 464.658.592,00
1.K-2 66379800 1 66.379.800,00
1.K-3 1057700 1 1.057.700,00
1.P-1/P-
2/P-3 16850 21 353.850,00
1.S-1 14000 500 7.000.000,00
1.S-2 155000 1 155.000,00
1.S-3 1.203 4000 4.812.000,00
1.V-1 4277300 4 17.109.200,00
1.V-2a/b 1555000 50 77.750.000,00
1.V-3 464700 30 13.941.000,00
1.V-4 205640 5 1.028.200,00
1.V-5 205640 4 822.560,00
1.T-1 2704600 1 2.704.600,00
1.T-2 9785500 2 19.571.000,00
Total: 1.233.249.102,00
Table 32: Syngas processing costs
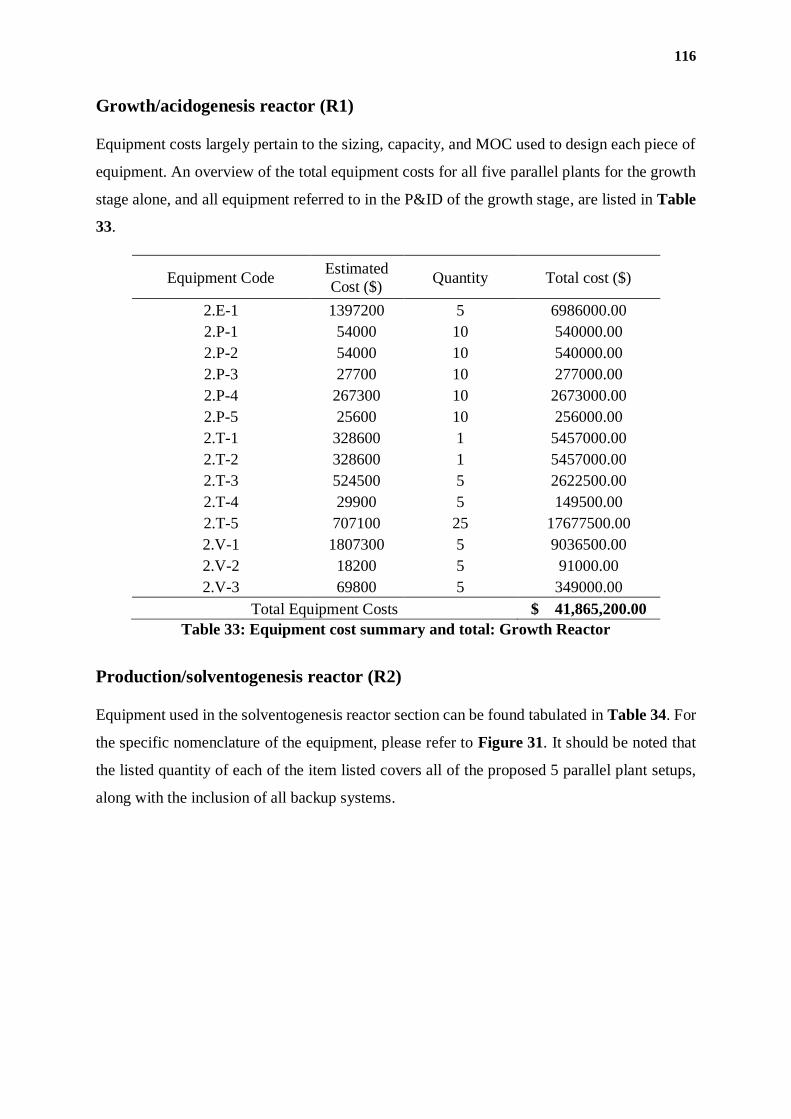
116
Growth/acidogenesis reactor (R1)
Equipment costs largely pertain to the sizing, capacity, and MOC used to design each piece of
equipment. An overview of the total equipment costs for all five parallel plants for the growth
stage alone, and all equipment referred to in the P&ID of the growth stage, are listed in Table
33.
Equipment Code Estimated
Cost ($) Quantity Total cost ($)
2.E-1 1397200 5 6986000.00
2.P-1 54000 10 540000.00
2.P-2 54000 10 540000.00
2.P-3 27700 10 277000.00
2.P-4 267300 10 2673000.00
2.P-5 25600 10 256000.00
2.T-1 328600 1 5457000.00
2.T-2 328600 1 5457000.00
2.T-3 524500 5 2622500.00
2.T-4 29900 5 149500.00
2.T-5 707100 25 17677500.00
2.V-1 1807300 5 9036500.00
2.V-2 18200 5 91000.00
2.V-3 69800 5 349000.00
Total Equipment Costs $ 41,865,200.00
Table 33: Equipment cost summary and total: Growth Reactor
Production/solventogenesis reactor (R2)
Equipment used in the solventogenesis reactor section can be found tabulated in Table 34. For
the specific nomenclature of the equipment, please refer to Figure 31. It should be noted that
the listed quantity of each of the item listed covers all of the proposed 5 parallel plant setups,
along with the inclusion of all backup systems.
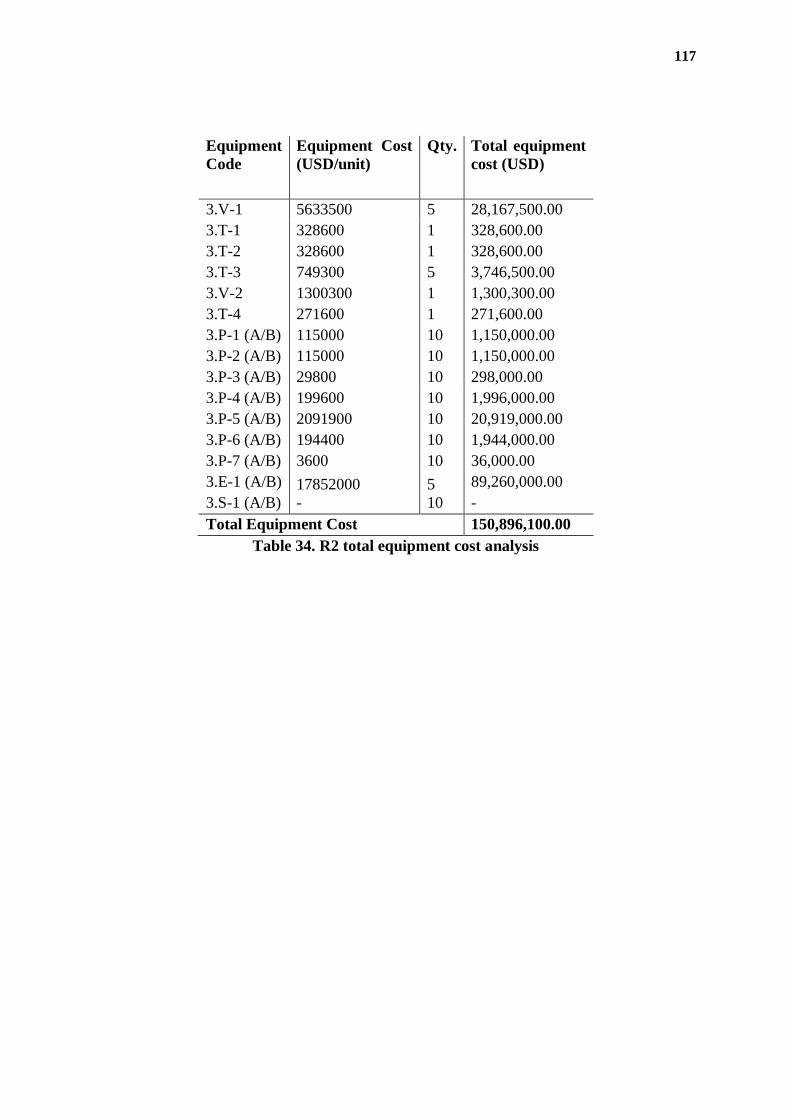
117
Equipment
Code
Equipment Cost
(USD/unit)
Qty. Total equipment
cost (USD)
3.V-1 5633500 5 28,167,500.00
3.T-1 328600 1 328,600.00
3.T-2 328600 1 328,600.00
3.T-3 749300 5 3,746,500.00
3.V-2 1300300 1 1,300,300.00
3.T-4 271600 1 271,600.00
3.P-1 (A/B) 115000 10 1,150,000.00
3.P-2 (A/B) 115000 10 1,150,000.00
3.P-3 (A/B) 29800 10 298,000.00
3.P-4 (A/B) 199600 10 1,996,000.00
3.P-5 (A/B) 2091900 10 20,919,000.00
3.P-6 (A/B) 194400 10 1,944,000.00
3.P-7 (A/B) 3600 10 36,000.00
3.E-1 (A/B) 17852000 5 89,260,000.00
3.S-1 (A/B) - 10 -
Total Equipment Cost 150,896,100.00
Table 34. R2 total equipment cost analysis
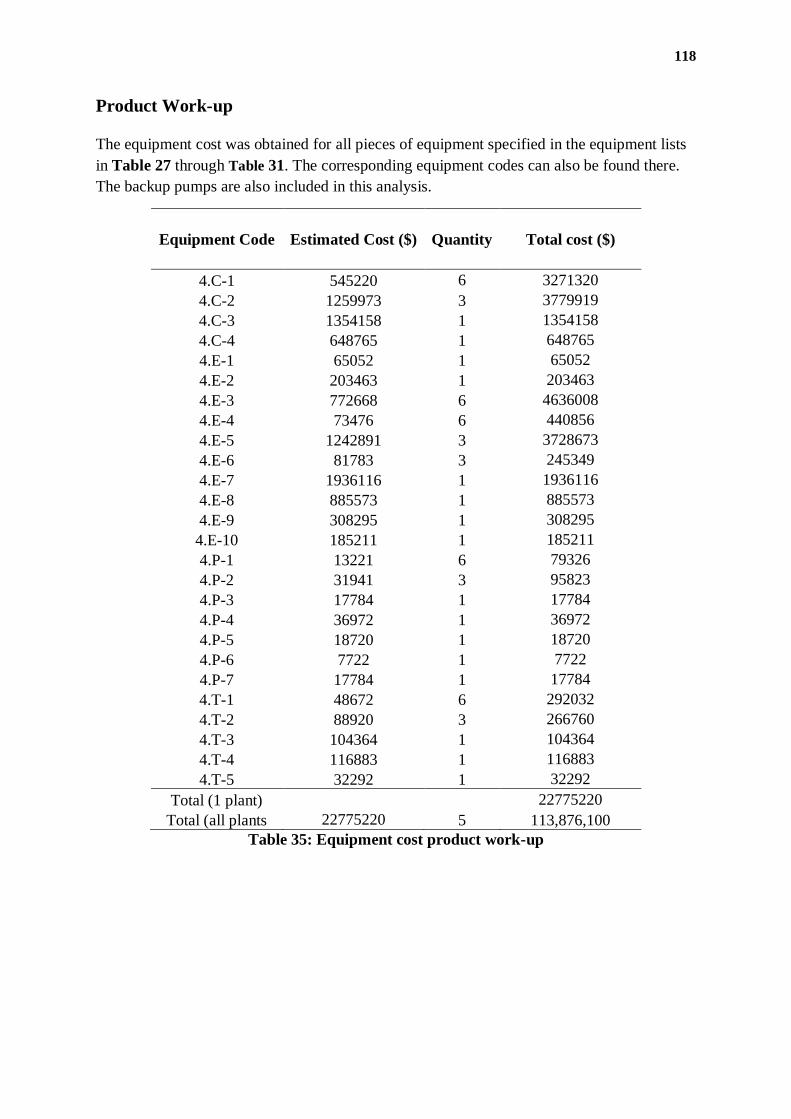
118
Product Work-up
The equipment cost was obtained for all pieces of equipment specified in the equipment lists
in Table 27 through Table 31. The corresponding equipment codes can also be found there.
The backup pumps are also included in this analysis.
Equipment Code Estimated Cost ($) Quantity Total cost ($)
4.C-1 545220 6 3271320
4.C-2 1259973 3 3779919
4.C-3 1354158 1 1354158
4.C-4 648765 1 648765
4.E-1 65052 1 65052
4.E-2 203463 1 203463
4.E-3 772668 6 4636008
4.E-4 73476 6 440856
4.E-5 1242891 3 3728673
4.E-6 81783 3 245349
4.E-7 1936116 1 1936116
4.E-8 885573 1 885573
4.E-9 308295 1 308295
4.E-10 185211 1 185211
4.P-1 13221 6 79326
4.P-2 31941 3 95823
4.P-3 17784 1 17784
4.P-4 36972 1 36972
4.P-5 18720 1 18720
4.P-6 7722 1 7722
4.P-7 17784 1 17784
4.T-1 48672 6 292032
4.T-2 88920 3 266760
4.T-3 104364 1 104364
4.T-4 116883 1 116883
4.T-5 32292 1 32292
Total (1 plant) 22775220
Total (all plants 22775220 5 113,876,100
Table 35: Equipment cost product work-up
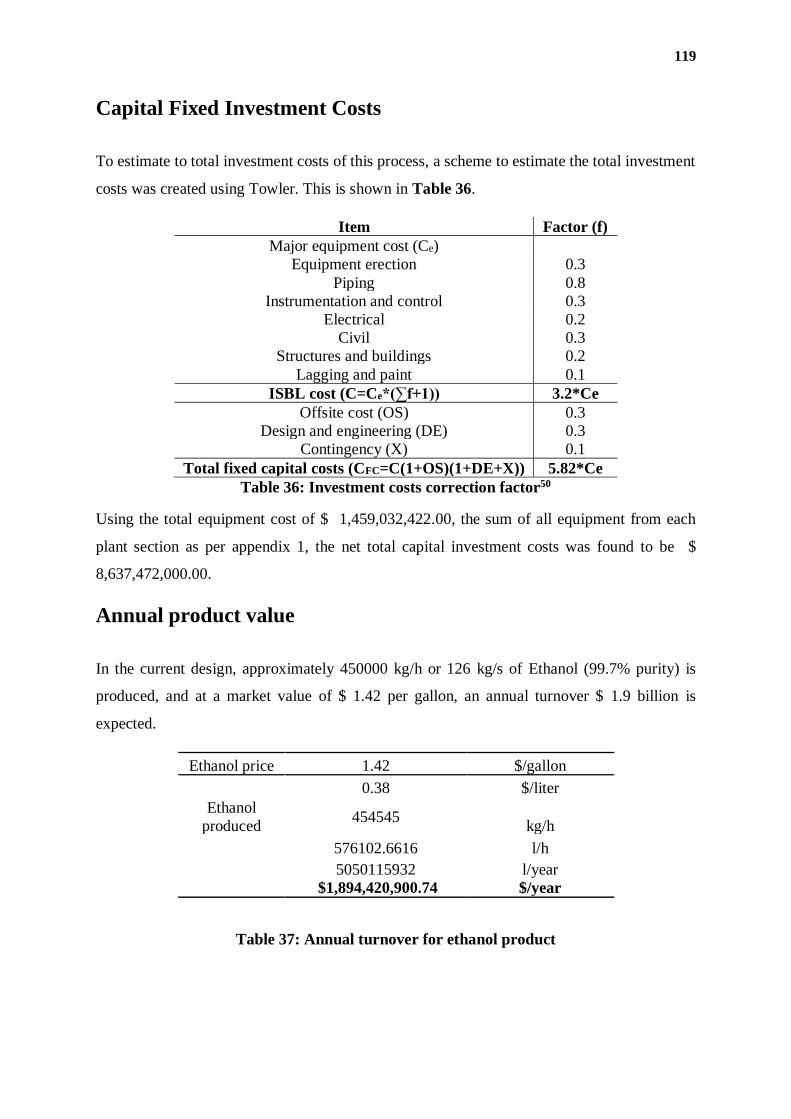
119
Capital Fixed Investment Costs
To estimate to total investment costs of this process, a scheme to estimate the total investment
costs was created using Towler. This is shown in Table 36.
Item Factor (f)
Major equipment cost (Ce)
Equipment erection 0.3
Piping 0.8
Instrumentation and control 0.3
Electrical 0.2
Civil 0.3
Structures and buildings 0.2
Lagging and paint 0.1
ISBL cost (C=Ce*(∑f+1)) 3.2*Ce
Offsite cost (OS) 0.3
Design and engineering (DE) 0.3
Contingency (X) 0.1
Total fixed capital costs (CFC=C(1+OS)(1+DE+X)) 5.82*Ce
Table 36: Investment costs correction factor50
Using the total equipment cost of $ 1,459,032,422.00, the sum of all equipment from each
plant section as per appendix 1, the net total capital investment costs was found to be $
8,637,472,000.00.
Annual product value
In the current design, approximately 450000 kg/h or 126 kg/s of Ethanol (99.7% purity) is
produced, and at a market value of $ 1.42 per gallon, an annual turnover $ 1.9 billion is
expected.
Ethanol price 1.42 $/gallon
0.38 $/liter
Ethanol
produced 454545
kg/h
576102.6616 l/h
5050115932 l/year
$1,894,420,900.74 $/year
Table 37: Annual turnover for ethanol product
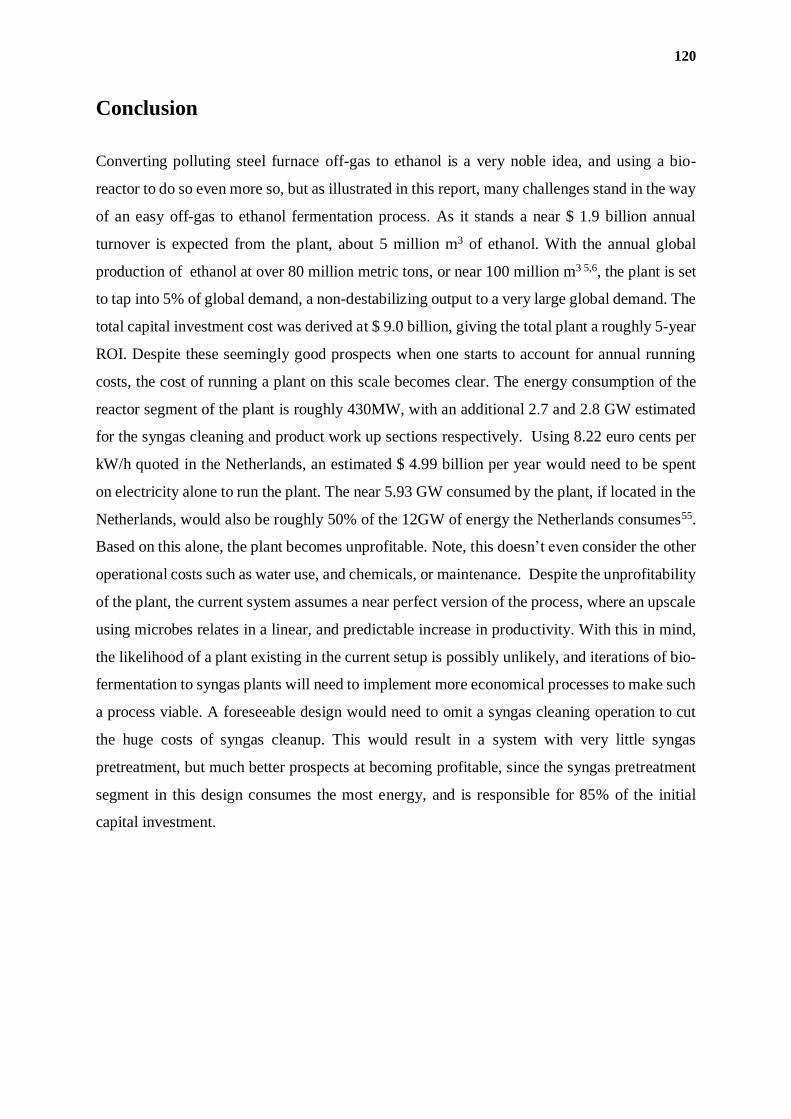
120
Conclusion
Converting polluting steel furnace off-gas to ethanol is a very noble idea, and using a bio-
reactor to do so even more so, but as illustrated in this report, many challenges stand in the way
of an easy off-gas to ethanol fermentation process. As it stands a near $ 1.9 billion annual
turnover is expected from the plant, about 5 million m3 of ethanol. With the annual global
production of ethanol at over 80 million metric tons, or near 100 million m3 5,6, the plant is set
to tap into 5% of global demand, a non-destabilizing output to a very large global demand. The
total capital investment cost was derived at $ 9.0 billion, giving the total plant a roughly 5-year
ROI. Despite these seemingly good prospects when one starts to account for annual running
costs, the cost of running a plant on this scale becomes clear. The energy consumption of the
reactor segment of the plant is roughly 430MW, with an additional 2.7 and 2.8 GW estimated
for the syngas cleaning and product work up sections respectively. Using 8.22 euro cents per
kW/h quoted in the Netherlands, an estimated $ 4.99 billion per year would need to be spent
on electricity alone to run the plant. The near 5.93 GW consumed by the plant, if located in the
Netherlands, would also be roughly 50% of the 12GW of energy the Netherlands consumes55.
Based on this alone, the plant becomes unprofitable. Note, this doesn’t even consider the other
operational costs such as water use, and chemicals, or maintenance. Despite the unprofitability
of the plant, the current system assumes a near perfect version of the process, where an upscale
using microbes relates in a linear, and predictable increase in productivity. With this in mind,
the likelihood of a plant existing in the current setup is possibly unlikely, and iterations of bio-
fermentation to syngas plants will need to implement more economical processes to make such
a process viable. A foreseeable design would need to omit a syngas cleaning operation to cut
the huge costs of syngas cleanup. This would result in a system with very little syngas
pretreatment, but much better prospects at becoming profitable, since the syngas pretreatment
segment in this design consumes the most energy, and is responsible for 85% of the initial
capital investment.

121
Bibliography
122
1 “Blast Furnace Gas.” Wikipedia, Wikimedia Foundation, 19 June 2018,
en.wikipedia.org/wiki/Blast_furnace_gas.
2 Kopalek, Mike. “U.S. Energy Information Administration - EIA - Independent Statistics and
Analysis.” Chinese Coal-Fired Electricity Generation Expected to Flatten as Mix Shifts to
Renewables - Today in Energy - U.S. Energy Information Administration (EIA), 14 Oct.
2014, www.eia.gov/todayinenergy/detail.php?id=18371.
3 Klasson, K T, et al. “Bioreactor Design for Synthesis Gas Fermentations.” Egyptian Journal
of Medical Human Genetics, Elsevier, 12 Aug. 2003,
www.sciencedirect.com/science/article/pii/0016236191901749.
4 The chemistry of steelmaking. The big picture.
http://resources.schoolscience.co.uk/Corus/14-16/steel/msch1pg1.html (accessed Jun 21,
2018). 5 Molitor, B.; Richter, H.; Martin, M.; Jensen, R.; Juminaga, A.; Mihalcea, C.; Angenent, L.
Carbon recovery by fermentation of CO-rich off gases – Turning steel mills into biorefineries
(accessed Jun 21, 2018). 6 Press Releases
https://www.siemens.com/press/en/pressrelease/?press=/en/pressrelease/2013/industry/metals
-techn (accessed Jun 21, 2018). 7 http://www.arpae-summit.com/paperclip/exhibitor_docs/14AE/LanzaTech_Inc._131.pdf
(accessed Jun 21, 2018). 8 Puko, T. Flaring off gas, viewed as wasteful, will soon be ending
http://triblive.com/news/1442093-74/gas-drilling-drillers-flaring-environmental-industry-
ozone-pollution-compressor-fuel (accessed Jun 21, 2018). 9 Fuel Ethanol Market Size & Analysis | Global Industry Report 2014-2025
https://www.grandviewresearch.com/industry-analysis/fuel-ethanol-market (accessed Jun 21,
2018). 10 Siemens and LanzaTech partner to transform steel mill off-gases into bioethanol -
LanzaTech http://www.lanzatech.com/siemens-and-lanzatech-partner-to-transform-steel-mill-
off-gases-into-bioethanol/ (accessed Jun 21, 2018). 11 Zhai, H.; Frey, H.; Rouphail, N.; Gonçalves, G.; Farias, T. Comparison Of Flexible Fuel
Vehicle And Life-Cycle Fuel Consumption And Emissions Of Selected Pollutants And
Greenhouse Gases For Ethanol 85 Versus Gasoline. Journal of the Air & Waste Management
Association 2009, 59, 912-924. 12 https://epure.org/media/1458/160922-european-renewable-ethanol-industry-annual-
statistics-report-2016.pdf (accessed Jun 21, 2018). 13 Pimentel, D.; Patzek, T. Ethanol Production Using Corn, Switchgrass, And Wood;
Biodiesel Production Using Soybean And Sunflower. Natural Resources Research 2005, 14,
65-76. 14 Dry, M. The Fischer–Tropsch Process: 1950–2000. Catalysis Today 2002, 71, 227-241.
123
15 Molitor, B.; Richter, H.; Martin, M.; Jensen, R.; Juminaga, A.; Mihalcea, C.; Angenent, L.
Carbon Recovery By Fermentation Of CO-Rich Off Gases – Turning Steel Mills Into
Biorefineries. Bioresource Technology 2016, 215, 386-396. 16 Huang, H.; Chai, C.; Li, N.; Rowe, P.; Minton, N.; Yang, S.; Jiang, W.; Gu, Y.
CRISPR/Cas9-Based Efficient Genome Editing In Clostridium Ljungdahlii, An Autotrophic
Gas-Fermenting Bacterium. ACS Synthetic Biology 2016, 5, 1355-1361. 17 Bengelsdorf, F.; Straub, M.; Dürre, P. Bacterial Synthesis Gas (Syngas)
Fermentation. Environmental Technology 2013, 34, 1639-1651. 18 Munasinghe, P.; Khanal, S. Biomass-Derived Syngas Fermentation Into Biofuels:
Opportunities And Challenges. Bioresource Technology 2010, 101, 5013-5022. 19 Strauss, E. Coenzyme A Biosynthesis And Enzymology. Comprehensive Natural Products
II 2010, 351-410. 20 Tanner, R.S., Miller, L.M., Yang, D., 1993. Clostridium ljungdahlii sp. nov., an acetogenic
species in clostridial ribosomal-RNA homology group-I. International Journal of Systematic
Bacteriology 43, 232–236. 21 Munasinghe, Pradeep Chaminda, and Samir Kumar Khanal . “Biomass-Derived Syngas
Fermentation into Biofuels: Opportunities and Challenges.” Egyptian Journal of Medical
Human Genetics, Elsevier, 21 Jan. 2010,
www.sciencedirect.com/science/article/pii/S0960852409017635.
22 Richter, H.; Martin, M.; Angenent, L. A Two-Stage Continuous Fermentation System for
Conversion of Syngas into Ethanol (accessed Apr 23, 2018).
23 Klasson, K T, et al. “Bioreactor Design for Synthesis Gas Fermentations.” Egyptian
Journal of Medical Human Genetics, Elsevier, 12 Aug. 2003,
www.sciencedirect.com/science/article/pii/0016236191901749.
24 Abubackar, H.; Veiga, M.; Kennes, C. Biological conversion of carbon monoxide to ethanol:
Effect of pH, gas pressure, reducing agent and yeast extract (accessed May 3, 2018). 25 “1.0 MOTION OF BUBBLES AND BUBBLE CHARACTERSTICS.” UCLA.edu, SEAS
UCLA, www.seas.ucla.edu/stenstro/Bubble.pdf.
26 P.C. Munasinghe, S.K. Khanal / Bioresource Technology 101 (2010) 5013–5022
27 “Henry's Law.” When Chemicals Meet Water—The Properties of Solutions, Annenburg
Learner, www.learner.org/courses/chemistry/text/text.html?dis=U.
28 Datar, Rohit P., et al. “Fermentation of Biomass‐Generated Producer Gas to
Ethanol.” Freshwater Biology, Wiley/Blackwell (10.1111), 15 Apr. 2004 29 Rajagopalan, Srini, et al. “Formation of Ethanol from Carbon Monoxide via a New
Microbial Catalyst.” Egyptian Journal of Medical Human Genetics, Elsevier, 25 Sept. 2002,
www.sciencedirect.com/science/article/pii/S0961953402000715. 30 “Anaerobic Bacteria-Cystine Sulfide Solution - (Oct/13/2012 ).” The Doubling Time of the
Fibroblasts - Cell Biology, www.protocol-online.org/biology-forums-2/posts/27272.html. 31 Hawk, C.; Golden, P.; Storch; H. and Fieldner;. Conversion of Methane to Carbon
Monoxide and Hydrogen
124
32 Torres, W.; Pansare, S.; Goodwin Jr., J. Hot Gas Removal of Tars, Ammonia, and
Hydrogen Sulfide from Biomass Gasification Gas 33 Chu, H.; Chien, T.; Li, S. Simultaneous absorption of SO2 and NO from flue gas with
KMnO4/NaOH solutions 34 naphthalene from coal tar: chemical product info at CHEMINDUSTRY.RU
http://chemindustry.ru/Naphthalene_from_tar.php 35 Clift, R.; Ghadiri, M.; Hoffman, A. A critique of two models for cyclone performance
http://www.academia.edu/20372208/A_critique_of_two_models_for_cyclone_performance 36 Klasson, K.; Ackerson, M.; Clausen, E.; Gaddy, J. Biological Conversion Of Coal And
Coal-Derived Synthesis Gas. Fuel 1993, 72, 1673-1678. 37 Li, GZ., Bai, P. New Operation Strategy for Separation of Ethanol−Water by Extractive
Distillation. Industrial & Engineering Chemistry Research 2012, 51.6, 2723-2729 38 Engineering Toolbox. Solubility of Gases in Water.
https://www.engineeringtoolbox.com/gases-solubility-water-d_1148.html (accessed June 3,
2018) 39 Guidelines for Air Emission Regulation - Environmental Guidelines Nr. 1 2002.” , Danish
Environmental Protection Agency,
eng.mst.dk/media/mst/69141/Guidelines%20for%20Air%20Emission%20Regulation.pdf.
40 Towler, G., Sinnott, R., Chemical Engineering Design: Principles, Practice and Economics
of Plant and Process Design, 2nd ed.; Kidlington, Oxford, U.K.; Waltham, Mass.:
Butterworth-Heinemann, 2013. 41 Tsuboi, Y.; Ito, S.; Takafuji, M.; Ohara, H.; Fujimori, T. Development of a Novel
Reformer for Tar-free Syngas Production 42 Chu, H.; Chien, T.; Li, S. Simultaneous absorption of SO2 and NO from flue gas with
KMnO4/NaOH solutions, Figure 4 43 http://www.ruhrpumpen.com/downloads/92-rdp-reciprocating-plunger-pump-brochure-
en/file, Page 6 44 https://www.generon.com/wp-content/uploads/2017/09/D-ICAB-6808-0617.pdf 45 “Emflon® Filter (Gas Filtration).” Cadence™ Acoustic Separator - Clarification,
shop.pall.com/us/en/microelectronics/display/gas-filtration-purification/emflon-filter-gas-
filtration--zidgri78m4t.
46 Done, Brad. “304 Stainless Steel versus 316 Stainless Steel.” Bollards by Reliance
Foundry, Reliance Foundry Ltd., 22 June 2017, www.reliance-foundry.com/blog/304-vs-316-
stainless-steel.
47 “Heating Systems - Steam and Condensate Loads.” Densities of Solids,
www.engineeringtoolbox.com/steam-condensate-load-heating-systems-d_276.html.
48 “Overall Heat Transfer Coefficient.” Densities of Solids,
www.engineeringtoolbox.com/overall-heat-transfer-coefficientd_434.html.
49 “Souders–Brown Equation.” Wikipedia, Wikimedia Foundation, 19 June 2018,
en.wikipedia.org/wiki/Souders%E2%80%93Brown_equation
125
50 Towler, G.; Sinnott, R. Chemical Engineering Design; Butterworth-Heinemann: Boston,
MA, 2013. 51 Overall Heat Transfer Coefficient Table Charts and Equation | Engineers Edge |
www.engineersedge.com
https://www.engineersedge.com/thermodynamics/overall_heat_transfer-table.htm (accessed
Jun 22, 2018). 52 Azom Materials. Stainless Steel - Grade 304.
https://www.azom.com/article.aspx?ArticleID=965 (accessed June 14, 2018)
53 Towler, G., Sinnott, R., Chemical Engineering Design: Principles, Practice and
Economics of Plant and Process Design, 2nd ed.; Kidlington, Oxford, U.K.; Waltham, Mass.:
Butterworth-Heinemann, 2013. 54 “Aspen Technology.” AspenTech | Asset Optimization Software ,
www.aspentech.com/en/products/pages/aspen-process-economic-analyzer.
54 Energy consumption in the Netherlands
https://www.worlddata.info/europe/netherlands/energy-consumption.php (accessed Jun 22,
2018).

126
Appendix
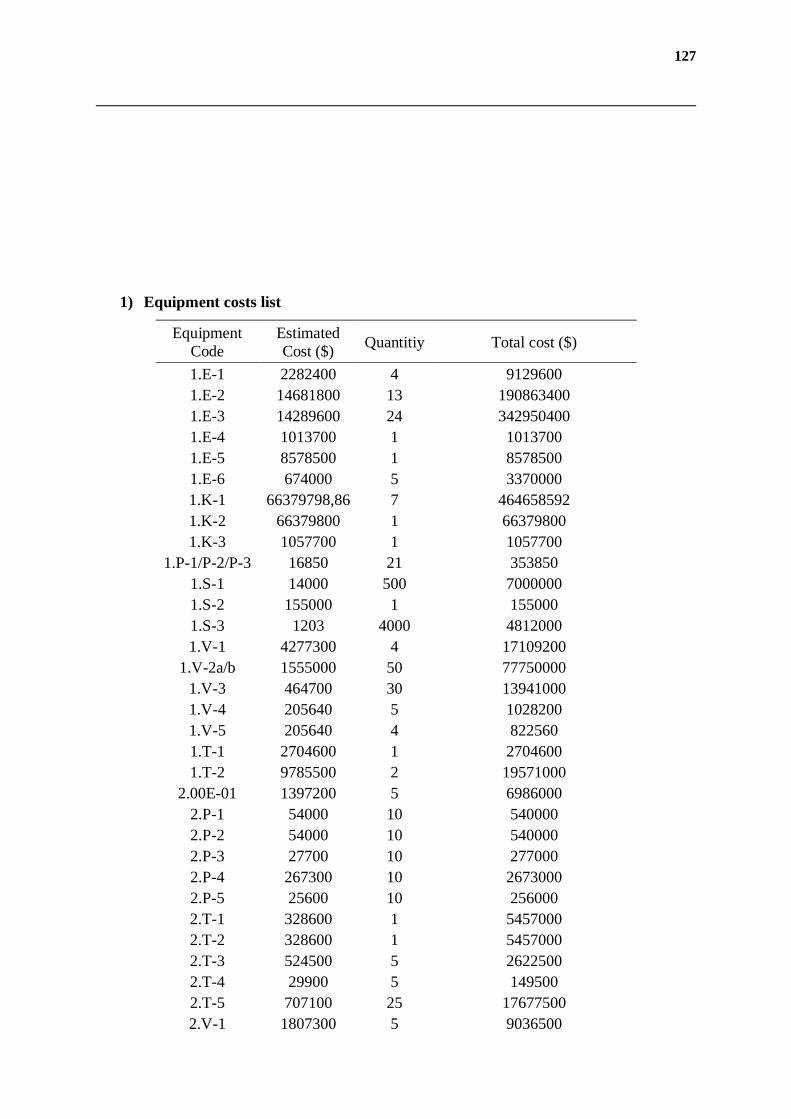
127
1) Equipment costs list
Equipment
Code
Estimated
Cost ($) Quantitiy Total cost ($)
1.E-1 2282400 4 9129600
1.E-2 14681800 13 190863400
1.E-3 14289600 24 342950400
1.E-4 1013700 1 1013700
1.E-5 8578500 1 8578500
1.E-6 674000 5 3370000
1.K-1 66379798,86 7 464658592
1.K-2 66379800 1 66379800
1.K-3 1057700 1 1057700
1.P-1/P-2/P-3 16850 21 353850
1.S-1 14000 500 7000000
1.S-2 155000 1 155000
1.S-3 1203 4000 4812000
1.V-1 4277300 4 17109200
1.V-2a/b 1555000 50 77750000
1.V-3 464700 30 13941000
1.V-4 205640 5 1028200
1.V-5 205640 4 822560
1.T-1 2704600 1 2704600
1.T-2 9785500 2 19571000
2.00E-01 1397200 5 6986000
2.P-1 54000 10 540000
2.P-2 54000 10 540000
2.P-3 27700 10 277000
2.P-4 267300 10 2673000
2.P-5 25600 10 256000
2.T-1 328600 1 5457000
2.T-2 328600 1 5457000
2.T-3 524500 5 2622500
2.T-4 29900 5 149500
2.T-5 707100 25 17677500
2.V-1 1807300 5 9036500
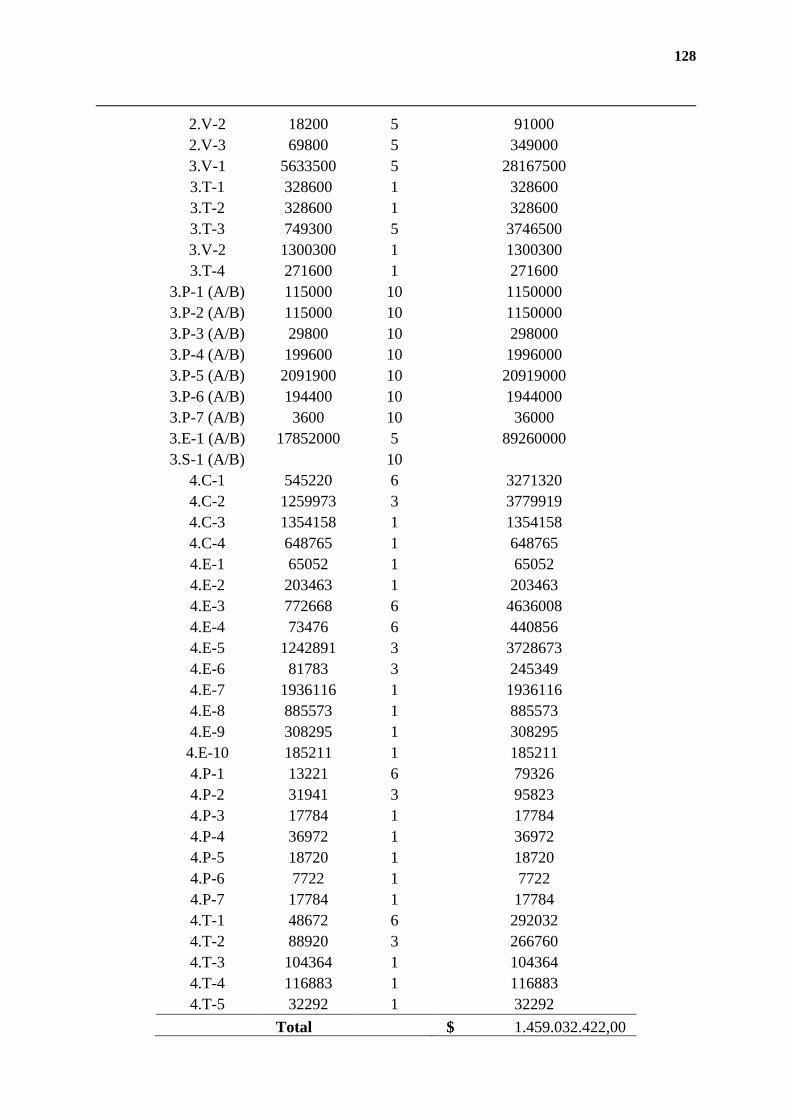
128
2.V-2 18200 5 91000
2.V-3 69800 5 349000
3.V-1 5633500 5 28167500
3.T-1 328600 1 328600
3.T-2 328600 1 328600
3.T-3 749300 5 3746500
3.V-2 1300300 1 1300300
3.T-4 271600 1 271600
3.P-1 (A/B) 115000 10 1150000
3.P-2 (A/B) 115000 10 1150000
3.P-3 (A/B) 29800 10 298000
3.P-4 (A/B) 199600 10 1996000
3.P-5 (A/B) 2091900 10 20919000
3.P-6 (A/B) 194400 10 1944000
3.P-7 (A/B) 3600 10 36000
3.E-1 (A/B) 17852000 5 89260000
3.S-1 (A/B) 10
4.C-1 545220 6 3271320
4.C-2 1259973 3 3779919
4.C-3 1354158 1 1354158
4.C-4 648765 1 648765
4.E-1 65052 1 65052
4.E-2 203463 1 203463
4.E-3 772668 6 4636008
4.E-4 73476 6 440856
4.E-5 1242891 3 3728673
4.E-6 81783 3 245349
4.E-7 1936116 1 1936116
4.E-8 885573 1 885573
4.E-9 308295 1 308295
4.E-10 185211 1 185211
4.P-1 13221 6 79326
4.P-2 31941 3 95823
4.P-3 17784 1 17784
4.P-4 36972 1 36972
4.P-5 18720 1 18720
4.P-6 7722 1 7722
4.P-7 17784 1 17784
4.T-1 48672 6 292032
4.T-2 88920 3 266760
4.T-3 104364 1 104364
4.T-4 116883 1 116883
4.T-5 32292 1 32292
Total $ 1.459.032.422,00
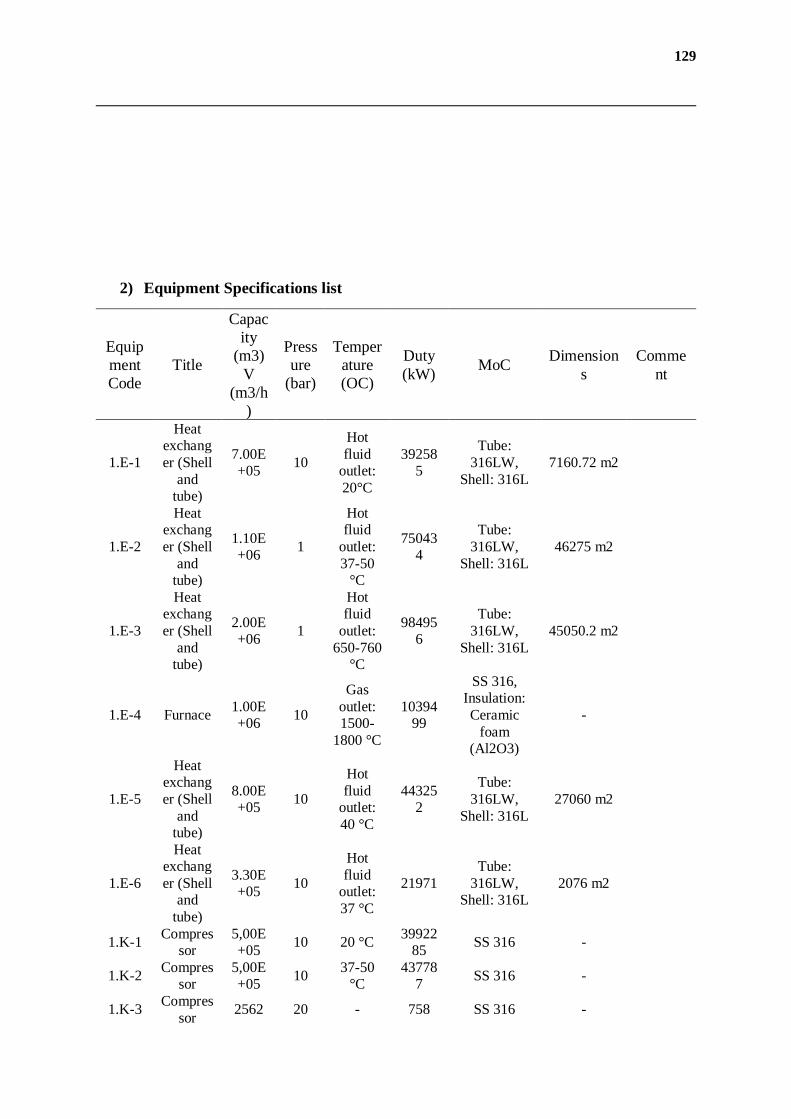
129
2) Equipment Specifications list
Equip
ment
Code
Title
Capac
ity
(m3)
V
(m3/h
)
Press
ure
(bar)
Temper
ature
(OC)
Duty
(kW) MoC
Dimension
s
Comme
nt
1.E-1
Heat
exchang
er (Shell
and
tube)
7.00E
+05 10
Hot
fluid
outlet:
20°C
39258
5
Tube:
316LW,
Shell: 316L
7160.72 m2
1.E-2
Heat
exchang
er (Shell
and
tube)
1.10E
+06 1
Hot
fluid
outlet:
37-50
°C
75043
4
Tube:
316LW,
Shell: 316L
46275 m2
1.E-3
Heat
exchang
er (Shell
and
tube)
2.00E
+06 1
Hot
fluid
outlet:
650-760
°C
98495
6
Tube:
316LW,
Shell: 316L
45050.2 m2
1.E-4 Furnace 1.00E
+06 10
Gas
outlet:
1500-
1800 °C
10394
99
SS 316,
Insulation:
Ceramic
foam
(Al2O3)
-
1.E-5
Heat
exchang
er (Shell
and
tube)
8.00E+05
10
Hot
fluid outlet:
40 °C
443252
Tube:
316LW,
Shell: 316L
27060 m2
1.E-6
Heat
exchang
er (Shell
and
tube)
3.30E
+05 10
Hot
fluid
outlet:
37 °C
21971
Tube:
316LW,
Shell: 316L
2076 m2
1.K-1 Compres
sor
5,00E
+05 10 20 °C
39922
85 SS 316 -
1.K-2 Compres
sor 5,00E+05
10 37-50
°C 43778
7 SS 316 -
1.K-3 Compres
sor 2562 20 - 758 SS 316 -
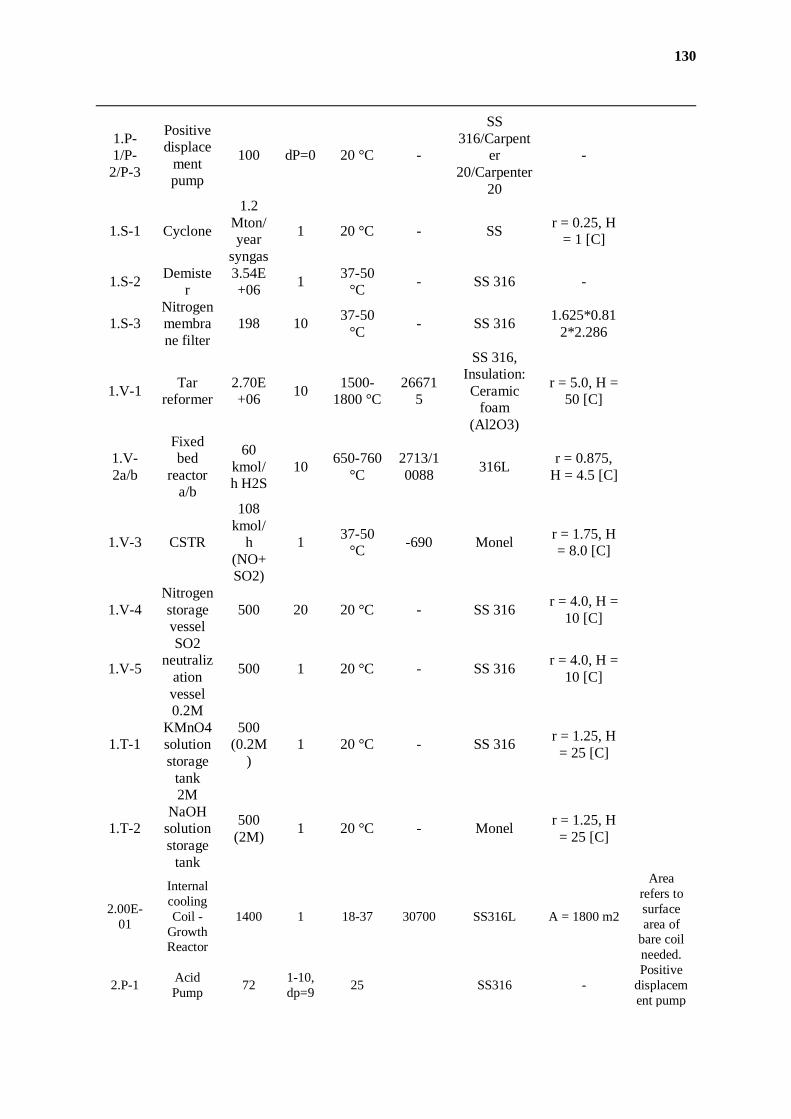
130
1.P-
1/P-
2/P-3
Positive
displace
ment
pump
100 dP=0 20 °C -
SS
316/Carpent
er
20/Carpenter
20
-
1.S-1 Cyclone
1.2
Mton/
year
syngas
1 20 °C - SS r = 0.25, H
= 1 [C]
1.S-2 Demiste
r
3.54E
+06 1
37-50
°C - SS 316 -
1.S-3
Nitrogen
membra
ne filter
198 10 37-50
°C - SS 316
1.625*0.81
2*2.286
1.V-1 Tar
reformer
2.70E
+06 10
1500-
1800 °C
26671
5
SS 316,
Insulation:
Ceramic
foam
(Al2O3)
r = 5.0, H =
50 [C]
1.V-
2a/b
Fixed
bed
reactor
a/b
60
kmol/
h H2S
10 650-760
°C
2713/1
0088 316L
r = 0.875,
H = 4.5 [C]
1.V-3 CSTR
108
kmol/
h
(NO+
SO2)
1 37-50
°C -690 Monel
r = 1.75, H
= 8.0 [C]
1.V-4
Nitrogen
storage
vessel
500 20 20 °C - SS 316 r = 4.0, H =
10 [C]
1.V-5
SO2
neutraliz
ation
vessel
500 1 20 °C - SS 316 r = 4.0, H =
10 [C]
1.T-1
0.2M
KMnO4
solution
storage
tank
500
(0.2M
)
1 20 °C - SS 316 r = 1.25, H
= 25 [C]
1.T-2
2M
NaOH solution
storage
tank
500
(2M) 1 20 °C - Monel
r = 1.25, H
= 25 [C]
2.00E-
01
Internal
cooling
Coil -
Growth Reactor
1400 1 18-37 30700 SS316L A = 1800 m2
Area
refers to
surface
area of bare coil
needed.
2.P-1 Acid
Pump 72
1-10,
dp=9 25 SS316 -
Positive
displacem
ent pump
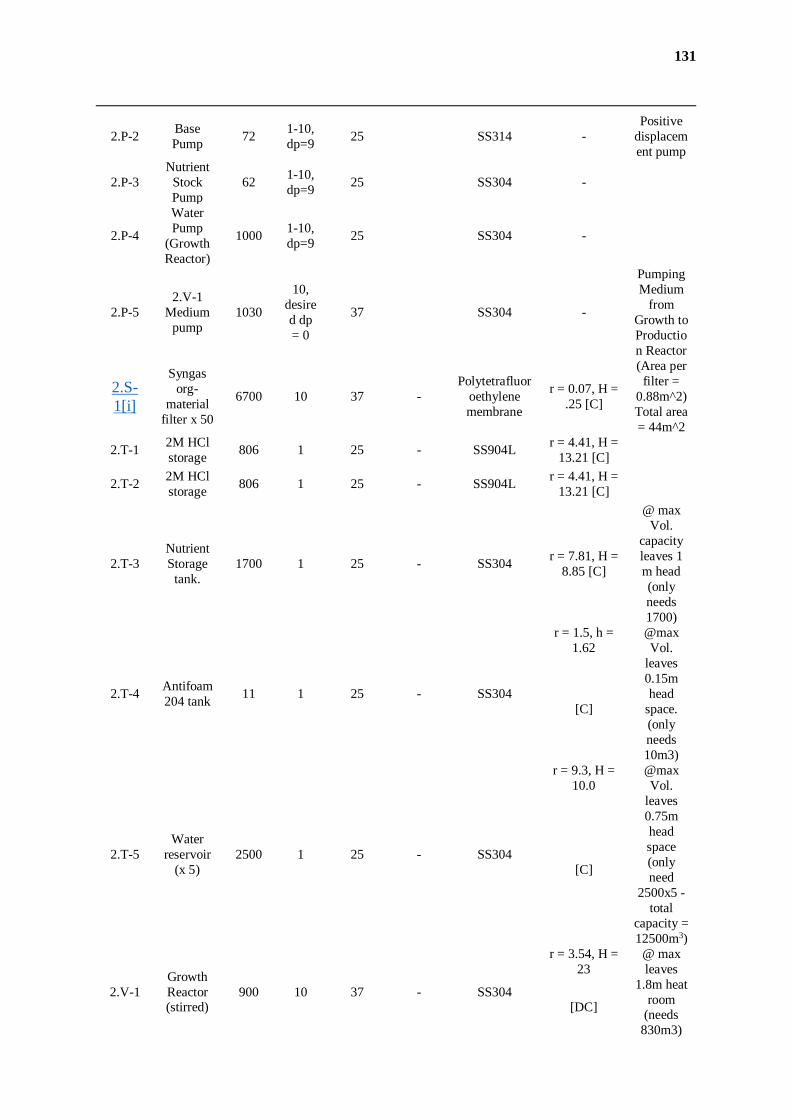
131
2.P-2 Base
Pump 72
1-10,
dp=9 25 SS314 -
Positive
displacem
ent pump
2.P-3
Nutrient
Stock
Pump
62 1-10,
dp=9 25 SS304 -
2.P-4
Water
Pump
(Growth
Reactor)
1000 1-10,
dp=9 25 SS304 -
2.P-5
2.V-1
Medium
pump
1030
10,
desire
d dp
= 0
37 SS304 -
Pumping
Medium
from
Growth to
Productio
n Reactor
2.S-
1[i]
Syngas
org-
material
filter x 50
6700 10 37 -
Polytetrafluor
oethylene
membrane
r = 0.07, H =
.25 [C]
(Area per
filter =
0.88m^2)
Total area
= 44m^2
2.T-1 2M HCl
storage 806 1 25 - SS904L
r = 4.41, H =
13.21 [C]
2.T-2 2M HCl
storage 806 1 25 - SS904L
r = 4.41, H =
13.21 [C]
2.T-3
Nutrient
Storage
tank.
1700 1 25 - SS304 r = 7.81, H =
8.85 [C]
@ max
Vol.
capacity
leaves 1
m head
(only
needs
1700)
2.T-4 Antifoam
204 tank 11 1 25 - SS304
r = 1.5, h =
1.62
@max
Vol.
leaves
0.15m
head
space.
(only
needs
10m3)
[C]
2.T-5
Water
reservoir
(x 5)
2500 1 25 - SS304
r = 9.3, H =
10.0
@max
Vol.
leaves
0.75m
head
space
(only
need
2500x5 -
total
capacity =
12500m3)
[C]
2.V-1
Growth
Reactor (stirred)
900 10 37 - SS304
r = 3.54, H =
23
@ max
leaves
1.8m heat
room (needs
830m3)
[DC]
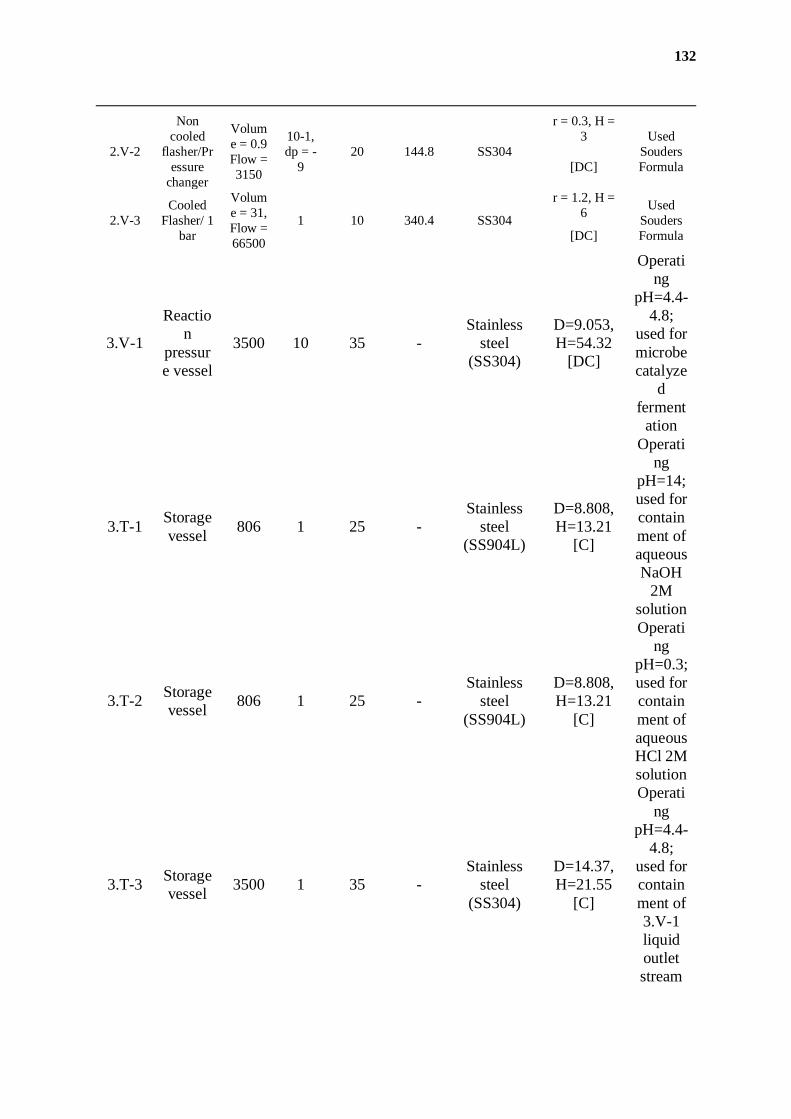
132
2.V-2
Non
cooled
flasher/Pr
essure
changer
Volum
e = 0.9
Flow =
3150
10-1,
dp = -
9
20 144.8 SS304
r = 0.3, H =
3 Used
Souders
Formula [DC]
2.V-3
Cooled
Flasher/ 1
bar
Volum
e = 31,
Flow =
66500
1 10 340.4 SS304
r = 1.2, H =
6 Used
Souders
Formula [DC]
3.V-1
Reactio
n
pressur
e vessel
3500 10 35 -
Stainless
steel
(SS304)
D=9.053,
H=54.32
[DC]
Operati
ng
pH=4.4-
4.8;
used for
microbe
catalyze
d
ferment
ation
3.T-1 Storage
vessel 806 1 25 -
Stainless
steel
(SS904L)
D=8.808,
H=13.21
[C]
Operati
ng
pH=14;
used for
contain
ment of
aqueous
NaOH
2M
solution
3.T-2 Storage
vessel 806 1 25 -
Stainless
steel
(SS904L)
D=8.808,
H=13.21
[C]
Operati
ng
pH=0.3;
used for
contain
ment of
aqueous
HCl 2M
solution
3.T-3 Storage
vessel 3500 1 35 -
Stainless
steel
(SS304)
D=14.37,
H=21.55
[C]
Operati
ng
pH=4.4-
4.8;
used for
contain
ment of
3.V-1
liquid
outlet
stream
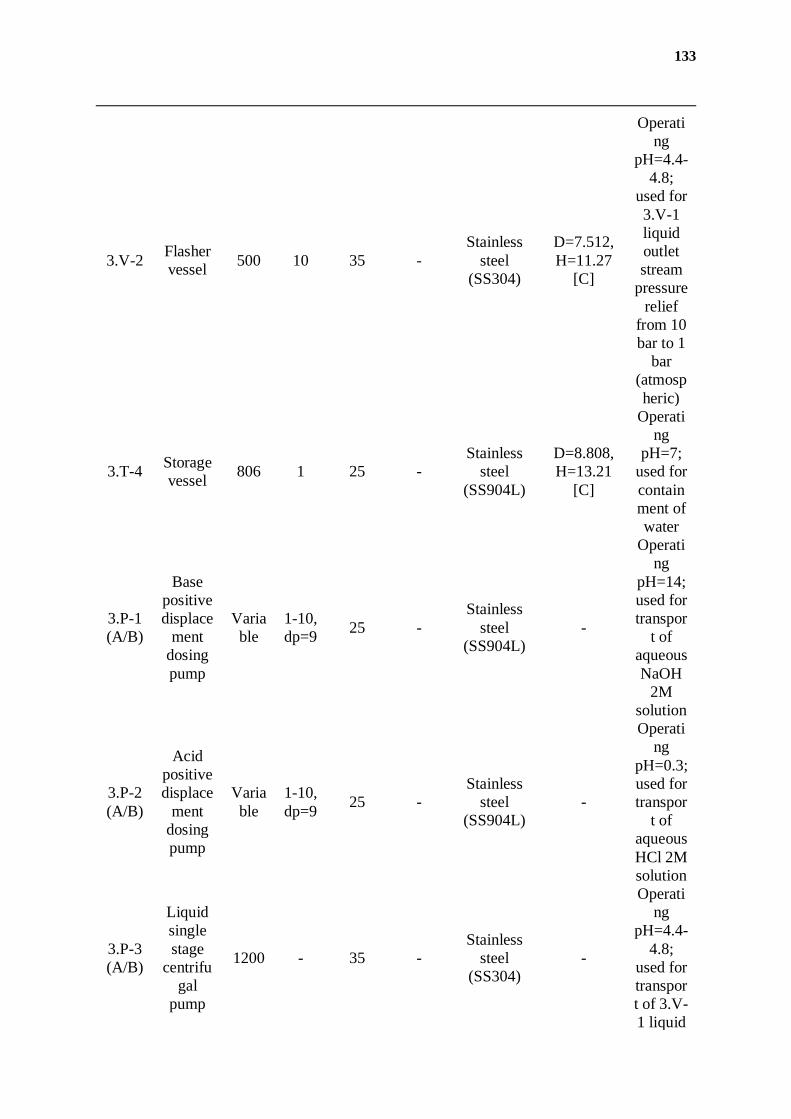
133
3.V-2 Flasher
vessel 500 10 35 -
Stainless
steel
(SS304)
D=7.512,
H=11.27
[C]
Operati
ng
pH=4.4-
4.8;
used for
3.V-1
liquid
outlet
stream
pressure
relief
from 10
bar to 1
bar
(atmosp
heric)
3.T-4 Storage
vessel 806 1 25 -
Stainless
steel
(SS904L)
D=8.808,
H=13.21
[C]
Operati
ng
pH=7;
used for
contain
ment of
water
3.P-1
(A/B)
Base
positive
displace
ment
dosing
pump
Varia
ble
1-10,
dp=9 25 -
Stainless
steel
(SS904L)
-
Operati
ng
pH=14;
used for
transpor
t of
aqueous
NaOH
2M
solution
3.P-2
(A/B)
Acid
positive
displace
ment
dosing
pump
Varia
ble
1-10,
dp=9 25 -
Stainless
steel
(SS904L)
-
Operati
ng
pH=0.3;
used for
transpor
t of
aqueous
HCl 2M
solution
3.P-3
(A/B)
Liquid
single
stage
centrifu
gal
pump
1200 - 35 -
Stainless
steel
(SS304)
-
Operati
ng
pH=4.4-
4.8;
used for
transpor
t of 3.V-
1 liquid
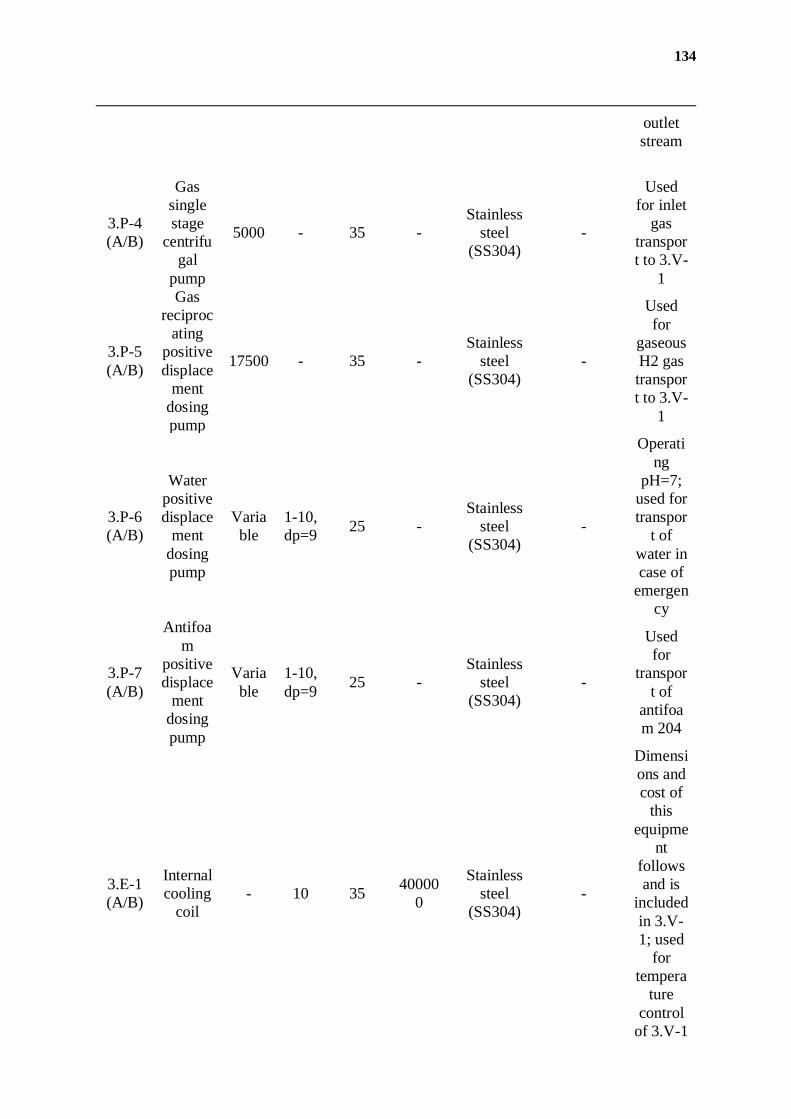
134
outlet
stream
3.P-4
(A/B)
Gas
single
stage
centrifu
gal
pump
5000 - 35 -
Stainless
steel
(SS304)
-
Used
for inlet
gas
transpor
t to 3.V-
1
3.P-5
(A/B)
Gas
reciproc
ating
positive
displace
ment
dosing
pump
17500 - 35 -
Stainless
steel
(SS304)
-
Used
for
gaseous
H2 gas
transpor
t to 3.V-
1
3.P-6
(A/B)
Water
positive
displace
ment
dosing
pump
Varia
ble
1-10,
dp=9 25 -
Stainless
steel
(SS304)
-
Operati
ng
pH=7;
used for
transpor
t of
water in
case of
emergen
cy
3.P-7
(A/B)
Antifoa
m
positive
displace
ment
dosing
pump
Varia
ble
1-10,
dp=9 25 -
Stainless
steel
(SS304)
-
Used
for
transpor
t of
antifoa
m 204
3.E-1
(A/B)
Internal
cooling
coil
- 10 35 40000
0
Stainless
steel
(SS304)
-
Dimensi
ons and
cost of
this
equipme
nt
follows
and is
included
in 3.V-
1; used
for
tempera
ture
control
of 3.V-1
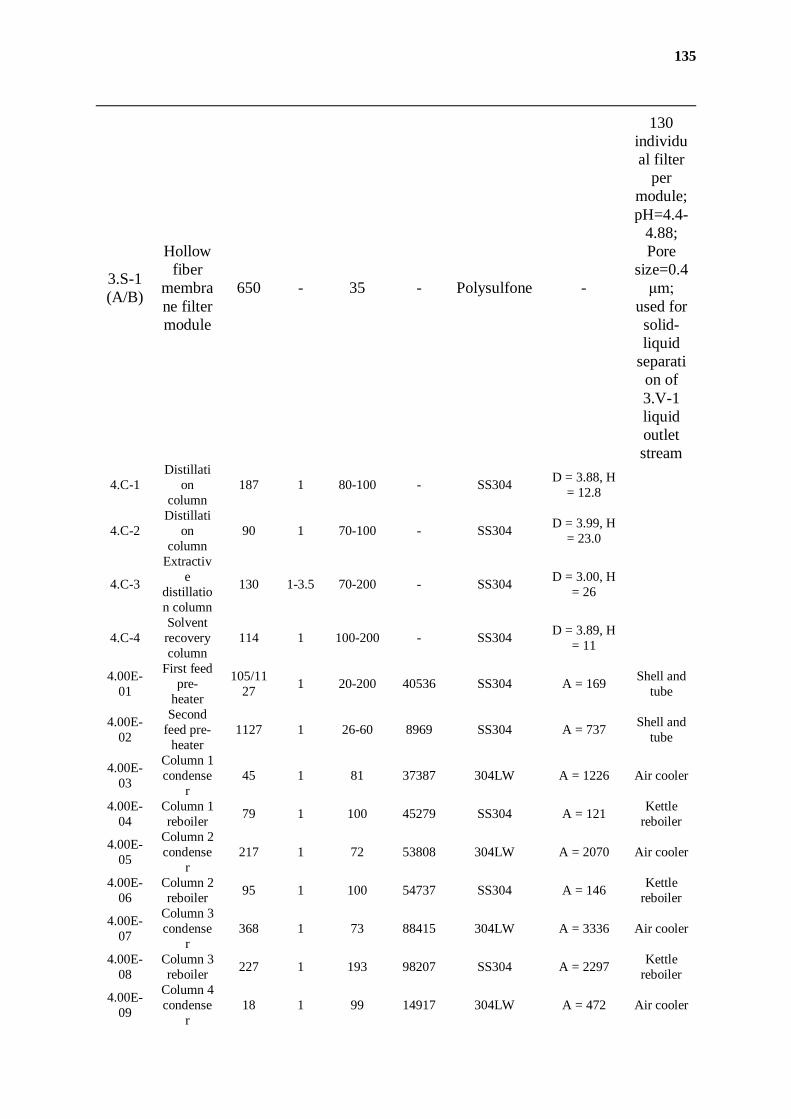
135
3.S-1
(A/B)
Hollow
fiber
membra
ne filter
module
650 - 35 - Polysulfone -
130
individu
al filter
per
module;
pH=4.4-
4.88;
Pore
size=0.4
μm;
used for
solid-
liquid
separati
on of
3.V-1
liquid
outlet
stream
4.C-1
Distillati
on
column
187 1 80-100 - SS304 D = 3.88, H
= 12.8
4.C-2
Distillati
on
column
90 1 70-100 - SS304 D = 3.99, H
= 23.0
4.C-3
Extractiv
e
distillatio
n column
130 1-3.5 70-200 - SS304 D = 3.00, H
= 26
4.C-4
Solvent
recovery
column
114 1 100-200 - SS304 D = 3.89, H
= 11
4.00E-
01
First feed
pre-
heater
105/11
27 1 20-200 40536 SS304 A = 169
Shell and
tube
4.00E-
02
Second
feed pre-
heater
1127 1 26-60 8969 SS304 A = 737 Shell and
tube
4.00E-
03
Column 1
condense
r
45 1 81 37387 304LW A = 1226 Air cooler
4.00E-
04
Column 1
reboiler 79 1 100 45279 SS304 A = 121
Kettle
reboiler
4.00E-
05
Column 2
condense
r
217 1 72 53808 304LW A = 2070 Air cooler
4.00E-
06
Column 2
reboiler 95 1 100 54737 SS304 A = 146
Kettle
reboiler
4.00E-
07
Column 3
condense
r
368 1 73 88415 304LW A = 3336 Air cooler
4.00E-
08
Column 3
reboiler 227 1 193 98207 SS304 A = 2297
Kettle
reboiler
4.00E-
09
Column 4
condense
r
18 1 99 14917 304LW A = 472 Air cooler
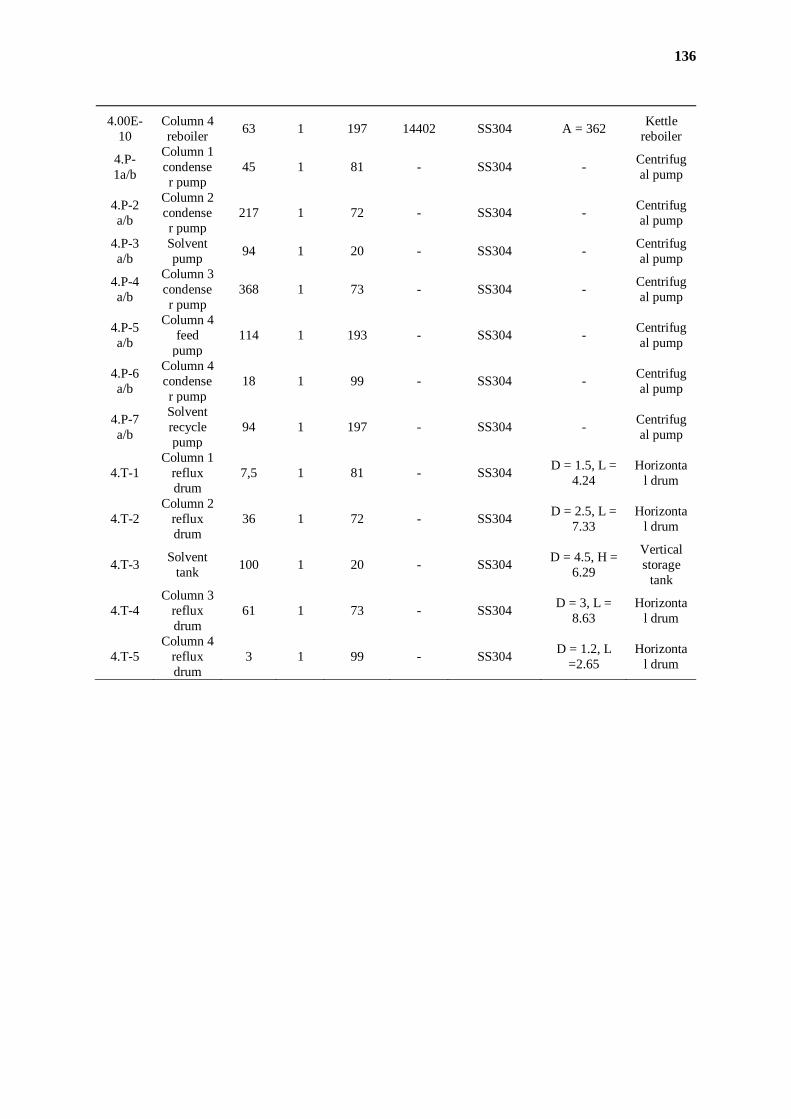
136
4.00E-
10
Column 4
reboiler 63 1 197 14402 SS304 A = 362
Kettle
reboiler
4.P-
1a/b
Column 1
condense
r pump
45 1 81 - SS304 - Centrifug
al pump
4.P-2
a/b
Column 2
condense
r pump
217 1 72 - SS304 - Centrifug
al pump
4.P-3
a/b
Solvent
pump 94 1 20 - SS304 -
Centrifug
al pump
4.P-4
a/b
Column 3
condense
r pump
368 1 73 - SS304 - Centrifug
al pump
4.P-5
a/b
Column 4
feed
pump
114 1 193 - SS304 - Centrifug
al pump
4.P-6
a/b
Column 4
condense
r pump
18 1 99 - SS304 - Centrifug
al pump
4.P-7
a/b
Solvent
recycle
pump
94 1 197 - SS304 - Centrifug
al pump
4.T-1
Column 1
reflux
drum
7,5 1 81 - SS304 D = 1.5, L =
4.24
Horizonta
l drum
4.T-2
Column 2
reflux
drum
36 1 72 - SS304 D = 2.5, L =
7.33
Horizonta
l drum
4.T-3 Solvent
tank 100 1 20 - SS304
D = 4.5, H =
6.29
Vertical
storage
tank
4.T-4
Column 3
reflux
drum
61 1 73 - SS304 D = 3, L =
8.63
Horizonta
l drum
4.T-5
Column 4
reflux
drum
3 1 99 - SS304 D = 1.2, L
=2.65
Horizonta
l drum
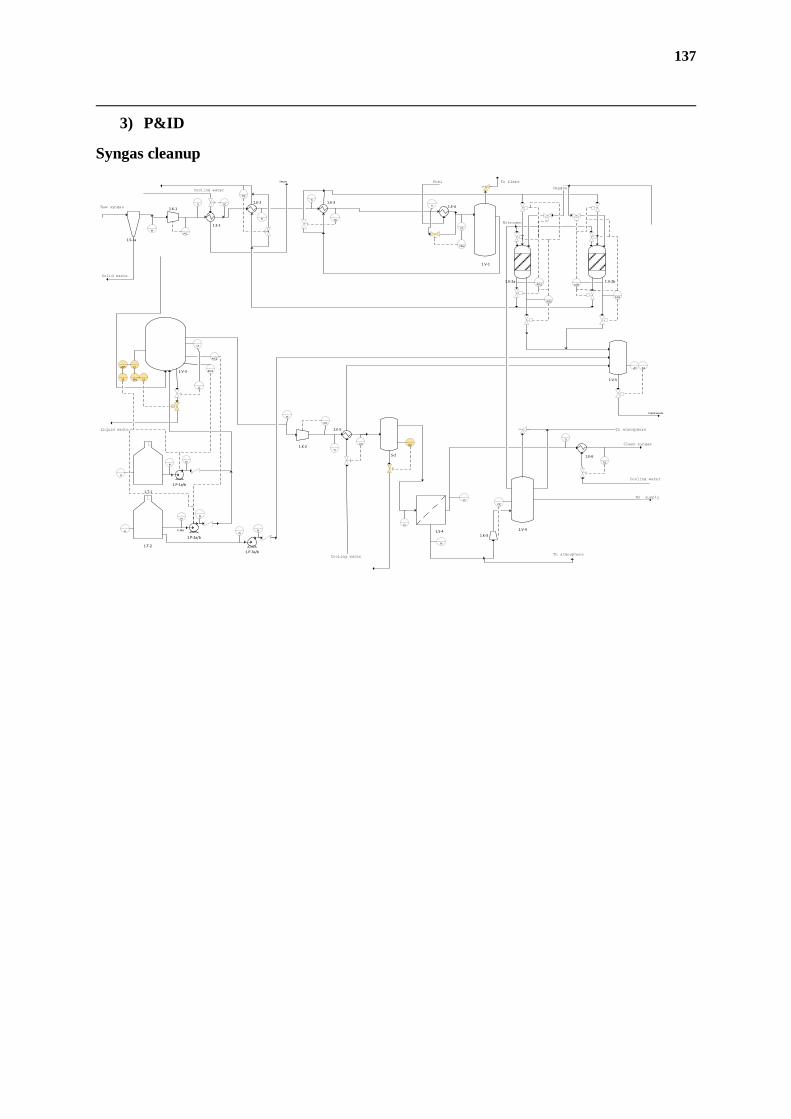
137
3) P&ID
Syngas cleanup
1.E-2 1.E-3
1.V-1
1.V-2a 1.V-2b
1.V-3
S-2
1.S-1a
Raw syngas
Solid waste
1.S-4 1.V-4
N2 supply
1.T-1
1.T-2
1.P-2a/b
1.P-1a/b
TIC
TI
TI
TI
TIC
AIS1 AIS1
AIS2
AIS2
To flare
LT
LC
AIC2
LT
LAL LS
LI
LI
PI
PI
PI
To atmosphere
1.K-2
TIC
TAH
PIC
1.E-5
TI
TIC
1.E-4
Cooling water
PIPI
PIPI
Cooling water
TI
1.E-6
Cooling water
TI
TIC
Clean syngas
To atmosphere
1.K-3
PIC
LIC
Fuel
Oxygen
1.K-1
1.E-1
Steam
TIC
1.P-3a/b
PIPIP-346
1.V-5
Liquid waste
ASAT
PI
PICPI
Nitrogen
AIC1
Liquid waste
LAH
LS
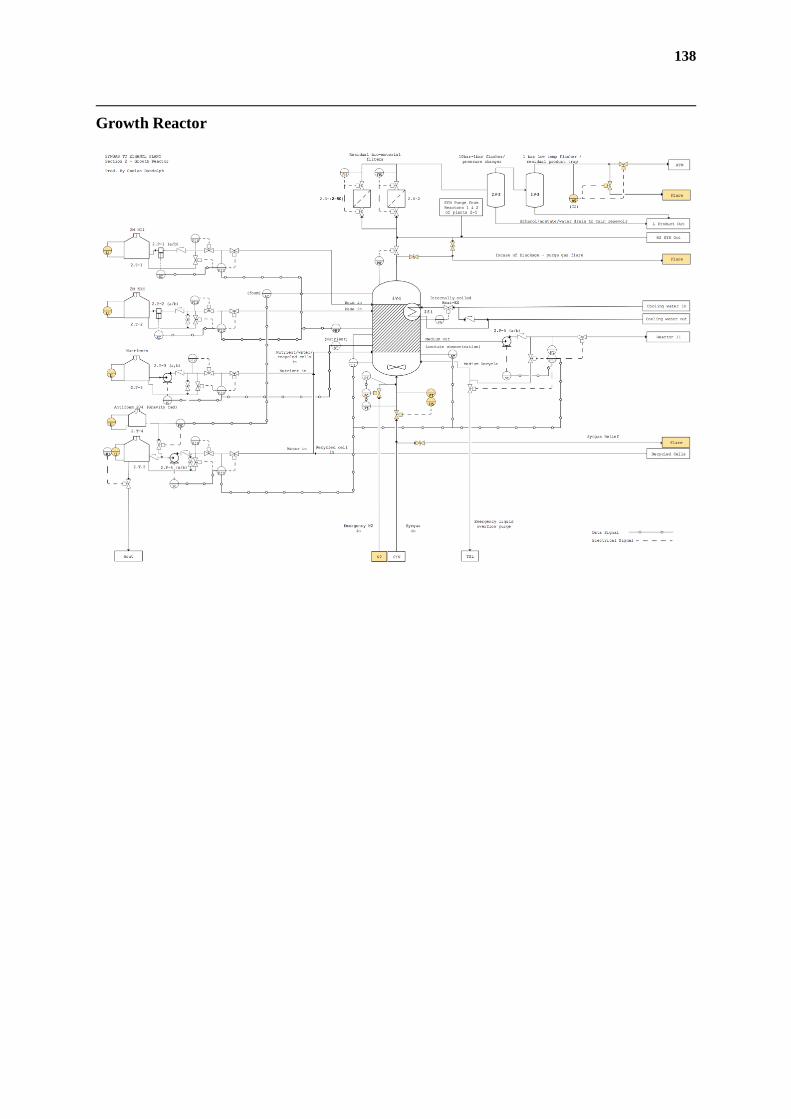
138
Growth Reactor
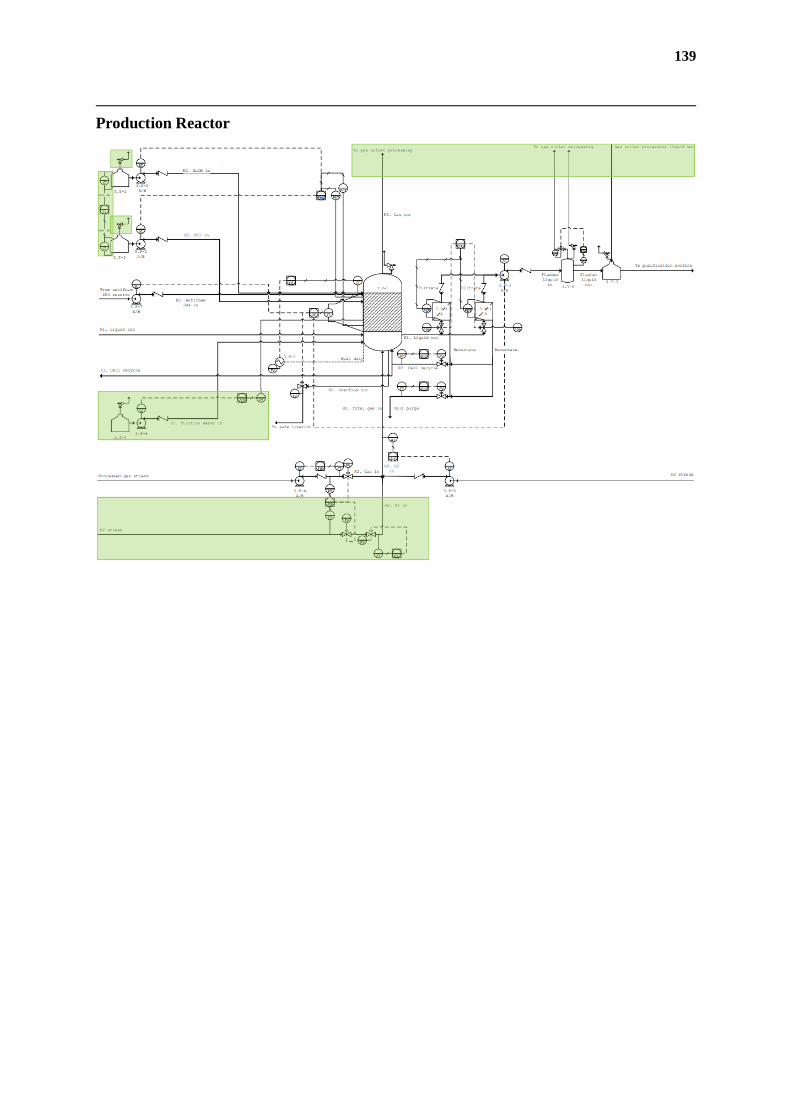
139
Production Reactor
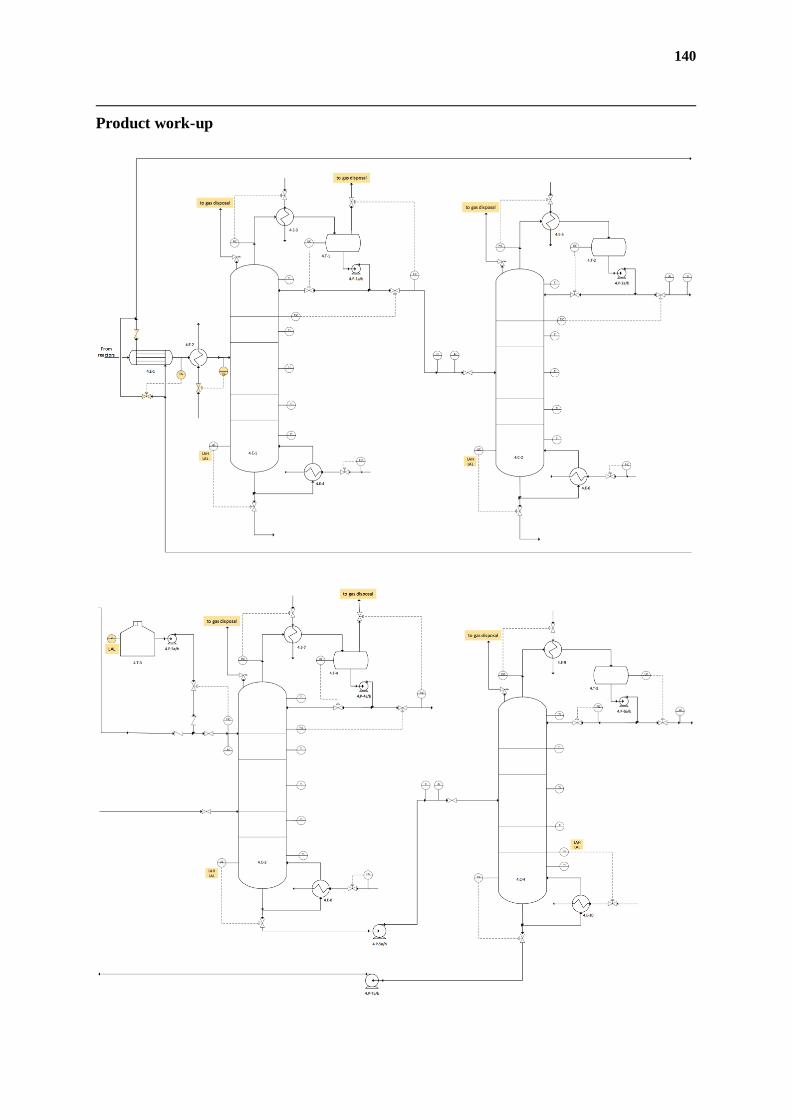
140
Product work-up
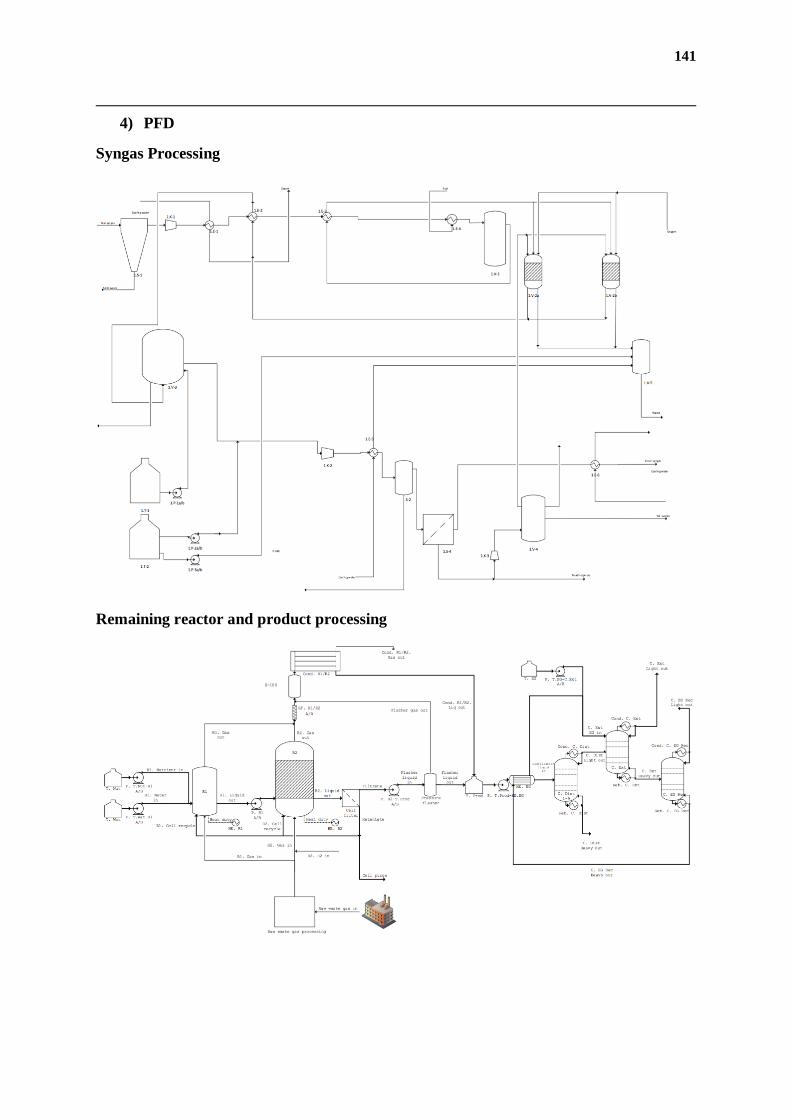
141
4) PFD
Syngas Processing
Remaining reactor and product processing
Recommended