Sydney: The City of Cities - Informed Thinking on Accessibility, Geographical Proximity
and Public Transport(A realistic View)
David A. Hensher FASSAProfessor of Management
DirectorInstitute of Transport and Logistics Studies (ITLS)
Faculty of Economics and BusinessThe University of Sydney
Economic Society (NSW Branch)17 May 2006
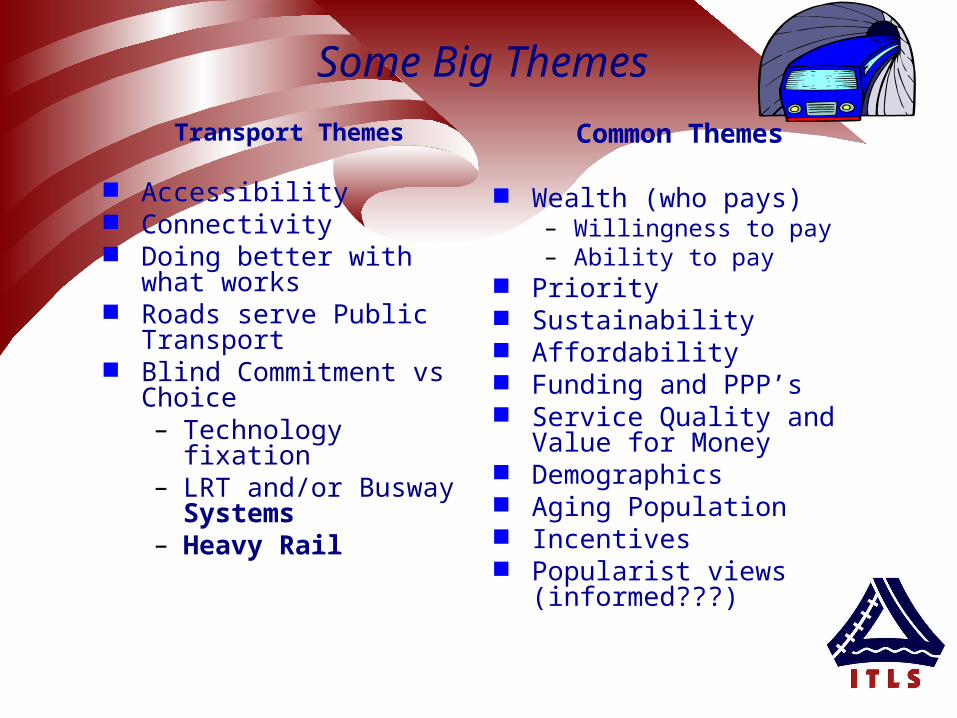
Some Big Themes
Transport Themes
Accessibility Connectivity Doing better with what
works Roads serve Public
Transport Blind Commitment vs
Choice– Technology fixation– LRT and/or Busway
Systems– Heavy Rail
Common Themes
Wealth (who pays)– Willingness to pay– Ability to pay
Priority Sustainability Affordability Funding and PPP’s Service Quality and Value
for Money Demographics Aging Population Incentives Popularist views
(informed???)

Where are We Today?
Sydney in a Snapshot
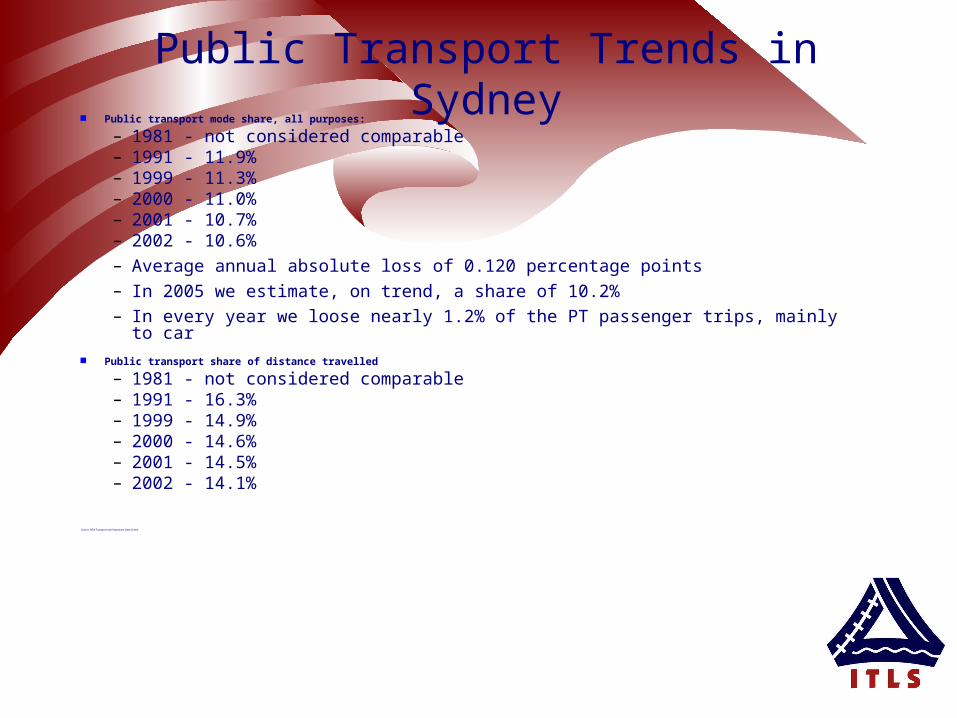
Public Transport Trends in Sydney Public transport mode share, all purposes:
– 1981 - not considered comparable– 1991 - 11.9%– 1999 - 11.3%– 2000 - 11.0%– 2001 - 10.7%– 2002 - 10.6%– Average annual absolute loss of 0.120 percentage points
– In 2005 we estimate, on trend, a share of 10.2%
– In every year we loose nearly 1.2% of the PT passenger trips, mainly to car
Public transport share of distance travelled
– 1981 - not considered comparable– 1991 - 16.3%– 1999 - 14.9%– 2000 - 14.6%– 2001 - 14.5%– 2002 - 14.1%
Source: NSW Transport and Population Data Centre
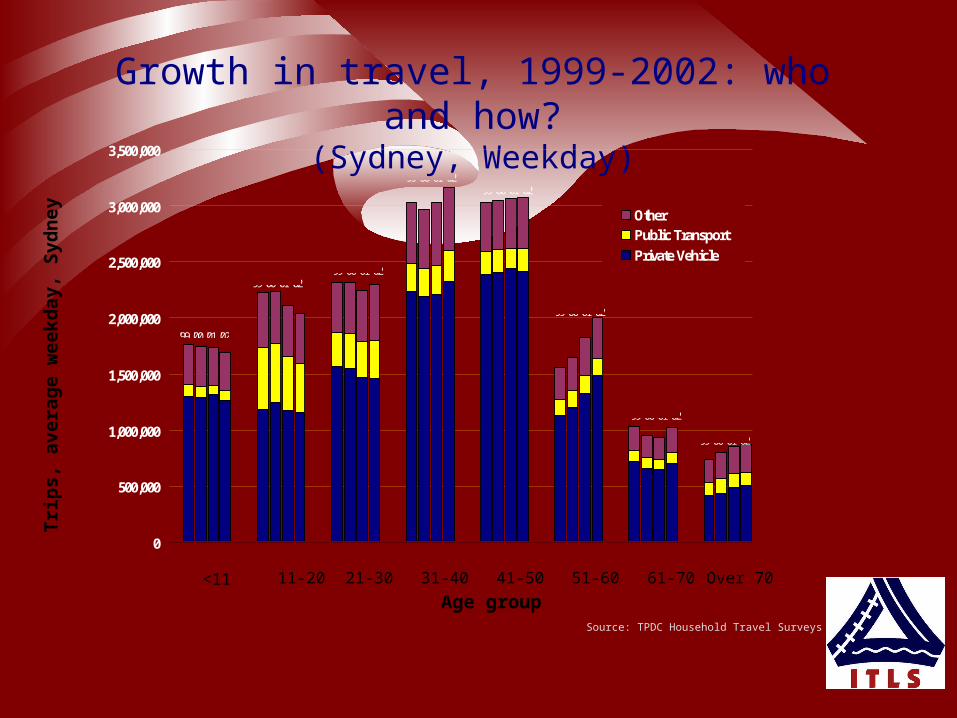
Growth in travel, 1999-2002: who and how?(Sydney, Weekday)
0
500,000
1,000,000
1,500,000
2,000,000
2,500,000
3,000,000
3,500,000
OtherPublic Transport
Private Vehicle
'99 '00 '01 '02
'99 '00 '01 '02'99 '00 '01 '02
'99 '00 '01 '02'99 '00 '01 '02
'99 '00 '01 '02
'99 '00 '01 '02
'99 '00 '01 '02
<11 11-20 21-30 31-40 41-50 51-60 61-70 Over 70
Age group
Trip
s, a
vera
ge w
eekd
ay, S
ydne
y
Source: TPDC Household Travel Surveys
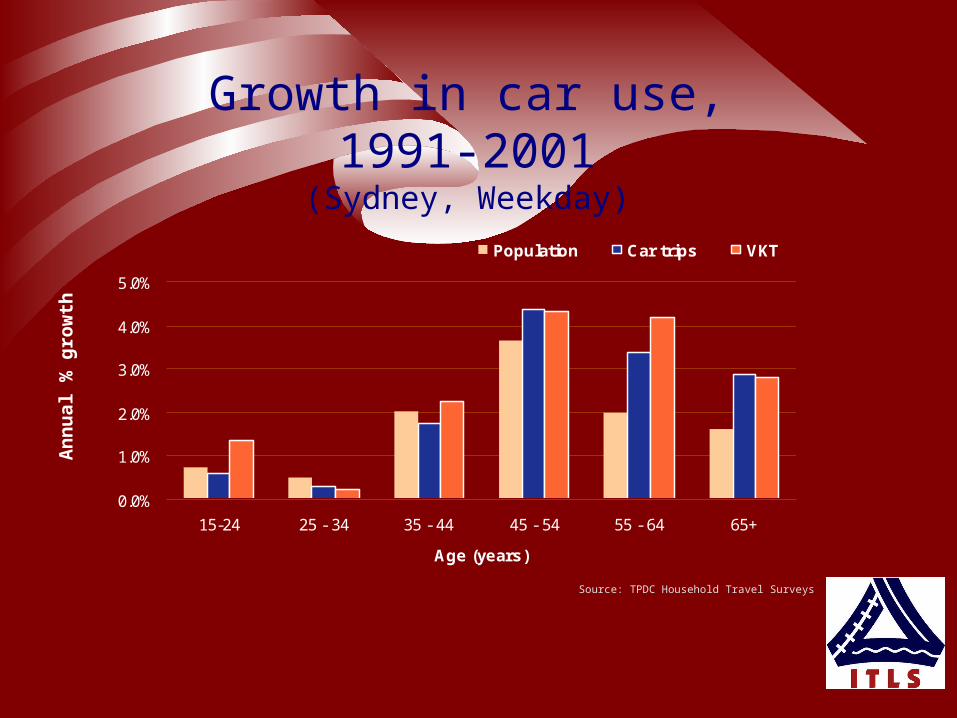
Growth in car use, 1991-2001(Sydney, Weekday)
0.0%
1.0%
2.0%
3.0%
4.0%
5.0%
15-24 25 - 34 35 - 44 45 - 54 55 - 64 65+
Age (years)
Population Car trips VKT
Ann
ual %
gro
wth
Source: TPDC Household Travel Surveys
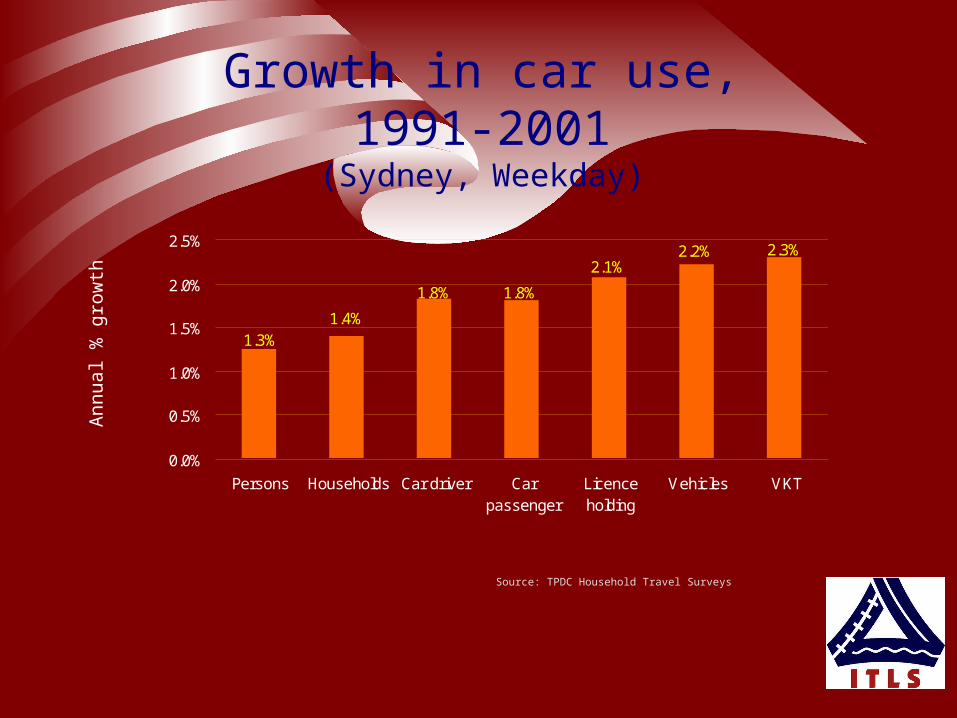
Growth in car use, 1991-2001(Sydney, Weekday)
1.4%
2.3%2.2%2.1%
1.8%
1.3%
1.8%
0.0%
0.5%
1.0%
1.5%
2.0%
2.5%
Persons Households Car driver Carpassenger
Licenceholding
Vehicles VKT
Source: TPDC Household Travel Surveys
Annu
al %
gro
wth
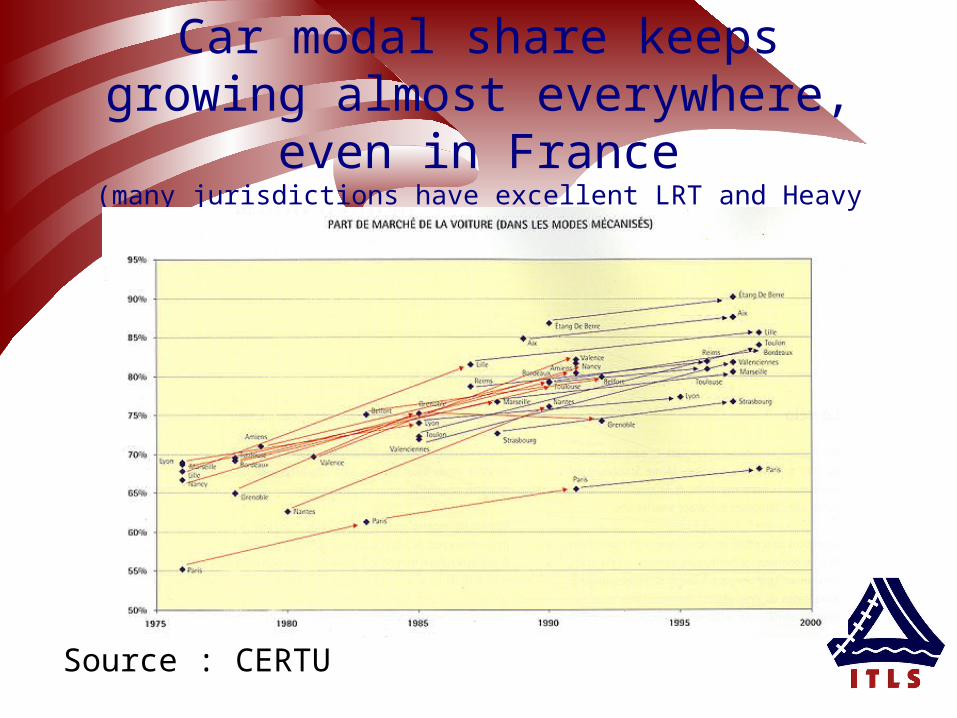
Car modal share keeps growing almost everywhere, even in France
(many jurisdictions have excellent LRT and Heavy Rail)
Source : CERTU
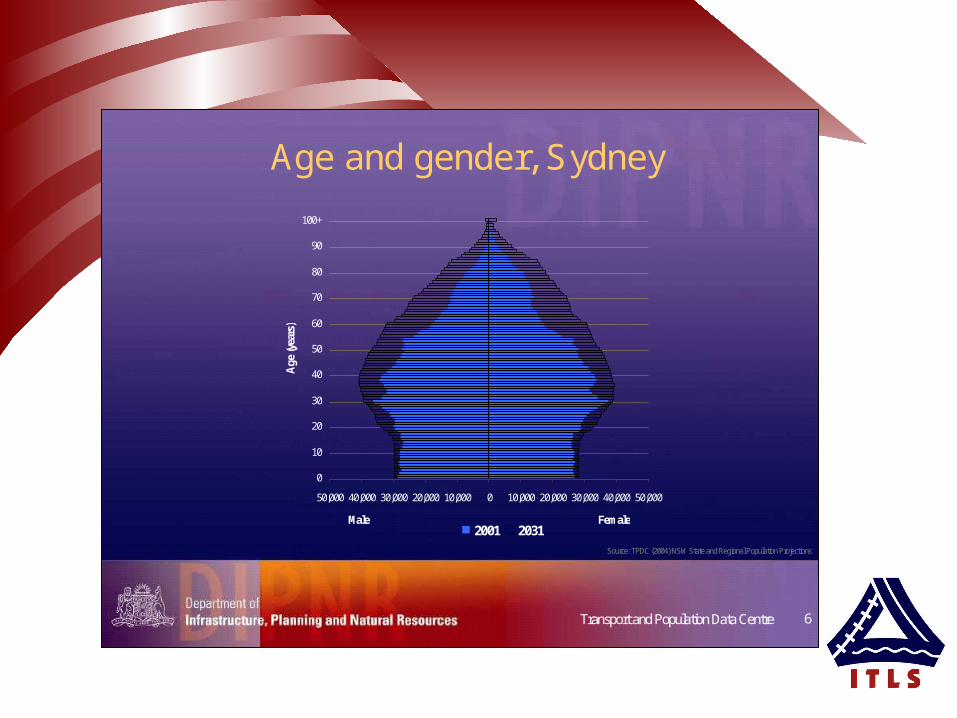
6Transport and Population Data Centre
Age and gender, Sydney
50,000 40,000 30,000 20,000 10,000 0 10,000 20,000 30,000 40,000 50,000
0
10
20
30
40
50
60
70
80
90
100+
Age
(yea
rs)
Male Female2001 2031
Source: TPDC (2004) NSW State and Regional Population Projections
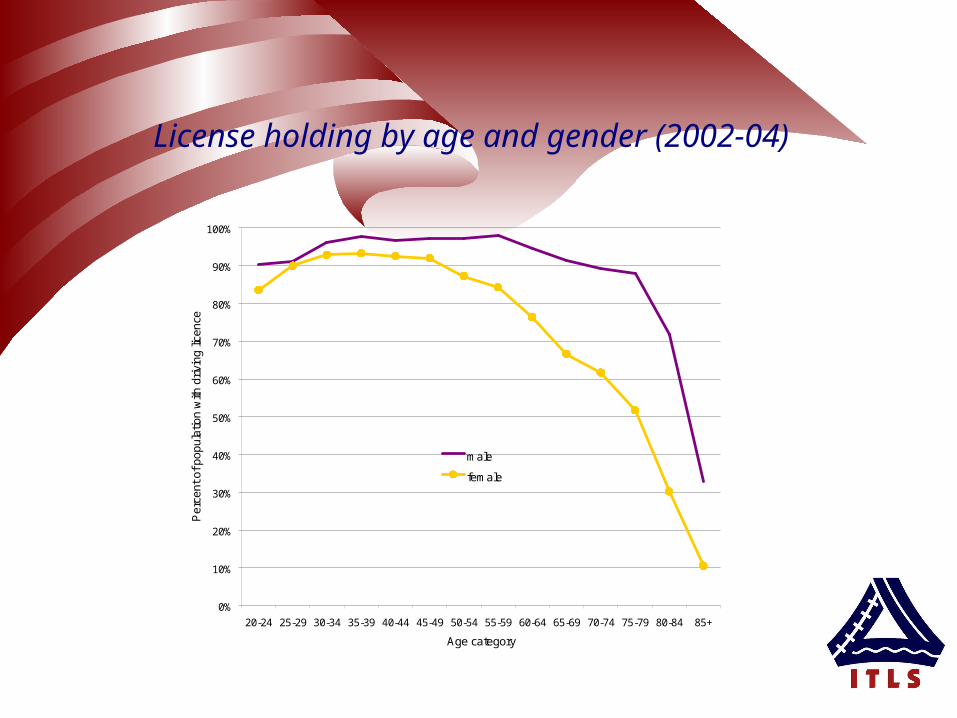
License holding by age and gender (2002-04)
0%
10%
20%
30%
40%
50%
60%
70%
80%
90%
100%
20-24 25-29 30-34 35-39 40-44 45-49 50-54 55-59 60-64 65-69 70-74 75-79 80-84 85+
Age category
Pe
rce
nt
of
po
pu
latio
n w
ith d
rivin
g li
cen
ce
male
female
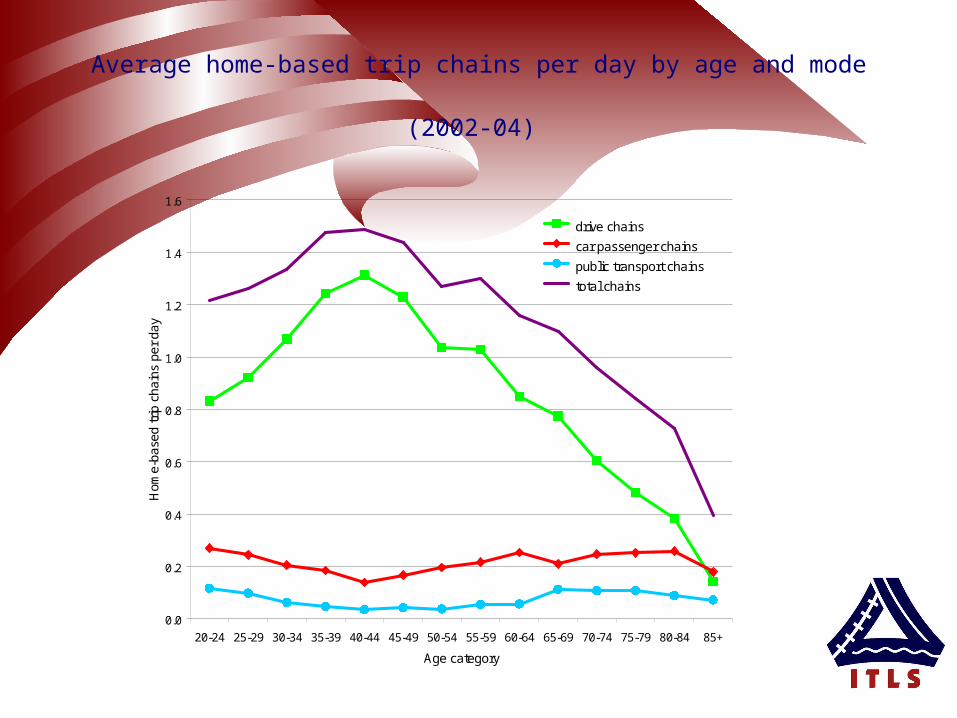
Average home-based trip chains per day by age and mode (2002-04)
0.0
0.2
0.4
0.6
0.8
1.0
1.2
1.4
1.6
20-24 25-29 30-34 35-39 40-44 45-49 50-54 55-59 60-64 65-69 70-74 75-79 80-84 85+
Age category
Hom
e-ba
sed
trip
cha
ins
per
day
drive chains
car passenger chains
public transport chains
total chains
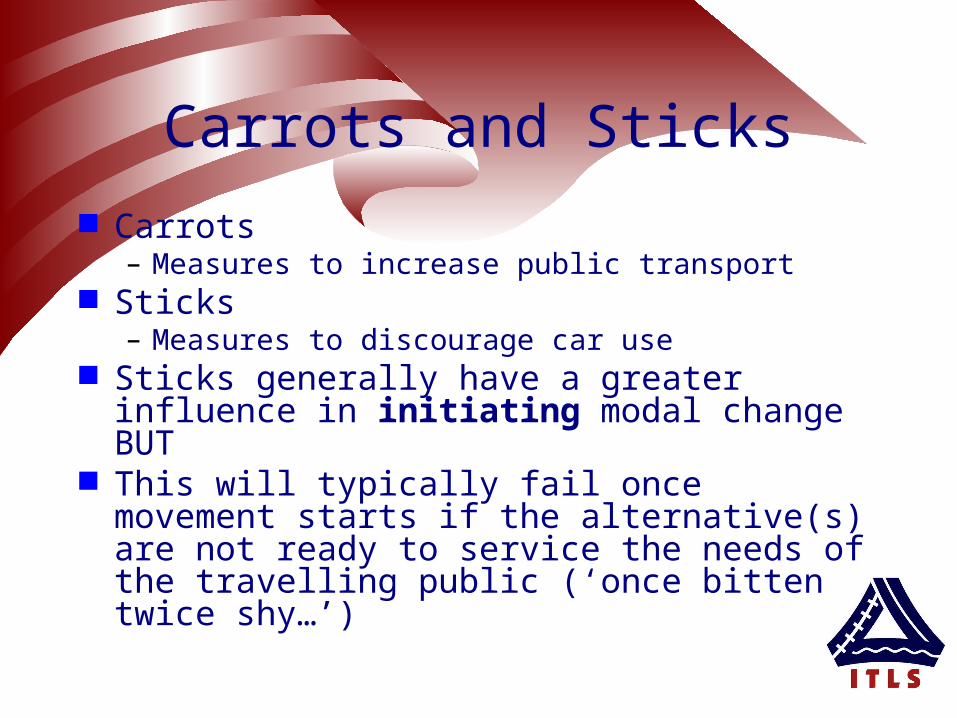
Carrots and Sticks
Carrots– Measures to increase public transport
Sticks– Measures to discourage car use
Sticks generally have a greater influence in initiating modal change BUT
This will typically fail once movement starts if the alternative(s) are not ready to service the needs of the travelling public (‘once bitten twice shy…’)
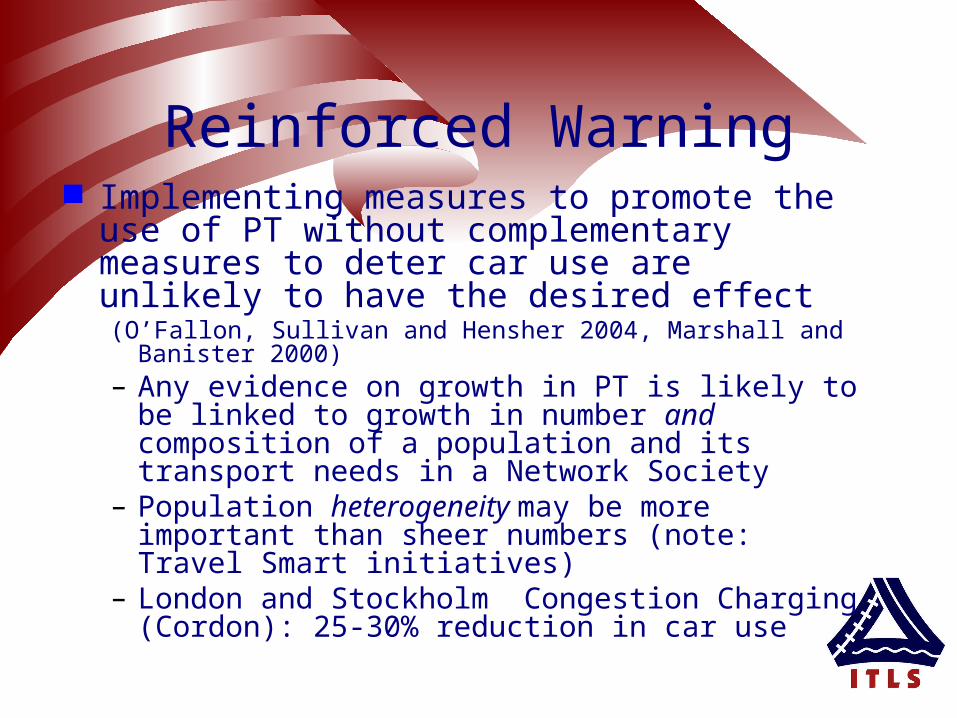
Reinforced Warning Implementing measures to promote the use
of PT without complementary measures to deter car use are unlikely to have the desired effect(O’Fallon, Sullivan and Hensher 2004, Marshall and Banister
2000)– Any evidence on growth in PT is likely to be linked
to growth in number and composition of a population and its transport needs in a Network Society
– Population heterogeneity may be more important than sheer numbers (note: Travel Smart initiatives)
– London and Stockholm Congestion Charging (Cordon): 25-30% reduction in car use
But why so much focus on Modal Share and PT?
Lets just concentrate on growing PT patronage?
Does it really matter if PT modal share declines if the demand for PT is sufficient to justify its existence?
Should the primary issue, however, be in establishing the appropriate form of PT?
No - The Real Focus should be on Accessibility
Accessibility is what Mattersand Not Mobility
Mobility: The ease of movement Accessibility: The ease of reaching destinations Generally, mobility is closely related to the level of service provided
on the transport system. – Higher levels of service are designed to represent lower
generalised costs per kilometre of travel. – Thus, increases in capacity of the system tend to lead to an
increase in mobility. An increase in mobility implies that the generalised cost
of travel (time plus money) per kilometre is reduced; an increase in accessibility implies that there is a reduction in the generalised cost of travel per destination.
Accessibility, however, is related to destinations, and therefore requires attention to urban form, land use and to the quality of destinations.
The experiences from Holland are especially valuable – PTO
Policies Positions and Modal Use: The Dutch ABC Experience Two Broad settings:
– Strict compact city Concentrating residential development within
and adjacent to built-up areas
– Concentrated decentralisation Growth centres (to promote suburban growth) This appears to be the Sydney model (no
matter what planners do)
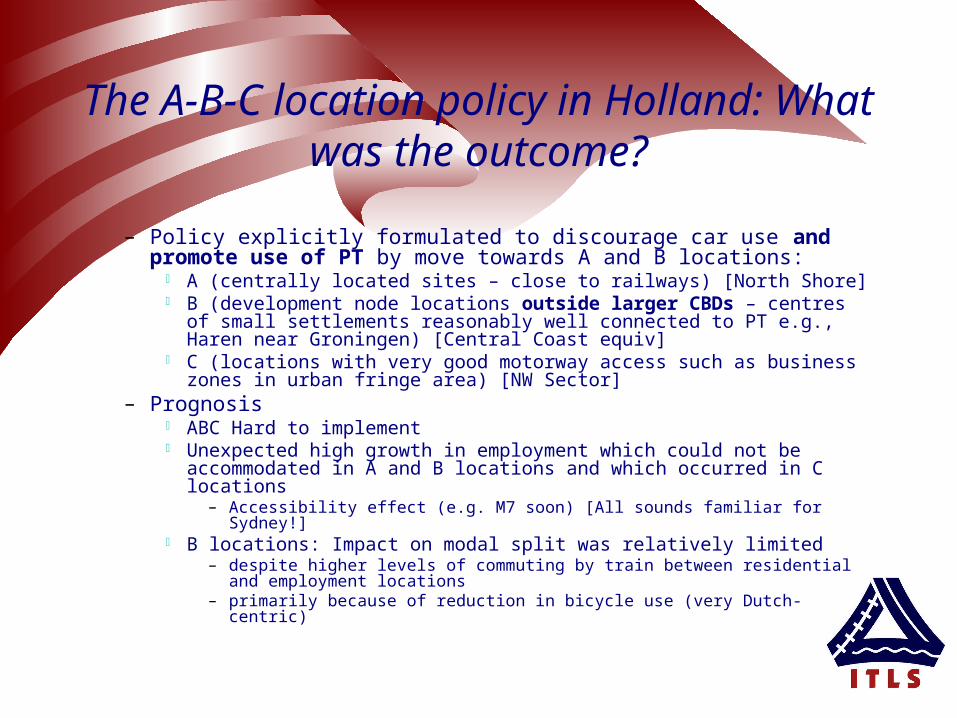
The A-B-C location policy in Holland: What was the outcome?
– Policy explicitly formulated to discourage car use and promote use of PT by move towards A and B locations:
A (centrally located sites – close to railways) [North Shore] B (development node locations outside larger CBDs – centres of small
settlements reasonably well connected to PT e.g., Haren near Groningen) [Central Coast equiv]
C (locations with very good motorway access such as business zones in urban fringe area) [NW Sector]
– Prognosis ABC Hard to implement Unexpected high growth in employment which could not be
accommodated in A and B locations and which occurred in C locations– Accessibility effect (e.g. M7 soon) [All sounds familiar for Sydney!]
B locations: Impact on modal split was relatively limited– despite higher levels of commuting by train between residential and
employment locations– primarily because of reduction in bicycle use (very Dutch-centric)
Revised A-B-C Policy in Holland
– To not only encourage the optimal use of different transport systems as in the ‘old’ A-B-C policy BUT TO
– Also encourage economic development, spatial quality and the quality of the living environment
– in a Network Society– Nothing mentioned about Public Transport
being the Means Peak spreading, telecommuting, local work….
The Modal Split Rearrangement: The System Wide Implications
In a Compact City Setting– The more likely are some urban functions to relocate to
suburbs (market forces) The ‘cramming’ effect has accelerated the de-concentration of
employment towards C locations, increasing car use. [Sydney experience]
– It may benefit PT but it does not reduce car use The big looser in Netherlands was non-motorised modes Re-arranging the modal share amongst non-car modes
– Switching from train to bus noticeable in Sydney– Do we really want policies that rearrange a declining PT share
between the bus and train?– Every bus passenger costs society a $1, every train trip costs $4,
in Sydney.
Brown and Greenfield Sites
Residential development on – Brownfield sites
Within existing urban fabric, tends to lead to less car travel (infilling and town houses….)
– Greenfield sites Adjacent to existing built up areas (i.e. urban
fringe) usually creates greater car dependency.
– The Australian experience is the same
Timing of Provision of PT But what if there had been good PT in place beforehand in
Greenfield Locations?– PT services come later in order to avoid initial operational deficits– But is it too late then?– Would timing have made any difference?
In many situations I believe it is NO. Why? Look at the North West Sector in Sydney:
– Young, two-worker households– Dispersed activity locations– Relatively high household incomes– Busy life style– Local employment profile not matching very well the local
residential worker profile
Maybe Regional (Incl. within Urban Area) Compactness Opens up more activity
time?
– Degree of urbanisation and travel time Not a simple relationship (despite what Kenworthy and Laube
say – what I refer to as correlational illness)– Boarnet and Crane (2001): many researchers and lay enthusiasts
leap from observed correlations between urban design and travel behaviour to the conclusion that design changes cause changes in travel behaviour (incl. one of our ex Sustainability Commissioners Prof Peter Newman and his disciples)
A continuing challenge about reality is the mismatch between workers and employment in regional locations, and the
Lagged effect of jobs after housing is established– But not strictly the right jobs (mismatch)– Skills and preferences of growth-centre residents usually
correspond less with the available jobs – Complicated by multi-worker households with diverse skills
producing diverse destination needs.
We have a Jobs-Housing Balance Challenge
– We support the JH balance BUT
The jobs must match – the skills and
– preferences of the local pool of eligible workers
If Transport Accessibility is to be the Beneficiary
– Matching unlikely to occur
The Big Challenge (as I see it)
The main questions– Can spatial planning policy influence travel behaviour?
Maybe it is a relatively blunt instrument? If it was sharper then why have we not seen the claimed (desired?) impacts?
– We may have but are they no more (i.e. less choice) than what the market would have delivered?
– If true, how can we harness the power of the market to produce the outcomes we claim we want? (Hensher’s 80:20 rule in favour of markets)
Maybe we still know little about how to balance the role of markets and planning (the M-P balance)?
Do land-use regulation and subsidies de-stabilise the market?– Seems to encourage, on balance, low density residential activity (esp. Local Govt.)
Does direct investment in central cities (i.e. downtown) and public transport lead to inefficient land-use patterns?
Does regulation of the development of urban form by planners (i.e. density planning) to curtail the costs of urban sprawl such as growing use of the car bring tangible net benefits?
– Government’s role should increasingly be to promote the operation of efficient (and equitable) markets! INCENTIVES are noticeably absent.
Popular Issue: DensityCan we do it through density – of What?
Development Density– Origin density (residential)?– Destination density (work, shopping, entertainment)?
Both? What is realistically achievable?
– Developing downtown-like centres in surburbia– Dense destinations, regardless of characteristics of trip origin, are the carrot
for increased demand for PT as long as it is provided Denied by many local govts. in the past
Suggestion: Lets focus on downtown-style development (in the regions) and not residential densities
– Can use car to get to PT interchange at Residential location and then walk to final (close) destination
– In contrast a destination a long way from PT is problematic since do not have car to complete trip.
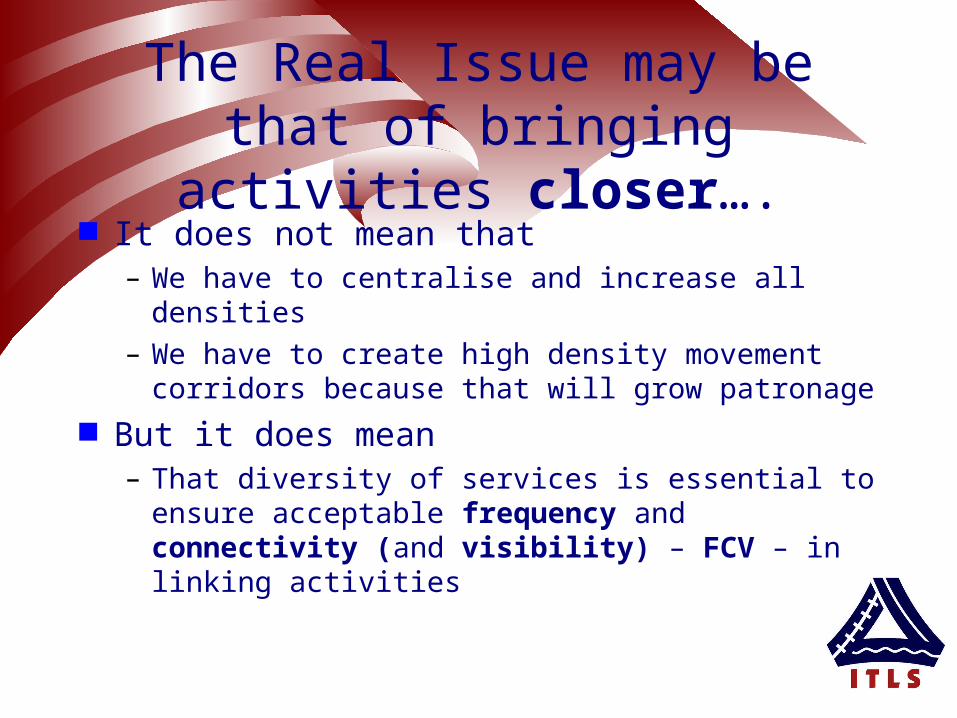
The Real Issue may be that of bringing activities closer….
It does not mean that– We have to centralise and increase all densities– We have to create high density movement
corridors because that will grow patronage
But it does mean– That diversity of services is essential to ensure
acceptable frequency and connectivity (and visibility) – FCV – in linking activities
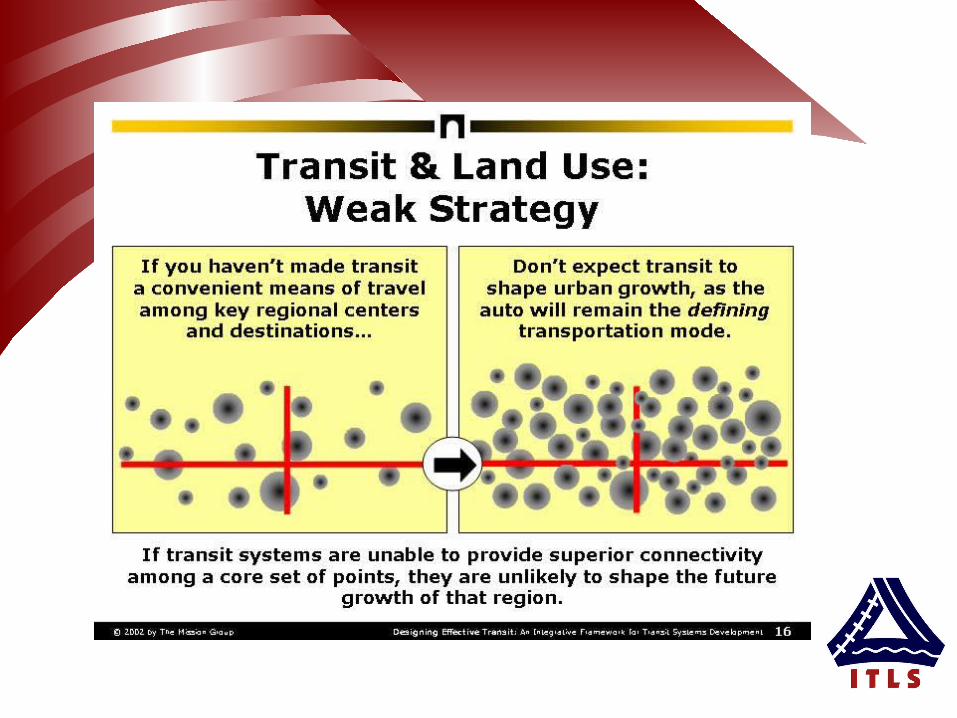
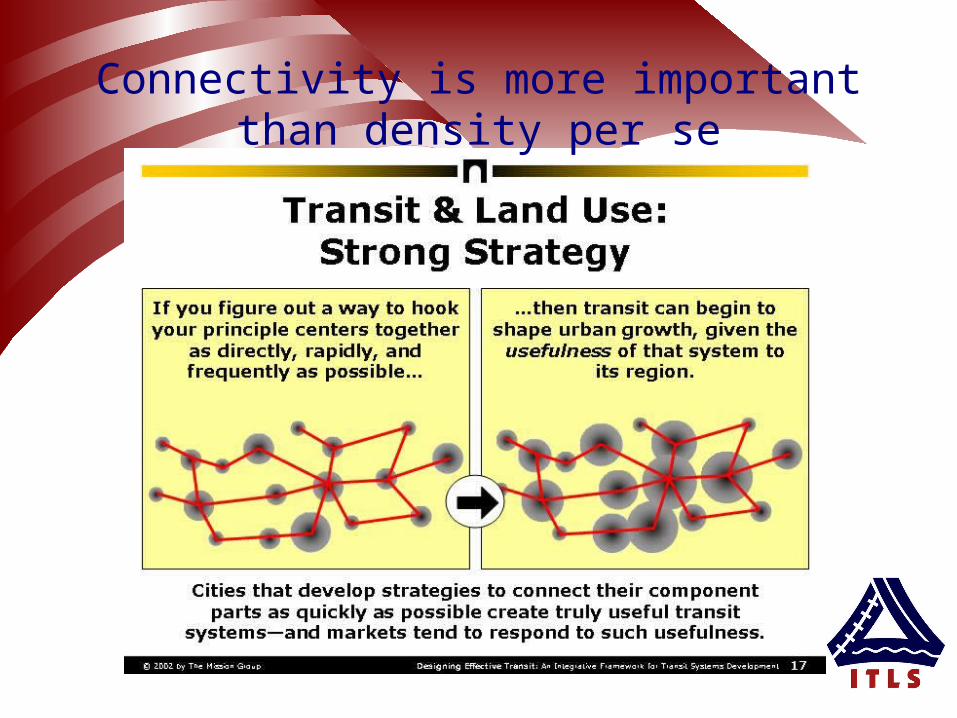
Connectivity is more important than density per se
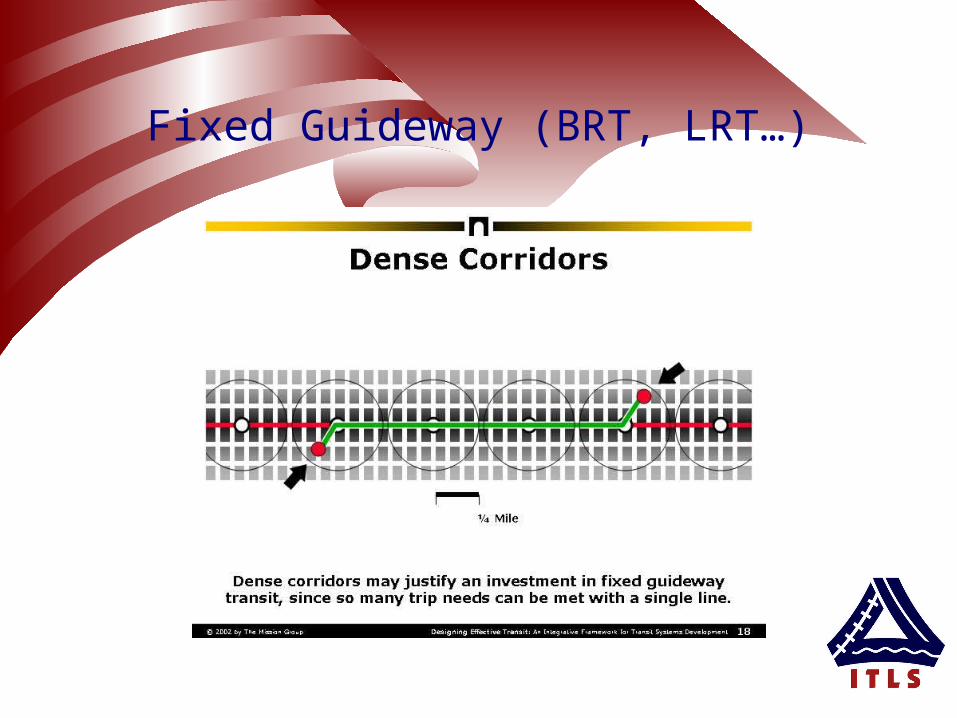
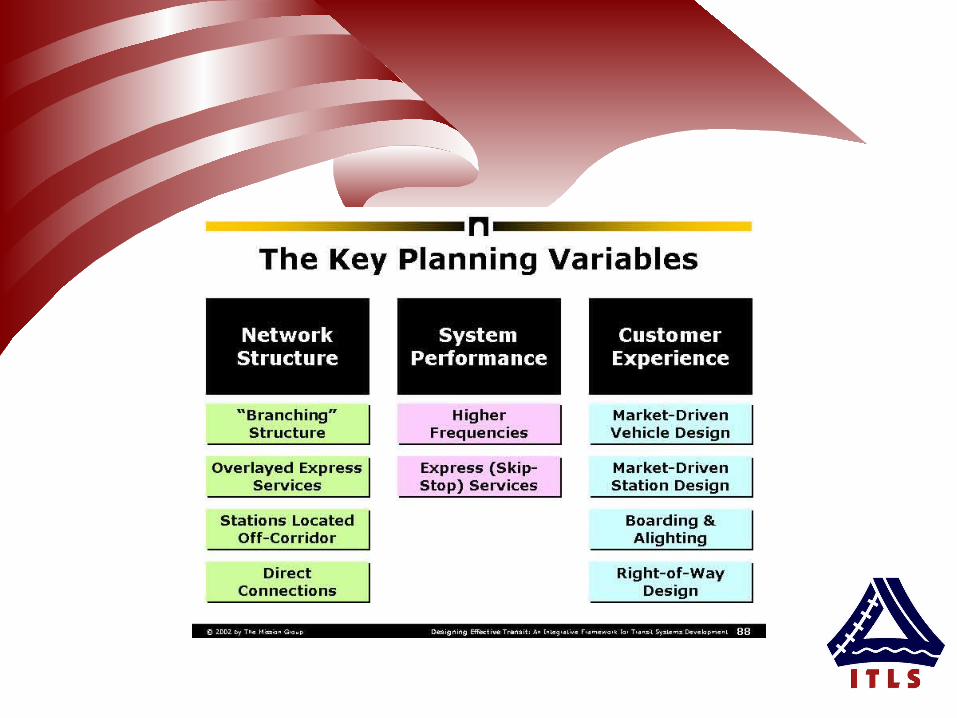
Fixed Guideway (BRT, LRT…)
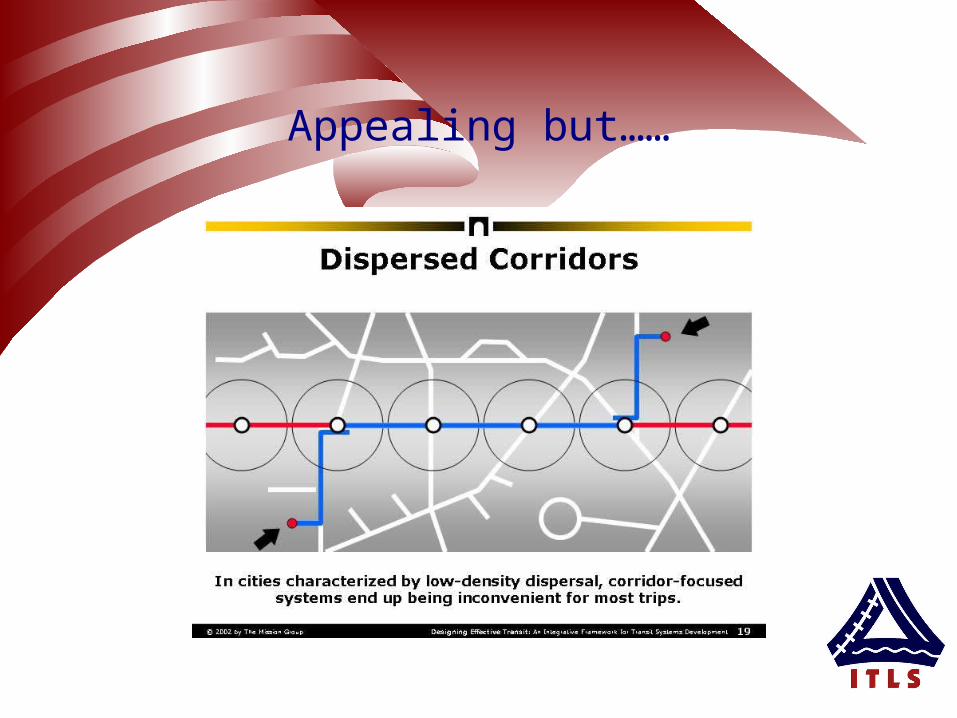
Appealing but……
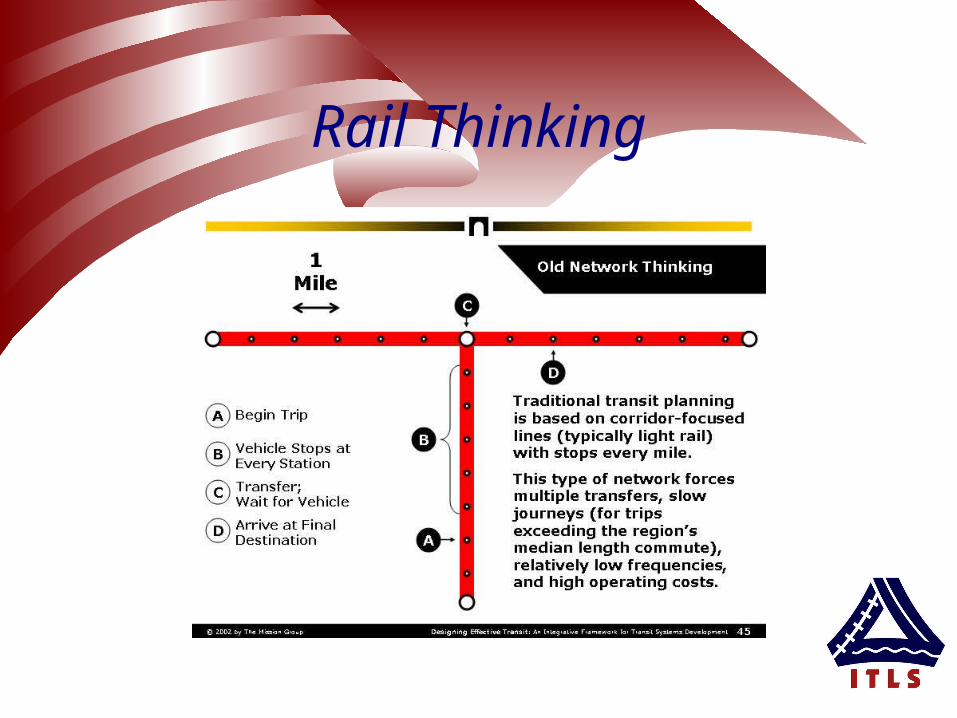
Rail Thinking
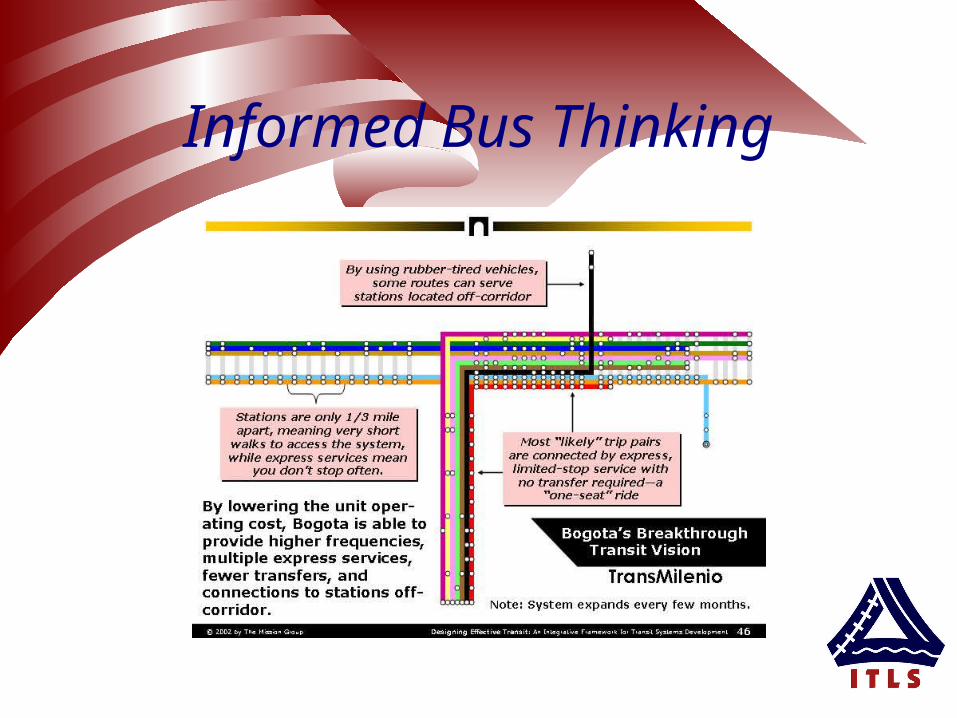
Informed Bus Thinking
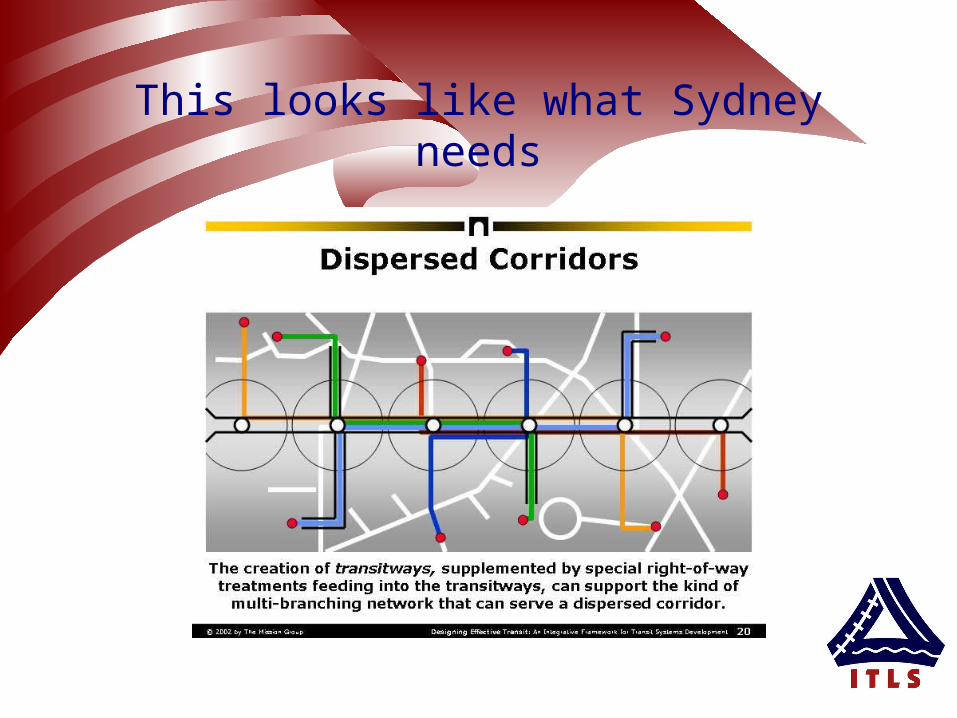
This looks like what Sydney needs

A Changing Future?The real focus (on bringing activities
closer…)– The emerging network society
Physical proximity and land use controls may be counter-productive (i.e. redundant and inefficient)
Future spatial configurations are emerging that promote nodes and flows rather than land use patterns
Travel must increasingly be perceived in time and not distance (obvious really).
– Look at the Hills District in Sydney since the M2 was open (substantial increase in accessibility)
– (Physical) Planners still think in distance (as far as I can tell!)
• ‘So I live 40 km from CBD but it only takes me 30 mins to get there….’
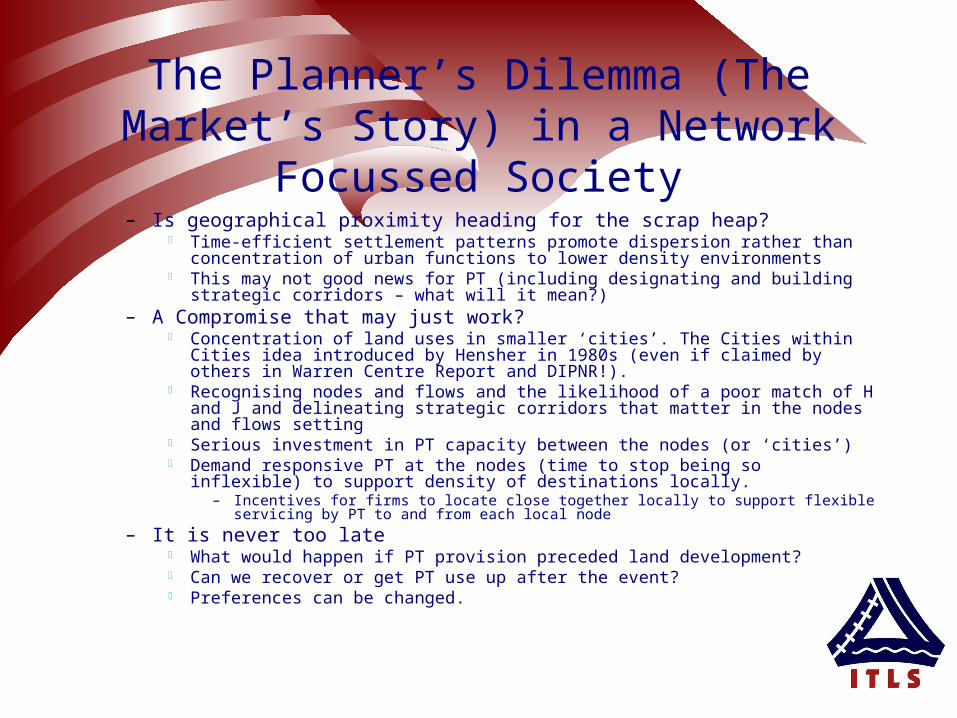
The Planner’s Dilemma (The Market’s Story) in a Network Focussed Society
– Is geographical proximity heading for the scrap heap? Time-efficient settlement patterns promote dispersion rather than concentration of
urban functions to lower density environments This may not good news for PT (including designating and building strategic
corridors – what will it mean?)– A Compromise that may just work?
Concentration of land uses in smaller ‘cities’. The Cities within Cities idea introduced by Hensher in 1980s (even if claimed by others in Warren Centre Report and DIPNR!).
Recognising nodes and flows and the likelihood of a poor match of H and J and delineating strategic corridors that matter in the nodes and flows setting
Serious investment in PT capacity between the nodes (or ‘cities’) Demand responsive PT at the nodes (time to stop being so inflexible) to support
density of destinations locally.– Incentives for firms to locate close together locally to support flexible servicing by PT to
and from each local node
– It is never too late What would happen if PT provision preceded land development? Can we recover or get PT use up after the event? Preferences can be changed.

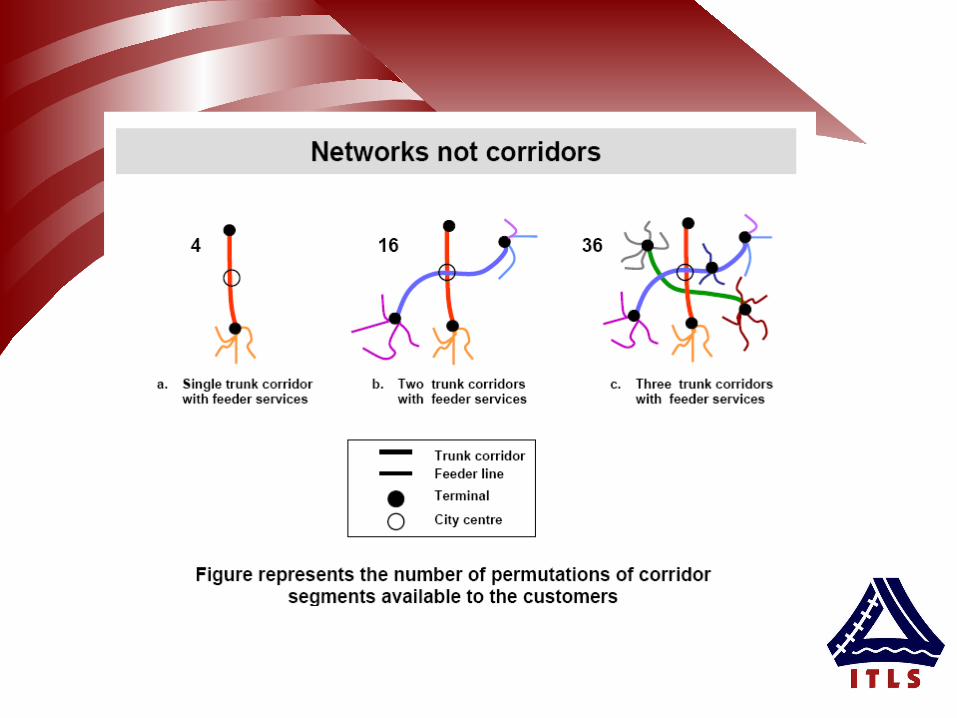
Frequency and Connectivity in addition to Scale
If we want to focus on a future with PT, then Frequency and connectivity (and visibility) is what it is all about
and this can be accommodated by flexible PT.– PT should be encouraged to be innovative in its delivery of
frequency and connectivity Furthermore given Australian OD densities, bus based systems
are ideal. They also are deliverable from the private sector and small (efficient) operators.
As we force large agglomeration of service providers we run the real risk of bureaucratising operator supply which together with the bureaucratised regulatory environment kills innovation and especially flexible service provision (World wide evidence). Also a concern about repatriating benefits offshore)
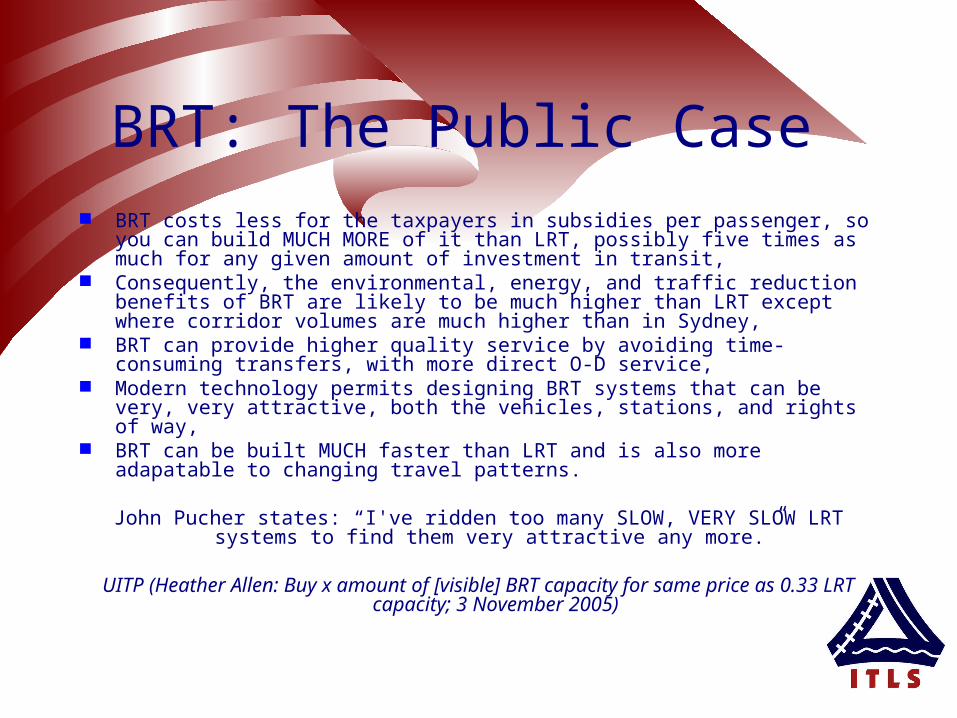
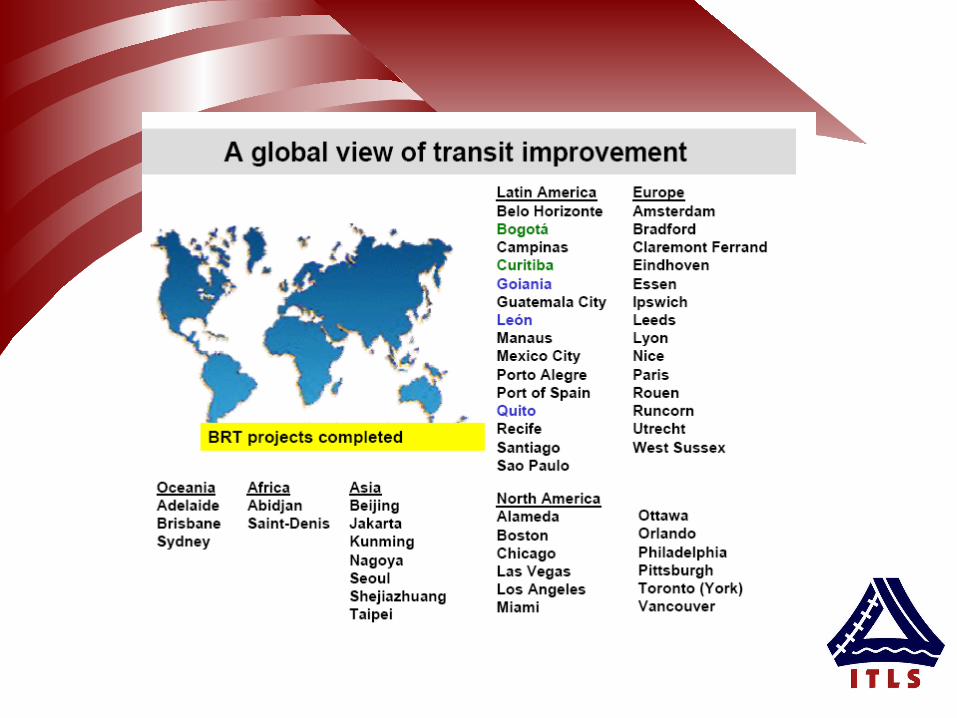
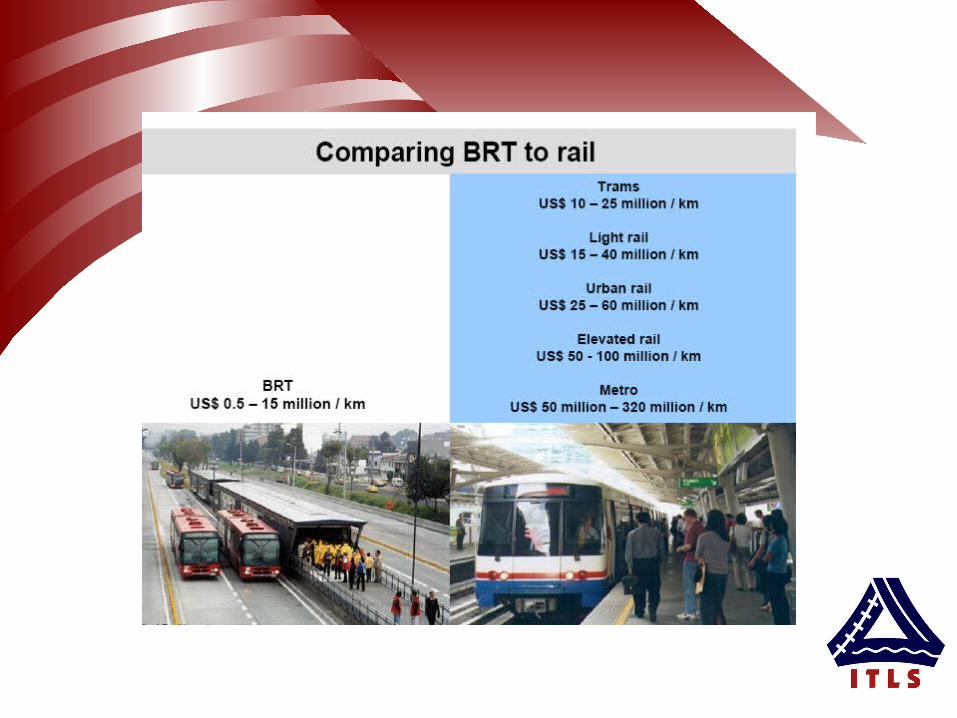
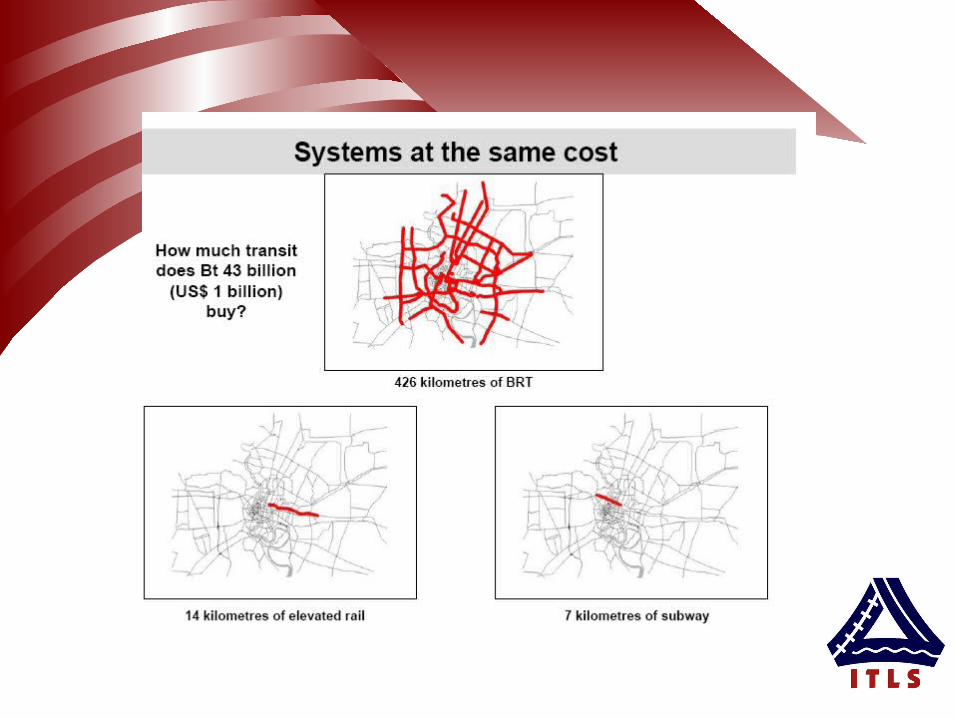
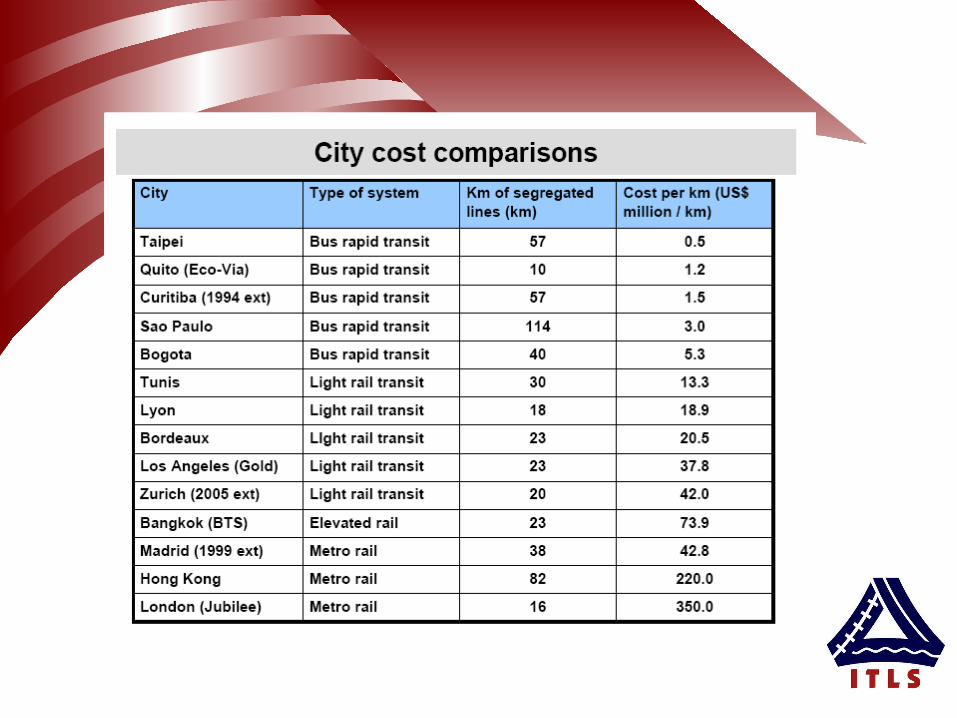
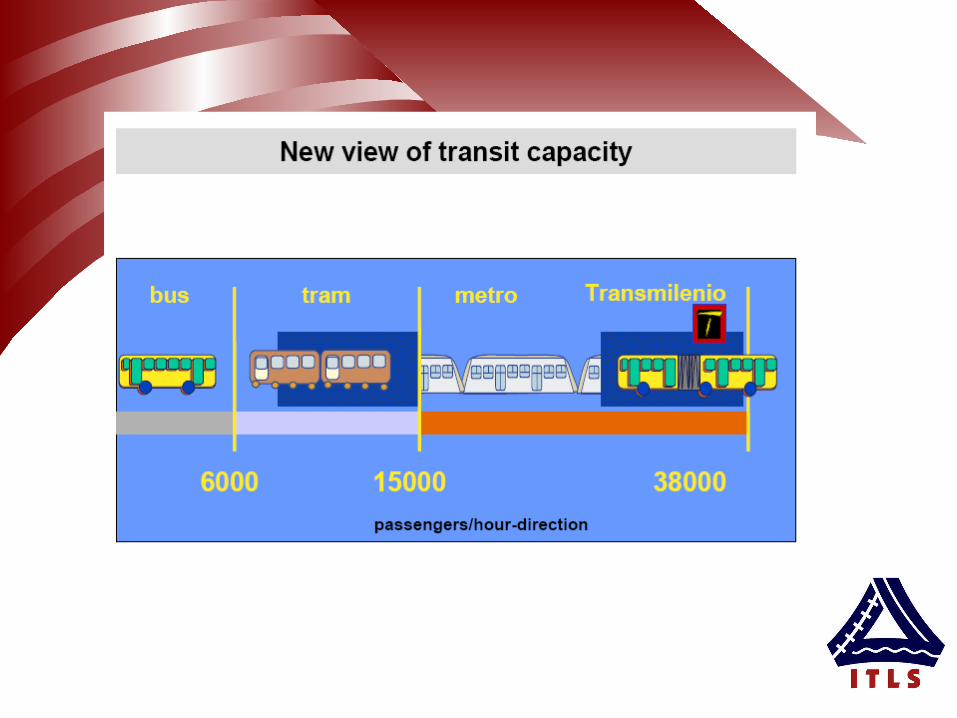
BRT: The Public Case BRT costs less for the taxpayers in subsidies per passenger, so you can build
MUCH MORE of it than LRT, possibly five times as much for any given amount of investment in transit,
Consequently, the environmental, energy, and traffic reduction benefits of BRT are likely to be much higher than LRT except where corridor volumes are much higher than in Sydney,
BRT can provide higher quality service by avoiding time-consuming transfers, with more direct O-D service,
Modern technology permits designing BRT systems that can be very, very attractive, both the vehicles, stations, and rights of way,
BRT can be built MUCH faster than LRT and is also more adapatable to changing travel patterns.
John Pucher states: “I've ridden too many SLOW, VERY SLOW LRT systems to find them very attractive any more.”
UITP (Heather Allen: Buy x amount of [visible] BRT capacity for same price as 0.33 LRT capacity; 3 November 2005)
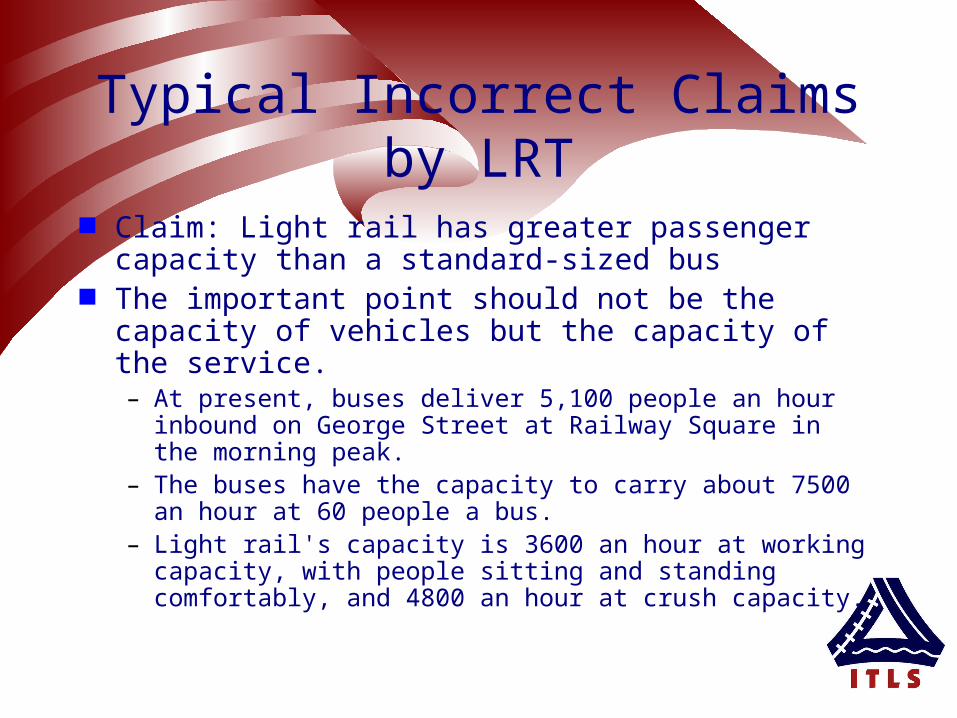
Typical Incorrect Claims by LRT
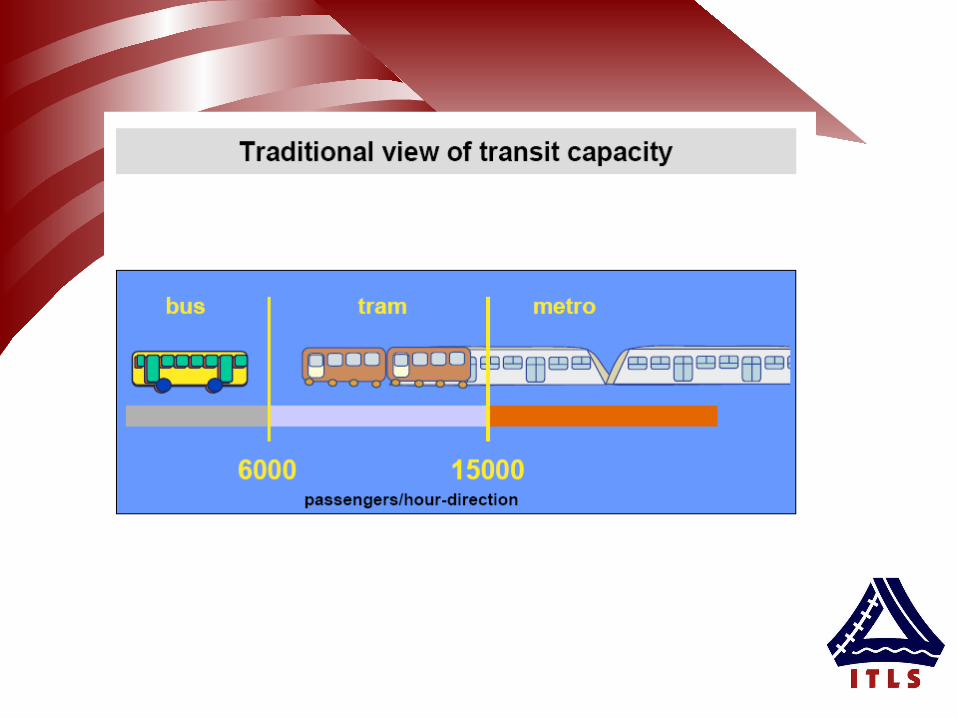
Claim: Light rail has greater passenger capacity than a standard-sized bus
The important point should not be the capacity of vehicles but the capacity of the service. – At present, buses deliver 5,100 people an hour inbound on
George Street at Railway Square in the morning peak. – The buses have the capacity to carry about 7500 an hour at
60 people a bus. – Light rail's capacity is 3600 an hour at working capacity, with
people sitting and standing comfortably, and 4800 an hour at crush capacity.
My Recommendation
Close off Castlereagh St entirely to all but buses– Allow almost seamless connections– This is the beginning of a real BRT
SYSTEM
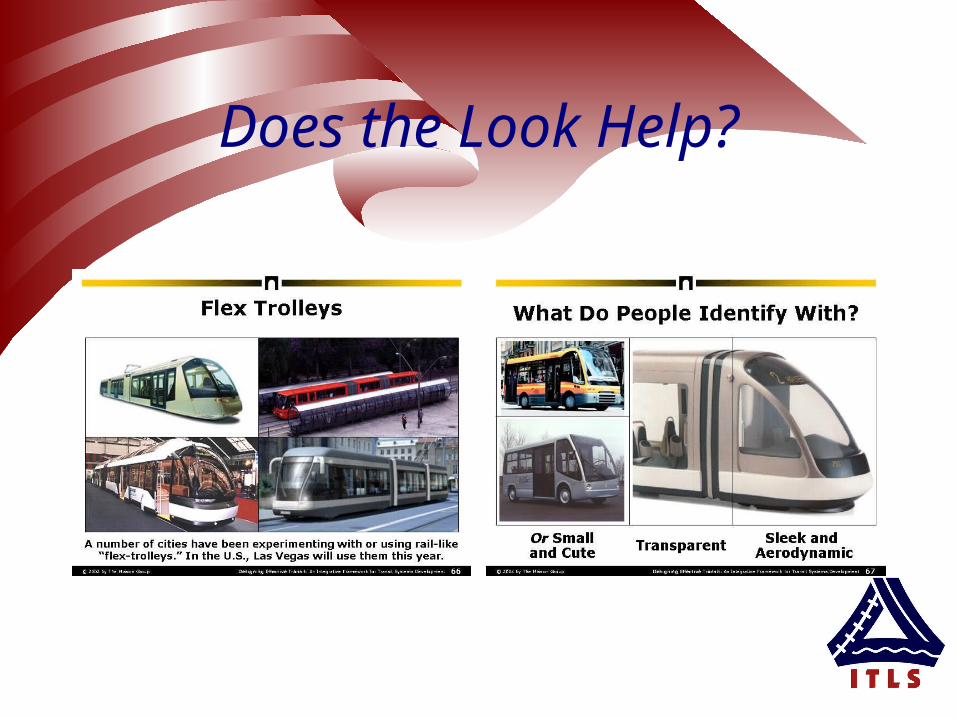
Does the Look Help?
Lets put it to the Test: The World Bank Proposal (circa 1993)
– Source: World Bank (1993) Housing: Enabling Markets to Work, Washington DC, The World Bank Select two (or more) greenfield sites Equip them with infrastructure (roads, PT…) far in
advance of new housing and land use
– Predicted Benefits: Improve competitiveness of PT Increase opportunities to discourage development of car-
based travel patterns Improve travel times for all modes
– The New Sydney Initiative?
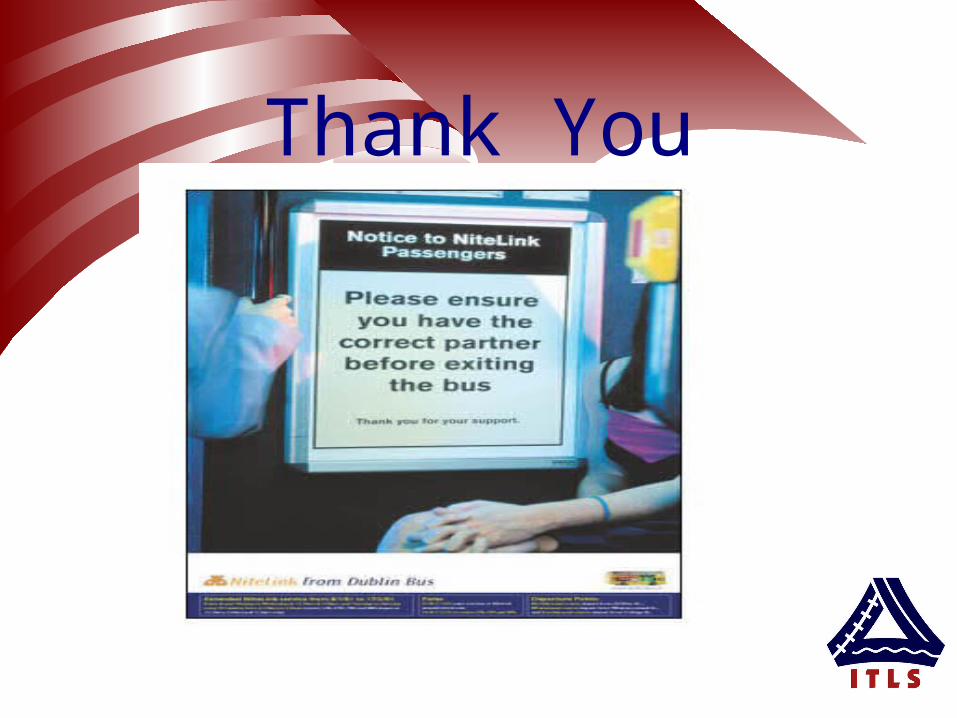
Thank You
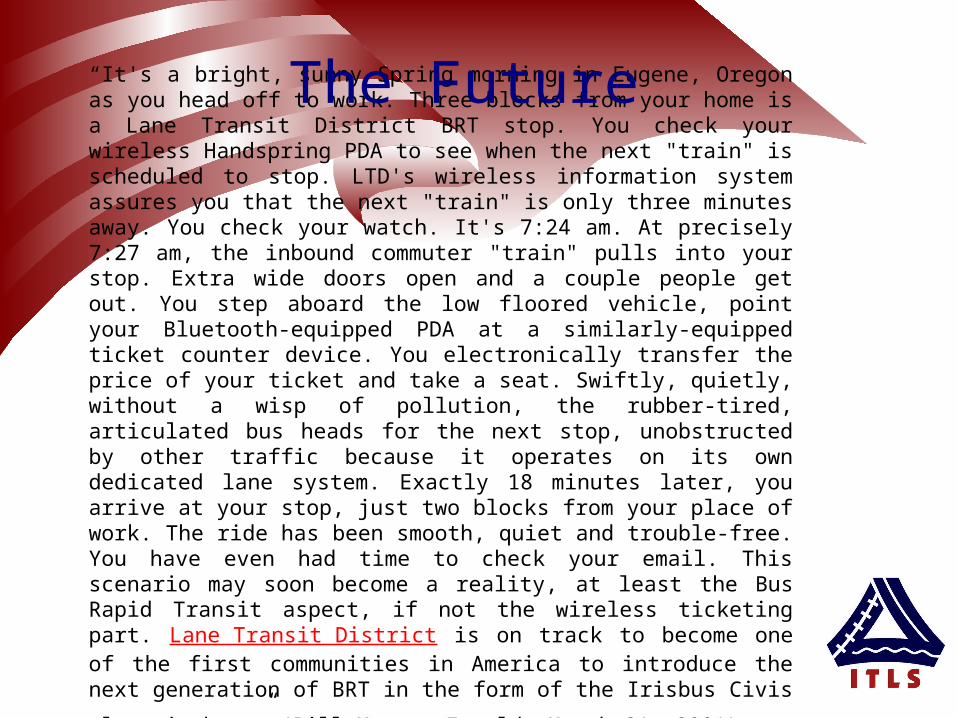
“It's a bright, sunny Spring morning in Eugene, Oregon as you head off to work. Three blocks from your home is a Lane Transit District BRT stop. You check your wireless Handspring PDA to see when the next "train" is scheduled to stop. LTD's wireless information system assures you that the next "train" is only three minutes away. You check your watch. It's 7:24 am. At precisely 7:27 am, the inbound commuter "train" pulls into your stop. Extra wide doors open and a couple people get out. You step aboard the low floored vehicle, point your Bluetooth-equipped PDA at a similarly-equipped ticket counter device. You electronically transfer the price of your ticket and take a seat. Swiftly, quietly, without a wisp of pollution, the rubber-tired, articulated bus heads for the next stop, unobstructed by other traffic because it operates on its own dedicated lane system. Exactly 18 minutes later, you arrive at your stop, just two blocks from your place of work. The ride has been smooth, quiet and trouble-free. You have even had time to check your email. This scenario may soon become a reality, at least the Bus Rapid Transit aspect, if not the wireless ticketing part. Lane Transit District is on track to become one of the first communities in America to introduce the next generation of BRT in the form of the Irisbus
Civis electric bus.” (Bill Moore, Eworld, March 31, 2001)
The Future
Recommended