SURVEY OF COMMERCIAL AND INSTITUTIONAL ENERGY USE –
BUILDINGS 2009DETAILED STATISTICAL REPORT
DECEMBER , 2012

Aussi disponible en français sous le titre : Enquête sur l’utilisation commerciale et institutionnelle d’énergie 2009 – bâtiment : rapport statistique détaillé
Cat. No. M144-4/1-2012 (Print)ISBN 978-1-100-54453-3
Cat. No. M144-4/1-2012E-PDF (On-line)ISBN 978-1-100-21536-5
© Her Majesty the Queen in Right of Canada, 2012
To obtain additional copies of this or other free publications on energy efficiency, contact:
Energy PublicationsOffice of Energy EfficiencyNatural Resources Canadac/o St. Joseph CommunicationsOrder Processing Unit1165 Kenaston StreetPO Box 9809, Stn TOttawa ON K1G 6S1Tel.: 1-800-387-2000 (toll-free)Fax: 613-740-3114TTY: 613-996-4397 (teletype for the hearing-impaired)
You can also view or order most Office of Energy Efficiency publications on-line. Visit our Virtual Library at oee.nrcan.gc.ca/publications. The Office of Energy Efficiency’s Web site is at oee.nrcan.gc.ca.
• Information contained in this publication or product may be reproduced, in part or in whole, and by any means, for personal or public non-commercial purposes, without charge or further permission, unless otherwise specified.
You are asked to:
• exercise due diligence in ensuring the accuracy of the materials reproduced;
• indicate the complete title of the materials reproduced, and the name and the author organization; and
• indicate that the reproduction is a copy of an official work that is published by the Government of Canada and that the reproduction has not been produced in affiliation with, or with the endorsement of the Government of Canada.
• Commercial reproduction and distribution is prohibited except with written permission from the Government of Canada’s copyright administrator, Public Works and Government Services Canada (PWGSC). For more information, contact PWGSC at 613-996-6886 or at [email protected].
DISCLAIMERHer Majesty is not responsible for the accuracy or completeness of the information contained in the reproduced material. Her Majesty shall at all times be indemnified and held harmless against any and all claims whatsoever arising out of negligence or other fault in the use of the information contained in this publication or product.
Recycled paper
Natural Resources Canada’s Office of Energy EfficiencyLeading Canadians to Energy Efficiency at Home, at Work and on the Road
SURVEY OF
COMMERCIAL AND INSTITUTIONAL ENERGY USE – BUILDINGS 2009
DETAILED STATISTICAL REPORT DECEMBER , 2012


iiiDetailed Statistical Report – December 2012
Contents
ContentsForeword . . . . . . . . . . . . . . . . . . . . . . . . . . . . . . . . . . . . . . . . . . . . . . . . . . . . . . . . . . . . . . . . . . . . . . . . . . . . . . . . . . . . . . . . . . . . . . . . . . . . . . . . . . . . . . . . . . . . . . . 1
How to read these tables . . . . . . . . . . . . . . . . . . . . . . . . . . . . . . . . . . . . . . . . . . . . . . . . . . . . . . . . . . . . . . . . . . . . . . . . . . . . . . . . . . . . . . . . . . . . . . . . 3
Scope of the report . . . . . . . . . . . . . . . . . . . . . . . . . . . . . . . . . . . . . . . . . . . . . . . . . . . . . . . . . . . . . . . . . . . . . . . . . . . . . . . . . . . . . . . . . . . . . . . . . . . . . . . 3
Table layout . . . . . . . . . . . . . . . . . . . . . . . . . . . . . . . . . . . . . . . . . . . . . . . . . . . . . . . . . . . . . . . . . . . . . . . . . . . . . . . . . . . . . . . . . . . . . . . . . . . . . . . . . . . . . . . . . . 3
Data quality . . . . . . . . . . . . . . . . . . . . . . . . . . . . . . . . . . . . . . . . . . . . . . . . . . . . . . . . . . . . . . . . . . . . . . . . . . . . . . . . . . . . . . . . . . . . . . . . . . . . . . . . . . . . . . . . . . 4
Regional information . . . . . . . . . . . . . . . . . . . . . . . . . . . . . . . . . . . . . . . . . . . . . . . . . . . . . . . . . . . . . . . . . . . . . . . . . . . . . . . . . . . . . . . . . . . . . . . . . . . . . . 5
Highlights . . . . . . . . . . . . . . . . . . . . . . . . . . . . . . . . . . . . . . . . . . . . . . . . . . . . . . . . . . . . . . . . . . . . . . . . . . . . . . . . . . . . . . . . . . . . . . . . . . . . . . . . . . . . . . . . . . . . . . . 7
Chapter 1. Canada . . . . . . . . . . . . . . . . . . . . . . . . . . . . . . . . . . . . . . . . . . . . . . . . . . . . . . . . . . . . . . . . . . . . . . . . . . . . . . . . . . . . . . . . . . . . . . . . . . . . . . . . . . 9
Table 1.1. Building characteristics and energy use by climate zone . . . . . . . . . . . . . . . . . . . . . . . . . . . . . . . . . . . . . . . . . . . . 10
Table 1.2. Building energy use by fuel type and climate zone . . . . . . . . . . . . . . . . . . . . . . . . . . . . . . . . . . . . . . . . . . . . . . . . . . . 10
Table 1.3. Building characteristics and energy use by primary activity of the building . . . . . . . . . . . . . . . . . . . . 11
Table 1.4. Building energy use by primary activity of the building . . . . . . . . . . . . . . . . . . . . . . . . . . . . . . . . . . . . . . . . . . . . . 12
Table 1.5. Building characteristics and energy use by number of floors . . . . . . . . . . . . . . . . . . . . . . . . . . . . . . . . . . . . . . 13
Table 1.6. Building characteristics and energy use by building size . . . . . . . . . . . . . . . . . . . . . . . . . . . . . . . . . . . . . . . . . . . . . 13
Table 1.7. Building characteristics and energy use by year of construction . . . . . . . . . . . . . . . . . . . . . . . . . . . . . . . . . . 14
Table 1.8. Building characteristics and energy use by hours of operation . . . . . . . . . . . . . . . . . . . . . . . . . . . . . . . . . . . 14
Table 1.9. Canadian commercial buildings by type of renovation . . . . . . . . . . . . . . . . . . . . . . . . . . . . . . . . . . . . . . . . . . . . . . 15
Table 1.10. Canadian commercial buildings by energy efficiency feature . . . . . . . . . . . . . . . . . . . . . . . . . . . . . . . . . . . . 16
Table 1.11. Building characteristics by energy source used . . . . . . . . . . . . . . . . . . . . . . . . . . . . . . . . . . . . . . . . . . . . . . . . . . . . . . 17
Table 1.12. Building characteristics by main energy source for space heating . . . . . . . . . . . . . . . . . . . . . . . . . . . . . . 18
Table 1.13. Building characteristics by main energy source for space cooling . . . . . . . . . . . . . . . . . . . . . . . . . . . . . . 18
Table 1.14. Building characteristics by main energy source for water heating . . . . . . . . . . . . . . . . . . . . . . . . . . . . . . 19
Table 1.15. Building characteristics and energy use by primary activity and size . . . . . . . . . . . . . . . . . . . . . . . . . . . 20
Table 1.16. Building characteristics and energy use by primary activity and year of construction . . . . . 24
Table 1.17. Building characteristics and energy use by primary activity and number of floors . . . . . . . . . 30
Table 1.18. Building characteristics and energy use by primary activity and number of hours of operation . . . . . . . . . . . . . . . . . . . . . . . . . . . . . . . . . . . . . . . . . . . . . . . . . . . . . . . . . . . . . . . . . . . . . . . . . . . . . . . . . . . . . . . . . . . . . . . . . 34
Table 1.19. Building characteristics by primary activity and type of renovation . . . . . . . . . . . . . . . . . . . . . . . . . . . . 38
iv Survey of Commercial and Institutional Energy Use – Buildings 2009
Contents
Chapter 2. Climate zone and region . . . . . . . . . . . . . . . . . . . . . . . . . . . . . . . . . . . . . . . . . . . . . . . . . . . . . . . . . . . . . . . . . . . . . . . . . . . . . . . 45
Table 2.1. Building characteristics and energy use by climate zone and size . . . . . . . . . . . . . . . . . . . . . . . . . . . . . . . . 46
Table 2.2. Building characteristics and energy use by climate zone and year of construction . . . . . . . . . . 48
Table 2.3. Building characteristics and energy use by climate zone and hours of operation . . . . . . . . . . . . 50
Table 2.4. Building characteristics and energy use by climate zone and primary activity . . . . . . . . . . . . . . . . . 52
Table 2.5. Building characteristics by climate zone and type of renovation . . . . . . . . . . . . . . . . . . . . . . . . . . . . . . . . . 54
Table 2.6. Building characteristics by climate zone and energy efficiency features . . . . . . . . . . . . . . . . . . . . . . . . . 56
Chapter 3. Renovations . . . . . . . . . . . . . . . . . . . . . . . . . . . . . . . . . . . . . . . . . . . . . . . . . . . . . . . . . . . . . . . . . . . . . . . . . . . . . . . . . . . . . . . . . . . . . . . . . 57
Table 3.1. Characteristics of buildings with any type of renovation . . . . . . . . . . . . . . . . . . . . . . . . . . . . . . . . . . . . . . . . . . . 58
Table 3.2. Characteristics of buildings with space heating renovations . . . . . . . . . . . . . . . . . . . . . . . . . . . . . . . . . . . . . . . 59
Table 3.3. Characteristics of buildings with space cooling renovations . . . . . . . . . . . . . . . . . . . . . . . . . . . . . . . . . . . . . . . 60
Table 3.4. Characteristics of buildings with lighting renovations . . . . . . . . . . . . . . . . . . . . . . . . . . . . . . . . . . . . . . . . . . . . . . . . 61
Table 3.5. Characteristics of buildings with windows/insulation renovations . . . . . . . . . . . . . . . . . . . . . . . . . . . . . . . . 62
Table 3.6. Characteristics of buildings with any other type of renovations . . . . . . . . . . . . . . . . . . . . . . . . . . . . . . . . . . 63
Chapter 4. Energy use . . . . . . . . . . . . . . . . . . . . . . . . . . . . . . . . . . . . . . . . . . . . . . . . . . . . . . . . . . . . . . . . . . . . . . . . . . . . . . . . . . . . . . . . . . . . . . . . . . . 65
Table 4.1. Characteristics of buildings using electricity . . . . . . . . . . . . . . . . . . . . . . . . . . . . . . . . . . . . . . . . . . . . . . . . . . . . . . . . . . . . 66
Table 4.2. Characteristics of buildings using natural gas . . . . . . . . . . . . . . . . . . . . . . . . . . . . . . . . . . . . . . . . . . . . . . . . . . . . . . . . . . 68
Table 4.3. Characteristics of buildings using distillates . . . . . . . . . . . . . . . . . . . . . . . . . . . . . . . . . . . . . . . . . . . . . . . . . . . . . . . . . . . . 70
Table 4.4. Characteristics of buildings using propane . . . . . . . . . . . . . . . . . . . . . . . . . . . . . . . . . . . . . . . . . . . . . . . . . . . . . . . . . . . . . 72
Table 4.5. Characteristics of buildings using other fuels . . . . . . . . . . . . . . . . . . . . . . . . . . . . . . . . . . . . . . . . . . . . . . . . . . . . . . . . . . 74
Table 4.6. Characteristics of buildings that primarily use electricity for space heating . . . . . . . . . . . . . . . . . . . . 76
Table 4.7. Characteristics of buildings that primarily use natural gas for space heating . . . . . . . . . . . . . . . . . . 78
Table 4.8. Characteristics of buildings that primarily use distillates for space heating . . . . . . . . . . . . . . . . . . . . . 80
Table 4.9. Characteristics of buildings that have no space cooling . . . . . . . . . . . . . . . . . . . . . . . . . . . . . . . . . . . . . . . . . . . . . 82
Table 4.10. Characteristics of buildings that primarily use electricity for space cooling . . . . . . . . . . . . . . . . . . 84
Table 4.11. Characteristics of buildings that primarily use natural gas for space cooling . . . . . . . . . . . . . . . . . 86
Table 4.12. Characteristics of buildings that have no water heating . . . . . . . . . . . . . . . . . . . . . . . . . . . . . . . . . . . . . . . . . . . 88
Table 4.13. Characteristics of buildings that primarily use electricty for water heating . . . . . . . . . . . . . . . . . . . 90
Table 4.14. Characteristics of buildings that primarily use natural gas for water heating . . . . . . . . . . . . . . . . . 92
Table 4.15. Characteristics of buildings that primarily use distillates for water heating . . . . . . . . . . . . . . . . . . . 94
v
Contents
Chapter 5. Energy efficiency features . . . . . . . . . . . . . . . . . . . . . . . . . . . . . . . . . . . . . . . . . . . . . . . . . . . . . . . . . . . . . . . . . . . . . . . . . . . . . . 97
Table 5.1. Characteristics of buildings with energy efficiency features . . . . . . . . . . . . . . . . . . . . . . . . . . . . . . . . . . . . . . . . 98
Table 5.2. Characteristics of buildings with energy conservation awareness programs . . . . . . . . . . . . . . . . . . 99
Table 5.3. Characteristics of buildings with energy management control systems for HVAC . . . . . . . . 100
Table 5.4. Characteristics of buildings with energy management control systems for lighting . . . . . . . . 101
Appendix A. Methodology . . . . . . . . . . . . . . . . . . . . . . . . . . . . . . . . . . . . . . . . . . . . . . . . . . . . . . . . . . . . . . . . . . . . . . . . . . . . . . . . . . . . . . . . . . . .103
Introduction. . . . . . . . . . . . . . . . . . . . . . . . . . . . . . . . . . . . . . . . . . . . . . . . . . . . . . . . . . . . . . . . . . . . . . . . . . . . . . . . . . . . . . . . . . . . . . . . . . . . . . . . . . . . . . . 104
Overview of the integrated survey . . . . . . . . . . . . . . . . . . . . . . . . . . . . . . . . . . . . . . . . . . . . . . . . . . . . . . . . . . . . . . . . . . . . . . . . . . . . . . . . . 104
Appendix B. Glossary . . . . . . . . . . . . . . . . . . . . . . . . . . . . . . . . . . . . . . . . . . . . . . . . . . . . . . . . . . . . . . . . . . . . . . . . . . . . . . . . . . . . . . . . . . . . . . . . . . .109
Appendix C. Descriptions of building activity . . . . . . . . . . . . . . . . . . . . . . . . . . . . . . . . . . . . . . . . . . . . . . . . . . . . . . . . . . . . . . . . .113
Appendix D. Commercial and institutional building energy use survey – questionnaire . . . . .117
Appendix E. Climate zones . . . . . . . . . . . . . . . . . . . . . . . . . . . . . . . . . . . . . . . . . . . . . . . . . . . . . . . . . . . . . . . . . . . . . . . . . . . . . . . . . . . . . . . . . . .125
Appendix F. Regional information . . . . . . . . . . . . . . . . . . . . . . . . . . . . . . . . . . . . . . . . . . . . . . . . . . . . . . . . . . . . . . . . . . . . . . . . . . . . . . . . . .129
Table F-1. Building characteristics and energy use by region and size . . . . . . . . . . . . . . . . . . . . . . . . . . . . . . . . . . . . . . 130
Table F-2. Building characteristics and energy use by region and year of construction . . . . . . . . . . . . . . . . 132
Table F-3. Building characteristics and energy use by region and hours of operation . . . . . . . . . . . . . . . . . . 134
Table F-4. Building characteristics and energy use by region and primary activity . . . . . . . . . . . . . . . . . . . . . . . 136


1
Foreword
ForewordThe Survey of Commercial and Institutional Energy Use (SCIEU) combines the goals of two existing energy-use surveys: the Commercial and Institutional Consumption of Energy Survey (CICES) and the Commercial and Institutional Building Energy Use Survey (CIBEUS).
Every year Natural Resources Canada’s Office of Energy Efficiency (OEE) estimates Canada’s energy consumption by economic sector. The objective of the establishment-based component of the SCIEU is to produce statistical estimates of energy consumption for calendar year 2009 for the commercial and institutional (C&I) sector based on selected North American Industrial Classification System (NAICS) groupings. These estimates are then used as a key input into estimating the sector’s contribution to Canada’s overall end use energy consumption.
The OEE also develops policies and programs to encourage reducing energy consumption of C&I buildings. The objective of the buildings-based component of the SCIEU is to establish baseline energy consumption figures against which new policies and programs geared toward energy efficiency in C&I buildings can be measured. The buildings-based component of the SCIEU collects building characteristics and energy consumption estimates by building type and by climate zone.
This statistical report on the SCIEU 2009 buildings was prepared by Samuel Blais, Margaretta Do and Bing He, while overall direction was provided by Andrew Kormylo, of the Demand Policy and Analysis Division of the OEE. An electronic version of the publication is available on the OEE Web site at oee.nrcan.gc.ca/statistics.
For more information on this publication or the OEE’s services, visit the Web site at oee.nrcan.gc.ca. You can also contact the OEE by e-mail at [email protected] or by writing to
Office of Energy EfficiencyNatural Resources Canada580 Booth StreetOttawa ON K1A 0E4


3
How to read these tables
How to read these tables
Scope of the reportThis detailed statistical report provides estimates of the number of buildings, floor space, energy consumption and energy intensity at a desegregated level for the target population. The target population includes buildings in which at least 50 percent of the floor space is devoted to the following commercial or institutional activities:
• office buildings (non-medical)
•medical office buildings
• elementary and secondary schools
• nursing and residential care facilities
•warehouses
• hotels and motels
• hospitals
• food and beverage stores
• non-food retail stores
• other
For more detail on the survey and/or how the data is gathered by Statistics Canada, see Appendix A, Methodology.
Table layoutAll data in this report are presented in a data table format. A typical data table is presented below.
For each category listed in the left column of a table, the building’s characteristic is listed under the appropriate column on the right. All numbers in the tables are rounded to varying degrees according to the characteristic. As a result, these numbers may not add up to the totals indicated and may differ slightly among tables.
The example below provides data estimates for the number of buildings, floor space, energy use and energy intensity for the various climate zones. For example, if the reader wants to know how many C&I buildings were in the Atlantic climate zone in 2009, one would look for those categories in each column (see the yellow arrows) and locate the data estimate that lines up with both categories (see the yellow rectangle).
Example Table 1.1 – Building characteristics and energy use by climate zone
Climate zone
Buildings Floor space Energy use Energy intensity
Q.I. (millions of m2)
Q.I. (PJ) Q.I. (GJ/m2) Q.I.
Atlantic 47 911 A 69.8 A 71.6 A 1.03 A
Great Lakes 233 880 A 417.3 A 437.2 A 1.05 A
Pacific Coast 38 092 A 64.6 A 64.0 B 0.99 A
Other 162 383 A 214.2 A 269.4 A 1.26 A
Canada 482 266 A 765.9 A 842.2 A 1.10 A

4
How to read these tables
Data qualityIt is important to note that the SCIEU is a survey, not a census, of the C&I sector. Despite the best efforts of Statistics Canada to maintain a high level of quality for each of the survey’s phases, the data estimates produced are inevitably subject to variance in the level of confidence, as is the case with any survey. In addition, the SCIEU was not designed as a longitudinal survey in which the same respondents are surveyed for each survey iteration. Therefore, it is not advisable to compare these results with previous surveys of the C&I sector such as CIBEUS 2000, CICES 2007 or CICES 2008.
The quality of the data estimates must be assessed because the estimates represent 482 266 buildings but were created from a sample of 5704 buildings. When estimates are calculated, coefficients of variation are also provided. The coefficients indicate the reliability of the estimate. An example of the letter coding is circled in yellow in the table presented on the previous page. The letter coding is defined as follows.
Quality indicators associated with the coefficients of variation
Coefficient of variation
Quality indicator
Quality of estimate
20% or less A excellent
21 to 30% B good
31 to 40% C acceptable
more than 40% F too unreliable to be published
Confidential X suppressed to meet the confidentiality requirements of The Statistics Act
The data presented in this report are estimates. The real values differ from the estimates by less than two times the coefficient of variation (CV) 95 percent of the time. In other words, if the survey was repeated 20 times, the estimated value of the survey would be expected to fall between certain values 19 times out of 20.
The following example uses the total energy intensity for Canada presented in Table 1.1.
1.10 gigajoules per square metre (GJ/m2) and a Q.I. of A (CV = 3.45 percent)
Value {1 +/- 1.96 [CV]} = 1.10 {1 ±1.96 [3.45%]} = {1.03, 1.17}
If this survey was repeated 20 times, it is expected that the Canadian total energy intensity would be between 1.03 and 1.17 GJ/m2 19 times.
In the tables, there are some instances where there are poor quality indicators for floor space and poor quality indicators for energy use (sometimes even F quality and hidden values), yet total energy intensity will appear with a good quality indicator.
This may appear to be counterintuitive because the quality indicator is mostly based on the coefficient of variation and because the total energy intensity is a ratio. But if both estimates of each contributing record (the numerator and denominator) vary in the same direction, the resulting ratio is stable and can therefore have a better quality indicator.
The methodology used to calculate estimates, as well as to collect data, is summarized in Appendix A.
5
How to read these tables
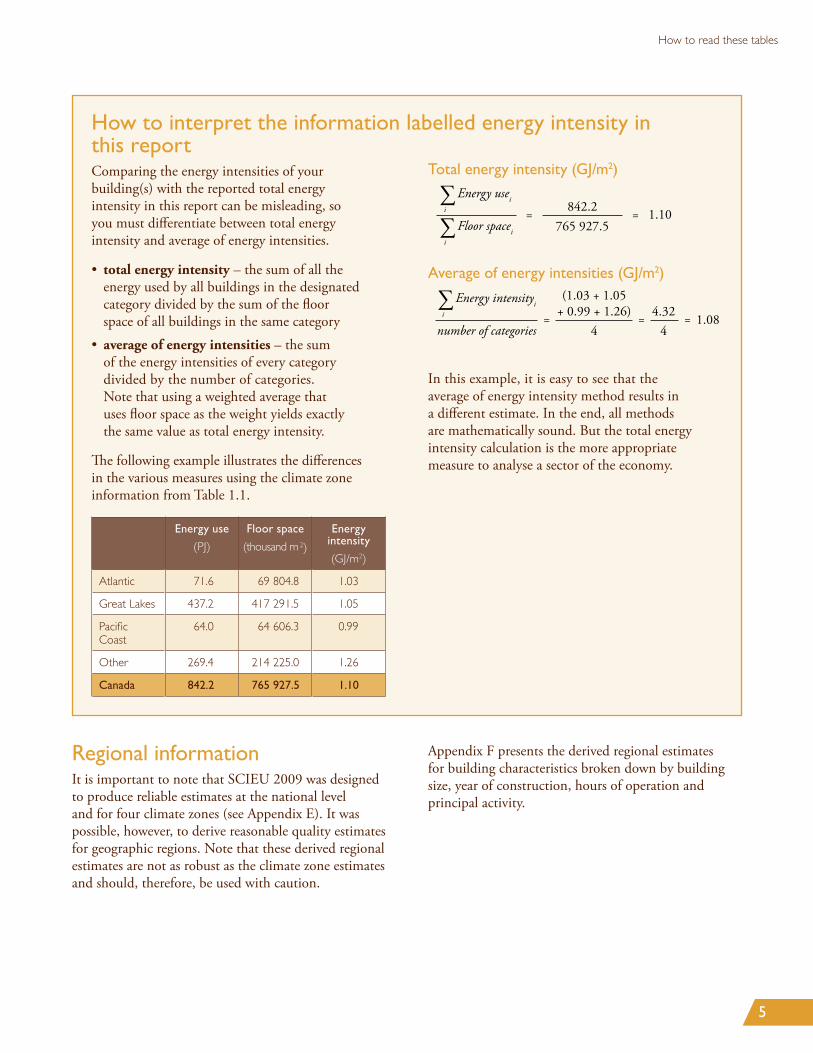
How to interpret the information labelled energy intensity in this reportComparing the energy intensities of your building(s) with the reported total energy intensity in this report can be misleading, so you must differentiate between total energy intensity and average of energy intensities.
• total energy intensity – the sum of all the energy used by all buildings in the designated category divided by the sum of the floor space of all buildings in the same category
• average of energy intensities – the sum of the energy intensities of every category divided by the number of categories. Note that using a weighted average that uses floor space as the weight yields exactly the same value as total energy intensity.
The following example illustrates the differences in the various measures using the climate zone information from Table 1.1.
Energy use
(PJ)
Floor space
(thousand m2)
Energy intensity
(GJ/m2)
Atlantic 71.6 69 804.8 1.03
Great Lakes 437.2 417 291.5 1.05
Pacific Coast
64.0 64 606.3 0.99
Other 269.4 214 225.0 1.26
Canada 842.2 765 927.5 1.10
Total energy intensity (GJ/m2)
Average of energy intensities (GJ/m2)
∑Energy usei
∑Floor spacei
∑Energy intensityi
number of categories
i
i
= = 1.10842.2765 927.5
i = =
(1.03 + 1.05+ 0.99 + 1.26)
44.32
4= 1.08
In this example, it is easy to see that the average of energy intensity method results in a different estimate. In the end, all methods are mathematically sound. But the total energy intensity calculation is the more appropriate measure to analyse a sector of the economy.
∑Energy usei
∑Floor spacei
∑Energy intensityi
number of categories
i
i
= = 1.10842.2765 927.5
i = =
(1.03 + 1.05+ 0.99 + 1.26)
44.32
4= 1.08
Regional informationIt is important to note that SCIEU 2009 was designed to produce reliable estimates at the national level and for four climate zones (see Appendix E). It was possible, however, to derive reasonable quality estimates for geographic regions. Note that these derived regional estimates are not as robust as the climate zone estimates and should, therefore, be used with caution.
Appendix F presents the derived regional estimates for building characteristics broken down by building size, year of construction, hours of operation and principal activity.


7
Highlights
HighlightsThere were more than 480 000 C&I buildings in Canada in 2009, occupying more than 750 million m2 of floor space and using more than 840 petajoules (PJ) of energy, according to the SCIEU. Almost half (48.5 percent) of Canada’s C&I buildings were in the Great Lakes climate zone in 2009.
The overall energy intensity of C&I buildings in Canada was 1.10 GJ/m2 in 2009. In comparison, in 2009, the average household used 0.79 GJ/m2 (Energy Use Data Handbook 1990 to 2009).
Office buildings (non-medical) represented 17.3 percent of all C&I buildings.
More than 34 percent of all C&I buildings in Canada were built between 1970 and 1989.
Natural gas was the primary energy source used for space heating by the majority (54.0 percent) of C&I buildings.
Nearly half (45.6 percent) of all C&I buildings had some type of renovation done in the last five years.
More than half (55.2 percent) of all C&I buildings had some form of energy efficiency feature1 in place in 2009.
1 energy conservation awareness program, energy management control system for heating, ventilating and cooling and/or lighting


Title: Lorem ipsum
9
1CANADA
10 Survey of Commercial and Institutional Energy Use – Buildings 2009
Chapter 1: Canada
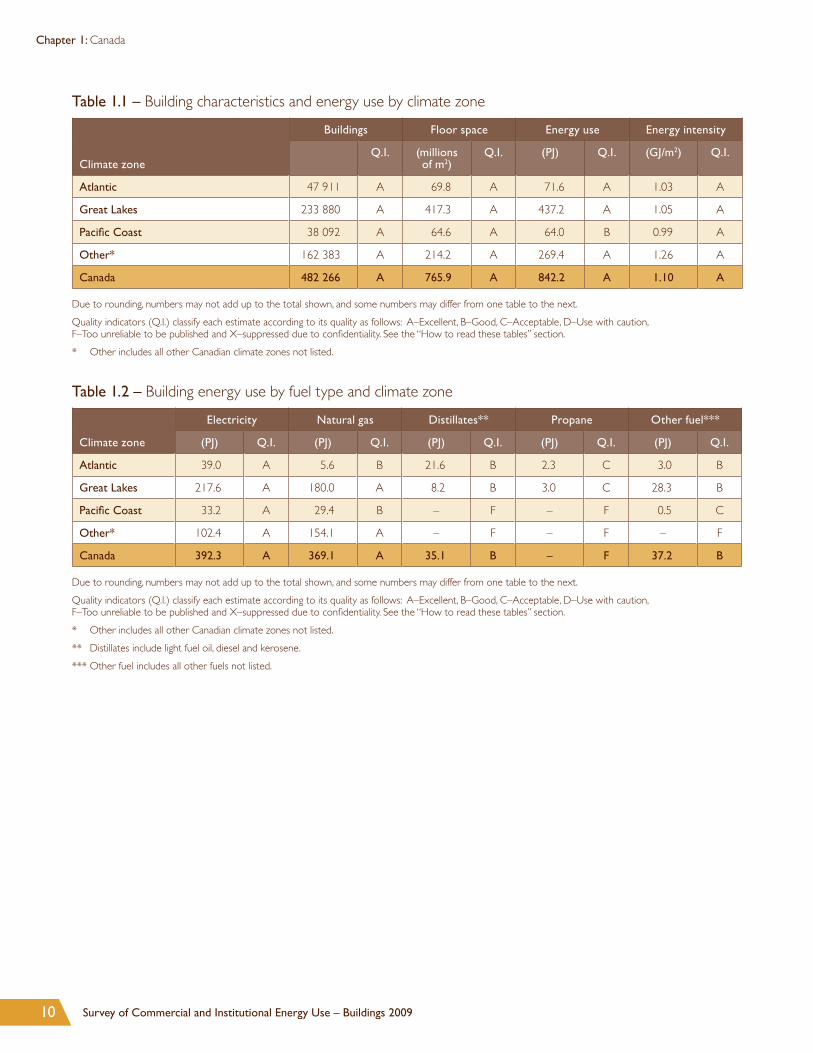
Table 1.1 – Building characteristics and energy use by climate zone
Climate zone
Buildings Floor space Energy use Energy intensity
Q.I. (millions of m2)
Q.I. (PJ) Q.I. (GJ/m2) Q.I.
Atlantic 47 911 A 69.8 A 71.6 A 1.03 A
Great Lakes 233 880 A 417.3 A 437.2 A 1.05 A
Pacific Coast 38 092 A 64.6 A 64.0 B 0.99 A
Other* 162 383 A 214.2 A 269.4 A 1.26 A
Canada 482 266 A 765.9 A 842.2 A 1.10 A
Due to rounding, numbers may not add up to the total shown, and some numbers may differ from one table to the next.
Quality indicators (Q.I.) classify each estimate according to its quality as follows: A–Excellent, B–Good, C–Acceptable, D–Use with caution, F–Too unreliable to be published and X–suppressed due to confidentiality. See the “How to read these tables” section.
* Other includes all other Canadian climate zones not listed.
Table 1.2 – Building energy use by fuel type and climate zone
Climate zone
Electricity Natural gas Distillates** Propane Other fuel***
(PJ) Q.I. (PJ) Q.I. (PJ) Q.I. (PJ) Q.I. (PJ) Q.I.
Atlantic 39.0 A 5.6 B 21.6 B 2.3 C 3.0 B
Great Lakes 217.6 A 180.0 A 8.2 B 3.0 C 28.3 B
Pacific Coast 33.2 A 29.4 B – F – F 0.5 C
Other* 102.4 A 154.1 A – F – F – F
Canada 392.3 A 369.1 A 35.1 B – F 37.2 B
Due to rounding, numbers may not add up to the total shown, and some numbers may differ from one table to the next.
Quality indicators (Q.I.) classify each estimate according to its quality as follows: A–Excellent, B–Good, C–Acceptable, D–Use with caution, F–Too unreliable to be published and X–suppressed due to confidentiality. See the “How to read these tables” section.
* Other includes all other Canadian climate zones not listed.
** Distillates include light fuel oil, diesel and kerosene.
*** Other fuel includes all other fuels not listed.
11Detailed Statistical Report – December 2012
Chapter 1: Canada
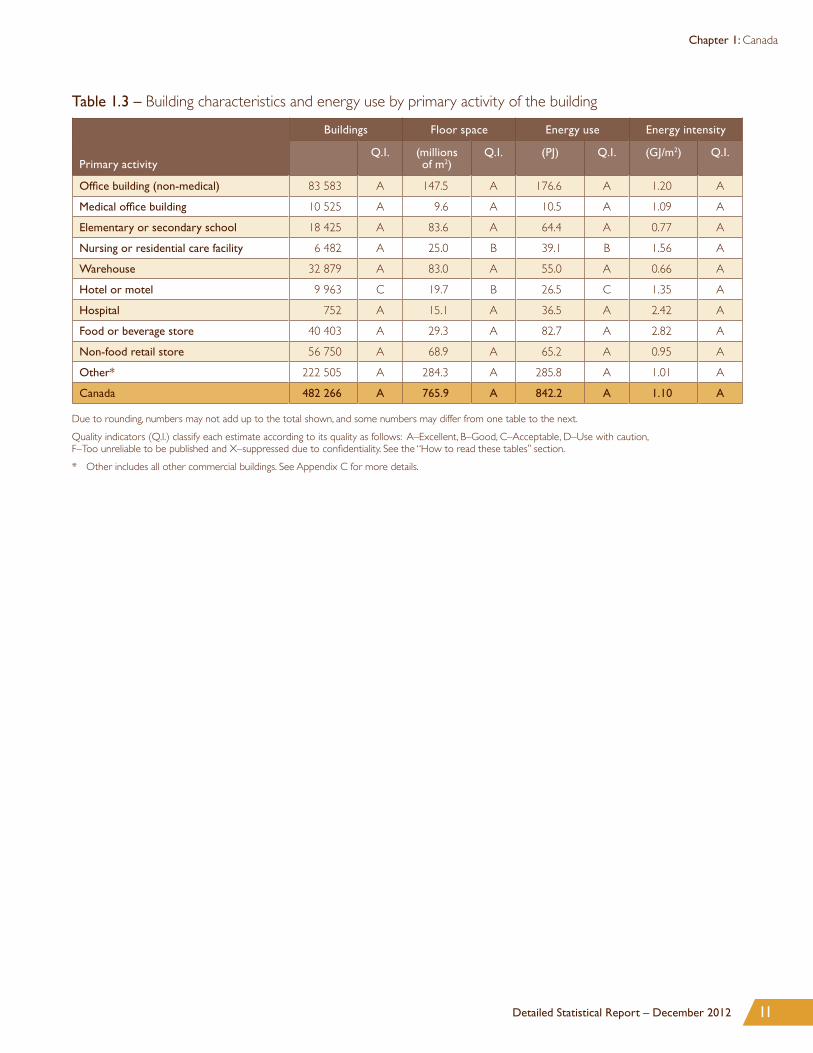
Table 1.3 – Building characteristics and energy use by primary activity of the building
Primary activity
Buildings Floor space Energy use Energy intensity
Q.I. (millions of m2)
Q.I. (PJ) Q.I. (GJ/m2) Q.I.
Office building (non-medical) 83 583 A 147.5 A 176.6 A 1.20 A
Medical office building 10 525 A 9.6 A 10.5 A 1.09 A
Elementary or secondary school 18 425 A 83.6 A 64.4 A 0.77 A
Nursing or residential care facility 6 482 A 25.0 B 39.1 B 1.56 A
Warehouse 32 879 A 83.0 A 55.0 A 0.66 A
Hotel or motel 9 963 C 19.7 B 26.5 C 1.35 A
Hospital 752 A 15.1 A 36.5 A 2.42 A
Food or beverage store 40 403 A 29.3 A 82.7 A 2.82 A
Non-food retail store 56 750 A 68.9 A 65.2 A 0.95 A
Other* 222 505 A 284.3 A 285.8 A 1.01 A
Canada 482 266 A 765.9 A 842.2 A 1.10 A
Due to rounding, numbers may not add up to the total shown, and some numbers may differ from one table to the next.
Quality indicators (Q.I.) classify each estimate according to its quality as follows: A–Excellent, B–Good, C–Acceptable, D–Use with caution, F–Too unreliable to be published and X–suppressed due to confidentiality. See the “How to read these tables” section.
* Other includes all other commercial buildings. See Appendix C for more details.

12 Survey of Commercial and Institutional Energy Use – Buildings 2009
Chapter 1: Canada
Table 1.4 – Building energy use by primary activity of the building
Primary activity
Electricity Natural gas Distillates** Propane Other fuel***
(PJ) Q.I. (PJ) Q.I. (PJ) Q.I. (PJ) Q.I. (PJ) Q.I.
Office building (non-medical) 101.1 A 63.4 A 2.3 B – F – F
Medical office building 5.4 A 4.7 B 0.1 B – F 0.2 C
Elementary or secondary school 24.1 A 34.7 A 4.8 B – F X X
Nursing or residential care facility 14.9 B 19.8 B 0.9 A 0.1 C – F
Warehouse 24.9 A 29.4 A 0.5 C – F X X
Hotel or motel 11.0 C – F – F – F – F
Hospital 12.6 A 18.2 A 3.7 C – F 1.9 B
Food or beverage store 45.2 A 35.7 A 0.8 C 1.0 C X X
Non-food retail store 31.7 A 29.6 B – F – F – F
Other* 121.4 A 120.5 A – F – F 21.5 B
Canada 392.3 A 369.1 A 35.1 B – F 37.2 B
Due to rounding, numbers may not add up to the total shown, and some numbers may differ from one table to the next.
Quality indicators (Q.I.) classify each estimate according to its quality as follows: A–Excellent, B–Good, C–Acceptable, D–Use with caution, F–Too unreliable to be published and X–suppressed due to confidentiality. See the “How to read these tables” section.
* Other includes all other commercial buildings. See Appendix C for more details.
** Distillates include light fuel oil, diesel and kerosene.
*** Other fuel includes all other fuels not listed.

13Detailed Statistical Report – December 2012
Chapter 1: Canada
Table 1.5 – Building characteristics and energy use by number of floors
Floors
Buildings Floor space Energy use Energy intensity
Q.I. (millions of m2)
Q.I. (PJ) Q.I. (GJ/m2) Q.I.
1 229 475 A 227.9 A 269.7 A 1.18 A
2 147 645 A 220.6 A 215.2 A 0.98 A
3 73 782 A 135.5 A 126.9 A 0.94 A
4 to 9 29 482 A 112.6 A 138.3 A 1.23 A
10 and more 1 881 B 69.4 C 92.2 B 1.33 A
Canada 482 266 A 765.9 A 842.2 A 1.10 A
Due to rounding, numbers may not add up to the total shown, and some numbers may differ from one table to the next.
Quality indicators (Q.I.) classify each estimate according to its quality as follows: A–Excellent, B–Good, C–Acceptable, D–Use with caution, F–Too unreliable to be published and X–suppressed due to confidentiality. See the “How to read these tables” section.
Table 1.6 – Building characteristics and energy use by building size
Building size
Buildings Floor space Energy use Energy intensity
Q.I. (millions of m2)
Q.I. (PJ) Q.I. (GJ/m2) Q.I.
5000 square feet or less (465 m2 or less) 236 539 A 57.3 A 93.8 A 1.64 A
5001 to 10 000 square feet (466 to 929 m2) 91 680 A 61.6 A 72.7 A 1.18 A
10 001 to 50 000 square feet (930 to 4645 m2) 123 565 A 252.4 A 259.3 A 1.03 A
50 001 to 200 000 square feet (4646 to 18 580 m2) 25 319 A 208.3 A 226.1 A 1.09 A
Over 200 000 square feet (Over 18 580 m2) 5 162 A 186.4 A 190.4 A 1.02 A
Canada 482 266 A 765.9 A 842.2 A 1.10 A
Due to rounding, numbers may not add up to the total shown, and some numbers may differ from one table to the next.
Quality indicators (Q.I.) classify each estimate according to its quality as follows: A–Excellent, B–Good, C–Acceptable, D–Use with caution, F–Too unreliable to be published and X–suppressed due to confidentiality. See the “How to read these tables” section.

14 Survey of Commercial and Institutional Energy Use – Buildings 2009
Chapter 1: Canada
Table 1.7 – Building characteristics and energy use by year of construction
Building size
Buildings Floor space Energy use Energy intensity
Q.I. (millions of m2)
Q.I. (PJ) Q.I. (GJ/m2) Q.I.
Before 1920 46 951 A 54.0 A 50.5 A 0.93 A
1920 to 1959 83 521 A 91.1 A 98.9 A 1.09 A
1960 to 1969 67 758 A 126.1 A 120.6 A 0.96 A
1970 to 1979 75 107 A 158.6 A 183.1 A 1.15 A
1980 to 1989 91 404 A 116.2 A 131.9 A 1.14 A
1990 to 1999 58 106 A 105.3 A 120.1 A 1.14 A
2000 or later 59 418 A 114.6 A 137.1 A 1.20 A
2000 to 2004 29 316 A 55.3 A 74.0 B 1.34 A
2005 or later 30 102 A 59.4 B 63.1 A 1.06 A
Canada 482 266 A 765.9 A 842.2 A 1.10 A
Due to rounding, numbers may not add up to the total shown, and some numbers may differ from one table to the next.
Quality indicators (Q.I.) classify each estimate according to its quality as follows: A–Excellent, B–Good, C–Acceptable, D–Use with caution, F–Too unreliable to be published and X–suppressed due to confidentiality. See the “How to read these tables” section.
Table 1.8 – Building characteristics and energy use by hours of operation*
Hours of operation
Buildings Floor space Energy use Energy intensity
Q.I. (millions of m2)
Q.I. (PJ) Q.I. (GJ/m2) Q.I.
36 or less 48 333 A 31.8 A 26.8 A 0.84 A
37 to 48 132 389 A 148.2 A 128.4 A 0.87 A
49 to 72 149 721 A 234.0 A 207.0 A 0.88 A
73 to 96 47 380 A 109.0 A 129.2 A 1.18 A
97 to 120 38 492 A 62.5 A 104.5 A 1.67 A
121 to 168 65 951 A 180.4 A 246.3 A 1.37 A
Canada 482 266 A 765.9 A 842.2 A 1.10 A
Due to rounding, numbers may not add up to the total shown, and some numbers may differ from one table to the next.
Quality indicators (Q.I.) classify each estimate according to its quality as follows: A–Excellent, B–Good, C–Acceptable, D–Use with caution, F–Too unreliable to be published and X–suppressed due to confidentiality. See the “How to read these tables” section.
* Total number of operating hours in a typical week.

15Detailed Statistical Report – December 2012
Chapter 1: Canada
Note that a building can have more than one type of renovation. Therefore the sum of the renovated buildings will not add up to the total number of buildings in Canada. Overall, there were 219 910 buildings had at least one renovation, while 262 355 did not have any renovations. The renovations/retrofits noted above were undertaken during the years 2005 to 2009 (in the last five years).
Table 1.9 – Canadian commercial buildings by type of renovation
Type of renovation
Buildings Share of total buildings
Floor space Share of total floor space
Q.I. (millions of m2)
Q.I.
No renovation 262 355 A 54.4% 328.7 A 42.9%
Any type of renovation 219 910 A 45.6% 437.2 A 57.1%
Space heating 84 385 A 17.5% 211.2 A 27.6%
Space cooling 61 219 A 12.7% 156.3 A 20.4%
Lighting 125 518 A 26.0% 282.6 A 36.9%
Windows/insulation 82 900 A 17.2% 167.0 A 21.8%
Additions/reductions 22 226 A 4.6% 58.5 A 7.6%
Other* 81 576 A 16.9% 164.5 A 21.5%
Any two energy-related renovations** 46 372 A 9.6% 109.4 A 14.3%
Any three energy-related renovations** 30 409 A 6.3% 72.9 A 9.5%
Any four energy-related renovations** 13 586 B 2.8% 35.2 B 4.6%
Any five energy-related renovations** 9 096 B 1.9% 24.5 C 3.2%
Canada 482 266 A 765.9 A
Due to rounding, numbers may not add up to the total shown, and some numbers may differ from one table to the next.
Quality indicators (Q.I.) classify each estimate according to its quality as follows: A–Excellent, B–Good, C–Acceptable, D–Use with caution, F–Too unreliable to be published and X–suppressed due to confidentiality. See the “How to read these tables” section.
* Other includes all other renovations not listed.
** Energy-related renovations are space heating and cooling, lighting, windows and insulation.

16 Survey of Commercial and Institutional Energy Use – Buildings 2009
Chapter 1: Canada
Table 1.10 – Canadian commercial buildings by energy efficiency feature
Energy efficiency feature
Buildings Share of total buildings
Floor space Share of total floor space
Q.I. (millions of m2)
Q.I.
No energy efficiency feature 266 278 A 55.2% 246.7 A 32.2%
Any energy efficiency feature 215 987 A 44.8% 519.2 A 67.8%
Energy conservation awareness program 110 590 A 22.9% 340.7 A 44.5%
Energy management control system for heating, ventilating and cooling (HVAC) 157 410 A 32.6% 427.8 A 55.9%
Energy management control system for lighting 79 533 A 16.5% 265.7 A 34.7%
Any two energy efficiency features 72 587 A 15.1% 176.7 A 23.1%
All three energy efficiency features 29 479 A 6.1% 169.2 A 22.1%
Canada 482 266 A 765.9 A
Due to rounding, numbers may not add up to the total shown, and some numbers may differ from one table to the next.
Quality indicators (Q.I.) classify each estimate according to its quality as follows: A–Excellent, B–Good, C–Acceptable, D–Use with caution, F–Too unreliable to be published and X–suppressed due to confidentiality. See the “How to read these tables” section.
Note that a building can have more than one type of energy efficiency feature. Therefore, the sum of the buildings will not add up to the total number of buildings in Canada.

17Detailed Statistical Report – December 2012
Chapter 1: Canada
Note that energy sources are not mutually exclusive (e.g. a building using electricity can also use natural gas).Therefore, the table should be read as follows: 63.4% of commercial buildings used natural gas in 2009.
Table 1.11 – Building characteristics by energy source used
Energy source
Buildings Share of total buildings
Floor space Share of total floor space
Q.I. (millions of m2)
Q.I.
Electricity 471 117 A 97.7% 755.6 A 98.7%
Natural gas 305 665 A 63.4% 581.6 A 75.9%
Distillates* 62 846 A 13.0% 139.4 A 18.2%
Propane 27 508 A 5.7% 48.6 B 6.3%
Other fuel** 23 519 A 4.9% 77.6 A 10.1%
Canada 482 266 A 765.9 A
Used only electricity and natural gas 281 496 A 58.4% 457.4 A 59.7%
Used only electricity and distillates* 47 241 A 9.8% 42.0 A 5.5%
Used only electricity and propane 19 211 B 4.0% 15.7 B 2.1%
Used only electricity and other fuel** 6 434 A 1.3% 26.2 B 3.4%
Used only natural gas and distillates* X X X X X X
Used only natural gas and propane X X X X X X
Used only natural gas and other fuel** X X X X X X
Used only electricity, natural gas and distillates* 8 448 B 1.8% 63.1 C 8.2%
Used only electricity, natural gas and propane 9 548 B 2.0% 40.5 B 5.3%
Used only electricity, natural gas and other fuel** X X X X X X
Due to rounding, numbers may not add up to the total shown, and some numbers may differ from one table to the next.
Quality indicators (Q.I.) classify each estimate according to its quality as follows: A–Excellent, B–Good, C–Acceptable, D–Use with caution, F–Too unreliable to be published and X–suppressed due to confidentiality. See the “How to read these tables” section.
* Distillates include light fuel oil, diesel and kerosene.
** Other fuel includes all other fuels not listed.

18 Survey of Commercial and Institutional Energy Use – Buildings 2009
Chapter 1: Canada
Table 1.12 – Building characteristics by main energy source for space heating
Energy source
Buildings Share of total buildings
Floor space Share of total floor space
Q.I. (millions of m2)
Q.I.
No space heating 19 964 C 4.1% 10.3 C 1.3%
Electricity 131 659 A 27.3% 185.2 A 24.2%
Natural gas 260 550 A 54.0% 460.4 A 60.1%
Distillates* 49 903 A 10.3% 52.5 A 6.9%
Propane – F – – F –
Other fuel** 9 562 B 2.0% 50.1 A 6.5%
Canada 482 266 A 100.0% 765.9 A 100.0%
Due to rounding, numbers may not add up to the total shown, and some numbers may differ from one table to the next.
Quality indicators (Q.I.) classify each estimate according to its quality as follows: A–Excellent, B–Good, C–Acceptable, D–Use with caution, F–Too unreliable to be published and X–suppressed due to confidentiality. See the “How to read these tables” section.
* Distillates include light fuel oil, diesel and kerosene.
** Other fuel includes all other fuels not listed.
Table 1.13 – Building characteristics by main energy source for space cooling
Energy source
Buildings Share of total buildings
Floor space Share of total floor space
Q.I. (millions of m2)
Q.I.
No space cooling 150 583 A 31.2% 130.2 A 17.0%
Electricity 290 565 A 60.3% 556.0 A 72.6%
Natural gas 35 089 A 7.3% 54.4 A 7.1%
Distillates* – F – – F –
Propane – F – – F –
Other fuel** 4 058 C 0.8% 24.0 B 3.1%
Canada 482 266 A 100.0% 765.9 A 100.0%
Due to rounding, numbers may not add up to the total shown, and some numbers may differ from one table to the next.
Quality indicators (Q.I.) classify each estimate according to its quality as follows: A–Excellent, B–Good, C–Acceptable, D–Use with caution, F–Too unreliable to be published and X–suppressed due to confidentiality. See the “How to read these tables” section.
* Distillates include light fuel oil, diesel and kerosene.
** Other fuel includes all other fuels not listed.
19Detailed Statistical Report – December 2012
Chapter 1: Canada
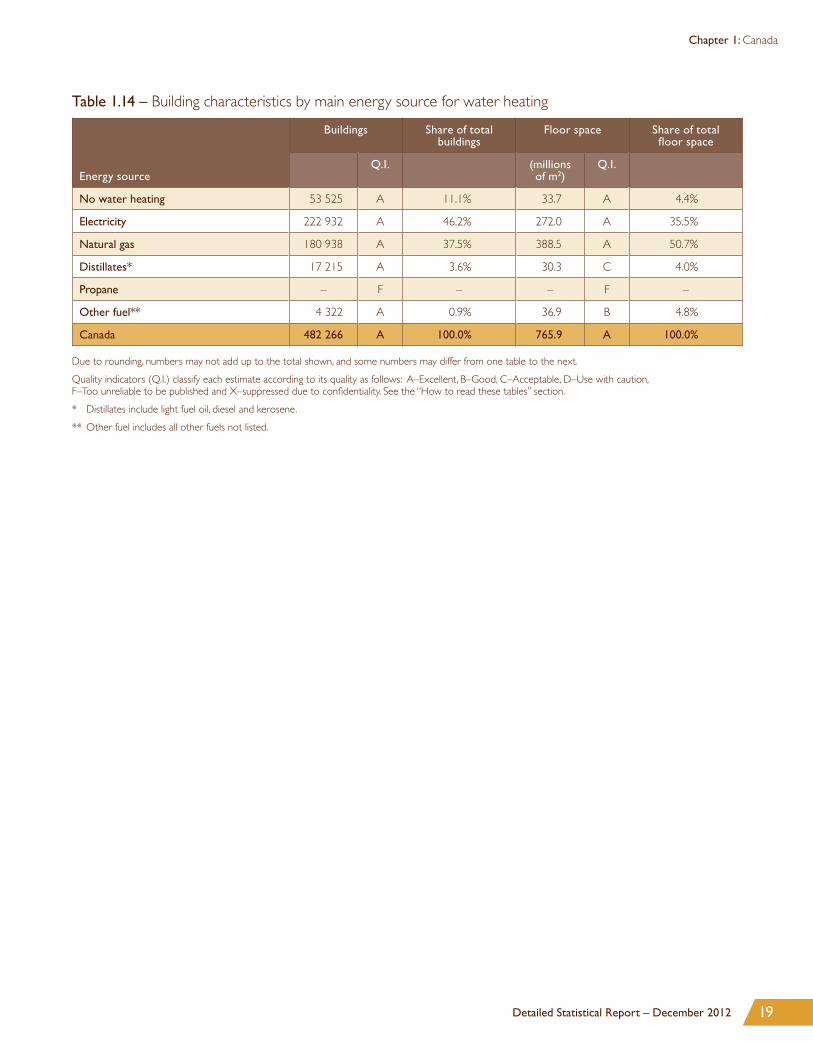
Table 1.14 – Building characteristics by main energy source for water heating
Energy source
Buildings Share of total buildings
Floor space Share of total floor space
Q.I. (millions of m2)
Q.I.
No water heating 53 525 A 11.1% 33.7 A 4.4%
Electricity 222 932 A 46.2% 272.0 A 35.5%
Natural gas 180 938 A 37.5% 388.5 A 50.7%
Distillates* 17 215 A 3.6% 30.3 C 4.0%
Propane – F – – F –
Other fuel** 4 322 A 0.9% 36.9 B 4.8%
Canada 482 266 A 100.0% 765.9 A 100.0%
Due to rounding, numbers may not add up to the total shown, and some numbers may differ from one table to the next.
Quality indicators (Q.I.) classify each estimate according to its quality as follows: A–Excellent, B–Good, C–Acceptable, D–Use with caution, F–Too unreliable to be published and X–suppressed due to confidentiality. See the “How to read these tables” section.
* Distillates include light fuel oil, diesel and kerosene.
** Other fuel includes all other fuels not listed.

20 Survey of Commercial and Institutional Energy Use – Buildings 2009
Chapter 1: Canada
Tabl
e 1.
15 –
Bui
ldin
g ch
arac
teris
tics
and
ener
gy u
se b
y pr
imar
y ac
tivity
and
size
Prim
ary
acti
vity
Bui
ldin
g si
ze
Bui
ldin
gsFl
oor
spac
eEn
ergy
use
Ener
gy in
tens
ity
Q.I.
(mill
ions
of
m2 )
Q.I.
(PJ)
Q.I.
(GJ/m
2 )Q
.I.
Offi
ce b
uild
ing
(non
-med
ical
)To
tal
83
583
A14
7.5
A17
6.6
A1.
20A
5000
squ
are
feet
or
less
(46
5 m
2 or
less
) 4
7 81
5A
12.4
A13
.5B
1.08
A
5001
to 1
0 00
0 sq
uare
feet
(466
to 9
29 m
2 ) 1
2 48
1B
8.2
B7.
7B
0.93
A
10 0
01 t
o 50
000
squ
are
feet
(93
0 to
464
5 m
2 ) 1
7 47
9A
34.2
A39
.4A
1.15
A
50 0
01 t
o 20
0 00
0 sq
uare
feet
(46
46 t
o 18
580
m2 )
4 8
38B
39.6
B53
.9B
1.36
A
Ove
r 20
0 00
0 sq
uare
feet
(O
ver
18 5
80 m
2 )97
0C
–F
62.1
C1.
17A
Med
ical
offi
ce
build
ing
Tota
l 1
0 52
5A
9.6
A10
.5A
1.09
A
5000
squ
are
feet
or
less
(46
5 m
2 or
less
) 5
086
B0.
9B
0.9
B0.
98A
5001
to
10 0
00 s
quar
e fe
et (
466
to 9
29 m
2 ) 2
876
C1.
9C
–F
0.93
B
10 0
01 t
o 50
000
squ
are
feet
(93
0 to
464
5 m
2 ) 2
213
B3.
3B
3.3
B1.
00A
50 0
01 t
o 20
0 00
0 sq
uare
feet
(46
46 t
o 18
580
m2 )
335
B2.
9B
3.4
B1.
16A
Ove
r 20
0 00
0 sq
uare
feet
(O
ver
18 5
80 m
2 )–
F0.
6C
–F
1.83
A
Elem
enta
ry o
r se
cond
ary
scho
olTo
tal
18
425
A83
.6A
64.4
A0.
77A
5000
squ
are
feet
or
less
(46
5 m
2 or
less
) 1
108
C–
F–
F1.
43C
5001
to 1
0 00
0 sq
uare
feet
(466
to 9
29 m
2 )95
4C
0.7
C–
F–
F
10 0
01 t
o 50
000
squ
are
feet
(93
0 to
464
5 m
2 ) 1
1 60
1A
29.9
A22
.4A
0.75
A
50 0
01 t
o 20
0 00
0 sq
uare
feet
(46
46 t
o 18
580
m2 )
4 0
05A
33.2
A29
.4A
0.89
A
Ove
r 20
0 00
0 sq
uare
feet
(O
ver
18 5
80 m
2 )75
7C
19.5
C10
.3C
0.53
A
(Con
tinue
d)

21Detailed Statistical Report – December 2012
Chapter 1: Canada
Prim
ary
acti
vity
Bui
ldin
g si
ze
Bui
ldin
gsFl
oor
spac
eEn
ergy
use
Ener
gy in
tens
ity
Q.I.
(mill
ions
of
m2 )
Q.I.
(PJ)
Q.I.
(GJ/m
2 )Q
.I.
Nur
sing
or
resi
dent
ial
care
faci
lity
Tota
l 6
482
A25
.0B
39.1
B1.
56A
5000
squ
are
feet
or
less
(46
5 m
2 or
less
) 2
966
A0.
8B
1.1
C1.
40A
5001
to 1
0 00
0 sq
uare
feet
(466
to 9
29 m
2 )36
1C
0.2
C0.
2C
0.87
A
10 0
01 t
o 50
,000
squ
are
feet
(93
0 to
464
5 m
2 ) 1
540
B4.
3B
9.0
C2.
08A
50 0
01 t
o 20
0 00
0 sq
uare
feet
(46
46 t
o 18
580
m2 )
1 3
77B
11.4
B17
.5B
1.54
A
Ove
r 20
0 00
0 sq
uare
feet
(O
ver
18 5
80 m
2 )–
F–
F–
F1.
37A
War
ehou
seTo
tal
32
879
A83
.0A
55.0
A0.
66A
5000
squ
are
feet
or
less
(46
5 m
2 or
less
) 1
3 67
8B
3.3
C–
F1.
16C
5001
to 1
0 00
0 sq
uare
feet
(466
to 9
29 m
2 ) 4
548
C3.
1C
2.4
C0.
79B
10 0
01 t
o 50
000
squ
are
feet
(93
0 to
464
5 m
2 ) 1
0 84
8B
22.2
B15
.9B
0.72
A
50 0
01 t
o 20
0 00
0 sq
uare
feet
(46
46 t
o 18
580
m2 )
2 5
78B
21.6
B12
.3B
0.57
A
Ove
r 20
0 00
0 sq
uare
feet
(O
ver
18 5
80 m
2 ) 1
227
C32
.8C
20.5
C0.
63B
Hot
el o
r m
otel
Tota
l 9
963
C19
.7B
26.5
C1.
35A
5000
squ
are
feet
or
less
(46
5 m
2 or
less
)–
F0.
8C
–F
–F
5001
to 1
0 00
0 sq
uare
feet
(466
to 9
29 m
2 ) 1
232
C0.
8C
–F
–F
10 0
01 t
o 50
000
squ
are
feet
(93
0 to
464
5 m
2 ) 2
585
A5.
6B
6.4
B1.
14A
50 0
01 t
o 20
0 00
0 sq
uare
feet
(46
46 t
o 18
580
m2 )
757
C6.
4C
8.8
B1.
39A
Ove
r 20
0 00
0 sq
uare
feet
(O
ver
18 5
80 m
2 )–
F–
F–
F1.
42C
(Con
tinue
d)
Tabl
e 1.
15 –
Bui
ldin
g ch
arac
teris
tics
and
ener
gy u
se b
y pr
imar
y ac
tivity
and
size
(con
tinue
d)
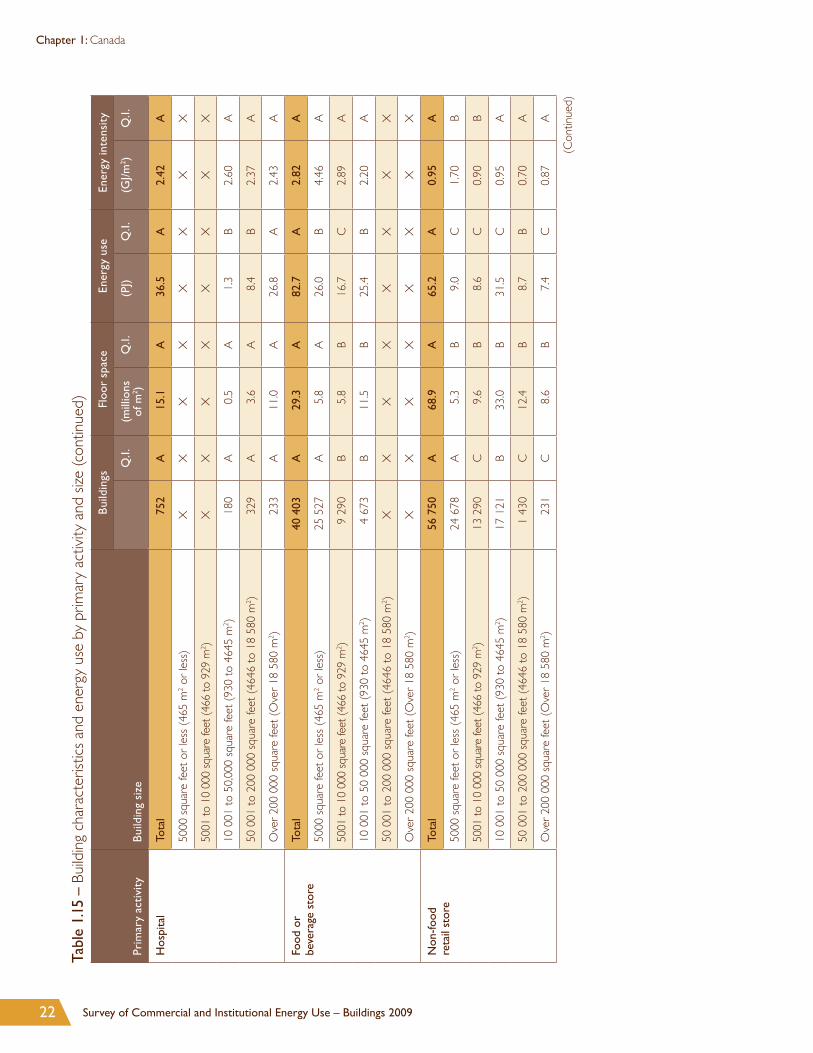
22 Survey of Commercial and Institutional Energy Use – Buildings 2009
Chapter 1: Canada
Prim
ary
acti
vity
Bui
ldin
g si
ze
Bui
ldin
gsFl
oor
spac
eEn
ergy
use
Ener
gy in
tens
ity
Q.I.
(mill
ions
of
m2 )
Q.I.
(PJ)
Q.I.
(GJ/m
2 )Q
.I.
Hos
pita
lTo
tal
752
A15
.1A
36.5
A2.
42A
5000
squ
are
feet
or
less
(46
5 m
2 or
less
)X
XX
XX
XX
X
5001
to 1
0 00
0 sq
uare
feet
(466
to 9
29 m
2 )X
XX
XX
XX
X
10 0
01 t
o 50
,000
squ
are
feet
(93
0 to
464
5 m
2 )18
0A
0.5
A1.
3B
2.60
A
50 0
01 t
o 20
0 00
0 sq
uare
feet
(46
46 t
o 18
580
m2 )
329
A3.
6A
8.4
B2.
37A
Ove
r 20
0 00
0 sq
uare
feet
(O
ver
18 5
80 m
2 )23
3A
11.0
A26
.8A
2.43
A
Food
or
beve
rage
sto
reTo
tal
40
403
A29
.3A
82.7
A2.
82A
5000
squ
are
feet
or
less
(46
5 m
2 or
less
) 2
5 52
7A
5.8
A26
.0B
4.46
A
5001
to 1
0 00
0 sq
uare
feet
(466
to 9
29 m
2 ) 9
290
B5.
8B
16.7
C2.
89A
10 0
01 t
o 50
000
squ
are
feet
(93
0 to
464
5 m
2 ) 4
673
B11
.5B
25.4
B2.
20A
50 0
01 t
o 20
0 00
0 sq
uare
feet
(46
46 t
o 18
580
m2 )
XX
XX
XX
XX
Ove
r 20
0 00
0 sq
uare
feet
(O
ver
18 5
80 m
2 )X
XX
XX
XX
X
Non
-food
re
tail
stor
eTo
tal
56
750
A68
.9A
65.2
A0.
95A
5000
squ
are
feet
or
less
(46
5 m
2 or
less
) 2
4 67
8A
5.3
B9.
0C
1.70
B
5001
to 1
0 00
0 sq
uare
feet
(466
to 9
29 m
2 ) 1
3 29
0C
9.6
B8.
6C
0.90
B
10 0
01 t
o 50
000
squ
are
feet
(93
0 to
464
5 m
2 ) 1
7 12
1B
33.0
B31
.5C
0.95
A
50 0
01 t
o 20
0 00
0 sq
uare
feet
(46
46 t
o 18
580
m2 )
1 4
30C
12.4
B8.
7B
0.70
A
Ove
r 20
0 00
0 sq
uare
feet
(O
ver
18 5
80 m
2 )23
1C
8.6
B7.
4C
0.87
A
(Con
tinue
d)
Tabl
e 1.
15 –
Bui
ldin
g ch
arac
teris
tics
and
ener
gy u
se b
y pr
imar
y ac
tivity
and
size
(con
tinue
d)

23Detailed Statistical Report – December 2012
Chapter 1: Canada
Prim
ary
acti
vity
Bui
ldin
g si
ze
Bui
ldin
gsFl
oor
spac
eEn
ergy
use
Ener
gy in
tens
ity
Q.I.
(mill
ions
of
m2 )
Q.I.
(PJ)
Q.I.
(GJ/m
2 )Q
.I.
Oth
er*
Tota
l 2
22 5
05A
284.
3A
285.
8A
1.01
A
5000
squ
are
feet
or
less
(46
5 m
2 or
less
) 1
10 4
47A
27.6
A38
.4A
1.39
A
5001
to 1
0 00
0 sq
uare
feet
(466
to 9
29 m
2 ) 4
6 64
7A
31.4
A31
.6A
1.01
A
10 0
01 t
o 50
000
squ
are
feet
(93
0 to
464
5 m
2 ) 5
5 32
5A
107.
8A
104.
8A
0.97
A
50 0
01 t
o 20
0 00
0 sq
uare
feet
(46
46 t
o 18
580
m2 )
8 7
58A
71.1
A68
.9A
0.97
A
Ove
r 20
0 00
0 sq
uare
feet
(O
ver
18 5
80 m
2 ) 1
329
C46
.4B
42.0
C0.
91A
All
build
ing
type
sTo
tal
482
266
A76
5.9
A84
2.2
A1.
10A
5000
squ
are
feet
or
less
(46
5 m
2 or
less
) 2
36 5
39A
57.3
A93
.8A
1.64
A
5001
to
10 0
00 s
quar
e fe
et (
466
to 9
29 m
2 ) 9
1 68
0A
61.6
A72
.7A
1.18
A
10 0
01 t
o 50
000
squ
are
feet
(93
0 to
464
5 m
2 ) 1
23 5
65A
252.
4A
259.
3A
1.03
A
50 0
01 t
o 20
0 00
0 sq
uare
feet
(46
46 t
o 18
580
m2 )
25
319
A20
8.3
A22
6.1
A1.
09A
Ove
r 20
0 00
0 sq
uare
feet
(O
ver
18 5
80 m
2 ) 5
162
A18
6.4
A19
0.4
A1.
02A
Due
to
roun
ding
, num
bers
may
not
add
up
to t
he t
otal
sho
wn,
and
som
e nu
mbe
rs m
ay d
iffer
from
one
tab
le t
o th
e ne
xt.
Qua
lity
indi
cato
rs (
Q.I.)
cla
ssify
eac
h es
timat
e ac
cord
ing
to it
s qu
ality
as
follo
ws:
A–E
xcel
lent
, B–G
ood,
C–A
ccep
tabl
e, D
–Use
with
cau
tion,
F–To
o un
relia
ble
to b
e pu
blish
ed a
nd X
–sup
pres
sed
due
to c
onfid
entia
lity.
See
the
“How
to
read
the
se t
able
s” s
ectio
n.
* O
ther
incl
udes
all
othe
r co
mm
erci
al b
uild
ings
. See
App
endi
x C
for
mor
e de
tails
.
Tabl
e 1.
15 –
Bui
ldin
g ch
arac
teris
tics
and
ener
gy u
se b
y pr
imar
y ac
tivity
and
size
(con
tinue
d)

24 Survey of Commercial and Institutional Energy Use – Buildings 2009
Chapter 1: Canada
Tabl
e 1.
16 –
Bui
ldin
g ch
arac
teris
tics
and
ener
gy u
se b
y pr
imar
y ac
tivity
and
yea
r of
con
stru
ctio
n
Prim
ary
acti
vity
Year
of c
onst
ruct
ion
Bui
ldin
gsFl
oor
spac
eEn
ergy
use
Ener
gy in
tens
ity
Q.I.
(mill
ions
of
m2 )
Q.I.
(PJ)
Q.I.
(GJ/m
2 )Q
.I.
Offi
ce b
uild
ing
(non
-med
ical
)To
tal
83
583
A14
7.5
A17
6.6
A1.
20A
Befo
re 1
920
11
963
C10
.8B
11.7
B1.
08A
1920
to 1
959
13
221
B14
.9B
15.4
B1.
03A
1960
to
1969
8 7
77C
9.0
B14
.3C
1.60
A
1970
to
1979
16
397
B56
.5C
61.2
C1.
08A
1980
to
1989
12
904
B28
.8A
36.1
A1.
25A
1990
to
1999
5 3
60B
–F
–F
1.22
B
2000
or
late
r 1
4 96
1B
–F
–F
–F
2000
to
2004
6 5
70C
6.1
C–
F–
F
2005
or
late
r–
F–
F–
F0.
85B
Med
ical
offi
ce
build
ing
Tota
l 1
0 52
5A
9.6
A10
.5A
1.09
A
Befo
re 1
920
XX
XX
XX
XX
1920
to 1
959
XX
XX
XX
XX
1960
to
1969
–F
1.9
C–
F1.
21A
1970
to
1979
2 1
42C
1.9
C1.
7C
0.89
A
1980
to
1989
1 8
99C
1.8
B2.
0C
1.13
A
1990
to
1999
1 4
73C
1.3
C–
F1.
17A
2000
or
late
r–
F0.
9C
0.7
C0.
82A
2000
to
2004
–F
–F
–F
0.87
B
2005
or
late
r–
F–
F–
F0.
77B
(Con
tinue
d)

25Detailed Statistical Report – December 2012
Chapter 1: Canada
Prim
ary
acti
vity
Year
of c
onst
ruct
ion
Bui
ldin
gsFl
oor
spac
eEn
ergy
use
Ener
gy in
tens
ity
Q.I.
(mill
ions
of
m2 )
Q.I.
(PJ)
Q.I.
(GJ/m
2 )Q
.I.
Elem
enta
ry o
r se
cond
ary
scho
olTo
tal
18
425
A83
.6A
64.4
A0.
77A
Befo
re 1
920
–F
–F
–F
0.95
A
1920
to 1
959
2 9
92A
11.1
A9.
1B
0.82
A
1960
to
1969
6 0
61B
27.0
B19
.6A
0.73
A
1970
to
1979
2 5
17B
16.1
B12
.6B
0.79
B
1980
to
1989
1 3
72B
5.0
B3.
6C
0.71
A
1990
to
1999
2 4
51B
11.2
B8.
4B
0.75
A
2000
or
late
r 1
935
C8.
3B
6.5
B0.
78A
2000
to
2004
–F
4.9
C3.
2C
0.67
A
2005
or
late
r–
F–
F–
F0.
94A
Nur
sing
or
resi
dent
ial
care
faci
lity
Tota
l 6
482
A25
.0B
39.1
B1.
56A
Befo
re 1
920
–F
–F
1.9
C0.
74B
1920
to 1
959
426
C1.
4C
2.1
C1.
47A
1960
to
1969
1 5
02B
3.6
C–
F1.
91B
1970
to
1979
1 2
10B
3.2
B5.
4B
1.70
A
1980
to
1989
777
B2.
0B
2.5
B1.
27A
1990
to
1999
1 1
69B
–F
–F
1.49
A
2000
or
late
r93
4C
3.6
C7.
4C
2.05
A
2000
to
2004
–F
–F
–F
2.23
A
2005
or
late
r–
F–
F–
F1.
68A
(Con
tinue
d)
Tabl
e 1.
16 –
Bui
ldin
g ch
arac
teris
tics
and
ener
gy u
se b
y pr
imar
y ac
tivity
and
yea
r of
con
stru
ctio
n (c
ontin
ued)
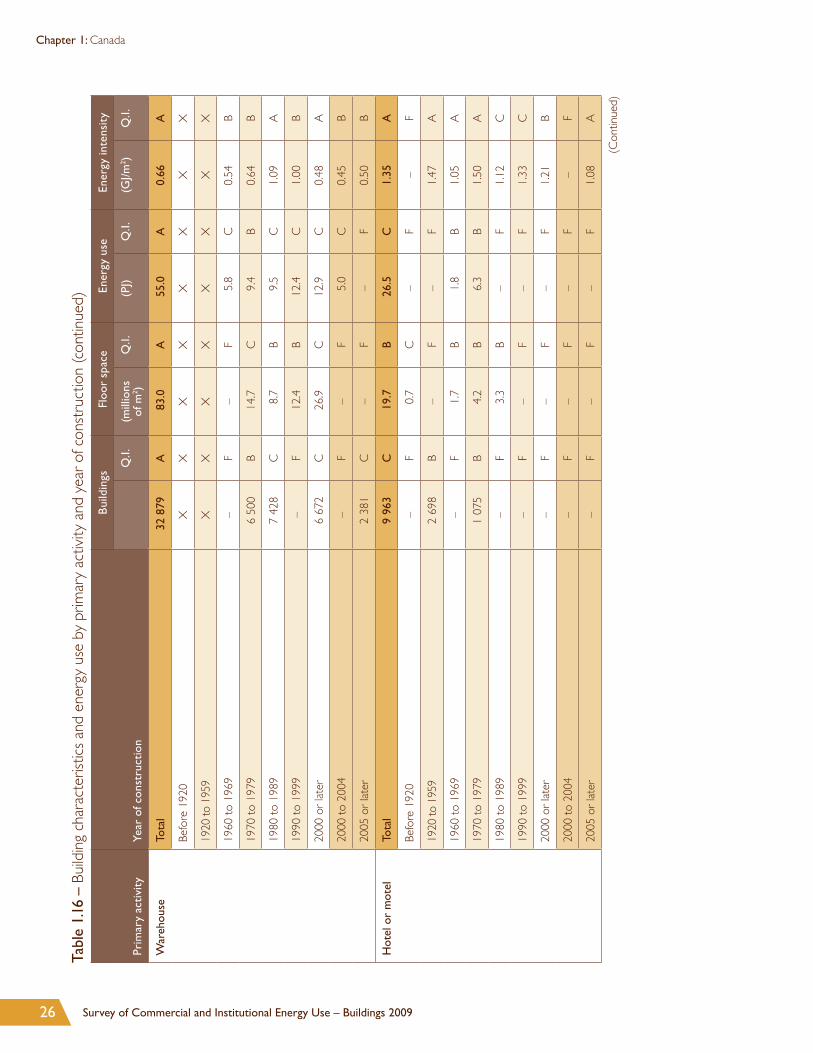
26 Survey of Commercial and Institutional Energy Use – Buildings 2009
Chapter 1: Canada
Prim
ary
acti
vity
Year
of c
onst
ruct
ion
Bui
ldin
gsFl
oor
spac
eEn
ergy
use
Ener
gy in
tens
ity
Q.I.
(mill
ions
of
m2 )
Q.I.
(PJ)
Q.I.
(GJ/m
2 )Q
.I.
War
ehou
seTo
tal
32
879
A83
.0A
55.0
A0.
66A
Befo
re 1
920
XX
XX
XX
XX
1920
to 1
959
XX
XX
XX
XX
1960
to
1969
–F
–F
5.8
C0.
54B
1970
to
1979
6 5
00B
14.7
C9.
4B
0.64
B
1980
to
1989
7 4
28C
8.7
B9.
5C
1.09
A
1990
to
1999
–F
12.4
B12
.4C
1.00
B
2000
or
late
r 6
672
C26
.9C
12.9
C0.
48A
2000
to
2004
–F
–F
5.0
C0.
45B
2005
or
late
r 2
381
C–
F–
F0.
50B
Hot
el o
r m
otel
Tota
l 9
963
C19
.7B
26.5
C1.
35A
Befo
re 1
920
–F
0.7
C–
F–
F
1920
to 1
959
2 6
98B
–F
–F
1.47
A
1960
to
1969
–F
1.7
B1.
8B
1.05
A
1970
to
1979
1 0
75B
4.2
B6.
3B
1.50
A
1980
to
1989
–F
3.3
B–
F1.
12C
1990
to
1999
–F
–F
–F
1.33
C
2000
or
late
r–
F–
F–
F1.
21B
2000
to
2004
–F
–F
–F
–F
2005
or
late
r–
F–
F–
F1.
08A
(Con
tinue
d)
Tabl
e 1.
16 –
Bui
ldin
g ch
arac
teris
tics
and
ener
gy u
se b
y pr
imar
y ac
tivity
and
yea
r of
con
stru
ctio
n (c
ontin
ued)

27Detailed Statistical Report – December 2012
Chapter 1: Canada
Prim
ary
acti
vity
Year
of c
onst
ruct
ion
Bui
ldin
gsFl
oor
spac
eEn
ergy
use
Ener
gy in
tens
ity
Q.I.
(mill
ions
of
m2 )
Q.I.
(PJ)
Q.I.
(GJ/m
2 )Q
.I.
Hos
pita
lTo
tal
752
A15
.1A
36.5
A2.
42A
Befo
re 1
920
17C
1.1
C1.
4B
1.30
B
1920
to 1
959
106
A2.
3A
4.8
A2.
04A
1960
to
1969
224
B3.
4A
7.3
B2.
17A
1970
to
1979
156
B4.
0B
12.5
C3.
14A
1980
to
1989
94B
1.5
B3.
4B
2.29
A
1990
to
1999
60B
0.8
C2.
4C
2.88
A
2000
or
late
r94
B2.
0B
4.7
B2.
38A
2000
to
2004
57C
–F
–F
2.51
A
2005
or
late
r37
C1.
3C
3.1
C2.
31A
Food
or
beve
rage
sto
reTo
tal
40
403
A29
.3A
82.7
A2.
82A
Befo
re 1
920
–F
–F
–F
0.70
B
1920
to 1
959
9 1
42A
5.2
B–
F2.
42B
1960
to
1969
6 8
87C
3.6
C7.
3C
2.04
B
1970
to
1979
5 6
19C
3.4
C10
.1C
2.95
B
1980
to
1989
6 3
33B
–F
13.8
C2.
43B
1990
to
1999
4 9
71C
4.2
C13
.5B
3.20
A
2000
or
late
r 6
914
B7.
0C
25.4
C3.
63A
2000
to
2004
2 9
68B
–F
–F
2.97
A
2005
or
late
r–
F2.
1C
–F
5.18
A
(Con
tinue
d)
Tabl
e 1.
16 –
Bui
ldin
g ch
arac
teris
tics
and
ener
gy u
se b
y pr
imar
y ac
tivity
and
yea
r of
con
stru
ctio
n (c
ontin
ued)

28 Survey of Commercial and Institutional Energy Use – Buildings 2009
Chapter 1: Canada
Prim
ary
acti
vity
Year
of c
onst
ruct
ion
Bui
ldin
gsFl
oor
spac
eEn
ergy
use
Ener
gy in
tens
ity
Q.I.
(mill
ions
of
m2 )
Q.I.
(PJ)
Q.I.
(GJ/m
2 )Q
.I.
Non
-food
re
tail
stor
eTo
tal
56
750
A68
.9A
65.2
A0.
95A
Befo
re 1
920
–F
–F
–F
0.52
A
1920
to 1
959
9 5
48B
6.8
C6.
4C
0.94
A
1960
to
1969
6 4
91C
4.0
C5.
8C
1.47
B
1970
to
1979
8 7
42C
12.9
B12
.7C
0.98
B
1980
to
1989
10
035
C9.
3B
7.6
C0.
81A
1990
to
1999
–F
11.2
C9.
4C
0.84
B
2000
or
late
r 1
0 24
0C
15.9
C–
F1.
18B
2000
to
2004
–F
–F
–F
1.48
A
2005
or
late
r–
F–
F–
F1.
01C
Oth
er*
Tota
l 2
22 5
05A
284.
3A
285.
8A
1.01
A
Befo
re 1
920
25
954
B24
.5B
23.6
B0.
96A
1920
to 1
959
40
839
A36
.1B
39.2
C1.
08B
1960
to
1969
28
487
A61
.3B
49.5
B0.
81A
1970
to
1979
30
749
A41
.8A
51.2
A1.
22A
1980
to
1989
49
249
A50
.0A
49.6
B0.
99A
1990
to
1999
31
134
B35
.4B
34.4
C0.
97A
2000
or
late
r 1
6 09
4A
35.2
A38
.3A
1.09
A
2000
to
2004
8 9
47B
18.5
B20
.1B
1.09
A
2005
or
late
r 7
147
A16
.7B
18.2
B1.
09A
(Con
tinue
d)
Tabl
e 1.
16 –
Bui
ldin
g ch
arac
teris
tics
and
ener
gy u
se b
y pr
imar
y ac
tivity
and
yea
r of
con
stru
ctio
n (c
ontin
ued)
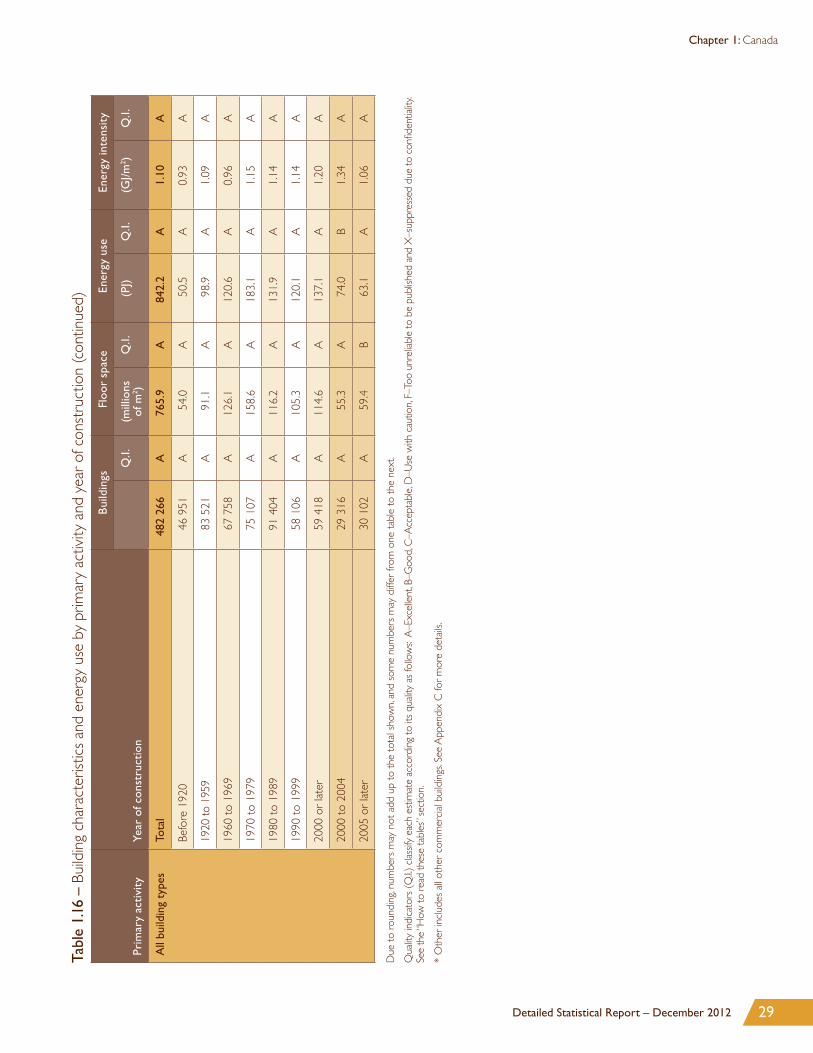
29Detailed Statistical Report – December 2012
Chapter 1: Canada
Prim
ary
acti
vity
Year
of c
onst
ruct
ion
Bui
ldin
gsFl
oor
spac
eEn
ergy
use
Ener
gy in
tens
ity
Q.I.
(mill
ions
of
m2 )
Q.I.
(PJ)
Q.I.
(GJ/m
2 )Q
.I.
All
build
ing
type
sTo
tal
482
266
A76
5.9
A84
2.2
A1.
10A
Befo
re 1
920
46
951
A54
.0A
50.5
A0.
93A
1920
to 1
959
83
521
A91
.1A
98.9
A1.
09A
1960
to
1969
67
758
A12
6.1
A12
0.6
A0.
96A
1970
to
1979
75
107
A15
8.6
A18
3.1
A1.
15A
1980
to
1989
91
404
A11
6.2
A13
1.9
A1.
14A
1990
to
1999
58
106
A10
5.3
A12
0.1
A1.
14A
2000
or
late
r 5
9 41
8A
114.
6A
137.
1A
1.20
A
2000
to
2004
29
316
A55
.3A
74.0
B1.
34A
2005
or
late
r 3
0 10
2A
59.4
B63
.1A
1.06
A
Due
to
roun
ding
, num
bers
may
not
add
up
to t
he t
otal
sho
wn,
and
som
e nu
mbe
rs m
ay d
iffer
from
one
tab
le t
o th
e ne
xt.
Qua
lity
indi
cato
rs (
Q.I.)
cla
ssify
eac
h es
timat
e ac
cord
ing
to it
s qu
ality
as
follo
ws:
A–E
xcel
lent
, B–G
ood,
C–A
ccep
tabl
e, D
–Use
with
cau
tion,
F–To
o un
relia
ble
to b
e pu
blish
ed a
nd X
–sup
pres
sed
due
to c
onfid
entia
lity.
See
the
“How
to r
ead
thes
e ta
bles
” sec
tion.
* O
ther
incl
udes
all
othe
r co
mm
erci
al b
uild
ings
. See
App
endi
x C
for
mor
e de
tails
.
Tabl
e 1.
16 –
Bui
ldin
g ch
arac
teris
tics
and
ener
gy u
se b
y pr
imar
y ac
tivity
and
yea
r of
con
stru
ctio
n (c
ontin
ued)

30 Survey of Commercial and Institutional Energy Use – Buildings 2009
Chapter 1: Canada
Tabl
e 1.
17 –
Bui
ldin
g ch
arac
teris
tics
and
ener
gy u
se b
y pr
imar
y ac
tivity
and
num
ber
of fl
oors
Prim
ary
acti
vity
Floo
rs
Bui
ldin
gsFl
oor
spac
eEn
ergy
use
Ener
gy in
tens
ity
Q.I.
(mill
ions
of
m2 )
Q.I.
(PJ)
Q.I.
(GJ/m
2 )Q
.I.
Offi
ce b
uild
ing
(non
-med
ical
)To
tal
83
583
A14
7.5
A17
6.6
A1.
20A
1 2
2 01
3A
18.8
B34
.7C
1.85
B
2 3
3 61
5A
23.7
A23
.1A
0.98
A
3 2
0 11
3B
24.7
B23
.4B
0.95
A
4 to
9 6
638
B28
.6B
30.5
B1.
07A
10 a
nd m
ore
1 2
04B
–F
64.9
C1.
26A
Med
ical
offi
ce
build
ing
Tota
l 1
0 52
5A
9.6
A10
.5A
1.09
A
1 3
959
B2.
2C
2.5
C1.
15A
2 4
548
B3.
2B
3.0
B0.
94A
3–
F0.
9B
0.7
B0.
83A
4 to
9–
F2.
4C
3.2
B1.
33A
10 a
nd m
ore
–F
–F
–F
1.07
A
Elem
enta
ry o
r se
cond
ary
scho
olTo
tal
18
425
A83
.6A
64.4
A0.
77A
1 9
231
A28
.9A
19.7
A0.
68A
2 5
454
A27
.4A
23.1
A0.
84A
3 3
456
A24
.7B
19.7
B0.
80A
4 to
9X
XX
XX
XX
X
10 a
nd m
ore
XX
XX
XX
XX
(Con
tinue
d)

31Detailed Statistical Report – December 2012
Chapter 1: Canada
Prim
ary
acti
vity
Floo
rs
Bui
ldin
gsFl
oor
spac
eEn
ergy
use
Ener
gy in
tens
ity
Q.I.
(mill
ions
of
m2 )
Q.I.
(PJ)
Q.I.
(GJ/m
2 )Q
.I.
Nur
sing
or
resi
dent
ial
care
faci
lity
Tota
l 6
482
A25
.0B
39.1
B1.
56A
1 1
676
B3.
7C
6.9
C1.
87A
2X
XX
XX
XX
X
3 1
369
B4.
6C
–F
1.34
B
4 to
974
5A
7.0
A10
.8A
1.55
A
10 a
nd m
ore
XX
XX
XX
XX
War
ehou
seTo
tal
32
879
A83
.0A
55.0
A0.
66A
1 2
3 39
6B
38.7
A25
.2A
0.65
A
2 8
708
B38
.9B
23.8
B0.
61A
3–
F–
F–
F–
F
4 to
9X
XX
XX
XX
X
10 a
nd m
ore
XX
XX
XX
XX
Hot
el o
r m
otel
Tota
l 9
963
C19
.7B
26.5
C1.
35A
1–
F0.
9C
–F
0.66
B
2 2
808
C3.
8C
–F
1.07
B
3 1
533
C–
F–
F1.
40B
4 to
9 1
491
C6.
2B
8.6
B1.
40A
10 a
nd m
ore
–F
–F
–F
1.55
B
(Con
tinue
d)
Tabl
e 1.
17 –
Bui
ldin
g ch
arac
teris
tics
and
ener
gy u
se b
y pr
imar
y ac
tivity
and
num
ber
of fl
oors
(con
tinue
d)

32 Survey of Commercial and Institutional Energy Use – Buildings 2009
Chapter 1: Canada
Prim
ary
acti
vity
Floo
rs
Bui
ldin
gsFl
oor
spac
eEn
ergy
use
Ener
gy in
tens
ity
Q.I.
(mill
ions
of
m2 )
Q.I.
(PJ)
Q.I.
(GJ/m
2 )Q
.I.
Hos
pita
lTo
tal
752
A15
.1A
36.5
A2.
42A
192
B0.
6C
–F
2.99
A
217
6B
1.1
C–
F2.
27B
372
B0.
7B
1.6
B2.
29A
4 to
934
9A
9.4
A21
.8A
2.32
A
10 a
nd m
ore
63B
3.3
B8.
8C
2.70
A
Food
or
beve
rage
sto
reTo
tal
40
403
A29
.3A
82.7
A2.
82A
1 2
3 87
4A
16.9
B58
.0A
3.44
A
2 1
0 36
0A
7.6
A17
.6B
2.31
A
3 5
501
C4.
1C
5.2
C1.
25A
4 to
9X
XX
XX
XX
X
10 a
nd m
ore
XX
XX
XX
XX
Non
-food
re
tail
stor
eTo
tal
56
750
A68
.9A
65.2
A0.
95A
1 3
0 27
7A
37.5
B45
.2B
1.21
A
2 1
4 30
0B
13.4
B9.
6B
0.72
A
3 8
584
C12
.7C
7.9
C0.
63A
4 to
9X
XX
XX
XX
X
10 a
nd m
ore
XX
XX
XX
XX
(Con
tinue
d)
Tabl
e 1.
17 –
Bui
ldin
g ch
arac
teris
tics
and
ener
gy u
se b
y pr
imar
y ac
tivity
and
num
ber
of fl
oors
(con
tinue
d)
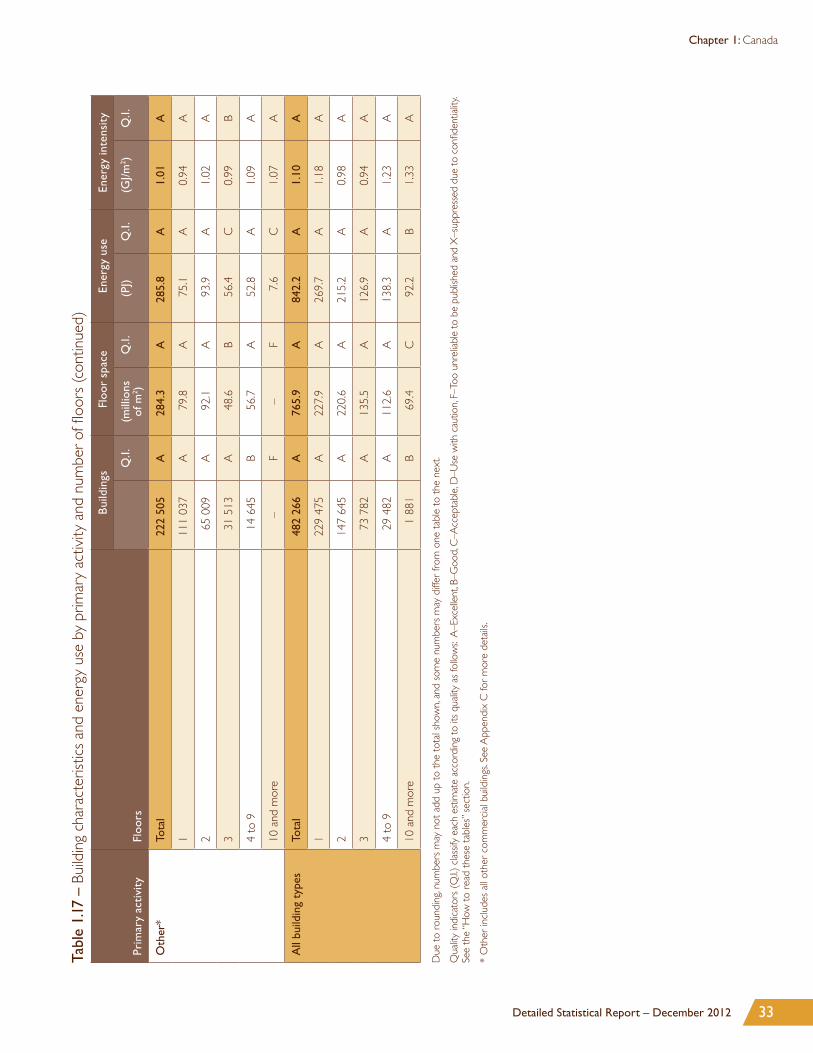
33Detailed Statistical Report – December 2012
Chapter 1: Canada
Prim
ary
acti
vity
Floo
rs
Bui
ldin
gsFl
oor
spac
eEn
ergy
use
Ener
gy in
tens
ity
Q.I.
(mill
ions
of
m2 )
Q.I.
(PJ)
Q.I.
(GJ/m
2 )Q
.I.
Oth
er*
Tota
l 2
22 5
05A
284.
3A
285.
8A
1.01
A
1 1
11 0
37A
79.8
A75
.1A
0.94
A
2 6
5 00
9A
92.1
A93
.9A
1.02
A
3 3
1 51
3A
48.6
B56
.4C
0.99
B
4 to
9 1
4 64
5B
56.7
A52
.8A
1.09
A
10 a
nd m
ore
–F
–F
7.6
C1.
07A
All
build
ing
type
sTo
tal
482
266
A76
5.9
A84
2.2
A1.
10A
1 2
29 4
75A
227.
9A
269.
7A
1.18
A
2 1
47 6
45A
220.
6A
215.
2A
0.98
A
3 7
3 78
2A
135.
5A
126.
9A
0.94
A
4 to
9 2
9 48
2A
112.
6A
138.
3A
1.23
A
10 a
nd m
ore
1 8
81B
69.4
C92
.2B
1.33
A
Due
to
roun
ding
, num
bers
may
not
add
up
to t
he t
otal
sho
wn,
and
som
e nu
mbe
rs m
ay d
iffer
from
one
tab
le t
o th
e ne
xt.
Qua
lity
indi
cato
rs (
Q.I.)
cla
ssify
eac
h es
timat
e ac
cord
ing
to it
s qu
ality
as
follo
ws:
A–E
xcel
lent
, B–G
ood,
C–A
ccep
tabl
e, D
–Use
with
cau
tion,
F–To
o un
relia
ble
to b
e pu
blish
ed a
nd X
–sup
pres
sed
due
to c
onfid
entia
lity.
See
the
“How
to
read
the
se t
able
s” s
ectio
n.
* O
ther
incl
udes
all
othe
r co
mm
erci
al b
uild
ings
. See
App
endi
x C
for
mor
e de
tails
.
Tabl
e 1.
17 –
Bui
ldin
g ch
arac
teris
tics
and
ener
gy u
se b
y pr
imar
y ac
tivity
and
num
ber
of fl
oors
(con
tinue
d)

34 Survey of Commercial and Institutional Energy Use – Buildings 2009
Chapter 1: Canada
Tabl
e 1.
18 –
Bui
ldin
g ch
arac
teris
tics
and
ener
gy u
se b
y pr
imar
y ac
tivity
and
num
ber
of h
ours
of o
pera
tion
Prim
ary
acti
vity
Hou
rs o
f ope
rati
on
Bui
ldin
gsFl
oor
spac
eEn
ergy
use
Ener
gy in
tens
ity
Q.I.
(mill
ions
of
m2 )
Q.I.
(PJ)
Q.I.
(GJ/m
2 )Q
.I.
Offi
ce b
uild
ing
(non
-med
ical
)To
tal
83
583
A14
7.5
A17
6.6
A1.
20A
36 o
r le
ss 5
260
C2.
7C
–F
1.51
C
37 to
48
40
672
A40
.5B
42.6
B1.
05A
49 t
o 72
27
170
B67
.6C
75.4
B1.
12A
73 t
o 96
–F
11.4
C14
.6C
1.28
A
97 t
o 12
0 2
189
C–
F–
F–
F
121
to 1
68 3
288
B17
.5C
24.2
C1.
38A
Med
ical
offi
ce
build
ing
Tota
l 1
0 52
5A
9.6
A10
.5A
1.09
A
36 o
r le
ssX
XX
XX
XX
X
37 to
48
3 1
61C
1.8
B1.
6B
0.85
A
49 t
o 72
4 0
77B
3.9
B3.
8B
0.99
A
73 t
o 96
–F
2.4
C2.
6C
1.13
A
97 t
o 12
0X
XX
XX
XX
X
121
to 1
6891
C0.
7C
1.3
C1.
89A
Elem
enta
ry o
r se
cond
ary
scho
olTo
tal
18
425
A83
.6A
64.4
A0.
77A
36 o
r le
ss 1
496
B7.
7C
6.3
C0.
82A
37 to
48
7 0
01A
27.7
A21
.1A
0.76
A
49 t
o 72
7 2
87A
29.9
B23
.0B
0.77
A
73 t
o 96
2 2
96B
13.5
A9.
9A
0.73
A
97 t
o 12
0–
F1.
9C
1.5
C0.
79A
121
to 1
68–
F–
F–
F0.
89A
(Con
tinue
d)

35Detailed Statistical Report – December 2012
Chapter 1: Canada
Prim
ary
acti
vity
Hou
rs o
f ope
rati
on
Bui
ldin
gsFl
oor
spac
eEn
ergy
use
Ener
gy in
tens
ity
Q.I.
(mill
ions
of
m2 )
Q.I.
(PJ)
Q.I.
(GJ/m
2 )Q
.I.
Nur
sing
or
resi
dent
ial
care
faci
lity
Tota
l 6
482
A25
.0B
39.1
B1.
56A
36 o
r le
ssX
XX
XX
XX
X
37 to
48
XX
XX
XX
XX
49 t
o 72
XX
XX
XX
XX
73 t
o 96
XX
XX
XX
XX
97 t
o 12
0X
XX
XX
XX
X
121
to 1
68 6
354
A24
.7B
38.7
B1.
57A
War
ehou
seTo
tal
32
879
A83
.0A
55.0
A0.
66A
36 o
r le
ss–
F–
F–
F0.
73C
37 to
48
14
005
B14
.9A
12.2
B0.
82A
49 t
o 72
11
168
B–
B15
.8B
0.48
A
73 t
o 96
1 0
20B
–F
–F
0.67
A
97 t
o 12
0–
F–
F–
F0.
63C
121
to 1
68 1
561
B16
.8C
14.9
C0.
89B
Hot
el o
r m
otel
Tota
l 9
963
C19
.7B
26.5
C1.
35A
36 o
r le
ssX
XX
XX
XX
X
37 to
48
XX
XX
XX
XX
49 t
o 72
XX
XX
XX
XX
73 t
o 96
XX
XX
XX
XX
97 t
o 12
0–
F–
F–
F1.
11B
121
to 1
68 7
616
C18
.6B
25.2
C1.
35A
(Con
tinue
d)
Tabl
e 1.
18 –
Bui
ldin
g ch
arac
teris
tics
and
ener
gy u
se b
y pr
imar
y ac
tivity
and
num
ber
of h
ours
of o
pera
tion
(con
tinue
d)

36 Survey of Commercial and Institutional Energy Use – Buildings 2009
Chapter 1: Canada
Prim
ary
acti
vity
Hou
rs o
f ope
rati
on
Bui
ldin
gsFl
oor
spac
eEn
ergy
use
Ener
gy in
tens
ity
Q.I.
(mill
ions
of
m2 )
Q.I.
(PJ)
Q.I.
(GJ/m
2 )Q
.I.
Hos
pita
lTo
tal
752
A15
.1A
36.5
A2.
42A
36 o
r le
ssX
XX
XX
XX
X
37 to
48
–F
–F
–F
1.69
A
49 t
o 72
XX
XX
XX
XX
73 t
o 96
XX
XX
XX
XX
97 t
o 12
0X
XX
XX
XX
X
121
to 1
6872
3A
14.9
A36
.3A
2.43
A
Food
or
beve
rage
sto
reTo
tal
40
403
A29
.3A
82.7
A2.
82A
36 o
r le
ssX
XX
XX
XX
X
37 to
48
XX
XX
XX
XX
49 t
o 72
8 9
37B
2.6
B6.
1B
2.35
A
73 t
o 96
10
748
A7.
6B
26.1
B3.
41A
97 t
o 12
0 1
2 93
0B
9.7
B28
.3B
2.91
A
121
to 1
68 6
404
B8.
7C
21.4
C2.
47A
Non
-food
re
tail
stor
eTo
tal
56
750
A68
.9A
65.2
A0.
95A
36 o
r le
ss–
F–
F–
F0.
40A
37 to
48
14
172
A9.
7A
6.2
A0.
64A
49 t
o 72
25
328
A28
.6A
27.9
B0.
98A
73 t
o 96
–F
18.2
C–
F0.
87B
97 t
o 12
0–
F8.
0C
11.0
C1.
37B
121
to 1
68–
F–
F–
F1.
40A
(Con
tinue
d)
Tabl
e 1.
18 –
Bui
ldin
g ch
arac
teris
tics
and
ener
gy u
se b
y pr
imar
y ac
tivity
and
num
ber
of h
ours
of o
pera
tion
(con
tinue
d)
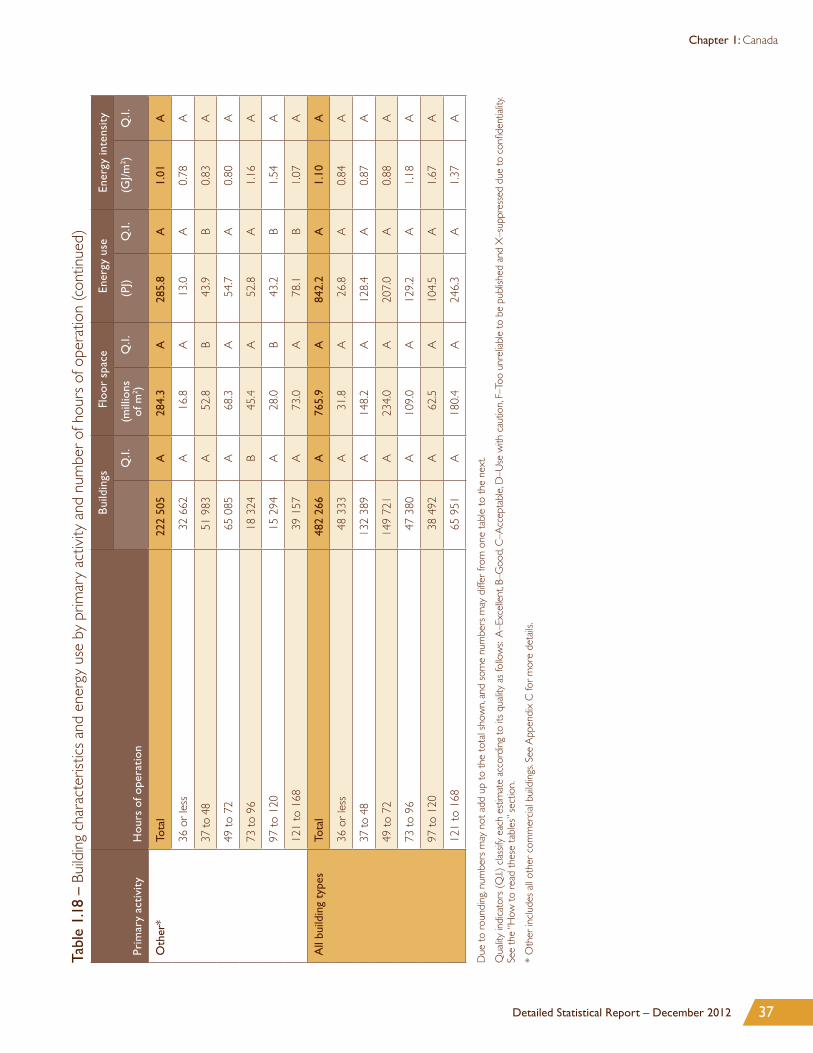
37Detailed Statistical Report – December 2012
Chapter 1: Canada
Prim
ary
acti
vity
Hou
rs o
f ope
rati
on
Bui
ldin
gsFl
oor
spac
eEn
ergy
use
Ener
gy in
tens
ity
Q.I.
(mill
ions
of
m2 )
Q.I.
(PJ)
Q.I.
(GJ/m
2 )Q
.I.
Oth
er*
Tota
l 2
22 5
05A
284.
3A
285.
8A
1.01
A
36 o
r le
ss 3
2 66
2A
16.8
A13
.0A
0.78
A
37 to
48
51
983
A52
.8B
43.9
B0.
83A
49 t
o 72
65
085
A68
.3A
54.7
A0.
80A
73 t
o 96
18
324
B45
.4A
52.8
A1.
16A
97 t
o 12
0 1
5 29
4A
28.0
B43
.2B
1.54
A
121
to 1
68 3
9 15
7A
73.0
A78
.1B
1.07
A
All
build
ing
type
sTo
tal
482
266
A76
5.9
A84
2.2
A1.
10A
36 o
r le
ss 4
8 33
3A
31.8
A26
.8A
0.84
A
37 to
48
132
389
A14
8.2
A12
8.4
A0.
87A
49 t
o 72
149
721
A23
4.0
A20
7.0
A0.
88A
73 t
o 96
47
380
A10
9.0
A12
9.2
A1.
18A
97 t
o 12
0 3
8 49
2A
62.5
A10
4.5
A1.
67A
121
to 1
68 6
5 95
1A
180.
4A
246.
3A
1.37
A
Due
to
roun
ding
, num
bers
may
not
add
up
to t
he t
otal
sho
wn,
and
som
e nu
mbe
rs m
ay d
iffer
from
one
tab
le t
o th
e ne
xt.
Qua
lity
indi
cato
rs (
Q.I.)
cla
ssify
eac
h es
timat
e ac
cord
ing
to it
s qu
ality
as
follo
ws:
A–E
xcel
lent
, B–G
ood,
C–A
ccep
tabl
e, D
–Use
with
cau
tion,
F–To
o un
relia
ble
to b
e pu
blish
ed a
nd X
–sup
pres
sed
due
to c
onfid
entia
lity.
See
the
“How
to
read
the
se t
able
s” s
ectio
n.
* O
ther
incl
udes
all
othe
r co
mm
erci
al b
uild
ings
. See
App
endi
x C
for
mor
e de
tails
.
Tabl
e 1.
18 –
Bui
ldin
g ch
arac
teris
tics
and
ener
gy u
se b
y pr
imar
y ac
tivity
and
num
ber
of h
ours
of o
pera
tion
(con
tinue
d)
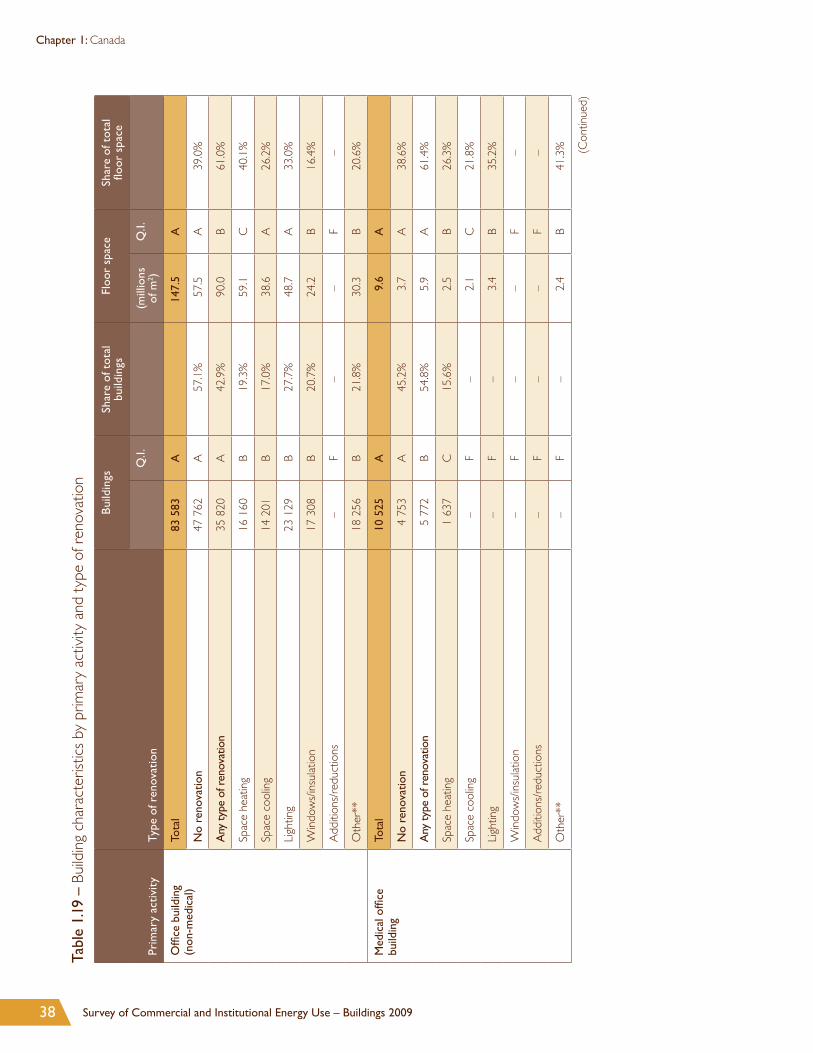
38 Survey of Commercial and Institutional Energy Use – Buildings 2009
Chapter 1: Canada
Tabl
e 1.
19 –
Bui
ldin
g ch
arac
teris
tics
by p
rimar
y ac
tivity
and
typ
e of
ren
ovat
ion
Prim
ary
acti
vity
Type
of r
enov
atio
n
Bui
ldin
gsSh
are
of t
otal
bu
ildin
gsFl
oor
spac
eSh
are
of t
otal
flo
or s
pace
Q.I.
(mill
ions
of
m2 )
Q.I.
Offi
ce b
uild
ing
(non
-med
ical
)To
tal
83
583
A14
7.5
A
No
reno
vatio
n 4
7 76
2A
57.1
%57
.5A
39.0
%
Any
type
of r
enov
atio
n 3
5 82
0A
42.9
%90
.0B
61.0
%
Spac
e he
atin
g 1
6 16
0B
19.3
%59
.1C
40.1
%
Spac
e co
olin
g 1
4 20
1B
17.0
%38
.6A
26.2
%
Ligh
ting
23
129
B27
.7%
48.7
A33
.0%
Win
dow
s/in
sula
tion
17
308
B20
.7%
24.2
B16
.4%
Add
ition
s/re
duct
ions
–F
––
F–
Oth
er**
18
256
B21
.8%
30.3
B20
.6%
Med
ical
offi
ce
build
ing
Tota
l 1
0 52
5A
9.6
A
No
reno
vatio
n 4
753
A45
.2%
3.7
A38
.6%
Any
type
of r
enov
atio
n 5
772
B54
.8%
5.9
A61
.4%
Spac
e he
atin
g 1
637
C15
.6%
2.5
B26
.3%
Spac
e co
olin
g–
F–
2.1
C21
.8%
Ligh
ting
–F
–3.
4B
35.2
%
Win
dow
s/in
sula
tion
–F
––
F–
Add
ition
s/re
duct
ions
–F
––
F–
Oth
er**
–F
–2.
4B
41.3
% (Con
tinue
d)
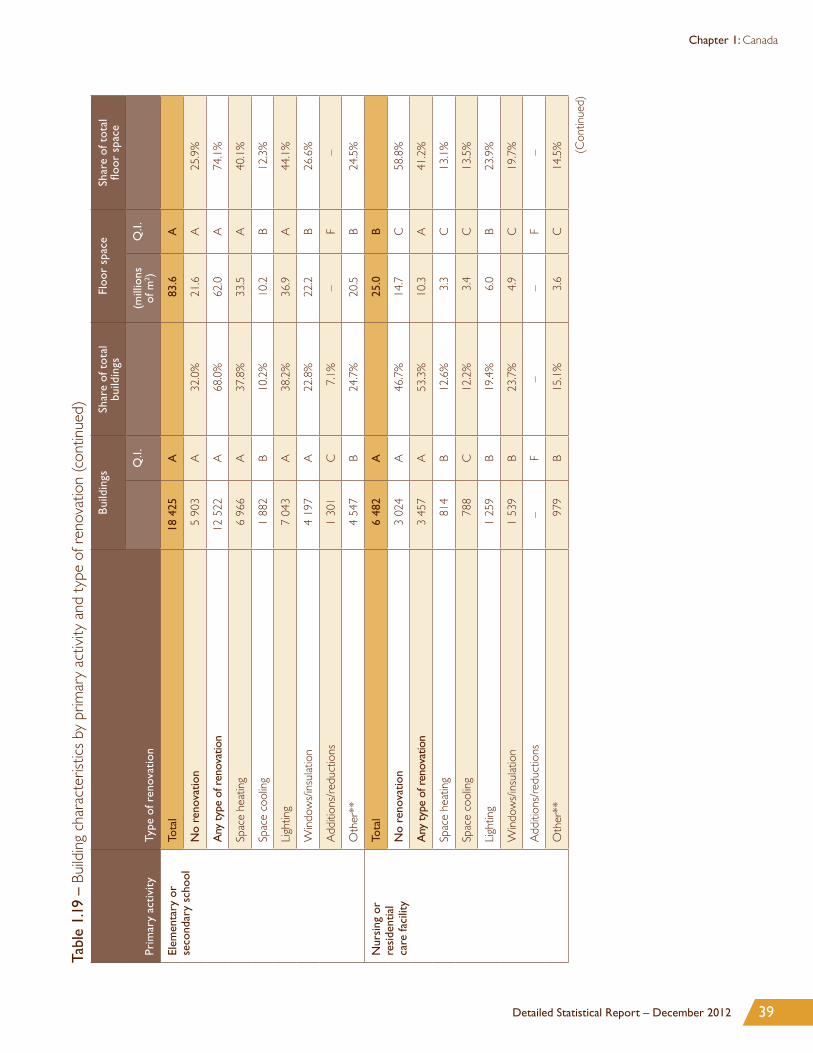
39Detailed Statistical Report – December 2012
Chapter 1: Canada
Prim
ary
acti
vity
Type
of r
enov
atio
n
Bui
ldin
gsSh
are
of t
otal
bu
ildin
gsFl
oor
spac
eSh
are
of t
otal
flo
or s
pace
Q.I.
(mill
ions
of
m2 )
Q.I.
Elem
enta
ry o
r se
cond
ary
scho
olTo
tal
18
425
A83
.6A
No
reno
vatio
n 5
903
A32
.0%
21.6
A25
.9%
Any
type
of r
enov
atio
n 1
2 52
2A
68.0
%62
.0A
74.1
%
Spac
e he
atin
g 6
966
A37
.8%
33.5
A40
.1%
Spac
e co
olin
g 1
882
B10
.2%
10.2
B12
.3%
Ligh
ting
7 0
43A
38.2
%36
.9A
44.1
%
Win
dow
s/in
sula
tion
4 1
97A
22.8
%22
.2B
26.6
%
Add
ition
s/re
duct
ions
1 3
01C
7.1%
–F
–
Oth
er**
4 5
47B
24.7
%20
.5B
24.5
%
Nur
sing
or
resi
dent
ial
care
faci
lity
Tota
l 6
482
A25
.0B
No
reno
vatio
n 3
024
A46
.7%
14.7
C58
.8%
Any
type
of r
enov
atio
n 3
457
A53
.3%
10.3
A41
.2%
Spac
e he
atin
g81
4B
12.6
%3.
3C
13.1
%
Spac
e co
olin
g78
8C
12.2
%3.
4C
13.5
%
Ligh
ting
1 2
59B
19.4
%6.
0B
23.9
%
Win
dow
s/in
sula
tion
1 5
39B
23.7
%4.
9C
19.7
%
Add
ition
s/re
duct
ions
–F
––
F–
Oth
er**
979
B15
.1%
3.6
C14
.5% (C
ontin
ued)
Tabl
e 1.
19 –
Bui
ldin
g ch
arac
teris
tics
by p
rimar
y ac
tivity
and
typ
e of
ren
ovat
ion
(con
tinue
d)

40 Survey of Commercial and Institutional Energy Use – Buildings 2009
Chapter 1: Canada
Prim
ary
acti
vity
Type
of r
enov
atio
n
Bui
ldin
gsSh
are
of t
otal
bu
ildin
gsFl
oor
spac
eSh
are
of t
otal
flo
or s
pace
Q.I.
(mill
ions
of
m2 )
Q.I.
War
ehou
seTo
tal
32
879
A83
.0A
No
reno
vatio
n 2
3 05
2A
70.1
%43
.5B
52.4
%
Any
type
of r
enov
atio
n 9
828
B29
.9%
39.5
B47
.6%
Spac
e he
atin
g 4
948
C15
.1%
14.6
C17
.6%
Spac
e co
olin
g–
F–
8.7
B10
.5%
Ligh
ting
3 9
99B
12.2
%29
.3C
35.3
%
Win
dow
s/in
sula
tion
2 7
73B
8.4%
–F
–
Add
ition
s/re
duct
ions
–F
––
F–
Oth
er**
2 9
80C
9.1%
–F
–
Hot
el o
r m
otel
Tota
l 9
963
C19
.7B
No
reno
vatio
n–
F–
–F
–
Any
type
of r
enov
atio
n 6
287
B63
.1%
13.4
B67
.9%
Spac
e he
atin
g–
F–
7.8
C39
.7%
Spac
e co
olin
g 2
744
B27
.5%
8.0
C40
.7%
Ligh
ting
5 0
10B
50.3
%11
.1B
56.4
%
Win
dow
s/in
sula
tion
3 1
92C
32.0
%3.
3A
16.9
%
Add
ition
s/re
duct
ions
–F
––
F–
Oth
er**
2 6
97B
27.1
%–
F– (C
ontin
ued)
Tabl
e 1.
19 –
Bui
ldin
g ch
arac
teris
tics
by p
rimar
y ac
tivity
and
typ
e of
ren
ovat
ion
(con
tinue
d)

41Detailed Statistical Report – December 2012
Chapter 1: Canada
Prim
ary
acti
vity
Type
of r
enov
atio
n
Bui
ldin
gsSh
are
of t
otal
bu
ildin
gsFl
oor
spac
eSh
are
of t
otal
flo
or s
pace
Q.I.
(mill
ions
of
m2 )
Q.I.
Hos
pita
lTo
tal
752
A15
.1A
No
reno
vatio
n23
4A
31.1
%3.
2B
21.3
%
Any
type
of r
enov
atio
n51
8A
68.9
%11
.9A
78.7
%
Spac
e he
atin
g27
4A
36.5
%6.
6A
44.0
%
Spac
e co
olin
g27
9A
37.2
%6.
6A
44.0
%
Ligh
ting
329
A43
.8%
6.8
A45
.3%
Win
dow
s/in
sula
tion
145
A19
.3%
3.4
A22
.4%
Add
ition
s/re
duct
ions
88A
11.8
%4.
5B
30.1
%
Oth
er**
164
A21
.8%
4.3
A28
.5%
Food
or
beve
rage
sto
reTo
tal
40
403
A29
.3A
No
reno
vatio
n 2
6 05
1A
64.5
%18
.6B
63.5
%
Any
type
of r
enov
atio
n 1
4 35
2A
35.5
%10
.7B
36.5
%
Spac
e he
atin
g 3
391
B8.
4%4.
1C
14.0
%
Spac
e co
olin
g 3
213
C8.
0%–
F–
Ligh
ting
8 7
46B
21.6
%6.
3B
21.6
%
Win
dow
s/in
sula
tion
3 0
10B
7.5%
1.8
C6.
1%
Add
ition
s/re
duct
ions
–F
––
F–
Oth
er**
3 5
87B
8.9%
–F
– (Con
tinue
d)
Tabl
e 1.
19 –
Bui
ldin
g ch
arac
teris
tics
by p
rimar
y ac
tivity
and
typ
e of
ren
ovat
ion
(con
tinue
d)

42 Survey of Commercial and Institutional Energy Use – Buildings 2009
Chapter 1: Canada
Prim
ary
acti
vity
Type
of r
enov
atio
n
Bui
ldin
gsSh
are
of t
otal
bu
ildin
gsFl
oor
spac
eSh
are
of t
otal
flo
or s
pace
Q.I.
(mill
ions
of
m2 )
Q.I.
Non
-food
re
tail
stor
eTo
tal
56
750
A68
.9A
No
reno
vatio
n 3
6 98
5A
65.2
%41
.0A
59.5
%
Any
type
of r
enov
atio
n 1
9 76
4B
34.8
%27
.9B
40.5
%
Spac
e he
atin
g 1
0 74
7C
18.9
%12
.3C
17.8
%
Spac
e co
olin
g 6
896
C12
.2%
13.8
C20
.1%
Ligh
ting
12
850
B22
.6%
22.0
B31
.9%
Win
dow
s/in
sula
tion
9 6
56C
17.0
%10
.7C
15.6
%
Add
ition
s/re
duct
ions
–F
––
F–
Oth
er**
7 1
42C
12.6
%11
.4C
16.5
%
Oth
er*
Tota
l 2
22 5
05A
284.
3A
No
reno
vatio
n 1
10 9
16A
49.8
%11
8.6
A41
.7%
Any
type
of r
enov
atio
n 1
11 5
90A
50.2
%16
5.7
A58
.3%
Spac
e he
atin
g 3
6 85
0A
16.6
%67
.3A
23.7
%
Spac
e co
olin
g 2
7 41
3A
12.3
%60
.2A
21.2
%
Ligh
ting
60
699
A27
.3%
112.
1A
39.4
%
Win
dow
s/in
sula
tion
39
426
A17
.7%
79.0
A27
.8%
Add
ition
s/re
duct
ions
11
317
C5.
1%27
.9C
9.8%
Oth
er**
39
260
A17
.6%
66.1
A23
.2% (C
ontin
ued)
Tabl
e 1.
19 –
Bui
ldin
g ch
arac
teris
tics
by p
rimar
y ac
tivity
and
typ
e of
ren
ovat
ion
(con
tinue
d)

43Detailed Statistical Report – December 2012
Chapter 1: Canada
Prim
ary
acti
vity
Type
of r
enov
atio
n
Bui
ldin
gsSh
are
of t
otal
bu
ildin
gsFl
oor
spac
eSh
are
of t
otal
flo
or s
pace
Q.I.
(mill
ions
of
m2 )
Q.I.
All
build
ing
type
sTo
tal
482
266
A76
5.9
A
No
reno
vatio
n 2
62 3
55A
54.4
%32
8.7
A42
.9%
Any
type
of r
enov
atio
n 2
19 9
10A
45.6
%43
7.2
A57
.1%
Spac
e he
atin
g 8
4 38
5A
17.5
%21
1.2
A27
.6%
Spac
e co
olin
g 6
1 21
9A
12.7
%15
6.3
A20
.4%
Ligh
ting
125
518
A26
.0%
282.
6A
36.9
%
Win
dow
s/in
sula
tion
82
900
A17
.2%
167.
0A
21.8
%
Add
ition
s/re
duct
ions
22
226
A4.
6%58
.5A
7.6%
Oth
er**
81
576
A16
.9%
164.
5A
21.5
%
Due
to
roun
ding
, num
bers
may
not
add
up
to t
he t
otal
sho
wn,
and
som
e nu
mbe
rs m
ay d
iffer
from
one
tab
le t
o th
e ne
xt.
Qua
lity
indi
cato
rs (
Q.I.)
cla
ssify
eac
h es
timat
e ac
cord
ing
to it
s qu
ality
as
follo
ws:
A–E
xcel
lent
, B–G
ood,
C–A
ccep
tabl
e, D
–Use
with
cau
tion,
F–To
o un
relia
ble
to b
e pu
blish
ed a
nd X
–sup
pres
sed
due
to c
onfid
entia
lity.
See
the
“How
to r
ead
thes
e ta
bles
” sec
tion.
* O
ther
incl
udes
all
othe
r co
mm
erci
al b
uild
ings
. See
App
endi
x C
for
mor
e de
tails
.
** O
ther
incl
udes
all
othe
r re
nova
tions
not
list
ed.
Tabl
e 1.
19 –
Bui
ldin
g ch
arac
teris
tics
by p
rimar
y ac
tivity
and
typ
e of
ren
ovat
ion
(con
tinue
d)
Plea
se n
ote t
hat a
bui
ldin
g ca
n ha
ve m
ore t
han
one t
ype o
f ren
ovat
ion.
As s
uch,
the s
um o
f the
reno
vate
d bu
ildin
gs w
ill n
ot ad
d to
the t
otal
num
ber o
f bu
ildin
gs. Th
e abo
ve n
oted
reno
vatio
ns/re
trofit
s wer
e und
erta
ken
durin
g th
e yea
rs 20
05 to
200
9 (in
the l
ast fi
ve y
ears)
.


Title: Lorem ipsum
45
2CLIMATE ZONE AND REGION

46 Survey of Commercial and Institutional Energy Use – Buildings 2009
Chapter 2: Climate zone and region
Tabl
e 2.
1 –
Build
ing
char
acte
ristic
s an
d en
ergy
use
by
clim
ate
zone
and
size
Clim
ate
zone
Bui
ldin
g si
ze
Bui
ldin
gsFl
oor
spac
eEn
ergy
use
Ener
gy in
tens
ity
Q.I.
(mill
ions
of
m2 )
Q.I.
(PJ)
Q.I.
(GJ/m
2 )Q
.I.
Atla
ntic
Tota
l 4
7 91
1A
69.8
A71
.6A
1.03
A
5000
squ
are
feet
or
less
(46
5 m
2 or
less
) 2
5 31
3A
5.4
A7.
0A
1.29
A
5001
to 1
0 00
0 sq
uare
feet
(466
to 9
29 m
2 ) 9
198
A6.
0A
6.0
A1.
00A
10 0
01 t
o 50
000
squ
are
feet
(93
0 to
464
5 m
2 ) 1
0 33
5A
19.7
A16
.6A
0.84
A
50 0
01 t
o 20
0 00
0 sq
uare
feet
(46
46 t
o 18
580
m2 )
2 5
91B
20.9
A21
.0A
1.00
A
Ove
r 20
0 00
0 sq
uare
feet
(O
ver
18 5
80 m
2 )–
F–
F–
F1.
18A
Gre
at L
akes
Tota
l 2
33 8
80A
417.
3A
437.
2A
1.05
A
5000
squ
are
feet
or
less
(46
5 m
2 or
less
) 1
16 4
27A
29.9
A49
.4A
1.65
A
5001
to 1
0 00
0 sq
uare
feet
(466
to 9
29 m
2 ) 4
2 87
6A
28.4
A28
.5B
1.00
A
10 0
01 t
o 50
000
squ
are
feet
(93
0 to
464
5 m
2 ) 5
7 47
8A
121.
6A
120.
4A
0.99
A
50 0
01 t
o 20
0 00
0 sq
uare
feet
(46
46 t
o 18
580
m2 )
13
666
A11
2.1
A10
8.4
A0.
97A
Ove
r 20
0 00
0 sq
uare
feet
(O
ver
18 5
80 m
2 ) 3
434
B12
5.2
B13
0.5
B1.
04A
Paci
fic C
oast
Tota
l 3
8 09
2A
64.6
A64
.0B
0.99
A
5000
squ
are
feet
or
less
(46
5 m
2 or
less
) 1
7 60
0A
3.6
B7.
0B
1.93
A
5001
to 1
0 00
0 sq
uare
feet
(466
to 9
29 m
2 ) 5
439
C–
F3.
8C
1.04
B
10 0
01 t
o 50
000
squ
are
feet
(93
0 to
464
5 m
2 ) 1
2 07
4B
26.1
B–
F0.
88C
50 0
01 t
o 20
0 00
0 sq
uare
feet
(46
46 t
o 18
,580
m2 )
2 7
21B
22.3
A23
.1A
1.03
A
Ove
r 20
0 00
0 sq
uare
feet
(O
ver
18 5
80 m
2 )25
9C
9.0
B7.
3B
0.81
A
(Con
tinue
d)
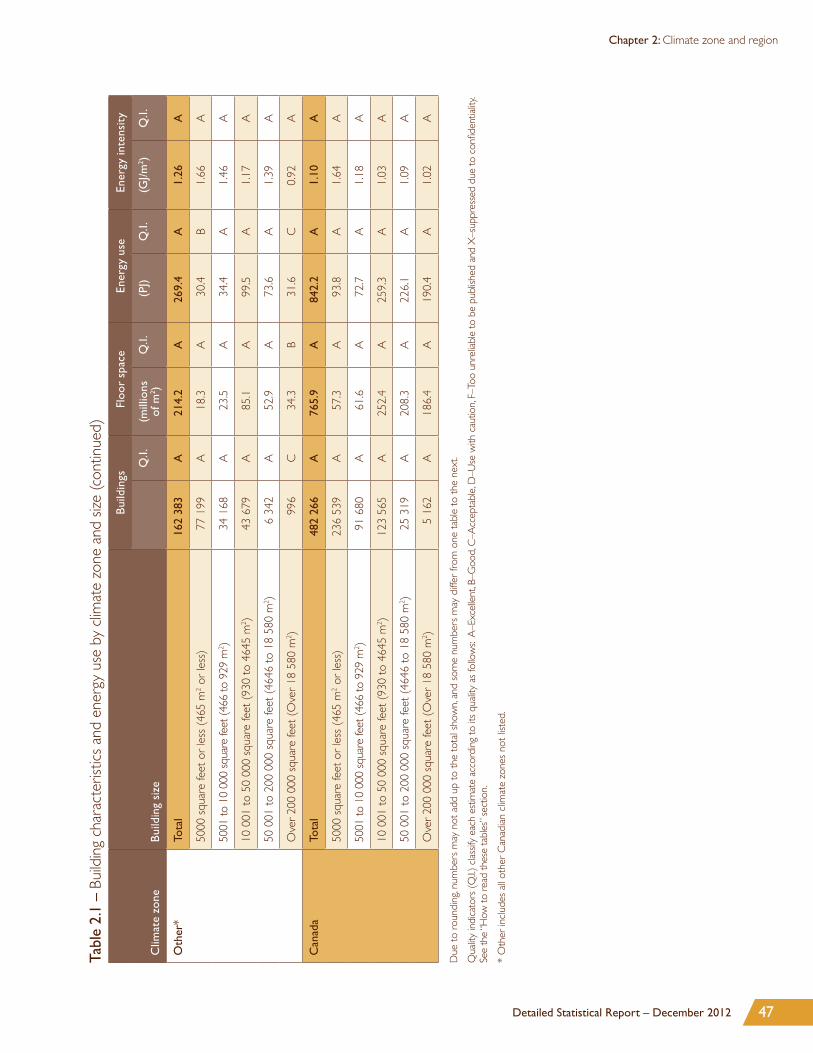
47Detailed Statistical Report – December 2012
Chapter 2: Climate zone and region
Clim
ate
zone
Bui
ldin
g si
ze
Bui
ldin
gsFl
oor
spac
eEn
ergy
use
Ener
gy in
tens
ity
Q.I.
(mill
ions
of
m2 )
Q.I.
(PJ)
Q.I.
(GJ/m
2 )Q
.I.
Oth
er*
Tota
l 1
62 3
83A
214.
2A
269.
4A
1.26
A
5000
squ
are
feet
or
less
(46
5 m
2 or
less
) 7
7 19
9A
18.3
A30
.4B
1.66
A
5001
to 1
0 00
0 sq
uare
feet
(466
to 9
29 m
2 ) 3
4 16
8A
23.5
A34
.4A
1.46
A
10 0
01 t
o 50
000
squ
are
feet
(93
0 to
464
5 m
2 ) 4
3 67
9A
85.1
A99
.5A
1.17
A
50 0
01 t
o 20
0 00
0 sq
uare
feet
(46
46 t
o 18
580
m2 )
6 3
42A
52.9
A73
.6A
1.39
A
Ove
r 20
0 00
0 sq
uare
feet
(O
ver
18 5
80 m
2 )99
6C
34.3
B31
.6C
0.92
A
Can
ada
Tota
l 4
82 2
66A
765.
9A
842.
2A
1.10
A
5000
squ
are
feet
or
less
(46
5 m
2 or
less
) 2
36 5
39A
57.3
A93
.8A
1.64
A
5001
to 1
0 00
0 sq
uare
feet
(466
to 9
29 m
2 ) 9
1 68
0A
61.6
A72
.7A
1.18
A
10 0
01 t
o 50
000
squ
are
feet
(93
0 to
464
5 m
2 ) 1
23 5
65A
252.
4A
259.
3A
1.03
A
50 0
01 t
o 20
0 00
0 sq
uare
feet
(46
46 t
o 18
580
m2 )
25
319
A20
8.3
A22
6.1
A1.
09A
Ove
r 20
0 00
0 sq
uare
feet
(O
ver
18 5
80 m
2 ) 5
162
A18
6.4
A19
0.4
A1.
02A
Due
to
roun
ding
, num
bers
may
not
add
up
to t
he t
otal
sho
wn,
and
som
e nu
mbe
rs m
ay d
iffer
from
one
tab
le t
o th
e ne
xt.
Qua
lity
indi
cato
rs (
Q.I.)
cla
ssify
eac
h es
timat
e ac
cord
ing
to it
s qu
ality
as
follo
ws:
A–E
xcel
lent
, B–G
ood,
C–A
ccep
tabl
e, D
–Use
with
cau
tion,
F–To
o un
relia
ble
to b
e pu
blish
ed a
nd X
–sup
pres
sed
due
to c
onfid
entia
lity.
See
the
“How
to r
ead
thes
e ta
bles
” sec
tion.
* O
ther
incl
udes
all
othe
r C
anad
ian
clim
ate
zone
s no
t lis
ted.
Tabl
e 2.
1 –
Build
ing
char
acte
ristic
s an
d en
ergy
use
by
clim
ate
zone
and
size
(con
tinue
d)

48 Survey of Commercial and Institutional Energy Use – Buildings 2009
Chapter 2: Climate zone and region
Tabl
e 2.
2 –
Build
ing
char
acte
ristic
s an
d en
ergy
use
by
clim
ate
zone
and
yea
r of
con
stru
ctio
n
Clim
ate
zone
Year
of c
onst
ruct
ion
Bui
ldin
gsFl
oor
spac
eEn
ergy
use
Ener
gy in
tens
ity
Q.I.
(mill
ions
of
m2 )
Q.I.
(PJ)
Q.I.
(GJ/m
2 )Q
.I.
Atla
ntic
Tota
l 4
7 91
1A
69.8
A71
.6A
1.03
A
Befo
re 1
920
3 8
26B
2.3
B1.
7B
0.74
A
1920
to 1
959
8 8
92A
6.6
A6.
4A
0.97
A
1960
to
1969
5 7
19A
–F
–F
1.15
A
1970
to
1979
6 9
42A
14.2
A14
.5A
1.02
A
1980
to
1989
7 5
54A
8.8
A7.
5A
0.86
A
1990
to
1999
8 0
60A
9.9
B10
.5B
1.06
A
2000
or
late
r 6
919
A9.
3B
9.5
B1.
02A
2000
to
2004
4 1
03B
3.0
A3.
4A
1.13
A
2005
or
late
r 2
816
B6.
3C
6.1
C0.
97A
Gre
at L
akes
Tota
l 2
33 8
80A
417.
3A
437.
2A
1.05
A
Befo
re 1
920
30
361
B36
.2A
35.5
A0.
98A
1920
to 1
959
42
054
A53
.2A
59.2
A1.
11A
1960
to
1969
32
615
A70
.5A
57.6
A0.
82A
1970
to
1979
30
602
A84
.5B
99.5
B1.
18A
1980
to
1989
45
955
A56
.7A
62.4
A1.
10A
1990
to
1999
25
123
C53
.5B
61.9
B1.
16A
2000
or
late
r 2
7 16
9A
62.6
A61
.2A
0.98
A
2000
to
2004
12
558
B36
.0B
34.4
B0.
96A
2005
or
late
r 1
4 61
2B
26.6
C26
.7C
1.00
B
Paci
fic C
oast
Tota
l 3
8 09
2A
64.6
A64
.0B
0.99
A
Befo
re 1
920
2 6
77C
4.1
C3.
8C
0.92
B
1920
to 1
959
6 1
01B
–F
–F
–F
1960
to
1969
–F
–F
7.0
B0.
82B
1970
to
1979
6 5
33B
13.5
B12
.0B
0.89
A
1980
to
1989
7 1
99B
9.5
B10
.0C
1.05
A
1990
to
1999
6 3
65C
11.1
B10
.1B
0.91
A
2000
or
late
r 5
048
C11
.9C
13.7
B1.
15B
2000
to
2004
–F
2.6
C4.
9C
1.84
A
2005
or
late
r–
F–
F8.
8C
0.95
B
(Con
tinue
d)
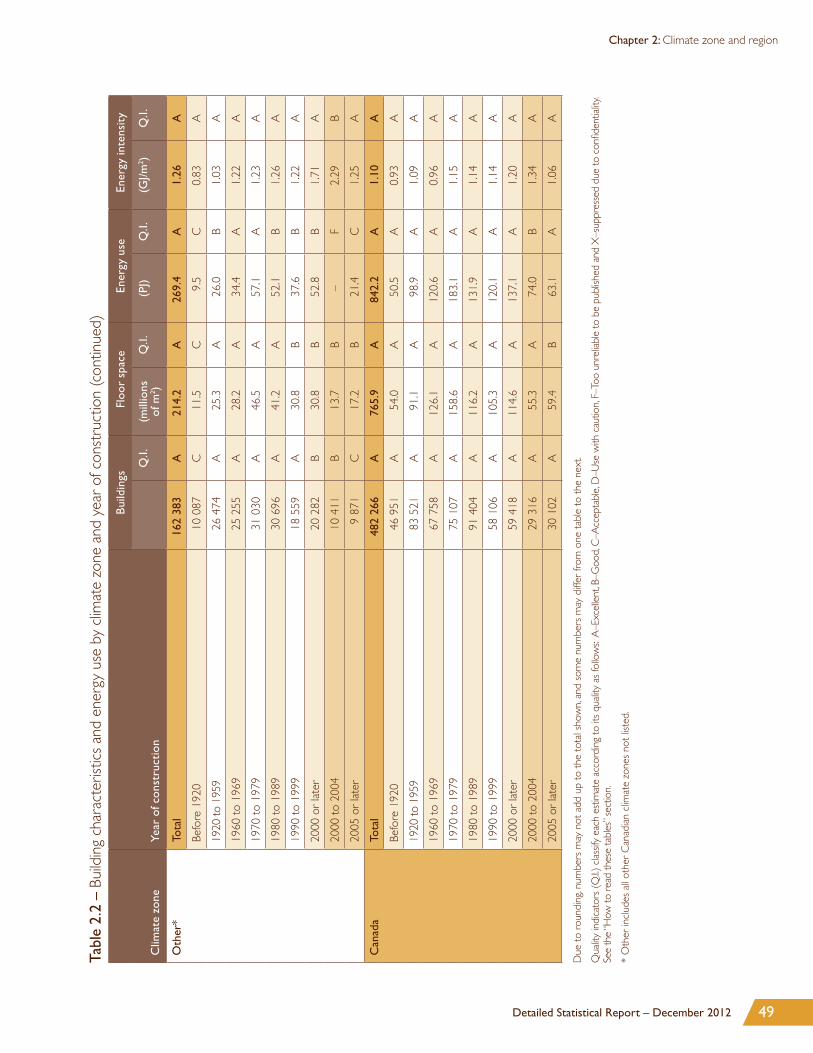
49Detailed Statistical Report – December 2012
Chapter 2: Climate zone and region
Clim
ate
zone
Year
of c
onst
ruct
ion
Bui
ldin
gsFl
oor
spac
eEn
ergy
use
Ener
gy in
tens
ity
Q.I.
(mill
ions
of
m2 )
Q.I.
(PJ)
Q.I.
(GJ/m
2 )Q
.I.
Oth
er*
Tota
l 1
62 3
83A
214.
2A
269.
4A
1.26
A
Befo
re 1
920
10
087
C11
.5C
9.5
C0.
83A
1920
to 1
959
26
474
A25
.3A
26.0
B1.
03A
1960
to
1969
25
255
A28
.2A
34.4
A1.
22A
1970
to
1979
31
030
A46
.5A
57.1
A1.
23A
1980
to
1989
30
696
A41
.2A
52.1
B1.
26A
1990
to
1999
18
559
A30
.8B
37.6
B1.
22A
2000
or
late
r 2
0 28
2B
30.8
B52
.8B
1.71
A
2000
to
2004
10
411
B13
.7B
–F
2.29
B
2005
or
late
r 9
871
C17
.2B
21.4
C1.
25A
Can
ada
Tota
l 4
82 2
66A
765.
9A
842.
2A
1.10
A
Befo
re 1
920
46
951
A54
.0A
50.5
A0.
93A
1920
to 1
959
83
521
A91
.1A
98.9
A1.
09A
1960
to
1969
67
758
A12
6.1
A12
0.6
A0.
96A
1970
to
1979
75
107
A15
8.6
A18
3.1
A1.
15A
1980
to
1989
91
404
A11
6.2
A13
1.9
A1.
14A
1990
to
1999
58
106
A10
5.3
A12
0.1
A1.
14A
2000
or
late
r 5
9 41
8A
114.
6A
137.
1A
1.20
A
2000
to
2004
29
316
A55
.3A
74.0
B1.
34A
2005
or
late
r 3
0 10
2A
59.4
B63
.1A
1.06
A
Due
to
roun
ding
, num
bers
may
not
add
up
to t
he t
otal
sho
wn,
and
som
e nu
mbe
rs m
ay d
iffer
from
one
tab
le t
o th
e ne
xt.
Qua
lity
indi
cato
rs (
Q.I.)
cla
ssify
eac
h es
timat
e ac
cord
ing
to it
s qu
ality
as
follo
ws:
A–E
xcel
lent
, B–G
ood,
C–A
ccep
tabl
e, D
–Use
with
cau
tion,
F–To
o un
relia
ble
to b
e pu
blish
ed a
nd X
–sup
pres
sed
due
to c
onfid
entia
lity.
See
the
“How
to r
ead
thes
e ta
bles
” sec
tion.
* O
ther
incl
udes
all
othe
r C
anad
ian
clim
ate
zone
s no
t lis
ted.
Tabl
e 2.
2 –
Build
ing
char
acte
ristic
s an
d en
ergy
use
by
clim
ate
zone
and
yea
r of
con
stru
ctio
n (c
ontin
ued)
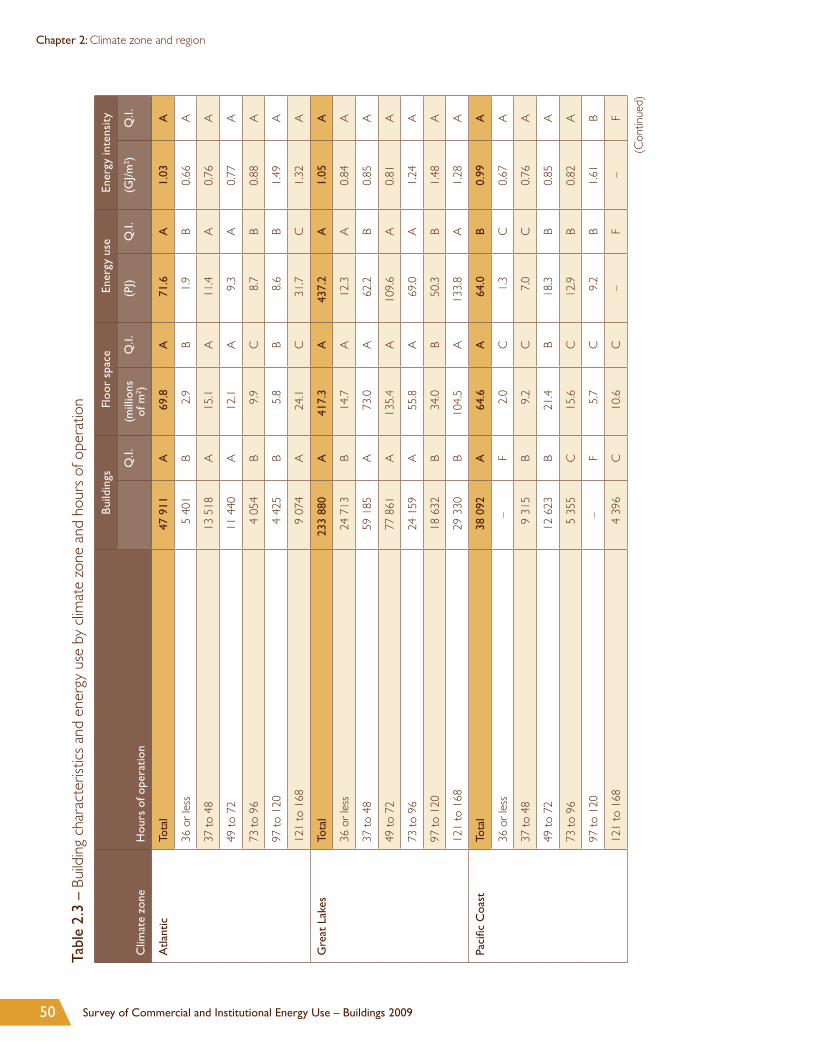
50 Survey of Commercial and Institutional Energy Use – Buildings 2009
Chapter 2: Climate zone and region
Tabl
e 2.
3 –
Build
ing
char
acte
ristic
s an
d en
ergy
use
by
clim
ate
zone
and
hou
rs o
f ope
ratio
n
Clim
ate
zone
Hou
rs o
f ope
rati
on
Bui
ldin
gsFl
oor
spac
eEn
ergy
use
Ener
gy in
tens
ity
Q.I.
(mill
ions
of
m2 )
Q.I.
(PJ)
Q.I.
(GJ/m
2 )Q
.I.
Atla
ntic
Tota
l 4
7 91
1A
69.8
A71
.6A
1.03
A
36 o
r le
ss 5
401
B2.
9B
1.9
B0.
66A
37 t
o 48
13
518
A15
.1A
11.4
A0.
76A
49 t
o 72
11
440
A12
.1A
9.3
A0.
77A
73 t
o 96
4 0
54B
9.9
C8.
7B
0.88
A
97 t
o 12
0 4
425
B5.
8B
8.6
B1.
49A
121
to 1
68 9
074
A24
.1C
31.7
C1.
32A
Gre
at L
akes
Tota
l 2
33 8
80A
417.
3A
437.
2A
1.05
A
36 o
r le
ss 2
4 71
3B
14.7
A12
.3A
0.84
A
37 t
o 48
59
185
A73
.0A
62.2
B0.
85A
49 t
o 72
77
861
A13
5.4
A10
9.6
A0.
81A
73 t
o 96
24
159
A55
.8A
69.0
A1.
24A
97 t
o 12
0 1
8 63
2B
34.0
B50
.3B
1.48
A
121
to 1
68 2
9 33
0B
104.
5A
133.
8A
1.28
A
Paci
fic C
oast
Tota
l 3
8 09
2A
64.6
A64
.0B
0.99
A
36 o
r le
ss–
F2.
0C
1.3
C0.
67A
37 t
o 48
9 3
15B
9.2
C7.
0C
0.76
A
49 t
o 72
12
623
B21
.4B
18.3
B0.
85A
73 t
o 96
5 3
55C
15.6
C12
.9B
0.82
A
97 t
o 12
0–
F5.
7C
9.2
B1.
61B
121
to 1
68 4
396
C10
.6C
–F
–F
(Con
tinue
d)

51Detailed Statistical Report – December 2012
Chapter 2: Climate zone and region
Clim
ate
zone
Hou
rs o
f ope
rati
on
Bui
ldin
gsFl
oor
spac
eEn
ergy
use
Ener
gy in
tens
ity
Q.I.
(mill
ions
of
m2 )
Q.I.
(PJ)
Q.I.
(GJ/m
2 )Q
.I.
Oth
er*
Tota
l 1
62 3
83A
214.
2A
269.
4A
1.26
A
36 o
r le
ss 1
5 44
7A
12.3
B11
.3B
0.92
A
37 t
o 48
50
371
A50
.9A
47.8
A0.
94A
49 t
o 72
47
797
A65
.1A
69.9
A1.
07A
73 t
o 96
13
812
B27
.7B
38.7
B1.
40A
97 t
o 12
0 1
1 80
4A
17.1
B36
.3C
2.13
B
121
to 1
68 2
3 15
2A
41.2
A65
.5B
1.59
A
Can
ada
Tota
l 4
82 2
66A
765.
9A
842.
2A
1.10
A
36 o
r le
ss 4
8 33
3A
31.8
A26
.8A
0.84
A
37 t
o 48
132
389
A14
8.2
A12
8.4
A0.
87A
49 t
o 72
149
721
A23
4.0
A20
7.0
A0.
88A
73 t
o 96
47
380
A10
9.0
A12
9.2
A1.
18A
97 t
o 12
0 3
8 49
2A
62.5
A10
4.5
A1.
67A
121
to 1
68 6
5 95
1A
180.
4A
246.
3A
1.37
A
Due
to
roun
ding
, num
bers
may
not
add
up
to t
he t
otal
sho
wn,
and
som
e nu
mbe
rs m
ay d
iffer
from
one
tab
le t
o th
e ne
xt.
Qua
lity
indi
cato
rs (
Q.I.)
cla
ssify
eac
h es
timat
e ac
cord
ing
to it
s qu
ality
as
follo
ws:
A–E
xcel
lent
, B–G
ood,
C–A
ccep
tabl
e, D
–Use
with
cau
tion,
F–To
o un
relia
ble
to b
e pu
blish
ed a
nd X
–sup
pres
sed
due
to c
onfid
entia
lity.
See
the
“How
to r
ead
thes
e ta
bles
” sec
tion.
* O
ther
incl
udes
all
othe
r C
anad
ian
clim
ate
zone
s no
t lis
ted.
Tabl
e 2.
3 –
Build
ing
char
acte
ristic
s an
d en
ergy
use
by
clim
ate
zone
and
hou
rs o
f ope
ratio
n (c
ontin
ued)

52 Survey of Commercial and Institutional Energy Use – Buildings 2009
Chapter 2: Climate zone and region
Tabl
e 2.
4 –
Build
ing
char
acte
ristic
s an
d en
ergy
use
by
clim
ate
zone
and
prim
ary
activ
ity
Clim
ate
zone
Prim
ary
acti
vity
Bui
ldin
gsFl
oor
spac
eEn
ergy
use
Ener
gy in
tens
ity
Q.I.
(mill
ions
of
m2 )
Q.I.
(PJ)
Q.I.
(GJ/m
2 )Q
.I.
Atla
ntic
Tota
l 4
7 91
1A
69.8
A71
.6A
1.03
A
Offi
ce b
uild
ing
(non
-med
ical
) 7
592
A6.
8A
6.6
B0.
97A
Med
ical
offi
ce b
uild
ing
735
B0.
7B
0.6
B0.
80A
Elem
enta
ry o
r se
cond
ary
scho
ol 2
014
B8.
2A
6.4
B0.
77A
Nur
sing
or r
esid
entia
l car
e fa
cilit
y 1
192
B1.
7B
2.4
B1.
40A
War
ehou
se 2
578
B4.
2B
2.0
B0.
47A
Hot
el o
r m
otel
1 9
88C
1.6
A1.
8A
1.09
A
Hos
pita
l12
1B
2.4
B6.
3B
2.61
A
Food
or
beve
rage
sto
re 5
395
A3.
5C
7.8
C2.
22A
Non
-food
ret
ail s
tore
3 4
06B
6.8
C5.
2C
0.76
A
Oth
er**
22
891
A33
.8B
32.6
C0.
96A
Gre
at L
akes
Tota
l 2
33 8
80A
417.
3A
437.
2A
1.05
A
Offi
ce b
uild
ing
(non
-med
ical
) 3
7 48
4A
87.2
B99
.3B
1.14
A
Med
ical
offi
ce b
uild
ing
3 9
14B
3.1
B3.
6B
1.17
A
Elem
enta
ry o
r se
cond
ary
scho
ol 9
170
A40
.7A
32.2
A0.
79A
Nur
sing
or r
esid
entia
l car
e fa
cilit
y 2
144
B17
.7C
24.4
C1.
38A
War
ehou
se 1
5 00
6B
56.6
B32
.4B
0.57
A
Hot
el o
r m
otel
3 1
39C
6.3
C8.
2C
1.31
B
Hos
pita
l23
0A
8.2
A20
.6A
2.49
A
Food
or
beve
rage
sto
re 1
8 53
5A
15.5
B45
.2B
2.92
A
Non
-food
ret
ail s
tore
24
220
B21
.2B
18.0
B0.
85A
Oth
er**
120
039
A16
0.8
A15
3.2
A0.
95A
Paci
fic C
oast
Tota
l 3
8 09
2A
64.6
A64
.0B
0.99
A
Offi
ce b
uild
ing
(non
-med
ical
) 5
056
C12
.5B
11.9
B0.
95A
Med
ical
offi
ce b
uild
ing
832
C1.
3B
1.4
C1.
05A
Elem
enta
ry o
r se
cond
ary
scho
ol 2
271
B7.
6A
4.8
A0.
64A
Nur
sing
or r
esid
entia
l car
e fa
cilit
y56
3A
0.8
B1.
2B
1.44
A
War
ehou
se–
F–
F–
F0.
86B
Hot
el o
r m
otel
–F
2.4
B2.
6B
1.11
A
Hos
pita
l90
A1.
5B
2.4
B1.
58A
Food
or
beve
rage
sto
re 4
095
B2.
6B
7.6
B2.
89A
Non
-food
ret
ail s
tore
6 4
75B
–F
5.3
C0.
65B
Oth
er**
15
429
B21
.6B
–F
1.00
C
(Con
tinue
d)

53Detailed Statistical Report – December 2012
Chapter 2: Climate zone and region
Clim
ate
zone
Prim
ary
acti
vity
Bui
ldin
gsFl
oor
spac
eEn
ergy
use
Ener
gy in
tens
ity
Q.I.
(mill
ions
of
m2 )
Q.I.
(PJ)
Q.I.
(GJ/m
2 )Q
.I.
Oth
er*
Tota
l 1
62 3
83A
214.
2A
269.
4A
1.26
A
Offi
ce b
uild
ing
(non
-med
ical
) 3
3 45
1A
41.1
A58
.8B
1.43
A
Med
ical
offi
ce b
uild
ing
5 0
43B
4.5
B4.
9B
1.09
A
Elem
enta
ry o
r se
cond
ary
scho
ol 4
970
A27
.0A
21.0
A0.
78A
Nur
sing
or r
esid
entia
l car
e fa
cilit
y 2
583
A4.
8A
11.1
B2.
32A
War
ehou
se 1
2 96
6B
16.1
A15
.3A
0.95
A
Hot
el o
r m
otel
–F
–F
–F
1.47
A
Hos
pita
l31
1A
2.9
A7.
3B
2.50
A
Food
or
beve
rage
sto
re 1
2 37
9A
7.7
A22
.0A
2.87
A
Non
-food
ret
ail s
tore
22
649
B32
.7B
36.7
C1.
12A
Oth
er**
64
146
A68
.1A
78.4
A1.
15A
Can
ada
Tota
l 4
82 2
66A
765.
9A
842.
2A
1.10
A
Offi
ce b
uild
ing
(non
-med
ical
) 8
3 58
3A
147.
5A
176.
6A
1.20
A
Med
ical
offi
ce b
uild
ing
10
525
A9.
6A
10.5
A1.
09A
Elem
enta
ry o
r se
cond
ary
scho
ol 1
8 42
5A
83.6
A64
.4A
0.77
A
Nur
sing
or r
esid
entia
l car
e fa
cilit
y 6
482
A25
.0B
39.1
B1.
56A
War
ehou
se 3
2 87
9A
83.0
A55
.0A
0.66
A
Hot
el o
r m
otel
9 9
63C
19.7
B26
.5C
1.35
A
Hos
pita
l75
2A
15.1
A36
.5A
2.42
A
Food
or
beve
rage
sto
re 4
0 40
3A
29.3
A82
.7A
2.82
A
Non
-food
ret
ail s
tore
56
750
A68
.9A
65.2
A0.
95A
Oth
er**
222
505
A28
4.3
A28
5.8
A1.
01A
Due
to
roun
ding
, num
bers
may
not
add
up
to t
he t
otal
sho
wn,
and
som
e nu
mbe
rs m
ay d
iffer
from
one
tab
le t
o th
e ne
xt.
Qua
lity
indi
cato
rs (
Q.I.)
cla
ssify
eac
h es
timat
e ac
cord
ing
to it
s qu
ality
as
follo
ws:
A–E
xcel
lent
, B–G
ood,
C–A
ccep
tabl
e, D
–Use
with
cau
tion,
F–To
o un
relia
ble
to b
e pu
blish
ed a
nd X
–sup
pres
sed
due
to c
onfid
entia
lity.
See
the
“How
to r
ead
thes
e ta
bles
” sec
tion.
* O
ther
incl
udes
all
othe
r C
anad
ian
clim
ate
zone
s no
t lis
ted.
** O
ther
incl
udes
all
othe
r co
mm
erci
al b
uild
ings
. See
App
endi
x C
for
mor
e de
tails
.
Tabl
e 2.
4 –
Build
ing
char
acte
ristic
s an
d en
ergy
use
by
clim
ate
zone
and
prim
ary
activ
ity (c
ontin
ued)
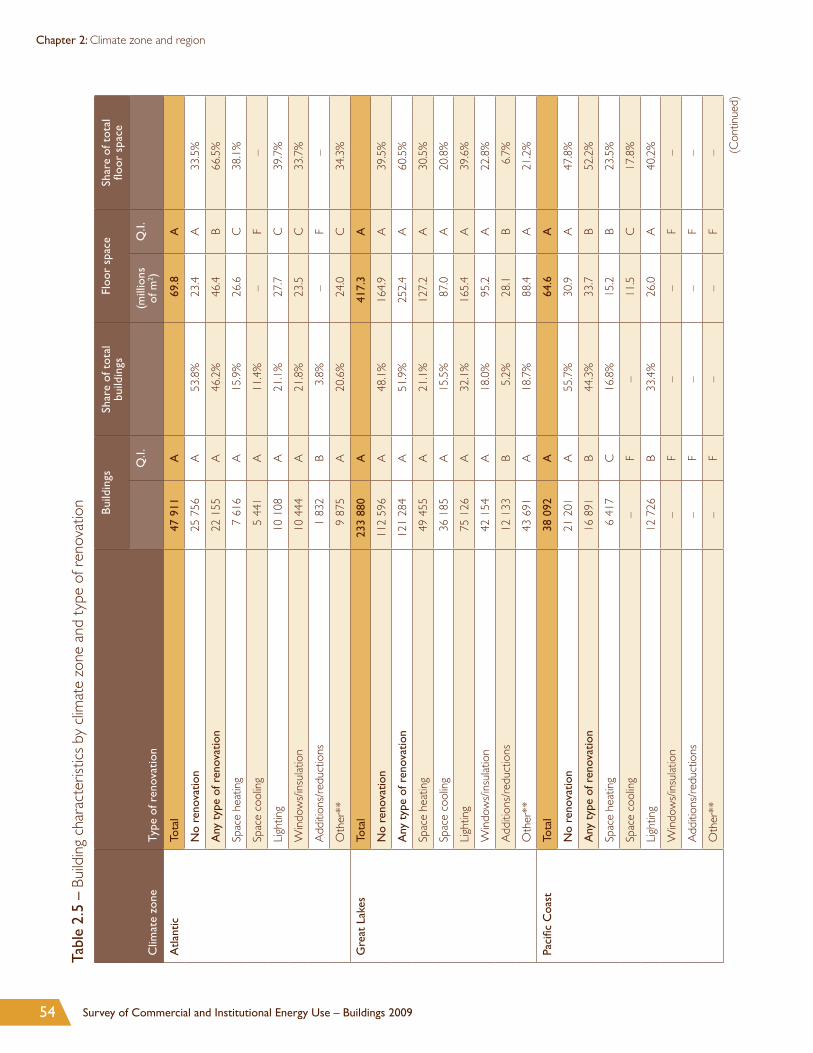
54 Survey of Commercial and Institutional Energy Use – Buildings 2009
Chapter 2: Climate zone and region
Tabl
e 2.
5 –
Build
ing
char
acte
ristic
s by
clim
ate
zone
and
typ
e of
ren
ovat
ion
Clim
ate
zone
Type
of r
enov
atio
n
Bui
ldin
gsSh
are
of t
otal
bu
ildin
gsFl
oor
spac
eSh
are
of t
otal
flo
or s
pace
Q.I.
(mill
ions
of
m2 )
Q.I.
Atla
ntic
Tota
l 4
7 91
1A
69.8
A
No
reno
vatio
n 2
5 75
6A
53.8
%23
.4A
33.5
%
Any
typ
e of
ren
ovat
ion
22
155
A46
.2%
46.4
B66
.5%
Spac
e he
atin
g 7
616
A15
.9%
26.6
C38
.1%
Spac
e co
olin
g 5
441
A11
.4%
–F
–
Ligh
ting
10
108
A21
.1%
27.7
C39
.7%
Win
dow
s/in
sula
tion
10
444
A21
.8%
23.5
C33
.7%
Add
ition
s/re
duct
ions
1 8
32B
3.8%
–F
–
Oth
er**
9 8
75A
20.6
%24
.0C
34.3
%
Gre
at L
akes
Tota
l 2
33 8
80A
417.
3A
No
reno
vatio
n 1
12 5
96A
48.1
%16
4.9
A39
.5%
Any
typ
e of
ren
ovat
ion
121
284
A51
.9%
252.
4A
60.5
%
Spac
e he
atin
g 4
9 45
5A
21.1
%12
7.2
A30
.5%
Spac
e co
olin
g 3
6 18
5A
15.5
%87
.0A
20.8
%
Ligh
ting
75
126
A32
.1%
165.
4A
39.6
%
Win
dow
s/in
sula
tion
42
154
A18
.0%
95.2
A22
.8%
Add
ition
s/re
duct
ions
12
133
B5.
2%28
.1B
6.7%
Oth
er**
43
691
A18
.7%
88.4
A21
.2%
Paci
fic C
oast
Tota
l 3
8 09
2A
64.6
A
No
reno
vatio
n 2
1 20
1A
55.7
%30
.9A
47.8
%
Any
typ
e of
ren
ovat
ion
16
891
B44
.3%
33.7
B52
.2%
Spac
e he
atin
g 6
417
C16
.8%
15.2
B23
.5%
Spac
e co
olin
g–
F–
11.5
C17
.8%
Ligh
ting
12
726
B33
.4%
26.0
A40
.2%
Win
dow
s/in
sula
tion
–F
––
F–
Add
ition
s/re
duct
ions
–F
––
F–
Oth
er**
–F
––
F– (C
ontin
ued)

55Detailed Statistical Report – December 2012
Chapter 2: Climate zone and region
Clim
ate
zone
Type
of r
enov
atio
n
Bui
ldin
gsSh
are
of t
otal
bu
ildin
gsFl
oor
spac
eSh
are
of t
otal
flo
or s
pace
Q.I.
(mill
ions
of
m2 )
Q.I.
Oth
er*
Tota
l 1
62 3
83A
214.
2A
No
reno
vatio
n 1
02 8
02A
63.3
%10
9.6
A51
.1%
Any
typ
e of
ren
ovat
ion
59
581
A36
.7%
104.
7A
48.9
%
Spac
e he
atin
g 2
0 89
7A
12.9
%42
.2A
19.7
%
Spac
e co
olin
g 1
4 93
1A
9.2%
36.2
A16
.9%
Ligh
ting
27
558
A17
.0%
63.5
A29
.6%
Win
dow
s/in
sula
tion
24
190
A14
.9%
37.8
A17
.6%
Add
ition
s/re
duct
ions
6 4
63B
4.0%
11.0
C5.
1%
Oth
er**
23
122
A14
.2%
39.6
A18
.5%
Can
ada
Tota
l 4
82 2
66A
765.
9A
No
reno
vatio
n 2
62 3
55A
54.4
%32
8.7
A42
.9%
Any
typ
e of
ren
ovat
ion
219
910
A45
.6%
437.
2A
57.1
%
Spac
e he
atin
g 8
4 38
5A
17.5
%21
1.2
A27
.6%
Spac
e co
olin
g 6
1 21
9A
12.7
%15
6.3
A20
.4%
Ligh
ting
125
518
A26
.0%
282.
6A
36.9
%
Win
dow
s/in
sula
tion
82
900
A17
.2%
167.
0A
21.8
%
Add
ition
s/re
duct
ions
22
226
A4.
6%58
.5A
7.6%
Oth
er**
81
576
A16
.9%
164.
5A
21.5
%
Due
to
roun
ding
, num
bers
may
not
add
up
to t
he t
otal
sho
wn,
and
som
e nu
mbe
rs m
ay d
iffer
from
one
tab
le t
o th
e ne
xt.
Qua
lity
indi
cato
rs (
Q.I.)
cla
ssify
eac
h es
timat
e ac
cord
ing
to it
s qu
ality
as
follo
ws:
A–E
xcel
lent
, B–G
ood,
C–A
ccep
tabl
e, D
–Use
with
cau
tion,
F–To
o un
relia
ble
to b
e pu
blish
ed a
nd X
–sup
pres
sed
due
to c
onfid
entia
lity.
See
the
“How
to r
ead
thes
e ta
bles
” sec
tion.
* O
ther
incl
udes
all
othe
r C
anad
ian
clim
ate
zone
s no
t lis
ted.
** O
ther
incl
udes
all
othe
r re
nova
tions
not
list
ed.
Tabl
e 2.
5 –
Build
ing
char
acte
ristic
s by
clim
ate
zone
and
typ
e of
ren
ovat
ion
(con
tinue
d)
Plea
se n
ote t
hat a
bui
ldin
g ca
n ha
ve m
ore t
han
one t
ype o
f ren
ovat
ion.
As s
uch,
the s
um o
f the
reno
vate
d bu
ildin
gs w
ill n
ot ad
d to
the t
otal
num
ber o
f bu
ildin
gs. Th
e abo
ve n
oted
reno
vatio
ns/re
trofit
s wer
e und
erta
ken
durin
g th
e yea
rs 20
05 to
200
9 (in
the l
ast fi
ve y
ears)
.

56 Survey of Commercial and Institutional Energy Use – Buildings 2009
Chapter 2: Climate zone and region
Tabl
e 2.
6 –
Build
ing
char
acte
ristic
s by
clim
ate
zone
and
ene
rgy
effic
ienc
y fe
atur
es
Clim
ate
zone
Ener
gy e
ffici
ency
feat
ure
Bui
ldin
gsSh
are
of t
otal
bu
ildin
gsFl
oor
spac
eSh
are
of t
otal
flo
or s
pace
Q.I.
(mill
ions
of
m2 )
Q.I.
Atla
ntic
Tota
l 4
7 91
1A
69.8
A
Any
ene
rgy
effic
ienc
y fe
atur
e 1
8 84
3A
39.3
%45
.9B
65.7
%
Ener
gy c
onse
rvat
ion
awar
enes
s pr
ogra
m 9
819
A20
.5%
29.4
C42
.1%
Ener
gy m
anag
emen
t co
ntro
l sys
tem
for
heat
ing,
vent
ilatin
g an
d co
olin
g (H
VAC
) 1
2 70
9A
26.5
%40
.9B
58.6
%
Ener
gy m
anag
emen
t co
ntro
l sys
tem
for
light
ing
5 7
34A
12.0
%–
F–
Gre
at L
akes
Tota
l 2
33 8
80A
417.
3A
Any
ene
rgy
effic
ienc
y fe
atur
e 1
11 7
19A
47.8
%29
5.3
A70
.8%
Ener
gy c
onse
rvat
ion
awar
enes
s pr
ogra
m 5
9 97
5A
25.6
%20
9.0
A50
.1%
Ener
gy m
anag
emen
t co
ntro
l sys
tem
for
heat
ing,
vent
ilatin
g an
d co
olin
g (H
VAC
) 8
0 38
0A
34.4
%23
8.3
A57
.1%
Ener
gy m
anag
emen
t co
ntro
l sys
tem
for
light
ing
43
123
A18
.4%
164.
8A
39.5
%
Paci
fic C
oast
Tota
l 3
8 09
2A
64.6
A
Any
ene
rgy
effic
ienc
y fe
atur
e 2
1 73
2A
57.1
%48
.2A
74.6
%
Ener
gy c
onse
rvat
ion
awar
enes
s pr
ogra
m 1
0 14
2B
26.6
%26
.9A
41.6
%
Ener
gy m
anag
emen
t co
ntro
l sys
tem
for
heat
ing,
vent
ilatin
g an
d co
olin
g (H
VAC
) 1
6 30
8B
42.8
%39
.8A
61.7
%
Ener
gy m
anag
emen
t co
ntro
l sys
tem
for
light
ing
9 6
17B
25.2
%25
.8A
39.9
%
Oth
er*
Tota
l 1
62 3
83A
214.
2A
Any
ene
rgy
effic
ienc
y fe
atur
e 6
3 69
3A
39.2
%12
9.8
A60
.6%
Ener
gy c
onse
rvat
ion
awar
enes
s pr
ogra
m 3
0 65
3B
18.9
%75
.4A
35.2
%
Ener
gy m
anag
emen
t co
ntro
l sys
tem
for
heat
ing,
vent
ilatin
g an
d co
olin
g (H
VAC
) 4
8 01
4A
29.6
%10
8.8
A50
.8%
Ener
gy m
anag
emen
t co
ntro
l sys
tem
for
light
ing
21
058
B13
.0%
53.7
A25
.1%
Can
ada
Tota
l 4
82 2
66A
765.
9A
Any
ene
rgy
effic
ienc
y fe
atur
e 2
15 9
87A
44.8
%51
9.2
A67
.8%
Ener
gy c
onse
rvat
ion
awar
enes
s pr
ogra
m 1
10 5
90A
22.9
%34
0.7
A44
.5%
Ener
gy m
anag
emen
t co
ntro
l sys
tem
for
heat
ing,
vent
ilatin
g an
d co
olin
g (H
VAC
) 1
57 4
10A
32.6
%42
7.8
A55
.9%
Ener
gy m
anag
emen
t co
ntro
l sys
tem
for
light
ing
79
533
A16
.5%
265.
7A
34.7
%
Not
e th
at a
bui
ldin
g m
ay h
ave
mor
e th
an o
ne e
nerg
y ef
ficie
ncy
feat
ure
Due
to
roun
ding
, num
bers
may
not
add
up
to t
he t
otal
sho
wn,
and
som
e nu
mbe
rs m
ay d
iffer
from
one
tab
le t
o th
e ne
xt.
Qua
lity
indi
cato
rs (
Q.I.)
cla
ssify
eac
h es
timat
e ac
cord
ing
to it
s qu
ality
as
follo
ws:
A–E
xcel
lent
, B–G
ood,
C–A
ccep
tabl
e, D
–Use
with
cau
tion,
F–T
oo u
nrel
iabl
e to
be
publ
ished
and
X–s
uppr
esse
d du
e to
co
nfide
ntia
lity.
See
the
“How
to
read
the
se t
able
s” s
ectio
n.
* O
ther
incl
udes
all
othe
r C
anad
ian
clim
ate
zone
s no
t lis
ted.
56

Title: Lorem ipsum
57
3RENOVATIONS
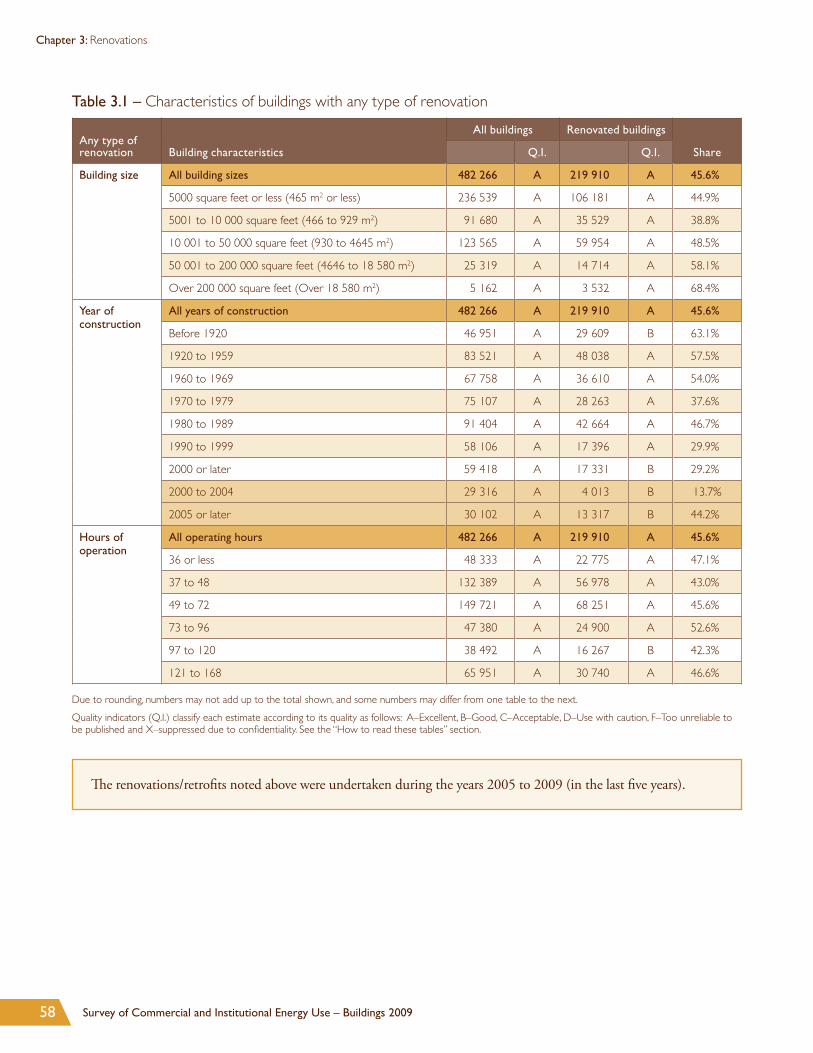
58 Survey of Commercial and Institutional Energy Use – Buildings 2009
Chapter 3: Renovations
Table 3.1 – Characteristics of buildings with any type of renovation
Any type of renovation Building characteristics
All buildings Renovated buildings
ShareQ.I. Q.I.
Building size All building sizes 482 266 A 219 910 A 45.6%
5000 square feet or less (465 m2 or less) 236 539 A 106 181 A 44.9%
5001 to 10 000 square feet (466 to 929 m2) 91 680 A 35 529 A 38.8%
10 001 to 50 000 square feet (930 to 4645 m2) 123 565 A 59 954 A 48.5%
50 001 to 200 000 square feet (4646 to 18 580 m2) 25 319 A 14 714 A 58.1%
Over 200 000 square feet (Over 18 580 m2) 5 162 A 3 532 A 68.4%
Year of construction
All years of construction 482 266 A 219 910 A 45.6%
Before 1920 46 951 A 29 609 B 63.1%
1920 to 1959 83 521 A 48 038 A 57.5%
1960 to 1969 67 758 A 36 610 A 54.0%
1970 to 1979 75 107 A 28 263 A 37.6%
1980 to 1989 91 404 A 42 664 A 46.7%
1990 to 1999 58 106 A 17 396 A 29.9%
2000 or later 59 418 A 17 331 B 29.2%
2000 to 2004 29 316 A 4 013 B 13.7%
2005 or later 30 102 A 13 317 B 44.2%
Hours of operation
All operating hours 482 266 A 219 910 A 45.6%
36 or less 48 333 A 22 775 A 47.1%
37 to 48 132 389 A 56 978 A 43.0%
49 to 72 149 721 A 68 251 A 45.6%
73 to 96 47 380 A 24 900 A 52.6%
97 to 120 38 492 A 16 267 B 42.3%
121 to 168 65 951 A 30 740 A 46.6%
Due to rounding, numbers may not add up to the total shown, and some numbers may differ from one table to the next.
Quality indicators (Q.I.) classify each estimate according to its quality as follows: A–Excellent, B–Good, C–Acceptable, D–Use with caution, F–Too unreliable to be published and X–suppressed due to confidentiality. See the “How to read these tables” section.
The renovations/retrofits noted above were undertaken during the years 2005 to 2009 (in the last five years).

59Detailed Statistical Report – December 2012
Chapter 3: Renovations
Table 3.2 – Characteristics of buildings with space heating renovations
Space heating Building characteristics
All buildings Renovated buildings
ShareQ.I. Q.I.
Building size All building sizes 482 266 A 84 385 A 17.5%
5000 square feet or less (465 m2 or less) 236 539 A 34 306 A 14.5%
5001 to 10 000 square feet (466 to 929 m2) 91 680 A 16 644 B 18.2%
10 001 to 50 000 square feet (930 to 4645 m2) 123 565 A 25 426 A 20.6%
50 001 to 200 000 square feet (4646 to 18 580 m2) 25 319 A 6 096 A 24.1%
Over 200 000 square feet (Over 18 580 m2) 5 162 A 1 912 B 37.0%
Year of construction
All years of construction 482 266 A 84 385 A 17.5%
Before 1920 46 951 A 11 811 C 25.2%
1920 to 1959 83 521 A 15 434 A 18.5%
1960 to 1969 67 758 A 14 270 A 21.1%
1970 to 1979 75 107 A 11 759 B 15.7%
1980 to 1989 91 404 A 15 808 B 17.3%
1990 to 1999 58 106 A 3 962 B 6.8%
2000 or later 59 418 A 11 341 B 19.1%
2000 to 2004 29 316 A – F –
2005 or later 30 102 A 10 373 C 34.5%
Hours of operation
All operating hours 482 266 A 84 385 A 17.5%
36 or less 48 333 A 6 986 B 14.5%
37 to 48 132 389 A 23 246 A 17.6%
49 to 72 149 721 A 29 418 A 19.6%
73 to 96 47 380 A 10 990 B 23.2%
97 to 120 38 492 A 6 856 C 17.8%
121 to 168 65 951 A 6 889 A 10.4%
Due to rounding, numbers may not add up to the total shown, and some numbers may differ from one table to the next.
Quality indicators (Q.I.) classify each estimate according to its quality as follows: A–Excellent, B–Good, C–Acceptable, D–Use with caution, F–Too unreliable to be published and X–suppressed due to confidentiality. See the “How to read these tables” section.
The renovations/retrofits noted above were undertaken during the years 2005 to 2009 (in the last five years).
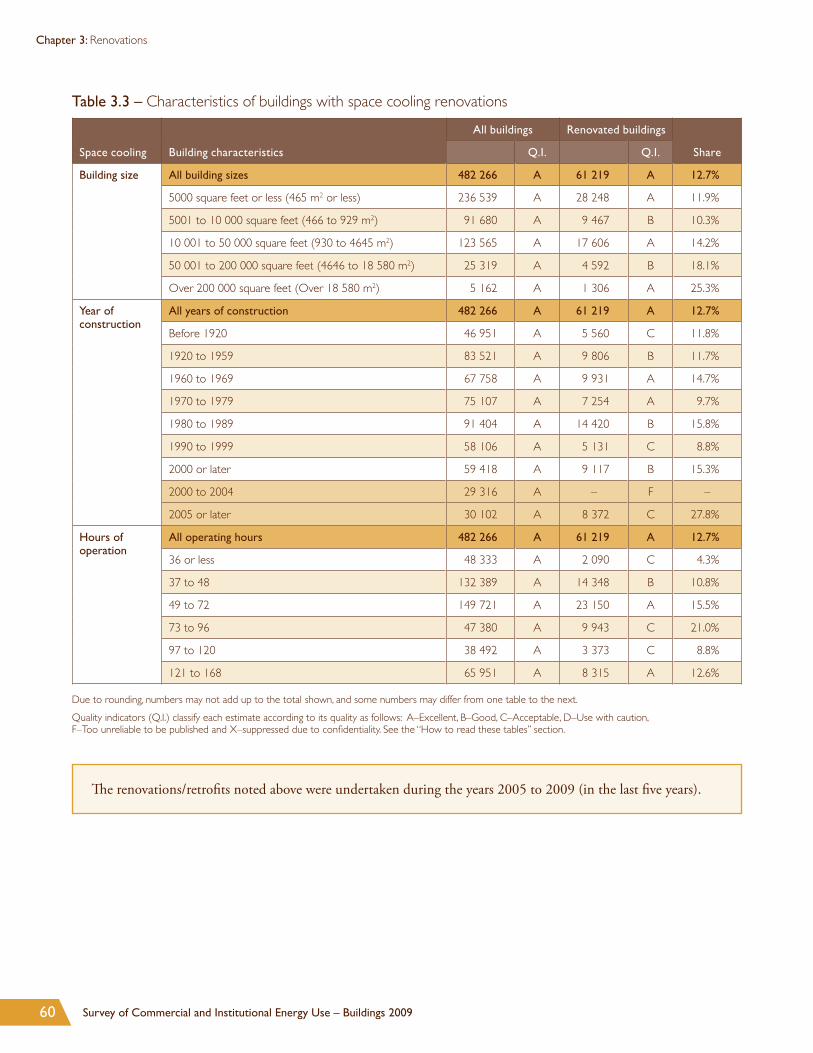
60 Survey of Commercial and Institutional Energy Use – Buildings 2009
Chapter 3: Renovations
Table 3.3 – Characteristics of buildings with space cooling renovations
Space cooling Building characteristics
All buildings Renovated buildings
ShareQ.I. Q.I.
Building size All building sizes 482 266 A 61 219 A 12.7%
5000 square feet or less (465 m2 or less) 236 539 A 28 248 A 11.9%
5001 to 10 000 square feet (466 to 929 m2) 91 680 A 9 467 B 10.3%
10 001 to 50 000 square feet (930 to 4645 m2) 123 565 A 17 606 A 14.2%
50 001 to 200 000 square feet (4646 to 18 580 m2) 25 319 A 4 592 B 18.1%
Over 200 000 square feet (Over 18 580 m2) 5 162 A 1 306 A 25.3%
Year of construction
All years of construction 482 266 A 61 219 A 12.7%
Before 1920 46 951 A 5 560 C 11.8%
1920 to 1959 83 521 A 9 806 B 11.7%
1960 to 1969 67 758 A 9 931 A 14.7%
1970 to 1979 75 107 A 7 254 A 9.7%
1980 to 1989 91 404 A 14 420 B 15.8%
1990 to 1999 58 106 A 5 131 C 8.8%
2000 or later 59 418 A 9 117 B 15.3%
2000 to 2004 29 316 A – F –
2005 or later 30 102 A 8 372 C 27.8%
Hours of operation
All operating hours 482 266 A 61 219 A 12.7%
36 or less 48 333 A 2 090 C 4.3%
37 to 48 132 389 A 14 348 B 10.8%
49 to 72 149 721 A 23 150 A 15.5%
73 to 96 47 380 A 9 943 C 21.0%
97 to 120 38 492 A 3 373 C 8.8%
121 to 168 65 951 A 8 315 A 12.6%
Due to rounding, numbers may not add up to the total shown, and some numbers may differ from one table to the next.
Quality indicators (Q.I.) classify each estimate according to its quality as follows: A–Excellent, B–Good, C–Acceptable, D–Use with caution, F–Too unreliable to be published and X–suppressed due to confidentiality. See the “How to read these tables” section.
The renovations/retrofits noted above were undertaken during the years 2005 to 2009 (in the last five years).
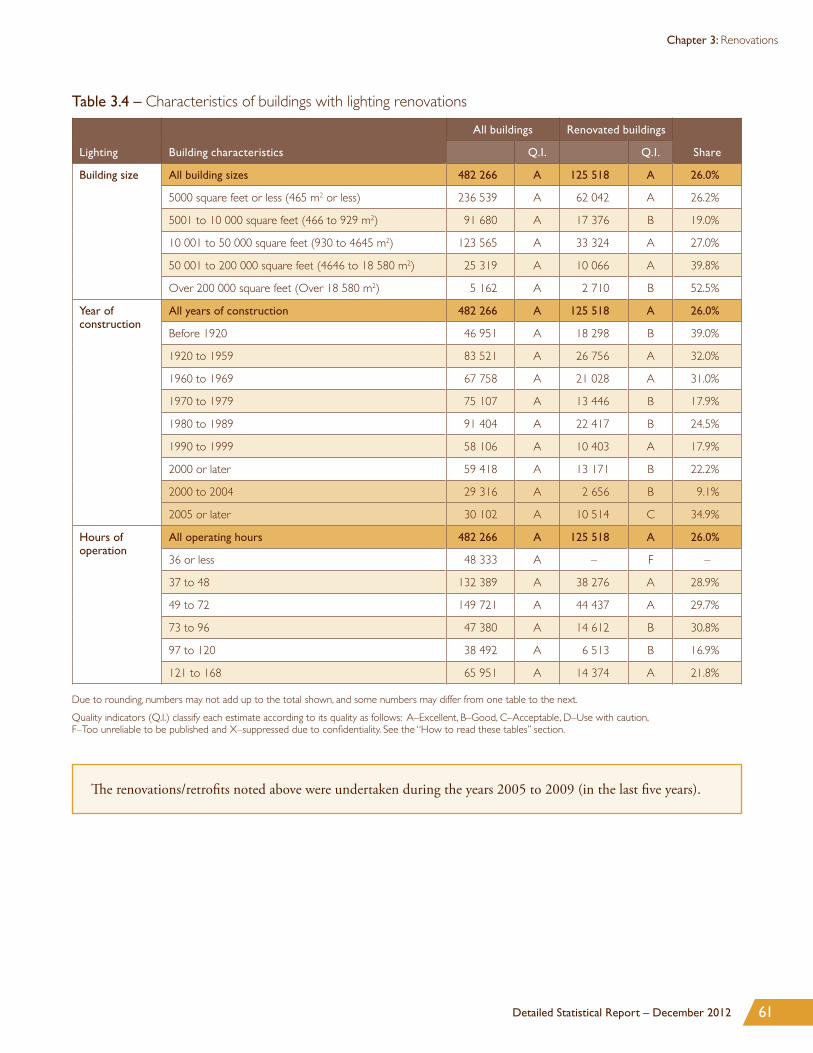
61Detailed Statistical Report – December 2012
Chapter 3: Renovations
Table 3.4 – Characteristics of buildings with lighting renovations
Lighting Building characteristics
All buildings Renovated buildings
ShareQ.I. Q.I.
Building size All building sizes 482 266 A 125 518 A 26.0%
5000 square feet or less (465 m2 or less) 236 539 A 62 042 A 26.2%
5001 to 10 000 square feet (466 to 929 m2) 91 680 A 17 376 B 19.0%
10 001 to 50 000 square feet (930 to 4645 m2) 123 565 A 33 324 A 27.0%
50 001 to 200 000 square feet (4646 to 18 580 m2) 25 319 A 10 066 A 39.8%
Over 200 000 square feet (Over 18 580 m2) 5 162 A 2 710 B 52.5%
Year of construction
All years of construction 482 266 A 125 518 A 26.0%
Before 1920 46 951 A 18 298 B 39.0%
1920 to 1959 83 521 A 26 756 A 32.0%
1960 to 1969 67 758 A 21 028 A 31.0%
1970 to 1979 75 107 A 13 446 B 17.9%
1980 to 1989 91 404 A 22 417 B 24.5%
1990 to 1999 58 106 A 10 403 A 17.9%
2000 or later 59 418 A 13 171 B 22.2%
2000 to 2004 29 316 A 2 656 B 9.1%
2005 or later 30 102 A 10 514 C 34.9%
Hours of operation
All operating hours 482 266 A 125 518 A 26.0%
36 or less 48 333 A – F –
37 to 48 132 389 A 38 276 A 28.9%
49 to 72 149 721 A 44 437 A 29.7%
73 to 96 47 380 A 14 612 B 30.8%
97 to 120 38 492 A 6 513 B 16.9%
121 to 168 65 951 A 14 374 A 21.8%
Due to rounding, numbers may not add up to the total shown, and some numbers may differ from one table to the next.
Quality indicators (Q.I.) classify each estimate according to its quality as follows: A–Excellent, B–Good, C–Acceptable, D–Use with caution, F–Too unreliable to be published and X–suppressed due to confidentiality. See the “How to read these tables” section.
The renovations/retrofits noted above were undertaken during the years 2005 to 2009 (in the last five years).

62 Survey of Commercial and Institutional Energy Use – Buildings 2009
Chapter 3: Renovations
Table 3.5 – Characteristics of buildings with windows/insulation renovations
Windows/insulation Building characteristics
All buildings Renovated buildings
ShareQ.I. Q.I.
Building size All building sizes 482 266 A 82 900 A 17.2%
5000 square feet or less (465 m2 or less) 236 539 A 37 285 A 15.8%
5001 to 10 000 square feet (466 to 929 m2) 91 680 A 12 339 C 13.5%
10 001 to 50 000 square feet (930 to 4645 m2) 123 565 A 26 247 A 21.2%
50 001 to 200 000 square feet (4646 to 18 580 m2) 25 319 A 5 682 B 22.4%
Over 200 000 square feet (Over 18 580 m2) 5 162 A 1 347 B 26.1%
Year of construction
All years of construction 482 266 A 82 900 A 17.2%
Before 1920 46 951 A 13 669 B 29.1%
1920 to 1959 83 521 A 22 950 A 27.5%
1960 to 1969 67 758 A 11 721 A 17.3%
1970 to 1979 75 107 A 9 041 A 12.0%
1980 to 1989 91 404 A 13 581 B 14.9%
1990 to 1999 58 106 A 2 445 B 4.2%
2000 or later 59 418 A 9 494 C 16.0%
2000 to 2004 29 316 A – F –
2005 or later 30 102 A 8 813 C 29.3%
Hours of operation
All operating hours 482 266 A 82 900 A 17.2%
36 or less 48 333 A 5 757 C 11.9%
37 to 48 132 389 A 24 488 A 18.5%
49 to 72 149 721 A 25 141 A 16.8%
73 to 96 47 380 A 8 724 B 18.4%
97 to 120 38 492 A 5 254 B 13.6%
121 to 168 65 951 A 13 536 B 20.5%
Due to rounding, numbers may not add up to the total shown, and some numbers may differ from one table to the next.
Quality indicators (Q.I.) classify each estimate according to its quality as follows: A–Excellent, B–Good, C–Acceptable, D–Use with caution, F–Too unreliable to be published and X–suppressed due to confidentiality. See the “How to read these tables” section.
The renovations/retrofits noted above were undertaken during the years 2005 to 2009 (in the last five years).
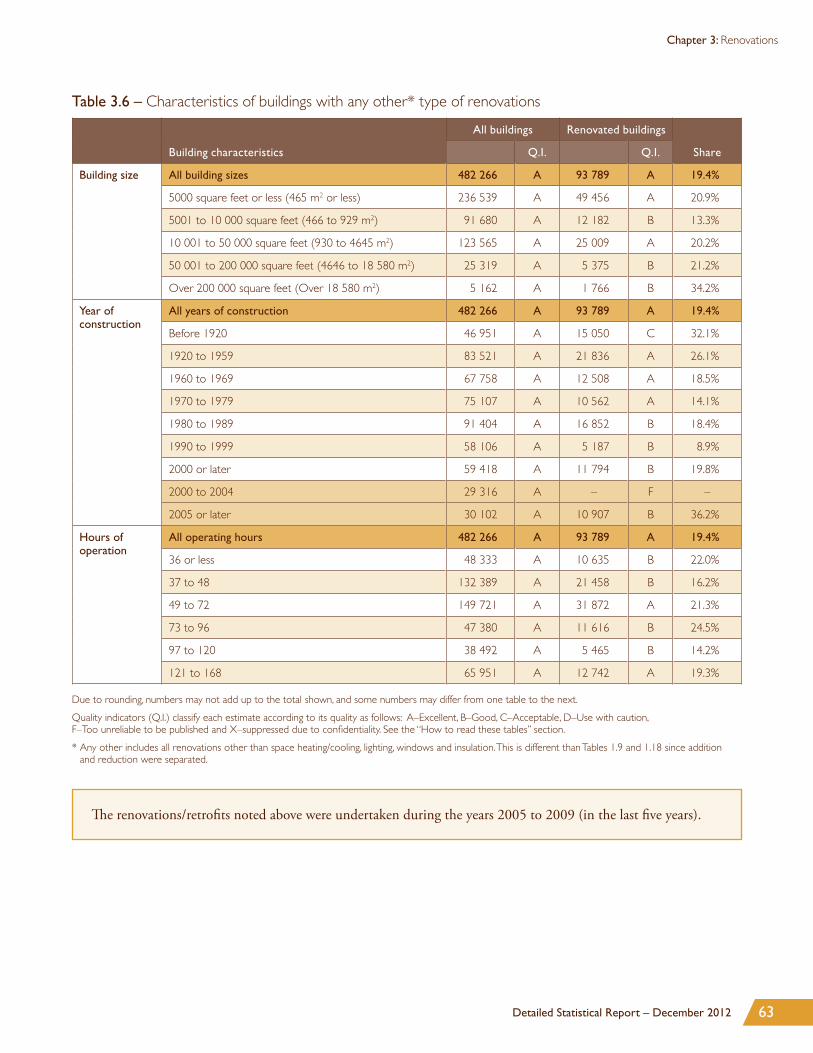
63Detailed Statistical Report – December 2012
Chapter 3: Renovations
Table 3.6 – Characteristics of buildings with any other* type of renovations
Building characteristics
All buildings Renovated buildings
ShareQ.I. Q.I.
Building size All building sizes 482 266 A 93 789 A 19.4%
5000 square feet or less (465 m2 or less) 236 539 A 49 456 A 20.9%
5001 to 10 000 square feet (466 to 929 m2) 91 680 A 12 182 B 13.3%
10 001 to 50 000 square feet (930 to 4645 m2) 123 565 A 25 009 A 20.2%
50 001 to 200 000 square feet (4646 to 18 580 m2) 25 319 A 5 375 B 21.2%
Over 200 000 square feet (Over 18 580 m2) 5 162 A 1 766 B 34.2%
Year of construction
All years of construction 482 266 A 93 789 A 19.4%
Before 1920 46 951 A 15 050 C 32.1%
1920 to 1959 83 521 A 21 836 A 26.1%
1960 to 1969 67 758 A 12 508 A 18.5%
1970 to 1979 75 107 A 10 562 A 14.1%
1980 to 1989 91 404 A 16 852 B 18.4%
1990 to 1999 58 106 A 5 187 B 8.9%
2000 or later 59 418 A 11 794 B 19.8%
2000 to 2004 29 316 A – F –
2005 or later 30 102 A 10 907 B 36.2%
Hours of operation
All operating hours 482 266 A 93 789 A 19.4%
36 or less 48 333 A 10 635 B 22.0%
37 to 48 132 389 A 21 458 B 16.2%
49 to 72 149 721 A 31 872 A 21.3%
73 to 96 47 380 A 11 616 B 24.5%
97 to 120 38 492 A 5 465 B 14.2%
121 to 168 65 951 A 12 742 A 19.3%
Due to rounding, numbers may not add up to the total shown, and some numbers may differ from one table to the next.
Quality indicators (Q.I.) classify each estimate according to its quality as follows: A–Excellent, B–Good, C–Acceptable, D–Use with caution, F–Too unreliable to be published and X–suppressed due to confidentiality. See the “How to read these tables” section.
* Any other includes all renovations other than space heating/cooling, lighting, windows and insulation. This is different than Tables 1.9 and 1.18 since addition and reduction were separated.
The renovations/retrofits noted above were undertaken during the years 2005 to 2009 (in the last five years).


Title: Lorem ipsum
65
4ENERGY USE

66 Survey of Commercial and Institutional Energy Use – Buildings 2009
Chapter 4: Energy use
Table 4.1 – Characteristics of buildings using electricity
Electricity use Building characteristics
All buildings Buildings that use electricity
ShareQ.I. Q.I.
Climate zone All climate zones 482 266 A 471 117 A 97.7%
Atlantic 47 911 A 46 404 A 96.9%
Great Lakes 233 880 A 229 605 A 98.2%
Pacific Coast 38 092 A 37 229 A 97.7%
Other* 162 383 A 157 879 A 97.2%
Primary activity All primary activities 482 266 A 471 117 A 97.7%
Office building (non-medical) 83 583 A 83 259 A 99.6%
Medical office building 10 525 A 10 524 A 100.0%
Elementary or secondary school 18 425 A 18 331 A 99.5%
Nursing or residential care facility 6 482 A 6 253 A 96.5%
Warehouse 32 879 A 30 494 A 92.7%
Hotel or motel 9 963 C 9 817 B 98.5%
Hospital 752 A 752 A 100.0%
Food or beverage store 40 403 A 40 403 A 100.0%
Non-food retail store 56 750 A 55 477 A 97.8%
Other** 222 505 A 215 807 A 97.0%
Building size All building sizes 482 266 A 471 117 A 97.7%
5000 square feet or less (465 m2 or less) 236 539 A 230 128 A 97.3%
5001 to 10 000 square feet (466 to 929 m2) 91 680 A 88 788 A 96.8%
10 001 to 50 000 square feet (930 to 4645 m2) 123 565 A 122 065 A 98.8%
50 001 to 200 000 square feet (4646 to 18 580 m2) 25 319 A 25 002 A 98.7%
Over 200 000 square feet (Over 18 580 m2) 5 162 A 5 134 A 99.5%
(Continued)

67Detailed Statistical Report – December 2012
Chapter 4: Energy use
Electricity use Building characteristics
All buildings Buildings that use electricity
ShareQ.I. Q.I.
Year of construction
All years of construction 482 266 A 471 117 A 97.7%
Before 1920 46 951 A 45 654 A 97.2%
1920 to 1959 83 521 A 82 099 A 98.3%
1960 to 1969 67 758 A 64 616 A 95.4%
1970 to 1979 75 107 A 74 292 A 98.9%
1980 to 1989 91 404 A 89 927 A 98.4%
1990 to 1999 58 106 A 57 942 A 99.7%
2000 or later 59 418 A 56 589 A 95.2%
2000 to 2004 29 316 A 26 685 A 91.0%
2005 or later 30 102 A 29 904 A 99.3%
Hours of operation
All operating hours 482 266 A 471 117 A 97.7%
36 or less 48 333 A 47 030 A 97.3%
37 to 48 132 389 A 127 923 A 96.6%
49 to 72 149 721 A 148 065 A 98.9%
73 to 96 47 380 A 46 091 A 97.3%
97 to 120 38 492 A 38 345 A 99.6%
121 to 168 65 951 A 63 664 A 96.5%
Due to rounding, numbers may not add up to the total shown, and some numbers may differ from one table to the next.
Quality indicators (Q.I.) classify each estimate according to its quality as follows: A–Excellent, B–Good, C–Acceptable, D–Use with caution, F–Too unreliable to be published and X–suppressed due to confidentiality. See the “How to read these tables” section.
* Other includes all other Canadian climate zones not listed.
** Other includes all other commercial buildings. See Appendix C for more details.
Table 4.1 – Characteristics of buildings using electricity (continued)

68 Survey of Commercial and Institutional Energy Use – Buildings 2009
Chapter 4: Energy use
Table 4.2 – Characteristics of buildings using natural gas
Natural gas use Building characteristics
All buildings Buildings that use natural gas
ShareQ.I. Q.I.
Climate zone All climate zones 482 266 A 305 665 A 63.4%
Atlantic 47 911 A 3 018 B 6.3%
Great Lakes 233 880 A 147 968 A 63.3%
Pacific Coast 38 092 A 26 149 A 68.6%
Other* 162 383 A 128 530 A 79.2%
Primary activity All primary activities 482 266 A 305 665 A 63.4%
Office building (non-medical) 83 583 A 56 981 A 68.2%
Medical office building 10 525 A 6 999 B 66.5%
Elementary or secondary school 18 425 A 13 585 A 73.7%
Nursing or residential care facility 6 482 A 4 548 A 70.2%
Warehouse 32 879 A 26 661 A 81.1%
Hotel or motel 9 963 C 4 102 A 41.2%
Hospital 752 A 558 A 74.2%
Food or beverage store 40 403 A 28 251 A 69.9%
Non-food retail store 56 750 A 32 022 A 56.4%
Other** 222 505 A 131 956 A 59.3%
Building size All building sizes 482 266 A 305 665 A 63.4%
5000 square feet or less (465 m2 or less) 236 539 A 132 689 A 56.1%
5001 to 10 000 square feet (466 to 929 m2) 91 680 A 52 081 A 56.8%
10 001 to 50 000 square feet (930 to 4645 m2) 123 565 A 97 261 A 78.7%
50 001 to 200 000 square feet (4646 to 18 580 m2) 25 319 A 19 748 A 78.0%
Over 200 000 square feet (Over 18 580 m2) 5 162 A 3 887 A 75.3%
(Continued)

69Detailed Statistical Report – December 2012
Chapter 4: Energy use
Natural gas use Building characteristics
All buildings Buildings that use natural gas
ShareQ.I. Q.I.
Year of construction
All years of construction 482 266 A 305 665 A 63.4%
Before 1920 46 951 A 28 970 A 61.7%
1920 to 1959 83 521 A 49 731 A 59.5%
1960 to 1969 67 758 A 47 855 A 70.6%
1970 to 1979 75 107 A 50 982 A 67.9%
1980 to 1989 91 404 A 55 140 A 60.3%
1990 to 1999 58 106 A 29 908 A 51.5%
2000 or later 59 418 A 43 079 A 72.5%
2000 to 2004 29 316 A 21 166 B 72.2%
2005 or later 30 102 A 21 914 B 72.8%
Hours of operation
All operating hours 482 266 A 305 665 A 63.4%
36 or less 48 333 A 26 320 A 54.5%
37 to 48 132 389 A 81 762 A 61.8%
49 to 72 149 721 A 101 320 A 67.7%
73 to 96 47 380 A 33 033 A 69.7%
97 to 120 38 492 A 28 287 A 73.5%
121 to 168 65 951 A 34 944 A 53.0%
Due to rounding, numbers may not add up to the total shown, and some numbers may differ from one table to the next.
Quality indicators (Q.I.) classify each estimate according to its quality as follows: A–Excellent, B–Good, C–Acceptable, D–Use with caution, F–Too unreliable to be published and X–suppressed due to confidentiality. See the “How to read these tables” section.
* Other includes all other Canadian climate zones not listed.
** Other includes all other commercial buildings. See Appendix C for more details.
Table 4.2 – Characteristics of buildings using natural gas (continued)

70 Survey of Commercial and Institutional Energy Use – Buildings 2009
Chapter 4: Energy use
Table 4.3 – Characteristics of buildings using distillates*
Distillates use Building characteristics
All buildings Buildings that use distillates
ShareQ.I. Q.I.
Climate zone All climate zones 482 266 A 62 846 A 13.0%
Atlantic 47 911 A 22 147 A 46.2%
Great Lakes 233 880 A 30 867 B 13.2%
Pacific Coast 38 092 A – F –
Other** 162 383 A 8 359 C 5.1%
Primary activity All primary activities 482 266 A 62 846 A 13.0%
Office building (non-medical) 83 583 A 7 581 B 9.1%
Medical office building 10 525 A – F –
Elementary or secondary school 18 425 A 2 515 A 13.6%
Nursing or residential care facility 6 482 A 980 A 15.1%
Warehouse 32 879 A 1 636 C 5.0%
Hotel or motel 9 963 C – F –
Hospital 752 A 324 A 43.1%
Food or beverage store 40 403 A 3 792 C 9.4%
Non-food retail store 56 750 A 8 197 C 14.4%
Other*** 222 505 A 36 693 B 16.5%
Building size All building sizes 482 266 A 62 846 A 13.0%
5000 square feet or less (465 m2 or less) 236 539 A 28 648 A 12.1%
5001 to 10 000 square feet (466 to 929 m2) 91 680 A 19 604 B 21.4%
10 001 to 50 000 square feet (930 to 4645 m2) 123 565 A 10 484 B 8.5%
50 001 to 200 000 square feet (4646 to 18 580 m2) 25 319 A 2 656 A 10.5%
Over 200 000 square feet (Over 18 580 m2) 5 162 A 1 454 B 28.2%
(Continued)
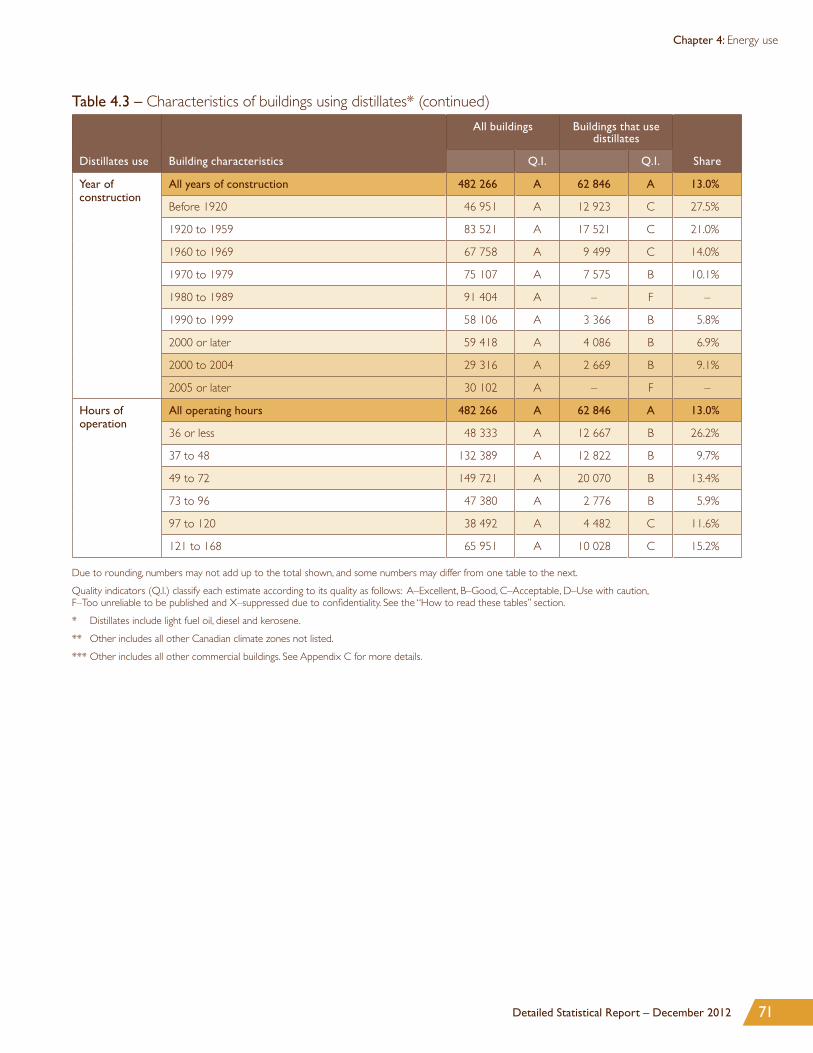
71Detailed Statistical Report – December 2012
Chapter 4: Energy use
Distillates use Building characteristics
All buildings Buildings that use distillates
ShareQ.I. Q.I.
Year of construction
All years of construction 482 266 A 62 846 A 13.0%
Before 1920 46 951 A 12 923 C 27.5%
1920 to 1959 83 521 A 17 521 C 21.0%
1960 to 1969 67 758 A 9 499 C 14.0%
1970 to 1979 75 107 A 7 575 B 10.1%
1980 to 1989 91 404 A – F –
1990 to 1999 58 106 A 3 366 B 5.8%
2000 or later 59 418 A 4 086 B 6.9%
2000 to 2004 29 316 A 2 669 B 9.1%
2005 or later 30 102 A – F –
Hours of operation
All operating hours 482 266 A 62 846 A 13.0%
36 or less 48 333 A 12 667 B 26.2%
37 to 48 132 389 A 12 822 B 9.7%
49 to 72 149 721 A 20 070 B 13.4%
73 to 96 47 380 A 2 776 B 5.9%
97 to 120 38 492 A 4 482 C 11.6%
121 to 168 65 951 A 10 028 C 15.2%
Due to rounding, numbers may not add up to the total shown, and some numbers may differ from one table to the next.
Quality indicators (Q.I.) classify each estimate according to its quality as follows: A–Excellent, B–Good, C–Acceptable, D–Use with caution, F–Too unreliable to be published and X–suppressed due to confidentiality. See the “How to read these tables” section.
* Distillates include light fuel oil, diesel and kerosene.
** Other includes all other Canadian climate zones not listed.
*** Other includes all other commercial buildings. See Appendix C for more details.
Table 4.3 – Characteristics of buildings using distillates* (continued)

72 Survey of Commercial and Institutional Energy Use – Buildings 2009
Chapter 4: Energy use
Table 4.4 – Characteristics of buildings using propane
Propane use Building characteristics
All buildings Buildings that use propane
ShareQ.I. Q.I.
Climate zone All climate zones 482 266 A 27 508 A 5.7%
Atlantic 47 911 A 5 977 A 12.5%
Great Lakes 233 880 A 11 796 C 5.0%
Pacific Coast 38 092 A – F –
Other* 162 383 A – F –
Primary activity All primary activities 482 266 A 27 508 A 5.7%
Office building (non-medical) 83 583 A – F –
Medical office building 10 525 A – F –
Elementary or secondary school 18 425 A – F –
Nursing or residential care facility 6 482 A 323 C 5.0%
Warehouse 32 879 A – F –
Hotel or motel 9 963 C – F –
Hospital 752 A 93 C 12.4%
Food or beverage store 40 403 A 4 281 B 10.6%
Non-food retail store 56 750 A – F –
Other** 222 505 A 14 526 B 6.5%
Building size All building sizes 482 266 A 27 508 A 5.7%
5000 square feet or less (465 m2 or less) 236 539 A 14 229 B 6.0%
5001 to 10 000 square feet (466 to 929 m2) 91 680 A 8 120 C 8.9%
10 001 to 50 000 square feet (930 to 4645 m2) 123 565 A – F –
50 001 to 200 000 square feet (4646 to 18 580 m2) 25 319 A 1 460 C 5.8%
Over 200 000 square feet (Over 18 580 m2) 5 162 A – F –
(Continued)

73Detailed Statistical Report – December 2012
Chapter 4: Energy use
Propane use Building characteristics
All buildings Buildings that use propane
ShareQ.I. Q.I.
Year of construction
All years of construction 482 266 A 27 508 A 5.7%
Before 1920 46 951 A – F –
1920 to 1959 83 521 A – F –
1960 to 1969 67 758 A – F –
1970 to 1979 75 107 A 3 420 B 4.6%
1980 to 1989 91 404 A 9 443 C 10.3%
1990 to 1999 58 106 A 4 379 C 7.5%
2000 or later 59 418 A 2 472 B 4.2%
2000 to 2004 29 316 A 1 262 C 4.3%
2005 or later 30 102 A 1 209 C 4.0%
Hours of operation
All operating hours 482 266 A 27 508 A 5.7%
36 or less 48 333 A – F –
37 to 48 132 389 A – F –
49 to 72 149 721 A 7 286 B 4.9%
73 to 96 47 380 A 3 369 C 7.1%
97 to 120 38 492 A – F –
121 to 168 65 951 A – F –
Due to rounding, numbers may not add up to the total shown, and some numbers may differ from one table to the next.
Quality indicators (Q.I.) classify each estimate according to its quality as follows: A–Excellent, B–Good, C–Acceptable, D–Use with caution, F–Too unreliable to be published and X–suppressed due to confidentiality. See the “How to read these tables” section.
* Other includes all other Canadian climate zones not listed.
** Other includes all other commercial buildings. See Appendix C for more details.
Table 4.4 – Characteristics of buildings using propane (continued)
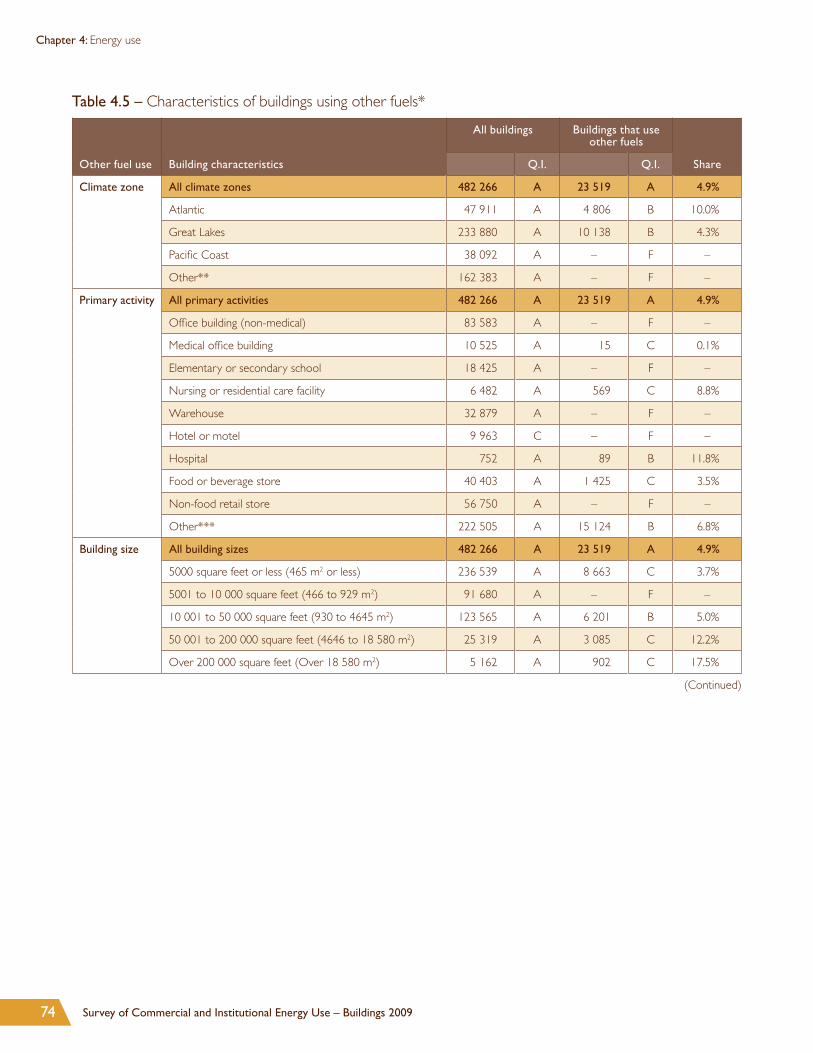
74 Survey of Commercial and Institutional Energy Use – Buildings 2009
Chapter 4: Energy use
Table 4.5 – Characteristics of buildings using other fuels*
Other fuel use Building characteristics
All buildings Buildings that use other fuels
ShareQ.I. Q.I.
Climate zone All climate zones 482 266 A 23 519 A 4.9%
Atlantic 47 911 A 4 806 B 10.0%
Great Lakes 233 880 A 10 138 B 4.3%
Pacific Coast 38 092 A – F –
Other** 162 383 A – F –
Primary activity All primary activities 482 266 A 23 519 A 4.9%
Office building (non-medical) 83 583 A – F –
Medical office building 10 525 A 15 C 0.1%
Elementary or secondary school 18 425 A – F –
Nursing or residential care facility 6 482 A 569 C 8.8%
Warehouse 32 879 A – F –
Hotel or motel 9 963 C – F –
Hospital 752 A 89 B 11.8%
Food or beverage store 40 403 A 1 425 C 3.5%
Non-food retail store 56 750 A – F –
Other*** 222 505 A 15 124 B 6.8%
Building size All building sizes 482 266 A 23 519 A 4.9%
5000 square feet or less (465 m2 or less) 236 539 A 8 663 C 3.7%
5001 to 10 000 square feet (466 to 929 m2) 91 680 A – F –
10 001 to 50 000 square feet (930 to 4645 m2) 123 565 A 6 201 B 5.0%
50 001 to 200 000 square feet (4646 to 18 580 m2) 25 319 A 3 085 C 12.2%
Over 200 000 square feet (Over 18 580 m2) 5 162 A 902 C 17.5%
(Continued)

75Detailed Statistical Report – December 2012
Chapter 4: Energy use
Other fuel use Building characteristics
All buildings Buildings that use other fuels
ShareQ.I. Q.I.
Year of construction
All years of construction 482 266 A 23 519 A 4.9%
Before 1920 46 951 A 4 154 C 8.8%
1920 to 1959 83 521 A 3 310 C 4.0%
1960 to 1969 67 758 A – F –
1970 to 1979 75 107 A 1 770 B 2.4%
1980 to 1989 91 404 A – F –
1990 to 1999 58 106 A 2 347 C 4.0%
2000 or later 59 418 A 2 563 B 4.3%
2000 to 2004 29 316 A 1 451 C 4.9%
2005 or later 30 102 A – F –
Hours of operation
All operating hours 482 266 A 23 519 A 4.9%
36 or less 48 333 A – F –
37 to 48 132 389 A 6 802 C 5.1%
49 to 72 149 721 A 6 042 B 4.0%
73 to 96 47 380 A 2 842 B 6.0%
97 to 120 38 492 A – F –
121 to 168 65 951 A – F –
Due to rounding, numbers may not add up to the total shown, and some numbers may differ from one table to the next.
Quality indicators (Q.I.) classify each estimate according to its quality as follows: A–Excellent, B–Good, C–Acceptable, D–Use with caution, F–Too unreliable to be published and X–suppressed due to confidentiality. See the “How to read these tables” section.
* Other Fuels include all other fuels other than electricity, natural gas, distillates and propane.
** Other includes all other Canadian climate zones not listed.
*** Other includes all other commercial buildings. See Appendix C for more details.
Table 4.5 – Characteristics of buildings using other fuels* (continued)

76 Survey of Commercial and Institutional Energy Use – Buildings 2009
Chapter 4: Energy use
Table 4.6 – Characteristics of buildings that primarily use electricity for space heating
Electricity use Building characteristics
All buildings Buildings that heat with electricity
ShareQ.I. Q.I.
Climate zone All climate zones 482 266 A 131 659 A 27.3%
Atlantic 47 911 A 22 785 A 47.6%
Great Lakes 233 880 A 60 011 A 25.7%
Pacific Coast 38 092 A 17 462 B 45.8%
Other* 162 383 A 31 401 A 19.3%
Primary activity All primary activities 482 266 A 131 659 A 27.3%
Office building (non-medical) 83 583 A 31 727 A 38.0%
Medical office building 10 525 A 4 054 A 38.5%
Elementary or secondary school 18 425 A 4 099 A 22.2%
Nursing or residential care facility 6 482 A 1 972 A 30.4%
Warehouse 32 879 A 4 703 A 14.3%
Hotel or motel 9 963 C – F –
Hospital 752 A 86 B 11.5%
Food or beverage store 40 403 A 14 916 A 36.9%
Non-food retail store 56 750 A 14 824 B 26.1%
Other** 222 505 A 49 422 A 22.2%
Building size All building sizes 482 266 A 131 659 A 27.3%
5000 square feet or less (465 m2 or less) 236 539 A 80 080 A 33.9%
5001 to 10 000 square feet (466 to 929 m2) 91 680 A 17 507 A 19.1%
10 001 to 50 000 square feet (930 to 4645 m2) 123 565 A 25 794 A 20.9%
50 001 to 200 000 square feet (4646 to 18 580 m2) 25 319 A 7 199 A 28.4%
Over 200 000 square feet (Over 18 580 m2) 5 162 A 1 080 C 20.9%
(Continued)
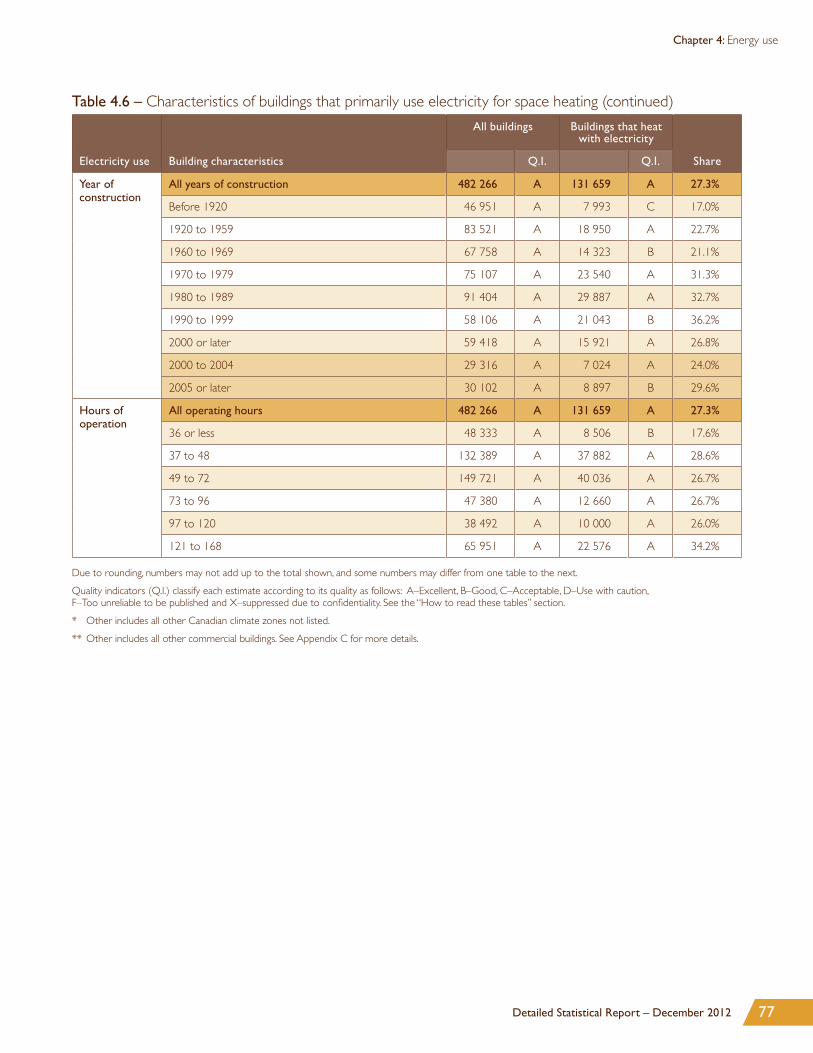
77Detailed Statistical Report – December 2012
Chapter 4: Energy use
Electricity use Building characteristics
All buildings Buildings that heat with electricity
ShareQ.I. Q.I.
Year of construction
All years of construction 482 266 A 131 659 A 27.3%
Before 1920 46 951 A 7 993 C 17.0%
1920 to 1959 83 521 A 18 950 A 22.7%
1960 to 1969 67 758 A 14 323 B 21.1%
1970 to 1979 75 107 A 23 540 A 31.3%
1980 to 1989 91 404 A 29 887 A 32.7%
1990 to 1999 58 106 A 21 043 B 36.2%
2000 or later 59 418 A 15 921 A 26.8%
2000 to 2004 29 316 A 7 024 A 24.0%
2005 or later 30 102 A 8 897 B 29.6%
Hours of operation
All operating hours 482 266 A 131 659 A 27.3%
36 or less 48 333 A 8 506 B 17.6%
37 to 48 132 389 A 37 882 A 28.6%
49 to 72 149 721 A 40 036 A 26.7%
73 to 96 47 380 A 12 660 A 26.7%
97 to 120 38 492 A 10 000 A 26.0%
121 to 168 65 951 A 22 576 A 34.2%
Due to rounding, numbers may not add up to the total shown, and some numbers may differ from one table to the next.
Quality indicators (Q.I.) classify each estimate according to its quality as follows: A–Excellent, B–Good, C–Acceptable, D–Use with caution, F–Too unreliable to be published and X–suppressed due to confidentiality. See the “How to read these tables” section.
* Other includes all other Canadian climate zones not listed.
** Other includes all other commercial buildings. See Appendix C for more details.
Table 4.6 – Characteristics of buildings that primarily use electricity for space heating (continued)

78 Survey of Commercial and Institutional Energy Use – Buildings 2009
Chapter 4: Energy use
Table 4.7 – Characteristics of buildings that primarily use natural gas for space heating
Natural gas use Building characteristics
All buildings Buildings that heat with natural gas
ShareQ.I. Q.I.
Climate zone All climate zones 482 266 A 260 550 A 54.0%
Atlantic 47 911 A 2 022 B 4.2%
Great Lakes 233 880 A 124 132 A 53.1%
Pacific Coast 38 092 A 17 320 A 45.5%
Other* 162 383 A 117 075 A 72.1%
Primary activity All primary activities 482 266 A 260 550 A 54.0%
Office building (non-medical) 83 583 A 46 804 A 56.0%
Medical office building 10 525 A 6 357 B 60.4%
Elementary or secondary school 18 425 A 11 866 A 64.4%
Nursing or residential care facility 6 482 A 3 959 A 61.1%
Warehouse 32 879 A 24 792 B 75.4%
Hotel or motel 9 963 C 2 548 B 25.6%
Hospital 752 A 504 A 67.1%
Food or beverage store 40 403 A 19 742 A 48.9%
Non-food retail store 56 750 A 29 724 A 52.4%
Other** 222 505 A 114 254 A 51.3%
Building size All building sizes 482 266 A 260 550 A 54.0%
5000 square feet or less (465 m2 or less) 236 539 A 112 984 A 47.8%
5001 to 10 000 square feet (466 to 929 m2) 91 680 A 46 345 A 50.6%
10 001 to 50 000 square feet (930 to 4645 m2) 123 565 A 83 319 A 67.4%
50 001 to 200 000 square feet (4646 to 18 580 m2) 25 319 A 14 768 A 58.3%
Over 200 000 square feet (Over 18 580 m2) 5 162 A 3 134 B 60.7%
(Continued)

79Detailed Statistical Report – December 2012
Chapter 4: Energy use
Natural gas use Building characteristics
All buildings Buildings that heat with natural gas
ShareQ.I. Q.I.
Year of construction
All years of construction 482 266 A 260 550 A 54.0%
Before 1920 46 951 A 24 871 B 53.0%
1920 to 1959 83 521 A 44 864 A 53.7%
1960 to 1969 67 758 A 40 674 A 60.0%
1970 to 1979 75 107 A 42 636 A 56.8%
1980 to 1989 91 404 A 46 766 A 51.2%
1990 to 1999 58 106 A 22 997 A 39.6%
2000 or later 59 418 A 37 743 A 63.5%
2000 to 2004 29 316 A 19 283 B 65.8%
2005 or later 30 102 A 18 460 B 61.3%
Hours of operation
All operating hours 482 266 A 260 550 A 54.0%
36 or less 48 333 A 24 393 A 50.5%
37 to 48 132 389 A 70 381 A 53.2%
49 to 72 149 721 A 87 491 A 58.4%
73 to 96 47 380 A 28 125 A 59.4%
97 to 120 38 492 A 23 837 A 61.9%
121 to 168 65 951 A 26 324 A 39.9%
Due to rounding, numbers may not add up to the total shown, and some numbers may differ from one table to the next.
Quality indicators (Q.I.) classify each estimate according to its quality as follows: A–Excellent, B–Good, C–Acceptable, D–Use with caution, F–Too unreliable to be published and X–suppressed due to confidentiality. See the “How to read these tables” section.
* Other includes all other Canadian climate zones not listed.
** Other includes all other commercial buildings. See Appendix C for more details.
Table 4.7 – Characteristics of buildings that primarily use natural gas for space heating (continued)

80 Survey of Commercial and Institutional Energy Use – Buildings 2009
Chapter 4: Energy use
Table 4.8 – Characteristics of buildings that primarily use distillates* for space heating
Distillates use Building characteristics
All buildings Buildings that heat with distillates
ShareQ.I. Q.I.
Climate zone All climate zones 482 266 A 49 903 A 10.3%
Atlantic 47 911 A 19 090 A 39.8%
Great Lakes 233 880 A 24 881 B 10.6%
Pacific Coast 38 092 A – F –
Other** 162 383 A 4 801 B 3.0%
Primary activity All primary activities 482 266 A 49 903 A 10.3%
Office building (non-medical) 83 583 A 4 253 B 5.1%
Medical office building 10 525 A – F –
Elementary or secondary school 18 425 A 2 188 A 11.9%
Nursing or residential care facility 6 482 A 512 C 7.9%
Warehouse 32 879 A – F –
Hotel or motel 9 963 C 155 C 1.6%
Hospital 752 A 118 B 15.8%
Food or beverage store 40 403 A – F –
Non-food retail store 56 750 A – F –
Other*** 222 505 A 30 317 B 13.6%
Building size All building sizes 482 266 A 49 903 A 10.3%
5000 square feet or less (465 m2 or less) 236 539 A 25 729 A 10.9%
5001 to 10 000 square feet (466 to 929 m2) 91 680 A 13 892 B 15.2%
10 001 to 50 000 square feet (930 to 4645 m2) 123 565 A 9 158 B 7.4%
50 001 to 200 000 square feet (4646 to 18 580 m2) 25 319 A 788 B 3.1%
Over 200 000 square feet (Over 18 580 m2) 5 162 A – F –
(Continued)

81Detailed Statistical Report – December 2012
Chapter 4: Energy use
Distillates use Building characteristics
All buildings Buildings that heat with distillates
ShareQ.I. Q.I.
Year of construction
All years of construction 482 266 A 49 903 A 10.3%
Before 1920 46 951 A 11 047 C 23.5%
1920 to 1959 83 521 A 14 707 C 17.6%
1960 to 1969 67 758 A 8 378 B 12.4%
1970 to 1979 75 107 A 5 825 B 7.8%
1980 to 1989 91 404 A – F –
1990 to 1999 58 106 A 2 329 C 4.0%
2000 or later 59 418 A 2 709 C 4.6%
2000 to 2004 29 316 A 1 550 C 5.3%
2005 or later 30 102 A – F –
Hours of operation
All operating hours 482 266 A 49 903 A 10.3%
36 or less 48 333 A 11 966 B 24.8%
37 to 48 132 389 A 11 159 A 8.4%
49 to 72 149 721 A 13 863 C 9.3%
73 to 96 47 380 A 2 276 C 4.8%
97 to 120 38 492 A – F –
121 to 168 65 951 A 7 457 C 11.3%
Due to rounding, numbers may not add up to the total shown, and some numbers may differ from one table to the next.
Quality indicators (Q.I.) classify each estimate according to its quality as follows: A–Excellent, B–Good, C–Acceptable, D–Use with caution, F–Too unreliable to be published and X–suppressed due to confidentiality. See the “How to read these tables” section.
* Distillates include light fuel oil, diesel and kerosene.
** Other includes all other Canadian climate zones not listed.
*** Other includes all other commercial buildings. See Appendix C for more details.
Table 4.8 – Characteristics of buildings that primarily use distillates* for space heating (continued)

82 Survey of Commercial and Institutional Energy Use – Buildings 2009
Chapter 4: Energy use
Table 4.9 – Characteristics of buildings that have no space cooling
No space cooling Building characteristics
All buildings Buildings with no space cooling
ShareQ.I. Q.I.
Climate zone All climate zones 482 266 A 150 583 A 31.2%
Atlantic 47 911 A 24 276 A 50.7%
Great Lakes 233 880 A 58 669 A 25.1%
Pacific Coast 38 092 A 15 914 B 41.8%
Other* 162 383 A 51 725 A 31.9%
Primary activity All primary activities 482 266 A 150 583 A 31.2%
Office building (non-medical) 83 583 A 9 509 B 11.4%
Medical office building 10 525 A – F –
Elementary or secondary school 18 425 A 6 681 A 36.3%
Nursing or residential care facility 6 482 A 1 520 A 23.5%
Warehouse 32 879 A 14 652 B 44.6%
Hotel or motel 9 963 C – F –
Hospital 752 A 10 C 1.3%
Food or beverage store 40 403 A 5 332 B 13.2%
Non-food retail store 56 750 A 12 213 C 21.5%
Other** 222 505 A 95 476 A 42.9%
Building size All building sizes 482 266 A 150 583 A 31.2%
5000 square feet or less (465 m2 or less) 236 539 A 91 592 A 38.7%
5001 to 10 000 square feet (466 to 929 m2) 91 680 A 27 427 B 29.9%
10 001 to 50 000 square feet (930 to 4645 m2) 123 565 A 27 675 A 22.4%
50 001 to 200 000 square feet (4646 to 18 580 m2) 25 319 A 3 449 B 13.6%
Over 200 000 square feet (Over 18 580 m2) 5 162 A 441 C 8.5%
(Continued)

83Detailed Statistical Report – December 2012
Chapter 4: Energy use
No space cooling Building characteristics
All buildings Buildings with no space cooling
ShareQ.I. Q.I.
Year of construction
All years of construction 482 266 A 150 583 A 31.2%
Before 1920 46 951 A 16 632 B 35.4%
1920 to 1959 83 521 A 30 640 A 36.7%
1960 to 1969 67 758 A 22 391 A 33.0%
1970 to 1979 75 107 A 27 014 A 36.0%
1980 to 1989 91 404 A 23 478 A 25.7%
1990 to 1999 58 106 A – F –
2000 or later 59 418 A 11 885 B 20.0%
2000 to 2004 29 316 A 6 925 B 23.6%
2005 or later 30 102 A – F –
Hours of operation
All operating hours 482 266 A 150 583 A 31.2%
36 or less 48 333 A 29 930 A 61.9%
37 to 48 132 389 A 48 027 A 36.3%
49 to 72 149 721 A 33 192 A 22.2%
73 to 96 47 380 A 6 816 A 14.4%
97 to 120 38 492 A 5 503 B 14.3%
121 to 168 65 951 A 27 116 B 41.1%
Due to rounding, numbers may not add up to the total shown, and some numbers may differ from one table to the next.
Quality indicators (Q.I.) classify each estimate according to its quality as follows: A–Excellent, B–Good, C–Acceptable, D–Use with caution, F–Too unreliable to be published and X–suppressed due to confidentiality. See the “How to read these tables” section.
* Other includes all other Canadian climate zones not listed.
** Other includes all other commercial buildings. See Appendix C for more details.
Table 4.9 – Characteristics of buildings that have no space cooling (continued)
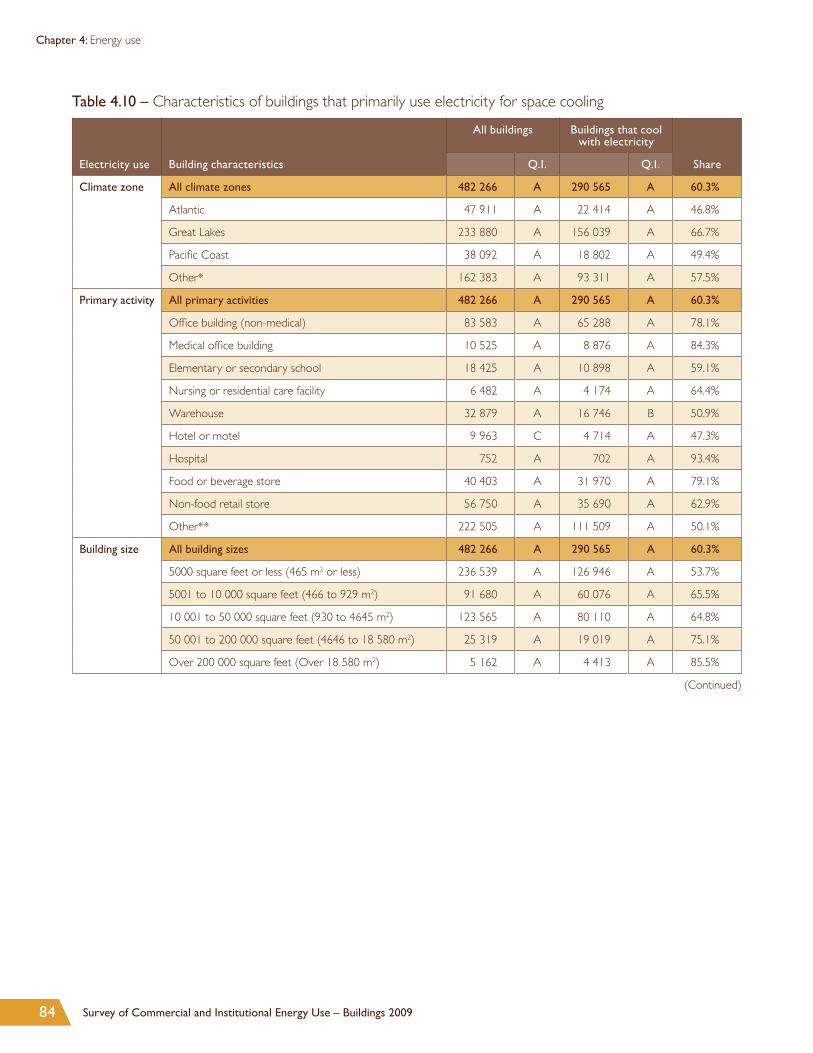
84 Survey of Commercial and Institutional Energy Use – Buildings 2009
Chapter 4: Energy use
Table 4.10 – Characteristics of buildings that primarily use electricity for space cooling
Electricity use Building characteristics
All buildings Buildings that cool with electricity
ShareQ.I. Q.I.
Climate zone All climate zones 482 266 A 290 565 A 60.3%
Atlantic 47 911 A 22 414 A 46.8%
Great Lakes 233 880 A 156 039 A 66.7%
Pacific Coast 38 092 A 18 802 A 49.4%
Other* 162 383 A 93 311 A 57.5%
Primary activity All primary activities 482 266 A 290 565 A 60.3%
Office building (non-medical) 83 583 A 65 288 A 78.1%
Medical office building 10 525 A 8 876 A 84.3%
Elementary or secondary school 18 425 A 10 898 A 59.1%
Nursing or residential care facility 6 482 A 4 174 A 64.4%
Warehouse 32 879 A 16 746 B 50.9%
Hotel or motel 9 963 C 4 714 A 47.3%
Hospital 752 A 702 A 93.4%
Food or beverage store 40 403 A 31 970 A 79.1%
Non-food retail store 56 750 A 35 690 A 62.9%
Other** 222 505 A 111 509 A 50.1%
Building size All building sizes 482 266 A 290 565 A 60.3%
5000 square feet or less (465 m2 or less) 236 539 A 126 946 A 53.7%
5001 to 10 000 square feet (466 to 929 m2) 91 680 A 60 076 A 65.5%
10 001 to 50 000 square feet (930 to 4645 m2) 123 565 A 80 110 A 64.8%
50 001 to 200 000 square feet (4646 to 18 580 m2) 25 319 A 19 019 A 75.1%
Over 200 000 square feet (Over 18 580 m2) 5 162 A 4 413 A 85.5%
(Continued)
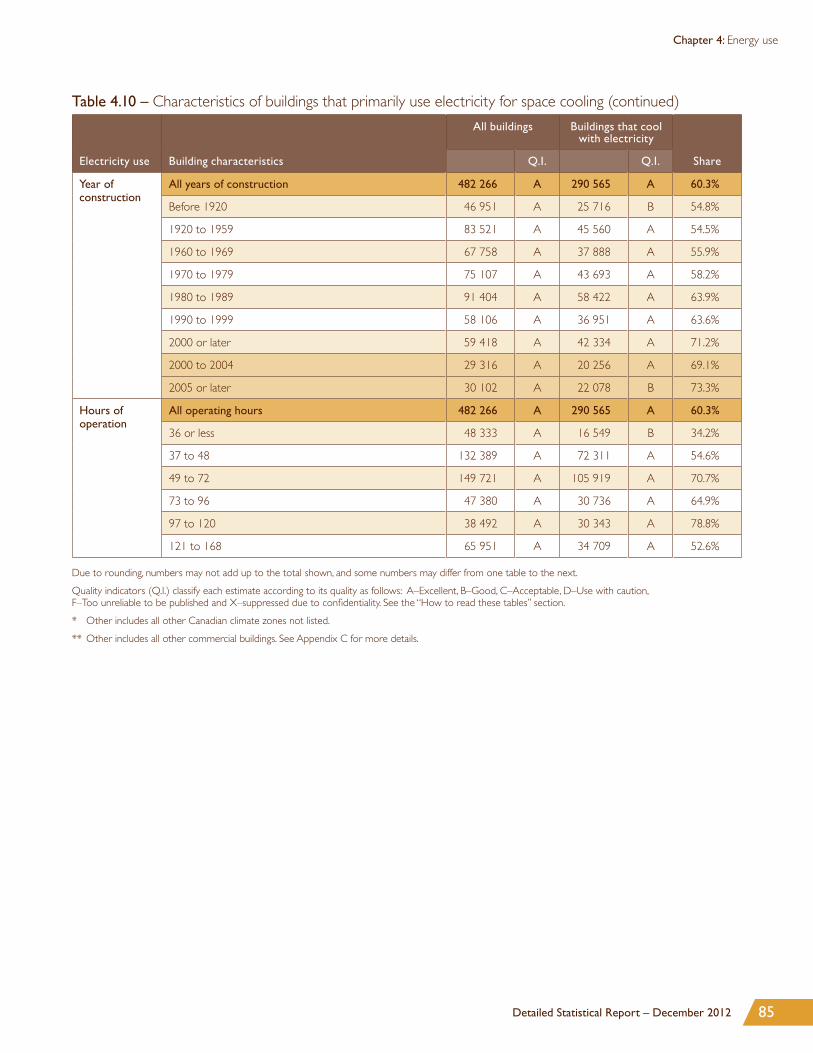
85Detailed Statistical Report – December 2012
Chapter 4: Energy use
Electricity use Building characteristics
All buildings Buildings that cool with electricity
ShareQ.I. Q.I.
Year of construction
All years of construction 482 266 A 290 565 A 60.3%
Before 1920 46 951 A 25 716 B 54.8%
1920 to 1959 83 521 A 45 560 A 54.5%
1960 to 1969 67 758 A 37 888 A 55.9%
1970 to 1979 75 107 A 43 693 A 58.2%
1980 to 1989 91 404 A 58 422 A 63.9%
1990 to 1999 58 106 A 36 951 A 63.6%
2000 or later 59 418 A 42 334 A 71.2%
2000 to 2004 29 316 A 20 256 A 69.1%
2005 or later 30 102 A 22 078 B 73.3%
Hours of operation
All operating hours 482 266 A 290 565 A 60.3%
36 or less 48 333 A 16 549 B 34.2%
37 to 48 132 389 A 72 311 A 54.6%
49 to 72 149 721 A 105 919 A 70.7%
73 to 96 47 380 A 30 736 A 64.9%
97 to 120 38 492 A 30 343 A 78.8%
121 to 168 65 951 A 34 709 A 52.6%
Due to rounding, numbers may not add up to the total shown, and some numbers may differ from one table to the next.
Quality indicators (Q.I.) classify each estimate according to its quality as follows: A–Excellent, B–Good, C–Acceptable, D–Use with caution, F–Too unreliable to be published and X–suppressed due to confidentiality. See the “How to read these tables” section.
* Other includes all other Canadian climate zones not listed.
** Other includes all other commercial buildings. See Appendix C for more details.
Table 4.10 – Characteristics of buildings that primarily use electricity for space cooling (continued)

86 Survey of Commercial and Institutional Energy Use – Buildings 2009
Chapter 4: Energy use
Table 4.11 – Characteristics of buildings that primarily use natural gas for space cooling
Natural gas use Building characteristics
All buildings Buildings that cool with natural gas
ShareQ.I. Q.I.
Climate zone All climate zones 482 266 A 35 089 A 7.3%
Atlantic 47 911 A – F –
Great Lakes 233 880 A 16 611 B 7.1%
Pacific Coast 38 092 A – F –
Other* 162 383 A 15 013 B 9.2%
Primary activity All primary activities 482 266 A 35 089 A 7.3%
Office building (non-medical) 83 583 A – F –
Medical office building 10 525 A – F –
Elementary or secondary school 18 425 A – F –
Nursing or residential care facility 6 482 A 627 C 9.7%
Warehouse 32 879 A – F –
Hotel or motel 9 963 C – F –
Hospital 752 A – F –
Food or beverage store 40 403 A – F –
Non-food retail store 56 750 A 8 555 C 15.1%
Other** 222 505 A 12 848 B 5.8%
Building size All building sizes 482 266 A 35 089 A 7.3%
5000 square feet or less (465 m2 or less) 236 539 A 14 472 C 6.1%
5001 to 10 000 square feet (466 to 929 m2) 91 680 A – F –
10 001 to 50 000 square feet (930 to 4645 m2) 123 565 A 14 896 B 12.1%
50 001 to 200 000 square feet (4646 to 18 580 m2) 25 319 A – F –
Over 200 000 square feet (Over 18 580 m2) 5 162 A – F –
(Continued)

87Detailed Statistical Report – December 2012
Chapter 4: Energy use
Natural gas use Building characteristics
All buildings Buildings that cool with natural gas
ShareQ.I. Q.I.
Year of construction
All years of construction 482 266 A 35 089 A 7.3%
Before 1920 46 951 A – F –
1920 to 1959 83 521 A – F –
1960 to 1969 67 758 A – F –
1970 to 1979 75 107 A 3 709 B 4.9%
1980 to 1989 91 404 A – F –
1990 to 1999 58 106 A – F –
2000 or later 59 418 A 4 595 C 7.7%
2000 to 2004 29 316 A – F –
2005 or later 30 102 A – F –
Hours of operation
All operating hours 482 266 A 35 089 A 7.3%
36 or less 48 333 A – F –
37 to 48 132 389 A 10 293 C 7.8%
49 to 72 149 721 A 9 820 C 6.6%
73 to 96 47 380 A – F –
97 to 120 38 492 A – F –
121 to 168 65 951 A 3 532 C 5.4%
Due to rounding, numbers may not add up to the total shown, and some numbers may differ from one table to the next.
Quality indicators (Q.I.) classify each estimate according to its quality as follows: A–Excellent, B–Good, C–Acceptable, D–Use with caution, ! and X–suppressed due to confidentiality. See the “How to read these tables” section.
* Other includes all other Canadian climate zones not listed.
** Other includes all other commercial buildings. See Appendix C for more details.
Table 4.11 – Characteristics of buildings that primarily use natural gas for space cooling (continued)

88 Survey of Commercial and Institutional Energy Use – Buildings 2009
Chapter 4: Energy use
Table 4.12 – Characteristics of buildings that have no water heating
No water heating Building characteristics
All buildings Buildings that have no water heating
ShareQ.I. Q.I.
Climate zone All climate zones 482 266 A 53 525 A 11.1%
Atlantic 47 911 A 4 491 B 9.4%
Great Lakes 233 880 A 28 574 B 12.2%
Pacific Coast 38 092 A 4 406 B 11.6%
Other* 162 383 A 16 053 B 9.9%
Primary activity All primary activities 482 266 A 53 525 A 11.1%
Office building (non-medical) 83 583 A 2 905 C 3.5%
Medical office building 10 525 A – F –
Elementary or secondary school 18 425 A 300 C 1.6%
Nursing or residential care facility 6 482 A X X X
Warehouse 32 879 A 9 606 C 29.2%
Hotel or motel 9 963 C – F –
Hospital 752 A X X X
Food or beverage store 40 403 A – F –
Non-food retail store 56 750 A – F –
Other** 222 505 A 35 022 A 15.7%
Building size All building sizes 482 266 A 53 525 A 11.1%
5000 square feet or less (465 m2 or less) 236 539 A 33 802 A 14.3%
5001 to 10 000 square feet (466 to 929 m2) 91 680 A – F –
10 001 to 50 000 square feet (930 to 4645 m2) 123 565 A 4 556 B 3.7%
50 001 to 200 000 square feet (4646 to 18 580 m2) 25 319 A – F –
Over 200 000 square feet (Over 18 580 m2) 5 162 A – F –
(Continued)

89Detailed Statistical Report – December 2012
Chapter 4: Energy use
No water heating Building characteristics
All buildings Buildings that have no water heating
ShareQ.I. Q.I.
Year of construction
All years of construction 482 266 A 53 525 A 11.1%
Before 1920 46 951 A 5 445 C 11.6%
1920 to 1959 83 521 A 7 807 C 9.3%
1960 to 1969 67 758 A – F –
1970 to 1979 75 107 A 7 175 B 9.6%
1980 to 1989 91 404 A 12 167 C 13.3%
1990 to 1999 58 106 A – F –
2000 or later 59 418 A 4 689 C 7.9%
2000 to 2004 29 316 A – F –
2005 or later 30 102 A – F –
Hours of operation
All operating hours 482 266 A 53 525 A 11.1%
36 or less 48 333 A 10 522 B 21.8%
37 to 48 132 389 A 21 423 B 16.2%
49 to 72 149 721 A 11 275 B 7.5%
73 to 96 47 380 A – F –
97 to 120 38 492 A 1 384 C 3.6%
121 to 168 65 951 A 7 093 C 10.8%
Due to rounding, numbers may not add up to the total shown, and some numbers may differ from one table to the next.
Quality indicators (Q.I.) classify each estimate according to its quality as follows: A–Excellent, B–Good, C–Acceptable, D–Use with caution, F–Too unreliable to be published and X–suppressed due to confidentiality. See the “How to read these tables” section.
* Other includes all other Canadian climate zones not listed.
** Other includes all other commercial buildings. See Appendix C for more details.
Table 4.12 – Characteristics of buildings that have no water heating (continued)

90 Survey of Commercial and Institutional Energy Use – Buildings 2009
Chapter 4: Energy use
Table 4.13 – Characteristics of buildings that primarily use electricity for water heating
Electricity use Building characteristics
All buildings Buildings that heat water with electricity
ShareQ.I. Q.I.
Climate zone All climate zones 482 266 A 222 932 A 46.2%
Atlantic 47 911 A 31 004 A 64.7%
Great Lakes 233 880 A 115 693 A 49.5%
Pacific Coast 38 092 A 18 417 B 48.3%
Other* 162 383 A 57 819 A 35.6%
Primary activity All primary activities 482 266 A 222 932 A 46.2%
Office building (non-medical) 83 583 A 46 194 A 55.3%
Medical office building 10 525 A 5 387 A 51.2%
Elementary or secondary school 18 425 A 8 556 A 46.4%
Nursing or residential care facility 6 482 A 1 968 A 30.4%
Warehouse 32 879 A 9 523 B 29.0%
Hotel or motel 9 963 C – F –
Hospital 752 A 104 B 13.8%
Food or beverage store 40 403 A 20 279 A 50.2%
Non-food retail store 56 750 A 30 842 A 54.3%
Other** 222 505 A 95 817 A 43.1%
Building size All building sizes 482 266 A 222 932 A 46.2%
5000 square feet or less (465 m2 or less) 236 539 A 119 328 A 50.4%
5001 to 10 000 square feet (466 to 929 m2) 91 680 A 43 241 A 47.2%
10 001 to 50 000 square feet (930 to 4645 m2) 123 565 A 51 109 A 41.4%
50 001 to 200 000 square feet (4646 to 18 580 m2) 25 319 A 7 844 A 31.0%
Over 200 000 square feet (Over 18 580 m2) 5 162 A 1 411 B 27.3%
(Continued)

91Detailed Statistical Report – December 2012
Chapter 4: Energy use
Electricity use Building characteristics
All buildings Buildings that heat water with electricity
ShareQ.I. Q.I.
Year of construction
All years of construction 482 266 A 222 932 A 46.2%
Before 1920 46 951 A 23 700 B 50.5%
1920 to 1959 83 521 A 40 800 A 48.8%
1960 to 1969 67 758 A 31 907 A 47.1%
1970 to 1979 75 107 A 32 384 A 43.1%
1980 to 1989 91 404 A 44 384 A 48.6%
1990 to 1999 58 106 A 25 610 B 44.1%
2000 or later 59 418 A 24 148 A 40.6%
2000 to 2004 29 316 A 10 753 A 36.7%
2005 or later 30 102 A 13 394 B 44.5%
Hours of operation
All operating hours 482 266 A 222 932 A 46.2%
36 or less 48 333 A 21 823 B 45.2%
37 to 48 132 389 A 55 485 A 41.9%
49 to 72 149 721 A 79 352 A 53.0%
73 to 96 47 380 A 21 535 A 45.5%
97 to 120 38 492 A 17 102 A 44.4%
121 to 168 65 951 A 27 635 A 41.9%
Due to rounding, numbers may not add up to the total shown, and some numbers may differ from one table to the next.
Quality indicators (Q.I.) classify each estimate according to its quality as follows: A–Excellent, B–Good, C–Acceptable, D–Use with caution, F–Too unreliable to be published and X–suppressed due to confidentiality. See the “How to read these tables” section.
* Other includes all other Canadian climate zones not listed.
** Other includes all other commercial buildings. See Appendix C for more details.
Table 4.13 – Characteristics of buildings that primarily use electricity for water heating (continued)

92 Survey of Commercial and Institutional Energy Use – Buildings 2009
Chapter 4: Energy use
Table 4.14 – Characteristics of buildings that primarily use natural gas for water heating
Natural gas use Building characteristics
All buildings Buildings that heat water with natural gas
ShareQ.I. Q.I.
Climate zone All climate zones 482 266 A 180 938 A 37.5%
Atlantic 47 911 A – F –
Great Lakes 233 880 A 81 716 A 34.9%
Pacific Coast 38 092 A 14 686 A 38.6%
Other* 162 383 A 83 729 A 51.6%
Primary activity All primary activities 482 266 A 180 938 A 37.5%
Office building (non-medical) 83 583 A 30 428 A 36.4%
Medical office building 10 525 A 4 397 C 41.8%
Elementary or secondary school 18 425 A 8 297 A 45.0%
Nursing or residential care facility 6 482 A 4 049 A 62.5%
Warehouse 32 879 A 13 224 B 40.2%
Hotel or motel 9 963 C 3 427 B 34.4%
Hospital 752 A 490 A 65.2%
Food or beverage store 40 403 A 16 808 A 41.6%
Non-food retail store 56 750 A 21 892 B 38.6%
Other** 222 505 A 77 926 A 35.0%
Building size All building sizes 482 266 A 180 938 A 37.5%
5000 square feet or less (465 m2 or less) 236 539 A 71 306 A 30.1%
5001 to 10 000 square feet (466 to 929 m2) 91 680 A 29 991 A 32.7%
10 001 to 50 000 square feet (930 to 4645 m2) 123 565 A 62 634 A 50.7%
50 001 to 200 000 square feet (4646 to 18 580 m2) 25 319 A 14 226 A 56.2%
Over 200 000 square feet (Over 18 580 m2) 5 162 A 2 782 B 53.9%
(Continued)

93Detailed Statistical Report – December 2012
Chapter 4: Energy use
Natural gas use Building characteristics
All buildings Buildings that heat water with natural gas
ShareQ.I. Q.I.
Year of construction
All years of construction 482 266 A 180 938 A 37.5%
Before 1920 46 951 A 13 419 B 28.6%
1920 to 1959 83 521 A 29 757 A 35.6%
1960 to 1969 67 758 A 26 199 A 38.7%
1970 to 1979 75 107 A 32 173 A 42.8%
1980 to 1989 91 404 A 32 167 A 35.2%
1990 to 1999 58 106 A 18 691 A 32.2%
2000 or later 59 418 A 28 533 A 48.0%
2000 to 2004 29 316 A 14 329 B 48.9%
2005 or later 30 102 A 14 204 B 47.2%
Hours of operation
All operating hours 482 266 A 180 938 A 37.5%
36 or less 48 333 A 13 811 A 28.6%
37 to 48 132 389 A 49 051 A 37.1%
49 to 72 149 721 A 53 921 A 36.0%
73 to 96 47 380 A 21 403 B 45.2%
97 to 120 38 492 A 17 518 B 45.5%
121 to 168 65 951 A 25 235 A 38.3%
Due to rounding, numbers may not add up to the total shown, and some numbers may differ from one table to the next.
Quality indicators (Q.I.) classify each estimate according to its quality as follows: A–Excellent, B–Good, C–Acceptable, D–Use with caution, F–Too unreliable to be published and X–suppressed due to confidentiality. See the “How to read these tables” section.
* Other includes all other Canadian climate zones not listed.
** Other includes all other commercial buildings. See Appendix C for more details.
Table 4.14 – Characteristics of buildings that primarily use natural gas for water heating (continued)

94 Survey of Commercial and Institutional Energy Use – Buildings 2009
Chapter 4: Energy use
Table 4.15 – Characteristics of buildings that primarily use distillates* for water heating
Distillates use Building characteristics
All buildings Buildings that heat water with distillates
ShareQ.I. Q.I.
Climate zone All climate zones 482 266 A 17 215 A 3.6%
Atlantic 47 911 A 9 126 A 19.0%
Great Lakes 233 880 A – F –
Pacific Coast 38 092 A – F –
Other** 162 383 A 2 530 C 1.6%
Primary activity All primary activities 482 266 A 17 215 A 3.6%
Office building (non-medical) 83 583 A 2 978 C 3.6%
Medical office building 10 525 A X X X
Elementary or secondary school 18 425 A 1 167 B 6.3%
Nursing or residential care facility 6 482 A 334 C 5.2%
Warehouse 32 879 A X X X
Hotel or motel 9 963 C 528 B 5.3%
Hospital 752 A 106 C 14.1%
Food or beverage store 40 403 A – F –
Non-food retail store 56 750 A – F –
Other*** 222 505 A 9 292 B 4.2%
Building size All building sizes 482 266 A 17 215 A 3.6%
5000 square feet or less (465 m2 or less) 236 539 A 8 956 B 3.8%
5001 to 10 000 square feet (466 to 929 m2) 91 680 A – F –
10 001 to 50 000 square feet (930 to 4645 m2) 123 565 A 3 434 C 2.8%
50 001 to 200 000 square feet (4646 to 18 580 m2) 25 319 A 632 C 2.5%
Over 200 000 square feet (Over 18 580 m2) 5 162 A – F –
(Continued)

95Detailed Statistical Report – December 2012
Chapter 4: Energy use
Distillates use Building characteristics
All buildings Buildings that heat water with distillates
ShareQ.I. Q.I.
Year of construction
All years of construction 482 266 A 17 215 A 3.6%
Before 1920 46 951 A – F –
1920 to 1959 83 521 A 3 036 A 3.6%
1960 to 1969 67 758 A – F –
1970 to 1979 75 107 A 2 254 B 3.0%
1980 to 1989 91 404 A 1 888 C 2.1%
1990 to 1999 58 106 A – F –
2000 or later 59 418 A 1 150 C 1.9%
2000 to 2004 29 316 A – F –
2005 or later 30 102 A – F –
Hours of operation
All operating hours 482 266 A 17 215 A 3.6%
36 or less 48 333 A – F –
37 to 48 132 389 A 4 323 B 3.3%
49 to 72 149 721 A – F –
73 to 96 47 380 A – F –
97 to 120 38 492 A – F –
121 to 168 65 951 A 3 772 B 5.7%
Due to rounding, numbers may not add up to the total shown, and some numbers may differ from one table to the next.
Quality indicators (Q.I.) classify each estimate according to its quality as follows: A–Excellent, B–Good, C–Acceptable, D–Use with caution, F–Too unreliable to be published and X–suppressed due to confidentiality. See the “How to read these tables” section.
* Distillates include light fuel oil, diesel and kerosene.
** Other includes all other Canadian climate zones not listed.
*** Other includes all other commercial buildings. See Appendix C for more details.
Table 4.15 – Characteristics of buildings that primarily use distillates* for water heating (continued)


Title: Lorem ipsum
97
5ENERGY EFFICIENCY FEATURES
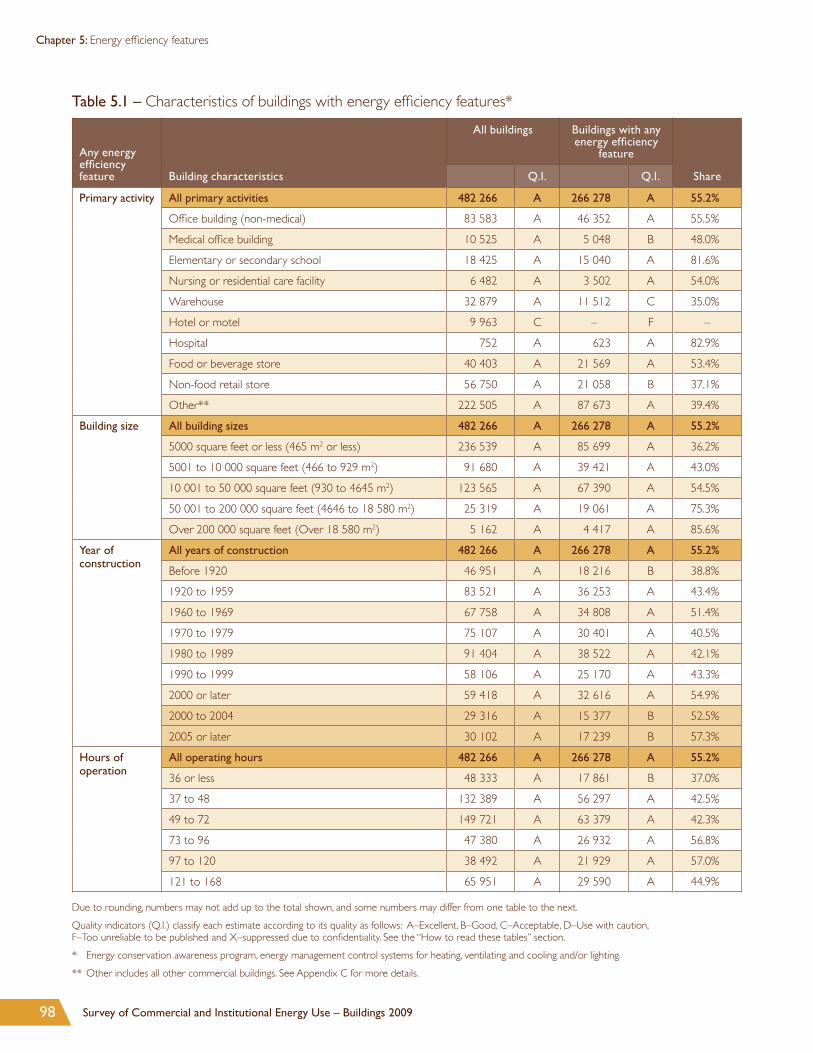
98 Survey of Commercial and Institutional Energy Use – Buildings 2009
Chapter 5: Energy efficiency features
Table 5.1 – Characteristics of buildings with energy efficiency features*
Any energy efficiency feature Building characteristics
All buildings Buildings with any energy efficiency
feature
ShareQ.I. Q.I.
Primary activity All primary activities 482 266 A 266 278 A 55.2%
Office building (non-medical) 83 583 A 46 352 A 55.5%
Medical office building 10 525 A 5 048 B 48.0%
Elementary or secondary school 18 425 A 15 040 A 81.6%
Nursing or residential care facility 6 482 A 3 502 A 54.0%
Warehouse 32 879 A 11 512 C 35.0%
Hotel or motel 9 963 C – F –
Hospital 752 A 623 A 82.9%
Food or beverage store 40 403 A 21 569 A 53.4%
Non-food retail store 56 750 A 21 058 B 37.1%
Other** 222 505 A 87 673 A 39.4%
Building size All building sizes 482 266 A 266 278 A 55.2%
5000 square feet or less (465 m2 or less) 236 539 A 85 699 A 36.2%
5001 to 10 000 square feet (466 to 929 m2) 91 680 A 39 421 A 43.0%
10 001 to 50 000 square feet (930 to 4645 m2) 123 565 A 67 390 A 54.5%
50 001 to 200 000 square feet (4646 to 18 580 m2) 25 319 A 19 061 A 75.3%
Over 200 000 square feet (Over 18 580 m2) 5 162 A 4 417 A 85.6%
Year of construction
All years of construction 482 266 A 266 278 A 55.2%
Before 1920 46 951 A 18 216 B 38.8%
1920 to 1959 83 521 A 36 253 A 43.4%
1960 to 1969 67 758 A 34 808 A 51.4%
1970 to 1979 75 107 A 30 401 A 40.5%
1980 to 1989 91 404 A 38 522 A 42.1%
1990 to 1999 58 106 A 25 170 A 43.3%
2000 or later 59 418 A 32 616 A 54.9%
2000 to 2004 29 316 A 15 377 B 52.5%
2005 or later 30 102 A 17 239 B 57.3%
Hours of operation
All operating hours 482 266 A 266 278 A 55.2%
36 or less 48 333 A 17 861 B 37.0%
37 to 48 132 389 A 56 297 A 42.5%
49 to 72 149 721 A 63 379 A 42.3%
73 to 96 47 380 A 26 932 A 56.8%
97 to 120 38 492 A 21 929 A 57.0%
121 to 168 65 951 A 29 590 A 44.9%
Due to rounding, numbers may not add up to the total shown, and some numbers may differ from one table to the next.
Quality indicators (Q.I.) classify each estimate according to its quality as follows: A–Excellent, B–Good, C–Acceptable, D–Use with caution, F–Too unreliable to be published and X–suppressed due to confidentiality. See the “How to read these tables” section.
* Energy conservation awareness program, energy management control systems for heating, ventilating and cooling and/or lighting.
** Other includes all other commercial buildings. See Appendix C for more details.

99Detailed Statistical Report – December 2012
Chapter 5: Energy efficiency features
Table 5.2 – Characteristics of buildings with energy conservation awareness programs
Energy conservation awareness program Building characteristics
All buildings Buildings with energy conservation
awareness programs
ShareQ.I. Q.I.
Primary activity All primary activities 482 266 A 110 590 A 22.9%
Office building (non-medical) 83 583 A 19 551 A 23.4%
Medical office building 10 525 A 2 001 C 19.0%
Elementary or secondary school 18 425 A 11 006 A 59.7%
Nursing or residential care facility 6 482 A 2 153 B 33.2%
Warehouse 32 879 A – F –
Hotel or motel 9 963 C – F –
Hospital 752 A 343 A 45.7%
Food or beverage store 40 403 A 11 536 B 28.6%
Non-food retail store 56 750 A – F –
Other* 222 505 A 52 002 A 23.4%
Building size All building sizes 482 266 A 110 590 A 22.9%
5000 square feet or less (465 m2 or less) 236 539 A 41 164 A 17.4%
5001 to 10 000 square feet (466 to 929 m2) 91 680 A 20 785 B 22.7%
10 001 to 50 000 square feet (930 to 4645 m2) 123 565 A 32 934 A 26.7%
50 001 to 200 000 square feet (4646 to 18 580 m2) 25 319 A 12 205 A 48.2%
Over 200 000 square feet (Over 18 580 m2) 5 162 A 3 501 A 67.8%
Year of construction
All years of construction 482 266 A 110 590 A 22.9%
Before 1920 46 951 A 8 924 B 19.0%
1920 to 1959 83 521 A 23 961 B 28.7%
1960 to 1969 67 758 A 16 658 A 24.6%
1970 to 1979 75 107 A 13 478 B 17.9%
1980 to 1989 91 404 A 16 702 B 18.3%
1990 to 1999 58 106 A 14 093 B 24.3%
2000 or later 59 418 A 16 774 B 28.2%
2000 to 2004 29 316 A 7 901 C 27.0%
2005 or later 30 102 A 8 873 C 29.5%
Hours of operation
All operating hours 482 266 A 110 590 A 22.9%
36 or less 48 333 A 11 504 B 23.8%
37 to 48 132 389 A 32 024 A 24.2%
49 to 72 149 721 A 25 251 A 16.9%
73 to 96 47 380 A 15 548 B 32.8%
97 to 120 38 492 A 9 402 B 24.4%
121 to 168 65 951 A 16 860 B 25.6%
Due to rounding, numbers may not add up to the total shown, and some numbers may differ from one table to the next.
Quality indicators (Q.I.) classify each estimate according to its quality as follows: A–Excellent, B–Good, C–Acceptable, D–Use with caution, F–Too unreliable to be published and X–suppressed due to confidentiality. See the “How to read these tables” section.
* Other includes all other commercial buildings. See Appendix C for more details.

100 Survey of Commercial and Institutional Energy Use – Buildings 2009
Chapter 5: Energy efficiency features
Table 5.3 – Characteristics of buildings with energy management control systems for HVAC
Energy management control system for heating, ventilating and air conditioning (HVAC) Building characteristics
All buildings Buildings with HVAC controls
ShareQ.I. Q.I.
Primary activity All primary activities 482 266 A 157 410 A 32.6%
Office building (non-medical) 83 583 A 37 598 A 45.0%
Medical office building 10 525 A 3 293 B 31.3%
Elementary or secondary school 18 425 A 13 388 A 72.7%
Nursing or residential care facility 6 482 A 2 144 A 33.1%
Warehouse 32 879 A 7 248 C 22.0%
Hotel or motel 9 963 C – F –
Hospital 752 A 559 A 74.4%
Food or beverage store 40 403 A 14 579 A 36.1%
Non-food retail store 56 750 A 19 249 B 33.9%
Other* 222 505 A 57 646 A 25.9%
Building size All building sizes 482 266 A 157 410 A 32.6%
5000 square feet or less (465 m2 or less) 236 539 A 59 501 A 25.2%
5001 to 10 000 square feet (466 to 929 m2) 91 680 A 24 797 A 27.0%
10 001 to 50 000 square feet (930 to 4645 m2) 123 565 A 52 996 A 42.9%
50 001 to 200 000 square feet (4646 to 18 580 m2) 25 319 A 16 433 A 64.9%
Over 200 000 square feet (Over 18 580 m2) 5 162 A 3 684 A 71.4%
Year of construction All years of construction 482 266 A 157 410 A 32.6%
Before 1920 46 951 A 13 281 B 28.3%
1920 to 1959 83 521 A 24 642 A 29.5%
1960 to 1969 67 758 A 28 479 A 42.0%
1970 to 1979 75 107 A 18 257 A 24.3%
1980 to 1989 91 404 A 23 794 A 26.0%
1990 to 1999 58 106 A 19 720 A 33.9%
2000 or later 59 418 A 29 237 A 49.2%
2000 to 2004 29 316 A 13 205 B 45.0%
2005 or later 30 102 A 16 032 B 53.3%
Hours of operation All operating hours 482 266 A 157 410 A 32.6%
36 or less 48 333 A 12 854 B 26.6%
37 to 48 132 389 A 35 980 A 27.2%
49 to 72 149 721 A 52 700 A 35.2%
73 to 96 47 380 A 22 176 B 46.8%
97 to 120 38 492 A 16 739 B 43.5%
121 to 168 65 951 A 16 962 A 25.7%
Due to rounding, numbers may not add up to the total shown, and some numbers may differ from one table to the next.
Quality indicators (Q.I.) classify each estimate according to its quality as follows: A–Excellent, B–Good, C–Acceptable, D–Use with caution, F–Too unreliable to be published and X–suppressed due to confidentiality. See the “How to read these tables” section.
* Other includes all other commercial buildings. See Appendix C for more details.
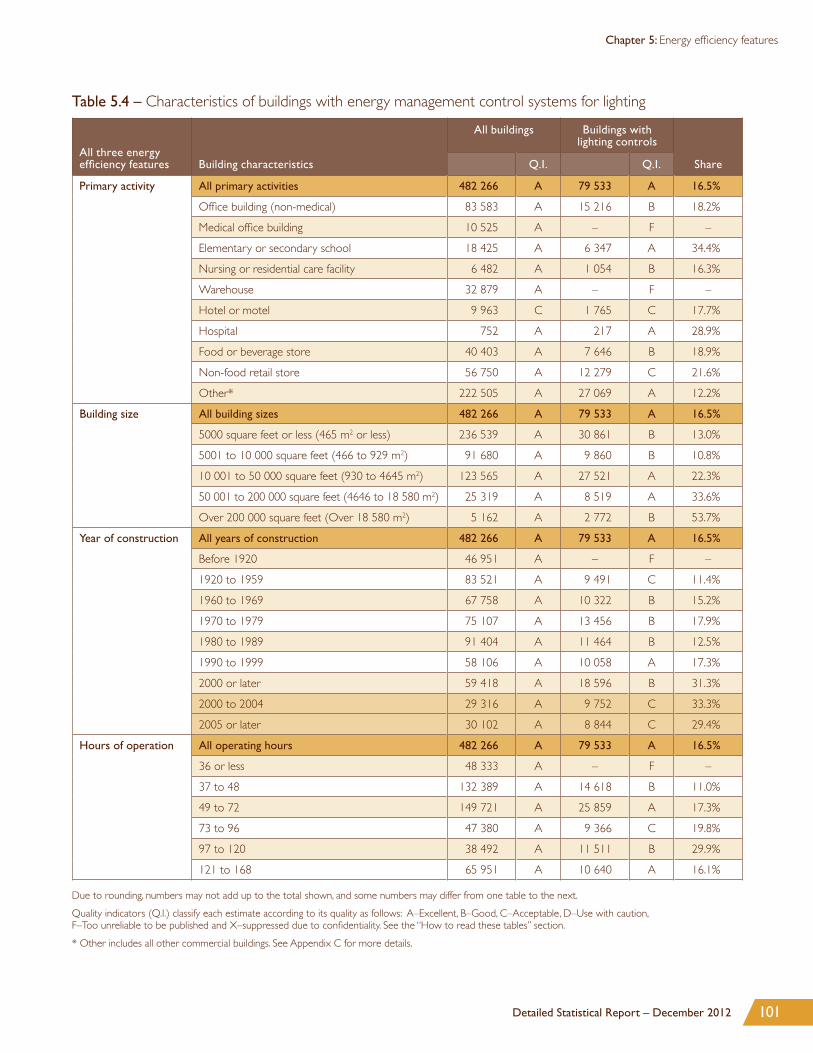
101Detailed Statistical Report – December 2012
Chapter 5: Energy efficiency features
Table 5.4 – Characteristics of buildings with energy management control systems for lighting
All three energy efficiency features Building characteristics
All buildings Buildings with lighting controls
ShareQ.I. Q.I.
Primary activity All primary activities 482 266 A 79 533 A 16.5%
Office building (non-medical) 83 583 A 15 216 B 18.2%
Medical office building 10 525 A – F –
Elementary or secondary school 18 425 A 6 347 A 34.4%
Nursing or residential care facility 6 482 A 1 054 B 16.3%
Warehouse 32 879 A – F –
Hotel or motel 9 963 C 1 765 C 17.7%
Hospital 752 A 217 A 28.9%
Food or beverage store 40 403 A 7 646 B 18.9%
Non-food retail store 56 750 A 12 279 C 21.6%
Other* 222 505 A 27 069 A 12.2%
Building size All building sizes 482 266 A 79 533 A 16.5%
5000 square feet or less (465 m2 or less) 236 539 A 30 861 B 13.0%
5001 to 10 000 square feet (466 to 929 m2) 91 680 A 9 860 B 10.8%
10 001 to 50 000 square feet (930 to 4645 m2) 123 565 A 27 521 A 22.3%
50 001 to 200 000 square feet (4646 to 18 580 m2) 25 319 A 8 519 A 33.6%
Over 200 000 square feet (Over 18 580 m2) 5 162 A 2 772 B 53.7%
Year of construction All years of construction 482 266 A 79 533 A 16.5%
Before 1920 46 951 A – F –
1920 to 1959 83 521 A 9 491 C 11.4%
1960 to 1969 67 758 A 10 322 B 15.2%
1970 to 1979 75 107 A 13 456 B 17.9%
1980 to 1989 91 404 A 11 464 B 12.5%
1990 to 1999 58 106 A 10 058 A 17.3%
2000 or later 59 418 A 18 596 B 31.3%
2000 to 2004 29 316 A 9 752 C 33.3%
2005 or later 30 102 A 8 844 C 29.4%
Hours of operation All operating hours 482 266 A 79 533 A 16.5%
36 or less 48 333 A – F –
37 to 48 132 389 A 14 618 B 11.0%
49 to 72 149 721 A 25 859 A 17.3%
73 to 96 47 380 A 9 366 C 19.8%
97 to 120 38 492 A 11 511 B 29.9%
121 to 168 65 951 A 10 640 A 16.1%
Due to rounding, numbers may not add up to the total shown, and some numbers may differ from one table to the next.
Quality indicators (Q.I.) classify each estimate according to its quality as follows: A–Excellent, B–Good, C–Acceptable, D–Use with caution, F–Too unreliable to be published and X–suppressed due to confidentiality. See the “How to read these tables” section.
* Other includes all other commercial buildings. See Appendix C for more details.


Title: Lorem ipsum
103
AAPPENDIX AMETHODOLOGY

104 Survey of Commercial and Institutional Energy Use – Buildings 2009
Appendix A: Methodology
IntroductionThe Survey on Commercial and Institutional Energy Use (SCIEU) was first conducted for reference year 2009. It amalgamated components of two previous surveys, the annual Commercial and Institutional Consumption of Energy Survey (CICES) and the Commercial and Industrial Building Energy Survey (CIBEUS).
The SCIEU was developed to meet the data needs of Natural Resources Canada (NRCan) and Environment Canada (EC) to support the following initiatives:
•monitoring energy consumption trends in the commercial and institutional (C&I) sector (NRCan)
•monitoring greenhouse gas trends in the C&I sector (EC)
• developing a model to allocate energy consumption and greenhouse gases at the building level and its final uses, such as heating, cooling and water heating (NRCan and EC)
•CICES had been conducted annually via mail-out/mail-back questionnaires to monitor energy consumption trends in the C&I sector at the establishment level
CIBEUS was carried out for the reference year 2000 and collected building-level information on energy use and building characteristics that affect energy consumption. CIBEUS was designed as a two-stage survey, where the first phase sampled enumeration areas, within which all C&I buildings were listed. In the second stage, a sample was selected from the listed buildings. Data for selected buildings were then collected by personal interview. The scope of this survey was limited to major cities.
For reference year 2009, information was required at both the establishment and building level. To collect this data, an integrated survey was designed that would collect data at both levels by using a co-ordinated approach for sampling and data collection.
Overview of the integrated surveyThe SCIEU integrated the building- and establishment-level components throughout the survey process. This was done primarily to take advantage of the direct relationships between establishments and buildings, which allowed us to realize both a cost savings and a reduction in response burden, avoiding having respondents receive and complete two similar questionnaires.
For approximately 50 percent of the establishments in the target population, the establishment and the building were equivalent entities because the establishment completely occupied one building but only one building. For the remaining establishments, the relationships were more complex because buildings could house multiple establishments and an establishment could occupy multiple buildings (either completely or partially).
It is also important to note that a list of C&I buildings in Canada that could serve as a survey frame was not available. Several administrative lists and databases available from private sector firms were considered. But none were of sufficient quality in all of the following aspects: complete coverage, reliable and documented updating procedures, and contact information for an appropriate respondent for this survey.
For this reason, a method that did not require a list frame was needed, such as area sampling or indirect sampling. Previous methods were not viable options because the target population had expanded to include rural areas, the timelines were compressed, and significant resources were already required for data collection. Consequently, an indirect sampling approach that extended from the sample of establishments was developed to obtain a representative sample of buildings.

105Detailed Statistical Report – December 2012
Appendix A: Methodology
Satisfaction by industry
Frame industry number Industry NAICS Population
1 Wholesale Trade 41 61 279
2 Postal Service (491), Couriers and Messengers (492), Warehousing and Storage (493) 49 5 260
3 Retail Trade 44 (except 445) and 45
106 354
4 Food and Beverage Industries 445 23 896
5 Information and Cultural Industries 51 13 369
6 Finance and Insurance, Real Estate and Rental Leasing; Professional, Scientific and Technical Services, Management of Companies and Enterprises, Administrative and Support, Waste Management and Remediation Services
52, 53, 54, 55 and 56
265 106
7 Ambulatory Health Care Services 621 64 083
8 Nursing and Residential Care Facilities 623 10 553
9 Social Assistance 624 17 627
10 Arts, Entertainment and Recreation 71 17 059
11 Accommodation Services 721 10 498
12 Food Services and Drinking Places 722 63 354
13 Transportation and Other Services (Except Public Administration) 48 and 81 (except 813110) 160 582
14 Public Administration 91 7 379
15 Colleges and CÉGEPs, Business Schools and Computer and Management Training, Technical and Trade Schools, Other Schools, Educational Support Services
6112, 6114, 6115, 6116, 6117 9 949
16 Universities 6113 198
17 Hospitals 6222 702
18 Primary and Secondary Schools 61113 16 222
19 Religious Organizations 813110 14 201
2 frame from the Health Statistics Division of Statistics Canada3 frame from Tourism and the Centre for Education Statistics of Statistics Canada

106 Survey of Commercial and Institutional Energy Use – Buildings 2009
Appendix A: Methodology
Stratification by region
Region Province Population
Atlantic New Brunswick, Nova Scotia, Prince Edward Island, Newfoundland and Labrador 59 509
Quebec Quebec 186 451
Ontario Ontario 315 327
Prairie Manitoba, Saskatchewan, Alberta 170 661
British Columbia British Columbia 135 723
Stratification by climate zone
Climate zone Description
AtlanticNew Brunswick, Nova Scotia, Prince Edward Island, Newfoundland and Labrador
Great Lakesa corridor in Ontario and Quebec that runs approximately from Windsor to Québec
Pacific Coastmostly western British Columbia and Vancouver Island
Otherprovincial areas not in the other three climate zones
Collection outcomes (establishments)
Total sample 7 141
Non-response to pre-contact 1 998
Non-response to personal interview 390
Out-of scope (pre-contact or personal interview) 936
Completed personal interview4 3 276
Unusable personal interview5 541
Building collection outcomes
Total sample 5 704
Non-response to pre-contact n/a
Non-response to personal interview 575
Out-of scope (pre-contact or personal interview) 177
Completed personal interview6 4 613
Unusable personal interview7 339
Comparisons with CICES 2008
SCIEU was not designed as a longitudinal survey that could be compared with previous surveys. At the request of NRCan, the SCIEU sample was selected to yield controlled overlap with the 2008 CICES sample of establishments. A target of 50 percent overlap was specified at the stratum level in the sampling program, and an overlap rate of 36 percent was achieved because of stratification constraints and a lack of identifiers to identify individual establishments in multiple years in several industries. This overlap was intended to evaluate the impact of changing collection modes from 2008.
The response level was low in both the 2008 CICES and the 2009 SCIEU surveys. Consequently, the number of responding units in common was low and insufficient for accurate year-to-year comparisons. Several methodological changes were introduced for the 2009 survey, including those summarized. The changes affect comparability of the results with previous surveys. The changes make it difficult to draw conclusions on real changes in the population of establishments by using comparisons of SCIEU 2009 establishment-based estimates and CICES 2008 establishment-based estimates.
4 includes responses derived from worksheets without a personal interview 5 includes responses with severe edit failures, as well as those that did not authorize Statistics Canada to share their data with Natural Resources Canada6 includes responses derived from worksheets without a personal interview 7 includes records with severe edit failures, as well as those that did not authorize Statistics Canada to share their data with Natural Resources Canada

107Detailed Statistical Report – December 2012
Appendix A: Methodology
Factors that affect comparability
• changes to the definition of the target population – The target population for SCIEU included three industries that were not previously surveyed: NAICS codes 48, 55 and 56.
• changes to the establishment survey population – To consolidate the frame to minimize the number of independent sources, the Business Register was used in place of custom lists for universities and colleges.
• change in the collection mode on the quality of response – To improve the quality of the reported data and increase the response rate, the data collection process was altered for the current survey. In the 2008 CICES survey, after a telephone pre-contact, the questionnaire data were collected by mail-out/mail-back paper questionnaires. In 2009, the telephone pre-contact confirmed or updated address, contact person and industry information but the survey data were collected by computer-assisted personal interview, after worksheets were mailed to the respondent prior to the interview to help with completing the SCIEU questionnaire.
• increase of response rate – The increased response rate reduced the risk of non-response bias compared with previous CICES surveys. As well, the increased response rate may have yielded a different profile for the responding units that could have led to differences in the estimates.
• change to the collection instrument – Some questions were rephrased. As well, in 2009, for quantitative questions, if the respondent could not provide an exact value, a choice of ranges was provided to choose from.
• increased focus on defining the coverage of each questionnaire for the respondents – Increased efforts were made to ensure that the respondent was answering for the correct amount of physical space (i.e. report for the entire chain or only one address) because a roster of buildings was available, and there was more opportunity for contact with each respondent.
Comparisons with CIBEUS 2000
Estimates from the building component of SCIEU 2009 should be used only for comparison. Because of the significant methodological changes, the estimates should not be used together with estimates from CIBEUS 2000 to estimate trends. The following is a summary of the methodological changes:
• changes to the target population – The CIBEUS 2000 was limited to buildings in the largest 24 cities in Canada and included only buildings larger than 1000 square feet and had a minimum of one employee working in the building. The SCIEU 2009 target population included the entire country (with the exception of the territories) and did not exclude buildings based on size or the number of employees working in the building.
• changes to the survey design – The indirect sampling of buildings used for SCIEU 2009 and the two-stage approach used in CIBEUS 2000 both lead to valid population-level estimates. However, the independent nature of each sample design does not allow efficient estimates for comparison from year to year.
• changes to the survey population – The group of buildings enumerated by listing may not be equivalent to the group of buildings identified by respondents from the establishments. As well, the definition of a building was provided to interviewers but in some cases may have been interpreted differently by respondents than it would have been by a Statistics Canada employee conducting a listing exercise.
• changes to the collection instrument – The SCIEU 2009 questionnaire used different wording and concepts than those used in CIBEUS 2000. As well, the use of a worksheet and example via show cards in the SCIEU 2009 may have had an effect on the values provided by respondents.
• changes to the collection mode – The SCIEU 2009 used a computer-assisted personal interview (CAPI) whereas the CIBEUS 2000 used a pencil-and-paper personal interview. This difference could impact the reported values because more editing was possible during data collection with a CAPI.
Survey of Commercial and Institutional Energy Use – Buildings 2009
Appendix A: Methodology
108
• subject-matter edits – The subject-matter edits that were applied after data collection were different for each survey.
• data processing – The parameters of the nearest-neighbour imputation were not the same for the two surveys. As well, the factors used to convert dollar values to energy quantities were not the same.
Comparisons of the SCIEU 2009 establishment and building components
The comparisons that can be made between the estimates from the establishment and building components are somewhat limited. This is mainly due to a lack of common variables between the two components. In some cases where variables appear to be comparable, there are conceptual differences in their definitions. For example, the SCIEU definition of building floor space included basements while establishment floor space did not.
In addition, the target population for the two components did not correspond to exactly the same C&I space. For example, there were cases where areas were in-scope for the building components and out-of-scope for the establishment components of the survey. Furthermore, although the samples of buildings and establishments were based on the same initial sample, non-response was independent between the two components, and the ultimate set of respondents did not necessarily correspond to the same spaces. For example, an establishment may not know what the energy source is for heating, but the building manager will.
The estimated counts of in-scope units were not expected to be the same because the relationships between buildings and establishments were complex. No external information was available to provide an estimate of the relationship between the aggregated counts. Therefore, because of the conceptual differences underlying the establishment and building floor space, estimates of energy intensity (consumption divided by floor space) should not be expected to be equal.
The variable that affords the most comparable base for the estimates is energy consumption, and the estimates of establishment and building energy consumption at the national level vary by only 1 percent.
More information is available through Statistics Canada at http://www23.statcan.gc.ca/imdb/p2sv.pl?Function=getSurvey&SDDS=5034&lang=en&db=imdb&adm=8&dis=2.

Title: Lorem ipsum
109
BAPPENDIX BGLOSSARY
110 Survey of Commercial and Institutional Energy Use – Buildings 2009
Appendix B: Glossary
buildingA structure totally enclosed by walls that extend from the foundation to the roof, intended for human occupancy. Included in the survey as a specific exception were structures erected on pillars to elevate the first fully enclosed level but leave the sides at ground level open. Excluded from the survey as non-buildings were the following: structures (other than the exception just noted) that were not totally enclosed by walls and a roof (such as oil refineries, steel mills and water towers), street lights, pumps, billboards, bridges, oil storage tanks, construction sites and mobile homes and trailers, even if they housed commercial activity.
building activityAn activity or function that occupies the majority of the floor space of a building. The categories are designed to group buildings that have similar patterns of energy consumption (see Appendix C for details).
building characteristicsInformation about the building that includes building floor space, year of construction, number of storeys, size, primary activity and hours of operation.
climate zoneA climatically distinct area, defined by long-term weather conditions that affect the heating and cooling loads in buildings (see Appendix E for details).
commercial and institutional building (see Appendix C for details)A building that has more than 50 percent of its floor space used for commercial activities or for activities focusing on not-for-profit services in the public’s interest. These buildings include, but are not limited to, the following:
• office buildings (non-medical)
•medical office buildings
• elementary and secondary schools
• nursing and residential care facilities
•warehouses
• hotels and motels
• hospitals
• food and beverage stores
• non-food retail stores
• vacant buildings
• other
coolingThe conditioning of air in a room for human comfort by a refrigeration unit (such as an air conditioner or heat pump) or by a central cooling or district cooling system that circulates chilled water. Use of fans or blowers by themselves without chilled air or water is not included in this definition of air conditioning.
dieselA liquid petroleum product that is less volatile than gasoline and that is burned for space or water-heating purposes.
district chilled waterWater chilled outside of a building in a central plant and piped into the building as an energy source for cooling. Chilled water may be purchased from a utility or provided by a central physical plant in a separate building that is part of the same multi-building facility (for example, a hospital complex or university).
district heatSteam or hot water produced outside of a building in a central plant and piped into the building as an energy source for space heating or another end use. The district heat may be purchased from a utility or provided by a central physical plant in a separate building that is part of the same multibuilding facility (for example, a hospital complex or university.) District heat includes district steam and/or district hot water.
district hot waterDistrict heat in the form of hot water.

111Detailed Statistical Report – December 2012
Appendix B: Glossary
district steamDistrict heat in the form of steam.
electricityElectric energy supplied to a building by a central utility via power lines or from a central physical plant in a separate building that is part of the same multibuilding facility. Electric power generated within a building for exclusive use in that building is specifically excluded from the definition of electricity as an energy source in this survey (see energy source).
electricity generationAs an energy end use, the onsite production of electricity by means of electricity generators on either a regular or emergency basis.
energy end useA use for which energy is consumed in a building.
energy intensityThe amount of energy used per unit of activity. Energy intensity is usually given on an aggregate basis, as the ratio of the total consumption for a set of buildings to the total floor space in those buildings.
energy sourceA type of energy or fuel consumed in a building. In this survey, information about the use of electricity, natural gas, oil, district steam heating and district hot water in commercial buildings is obtained from the building respondent and/or the utility selling the energy source to the building respondent. Electric power generated within a building for exclusive use in that building is specifically excluded from the definition of electricity as an energy source in this survey (see electricity).
establishmentThe level at which the accounting data required to measure production is available (principal inputs, revenues, salaries and wages). The establishment, as a statistical unit, is defined as the most homogeneous unit of production for which the business maintains accounting records. From such records, all the data elements required to compile the full structure of the gross value of production (total sales or shipments and inventories), the cost of materials and services, and labour and capital used in production can be assembled.
floor spaceAll the area enclosed above or below ground by the exterior walls of a building, including hallways, lobbies, stairways, penthouses and elevator shafts, indoor parking and mechanical areas.
hours of operationThe time when the building is open for normal operation, not including the time when only maintenance, housekeeping or security staff may be in the building.
imputationThe statistical method used to allocate a value to a missing value from data obtained to minimize distortion in the estimation.
keroseneA petroleum distillate with properties similar to those of No. 1 fuel oil; used primarily in space heaters, cooking stoves, and water heaters. In this report, no distinction is made between kerosene and fuel oil; kerosene is included in the “Distillates” category under “Energy source.”

112 Survey of Commercial and Institutional Energy Use – Buildings 2009
Appendix B: Glossary
112
light fuel oilA liquid petroleum product used as an energy source that is less volatile than gasoline. Fuel oil includes distillate fuel oil (Nos. 1, 2, and 4).
lightingThe illumination of the interior of a building by use of artificial sources of light.
natural gasHydrocarbon gas (mostly methane) supplied as an energy source to individual buildings by pipelines from a central utility company. Natural gas does not refer to liquefied petroleum gas (LPG) or to privately owned gas wells operated by a building owner (see also energy source, liquefied petroleum gas and propane).
number of floorsThe number of levels in the tallest section of a building that are actually considered a part of the building, including parking areas, basements or other floors below ground level, but excluding half-floors, mezzanines, balconies and lofts.
propaneA gaseous petroleum product that liquefies under pressure. Propane is the major component of liquefied petroleum gas.
quality indicatorsCoefficients of variation, which indicate the reliability of data, are used to determine which estimates may be published. Estimates whose coefficient of variation exceeds 40 percent are deemed too unreliable to be published.
space coolingAs an energy end use, the conditioning of air in a room for human comfort by a refrigeration unit (such as an air conditioner or heat pump) or by a central cooling or district cooling system that circulates chilled water. Excluded is the use of fans or blowers by themselves, without chilled air or water.
space heatingAs an energy end use, the use of mechanical equipment (including wood stoves and active solar-heating devices) to heat all, or part, of a building to at least 10°C.
square footageFloor space, in units of square feet. One square foot is approximately equal to 0.0929 square metres. (See floor space.)
water heatingAs energy end use, the use of energy to heat water for purposes other than space heating.
woodAs an energy source, logs or wood products that are used as fuel.
year of constructionThe year in which the major part or the largest portion of a building was constructed.

Title: Lorem ipsum
113
CAPPENDIX CDESCRIPTIONS OF
BUILDING ACTIVITY
114 Survey of Commercial and Institutional Energy Use – Buildings 2009
Appendix C: Descriptions of building activity
commercial and institutional buildingA building with more than 50 percent of its floor space used for commercial activities or for activities focusing on not-for-profit services in the public’s interest. These buildings include, but are not limited to, the following:
• office buildings (non-medical)
•medical office buildings
• elementary and secondary schools
• nursing and residential care facilities
•warehouses
• hotels and motels
• hospitals
• food and beverage stores
• non-food retail stores
• vacant buildings
• other
office buildings (non-medical)Applies to facility spaces used for general office, professional and administrative purposes. The floor area includes all supporting functions such as kitchens used by staff, lobbies, atriums, conference rooms and auditoria, fitness areas for staff, storage areas, stairways and elevator shafts.
medical office buildingsApplies to facility space used to provide diagnosis and treatment for medical, dental or psychiatric outpatient care. The floor area includes all supporting functions such as kitchens used by staff, laboratories, lobbies, atriums, conference rooms and auditoria, fitness areas for staff, storage areas, stairways and elevator shafts.
elementary and secondary schoolsFacility space used as a school building for kindergarten through secondary school students. This does not include college or university classroom facilities and laboratories or vocational, technical or trade schools. The floor area includes all supporting functions such as administrative space, conference rooms, kitchens used by staff, lobbies, cafeterias, gymnasiums, auditoria, laboratory classrooms, portable classrooms, greenhouses, stairways, atriums, elevator shafts and storage areas.
nursing and residential care facilitiesFacilities with permanent occupant care that provides rehabilitative, restorative and/or ongoing skilled nursing care to patients or residents in need of assistance with activities of daily living. Long-term care facilities include nursing homes and residential developmental handicap, mental health and substance abuse facilities. Purely residential retirement homes are not included in this category. The floor area includes all supporting functions such as administrative space, kitchens used by staff, lobbies and cafeterias.
warehousesApplies to unrefrigerated or refrigerated buildings that are used to store goods, manufactured products, merchandise or raw materials. The floor area includes all supporting functions such as offices, lobbies, stairways, rest rooms, equipment storage areas and elevator shafts. Existing atriums or areas with high ceilings only include the base floor area that they occupy.
115Detailed Statistical Report – December 2012
Appendix C: Descriptions of building activity
hotels and motelsApplies to buildings that rent overnight accommodations on a room/suite basis, typically including a bath/shower and other facilities in guest rooms. Hotel and motel properties typically have daily services available to guests, including housekeeping/laundry and a front desk / concierge. The floor area includes all interior space, including guestrooms, halls, lobbies, atriums, food preparation and restaurant space, conference and banquet space, health clubs/spas, indoor pool areas, and laundry facilities, as well as all space used for supporting functions such as elevator shafts, stairways, mechanical rooms, storage areas, employee break rooms and back-of-house offices. The term hotel/motel does not apply to fractional ownership properties such as condominiums or vacation timeshares. Hotel properties should be owned by a single entity and have rooms available on a nightly basis.
hospitalsFacilities that provide acute care services intended to treat patients for short periods (average less than 25 days) for any brief but severe medical condition, including emergency medical care, physicians’ services, diagnostic care, ambulatory care and surgical care. Acute care hospitals typically discharge patients as soon as the patient is deemed healthy and stable. Note: Long-term care residences are not considered hospitals.
food and beverage storesApplies to facility space used for the retail sale of food and beverage products. This description should not be used by restaurants. The floor area includes all supporting functions such as kitchens and break rooms used by staff, storage areas (refrigerated and non-refrigerated), administrative areas, stairwells, atriums and lobbies.
non-food retail storesApplies to facility space used for the retail sale of everything other than food and beverage products.
vacant buildingsBuilding in which more floor space was vacant than was used for any single commercial activity at the time of interview. A vacant building may have some occupied floor space.
otherA building with more than 50 percent of its floor space used for commercial activities or for activities focusing on not-for-profit services in the public’s interest, that is not listed in Appendix B. Examples include entertainment, leisure and recreation buildings (arenas), shopping centres, colleges and universities.


Title: Lorem ipsum
117
DAPPENDIX DCOMMERCIAL AND INSTITUTIONAL
BUILDING ENERGY USE SURVEY – QUESTIONNAIRE
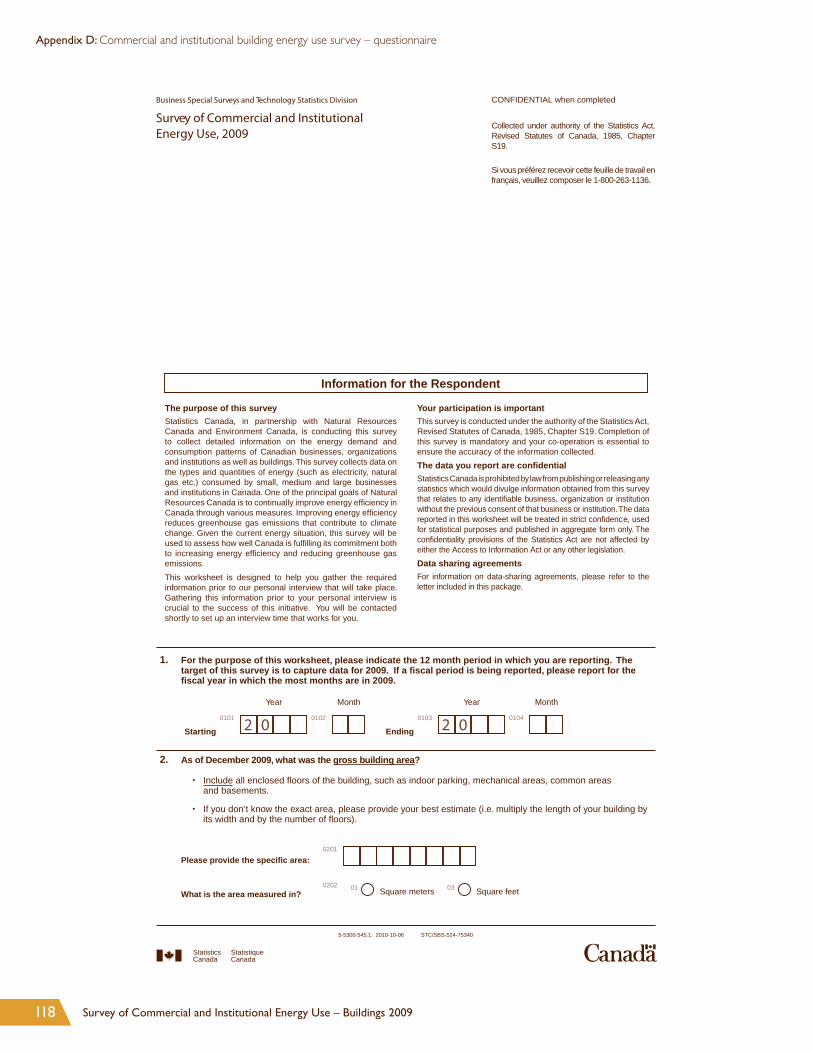
118 Survey of Commercial and Institutional Energy Use – Buildings 2009
Appendix D: Commercial and institutional building energy use survey – questionnaire
5-5300-545.1: 2010-10-06 STC/SBS-524-75340
Business Special Surveys and Technology Statistics Division
Survey of Commercial and Institutional Energy Use, 2009
1. For the purpose of this worksheet, please indicate the 12 month period in which you are reporting. The target of this survey is to capture data for 2009. If a fiscal period is being reported, please report for the fiscal year in which the most months are in 2009.
Year Month Year Month
Starting0101
2 00102
Ending0103
2 00104
2. As of December 2009, what was the gross building area?
Include• all enclosed floors of the building, such as indoor parking, mechanical areas, common areas and basements.
If you don’t know the exact area, please provide your best estimate (i.e. multiply the length of your building by • its width and by the number of floors).
Please provide the specific area:0201
What is the area measured in?0202 01
Square meters 03 Square feet
CONFIDENTIAL when completed
Collected under authority of the Statistics Act, Revised Statutes of Canada, 1985, Chapter S19.
Si vous préférez recevoir cette feuille de travail en français, veuillez composer le 1-800-263-1136.
The purpose of this surveyStatistics Canada, in partnership with Natural Resources Canada and Environment Canada, is conducting this survey to collect detailed information on the energy demand and consumption patterns of Canadian businesses, organizations and institutions as well as buildings. This survey collects data on the types and quantities of energy (such as electricity, natural gas etc.) consumed by small, medium and large businesses and institutions in Canada. One of the principal goals of Natural Resources Canada is to continually improve energy efficiency in Canada through various measures. Improving energy efficiency reduces greenhouse gas emissions that contribute to climate change. Given the current energy situation, this survey will be used to assess how well Canada is fulfilling its commitment both to increasing energy efficiency and reducing greenhouse gas emissions.This worksheet is designed to help you gather the required
.ecalp ekat lliw taht weivretni lanosrep ruo ot roirp noitamrofniGathering this information prior to your personal interview is crucial to the success of this initiative. You will be contacted shortly to set up an interview time that works for you.
Your participation is importantThis survey is conducted under the authority of the Statistics Act, Revised Statutes of Canada, 1985, Chapter S19. Completion of this survey is mandatory and your co-operation is essential to ensure the accuracy of the information collected.The data you report are confidentialStatistics Canada is prohibited by law from publishing or releasing any statistics which would divulge information obtained from this survey that relates to any identifiable business, organization or institution without the previous consent of that business or institution. The data reported in this worksheet will be treated in strict confidence, used for statistical purposes and published in aggregate form only. The confidentiality provisions of the Statistics Act are not affected by either the Access to Information Act or any other legislation.Data sharing agreementsFor information on data-sharing agreements, please refer to the letter included in this package.
Information for the Respondent
Statistique Canada
StatisticsCanada

119Detailed Statistical Report – December 2012
Appendix D: Commercial and institutional building energy use survey – questionnaire
5530545021
3. As of December 2009, what was the total rentable floor area occupied by your organization?
Exclude• indoor parking, and areas occupied by other organizations.
If your organization occupies space in more than one building, the total rentable area should include • the space occupied by your organization in all buildings.
If you don’t know the exact area, please provide your best estimate. •
Please provide the specific area:0301
Is that measured in:0302 01
Square meters 03 Square feet
4. What percentage of the gross building area occupied by this organization was heated to at least 10 degrees Celsius (50 degrees Fahrenheit) during 2009, including basements and enclosed garages?
0401 %
5. What percentage of the gross building area occupied by this organization was air conditioned during 2009, including basements?
0501 %
6. If your building is a warehouse space, please provide the volume of refrigerated space for the following categories?
Volume of space cooled to 1 degree Celsius or higher• 0601
Volume of space cooled between 0 and -28 degrees Celsius• 0602
Volume of space cooled below -28 degree Celsius• 0603
What are these volumes measured in? 0604 01 Cubic feet
03 Cubic meters
7. In which year was construction completed for the building?If portions of the building were constructed at different times, please provide the year in which construction was completed for the largest portion.
0701
8. Please indicate the total number of normal operating hours for your building during a typical week.Please exclude any time when maintenance, house-keeping, or security staff are working outside of the normal operating hours. If the hours vary for different parts of the building or complex, report for that area which is open the longest.
0801
9. If your building is an elementary or secondary school, how many students can be seated in all of the classrooms in this building at one time?
0901
10. If your building is an elementary or secondary school with portables, are the portables electrically powered by the main building supply?
1001
01 Yes
03 No
11. If your building is a hospital or nursing and residential care facility, what is the inpatient licensed bed capacity?
1101
12. How many people worked in the building during its main shift in 2009?By main shift, we mean the shift when most people are in the building. 1201
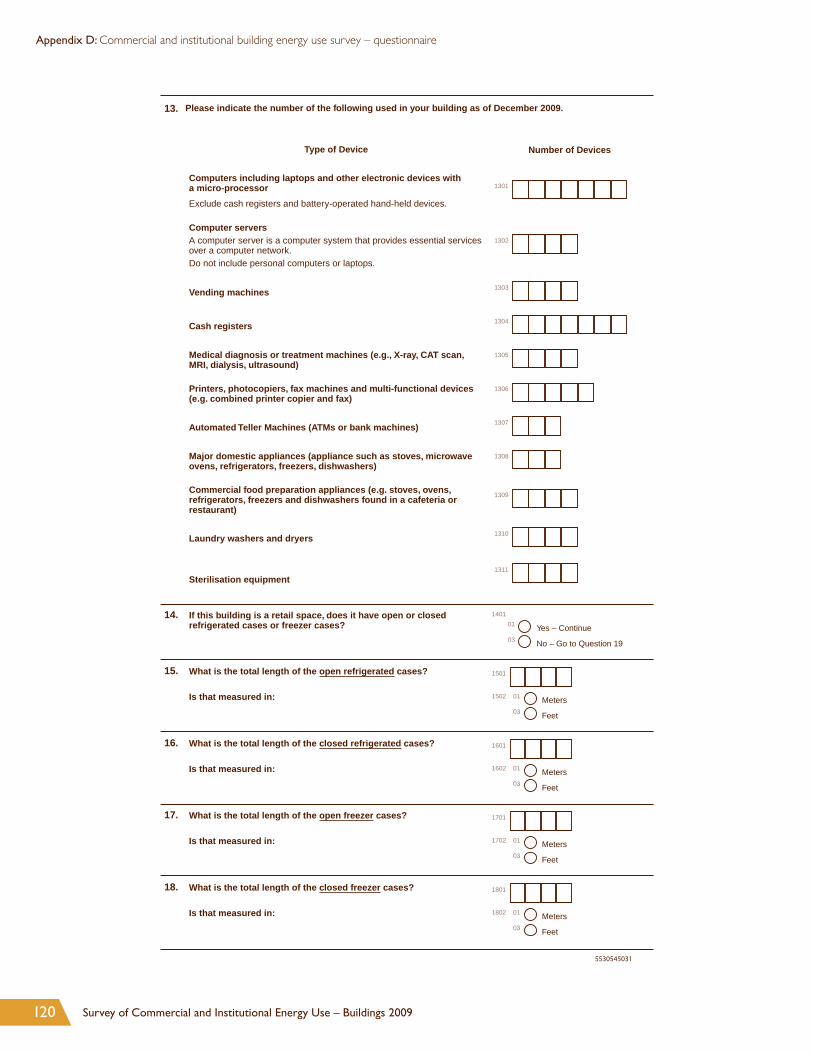
120 Survey of Commercial and Institutional Energy Use – Buildings 2009
Appendix D: Commercial and institutional building energy use survey – questionnaire
5530545031
13. Please indicate the number of the following used in your building as of December 2009.
Type of Device Number of Devices
Computers including laptops and other electronic devices with a micro-processorExclude cash registers and battery-operated hand-held devices.
1301
Computer serversA computer server is a computer system that provides essential services over a computer network. Do not include personal computers or laptops.
1302
Vending machines 1303
Cash registers 1304
Medical diagnosis or treatment machines (e.g., X-ray, CAT scan, MRI, dialysis, ultrasound)
1305
Printers, photocopiers, fax machines and multi-functional devices (e.g. combined printer copier and fax)
1306
Automated Teller Machines (ATMs or bank machines) 1307
Major domestic appliances (appliance such as stoves, microwave ovens, refrigerators, freezers, dishwashers)
1308
Commercial food preparation appliances (e.g. stoves, ovens, refrigerators, freezers and dishwashers found in a cafeteria or restaurant)
1309
Laundry washers and dryers 1310
Sterilisation equipment1311
14. If this building is a retail space, does it have open or closed refrigerated cases or freezer cases?
1401 01
Yes – Continue 03
No – Go to Question 19
15. What is the total length of the open refrigerated cases?
Is that measured in:
1501
1502 01 Meters
03 Feet
16. What is the total length of the closed refrigerated cases?
Is that measured in:
1601
1602 01 Meters
03 Feet
17. What is the total length of the open freezer cases?
Is that measured in:
1701
1702 01 Meters
03 Feet
18. What is the total length of the closed freezer cases?
Is that measured in:
1801
1802 01 Meters
03 Feet

121Detailed Statistical Report – December 2012
Appendix D: Commercial and institutional building energy use survey – questionnaire
5530545041
19. Which of the following types of heating equipment were used for spacing heating in this building? Check all that apply.1901
None1902
Furnaces that heat air directly, without using steam or hot water1903
Packaged central unit (roof mounted)1904
Boilers inside (or adjacent to) the building that produce steam or hot water1905
District steam or hot water piped in from outside the building1906
Heat pumps – packaged1907
Heat pumps – residential-type split system1908
Heat pumps – individual room system1909
Individual space heaters, other than heat pumps1910
Other (Please Specify)
1911
20. Which of the following types of cooling equipment were used for space cooling? Check all that apply.2001
None2002
Residential-type central air conditioners, other than heat pumps, that cool air directly and circulate it without using chilled water2003
Packaged air conditioning units, other than heat pumps2004
Central chillers inside (or adjacent to) the building that chill water for air conditioning2005
District chilled water piped in from outside the building2006
Heat pumps for cooling – packaged unit2007
Heat pumps for cooling – residential-type split system2008
Heat pumps for cooling – individual room heat pump2009
“Swamp” coolers or evaporative coolers2010
Other (Please Specify)
2011
21. Were any of the following renovations or retrofits executed during the years 2005 to 2009? Check all that apply.2101
None2102
Lighting2103
Cooling equipment2104
Heating equipment2105
Insulation of basement, roof or walls2106
Windows2107
Plumbing2108
Addition or annex2109
Reduction of enclosed floor space2110
Other, please specify:
2111

122 Survey of Commercial and Institutional Energy Use – Buildings 2009
Appendix D: Commercial and institutional building energy use survey – questionnaire
5530545051
22. For the 2009 calendar year, please indicate the main source of energy used to heat your building as well as any alternate sources used.
Energy SourceMain Energy Source for Space Heating
Mark (�) one only
Alternate Energy Source for Space Heating
Mark (�) all that apply
None 2201 01
2202
Electricity 02
2203
Natural Gas 03
2204
Light Fuel Oil 04
2205
Diesel 05
2206
Kerosene 06
2207
Propane or Other Bottled Gas 07
2208
District Steam purchased from an off-site plant
08
2209
District hot water purchased from an off-site plant
09
2210
District chilled water purchased from an off-site plant
10
2211
Wood or wood by-products 11
2212
On-site electricity generation (e.g. solar) 12
2213
Other – Specify 13
2214
2215 2216
23. For the 2009 calendar year, please indicate only the main source of energy used to cool your organization. Also for 2009, please indicate the main source of energy used for domestic water heating (water used for consumption, not for space heating).
Energy SourceMain Energy Source for Space Cooling
Mark (�) one only
Main Energy Sourcefor Domestic Water Heating
Mark (�) one only
None 2301 01
2302 01
Electricity 02
02
Natural Gas 03
03
Light Fuel Oil 04
04
Diesel 05
05
Kerosene 06
06
Propane or Other Bottled Gas 07
07
District Steam purchased from an off-site plant
08
08
District hot water purchased from an off-site plant
09
09
District chilled water purchased from an off-site plant
10
10
Wood or wood by-products 11
11
On-site electricity generation (e.g. solar) 12
12
Other – Specify 13
13
2303 2304

123Detailed Statistical Report – December 2012
Appendix D: Commercial and institutional building energy use survey – questionnaire
5530545061
24. For the 2009 calendar year, please indicate the total quantity of energy consumed, the unit of measure, and the total amount spent for each source of energy consumed by your building.
Please indicate only the energy consumed at the physical location of your building, relating to the floor area you • have reported in question 2. If your landlord pays your energy bills please forward this question to the appropriate person. Do not include fuel or energy used for transportation.For amount spent, please report in Canadian dollars the total including taxes, service charges and • any rebates.
Energy Source Quantity Consumed
EnergyUnit of Measure
Amount Spent Cdn $ (omit cents)
Electricity purchased(Exclude electricity generated at your building.)
2401 240201
kWh 02
MWh 03
GJ 240304
Other �
2404
.00
Natural gas
2405 240601
m 3 02
L 03
ft 3
04 GJ
05 MMBtu
240706
Other �
2408
.00
Light fuel oil
2409 241001
L 02
GJ 03
Gallons (US)04
Gallons (UK) 241105
Other �
2412
.00
Diesel
2413 241401
L 02
GJ 03
Gallons (US)04
Gallons (UK) 241505
Other �
2416
.00
Kerosene
2417 241801
L 02
GJ 03
Gallons (US)04
Gallons (UK) 241905
Other �
2420
.00
Propane or other bottled gas
2421 242201
L 02
kg 03
GJ04
lbs 05
MMBtu 242306
Other �
2424
.00
District steam purchased from an off-site plant
2425 242601
kg 02
GJ 03
lbs04
1000 lbs 05
MMBtu 242706
Other �
2428
.00
District hot water purchased from an off-site plant
2429 243001
GJ 02
MMBtu 243103
Other �
2432
.00
District chilled water purchased from an off-site plant
2433 243401
GJ 02
MMBtu 243503
Other �
2436
.00
Wood and wood by-products
2437 243801
Full cord 02
Pellets (tonnes)03
Tonnes (metric) 04
lbs 243905
Other �
2440
.00
Electricity generated on-siteIncluding emergency generator usage
2441 244201
kWh 02
GJ 244303
Other �
Domestic Water Consumed
2444 244501
L 02
m 3 03
Not metered 244604
Other �

Title: Lorem ipsum
125
EAPPENDIX ECLIMATE ZONES


127Detailed Statistical Report – December 2012
Appendix E: Climate zones
Source(s): Environment Canada, Atmospheric Environment Service, Climate Research Branch, 1998, Climate Trends and Variations Bulletin for Canada, Ottawa
In this report, the climate zone “other” includes all other climate zones shown in the map above that are not Atlantic Canada, Great Lakes / St. Lawrence or Pacific coast.
St. John’s
Victoria
Whitehorse
Yellowknife
Iqaluit
Edmonton
Calgary
Regina
Winnipeg
Toronto
Ottawa Montreal
Quebec
Fredericton
Halifax
CharlottetownVancouver
Climate zones
Atlantic Canada
Great Lakes/St Lawrence
Paci�c coast
Other


Title: Lorem ipsum
129
FAPPENDIX FREGIONAL INFORMATION

130 Survey of Commercial and Institutional Energy Use – Buildings 2009
Appendix F: Regional information
As d
escr
ibed
in th
e fo
rew
ord,
it is
impo
rtan
t to
note
that
SC
IEU
200
9 w
as d
esig
ned
to p
rodu
ce re
liabl
e es
timat
es a
t the
nat
iona
l lev
el a
nd fo
r fou
r cl
imat
e zo
nes (
see
Appe
ndix
E).
How
ever
, it w
as p
ossib
le to
der
ive
reas
onab
le q
ualit
y es
timat
es fo
r geo
grap
hic
regi
ons.
It sh
ould
be
note
d th
at th
ese
deriv
ed re
gion
al e
stim
ates
are
not
as r
obus
t as t
he c
limat
e zo
ne e
stim
ates
and
shou
ld th
eref
ore
be u
sed
with
cau
tion.
Tabl
e F.1
– B
uild
ing
char
acte
ristic
s an
d en
ergy
use
by
regi
on a
nd s
ize
Reg
ion
Bui
ldin
g si
ze
Bui
ldin
gsFl
oor
spac
eEn
ergy
use
Ener
gy in
tens
ity
Q.I.
(mill
ions
of
m2 )
Q.I.
(PJ)
Q.I.
(GJ/m
2 )Q
.I.
Atla
ntic
Tota
l 4
8 08
9A
70.1
A72
.0A
1.03
A
5000
squ
are
feet
or
less
(46
5 m
2 or
less
) 2
5 37
3A
5.4
A7.
0A
1.29
A
5001
to 1
0 00
0 sq
uare
feet
(466
to 9
29 m
2 ) 9
198
A6.
0A
6.0
A1.
00A
10 0
01 t
o 50
000
squ
are
feet
(93
0 to
464
5 m
2 ) 1
0 43
4A
19.9
A16
.7A
0.84
A
50 0
01 t
o 20
0 00
0 sq
uare
feet
(46
46 t
o 18
580
m2 )
2 6
10B
21.1
A21
.2A
1.01
A
Ove
r 20
0 00
0 sq
uare
feet
(O
ver
18 5
80 m
2 )–
F–
F–
F1.
18A
Que
bec
Tota
l 1
03 6
84A
176.
4A
157.
4A
0.89
A
5000
squ
are
feet
or
less
(46
5 m
2 or
less
) 5
5 75
0A
14.0
A19
.5A
1.39
A
5001
to 1
0 00
0 sq
uare
feet
(466
to 9
29 m
2 ) 1
6 68
8A
10.7
A10
.0B
0.94
A
10 0
01 t
o 50
000
squ
are
feet
(93
0 to
464
5 m
2 ) 2
5 14
3A
52.7
A43
.8A
0.83
A
50 0
01 t
o 20
0 00
0 sq
uare
feet
(46
46 t
o 18
,580
m2 )
4 6
07A
40.1
A34
.2A
0.85
A
Ove
r 20
0 00
0 sq
uare
feet
(O
ver
18 5
80 m
2 ) 1
496
C59
.0C
–F
0.85
A
Ont
ario
Tota
l 1
63 5
37A
277.
2A
316.
9A
1.14
A
5000
squ
are
feet
or
less
(46
5 m
2 or
less
) 8
0 08
2A
20.6
A37
.8B
1.8
A
5001
to 1
0 00
0 sq
uare
feet
(466
to 9
29 m
2 ) 3
2 14
1B
21.7
B22
.8B
1.05
B
10 0
01 t
o 50
000
squ
are
feet
(93
0 to
464
5 m
2 ) 3
9 05
4A
80.4
A87
.1A
1.08
A
50 0
01 t
o 20
0 00
0 sq
uare
feet
(46
46 t
o 18
580
m2 )
10
103
A81
.2A
83.6
A1.
03A
Ove
r 20
0 00
0 sq
uare
feet
(O
ver
18 5
80 m
2 ) 2
157
B73
.3A
85.7
B1.
17A
(Con
tinue
d)

131Detailed Statistical Report – December 2012
Appendix F: Regional information
Reg
ion
Bui
ldin
g si
ze
Bui
ldin
gsFl
oor
spac
eEn
ergy
use
Ener
gy in
tens
ity
Q.I.
(mill
ions
of
m2 )
Q.I.
(PJ)
Q.I.
(GJ/m
2 )Q
.I.
Prai
ries
Tota
l 1
05 5
19A
156.
1A
210.
9A
1.35
A
5000
squ
are
feet
or
less
(46
5 m
2 or
less
) 4
6 26
2A
10.5
A18
.0A
1.7
A
5001
to 1
0 00
0 sq
uare
feet
(466
to 9
29 m
2 ) 2
1 42
8A
14.9
A25
.4A
1.7
A
10 0
01 t
o 50
000
squ
are
feet
(93
0 to
464
5 m
2 ) 3
2 20
6A
63.8
A81
.5A
1.3
A
50 0
01 t
o 20
0 00
0 sq
uare
feet
(46
46 t
o 18
580
m2 )
4 8
75A
40.8
A60
.8B
1.5
A
Ove
r 20
0 00
0 sq
uare
feet
(O
ver
18 5
80 m
2 )74
8B
26.1
B25
.1C
1.0
B
Briti
sh C
olum
bia
Tota
l 6
1 43
8A
86.2
A85
.1B
0.99
A
5000
squ
are
feet
or
less
(46
5 m
2 or
less
) 2
9 07
2A
6.7
A–
F–
F
5001
to 1
0 00
0 sq
uare
feet
(466
to 9
29 m
2 ) 1
2 22
6B
8.3
B8.
5C
1.0
B
10 0
01 t
o 50
000
squ
are
feet
(93
0 to
464
5 m
2 ) 1
6 72
7A
35.8
B–
F0.
8C
50 0
01 t
o 20
0 00
0 sq
uare
feet
(46
46 t
o 18
580
m2 )
3 1
24A
25.2
A26
.3A
1.0
A
Ove
r 20
0 00
0 sq
uare
feet
(O
ver
18 5
80 m
2 )28
8B
10.2
B8.
6B
0.8
A
Can
ada
Tota
l 4
82 2
66A
765.
9A
842.
2A
1.10
A
5000
squ
are
feet
or
less
(46
5 m
2 or
less
) 2
36 5
39A
57.3
A93
.8A
1.64
A
5001
to 1
0 00
0 sq
uare
feet
(466
to 9
29 m
2 ) 9
1 68
0A
61.6
A72
.7A
1.18
A
10 0
01 t
o 50
000
squ
are
feet
(93
0 to
464
5 m
2 ) 1
23 5
65A
252.
4A
259.
3A
1.03
A
50 0
01 t
o 20
0 00
0 sq
uare
feet
(46
46 t
o 18
580
m2 )
25
319
A20
8.3
A22
6.1
A1.
09A
Ove
r 20
0 00
0 sq
uare
feet
(O
ver
18 5
80 m
2 ) 5
162
A18
6.4
A19
0.4
A1.
02A
Due
to
roun
ding
, num
bers
may
not
add
up
to t
he t
otal
sho
wn,
and
som
e nu
mbe
r m
ay d
iffer
from
one
tab
le t
o th
e ne
xt.
Qua
lity
indi
cato
rs (
Q.I.)
cla
ssify
eac
h es
timat
e ac
cord
ing
to it
s qu
ality
as
follo
ws:
A–E
xcel
lent
, B–G
ood,
C–A
ccep
tabl
e, D
–Use
with
cau
tion,
F–To
o un
relia
ble
to b
e pu
blish
ed a
nd X
–sup
pres
sed
due
to c
onfid
entia
lity.
See
the
“How
to r
ead
thes
e ta
bles
” se
ctio
n.
Tabl
e F.1
– B
uild
ing
char
acte
ristic
s an
d en
ergy
use
by
regi
on a
nd s
ize (c
ontin
ued)
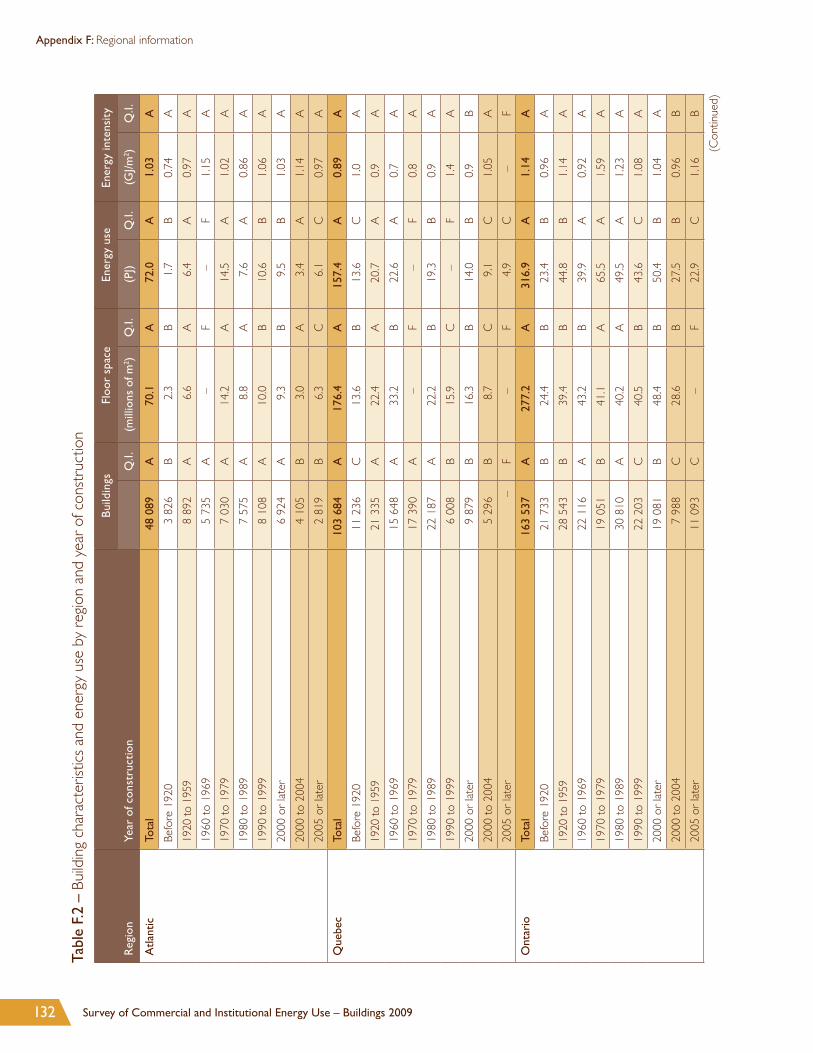
132 Survey of Commercial and Institutional Energy Use – Buildings 2009
Appendix F: Regional information
Tabl
e F.
2 –
Build
ing
char
acte
ristic
s an
d en
ergy
use
by
regi
on a
nd y
ear
of c
onst
ruct
ion
Reg
ion
Year
of c
onst
ruct
ion
Bui
ldin
gsFl
oor
spac
eEn
ergy
use
Ener
gy in
tens
ity
Q.I.
(mill
ions
of m
2 )Q
.I.(P
J)Q
.I.(G
J/m2 )
Q.I.
Atla
ntic
Tota
l 4
8 08
9A
70.1
A72
.0A
1.03
A
Befo
re 1
920
3 8
26B
2.3
B1.
7B
0.74
A
1920
to 1
959
8 8
92A
6.6
A6.
4A
0.97
A
1960
to
1969
5 7
35A
–F
–F
1.15
A
1970
to
1979
7 0
30A
14.2
A14
.5A
1.02
A
1980
to
1989
7 5
75A
8.8
A7.
6A
0.86
A
1990
to
1999
8 1
08A
10.0
B10
.6B
1.06
A
2000
or
late
r 6
924
A9.
3B
9.5
B1.
03A
2000
to
2004
4 1
05B
3.0
A3.
4A
1.14
A
2005
or
late
r 2
819
B6.
3C
6.1
C0.
97A
Que
bec
Tota
l 1
03 6
84A
176.
4A
157.
4A
0.89
A
Befo
re 1
920
11
236
C13
.6B
13.6
C1.
0A
1920
to 1
959
21
335
A22
.4A
20.7
A0.
9A
1960
to
1969
15
648
A33
.2B
22.6
A0.
7A
1970
to
1979
17
390
A–
F–
F0.
8A
1980
to
1989
22
187
A22
.2B
19.3
B0.
9A
1990
to
1999
6 0
08B
15.9
C–
F1.
4A
2000
or
late
r 9
879
B16
.3B
14.0
B0.
9B
2000
to
2004
5 2
96B
8.7
C9.
1C
1.05
A
2005
or
late
r–
F–
F4.
9C
–F
Ont
ario
Tota
l 1
63 5
37A
277.
2A
316.
9A
1.14
A
Befo
re 1
920
21
733
B24
.4B
23.4
B0.
96A
1920
to 1
959
28
543
B39
.4B
44.8
B1.
14A
1960
to
1969
22
116
A43
.2B
39.9
A0.
92A
1970
to
1979
19
051
B41
.1A
65.5
A1.
59A
1980
to
1989
30
810
A40
.2A
49.5
A1.
23A
1990
to
1999
22
203
C40
.5B
43.6
C1.
08A
2000
or
late
r 1
9 08
1B
48.4
B50
.4B
1.04
A
2000
to
2004
7 9
88C
28.6
B27
.5B
0.96
B
2005
or
late
r 1
1 09
3C
–F
22.9
C1.
16B
(Con
tinue
d)
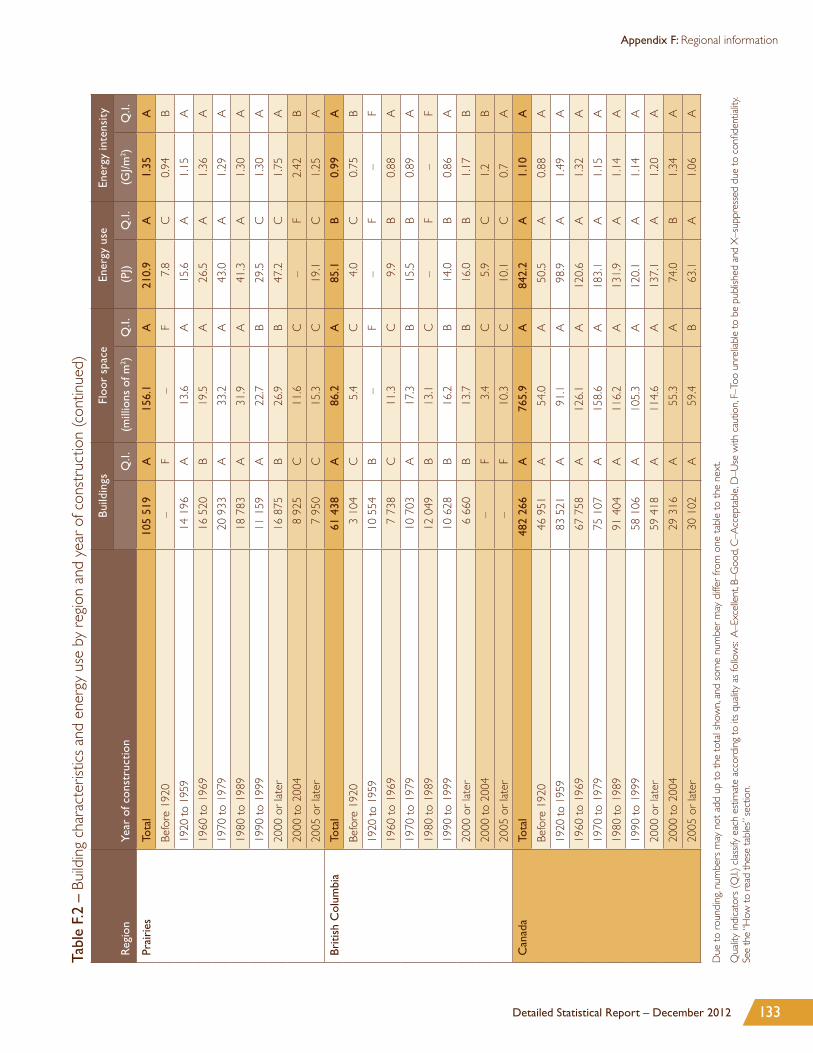
133Detailed Statistical Report – December 2012
Appendix F: Regional information
Tabl
e F.
2 –
Build
ing
char
acte
ristic
s an
d en
ergy
use
by
regi
on a
nd y
ear
of c
onst
ruct
ion
Reg
ion
Year
of c
onst
ruct
ion
Bui
ldin
gsFl
oor
spac
eEn
ergy
use
Ener
gy in
tens
ity
Q.I.
(mill
ions
of m
2 )Q
.I.(P
J)Q
.I.(G
J/m2 )
Q.I.
Atla
ntic
Tota
l 4
8 08
9A
70.1
A72
.0A
1.03
A
Befo
re 1
920
3 8
26B
2.3
B1.
7B
0.74
A
1920
to 1
959
8 8
92A
6.6
A6.
4A
0.97
A
1960
to
1969
5 7
35A
–F
–F
1.15
A
1970
to
1979
7 0
30A
14.2
A14
.5A
1.02
A
1980
to
1989
7 5
75A
8.8
A7.
6A
0.86
A
1990
to
1999
8 1
08A
10.0
B10
.6B
1.06
A
2000
or
late
r 6
924
A9.
3B
9.5
B1.
03A
2000
to
2004
4 1
05B
3.0
A3.
4A
1.14
A
2005
or
late
r 2
819
B6.
3C
6.1
C0.
97A
Que
bec
Tota
l 1
03 6
84A
176.
4A
157.
4A
0.89
A
Befo
re 1
920
11
236
C13
.6B
13.6
C1.
0A
1920
to 1
959
21
335
A22
.4A
20.7
A0.
9A
1960
to
1969
15
648
A33
.2B
22.6
A0.
7A
1970
to
1979
17
390
A–
F–
F0.
8A
1980
to
1989
22
187
A22
.2B
19.3
B0.
9A
1990
to
1999
6 0
08B
15.9
C–
F1.
4A
2000
or
late
r 9
879
B16
.3B
14.0
B0.
9B
2000
to
2004
5 2
96B
8.7
C9.
1C
1.05
A
2005
or
late
r–
F–
F4.
9C
–F
Ont
ario
Tota
l 1
63 5
37A
277.
2A
316.
9A
1.14
A
Befo
re 1
920
21
733
B24
.4B
23.4
B0.
96A
1920
to 1
959
28
543
B39
.4B
44.8
B1.
14A
1960
to
1969
22
116
A43
.2B
39.9
A0.
92A
1970
to
1979
19
051
B41
.1A
65.5
A1.
59A
1980
to
1989
30
810
A40
.2A
49.5
A1.
23A
1990
to
1999
22
203
C40
.5B
43.6
C1.
08A
2000
or
late
r 1
9 08
1B
48.4
B50
.4B
1.04
A
2000
to
2004
7 9
88C
28.6
B27
.5B
0.96
B
2005
or
late
r 1
1 09
3C
–F
22.9
C1.
16B
(Con
tinue
d)
Reg
ion
Year
of c
onst
ruct
ion
Bui
ldin
gsFl
oor
spac
eEn
ergy
use
Ener
gy in
tens
ity
Q.I.
(mill
ions
of m
2 )Q
.I.(P
J)Q
.I.(G
J/m2 )
Q.I.
Prai
ries
Tota
l 1
05 5
19A
156.
1A
210.
9A
1.35
A
Befo
re 1
920
–F
–F
7.8
C0.
94B
1920
to 1
959
14
196
A13
.6A
15.6
A1.
15A
1960
to
1969
16
520
B19
.5A
26.5
A1.
36A
1970
to
1979
20
933
A33
.2A
43.0
A1.
29A
1980
to
1989
18
783
A31
.9A
41.3
A1.
30A
1990
to
1999
11
159
A22
.7B
29.5
C1.
30A
2000
or
late
r 1
6 87
5B
26.9
B47
.2C
1.75
A
2000
to
2004
8 9
25C
11.6
C–
F2.
42B
2005
or
late
r 7
950
C15
.3C
19.1
C1.
25A
Briti
sh C
olum
bia
Tota
l 6
1 43
8A
86.2
A85
.1B
0.99
A
Befo
re 1
920
3 1
04C
5.4
C4.
0C
0.75
B
1920
to 1
959
10
554
B–
F–
F–
F
1960
to
1969
7 7
38C
11.3
C9.
9B
0.88
A
1970
to
1979
10
703
A17
.3B
15.5
B0.
89A
1980
to
1989
12
049
B13
.1C
–F
–F
1990
to
1999
10
628
B16
.2B
14.0
B0.
86A
2000
or
late
r 6
660
B13
.7B
16.0
B1.
17B
2000
to
2004
–F
3.4
C5.
9C
1.2
B
2005
or
late
r–
F10
.3C
10.1
C0.
7A
Can
ada
Tota
l 4
82 2
66A
765.
9A
842.
2A
1.10
A
Befo
re 1
920
46
951
A54
.0A
50.5
A0.
88A
1920
to 1
959
83
521
A91
.1A
98.9
A1.
49A
1960
to
1969
67
758
A12
6.1
A12
0.6
A1.
32A
1970
to
1979
75
107
A15
8.6
A18
3.1
A1.
15A
1980
to
1989
91
404
A11
6.2
A13
1.9
A1.
14A
1990
to
1999
58
106
A10
5.3
A12
0.1
A1.
14A
2000
or
late
r 5
9 41
8A
114.
6A
137.
1A
1.20
A
2000
to
2004
29
316
A55
.3A
74.0
B1.
34A
2005
or
late
r 3
0 10
2A
59.4
B63
.1A
1.06
A
Due
to
roun
ding
, num
bers
may
not
add
up
to t
he t
otal
sho
wn,
and
som
e nu
mbe
r m
ay d
iffer
from
one
tab
le t
o th
e ne
xt.
Qua
lity
indi
cato
rs (
Q.I.)
cla
ssify
eac
h es
timat
e ac
cord
ing
to it
s qu
ality
as
follo
ws:
A–E
xcel
lent
, B–G
ood,
C–A
ccep
tabl
e, D
–Use
with
cau
tion,
F–To
o un
relia
ble
to b
e pu
blish
ed a
nd X
–sup
pres
sed
due
to c
onfid
entia
lity.
See
the
“How
to r
ead
thes
e ta
bles
” sec
tion.
Tabl
e F.
2 –
Build
ing
char
acte
ristic
s an
d en
ergy
use
by
regi
on a
nd y
ear
of c
onst
ruct
ion
(con
tinue
d)

134 Survey of Commercial and Institutional Energy Use – Buildings 2009
Appendix F: Regional information
Tabl
e F.
3 –
Build
ing
char
acte
ristic
s an
d en
ergy
use
by
regi
on a
nd h
ours
of o
pera
tion
Reg
ion
Hou
rs o
f ope
rati
on
Bui
ldin
gsFl
oor
spac
eEn
ergy
use
Ener
gy in
tens
ity
Q.I.
(mill
ions
of
m2 )
Q.I.
(PJ)
Q.I.
(GJ/m
2 )Q
.I.
Atla
ntic
Tota
l 4
8 08
9A
70.1
A72
.0A
1.03
A
36 o
r le
ss 5
401
B2.
9B
1.9
B0.
66A
37 to
48
13
568
A15
.1A
11.4
A0.
76A
49 t
o 72
11
448
A12
.2A
9.3
A0.
77A
73 t
o 96
4 0
54B
9.9
C8.
7B
0.88
A
97 t
o 12
0 4
425
B5.
8B
8.6
B1.
49A
121
to 1
68 9
194
A24
.3C
32.0
C1.
32A
Que
bec
Tota
l 1
03 6
84A
176.
4A
157.
4A
0.89
A
36 o
r le
ss 1
2 55
4B
7.1
C6.
7C
0.95
A
37 to
48
25
991
A28
.5B
27.3
C0.
96B
49 t
o 72
36
826
A65
.3C
47.2
C0.
72A
73 t
o 96
9 5
17B
20.4
B21
.1A
1.03
A
97 t
o 12
0 7
068
A14
.0B
13.5
B0.
97A
121
to 1
68 1
1 72
8A
41.1
B41
.5A
1.01
A
Ont
ario
Tota
l 1
63 5
37A
277.
2A
316.
9A
1.14
A
36 o
r le
ss 1
6 15
1B
11.6
B10
.6B
0.92
A
37 to
48
43
636
A53
.7B
41.9
B0.
78A
49 t
o 72
49
137
A80
.1A
69.7
A0.
87A
73 t
o 96
16
063
B38
.2A
50.9
A1.
33A
97 t
o 12
0 1
4 62
9B
23.0
C40
.4C
1.76
A
121
to 1
68 2
3 92
1B
70.6
A10
3.3
A1.
46A
(Con
tinue
d)

135Detailed Statistical Report – December 2012
Appendix F: Regional information
Reg
ion
Hou
rs o
f ope
rati
on
Bui
ldin
gsFl
oor
spac
eEn
ergy
use
Ener
gy in
tens
ity
Q.I.
(mill
ions
of
m2 )
Q.I.
(PJ)
Q.I.
(GJ/m
2 )Q
.I.
Prai
ries
Tota
l 1
05 5
19A
156.
1A
210.
9A
1.35
A
36 o
r le
ss 9
286
B6.
8B
5.4
B0.
79B
37 to
48
33
083
A36
.9A
37.3
A1.
01A
49 t
o 72
31
447
A46
.4A
56.3
A1.
21A
73 t
o 96
11
135
B23
.1B
33.2
C1.
44B
97 t
o 12
0 6
161
A11
.7A
29.3
B2.
51A
121
to 1
68 1
4 40
7C
31.2
B49
.4B
1.58
A
Briti
sh C
olum
bia
Tota
l 6
1 43
8A
86.2
A85
.1B
0.99
A
36 o
r le
ss 4
941
C3.
4B
2.2
B0.
66A
37 to
48
16
111
B13
.9C
–F
0.75
B
49 t
o 72
20
863
A30
.0A
24.4
B0.
82A
73 t
o 96
6 6
12B
17.5
B15
.3B
0.87
A
97 t
o 12
0 6
210
C8.
1B
–F
1.55
C
121
to 1
68 6
701
C13
.3C
–F
1.52
C
Can
ada
Tota
l 4
82 2
66A
765.
9A
842.
2A
1.10
A
36 o
r le
ss 4
8 33
3A
31.8
A26
.8A
0.84
A
37 to
48
132
389
A14
8.2
A12
8.4
A0.
87A
49 t
o 72
149
721
A23
4.0
A20
7.0
A0.
88A
73 t
o 96
47
380
A10
9.0
A12
9.2
A1.
18A
97 t
o 12
0 3
8 49
2A
62.5
A10
4.5
A1.
67A
121
to 1
68 6
5 95
1A
180.
4A
246.
3A
1.37
A
Due
to
roun
ding
, num
bers
may
not
add
up
to t
he t
otal
sho
wn,
and
som
e nu
mbe
r m
ay d
iffer
from
one
tab
le t
o th
e ne
xt.
Qua
lity
indi
cato
rs (
Q.I.)
cla
ssify
eac
h es
timat
e ac
cord
ing
to it
s qu
ality
as
follo
ws:
A–E
xcel
lent
, B–G
ood,
C–A
ccep
tabl
e, D
–Use
with
cau
tion,
F–To
o un
relia
ble
to b
e pu
blish
ed a
nd X
–sup
pres
sed
due
to c
onfid
entia
lity.
See
the
“How
to r
ead
thes
e ta
bles
” sec
tion.
Tabl
e F.
3 –
Build
ing
char
acte
ristic
s an
d en
ergy
use
by
regi
on a
nd h
ours
of o
pera
tion
(con
tinue
d)

136 Survey of Commercial and Institutional Energy Use – Buildings 2009
Appendix F: Regional information
Tabl
e F.
4 –
Build
ing
char
acte
ristic
s an
d en
ergy
use
by
regi
on a
nd p
rimar
y ac
tivity
Reg
ion
Prim
ary
acti
vity
Bui
ldin
gsFl
oor
spac
eEn
ergy
use
Ener
gy in
tens
ity
Q.I.
(mill
ions
of m
2 )Q
.I.(P
J)Q
.I.(G
J/m2 )
Q.I.
Atla
ntic
Tota
l 4
8 08
9A
70.1
A72
.0A
1.03
AO
ffice
bui
ldin
g (n
on-m
edic
al)
7 6
54A
6.8
A6.
6B
0.97
AM
edica
l offi
ce b
uild
ing
735
B0.
7B
0.6
B0.
80A
Elem
enta
ry o
r se
cond
ary
scho
ol 2
062
B8.
3A
6.4
B0.
77A
Nur
sing
or r
esid
entia
l car
e fa
cilit
y 1
192
B1.
7B
2.4
B1.
40A
War
ehou
se 2
585
B4.
3B
2.0
B0.
47A
Hot
el o
r m
otel
2 0
44B
1.8
A1.
9A
1.07
AH
ospi
tal
126
B2.
5B
6.4
B2.
60A
Food
or
beve
rage
sto
re 5
395
A3.
5C
7.8
C2.
22A
Non
-food
ret
ail s
tore
3 4
06B
6.8
C5.
2C
0.76
AO
ther
* 2
2 89
1A
33.8
B32
.6C
0.96
AQ
uebe
cTo
tal
103
684
A17
6.4
A15
7.4
A0.
89A
Offi
ce b
uild
ing
(non
-med
ical
) 1
2 74
6A
–F
–F
0.93
AM
edica
l offi
ce b
uild
ing
2 3
89B
1.7
B2.
0C
1.18
AEl
emen
tary
or
seco
ndar
y sc
hool
3 4
81B
17.8
C11
.8B
0.66
AN
ursin
g or
res
iden
tial c
are
faci
lity
1 1
66B
6.1
B6.
1A
1.01
AW
areh
ouse
5 1
99B
–F
6.7
C0.
36B
Hot
el o
r m
otel
–F
–F
–F
1.26
BH
ospi
tal
109
A3.
0A
6.3
A2.
08A
Food
or
beve
rage
sto
re 7
737
B7.
4C
11.7
B1.
58A
Non
-food
ret
ail s
tore
13
296
B9.
3B
6.5
C0.
70A
Oth
er*
56
410
A63
.7A
60.0
A0.
94A
Ont
ario
Tota
l 1
63 5
37A
277.
2A
316.
9A
1.14
AO
ffice
bui
ldin
g (n
on-m
edic
al)
34
007
A47
.0A
63.7
B1.
35A
Med
ical o
ffice
bui
ldin
g 2
196
C1.
9B
2.0
C1.
08A
Elem
enta
ry o
r se
cond
ary
scho
ol 6
708
A30
.8A
25.5
A0.
83A
Nur
sing
or r
esid
entia
l car
e fa
cilit
y 1
457
B–
F20
.7C
1.60
AW
areh
ouse
11
960
B40
.2B
26.7
B0.
66A
Hot
el o
r m
otel
–F
5.3
C–
F1.
30C
Hos
pita
l20
7A
6.2
A16
.9B
2.71
AFo
od o
r be
vera
ge s
tore
13
142
B9.
4B
36.7
B3.
91A
Non
-food
ret
ail s
tore
13
830
B13
.5B
13.4
B0.
99B
Oth
er*
76
958
A11
0.0
A10
4.4
A0.
95A
(Con
tinue
d)

137Detailed Statistical Report – December 2012
Appendix F: Regional information
Tabl
e F.
4 –
Build
ing
char
acte
ristic
s an
d en
ergy
use
by
regi
on a
nd p
rimar
y ac
tivity
Reg
ion
Prim
ary
acti
vity
Bui
ldin
gsFl
oor
spac
eEn
ergy
use
Ener
gy in
tens
ity
Q.I.
(mill
ions
of m
2 )Q
.I.(P
J)Q
.I.(G
J/m2 )
Q.I.
Atla
ntic
Tota
l 4
8 08
9A
70.1
A72
.0A
1.03
AO
ffice
bui
ldin
g (n
on-m
edic
al)
7 6
54A
6.8
A6.
6B
0.97
AM
edica
l offi
ce b
uild
ing
735
B0.
7B
0.6
B0.
80A
Elem
enta
ry o
r se
cond
ary
scho
ol 2
062
B8.
3A
6.4
B0.
77A
Nur
sing
or r
esid
entia
l car
e fa
cilit
y 1
192
B1.
7B
2.4
B1.
40A
War
ehou
se 2
585
B4.
3B
2.0
B0.
47A
Hot
el o
r m
otel
2 0
44B
1.8
A1.
9A
1.07
AH
ospi
tal
126
B2.
5B
6.4
B2.
60A
Food
or
beve
rage
sto
re 5
395
A3.
5C
7.8
C2.
22A
Non
-food
ret
ail s
tore
3 4
06B
6.8
C5.
2C
0.76
AO
ther
* 2
2 89
1A
33.8
B32
.6C
0.96
AQ
uebe
cTo
tal
103
684
A17
6.4
A15
7.4
A0.
89A
Offi
ce b
uild
ing
(non
-med
ical
) 1
2 74
6A
–F
–F
0.93
AM
edica
l offi
ce b
uild
ing
2 3
89B
1.7
B2.
0C
1.18
AEl
emen
tary
or
seco
ndar
y sc
hool
3 4
81B
17.8
C11
.8B
0.66
AN
ursin
g or
res
iden
tial c
are
faci
lity
1 1
66B
6.1
B6.
1A
1.01
AW
areh
ouse
5 1
99B
–F
6.7
C0.
36B
Hot
el o
r m
otel
–F
–F
–F
1.26
BH
ospi
tal
109
A3.
0A
6.3
A2.
08A
Food
or
beve
rage
sto
re 7
737
B7.
4C
11.7
B1.
58A
Non
-food
ret
ail s
tore
13
296
B9.
3B
6.5
C0.
70A
Oth
er*
56
410
A63
.7A
60.0
A0.
94A
Ont
ario
Tota
l 1
63 5
37A
277.
2A
316.
9A
1.14
AO
ffice
bui
ldin
g (n
on-m
edic
al)
34
007
A47
.0A
63.7
B1.
35A
Med
ical o
ffice
bui
ldin
g 2
196
C1.
9B
2.0
C1.
08A
Elem
enta
ry o
r se
cond
ary
scho
ol 6
708
A30
.8A
25.5
A0.
83A
Nur
sing
or r
esid
entia
l car
e fa
cilit
y 1
457
B–
F20
.7C
1.60
AW
areh
ouse
11
960
B40
.2B
26.7
B0.
66A
Hot
el o
r m
otel
–F
5.3
C–
F1.
30C
Hos
pita
l20
7A
6.2
A16
.9B
2.71
AFo
od o
r be
vera
ge s
tore
13
142
B9.
4B
36.7
B3.
91A
Non
-food
ret
ail s
tore
13
830
B13
.5B
13.4
B0.
99B
Oth
er*
76
958
A11
0.0
A10
4.4
A0.
95A
(Con
tinue
d)
Reg
ion
Prim
ary
acti
vity
Bui
ldin
gsFl
oor
spac
eEn
ergy
use
Ener
gy in
tens
ity
Q.I.
(mill
ions
of m
2 )Q
.I.(P
J)Q
.I.(G
J/m2 )
Q.I.
Prai
ries
Tota
l 1
05 5
19A
156.
1A
210.
9A
1.35
AO
ffice
bui
ldin
g (n
on-m
edic
al)
19
458
B31
.0B
47.7
B1.
54A
Med
ical o
ffice
bui
ldin
g 3
513
C3.
6B
4.0
C1.
12A
Elem
enta
ry o
r se
cond
ary
scho
ol 3
160
A16
.9B
14.4
A0.
85A
Nur
sing
or r
esid
entia
l car
e fa
cilit
y 1
415
B3.
1B
8.0
C2.
54A
War
ehou
se 1
0 00
8C
13.1
A13
.8A
1.05
AH
otel
or
mot
el 2
182
B–
F–
F1.
53B
Hos
pita
l17
4A
1.4
B3.
9B
2.74
AFo
od o
r be
vera
ge s
tore
8 6
75A
5.0
A16
.4A
3.25
AN
on-fo
od r
etai
l sto
re 1
6 09
2B
27.0
B32
.1C
1.19
AO
ther
* 4
0 84
2A
47.9
A60
.0A
1.25
ABr
itish
Col
umbi
aTo
tal
61
438
A86
.2A
85.1
B0.
99A
Offi
ce b
uild
ing
(non
-med
ical
) 9
718
B16
.0B
14.9
B0.
93A
Med
ical o
ffice
bui
ldin
g 1
692
B1.
8B
1.9
B1.
06A
Elem
enta
ry o
r se
cond
ary
scho
ol 3
014
A9.
8A
6.4
A0.
65A
Nur
sing
or r
esid
entia
l car
e fa
cilit
y 1
252
B1.
2B
1.9
B1.
63A
War
ehou
se–
F6.
8C
–F
0.84
BH
otel
or
mot
el–
F3.
6A
4.5
B1.
25A
Hos
pita
l13
6A
1.9
B3.
0B
1.58
AFo
od o
r be
vera
ge s
tore
5 4
53A
3.9
B10
.1B
2.55
AN
on-fo
od r
etai
l sto
re 1
0 12
6B
12.3
C7.
9B
0.65
AO
ther
* 2
5 40
4A
29.0
B–
F–
FC
anad
aTo
tal
482
266
A76
5.9
A84
2.2
A1.
10A
Offi
ce b
uild
ing
(non
-med
ical
) 8
3 58
3A
147.
5A
176.
6A
1.20
AM
edica
l offi
ce b
uild
ing
10
525
A9.
6A
10.5
A1.
09A
Elem
enta
ry o
r se
cond
ary
scho
ol 1
8 42
5A
83.6
A64
.4A
0.77
AN
ursin
g or
res
iden
tial c
are
faci
lity
6 4
82A
25.0
B39
.1B
1.56
AW
areh
ouse
32
879
A83
.0A
55.0
A0.
66A
Hot
el o
r m
otel
9 9
63C
19.7
B26
.5C
1.35
AH
ospi
tal
752
A15
.1A
36.5
A2.
42A
Food
or
beve
rage
sto
re 4
0 40
3A
29.3
A82
.7A
2.82
AN
on-fo
od r
etai
l sto
re 5
6 75
0A
68.9
A65
.2A
0.95
AO
ther
* 2
22 5
05A
284.
3A
285.
8A
1.01
A
Due
to
roun
ding
, num
bers
may
not
add
up
to t
he t
otal
sho
wn,
and
som
e nu
mbe
r m
ay d
iffer
from
one
tab
le t
o th
e ne
xt.
Qua
lity
indi
cato
rs (
Q.I.)
cla
ssify
eac
h es
timat
e ac
cord
ing
to it
s qu
ality
as
follo
ws:
A–E
xcel
lent
, B–G
ood,
C–A
ccep
tabl
e, D
–Use
with
cau
tion,
F–To
o un
relia
ble
to b
e pu
blish
ed a
nd X
–sup
pres
sed
due
to c
onfid
entia
lity.
See
the
“How
to r
ead
thes
e ta
bles
” sec
tion.
* O
ther
incl
udes
all
othe
r co
mm
erci
al b
uild
ings
. See
App
endi
x C
for
mor
e de
tails
.
Tabl
e F.
4 –
Build
ing
char
acte
ristic
s an
d en
ergy
use
by
regi
on a
nd p
rimar
y ac
tivity
(con
tinue
d)

138 Survey of Commercial and Institutional Energy Use – Buildings 2009
Notes
Recommended