April 2016
SAND AND GRAVEL EXTRACTION, STURTON LE STEEPLE
Surface Water Drainage and Monitoring
RE
PO
RT
Report Number 1543476.501/A.0
Distribution:
David L Walker - 1 copy (pdf)
Golder Associates (UK) Ltd - 1 copy
Submitted to:
David L Walker Limited Albion House 89 Station Road Eckington Sheffield S21 4FW

SURFACE WATER DRAINAGE AND MONITORING
April 2016 Report No. 1543476.501/A.0 i
Table of Contents
1.0 INTRODUCTION ........................................................................................................................................................ 1
2.0 SITE DESCRIPTION AND DRAINAGE ..................................................................................................................... 1
2.1 Geology ........................................................................................................................................................ 1
2.2 Groundwater Levels ...................................................................................................................................... 1
2.3 Greenfield Runoff Rate ................................................................................................................................. 1
3.0 WATER MANAGEMENT ........................................................................................................................................... 2
3.1 Extraction and Dewatering ............................................................................................................................ 2
3.2 Surface Water Management ......................................................................................................................... 2
3.2.1 Extraction Areas, Phases 1-7 .................................................................................................................. 2
3.2.2 Site Access ............................................................................................................................................. 3
3.2.2.1 Access Road Drain Crossings ............................................................................................................. 3
3.2.3 Conveyor Access Track .......................................................................................................................... 3
3.2.4 Plant Site ................................................................................................................................................. 4
3.3 Restored Site ................................................................................................................................................ 4
4.0 EROSION CONTROL ................................................................................................................................................ 4
5.0 MAINTENANCE PLAN .............................................................................................................................................. 5
5.1.1 Management and Maintenance ............................................................................................................... 5
5.1.2 Maintenance Programme ........................................................................................................................ 5
5.1.3 Frequency of Maintenance and Inspection ............................................................................................. 6
5.1.4 Inspection and Maintenance Records ..................................................................................................... 6
6.0 SURFACE WATER MONITORING PLAN ................................................................................................................. 6
6.1 Surface Water Level Monitoring and Threshold Levels ................................................................................ 6
6.2 Water Quality Monitoring and Environmental Assessment Limits ................................................................. 7
6.3 Record Keeping ............................................................................................................................................ 8
6.4 Monitoring Plan Review ................................................................................................................................ 8
7.0 SUMMARY ................................................................................................................................................................. 8
8.0 REFERENCES ........................................................................................................................................................... 9
TABLES
Table 1: Pumped Discharge Locations................................................................................................................................ 2
Table 2: Surface Water Discharge - Operating Areas ......................................................................................................... 3

SURFACE WATER DRAINAGE AND MONITORING
April 2016 Report No. 1543476.501/A.0 ii
Table 3: Surface Water Maintenance Programme .............................................................................................................. 5
Table 4: Water Level Monitoring ......................................................................................................................................... 6
Table 5: Laboratory Water Quality Suites............................................................................................................................ 7
Table 6: Plan of action......................................................................................................................................................... 8
FIGURES
No table of figures entries found.
APPENDICES
APPENDIX A Drawings
APPENDIX B Borehole Logs
APPENDIX C Surface Water Runoff Calculations
APPENDIX D Proposed Channel Realignment
APPENDIX E Restoration Plans
SURFACE WATER DRAINAGE AND MONITORING
April 2016 Report No. 1543476.501/A.0 1
1.0 INTRODUCTION
Golder Associates (UK) Ltd has been commissioned by David L Walker Limited (Agent for Tarmac) to prepare
a drainage scheme and monitoring programme to meet obligations under a legal agreement and allow the
discharge of Planning Condition 41 for the proposed quarry east of Sturton Le Steeple. The obligations and
planning condition are as follows:
Planning Condition 41 – “No development approved by this permission shall be commenced until a
scheme for the provision of surface water drainage works has been submitted to and been approved in
writing by the MPA (Mineral Planning Authority). The scheme shall incorporate sustainable drainage
principles and shall not result in an increase in the rate of surface water discharge to the local land
drainage system and provide a timetable for the implementation of these works. The drainage works
shall be completed and maintained in accordance with the approved details.”
Obligations – “A detailed management scheme which sets out steps to mitigate any indirect hydrological
changes within the Mother Drain and New Ings Drain which shall include the collection of survey data of
seasonal water levels, the methods to be used and the determinants to be measured to assess water
quality, the location of sampling points, the frequency of sampling both within and between years, the
duration of sampling over the operation of the Site, and the trigger levels to be adopted for water pumping
(for the avoidance of doubt such mitigation scheme should be implemented during active quarry
dewatering operations).”
2.0 SITE DESCRIPTION AND DRAINAGE
The proposed extraction area is located east of Sturton Le Steeple on agricultural land that is drained by a
series of surface water drains, notably Mother Drain to the east, New Ings Drain to the north and Catchwater
Drain to the west of the extraction area (the Site). Laneham Internal Drainage Board (the IDB) manage these
drains and also maintain the pumping station North of the Site, which are used to control water levels in the
IDB drains, discharging water to the River Trent. The Site layout is presented in Appendix A.
2.1 Geology
British Geological Survey Sheet 101 (solid and drift), East Retford (1998) indicates superficial deposits are
located on land east of Catchwater Drain, overlying Mercia Mudstone; to the west there are no recorded
superficial deposits above the Mercia Mudstone.
The Site geology within the extraction area typically comprises of the following formations:
Silty top soil with fine sand;
Silty clays and silt alluvium;
1st Terrace, featuring fine to medium sand with some gravel, overlying gravel; and
Mercia Mudstone bedrock.
Borehole records from WB 5/96 and WB 6/96 indicate clayey and sandy soils overlying sand, which is
approximately 1 m below ground level (bgl). The borehole records are presented in Appendix B.
2.2 Groundwater Levels
Groundwater levels presented in the Environmental Statement (SLR, 2006) indicate a typically shallow depth
to groundwater of approximately 1.3 m during winter recharge. The depth to groundwater increases to
approximately 1.6 m along the access road and is assumed to increase as ground levels to the west increase.
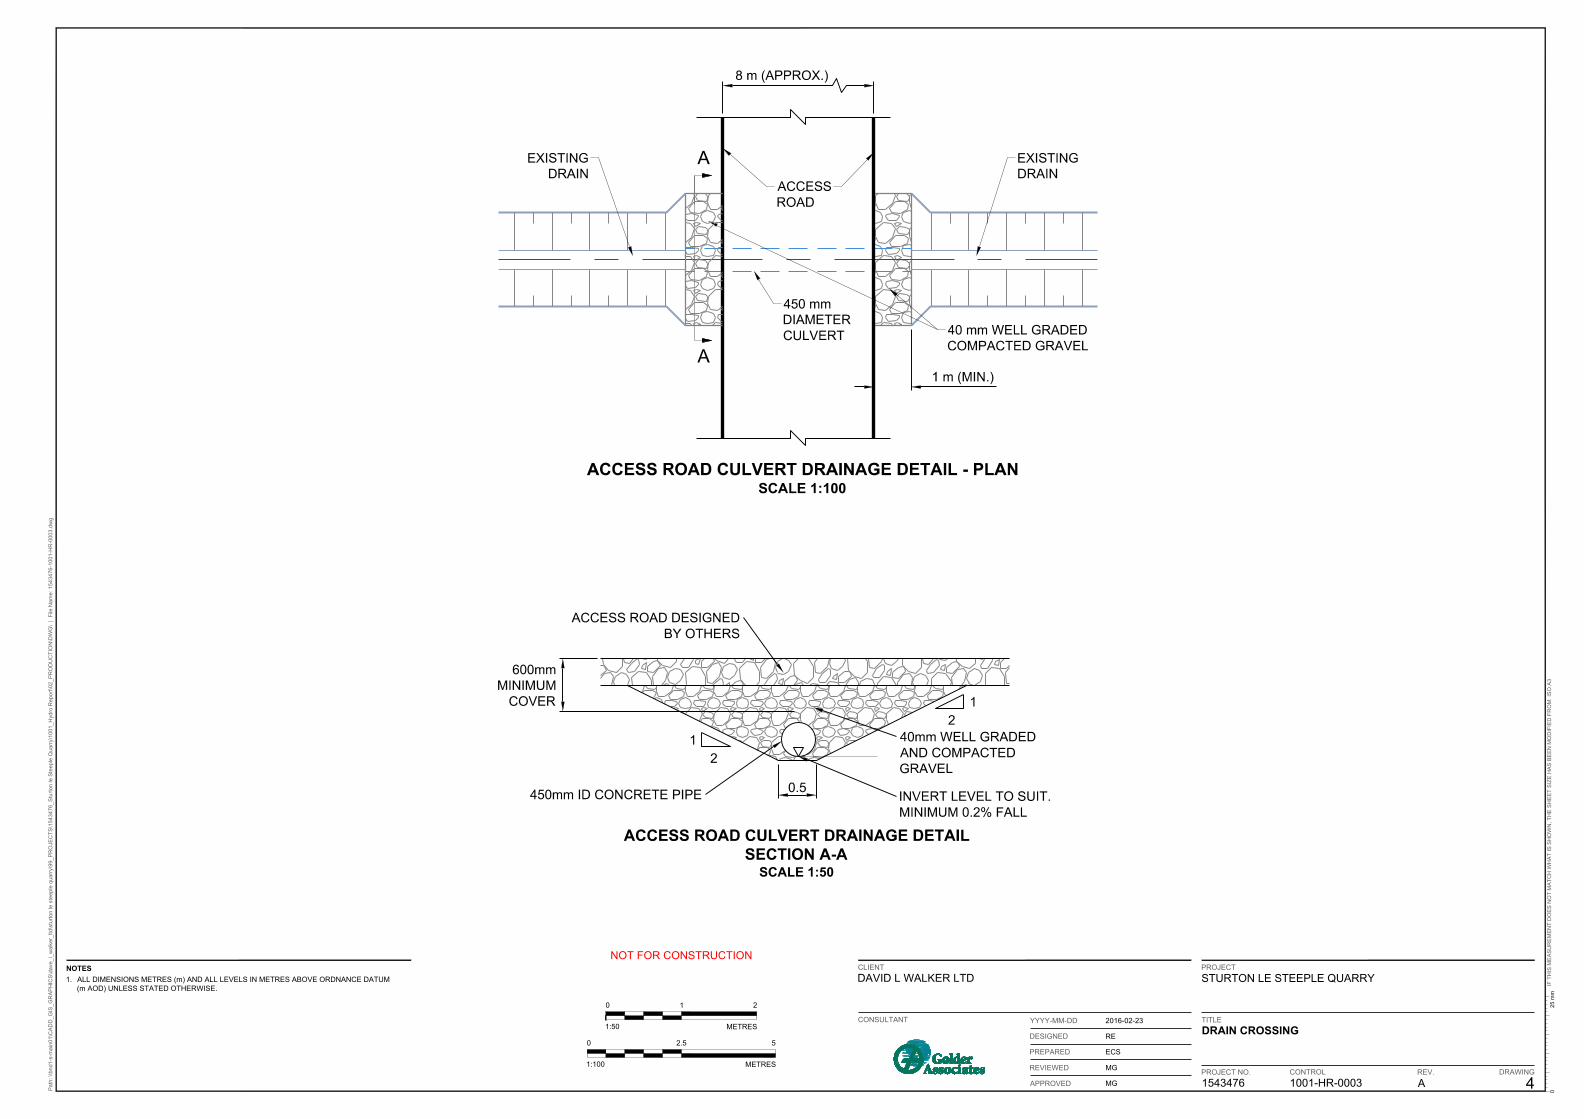
2.3 Greenfield Runoff Rate
Following a conversation with the IDB, a Greenfield runoff rate of 1.4 l/s/ha has been adopted for areas east
of Catchwater Drain.

SURFACE WATER DRAINAGE AND MONITORING
April 2016 Report No. 1543476.501/A.0 2
Greenfield runoff rate for the Site, calculated using the Institute of Hydrology (IoH) 124 method, is
approximately 3.5 l/s/ha. The underlying geology west of Catchwater Drain, comprising Mercia Mudstone, is
considered less permeable, consequently the Greenfield runoff is considered to be higher and therefore a rate
of 3.5 l/s/ha has been adopted for areas west of Catchwater Drain.
3.0 WATER MANAGEMENT
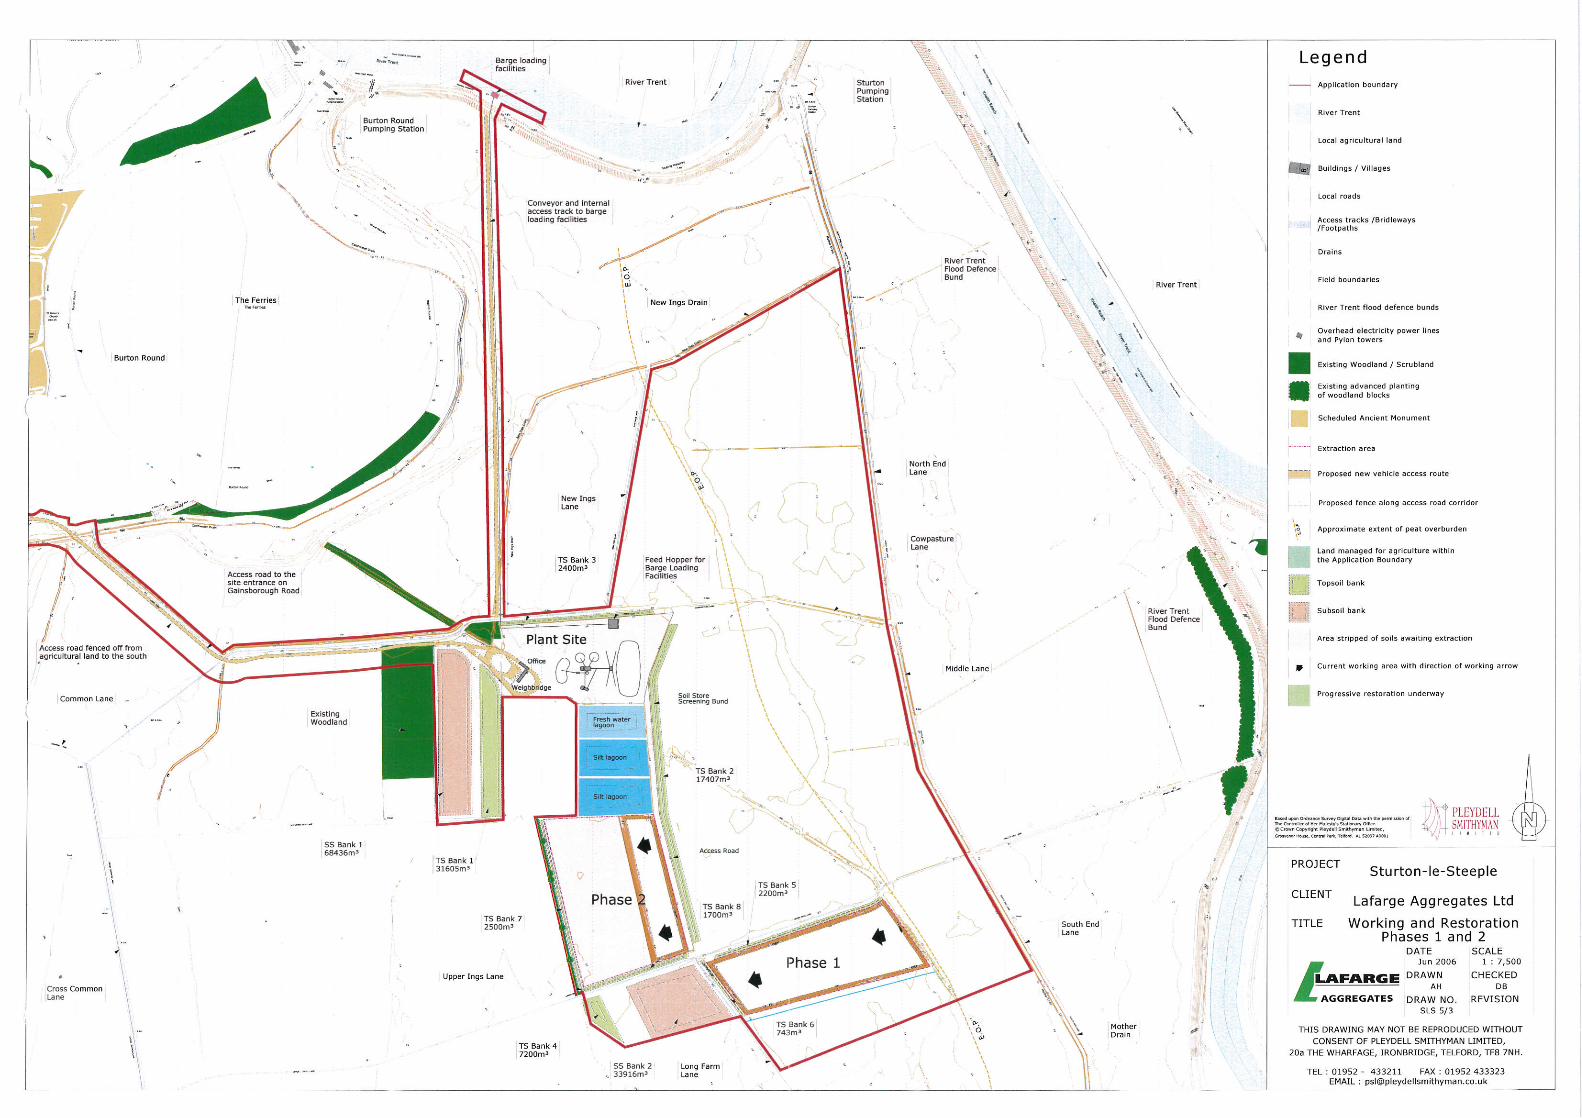
The proposed development of the Site will feature the construction of a 2.8 km Access Road, Plant site,
Conveyor and Access Track, Wharf and Lagoons. Following construction, the mineral will be extracted in 7
phases with progressive land restoration.
3.1 Extraction and Dewatering
Sand and gravel extraction will be in a phased approach, comprising 7 phases progressing in a generally
northerly direction. Phase 2 comprises just sand, therefore Phase 2 will need to be worked in parallel with
Phases 1, 3 and 4, which contain a gravel fraction, in order to provide an appropriate mix of aggregates. The
mineral will be worked dry by dewatering the individual phases of the extraction area. The rate of dewatering
is estimated to be 10 l/s (SLR, 2006). Water will be pumped to a recharge trench south of Phase 1 as
necessary and silt lagoons adjacent to the plant site, and the silt lagoon created in Phase 1. The silt lagoons
will allow suspended solids to settle out prior to discharge into surrounding drains (New Ings Drain and Mother
Drain), which will mitigate potential impacts of dewatering. Discharge locations will move progressively
northwards in parallel with extraction and are presented in Drawing 1 and listed in Table 1. The proposed
discharge locations will be revised should groundwater and surface water monitoring indicate the effects of
dewatering are having a greater or lesser impact than expected.
Table 1: Pumped Discharge Locations
Phase Pumped Discharge Location Watercourse
1-6 A Mother Drain
7 B Mother Drain
1-7 (Plant Site)* C New Ings Drain
*See Section 3.2.1
Discharge from the Site to New Ings Drain and Mother Drain will be controlled to the Greenfield runoff rate of
1.4 l/s/ha.
3.2 Surface Water Management
This section presents the surface water management scheme for the proposed Access Road and Plant site
area. Design drawings are presented in Appendix A.
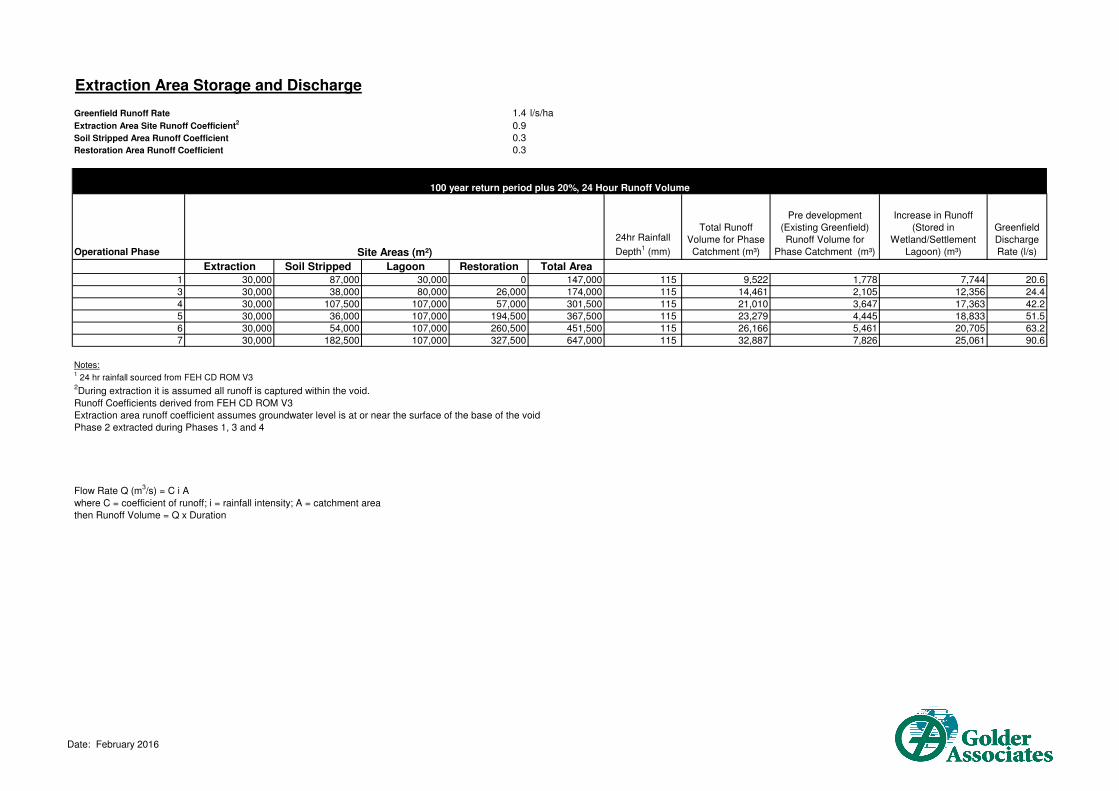
3.2.1 Extraction Areas, Phases 1-7
During the planned mineral extraction phases (which are stripped of topsoil and subsoil) will necessarily create
a void below existing ground level once the material has been removed. This means that the void will capture
surface water runoff. Runoff collecting in the voids will naturally soakaway into the permeable sand and gravels
or be pumped to a silt lagoon, prior to discharge. Surface water storage volume requirements and discharge
rates during a 1 in 100 year, 24 hour storm event including an allowance for climate change are provided in
Table 2. The total Greenfield discharge rate from mineral extraction, stripped soils, restored and lagoon areas
during each phase are also presented to provide the total discharge from these areas. Calculations are
presented in Appendix C.

SURFACE WATER DRAINAGE AND MONITORING
April 2016 Report No. 1543476.501/A.0 3
Table 2: Surface Water Discharge - Operating Areas
Phase
Total Area (Extraction, Soil Stripped, Restored and Lagoons) (m2)
Increase in Runoff (Stored in Wetland/Silt Lagoon) (m3)
Greenfield Discharge Rate (l/s)
1 147,000 7,744 20.6
2 174,000 12,356 24.4
4 301,500 17,363 42.2
5 367,500 18,833 51.5
6 451,500 20,705 63.2
7 647,000 25,061 90.6
Phase 2 in parallel with Phases 1, 3 and 4. See Section 3.1.
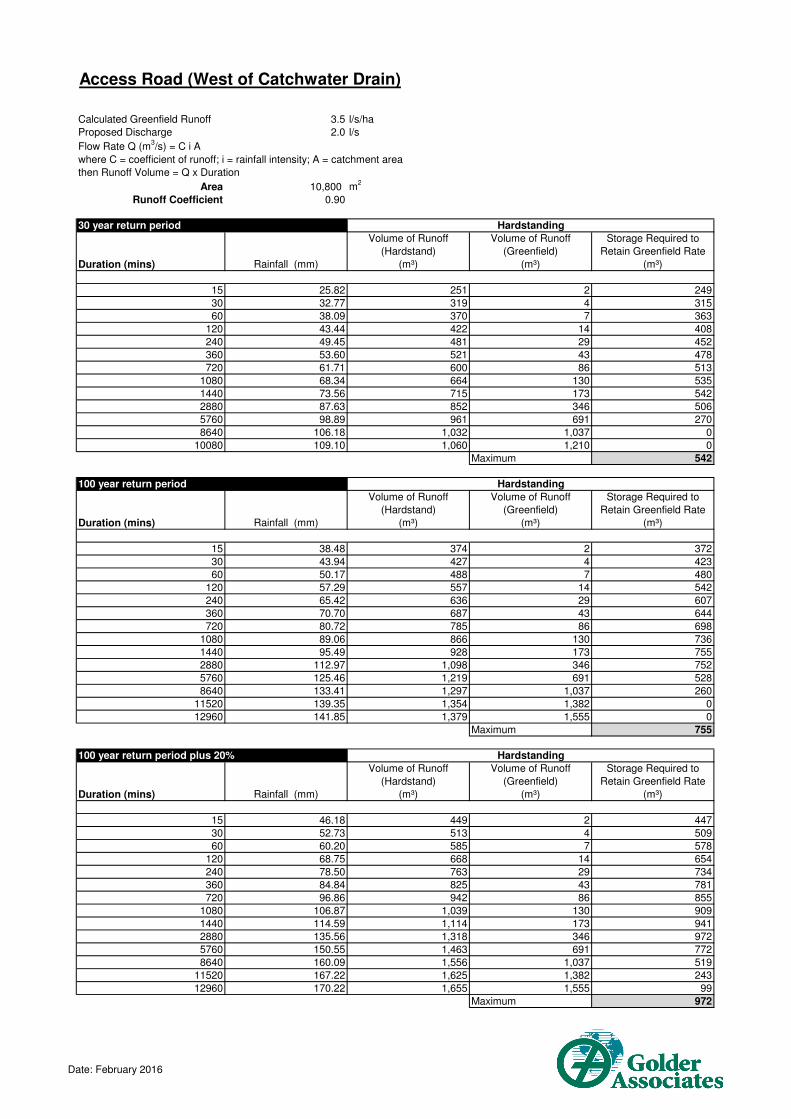
3.2.2 Site Access
The Access Road is approximately 2.8 km long and approximately 8 m wide. Runoff from the impermeable
road surface, which is approximately 22,400 m2, will be managed by roadside grass filter strips, swales and
check dams, providing 2 stages of water quality treatment prior to discharge. The access road is broken into
three distinct drainage areas, two west of Catchwater Drain, where the relatively impermeable geology is not
suitable for infiltration and will therefore feature a controlled discharge to nearby drains, and one east of
Catchwater Drain, where surface water runoff will be contained within the roadside swale and infiltrate to
ground. Roads will be graded towards the grass filter strip, which will be a minimum 1 m wide and sloping at
1%-5% towards the adjacent swale. The proposed swale dimensions are as follows:
Depth = 0.4 m
Base width = 0.4 m
Side Slope = 1V:4H
Top Width = 3.6 m
Check dams will be installed to promote infiltration and provide surface water storage. Surface water discharge
from the two swales west of Catchwater Drain (see Drawing 1) will be controlled by a vortex control device to
2 l/s. The swale east of Catchwater Drain is subject to infiltration testing but has been designed based on a
conservative infiltration rate of 1 x 10⁻⁶ and guidance provided in The SUDS Manual (CIRIA, 2015); nearby
borehole logs indicate a sandy soil media. A shallow swale is recommended so as not to inhibit maintenance
and maximise the depth to groundwater.
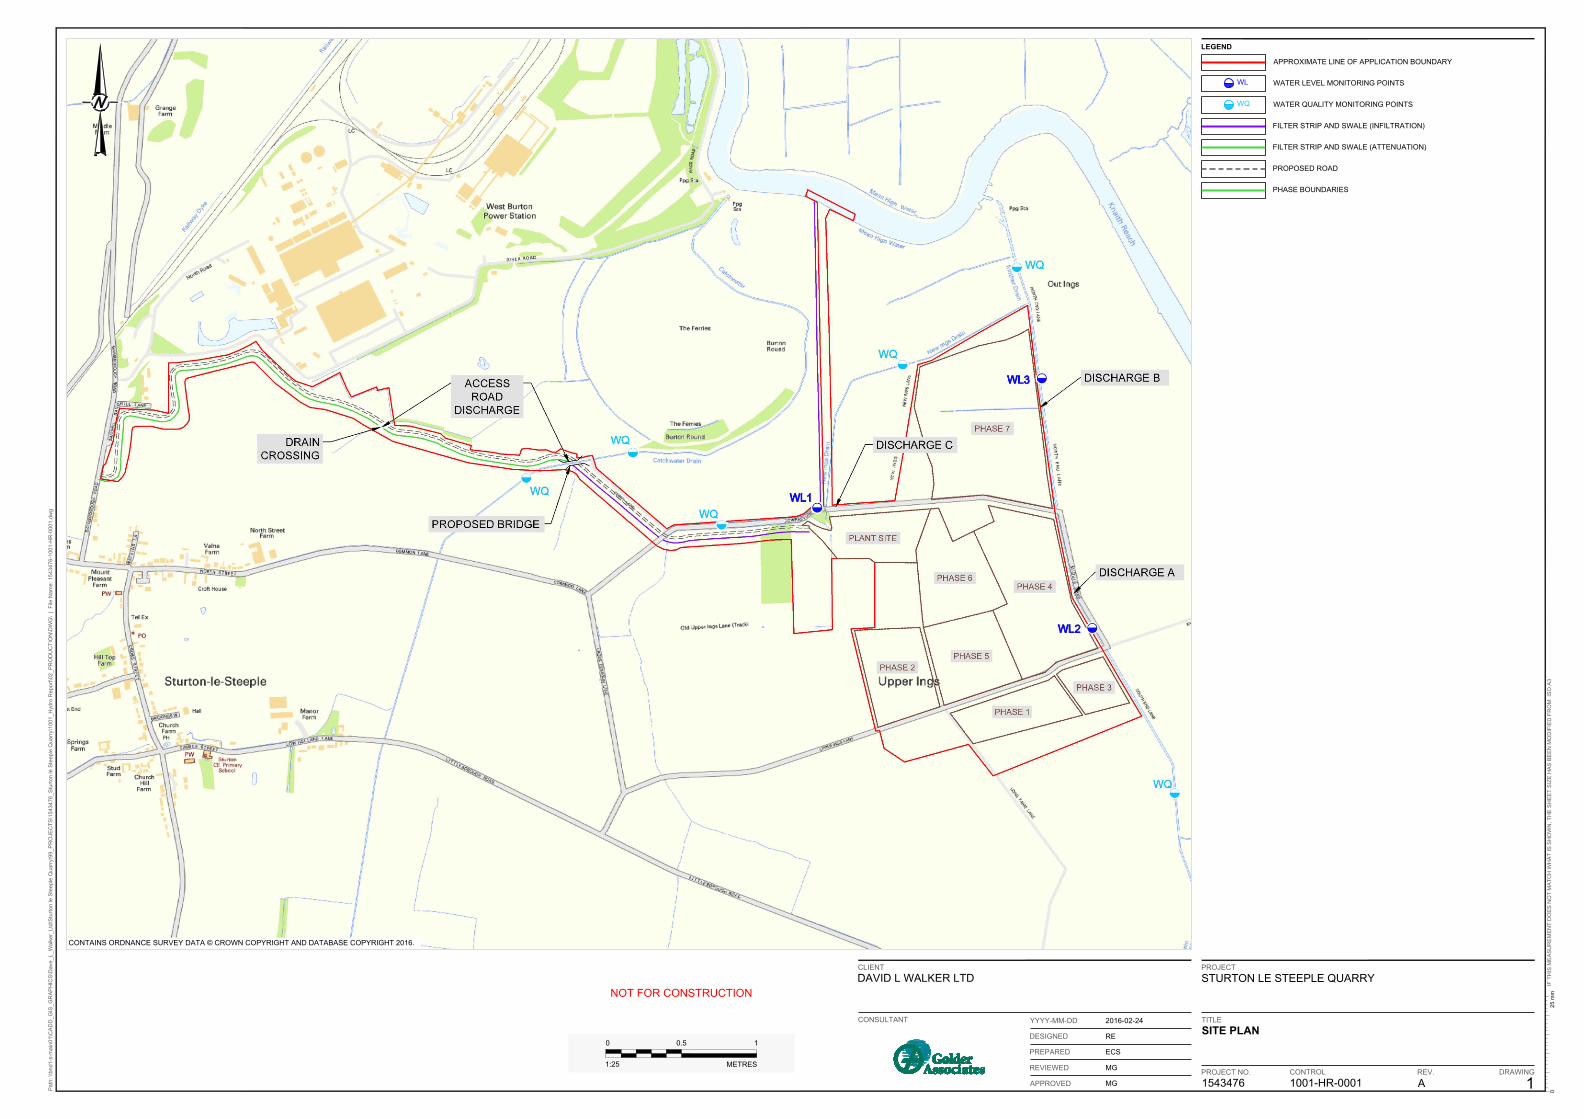
3.2.2.1 Access Road Drain Crossings
The proposed Access Road will cross a small drain west of the Catchwater Drain. Peak flow at this location
during a 1 in 100 year, plus an allowance for climate change, is approximately 0.12 m3/s. Peak flow has been
estimated using the Revitalised Flood Hydrograph (ReFH) method. In order to convey this flow the crossing
will be culverted with a minimum pipe diameter of 0.45 m. We understand that a bridge crossing will be installed
over Catchwater Drain, which will be designed not to impact flow within drain.
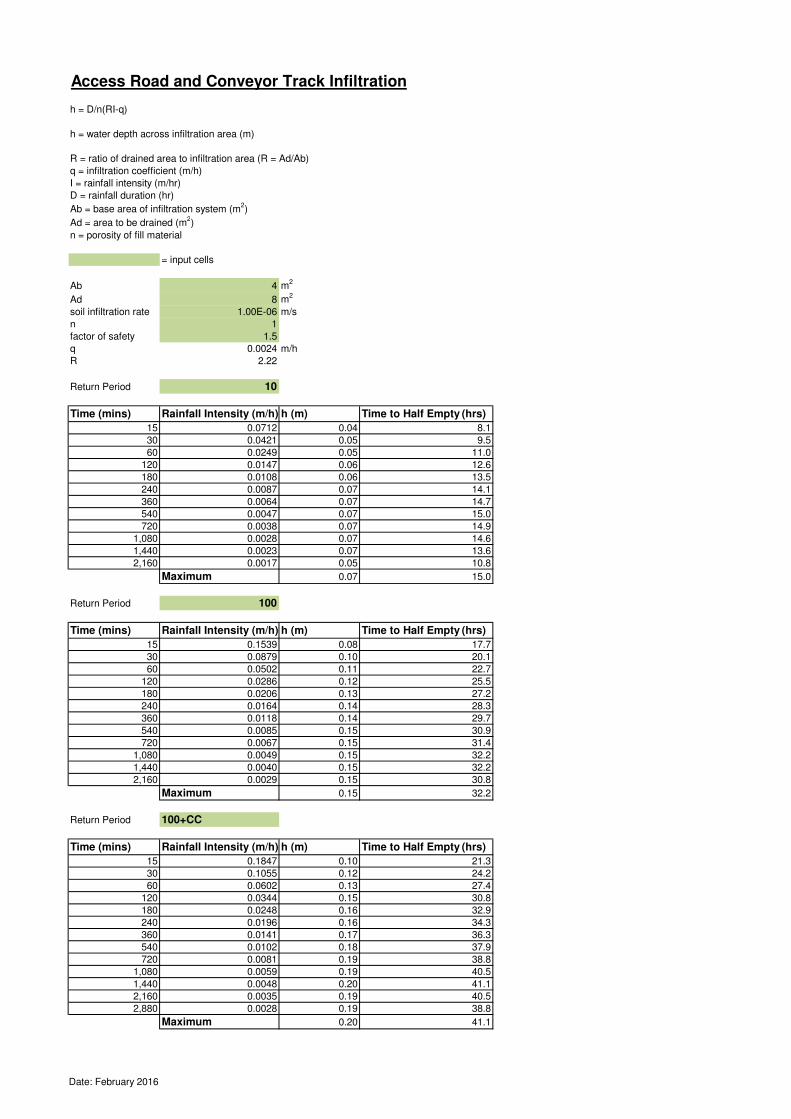
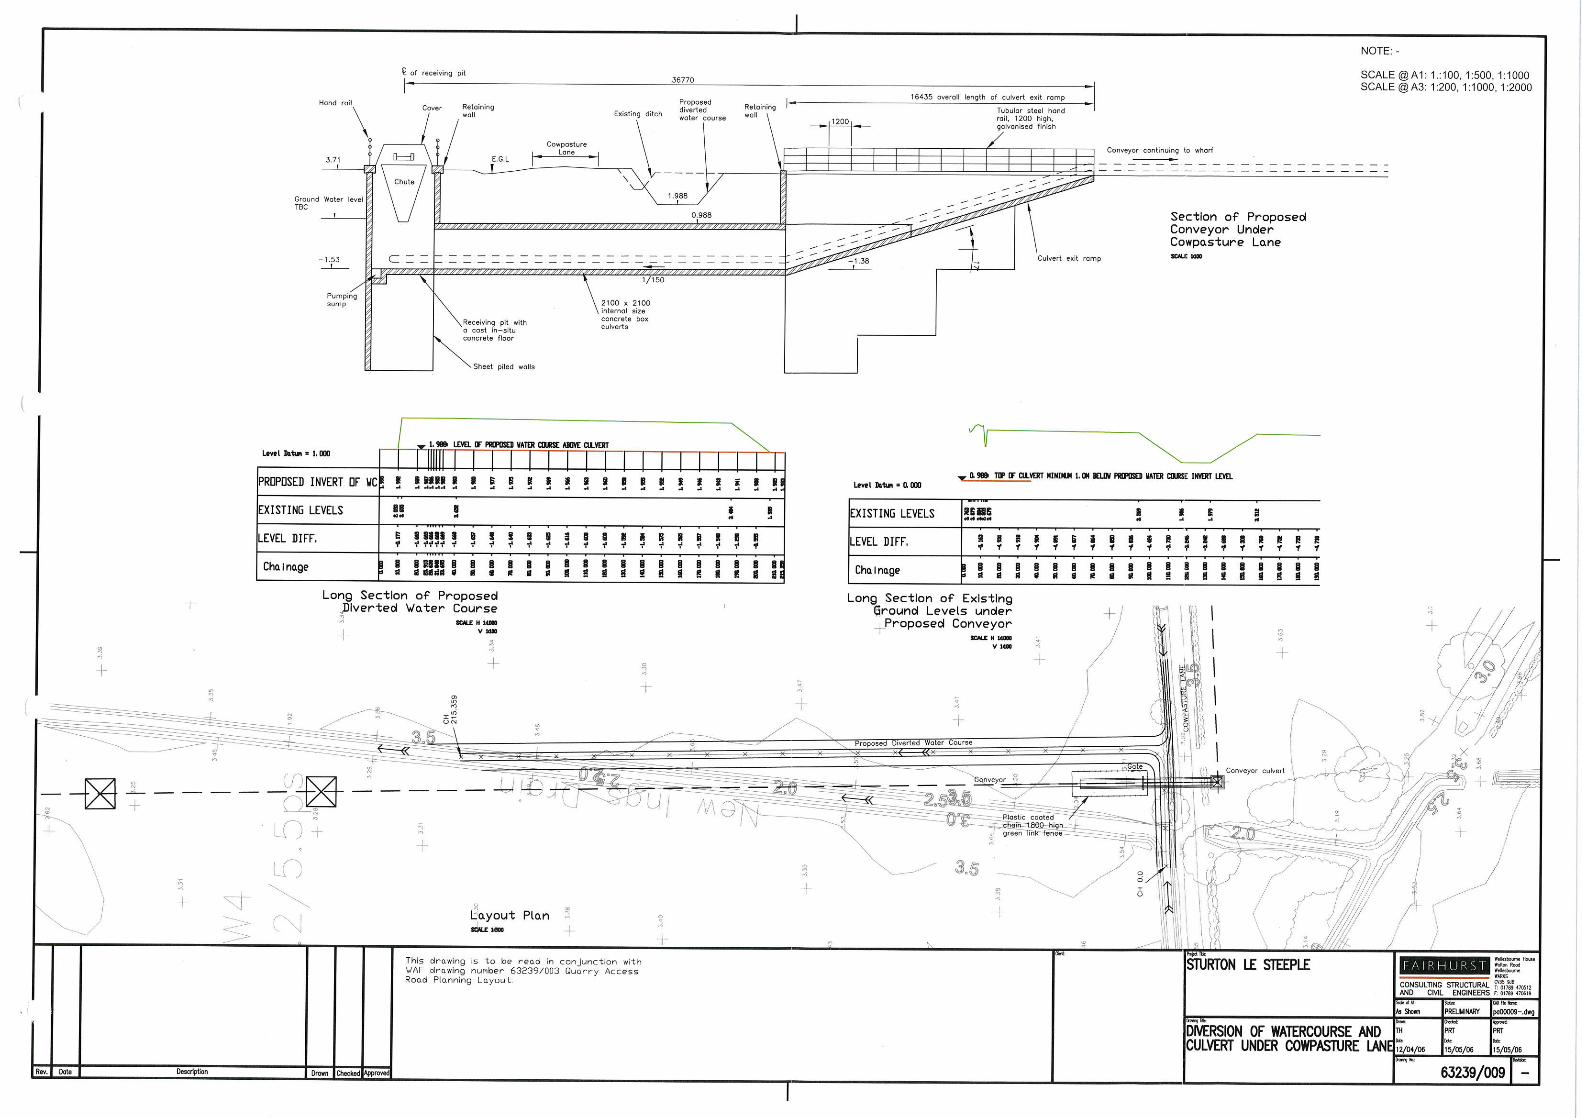
3.2.3 Conveyor Access Track
Runoff from the Conveyor Access Track will be managed by filter strips, check dams and infiltration within a
swale, as per the Site Access Road.
The Conveyor and Access Track will require the realignment of New Ings Drain and a culvert to allow access
from the plant site, across Cowpasture Lane and over New Ings Drain. Peak flow at this location during a 1 in
100 year, plus an allowance for climate change, is approximately 0.24 m3/s. Peak flow has been estimated
using the ReFH method. In order to convey this flow the crossing will be culverted with a minimum pipe

SURFACE WATER DRAINAGE AND MONITORING
April 2016 Report No. 1543476.501/A.0 4
diameter of 0.6 m. The dimensions of the realigned channel section of New Ings Drain will be as per the
existing channel dimensions, which are approximately as follows:
Base Width = 2 m
Depth = 3 m
Side Slope = 1V:1.5H
Appendix D presents the proposed channel realignment.
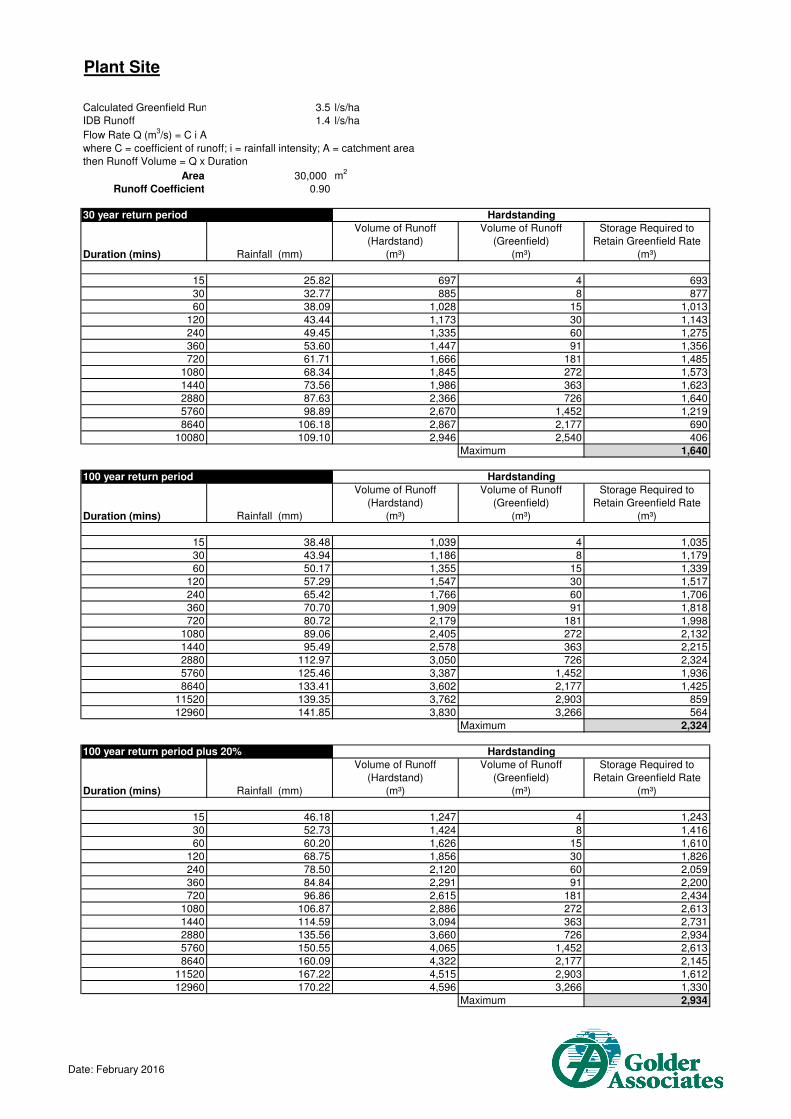
3.2.4 Plant Site
Runoff from the Plant Site area will be managed within the silt and fresh water lagoons to the south and
discharged to New Ings Drain at a rate no greater than 1.4 l/s/ha. Based on a Plant Site area of 3.0 ha, this
equates to 4.2 l/s.
The silt lagoon and freshwater lagoon will be managed to ensure a minimum volume of 2,900 m3 is always
available to accommodate surface water runoff from the Plant Site for all rainfall events up to and including the
1 in 100 year plus an allowance for climate change. Volume calculations are presented in Appendix C.
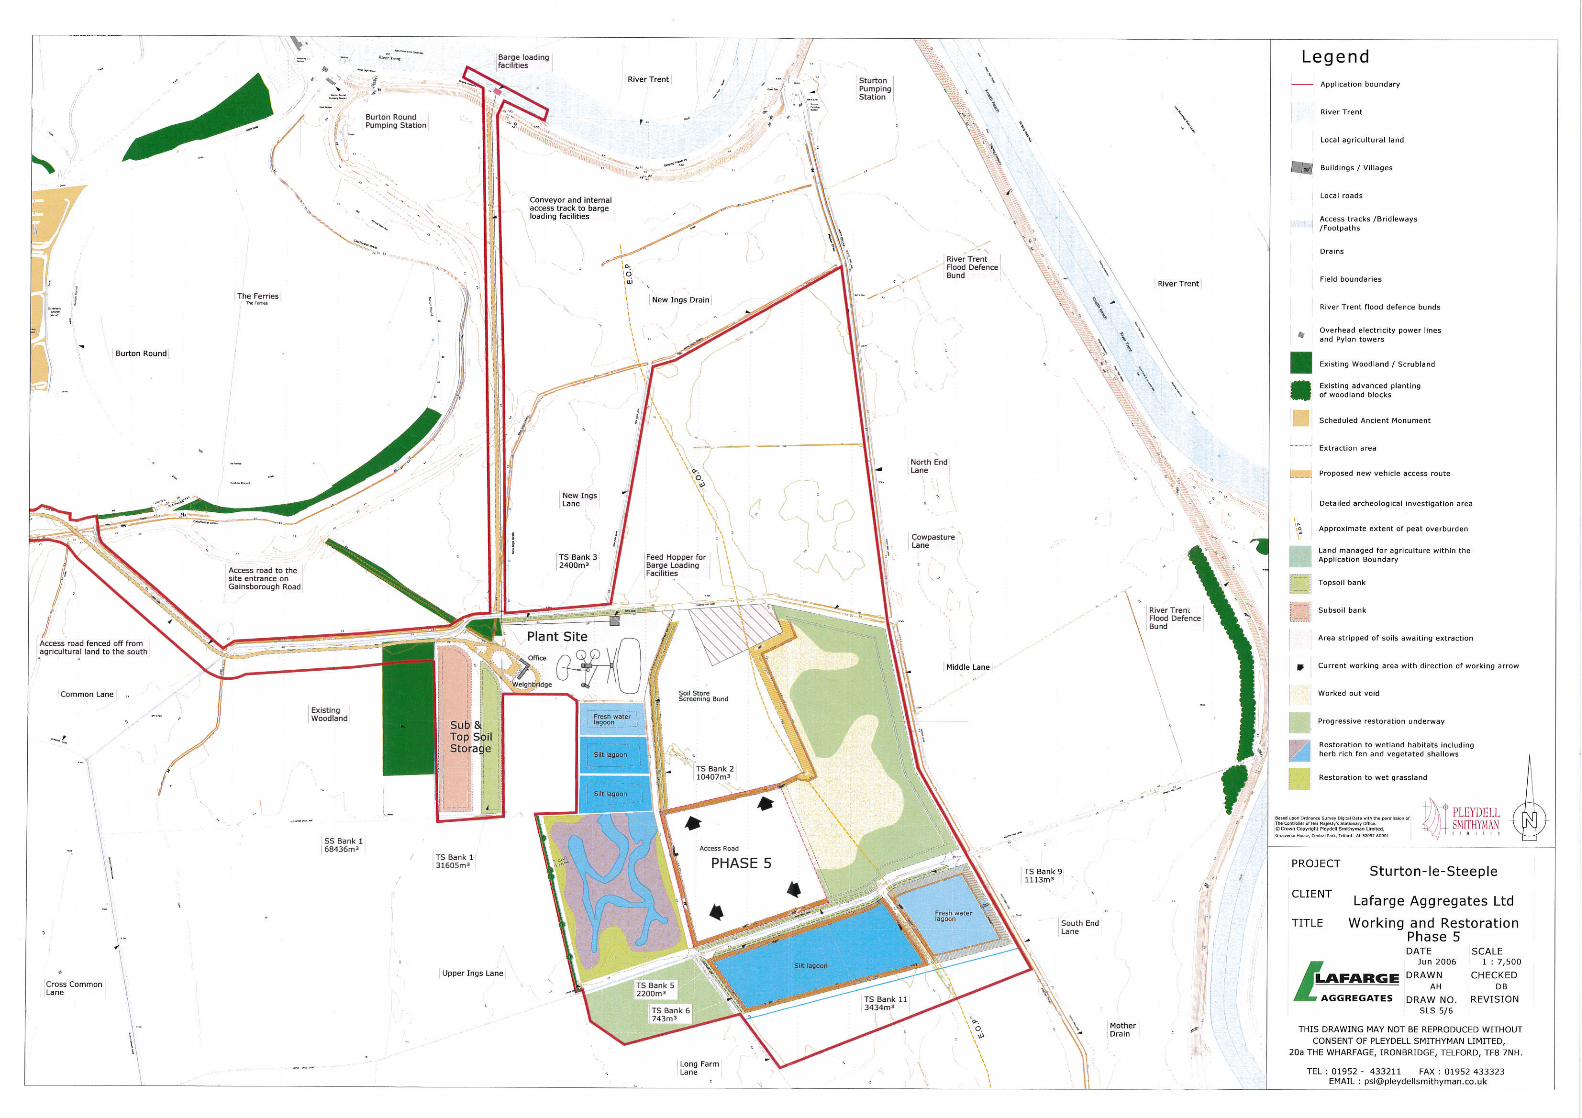
3.3 Restored Site
The proposed restoration plans for the Site are presented in Appendix E. Overburden stored during the
extraction phases will be used in the restoration of the Site and all hardstanding surfaces, with the exception
of the main access road, will be removed and returned to Greenfield conditions; infiltration and runoff will mimic
existing conditions. Ground levels will predominantly be lower than existing, creating an open water/wetland
habitat. Restoration of the site will progress as extraction moves between phases; progressive restoration will
minimise the area of exposed soils, curtailing the potential for erosion. Once the Site is fully restored and
vegetation becomes established, surface water quality and quantity will therefore be comparable to Greenfield
conditions.
4.0 EROSION CONTROL
A range of erosion control measures can be implemented at the Site to reduce erosion of exposed soils which
will promote reduced concentrations of total suspended solids in surface water at the Site. Typical measures
include:
Areas which are subject to earthworks will be restored as quickly as possible by dressing with topsoil and
planting in accordance with the restoration plan;
Long term stockpiles or bare earth slopes will be stabilised by seeding with grass seed;
To manage erosion prior to the establishment of a vegetative cover, temporary silt fences will be installed
at the base of the stockpiles located adjacent to surface water drains. Silt fences will be removed
following the establishment of a vegetative cover;
Allow for a standoff areas at the base of stockpiles to act as a buffer/filter strips. Grass should be left
dense and long to maximise this benefit. An additional 9 m of standoff, is required to allow the IDB access
for drain maintenance, is required for Mother Drain, New Ings Drain and Catchwater Drain;
Large stockpiles will be developed with benches that will act as a water break, minimising the formation
of rills and gullies;
Where practicable, internal access/haul roads will be aligned to drain laterally rather than along the length
of the road; and
The beds and banks at the discharge points to Mother Drain, New Ings Drain and Catchwater Drain will
be suitably protected, subject to consent from the IDB.
SURFACE WATER DRAINAGE AND MONITORING
April 2016 Report No. 1543476.501/A.0 5
5.0 MAINTENANCE PLAN
A surface water drainage maintenance plan for the Site has been prepared to ensure that the surface water
drainage system will be suitably maintained to remain functional during quarry operations to reduce the risk of
flooding to and from the Site, and manage suspended sediment.
Accumulated sediment within surface water control features shall be removed to ensure the design capacity
of surface water infrastructure is maintained. All infrastructure is to be maintained throughout operation of the
Site.
Neglecting to maintain the drainage system may result in reduced performance and could lead to eventual
failure (overtopping, increased risks of flooding, reduced water quality etc). Preventative maintenance will
reduce costs associated with repairing and the potential replacement of surface water infrastructure. Following
extreme rainfall events (outside of the deign parameters) repair to infrastructure may be necessary where it
has been undermined, washed out or sediment build-up has reduced the efficiency of drains.
5.1.1 Management and Maintenance
Management and maintenance of surface water drainage for the development will be the responsibility of
Tarmac as the Site operator. To ensure the reliability of the surface water drainage system, it should be
inspected, maintained and repaired on a regular basis by Tarmac. In particular inspections should be
undertaken prior, during and after significant rainfall or fluvial flooding events on Site. Inspection of the
drainage system should be undertaken by experienced and competent personnel. A suitably experienced and
competent staff member shall be appointed by Tarmac to take responsibility for the management and
maintenance of the drainage system. It is recommended a secondary competent person also be appointed
for instances when the primary staff member is unavailable.
5.1.2 Maintenance Programme
A maintenance programme for the surface water drainage infrastructure within the Site which includes the
recommended maintenance/inspection frequency that should be undertaken is provided within Table 3.
Table 3: Surface Water Maintenance Programme
Item Description Frequency
Site Drainage System Inspection/Audit
Routine site inspection/audit of the surface water drainage system
Inspection of all the components of the surface water drainage system and identify deficiencies and where maintenance and/or repair is required.
Quarterly and before/after heavy rainfall or fluvial flooding events within the Site.
Drainage channels and Swales
Channels and swales Inspection for scour and cleaned of silt/sediment and debris.
Monthly and before/after heavy rainfall or fluvial flooding events within the Site.
Rock check dams
Upstream of dams to be cleaned of silt/sediment and repair to rock dams where damaged or scoured.
Monthly and before/after heavy rainfall or fluvial flooding events within the Site.
Discharge control structures/outlets
Outlets to be inspected and cleaned of silt/sediment and debris.
Monthly and before/after heavy rainfall or fluvial flooding events within the Site.
Road Culverts
Culvert pipework Inspection for pipe blockages and cleaned of silt/sediment and debris.
Monthly and before/after heavy rainfall or fluvial flooding events within the Site.
SURFACE WATER DRAINAGE AND MONITORING
April 2016 Report No. 1543476.501/A.0 6
Item Description Frequency
Culvert inlets and outlets Inspection for scour and cleaned of silt/sediment and debris.
Monthly and before/after heavy rainfall or fluvial flooding events within the Site.
Sediment Control Devices
Silt Fences Inspection and cleaned of silt/sediment and debris
Monthly and before/after heavy rainfall or fluvial flooding events within the Site.
5.1.3 Frequency of Maintenance and Inspection
An assessment of the adequacy of the frequency of inspections and silt/sediment cleaning should be
undertaken by Tarmac in one, three and twelve month periods following commissioning of the surface water
drainage system. Based on this assessment a more (or less) frequent inspection and maintenance programme
may be more appropriate and should be updated and implemented as required.
5.1.4 Inspection and Maintenance Records
It is recommended a written record of routine inspections and maintenance be maintained on site throughout
quarry operation and should include the following:
Date;
Personnel;
Items inspected/maintained;
Maintenance/repairs undertaken;
Recommended replacement/maintenance/repairs that couldn’t be completed on record date (if any); and
Recommendations for further inspections.
6.0 SURFACE WATER MONITORING PLAN
This section details surface water monitoring and thresholds for cessation of pumping from the mineral
workings so as not to exacerbate flooding or reduce water quality in the receiving drains.
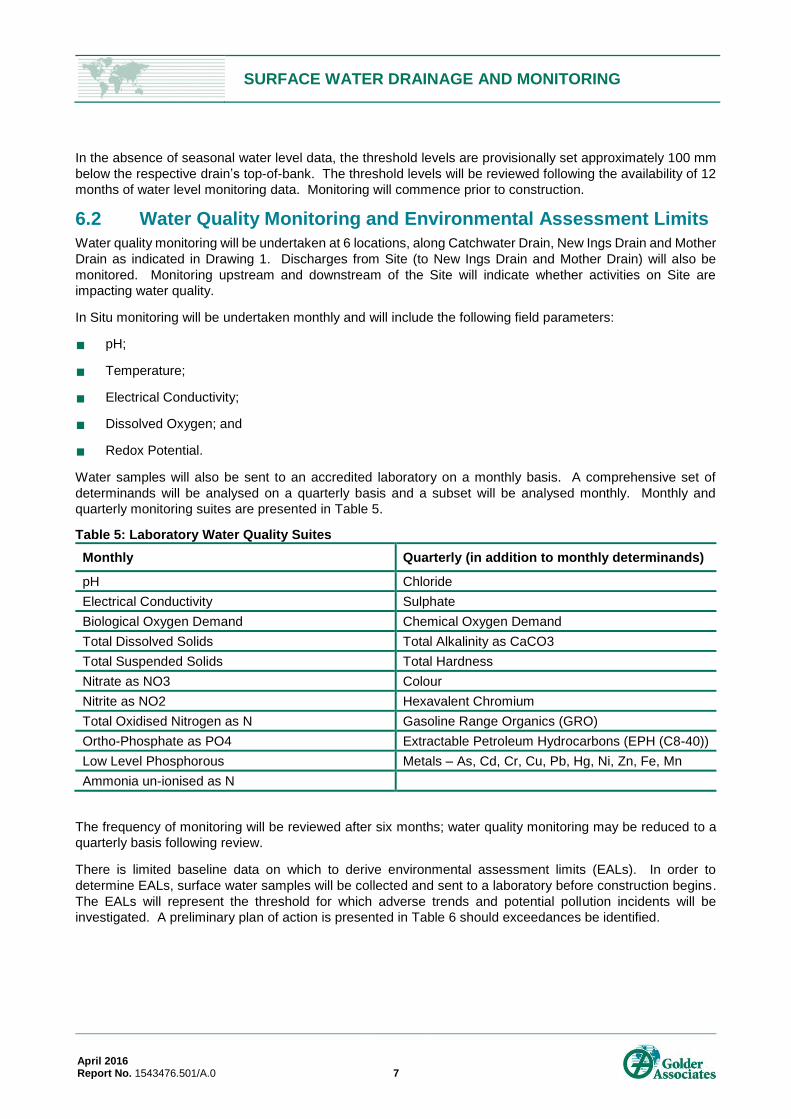
6.1 Surface Water Level Monitoring and Threshold Levels
Surface water level monitoring will be undertaken at two locations as indicated in Drawing 1. Gauge boards
will be installed prior to construction and surveyed within three months of installation. Surface water levels in
New Ings Drain and Mother Drain will be recorded by reading the surface water level, to the nearest 0.01 m,
on the gauge board.
The provisional threshold for cessation of dewatering/pumping is presented in Table 4.
Table 4: Water Level Monitoring
Monitoring Location Drain Threshold (mAOD) Monitoring Frequency
WL1 New Ings Drain 3.2 mAOD Daily – increase frequency following prolonged and heavy rainfall if water levels approach the threshold level.
WL2 Mother Drain 2.9 mAOD
WL3 Mother Drain 2.8 mAOD
SURFACE WATER DRAINAGE AND MONITORING
April 2016 Report No. 1543476.501/A.0 7
In the absence of seasonal water level data, the threshold levels are provisionally set approximately 100 mm
below the respective drain’s top-of-bank. The threshold levels will be reviewed following the availability of 12
months of water level monitoring data. Monitoring will commence prior to construction.
6.2 Water Quality Monitoring and Environmental Assessment Limits
Water quality monitoring will be undertaken at 6 locations, along Catchwater Drain, New Ings Drain and Mother
Drain as indicated in Drawing 1. Discharges from Site (to New Ings Drain and Mother Drain) will also be
monitored. Monitoring upstream and downstream of the Site will indicate whether activities on Site are
impacting water quality.
In Situ monitoring will be undertaken monthly and will include the following field parameters:
pH;
Temperature;
Electrical Conductivity;
Dissolved Oxygen; and
Redox Potential.
Water samples will also be sent to an accredited laboratory on a monthly basis. A comprehensive set of
determinands will be analysed on a quarterly basis and a subset will be analysed monthly. Monthly and
quarterly monitoring suites are presented in Table 5.
Table 5: Laboratory Water Quality Suites
Monthly Quarterly (in addition to monthly determinands)
pH Chloride
Electrical Conductivity Sulphate
Biological Oxygen Demand Chemical Oxygen Demand
Total Dissolved Solids Total Alkalinity as CaCO3
Total Suspended Solids Total Hardness
Nitrate as NO3 Colour
Nitrite as NO2 Hexavalent Chromium
Total Oxidised Nitrogen as N Gasoline Range Organics (GRO)
Ortho-Phosphate as PO4 Extractable Petroleum Hydrocarbons (EPH (C8-40))
Low Level Phosphorous Metals – As, Cd, Cr, Cu, Pb, Hg, Ni, Zn, Fe, Mn
Ammonia un-ionised as N
The frequency of monitoring will be reviewed after six months; water quality monitoring may be reduced to a
quarterly basis following review.
There is limited baseline data on which to derive environmental assessment limits (EALs). In order to
determine EALs, surface water samples will be collected and sent to a laboratory before construction begins.
The EALs will represent the threshold for which adverse trends and potential pollution incidents will be
investigated. A preliminary plan of action is presented in Table 6 should exceedances be identified.

SURFACE WATER DRAINAGE AND MONITORING
April 2016 Report No. 1543476.501/A.0 8
Table 6: Plan of action
Step Action
1 Notify the EA/IDB of the exceedance of the EAL.
2 Carry out an on-site inspection to identify the potential source(s) of the exceedance. Review any changes to site operations and procedures.
3 If the source is identified, carry out applicable mitigation and inform the EA/IDB of the action taken.
4 If no source is identified, repeat the measurement/analysis in upstream and downstream locations within two weeks.
5
If results of the repeat sampling also exceed the EAL and indicate the Site is a source, sampling up and downstream should continue on a fortnightly basis for 2 months. Data will be reviewed for the presence of any trends or patterns indicating an ongoing contamination event.
6
If the laboratory results from the monitoring show no indications of decline over a two month period, and the evidence indicates that site activities is the most likely cause of the decrease in water quality, then appropriate mitigation will be carried out the EA/IDB informed of the action taken.
6.3 Record Keeping
Electronic records will be kept for each monitoring round; for each monitoring location this shall include the
following:
Sampling point monitored;
Date and time of monitoring;
Monitoring personnel; and
Observations, including recent/current weather.
Water level monitoring locations will include the following:
Gauge board water level; and
Calculated surface water elevation in mAOD.
Water quality monitoring locations will include the following:
Field parameters (In Situ); and
Laboratory results.
6.4 Monitoring Plan Review
The surface water monitoring plan will be reviewed on an annual basis considering performance and Site
development over the monitoring period. Amendments to the monitoring plan will be agreed with the Mineral
Planning Authority (MPA), Environment Agency (EA) and IDB.
7.0 SUMMARY
Surface water management during operations has been designed to control surface water runoff for all
events up to and including the 1 in 100 year rainfall event, plus an allowance for climate change.
Two stages of treatment will be provided to manage surface water runoff quality from the access road
and discharge either to nearby drains or infiltrate to ground.

SURFACE WATER DRAINAGE AND MONITORING
April 2016 Report No. 1543476.501/A.0 9
Surface water runoff within the operational area of the Site will be manged by silt lagoons, settling out
solids before discharging at the Greenfield runoff rate to New Ings Drain and Mother Drain.
Preliminary threshold levels for pumping to New Ings Drain and Mother Drain have been established and
will be reviewed as more data becomes available.
Regular water level and water quality monitoring will be undertaken prior to and during operations to
ensure the development does not have any direct or indirect hydrological impacts to Mother Drain and
New Ings Drain.
8.0 REFERENCES
BGS, 1998. East Retford, Solid and Drift, Sheet 101, 1:50,000.
CIRIA, 2015. The SuDS Manual. C753
IoH, 1994. Institute of Hydrology, Report No. 124, Flood Estimation for Small Catchments
SLR, 2006. Sturton Le Steeple Quarry, Environmental Impact Assessment.

SURFACE WATER DRAINAGE AND MONITORING
April 2016 Report No. 1543476.501/A.0
APPENDIX A Drawings
025
mm
1543476CONTROL1001-HR-0001
DRAWING
1A
2016-02-24
ECS
RE
MG
MG
STURTON LE STEEPLE QUARRY
DAVID L WALKER LTD
SITE PLAN TITLE
PROJECT NO. REV.
PROJECTCLIENT
CONSULTANT
DESIGNED
PREPARED
REVIEWED
APPROVED
YYYY-MM-DD
Path
: \\b
nd1-
s-m
ain0
1\C
ADD
_GIS
_GR
APH
ICS\
Dav
e_L_
Wal
ker_
Ltd\
Stur
ton
le S
teep
le Q
uarry
\99_
PRO
JEC
TS\1
5434
76_S
turto
n le
Ste
eple
Qua
rry\1
001_
Hyd
ro R
epor
t\02_
PRO
DU
CTI
ON
\DW
G\
| Fi
le N
ame:
154
3476
-100
1-H
R-0
001.
dwg
IF T
HIS
MEA
SUR
EMEN
T D
OES
NO
T M
ATC
H W
HAT
IS S
HO
WN
, TH
E SH
EET
SIZE
HAS
BEE
N M
OD
IFIE
D F
RO
M: I
SO A
3
NOT FOR CONSTRUCTION
0
1:25
0.5 1
METRES
APPROXIMATE LINE OF APPLICATION BOUNDARY
WATER LEVEL MONITORING POINTS
WATER QUALITY MONITORING POINTS
LEGEND
MISCWQ
MISCWL
FILTER STRIP AND SWALE (ATTENUATION)
PROPOSED ROAD
CONTAINS ORDNANCE SURVEY DATA © CROWN COPYRIGHT AND DATABASE COPYRIGHT 2016.
FILTER STRIP AND SWALE (INFILTRATION)
PHASE BOUNDARIES

025 m
m
1543476
CONTROL
1001-HR-0002
DRAWING
2
A
2016-02-23
ECS
RE
MG
MG
STURTON LE STEEPLE QUARRY
DAVID L WALKER LTD
GENERAL DETAILS
TITLE
PROJECT NO. REV.
PROJECTCLIENT
CONSULTANT
DESIGNED
PREPARED
REVIEWED
APPROVED
YYYY-MM-DD
Path: \\bnd1-s-m
ain01\C
AD
D_G
IS
_G
RA
PH
IC
S\dave_l_w
alker_ltd\sturton le steeple quarry\99_P
RO
JE
CT
S\1543476_S
turton le S
teeple Q
uarry\1001_H
ydro R
eport\02_P
RO
DU
CT
IO
N\D
WG
\ | F
ile N
am
e: 1543476-1001-H
R-0002.dw
g
IF
T
HIS
M
EA
SU
RE
ME
NT
D
OE
S N
OT
M
AT
CH
W
HA
T IS
S
HO
WN
, T
HE
S
HE
ET
S
IZ
E H
AS
B
EE
N M
OD
IF
IE
D F
RO
M: IS
O A
3
1:20
0 1
METRES
0.5
NOT FOR CONSTRUCTION
0
1:25
0.5 1
METRES
NOTES
1. ALL DIMENSIONS METRES (m) AND ALL LEVELS IN METRES ABOVE ORDNANCE DATUM
(m AOD) UNLESS STATED OTHERWISE.
2. TYPICAL SILT FENCE DETAIL TO BE INCORPORATED AT THE BASE OF SLOPES AT
STORAGE AREAS.
3. ROADSIDE FILTER STRIP AND SWALE ACCESS ROAD TO BE INCORPORATED
ADJACENT TO SITE HAUL ROADS AND SERVICE ROADS.
4. ROCK CHECK DAM TO BE INCORPORATED INTERMITTENTLY ALONG SWALE .

025 m
m
1543476
CONTROL
1001-HR-0002
DRAWING
3
A
2016-02-23
ECS
RE
MG
MG
STURTON LE STEEPLE QUARRY
DAVID L WALKER LTD
SWALE DISCHARGE CONTROL STRUCTURE
TITLE
PROJECT NO. REV.
PROJECTCLIENT
CONSULTANT
DESIGNED
PREPARED
REVIEWED
APPROVED
YYYY-MM-DD
Path: \\bnd1-s-m
ain01\C
AD
D_G
IS
_G
RA
PH
IC
S\dave_l_w
alker_ltd\sturton le steeple quarry\99_P
RO
JE
CT
S\1543476_S
turton le S
teeple Q
uarry\1001_H
ydro R
eport\02_P
RO
DU
CT
IO
N\D
WG
\ | F
ile N
am
e: 1543476-1001-H
R-0002.dw
g
IF
T
HIS
M
EA
SU
RE
ME
NT
D
OE
S N
OT
M
AT
CH
W
HA
T IS
S
HO
WN
, T
HE
S
HE
ET
S
IZ
E H
AS
B
EE
N M
OD
IF
IE
D F
RO
M: IS
O A
3
NOT FOR CONSTRUCTION
0
1:25
0.5 1
METRES
NOTES
1. ALL DIMENSIONS METRES (m) AND ALL LEVELS IN METRES ABOVE ORDNANCE DATUM
(m AOD) UNLESS STATED OTHERWISE.
2. EXISTING GROUND LEVELS AT PROPOSED DISCHARGE CONTROL STRUCTURE TO BE
CONFIRMED ON SITE.
3. INLET AND OUTLET PIPE MATERIAL AS PER MANUFACTURERS RECOMMENDATIONS.
4. OUTLET DISCHARGE PIPE INSTALLED AT AN INVERT LEVEL OF 35.0 m AOD.
5. MAXIMUM ALLOWABLE DISCHARGE THROUGH VORTEX CONTROL DEVICE = 5 L/s.
025 m
m
1543476
CONTROL
1001-HR-0003
DRAWING
4
A
2016-02-23
ECS
RE
MG
MG
STURTON LE STEEPLE QUARRY
DAVID L WALKER LTD
DRAIN CROSSING
TITLE
PROJECT NO. REV.
PROJECTCLIENT
CONSULTANT
DESIGNED
PREPARED
REVIEWED
APPROVED
YYYY-MM-DD
Path: \\bnd1-s-m
ain01\C
AD
D_G
IS
_G
RA
PH
IC
S\dave_l_w
alker_ltd\sturton le steeple quarry\99_P
RO
JE
CT
S\1543476_S
turton le S
teeple Q
uarry\1001_H
ydro R
eport\02_P
RO
DU
CT
IO
N\D
WG
\ | F
ile N
am
e: 1543476-1001-H
R-0003.dw
g
IF
T
HIS
M
EA
SU
RE
ME
NT
D
OE
S N
OT
M
AT
CH
W
HA
T IS
S
HO
WN
, T
HE
S
HE
ET
S
IZ
E H
AS
B
EE
N M
OD
IF
IE
D F
RO
M: IS
O A
3
NOT FOR CONSTRUCTION
NOTES
1. ALL DIMENSIONS METRES (m) AND ALL LEVELS IN METRES ABOVE ORDNANCE DATUM
(m AOD) UNLESS STATED OTHERWISE.
1:100
50
METRES
2.5
0
1:50
1 2
METRES

SURFACE WATER DRAINAGE AND MONITORING
April 2016 Report No. 1543476.501/A.0
APPENDIX B Borehole Logs


SURFACE WATER DRAINAGE AND MONITORING
April 2016 Report No. 1543476.501/A.0
APPENDIX C Surface Water Runoff Calculations
IOH 124
LOCATION
Parmeter Unit ValueGrowthFactor
(100 years) Comments
Site Area ha 25
km2 0.25
Calc Area km2 0.5
SAAR mm 580
SOIL 4 0.45
Growth Factor 4 2.57
QBARrural l/s 176.27 453.02
l/s/ha 3.525 9.06
l/s (Site) 88.1 226.51
cumecs 0.088 0.23
Hardstandng ha 0
URBAN 0.000
CWI 78
CIND 32.92
NC 0.7808
QBARurban l/s 176.3 562.31
l/s/ha 3.525 11.25
l/s (Site) 88.1 281.16
cumecs 0.088 0.28QB
AR
urb
an
Sturton Le Steeple
Descripto
rsQ
BA
Rru
ral
Descripto
rs
Date: February 2016
Plant Site
Calculated Greenfield Runoff Rate 3.5 l/s/ha
IDB Runoff 1.4 l/s/ha
Flow Rate Q (m3/s) = C i A
where C = coefficient of runoff; i = rainfall intensity; A = catchment area
then Runoff Volume = Q x Duration
Area 30,000 m2
Runoff Coefficient 0.90
Duration (mins) Rainfall (mm)
Volume of Runoff
(Hardstand)
(m³)
Volume of Runoff
(Greenfield)
(m³)
Storage Required to
Retain Greenfield Rate
(m³)
0.0042
15 25.82 697 4 693
30 32.77 885 8 877
60 38.09 1,028 15 1,013
120 43.44 1,173 30 1,143
240 49.45 1,335 60 1,275
360 53.60 1,447 91 1,356
720 61.71 1,666 181 1,485
1080 68.34 1,845 272 1,573
1440 73.56 1,986 363 1,623
2880 87.63 2,366 726 1,640
5760 98.89 2,670 1,452 1,219
8640 106.18 2,867 2,177 690
10080 109.10 2,946 2,540 406
Maximum 1,640
Duration (mins) Rainfall (mm)
Volume of Runoff
(Hardstand)
(m³)
Volume of Runoff
(Greenfield)
(m³)
Storage Required to
Retain Greenfield Rate
(m³)
0.0042
15 38.48 1,039 4 1,035
30 43.94 1,186 8 1,179
60 50.17 1,355 15 1,339
120 57.29 1,547 30 1,517
240 65.42 1,766 60 1,706
360 70.70 1,909 91 1,818
720 80.72 2,179 181 1,998
1080 89.06 2,405 272 2,132
1440 95.49 2,578 363 2,215
2880 112.97 3,050 726 2,324
5760 125.46 3,387 1,452 1,936
8640 133.41 3,602 2,177 1,425
11520 139.35 3,762 2,903 859
12960 141.85 3,830 3,266 564
Maximum 2,324
Duration (mins) Rainfall (mm)
Volume of Runoff
(Hardstand)
(m³)
Volume of Runoff
(Greenfield)
(m³)
Storage Required to
Retain Greenfield Rate
(m³)
0.0042
15 46.18 1,247 4 1,243
30 52.73 1,424 8 1,416
60 60.20 1,626 15 1,610
120 68.75 1,856 30 1,826
240 78.50 2,120 60 2,059
360 84.84 2,291 91 2,200
720 96.86 2,615 181 2,434
1080 106.87 2,886 272 2,613
1440 114.59 3,094 363 2,731
2880 135.56 3,660 726 2,934
5760 150.55 4,065 1,452 2,613
8640 160.09 4,322 2,177 2,145
11520 167.22 4,515 2,903 1,612
12960 170.22 4,596 3,266 1,330
Maximum 2,934
30 year return period Hardstanding
100 year return period Hardstanding
100 year return period plus 20% Hardstanding
Date: February 2016
Access Road (West of Catchwater Drain)
Calculated Greenfield Runoff 3.5 l/s/ha
Proposed Discharge 2.0 l/s
Flow Rate Q (m3/s) = C i A
where C = coefficient of runoff; i = rainfall intensity; A = catchment area
then Runoff Volume = Q x Duration
Area 10,800 m2
Runoff Coefficient 0.90
Duration (mins) Rainfall (mm)
Volume of Runoff
(Hardstand)
(m³)
Volume of Runoff
(Greenfield)
(m³)
Storage Required to
Retain Greenfield Rate
(m³)
0.002
15 25.82 251 2 249
30 32.77 319 4 315
60 38.09 370 7 363
120 43.44 422 14 408
240 49.45 481 29 452
360 53.60 521 43 478
720 61.71 600 86 513
1080 68.34 664 130 535
1440 73.56 715 173 542
2880 87.63 852 346 506
5760 98.89 961 691 270
8640 106.18 1,032 1,037 0
10080 109.10 1,060 1,210 0
Maximum 542
Duration (mins) Rainfall (mm)
Volume of Runoff
(Hardstand)
(m³)
Volume of Runoff
(Greenfield)
(m³)
Storage Required to
Retain Greenfield Rate
(m³)
0.002
15 38.48 374 2 372
30 43.94 427 4 423
60 50.17 488 7 480
120 57.29 557 14 542
240 65.42 636 29 607
360 70.70 687 43 644
720 80.72 785 86 698
1080 89.06 866 130 736
1440 95.49 928 173 755
2880 112.97 1,098 346 752
5760 125.46 1,219 691 528
8640 133.41 1,297 1,037 260
11520 139.35 1,354 1,382 0
12960 141.85 1,379 1,555 0
Maximum 755
Duration (mins) Rainfall (mm)
Volume of Runoff
(Hardstand)
(m³)
Volume of Runoff
(Greenfield)
(m³)
Storage Required to
Retain Greenfield Rate
(m³)
0.002
15 46.18 449 2 447
30 52.73 513 4 509
60 60.20 585 7 578
120 68.75 668 14 654
240 78.50 763 29 734
360 84.84 825 43 781
720 96.86 942 86 855
1080 106.87 1,039 130 909
1440 114.59 1,114 173 941
2880 135.56 1,318 346 972
5760 150.55 1,463 691 772
8640 160.09 1,556 1,037 519
11520 167.22 1,625 1,382 243
12960 170.22 1,655 1,555 99
Maximum 972
30 year return period Hardstanding
100 year return period Hardstanding
100 year return period plus 20% Hardstanding
Date: February 2016

Access Road (West of Catchwater Drain)
Calculated Greenfield Runoff 3.5 l/s/ha
Proposed Discharge 2.0 l/s
Flow Rate Q (m3/s) = C i A
where C = coefficient of runoff; i = rainfall intensity; A = catchment area
then Runoff Volume = Q x Duration
Area 4,800 m2
Runoff Coefficient 0.90
Duration (mins) Rainfall (mm)
Volume of Runoff
(Hardstand)
(m³)
Volume of Runoff
(Greenfield)
(m³)
Storage Required to
Retain Greenfield Rate
(m³)
0.002
15 25.82 112 2 110
30 32.77 142 4 138
60 38.09 165 7 157
120 43.44 188 14 173
240 49.45 214 29 185
360 53.60 232 43 188
720 61.71 267 86 180
1080 68.34 295 130 166
1440 73.56 318 173 145
2880 87.63 379 346 33
5760 98.89 427 691 0
8640 106.18 459 1,037 0
10080 109.10 471 1,210 0
Maximum 188
Duration (mins) Rainfall (mm)
Volume of Runoff
(Hardstand)
(m³)
Volume of Runoff
(Greenfield)
(m³)
Storage Required to
Retain Greenfield Rate
(m³)
0.002
15 38.48 166 2 164
30 43.94 190 4 186
60 50.17 217 7 210
120 57.29 247 14 233
240 65.42 283 29 254
360 70.70 305 43 262
720 80.72 349 86 262
1080 89.06 385 130 255
1440 95.49 413 173 240
2880 112.97 488 346 142
5760 125.46 542 691 0
8640 133.41 576 1,037 0
11520 139.35 602 1,382 0
12960 141.85 613 1,555 0
Maximum 262
Duration (mins) Rainfall (mm)
Volume of Runoff
(Hardstand)
(m³)
Volume of Runoff
(Greenfield)
(m³)
Storage Required to
Retain Greenfield Rate
(m³)
0.002
15 46.18 199 2 198
30 52.73 228 4 224
60 60.20 260 7 253
120 68.75 297 14 283
240 78.50 339 29 310
360 84.84 367 43 323
720 96.86 418 86 332
1080 106.87 462 130 332
1440 114.59 495 173 322
2880 135.56 586 346 240
5760 150.55 650 691 0
8640 160.09 692 1,037 0
11520 167.22 722 1,382 0
12960 170.22 735 1,555 0
Maximum 332
30 year return period Hardstanding
100 year return period Hardstanding
100 year return period plus 20% Hardstanding
Date: February 2016
Access Road and Conveyor Track Infiltration
h = D/n(RI-q)
h = water depth across infiltration area (m)
R = ratio of drained area to infiltration area (R = Ad/Ab)
q = infiltration coefficient (m/h)
I = rainfall intensity (m/hr)
D = rainfall duration (hr)
Ab = base area of infiltration system (m2)
Ad = area to be drained (m2)
n = porosity of fill material
= input cells
Ab 4 m2
Ad 8 m2
soil infiltration rate 1.00E-06 m/s
n 1
factor of safety 1.5
q 0.0024 m/h
R 2.22
Return Period 10
Time (mins) Rainfall Intensity (m/h) h (m) Time to Half Empty (hrs)
15 0.0712 0.04 8.1
30 0.0421 0.05 9.5
60 0.0249 0.05 11.0
120 0.0147 0.06 12.6
180 0.0108 0.06 13.5
240 0.0087 0.07 14.1
360 0.0064 0.07 14.7
540 0.0047 0.07 15.0
720 0.0038 0.07 14.9
1,080 0.0028 0.07 14.6
1,440 0.0023 0.07 13.6
2,160 0.0017 0.05 10.8
Maximum 0.07 15.0
Return Period 100
Time (mins) Rainfall Intensity (m/h) h (m) Time to Half Empty (hrs)
15 0.1539 0.08 17.7
30 0.0879 0.10 20.1
60 0.0502 0.11 22.7
120 0.0286 0.12 25.5
180 0.0206 0.13 27.2
240 0.0164 0.14 28.3
360 0.0118 0.14 29.7
540 0.0085 0.15 30.9
720 0.0067 0.15 31.4
1,080 0.0049 0.15 32.2
1,440 0.0040 0.15 32.2
2,160 0.0029 0.15 30.8
Maximum 0.15 32.2
Return Period 100+CC
Time (mins) Rainfall Intensity (m/h) h (m) Time to Half Empty (hrs)
15 0.1847 0.10 21.3
30 0.1055 0.12 24.2
60 0.0602 0.13 27.4
120 0.0344 0.15 30.8
180 0.0248 0.16 32.9
240 0.0196 0.16 34.3
360 0.0141 0.17 36.3
540 0.0102 0.18 37.9
720 0.0081 0.19 38.8
1,080 0.0059 0.19 40.5
1,440 0.0048 0.20 41.1
2,160 0.0035 0.19 40.5
2,880 0.0028 0.19 38.8
Maximum 0.20 41.1
Date: February 2016
Extraction Area Storage and Discharge
Greenfield Runoff Rate 1.4 l/s/ha
Extraction Area Site Runoff Coefficient2 0.9
Soil Stripped Area Runoff Coefficient 0.3
Restoration Area Runoff Coefficient 0.3
Operational Phase
24hr Rainfall
Depth1 (mm)
Total Runoff
Volume for Phase
Catchment (m³)
Pre development
(Existing Greenfield)
Runoff Volume for
Phase Catchment (m³)
Increase in Runoff
(Stored in
Wetland/Settlement
Lagoon) (m³)
Greenfield
Discharge
Rate (l/s)
Extraction Soil Stripped Lagoon Restoration Total Area #REF!
1 30,000 87,000 30,000 0 147,000 115 9,522 1,778 7,744 20.6
3 30,000 38,000 80,000 26,000 174,000 115 14,461 2,105 12,356 24.4
4 30,000 107,500 107,000 57,000 301,500 115 21,010 3,647 17,363 42.2
5 30,000 36,000 107,000 194,500 367,500 115 23,279 4,445 18,833 51.5
6 30,000 54,000 107,000 260,500 451,500 115 26,166 5,461 20,705 63.2
7 30,000 182,500 107,000 327,500 647,000 115 32,887 7,826 25,061 90.6
Notes:1 24 hr rainfall sourced from FEH CD ROM V3
2During extraction it is assumed all runoff is captured within the void.
Runoff Coefficients derived from FEH CD ROM V3
Extraction area runoff coefficient assumes groundwater level is at or near the surface of the base of the void
Phase 2 extracted during Phases 1, 3 and 4
Flow Rate Q (m3/s) = C i A
where C = coefficient of runoff; i = rainfall intensity; A = catchment area
then Runoff Volume = Q x Duration
100 year return period plus 20%, 24 Hour Runoff Volume
Site Areas (m²)
Date: February 2016

Extraction Area Storage and Discharge
Greenfield Runoff Rate 1.4 l/s/ha
Extraction Area Site Runoff Coefficient2 0.9
Soil Stripped Area Runoff Coefficient 0.3
Restoration Area Runoff Coefficient 0.3
Operational Phase
7 day Rainfall
Depth1 (mm)
Total Runoff
Volume for Phase
Catchment (m³)
Pre development
(Existing Greenfield)
Runoff Volume for
Phase Catchment (m³)
Increase in Runoff
(Stored in
Wetland/Settlement
Lagoon) (m³)
Greenfield
Discharge
Rate (l/s)
Extraction Soil Stripped Lagoon Restoration Total Area #REF!
1 30,000 87,000 30,000 0 147,000 164 13,618 12,447 1,171 20.6
3 30,000 38,000 80,000 26,000 174,000 164 20,681 14,733 5,948 24.4
4 30,000 107,500 107,000 57,000 301,500 164 30,046 25,529 4,517 42.2
5 30,000 36,000 107,000 194,500 367,500 164 33,291 31,117 2,174 51.5
6 30,000 54,000 107,000 260,500 451,500 164 37,420 38,229 0 63.2
7 30,000 182,500 107,000 327,500 647,000 164 47,031 54,783 0 90.6
Notes:1 24 hr rainfall sourced from FEH CD ROM V3
2During extraction it is assumed all runoff is captured within the void.
Runoff Coefficients derived from FEH CD ROM V3
Extraction area runoff coefficient assumes groundwater level is at or near the surface of the base of the void
Phase 2 extracted during Phases 1, 3 and 4
Flow Rate Q (m3/s) = C i A
where C = coefficient of runoff; i = rainfall intensity; A = catchment area
then Runoff Volume = Q x Duration
100 year return period plus 20%, 7 day Runoff Volume
Site Areas (m²)
Date: February 2016
SURFACE WATER DRAINAGE AND MONITORING
April 2016 Report No. 1543476.501/A.0
APPENDIX D Proposed Channel Realignment

SURFACE WATER DRAINAGE AND MONITORING
April 2016 Report No. 1543476.501/A.0
APPENDIX E Restoration Plans


Golder Associates (UK) Ltd
Cavendish House
Bourne End Business Park
Cores End Road
Bourne End
Buckinghamshire
SL8 5AS
UK
T: [+44] (0) 1628 851851
Caption Text
Recommended