4a Old Main Road, Judges Walk, Kloof, Kwazulu-Natal South Africa 3610
PO Box 819 Gillitts 3603 South Africa
Telephone: +27 (0)31 764 7130 Facsimile: +27 (0)31 764 7140
Web: www.gcs-sa.biz
Surface Water Assessment for the Magdalena
Colliery Discard Dump Extension
Version – V1
10 November 2013
For: Zinoju Coal (Pty) Ltd
GCS Project Number: 12-094

Zinoju Coal (Pty) Ltd Magdalena Colliery Discard Dump Extension
12-094 10 November 2013 Page ii
Surface Water Assessment for the Magdalena Discard Dump extension
Final
10 November 2013
For: Zinoju Coal (Pty) Ltd
DOCUMENT ISSUE STATUS
Report Issue Final
GCS Reference Number GSC Ref- 12-094
Title Hydrological Assessment for the Magdalena Colliery Discard Dump
Extension
Name Signature Date
Author
Nhlakanipho Zondi
09 September 2013
Document Reviewer Phillip Lourens
01 November 2013
Director Pieter Labuschagne
05 November 2013
LEGAL NOTICE
This report or any proportion thereof and any associated documentation remain the property of GCS until the
mandator effects payment of all fees and disbursements due to GCS in terms of the GCS Conditions of Contract
and Project Acceptance Form. Notwithstanding the aforesaid, any reproduction, duplication, copying, adaptation,
editing, change, disclosure, publication, distribution, incorporation, modification, lending, transfer, sending,
delivering, serving or broadcasting must be authorised in writing by GCS.
EXECUTIVE SUMMARY

Zinoju Coal (Pty) Ltd Magdalena Colliery Discard Dump Extension
12-094 10 November 2013 Page iii
Zinoju Coal (Pty) Ltd intends to extend their Discard Dump operation at the Magdalena
Colliery near Dundee KwaZulu-Natal. As part of an amendment to the existing
Environmental Management Programme (EMPR), GCS Water and Environmental (Pty) Ltd has
been commissioned by Zinoju Coal to conduct a hydrological assessment for the proposed
Discard Dump extension activities in order to understand the impact such activities will
have on site hydrology.
The following information were considered and evaluated:
• Rainfall, evaporation, and runoff;
• Surface water quality;
• Magdalena storm water management plan ; and
• Surface water monitoring.
The main findings can be summarised as follows:
• The mine is located in Water Management Area 7 uThukela in quaternary catchment
area V32D;
• The mine has a Mean Annual Rainfall of 791 mm;
• The mine experiences a Mean Annual Evaporation of 1 500 mm;
• The proposed Discard Dump site has Mean Annual Runoff of 0.00533 Mm3
• 10 of 16 surface water quality samples are within SANS standards;
• Water Balance of the mine needs to be updated to incorporate the Discard Dump
extension site.
• The Storm Water Management Plan of the mine indicates dirty storm water is
generated in two catchments:
o the discard dump and slurry dam area,
o the coal processing area, including the administration buildings and the
workshops;
• The surface water quality monitoring plan of the mine indicates compliance with
stipulations in the Environmental Management Plan.
The recommended way forward for the Magdalena Mine in terms of hydrology is summarised
as follows
• For the hydrology of the mine:

Zinoju Coal (Pty) Ltd Magdalena Colliery Discard Dump Extension
12-094 10 November 2013 Page iv
o A GN704 audit;
o A site visit and detailed investigation into the surface water of the mine ;
and
o Surface water quality samples of Poonaspruit stream and process water on
the mine.

Zinoju Coal (Pty) Ltd Magdalena Colliery Discard Dump Extension
12-094 10 November 2013 Page v
GLOSSARY OF TERMINOLOGY
In this report any expression to which a meaning has been assigned, shall have the meaning
so assigned, and unless the context indicates otherwise-
Catchment - The area from which any rainfall will drain into the watercourse or
watercourses or part of the water course, through surface flow to a common point or
common points;
Activity- means any mining related process on the mine including the operation of washing
plants, mineral processing facilities, mineral refineries and extraction plants, and the
operation and the use of mineral loading and off-loading zones, transport facilities and
mineral storage yards, whether situated at the mine or not,
Clean water system- includes any dam, other form of impoundment, canal, works,
pipeline and any other structure or facility constructed for the retention or conveyance of
un-contaminate water;
Dam- includes any settling dam, slurry dam, evaporation dam, catchment or barrier dam
and any other form of impoundment used for the storage of unpolluted water or water
containing waste;
Dirty catchment- means any area at a mine or activity which causes, has caused or is likely
to cause contamination of a water resource;
Dirty water system- includes any dam, other form of impoundment, canal, works, pipeline,
residue deposit and any other structure or facility constructed for the retention or
conveyance of water containing waste;
Facility- in relation to an activity includes any installation and appurtenant works for the
storage, stockpiling, disposal, handling or processing of any substance;
Residue- includes any debris, discard, tailings, slimes, screenings, slurry, waste rock,
foundry sand, beneficiation plant waste, ash and any other waste product derived from or
incidental to the operation of a mine or activity and which is stockpiled, stored or
accumulated for potential re-use or recycling or which is disposed of;

Zinoju Coal (Pty) Ltd Magdalena Colliery Discard Dump Extension
12-094 10 November 2013 Page vi
Residue deposit- includes any dump, tailings dam, slimes dam, ash dump, waste rock
dump, in-pit deposit and any other heap, pile or accumulation of residue;

Zinoju Coal (Pty) Ltd Magdalena Colliery Discard Dump Extension
12-094 10 November 2013 Page vii
CONTENTS PAGE
1 INTRODUCTION .......................................................................................................................... 1
2 OBJECTIVES AND SCOPE OF WORK ............................................................................................. 2
2.1 OBJECTIVES .................................................................................................................................. 2 2.2 SCOPE OF WORK ............................................................................................................................ 2
3 METHODOLOGY ......................................................................................................................... 3
3.1 OVERVIEW OF RELEVANT LEGISLATION AND STANDARDS ....................................................................... 4 3.1.1 Legal Framework .............................................................................................................. 4
3.2 NATIONAL LEGISLATION .................................................................................................................. 5 3.3 NATIONAL POLICY/GUIDELINES ........................................................................................................ 5
4 LOCALITY .................................................................................................................................... 6
5 BACKGROUND INFORMATION .................................................................................................... 9
5.1 GEOLOGY ..................................................................................................................................... 9 5.2 CLIMATE ...................................................................................................................................... 9 5.3 TOPOGRAPHY ............................................................................................................................... 9 5.4 SURFACE WATER .......................................................................................................................... 10
6 DESCRIPTION OF SITE HYDROLOGY .......................................................................................... 11
6.1 RAINFALL ................................................................................................................................... 11 6.2 AVERAGE EVAPORATION................................................................................................................ 13 6.3 PEAK STORM RAINFALL ................................................................................................................. 14 6.4 SURFACE WATER RESOURCES AND CATCHMENT DELINEATION ............................................................. 14 6.5 CATCHMENT AREA AND DELINEATION.............................................................................................. 15 6.6 MEAN ANNUL RUNOFF ................................................................................................................. 17 6.7 CATCHMENT SLOPE AND TIME OF CONCENTRATION ............................................................................ 18 6.8 PEAK FLOWS AND VOLUMES .......................................................................................................... 19
7 WATER QUALITY ....................................................................................................................... 20
8 STORMWATER MANAGEMEMNT PLAN .................................................................................... 25
9 KEY ISSUES AND SCENARIOUS .................................................................................................. 26
9.1 CHANGES IN CATCHMENT CHARACTERISTICS ..................................................................................... 26 9.2 CHANGES IN PEAK FLOWS AND VOLUMES ......................................................................................... 26 9.3 CHANGES IN MEAN ANNUL RUNOFF ............................................................................................... 29 9.4 INCREASED SEDIMENT YIELD .......................................................................................................... 29
10 SURFACE WATER IMPACT ASSESSMENT ................................................................................... 30
10.1 CONSTRUCTION PHASE ................................................................................................................. 31 10.1.1 Surface water contamination ......................................................................................... 32 10.1.2 Siltation of surface water ................................................................................................ 32
10.2 OPERATIONAL PHASE ................................................................................................................... 34 10.2.1 Stream Peak flow Reduction ........................................................................................... 34
11 MONITORING PROGRAM ......................................................................................................... 38
12 GAP ANALYSIS .......................................................................................................................... 39
13 CONCLUSION ............................................................................................................................ 40
14 REFERENCES ............................................................................................................................. 42
LIST OF FIGURES
Figure 4-1: Zinoju Coal Operations Locality map ................................................ 7 Figure 4-2: Magdalena Discard Dump and Mine Boundary Overview ............................ 8
Zinoju Coal (Pty) Ltd Magdalena Colliery Discard Dump Extension
12-094 10 November 2013 Page viii
Figure 6-1: Rainfall Station Close to Magdalena Area ............................................ 12 Figure 6-2: Average Rainfall Distribution ........................................................... 13 Figure 6-3: Magdalena Average Monthly Evaporation ............................................. 14 Figure 6-4: Magdalena Delineated Catchments .................................................... 16 Figure 7-1: Annual pH and sulphate for Surface Water site MS4a .............................. 21 Figure 7-2: Annual pH and sulphate for Surface Water site BOX ............................... 22 Figure 7-3: Magdalena Colliery Groundwater and Surface Water Monitoring Network ...... 23 Figure 7-4: Zoomed In Map Showing the Sectiion of Discard Dump Extansion and Monitoring Sites 24 Figure 9-1: Calculated Peak flows for the Bloubankspruit Catchment ........................ 27 Figure 9-2: Calculated Peak flows for the Catchement A ........................................ 27 Figure 9-3: Calculated Peak Volumes for the Bloubankspruit Catchement ................... 28 Figure 9-4: Calculated Peak Volumes for the Catchment A ..................................... 28
LIST OF TABLES
Table 5-1: Flood peaks and Volume for catchments at Magdalena Colliery ................. 10 Table 6-1: Rainfall Stations Considered ............................................................ 13 Table 6-2: Design 24 hour Peak Rainfall ............................................................ 14 Table 6-3: Catchment Area Sizes .................................................................... 15 Table 6-4: Baseline MAR before the Proposed Discard Dump Site ............................. 17 Table 6-5: Post Development Reduction in MAR .................................................. 17 Table 6-6: Baseline Catchment Characteristics ................................................... 18 Table 6-7 Baseline Flood Peaks and Volume ...................................................... 19 Table 6-8: Calculated Post Development Peak Runoff Flows and Volumes ................... 19 Table 10-1: Risk Assessment Significance Value .................................................... 30 Table 10-2: Risk Rating Matrix ......................................................................... 30 Table 10-3: Magdalena Construction Phase.......................................................... 33 Table 10-4: Magdalena Operational Phase Risk Assessment ...................................... 35 Table 10-5: Magdalena Closure Phase Risk Assessment ........................................... 36 Table 11-1: Monitoring Objectives According to EMP .............................................. 38
LIST OF APPENDICES
APPENDIX A: MAGDALENA 2ND
QUARTEYLY WATER MONITORING REPORT ................................... 43
APPENDIX B: MAGDALENA STORM WATER MANAGEMENT PLAN REPORT .................................... 44
Zinoju Coal (Pty) Ltd Magdalena Colliery Discard Dump Extension
12-094 Page 1
1 INTRODUCTION
Zinoju Coal (Pty) Ltd intends to extend the current Phase 3 operations at the Magdalena
Colliery to incorporate an extension to their existing discard dump. This proposal requires
that the approved Phase 3 Environmental Management Programme (EMP) be amended to
incorporate the proposed extension. As part of the EMP amendment, the GCS Water and
Environment (Pty) Ltd. (GCS) Water Unit was commissioned by Zinoju Coal to conduct a
surface water assessment for the proposed extension of the discard dump facility.
Zinoju Coal intends to expand the size of the Magdalena Colliery discard dump from 33
295.05m2(3.33ha) to 389 703.04m2 (38.97ha) (expansion of 356 407.98m2/35.64ha) in order
to accommodate the operational life of the company’s mining operations at the Magdalena
and Aviemore collieries.
The Magdalena Colliery is an existing coal mine that has been operational since 2003. The
existing mining area is operational under a number of Mining Rights, namely 227MR (Phase
1), 213MR (Phase 2) and 198MR (Phase 3) with corresponding approved Environmental
Management Programmes (EMPr’s) in accordance with the Mineral and Petroleum Resources
Development Act, 2002 (Act No. 28 of 2002) (MPRDA). In addition, an Integrated Water Use
License Application (IWULA) process for all existing water uses was completed in 2007.
The discard dump has been designed based on the planned life of mine during which discard
will be generated at a rate of 16 800 tonnes per month. A site selection process has been
followed and a preferred coal discard disposal facility was selected. GCS carried out a
preliminary geotechnical investigation at the preferred site.
As part of this amendment, a surface water assessment report; amongst other; is required
to identify any new potential impacts that may occur in addition to those identified in the
original EIA Report (ref) and inform and guide the selection of appropriate mitigation and
management measures.

Zinoju Coal (Pty) Ltd Magdalena Colliery Discard Dump Extension
12-094 Page 2
2 OBJECTIVES AND SCOPE OF WORK
The main focus of this assessment was to assess possible impacts on the surface water
environment; the following was required from this assessment:
2.1 Objectives
Update the existing hydrological baseline description for the mine;
• Determine and assess the potential surface water impacts associated with the
discard dump extension;
• Advise on mitigation measures for identified risks/impacts and enhance positive
opportunities/impacts of the project;
• Provide input to the WULA and NEMA documentation.
2.2 Scope of work
The Scope of Work (SoW) for the Hydrology Assessment is summarised as follows:
Phase 1:
• Information sourcing / literature review
• Collection and revision of relevant information
Phase 2:
• Site Visit
o Site assessment (better understanding of site) & quality sampling
• Update catchment hydrology with newly available data
o Catchment characteristics and delineation
o Meteorological analysis (including MAP)
o Average runoff analyses (MAR & NDWF)
o Peak flow analyses for 1:50 and 1:100 floods
o Analyses of all new and updated water quality samples and water level
monitoring data
• Updating Hydrology of the mine itself;

Zinoju Coal (Pty) Ltd Magdalena Colliery Discard Dump Extension
12-094 Page 3
o Review existing information and proposed water management strategies for
the mine;
o Undertake an impact assessment in accordance with GCS’s impact
assessment methodology;
o Identify monitoring mechanisms for implementing the suggested mitigation
measures;
o Provide the necessary supporting documentation for the WULA and NEMWA
applications.
3 METHODOLOGY
The following methodologies were used for the hydrological assessment of the catchment
that the mine is situated in:
A holistic approach was followed and an attempt was made to link local hydrological, water
quality and environmental studies to regional and national concerns, regulations and
management strategies.
A site visit was conducted in order to obtain information on normal flow rates, river health
and potential factors that could influence hydrological modelling of flows.
Generally accepted methods and formulae were used to determine design floods in the
relevant catchments. The following paragraph will briefly explain the Rational Method that
was ultimately used in the peak flow analyses:
Rational Method
The rational method was developed in the mid 19th century and is one of the most widely
used methods for the calculation of peak flows for small catchments.
The formula indicates that Q = CiA,
where Q is the peak flow, “i” is the rainfall intensity, A is the runoff area and C is the
runoff coefficient.

Zinoju Coal (Pty) Ltd Magdalena Colliery Discard Dump Extension
12-094 Page 4
Rainfall distribution is assumed to be uniform over small catchment areas of up to 15 km2.
A Time of Concentration (Tc) is calculated which represents the time it takes for rainfall to
contribute to runoff at the same discharge point of the catchment from all areas (even
furthest point) of the catchment. The slope of the catchment is used to determine Tc.
Average runoff from streams running through the site was calculated using accepted
techniques to downscale quaternary catchment data (WR2005).
Software employed in the study includes:
• ArcGIS10.1 (ESRI, 2012) for Geographic Information Systems (GIS) work and
• Design Rainfall Estimation package (Smithers and Schulze, 2003) for 24 design
rainfall depth;
The likely surface water impact associated with the planned mining development was
identified and possible mitigation measures were recommended to reduce the impacts
thereof.
3.1 Overview of Relevant Legislation and Standards
The entire process followed was guided by the following legislations
3.1.1 Legal Framework
DWA’s vision for water quality management in South Africa is to:
• ensure the continuous improvement of Water Quality Management
• become a recognized world leader in Water Quality Management
• be proactive, dynamic, efficient and effective in its delivery of services to the
public
• provide the necessary policies and systems to ensure integrated sustainable
management of water quality
• promote cooperative governance across all spheres of management and
• ensure a fully capacitated, loyal workforce to support its functions.

Zinoju Coal (Pty) Ltd Magdalena Colliery Discard Dump Extension
12-094 Page 5
3.2 National Legislation
National legislation applicable to surface water management includes:
• Constitution of the Republic of South Africa, 1996 (No. 108 of 1996) – The Bill of
Rights states that everyone has the right to an environment that is not harmful to
their health or well-being.
• National Water Act, 1998 (Act 36 of 1998) – Provides for the protection of the
quality of water and water resources in South Africa and provides for the
establishment of Water Management
3.3 National Policy/Guidelines
National policy and guidelines applicable to surface water management includes:
• South African Water Quality Guidelines, First Edition, 1996 – These guidelines set
out the minimum water quality requirements for a range of water quality
parameters for each water user.
• Development of a Waste Discharge Charge System: Framework Document. Second
Edition, 2000 – Provides a framework for the implementation of a system to charge
for water use such as the discharge of waste that impacts on water resources.
• Framework for a Water Quality Management Performance Assessment System:
(WQMPAS), First Edition, 2000 – Reports results on an initial investigation into a
performance management system to enable a more effective WQPMAS in future.
• Best Practice Guidelines for the mining sector, DWAF 2006, 2008 dealing with
aspects of DWA’s water management hierarchy and deals with integrated mine
water management, pollution prevention and minimisation of impacts, water reuse
and reclamation and water treatment.
• Best Practice Guidelines for the mining sector, DWAF 2006, 2008 dealing with
general water management strategies, techniques and tools which could be applied
cross – sectorial and deals with storm water management, water and salt balances,
water monitoring systems, impact prediction.

Zinoju Coal (Pty) Ltd Magdalena Colliery Discard Dump Extension
12-094 Page 6
• Best Practice Guidelines for the mining sector, DWAF 2006-2008 dealing with
specific mining activities and addresses the prevention and management of impacts
from small scale mining, water management for Mine Residue Deposits, pollution
control dams, water management for surface mines, and water management for
underground mines.
4 LOCALITY
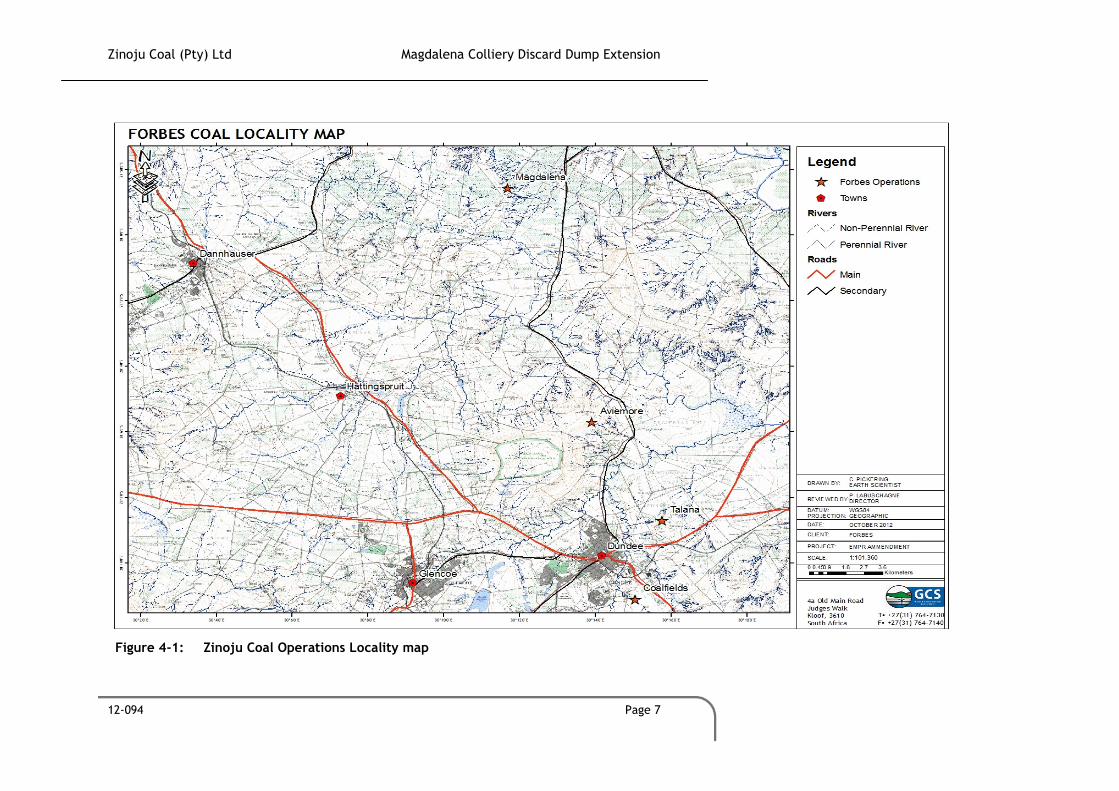
The Magdalena Colliery is located approximately 22 km north of the town of Dundee, within
the Dannhauser Local Municipality and the Amajuba District Municipality in the KwaZulu-
Natal Province. The mine is located in Water Management Area 7 Thukela (WMA7) and in
quaternary catchment V32D. The mine locality map is shown in Figure 4-1.
Figure 6.2 shows the layout of the proposed discard dump extension in relation to the
current discard dump, underground workings and surface operations.
Zinoju Coal (Pty) Ltd Magdalena Colliery Discard Dump Extension
12-094 Page 7
Figure 4-1: Zinoju Coal Operations Locality map

Zinoju Coal (Pty) Ltd Magdalena Colliery Discard Dump Extension
12-094 Page 8
Figure 4-2: Magdalena Discard Dump and Mine Boundary Overview

Zinoju Coal (Pty) Ltd Magdalena Colliery Discard Dump Extension
12-094 Page 9
5 BACKGROUND INFORMATION
This section includes background information on the Magdalena Colliery Mine and the area
surrounding the mine. This was taken from the 2002 EMPR and will include information on
the Geology, climate and surface water for Bloubankspruit catchment within the W32D
quaternary catchment area.
5.1 Geology
The site consists of a series of horizontally layered sedimentary units of the Vryheid
formation located within the Ecca Group of the Karoo Supergroup. These sediments
comprise successions of sandstones, shales, mudstones, carbonaceous shales and coal
seams. The Ecca Group overlies rocks of the Dwyka Group.
5.2 Climate
The project area falls within the Newcastle, Vryheid and Dundee areas, the winters are
generally cold with average temperatures being 150C, extremes of down to –10OC. The
summers are warm to hot with the average temperatures of 27OC, but extreme high
temperatures of up to 40OC. The Mean Annual Precipitation (MAP) for the Dundee area is
791.3 mm. Mean wet season precipitation (October –April) is 702.9 mm and mean dry
season precipitation (May- September) is 88.4 mm. The mean annual “A-pan” evaporation
for the Newcastle area (1957 -1987) is 1 670.5 mm per year.
5.3 Topography
The area between the watershed and the escarpment edge is characterised by relatively
flat to steep terrain, with slopes varying from 0.76 to 15.2 %. The steep escarpment is
characterised by sparse grassveld vegetation, and a few shrubs and small trees. Runoff from
this area is likely to be high due to the shallow soils, steep terrain, and thin vegetation
cover.

Zinoju Coal (Pty) Ltd Magdalena Colliery Discard Dump Extension
12-094 Page 10
5.4 Surface water
The Magdalena colliery occurs within the upper catchments of the Poonaspruit and
Bloubankspruit. The streams are non-perennial and tributaries of the Buffels River. The
Bloubankspruit is 24.6 km2 in area with the MAR of 1.968 x10⁶ m3 and Poonaspruit has an
area of 17.95 with the MAR of 1.436 x 10⁶ m3. The calculated flood peaks and volumes for
the Poonaspruit and Bloubankspruit catchments are indicated in the table below.
Table 5-1: Flood peaks and Volume for catchments at Magdalena Colliery
Parameter Peak Discharge (m3/s) Peak Volumes (m3)
Catchment Area (km2) Area (Km2) Q50 Q100 QRMF V50 V100 VRMF
Poonaspruit catchment 17.95 63.6 77.8 142.7 11180 12300 35780
Bloubankspruit catchment 24.6 88.5 108.28 201.5 15330 16870 49060

Zinoju Coal (Pty) Ltd Magdalena Colliery Discard Dump Extension
12-094 Page 11
6 DESCRIPTION OF SITE HYDROLOGY
The original scope of works required that the existing hydrology of the proposed
development area be checked. In order to do so GCS performed a hydrological analysis of
the site. Results of previous hydrological analyses of the area are presented in section 5 of
this report.
6.1 Rainfall
Rainfall Data for the site was obtained from the WR2005 study (Middleton and Bailey,
2009), the Rainfall Extraction Utility Programme (Kunz, 2004) and the Design Rainfall
Estimation Program (Smithers and Schulze, 2002). The daily rainfall extraction utility
contains daily patched rainfall data for all official South African Weather Services stations.
The rainfall stations considered were close to the site, had a reasonable length of record
and a relatively complete and reliable data set. Please see Table 6-1 and Figure 6-1 below.
Dundee Pol. (0335400_W) was selected for use in the study. The station is located about
20km from the site at a similar altitude and thus represents local rainfall conditions.

Zinoju Coal (Pty) Ltd Magdalena Colliery Discard Dump Extension
12-094 Page 12
Figure 6-1: Rainfall Station Close to Magdalena Area

Zinoju Coal (Pty) Ltd Magdalena Colliery Discard Dump Extension
12-094 Page 13
Table 6-1: Rainfall Stations Considered
Station Number Station NameDistance from Site
(Km)
Start of
RecordEnd of Record
Number of
Years
Altitude
(mamsl)MAP
0335250W Glencoe 22.4 01-Apr-34 10-Sep-98 64 1322 837
0335400W Dundee Pol 20 01-Jul-33 31-May-00 67 1243 795
0370834W Ballangleigh 24 01-Aug-12 30-Jul-73 61 1228 858
0371150W Try Again 18 01-Aug-24 31-Jul-69 45 1433 760
0371706W Waaihoek 31.3 01-Jan-59 30-Jun-20 41 1355 676
0335520A Dundee Agric Res 26 01-Jan-31 13-Dec-82 46 1275 794
Monthly Rainfall data for the area are shown below. The mean annual precipitation for the
area is approximately 795mm. The average monthly distribution of this rainfall is shown in
the graph below.
Figure 6-2: Average Rainfall Distribution
6.2 Average evaporation
The Mean Annual Evaporation (MAE) for the site area according to the WR2005 database,
evaporation zone 21A is 1 500 mm. The average monthly distribution of this evaporation is
shown in the graph below.

Zinoju Coal (Pty) Ltd Magdalena Colliery Discard Dump Extension
12-094 Page 14
Figure 6-3: Magdalena Average Monthly Evaporation
6.3 Peak Storm Rainfall
The 24 hour storm rainfall depths described below for the 1:2, 1:5, 1:10, 1:20, 1:50 and
1:100 year recurrence intervals based on the data measured at the Dundee Pol. Rainfall
station, were extracted using the Design Rainfall Estimation package (Smithers and Schulze,
2003).
Table 6-2: Design 24 hour Peak Rainfall
Return Period 1:2 1:5 1:10 1:20 1:50 1:100
Rainfall Depth (mm) 62.4 83.4 97.8 112.1 131.4 146.2
6.4 Surface Water Resources and Catchment Delineation
The main hydrological feature on site is the Bloubankspruit non-perennial stream, which
flows from west to east across the catchment and drains to the Buffel River. Natural water
feature on site is a spring. Artificial water features include one storage dam used to
temporarily hold water from the slurry pond and four earth dams within the catchment.

Zinoju Coal (Pty) Ltd Magdalena Colliery Discard Dump Extension
12-094 Page 15
6.5 Catchment Area and Delineation
The baseline surface water assessment identified two sub-catchments affected by
Magdalena operation, see section 5 of this report. The Bloubankspruit sub-catchment is of
particular interest for this study being only affected by proposed discard dumb extension.
Bloubankspruit stream and non-perennial unnamed stream, a tributary to the
Bloubankspruit stream referred to as stream 1; were identified and used to delineate the
sub-catchments. The two sub-catchments are labelled and referred to as Bloubankspruit
and sub-catchment A and are representing natural drainage on the proposed site. The
existing and proposed discard dump extension site occurs within the upper catchment of
the Bloubankspruit. The Bloubankspruit catchment was reported to be 24.6 km2 in area
(EMPR 2002). Using the ArcGIS10.1 program the Bloubankspruit sub-catchment was
recalculated as 43.1 km2 in area and the sub-catchment A was 8.73 km2. The sub-
catchments are shown in the Figure 6-4 below. Table 6-3 shows the summary sub-
catchment nomenclature adopted for this report.
The sub-catchments are largely rural with a few, isolated residential properties and one
storage dam along the non-perennial stream running on catchment A and four storage dams
within Bloubankspruit sub-catchment
Table 6-3: Catchment Area Sizes
Catchments
Total surface area size
(km2)
WMA 7
29 046
Quaternary catchment W32D
590
Bloubankspruit sub-catchment
43.13
Sub-catchment A
8.73
The natural vegetation of the two sub-catchments are similar and characterised by
grasslands, some areas of trees (natural trees) and light bush.

Zinoju Coal (Pty) Ltd Magdalena Colliery Discard Dump Extension
12-094 Page 16
Figure 6-4: Magdalena Delineated Catchments

Zinoju Coal (Pty) Ltd Magdalena Colliery Discard Dump Extension
12-094 Page 17
6.6 Mean Annul Runoff
The baseline surface water study (2001 EMPR), indicates a Mean Annual Runoff (MAR) of
1.968 Mm3 for the Bloubankspruit sub-catchment .The WR2005 runoff data indicates a
(MAR) of 28.21 Mm3 for the quaternary catchment area V32D.
WR2005 quaternary runoff data (Middleton and Bailey, 2009) were downscaled in order to
obtain representative post development site runoff. The MAR for the Bloubankspruit sub-
cathcment and the proposed discard dump site were calculated by multiplying monthly
runoff values obtained from the WR2005 database (Middleton & Bailey, 2009) by a
correction factor. This factor was calculated by multiplying the quotient of the site area
and the quaternary catchment area, raised to the power of 2.6, by the quotient of the site
rainfall and the quaternary catchment rainfall. The resulting MAR values are tabulated
below. Table 5-4 illustrates the Baseline MAR in the context of the quaternary catchment,
whilst Table 10 presents the Anticipated reduction in MAR as a consequence of the discard
dump expansion.
Table 6-4: Baseline MAR before the Proposed Discard Dump Site
Sub-
Catchment
Quaternary
Catchment
Quaternary
Catchment
Area (km2)
Quaternary
Catchment
MAR (x106 m
3)
Sub-
Catchment
MAR (x106
m3)
Sub-
Catchment
Contribution
to MAR %
Bloubankspruit V32D 590 28.215 2.6 9
Catchment A V32D 590 28.215 0.5 1.8
Table 6-5: Post Development Reduction in MAR
Sub-Catchments
Post Development Sub
Catchment MAR (x106
m3)
Reduction in Sub-
Catchment MAR (%)
Sub-Catchment
Contribution to MAR (%)
Bloubankspruit 2.43 6.5 8.6
Catchment A 0.47 6 1.7

Zinoju Coal (Pty) Ltd Magdalena Colliery Discard Dump Extension
12-094 Page 18
It is anticipated that the proposed discard dump will affect the nature of the sub-
catchments and alter the rainfall runoff response. Anticipated changes are presented in
Table 6-5 above. It should be noted that the effective sub-catchment areas are significantly
reduced due to the assumed capture, retention and reuse of rainfall within the designated
“dirty” area. These include the two designed return water dams located north to the
existing dump and south to the proposed extension. Also the old open pit north of the
existing dump will be used as a return water dam.
6.7 Catchment slope and Time of Concentration
The slope of a catchment is a very important characteristic in the determination of flood
peaks. Steep slopes cause water to run faster and to shorten the critical duration of flood
inducing storms, thus leading to the use of higher rainfall intensities in the runoff formulae.
On steep slopes the vegetation is generally less dense, soil layers are shallower, and there
are fewer depressions, all of which cause water to run off more rapidly. The result is that
infiltration is reduced and flood peaks are consequently even higher. The average
catchment slope (SA) for the two sub-catchments under consideration are presented in
Table 6-6 below.
Table 6-6: Baseline Catchment Characteristics
Sub-Catchments Area (km
2) L (km) SL (m/m) SA (m/m) Tc (h)
Bloubankspruit 43.13 13.73 0.052 0.73
0.5622
Catchment A 8.73 4.76 0.011 0.18
0.428
Main watercourse slopes (SL) were determined using the 1085 method developed by The US
Geological Survey. This method has been found to yield accurate results for relatively small
catchments such as these.
The time that a water particle requires to travel from the furthest point in the catchment
to the outlet is known as the time of concentration. The time of Concentration can consist
of natural stream flow and overland flow components. Table 6-6 illustrates the baseline
catchment characteristics that affect the time of concentration.
Zinoju Coal (Pty) Ltd Magdalena Colliery Discard Dump Extension
12-094 Page 19
6.8 Peak flows and Volumes
The baseline Peak flows for the Bloubankspruit sub-catchment were determined in the 2002
EMPR, refer to section 5 of this report. Since new Bloubankspruit catchment area was
calculated and adapted for this study, the peak flows and volume were also necessary to be
update.
Peak flows can be estimated by using empirical, statistical and deterministic methods.
Empirical methods have not been used, as they are recommended for areas lager than 100
km2 (with caution for area lager than 10 km2). Calculated 1:50 and 1: 100-year storm peak
flows were determined using the rational method.
The Peak volumes were calculated for the 1:50 and 1:100-year return periods using the
calculation: Volume (m3) = 0.5*(3*Tc (sec))* Qp, from the South African National Roads
Agency Drainage Manual (SANRAL, 2007).
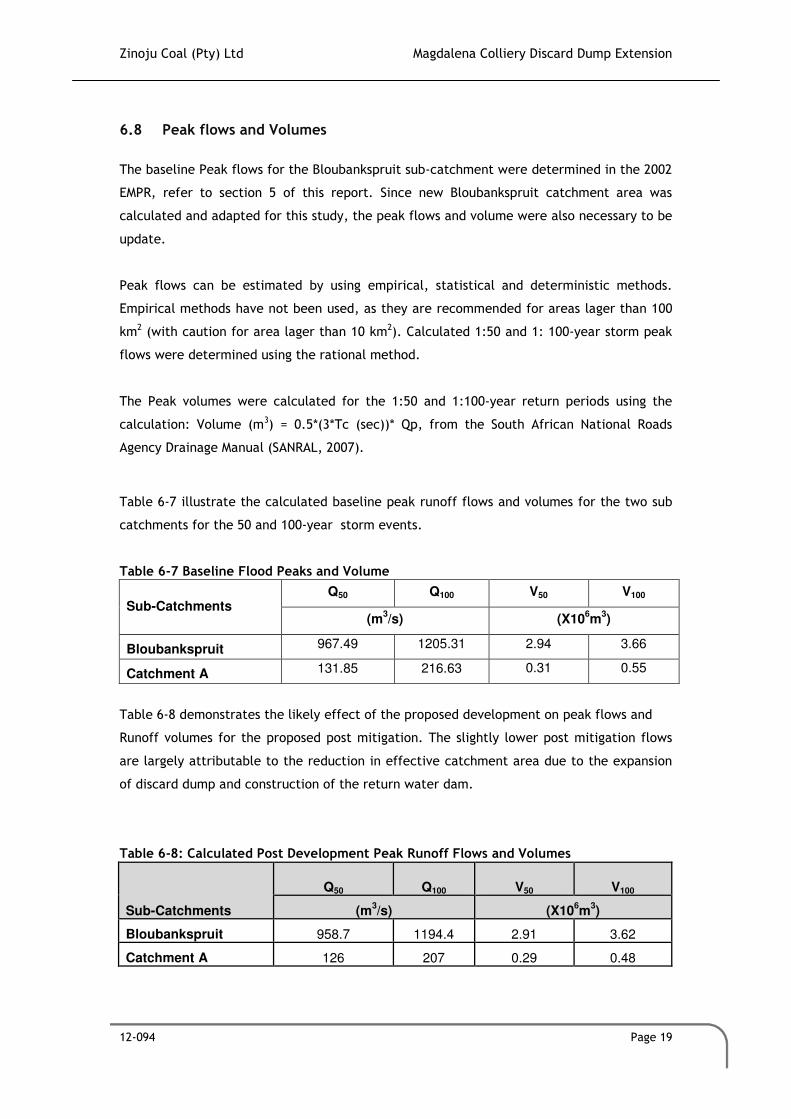
Table 6-7 illustrate the calculated baseline peak runoff flows and volumes for the two sub
catchments for the 50 and 100-year storm events.
Table 6-7 Baseline Flood Peaks and Volume
Sub-Catchments Q50 Q100 V50 V100
(m3/s) (X10
6m
3)
Bloubankspruit 967.49 1205.31 2.94 3.66
Catchment A 131.85 216.63 0.31 0.55
Table 6-8 demonstrates the likely effect of the proposed development on peak flows and
Runoff volumes for the proposed post mitigation. The slightly lower post mitigation flows
are largely attributable to the reduction in effective catchment area due to the expansion
of discard dump and construction of the return water dam.
Table 6-8: Calculated Post Development Peak Runoff Flows and Volumes
Sub-Catchments
Q50 Q100 V50 V100
(m3/s) (X10
6m
3)
Bloubankspruit 958.7 1194.4 2.91 3.62
Catchment A 126 207 0.29 0.48
Zinoju Coal (Pty) Ltd Magdalena Colliery Discard Dump Extension
12-094 Page 20
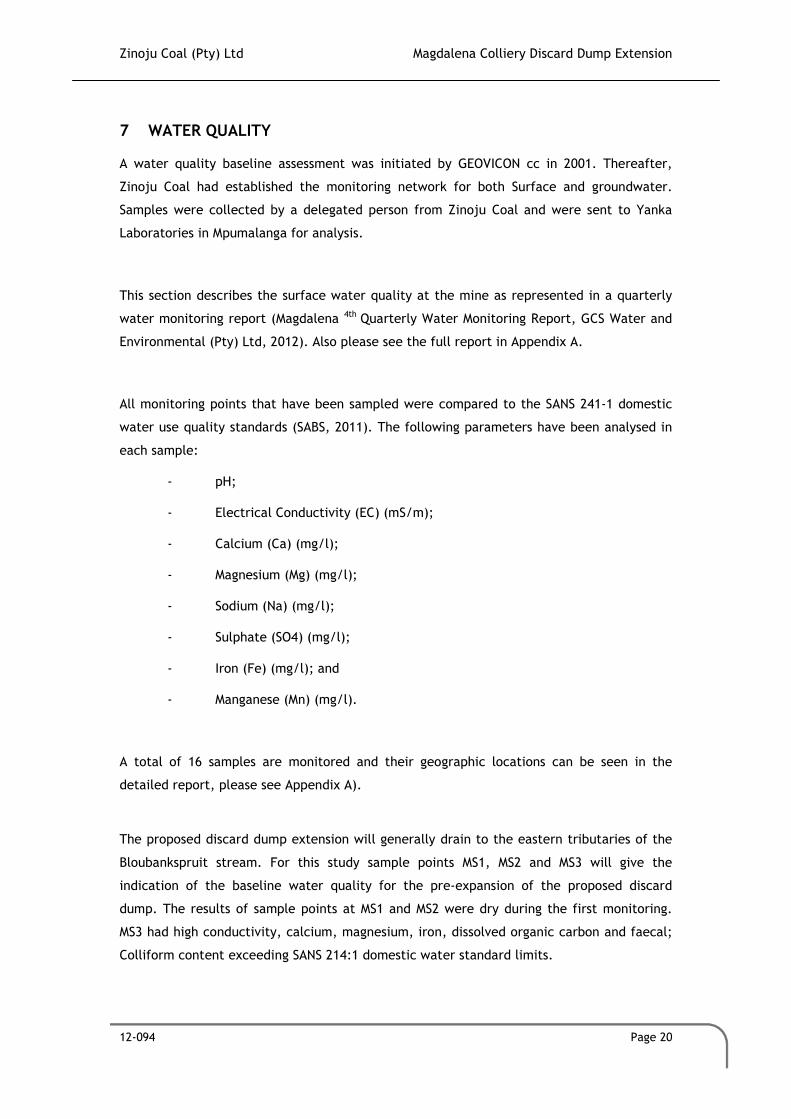
7 WATER QUALITY
A water quality baseline assessment was initiated by GEOVICON cc in 2001. Thereafter,
Zinoju Coal had established the monitoring network for both Surface and groundwater.
Samples were collected by a delegated person from Zinoju Coal and were sent to Yanka
Laboratories in Mpumalanga for analysis.
This section describes the surface water quality at the mine as represented in a quarterly
water monitoring report (Magdalena 4th Quarterly Water Monitoring Report, GCS Water and
Environmental (Pty) Ltd, 2012). Also please see the full report in Appendix A.
All monitoring points that have been sampled were compared to the SANS 241-1 domestic
water use quality standards (SABS, 2011). The following parameters have been analysed in
each sample:
- pH;
- Electrical Conductivity (EC) (mS/m);
- Calcium (Ca) (mg/l);
- Magnesium (Mg) (mg/l);
- Sodium (Na) (mg/l);
- Sulphate (SO4) (mg/l);
- Iron (Fe) (mg/l); and
- Manganese (Mn) (mg/l).
A total of 16 samples are monitored and their geographic locations can be seen in the
detailed report, please see Appendix A).
The proposed discard dump extension will generally drain to the eastern tributaries of the
Bloubankspruit stream. For this study sample points MS1, MS2 and MS3 will give the
indication of the baseline water quality for the pre-expansion of the proposed discard
dump. The results of sample points at MS1 and MS2 were dry during the first monitoring.
MS3 had high conductivity, calcium, magnesium, iron, dissolved organic carbon and faecal;
Colliform content exceeding SANS 214:1 domestic water standard limits.

Zinoju Coal (Pty) Ltd Magdalena Colliery Discard Dump Extension
12-094 Page 21
The following paragraphs briefly describe the laboratory results of 6 out 16 sample
locations with bad quality:
• MS4a, BOX, BUL, FD1, FD2 and SPRING all have high conductivity, TDS, sodium and
sulphate concentrations, exceeding the maximum allowable SANS water quality
limits. SPRING and BOX also have high manganese concentrations;
• Figure 7-1 shows a general increase in sulphate concentrations at MS4a with a
relatively stable pH over the same time period which is a result of surface water
and stormwater management problems. This could also be a result of shallow
aquifer seepage as baseflow into the stream;
Figure 7-1: Annual pH and sulphate for Surface Water site MS4a
• Figure 7-2 shows the sulphate versus pH levels at BOX. Sulphate levels has generally
increased over time whilst pH has remained relatively stable, with the exception of
a period in 2009 in which pH levels dropped significantly resulting in a concurrent
spike in sulphate levels. Poor water quality is a result of pumping water from the
slurry pond into BOX to reduce the water levels in the slurry pond.

Zinoju Coal (Pty) Ltd Magdalena Colliery Discard Dump Extension
12-094 Page 22
Figure 7-2: Annual pH and sulphate for Surface Water site BOX In Conclusion:
• Many of the surface water points were dry as a result of the recent drought; and
• No acidic pH conditions were evident from any of the surface water sites.

Zinoju Coal (Pty) Ltd Magdalena Colliery Discard Dump Extension
12-094 Page 23
Figure 7-3: Magdalena Colliery Groundwater and Surface Water Monitoring Network

Zinoju Coal (Pty) Ltd Magdalena Colliery Discard Dump Extension
12-094 Page 24
Figure 7-4: Zoomed In Map Showing the Sectiion of Discard Dump Extansion and Monitoring Sites

Zinoju Coal (Pty) Ltd Magdalena Colliery Discard Dump Extension
12-094 Page 25
8 STORMWATER MANAGEMEMNT PLAN
Effort has been made by the mine to separate clean and dirty water on site. The paragraphs
below detail the conceptual Storm Water Management Plan (SWMP) supplied to the
consultant by the mine (Magdalena Storm Water Management Plan report, iLanda Water
Services, August 2011. Please see the full report in Appendix B.
Clean and Dirty Catchment Identification and Separation
• Storm water generally flows from west to east across the Magdalena Colliery site.
• Clean storm water is generated to the west of the Colliery.
• Dirty storm water is generated in two areas:
o the discard dump and slurry dam area
o the coal processing area, including the administration buildings and the
workshops;
• The proposed Discard Dump workings at Magdalena Colliery is planned to be
operational approximately for 14 months, (communication with Frank Talbot);
• The storm water management infrastructure requirements should be incorporated
into the operation and rehabilitation works of the discard dump;
• The slurry dam, discard dump, the coal washing and processing facilities will
remain operational for the foreseeable future. The Storm water diversion channels
are required to the west of these facilities. These diversion channels will divert
clean storm water around the facilities and discharge the storm water to the east
of the facilities;
• Two adits to the underground workings will remain operational. These are located
in two sections of the current Discard Dump workings. The pits and access ramps
that currently serve the two adits will remain in place. Storm water will be
directed around these pits.
Please see a detail report in Appendix B.

Zinoju Coal (Pty) Ltd Magdalena Colliery Discard Dump Extension
12-094 Page 26
9 KEY ISSUES AND SCENARIOUS
From a hydrological perspective, the following key issues have been identified. These issues
are discussed below, while their impact and possible mitigating measures are discussed in
the following section.
9.1 Changes in Catchment Characteristics
The catchment characteristics of Bloubankspruit sub-catchment will be altered by the
proposed extension. The discard dump has been classified as “dirty” in terms of the DWA
Best Practice Guideline (BGP). Every effort must be made to separate clean and dirty area
by containing runoff from “dirty” areas.
Surface water runoff from the discard dump area should be collected and contained in
order to ensure the following objectives are met:
• Minimisation of contaminated areas and reuse of dirty water (where possible)
• Minimisation of seepage from the discard facility
• Prevention of overflows and minimization of seepage losses from storage facilities
(pollution control dams) Prevention of further deterioration of water quality.
Being dirty, surface water emanating from the discard dump would be captured as close as
possible. The return water dam would also cause an increase in hydrologically ineffective
areas. Consequently, the calculated flood peak values and MAR would decrease as shown in
Table 6-8
9.2 Changes in Peak flows and Volumes
The baseline and anticipated post-development peal runoff flows and volumes calculations
are illustrated in section 6 of this report. This section assess the key issues associated with
these changes whilst the impact on surface water follows in section 10
Zinoju Coal (Pty) Ltd Magdalena Colliery Discard Dump Extension
12-094 Page 27
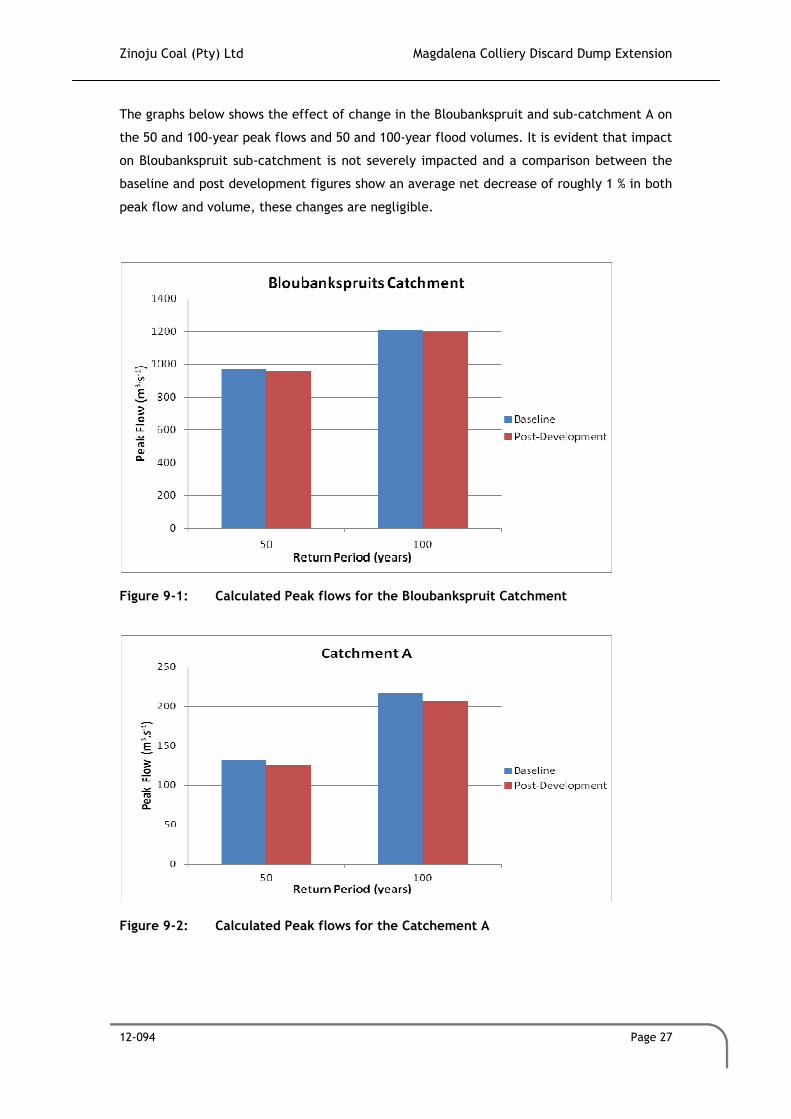
The graphs below shows the effect of change in the Bloubankspruit and sub-catchment A on
the 50 and 100-year peak flows and 50 and 100-year flood volumes. It is evident that impact
on Bloubankspruit sub-catchment is not severely impacted and a comparison between the
baseline and post development figures show an average net decrease of roughly 1 % in both
peak flow and volume, these changes are negligible.
Figure 9-1: Calculated Peak flows for the Bloubankspruit Catchment
Figure 9-2: Calculated Peak flows for the Catchement A

Zinoju Coal (Pty) Ltd Magdalena Colliery Discard Dump Extension
12-094 Page 28
Figure 9-3: Calculated Peak Volumes for the Bloubankspruit Catchement
Figure 9-4: Calculated Peak Volumes for the Catchment A

Zinoju Coal (Pty) Ltd Magdalena Colliery Discard Dump Extension
12-094 Page 29
9.3 Changes in Mean Annul Runoff
It is evidence from the MAR values in Table 6-5 that the proposed discard dump effect
would not be significant on Bloubankspruit sub-catchment. The impact of this change on
surface water follows in section 10 of this report. The Post development MAR would be
0.47m3 per annum. This quantity of water would be contained the two PCDs. The reduction
in MAR quaternary catchment would be in order of 0.2%, which would be negligible.
However the reduction in MAR for the Bloubankspruit would be about 8.6%. The findings in
section 6 verify that there would be no noticeable impact on the quaternary catchment
V32D.
9.4 Increased Sediment Yield
The construction of haul roads and transport of discard material would increase the
quantity of airborne sediments. This dust would settle of the ground surface where it would
present additional sediments during rainfall events. The impact of this change in surface
water follows in Section 10 of this report.

Zinoju Coal (Pty) Ltd Magdalena Colliery Discard Dump Extension
12-094 Page 30
10 SURFACE WATER IMPACT ASSESSMENT
This exercise of risk identification and mitigation involves identification of streams found
downstream of the proposed development, as well as a description of the identified risks
the environment may incur during the various phases of the project.
The risk rating matrix methodology used is based on the following quantitative measures:
• The probability of impact occurrence;
• The frequency of impact occurrence;
• The special extent of impact occurrence;
• The intensity of impact occurrence; and
• Duration of impact occurrence.
The ratings to be assigned are presented in Table 10-2. The ratings are then combined to
determine the risk significance points for the impact according to the following equation:
Risk significance value = (magnitude + duration + intensity + frequency) x probability
The maximum value is 18 risk points and ratings are scaled from high, medium to low in
respect to their environmental impact. The ranking system used in the study is presented in
Table 10-1.
Table 10-1: Risk Assessment Significance Value
The maximum value that can be achieved is 100 Significance Points (SP). Environmental effects were rated as follows:
Significance Environmental Significance Points Colour Code
High (positive) >60 H
Medium (positive) 30 to 60 M
Low (positive) <30 L
Neutral 0 N
Low (negative) >-30 L
Medium (negative)
-30 to -60 M
High (negative) <-60 H
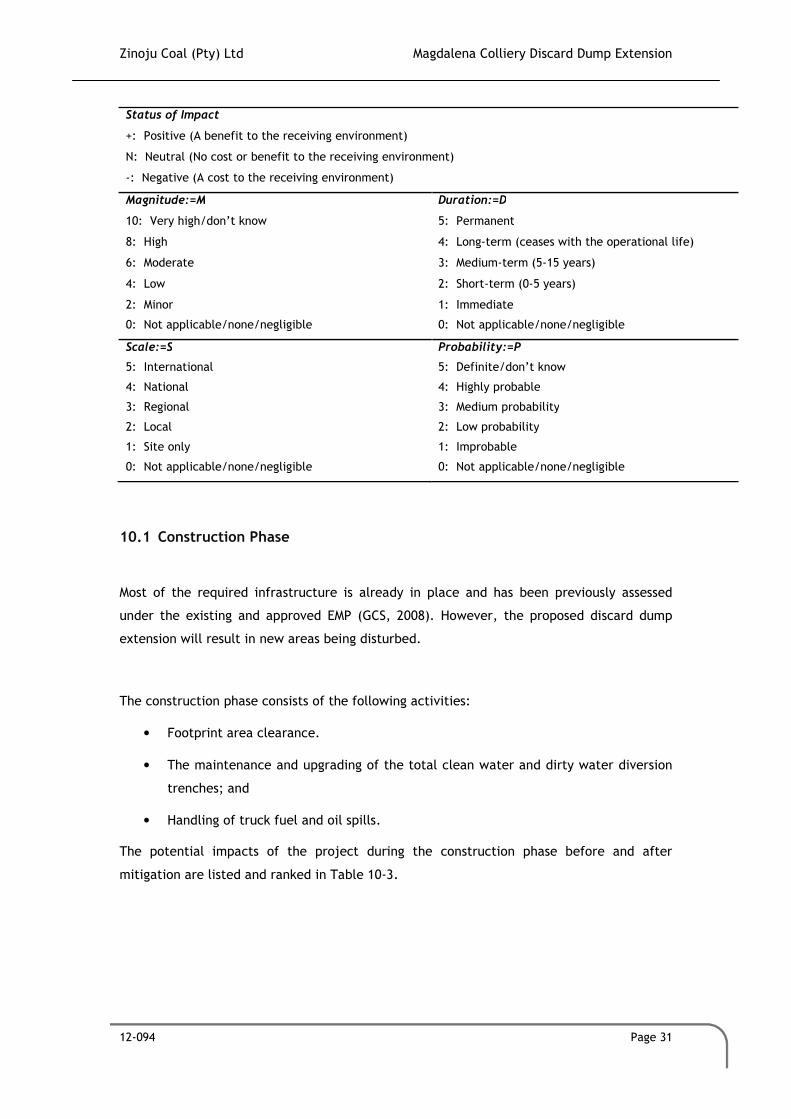
Table 10-2: Risk Rating Matrix
Zinoju Coal (Pty) Ltd Magdalena Colliery Discard Dump Extension
12-094 Page 31
Status of Impact
+: Positive (A benefit to the receiving environment)
N: Neutral (No cost or benefit to the receiving environment)
-: Negative (A cost to the receiving environment)
Magnitude:=M Duration:=D
10: Very high/don’t know 5: Permanent
8: High 4: Long-term (ceases with the operational life)
6: Moderate 3: Medium-term (5-15 years)
4: Low 2: Short-term (0-5 years)
2: Minor 1: Immediate
0: Not applicable/none/negligible 0: Not applicable/none/negligible
Scale:=S Probability:=P
5: International 5: Definite/don’t know
4: National 4: Highly probable
3: Regional 3: Medium probability
2: Local 2: Low probability
1: Site only 1: Improbable
0: Not applicable/none/negligible 0: Not applicable/none/negligible
10.1 Construction Phase
Most of the required infrastructure is already in place and has been previously assessed
under the existing and approved EMP (GCS, 2008). However, the proposed discard dump
extension will result in new areas being disturbed.
The construction phase consists of the following activities:
• Footprint area clearance.
• The maintenance and upgrading of the total clean water and dirty water diversion
trenches; and
• Handling of truck fuel and oil spills.
The potential impacts of the project during the construction phase before and after
mitigation are listed and ranked in Table 10-3.

Zinoju Coal (Pty) Ltd Magdalena Colliery Discard Dump Extension
12-094 Page 32
10.1.1 Surface water contamination
Truck oils and fuel could lick and spill to water resources. All oils and fuels must be stored
in banded areas and any spillages must be managed immediately in accordance with the
Emergency Response plan. The emergency response plan must be provided by contractors.
This will reduce the risks from High to low
The current discard dump could be disturbed and cause instability resulting in more
seepage to surface water resources. Any seepage must be contained according to design
criteria. The berms must be constructed upslope of the footprint area to divert clean water
to the discard dump and dirty water emanating from the dump should be captured and
contained. This will reduce the risks from high to low.
10.1.2 Siltation of surface water
Footprint clearance will expose soil. Prior to construction; clean and dirty separation
infrastructure need to be in place to manage runoff velocity preventing erosion gullies. The
Risk will be reduced from high to low.

Zinoju Coal (Pty) Ltd Magdalena Colliery Discard Dump Extension
12-094 Page 33
Table 10-3: Magdalena Construction Phase
M D S P
TOTAL
STATUS
SP M D S P
TOTAL
STATUS
SP
Siltation of surface water
resources & associated soil erosion
Footprint Clearance &
Construction - exposed soil10 4 3 5 85 - H
Ensure that clean and dirty water
separation infrastructure is in place prior
to the commencement of construction.
4 4 1 2 18 - L
Reduced runoff to surface water
resources & potential
contamination due to incorrect
dam sizing
Construction - SWMP
measures diverted runoff10 4 2 5 80 - H
Minimise the dirty water area. Appropriate
SWMP 1:50 year storm event to be
contained and re-used water in plant
processing.
6 1 1 3 24 - L
Waste Handling - fuel and oil
spills6 3 3 3 36 - M Prevent spillage of fuel and oils. 4 3 2 2 18 - L
Waste Handling - Seepage to
surface water resources from
disacard dump area
10 4 2 5 80 - H
Design criteria should prevent seepage
(Refer the Magdalena Discard dump design
and Hydrogeological study). Any seepage
must be contained.
6 4 1 2 22 - L
CONSTRUCTION PHASE ACTIVITIES: SITE PREPARATION and FOOTPRINT CLEARANCE
MAGDALENA MINING AREAS: 1.EXISTING DICARD DUMP and EXPANSION DISCARD DUMP
SURFACE WATER
Dicard Dump Expansion
Surface water contamination
POTENTIAL ENVIRONMENTAL
IMPACT
APPLICABLE
MAGDALENA MINE
AREA
ACTIVITY
ENVIRONMENTAL SIGNIFICANCE
BEFORE MITIGATION
RECOMMENDED MITIGATION MEASURES
ENVIRONMENTAL SIGNIFICANCE
AFTER MITIGATION

Zinoju Coal (Pty) Ltd Magdalena Colliery Discard Dump Extension
12-094 Page 34
10.2 Operational Phase
During the operational phase, coal will be mined and processed in the crushing and
screening plant. The coal will be washed and transported by truck to the stockpile area
after processing. The associated residue will be disposed of at the discard dump facility.
The Operational phase consists of the following activities:
• Dirty runoff from the discard;
• Exposure of soil surface and ineffective rehabilitation; and
• Discard dump risk of failure
The potential impacts of the project during the operation phase before and after mitigation
are listed and ranked in Table 10-4.
10.2.1 Stream Peak flow Reduction
The discard dump extension will reduce the Bloubankspruit and sub-catchment A areas and
runoff volumes. The baseline MAR for Bloubankspruit and sub-catchment A were modelled
as 2.3Mm3 and 0.5Mm3. The post-development discard dump extension site runoff was
modelled at 0.47 Mm3 per year.
As the figures are small the proposed development is not anticipated to have a large
potential peak flow reduction impact on the runoff of the immediate and general areas.
Mitigation Measures:
The discard dump rehabilitation process will be progressively be done. Clean water run-off
must be diverted around areas of disturbance. Where practicable, sediments must be
captured and retained on-site. This will reduce ranking from medium to low.

Zinoju Coal (Pty) Ltd Magdalena Colliery Discard Dump Extension
12-094 Page 35
Table 10-4: Magdalena Operational Phase Risk Assessment
M D S P
TOTAL
STATUS
SP M D S P
TOTAL
STATUS
SP
SURFACE WATER
Deterioration of surface water
quality
Discard Dump
Extpansion
Discard dump -
contaminated runoff10 4 3 4 68 - H
Consider runoff from discard dump as dirty
water. Maintain all water control
infrastructure. Design pollution control
structures to contain the 1:50 year flood
event
6 4 3 4 52 - M
Siltation of water resources All mine areas
All operation activities -
exposure of soil surfaces
and ineffective
rehabilitation
8 4 3 4 60 - MMaintain storm water infrastructure,
ensure effective rehabilitation6 4 3 4 52 - M
Pollution of water
resourcesExtension Dump
Discard Deposition - risk
of failure10 4 3 4 68 - H
Ensure regular inspection and maintenance
of the extension dump 6 4 3 3 39 - M
OPERATIONAL PHASE ACTIVITIES: DISCARD DUMP
MAGDALENA MINING AREA: 1. EXISTING AND DISCARD DUMP EXTENSION
ENVIRONMENTAL SIGNIFICANCE
AFTER MITIGATIONPOTENTIAL ENVIRONMENTAL
IMPACT
APPLICABLE
MAGDALENA MINE AREAACTIVITY
ENVIRONMENTAL SIGNIFICANCE
BEFORE MITIGATION
RECOMMENDED MITIGATION MEASURES
Zinoju Coal (Pty) Ltd Magdalena Colliery Discard Dump Extension
12-094 Page 36
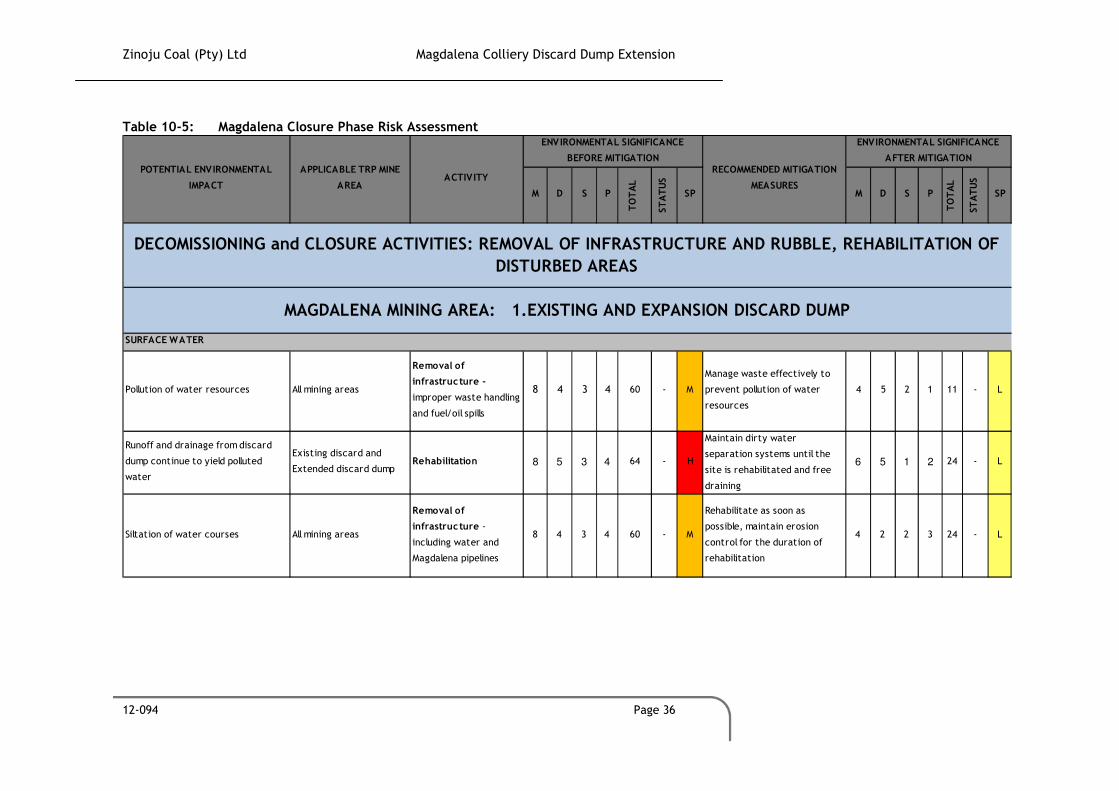
Table 10-5: Magdalena Closure Phase Risk Assessment
M D S P
TOTAL
STATUS
SP M D S P
TOTAL
STATUS
SP
Pollution of water resources All mining areas
Removal of
infrastructure -
improper waste handling
and fuel/oil spills
8 4 3 4 60 - M
Manage waste effectively to
prevent pollution of water
resources
4 5 2 1 11 - L
Runoff and drainage from discard
dump continue to yield polluted
water
Existing discard and
Extended discard dumpRehabilitation 8 5 3 4 64 - H
Maintain dirty water
separation systems until the
site is rehabilitated and free
draining
6 5 1 2 24 - L
Siltation of water courses All mining areas
Removal of
infrastructure -
including water and
Magdalena pipelines
8 4 3 4 60 - M
Rehabilitate as soon as
possible, maintain erosion
control for the duration of
rehabilitation
4 2 2 3 24 - L
SURFACE WATER
POTENTIAL ENVIRONMENTAL
IMPACT
APPLICABLE TRP MINE
AREAACTIVITY
ENVIRONMENTAL SIGNIFICANCE
BEFORE MITIGATIONRECOMMENDED MITIGATION
MEASURES
ENVIRONMENTAL SIGNIFICANCE
AFTER MITIGATION
DECOMISSIONING and CLOSURE ACTIVITIES: REMOVAL OF INFRASTRUCTURE AND RUBBLE, REHABILITATION OF
DISTURBED AREAS
MAGDALENA MINING AREA: 1.EXISTING AND EXPANSION DISCARD DUMP

Zinoju Coal (Pty) Ltd Magdalena Colliery Discard Dump Extension
12-094 Page 38
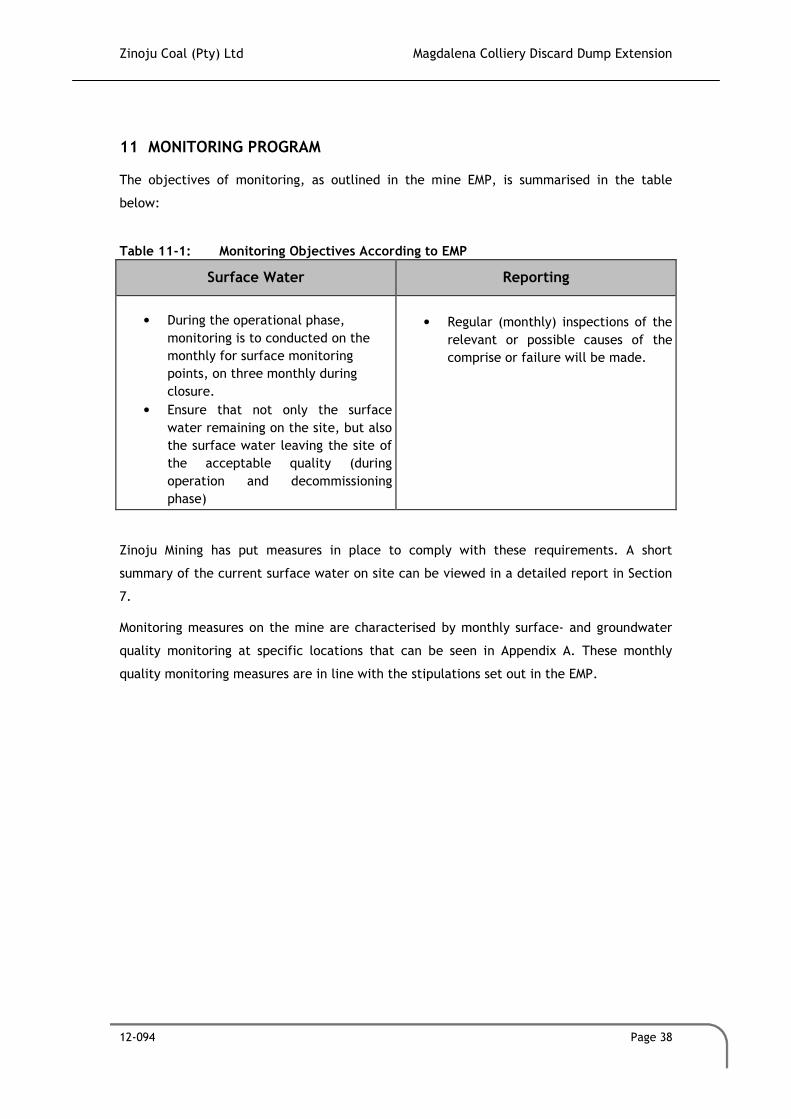
11 MONITORING PROGRAM
The objectives of monitoring, as outlined in the mine EMP, is summarised in the table
below:
Table 11-1: Monitoring Objectives According to EMP
Surface Water Reporting
• During the operational phase,
monitoring is to conducted on the
monthly for surface monitoring
points, on three monthly during
closure.
• Ensure that not only the surface
water remaining on the site, but also
the surface water leaving the site of
the acceptable quality (during
operation and decommissioning
phase)
• Regular (monthly) inspections of the
relevant or possible causes of the
comprise or failure will be made.
Zinoju Mining has put measures in place to comply with these requirements. A short
summary of the current surface water on site can be viewed in a detailed report in Section
7.
Monitoring measures on the mine are characterised by monthly surface- and groundwater
quality monitoring at specific locations that can be seen in Appendix A. These monthly
quality monitoring measures are in line with the stipulations set out in the EMP.

Zinoju Coal (Pty) Ltd Magdalena Colliery Discard Dump Extension
12-094 Page 39
12 GAP ANALYSIS
From evaluation of all the different sections in this report the following gaps were
identified:
• From the hydrology of the catchment that the mine is situated in:
o The data used in the modelling from WR2005 is only up to 2005, this is not
updated. Modelling should be with up to date information and more models
should be considered.
o Some generic values are used which apply to bigger and whole catchment which
might not apply here as we are at the watershed.
• From the hydrology of the mine:
o Bloubankspruit water quality monitoring on the mine.
o A mine water balance; and
o A update of Mine SWMP

Zinoju Coal (Pty) Ltd Magdalena Colliery Discard Dump Extension
12-094 Page 40
13 CONCLUSION
The following conclusions are drawn from the Magdalena Hydrological study:
• From the hydrology of the catchment that the proposed Discard Dump mine is
situated in:
o The location of the mine is characterised by Water Management Area 7
UThukela (WMA 7) and quaternary catchment area V32D;
o The climate of the project area is characterised by a MAP of 792.1 mm and
MAE of 1 500 mm. Point rainfall of potential 1:50 year storms are defined
by 131.5 mm;
o The hydrology of the project area is characterised by a quaternary
catchment surface area size of 590 km2 (V32D). Furthermore the
quaternary hydrology is characterised by a MAR of 28.21 Mm3 and proposed
Discard Dump by a MAR of 0.47Mm3
o The peak flows for the proposed Discard Dump area are 0.36 m3/s and 0.46
m3/s for potential 1: 50 and 1:100 year storms
• From the hydrology of the mine:
o The surface water quality of the mine is characterized by 16 samples. From
the sample results and analyses it is seen that 10 of the 16 locations of the
water monitored on the mine site are within the SANS214:1 domestic water
use standard limits. However no acidic pH conditions were evident from any
of the other 6 surface water samples;
o The SWMP of the mine is characterised by two dirty catchments:
- the discard dump and slurry dam area;
- the coal processing area, including the administration buildings and
the workshops;
o Monitoring measures on the mine is characterised by monthly surface and
ground water quality monitoring at specific locations. These monthly
quality monitoring measures are in line with the stipulations set out in the
EMP.

Zinoju Coal (Pty) Ltd Magdalena Colliery Discard Dump Extension
12-094 Page 41
The following recommendations are made for the Magdalena hydrology:
• For the hydrology of the mine:
o A GN704 audit;
o A site visit and detailed investigation into the surface water of the mine to
update WB; and
Zinoju Coal (Pty) Ltd Magdalena Colliery Discard Dump Extension
12-094 Page 42
14 REFERENCES
Department of Water Affairs and Forestry (2008). Best Practice Guideline G3: Water
Monitoring System.
GCS (2002). Magdalena Environmental Management Program Report Ammendment, Phase 2.
GCS (2012). Magdalena 4th Quarterly Water Monitoring Report.
Kunz, R (2004). Daily Rainfall Data Extraction Utility, Version 1.4.
Middleton, B.J. and A.K. Bailey. (2009). Water Resources of South Africa, 2005 Study.
(WR2005). WRC Report No’s 380/08, 381/08, 382/08. Water Research Commission.
Pretoria.
Midgley, D.C., Pitman W.V. and Middleton, B.J. (1994). Surface Water Resources of South
SANRAL (2006). The South African National Road Agency Limited. Drainage Mannual, 5th
Edition, fully Revised
Smithers JC and Schulze RE. (2003) Design rainfall and flood estimation in SA
(Regionalisation of rainfall statistics for design flood estimation), Water Research
Commission Report No1060/1.
Zinoju Coal (Pty) Ltd Magdalena Colliery Discard Dump Extension
12-094 Page 43
APPENDIX A: MAGDALENA 2ND QUARTEYLY WATER MONITORING REPORT

Zinoju Coal (Pty) Ltd Magdalena Colliery Discard Dump Extension
12-094 Page 44
APPENDIX B: MAGDALENA STORM WATER MANAGEMENT PLAN REPORT

Zinoju Coal (Pty) Ltd Magdalena Colliery Discard Dump Extension
12-094 Page 45
Recommended